Embed Size (px)
Citation preview

UNIVERSIDADE DA BEIRA INTERIOR SCIENCE
ELECTROCHEMICAL TREATMENT OF TANNERY EFFLUENTS
Paulo Cezar Caliari
THESIS SUBMITTED IN PARTIAL FULFILLMENT OF THE REQUIREMENTS FOR THE DEGREE OF DOCTOR OF PHILOSOPHY
CHEMISTRY (3rd Cycle)
Supervisor: Professor Ph.D Ana Maria Carreira Lopes
Covilhã, February/2017

ii
DEDICATION
All the blood, sweat, tears, longings, desires, wishes, loneliness, emotions, success, smiles,
joy, happiness........ everything put into this work is dedicated to
my wife Ester Cristina Nápoli Caliari, my eternal girlfriend, the fire that burns in my heart,
my eternal flame, the invincible and tireless bravery, who with strength and dedication
guided our family with wisdom and devotion in my absence
my daughter Dominique Nápoli Caliari, my warrior
my daughter Domitila Nápoli Caliari, my flower
my son Dante Nápoli Caliari, my prince

iii
ACKNOWLEDGEMENTS
To my father Albino Caliari and my beloved mother Edina Corradi Caliari (in memoriam), for
all the valuable fundamentals that were taught to me.
To my supervisor, Professor Ph.D Ana Maria Carreira Lopes, for the generous dedication and
attention. For showing the right way in times of doubt. For illuminating my every step in the
journey. For the constructive criticism and sensible view of the activities proposed and
carried out. For setting guidelines and providing the precise evaluations required to meet the
desired objectives
To Professor Ph.D Maria Isabel Almeida Ferra, for giving continuity to my request for
information on the chemistry doctoral program at the Universidade da Beira Interior
To Professors Ph.D Maria José Pacheco, for the immense help dealing with the HPLC, a
creature with a life of its own, and Lurdes Ciríaco for assisting me in the handling of metal
oxide electrodes
To Carlos Carriço, for the explanation about the Theory of the Saboteurs
To Professor D.Sc Luiz Carlos Machado for the constant support he gave me for the fulfillment
of my doctoral studies
To Jorge Costa de Moura, my brother, who both devoted himself in order for important
documents requested by the university to travel across the Atlantic Ocean
To Tiago Alexandre Pires Rosado, my other brother, the "purtuguêis" of the mad songs
To the countless smiles of Francisca Santos and Tiago Carmo e Souza (in memoriam)
To the professionals of the technical area of the Chemistry Department, Ana Maria Brás, João
Antunes Pereira, Luis Matias, João Gonçalves and Dulce Reis
To the informatics guys, Richard Guise, Hugo Veiga, Joao Miguel Correia, João José Madeira,
Carlos Manoel dos Santos Pinto, Tiago Lourenço Batista, Nuno "Mister Android" dos Santos
To the laboratory colleagues Dalia, Nuno Monteiro, Ana Sofia, Maria João, Annabel, Karolina
Gross, Lazhar Labiadh and Mariana Monteiro
To the Coordenação de Aperfeiçoamento de Pessoal de Ensino Superior, CAPES, for granting
the doctoral grant (BEX 0714 / 13-5), and a special thanks to Silvio dos Santos Salles, the
manager of my scholarship.
To Fundação para a Ciência e a Tecnologia for the project PEst-OE/CTM/UI0195/2014 of the
FibEnTech-UBI Research Unit.
To the profound mystery of the Quinta de Santo António .................

iv
Não sou escravo de ninguém
Ninguém, senhor do meu domínio
Sei o que devo defender
E, por valor eu tenho
E temo o que agora se desfaz
Não me entrego sem lutar
Tenho ainda coração
Não aprendi a me render
Que caia o inimigo então
Metal Contra as Nuvens – Legião Urbana (1991)
Minhas raízes estão no ar
Minha casa é qualquer lugar
Se depender de mim
Eu vou até o fim
Cada célula
Todo fio de cabelo
Falando assim
Parece exagero
Mas se depender de mim
Eu vou até fim
Até o Fim - Engenheiros do Hawaii (2003)
Don't stop believin'
Don't Stop Believin' - Journey (1981)
“O tempo engana aqueles que pensam que sabem demais, que juram que
pensam. Existem também aqueles que juram sem saber.”
Sobre o tempo Sobre o tempo Sobre o tempo Sobre o tempo –––– Nenhum de NóNenhum de NóNenhum de NóNenhum de Nós (1990)s (1990)s (1990)s (1990)

v
RESUMO ALARGADO
Os efluentes das indústrias de couro são altamente complexos e contêm concentrações
elevadas de produtos orgânicos, sais e outros produtos químicos tóxicos que inibem a
atividade de micro-organismos durante as oxidações biológicas, nomeadamente, sulfuretos e
crómio. Assim, os processos biológicos não são capazes de depurar totalmente as águas
residuais provenientes desta indústria. Como alternativa à utilização dos processos biológicos
para o tratamento de águas residuais com cargas poluentes elevadas tem sido estudada a
aplicação de processos de oxidação eletroquímica no tratamento de resíduos aquosos.
Neste trabalho estudou-se a aplicação da oxidação eletroquímica no tratamento de amostras
de efluentes provenientes da indústria dos curtumes, clarificadas ou não. Os ensaios de
oxidação eletroquímica foram realizados sob condições galvanostáticas num reator
eletroquímico equipado com ânodos de óxidos metálicos, Ti/Pt/PbO2 e Ti/Pt/SnO2-Sb2O4, e de
diamante dopado com boro (BDD), utilizando diferentes densidades de corrente. A
clarificação das amostras foi realizada por coagulação química (com iões de ferro ou
alumínio) ou eletrocoagulação (com elétrodos de ferro ou alumínio). Para além disso,
estudou-se a cinética da conversão do S2- em SO42-, com soluções aquosas de S2- (60 mM), por
eletro-oxidação, utilizando ânodos de BDD.
Para o estudo da cinética da conversão de S2- em SO42- foram realizados ensaios a diferentes
densidades de corrente, que variaram entre 10 e 60 mA cm-2. A duração dos ensaios variou
com a densidade de corrente aplicada, tendo sido de 42 h para 10 mA cm-2 e de 10 h para 60
mA cm-2. Os resultados mostraram que a conversão eletroquímica ocorre em etapas, através
da produção de outras espécies intermediárias de enxofre (S2-� Sx
2- �SnOm
y-, com x, n, m e y
inteiros). A taxa de oxidação, para além de variar com a concentração de sulfureto, varia
fortemente com a intensidade de corrente aplicada, sendo de ordem 2 para a densidade de
corrente mais baixa, 10 mA cm-2. Para densidades de corrente mais elevadas, em que o
controlo de corrente é menos importante, a ordem de reação varia entre 0,15 e 0,44 para as
densidades de corrente aplicadas de 20 e 60 mA cm-2, respetivamente. Para a formação de
SO42-, a ordem da reação em relação à concentração de S2- é sempre zero para todas as
densidades de corrente aplicadas.
Nos estudos de remoção de contaminantes de efluentes da indústria dos curtumes, os
desempenhos de cada ensaio de oxidação anódica foram verificados por meio de variações
observadas nas concentrações de carência química de oxigénio, carbono inorgânico dissolvido,
carbono orgânico dissolvido, carbono total dissolvido, azoto total Kjeldhal, azoto total, N-
NH4+, N-NH3, NO3
-, NO2-, S2- e SO4
2-.
Para a oxidação eletroquímica de amostras de efluente não clarificadas (400 mL), os ensaios
foram realizados com densidade de corrente de 30 mA cm-2, agitação (100 rpm) e duração dos

vi
ensaios de 8 h. O elétrodo de BDD apresentou o melhor desempenho na remoção de carbono
orgânico dissolvido e de carbono total dissolvido. Os outros dois elétrodos testados
apresentaram comportamentos semelhantes nas remoções do carbono orgânico dissolvido;
Ti/Pt/SnO2-Sb2O4 foi o menos eficiente na oxidação do azoto a NO3-, tendo levado à produção
de formas de azoto gasoso, o que reduz a carga total de azoto presente nas amostras finais; o
elétrodo de BDD removeu mais intensamente o S2-, apesar dos outros elétrodos apresentarem
um comportamento semelhante. O elétrodo de Ti/Pt/SnO2-Sb2O4 foi mais eficaz na formação
do SO42-. Em relação ao consumo específico de carga, o BDD mostrou o menor consumo, 2,70
C/(g de CQO removida), contra 3,25 e 3,21 C/(g de CQO removida) para os elétrodos de
Ti/Pt/PbO2 e de Ti/Pt/SnO2-Sb2O4, respetivamente.
Foram também realizados ensaios de oxidação anódica ao efluente clarificado e não
clarificado. Para todos os ensaios de pré-tratamento por clarificação, o melhor desempenho
foi verificado para a coagulação química. Isto parece ser devido ao melhor controlo
operacional na coagulação química face à eletrocoagulação. Além disso, os catiões de ferro
foram mais eficientes do que os catiões de alumínio. Isto é importante porque a clarificação
por ferro evita a presença de alumínio no lodo final.
As oxidações anódicas das amostras (400 mL), clarificadas previamente por coagulação
química ou eletrocoagulação por alumínio, foram processadas por 8 h com densidade de
corrente de 30 mA cm-2 e agitação contínua (100 rpm). Foram realizados ensaios idênticos de
eletro-oxidação para amostras não clarificadas. Neste sentido, a etapa de clarificação
influenciou fortemente os processos de oxidação anódica e mostrou que a eletrodegradação
com elétrodos de Ti/Pt/PbO2 e Ti/Pt/SnO2-Sb2O4 pode ser usada como etapa de polimento no
tratamento de efluentes. O elétrodo de BDD, em geral, mostrou melhor desempenho na
remoção de contaminantes a partir das amostras não clarificadas e foi muito eficiente na
remoção S2-, mas não na sua conversão em SO42-. Pelo contrário, o elétrodo de Ti/Pt/SnO2-
Sb2O4 mostrou excelente desempenho para produção de SO42- a partir de espécies
intermediárias sulfuradas, uma vez que, para estes elétrodos, a formação de SO42- foi maior
do que a esperada. O consumo de energia dos processos de oxidação anódica realizados com
ânodos de Ti/Pt/PbO2 e de Ti/Pt/SnO2-Sb2O4 é fortemente influenciado pelas concentrações
de contaminantes. O processo combinado, coagulação química seguido por oxidação anódica
com elétrodos de óxidos metálicos, provou ser uma boa alternativa aos elétrodos de BDD para
tratamento de águas residuais. Um processo similar foi efetuado para amostras clarificadas,
ou não, com catiões de ferro. Os resultados dos ensaios de oxidação anódica mostraram ser
semelhantes aos observados quando a clarificação foi realizada por alumínio.
Tendo em vista os resultados anteriormente descritos, na última fase do trabalho efetuou-se
a eletrooxidação, durante 8 h, de amostras clarificadas por catiões ferro, 0,25 g L-1, com
volume total de 2 L, em dois sistemas diferentes, dotados de recirculação: um sistema de
eletrooxidação continha ânodos de Ti/Pt/SnO2-Sb2O4 e de Ti/Pt/PbO2 (A); o outro sistema era
formado apenas por um ânodo de BDD (B). As densidades de corrente em cada conjunto foram

vii
20 mA cm-2 e 40 mA cm-2 para Ti/Pt/SnO2-Sb2O4 e Ti/Pt/PbO2, respetivamente, no sistema A,
e 60 mA cm-2 para o BDD, no sistema B. Ambos os sistemas testados mostraram um
comportamento semelhante na remoção de CQO, carbono dissolvido total, carbono orgânico
dissolvido, azoto total de Kjeldahl, N-NH3 e azoto total. Os resultados mostraram a
viabilidade dos elétrodos de óxidos metálicos em substituição do elétrodo de BDD em sistemas
de oxidação; o conjunto A foi o menos eficiente na oxidação do azoto a NO3-, apesar de
mostrar um comportamento semelhante ao conjunto B para a produção de azoto gasoso, o
que reduz a carga total de azoto presente nas amostras finais; a concentração de CQO
funcionou como um importante fator inibidor para a remoção azoto total de Kjeldahl. Em
relação ao consumo de energia, de uma maneira geral, o conjunto B apresentou o menor
consumo.
Palavras-chave
BDD; Ti/Pt/PbO2; Ti/Pt/SnO2-Sb2O4; Oxidação eletroquímica; Efluente de curtume; Oxidação
de sulfureto.

viii
ABSTRACT
Tannery wastewater is highly complex and contains high concentrations of organics and other
toxic chemicals, such as sulfide and chromium, which inhibit the activity of microorganisms
during biological oxidations and are not removed completely from wastewater. Since the
biological processes are not able to fully depollute tannery effluents, other technologies, such
as electrochemical oxidation processes, are being studied for the treatment of aqueous
wastewaters.
In this work, the study of the electrochemical oxidation of samples from tannery wastewater,
clarified or not, was carried out. Assays were run under galvanostatic conditions, with
different current densities, in electrochemical reactors equipped with anodes based on metal
oxides, Ti/Pt/PbO2 and Ti/Pt/SnO2-Sb2O4, and of boron-doped diamond (BDD). For the
pretreatment by clarification, chemical coagulation (with iron and aluminum ions) and
electrocoagulation (with iron and aluminum consumable anodes) were used. The performance
of each assay was followed by variations observed in the concentrations of COD, DIC, DOC,
TDC, TKN,TN, N-NH4+, N-NH3, NO3
-, NO2-, S2- and SO4
2-. The kinetics of the conversion of S2-
into SO42- , in aqueous solutions of S2- (60 mM), by electro-oxidation using a BDD electrode was
also investigated.
For the conversion of S2- to SO42-, assays were run at current densities from 10 to 60 mA cm-2,
with a duration varying from 10 to 42 h. The results showed that the electrochemical
conversion occurs in steps, via intermediate production of other sulfur species (S2-� Sx
2-
�SnOmy-, with x, n, m and y integers) and the oxidation rate of the sulfide ion is dependent
on its concentration and current density. The reaction order strongly varies with the applied
current intensity, being order 2 for the lower applied current density. For higher applied
current densities, where the current control is less important, the reaction order varies from
0.15 to 0.44 for the applied current densities of 20 and 60 mA cm-2, respectively. For the
formation of SO42- from S2- electro-oxidation, the reaction order with respect to sulfide varied
from 0.35 to 0.05 when the applied current densities changed from 10 to 60 mA cm-2.
The electrochemical oxidation for unclarified effluent samples under a current density of 30
mA cm-2 and in a batch with stirring (100 rpm) during 8 h assays showed the best performance
for BDD electrode in the removal of COD and TDC. The others two tested electrode presented
similar behavior in the DOC removal; Ti/Pt/SnO2-Sb2O4 was the least efficient in the oxidation
of nitrogen to NO3-, despite providing considerable production of gaseous nitrogen
compounds, which reduces the total nitrogen load present in the final samples; removal of S2-
was more intense at BDD, although the other electrodes presented similar behavior.
Ti/Pt/SnO2-Sb2O4 electrode was more effective to form SO42-. Regarding specific charge
consumption, BDD showed the lowest consumption, 2.70 C g-1 of COD removed, against 3.25
and 3.21 C g-1 of COD for the Ti/Pt/PbO2 and Ti/Pt/SnO2-Sb2O4 electrodes, respectively.

ix
In all clarifications assays the best performance was verified for chemical coagulation. This
appears be derived from a better operational control in chemical coagulation than in
electrocoagulation. In addition, iron cation was more efficient than aluminum cation. This is
important because the clarification by iron avoids the presence of aluminum in the final
sludge
In the case of anodic oxidation (8 h assays, current density of 30 mA cm-2 and constant stirring
at a rate of 100 rpm) for effluent samples (400 mL), previously clarified by chemical
coagulation or electrocoagulation by aluminum, the clarification stage strongly influenced the
anodic oxidation processes and showed that electrodegradation by Ti/Pt/PbO2 and
Ti/Pt/SnO2-Sb2O4 electrodes can be used as effluent polishing step. BDD electrode generally
showed better performance in the removal of contaminants from the not clarified samples
and was very efficient in the S2- removal but not in its conversion to SO42-. On the contrary,
Ti/Pt/SnO2-Sb2O4 electrode showed better performance in the production of SO42- from
intermediate sulfur species. The energy consumption of the anodic oxidation processes
performed with Ti/Pt/PbO2 and Ti/Pt/SnO2-Sb2O4 anodes is strongly influenced by the
contaminant concentrations. The combined process, chemical coagulation followed by anodic
oxidation with metal oxide electrodes, proved to be a good alternative to the BDD electrodes
for wastewater treatment. The same situation was observed in the anodic oxidation of
samples previously clarified by chemical coagulation or electrocoagulation using iron cation.
Finally, in the last stage, clarified samples by Fe3+ ion, 0.25 g L-1, were submitted to anodic
oxidation (8 h) in two different sets with recirculation system: set A composed by Ti/Pt/SnO2-
Sb2O4 + Ti/Pt/PbO2 electrodes, and set B with BDD only. The current densities in each set
were 20 mA cm-2 and 40 mA cm-2 for Ti/Pt/SnO2-Sb2O4 and Ti/Pt/PbO2, respectively, in set A;
and 60 mA cm-2, for BDD, set B. Both the tested sets showed similar behavior in the removal
of COD, TC, DOC, TKN and ammonia nitrogen, showing the feasibility of metal oxides as
electrodes in replacement to BDD electrode in anodic oxidation systems; set A was the least
efficient in the oxidation of nitrogen to NO3-, despite show similar behavior to the set B for
production of gaseous nitrogen compounds, which reduces the total nitrogen load present in
the final samples; the COD concentration worked as an important inhibiting factor for TKN
removal. Regarding energy consumption, in a general way, the set B showed the lowest
consumption.
Keywords
BDD; Ti/Pt/PbO2; Ti/Pt/SnO2-Sb2O4; Electrochemical oxidation; Tannery wastewater; Sulfide
oxidation.

x
SUMARY
1 Introduction 1
2 Literature Review 3
2.1 Tanning Industry 3
2.2 Characteristics of the tannery industry effluent 4
2.2.1 Sulfide 7
2.2.2 Chromium 7
2.2.3 Organic load 8
2.2.4 Nitrogenous matter 10
2.3 Usual methods for wastewater treatment 11
2.4 Additional methods for wastewater treatment 12
2.4.1 Chemical Coagulation 12
2.4.1.1 Chemical coagulation by aluminum salts 13
2.4.1.2 Chemical coagulation by iron salts 15
2.4.2 Electrocoagulation 17
2.4.2.1 Electrocoagulation with aluminum anodes 17
2.4.2.2 Electrocoagulation with iron anodes 19
2.4.3 Chemical Coagulation vs. Electrocoagulation for
organic load removal 21
2.5 Anodic oxidation, a new horizon 22
2.5.1 General characteristics 22
2.5.2 The influence of the electrode type 24
2.5.2.1 Metal oxides 24
2.5.2.2 Boron-doped diamond - BDD 26
3 Analytical methods for parameters determination 29
3.1 Chemical Oxygen Demand 29
3.2 Total Dissolved Carbon, Total Dissolved Organic and
Inorganic Carbon 29
3.3 Nitrogen: Kjeldahl, Ammonia and Total 30

xi
3.4 Sulfate, Nitrate, Nitrite, Chloride, Sulfide, Sulfur and Ammonium 31
3.5 Total Chromium, Chromium (VI), Aluminum and Iron 32
3.6 pH, Conductivity, Electric Potential and Turbidity 32
4 Results and Discussions 34
4.1 Sulfide oxidation with BDD: Effect of the current density on the kinetic
of the conversion to sulfate 34
4.1.1 Sulfur and polysulfides: production and features 34
4.1.2 Sulfide removal: effect of current density and
kinetic aspects 38
4.1.3 Sulfate formation 42
4.1.4 Conclusions 45
4.2 Evaluation of the performance of three different electrode
materials – BDD, Ti/Pt/PbO2 and Ti/Pt/SnO2-Sb2O4 on the
contaminants removal 46
4.2.1 Experimental details 46
4.2.2 Wastewater characterization 46
4.2.3 Organic load removal 47
4.2.4 Nitrogen-containing compounds decay 48
4.2.5 Sulfur compounds: S2- and SO42- 50
4.2.6 pH, Conductivity and Electrical Potential 52
4.2.7 Specific Charge Consumption 53
4.2.8 Conclusions 55
4.3 Chemical or electrochemical coagulation with aluminum combined
with anodic oxidation at different electrode materials 56
4.3.1 Experimental details 56
4.3.2 Wastewater characterization 57
4.3.3 Influence of clarifier concentration and hydrodynamic
conditions on the clarification process 58
4.3.4 Clarification assays 58
4.3.5 Electro-oxidation 60

xii
4.3.5.1 Carbonaceous compounds 60
4.3.5.2 Nitrogen compounds 61
4.3.5.3 Sulfide removal and Sulfate formation 63
4.3.5.4 Chloride, Conductivity, pH and Potential 65
4.3.5.5 Specific Charge Consumption 66
4.3.6 Conclusions 68
4.4 Chemical or electrochemical coagulation with iron combined with
anodic oxidation at different electrode materials 70
4.4.1 Experimental details 70
4.4.2 Wastewater characteristics 70
4.4.3 Influence of clarifier concentration and hydrodynamic
conditions on clarification process 72
4.4.4 Clarification assays 73
4.4.5 Anodic oxidation 74
4.4.5.1 Carbonaceous compounds 74
4.4.5.2 Nitrogenous matter 76
4.4.5.3 Sulfur compounds 77
4.4.5.4 Chloride, Conductivity, pH and potential 79
4.4.5.5 Specific Charge Consumption 80
4.4.6 Conclusions 82
4.5 Chemical coagulation with iron ion, followed by two different
experimental setups of anodic oxidation with recirculation 83
4.5.1 Experimental details 83
4.5.2 Wastewater characteristics 84
4.5.3 Clarification assays by Chemical Coagulation 86
4.5.4 Anodic Oxidation 87
4.5.4.1 Carbonaceous matter 87
4.5.4.2 Nitrogenous matter 89
4.5.4.3 Sulfur compounds 91
4.5.4.4 Chromium 92

xiii
4.5.4.5 Chloride, Conductivity, pH and Potential 93
4.5.4.6 Specific Charge Consumption 95
4.5.5 Conclusions 96
5 Conclusions and prospects for future works 98
5.1 Conclusions 98
5.2 Future works 99
Bibliography 101
xiv
LIST OF FIGURES
Figure 1. Variation of a) COD removal with [X3+(ad)]/COD0 and b) (COD0 – CODfinal)
with COD0 for data presented in the literature (see Table 3 to 6) for different
techniques utilized in COD abatement. X3+(ad): aluminum or iron cations added. 22
Figure 2. a) Photograph and b) micrograph, with a magnification of 4000x, of the
sulfur formation on BDD surface, and results from the c) EDS analysis. 35
Figure 3. Variation in time of the a) potential difference between anode and
cathode and b) pH for the assays performed at different applied current densities:
[S2-]0 = 60 mM. 36
Figure 4. Sulfide removal at different applied current densities: a) Variation of the
[S2-] with time; b) Variation of the [S2-] with electrical charge; Inset of b) Time
needed for the removal of 50 % S2- initial concentration; c) and d) [S2-]1-n
experimental data versus time and fittings to experimental data (Eq. 77). S2- initial
concentration of 60 mM. 40
Figure 5. Variation of S2- concentration with time in different scenarios:
experimental (symbols); oxidation through Eq. (47) (scenario a); and oxidation
through Eq. (67) or (73) (scenario b). Applied current densities of a) 10, b) 20, c) 30,
d) 40, e) 50 and f) 60 mA cm-2. S2- initial concentration of 60 mM. 42
Figure 6. a) Evolution in time of the SO42- formation for different applied current
density; b) evolution in time of the sulfur species other than sulfide or sulfate, for
different applied current densities; c) Variation of the sulfate formation with the
electrical charge delivered; reaction pseudo-kinetic constants for the electro-
oxidation of S2- d) and for the formation of SO42- e) from S2- electro-oxidation for the
different applied current densities. [S2-]0= 60 mM. 43
Figure 7. Variations in time of a) COD, b) DOC and (inset of b) DIC for the assays
performed with the three electrode materials. I= 300 mA. 48
Figure 8. Variation in time a) TN, (inset of a) NH4+, b) NO3
- and (inset of b) TKN for
the assays performed with the three different electrode materials. I= 300 mA. 50
Figure 9. Variations of the concentration of a) S2- and b) SO42- during the assays run
with the three different electrode materials. I= 300 mA. 50
Figure 10. Values for the ratios a) [COD]/[S2-] and b) [TN]/[S2-] for the three
electrode materials tested during the assays. I= 300 mA. 51
Figure 11. Variation of a) pH, (inset of a) chloride concentration, b) conductivity
and c) potential difference for the assays performed with the three different
electrode materials. I= 300 mA. 53

xv
Figure 12. Energy consumption for the three different anodes during the electro-
oxidation assays and (inset) time needed to attain the removal of 1/3 of the initial
COD and energy consumed in this process. I= 300 mA. 54
Figure 13. Changes in the concentrations of a) S2- and b) SO42- during AO, performed
with the three electrodes, for clarified and unclarified sample. Duration: 8 h. 64
Figure 14. Variations of: a) chloride concentration; b) potential; c) conductivity and
d) pH for all the AO assays performed at the 3 electrode materials, using samples
with different pretreatments. Duration 8 h. 66
Figure 15. Changes in the concentrations of a) COD and b) TKN during AO assays for
all tested sets for clarified. Duration: 8 h. 68
Figure 16. Dynamic of variations of: a) chloride concentration; b) potential; c)
conductivity and d) pH, for all anodic oxidation assays. Duration 8 h. 80
Figure 17. Recirculation system settings for the anodic oxidation assays: a) PS setup;
b) BDD setup. 84
Figure 18. Changes in the concentrations of a) COD and b) DOC for the two tested
sets for clarified and unclarified samples. Duration: 8 h. 88
Figure 19. Changes in the concentrations of a) TN, b) TKN, c) ammonia nitrogen and
d) nitrate for the two tested setups for clarified and unclarified samples. Duration: 8
h. 90
Figure 20. Changes in the concentrations of SO42- during AO assays for all tested sets
for clarified and unclarified. Duration: 8 h. 91
Figure 21. Variations for Cr(VI) concentration for all tested setups. Duration: 8 h. 93
Figure 22. Variations in time of: a) chloride concentration; b) conductivity; c)
potential and d) pH for all AO assays. Duration 8 h. In c), P stands for PbO2 anode
and S for SnO2 anode. 93

xvi
LIST OF TABLES
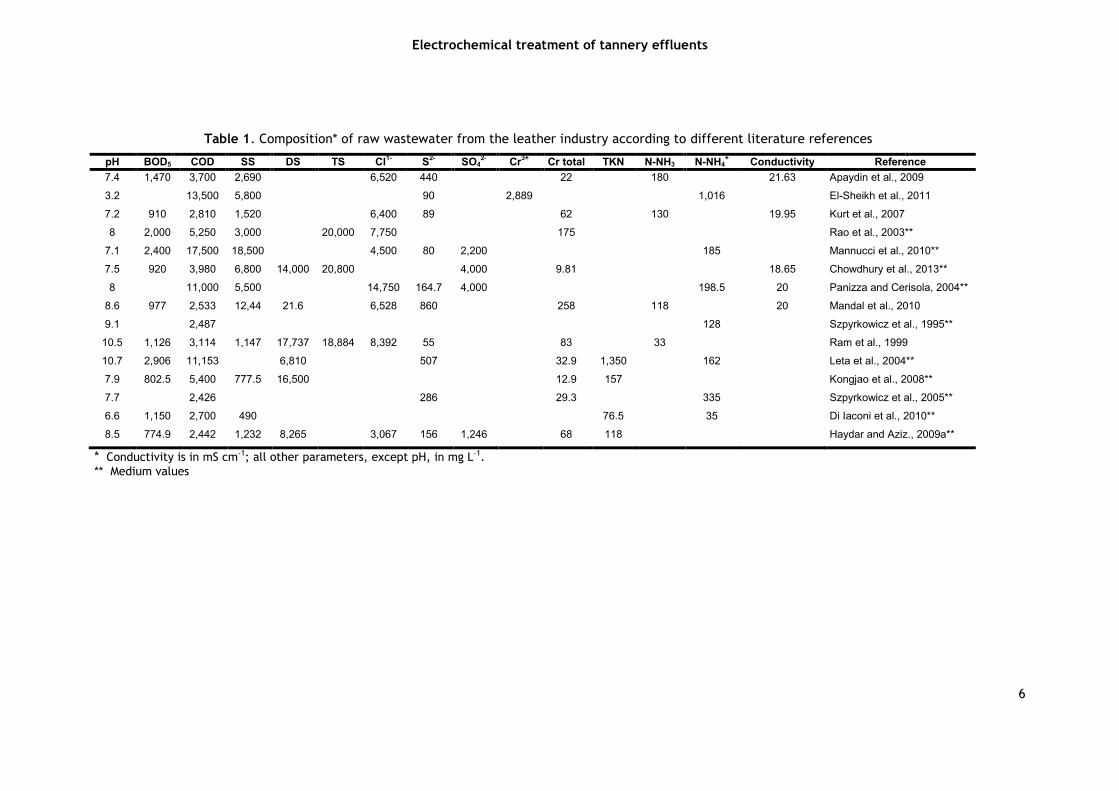
Table 1. Composition of raw wastewater from the leather industry according
to different literature references. 6
Table 2. Results presented in the literature for removal of COD, S2- and TKN
from tannery wastewaters by chemical coagulation using aluminum salts. 14
Table 3. Results presented in the reading for removal of COD, S2- and TKN
from tannery wastewaters by chemical coagulation using iron cations. 16
Table 4. Results presented in the literature for tannery wastewaters
electrocoagulation with aluminum anodes at different experimental
conditions. 19
Table 5. Results presented in the literature for tannery wastewaters
electrocoagulation with iron anodes at different experimental conditions. 21
Table 6. Results presented in the literature for tannery wastewaters electro-
oxidation at different experimental conditions. 28
Table 7. Reaction pseudo-orders for the kinetics of the [S2-] decay at different
current densities. 41
Table 8. Variation of sulfate concentration, in mg L-1, with time, in h, and
kinetic data, Eq. (79) for the formation of SO42- from S2- electro-oxidation, for
different applied current densities. 44
Table 9. Physicochemical characteristics of the effluent. 47
Table 10. Values for the expected SO42- formation, based on S2- consumption,
observed and the excess of produced SO42-. 52
Table 11. Specific charge consumption for COD and S2- removal and SO42-
formation. 54
Table 12. Hydrodynamic conditions for the clarification tests. 56
Table 13. Physicochemical characteristics and parameters concentrations for
raw effluent and after CC and EC assays, with respective standard deviations.
Conductivity is in mS cm-1; all other parameters, except pH, are in mg L-1. 57
Table 14. Turbidity values with standard deviations obtained for the different
hydrodynamic conditions (Table 12) used in clarification tests by CC. 58
Table 15. Final concentrations in COD and DOC (mg L-1), with standard
deviations, after 8 h AO assay for the samples pretreated with clarification by
CC or EC and for the raw sample. 60

xvii
Table 16. [TDC]/[DOC] ratio for AO assays. Duration: 8 h. 61
Table 17. Final concentrations (mg L-1), with standard deviations, of TN, TKN,
N-NH3 and NO3- for clarification by CC and EC, and for raw sample, after 8 h of
AO assay. 62
Table 18. [TN]/[TKN] ratio for AO assays. Duration: 8 h. 63
Table 19. SO42- concentrations (mg L-1), formed and expected for all anodic
oxidation assays considering S2- ion available. Duration: 8 h. 64
Table 20. Average specific energy consumption for 8-h AO assays: For COD,
DOC and TKN - kC/g removed; for SO42- - kC/g formed. Duration: 8 h. 67
Table 21. Specific Energy Consumption during AO assays. For COD, DOC and
TKN: kC/g removed; for SO42-: kC/g formed considering the first 4 hours. 68
Table 22. Physicochemical characteristics of the effluent analyzed with
respective values of standard deviations. Conductivity in mS cm-1; all other
parameters, except pH, in mg L-1. 71
Table 23. Residual turbidity with standard deviation after clarification by CC
to the different hydrodynamics conditions. For the different conditions, see
Table 12. 72
Table 24. Physicochemical parameters and concentrations of the pretreated
effluent, after CC and EC assays, with respective standard deviations.
Conductivity in mS cm-1; all other parameters, except pH, in mg L-1. 73
Table 25. Final concentrations (mg L-1), with standard deviations, for COD,
DOC, TDC, N-NH3, TKN, TN, NO3- and SO4
2-, for samples clarified by CC and EC,
and for SB raw sample, after 8 h of AO assay. 75
Table 26. Formed and expected SO42- concentrations (mg L-1) for all anodizing
assays after 8 h. 79
Table 27. Specific energy consumption during AO assays: For COD, DOC and
TKN - kC/g removed; for SO42- - kC/g formed. Time duration: 8 h. 81
Table 28. Specific energy consumption during AO assays: For COD, DOC and
TKN - kC/g removed; for SO42- - kC/g formed. First 4 hours. 82
Table 29. Physicochemical characteristics of effluent, with respective values
of standard deviations. Conductivity in mS cm-1; all other parameters, except
pH, in mg L-1. 85
Table 30. Residual turbidity with standard deviation after clarification by CC
at the different hydrodynamics conditions. 86

xviii
Table 31. Physicochemical characteristics of effluent after CC, with standard
deviations and variation (%) due to CC. Conductivity in mS cm-1; all other
parameters, except pH, in mg L-1. 87
Table 32. Final concentrations (mg L-1), with standard deviations, of COD and
DOC after 8 h of AO assay. 88
Table 33. Final concentrations (mg L-1), with standard deviations, of TN, TKN,
N-NH3 and NO3- after 8 h of AO assay for clarified and raw samples. 89
Table 34. Adjusted equations for chloride consumption during assays for
clarified and raw samples. All tested sets. Duration time: 8 h. 94
Table 35. Specific Energy Consumption. For COD, DOC and TKN: C/g removed;
for SO42-: C/g formed. All AO assays. The first value is for 4 h assay; the second
value is for total time. 95

xix
ACRONYMS
AO: Anodic Oxidation
BCS: Basic Chromium Sulfate
BOD: Biological Oxygen Demand
CC: Chemical Coagulation
COD: Chemical Oxygen Demand
DIC: Dissolved Inorganic Carbon
DOC: Dissolved Organic Carbon
DS: Dissolved Solids
EC: Electrocoagulation
EDS: Energy Dispersive X-ray Spectrometry
NTU: Nephelometric Turbidity Unit
SEM: Scanning Electron Microscope
SS: Suspended Solids
SC: Specific Charge Consumption
SHE: Standard Hydrogen Electrode
TDC: Total Dissolved Carbon
TKN: Total Kjeldahl Nitrogen
TN: Total Nitrogen
TS: Total Solids

Electrochemical treatment of tannery effluents
1
1 INTRODUCTION
The tanning industry converts animal hides to leather, a material relatively stable and non-
degradable. The transformation of hides/skins into leather involves three main stages: the
beamhouse, where the skins are cleaned and all the undesirable substances are removed; the
tanning process, where the pretreated skins are transformed into leather; the finishing
process that gives the wanted physical and mechanical properties to the leather.
The leather industry is one of the oldest industries in the world and tannery effluents are a
source of hazardous environmental impacts. The characteristics of tannery wastewater vary
widely and are dependent on the adopted tanning process, the amount of water used, the
process of hide preservation, and the hide processing capacity. Tannery wastewater is a
powerful pollutant that can cause severe environmental problems because of its high organic
and inorganic loads, suspended solids, and high contents in chromium, chloride, ammonia,
sulfide, oil, grease, among others.
Biological processes are often used to treat tannery wastewater. However, the application of
these processes to treat tannery effluents presents some difficulties due to their composition.
Thus, conventional biological treatment methods are often inadequate to completely remove
pollutants present in tannery wastewater. Considering the complexity of the effluents
generated by tanneries, and the serious environmental and technological problem posed by
this industry, the development of effective treatment methods for these effluents is
extremely necessary.
Electrochemical oxidation processes have already been tested for the treatment of different
types of complex wastewaters (Cabeza et al., 2007; Costa et al., 2008; Isarain-Chávez et al.,
2014; Rao et al., 2001; Panizza et al., 2010; Fernandes et al., 2014). In this context, the main
objective of this work was to evaluate and compare the efficiencies of different electrode
materials, Ti/Pt/PbO2, Ti/Pt/SnO2-Sb2O4 and BDD, in the removal of carbonaceous and
nitrogenous compounds from tannery effluents, by electrodegradation processes. Since
coagulation is by far the most widely used process for wastewater pretreatment, this work
intended also to study the electrodegradation of tannery effluents pretreated with chemical
coagulation or electrocoagulation, with iron or aluminum ions.
Sulfide and chromium are two of the most hazardous pollutants present in tannery effluents.
Thus, this work was also focused on the removal of these contaminants during the proposed
treatment, and the kinetics of sulfide removal in the form of sulfate was also studied, as well
as the influence of the clarification of the sample by chemical coagulation and
electrocoagulation on the sulfide and chromium removals.

Electrochemical treatment of tannery effluents
2
This Ph.D thesis is structured in five chapters. This first one reports an initial overview of the
present work. Chapter 2 presents a broader approach of the literature review, including the
characterization of the main stages of leather production, effluent generation, and common
treatments of the generated effluent and new procedures that can be applied for this
purpose. Materials and methods used to monitor the removal of various contaminants present
in samples from tannery industry are described on chapter 3. According to the present work
goals, chapter 4 was subdivided into different sections reporting the experimental procedure
applied, the samples preliminary treatment, the realization of anodic oxidation assays, the
results and conclusions.
The sections present on chapter 4 are structured as:
4.1 – In this section it is presented the study performed to evaluate the effect that current
density has on the conversion of S2- to SO42- during the anodic oxidation of aqueous solutions
of Na2S with the monitoring of changes in concentrations of S2- and SO42- after defined periods
of time. BDD electrode was used as anode.
4.2 – This section presents the studies done to evaluate the performance of three different
anodes, Ti/Pt/PbO2, Ti/Pt/SnO2-Sb2O4 and BDD, on the decrease of organic and nitrogenous
matter and S2-. In order to conduct this study, anodic oxidation tests were performed on
leather industry effluents. These tests include the monitoring of contaminants concentration
variation after defined periods of time and energy consumption for some contaminants.
4.3 and 4.4 – Following the results of the performances of the different electrodes utilized in
section 4.2, in these two sections, the results obtained in the anodic oxidation assays carried
out with the three electrodes are presented. The samples used in these studies were
previously clarified by chemical coagulation or electrocoagulation, using iron or aluminum as
clarification agents. The effect of the pretreatment (clarification) on the anodic oxidation
process was evaluated considering the dynamic of contaminants removal and the energy
efficiency of the process. An evaluation of the performance of each clarification agent in the
pretreatment was also reported.
4.5 – Results from sections 4.3 and 4.4 were used as a reference for the implementation of
the studies presented in this section. Therefore, two sets of anodic oxidation were assembled
with different combinations of electrodes and recirculation of the effluent. Regarding the
anodic oxidation assays, the samples were previously clarified by chemical coagulation using
iron cations. In this case, the performance of each system also was evaluated based on the
dynamic removal of contaminants and energy consumption.
The main conclusions and the prospects for future work are presented in chapter 5.

Electrochemical treatment of tannery effluents
3
2 LITERATURE REVIEW
This chapter starts with a description of the leather production process from raw fur and all
the environmental constrains of the tanning industry. An outline of the tanning process and
the implication on the characteristics and the main contaminants of the effluents is also
presented. The usual methods to treat tannery effluents and other less common treatment
technologies, such as chemical and electrochemical coagulation, are also discussed. The
chapter ends with an overview on recent proposals for pollution abatement – anodic oxidation
with boron-doped diamond and metal oxide anodes.
2.1 Tanning Industry
Leather has remained a unique material for a long time. However, on account of the
environmental threat from the tanning activity, it has changed from an ecologic to a negative
product, for the public perception (Sreeram and Ramasami, 2003). Leather tanning industry is
considered one of the most polluting industrial activities in the world (Mannucci et al., 2010).
The ecological degradation arising from traditional techniques of leather processing has been
well-documented (Rao et al., 2003).
The leather production involves leather/skin cleaning of unwanted material through a series
of pre-tanning operations, a permanent preservation through tanning, and incorporation of
aesthetic characteristics during post-tanning steps (Suthanthararajan et al., 2004). Tanning
operations consist of transforming the raw hide/skin, a highly putrescible material, into
leather, a stable product with a commercial value (Ayoub et al., 2013). The leather
production process includes different steps, in which large quantities of water and chemicals
are applied to the skins.
The transformation of skins into leather involves three main stages: a) beamhouse, which
eliminates the substances that will not compose the leather; b) tanning, where the
pretreated skins are transformed into leather; c) finishing that confers to the leather the
desired physical and mechanical properties (Costa et al., 2008; Mlaik et al., 2011; El-Sheikh
et al., 2011).
The first phase of the hides processing is called beamhouse operations and involves multiple
mechanical, chemical and biological unit operations. Its objective is to remove dirt, hair,
epidermis, non-collagenous proteins and grease from raw skin, and open up the collagen
fibers to favor the subsequent tanning process (Wang et al., 2016). The process is performed
in a drum by mixing the raw hides with an alkaline solution containing lime and reducing
agents, usually sulfide salts, being the hair chemically removed from the surface of the hide
(Șengil et al., 2009). The beamhouse operations are the most water consuming and the

Electrochemical treatment of tannery effluents
4
effluents generated present very high organic load (Mendoza-Roca et al., 2010). The dehairing
procedures are known for its uncleanness, contributing with 60 to 70% of the total pollution
load in leather production. The conventional dehairing process with sodium sulfide and lime
contributes to a significant amount of BOD, COD, sulfide, and solid wastes (Senthilvelan et
al., 2012).
The tanning process is one of the oldest procedures in the world, and currently these
industrial activities are based on chemical processes involving several organic and inorganic
compounds (Paschoal et al., 2009). This step gives the leather stabilization and durable
finish. The stabilization of the collagen matrix proteins in the skin against the wet and dry
heat, mechanical stress, enzymatic attack, among others, forms the basis of leather
production. According to Walsh and O'Halloran (1996), and Sreeram and Ramasami (2003), this
stabilization is attributed to the formation of new chemical crosslinks in the matrix proteins.
The tanning stages are classified as mineral, vegetable and synthetic. When the skin
stabilization is achieved by a suitable inorganic salt, the process is known as mineral tanning,
and the most commonly used mineral tanning salt is the basic chromium sulfate, BCS
(Sreeram and Ramasami, 2003). According to Ram et al. (1999), 90% of the leather is
produced by the chrome tanning process. The BCS is mainly a mixture of Cr(OH)SO4 and
Na2SO4, characterized as a green colored powder containing Cr2O3, 26%, and Na2(SO4), < 26%,
with 33% of basicity. This means that the BCS is one-third basic with respect to basicity of
Cr(OH)3 (Panda et al., 2016).
The finishing step complements the previous stage, tanning, and provides the leather with
the required physical and mechanical properties, such as color, tensile strength,
impermeability, softness, flexibility and elasticity.
In the different steps of the leather production process large quantities of water and
chemicals are applied to the skins, being the type of chemicals dependent on the applied
processes. Thus, the characteristics and the flow rate of the effluent are not constants. The
literature data are not accurate about the water quantity used by the leather industry, and it
can vary between 15 and 20, 30 and 35, 30 and 40, and 25 and 80 m3 of water/ton of
processed skin, according to Mohammed and Sahu (2015), Sreeram and Ramasami (2003), Rao
et al. (2003) and Mannucci et al. (2010), respectively. However, according to Chowdhury et
al. (2013), 90% of the consumed water is discharged as effluent.
2.2 Characteristics of the tannery industry effluent
The tannery wastewater is a powerful pollutant that can cause severe problems associated
with its organic load, inorganic matter, chromium, suspended solids, organic and ammoniacal
nitrogen, sulfide, chloride, among others, derived from the matter removed from raw

Electrochemical treatment of tannery effluents
5
hides/skins and from reagents added for processing these materials (Roš and Gantar, 1998;
Szpyrkowicz et al., 2001; Szpyrkowicz et al., 2005; Kongjao et al., 2008; Zhi et al., 2009;
Aber et al., 2010; Ayoub et al., 2011; Chowdhury et al., 2013; Gallego-Molina et al., 2013).
Thus, leather industry has a profound impact on the environment because it generates large
amounts of wastewater, becoming an important source of industrial wastewater and a serious
threat to the aquatic environment and the human health (Szpyrkowicz et al., 2005; Tammaro
et al., 2014).
According to Kurt et al. (2007), the characteristics of the effluent from tannery can vary
widely depending on the nature of the tanning process adopted, the amount of water used,
the skins conservation process, the ability of processing, among others. In fact, a wide variety
of constituents may be found in raw effluent of tannery, besides disparate physicochemical
characteristics. This wide range in the composition of tannery effluents is well documented in
Table 1 that gives an overview on the composition of different effluents from leather industry
presented in the literature.
In the next sections, details about some contaminants present in tannery effluents will be
presented.
Electrochemical treatment of tannery effluents
6
Table 1. Composition* of raw wastewater from the leather industry according to different literature references
pH BOD5 COD SS DS TS Cl1- S
2- SO4
2- Cr
3+ Cr total TKN N-NH3 N-NH4
+ Conductivity Reference
7.4 1,470 3,700 2,690 6,520 440 22 180 21.63 Apaydin et al., 2009
3.2 13,500 5,800 90 2,889 1,016 El-Sheikh et al., 2011
7.2 910 2,810 1,520 6,400 89 62 130 19.95 Kurt et al., 2007
8 2,000 5,250 3,000 20,000 7,750 175 Rao et al., 2003**
7.1 2,400 17,500 18,500 4,500 80 2,200 185 Mannucci et al., 2010**
7.5 920 3,980 6,800 14,000 20,800 4,000 9.81 18.65 Chowdhury et al., 2013**
8 11,000 5,500 14,750 164.7 4,000 198.5 20 Panizza and Cerisola, 2004**
8.6 977 2,533 12,44 21.6 6,528 860 258 118 20 Mandal et al., 2010
9.1 2,487 128 Szpyrkowicz et al., 1995**
10.5 1,126 3,114 1,147 17,737 18,884 8,392 55 83 33 Ram et al., 1999
10.7 2,906 11,153 6,810 507 32.9 1,350 162 Leta et al., 2004**
7.9 802.5 5,400 777.5 16,500 12.9 157 Kongjao et al., 2008**
7.7 2,426 286 29.3 335 Szpyrkowicz et al., 2005**
6.6 1,150 2,700 490 76.5 35 Di Iaconi et al., 2010**
8.5 774.9 2,442 1,232 8,265 3,067 156 1,246 68 118 Haydar and Aziz., 2009a**
* Conductivity is in mS cm-1; all other parameters, except pH, in mg L-1. ** Medium values

Electrochemical treatment of tannery effluents
7
2.2.1 Sulfide
The first step of leather production is the dehairing. As the conventional dehairing process is
performed with sodium sulfide and lime, the beamhouse effluent contains high concentration
of sulfide ions (Murugananthan et al., 2004; Șengil et al., 2009; Mendoza-Roca et al., 2010;
Senthilvelan et al., 2012). At the end of the operation, a residual bath with a pH value of
about 12 and with a high content of organic substances (proteins), lime and sulfur compounds
(as S2− and HS−) is left (Mendoza-Roca et al., 2010).
Sulfide is toxic, odorous and corrosive and is of particular concern in sewer systems, since it
causes pipes corrosion (Cai and Zheng, 2013). Concrete corrosion problems have also been
reported for S2- concentration between 0.1 and 0.5 mg L-1 (Zhang et al., 2008). Its presence in
sewage systems is a common problem due to the stimulation of the metabolic activity of
sulfate-reducing bacteria, given the high organic load and low dissolved oxygen concentration
(Garcia-de-Lomas et al., 2007).
In leather tanning industrial areas sulfide management represents a major problem (Vannini
et al., 2008). The extensive use of sulfide bears unfavorable consequences on the
environment and on the efficacy of effluent treatment systems (Senthilvelan et al., 2012).
Sulfide toxicity is a common problem for anaerobic treatment systems of industrial waste
(Wang et al., 2014b). The presence of sulfide ions in the liquid phase can cause several
problems in plants of conventional activated sludge, such as inhibition of nitrification, growth
of filamentous bacteria, floc disruption, as well as lower efficiency in sludge dehydration
(Vannini et al., 2008). Thus, beamhouse wastewater presents a great problem in the
anaerobic treatment due to the high content in sulfide and organic sulfur that, although in a
low concentration, will become sulfide during the anaerobic treatment (Schenk et al., 1999).
The soluble sulfide concentration varying from 50 to 100 mg L-1 can be tolerated by anaerobic
treatment systems; with continuous operation and some acclimation, concentration up to 200
mg L-1 of soluble sulfides can be tolerated with no significant inhibition of the anaerobic
treatment (Vijayaraghavan and Murthy, 1997). However, at a pH near neutral, sulfides at
concentrations above 200 mg L-1 are toxic to the methane-forming bacteria in anaerobic
systems (Song et al., 2001).
2.2.2 Chromium
The chrome tanning method is widely used in the majority of the tanneries, through the
application of chromium salt, although the vegetable tanning method may also be applied
(Tahir and Naseem, 2007). According to Bajza et al. (2004), chrome tanning accounts for 70
to 80% of all leather production, given the outstanding tanning properties of the trivalent
chromium ion.

Electrochemical treatment of tannery effluents
8
The leather tanning with Cr(III) was first introduced in 1858 (Walsh and O'Halloran, 1996).
Although the tanning based on chrome presents advantages such as high processing rate, low
costs and a greater stability of the produced leather, about 20 to 40% of the added chromium
do not react with the skins and remains in the final effluent (Houshyar et al., 2012). The
effluent from the chrome tanning process consists mainly of a chromium saline solution, with
a pH between 3 and 5 (Dantas Neto et al., 2004).
According to Cooman et al. (2003), the chrome tanning wastewater contains high
concentration of total chromium (up to 4,950 mg L−1). In the industrial area, the chrome
tanning wastewater stream is usually homogenized with the remaining industrial effluents and
the chromium precipitates as chromium hydroxide, thus being retained in the sludge of the
water treatment plants (Mohammed and Sahu, 2015).
The leather industry contributes with 40% of industrial pollution by chromium (López-Luna et
al., 2009). Although most of the tanning operations in leather industry is based on Cr(III),
attention is focused on the possible hazards resulting from the presence of Cr(VI) in the
effluent, due to the natural oxidation or biotransformation in the environment (Paschoal et
al., 2009). The Cr(VI) is much more mobile than Cr(III), more difficult to remove from
solution, and the most toxic form of chromium, about 10 to 100 times more toxic than Cr(III)
(Guertin et al., 2005).
Cr(III) is by far the most stable chromium oxidation state, and this is reflected in the high
oxidizing power of Cr(VI), Cr6+/Cr3+ (Eo= 1.33 V) (Greenwood and Earnshaw, 1997). However,
the inter-conversion between Cr(III) and Cr(VI) is strongly dependent on the environmental
nature (Sirajuddin et al., 2007). Moreover, although the thermodynamic indicates that Cr6+ is
present under oxic conditions, and Cr3+ predominates under anoxic or suboxic conditions, both
forms have been detected simultaneously, and one possible explanation is the slow kinetics of
reactions between Cr6+ and reducing substances (Sedlak and Chan, 1997).
Although biological processes are usually prescribed for treating industrial effluents, the high
level of chromium may exert toxic or inhibitory effects on the microorganism activities
(Dogruel et al., 2006; Houshyar et al., 2012; Lofrano et al., 2013). In fact, Stasinakis et al.
(2002) found a significant inhibition of heterotrophic growth for Cr(VI) concentration of 10 mg
L-1. Farabegoli et al. (2004) reported inhibition of nitrifying bacteria when Cr(III) reached 120
mg L-1. Leta et al. (2004) found reductions of nitrification activities when the Cr(III)
concentration reached 50 mg L-1.
2.2.3 Organic load
The tannery wastewater is a complex mixture of biogenic matter of the hides and a large
variety of organic chemicals added during the tanning process that contains high
concentrations of dissolved organic matter and suspended solids (Reemtsma and Jekel, 1997;

Electrochemical treatment of tannery effluents
9
Lefebvre et al., 2006). The organic matter is mainly due to blood, dung, proteins in solution
and in suspension, animal fats, lipids and hair from the raw skins. In fact, the raw skin loses
about 30% of the organic material during the production of the leather (Mannucci et al.,
2010). The organic matter may also be introduced during the working cycle, by the use of
tannins in the tanning process, or the use of organic solvents in the leather degreasing
(Cassano et al., 2001). Thus, according to the process utilized, effluents present a complex
and variable matrix (Ates et al., 1997). Rao et al. (2001) found the presence of various
organic compounds, namely, phenol, pelletierine, 5-benzoyloxy benzoic acid, dibutyl
phthalate, among others, in the raw wastewater.
The beamhouse operations generate the principal organic load in leather industry, but are not
the only source. In fact, the retanning and wet finishing streams are relatively low in BOD and
TSS, but contain high COD concentration, in addition to trivalent chromium, tannins,
sulfonated oils and spent dyes (Lofrano et al., 2013).
Although COD is a useful parameter that reflects the total organic content of a wastewater, it
has inherent deficiencies because it covers not only biodegradable organics but also
biologically resistant and refractory compounds, i.e., it provides no information on significant
organic fractions with different biodegradation kinetics. Despite this, some information about
the different forms of organic load were collected in the literature: Orhon et al. (1999) found
in the settled tannery wastewater that, from the total COD, 79% were biologically degraded
(19% readily, and 60% slowly biodegradable), and the residual 21% were biologically
refractory; Karahan et al. (2008), working with tannery wastewater, found that 60, 25 and
15% of the total COD were particulate fraction, soluble, and colloidal fraction, respectively.
Previous studies have reported that tannery wastewaters include biodegradable portions
comprising different fractions with distinct biodegradation rates and inert COD fractions that
play an important role on the extent of treatment performance (Ates et al., 1997; Orhon et
al., 1998). Thus, the BOD is a controversial parameter if applied to tannery wastewater since
the wastewater contains many inhibitors (Ates et al., 1997).
For leather industry that uses non-chrome tanning, the tanning stage is performed with
tannins, i.e., there is one more problem for the organic load. The tannins are polyphenolic
compounds characterized by low biodegradability (Szpyrkowicz et al., 2005). They are
difficult to break and are considered highly toxic pollutants (Vlyssides and Israilides, 1997).
Tannins form stable complexes with protein, thus making it resistant to microbial
decomposition (Vijayaraghavan and Murthy, 1997). Some groups of tannins have complex
structures, which are not easily degraded by microorganisms in either aerobic or anaerobic
environments (Mingshu et al., 2006). Methanogens bacteria are strongly inhibited by tannins
concentration between 0.3 to 2 g L-1 (Gupta and Haslam, 1980).
For the reasons presented above and because conventional biological processes are not
capable of the complete removal of these compounds, tannery wastewater is among the most

Electrochemical treatment of tannery effluents
10
difficult wastes to treat and is a serious and actual technological and environmental challenge
(Vlyssides and Israilides, 1997; Costa et al., 2008; Schrank et al., 2009).
2.2.4 Nitrogenous matter
The predominant nitrogen fraction in tannery wastewaters is organic nitrogen from non-
collagenous proteins (such as keratin, albumins, globulins, etc.) that are removed from skin
during beamhouse processing (Leta et al., 2004; Wang et al., 2016). The total nitrogen in the
beamhouse effluent is mainly organic nitrogen (60%) and ammonia nitrogen (40%), being
nitrate and nitrite negligible (Wang et al., 2012). According to the same authors, the
contamination by ammonia nitrogen is mainly originated from deliming and bating processes,
due to the use of ammonium salts that accounts for 80% of ammonia nitrogen pollution in the
beamhouse wastewater.
The elimination of solubilized proteins would considerably reduce the organic nitrogen
content, but the treatment of tannery wastewater with high organic and nitrogen contents by
conventional biological processes, such as activated sludge, is not very economical nor
technically feasible, as these processes normally require large area and high operating cost
(Marsal et al., 2010; Chung et al., 2004). The presence of sulfide, chromium and especially
chloride are likely to exert adverse effects on nitrification. Furthermore, fluctuations in
wastewater temperature become a major concern for maintaining a nitrifying biomass (Murat
et al., 2006). According to Orhon et al. (2000), the high chloride content of the wastewater
should be the major concern for the inhibition of the nitrification process, thus acting as the
limiting step for nitrogen removal.
The biological treatment is commonly used for tannery wastewater treatment (Szpyrkowicz et
al., 2001). However, according to Murat et al. (2002), the nitrogen removal from tannery
wastewater by biological treatment is more complex, since ammonium oxidizing bacteria are
difficult to maintain in the reactor biomass due to the high conductivity and the presence of
inhibiting substances. The limiting step for nitrogen oxidation is nitrification, a process which
is sensitive to inhibitory effects (Orhon et al., 1999).
In conventional biological treatment, the mass ratio of C:N:P is one of the most important
factors for achieving efficient removal of pollutants (Wang et al., 2016). The proper ratio of
C:N:P is, generally, around 100:5:1 and 250:5:1 for aerobic and anaerobic treatments,
respectively (Ammary, 2004). Tannery wastewater contains excessive nitrogen concentration
and, therefore, conventional biological treatment usually achieves unsatisfactory nitrogen
removal (Sathish et al., 2013; Zhou et al., 2014). According to Wang et al. (2016), total
nitrogen concentration in untreated wastewater is commonly higher than 200 mg L-1.
Due to the high ammonium content in tannery wastewater, it cannot be removed by
conventional nitrification and denitrification, and preliminary ammonium removal is

Electrochemical treatment of tannery effluents
11
considered as a prerequisite for the application of biological processes (Min et al., 2004).
Nevertheless, a considerable quantity of ammonium nitrogen will be formed from organic
nitrogen during biochemical treatment of tannery wastewater, resulting in the decrease of
ammonia removal rate.
2.3 Usual methods for wastewater treatment
To reduce the organic content from industrial effluents biological processes are usually
recommended (Lofrano et al., 2013). In the case of tannery general effluents, they are
usually pretreated by mechanical and physico-chemical processes, followed by biological
treatment (Bordes et al., 2015; Gomes et al., 2016). As already pointed out, biological
processes are often inefficient and inadequate to remove pollutants completely, besides
being time-consuming (Apaydin et al., 2009). In the case of tannery effluents, very often they
present low biodegradability, since the ability of some microorganisms to degrade some
contaminants is restricted, which does not allow the complete removal of these compounds
by a conventional biological process (Szpyrkowicz et al., 2005; Costa et al., 2008; Benhadji et
al., 2011). In fact, data presented in Table 1 shows only one effluent with a BOD/COD ratio
higher than 0.40 (Di Iaconi et al., 2010).
According to Reemtsma and Jekel (1997), the biological treatment of tannery effluents in two
steps, aerobic and anaerobic, tends to promotes enrichment of high-molecular weight
compounds, which can act as recalcitrant agents in the process. In addition, composition,
temperature, pH, COD, suspended solids, among others, fluctuate significantly with the
tanning procedure, leading to unsatisfactory performance of the conventional biological
treatments (Farabegoli et al., 2004; Wang et al., 2014b; Deghles and Kurt, 2016).
Furthermore, the presence of sodium sulfide (for the dehairing process) and chromium (from
the tanning process) are potentially toxic for the posterior biological treatment of the
wastewater (Song et al., 2001; Karthikeyan et al., 2012; Senthilvelan et al., 2012).
Biological sulfide oxidation under aerobic conditions is exhaustively used, but the oxygen
injection requires energy which makes the operation costly (Tang et al., 2010). On the other
hand, biological sulfide oxidation under anaerobic conditions presents problems like odor,
among others. Anyway, this process is suitable only to low sulfide concentration (Alcántara et
al., 2004). In fact, sulfide is known to be toxic to anaerobic bacteria, leading to complete
inhibition of anaerobic step for sulfide concentration higher than 260 mg L-1 (Schenk et al.,
1999; Song et al., 2001).
After beamhouse, if the tanning process is chrome based, the effluent is chrome-rich, which
can generate problems for the biological treatment. According to Lofrano et al. (2013), the
presence of metals, like chromium, can inhibit this treatment process. In fact, there is a
significant inhibition of heterotrophic growth for Cr(VI) concentration around of 10 mg L-1,

Electrochemical treatment of tannery effluents
12
and inhibition of nitrifying bacteria when chromium concentration reached 120 mg L-1, as well
as reductions in the nitrification activities when the Cr(III) concentration reached 50 mg L-1
were already reported (Stasinakis et al., 2002; Farabegoli et al., 2004; Leta et al., 2004).
Thus, alternative approaches to classical physico-chemical and biological processes to treat
tannery effluents are being increasingly explored (Bordes et al., 2015; Isarain-Chávez et al.,
2014). The main alternatives are based on basic physical treatment, chemical treatment,
including coagulation/flocculation (Garrote et al., 1995; Roš and Gantar, 1998; Ayoub et al.,
2000; Haydar and Aziz, 2009b; Ayoub et al., 2011; Islam et al., 2011; Chowdhury et al.,
2013), electrocoagulation (Murugananthan et al., 2004; Kongjao et al., 2008; Apaydin et al.,
2009; Șengil et al., 2009; Tchamango et al., 2010; Isarain-Chávez et al., 2014; Deghles and
Kurt, 2016), biological treatment (Vijayaraghavan and Murthy, 1997; Roš and Gantar, 1998;
Sekaran et al., 2013), combined chemical/biological processes (Roš and Gantar, 1998; Song et
al., 2000; Song et al., 2001; Di Iaconi et al., 2002; Song et al., 2004; Ryu et al., 2007),
electrochemical treatment (Szpyrkowicz et al., 1995; Rao et al., 2001; Szpyrkowicz et al.,
2005; Costa et al., 2008; Sundarapandiyan et al., 2010; Isarain-Chávez et al., 2014), ion
exchange (Tiravanti et al., (1997), ozonization (Preethi et al., 2009; Houshyar et al., 2012),
and Fenton (Thankappan et al., 2015), among others.
2.4 Additional methods for wastewater treatment
Since the tannery wastewater contains high amount of suspended solids and possesses high
turbidity, coagulation processes can be a good alternative to treat this type of effluents. In
this section, the treatment of this type of wastewaters by chemical coagulation and
electrocoagulation processes, using iron and aluminum ions abilities, will be discussed.
2.4.1 Chemical Coagulation
The stability of a pollutant is determined by its physical chemical properties. Many pollutants
are made of particles with the same electric charge that repel each other and create a stable
system (colloid system) (Holt et al., 2002). Settling rates of colloid forms are so slow that
remove them from the wastewater by simple sedimentation is impossible, and a coagulant
agent must be applied (Corbitt, 1989).
Coagulation is an event in which the charged particles in colloidal suspension are neutralized
by counter-ions, through mutual interaction, forming agglomerates and sedimenting (Mollah
et al., 2001). The destabilization, followed by coagulation � flocculation � sedimentation
can be achieved by cations that interact specifically with negative colloids to neutralize their
charge. Coagulation may involve two distinct mechanisms: (i) neutralization of the negative
charges of the colloids by hydrolysis products and (ii) incorporation of impurities in the

Electrochemical treatment of tannery effluents
13
amorphous hydroxides (Bajza et al., 2004). The contaminants destabilization mechanism may
be as follows: (i) compression of the diffuse double layer of charged species by the
interactions with counter-ion from coagulants; (ii) neutralization of the ionic species present
in the wastewater, reducing the electrostatic repulsion and initiating the clotting; (iii)
formation of flakes with capture of the contaminants particles and subsequent removal of
contaminants by sedimentation (Mollah et al., 2001).
The chemical coagulation (CC) process consists of the rapid dispersal of a coagulant by
intense agitation (rapid mixing), followed by non-intense agitation (slow mix) and
sedimentation. Although widely applied for effluent clarification, this treatment is influenced
by the characteristics of the raw water, temperature, pH, type of coagulant, coagulant
dosage, rapid mixing intensity and its duration time (Rossini et al., 1999).
According to Alley (2007), the coagulant dosage can be: a) insufficient to promote
coagulation; b) enough to destabilize colloids by reduction of its negative surface charges, in
a neutral or weakly acidic conditions; c) excessive, with reversal of the electric charges of
the colloids, rebalancing the particles; d) excessive with super saturation and metal
hydroxide precipitation scavenging colloidal particles, in neutral or alkaline conditions.
About the rapid mixing stage, Dharmappa et al. (1993) found that this is the most significant
step for process optimization. Nevertheless, the literature suggests conflicting
recommendations for rapid mixing times: whereas some authors suggest instant mix based on
chemical theories of adsorption-destabilization, others recommend several minutes to
detention times in rapid mixing units (Rossini et al., 1999).
The treatment of effluent by coagulation-flocculation is applied to all kinds of industries but
is particularly important for tannery industry, since it contains high organic load. A
substantial part of these pollutants can be removed at coagulation-flocculation-sedimentation
pretreatment (Haydar and Aziz, 2009c). In fact, CC is by far the most widely used way to
remove substances responsible for water turbidity (Song et al., 2004).
Although there is sludge formation during CC, this sludge is an organic mass (biosolid) and can
be applied as fertilizer to enrich the agricultural soil after being treated and stabilized
(Bengtsson and Tillman, 2004; Axelrad et al., 2013).
Metal salts are widely used as CC and play a vital role in the removal of many impurities from
polluted waters. The most common additives are aluminum sulfate, ferric chloride and ferric
sulfate (Duan and Gregory, 2003).
2.4.1.1 Chemical coagulation by aluminum salts
Hydrolyzing coagulants have been applied routinely since the beginning of the 20th century
and play a vital role in the removal of several impurities from polluted waters (Duan and
Gregory, 2003). When promoted by aluminum salts, the action mode is explained by the

Electrochemical treatment of tannery effluents
14
neutralization of the negative charges on the colloids' surface by hydrolysis products like
AlOH2+ and Al(OH)2+, Eq. (1) and (2), and incorporation of impurities by the formed hydroxide
like Al(OH)3, Eq. (3), (Holt et al., 2002).
Al3+ + H2O � AlOH2+ + H+ (1)
AlOH2++ H2O � Al(OH)2++ H+ (2)
Al(OH)2++ H2O � Al(OH)3 + H+ (3)
Al(OH)3 + H2O � Al(OH)4- + H+ (4)
Table 2 lists some results obtained in the treatment of tannery effluents by chemical
coagulation using aluminum salts as coagulant.
Table 2. Results presented in the literature for removal of COD, S2- and TKN from tannery wastewaters by chemical coagulation using aluminum salts.
Treatment Parameter C0 / mg L-1
Al3+(ad)
/ mg L-1 pH Removal / % Reference
Chemical Coagulation
COD
8080 2300 3.1 68.3 Das et al., 2007a
6650 3.99 6.8 80.0 Islam et al., 2011a
3300 88.8 7.5 32.0 Song et al., 2001
3300 88.8 7.0 36.0 Song et al., 2004
1840 18.9 7.5 58.7 Haydar and Aziz, 2009b
S2- 100 88.8 7.5 80.0 Song et al., 2001
TKN 820 88.8 7.5 40.0 Song et al., 2001
C0= initial concentration of the considered parameter; Al3+
(ad)= initial aluminum cation concentration added. a= the clarifier agent “Alum” present in Das et al., 2007, and Islam et al., 2011, was considered as KAl(SO4)2. 12H2O
Data in Table 2 illustrate the situation previously described, and the different initial pH and
organic loads may explain the different Al3+ optimized concentrations used to clarify the
samples, which produced different removals rates of the considered parameters.
About the effect of pH, the loss of removal efficiency in Das et al. (2007) appears to be
derived from the low pH value of 3.12, since, according to Alley (2007), the optimal pH range
for clarification by aluminum is between 5 and 7. Furthermore, considering that the results
were obtained from different tannery wastewater, the literature data do not identify the best
[COD]/[Al3+] ratio to maximize COD removal.
Regarding S2- and TKN removals, the work performed by Song et al. (2001) shows that the
removals of these two parameters are also satisfactory. Although S2- can be removed by

Electrochemical treatment of tannery effluents
15
addition of Al3+ cations, its removal tends to be less efficient, if compared with the removal
by Fe3+ cations. This situation can be explained on the basis of the solubility product (Ksp) of
the possible species formed from S2- with Al3+, Al2S3, Eq. (5) (Freiser, 1992), or with Fe3+,
Fe2S3, Eq. (6) (Brown and Holme, 2011). Thus, better S2- removal is expected with iron
cations, since iron sulfide is much more insoluble than aluminum sulfide.
Al3+ + S2− � Al2S3 ksp= 2.0x10⁻⁷ (5)
Fe3+ + S2− � Fe2S3 ksp= 1.4x10-88 (6)
2.4.1.2 Chemical coagulation by iron salts
According to Mollah et al. (2001), in the case of CC by FeCl3, the Fe3+ released may undergo
hydration and, depending on the pH of the solution, can produce species such as Fe(OH)2+ and
Fe(OH)2+, through Eq. (7) and (8), which are responsible for the neutralization of the
pollutants surface charges and their subsequent removal. Moreover, due to the formation of
insoluble gelatinous species, Fe(OH)3, Eq. (9), part of the suspended material is removed
during the sedimentation process.
Fe3+ + H2O � Fe(OH)2+ + H+ (7)
Fe3+ + 2 H2O � Fe(OH)2+ + 2 H+ (8)
Fe3+ + 3 H2O � Fe(OH)3 + 3 H+ (9)
Similar situation may occur when Fe2+ is the coagulant agent because there may be formation
of Fe(OH)2 or Fe(OH)3. This latter is more common for systems with a high pH.
Table 3 lists COD, S2- and TKN removals from tannery effluents by CC using iron salts as
coagulant. As the concentrations of the contaminants are not unique and depend on the
different steps, water quantity and chemicals applied to the skins production, the different
Fe2+ and Fe3+ concentrations utilized in samples clarifications and the different removal rates
obtained were expected.
According to Aboulhassan et al. (2006), FeCl3 proved to be an effective coagulant in the pH
range between 7 and 9. However, when comparing the works of Chowdhury et al. (2013),
Song et al. (2001 and 2004) and Garrote et al. (1995), with similar pH values and COD
concentrations, there is no obvious tendency in the COD removal rate with iron cation
concentration. Furthermore, if all the values presented in Table 3 are compared, it is clear
that there is no relationship between COD and Fen+ added, like [Fen+]/[COD], that provides an
ideal clarifier dosage and COD removal, i.e., the coagulation performance depends of the

Electrochemical treatment of tannery effluents
16
inherent characteristics of the effluent, and is difficult to identify the best [Fen+]/[COD] ratio
that maximizes COD removal.
Table 3. Results presented in the reading for removal of COD, S2- and TKN from tannery wastewaters by chemical coagulation using iron cations.
Treatment Parameter C0 / mg L-1
Fen+(ad)
/ mg L-1 pH Removal / % Reference
Chemical Coagulation
COD
3,980 51.7 7.0 92.4 Chowdhury et al., 2013
3,300 165.6 7.5 35.6 Song et al., 2001
9,000 34.4 12.9 64.8 Ryu et al., 2007
6,650 24.1 10.4 80.0 Islam et al., 2011
3,300 165.6 7.0 36.0 Song et al., 2004
3,192 68.9 8.5 86.0 Garrote et al., 1995
5,840 957.9 5.5 67.0 Zhi et al., 2009
S2- 100 165.6 7.5 100 Song et al., 2001
625 957.9 5.5 99.0 Zhi et al., 2009
TKN 610 34.4 12.9 36.8 Ryu et al., 2007
820 165.6 7.5 47.6 Song et al., 2001
C0= initial concentration of the considered parameter; Fen+
(ad)= Fe2+ or Fe3+ cation concentration used for clarification.
The results concerning S2- removal showed almost total removal of this parameter. The two
iron species (Fe2+ and Fe3+) are typically used for sulfide elimination by reaction with sulfide
species (Firer et al., 2008). The solubility products of FeS and Fe2S3 are 4.9x10⁻¹⁸ and 1.4x10-88
(Brown and Holme, 2011).
According to Altaş and Büyükgüngör (2008), ferric ion also reduces the sulfide concentration
by being reduced to iron (II), while the sulfide is oxidized to sulfur, Eq. (10), and ferrous ion
formed leads to sulfide precipitation. Besides that, S2- is in equilibrium with HS−, since S2- and
HS− coexist in pH between 9 and 14, with a predominance of S2- when the value is approaching
14 (Shao et al., 2012), and HS− can react with Fe2+, decreasing S2- concentration, through Eq.
(11) (Murugananthan et al., 2004).
2 Fe3+ + S2− � 2 Fe2+ +S0 (10)
Fe2+ + HS− � FeS + H+ (11)
According to Firer et al. (2008), ferric ion can also oxidize HS−, forming Fe2+ and S0, Eq. (12),
followed by FeS. In addition, HS− concentration can decrease by the formation of Fe2+ and
SO42-, Eq. (13), being sulfide concentration reduced due to FeS precipitation.

Electrochemical treatment of tannery effluents
17
2 Fe3+ + HS− � 2 Fe2+ + S0 (12)
8 Fe3+ + HS− + 4 H2O � 8 Fe2+ + SO42- + 9 H+ (13)
2.4.2 Electrocoagulation
The electrocoagulation (EC) is a complex process, with a multiplicity of synergetic
mechanisms, to remove the pollutants from the wastewater. It comprises the electro
dissolution of the sacrificial anode with hydrolysis of metal ions to form hydroxides
complexes, the destabilization of the contaminants, and the adsorption of the pollutants in
complex hydroxide precipitates to form flakes (Mollah et al., 2004).
There are a wide variety of EC reactor configurations and EC mechanisms in the literature,
depending on the different characteristics and compositions of the effluents (Holt et al.,
2002). Very often, the electrocoagulation units are used as simple ion supplier and do not
take advantage of the electrolytic gases produced in the electrocoagulation process that may
promote flotation (Holt et al., 1999). It is a technology used in primary
treatment/pretreatment of industrial effluents from agriculture or urban areas (Zongo et al.,
2009). The EC with Al and Fe electrodes was patented in the US in 1909. Production of
drinking water was the first EC application on a large scale in the US in 1946 (Chen, 2004).
The EC technology has been developed as an alternative for breaking emulsions and stable
suspensions in water, using metal salts, polyelectrolytes or polymers (Solak et al., 2009). It
has been successfully employed in removing metals, particulate matters, COD, BOD, clay
minerals, organic dyes, oil and grease from a variety of industrial effluents (Mollah et al.,
2004; Benhadji et al., 2011). Because of the relatively large capital investment and electricity
supply costs, electrochemical technology for the treatment of water has not found broad
application worldwide (Chen, 2004).
In EC, the coagulant is generated by electrolytic oxidation of a suitable anode material, which
produces, at an appropriate pH, the corresponding metal ions that almost immediately
hydrolyze to polymeric hydroxides and neutralize the electrostatic charges on the suspended
solids surface, enabling the agglomeration or coagulation, and separating them from the
aqueous phase (Holt et al., 2002; Kobya et al., 2003; Mollah et al., 2004). The EC mechanism
is extremely dependent on the chemistry of the aqueous system, especially its conductivity.
2.4.2.1 Electrocoagulation with aluminum anodes
When direct current passes through aluminum anodes, Al is oxidized to Al3+ that dissolves and
form metal hydroxide, resulting in colloidal particles, where metal hydroxides are the nucleus
(Inan et al., 2004). In the case of Al, metal hydroxide production can occur from two
different mechanisms, Eq. (14) to (20) (Ilhan et al., 2008).

Electrochemical treatment of tannery effluents
18
Mechanism 1:
Anode (oxidation)
Al � Al3+ + 3 e− (14)
Chemical (in the bulk of the solution/suspension)
Al3+ + 3 H2O � Al(OH)3 + 3 H+ (15)
Cathode (reduction)
8 H+ + 8 e− � 4 H2 (16)
Mechanism 2:
Anode (oxidation)
Al � Al3+ + 3 e− (17)
Chemical (in the bulk of the solution/suspension )
Al3+ + 3 OH− � Al(OH)3 (18)
Cathode (reduction)
2 H2O + 2 e− � H2 + 2 OH− (19)
Overall reaction for the two mechanisms:
2 Al + 6 H2O � 2 Al(OH)3 + 3 H2 (20)
Simultaneously, according to Mollah et al. (2004), water is also oxidized in the solution’s bulk
in a parallel reaction, Eq. (21).
2 H2O � 4 H+ + O2 + 4 e− (21)
The hydrolysis of the aluminum cations can form mononuclear complexes, Eq. (1), (2) and (4).
According to Mollah et al. (2004), other species, such as Al(H2O)63+, Al(H2O)5OH2+,
Al(H2O)4(OH)2+, Al2(OH)24+, Al6(OH)15
3+, Al7(OH)174+, Al8(OH)20
4+, Al13O4(OH)247+, Al13(OH)34
5+, may
also be formed over a wide pH range. These hydroxides/polyhydroxides/polyhydroxymetallic
compounds have strong affinity for dispersed particles, leading to coagulation. The produced
gas, Eq. (19) and (21), can cause flotation of the coagulated material (Mollah et al., 2004;
Benhadji et al., 2011). The clusters’ coagulation process is identical to that described for CC.
Table 4 lists some conclusions obtained during different treatments of tannery wastewater by
electrocoagulation process with the use of aluminum electrodes.

Electrochemical treatment of tannery effluents
19
Table 4. Results presented in the literature for tannery wastewaters electrocoagulation with aluminium anodes at different experimental conditions.
Treatment Parameter C0 / mg L-1
Charge / C
Al3+(ad)
/ mg L-1 pH Removal / % Reference
Electro Coagulation
COD
22,500 2157 500.0 3.0 42.0 Şengil et al. (2009)
7,680 900 83.8 7.5 90.0 Benhadji et al. (2011)
2,400 3,600 167.8 8.8 50.0 Feng et al. (2007)
2,995 4,926 91.8 6.8 80.0 Espinoza-Quiñones et al. (2009)
DOC 1,007 3,600 167.8 8.8 50.0 Feng et al. (2007)
S2- 2,100 2,157 500.0 3.0 28.0 Şengil et al. (2009)
110 3,600 167.8 8.8 9.0 Feng et al. (2007)
NH3-N 220 3,600 167.8 8.8 68.0 Feng et al. (2007)
C0= initial concentration of the considered parameter; Al3+
(ad)= Al3+ cation concentration used for clarification.
Data in Table 4 show different Al3+ concentrations applied in the clarification process, which
produced different removals rates of the considered parameters. The results not show clear
trend of increase or decrease of the efficiency of the clarification by electrocoagulation with
aluminum electrode by increasing or decreasing the applied load, which will directly
influence the concentration of aluminum cation in the clarification process, i.e., the unique
characteristics for each effluent don’t allow identify the best [Al3+]/[COD] ratio to maximize
COD removal. About the pH influence in the COD removal, the pH values for all authors not
show a linear relation with the percentage of COD removal, since it is not clear the tendency
of increase or decrease of the COD removal with the variations observed for pH values.
Regarding S2- removal, it is clear the low-yield for this process if it is realized by Al3+, since
the S2- removal by aluminum cations tends to be less efficient when compared with the
removal by Fe3+ cations. This is explained by Eq. (5) and (6) and is related with the solubility
product (Ksp) of the possible species formed from S2- with Al3+, Al2S3, or with Fe3+, Fe2S3.
Thus, low S2- removal is expected when aluminum cations are used in the clarification step,
since aluminum sulfide is more soluble than iron sulfide.
2.4.2.2 Electrocoagulation with iron anodes
According to Mollah et al. (2001), the EC with consumable iron anode can occur according to
two different mechanisms:
Mechanism 1:
Anode (oxidation):
4Fe � 4 Fe2+ + 8 e- (22)
4 Fe2+ + 10 H2O + O2 � 4 Fe(OH)3 + 8 H+ (23)

Electrochemical treatment of tannery effluents
20
Cathode (reduction):
8 H+ + 8 e- � 4 H2 (24)
Overall:
4 Fe + 10 H2O + O2 � 4 Fe(OH)3 + 4 H2 (25)
Mechanism 2:
Anode (oxidation):
Fe � Fe2+ + 2 e- (26)
Fe2+ + 2 OH- � Fe(OH)2 (27)
Cathode (reduction):
2 H2O + 2 e- � H2 + 2 OH- (28)
Overall:
Fe + 2 H2O � Fe(OH)2 + H2 (29)
The Fe3+ hydrolysis also leads to the formation of reactive species for wastewater treatment,
such as, Fe(OH)2+, Fe(OH)2+ and Fe(OH)6
3-, Fe(OH)4-, Fe(H2O)3(OH)3, Fe(H2O)6
3+, Fe(H2O)5(OH)2+,
Fe(H2O)4(OH)2+, among others, depending on the pH of the system (Mollah et al., 2004; Golder
et al., 2005).
Regardless the mechanism, the Fe(OH)n formed remains in the aqueous phase as a gelatinous
suspension, which can remove pollutants from wastewater by complexation or electrostatic
attraction, followed by coagulation. In complexation, the pollutant acts as a ligand (L) that
binds chemically to the hydrated iron, Eq. (30) (Mollah et al., 2004).
L – H + (OH)OFe � L – OFe + H2O (30)
Table 5 lists the removal rates of some parameters from tannery wastewater by EC with iron
as consumable anode.

Electrochemical treatment of tannery effluents
21
Table 5. Results presented in the literature for tannery wastewaters electrocoagulation with iron anodes at different experimental conditions.
Treatment Parameter C0 / mg L-1
Charge / C
Fen+(ad)
/ mg L-1 pH Removal / % Reference
Electro Coagulation
COD
2,400 3,600 522.4 9.8 54.0 Feng et al., 2007
22,100 3,960 2,873.0 3.0 80.0 Șengil et al., 2009
3,700 2,700 1,958.9 9.2 50.0 Apaydin et al., 2009
5,400 594.1 172.4 8.2 94.0 Kongjao et al., 2008
DOC 1,007 3,600 522.4 9.8 40.0 Feng et al., 2007
S2-
110 3,600 522.4 9.8 96.0 Feng et al., 2007
2,560 3,960 2,873.0 3.0 90.0 Șengil et al., 2009
440 2,700 1,958.9 9.2 97.0 Apaydin et al., 2009
N-NH3 225 3,600 522.4 9.8 31.0 Feng et al., 2007
180 2,700 1,958.9 9.2 10.0 Apaydin et al., 2009
TKN 157 594.1 172.4 8.2 62.0 Kongjao et al., 2008
C0= initial concentration of the considered parameter; Fen+
(ad)= Fe2+ or Fe3+ cation concentration used for clarification.
Similarly to the discussion for Table 4, the results from literature present at Table 5 show
different removals rates for a same parameter, such as COD and N-NH3, for example. In the
same way, the results not show clear trend of increase or decrease for clarification efficiency
with the increase of the iron concentration, i.e., the intrinsic characteristics of each effluent
do not allow the identification of the best [Fe3+]/[COD] or [Fe3+]/[N-NH3] ratio to maximize
COD or N-NH3 removal, respectively. In the same sense, it was noted the influence of the pH
in the removal rates of the parameters.
Regarding S2- removal, data made clear the best yield obtained in this process when iron
cations are used. As can seem at Table 5, the minimum removal was 90% for Șengil et al.,
2009. This is aligned with the high efficiency of S2- removal by iron cation, since the iron
sulfides formed through reaction between S2- and Fe2+ or Fe3+, present low solubility,
increasing the sulfide removal by sedimentation. Anyway, the results concerning S2- removal
showed an almost total removal, i.e., EC seems to be an efficient way for S2- removal.
2.4.3 Chemical Coagulation vs. Electrocoagulation for organic load
removal
The literature results regarding COD abatement by CC or EC, with aluminum or iron cations,
are presented in Tables 2 to 5. In order to find the best performance for COD abatement
between these different technologies, data from those tables was compared. Figure 1, a and
b, present, respectively, plots of COD removal vs. [X3+(ad)]/COD0 and (COD0 – CODfinal) vs. COD0,
where X3+
(ad) stands for aluminum or iron cations added, in mg L-1. It can be observed (Figure
1a) that the best results for all the tested techniques were obtained for [X3+(ad)]/COD0 lower
than 0.1, meaning that probably there is no need for adding high quantities of aluminum or

Electrochemical treatment of tannery effluents
22
iron ions, since, according to already referred, these ions are regenerated during the
coagulation process. This conclusion is corroborated by data presented in Figure 1b, which
shows a linear relation between COD removed and initial COD, i.e., the higher the initial COD
the higher the COD removed.
Regarding the efficiency of the different operations, it is not possible to assume, without any
doubt, which one is the best process for COD removal, although EC with Fe seems to lead to
the poorest results.
Figure 1. Variation of (a) COD removal with [X3+(ad)]/COD0 and (b) (COD0 – CODfinal) with
COD0 for data presented in the literature (see Table 3 to 6) for different techniques utilized in COD abatement. X
3+(ad): aluminum or iron cations added.
2.5 Anodic oxidation, a new horizon
2.5.1 General characteristics
As already pointed out, effluents from tanning industry vary greatly, and present low
biodegradability, being a serious environmental and technological problem (Di Iaconi et al.,
2002). Conventional technologies, which include biological processes followed by
sedimentation, filtration, among others, may present poor reliability, economically infeasible
and low efficiency and are not enough to reach the level of purification needed to eliminate
the negative impact on the environment (Panizza et al., 2008; Naumczyk and Kucharska,
2011).
The presence of recalcitrant pollutants to conventional biological and chemical treatments,
along with the strict restrictions imposed by legislations have encouraged the search for
alternatives to the existing conventional treatments. In recent years many scientific works
have been focused on advanced oxidation processes, like photochemical oxidation, ozonation,
Fenton oxidation and electrochemical oxidation, which offer effective wastewater
purification performance and can eliminate persistent pollutants (Woisetschläger et al.,
2013).

Electrochemical treatment of tannery effluents
23
The application of emerging technologies have been studied either as an alternative to the
conventional treatments or as a complement in tannery wastewaters treatment (Schrank et
al., 2004). Among these emerging technologies, electrochemical processes received great
attention, since they present high treatment efficiencies (Feng et al., 2003). These processes
offer: (a) flexibility, (b) automation, and (c) environmental compatibility (Costa et al., 2008).
Electrochemical reactors have been used since the early 1960’s in pollutants recovering from
electroplating industry, and were recently considered for other applications, since they can
either lead to the total mineralization of the organic pollutants or to the formation of
intermediate species, resulting in an enhancement of the biodegradability of the effluent
(Szpyrkowicz et al., 2001). According to Kurt et al. (2007), the kinetics of the electrochemical
processes is about 100 times faster than biological oxidation processes.
The electro-oxidation of wastewater containing toxic pollutants has been applied successfully
to the treatment of different types of wastewaters. In the case of the tannery wastewaters,
which have good conductivity and a high chloride concentration, electrochemical methods
may be effective as a final polishing step because the pollutants can be oxidized by direct and
indirect process (Apaydin et al., 2009).
It has been reported that the presence of high concentrations of ions, especially chlorides,
favors the electro-oxidation process, which makes tannery wastewaters suitable for the
application of this treatment (Szpyrkowicz et al., 2001). Panizza and Cerisola (2004) reported
that, for tannery wastewaters, which present good conductivity and high chloride ions
concentration, electrochemical methods have shown to be effective as a polishing step,
where organic pollutants, NH4+ and S2-, were oxidized by direct and indirect oxidation through
electrogenerated Cl2.
According to Panizza et al. (2010), the oxidation of contaminant organic matter (R), can
occurs by direct, Eq. (31), or indirect oxidation, Eq. (32) to (34), through the
electrogeneration of strong oxidizing agents, like Cl2, on the surface of the anode, which
subsequently destroy the pollutants in the solution.
R + H2O � CO2 + H+ + e- (31)
2 Cl- � Cl2 + 2 e- (32)
Cl2 + H2O � HOCl + H+ + Cl- (33)
R + HOCl � CO2 + H2O + HCl (34)
Although the oxidation of the organic matter can be attributed to two different processes,
direct and indirect oxidation, the effective degradation of contaminants is based on the
direct electrochemical process and depends mainly on the reaction with •OH radicals on the

Electrochemical treatment of tannery effluents
24
electrode’s surface (Vlyssides and Israilides, 1997). The •OH radical has a high standard
reduction potential (E = 2.80 V vs SHE) that makes it capable of non-selectively reaction with
organic molecules until their complete mineralization to CO2, water and inorganic ions (Brillas
et al., 2007).
In addition to the organic load removal, the electrochemical oxidation process has been
shown as a promising alternative for ammonium removal from different types of wastewaters
by indirect oxidation, and the reaction with ammonium is of primary importance (Szpyrkowicz
et al., 1995). Ammonium degradation takes place by chlorine generation, Eq. (32), followed
by HClO formation, Eq. (33). Finally, the HClO oxidizes the NH4+, Eq. (35) (Cabeza et al.,
2007):
2 NH4+ + 2 HClO � N2 + 2 H2O + 6 H+ + 2 Cl- + 2 e- (35)
Anodic oxidation can be very effective in removing contaminants from effluents, but
unwanted chemical species can be formed during the process. In fact, Costa et al. (2008)
verified the formation of Cr(VI) from Cr(III) in anodic oxidation of tannery effluent using DSA
electrodes.
According to Apaydin et al. (2009), electrochemical oxidation effectiveness depends strongly
on the nature of the electrode material, and there are several studies focused on pollutants
oxidation efficiency with different electrodes, improvement of the electrocatalytic activity
and electrochemical stability of the electrode materials, factors that affect the process
performance, the mechanisms and kinetics of the pollutants degradation, among others (Chen
(2004).
According to Panizza et al. (2008), although several anode materials have been tested for the
electrochemical oxidation of organic compounds, the complete mineralization to CO2 and
good energetic efficiency was obtained only using high oxygen overpotential anodes, such as
SnO2, PbO2 and BDD.
2.5.2 The influence of the electrode material
Although there are several different materials that can be used as anode in the degradation
of organic pollutants, this subchapter will be only focused on the performances of lead oxide,
antimony and stannous mixed oxides and boron-doped diamond as anode materials.
2.5.2.1 Metal oxides
Metal oxide anodes have attracted the attention of researchers due to their high conductivity
and oxidation capability (Feng et al., 2003). Several metal oxides were already tested as

Electrochemical treatment of tannery effluents
25
anodes in the electrodegradation of wastewaters, being lead oxide and antimony and
stannous mixed oxides among those most widely investigated. In fact, Ti/SnO2 and Ti/PbO2
anodes have shown effectiveness in the removal of several organic pollutants from different
wastewaters, in addition to demonstrating effectiveness in the removal of N-NH4+ (Chiang et
al., 1995; Rao et al., 2001; Chiang et al., 2001; Szpyrkowicz et al., 2005).
The indirect oxidation of organic matter, R, at the oxide anodes (MOx) surface starts with
water electrolysis, producing adsorbed •OH radicals, Eq. (36), with subsequent oxidation of R,
Eq. (37). The •OH adsorbed radicals can form adsorbed oxygen, chemically active, Eq. (38),
which can promote the oxidation of R, Eq. (39); other strong oxidants, Cl2 and HOCl, can be
produced in many effluents containing chlorides through Eq. (32) and (33), respectively
(Comninellis, 1994).
H2O + MOx � MOx[•OH] + H+ + e- (36)
R + MOx[•OH] � MOx + CO2 + z H+ + z e- (37)
MOx[•OH] � MOx+1 + H+ + e- (38)
MOx+1 + R � MOx + RO (39)
Other strong oxidants can be produced from the generated HOCl, such as OCl-, Eq. (40),
which can contribute to the elimination of the contaminant [Anglada et al. (2009)].
HOCl � H+ + OCl- (40)
The results reported by Ciríaco et al. (2009) showed that the Ti/Pt/PbO2 anode presented
considerable efficiency in total organic carbon and COD removals. Panizza and Cerisola (2004)
also obtained good results in COD reduction during the electro-oxidation of simulated
effluent, containing tannic acid, with Ti/PbO2 anodes.
Santos et al. (2013) applied Ti/SnO2–Sb2O4 and Ti/Pt/SnO2–Sb2O4 electrodes in the anodic
oxidation of pharmaceutical drugs, having achieved very good COD and DOC removals
particularly with Ti/SnO2–Sb2O4 anode. However, electrode’s lifetime is deeply increased
when the Pt interlayer is introduced. Authors have noticed the great influence on the
degradation results of the electrode preparation method and the applied current density.
The versatility of metal oxide anodes was also described by Rao et al. (2001), which reduced
the COD and N-NH4+ levels, present in tannery effluent samples, using Ti/PbO2 and Ti/MnO2
anodes. Using Ti/PbO2, the COD removals were between 64.2 and 71.3%, for an initial COD of
533.3 mg L-1, and the N-NH4+ removals varied between 48.1 and 78.4 %, for an initial N-NH4
+ of

Electrochemical treatment of tannery effluents
26
103.7 mg L-1. Panizza and Martinez-Huitle (2013) reported COD and N-NH4+ removals of 70 and
95%, respectively, after 4 hours of electrolysis of a landfill leachate, with initial COD and N-
NH4+ of 780 and 266 mg L-1, respectively. Similar results were achieved by Panizza et al.
(2010).
Ti/Pt/PbO2 and Ti/Pt/SnO2-Sb2O4 anodes were tested in samples with high organic load
(initial COD of 6,200 mg L-1) by Fernandes et al. (2014), and the results showed COD removals
of 37 and 40% for Ti/Pt/PbO2 and Ti/Pt/SnO2-Sb2O4, respectively, after 8 h of treatment at a
current density of 30 mA cm-2. Regarding N-NH4+ removals, 90 and 65% were achieved for
Ti/Pt/PbO2 and Ti/Pt/SnO2-Sb2O4 anodes, respectively, for an initial N-NH4+ concentration of
480 mg L-1. These authors reported high removal rates of ammonium nitrogen and total
nitrogen (TN).
In the last two decades, the literature provided several studies about anodic oxidation using
SnO2 anode. However, in these works, such as Comninellis and Pulgarin (1991), Comninellis
and Pulgarin (1993), Comninellis and Nerini (1995), Polcaro et al. (1999), Zanta et al. (2003),
Chen et al. (2005) and Waterston et al. (2006), among others, the process is focused on the
oxidation of phenol and its derivatives. For real effluent, papers are very scarce and only few
studies, such as Fernandes et al. (2014), are found.
According to Li et al. (2013) metal oxides electrodes have several advantages, like low cost,
long life-time, great stability, high availability, and strong electrocatalytic activity for
chlorine evolution, which can improve indirect oxidation of recalcitrant organic compounds.
Since PbO2 electrode meets all these requirements and is effective in oxidizing pollutants, it
becomes the most widely investigated metal oxide anode material for electro-oxidation
(Chen, 2004).
Although there are a lot of works about electro-oxidation of various pollutants, the
application of anodic oxidation to tannery wastewater is still relatively scarce, and there are
only a few electrode materials that have already been tested. Table 6 contains some results
reported in the literature.
2.5.2.2 Boron-doped diamond - BDD
Boron-doped diamond electrodes have been described as presenting high organic oxidation
levels (Anglada et al., 2009). This anode material is known for its high chemical stability, its
inert surface and long lifetime (Cabeza et al., 2007). However, a BDD anode is still very
expensive, and thus the industrial applications are currently very limited (Chen et al., 2003).
BDD anodes also present a high overpotential for O2 evolution, much higher than that of
conventional anodes, producing large amounts of weakly adsorbed •OH, Eq. (41), and thereby
resulting in a rapid and effective pollutants degradation (Palma-Goyes et al., 2010).

Electrochemical treatment of tannery effluents
27
BDD + H2O � BDD(•OH) + H+ + e- (41)
Thus, an organic pollutant, R, may be oxidized by the BDD(•OH) formed, Eq. (42) (Fóti et al.,
1999). At same time, oxygen can be generated from the adsorbed •OH, equation (43) (Chen et
al., 2003).
R + BDD(•OH) � BDD + CO2 + z H+ + z e- (42)
BDD(•OH) � BDD +½ O2 + H+ + e- (43)
According to Palma-Goyes et al. (2010), the BDD high oxidizing power allows simultaneous
formation of several side-oxidants, such as H2O2, S2O82- and O3, through Eq. (44) to (46),
respectively, as well as chlorinated oxidants.
2 BDD(•OH) � 2 BDD + H2O2 (44)
2 SO42- � S2O8
2- + 2 e- (45)
3 H2O � O3 + 6 H+ + 6 e- (46)
The onset potential for O2 evolution on BDD is higher than that on PbO2 and SnO2, for
example, and indicates that BDD electrodes have higher current efficiency for pollutant
oxidation (Chen, 2004).
The literature about the oxidation of real tanning effluents using BDD anodes is still scarce
and only one study was found in the literature (Isarain-Chávez et al., 2014). However, several
works have demonstrated the effectiveness of BDD electrode in pollutants removal, in the
form of organic load, nitrogen-containing compounds, like ammonia, among others (Kraft,
2007; Anglada et al., 2009; Panizza and Cerisola, 2009; Sirés and Brillas, 2012; Ganzenko et
al., 2014; Sirés et al., 2014).

Electrochemical treatment of tannery effluents
28
Table 6. Results presented in the literature for tannery wastewaters electro-oxidation at different experimental conditions.
Parameter initial concentration / mg L-1
Current density / mA cm-2
Samples volume / mL Time / h Electrode material
(area/cm2) Removal
/ % Reference
COD
544.0 16.7 200 4
Ti/PbO2 (30) 71.3
Rao et al., 2001 515.0 55.6 60 Ti/Pt
(9) 62.0
8540.0 261.1 15000 3 Ti/Pt (383) 84.0 Vlyssides and Israilides, 1997
1774.0 30
640 1.0 Ti/Pt
(100) 46.4 Szpyrkowicz et al., 1995
30 0.5 Ti/Pt/Ir (100) 10.9
TOC 1005.0 50 50 5 Ti/Ru0.30Ti0.70O2
(1) 31.3 Isarain-Chávez et al., 2014
1875.0 65 250 3 BDD (7.6) 48.0 Costa et al., 2008
NH4+
102.0 16.7 200 4
Ti/PbO2 (30) 78.4
Rao et al., 2001 107.0 55.6 60 Ti/Pt
(9) 96.0
125.0 30
640 1 Ti/Pt
(100) 79.2 Szpyrkowicz et al., 1995
30 0.5 Ti/Pt/Ir (100) 99.2
S2-
385.0 261.1 15000 3 Ti/Pt (383) ~100 Vlyssides and Israilides, 1997
1.99 16.7 200 4
Ti/PbO2 (30) 64.8
Rao et al., 2001 2.0 55.6 60 Ti/Pt
(9) 88.0
352.0 40 1000
0.38 Ti/Pt/Ir (100) 99.4
Szpyrkowicz et al., 2005 232.0 0.37 Ti/PbO-Co3O4
(100) 99.1

Electrochemical treatment of tannery effluents
29
3 ANALYTICAL METHODS FOR
PARAMETERS DETERMINATION
This chapter describes the analytical methods utilized for the determination of the different
parameters used to follow contaminants removal during the proposed treatments. It also
presents the specifications of the equipment utilized to perform the analytical
determinations.
3.1 Chemical Oxygen Demand
Chemical Oxygen Demand (COD) often is used as a measurement of pollutants in wastewater
and natural waters. It is defined as the amount of a specified oxidant that reacts with the
sample under controlled conditions. The quantity of oxidant consumed is expressed in terms
of its oxygen equivalence. Because of its unique chemical properties, the dichromate ion is
the specified oxidant for this method. Both organic and inorganic components of a sample are
subject to oxidation, but in most cases the organic component predominates and is of the
greater interest (APHA, 2005)
The COD analysis was performed according to APHA (2005), section 5220 C. For this, the
sample was refluxed in strongly acid solution with a known excess of potassium dichromate.
After digestion, the remaining unreduced K2Cr2O7 was titrated with ferrous ammonium sulfate
to determine the amount of K2Cr2O7 consumed. The oxidizable matter was calculated in terms
of oxygen equivalent.
3.2 Total Dissolved Carbon, Total Dissolved Organic and
Inorganic Carbon
The carbon in water and wastewater is composed of a variety of compounds in various
oxidation states. Some of these carbon compounds can be oxidized further by biological or
chemical processes. These fractions of carbon are defined as: inorganic carbon, total organic
carbon; dissolved organic carbon, suspended organic carbon, among others.
The Total Dissolved Carbon (TDC) represents all the carbon in the sample, including both
inorganic and organic carbon, and Dissolved Organic Carbon (DOC) and Dissolved Inorganic
Carbon (DIC) are the fractions of organic and inorganic carbon, respectively, that pass
through a 0.45 μm pore-diameter filter.
In the present study, Total Dissolved Carbon, Dissolved Inorganic Carbon and Dissolved
Organic Carbon were measured by a Shimadzu TOC-CPH analyzer combined with a TNM-1 unit,

Electrochemical treatment of tannery effluents
30
which combines a combustion catalytic oxidation at 680°C and a non-dispersive infrared
detection methods.
For TDC determinations, an automated process injected the sample into the combustion
furnace, where it undergoes combustion through heating at 680 ºC, with a platinum catalyst
in an oxygen rich atmosphere. The water is vaporized and the organic and inorganic carbons
are oxidized to CO2 and H2O. The gas phase, containing the CO2, is transported in the carrier
gas through a moisture trap and halide scrubbers, to remove water vapour and halides from
the gas stream before it reaches the detector. The CO2 generated concentration is then
measured with non-dispersive infrared detector. DIC is measured separately by injecting the
sample into a reaction chamber where it is acidified, and all inorganic carbon is converted to
CO2, which is carried to the detector and measured. The DOC value is determined by the
difference between TDC and TIC.
In this method, samples are homogenized, and diluted as necessary, and injected into a
heated reaction chamber packed with an oxidative catalyst. The water is vaporized and the
organic carbon is oxidized to CO2. The CO2 from oxidation of organic and inorganic carbon is
transported in the carrier-gas streams and is measured by means of a nondispersive infrared
analyzer. Because total carbon is measured, inorganic carbon must be removed by
acidification and sparging or measured separately and DOC obtained by difference.
3.3 Nitrogen: Kjeldahl, Ammonia and Total
The element Nitrogen is a primary growth ingredient found in numerous chemical compounds.
In waters and wastewaters the forms of nitrogen of greatest interest are, in order of
decreasing oxidation state, nitrate, nitrite, ammonia, and organic nitrogen.
Organic nitrogen is defined functionally as organically bound nitrogen in the trinegative
oxidation state. It does not include all organic nitrogen compounds. Analytically, organic
nitrogen and ammonia can be determined together and have been referred to as Kjeldahl
Nitrogen. Total Kjeldahl Nitrogen (TKN) is the sum of organic nitrogen, ammonia (NH3), and
ammonium (NH4+). Environmentally, the term ammonia refers to two chemical species which
are in equilibrium in water (NH3, un-ionized and NH4+, ionized). Total Nitrogen (TN) is the sum
of nitrate-nitrogen (N-NO3-), nitrite-nitrogen (N-NO2
-), ammonia-nitrogen (N-NH3), ammonium-
nitrogen (N-NH4+) and organically bonded nitrogen.
TKN was determined using a Kjeldatherm block digestion system and a Vapodest 20 s
distillation system, both from Gerhardt, and an automatic titrator Metrohm 876 Dosimat
Plus.s, according to APHA (2005) section 4500-Norg B. According to this section, in the
presence of sulfuric acid, potassium sulfate, and cupric sulfate catalyst, amino nitrogen of
many organic materials is converted to ammonium. Free ammonia is also converted to

Electrochemical treatment of tannery effluents
31
ammonium. After addition of base, the ammonia is distilled from an alkaline medium and
absorbed in boric or sulfuric acid. The ammonia is determined by titration with a standard
mineral acid.
The concentration of ammonia nitrogen was determined in the distillation Vapodest Gerhardt
20s, according to APHA (2005) sections 4500-NH3 B and C. For this, the sample is buffered at
pH 9.5 with a borate buffer to decrease hydrolysis of cyanates and organic nitrogen
compounds. Then, it is distilled into a solution of boric acid and the ammonia in the distillate
is determined titrimetrically with standard H2SO4 and a mixed indicator.
TN was measured in a Shimadzu TNM-1 unit coupled with the TOC-VCPH analyser. All nitrogen
present in samples is first converted to nitrogen monoxide and nitrogen dioxide by catalytic
combustion in the furnace. The nitrogen species are then reacted with ozone, to form an
excited state of nitrogen dioxide. Upon returning to ground state, the emitted light energy is
measured, using a chemiluminescence detector, and converted to TN.
3.4 Sulfate, Nitrate, Nitrite, Chloride, Sulfide, Sulfur and
Ammonium
The concentrations of SO42-, NO3
-, NO2-, Cl- and NH4
+ were determined by ion chromatography,
using a Shimadzu 10AVP HPLC instrument coupled with a conductivity detector Shimadzu CDD
10AVP. The determinations of anions was performed using an IC I-524A Shodex (4.6 mm
ID×100 mm) anion column at 40 ◦C and an aqueous solution of 2.5 mM of phthalic acid and 2.3
mM of tris(hydroxymethyl)aminomethane as a mobile phase at a flow rate of 1.5 mL min−1.
Before each HPLC run, the samples were filtered on Whatman filter with porosity 0.2 μm.
For NH4+ determination, an IC YK-A Shodex (4.6 mm ID × 100 mm) column at 40 ºC was used.
The isocratic elution mode was used and the mobile phase was a 5.0 mM tartaric acid, 1.0 mM
dipicolinic acid and 24 mM boric acid aqueous solution at a flow rate of 1.0 mL min−1.
The presence of sulfur on the electrode surface was investigated by SEM/EDS/X-ray (Scanning
Electron Microscopy (SEM), Dispersive Energy Spectroscopy (EDS) performed in a Hitachi (S-
2700)/Oxford (60–74) system operating at 20 keV, and X-ray powder diffraction (XRD) Rigaku
DMAXIII/C).
The determination of S2- concentration was performed according to APHA (2005), section
4500-S2- F. In this method, sulfide reacts with an excess of iodine in acid solution, and the
remaining iodine is then determined by titration with sodium thiosulfate, using starch as an
indicator.
Electrochemical treatment of tannery effluents
32
3.5 Total Chromium, Chromium(VI), Aluminum and Iron
Total chromium, iron and aluminum concentrations were performed by Flame Atomic
Absorption Spectroscopy (Perkin Elmer AAnalyst 800) according to APHA (2005) section 3111 B
for iron and chromium, for aluminum, section 3111 D.
In flame atomic absorption spectroscopy, a sample previously digested by HNO3-HCl in a
reflux system is aspirated into a flame and atomized. A light beam is directed through the
flame, into a monochromator, and onto a detector that measures the amount of light
absorbed by the atomized element in the flame, and a calibration curve is used to determine
the unknown concentration of an element in a solution.
The Cr(VI) concentration was realized according to APHA (2005) section 3500-Cr B using a
Shimadzu UV-Vis Spectrophotometer UV-1800. In this technique, the hexavalent chromium,
Cr(VI), is determined colorimetrically by reaction with diphenylcarbazide in acid solution that
produces a red-violet colored complex of unknown composition. From a calibration curve
which contains Cr(VI) concentration vs. Absorbance, and the absorbance determined by the
Spectrophotometer, the unknown Cr(VI) concentration is determined.
3.6 pH, Conductivity, Electric Potential and Turbidity
Acidity of a water is its quantitative capacity to react with a strong base to a selected pH.
The measured value may vary significantly with the end-point pH used in the determination.
Acidity is a measure of an aggregate property of water and can be interpreted in terms of
specific substances only when the chemical composition of the sample is known. Strong
mineral acids, weak acids such as carbonic and acetic, and hydrolyzing salts such as iron or
aluminum sulfates may contribute to the measured acidity according to the method of
determination. The measurement also reflects a change in the quality of the source water.
Conductivity is a measure of the ability of an aqueous solution to carry an electric current
which interferes in the Electric Potential. This ability depends on the presence of ions; on
their total concentration, mobility, and valence; and on the temperature of measurement.
Solutions of most inorganic species are relatively good conductors. Conversely, molecules of
organic compounds that do not dissociate in aqueous solution conduct a current very poorly,
if at all.
The clarity of a natural body of water is an important determinant of its condition and
productivity. Turbidity in water is caused by suspended and colloidal matter such as clay, silt,
finely divided organic and inorganic matter, and plankton and other microscopic organisms.
Turbidity is an expression of the optical property that causes light to be scattered and
absorbed rather than transmitted with no change in direction or flux level through the
sample. Correlation of turbidity with the weight or particle number concentration of

Electrochemical treatment of tannery effluents
33
suspended matter is difficult because the size, shape, and refractive index of the particles
affect the light-scattering properties of the suspension.
In this work, the pH was measured using a Hanna pH meter (HI931400) and the conductivity
with a Mettler Toledo conductivity meter (SevenEasy S30K). The potential was verified on the
own power supply (Laboratory DC Power Supply, Model GPS-3030D; 0-30 V, 0-3 A) used in the
assays. The CC and EC assays were performed in the Jar Test Lovibond Floc-Tester ET 730.
The turbidity was verified in the digital turbidimeter Orbeco-Hellige 965-10.

Electrochemical treatment of tannery effluents
34
4 RESULTS AND DISCUSSIONS
This chapter starts with the results obtained regarding the effect of the current density in the
kinetic of the conversion S2- to SO42-, section 4.1. Following the latter, are presented the
performances of metal oxide and BDD electrodes to remove contaminants in tannery
effluents, section 4.2. In sections 4.3 and 4.4 are evaluated the performances of two
clarifying agents, aluminum and iron, used on the pretreatment of tannery wastewater in
order to study their effects on the contaminant removal by anodic oxidation. In the last
section, 4.5, are discussed the results obtained for the efficiency of contaminant removal by
anodic oxidation in recirculation system of a pretreated effluent by iron.
4.1 Sulfide oxidation with BDD: Effect of the current density
on the kinetic of the conversion to sulfate
The objective of this study was to evaluate the effect of the current density on the kinetics of
the conversion of sulfide into sulfate, by anodic oxidation at a BDD electrode, using high
sulfide concentration.
A boron doped diamond anode, BDD, purchased from Adamant Technologies (now NeoCoat),
with an area of 10 cm2, and a stainless steel plate cathode, with similar area, were used.
Current densities were imposed by a power supply unit, Laboratory DC Power Supply, Model
GPS-3030D (0-30 V, 0-3 A). Stirring (100 rpm) was accomplished by a magnetic stirrer,
Metrohm AG.
Na2S solutions, 500 mL, with S2- concentration of 1,953.03 ± 48.70 mg L-1 (approximately 60
mM) were electrolyzed in an open system, during the proposed experimental periods, with
removal of 20 mL sample each hour for the respective analyzes: 10 mL for the determination
of S2- concentration, 5 mL to pH and conductivity measurements and 5 mL for the
determination of SO42- concentration. The presence of sulfur on the surface of BDD was
investigated by SEM/EDS/X-ray.
The current density (mA cm-2) and the run time (h) applied, (mA cm-2/h) were 10/42, 20/20,
30/20, 40/20, 50/17 and 60/15.
4.1.1 Sulfur and polysulfides: production and features
In all the sulfide electro-oxidation assays, it was observed the formation of a yellow deposit
on the surface of the BDD anode (Figure 2a). Figure 2b presents a SEM micrograph of the
yellow powder, with a magnification of 4000 times, that was confirmed as sulfur by X-ray
powder diffraction (data not shown) and EDS analyses (Figure 2c).

Electrochemical treatment of tannery effluents
35
The extent of the formation of the sulfur deposit was directly associated to the current
intensities used, i.e., the formation of sulfur on the surface of the anode increased with the
increase of the applied current density from 10 to 60 mA cm-2. This characterizes the
occurrence of reaction with sulfur formation, Eq. (47) (Awe et al., 2013). Similar results were
also obtained by other authors (Ateya and Al-Kharafi, 2002; Ateya et al., 2005; Waterston et
al., 2007; Haner et al., 2009; Al Kharafi et al., 2010; Hastie et al., 2011; Pikaar et al., 2011a;
Awe et al., 2013).
S2- � S + 2 e− Eo= -476 mV (47)
Figure 2. a) Photograph and b) micrograph, with a magnification of 4000x, of the sulfur formation on BDD surface, and results from the c) EDS analysis..
During the assays performed at 10, 20 and 30 mA cm-2 no significant variation of the potential
was observed, whereas for the assays performed at 40, 50 and 60 mA cm-2 applied current
densities it decreased in the begin of the assays and increased after some time, as can be
seen in Figure 3a. For higher current densities, the initial decrease must be related to an
increased in the formation rate of sulfate rather than sulfur that would also be responsible for
a partial polarization of the electrode’s surface.
a) b)
c)

Electrochemical treatment of tannery effluents
36
The polarization by sulfur formation may explain the initial slight increase in potential at 20
and 30 mA cm-2, since at low current densities reactions involving less electrons transfer, Eq.
(47) (Awe et al., 2013), become more important. In their works, Ateya and Al-Kharafi (2002),
Ateya et al. (2005) and Dutta et al. (2008) found that the formation of sulfur promoted the
passivation of the electrode. This seemed to be derived from the porosity of graphite
electrode that caused a strong adhesion to the electrode’s surface of the sulfur formed,
leading to greater difficulty in the transfer of the electric charge.
The sulfur deposition on the electrode surface, with subsequent passivation, was also
observed by Miller and Chen (2005) with a Ti/Ta2O5-IrO2 electrode. This situation seems to be
due to the possibility of strong adsorption of the sulfur formed on the electrode surface
because, typically, the metal oxide electrodes have higher roughness than the BDD. These
results were substantially different from those obtained by Pikaar et al. (2011b), since they
have not observed the presence of elemental sulfur on the surfaces of electrodes. This
situation appears to be associated with the low current density used by the authors, 10 mA
cm-2, and the low S2-concentration, 10 mg L-1.
Figure 3. Variation in time of the a) potential difference between anode and cathode and b) pH for the assays performed at different applied current densities: [S2-]0 = 60 mM.
Besides the formation of sulfur on the anode’s surface, it was also observed the development
of a yellow color. According to the literature (Kleinjan et al., 2005; Waterston et al., 2007;
Haner et al., 2009; Hastie et al., 2011), this phenomenon was related with the formation of
polysulfides, Sx2- (where x= 2, 3, 4, ….). The sulfur formed can react with S2- forming S2
2-, Eq.
(48), which can be oxidized, Eq. (49) to (51), providing the intensification of the color (Ateya
et al.,2005). The S22- may also be formed via Eq. (52) (Valensi et al., 1963). The fact that the
elemental sulfur concentration remains stable for most of the time indicates that the rates of
reactions described in Eq. (48), (55) to (58) (Awe et al., 2013), and (61) (Ateya and Al –
Kharafi, 2002), are smaller than the formation rate of the elemental sulfur, Eq. (47) and
(54)(Awe et al., 2013), under the experimental conditions of this work.

Electrochemical treatment of tannery effluents
37
S2- + S � S22- (48)
3 S22-� 2 S3
2- + 2 e
- E
o= -506 mV (49)
4 S32-� 3 S4
2- + 2 e
- E
o= -478 mV (50)
5 S42-� 4 S5
2- + 2 e
- E
o= -441 mV (51)
2 S2-� S2
2- + 2 e- Eo= -524 mV (52)
2 S + 3 H2O � S2O32- + 6 H+ + 4 e- E
o= 0.165 mV (53)
S22-� 2 S + 2 e- E
o= -0.310 mV (54)
4 S + 12 OH-� S4O6
2- + 6 H2O + 10 e
- E
o= -578 mV (55)
S + 6 OH-� SO3
2- + 3 H2O + 4 e
- E
o= -657 mV (56)
2 S + 6 OH-� S2O3
2- + 3 H2O + 4 e
- E
o= -743 mV (57)
S + 8 OH-� SO4
2- + 4 H2O + 6 e
- E
o= -747 mV (58)
2 S + 3 H2O � S2O32- + 6H+ + 4 e- E
o= 0.165 mV (59)
The hydrolysis of S2- occurs in two steps, according to the following equilibrium, Eq. (60) and
(61) (Rysselberghe and Gropp, 1944):
S2- + H2O � HS- + OH- K1= 10 (60)
HS- + H2O � H2S + OH- K2= 10-7 (61)
The values for the equilibrium constants K1 and K2 indicate that reaction (61) occurs in a
much smaller extent than (60). Thus, the characteristics of the solution from the S2-
hydrolysis, high pH and the presence of HS-, will be determined by reaction (60). In fact, all
the initial solutions presented pH above 7, ranging between 12.7 and 12.9. It was noted that
pH was reduced during the experiment, as can be seen in Figure 3b. The results showed that
the intensity of pH reduction appeared to be directly related to the applied current density,
particularly during the first 10 hours of the experiments. The decrease in pH is associated
with the occurrence of reactions presented in Eq. (55) to (58), among others, since the S2-
consumption is followed by OH- consumption. The reactions depicted in Eq. (62) to (64) (Awe
et al., 2013), related to the oxidation of intermediate species (S2O32-, S4O6
2- and SO32-),
eventually produced, show also the consumption of OH-, which decreases the pH.

Electrochemical treatment of tannery effluents
38
S2O32- + 10 OH-
� 2 SO42-
+ 5 H2O + 8 e- E
o= -799 mV (62)
S4O62- + 20 OH-
� 4 SO42-
+ 10 H2O + 14 e- E
o= -872 mV (63)
SO32- + 2 OH-
� SO42-
+ H2O + 2 e- E
o= -920 mV (64)
Another interesting situation is associated with Eq. (65) to (67) (Valensi et al., 1963), because
their occurrence reduces S2- concentration, inducing the displacement of Eq. (60), to produce
S2- with OH-consumption, intensifying the decrease in pH. After 15 h of the assay run at 50 mA
cm-2, and 16 h for 40 mA cm-2, i.e., when the removal of S2- was already very high, it was
noted a subtle increase of the pH, Figure 3b. This situation may be derived from the
occurrence of Eq. (68) and (69) (Milazzo et al., 1978), due to the presence of intermediate
species generated during the process. This fact would also explain lower decrease in pH after
10 hours run for the assay performed at an applied current density of 60 mA cm-2.
2 S2- + 3 H2O � S2O32-
+ 6 H+ + 8 e
- E
o= -6 mV (65)
S2- + 3 H2O � SO32-
+ 6 H+ + 6 e
- E
o= 231 mV (66)
S2- + 4 H2O � SO42-
+ 8 H+ + 8 e
- E
o= 149 mV (67)
2 SO32- + 3 H2O + 4 e-
� S2O32-
+ 6 OH- E
o= -571 mV (68)
2 SO32- + 2 H2O + 2 e-
� S2O42-
+ 4 OH- E
o= -1120 mV (69)
4.1.2 Sulfide removal: effect of current density and kinetic aspects
About sulfide removal, the results showed that it is strongly influenced by the current
density, Figure 4a. Similar results were also found by other authors (Waterston et al., 2007;
Haner et al., 2009; Hastie et al., 2011; Pikaar et al., 2011b).
The efficiency of the electro-oxidation process, expressed as sulfide removal versus electrical
charge passed, at the different applied current densities, is depicted in Figure 4b, showing a
decrease in efficiency with the increase in applied current due to an increase in the
relevance of the diffusional step. After 8 h of electrolysis, sulfide removals were 34.3, 84.8,
97.8, 99.8, 99.2 and 99.4% for the applied current densities of 10, 20, 30, 40, 50 and 60 mA
cm-2, respectively.
Further analysis showed that, if it is considered the time needed to remove 50% of the initial
[S2-] (inset of Figure 4b), the increasing current density does not decrease substantially the
time needed to achieve the desired removal, particularly for current densities between 40
and 60 mA cm-2, since for these current densities the time decreases from 6.2 to 4.9 h.
Nevertheless, when the density increases from 10 to 40 mA cm-2, the time to achieve 50%
removal in [S2-] is reduced from 29.8 to 6.2 h. The influence of the current density on the S2-

Electrochemical treatment of tannery effluents
39
consumption is shown by the occurrence of the reactions (47) and (70) to (73) (Awe et al.,
2013); (54) and (65) to (67) (Valensi et al., 1963), since the increase in current density tends
to enhance the occurrence of those reactions, having also influence on their relative
occurrence.
4 S2- + 12 OH-� S4O6
2- + 6 H2O + 18 e- Eo= -542 mV (70)
S2- + 6 OH-�SO3
2- + 3 H2O + 6 e- Eo= -598 mV (71)
2 S2- + 6 OH-� S2O3
2- + 3 H2O + 8 e- Eo= -612 mV (72)
S2- + 8 OH-� SO4
2- + 4 H2O + 8 e- Eo= -679 mV (73)
Kinetic models based on kinetic control (reaction rate independent of S2- concentration) and
diffusion control (reaction rate dependent on S2- concentration) were tested, to verify the
kinetics of S2-decay. To find the equations that best fit the experimental data, the model of
partial order developed by Li et al. (2008) was used, where the reaction rate is proportional
to [S2-]n and dependent on the applied current, as represented in Eq. (74) and (75).
reaction rate = k [S2-]nim (74)
[S2-]1-n(t) = [S2-]1-n
(0) – k(n-1) im t (75)
where, k is the kinetic constant, [S2-] is in mg L-1, i is the applied current intensity in A, t is
the time in h, and n and m are partial reaction orders. Since in each test the current intensity
remained constant throughout the experimental period, as well as n, Eq. (74) and (75) can
take the form of Eq. (76) and (77), respectively.
reaction rate = k’ [S2-]n (76)
[S2-]1-n(t) = [S2-]1-n
(0) – k’ t (77)
where k’ is a pseudo kinetic constant.
Analysis of [S2-]n versus time, at constant current density, were carried out by varying n in
steps of 0.01, up to the best correlation factor was obtained for each applied current density.
For the tests run with 60 mM sulfide initial concentration, at different current densities, the
optimal n values and the fitted equations are presented in Table 7 and Fig. 4, c and d.

Electrochemical treatment of tannery effluents
40
Figure 4. Sulfide removal at different applied current densities: a) Variation of the [S2-] with time; b) Variation of the [S2-] with electrical charge; Inset of b) Time needed for the removal of 50 % S2- initial concentration; c) and d) [S2-]1-n experimental data versus time and fittings to experimental data (Eq. 77). S2- initial concentration of 60 mM.
The different orders found for the different applied current densities suggest that the kinetics
of the S2- oxidation is strongly influenced by the current density. For 10 mA cm-2, the results
showed a second order reaction related to S2-. This behavior can be explained if it is assumed
that the system was on kinetic control and the low flux of electrons prioritizes reactions
involving few electrons, i.e., Eq. (47) and (48) or (54). The presence in these reactions of two
S2- species as reagent may explain the second order kinetics experimentally observed. The
reaction scheme will slowly proceed with Eq. (54), (49) to (51), etc, due to the limited
availability of electrons.
The increase in current density to the double, 20 mA cm-2, reduces the meaning of the
current control and gives more relevance to the S2- diffusion. A further increase in the current
density leads to an increase in the reaction order, showing that the system tends to be
controlled by diffusion. Thus, oxidation was influenced by both the oxidation rate, kinetic
control, and the diffusion rate of the substrate, diffusive control, as also observed by Haner
et al. (2009) and Waterston et al. (2007).

Electrochemical treatment of tannery effluents
41
Table 7. Reaction pseudo-orders for the kinetics of the [S2-] decay at different current densities.
Current density / mA cm-2 10 20 30 40 50 60
Reaction order –n 2.00 0.15 0.24 0.36 0.43 0.44
A value for the reaction order that is different from an integer is typically indicative of a
complex mechanism that, in this case, must be a consequence of the competition between
reactions, sometimes consuming S2-, Eq. (47), (48), (66) and (67), among others, or consuming
intermediate species derived from the previous reactions and competing for electric charges,
Eq. (62) to (64) and (49), among others.
Considering the various presented possibilities for the S2- oxidation, regarding the possible
species formed, it was evaluated the behavior of S2- during the oxidation process in relation
to the SO42- formation for the two extremes situations: a) transfer of 2 electric charges –
oxidation of S2- to S0, reaction (47); b) transfer of 8 electric charges – oxidation of S2- to SO42-,
Eq. (67) or (73). Figure 5 presents the hypothetical decays in [S2-] if only extremes scenarios
a) and b) were possible, as well as the real scenario. Scenarios a) and b) were calculated
using the respective current intensities and Coulomb's law, Eq. (78).
q= i t (78)
where q is the electric charge, in C, i is the current intensity, in A, and t is in s.
According to Figure 5, a to f, the decrease in S2- concentration showed intermediate behavior
between the exclusive formation of elemental sulfur and the direct formation of SO42-, i.e.,
the oxidation of S2- occurs in steps in which the intermediate oxygenated species are formed
and oxidized gradually until the final step represented by SO42-. If there was a direct
oxidation to SO42-, the decrease in S2- concentration would be less effective; on the other
hand, if there was only oxidation of S2- to elemental sulfur, the decay of the S2- concentration
would be dramatically higher. So, the reaction pathway involves the occurrence of the
reactions described by Eq. (48) to (51), where the sulfur formed on the surface of BDD reacts
with the S2- producing Sx2-. In fact, the formation of Sx
2- was observed, since the liquid phase
presented a yellow color. However, polysulfides produced are consumed, producing SO42- as a
final step, explaining the loss of the yellow coloration.

Electrochemical treatment of tannery effluents
42
Figure 5. Variation of S2- concentration with time in different scenarios: experimental (symbols); oxidation through Eq. (47) (scenario a); and oxidation through Eq. (67) or (73) (scenario b). Applied current densities of a) 10, b) 20, c) 30, d) 40, e) 50 and f) 60 mA cm-2. S2- initial concentration of 60 mM.
4.1.3 Sulfate formation
Regardless of the applied current density, in all the assays there was the formation of SO42-.
However, its formation rate is strongly influenced by the current density, with a linear
behavior, as can be seen in Figure 6a for the initial S2- concentration of 60 mM. The S2-
oxidation to SO42- can happen either by direct oxidation, Eq. (67) or (73), or by indirect
reactions, Eq. (66) followed by (64), and the greater the availability of electrons, the higher
the sulfate formation rate. The linear equations adjusted to the experimental data up to the
fifteenth hour of the assay are presented in Table 8.
To better understand the formation of SO42- from the oxidation of S2-, Eq. (79) was adjusted
to the experimental data obtained for the SO42- formation rate, being assumed that SO4
2--is
obtained from S2- oxidation and neglecting the formed intermediates.

Electrochemical treatment of tannery effluents
43
��������
�k �S���� i� (79)
where k’’ is a kinetic pseudo-constant for the sulfate formation, n’ and m’ are the reaction
order for [S2-] and for current intensity, respectively.
By applying natural logarithm to Eq. (79) and using the Solver tool from Excel, the values of
k’’, n’ and m’ were calculated, using the experimental data for the variation of [SO42-]and [S2-
]with time. The obtained values are presented in Table 8, except for n’ that is equal to zero
for all the applied current densities tested, and it can be observed that the sulfate formation
is only dependent on the current density. Lower current densities originate lower SO42-
formation yield due to the current control and to the accumulation of intermediate species,
such as S22-, S3
2-, SO32-, S2O3
2-, and others.
Figure 6. a) Evolution in time of the SO42- formation for different applied current density;
b) evolution in time of the sulfur species other than sulfide or sulfate, for different applied current densities; c) Variation of the sulfate formation with the electrical charge delivered; reaction pseudo-kinetic constants for the electro-oxidation of S2- (d) and for the formation of SO4
2- (e) from S2- electro-oxidation for the different applied current densities.[S2-]o= 60 mM.

Electrochemical treatment of tannery effluents
44
Table 8. Variation of sulfate concentration, in mg L-1, with time, in h, and kinetic data, Eq. (79) for the formation of SO4
2- from S2- electro-oxidation, for different applied current densities
j / mA cm-2 Adjusted equations R2 k” / mg L-1 h-1 A-1 m’
10 [SO42-] = 30.47 t + 178.6 0.990 348 1.05
20 [SO42-] = 178.6 t + 128.6 0.993 951 1.00
30 [SO42-] = 264.6 t – 146.3 0.992 905 1.00
40 [SO42-] = 342.5 t – 96.94 0.996 794 1.00
50 [SO42-] = 374.5 t + 3.217 0.998 682 1.00
60 [SO42-] = 400.1 t + 74.70 0.999 667 1.04
To find out the amount of other sulfur oxidized species different from SO42-, the variation of
[S2-]0 - [S2-] - [SO4
2-] was plotted against time (Fig. 6b), showing that the oxidation of S2- may
involve the formation of different species, besides the direct conversion into SO42-. In fact,
the oxidation conducted at 10 and 20 mA cm -2 showed the greatest differences in the mass
balances, and persistently, indicating that the conversion of S2- into SO42- via anodic oxidation
tends to present greater difficulties, because of the competition with the intermediate
species by electrons.
For 20 mA cm-2, the mass balance showed that consumption of S2- was also followed by
intense formation of intermediate species, with the maximum difference between the
expected and the total sulfur formed at 18 h of run. Regarding the results for 30 mA cm-2, the
mass balance shows low oxidation to SO42- until 7 h. Between 7 and 12 h, the accumulation of
intermediates remained approximately constant, indicating an increase in their oxidation rate
probably due to the decrease in the [S2-] after the 12 h assay.
For 40 and 50 mA cm-2, the trend lines are similar to the assays performed at 20 and 30 mA
cm-2. This similarity in the intermediate species concentration between 20 and 50 mA cm-2
applied current densities doesn’t necessarily means that the rate of SO42- formation is equal,
because [S2-] decay increases with current density and, consequently, if the intermediates
concentration is equal the SO42- formation must be higher for the highest applied current
density.
The highest current density used in the last test, 60 mA cm-2, showed a slightly different
behavior. Apparently, the higher current intensity promoted more intense oxidation of S2- in
the first moments, i.e., generating appreciable concentrations of intermediate sulfur species.
As can be seen in Figure 6b, at 5 h it was achieved the maximum concentration of those
species, intensifying the competition between them and S2-. After 5 h run, an enhancement of
the intermediates oxidative process or a reduction on their formation rate is observed.

Electrochemical treatment of tannery effluents
45
The current efficiency for the formation of sulfate from sulfide oxidation is depicted in Figure
6c, being the lowest efficiency observed for 10 mA cm-2, probably because reactions involving
lower number of electrons are favored, leading to low sulfate formation rate. On the other
hand, the highest current efficiency regarding sulfate formation is observed for 20 mA cm-2,
since this must be the lowest current density that maintains the process in diffusional control,
but with low oxygen evolution. For current density higher than 20 mA cm-2, the process is
clearly in diffusional control, wasting part of the applied current in oxygen evolution, which
increases with applied current.
The influence of the applied current density on the direct formation of sulfate from sulfide
can also be visualized in Figure 6, d and e, where the pseudo-kinetic constants k’ and k’’,
obtained from data presented on Figure 4, c and d, and Table 8, are plotted against the
current density. If data for 10 mA cm-2 is excluded, it can be observed that the decay in [S2-]
is less influenced by changes in the applied current density than the sulfate formation rate,
meaning that an increase in the current density will increase mainly the conversion of the
intermediate species to sulfate rather than the oxidation of sulfide to intermediate species.
The k’ and k’’ values for 10 mA cm-2 can be explained by the low current intensity that
greatly increases the current control.
4.1.4 Conclusions
The results obtained have proved that sulfide can be efficiently converted to sulfate by
electrochemical oxidation using a BDD anode and that the process can be used to efficiently
remove sulfide from effluents, even when its concentration is high. The following conclusions
were also obtained:
- Oxidation of S2- to SO42- occurs in stages, characterized by the formation of sulfurous
intermediate species, oxygenated or not, whose concentration tends to be lower with the
increase in the applied current density.
- The oxidation of S2- does not follow a single pathway, being dependent on the applied
current density and presenting order 2 for the lower applied current density, which is
compatible with a mechanism involving two S2- ions to give S22-. For higher applied current
densities, where the current control is less important, the reaction order varies from 0.15 to
0.44 for the applied current densities of 20 and 60 mA cm-2, respectively.
- The formation of SO42- is strongly influenced by the applied current density, probably due to
the involvement of hydroxyl radicals, and it is not dependent on the sulfide concentration.

Electrochemical treatment of tannery effluents
46
4.2 Evaluation of the performance of three different electrode
materials – BDD, Ti/Pt/PbO2 and Ti/PtSnO2-Sb2O4 - on the
contaminants removal
The aim of this work was to evaluate and compare the efficiencies of different electrode
materials, Ti/Pt/PbO2, Ti/Pt/SnO2-Sb2O4 and BDD, in the removal of carbonaceous and
nitrogenous compounds from tannery effluents, simultaneously with the kinetic study of
sulfide removal in the form of sulfate.
4.2.1 Experimental details
The electrodegradation assays were performed in batch mode for 8 h with constant stirring
(100 rpm), using 250 mL of effluent collected in Curtumes Fabricio lda, Seia, Portugal.
Ti/Pt/PbO2, Ti/Pt/SnO2-Sb2O4 (henceforth designated by PbO2 and SnO2, respectively) and
BDD were used as anodes; a stainless steel foil was used as cathode. The electrodes of
Ti/Pt/PbO2 and Ti/Pt/SnO2-Sb2O4 (4 electrodepositions repetitions) were prepared as
described in the literature (Andrade et al., 2007; Ciríaco et al., 2009; Santos et al., 2013).
The electrodes immersed areas were 10 cm2, with an inter-electrode gap of 2 cm.
Experiments were conducted at an applied current intensity of 0.3 A, at ambient temperature
(22-25 oC), without the addition of supporting electrolyte. A power supply unit (Laboratory DC
Power supply, Model GPS-3030D (0-30 V, 0-3 A) was utilized as power source.
For each experiment, 6 mL of sample were collected hourly to determine the proposed
parameters: COD, TDC, DOC, TKN, TN, S2-, SO42-, Cl-, NO3
-, NO2-, NH4
+, pH and conductivity.
4.2.2 Wastewater characterization
The analyzed effluent was produced in the washing process of the salted skins, and the
samples used in this study were collected in an equalization basin, after a peroxide
treatment, which aimed to oxidize the sulfide used in the skins’ preparation process. The
characteristics of the effluent are presented in Table 9.
The effluent contains a high organic load, which gives rise to high COD, DOC and TDC
contents. The organic load is mainly due to fat, flesh, hair, skin, tallow and collagen fibers,
derived from the skin cleaning process. Ammonium, nitrites and nitrates are low and the total
nitrogen is almost only organic nitrogen, due to the presence of amino acids. Sulfide
concentration is high, being one of the main problems of these effluents. It results from the
skins pelage removal process, which utilizes sodium sulfide.
In the specific case of the effluent used in this study, since it was collected in a tank after
the application of hydrogen peroxide, part of the sulfide was already oxidized to sulfate and,

Electrochemical treatment of tannery effluents
47
thus, high concentration in SO42- was expected. The high chloride concentration is due to the
brine of the skins. The high pH value of 11.3 comes from the use of calcium oxide in the
initial stages of the skins preparation process. Thus, the high value observed for the
conductivity is derived from the several ionic species utilized during the initial procedures,
previously cited.
Table 9. Physicochemical characteristics of the effluent.
Parameter Average initialvalue (±SDa) COD / g L-1 30 ± 1 TDC / g L-1 7.95 ± 0.01 DOC / g L-1 7.81 ± 0.01 NH4
+ / mg L-1 95 ± 4 NO2
- / mg L-1 5.0 ± 0.1 NO3
- /mg L-1 50 ± 3 TN / g N L-1 2.98 ± 0.01 TKN / g N L-1 2.81 ± 0.05 S2- / mg L-1 339 ± 1 SO4
2- / g L-1 2.16 ± 0.01 Cl- / g L-1 6.09 ± 0.04 pH 11.3 ± 0.1 Conductivity / mS cm-1 26.7 ± 0.6
aStandard Deviation
The results presented in Table 9 may differ from others presented in the literature, because
samples were collected in different parts of the effluents treatment plant: Kurt et al. (2007)
and Apaydin et al. (2009) used the effluent obtained after the equalization basin;
Szpyrkowicz et al. (2001) analyzed an effluent from an anaerobic treatment; Szpyrkowicz et
al. (1995) and Song et al. (2001) worked with effluent collected after sedimentation tank;
Rao et al (2001) used effluent gathered after secondary clarification stage; El-Sheikh et al.
(2011) used effluent collected after a physicochemical treatment.
4.2.3 Organic load removal
The results of the organic load removal obtained in the electrodegradation assays performed
at 30 mA cm-2, with the different electrode materials, are presented in Figure 7. In the first
four hours of the experiments, similar COD removals were attained with the different anode
materials. After that time, higher removal efficiency was observed for the BDD electrode
(Fig. 7a). At 4 hours assay, the COD removals were 29.6, 28.9 and 28.5% for BDD, PbO2 and
SnO2, respectively, indicating the possibility of using metal oxides as a good alternative to
BDD electrodes. For the total running time, 8 h, COD removals were 42.4, 34.7 and 35.8% for
BDD, PbO2 and SnO2, respectively.
Regarding PbO2 electrode, Rao et al. (2001) achieved higher COD removal rates than the
obtained in this study. However, these authors used a tannery wastewater from secondary

Electrochemical treatment of tannery effluents
48
clarifier with an average initial COD of 544 mg O2 L-1, much lower than the value observed in
the effluent utilized in this study, 30 g O2 L-1. This may indicate the possibility of using metal
oxides electrodes not only for degrading wastewater contaminants, but also as polishing step
after biological treatment of the effluent.
In the removals of DOC (Fig. 7b) and TDC (data not shown) with the three electrode
materials, BDD presented better results at the end of the 8 h assay, showing an augmented
appetency for the mineralization of the organic compounds.
Figure 7. Variations in time of a) COD, b) DOC and (inset of b) DIC for the assays performed with the three electrode materials. I= 300 mA.
Considering that the oxidation of the organic matter present in effluents can occurs by direct
or indirect oxidation, and although the effective degradation of contaminants is based on the
direct electrochemical process and depends mainly on the reaction with •OH radicals on the
electrode’s surface, the high Cl- concentration in the samples (Table 9), the decays in COD,
DOC and TDC along the treatment process and the characteristic strong odor of active
chlorine during electrolysis, it appears evident the existence of simultaneous direct and
indirect oxidation processes.
During the oxidation assays there are small variations in the DIC content (Fig 7b, inset), for all
the tested anode materials. These variations must be mainly due to the progressive
dissolution of the suspended solids present in the initial samples, process that must be also
responsible for the low reductions in DOC observed during the 8th hour of the assays. This
fact is not observed for COD, since DOC determinations are made with filtered samples and
COD with non-filtered samples.
4.2.4 Nitrogen-containing compounds decay
Regarding TN removal, Figure 8a, the results show that the PbO2 and SnO2 electrodes tested
led to similar yields (24%), being the results obtained with BDD slightly better (30%). The TN

Electrochemical treatment of tannery effluents
49
reductions obtained with the metal oxides electrodes show that, in the case of this
parameter, they can be used as a BDD alternative to remove nitrogen from wastewater.
The initial concentration of TN and TKN were very similar, being almost all TN oxidizable.
Thus, the TN reduction, the NO2- constant concentration observed (about 5 mg L-1, data not
shown) and the limited production of NO3- (maximum 214.3 mg L-1 for BDD, Figure 8b)
indicate that almost all TN removal was due to nitrogen losses in the gaseous form, such as
N2. However, the irregular variation presented by ammonia concentration points to a removal
of the organic nitrogen by a mechanism that presents as first step its conversion to ammonia,
followed by ammonia conversion to nitrogen gaseous forms or nitrate.
The formation of NO3-, Figure 8b, showed very distinct behaviors for the different anode
materials, since during the assays the formation of this species was 214.3, 153.6 and 103.7 mg
L-1, for BDD, PbO2 and SnO2, respectively. Whereas BDD showed greater efficiency in the
production of NO3-, SnO2 was the least efficient in the N-containing compounds oxidation to
NO3-. Thus, despite similar TN reductions provided by the three electrodes, BDD presents the
highest ability to convert nitrogen to NO3-, whereas SnO2 presents the lowest.
The loss in the ability for converting NH4+ to NO3
- in the presence of Cl- was also noted by
Cabeza et al. (2007). According to these authors, Cl- improves the efficiency for NH4+ removal
but not its conversion to NO3-. However, it should be noted that in the case of SnO2, the
results showed that most of the nitrogen was converted to nitrogen gaseous species, which is
an interesting situation because N and P are watercourses eutrophic agents, and the
elimination of nitrogen from solution means that it will not be released into water bodies,
thus reducing the potential for eutrophication.
The irregular variation for the NH4+ concentration obtained during the assays performed with
BDD, PbO2 and SnO2 electrodes (inset of Figure 8a), which presents a residual value, shows a
lower efficacy in eliminating NH4+ than that observed by Rao et al. (2001), in assays
performed with smaller running times and lower current densities for an NH4+ initial content
only slightly higher than the initial concentration of the samples used in this work (Table 9).
However, the COD values for the samples used by Rao et al. (2001), around 500 mg L-1, were
much lower than the initial value of the effluent used in this study, 30 g L-1. Thus, it can be
seen that the NH4+ oxidation process observed by Rao et al. (2001) seems to have been
intensified due to the low COD content of the samples. In the present study, the competition
between organic matter and NH4+, due to the higher COD content, led to a decrease in the
NH4+ oxidation rate.

Electrochemical treatment of tannery effluents
50
Figure 8. Variation in time a) TN, (inset of a) NH4+, b) NO3
- and (inset of b) TKN for the assays performed with the three different electrode materials. I= 300 mA.
The NH4+ present in solutions containing Cl- is indirectly oxidized according to Eq. (35)
(Szpyrkowicz et al., 2001). This later explanation, and the proposed mechanism for the
elimination of the organic nitrogen, already observed in different studies (Santos et al.,
2010), may explain the irregular variation of the ammonia content.
Regarding TKN variation during the assays (inset of Figure 8b), BDD is the most effective
anode for the oxidation of the organic nitrogen, followed by SnO2 anode.
4.2.5 Sulfur compounds: S2- and SO42-
The results presented in Figure 9a show that S2- removal by BDD electrode was higher than
with the other two tested electrodes. After 8 hours, reductions in S2- concentrations were
64.7, 44.1 and 27.9% for BDD, PbO2 and SnO2, respectively. Besides the different removal
rates observed, a different removal dynamic for the three electrodes tested was also noted.
Figure 9. Variations of the concentration of a) S2- and b) SO42- during the assays run with the
three different electrode materials. I= 300 mA.

Electrochemical treatment of tannery effluents
51
At the beginning of run, BDD presented higher S2- removal rate when compared with the other
electrodes. After the fourth hour, the oxidation rate of S2- at BDD showed an increase that
was kept until the end of the experiment. The PbO2 electrode provided reductions in the
concentration of this parameter only after the third hour of the assay, and SnO2 only after the
fourth hour, the later with an apparent removal rate higher than that obtained with PbO2
after that initial period.
According to the results, it seems that S2- removal was limited by COD and TN contents, i.e.,
there is a priority in the removal, by electro-oxidation, of the different wastewater
contaminants. In fact, the results showed that the removal of S2- by BDD follows a trend in
which is noted the inhibition of the S2- oxidation by organic load and total nitrogen. However,
from the fourth hour of the assays, COD/[S2-] and [TN]/[S2-] ratios reach the values of 84 and
9 (Figure 10, a and b) and S2- oxidation become more intense. Apparently, there are limits of
COD and TN concentrations, depending on the concentration of S2-, from which the oxidation
of S2- tends to be more efficient. Similar situations were observed for the electrodes of PbO2
and SnO2.
Figure 10. Values for the ratios a) [COD]/[S2-] and b) [TN]/[S2-] for the three electrode materials tested during the assays. I= 300 mA.
Regarding to the PbO2 electrode, the boundary limits were 68 and 7 to [COD]/[S2-] and
[TN]/[S2-], respectively. To the SnO2 electrode, the boundary limits were 64 and 6.8. These
results make clear the greater ability of BDD for the simultaneous removal of organic load,
total nitrogen and sulfide. Thus, S2- oxidation rate seems to be strongly limited by COD and
TN, and this limitation is more intensely observed for the PbO2 and SnO2 electrodes.
For the SO42- formation, Figure 9b, the behavior of the electrodes were similar to those found
in the S2- removal, that is, the best performance was observed by the BDD, followed by PbO2
and SnO2. Further analysis of the results showed a discrepancy between S2- decay and SO42-

Electrochemical treatment of tannery effluents
52
formation, Table 10, presenting all the three electrodes formation of SO42- amounts higher
than expected based on S2- consumption. This fact indicates that much of the sulfur in the
system was in the form of structures with intermediate oxidation states between S2- and SO42-.
Thus, the electro-oxidation promoted the oxidation to SO42- of the S2- and other sulfur species
present in the samples.
Table 10. Values for the expected SO42- formation, based on S2-consumption, observed
and the excess of produced SO42-.
Electrode S2- consumed /
mg L-1 SO4
2- expected / mg L-1
SO42- formed / mg L-1
Excess / %
BDD 219.0 657.8 1838.2 179.4 PbO2 149.3 447.9 1754.4 291.7 SnO2 94.6 283.8 1558.2 449.0
4.2.6 pH, Conductivity and Electrical Potential
The results showed a reduction during the assays of the pH in the three systems tested, as
can be seen in Fig. 11a. For BDD electrode, this situation appears to be associated with the
occurrence of reactions shown by Eq. (41), (42) and (46). For the other two electrodes,
equations (36), (37) and (38) may explain the phenomenon. Besides, the reactions (33), (35)
and (40) also are associated with the pH reduction for all systems.
The strong chlorine odor found in the three systems, formed via Eq. (33), and the reduction in
COD, DOC and TDC, Eq. (33) followed by (34) also appear to be involved in pH reduction.
Similar analysis can be extrapolated for Eq. (35), related with ammonia oxidation. According
to Panizza and Cerisola (2004), the initial pH is an important parameter in indirect
electrochemical processes because it influences the activity of chlorine and its oxidation
potential. In fact, the electrogenerated chlorine can disproportionate, forming hypochlorous
acid, Eq. (33), which is converted to hypochlorite ions, by Eq. (40).
Furthermore, the higher COD removal obtained with BDD is mainly related with Eq. (41) and
(42), justifying the larger pH drop for the sample treated by this electrode.
Regarding the variation of the conductivity during the assays, Figure 11b, the higher increase
occurred for BDD and may be explained by the higher reduction observed in COD, as well as,
higher NO3- formation, etc. In fact, the formation of smaller particles will increase the value
of the conductivity.BDD electrode was also the material that presented the highest initial
potential difference, 7.5 V, compared to the other two electrodes tested, PbO2, 5.9 V, and
SnO2, 6.7 V, Figure 11c. Similar results were found by Fernandes et al. (2014) in the electro-
oxidation of landfill leachate. According to these authors, this situation is due to the higher
conductivity of the metal oxides electrodes when compared to BDD.

Electrochemical treatment of tannery effluents
53
Figure 11. Variation of a) pH, (inset of a) chloride concentration, b) conductivity and c) potential difference for the assays performed with the three different electrode materials. I= 300 mA.
In all systems, it was noted a reduction in the potential during the assays. According to Costa
et al. (2008), the electrode potential reduction occurs due to the increasing conductivity of
the samples along the assay. The reduction in the electrical resistance of the system appears
to be derived from the increase in ionic species and small molecules formed during the
elimination and/or conversion of contaminants that also contribute to the increase in
conductivity of the samples. Thus, it appears that BDD has a higher efficiency, given the
higher increase in the potential reduction observed for this material. This is in line with its
great ability for oxidation of wastewater contaminants.
4.2.7 Specific Charge Consumption
To analyze the effect of different electrode materials, the specific charge consumption, SC,
in C (g of removed COD)-1, was determined by Eq. (80). For S2-, C (g of removed S2-)-1; for
SO42-, in C (g of formed SO4
2-)-1.
�� ��
���������� ! (80)
where i is the current intensity, in A, t is in s, and CODn and CODm are COD values, in g L-1, at
time n and m, respectively, and V is the volume, in L. As can be seen in Figure 12, the results
showed that for 8 h assay BDD presented the lowest energy consumption. However, for the
first three hours of the assays, the charge consumption for the different electrodes was very
similar, around 1.77 kCg-1 COD removed, indicating the possibility of the application of metal
oxide electrodes as an alternative to BDD in the COD removal from tannery effluents.

Electrochemical treatment of tannery effluents
54
Regarding S2- removal, the results showed that in addition to providing the greatest reduction
of this contaminant, BDD presented the lowest power consumption, as can be seen in Table
11, showing a great ability for S2- removal from tannery wastewater. However, when the
energy consumption for the SO42- formation is evaluated, the results show that, although SnO2
energy consumption is higher, SnO2 led to the increased formation of SO42- based on S2-
consumed, as described above. This situation shows that although SnO2 electrode presents
higher power consumption than BDD, it presented higher ability to produce SO42- from S2- and
other various sulfur species.
Figure 12. Charge consumption for the three different anodes during the electro-oxidation assays and (inset) time needed to attain the removal of 1/3 of the initial COD and energy consumed in this process. I= 300 mA.
Table 11. Specific charge consumption for COD and S2- removal and SO42- formation.
Electrode Specific charge consumption (kC g-1)
COD consumed S2- consumed SO42- formed
BDD 2.70 157.81 18.80
PbO2 3.25 231.40 19.70
SnO2 3.21 365.33 22.18

Electrochemical treatment of tannery effluents
55
4.2.8 Conclusions
The results obtained show that:
- BDD proved to be more efficient in the removal of COD and TDC without, however,
presenting different behavior from the two other electrodes with respect to DOC removal;
- Although SnO2 electrode has smaller ability for conversion of nitrogen forms into NO3-, it
presents as an interesting alternative for the removal of this contaminant by converting the
organic nitrogen to gaseous N-containing compounds, which is very interesting to avoid
eutrophication of the water bodies;
- Whereas BDD acts intensively on the S2- oxidation to SO42-, promoting this conversion at
higher initial rates than the other tested electrode materials, after a time interval, rates
become similar. In some cases, the oxide metal electrodes present even higher sulfide
oxidation rates, showing the possibility of their application in the treatment of tannery
wastewater for S2-removal. This is interesting because they are less expensive materials than
BDD;
- In addition to greater ability for COD removal, BDD presented also the lowest energy
consumption.

Electrochemical treatment of tannery effluents
56
4.3 Chemical or electrochemical coagulation with aluminum
combined with anodic oxidation at different electrode materials
The aim of this study was to evaluate and compare the efficiencies of different electrode
materials, SnO2, PbO2 and BDD, in the removal of carbonaceous and nitrogenous compounds
from tannery effluents previously clarified by chemical coagulation, with aluminum salts, or
by electrochemical coagulation with aluminum sacrificial anodes. In addition, the kinetic
study of sulfide removal in the form of sulfate during anodic oxidation assays of tannery
wastewater samples pretreated with chemical coagulation or electrocoagulation, by
aluminum cations, was also assessed.
4.3.1 Experimental details
Before the sample’s clarification by chemical coagulation, the determination of the best
dosage of clarifier Al2(SO4)3 was carried out in a Jar Test equipment, Lovibond Floc tester ET
730. Samples (0.4 L) were tested for different Al3+concentrations, 0.25, 0.5, 1.0, 2.0 and 4.0
g L-1, for three different hydrodynamic conditions, as shown in Table 12. All tests were run in
duplicate.
Table 12. Hydrodynamic conditions for the clarification tests.
Operation Condition 1 Condition 2 Condition 3
time (/min) / stirring rate (/rpm)
rapid mixing 1 / 100 2 / 200 3 / 200
slow mixing 15 / 20 15 / 20 15 / 20
sedimentation 120 / 0 120 / 0 120 / 0
After each clarification test, the determination of residual turbidity was carried out using a
digital turbidimeter Orbeco-Hellige 965-10. The dosage of clarifier that generated lower
residual turbidity was defined as the best concentration for the clarification stage. Once
determined the best clarifying conditions, sufficient quantities of samples were obtained to
perform the anodic electro-oxidation steps with SnO2, PbO2 and BDD anodes.
To evaluate the performance of the clarifications by chemical coagulation and
electrocoagulation, the raw effluent was also subjected to clarification by
electrocoagulation. In this step, aluminum plates were used as cathode and anode. The
electrodes were separated by 2 cm, with 20 cm of immersed areas each one. The EC was
performed with 0.4 L of sample volume, contained in 0.6 L glass beakers, placed in the Jar
Test. The stirring rate was 20 rpm. The EC time was similar to that one used in the mixing
process of the CC assays; the applied electric current was the sufficient to reach the best

Electrochemical treatment of tannery effluents
57
clarifier concentration determined for the CC assays. The assays were repeated until enough
clarified samples were produced for the electro-oxidation tests to be run with SnO2, PbO2 and
BDD anodes.
The electro-oxidation assays were conducted in batch mode, for 8 h with constant stirring
(100 rpm), using 400 mL of clarified sample at room temperature (22-25 oC) without adding
any electrolyte. SnO2, PbO2 and BDD electrodes were used as anodes; a stainless steel plate
was used as cathode. The anode and the cathode were separated by 2 cm, having 10 cm2 of
immersed area each one. The electric current used was 0.3 A. A power supply unit
(Laboratory DC Power Supply, GPS-3030D model (0-30 V, 0-3 A)) was used as the power
source.
For each oxidation assay, 12 mL of sample were taken in intervals of 2 h to determine the
proposed parameters: COD, DOC, TDC, DIC, TKN, TN, N-NH3, S2-, SO4
2-, Cl-, NO3-, NO2
-, Al3+, pH
and conductivity. The samples subjected to determination of aluminum concentration were
those pre- and post-clarified (0 h), and collected at 4 and 8 h of the anodic oxidation assays.
4.3.2 Wastewater characterization
Table 13 shows the results for the raw wastewater characterization, collected in the
equalization tank of a tannery industry, Curtumes Fabricio lda, Seia, Portugal. The effluent
contains mostly organic compounds, such as fats, meat, hair, skin, fat and collagen fibers
derived from the skin cleaning process, which directly contribute for the COD, TDC, DOC and
TN parameters. The presence of S2- results from the process of hair removal that uses sodium
sulfide. For this reason, high S2- concentration was observed in the samples.
Table 13. Physicochemical characteristics and parameters concentrations for raw effluent and after CC and EC assays, with respective standard deviations. Conductivity is in mS cm-1; all other parameters, except pH, are in mg L-1.
Parameter Raw sample After CC After EC pH 9.0 ± 0.1 7.6 ± 0.0 9.9 ± 0.1
Conductivity 20.4 ± 0.0 21.1 ± 0.2 18.6 ± 0.1 COD 5,326 ± 73 3,354 ± 85 3,423 ± 35 DOC 1,332± 6 982 ± 27 1,051 ± 15 TDC 1,562 ± 14 1,094 ± 39 1,164 ± 17 DIC 233 ± 4 116 ± 8 116 ± 8
N-NH3 328 ± 6 311 ± 7 287 ± 16 TKN 468 ± 5 357 ± 2 354 ± 4 TN 489 ± 1 413 ± 6 406 ± 8 S2- 165 ± 4 114 ± 2 110 ± 3
NO3- 20 ± 2 30 ± 9 16 ± 2
NO2- < 5.0 < 5.0 < 5.0
SO42- 1,053 ± 8 2,380 ± 23 910 ± 27
Al 8 ± 3 2.4 ± 0.3 20 ± 2 Cl- 5,306 ± 96 5,223 ± 35 4,881 ± 13

Electrochemical treatment of tannery effluents
58
The high Cl- concentration observed in the initial effluent results from the leather processing
process, since it is previously salty. The initial pH value, 9.3, results from the use of calcium
oxide in the initial stages of the preparation process of the skin. The high conductivity is
derived from the various substances used during the procedures previously cited.
The reasons why the results of the effluent characterization differ substantially from those
presented in the literature were already discussed in section 4.2.2 of this thesis.
4.3.3 Influence of clarifier concentration and hydrodynamic conditions on
the clarification process
The results from the effluent clarification tests are shown in Table 14. It was found that the
clarification efficacy was influenced by the concentration of the clarifying agent, reaching
the maximum efficiency for Al3+ concentration of 0.5 g L-1. The increase in turbidity observed
at concentrations higher than 0.5 g L-1 was due to the loss of clarification efficiency, because
excess coagulant reverses the neutralization of the surface charge of suspended particles,
preventing the coagulation (Duan and Gregory, 2003).
Table 14. Turbidity values with standard deviations obtained for the different hydrodynamic conditions (Table 12) used in clarification tests by CC.
[Al3+] /g L-1 Turbidity (NTU)
Condition 1 Condition 2 Condition 3 0.0 2,530 ± 42 2,520 ± 240 2,726 ± 35 0.25 80 ± 28 44 ± 1 50 ± 2 0.5 6 ± 1 6 ± 1 6.5 ± 0.7 1.0 72 ± 10 73 ± 6 72 ± 26 2.0 532 ± 9 489 ± 32 440 ± 13 4.0 681 ± 42 684 ± 69 701 ± 90
Regarding the hydrodynamic characteristics of the process, there were no significant
influences. Considering the residual turbidity and the fact that condition 1 requires less
energy consumption (rapid mixing step), the anodic oxidation assays were performed with
clarified samples under this condition, utilizing an Al3+ concentration of 0.5 g L-1.
4.3.4 Clarification assays
Given the conclusions obtained in the previous subsection for the best experimental
conditions to perform CC, the experimental conditions set for EC assays were the following:
an EC time of 18 min, similar to that one used in the mixing process of the CC assays; an
applied electric current of 1.98 A, needed to introduce in the raw effluent an aluminum
amount similar to that used in CC experiment during the 18 min.

Electrochemical treatment of tannery effluents
59
The experimental results obtained in the clarification assays showed no significant differences
between the CC and the EC clarification processes for COD removal (Table 13). The COD
removal for CC and EC were 37% (1,972 mg L-1) and 36% (1,903 mg L-1), respectively. This
shows the feasibility of applying any of the two processes tested for the effluent clarification.
Nevertheless, the clarification of wastewater by using aluminum, either CC or EC, presents a
large drawback that is the formation of sludge rich in this metal, because it is a toxic metal.
Table 13 shows that approximately 85% of TDC was organic carbon. This was expected, since
the effluent used in this study was a newly generated effluent. Furthermore, approximately
30% (468 mg L-1) of TDC was removed in the CC step. Regarding DOC, the clarification assay
by CC and EC reached removals of 26% (350 mg L-1) and 21% (281 mg L-1), respectively, Table
13. Although it was used the same concentration of Al3+ (0.5 g L-1) in both cases, these
differences can be derived from a better operational control in CC process than in EC. The
best operational control in clarification by CC can explain the change in the aluminum
concentration from raw to after CC and after EC, Table 13, because it decreased from 8 to
2.4 mg L-1 for CC, whereas for EC an increase in its concentration was observed, with 20 mg L-
1 as final value.
The N-NH3 removals were low: 5.2% (17 mg L-1) for CC and 12.5% (41 mg L-1) for EC. This
reduced efficacy in the N-NH3 depletion during coagulation/flocculation happens because of
ammonia solubilization. A different situation was observed for TKN, since the removals by CC
and EC were 23.8 and 24.3%, respectively. These values were very similar to those verified for
DOC. This shows that the fall in TN concentration during coagulation/flocculation for tannery
wastewater treatment is mainly derived from TKN removal and occurs parallel to DOC
removal.
The results for S2- removal, Table 13, showed that the two applied clarification methods, CC
and EC, presented similar efficiencies in the removing of S2-, 30.9% (51 mg L-1) and 33.3% (55
mg L-1), respectively. As it was expected, reductions in the S2- levels by aluminum cation were
much lower than those observed in the literature when iron cation is used. The low efficiency
of aluminum for S2- removal, if compared with iron, is easily evidenced by Eq. (5), since the
solubility of the product formed, Al2S3, is not as low as that observed for the Fe2S3, Eq. (6).
The increase in SO42- concentration during clarification by CC , from 1,053 to 2,380 mg L-1 (+
126%) was expected, since it was used Al2(SO4)3 as clarifier agent. For the samples clarified by
EC, significant differences between the initial and final SO42- concentration were not verified.
This evidences that the EC is not a good process for SO42- removal.
The reduction in the chlorine concentration, when comparing values for Raw and after EC
clarification samples, appears to be associated with the EC process itself, since the oxidation
at the anode can produces Cl2, Eq. (32), that induces Cl- consumption.

Electrochemical treatment of tannery effluents
60
4.3.5 Electro-oxidation
4.3.5.1 Carbonaceous compounds
The anodic oxidation of the clarified samples from CC and EC showed similar results in all
tests for COD removal, Table 15. However, at the end of the 8 h of AO, the samples clarified
by CC and oxidized using PbO2 and BDD anodes showed substantial difference from the value
observed for the SnO2 anode for COD removal, 40% (1,344 mg L-1), 41% (1,366 mg L-1) and 31%
(1,035 mg L-1), respectively.
The observed results for COD removal for the CC+AO and CE+AO sets were higher than those
observed for anodic oxidation of not clarified samples. This situation demonstrates once again
the possibility of use of AO as polishing step in the treatment of tannery industry effluents,
and the importance of the pretreatment as factor for the best performance of the oxidation
system.
Table 15. Final concentrations in COD and DOC (mg L-1), with standard deviations, after 8 h AO assay for the samples pretreated with clarification by CC or EC and for the raw sample.
Electrode Pretreatment
CC EC Raw CC EC Raw COD DOC
SnO2 2,319 ± 17 2,296 ± 47 3,323 ± 62 951 ± 4 924 ± 13 1,186 ± 23 PbO2 2,010 ± 46 2,181 ± 31 3,097 ± 40 897 ± 5 916 ± 9 1,106 ± 32 BDD 1,988 ± 49 2,058 ± 20 2,717 ± 141 773 ± 13 797 ± 2 1,021 ± 27
Regarding DOC removal, the results obtained with BDD for the clarified (CC or EC) and
unclarified samples are better than those obtained with SnO2 and PbO2 electrodes, Table 15.
This situation is consistent with the high oxidant capacity of the BDD, compared with the
other two tested electrodes, and demonstrates its ability to eliminate organic carbon.
For the anodic oxidation of the unclarified sample, the best performance in DOC removal was
presented by the BDD electrode, 23.4% removal (311 mg L-1). However, only the DOC removal
during clarification by the CC was higher, 26.3% (350.0 mg L-1), Tables 13 and 15. This
situation confirms the limited capacity of AO, since the verified DOC removal by CC was
greater than that observed for the best electrode, the BDD. On the other hand, if considered
the CC+AO set for BDD, the total DOC removal increased to 40% (535 mg L-1). Thus, despite its
limitation, the data confirm that the AO can be studied as a polishing step in the treatment of
pre-treated tannery effluent, e.g., by CC.
According to Vlyssides and Israilides (1997), the effective degradation of the organic matter
present in effluents is based on the direct electrochemical process and depends mainly on the
reaction with •OH radicals on the electrode’s surface, Eq. (41). Besides, the BDD anode
presents an overvpotential for O2 evolution, much higher than the conventional anodes,

Electrochemical treatment of tannery effluents
61
producing large amounts of adsorbed •OH, Eq. (41), and thereby resulting in a rapid and
effective pollutants degradation (Palma-Goyes et al., 2010). These observations can explain
the greatest removal of COD by BDD.
Further analysis showed that, for all samples, the TDC and DOC removals were not similar
during the AO assay, with a slight advantage for the TDC removal, since the relationship
between [TDC]/[DOC] decreased, as can be seen in Table 16. Thus, although the AO process
has shown good performance for TDC removal, in special for DIC removal, it did not present
the same efficiency in the DOC elimination.
Table 16. [TDC]/[DOC] ratio for AO assays. Duration: 8 h.
Pretreatment Time / h [TDC]/[DOC]
SnO2 PbO2 BDD
Raw 0 1.2 1.2 1.2 8 1.0 1.0 1.0
CC 0 1.1 1.1 1.1 8 1.0 1.0 1.0
EC 0 1.1 1.1 1.1 8 1.0 1.0 1.0
The high Cl- concentration in the samples, Table 13, the COD, TDC and DOC removals in the
process and the strong characteristic odor of active chlorine, showed the participation of
chlorine, and its derivatives, in the removal process of the organic matter, through indirect
oxidation. However, according to Vlyssides and Israilides (1997), whereas the active chlorine
can act as a mediator for wastewater treatment, Eq. (81) and (82), it is unable to completely
oxidize the organic compounds. Thus, it can be inferred that the observed depletion in the
DOC concentration was almost exclusively derived from the reactions occurring on the surface
of the electrodes, Eq. (31).
R + Cl2 + e- � RCl + Cl- (81)
RCl + OH- � RO + Cl
- + H
+ + e
- (82)
4.3.5.2 Nitrogen compounds
The results showed high efficacy of BDD in the removal of ammonia nitrogen for all the tested
samples. The SnO2 electrode presented the lowest performance, Table 17. However, for the
three tested electrodes, the ammonia nitrogen removal during AO was substantially lower for
the raw effluent than for the clarified effluent. This situation seems to be derived from the
competition for the electric charges by the organic load, Eq. (31), and the Cl-, to form Cl2 and
HOCl, Eq. (32) and (33), respectively, with posterior attack to the organic contaminants, Eq.

Electrochemical treatment of tannery effluents
62
(34), since in these cases, the sample had large organic load. Thus, it is clear the negative
influence of the organic load in the ammonia removal by anodic oxidation. The NH4+ present
in solutions containing Cl- is indirectly oxidized according to Eq. (35).
Table 17. Final concentrations (mg L-1), with standard deviations, of TN, TKN, N-NH3 and NO3
- for clarification by CC and EC, and for raw sample, after 8 h of AO assay.
Parameter Pretreatment Electrode
SnO2 PbO2 BDD
TN Raw 278 ± 5 237 ± 17 217 ± 9 CC 238 ± 9 213 ± 8 154 ± 6 EC 225 ± 2 178 ± 8 206 ± 13
TKN Raw 225 ± 19 190 ± 5 136 ± 12 CC 195 ± 6 164 ± 7 54 ± 10 EC 179 ± 2 135 ± 5 108 ± 1
N-NH3 Raw 149 ± 9 120 ± 12 70 ± 7 CC 120 ± 8 100 ± 6 26 ± 4 EC 123 ± 6 120 ± 12 57 ± 9
NO3-
Raw 142 ± 5 185 ± 2 406 ± 13 CC 161 ± 2 210 ± 10 467.9 ± 0.8 EC 100 ± 8 185 ± 11 419 ± 24
The ammonia nitrogen reductions found by Rao et al. (2001) were much higher, even with
lesser running time and current densities. At the end of 4 h and using current densities
ranging from 6.7 to 16.7 mA cm-2, the NH4+ removals were between 48.1 and 81.2% for an
initial concentration between 102 and 105 mg L-1, just above the concentration in this work.
However, the COD concentration in Rao et al. (2001), presented values between 520 and 544
mg L-1, much lower than in this work, 5,326 mg L-1. Thus, it can be concluded that the
oxidative processes for NH4+ removal, observed in the Rao et al. (2001) study, were
intensified due to the low COD concentration, i.e., the decrease in competition between
organic carbonated matter and Cl- for the electric charges due to the low COD concentrations
have led to more intense oxidative activity of NH4+.
The observed results for ammonia oxidation open an interesting possibility of AO application
for post-treatment of anaerobic steps, because this system, besides removing organic load,
also promotes the conversion of organic nitrogen into ammonia nitrogen, which could
facilitate the nitrogen removal in the case of a posterior AO treatment. Moreover, the
reduction in nitrogen load in the effluent limits its eutrophic ability for water courses.
Although, in general, the BDD electrode has better yields, the results showed that the anodic
oxidation by PbO2 and SnO2, when applied to clarified effluent, can satisfactorily remove the
ammonia nitrogen.

Electrochemical treatment of tannery effluents
63
Further analysis showed that the Kjeldahl nitrogen removal was more intense than that
observed for TN, for all electrodes, Table 17, i.e., Kjeldhal nitrogen oxidation occurred more
intensively than the loss of nitrogen as N2, Eq. (35), or other gaseous forms of nitrogen. In
addition, BDD electrode showed the best TKN capacity removal when compared to the other
two tested electrodes. Table 18 presents TN/TKN ratios for the different assays and it can be
observed that there is an increase in this ratio, in particular for the assays run with BDD
anode.
Regarding the reductions in TN concentrations for the three tested electrodes during the
anodic oxidation tests, Tables 13 and 17, BDD presented the best performance, followed by
PbO2 and SnO2. BDD electrode also presents greater capacity for conversion of ammonia
nitrogen into nitrates, since these parameters present the highest values for the electro-
oxidation performed with this anode, being SnO2the electrode with the low stability for the
conversion of ammonia to nitrate. During all the assays, NO2- concentrations below 5 mg L-1
were found.
Table 18. [TN]/[TKN] ratio for AO assays. Duration: 8 h.
Pretreatment Time / h [TN]/[TKN]
SnO2 PbO2 BDD
Raw 0 1.0 1.0 1.0 8 1.2 1.3 1.6
CC 0 1.2 1.2 1.2 8 1.2 1.3 2.8
EC 0 1.1 1.1 1.1 8 1.3 1.3 1.9
4.3.5.3 Sulfide removal and Sulfate formation
Results obtained for the anodic oxidation of the clarified samples showed that after 4 hours
the S2- ion was completely eliminated, Figure 13a. This shows that the tested electrodes have
similar efficiencies for sulfide removal, showing that PbO2 and SnO2 anodes can be used for S2-
removal from effluents with similar concentrations to those observed in this study.
Regarding S2- removal, there is no advantage of sample clarification, since after 4 h of AO of
raw samples there was no noticeable S2- concentrations.
The SO42- concentrations increased over the time, Figure 13b, with a tendency to stabilize
after 8 h of assay, showing the scarcity of SO42- precursor species. It was also found that the
SO42- final concentrations were much higher than the initial S2– concentration. Detailed
analysis showed that the conversion S2-/SO42- presented peculiar characteristics. As it can be
seen in Table 19, the three electrodes produced SO42- quantity above the predicted, based on

Electrochemical treatment of tannery effluents
64
S2-availability. This situation shows that the SO42- formation is due to S2- oxidation, oxidation
of intermediate sulfur species derived from S2-, originally present in the samples, and also
from organic sulfur.
When comparing the results for clarified samples, the samples clarified by CC presented
lower SO42- formation than those clarified by EC, Table 19. Such a situation is probably due to
a more intense removal of existing sulfur species in the clarification by CC. It seems that the
best CC operational control provided better performance, which can facilitated the removal
of these species, with lower formation of SO42- during AO. In the case of wastewater
treatment process optimization, this seems to be very interesting, since removing almost
total S2- and sulfur species by CC reduces competition for electrical charges, favoring the
removal of carbonaceous and nitrogenous contaminants.
Figure 13. Changes in the concentrations of a) S2- and b) SO42-during AO, performed with
the three electrodes, for clarified and unclarified sample. Duration: 8 h.
For all the series, the final SO42- concentrations obtained for SnO2 and PbO2 electrodes were
similar to those observed for BDD, indicating the possibility of using metal oxide electrodes,
like SnO2 and PbO2, to replace BDD in the conversion of species containing sulfur into SO42- in
the electrochemical oxidation of tannery effluents.
Table 19. SO42- concentrations (mg L-1), formed and expected for all anodic oxidation assays,
considering S2- ion available. Duration: 8 h.
SO42-
CC EC without clarification SnO2 PbO2 BDD SnO2 PbO2 BDD SnO2 PbO2 BDD
Formed 686.0 726.0 653.0 1027.0 978.0 949.0 863.0 879.0 842.0 Expected 341.1 341.1 341.1 330.3 330.3 330.3 475.5 475.5 475.5

Electrochemical treatment of tannery effluents
65
4.3.5.4 Chloride, Conductivity, pH and Potential
The Cl- concentrations decreased over the experiments, Figure 14a, independently of the
process. This situation seems to be associated with the loss of Cl- as Cl2, Eq. (32), since it was
observed the occurrence of a strong odor to Cl2 during the assays.
For all the tests, Figure 14b, BDD was the electrode material that systematically presented
the highest potential. Similar results were found by Fernandes et al. (2014) during tests with
the same electrodes in the electro-oxidation of landfill leachate and were attributed to the
higher conductivity of the metal oxides when compared to BDD.
For all samples submitted to electro-oxidation by SnO2 and PbO2, clarified or not, it was not
found any trend in the potential variation. However, with BDD a clear reduction in the
potential throughout the assays was observed, as can be seen in Figure 14b. According to
Costa et al. (2008), reductions in the potential occur due to the increase in sample’s
conductivity. This reduction appears to be derived from the increase in the number of ionic
species and small molecules formed due to the initial pollutants electrodegradation.
The decrease in the initial conductivity for samples pretreated with EC, when compared with
the initial conductivity for raw sample, Figure 14c, appears be derived from the
electrocoagulation process itself, since the reactions occurring in the system, reduction and
oxidation reactions, can change the molecular structure of some contaminants, promoting the
reducing in conductivity.
About pH, the results demonstrated a decrease of this parameter in all the tests, as can be
seen in Figure 14d. For BDD, this situation seems to be associated with the occurrence of the
reaction represented by Eq. (41). For the other two electrodes, Eq. (36) to (38) can explain
this situation.
The chlorine strong odor for all three systems showing its formation, Eq. (32), followed by Eq.
(33), associated with COD, DOC and TDC reductions, Eq. (34), also seem to be related to the
pH reduction. The same analysis can be extrapolated to the Eq. (35), related to the reduction
of nitrogen load.

Electrochemical treatment of tannery effluents
66
Figure 14. Variations of: a) chloride concentration; b) potential; c) conductivity and d) pH for all the AO assays performed at the 3 electrode materials, using samples with different pretreatments. Duration 8 h.
4.3.5.5 Specific Charge Consumption
Equation (80) was used to analyze the effect of the different electrode materials on the
specific charge consumption.
For all the samples submitted to AO, BDD electrode showed the lower energy consumption for
COD, DOC and TKN removals, Table 20, independently of the pretreatment. According to the
literature, such situation is derived from its higher oxidation ability, compared to the other
electrode materials. In general, SnO2 and PbO2 electrodes presented higher energy
consumption for clarified samples, suggesting that the energy efficiency of these electrodes is
more strongly influenced by the contaminant concentration than for the BDD electrode, since
the energy consumption for clarified samples were always much higher than that observed for
non-clarified samples.
In general, COD, DOC and TKN removals were accompanied by lower energy consumption for
the samples clarified by EC than clarified by CC, Table 20. This must be due to some partial
oxidation of contaminants during EC, potentiating the oxidation by AO, the last step.

Electrochemical treatment of tannery effluents
67
Table 20. Average specific energy consumption for 8-h AO assays: For COD, DOC and TKN - kC/g removed; for SO4
2- - kC/g formed. Duration: 8 h.
Parameter CC EC raw
SnO2 PbO2 BDD SnO2 PbO2 BDD SnO2 PbO2 BDD COD 22.7 16.1 14.9 19.4 16.8 16.1 10.4 9.4 8.0 DOC 351.2 287.0 114.4 154.8 183.1 83.6 167.4 103.3 73.5 TKN 131.6 111.4 71.9 120.5 100.6 87.2 89.5 78.2 65.4 SO4
2- 31.5 29.8 33.1 21.0 22.1 22.8 25.0 24.6 25.7
As for the specific charge consumption, the energy values for SO42- formation are aligned with
the comments about S2-/SO42- conversion, since it was found higher quantity formed than the
expected for the SO42- ion, featuring the BDD electrode as the most efficient in the S2-
removal, but not in the SO42- production. An opposite situation can be found for SnO2 and
PbO2 electrodes.
The COD removal, at the time interval from 0 to 4 h, occurred with the highest removal rates.
At the same time, the best energetic efficiency for all systems was observed and, in general,
the BDD electrode showed superior performance, Table 21. This situation was expected, since
at this time interval there were high contaminant concentrations, i.e., the system worked
under a typical kinetic control. In fact, if the intervals 0 to 4 h and 4 to 8 h are compared,
from 4 to 8 h, the energy consumption for all sets increased between 26 and 73%, with small
removal rates, Tables 20 and 21. Thus, it is clear that a typical diffusional control become
more important during the second part of the assays.
The energy consumptions for COD removals were always lower than those observed for the
other parameters, regardless the time interval considered, 4 or 8 h. Thus, this situation
demonstrates that this parameter is easily removed, but not necessarily indicates facility for
DOC removals, since the energy consumptions for DOC removals were always much higher
than those observed for COD removal.
Regarding energetic efficiency for DOC removal, the opposite effect was observed, Tables 20
and 21, since in the time interval from 4 to 8 h, in general, there was a decrease in the
specific charge consumption, with the PbO2 electrode showing the highest drop. The observed
drop in specific charge consumption for DOC removal seems to indicate that COD is more
easily removed than DOC. This means that organic matter is mainly converted to small
oxidized molecules instead of being eliminated as CO2.

Electrochemical treatment of tannery effluents
68
Table 21. Specific Energy Consumption during AO assays. For COD, DOC and TKN: kC/g removed; for SO4
2-: kC/g formed considering the first 4 hours.
Parameter post CC post EC without clarification
SnO2 PbO2 BDD SnO2 PbO2 BDD SnO2 PbO2 BDD COD 17.5 12.8 11.4 11.5 11.5 11.8 6.0 5.6 5.6 DOC 375.7 411.4 108.5 241.3 389.2 83.4 119.7 110.5 77.7 TKN 198.8 196.2 110.4 270.7 181.3 93.9 91.5 56.3 78.0 SO4
2- 19.7 19.9 18.9 14.9 13.7 13.2 16.2 15.5 16.8
The comparison of specific charge consumption for TKN removal for the time intervals 0 to 4,
Table 21, and 4 to 8 h show an increase in energetic efficiency, Table 20, since there was
decrease with time of the specific charge consumption for all clarified samples. This situation
characterizes the difficulty for TKN removal, when compared with COD removal. In other
words, the COD acts like a limiting factor for a better TKN removal, showing that the process
has a priority sequence for contaminants removal, as can be seen in figures 15a and 15b. The
same scenario was not observed for unclarified samples.
Figure 15. Changes in the concentrations of a) COD and b) TKN during AO assays for all tested sets for clarified. Duration: 8 h.
4.3.6 Conclusions
The obtained results led to the following conclusions:
- The chemical coagulation with aluminum proved to be more efficient than the
electrocoagulation to clarify the samples and reduce the levels of contaminants. This may be
associated with better management of operating conditions in chemical coagulation system
than those applied to electrocoagulation systems;

Electrochemical treatment of tannery effluents
69
- Regardless of the process, the clarification of effluent proved to be a useful pretreatment
for tannery wastewater, since it can remove efficiently part of the organic load;
- The energy consumption in the anodic oxidation processes performed with SnO2 and PbO2
anodes is more strongly influenced by the contaminants concentrations than for the BDD
anode;
- The BDD proved to be very efficient in the NH4+ removal, which promoted reduction in TKN
concentrations through conversion of NH4+ to NO3
- for both clarified and non-clarified
samples;
- The greatest ability of BDD electrode in S2- oxidation is not reflected in the conversion of
this species into SO42-. In fact, the SnO2 electrode, although present low S2- oxidation ability,
is more efficient in the conversion of intermediate species containing sulfur into SO42-.

Electrochemical treatment of tannery effluents
70
4.4 Chemical or electrochemical coagulation with iron
combined with anodic oxidation at different electrode materials
The aim of this work was to evaluate and compare the efficiencies of different electrode
materials, SnO2, PbO2 and BDD, in the removal of carbonaceous and nitrogenous compounds
from tannery effluents pretreated with chemical or electrochemical coagulation, with iron
ions. The effect of biological activities on the efficiency of clarification process and of anodic
oxidation was also assessed.
4.4.1 Experimental details
Raw tannery effluent was collected in the equalization tank of a tannery industry, Curtumes
Fabricio lda, Seia, Portugal. To check the effect of biological activities on the efficiency of
the clarification process and anodic oxidation, the sample was used as collected, SA, and part
of the raw material was stored in an open container without aeration system for 10 days at
room temperature, 22-27 oC, to give a different sample, SB. SA and SB samples were
subjected to the treatments described below.
SA: Clarification by chemical coagulation with FeCl3, followed by anodic oxidation using SnO2
or PbO2 electrodes as anodes.
SB: a) Clarification by chemical coagulation with FeCl3, followed by anodic oxidation using
SnO2 or PbO2 electrodes as anodes.
b) Clarification by electrocoagulation using iron electrodes, followed by anodic oxidation
with PbO2, SnO2 and BDD electrodes.
c) Anodic oxidation with PbO2, SnO2 and BDD electrodes.
The experimental details for these assays were as described in section 4.3.1, Table 12, being
Al2(SO4)3 replaced by FeCl3.
4.4.2 Wastewater characteristics
Table 22 shows the results obtained in the characterization of both wastewaters utilized in
this study, SA and SB. The effluent contains mostly organic compounds, such as fats, meat,
hair, skin, tallow and collagen fibers derived from the skin cleansing process, which directly
interfere with the COD, TDC, DOC and TN parameters. As referred before, the
characterization results differ substantially from the literature, because the characteristics of
the samples are strongly influenced by the operating conditions of leather production systems
and the moment of taking the sample

Electrochemical treatment of tannery effluents
71
The higher initial pH, 11.3, stems from the use of calcium oxide – lime (CaO) in the initial
stages of the processing of the skin. The high conductivity observed is derived from the
various substances used during the initial procedures previously cited.
Table 22. Physicochemical characteristics of the effluent analysed with respective medium values and standard deviations. Conductivity in mS cm-1; all other parameters, except pH, in mg L-1.
Parameter SA SB pH 11.6 ± 0.0 8.2 ± 0.2
Conductivity 12.5 ± 0.0 15.5 ± 0.2 COD 9,982 ± 142 9,905 ± 37 DOC 2,950 ± 27 3,066 ± 120 TDC 2,980 ± 33 3,269 ± 116 DIC 25 ± 1 216 ± 14
NH3-N 70 ± 8 602 ± 6 TN 1,057 ± 23 1,050 ± 13 TKN 1,030 ± 8 1,042 ± 12 S2- 110 ± 4 76 ± 1
NO3- 23 ± 3 23 ± 4
NO2- < 5.0 < 5.0
SO42- 1,314 ± 25 1,314 ± 25
Fe 24 ± 2 24 ± 2 Cl- 2,868 ± 16 2,802 ± 44
The results showed no significant influence of biological action on the concentration of COD
for SB, despite having affected other parameters. Considering that the system has not been
aerated, the main biological activities that took place were anaerobic. Thus, the unchanged
COD appears to be associated with the consumption of carbonaceous matter for the
proliferation and maintenance of microorganisms, retaining thereby the carbon available in
the system.
The effects of the biological activities in the effluent SB resulted in the increase of
conductivity and inorganic carbon concentration and the decrease of pH and S2-
concentration. The decrease in S2- concentration happens due to the decrease in pH, because
the formation of this ionic specie is favored at high pH values. It is important to note that the
absence of additional aeration to the SB promoted the conversion of the organic nitrogen into
N-NH3, not into NO3-. The formation of NO3
- from organic nitrogen is expected only in aerated
systems.
The results showed a decrease of 30.5% in S2- concentration for sample SB (110 to 76 mg L-1).
According to USEPA (1985), S2-solutions can contain three sulfur chemical species, S2-, HS- and
H2S, equations (83) and (84), and the species concentrations depend heavily on the system
pH.
H2S ↔ HS- + H+ (83)
HS-↔ S2- + H+ (84)

Electrochemical treatment of tannery effluents
72
Thus, whereas pH increase promotes S2- formation, pH reductions lead to its consumption and
H2S formation. In this case, due to a decrease in pH from 11.6 to 8.2, H2S was produced and
released by the system, causing S2- concentration depletion.
4.4.3 Influence of clarifier concentration and hydrodynamic conditions on
clarification process
The results from the effluent clarification tests are listed in Table 23. As it can be seen, the
clarification efficiency and lowest residual turbidity were influenced by the concentration of
the clarifying agent, reaching maximum efficiency for iron concentration equal to 1.0 mg L-1.
Table 23. Residual turbidity with standard deviation after clarification by CC to the different hydrodynamics conditions. For the different conditions, see Table 12.
Fe3+ / g L-1 Turbidity (NTU)
Condition 1 Condition 2 Condition 3
0.0 1,810 ± 184 1,810 ± 184 1,810 ± 184
0.5 428 ± 60 164 ± 42 152 ± 138
1.0 19 ± 4 10 ± 3 8.0 ± 0.0
2.0 529 ± 37 482 ± 32 459 ± 27
4.0 206 ± 36 123 ± 7 106 ± 6
The increase in turbidity for concentrations higher than 1.0 mg L-1 was due to the loss of
clarification efficiency, since an excess of coagulant reverses the neutralization of surface
charges of the suspended particles and promotes a negative impact in the clarification (Duan
and Gregory, 2003).
The decrease on the residual turbidity when the iron concentration was changed from 2 to 4
mg L -1 was derived from the intensification of the sample color by adding coagulant. The iron
cation (Fe3+) is brown and increases the color of the solution. This interferes in the
determination of the turbidity, because the scattered light is absorbed by the sample before
reaching the sensor that captures the scattered light. In fact, Teixeira and Caliari (2005)
found that the increase in the sample’s color was accompanied by a reduction in turbidity.
Regarding the hydrodynamic characteristics of the process, it was found that increasing the
time in rapid mixing it increases the efficiency of the clarification process, as already
observed by Dharmappa et al. (1993).

Electrochemical treatment of tannery effluents
73
4.4.4 Clarification assays
Table 24 presents the results obtained for SA after CC and SB after CC and EC.
Table 24. Physicochemical parameters and concentrations of the pretreated effluent, after CC and EC assays, with respective standard deviations. Conductivity in mS cm-1; all other parameters, except pH, in mg L-1.
Parameter SA SB After CC After CC After EC
pH 3.8 ± 0.0 5.9 ± 0.0 7.9 ± 0.1 Conductivity 16.2 ± 0.1 16.8 ± 0.2 14.3 ± 0.6 COD 1,735 ± 21 5,312 ± 70 6,566 ± 84 DOC 586 ± 15 1,748 ± 44 2,241 ± 205 TDC 599 ± 14 1,785 ± 48 2,453 ± 34 DIC 12.0 ± 0.4 38 ± 3 113 ± 13 N-NH3 49.4 ± 0.7 575 ± 14 535 ± 24 TN 260 ± 2 847 ± 15 809 ± 39 TKN 239 ± 18 832 ± 53 757 ± 22 S2- 4.0 ± 0.7 3.7 ± 0.5 17.2± 0.0 NO3
- 33 ± 2 34 ± 3 28 ± 2 NO2
- <5.0 <5.0 <5.0 SO4
2- 1,246 ± 1 1,247 ± 17 1,425 ± 14 Fe 3 ± 1 2.5 ± 0.2 42 ± 13 Cl- 5,085 ± 24 5,109 ± 32 2,592 ± 28
The samples SA and SB clarified by CC showed a different behavior due to the biological
activity suffered by SB. The removals in COD for pretreated SA and SB were 82.6% (8,247 mg
L-1) and 46.3% (4,593 mg L-1), respectively. This means a loss in clarification efficiency of
44.0%. This situation was due to the biodegradation of the contaminants present in the
sample, converting the suspended organic matter into soluble organic matter, hindering the
removal by sedimentation. Thus, these results show a negative effect of the biological
activity for samples to be clarified by CC.
For sample SB, CC was more efficient in COD removal than EC probably because CC allows
better operating control than EC.
Regarding DOC removal, the clarification by CC of SA and SB samples reached removal rates
of 80.1% (2,364 mg L-1) and 43.0% (1,318 mg L-1), respectively. The SB clarification by EC
presented DOC removal of 26.9% (825 mg L-1). The removal rates obtained in the clarification
of SB by EC, once again, show the harmful effect of the biological activities, particularly the
dissolution of organic carbon in the liquid phase, when the objective is to remove the organic
matter applying clarification as pretreatment.
The SA clarification by CC showed that the carbonaceous compounds, measured as TDC and
DOC, were basically organic carbon, since the observed removal of these parameters were
2,381 and 2,364 mg L-1, for TDC and DOC, respectively, Tables 22 and 24. In addition, the TKN

Electrochemical treatment of tannery effluents
74
must be essentially suspended material, because its reduction was 792 mg L-1. The same
scenario was not observed for SB, where the TDC and DOC concentrations were reduced in
1,484 and 1,318 mg L-1, respectively, while the TKN was reduced in 209 mg L-1. These
situations resulted from the solubilization of large quantity of TDC and the conversion of TKN
into N-NH3 by the biological activities.
Data in Tables 22 and 24 show that CC was more efficient in the S2- removal when compared
with EC, since the S2- removal by CC attained index of 96.4% (106 mg L-1) and 95.2% (73 mg L-
1) for samples from SA and SB, respectively. The EC reached 77.5% (59 mg L-1) as maximum
reduction in S2- concentration in the sample SB. Reductions in S2- levels in the samples can be
explained by Eq. (10). Also, due to the coexistence of the HS- and S2- species, the sulfide can
be removed according to equations (11) and (13).
The reduction in the pH after CC resulted from the Fe3+ hydrolysis, Eq. (7), (8) and (9).
4.4.5 Anodic oxidation
4.4.5.1 Carbonaceous compounds
The anodic oxidation of the sample from SA clarified by CC (SA_CC) showed similar results
with SnO2 and PbO2 electrodes after 8-h assays, with removals of 812.1 and 724.9 mg L-1,
respectively, Tables 24 and 25. This shows the similar efficiencies of these electrodes in the
removal of COD. For the samples SB submitted to EC (SB_EC) there was a small loss in
efficiency of SnO2 and PbO2 electrodes, with removals of 702.9 and 606.8 mg L-1, respectively.
This loss in efficiency seems to be associated with the low yield in the clarification provided
by electrocoagulation, if compared with that obtained by chemical coagulation that increases
competition by the electric charges.
In the AO of SB_EC, BDD anode was more efficient than PbO2 and SnO2 anodes in the COD
removal, since removal was 1,995.6 mg L-1, i.e., approximately 3 times higher than COD
removal by PbO2 and SnO2 electrodes. For unclarified sample (SB_raw), the COD reductions
provided by BDD, SnO2 and PbO2 electrodes were 3,101.8, 2,482.1 and 2,633.6 mg L-1,
respectively, showing the best performance of BDD.
The results for DOC and TDC removals for SB_EC and SB_raw showed identical behavior to
that of COD. Anyway, the clarification of the sample, in special by CC, tends to improve the
performance of the anodic oxidation, namely of metal oxide electrodes, like SnO2 and PbO2.
The overpotential for O2 evolution presented by BDD anodes, which produces large amounts
of adsorbed •OH, Eq. (41), and thereby resulting in a rapid and effective pollutants
degradation can explain the greater removal of COD by BDD (Palma-Goyes et al. 2010).

Electrochemical treatment of tannery effluents
75
Table 25. Final concentrations (mg L-1), with standard deviations, for COD, DOC, TDC, N-NH3, TKN, TN, NO3
- and SO42-, for samples clarified by CC and EC, and for SB raw sample, after 8 h
of AO assay.
Parameter Electrode Sample
SA_CC SB_CC SB_EC SB_raw
COD
SnO2 923 ± 28 ---- 5,863 ± 14 7,423 ± 49
PbO2 1,010 ± 52 ---- 5,959 ± 28 7,271 ± 81
BDD ---- 3,604 ± 85 4,571 ± 38 6,803 ± 50
DOC
SnO2 407 ± 6 ---- 2,164 ± 20 2,659 ± 43
PbO2 441 ± 14 ---- 2,179 ± 22 2,580 ± 13
BDD ---- 1,350 ± 69 1,534 ± 11 2,339 ± 4
TDC
SnO2 409 ± 1 ---- 2,156 ± 14 2,693 ± 49
PbO2 458 ± 12 ---- 2,163 ± 17 2,610 ± 18
BDD ---- 1,364 ± 41 1,860 ± 21 2,378 ± 2
N-NH3
SnO2 0 ---- 438 ± 7 501 ± 2
PbO2 0 ---- 446 ± 15 442 ± 11
BDD ---- 293 ± 6 358 ± 17 446.7 ± 0.8
TKN
SnO2 51 ± 10 ---- 621 ± 6 710 ± 10
PbO2 56 ± 1 ---- 620 ± 14 686 ± 7
BDD ---- 346 ± 32 467 ± 49 680 ± 14
TN
SnO2 78 ± 4 ---- 755 ± 13 893 ± 23
PbO2 85 ± 9 ---- 749.1 ± 0.9 877 ± 1
BDD ---- 488 ± 15 652 ± 38 904 ± 15
NO3-
SnO2 140 ± 6 ---- 144 ± 7 132 ± 14
PbO2 130 ± 9 ---- 100 ± 2 99 ± 5
BDD ---- 248 ± 10 369 ± 6 417 ± 14
SO42-
SnO2 1,345 ± 6 ---- 1,529 ± 46 1,530 ± 3
PbO2 1,330 ± 13 ---- 1,536 ± 20 1,526.5 ± 0.5
BDD ---- 1,317 ± 15 1,493 ± 24 1,465 ± 20
It is worth noting that for sample SB_raw after 8 hours of anodic oxidation the maximum DOC
removal efficiency was observed for the BDD electrode, 23.7% (726 mg L-1), Tables 22 and 25,
whereas only the CC of the same sample showed removal of 1,318 mg L-1, Tables 22 and 24.
These results again demonstrate the feasibility of using a CC pretreatment in the effluent
treatment process of the tannery industry. This situation seems to be interesting, because,
according to Bengtsson and Tillman (2004), Axelrad et al. (2013) and Toumi et al. (2015), the
sludge generated in the clarification can be applied as a soil fertilizer, promoting agricultural
production.

Electrochemical treatment of tannery effluents
76
The high concentration of Cl- in the samples, Table 22, and its behavior during the anodic
oxidation tests, the reductions in COD, DOC and TDC concentrations, and the strong
characteristic odor of active chlorine during electrolysis showed the participation of chlorine,
through indirect reactions, equations (81) and (82), in the organic matter removal. The final
TDC results for AO are presented in Table 25.
4.4.5.2 Nitrogenous matter
For the samples from SA anodically treated by SnO2 and PbO2 it was observed total N-NH3
elimination after 6 and 8 h assay, respectively, Table 25, i.e., the two electrodes showed
similar behavior in the N-NH3 removal. This may be associated not only to the low
concentrations of this contaminant, 49 mg L-1, Table 24, but also the possible participation of
Cl-. According to Szpyrkowicz et al. (2001), NH4+ present in solutions containing Cl- is oxidized
indirectly from Eq. (35).
In fact, the low N-NH3 concentration in SA seems to be the main factor involved in the total
N-NH3 removal, since in the SB sample the initial N-NH3 concentration was 535 mg L-1, Table
24, and the final concentration oscillated between 358 and 438 mg L-1 for the three tested
electrodes, Table 25, i.e., the maximum removal was 178 mg L-1. The loss in efficiency for N-
NH3 removal seems to be associated with the high concentration of carbonaceous matter
present in the SB sample submitted to EC, Table 24, because this condition tends to intensify
the competition by electrical charges, reducing N-NH3 removal rates.
Indeed, the results showed similar efficiency for N-NH3 removal for the three tested
electrodes for unclarified samples, since the removals for BDD, SnO2 and PbO2 were 25.9, 16.8
and 26.6%, respectively, values very similar to those observed for SB_EC submitted to AO,
33.2, 16.2 and 16.7%, respectively, for the same electrodes.
Although, in general, BDD leads to better yields, the results showed that the anodic oxidation
with SnO2 and PbO2, when applied to newly produced tannery effluent, i.e., without the
application of biological treatment, and previously subjected to CC by FeCl3, can
satisfactorily remove the N-NH3. However, this situation is conditioned in the absence of
biological activities, in which case the organic nitrogen can be converted to N-NH3 (anaerobic
activities), which compromises the removal by CC and AO. In this case not even the BDD could
remove completely the N-NH3.
The results showed that TKN removal was very similar to N-NH3 removal, for the same
samples. However, the relationship between TKN and N-NH3 did not change in the same way
during assay for the three tested electrodes. In fact, when comparing TKN and N-NH3 in SB_EC
before and after AO, Tables 24 and 25, it is clear that TKN reduction was higher than N-NH3
decrease, i.e., the AO promoted the elimination not only of N-NH3, but of the organic
nitrogen too. Moreover, the biggest difference was noted for the BDD electrode, i.e., the BDD

Electrochemical treatment of tannery effluents
77
electrode presented higher eliminating ability of N-NH3, it also eliminated more intensely the
organic nitrogen from the sample, indicating its great oxidation capacity. The same situation
was not verified for unclarified samples. This seems to be associated with the high
contaminants concentrations in this system, which provides greater competition by electrical
charges.
The observed TN removals, which may be associated with the elimination of N-NH3, Eq. (35),
were similar for the three electrodes for unclarified sample, Table 25. For SB_EC after AO,
the BDD electrode showed significant difference when compared to SnO2 and PbO2, 19.4
against 6.8 and 7.4%, respectively. These results are compatible with the higher production
by BDD anode of adsorbed •OH, which results in a rapid and effective pollutants degradation.
The results of SA coagulated samples showed that the addition of an extra step in the
treatment of tannery wastewater tends to be very favorable, since the removal of 75.4% of
TN in CC stage, associated with anodic oxidation reached final levels higher than 92.0% for
SnO2 and PbO2 electrodes, demonstrating the feasibility of using these electrodes.
The results for NO3- formation from SB_raw and SB-EC show that during the anodic oxidation
step BDD electrode is the most efficient, followed by SnO2 electrode and PbO2. Once more,
this situation seems to result from the high •OH production by BDD anode that oxidizes the
reduced species to the highest oxidation, as in the case of NO3-.
As can be seen in Table 25, for BDD there was lower NO3- production in AO of SB_CC. This
result shows that the formation of NO3- is influenced by NH4
+ consumption, and this formation
is strongly, negatively, influenced by the presence of Cl-, because this ion is converted to
HOCl, Eq. (32) followed by Eq. (33), which reacts with NH4+ forming N2, equation (35), rather
than NO3-. This situation was also noted by Cabeza et al. (2007). Thus, the results of the
combined treatment CC+AO show an excellent alternative to nitrogen load removal. This is
very interesting, because if the final effluent presents nitrogen load still not fully oxidized,
there will be the consumption of dissolved oxygen in the system. On the other hand, if the
nitrogen loading is oxidized, for example, in the form of NO3-, there will be an undesirable
situation, because the nitrogen is one of eutrophying agents, together with phosphorus, of
watercourses. So, maximizing the elimination of nitrogen load there will be a significant and
positive impact on water quality of watercourses.
For all assays the NO2- concentrations were below 5 mg L-1.
4.4.5.3 Sulfur compounds
The anodic oxidation results for the samples subjected to CC or EC showed that after 2 h
there was no S2- in the system. This situation was certainly derived from the low S2-
concentrations in the clarified samples, because even after 4 h of the AO of unclarified
samples S2- could be detected.
Electrochemical treatment of tannery effluents
78
The S2- residual concentration after 4 h assay for the unclarified sample anodically oxidized by
BDD, 4 mg L-1, was less than that observed with PbO2 and SnO2, 13.5 and 12.9 mg L-1,
respectively. This also proves the efficacy of BDD in the S2- removal.
The results for the SO42- showed negligible decrease in its concentration during CC test,
Tables 22 and 24. This shows that this treatment does not promote satisfactory reduction in
SO42- concentration. Regarding the samples submitted to EC, it was verified a slight increase
in the SO42- concentration, Tables 22 and 24. This situation may be due to the existence of
oxidation phenomena that may occur during EC.
Regarding SO42- concentrations after 8 h assay, it was observed substantial differences. While
the final SO42- concentrations of clarified samples by CC samples were approximately 1,300
mg L-1, for those from EC, and non-clarified, the concentration of SO42- was around 1,500 mg
L-1, Table 25. Such situation also shows the great effectiveness of CC in the S2- removal, due
to the low production of SO42- observed at the end of 8 h of anodic oxidation, that is, it
appears that the formed SO42- during the anodic oxidation is predominantly formed from S2-
present in the system. This is ratified by the larger SO42- concentrations observed in the
samples subjected to EC and non-clarified, since in these cases the unsatisfactory removals of
S2- provided greater SO42- formations during the anodic oxidation process. In the case of
wastewater treatment process optimization, this seems to be very interesting, because the
almost total S2- removal by CC reduces competition for electrics charges, favoring the
removal of carbonaceous and nitrogenous contaminants.
Further analysis of the results showed that the S2-/SO42- conversion presented peculiar
characteristics. As can be seen in Table 26, the three electrodes formed greater quantity of
SO42- than that predicted, based on the available S2- present in samples clarified by both CC
and EC. A small advantage was observed for the SnO2 electrode. This situation shows, once
more, that SO42- produced in the system is not only derived from S2- oxidation, but also from
the oxidation of intermediate sulfur species, in addition to the existing sulfur in organic
compounds. In fact, the S2- ion in solution can reacts forming several intermediate species
between S2- and SO42-, such as in Eq. (47), (48), (56), (71) and (72), among others. Thus, the
oxidation activities imposed by electrodes make not only the S2- oxidation, but the oxidation
of all present sulfur species.
The S2- removal results for samples not clarified, showed that the BDD electrode was more
efficient. The Table 27 shows that for the samples not clarified, SO42- formation with BDD was
lower, considering the S2- removal by this electrode, i.e., the S2- removed by this electrode is
not necessarily converted to SO42-. Moreover, although the SnO2 electrode shows small S2-
removal efficiency, it provided large SO42- production. Thus, can be inferred that while the
BDD electrode is more efficient in S2- oxidation and production of intermediate sulfur species,
the SnO2 electrode present high conversion ability of these species into SO42-.

Electrochemical treatment of tannery effluents
79
Table 26. Formed and expected SO4
2- concentrations (mg L-1) for all anodizing assays after 8 h.
SO42-
CC EC without clarification
SnO2 PbO2 BDD SnO2 PbO2 BDD SnO2 PbO2 BDD
formed 97.6 82.4 70.0 96.2 92.6 84.7 216.1 212.6 151.0 expected 11.9 11.9 11.1 51.7 51.7 51.7 229.4 229.4 229.4
4.4.5.4 Chloride, Conductivity, pH and potential
The Cl- concentration decreased during the experiments for all the different samples and
applied processes, Figure 16a. This situation seems to be associated with Cl- oxidation,
namely to Cl2, Eq. (32). It is important to highlight the lower final levels of Cl- in the sample
subjected to anodic oxidation by BDD, showing the superior Cl- oxidation ability when
compared to PbO2 and SnO2 electrodes.
BDD was the electrode that systematically presented the highest potentials, Figure 16b,
probably due to the higher conductivity of the metal oxides electrodes (Fernandes et al.,
2014).
For the non-clarified samples and those subjected to electro-oxidation by PbO2 and SnO2, post
CC, a reduction in the potential during the anodic oxidation tests was observed, as can be
seen in figure 16b. According to Costa et al. (2008), if the current densities are the same, the
electrode potential reductions occur due to the increased conductivity of the sample. Thus,
reduction of electrical resistance of the system appears to be derived from the increase of
ionic species from molecules or ions present in the system, identifying the removal and/or
conversion of contaminants.
The samples subjected to EC and anodically oxidized showed a slightly different behavior,
since the potential practically did not change, Figure 16b, at same time that the conductivity,
Figure 16c, showed negligible changes. This last event explains the relative constancy of the
observed potential. This condition seems to be associated with the applied current density
and high COD remaining due to the unsatisfactory contaminants removal by EC process, i.e.,
if the remaining organic load is high, and the applied electrical charge is low, oxidation
processes will occur in the chemical structures more susceptible to oxidation or small species,
without oxidation of larger chemical structure, with subsequent formation of smaller ionic
chemical agglomerates, which would lead to a considerable increase in the conductivity and a
decrease in the potential.

Electrochemical treatment of tannery effluents
80
Figure 16. Dynamic of variations of: a) chloride concentration; b) potential; c) conductivity and d) pH, for all anodic oxidation assays. Duration 8 h.
The pH results demonstrated a reduction of this parameter on all the tests, as can be seen in
Figure 16d. For BDD, this situation seems to be associated with the occurrence of the reaction
represented by Eq. (41). As for the other two electrodes formed by metal oxides, Eq. (36) to
(38) can explain the phenomenon. The strong odor of chlorine, Cl2, observed in all three
systems, showing its formation, associated with COD, DOC and TDC reductions, Eq. (32) to
(34), also seem to be related to reduction of pH. The same analysis can be extrapolated to
the reaction (35) related to the reduction of nitrogen load.
4.4.5.5 Specific Charge Consumption
Equation (80) was used to analyze the effect of the different electrode materials on the
specific charge consumption.
For all anodically oxidized samples, it was noted that there was low energy consumption for
BDD, Table 27. This situation is derived from its higher oxidation ability, compared to the
other two electrodes, SnO2 and PbO2, and the reasons for this behavior were already
discussed in section 4.3 of this thesis.

Electrochemical treatment of tannery effluents
81
The results for samples clarified by CC proved to be very interesting, despite having similar
charge consumption to those subjected to CE, the final COD levels are substantially lower,
especially in the case to the PbO2 and SnO2 electrodes. A similar situation can be described
for COD and TKN. The higher consumed electric charge for DOC removal, in relation to COD,
in all cases, suggests the presence of complex organic molecules in the samples, which offer
greater resistance to oxidation.
Whereas the applied electric charge to the EC in each sample was 1.4 kC and the
contaminants removal rate was always lower than that observed for CC, the specific values of
energy consumed for some parameters in the overall process, EC+AO, were higher than those
recorded for CC+AO set, Table 27. Thus, it is noted that EC, as a preliminary treatment step
for these effluents, is not as suitable as CC.
About the results of specific energy consumption observed for SO42- formation, the values are
aligned with the comments made in the S2-/SO42- conversion, with higher SO4
2- production than
expected.
Table 27. Specific charge consumption during AO assays: For COD, DOC and TKN - kC/g removed; for SO4
2- - kC/g formed. Time duration: 8 h.
Parameter CC EC without clarification
SnO2 PbO2 BDD SnO2 PbO2 BDD SnO2 PbO2 BDD
COD 26.6 29.8 12.6 30.7 35.6 10.8 8.7 8.2 7.0 DOC 120.5 148.8 54.4 112.5 129.5 46.0 53.2 44.5 29.7 TKN 115.1 118.4 44.4 158.1 157.2 74.5 65.2 60.8 59.8 SO4
2- 221.3 262.0 308.4 224.4 233.3 255.1 100.0 101.6 143.0
In the time interval from 0 to 4 h, the SnO2 and PbO2 electrodes showed higher SC values for
SA_CC samples, if compared to SB_CC with BDD electrode, Table 28. Although BDD electrode
presents, in general, lower values than those obtained with metal oxide electrodes, in this
case the low SC value observed for BDD seems to be from the higher COD content of the
samples oxidized by BDD, Table 24, since only BDD was used for SB samples.
The lower energy consumption by BDD for COD removal can be checked in the SC values for
samples submitted to EC, since in this case equal samples were used in the AO assays.
Anyway, by comparing the results for 0 to 4 h and 4 to 8 h, in general, there was no great
change in the SC for each electrode.

Electrochemical treatment of tannery effluents
82
Table 28. Specific charge consumption during AO assays: For COD, DOC and TKN - kC/g removed; for SO4
2- - kC/g formed. First 4 hours.
Parameter CC EC without clarification
SnO2 PbO2 BDD SnO2 PbO2 BDD SnO2 PbO2 BDD
COD 19.1 41.6 10.9 40.1 35.8 9.1 6.0 6.9 5.5 DOC 97.1 133.7 43.5 236.1 117.1 47.7 39.7 33.4 24.5 TKN 119.5 167.7 47.0 163.8 250.7 77.5 65.1 43.0 44.5 SO4
2- 205.6 139.8 239.9 256.5 212.8 174.9 88.3 70.5 115.1
Most of the results obtained in this study regarding specific energy consumption are similar to
those obtained in the previous study (section 4.3). However, the following general conclusions
can be drawn: The energy consumptions for COD removals were always lower than those
observed for the other parameters; the energy consumptions for DOC removals were always
much higher than those observed for COD removal, i.e., COD is more easily removed than
DOC. The comparison of SC for TKN removal for the first 4 h and the total time, 8 h, Tables
27 and 28, shows an increase in the energetic efficiency, since there was a decrease in the
specific charge consumption for all clarified samples.
4.4.6 Conclusions
The results obtained have provided the following conclusions:
- The chemical coagulation has proven to be more efficient than the electrocoagulation to
clarify the samples and reduce the levels of contaminants;
- The occurrence of biological activities significantly impact the quality of the effluent and
acts as a harmful factor to further clarify the sample, either by chemical coagulation or by
electrocoagulation;
- The chemical coagulation has proven to be a great ally as a preliminary treatment of
tannery wastewater, since the anodic oxidation application is limited for this purpose;
- The energy consumption in the anodic oxidation processes by SnO2 and PbO2 are more
strongly influenced by the concentrations of contaminants than those observed for the BDD;
- BDD anode proved to be very efficient in TKN removal, without, however, presenting similar
efficiency in NO3- production. In this sense, the SnO2 electrode presented the best ability to
form NO3- from TKN;
- BDD electrode has the highest ability to make S2- oxidation, although it presents great ability
to produce intermediate sulfur species different from SO42-;
- SnO2 anode, despite a low S2- oxidation ability, is more efficient in converting intermediate
sulfur species into SO42-.

Electrochemical treatment of tannery effluents
83
4.5 Chemical coagulation with iron ion, followed by two
different experimental setups of anodic oxidation with
recirculation
The aim of this work was to evaluate and compare the removal of organic load, nitrogenous
compounds and sulfide from tannery effluents by chemical coagulation using iron cations,
Fe3+, followed by two different experimental set-ups of anodic oxidation:
• setup PS, where the clarified effluent is recirculated, passing first through an
electrochemical reactor with a PbO2 (P) anode and after that through an
electrochemical reactor with a SnO2 (S) anode, returning then to the first reactor
(sample CC_PS);
• setup BDD, where the clarified effluent is recirculated through an electrochemical
reactor with a BDD anode (sample CC_BDD).
The setups PS and BDD were also utilized with raw unclarified samples (raw_PS and raw_BDD,
respectively), to compare the results.
The behavior of the Cr(VI) during the treatment process was also evaluated.
4.5.1 Experimental details
The effluent used in this work was sampled in the equalization tank of Curtumes Fabrício Lda,
located in Vila Verde, Paranhos, Seia, Portugal. Usually, this company works with salted skins
for the manufacture of leather. After the washing, the skins are submitted to dehairing with
sodium sulfide, Na2S. The effluent generated by washing and dehairing is sent for the
equalization tank in which it is added hydrogen peroxide, H2O2, for a previous oxidation of the
sulfide. The determination of the best dosage of clarifier, FeCl3, was carried testing different
concentrations of Fe3+, 0.25, 0.5, 1.0 and 2.0 g L-1, according to the methodology already
described in subsection 4.3.1.
The recirculation system for the anodic oxidation assays, with 2,000 mL total volume, was
composed by four vessels, R1, R2, R3 and R4, with 500, 200, 600 and 600 mL, respectively,
working volumes. The recirculation was enabled by a peristaltic pump (P). The working
volume for the pump and tubes was 100 mL. Electrodes were disposed in the recirculation
system to give two different configurations, setup PS and setup BDD, Figures 17, a and b,
respectively. Setup PS contained a PbO2 anode in R3 and a SnO2 anode at R4. Setup BDD
contained only a BDD electrode at R3.

Electrochemical treatment of tannery effluents
84
Figure 17. Recirculation system settings for the anodic oxidation assays: a) PS setup; b) BDD setup.
The experiments were conducted in batch mode with recirculation (3.6 L h-1), for 8 h, using 2
L of clarified sample at room temperature (22-25 oC) without adding a supporting electrolyte.
SnO2, PbO2 and DDB were used as anodes and a stainless steel plate was used as cathode. For
all assays, the anode and the cathode were separated by 2 cm with 10 cm2 of immersed area
each one. The applied current intensity for setup BDD was 0.6 A; for SnO2 and PbO2, the
current intensities were 0.2 and 0.4 A, respectively. Thus, the applied charge for each setup
was 17,280 C. A power supply unit (Laboratory DC Power Supply, GPS-3030D model (0-30 V, 0-
3 A) was used.
For each oxidation assay, 12 mL samples were taken in intervals of 2 h to determine the
proposed parameters:, COD, DOC, TDC, DIC, TN, TKN, N-NH3, Cl−, NO3−, NO2
–, SO42-, S2-, pH,
conductivity, iron cation concentration, total chromium and Cr(VI) concentrations.
4.5.2 Wastewater characteristics
Table 29 shows the results of the characterization of the wastewater used in this study. The
objective of the dehairing stage is to clean the skins and prepare it for the next step - the
tanning. In addition of removing hair, in the dehairing process impurities adhered to the skin,
such as fats, meat, etc, are also removed, i.e., a large volume of effluent with high organic
load is produced at this stage. As can be seen in Table 29, the effluent presents considerable
organic load, in addition to N-containing and S-containing species. The results for DOC and
TDC showed that almost the totality (98%) of the carbon was in the form of organic carbon.
This is in accordance with the characteristics of a fresh effluent from the dehairing step
before any treatment, biological or chemical. Regarding nitrogenous species concentration,
more than an half of the existing nitrogen is organic nitrogen, i.e., from the total nitrogen,
92% is TKN, being 38% N-NH3 and 62% for organic nitrogen.
The presence of S2- in the sample is due to sodium sulfide, used to remove hairs from the
a b

Electrochemical treatment of tannery effluents
85
skin. The high SO42- concentration observed is due to the partial oxidation of the sulfide,
because the company uses H2O2 to oxidize S2- in the equalization tank.
During the leather processing, the skins are salty, to preserve them, which explains the high
chloride concentration observed in the initial effluent. The high conductivity is due to the
various substances associated with the process, such as Cl-, S2-, SO42-, among others.
The high chromium concentration, 2,191.8 mg L-1, was expected, since, according to
Houshyar et al. (2012), from 20 to 40% of the added chromium in tanning process, usually in
the form of Cr(OH)SO4, remain in the final effluent. This explains also the high SO42-
concentration of the samples. This presents a problem to the tannery industry, because it
prevents the direct biological treatment of the effluent. The reduced Cr(VI) concentration,
4.1 mg L-1, was expected, since species such as S2-, H2S, S2O32-, etc, may reduce chromium,
from (VI) to (III) (Guertin et al., 2005). Besides that, the stability of Cr(III) and the high
oxidizing power of Cr(VI), Cr6+/Cr3+ (Eo= 1.33 V), may also explain the Cr(VI) absence.
The presence of iron in the samples, 32.3 mg L-1, may be associated with wear and tear of the
devices used in the dehairing and tanning processes. It should be also considered the possible
contamination of the chemicals used in process, water contamination, and the presence of
iron in the skin, since iron is in the biological composition of the skins used in the leather
industry.
Table 29. Physicochemical characteristics of effluent, with respective values of standard deviations. Conductivity in mS cm-1; all other parameters, except pH, in mg L-1.
Parameter Average values (mg L-1) pH 4.4 ± 0.1
Conductivity 58 ± 1 COD 5,463 ± 294 DOC 1,660 ± 106 TDC 1,685 ± 112 DIC 25 ± 7
N-NH3 162 ± 5 TKN 400 ± 7 TN 422 ± 12 S2- 58 ± 14
NO3- 34 ± 4
NO2- < 5.0
SO42- 9,209 ± 146
Fe 32 ± 3 Total Cr 2,192 ± 92 Cr(VI) 4.1 ± 0.5
Cl- 10,671 ± 136
As already pointed out, the results differ substantially from those presented in the literature,
since the characteristics of the samples are strongly influenced by the operating conditions of
the leather production system at the moment of the sampling.

Electrochemical treatment of tannery effluents
86
4.5.3 Clarification assays by Chemical Coagulation
The results from the effluent clarification tests are listed in Table 31. The clarification
efficacy, i.e., lower final residual turbidity, was influenced by the concentration of the
clarifying agent, being the maximum efficacy obtained for the iron concentration 0.25 g L-1.
The increase in turbidity for concentrations higher than 0.25 g L-1 was due to the excess of
coagulant that reverses the neutralization of the superficial electric charge of the suspended
particles and promotes negative impact in the clarification (Duan and Gregory, 2003). This
was observed for iron concentrations of 0.50 and 1.00 g L-1. The decrease in the residual
turbidity for the iron concentration of 2.00 g L -1 was explained by Teixeira and Caliari (2005)
(see also section 4.4.3 of this thesis).
Table 30. Residual turbidity with standard deviation after clarification by CC at the different hydrodynamics conditions.
Fe3+ (g L-1) Turbidity (NTU)
Condition 1 Condition 2 Condition 3 0.00 1,120± 57 1,090 ± 14 1,080 ± 14 0.25 128 ± 11 168 ± 11 198 ± 11 0.50 302 ± 53 302 ± 4 422 ± 60 1.00 668 ± 187 512 ± 4 790 ± 57 2.00 125 ± 14 68 ± 4 98 ± 25
The results of the effluent characterization after CC are presented in Table 31. A decrease in
the pH was observed probably due to the acid hydrolysis of the Fe3+ ion, described by the Eq.
(7) to (9).
COD, DOC and TDC removals were 27, 8 and 14%, respectively. The COD removal was lower
than those determined by Song et al. (2001), Ryu et al. (2007), Islam et al. (2011) and
Chowdhury et al. (2013), that were 35.6, 64.8, 70 and 92%, respectively. According to
Aboulhassan et al. (2006), the treatment with FeCl3 proved to be effective in the pH range
between 7 and 9, and the pH values for the referred works were between 7.5 and 12.9, 10.43
and 7.5, respectively. As can be seen in Table 29, the pH for this work was 4.4 and low COD
removal was expected. Similar reasoning can be used to explain the TKN removal, since it was
10% in this work, whereas for Ryu et al. (2007) and Song et al. (2001) were 36.8 and 47.6%,
respectively, for much higher pH values.
Regarding the N-NH3, only 4% removal was observed, probably because the N-NH3 is
solubilized, which reduces its removal efficacy through coagulation/flocculation.

Electrochemical treatment of tannery effluents
87
Table 31. Physicochemical characteristics of effluent after CC, with standard deviations and variation (%) due to CC. Conductivity in mS cm-1; all other parameters, except pH, in mg L-1.
Parameter Average values Variation (%) pH 4.0 ± 0.0 -9
Conductivity 59 ± 1 0 COD 3986 ± 73 -27 DOC 1521 ± 32 -8 TDC 1540 ± 32 -14 DIC 19.7 ± 0.4 -37
N-NH3 152 ± 4 -6 TKN 360 ± 10 -10 TN 389 ± 3 -8 S2- 0.0 ± 0.0 -100
NO3- 42 ± 6 +24
NO2- < 5.0 0
SO42- 8692 ± 5 -6
Fe 268 ± 10 +762 Total Cr 2,060 ± 49 -6 Cr(VI) 1.1 ± 0.0 -73
Cl- 10,900 ± 16 +2
4.5.4 Anodic Oxidation
4.5.4.1 Carbonaceous matter
The anodic oxidation of the clarified and raw samples after 8-h AO assay showed similar
results in COD removal for both setups, Table 32 and Figure 18a. For samples pretreated with
CC, removal rates were 20.3% (810 mg L-1) and 21.7 % (865 mg L-1) for PS and BDD setups,
respectively. In the case of unclarified samples, at the end of the AO 8-h assay, the results
presented yield with a slight advantage for the PS set. The removals rates were 34.8% (1,822
mg L-1) and 31.5% (1,648 mg L-1) for PS and BDD, respectively.
Although a better performance was observed in the removal rates for unclarified samples, if
compared with the clarified samples, the final COD concentrations were always minor for
unclarified samples, Table 32, i.e., the clarification by CC showed to be an interesting step
for COD removal. Thus, the observed results in the COD removal for the CC+AO set were
higher than those observed for the anodic oxidation of unclarified samples. This situation
demonstrates once again the possibility of using AO as a polishing step in the treatment of
tannery industry effluents, and the importance of the pretreatment as a factor for the best
performance of the oxidation step.

Electrochemical treatment of tannery effluents
88
Table 32. Final concentrations (mg L-1), with standard deviations, of COD and DOC after 8 h of AO assay.
Electrode set COD DOC
After CC Raw After CC Raw PS 3,176 ± 44 3,408 ± 88 1,370 ± 6 1,318 ± 4
BDD 3,121 ± 24 3,581 ± 48 1,327 ± 5 1,372 ± 17
Regarding DOC removal, the results obtained for AO of clarified samples showed that the
performance for BDD setup was slightly superior, almost the same removal rate, than that
observed for PS set, Table 32/Figure 18b. The removals were 12.8% (195 mg L-1) and 9.9% (151
mg L-1) for BDD and PS, respectively. This shows the possibility of feasibility of using metal
oxide electrodes in the replacing of BDD electrode in DOC removal.
For anodic oxidation of unclarified samples, the results showed no significant difference for
PS and BDD sets, as can be viewed at Table 32. The DOC final concentrations in Table 32 and
Figure 18b demonstrate that the clarification by CC made no difference in the final results,
since the DOC final concentrations for clarified and not clarified samples were similar. This
situation can be derived from the presence of organic compounds that present difficulty to be
oxidized, limiting the action of the AO process.
Figure 18. Changes in the concentrations of a) COD and b) DOC for the two tested sets for clarified and unclarified samples. Duration: 8 h.
Additional analysis showed that the DOC and TDC removals were virtually similar during the
AO assays for clarified and not clarified samples. This demonstrates that the elimination of
the carbon system, in particular in the form of CO2, was limited to the oxidation of organic
carbon present. In fact, over 98 % of the present carbon was organic carbon. However,
despite its limitation, the data confirm that the AO can be exploited as a polishing step in the
treatment of pretreated tannery effluent, e.g., by CC.

Electrochemical treatment of tannery effluents
89
The high Cl- concentration in the samples, Tables 29 and 31, the COD, TDC and DOC removals,
and the strong characteristic odor of active chlorine, showed the participation of chlorine in
the removal processes of organic matter, through indirect reactions, Eq. (32) to (34).
However, according to Vlyssides and Israilides (1997), it is unable to completely oxidize the
organic compounds. Thus, it can be inferred that the observed depletions in the COD, TC and
TOC concentrations were almost exclusively derived from the reactions occurring on the
surface of the electrodes.
4.5.4.2 Nitrogenous matter
The results showed similar efficiency for PS and BDD sets in the removal of ammonia nitrogen
for all tested samples, Table 33/Figure 19c, with average yield of 26%. According to
Szpyrkowicz et al. (2001), NH4+ in solutions containing Cl- is indirectly oxidized according to
equation (35), leading to nitrogen losses as N2, Table 35/Figure 19c. The similar results can
be associated with the high chloride concentration, Tables 31 and 33, that provides intense
productions of HOCl (Eq. (32) and (33)), that, in turn, oxidizes the ammonia nitrogen to
gaseous nitrogen (Eq. (35)), explaining the reductions in TN levels. The low pH for all
samples, between 4.0 and 4.4, potentiates this situation, since at low pH the ammonia
nitrogen tends to exist in the form of NH4+.
Table 33. Final concentrations (mg L-1), with standard deviations, of TN, TKN, N-NH3 and NO3
- after 8 h of AO assay for clarified and raw samples.
Parameter Pretreatment Electrode Set
PS BDD
TN Raw 304 ± 5 315 ± 15 CC 302 ± 6 315 ± 13
TKN Raw 264 ± 31 252 ± 18 CC 262 ± 13 252 ± 17
N-NH3 Raw 124 ± 15 106 ± 3 CC 113 ± 2 120 ± 6
NO3-
Raw 58 ± 1 102 ± 6 CC 68 ± 6 98 ± 15
The reductions of ammonia nitrogen found by Rao et al. (2001) were higher, between 48.1
and 81.2%, for current densities ranging from 6.7 to 16.7 mA cm-2. However, for these
authors, the initial concentrations for ammonia nitrogen were between 102 and 105 mg L-1,
for chloride between 4,500 and 4,600 mg L-1 and for COD between 480 and 550 mg L-1. Thus,
the NH4+ removal observed in Rao et al. (2001) was intensified due to the low COD
concentration, that wouldn’t compete for the electric charges, the high chloride
concentration and with the low NH4+ concentration.

Electrochemical treatment of tannery effluents
90
Figure 19. Changes in the concentrations of a) TN, b) TKN, c) ammonia nitrogen and d) nitrate for the two tested setups for clarified and unclarified samples. Duration: 8 h.
In face of the observed results, the application of AO after an anaerobic step seems feasible,
since the anaerobic treatment promotes the conversion of organic nitrogen into ammonia
nitrogen, in addition to the organic load removal, which could facilitate the nitrogen removal
during the AO post-treatment. Moreover, the similar reductions of nitrogen load in the
anodized samples by the PS and BDD sets show the feasibility of the application of PS
electrodes in alternative to the BDD electrode for effluents treatment.
The NO3- formation, Table 33/Figure 19d, during the AO step, regardless of the type of
oxidized sample, always presented the BDD set as the most efficient. The production of NO3-
was 59% (average) higher in the BDD set when compared with the set PS, both for clarified
samples for non-clarified. According to Brillas et al. (2007), the BDD electrode has greater O2-
overpotential than conventional electrodes and produces higher amount of reactive •OH,
yielding an intense oxidation of the contaminants. In fact, the onset potential for O2 evolution
on BDD is higher than in PbO2 and SnO2 (Chen, 2004).
In all the assays, NO2- concentrations below 5 mg L-1 were found.

Electrochemical treatment of tannery effluents
91
4.5.4.3 Sulfur compounds
The anodic oxidation results for clarified samples showed continuous production of SO42-,
Figure 20, which were higher for the BDD setup. The final concentrations were 8,819 mg L-1
(+1.4%) and 8,906 mg L-1 (+2.5%). This situation demonstrates that S2- is not the only precursor
of SO42-, i.e., it seems that the S2- initially present at samples is converted in several sulfur
species that act as formers of SO42- during the AO step. The S2- removal will not prevent the
increase in SO42- concentration, unless all sulfur species are removed. Anyway, the presence
of SO42- in the final stage is better than other sulfur species, since intermediate sulfur species
act as reducing agents, for example, reducing the dissolved oxygen levels.
Figure 20. Changes in the concentrations of SO42- during
AO assays for all tested sets for clarified and unclarified. Duration: 8 h.
The SO42- production in non-clarified samples was slightly higher than for clarified samples,
Figure 20. It must be due to the presence of S2- not removed by CC. This shows that the S2- is
also converted into SO42- as the final sulfur species during the AO step. For non-clarified
samples, the highest SO42- production was observed for BDD setup.
The obtained results for sulfur removal, as for the other parameters, show the feasibility of
using metal oxides electrodes, in special the PbO2 and SnO2 electrodes, for the oxidation of
sulfur contaminants in wastewater.

Electrochemical treatment of tannery effluents
92
4.5.4.4 Chromium
Whereas the total chromium concentrations remained virtually unchanged in all assays, the
results for non-clarified samples showed a regular increase in Cr(VI) concentration during the
assays with the PS setup that showed higher Cr (VI) production than at BDD setup, Figure 21.
According to Souza et al. (1993), the oxidation of Cr3+ can be promoted by •OH adsorbed at
the electrode surface, Eq. (38) or (41), followed by equations (85) and (86).
Cr3+ + 3 •OH � CrO3 + 3 H+ (85)
2 CrO3 + H2O � Cr2O72-
+ 2 H+ (86)
The dynamics for Cr(VI) concentrations in clarified samples, Figure 21, show an increase in
Cr(VI) concentration after 4 h assay, at PS setup, whereas for BDD setup, Cr(VI) formation was
not observed. The electro-oxidation of Cr(III) may occurs in PbO2 deposited over a Pb metallic
surface, at potentials near the oxygen evolution potential [Pletcher and Tait (1981)]. In fact,
Souza et al. (1993) observed the oxidation of Cr(III) to Cr(VI) on the surface of a lead anode
coated with a PbO2 layer. This can explain the high Cr(VI) production at PS setup.
On the other hand, according to several works (Schroeder and Lee, 1975; Saleh et al., 1989;
Eary and Rai, 1991) Fe2+ ion can play an important role as reducing agent for Cr(VI) being the
Cr(VI) reduction favored at acidic conditions (Kimbrough et al. (1999)). In fact, Eary and Rai
(1991) observed the reduction of Cr(VI) by Fe2+ in solutions at pH between 2.5 and 5.5. The
same behavior was detected by Sedlak and Chan (1997) in solutions with pH between 2.5 and
8.0. According to these last authors, Cr(VI) reduction can occur by reaction with Fe2+ through
three one-electron-transfer steps (Eq. (87) to (89)). Meanwhile, the Fe(OH)3 formed through
Eq. (9) can react according to Eq. (90) [Green et al. (2006)]. Since the CC was performed with
the addition of Fe3+, Eq (90), followed by Eqs. (87) to (89), and Eqs. (85) and (86), can explain
the absence (or low formation) of Cr(VI) in non-clarified samples at BDD set.
Fe2+ + Cr6+�Fe
3+ + Cr
5+ (87)
Fe2+ + Cr5+�Fe
3+ + Cr
4+ (88)
Fe2+ + Cr4+�Fe
3+ + Cr
3+ (89)
Fe(OH)3 + 2 H+� Fe
2+ + ¼ O2 + 5/2 H2O (90)

Electrochemical treatment of tannery effluents
93
Figure 21. Variations for Cr(VI) concentration for all tested setups. Duration: 8 h.
4.5.4.5 Chloride, Conductivity, pH and Potential
The Cl- concentrations decreased in all the assays, Figure 22a. This situation seems to be
associated with the oxidation of Cl- to Cl2, and its elimination from solution, since a strong
odor to Cl2 was observed during assays.
Figure 22. Variations in time of: a) chloride concentration; b) conductivity; c) potential and d) pH for all AO assays. Duration 8 h. In c) P stands for PbO2 anode and S for SnO2 anode.

Electrochemical treatment of tannery effluents
94
The clarification influenced the variation of chloride concentration. As can be seen in Figure
22a, the chloride concentration decay was more pronounced in clarified samples. This
behavior is associated to the lower organic load in the clarified samples, which reduces the
competition for the electric charges, increasing the rate of the reaction described by Eq. 32.
At BDD setup, the decrease in the chloride concentration during the assays is lesser
influenced by the clarification process than at PS setup.
Table 34 shows the fitted equations for chloride concentration decay. The slope values for
BDD setup, -20.53 and -17.93, for clarified and non-clarified samples, respectively, Table 34,
also shows that the high BDD oxidant capacity was not greatly influenced by the clarification
of samples, i.e., the oxidation capacity of chloride ion by BDD electrode is less susceptible to
interference by contaminants, if compared with PS setup. On the other hand, the production
of chlorine by PS setup shows that it is strongly influenced by the presence of contaminants,
i.e., it is influenced for the competition by the electric charges, since the slopes were -10.87
and -26.21 for raw and clarified samples, respectively.
Table 34. Adjusted equations for chloride consumption during assays for clarified and raw samples. All tested sets. Duration time: 8 h.
Electrode Set Equation R2 value Sample
PS -10.87 x + 10,567 0.987 Raw -26.21 x + 10,902 0.974 CC
BDD -17.93 x + 10,523 0.921 Raw -20.53 x + 10,855 0.842 CC
The potential difference between anode and cathode for the clarified samples was slightly
lower than that for non-clarified samples, Figure 22c. On the other hand, the conductivity for
clarified samples were slightly higher than that observed for non-clarified samples, Figure
22b. Both results must be due to the FeCl3 addition in the clarification step that increases
conductivity and, consequently, decreases the potential difference.
The BDD set was the system that systematically presented the highest potential, Figure 22c.
The lower potentials observed for the PS set, according to Fernandes et al. (2014) are due to
the higher conductivity of the metal oxides electrode when compared to BDD.
During the assays, a slight reduction in the potential for PS setup was found, whereas for BDD
setup, a clear reduction in the potential throughout the assays was verified. These facts must
be related to the application of low current density in PS setup, 0.2 and 0.4 A for SnO2 and
PbO2 electrodes, respectively, which is lower than that applied to BDD setup, 0.6 A.
According to Costa et al. (2008), the reductions in the potential occur due to the increase in

Electrochemical treatment of tannery effluents
95
conductivity, which is associated with the increase of ionic species from molecules or ions
present in the system, identifying their removal and/or conversion into other species.
In all the tests, a reduction in the pH was observed, Figure 22d. This fact can be explained by
Eq. (32). Eq. (36) to (41) also account for this observation (see also section 4.2.6).
4.5.4.6 Specific Charge Consumption
The Eq. (80) was used to analyze the effect of the different electrode materials on the
specific charge consumption.
The results showed that the specific charge consumed for COD, DOC and TKN removals, and
SO42- formation, was lower for the samples non-clarified than for the clarified ones (Table
35). This must be due to the higher initial concentrations of contaminants in the raw samples.
In general, BDD setup presented better energetic efficiency than PS setup.
Table 35. Specific Energy Consumption. For COD, DOC and TKN: C/g removed; for SO4
2-: C/g formed. All AO assays. The first value is for 4 h assay; the second value is for total time.
Parameter post CC without clarification
PS BDD PS BDD
COD 7.0 / 11.4 6.7 / 9.4 2.9 / 3.7 3.2 / 4.2 DOC 47.6 / 67.2 34.9 / 39.8 26.7 / 36.3 32.1 / 41.4 TKN 133.1 / 94.2 85.5 / 75.1 100.1 / 64.1 82.2 / 61.8 SO4
2- 59.8 / 70.3 27.3 / 39.7 62.6 / 58.0 28.6 / 29.4
The charge consumption regarding COD, TKN and DOC removals were greatly increased by the
introduction of a CC step in the assays performed with the PS setup, whereas with the BDD
setup that increase in the charge consumption was not so pronounced, mainly in the DOC
removal where a decrease was observed. It seems that CC removes the most easily oxidizable
and mineralizable organic matter, leaving the most recalcitrant matter for the AO, even
because the SC values regarding COD and DOC removal are always higher at 8 h than at 4 h.
Regarding charge consumption for TKN removal, it decreased with time for both setups. This
behavior was already observed in other situations and can be explained if it is assumed that
first is oxidized the most easily oxidizable carbonaceous matter, then the ammonia nitrogen,
which reduces TKN, and only then the recalcitrant carbonaceous matter is oxidized.
For the AO assays run with the clarified samples, the specific charge consumption for the
SO42- formation increased with time, showing the effect of the diffusional step during AO,
since most of the sulfur species had already been oxidized during CC. For the non-clarified
assays, the SC slightly decreased with time for PS setup and slightly increased with time for
BDD setup, but the differences may be considered within the experimental error.

Electrochemical treatment of tannery effluents
96
The much lower values for charge consumption regarding TKN removal and SO42- formation for
the assays run with BDD setup may be due to a better performance of this system for species
that are mainly oxidized by indirect processes, in the bulk of the solution. In fact, the
chloride reduction is faster at the BDD setup than at PS setup, probably because BDD setup is
more prone to form chlorine oxidizing species.
The TKN removal for clarified samples showed a better energetic efficiency in all assays for
BDD setup. Furthermore, it was observed reduction of the specific charge consumption from
the fourth hour of the assay. For clarified samples, the specific charge in the interval from 0
to 4 h was 133.1 and 85.5 C per (g of removed TKN), for PS and BDD setups, respectively.
When considering the total time, 8 h, the specific charge consumption decreased in 29.2 and
12.3% for PS and BDD setups, respectively. This latter situation characterizes the difficult of
removal the TKN, when compared with COD. In other words, the removal of contaminants
started more intensely for COD, and the TKN was more intensely removed from the fourth
hour of assay, after the reduction in COD concentration, as can be seen in Figure 18a and
19b.
The specific charge consumption for SO42- formation was lower for non-clarified samples, for
the two setups, Table 35. However, while the specific charge consumption for clarified
samples remained approximately constant, if compared the time intervals 0 to 4 h and 4 to 8
h, for clarified sample, it was observed an increase of specific charge consumption, if
compared the same time intervals. Thus, the scarcity of sulfur species increased the
consumption of specific charge, that is, the system demonstrated diffusive control behavior.
Anyway, the BDD setup showed greater energy efficiency, identifying it as the best system for
SO42- production from the conversion of several sulfur species.
4.5.5 Conclusions
The results obtained have provided the following conclusions:
- Although the chemical coagulation is effective for clarification of effluents, the pH of the
solution is a very important parameter in the process and its control is necessary for a best
performance;
- The energy consumption by the PS setup is more strongly influenced by the concentrations
of contaminants than those observed for the BDD setup;
- Although the BDD presents great performance for contaminants removal by anodic
oxidation, the PS setup proved the feasibility to replacement the BDD electrode, since the
final results for contaminants concentrations were similar after the processes;
- The BDD setup presented a performance slight superior than PS set in SO42- production from
sulfur species, besides present the best specific charge consumption;

Electrochemical treatment of tannery effluents
97
- The COD parameter showed great influence in the TKN removal, since the rate of TKN
removal was dependent of COD concentration;
- Despite the anodic oxidation for treatment of effluents create conditions for Cr6+ formation,
as from chrome in low oxidation states, the Fe3+ ion showed to act as an inhibitor of this
process;
- Both systems tested showed similar behavior in removing TKN and ammonia nitrogen as N2.
However, BDD proved to be more efficient at converting nitrogen species into NO3-;
- The BDD setup showed best energetic performance for removing carbonaceous compounds
than the PS setup.

Electrochemical treatment of tannery effluents
98
5 CONCLUSIONS AND PROSPECTS FOR
FUTURE WORKS
5.1 Conclusions
One of the main objectives of this thesis was to evaluate the performance of different
electrode materials in the electrochemical removal of organic and inorganic loads from
effluents collected in a Portuguese tannery industry. Three different materials were tested,
namely, Ti/Pt/PbO2, Ti/Pt/SnO2-Sb2O4 and BDD, and the results obtained for several different
effluents, collected in different seasons of the year and at different steps of the tanning
process, have shown that electro-oxidation with the tested materials is undoubtedly a process
that deserves attention to solve the environmental problems generated by this industry. In
fact, for an effluent containing 30 g L-1 of COD with 8 h of anodic oxidation the COD removals
were 42.4, 34.7 and 35.8% for BDD, Ti/Pt/PbO2 and Ti/Pt/SnO2-Sb2O4, respectively.
Since the organic load and suspended matter is very high in the tannery effluents, and
electro-oxidation acts on the dissolved matter, studies on the application of chemical and
electrochemical coagulations as pretreatment to the anodic oxidation were performed. These
processes combination have shown to be also feasible treatments for tannery effluents. For
an effluent with an initial COD of 5.3 g L-1, COD removals varied between 56% (chemical
coagulation, with aluminum salts, followed by anodic oxidation with BDD) and 63% (chemical
coagulation, with aluminum salts, followed by anodic oxidation with Ti/Pt/SnO2-Sb2O4).
When comparison is possible, chemical coagulation pretreatment proved to be more efficient
in the COD removal than electrochemical coagulation. However, conditions were optimized
for chemical coagulation and then reproduced for the electrochemical coagulation studies.
The behavior during the applied treatment processes of two specific pollutants from tannery
industry, sulfide and chromium, was also assessed. During anodic oxidation, sulfide is
converted to sulfate by a mechanism that involves a series of sulfur species, with different
oxidation states, and that depends on the applied current density. Regarding the variation of
Cr(VI) concentration during the performed treatments, it seems that chemical coagulation
with iron salts preserves its formation from Cr3+ ions, either because Cr3+ ions are removed
during chemical coagulation or because Cr(VI) is reduced to Cr3+ by Fe2+ ions.
The results obtained during the studies performed have provided also more specific
conclusions:
- Oxidation of S2- to SO42- does not follow a single pathway, being dependent on the applied

Electrochemical treatment of tannery effluents
99
current density; it occurs in stages characterized by the formation of sulfurous species,
oxygenated or not, whose concentration decreases with the increase in applied current
density.
- The formation of SO42- is strongly influenced by the applied current density, due to the
involvement of hydroxyl radicals and O2electrogenerated by the water oxidation process.
- The clarification of the effluent showed to be an important step in the wastewater
treatment;
- Clarification by iron cations proved to be more efficient than with aluminum cations, and
chemical coagulation has proven to be more efficient than electrocoagulation to clarify the
samples and reduce the level of contaminants. However, the pH of the effluent deeply
influences the chemical coagulation process.
- In general, BDD electrode was more efficient in the contaminants removal, showing the
highest energy efficiency. Moreover, the energy consumption by Ti/Pt/SnO2-Sb2O4 and
Ti/Pt/PbO2 electrodes is more strongly influenced by the contaminants concentration;
- Ti/Pt/SnO2-Sb2O4 electrode is not so efficient as BDD in the S2- removal, being the initial
removal rates of S2- lower than the ones presented by BDD. However, Ti/Pt/SnO2-Sb2O4
electrode is much more effective in the production of SO42- from intermediate sulfur species.
This is interesting because Ti/Pt/SnO2-Sb2O4 is a less expensive material than BDD;
- Ti/Pt/SnO2-Sb2O4 electrode presented small efficacy for the conversion of nitrogen forms
into NO3-, and a good ability for their conversion into nitrogen gas. Thus, it is an interesting
alternative for the removal of N-containing species from wastewater, avoiding eutrophication
of the water bodies;
- The clarification with Fe3+seems to act as an inhibitor in the conversion Cr(III) to Cr(VI),
which is important because the anodic oxidation systems create conditions for the formation
of Cr(VI) from Cr(III).
- Combining Ti/Pt/PbO2 and Ti/Pt/SnO2-Sb2O4 electrodes seems to be viable as an alternative
to BDD electrode, since the results for the contaminant removals were similar for the two
different experimental setups.
5.2 Future works
Although very important conclusions were obtained in this study, there are several aspects
that must be considered to improve the performance of electrochemical processes to treat
industrial tannery wastewaters. Some ideas of what can be done to pursue this objective are

Electrochemical treatment of tannery effluents
100
presented bellow:
• Perform anodic oxidation assays at current densities higher than 30 mA cm-2 for
clarified and unclarified samples, to study the influence of this parameter in the
current efficiency and specific charge consumption.
• Evaluate the use of polyelectrolyte as auxiliary agents in the clarification step and its
effects on the anodic oxidation step.
• Analyze the influence of the pH adjustment in the organic load removal rate from
tannery effluents by chemical coagulation, with iron cations, and its influence in the
anodic oxidation posterior step.
• Optimize the electrocoagulation process, namely studying the effect of initial pH,
applied current intensity, duration of the assay, and settling process.
• Test other current densities combinations in the anodic oxidation with the PS and BDD
setups.

Electrochemical treatment of tannery effluents
101
Bibliography
Aber, S., Salari, D. and Parsa, M.R. (2010). Employing the Taguchi method to obtain the
optimum conditions of coagulation–flocculation process in tannery wastewater treatment.
Chemical Engineering Journal 162, 127–134.
Aboulhassan, M.A., Souabi, S., Yaacoubi, A. and Baudu, M. (2006). Removal of surfactant from
industrial wastewaters by coagulation flocculation process. International Journal of
Environmental Science and Technology 3(4), 327-332.
Alcántara, S., Velasco, A., Muñoz, A., Cid, J., Revah, S. and Razo-Flores, E. (2004). Hydrogen
sulfide oxidation by a microbial consortium in a recirculation reactor system: sulfur formation
under oxygen limitation and removal of phenols. Environmental Science Technology 38, 918-
923.
Al Kharafi, F.M., Saad A. Y., Ateya, B.G., Ghayad, I. M. (2010). Electrochemical oxidation of
sulfide ions on platinum electrodes. Modern Applied Science 4(3), 2-11.
Alley, E.R. (2007). Water quality control handbook. Second Edition. McGraw-Hill.
Altaş, L. and Büyükgüngör, H. (2008). Sulfide removal in petroleum refinery wastewater by
chemical precipitation. Journal of Hazardous Materials 153, 462–469.
Ammary, B.Y. (2004). Nutrients requirements in biological industrial wastewater treatment.
African Journal of Biotechnology 3(4), 236-238.
Andrade, L.S., Ruotolo, L.A.M., Rocha-Filho, R.C., Bocchi, N., Biaggio, S.R., Iniesta, J.,
García-Garcia, V. and Montiel, V. (2007). On the performance of Fe and Fe, F doped Ti–
Pt/PbO2 electrodes in the electro-oxidation of the Blue Reactive 19 dye in simulated textile
wastewater. Chemosphere 66, 2035–2043.
Anglada, A., Urtiaga, A. and Ortiz, I. (2009). Contributions of electrochemical oxidation to
waste-water treatment: Fundamentals and review of applications. Journal of Chemical
Technology and Biotechnology 84, 1747–1755.
American Public Health Association - APHA (2005). Standard methods for the examination of
water and wastewater, 21st ed. American Public Health Association, Washington, DC.
Apaydin, Ö., Kurt, U. and Gönüllü, M.T. (2009). An investigation on the treatment of tannery
wastewater by electrocoagulation. Global NEST Journal 11(4), 546-555.
Ates, E., Orhon, D. and Tünay, O. (1997). Characterization of tannery wastewaters for
pretreatment selected case studies. Water Science Technonoly 36(2-3), 217-223.
Ateya, B.G. and Al-Kharafi, F.M. (2002). Anodic oxidation of sulfide ions from chloride brines.
Electrochemistry Communications 4, 231–238.

Electrochemical treatment of tannery effluents
102
Ateya, B.G., Al-Kharafi, F.M., Abdallah, R.M. and Al-Azab, A.S. (2005). Electrochemical
removal of hydrogen sulfide from polluted brines using porous flow through electrodes.
Journal of Applied Electrochemistry 35, 297–303.
Awe, S.A., Sundkvist, J.E., Sandström, Å. (2013). Formation of sulphur oxyanions and their
influence on antimony electrowinning from sulphide electrolytes. Minerals Engineering 53, 39–
47.
Axelrad, G., Gershfeld, T. and Feinerman, E. (2013). Reclamation of sewage sludge for use in
Israeli agriculture: economic, environmental and organizational aspects. Journal of
Environmental Planning and Management 56(10), 1419-1448.
Ayoub, G.M., Hamzeh, A. and Al-Hindi, M. (2013). The impact of process sequences on
pollutant removal efficiencies in tannery wastewater treatment. Water, Air and Soil Pollution
224(1), 1-13.
Ayoub, G.M., Hamzeh, A. and Semerjian, L. (2011). Post treatment of tannery wastewater
using lime/bittern coagulation and activated carbon adsorption. Desalination 273, 359–365.
Ayoub, G.M., Merhebi, F., Acra, A., El-Fadel, M. and Koopman B. (2000). Seawater bittern for
the treatment of alkalized industrial effluents. Water Research 34(2), 640-656.
Bajza, Ž., Hitrec, P. and Mužic. (2004). Influence of different concentrations of Al2(SO4)3 and
anionic polyelectrolytes on tannery wastewater flocculation. Desalination 171, 13-20.
Bengtsson, M. and Tillman, A.M. (2004). Actors and interpretations in an environmental
controversy: the Swedish debate on sewage sludge use in agriculture. Resources, Conservation
and Recycling 42, 65–82.
Benhadji, A., Ahmed, M.T. and Maachi, R. (2011). Electrocoagulation and effect of cathode
materials on the removal of pollutants from tannery wastewater of Rouïba. Desalination 277,
128–134.
Bordes, M.C., Vicent, M., Moreno, R., García-Montaño, J., Serra, A., Sánchez, E. (2015).
Application of plasma-sprayed TiO2 coatings for industrial (tannery) wastewater treatment.
Ceramics International 41, 14468–14474.
Brillas, E., Baños, M.Á., Skoumal, M., Cabot, P.L., Garrido, J.A. and Rodríguez, R.M. (2007).
Degradation of the herbicide 2,4-DP by anodic oxidation, electro-Fenton and photoelectro-
Fenton using platinum and boron-doped diamond anodes. Chemosphere 68, 199–209.
Brown, L.S. and Holme, T.A. (2011). Chemistry for engineering students, 2nd edition.
Brooks/Cole, Belmont, CA.
Cabeza, A., Urtiaga, A., River, M.J, Ortiz, I. (2007). Ammonium removal from landfill
leachate by anodic oxidation. Journal of Hazardous Materials 144, 715–719.

Electrochemical treatment of tannery effluents
103
Cai, J. and Zheng, P. (2013). Simultaneous anaerobic sulfide and nitrate removal in microbial
fuel cell. Bioresource Technology 128, 760–764.
Cassano, A., Molinari, R., Romano, M. and Drioli, E. (2001). Treatment of aqueous effluents of
the leather industry by membrane processes: a review. Journal of Membrane Science 181,
111–126.
Chen, G. (2004). Electrochemical technologies in wastewater treatment. Separation and
Purification Technology 38, 11–41.
Chen, X., Chen, G., Gao, F., Yue, P.L. (2003). High-Performance Ti/BDD electrodes for
pollutant oxidation. Environmental Science and Technology 37, 5021-5026.
Chen, X., Gao, F. and Chen, G. (2005). Comparison of Ti/BDD and Ti/SnO2–Sb2O5 electrodes
for pollutant oxidation. Journal of Applied Electrochemistry 35, 185–191.
Chiang, L.C., Chang, J.E. and Chung, C.T. (2001). Electrochemical oxidation combined with
physical–chemical pretreatment processes for the treatment of refractory landfill leachate.
Environmental Engineering Science 18(6), 369-379.
Chiang, L.C., Chang, J.E. and Wen, T.C. (1995). Electrochemical treatability of refractory
pollutants in landfill leachate. Hazardous Waste and Hazardous Materials 12(1), 71-82.
Chowdhury, M., Mostafa, M.G., Biswas, T.K. and Saha, A.K. (2013). Treatment of leather
industrial effluents by filtration and coagulation processes. Water Resources and Industry 3,
11–22.
Chung, Y.J., Choi, H.N., Lee, S.E. and Cho, J.B. (2004). Treatment of tannery wastewater
with high nitrogen content using anoxic/oxic membrane bio-reactor (MBR). Journal of
Environmental Science and Health A, 39(7), 1881-1890.
Ciríaco, L. Anjo, C. Correia, J. Pacheco, M.J. Lopes, A. (2009). Electrochemical degradation
of Ibuprofen on Ti/Pt/PbO2 and Si/BDD electrodes. Electrochimica Acta 54, 1464–1472.
Comninellis, C. (1994). Electrocatalysis in the electrochemical conversion/combustion of
organic pollutants forwastewater treatment. Electrochimica Acta 39, 1857–1862.
Comninellis, C. and Nerini, A. (1995). Anodic oxidation of phenol in the presence of NaCI for
wastewater treatment. Journal of Applied Electrochemistry 25, 23-28.
Comninellis, C. and Pulgarin, C. (1991). Anodic oxidation of phenol for waste water
treatment. Journal of Applied Electrochemistry 21, 703-708.
Comninellis, C. and Pulgarin, C. (1993). Electrochemical oxidation of phenol for wastewater
treatment using SnO2 anodes. Journal of Applied Electrochemistry 23, 108-112.
Cooman, K., Gajardo, M., Nieto, J., Bornhardt, C. and Vidal, G. (2003). Tannery wastewater
characterization and toxicity effects on Daphnia spp. Environmental Toxicology 18, 45–51.

Electrochemical treatment of tannery effluents
104
Corbitt, R.A. (1989). In H.B. Crawford and D. Gleason, eds., Stand Handbook of Environment
Engineering, 671-698.
Costa, C.R., Botta, C.M.R., Espindola, E.L.G. and Olivi, P. (2008). Electrochemical treatment
of tannery wastewater using DSA® electrodes. Journal of Hazardous Materials 153, 616–627.
Dantas Neto, A.A., Dantas, T.N.C., Moura, M.C.P.A. (2004). Evaluation and optimization of
chromium removal from tannery effluent by microemulsion in the Morris extractor. Journal of
Hazardous Materials B 114, 115–122.
Das, C., DasGupta, S. and De, S. (2007). Treatment of soaking effluent from a tannery using
membrane separation processes. Desalination 216, 160–173.
Deghles, A. and Kurt, U. (2016). Treatment of tannery wastewater by a hybrid
electrocoagulation/electrodialysis process. Chemical Engineering and Processing 104, 43–50.
Di Iaconi, C., Lopez, A., Ramadori, R., Di Pinto, A.C. and Passino, R. (2002). Combined
chemical and biological degradation of tannery wastewater by a periodic submerged filter
(SBBR) Water Research 36, 2205–2214.
Di Iaconi, C., Moro, G., Sanctis, M., Rossetti, S. (2010). A chemically enhanced biological
process for lowering operative costs and solid residues of industrial recalcitrant wastewater
treatment. Water Research 44, 3635-3644.
Dharmappa, H. B., Verink, J., Fujiwara O., Vigneswaran S. (1993). Optimal design of a
flocculator. Water Research 27(3), 513-519.
Dogruel, S., Genceli, E.A., Babuna, F.G. and Orhon, D. (2006). An investigation on the
optimal location of ozonation within biological treatment for a tannery wastewater. Journal
of Chemical Technology and Biotechnology 81, 1877–1885.
Duan, J. and Gregory, J. (2003). Coagulation by hydrolysing metal salts. Advances in Colloid
and Interface Science 100 –102, 475–502.
Dutta, P.K., Rabaey, K., Yuan, Z., Keller, J. (2008). Spontaneous electrochemical removal of
aqueous sulfide. Water Research 42, 4965–4975.
Eary, L.E. and Rai, D. (1991). Chromate reduction by subsurface soils under acidic conditions.
Soil Science Society of America Journal 55, 676–683.
El-Sheikh, M.A., Saleh, H.I, Flora, J.R. and AbdEl-Ghany, M.R. (2011). Biological tannery
wastewater treatment using two stage UASB reactors. Desalination 276, 253–259.
Espinoza-Quiñones, F.R., Fornari, M.M.T., Módenes, A.N., Palácio, S.M., Trigueros, D.E.G.,
Borba, F.H. and Kroumov, A.D. (2009). Electrocoagulation efficiency of the tannery effluent
treatment using aluminium electrodes .Water Science and Technology 60(8), 2173-85.

Electrochemical treatment of tannery effluents
105
Fahim, N.F., Barsoum, B.N., Eid, A.E. and Khalil, M.S. (2006). Removal of chromium (III) from
tannery wastewater using activated carbon from sugar industrial waste. Journal of Hazardous
Materials B 136, 303–309.
Farabegoli, G., Carucci, A., Majone, M. and Rolle, E. (2004). Biological treatment of tannery
wastewater in the presence of chromium. Journal of Environmental Management 71, 345–349.
Feng, C., Sugiura, N., Shimada, S. and Maekawa, T. (2003). Development of a high
performance electrochemical wastewater treatment system. Journal of Hazardous Materials B
103, 65–78.
Feng, J.W., Sun, Y.B., Zheng, Z., Zhang, J.B., Li, S. and Tian, Y,C. (2007). Treatment of
tannery wastewater by electrocoagulation. Journal of Environmental Sciences 19, 1409–1415.
Fernandes, A., Santos, D., Pacheco, M.J., Ciríaco, L. and Lopes, A. (2014). Nitrogen and
organic load removal from sanitary landfill leachates by anodic oxidation at Ti/Pt/PbO2,
Ti/Pt/SnO2-Sb2O4 and Si/BDD. Applied Catalysis B: Environmental 148–149, 288–294.
Firer, D., Friedler, E. and Lahav, O. (2008). Control of sulfide in sewer systems by dosage of
iron salts: Comparison between theoretical and experimental results, and practical
implications. Science of the Total Environment 392, 145-156.
Fóti G., Gandini D., Comninellis C., Perret A. and Haenni W. (1999). Oxidation of organics by
intermediates of water discharge on IrO2 and synthetic diamond anodes. Electrochemical and
Solid-State Letters 2, 228-232.
Freiser, H. (1992). Concepts and Calculations in Analytical Chemistry: A Spreadsheet
Approach. CRC Press.
Gallego-Molina, A., Mendoza-Roca, J.A., Aguado, D. and Galiana-Aleixandre, M.V. (2013).
Reducing pollution from the deliming–bating operation in a tannery. Wastewater reuse by
microfiltration membranes. Chemical Engineering Research and Design 91, 369–376.
Ganzenko, O., Huguenot, D., Hullebusch, E.D., Esposito, G and Oturan, M.A. (2014).
Electrochemical advanced oxidation and biological processes for wastewater treatment: a
review of the combined approaches. Environmental Science and Pollution Research 21, 8493–
8524.
Garcia-de-Lomas, J., Corzoa, A., Portillo, M.C., Gonzalez, J.M., Andrades, J.A., Saiz-
Jimenez, C. and Garcia-Robledo, E. (2007). Nitrate stimulation of indigenous nitrate-
reducing, sulfide-oxidising bacterial community in wastewater anaerobic biofilms. Water
Research 41, 3121–3131.
Garrote, J.I., Bao, M., Castro, P. and Bao, M.J. (1995). Treatment of tannery effluents by a
two step coagulation/flocculation process. Water Research 29(11), 2605-2608.

Electrochemical treatment of tannery effluents
106
Golder, A.K., Hridaya, N., Samanta, A.N. and Ray, S. (2005). Electrocoagulation of methylene
blue and eosin yellowish using mild steel electrodes. Journal of Hazardous Materials B1 27,
134–140.
Gomes, C.S., Piccin, J.S. and Gutterres, M. (2016). Optimizing adsorption parameters in
tannery-dye-containing effluent treatment with leather shaving waste. Process Safety and
Environmental Protection 99, 98–106.
Green, R., Waite, T.D., Melville M.D. and MacDonald, B.C.T. (2006). Characteristics of the
acidity in acid sulfate soil drainage waters, McLeods Creek, Northeastern NSW, Australia.
Environmental Chemistry 3(3), 225–232.
Greenwood, N.N. and Earnshaw, A. (1997). Chemistry of the elements. Pergamon Press.
Guertin, J., Jacobs, J.A. and Avakian, C.P. (2005). Chromium(VI) Handbook, CRC Press.
Gupta R. K. and Haslam E. (1980). Vegetable tannins - structure and biosynthesis. In
Polyphenols in Cereals and Legumes (Edited by Hulse J. H.), 15-24.
Haner, J., Bejan, D. and Bunce, N. J. (2009). Electrochemical oxidation of sulfide ion at a
Ti/IrO2–Ta2O5 anode in the presence and absence of naphthenic acids. Journal of Applied
Electrochemistry 39, 1733–1738.
Hastie, J., Bejan, D., Bunce, N.J. (2011). Oxidation of sulfide ion in synthetic geothermal
brines at carbon-based anodes. The Canadian Journal of Chemical Engineering 89, 948-957.
Haydar, S. and Aziz, J.A. (2009a). Characterization and treatability studies of tannery
wastewater using chemically enhanced primary treatment (CEPT)—a case study of Saddiq
Leather Works. Journal of Hazardous Materials 163, 1076–1083.
Haydar, S. and Aziz, J.A. (2009b). Coagulation–flocculation studies of tannery wastewater
using cationic polymers as a replacement of metal salts. Water Science and Technology 59(2),
381-90.
Haydar, S and Aziz, J.A. (2009c). Coagulation–flocculation studies of tannery wastewater
using combination of alum with cationic and anionic polymers. Journal of Hazardous Materials
168, 1035–1040.
Holt, P.K., Barton, G.W., Wark, M. and Mitchell, C.A. (2002). A quantitative comparison
between chemical dosing and electrocoagulation. Colloids and Surfaces A: Physicochemical
and Engineering Aspects 211, 233-248.
Holt, P., Barton, G. and Mitchell, C. (1999). Electrocoagulation as a wastewater treatment. In
The Third Annual Australian Environmental Engineering Research Event.
Houshyar, Z, Ali Baradar Khoshfetrat, A.B., Fatehifar, E. (2012). Influence of ozonation
process on characteristics of pre-alkalized tannery effluents. Chemical Engineering Journal
191, 59-65.

Electrochemical treatment of tannery effluents
107
Ilhan, F., Kurt, U., Apaydin, O. and Gonullu, M.T. (2008). Treatment of leachate by
electrocoagulation using aluminum and iron electrodes. Journal of Hazardous Materials 154,
381–389.
Inan, H., Dimoglo, A., Şimşek, H. and Karpuzcu, M. (2004). Olive oil mill wastewater
treatment by means of electro-coagulation. Separation and Purification Technology 36, 23–31.
Isarain-Chávez, E., De la Rosa, C., Godínez, L.A., Brillas, E. and Peralta-Hernández, J.M.
(2014). Comparative study of electrochemical water treatment processes for a tannery
wastewater effluent. Journal of Electroanalytical Chemistry 713, 62–69
Islam, K.M.N., Misbahuzzaman, K., Majumder, A.K. and Chakrabarty, M. (2011). Efficiency of
different coagulants combination for the treatment of tannery effluents: A case study of
Bangladesh. African Journal of Environmental Science and Technology 5(6), 409-419.
Karahan, Ö., Dogruel, S., Dulekgurgen, E. and Orhon, D. (2008). COD fractionation of tannery
wastewaters—Particle size distribution, biodegradability and modeling. Water Research 42,
1083-1092.
Karthikeyan, S., Gupta, V.K., Boopathy, R., Titus, A. and Sekaran, G. (2012). A new approach
for the degradation of high concentration of aromatic amine by heterocatalytic Fenton
oxidation: kinetic and spectroscopic studies. Journal of Molecular Liquids 173, 153–163.
Kimbrough, D.E., Cohen, Y., Winer, A.M., Creelman, L. and Mabuni, C. (1999). A Critical
Assessment of Chromium in the Environment. Critical Reviews in Environmental Science and
Technology 29(1), 1–46.
Kleinjan, W.E., Keizera, A., Janssen, A.J.H. (2005). Kinetics of the chemical oxidation of
polysulfide anions in aqueous solution. Water Research 39, 4093–4100.
Kobya, M., Can, O.T. and Bayramoglu, M. (2003). Treatment of textile wastewaters by
electrocoagulation using iron and aluminum electrodes. Journal of Hazardous Materials B 100,
163–178
Kongjao, S., Damronglerd, S. and Hunsom, M. (2008). Simultaneous removal of organic and
inorganic pollutants in tannery wastewater using electrocoagulation technique. Korean
Journal of Chemical Engineering 25(4), 703-709.
Kraft, A. (2007). Doped diamond: a compact review on a new, versatile electrode material.
International Journal of Electrochemical Science 2, 355 - 385
Kurt, U., Apaydin, O. and Gonullu, M.T. (2007). Reduction of COD in wastewater from an
organized tannery industrial region by Electro-Fenton process. Journal of Hazardous Materials
143, 33–40.

Electrochemical treatment of tannery effluents
108
Lefebvre, O., Vasudevan, N., Torrijos, M., Thanasekaran, K. and Moletta, R. (2006).
Anaerobic digestion of tannery soak liquor with an aerobic post-treatment. Water Research
40, 1492-1500.
Leta, S., Assefa, F., Gumaelius, L. and Dalhammar, G. (2004). Biological nitrogen and organic
matter removal from tannery wastewater in pilot plant operations in Ethiopia. Applied
Microbiology and Biotechnology 66, 333–339.
Li, S., Bejan, D., McDowell, M.S., Bunce, N.J. (2008). Mixed first and zero order kinetics in
the electro-oxidation of sulfamethoxazole at a boron-doped diamond (BDD) anode. Journal of
Applied Electrochemistry 38, 151–159.
Li, X., Wang, C., Qian, Y., Wang, Y. and Zhang, L. (2013). Simultaneous removal of chemical
oxygen demand, turbidity and hardness from biologically treated citric acid wastewater by
electrochemical oxidation for reuse. Separation and Purification Technology 107, 281–288.
Lofrano, G., Meriç, S., Zengin, G.E. and Orhon, D. (2013). Chemical and biological treatment
technologies for leather tannery chemicals and wastewaters: A review. Science of the Total
Environment 461–462, 265–281.
López-Luna, J., González-Chávez, M.C., Esparza-García, F.J. and Rodríguez-Vázquez, R.
(2009). Toxicity assessment of soil amended with tannery sludge, trivalent chromium and
hexavalent chromium, using wheat, oat and sorghum plants. Journal of Hazardous Materials
163, 829–834.
Mandal, T., Dasgupta, D., Mandal, S. and Datta, S. (2010). Treatment of leather industry
wastewater by aerobic biological and Fenton oxidation process. Journal of Hazardous
Materials 180, 204–211.
Mannucci, A., Munz, G., Mori, G. and Lubello, C. (2010). Anaerobic treatment of vegetable
tannery wastewaters: A review. Desalination 264, 1–8.
Marsal, A., Hernández, E., Cuadros, S., Puig, R., Bautista, E. and Font, J. (2010). Recovery of
proteins from wastewater of tannery beamhouse operations: influence on the main pollution
parameters. Water Science and Technology, 62(3), 658–666.
Mendoza-Roca, J.A., Galiana-Aleixandre, M.V., Lora-García, J. and Bes-Piá, A. (2010).
Purification of tannery effluents by ultrafiltration in view of permeate reuse. Separation and
Purification Technology 70, 296–301.
Milazzo, G., Caroli, S., Sharma, V.K. (1978). Tables of Standard Electrode Potentials. Wiley.
Miller, B. and Chen, A. (2005). Effect of concentration and temperature on electrochemical
oscillations during sulfide oxidation on Ti/Ta2O5–IrO2 electrodes. Electrochimica Acta 50,
2203–2212.

Electrochemical treatment of tannery effluents
109
Min, K.S., Yu, J.J., Kim, Y.J. and Yun, Z. (2004). Removal of ammonium from tannery
wastewater by electrochemical treatment. Journal of Environmental Science and Health, Part
A, 39(7), 1867-1879.
Mingshu, L., Kai, Y., Qiang, H. and Dongying, J. (2006). Biodegradation of gallotannins and
ellagitannins. Journal of Basic Microbiology 46(1), 68–84.
Mlaik,N., Gouider, M., Bouzid,J., Belbahri, L., Woodward, S. Mechichia, T. (2011). Treatment
of unhairing effluents by activated sludge system. Environmental Progress and Sustainable
Energy 30(3), 337–346.
Mohammed, K. and Sahu, O. (2015). Bioadsorption and membrane technology for reduction
and recovery of chromium from tannery industry wastewater. Environmental Technology and
Innovation 4, 150–158.
Mollah, M.Y.A., Morkovsky, P., Gomes, J.A.G., Kesmez, M., Parga, J. and Cocke, D.L. (2004).
Fundamentals, present and future perspectives of electrocoagulation. Journal of Hazardous
Materials B 114, 199–210.
Mollah, M.Y.A., Schennach, R., Parga, J.R. and Cocke, D.L. (2001). Electrocoagulation (EC)-
science and applications. Journal of Hazardous Materials B 84, 29–41.
Murat, S., Genceli, E.A., Taşlı, R., Artan, N. and Orhon, D. (2002). Sequencing batch reactor
treatment of tannery wastewater for carbon and nitrogen removal. Water Science and
Technology 46(9), 219–227.
Murat, S., Insel, G., Artan, N and Orhon, D. (2006). Performance evaluation of SBR treatment
for nitrogen removal from tannery wastewater. Water Science and Technology 53(12), 275–
284.
Murugananthan, M.; Raju, G. B.; Prabhakar. S. (2004). Removal of sulfide, sulfate and sulfite
ions by electro coagulation. Journal of Hazardous Materials 109, 37–44.
Naumczyk, J. and Kucharska, M. (2011). Tannery wastewater treatment by anodic electro-
oxidation coupled with electro-Fenton process. Environment Protection Engineering 37(3), 47-
54.
Orhon, D., Genceli, E.A. and Çokgör, E.U. (1999). Characterization and modeling of activated
sludge for tannery wastewater. Water Environment Research 71(1), 50-63.
Orhon, D., Genceli, E.A. and Sözen, S. (2000). Experimental evaluation of the nitrification
kinetics for tannery wastewaters. Water SA 26(1), 43-50.
Orhon, D., Sözen, S., Çokgör, E.U and Genceli, E.A. (1998). The effect of chemical settling on
the kinetics and design of activated sludge for tannery wastewaters. Water Science and
Technology 38(4-5), 355-362.

Electrochemical treatment of tannery effluents
110
Palma-Goyes, R.E., Guzmán-Duque, F.L., Peñuela, G., González, I., Nava, J.L., Torres-Palma,
R.A. (2010). Electrochemical degradation of crystal violet with BDD electrodes: Effect of
electrochemical parameters and identification of organic by-products. Chemosphere 81, 26–
32.
Panda, R.C., Selvasekhar, S., Murugan, D., Sivakumar, V., Narayani, T. and Sreepradha, C.
(2016). Cleaner production of basic chromium sulfate e with a review of sustainable green
production options. Journal of Cleaner Production 112, 4854-4862.
Panizza, M. and Cerisola, G. (2009). Direct and mediated anodic oxidation of organic
pollutants. Chemical Reviews 109, 6541–6569.
Panizza, M. and Cerisola, G. (2004). Electrochemical oxidation as a final treatment of
synthetic tannery wastewater. Environmental Science and Technology, 38(20), 5470-5475.
Panizza, M., Delucchi, M. and Sirés, I. (2010). Electrochemical process for the treatment of
landfill leachate. Journal of Applied Electrochemistry 40, 1721–1727.
Panizza, M., Kapalka, A. and Comninellis, C. (2008). Oxidation of organic pollutants on BDD
anodes using modulated current electrolysis. Electrochimica Acta 53, 2289–2295.
Panizza, M. and Martinez-Huitle, C.A. (2013). Role of electrode materials for the anodic
oxidation of a real landfill leachate – Comparison between Ti–Ru–Sn ternary oxide, PbO2 and
boron-doped diamond anode. Chemosphere 90, 1455–1460.
Paschoal, F.M.M, Anderson, M.A. and Zanoni, M.V.B. (2009). Simultaneous removal of
chromium and leather dye from simulated tannery effluent by photoelectrochemistry. Journal
of Hazardous Materials 166, 531–537.
Pikaar, I., Rozendal, R.A., Yuan, Z., Keller, J., Rabaey, K. (2011a). Electrochemical sulfide
oxidation from domestic wastewater using mixed metal-coated titanium electrodes. Water
Research 45, 5381–5388.
Pikaar, I., Rozendal, R.A., Yuan, Z., Keller, J., Rabaey, K. (2011b). Electrochemical sulfide
removal from synthetic and real domestic wastewater at high current densities. Water
Research 45, 2281–2289.
Pletcher, D. and Tait, S.J.D. (1981). The electrolytic oxidation of chromic sulphate to chromic
acid: the effects of lead anode preparation. Journal of Applied Electrochemistry 11, 493–502.
Polcaro, A.M., Palmas, S., Renoldi, F., Mascia, M. (1999). On the performance of Ti/SnO2 and
Ti/PbO2 anodes in electrochemical degradation of 2-chlorophenol for wastewater treatment.
Journal of Applied Electrochemistry 29, 147-151.
Preethi, V., Kalyani, K.S.P., Iyappan, K., Srinivasakannan, C., Balasubramaniam, N. and
Vedaraman, N. (2009). Ozonation of tannery effluent for removal of cod and color. Journal of
Hazardous Materials 166, 150–154.

Electrochemical treatment of tannery effluents
111
Ram, B., Bajpai, P.K., Parwana, H.K. (1999). Kinetics of chrome-tannery effluent treatment
by the activated-sludge system. Process Biochemistry 35, 255–265.
Rao, J.R., Chandrababu, N.K., Muralidharan, C. Nair, B.U., Rao, P.G. and Ramasami, T.
(2003). Recouping the wastewater: a way forward for cleaner leather processing. Journal of
Cleaner Production 11, 591–599.
Rao, N.N., Somasekhar, K.M., Kaul, S.N. and Szpyrkowicz, L. (2001). Electrochemical
oxidation of tannery wastewater. Journal of Chemical Technology and Biotechnology 1124-
1131.
Reemtsma, T and Jekel, M. (1997). Dissolved organics in tannery wastewaters and their
alteration by a combined anaerobic and aerobic treatment. Water Research 31(5), 1035–1046.
Roš, M. and Gantar, A. (1998). Possibilities of reduction of recipient loading of tannery
wastewater in Slovenia. Water Science and Technology 37(8), 145-152.
Rossini, M., Garrido, J.G. and Galluzzo, M. (1999). Optimization of the coagulation-
flocculation treatment: influence of rapid mix parameters. Water Research 33(8), 1817-1826.
Rysselberghe, P.V. and Gropp, A.H. (1994). Influence of sulfide ion hydrolysis on the
solubility-solubility product relationship of metallic sulfides. Journal of Chemical Education
21(2), 96-99.
Ryu, H.D., Lee, S.I. and Chung, K.Y. (2007). Chemical oxygen demand removal efficiency of
biological treatment process treating tannery wastewater following seawater flocculation.
Environmental Engineering Science 24(3), 394-399.
Saleh, F.Y., Parkerton, T.F., Lewis, R.V., Huang, J.H. and Dickson, K.L. (1989). Kinetics of
chromium transformations in the environment. The Science of the Total Environment 86, 25–
41.
Santos, D., Pacheco, M.J., Gomes, A., Lopes, A. and Ciríaco, L. (2013). Preparation of
Ti/Pt/SnO2–Sb2O4 electrodes for anodic oxidation of pharmaceutical drugs. Journal of Applied
Electrochemistry 43, 407–416.
Santos, V., Diogo, J., Pacheco M.J.A., Ciríaco L., Morão A., Lopes, A. (2010). Electrochemical
degradation of sulfonated amines on SI/BDD electrodes. Chemosphere 79, 637–645.
Sathish, M., Madhan, B., Saravanan, P., Rao, J.R., Nair, B.U. (2013). Dry ice e an eco-friendly
alternative for ammonium reduction in leather manufacturing. Journal of Cleaner Production
54, 289-295.
Schenk, H, Wiemann, M. and Hegemann, W. (1999). Improvement of anaerobic treatment of
tannery beamhouse wastewater by an integrated sulphide elimination process. Water Science
and Technology 40(1), 245-252.

Electrochemical treatment of tannery effluents
112
Schrank, S.G., Bieling, U., José, H.J., Moreira, R.F.P.M and Schröder, H.F. (2009). Generation
of endocrine disruptor compounds during ozone treatment of tannery wastewater confirmed
by biological effect analysis and substance specific analysis. Water Science and Technology
59(1), 31-38.
Schrank, S.G., José, H.J., Moreira, R.F.P.M. and H.Fr. Schröder. (2004). Eucidation of the
behavior of tannery wastewater under advanced oxidation conditions. Chemosphere 56, 411–
423.
Schroeder, D.C. and Lee G.F. (1975). Potential transformations of chromium in natural
waters. Water, Air and Soil Pollution 4, 355–365.
Sedlak, D.L. and Chan, P.G. (1997). Reduction of hexavalent chromium by ferrous iron.
Geochimica et Cosmochimica Acta 61(11), 2185–2192.
Șengil, I.A., Kulaç, S. and Özacar, M. (2009). Treatment of tannery liming drum wastewater
by electrocoagulation. Journal of Hazardous Materials 167, 940–946.
Senthilvelan, T., Kanagaraj, J. and Mandal, A.B. (2012). Application of enzymes for dehairing
of skins: cleaner leather processing. Clean Technologies and Environmental Policy 14, 889–
897.
Shao, Y., Wu, L., Gao, H. and Wang. F. (2012). Effect of Soluble Sulfide on the Activity of
Luminescent Bacteria. Molecules 17, 6046-6055.
Sirajuddin, Kakakhel, L. Lutfullah, G., Bhanger, M.I., Shah, A. and Niaz, A. (2007).
Electrolytic recovery of chromium salts from tannery wastewater. Journal of Hazardous
Materials 148, 560–565.
Sirés, I. and Brillas, E. (2012). Remediation of water pollution caused by pharmaceutical
residues based on electrochemical separation and degradation technologies: a review.
Environment International 40, 212–229.
Sirés, I., Brillas, E., Oturan, M.A., Rodrigo, M.A. and Panizza, M. (2014). Electrochemical
advanced oxidation processes: today and tomorrow. a review. Environmental Science and
Pollution Research 21, 8336–8367.
Solak, M., Kiliç, M., Yazici, H. and Şencan, A. (2009). Removal of suspended solids and
turbidity from marble processing wastewaters by electrocoagulation: Comparison of electrode
materials and electrode connection systems. Journal of Hazardous Materials 172, 345–352.
Song, Z., Williams, C.J. and Edyvean, R.G.J. (2001). Coagulation and anaerobic digestion of
tannery wastewater. IChemE B 79, 23-28.
Song, Z., Williams, C.J. and Edyvean, R.G.J. (2004). Treatment of tannery wastewater by
chemical coagulation. Desalination 164, 249-259.

Electrochemical treatment of tannery effluents
113
Souza, C.E., Machado, S.A.S., Mazo, L.H. and Avaca, L.A. (1993). Oxidação eletroquímica do
cromo (III) sobre Pb/PbO2. Quimica Nova 16(5), 426–430.
Sreeram, K.J. and Ramasami, T. (2003). Sustaining tanning process through conservation,
recovery and better utilization of chromium. Resources, Conservation and Recycling 38, 185-
212.
Stasinakis, A.S., Mamais, D., Thomaidis, N.S. and Lekkas, T.D. (2002). Effect of chromium
Cr(VI) on bacterial kinetics of heterotrophic biomass of activated sludge. Water Research 36,
3341–3349.
Sundarapandiyan, S., Chandrasekar, R., Ramanaiah, B., Krishnan, S. and Saravanan, P. (2010).
Electrochemical oxidation and reuse of tannery saline wastewater. Journal of Hazardous
Materials 180, 197–203.
Suthanthararajan, R., Ravindranath, E., Chitra, K., Umamaheswari, B., Ramesh, T. and
Rajamani, S. (2004). Membrane application for recovery and reuse of water from treated
tannery wastewater. Desalination 164, 151-156.
Szpyrkowicz, L., Kelsall, G.H., Kaul, S.N. and De Faveri, M. (2001). Performance of
electrochemical reactor for treatment of tannery wastewaters. Chemical Engineering Science
56, 1579-1586.
Szpyrkowicz, L., Kaul, S.N, Neti, R.N. e Satyanarayan, S. (2005). Influence of anode material
on electrochemical oxidation for the treatment of tannery wastewater. Water Research 39,
1601–1613.
Szpyrkowicz, L., Naumczyk, J. and Zilio-Grandi, F. (1995). Electrochemical treatment of
tannery wastewater using Ti/Pt and Ti/Pt/Ir electrodes. Water Research 29(2), 517-524.
Tahir, S.S. and Naseem, R. (2007). Removal of Cr(III) from tannery wastewater by adsorption
onto bentonite clay. Separation and Purification Technology 53, 312–321.
Tammaro, M., Salluzzo, A., Perfetto, R. and Lancia, A. (2014). A comparative evaluation of
biological activated carbon and activated sludge processes for the treatment of tannery
wastewater. Journal of Environmental Chemical Engineering 2, 1445–1455.
Tang, K., An, S. and Nemati, M. (2010). Evaluation of autotrophic and heterotrophic processes
in biofilm reactors used for removal of sulphide, nitrate and COD. Bioresource Technology
101, 8109–8118.
Tchamango, S., Nanseu-Njiki, C.P., Ngameni, E., Hadjiev, D. and Darchen, A. (2010).
Treatment of dairy effluents by electrocoagulation using aluminium electrodes. Science of
the Total Environment 408, 947–952.

Electrochemical treatment of tannery effluents
114
Teixeira, E.C. and Caliari, P.C. (2005). Estimation of the concentration of suspended solids in
rivers from turbidity measurement: error assessment. In Sediment Budgets 1, Walling DE,
Horowitz A.J. (eds). IAHS Press 291, 151–160.
Thankappan, R., Nguyen, T.V., Srinivasan, S.V., Vigneswaran, S., Kandasamy, J. and
Loganathan, P. (2015). Removal of leather tanning agent syntan from aqueous solution using
Fenton oxidation followed by GAC adsorption. Journal of Industrial and Engineering Chemistry
21, 483–488.
Tiravanti, G., Petruzzelli, D. and Passino, R. (1997). Pretreatment of tannery wastewaters by
an ion exchange process for Cr(III) removal and recovery. Water Science and Technology 36(2-
3), 191-201.
Toumi, J., Miladi, B., Farhat, A., Nouira, S., Hamdi, M., Gtari, M, and Bouallag, H. (2015).
Microbial ecology overview during anaerobic codigestion of dairywastewater and cattle
manure and use in agriculture of obtained bio-fertilisers. Bioresource Technology 198, 141–
149.
USEPA. (1985). Design Manual: Odor and Corrosion Control in Sanitary Sewerage Systems and
Treatment Plants. Center for Environmental Research Information.
Valensi, G., Muylder Van, J., Pourbaix, M. (1963). Soufre. In: Pourbaix, M., Zubov de, N.,
Muylder Van, J. Atlas d'Equilibres Electrochimiques. Gauthier-Villars, 545–553.
Vannini, C., Munz, G., Mori, G., Lubello, C., Verni, F., Petroni, G. (2008). Sulphide oxidation
to elemental sulphur in a membrane bioreactor: Performance and characterization of the
selected microbial sulphur-oxidizing community. Systematic and Applied Microbiology 31, 461–
473.
Vijayaraghavan, K. and Murthy, D.V.S. (1997). Effect of toxic substances in anaerobic
treatment of tannery wastewaters. Bioprocess Engineering 16, 151-155.
Vlyssides, A.G. and Israilides, C.J. (1997). Detoxification of tannery waste liquors with an
electrolysis system. Environmental Pollution 97(1-2), 147-152.
Walsh, A. R. and O'Halloran, J. (1996). Chromium speciation in tannery effluent-II. Speciation
in the effluent and in a receiving estuary. Water Research 30(10), 2401-2412.
Wang, K., Li, W., Gong, X., Li, X., Liu, W., He, C., Wang, Z., Minh, Q.N., Chen, C.L. and
Wang, J.Y. (2014). Biological pretreatment of tannery wastewater using a full-scale hydrolysis
acidification system. International Biodeterioration and Biodegradation 95, 41-45.
Wang, Y., Zeng, Y., Chai, X., Liao, X., He, Q. and Shi, B. (2012). Ammonia nitrogen in tannery
wastewater: distribution, origin and prevention. Journal of the American Leather Chemists
Association 107, 40-50.

Electrochemical treatment of tannery effluents
115
Wang, Y., Zeng, Y., Zhou, J., Zhang, W., Liao, X. and Shi, B. (2016). An integrated cleaner
beamhouse process for minimization of nitrogen pollution in leather manufacture. Journal of
Cleaner Production 112, 2-8.
Waterston, K., Bejan, D. and Bunce, N.J. (2007). Electrochemical oxidation of sulfide ion at a
boron-doped diamond anode. Journal of Applied Electrochemistry 37, 367–373.
Waterston, K., Wang, J.W., Bejan, D. and Bunce, N.J. (2006). Electrochemical waste water
treatment: electrooxidation of acetaminophen. Journal of Applied Electrochemistry 36, 227–
232.
Woisetschläger, D., Humpl, B., Koncar, M. and Siebenhofer, M. (2013). Electrochemical
oxidation of wastewater – opportunities and drawbacks. Water Science and Technology 68(5),
1173-1179.
Zanta, C.L.P.S., Michaud, P.A., Comninellis, C., Andrade, A.R. and Boodts, J.F.C. (2003).
Electrochemical oxidation of p-chlorophenol on SnO2–Sb2O5 based anodes for wastewater
treatment. Journal of Applied Electrochemistry 33, 1211–1215.
Zhang, L., Schryver, P., Gusseme, B., Muynck, W., Boon, N. and Verstraete, W. (2008).
Chemical and biological technologies for hydrogen sulfide emission control in sewer systems:
A review. Water Research 42, 1–12.
Zhi, X., Qingzhi, F. and Weilei, Z. (2009). Research on orthogonal coagulated setting and
coagulation-flotation test of tannery wastewater. Journal of Environmental Sciences 21,
supplement 1, S158–S161.
Zhou, J., Wang, Y., Zhang, W. and Shi, B. (2014). Nutrient balance in aerobic biological
treatment of tannery wastewater. Journal of the American Leather Chemists Association 109,
154-160.
Zongo, I., Maiga, A.H., Wéthé, J., Valentin, G., Leclerc, J.P., Paternotte, G. and Lapicque, F.
(2009). Electrocoagulation for the treatment of textile wastewaters with Al or Fe electrodes:
Compared variations of COD levels, turbidity and absorbance. Journal of Hazardous Materials
169, 70–76.