Embed Size (px)
Citation preview

UNIVERSIDAD POLITÉCNICA DE MADRID ESCUELA TÉCNICA SUPERIOR
DE INGENIEROS DE TELECOMUNICACIÓN
TESIS DOCTORAL
LONG POLYPHASE SEQUENCES FOR ADAPTIVE MMSE DETECTOR
IN ASYNCHRONOUS CDMA PLC NETWORK WITH IMPULSIVE
NOISE
IÑAKI VAL BEITIA
INGENIERO EN AUTOMÁTICA Y ELECTRÓNICA INDUSTRIAL
2011


UNIVERSIDAD POLITÉCNICA DE MADRID
DEPARTAMENTO DE SEÑALES, SISTEMAS Y RADIOCOMUNICACIONES
ESCUELA TÉCNICA SUPERIOR DE INGENIEROS DE TELECOMUNICACIÓN
TESIS DOCTORAL
LONG POLYPHASE SEQUENCES FOR ADAPTIVE MMSE DETECTOR
IN ASYNCHRONOUS CDMA PLC NETWORK WITH IMPULSIVE
NOISE
AUTOR: Iñaki Val Beitia Ingeniero en Automática y Electrónica Industrial DIRECTOR: Francisco Javier Casajús Quirós Doctor Ingeniero de Telecomunicación
2011


Tribunal nombrado por el Mgfco. y Excmo. Sr. Rector de la Universidad Politécnica de Madrid.
PRESIDENTE:
VOCALES:
SECRETARIO:
SUPLENTES:
Realizado el acto de defensa y lectura de la Tesis en Madrid,
el día ___ de ________ de 201__.
Calificación:
EL PRESIDENTE LOS VOCALES
EL SECRETARIO


A Belén


Agradecimientos
Quiero dedicar unas líneas de agradecimiento en atención a todos aquellos que con su ayuda
y orientación han permitido la realización de este trabajo.
Mencionaré en primer lugar al Doctor Francisco Javier Casajús Quiros al que tengo que
agradecer su labor de dirección, así como sus valiosos consejos, y dedicación.
Mi más sincera gratitud va también para el Doctor Igor Armendariz, por su cuidadosa
revisión del manuscrito y sus valiosos consejos. Debo mencionar también a la institución Ikerlan-
IK4 por su soporte.
No puedo olvidarme de mi familia por todo su apoyo. Y por último, pero no por ello menos
importante, quiero agradecer a Belén sus ánimos, comprensión y apoyo incondicional, que sin ello
habría sido imposible llevar a buen puerto este trabajo.


Resumen i
Resumen
Esta tesis analiza el diseño e implementación de un dispositivo PLC Smart Grid para un
entorno de una red de área de hogar, donde la robustez y fiabilidad del enlace de
comunicación son un requisito. La red powerline es un medio de transmisión compartido
usado por todos los nodos de forma independiente. Por lo tanto, se deben emplear técnicas
de acceso múltiple para dividir las señales de transmisión, las cuales deben ser ortogonales
entre sí. Además de esto, la complejidad computacional del sistema, coste y consumo
energético deben tenerse en cuenta durante la fase de diseño. De modo que es necesario
implementar sistemas simples, de manera que todos los usuarios accedan asíncronamente
al medio de transmisión sin la necesidad de ningún nodo central.
Para entender las dificultades de las comunicaciones powerline, y diseñar sistemas de
transmisión robustos, se debe tener una buena comprensión de las características del canal
de comunicaciones. En particular, el rango de la respuesta frecuencial y las propiedades del
ruido del canal. En esta tesis se propone un modelo de simulación del canal powerline que
tiene en cuenta el ruido generado en la red así como los perfiles de atenuación frecuencial
de una red desadaptada. El modelo propuesto está basado en los resultados de una
campaña de medidas y las propuestas de otros trabajos. Un análisis del efecto del ruido
impulsional sobre las señales transmitidas revela un umbral en el rendimiento del receptor,
que depende de las propiedades estadísticas del ruido impulsional.
Los sistemas multiportadora de alta velocidad han mostrado un excelente rendimiento
en canales con efecto multitrayecto, mientras que las extensiones MC-CDMA y OFDMA han
investigado los buenos resultados en entornos síncronos de comunicaciones powerline. Esta
tesis examina el rendimiento de algunas de estas técnicas de acceso múltiple en entornos
asíncronos powerline, usando secuencias de ensanchamiento largas binarias y complejas, en
lugar de las tradicionales ortogonales cortas debido a sus malas propiedades de correlación
cruzada en entornos asíncronos.
Con el objetivo centrado en dispositivos Smart Grid, esta tesis evita el uso de técnicas
complejas de detección multiusuario (MUD) en el receptor como por ejemplo canceladores
de interferencia en paralelo, para centrarse en técnicas más simples de un único usuario
(SUD). Con respecto a sistemas CDMA monoportadora, se selecciona un receptor MMSE
debido a la facilidad de adaptación usando algoritmos adaptativos. El rendimiento de un
receptor MMSE a nivel de símbolo en sistemas asíncronos DS-CDMA con secuencias largas es
analizado y comparado con sistemas MC-CDMA empleando intervalo de guarda en forma de
Resumen
ii
prefijo cíclico. Los análisis de rendimiento se basan en el método SGA y son verificados con
simulaciones Monte Carlo para un número alto de usuarios simultáneos con ruido
impulsional, y usando diferentes tipos de secuencias. De los resultados del análisis se
muestra un superior rendimiento desechando la interferencia de acceso múltiple de los
sistemas CDMA monoportadora en entornos asíncronos. Las simulaciones Monte Carlo
también confirman el umbral de la tasa de error debido al ruido impulsional.
Se propone una estructura adaptativa para la implementación del receptor MMSE, que
requiere diferentes parámetros difíciles de estimar desde el receptor. El receptor adaptativo
está basado en un filtro cuyos coeficientes son actualizados por un algoritmo, teniendo la
capacidad de suprimir la interferencia de ruido y acceso múltiple haciendo uso de las
propiedades cicloestacionarias de las señales transmitidas. Las simulaciones Monte Carlo
muestran un buen rendimiento en sistemas DS-CDMA asíncronos comparado con los
sistemas multiportadora MC-CDMA y MC-DS-CDMA en las mismas condiciones,
especialmente usando secuencias polifásicas. Se examinan los algoritmos NLMS y RLS, y se
propone una versión mejorada de este último que resulta menos vulnerable al ruido
impulsional. Para SNR altas la interferencia de acceso múltiple degrada el rendimiento del
receptor adaptativo usando secuencias binarias largas, mientras que el ruido impulsional
prevalece sobre la interferencia en caso de usar secuencias polifásicas, las cuales obtienen el
mejor rendimiento en combinación de un receptor RLS mejorado. Para finalizar, se muestra
como los algoritmos adaptativos muestran mejores capacidades de seguimiento y mejor
rechazo de interferencia cerca-lejano con secuencias largas polifásicas.

Abstract iii
Abstract
This thesis examines the design and implementation of a Smart Grid powerline
communication device for a Home Area Network environment, where the communication
link robustness and reliability are a requirement. Powerline network represents a shared
transmission medium used by all nodes independently. Therefore, multiple–access
techniques must be employed in order to divide transmitted signals, which have to be
orthogonal to each other. In addition to this, system computational complexity, cost and
power consumption need to be taken into account during design phase. So, simple systems
need to be implemented, so that all the users access the medium asynchronously without
the coordination of any central node.
To understand the challenges of powerline communication, and to design robust data
transmission systems, one must have a good understanding of the communication channel
characteristics; in particular, the range of channel frequency response, and the
characteristics of the channel noise. In this thesis, a powerline channel model is proposed,
which takes into account the noise generated in the network as well as the frequency
attenuation profile of the unmatched network. The proposed model is based on a channel
measurement campaign results and proposals from other works. An analysis of the impulsive
noise effect over transmitted signals reveals a performance bound at the receiver side,
which depends on impulsive noise statistics.
High data rate multi–carrier systems have shown successful performance under
multipath channels, whereas its multiple–access extensions MC-CDMA and OFDMA have
probed good results under synchronous powerline communications environments. The
thesis examines the performance of some multiple–access techniques in asynchronous
powerline communications environments using long binary and complex–valued polyphase
spreading sequences, instead of short orthogonal codes due to their worse cross–correlation
properties in asynchronous environments.
This thesis avoids complex joint detection techniques at the receiver, such as multi–
user detection and parallel interference cancellers, and it focuses on single–user detection
techniques. Concerning single–carrier CDMA system, an MMSE receiver is selected due to its
advantage of ease of adaptation, since standard adaptive algorithms can be employed. The
performance of the single user detector symbol–level MMSE receiver in asynchronous long
sequences DS-CDMA systems is analyzed and compared with that of MC-CDMA receiver
employing an interval guard in the form of a CP. Performance analysis is based on the SGA

Abstract
iv
method, and validated for a large number of simultaneous nodes with Monte Carlo
simulations under powerline impulsive noise, and using different kind of long sequences.
From analysis results, it is shown the superior performance rejecting MAI of single-carrier
multiple–access technique in asynchronous environments. Monte Carlo simulations also
confirm the BER bound due to impulsive noise
An adaptive architecture is proposed for practical implementation of the MMSE
receiver, which requires several parameters difficult to estimate from the receiver side. The
adaptive receiver is based on a FSE whose tap weights are updated by an adaptive algorithm,
having the capability of performing multiple-access interference and narrowband noise
suppression taking advantage from cyclostationary properties of the transmitted signals,
requiring the knowledge of fewer parameters compared to the MMSE and RAKE receiver.
Monte Carlo simulations show the good performance of adaptive FSE receivers in
asynchronous DS-CDMA systems compared to MC-CDMA and MC-DS-CDMA systems,
especially using polyphase long sequences. Two well-known pilot-aided NLMS and RLS
adaptive algorithms are examined. An enhanced version of the RLS algorithm less vulnerable
to the impulsive noise is proposed. At high signal-to-noise ratio, the MAI degrades the
performance of adaptive FSE receiver using binary long sequences, whereas the powerline
impulsive noise prevails over the MAI in the case of using polyphase long sequences, which
achieves the best performance in combination with the enhanced RLS receiver. The adaptive
algorithms show better tracking capabilities and good near-far interference rejection with
long polyphase sequences.

Glossary v
Glossary
3G 3rd Generation
3GPP 3rd Generation Partnership Project
AC Alternating Current
ADSL Asymmetric Digital Subscriber Line
ANSI American National Standards Institute
AWGN Additive White Gaussian Noise
BER Bit Error Rate
BLE Bit Loading Estimate
BPSK Binary Phase-Shift Keying
CCo Central Coordinator
CDMA Code Division Multiple–Access
CDF Cumulative Distribution function
CDV Committee Draft for Vote
CDWMT Complex Discrete Wavelet Multi–Tone
CE Conformité Européenne
CEBus Consumer Electronics Bus
CENELEC Comité Européen de Normalisation Electrotechnique
CFO Carrier Frequency Offset
CISPR Comité International spécial des perturbations radioélectriques
CLT Central Limit Theorem
CMFB Cosine Modulated Filter Bank
CMOE Constrained Minimum Output Energy
CP Cyclic Prefix
CSMA/CA Carrier Sense Multiple–access / Collision Avoidance
CSI Channel State Information
DBPSK Differential Binary Phase–Shift Keying
DECT Digital Enhanced Cordless Telecommunication
DFT Discrete Fourier Transform
DHS Digital Home Standard
DMT Digital Multi-Tone
DQPSK Differential Quadrature Phase-Shift Keying
DS-CDMA Direct–Sequence Code Division Multiple–Access
DSL Digital Subscriber Line
DSSS Direct–Sequence Spread Spectrum
DWMT Discrete Wavelet Multi–Tone
ECC Even cross–correlation
ECG Equal Gain Combining
EHS European Home System
EHSA European Home System Association
EIB European Installation Bus
EIBA European Installation Bus Association
Glossary
vi
EMC Electromagnetic Compatibility
ETSI European Telecommunications Standards Institute
E-UTRA Evolved Universal Terrestrial Radio Access
FCC Federal Communications Commission
FDM Frequency Division Multiplexing
FDMA Frequency Division Multiple–Access
FEC Forward Error Correction
FFT Fast Fourier Transform
FH-CDMA Frequency–Hopping Code Division Multiple–Access
FHSS Frequency–Hopping Spread Spectrum
FIR Finite Impulse Response
FMT Filtered Multi–Tone
FSE Fractionally Spaced Equalizer
GHG GreenHouse Gases
GPS Global Positioning System
GSM Global System for Mobile communications
HAN Home Area Network
HD-PLC High Definition PowerLine Communications
HDTV High Definition TeleVision
HPA HomePlug Powerline Alliance
HV High Voltage
ICI Inter Carrier Interference
IDFT Inverse Discrete Fourier Transform
IEC International Electrotechnical Commission
IED Intelligent Electronic Device
IEEE Institute of Electrical and Electronics Engineers
ISI Inter Symbol Interference
ITU International Telecommunication Union
IAT Inter Arrival Time
LAN Local Area Network
LDPC Low Density Parity Check
LMS Least mean squares
LPTV Linear Periodically Time Varying
LTE Long–Term Evolution
LV Low Voltage
MAC Medium Access Control
MAI Multiple Access Interference
MC-CDMA Multi Carrier Code Division Multiple–Access
MC-DS-CDMA Multi Carrier Direct Sequence Code Division Multiple–Access
MC-SS Multi Carrier Spread Spectrum
MMSE Minimum Mean Square Error
MRC Maximum Ration Combining
MSE Mean Square Error
MUD Multi–User Detection
MV Medium Voltage
NLMS Normalized Least mean squares

Glossary
vii
OCC Odd cross–correlation
OFDM Orthogonal Frequency Division Multiplexing
OFDMA Orthogonal Frequency Division Multiple–Access
OSI Open System Interconnection
PAPR Peak–to–Average Power Ratio
PC Personal Computer
PDF Probability Density Function
PIC Parallel Interference Canceller
PLC Power Line Communication
PLT Power Line Technology
PSD Power Spectral Density
QoS Quality of Service
QPSK Quadrature Phase–Shift Keying
RF Radio Frequency
RLS Recursive Least squares
RTU Remote terminal unit
ScDMA Scattering Division Multiple–Access
SC-FDMA Single Carrier Frequency Division Multiple–Access
SCR Silicon Controlled Rectifier
SGA Standard Gaussian Approximation
SINR Signal–to–Interference Noise Ratio
SNR Signal–to–Noise Ratio
SS Spread Spectrum
SS-MC-MA Spread Spectrum Multi Carrier Multiple–Access
SUD Single–User Detection
TDMA Time Division Multiple–access
TH-CDMA Time–Hopping Code Division Multiple–Access
THSS Time–Hopping Spread Spectrum
TIA Telecommunication Industry Association
TO Time Offset
UPA Universal Powerline Association
UWB Ultra Wide Band
VDSL2 Very High Digital Subscriber Line 2
VoIP Voice over Internet Protocol
W-CDMA Wideband Code Division Multiple–Access
WSCS Wide Sense CycloStationary
WLAN Wireless Local Area Network


Index of contents ix
Index of contents
LIST OF FIGURES............................................................................................................................................ XIII
LIST OF TABLES ............................................................................................................................................ XVII
1 INTRODUCTION .........................................................................................................................................1
1.1 POWER LINES FOR COMMUNICATION ..................................................................................................... 1
1.2 SMART GRID ............................................................................................................................................. 4
1.3 OBJECTIVES .............................................................................................................................................. 7
1.4 OUTLINE OF THE THESIS ........................................................................................................................... 7
2 STATE OF THE ART REVIEW .......................................................................................................................9
2.1 POWERLINE CHANNEL ........................................................................................................................... 10
2.1.1 Topology of the network ................................................................................................................ 11
2.1.2 Frequency response ........................................................................................................................ 11
2.1.3 Channel Noise ................................................................................................................................ 16
2.1.3.1 Background and narrowband noise ........................................................................................................... 18
2.1.3.2 Impulsive noise .......................................................................................................................................... 19
2.1.4 EMC constrains and interferences .................................................................................................. 20
2.2 NARROWBAND POWERLINE .................................................................................................................. 26
2.2.1 X-10 Protocol .................................................................................................................................. 27
2.2.2 CEBus Protocol ............................................................................................................................... 28
2.2.3 LONWORKS Protocol ...................................................................................................................... 28
2.2.4 EHS Protocol ................................................................................................................................... 29
2.2.5 KONNEX Protocol ........................................................................................................................... 29
2.3 BROADBAND POWERLINE ...................................................................................................................... 29
2.3.1 HOMEPLUG POWERLINE ALLIANCE ............................................................................................... 30

Index of contents
x
2.3.1.1 HOMEPLUG 1.0 .......................................................................................................................................... 31
2.3.1.2 HOMEPLUG AV .......................................................................................................................................... 32
2.3.1.3 HOMEPLUG Green PHY .............................................................................................................................. 32
2.3.1.4 HOMEPLUG AV2 ........................................................................................................................................ 33
2.3.2 UNIVERSAL POWERLINE ASSOCIATION .......................................................................................... 33
2.3.3 HD POWERLINE COMMUNICATIONS ............................................................................................. 34
2.3.4 HOMEGRID FORUM ....................................................................................................................... 34
2.3.5 STANDARDISATION ........................................................................................................................ 35
2.3.5.1 IEEE P1901 ................................................................................................................................................. 35
2.3.5.2 ITU G.hn ..................................................................................................................................................... 36
2.4 SMART GRID ........................................................................................................................................... 37
3 STATEMENT OF THE PROBLEM ................................................................................................................ 43
3.1 TDMA ..................................................................................................................................................... 44
3.2 FDMA ..................................................................................................................................................... 49
3.3 CDMA ..................................................................................................................................................... 57
3.4 SCDMA .................................................................................................................................................... 62
3.5 SUMMARY AND CONTRIBUTIONS .......................................................................................................... 62
4 MEASUREMENT CAMPAIGN AND CHANNEL MODELING ......................................................................... 69
4.1 CHANNEL MEASUREMENTS ................................................................................................................... 70
4.1.1 Frequency response ........................................................................................................................ 70
4.1.2 Channel Noise ................................................................................................................................ 76
4.1.2.1 Background noise ...................................................................................................................................... 77
4.1.2.2 Impulsive noise .......................................................................................................................................... 78
4.2 CHANNEL MODELING ............................................................................................................................. 85
4.2.1 Frequency response ........................................................................................................................ 85
4.2.2 Noise .............................................................................................................................................. 93
4.2.2.1 Background noise ...................................................................................................................................... 93
4.2.2.2 Impulsive noise .......................................................................................................................................... 98
4.3 IMPULSIVE NOISE EFFECT ..................................................................................................................... 101
5 THEORETICAL ANALYSIS ........................................................................................................................ 103
5.1 SPREADING SEQUENCES ...................................................................................................................... 104
5.2 ANALYSIS OF ASYNCHRONOUS DS-CDMA SYSTEM .............................................................................. 108
5.3 ANALYSIS OF ASYNCHRONOUS MC-CDMA SYSTEM ............................................................................. 115
6 PERFORMANCE ANALYSIS ..................................................................................................................... 121
6.1 SPREADING SEQUENCES ...................................................................................................................... 122
6.2 NUMERICAL RESULTS ........................................................................................................................... 132

Index of contents
xi
6.3 SUMMARY ............................................................................................................................................ 137
7 ALGORITHMIC RESEARCH ...................................................................................................................... 139
7.1 ADAPTIVE RECEIVER ............................................................................................................................. 140
7.2 NUMERICAL RESULTS ........................................................................................................................... 149
7.2.1 SPREADING SEQUENCES COMPARISON ....................................................................................... 152
7.2.2 RECEIVERS COMPARISON ............................................................................................................. 159
7.2.3 NEAR–FAR EFFECT ........................................................................................................................ 164
7.3 SUMMARY ............................................................................................................................................ 166
8 CONCLUSIONS ....................................................................................................................................... 169
8.1 WORK SUMMARY ................................................................................................................................. 169
8.2 FUTURE WORK ..................................................................................................................................... 172
REFERENCES.................................................................................................................................................. 173

List of Figures xiii
List of Figures
List of Figures
Figure 1.1 European power delivery grid topology ............................................................................................. 2
Figure 1.2 PLC signal under impulsive noise [Echelon] ..................................................................................... 2
Figure 1.3 Home area network [HomeGrid] .......................................................................................................... 3
Figure 1.4 Smart Grid device complexity [HomeGrid] ........................................................................................ 6
Figure 2.1 In–home powerline topology ............................................................................................................. 11
Figure 2.2 Transmission lines ............................................................................................................................. 15
Figure 2.3 PLC channel frequency response ..................................................................................................... 15
Figure 2.4 Time variant PLC channel frequency response due to connection and disconnection of
electrical devices .................................................................................................................................................. 16
Figure 2.5 PLC channel noise classification [Zimmermann and Dostert, 2000] ............................................. 18
Figure 2.6 Background and narrowband noise PSD ......................................................................................... 18
Figure 2.7 Impulse noise parameters ................................................................................................................. 20
Figure 2.8 Electromagnetic compatibility areas [Hrasnica et al., 2004] ........................................................... 21
Figure 2.9 CENELEC Regulation for narrowband PLC ..................................................................................... 22
Figure 2.10 Occupation band 150 kHz–30 MHz.................................................................................................. 23
Figure 2.11 Home automation using narrowband EIB-PLC .............................................................................. 26
Figure 2.12 X-10 coding in a three–phase network ........................................................................................... 27
Figure 2.13 PLC standardization map ................................................................................................................ 35
Figure 2.14 Overview of Smart Grid [EPRI, 2009] .............................................................................................. 37
Figure 3.1 TDMA time slots scheduling ............................................................................................................. 44
Figure 3.2 OFDM modulation............................................................................................................................... 46
Figure 3.3 Bit loading over an OFDM symbol .................................................................................................... 47
Figure 3.4 FDMA technique ................................................................................................................................. 49
Figure 3.5 OFDMA (DMT-FDMA) technique ........................................................................................................ 51
Figure 3.6 Comparison between TDMA/OFDMA and TDMA techniques (each color represents an user) ... 52
Figure 3.7 Comparison between OFDMA and SC-FDMA techniques ............................................................. 55

List of Figures
xiv
Figure 3.8 CDMA technique ................................................................................................................................. 58
Figure 3.9 Multiple–access schemes .................................................................................................................. 63
Figure 3.10 Spread spectrum receivers for PLC................................................................................................ 66
Figure 4.1 Frequency response measurements set–up .................................................................................... 70
Figure 4.2 Powerline coupling circuit ................................................................................................................. 71
Figure 4.3 Transmission pass–band filter .......................................................................................................... 71
Figure 4.4 Reception pass–band filter ................................................................................................................ 72
Figure 4.5 Pass–band filter frequency response ............................................................................................... 72
Figure 4.6 Measured channel frequency response (Gain) ................................................................................ 73
Figure 4.7 Measured channel frequency response (Phase) ............................................................................. 73
Figure 4.8 Comparative channel responses in accordance with loads ........................................................... 74
Figure 4.9 Frequency response expansion ....................................................................................................... 74
Figure 4.10 Channel impulsive response .......................................................................................................... 75
Figure 4.11 Noise measurement set–up ............................................................................................................ 76
Figure 4.12 High–pass filter response ............................................................................................................... 76
Figure 4.13 Background noise PSD ................................................................................................................... 77
Figure 4.14 Measured impulsive noise .............................................................................................................. 78
Figure 4.15 Time between pulses PDF (20s) ..................................................................................................... 79
Figure 4.16 Time between pulses PDF (200ms) ................................................................................................ 79
Figure 4.17 Measured single pulse noise .......................................................................................................... 80
Figure 4.18 Measured single pulse noise PSD ................................................................................................. 80
Figure 4.19 Measured pulse–burst noise .......................................................................................................... 81
Figure 4.20 Measured single pulse noise PSD ................................................................................................. 82
Figure 4.21 Pulse amplitude PDF ....................................................................................................................... 83
Figure 4.22 Pulse amplitude CDF ....................................................................................................................... 84
Figure 4.23 Burst pulse duration PDF ............................................................................................................... 84
Figure 4.24 Burst pulse duration CDF ............................................................................................................... 85
Figure 4.25 Unmatched transmission line ............................................................................................................. 86
Figure 4.26 Non–ideality of the source .............................................................................................................. 89
Figure 4.27 Network topology ............................................................................................................................ 92
Figure 4.28 Random network topology ............................................................................................................. 92
Figure 4.29 Random frequency responses ....................................................................................................... 93
Figure 4.30 Randomly generated PSD shape .................................................................................................. 97
Figure 4.31 Filtered background noise PSD ..................................................................................................... 97
Figure 4.32 PSD noise and cf = 13.4MHz ....................................................................................................... 100
Figure 4.33 Impulsive noise effect over received data symbols ................................................................... 102
Figure 5.1 User even and odd cross–correlation ............................................................................................ 106
Figure 5.2 System users asynchronism ........................................................................................................... 109
Figure 5.3 Long sequence reordering for DS-CDMA interference users ....................................................... 109
Figure 5.4 Multiple–access interference for asynchronous DS-CDMA ......................................................... 110
Figure 5.5 Long sequence reordering for MC-CDMA interference users ...................................................... 116
Figure 5.6 Multiple–access interference for asynchronous MC-CDMA ......................................................... 118
Figure 6.1 ECC and OCC calculation for τ delay ............................................................................................ 123

List of Figures
xv
Figure 6.2 ECC for Walsh sequences Lc=64 .................................................................................................... 123
Figure 6.3 OCC for Walsh sequences Lc=64 .................................................................................................... 123
Figure 6.4 OCC for Gold sequences Lc=2047 .................................................................................................. 124
Figure 6.5 ECC for Gold sequences Lc=2047 ................................................................................................... 124
Figure 6.6 OCC for Song–Park sequences Lc=2048 ........................................................................................ 125
Figure 6.7 ECC for Song–Park sequences Lc=2048 ........................................................................................ 125
Figure 6.8 ECC for Oppermann sequences Lc=2039 ....................................................................................... 126
Figure 6.9 OCC for Oppermann sequences Lc=2039 ....................................................................................... 126
Figure 6.10 OCC surface for Walsh sequences Lc=64 .................................................................................... 127
Figure 6.11 ECC surface for Walsh sequences Lc=64 ..................................................................................... 127
Figure 6.12 OCC surface for Gold sequences Lc=2047 ................................................................................... 128
Figure 6.13 ECC surface for Gold sequences Lc=2047 ................................................................................... 128
Figure 6.14 OCC surface for Song–Park sequences Lc=2048 ........................................................................ 129
Figure 6.15 ECC surface for Song–Park sequences Lc=2048 ......................................................................... 129
Figure 6.16 OCC surface for Oppermann sequences Lc=2039 ....................................................................... 130
Figure 6.17 ECC surface for Oppermann sequences Lc=2039 ....................................................................... 130
Figure 6.18 Theoretical BER performance for asynchronous DS-CDMA system without impulsive noise
with 10uN = , 4=R and 0 (1 1)n uP P n N= ≤ ≤ − . ........................................................................................ 132
Figure 6.19 Theoretical and Monte Carlo BER performance for asynchronous DS-CDMA system under
impulsive noise with 10uN = , 4=R and 0 (1 1)n uP P n N= ≤ ≤ − . Monte Carlo simulations marked
with∗ . ................................................................................................................................................................. 133
Figure 6.20 Theoretical BER performance for asynchronous MC-CDMA system with 10uN = and
0 (1 1)n uP P n N= ≤ ≤ − . ..................................................................................................................................... 134
Figure 6.21 Theoretical and Monte Carlo BER performance for asynchronous MC-CDMA under impulsive
noise with 10uN = and 0 (1 1)n uP P n N= ≤ ≤ − . Monte Carlo simulations marked with∗ . ...................... 135
Figure 6.22 Theoretical BER performance comparison for asynchronous MC-DMA and DS-CDMA under
impulsive noise .................................................................................................................................................. 136
Figure 7.1 Approximated convergence rate compared with real (simulation) transient for step size µ = 0.03
............................................................................................................................................................................. 144
Figure 7.2 Training curve of the NLMS (µ=0.03) and RLS (λ=0.9995) algorithms for asynchronous DS-
CDMA system with Eb/N0 = 12 dB, 10uN = , 4R = , 64cN = , 1kV = . Solid line represents the MMSE =
0.0443. ................................................................................................................................................................. 145
Figure 7.3 Training curve of the NLMS (µ=0.03) and RLS (λ=0.9995) algorithms for asynchronous DS-
CDMA system with Eb/N0 = 22 dB, 10uN = , 4R = , 64cN = , 1kV = . Solid line represents the MMSE =
0.0055. ................................................................................................................................................................. 146
Figure 7.4 RLS based FSE coefficients divergence under impulsive noise ................................................. 147
Figure 7.5 BER performance for asynchronous DS-CDMA RAKE receiver under impulsive noise with
10uN = , 1R = and 0 (1 1)n uP P n N= ≤ ≤ − . ................................................................................................. 152
Figure 7.6 BER performance for asynchronous DS-CDMA NLMS-FSE receiver (µ=0.03) under impulsive
noise with 10uN = , 4R = and0 (1 1)n uP P n N= ≤ ≤ − . ................................................................................ 153

List of Figures
xvi
Figure 7.7 BER performance with different oversampling ratios for asynchronous DS-CDMA NLMS-FSE
receiver (µ=0.03) under impulsive noise with 10uN = and 0 (1 1)n uP P n N= ≤ ≤ − . ................................. 154
Figure 7.8 BER performance for asynchronous DS-CDMA RLS-FSE receiver (λ=0.9995) under impulsive
noise with 10uN = , 4R = and 0 (1 1)n uP P n N= ≤ ≤ − . .............................................................................. 155
Figure 7.9 BER performance for asynchronous DS-CDMA RLS-FSE enhanced receiver (λ=0.9995) under
impulsive noise with 10uN = , 4R = and 0 (1 1)n uP P n N= ≤ ≤ − ............................................................. 156
Figure 7.10 MMSE and adaptive MMSE performance comparison for asynchronous DS-CDMA system
under impulsive noise with 10uN = , 4=R and 0 (1 1)n uP P n N= ≤ ≤ − . ................................................. 157
Figure 7.11 BER performance for asynchronous MC-CDMA MRC receiver under impulsive noise with
10uN = and 0 (1 1)n uP P n N= ≤ ≤ − . ............................................................................................................. 158
Figure 7.12 BER performance for asynchronous MC-DS-CDMA MRC receiver under impulsive noise with
10uN = and 0 (1 1)n uP P n N= ≤ ≤ − . ............................................................................................................. 158
Figure 7.13 BER performance comparison under impulsive noise for Walsh spreading sequences for
64cL = and 0 (1 1)n uP P n N= ≤ ≤ − . .............................................................................................................. 159
Figure 7.14 BER performance comparison under impulsive noise for Gold spreading sequences for
2047cL = and 0 (1 1)n uP P n N= ≤ ≤ − . .......................................................................................................... 160
Figure 7.15 BER performance comparison under impulsive noise for Oppermann spreading sequences
for 2039cL = and 0 (1 1)n uP P n N= ≤ ≤ − . .................................................................................................... 161
Figure 7.16 BER performance comparison under impulsive noise for Song–Park spreading sequences for
2048cL = and 0 (1 1)n uP P n N= ≤ ≤ − . .......................................................................................................... 162
Figure 7.17 BER performance for asynchronous DS-CDMA RLS-FSE enhanced receiver at 8 Mbps under
impulsive noise with 0 16V = , 2R = and
0 (1 1)n uP P n N= ≤ ≤ − . .............................................................. 163
Figure 7.18 BER performance for asynchronous DS-CDMA NLMS-FSE receiver at 8 Mbps under impulsive
noise with 0 16V = , 2R = and
0 (1 1)n uP P n N= ≤ ≤ − . ............................................................................... 164
Figure 7.19 BER performance comparison for asynchronous DS-CDMA receiver at 8 Mbps under
impulsive noise with 0 16V = , 2R = , 10uN = and
0 (1 1)n uP P n N= ≤ ≤ − . ............................................. 165
Figure 7.20 BER performance for NLMS receiver and near-far effect under impulsive noise with 4R = ,
10uN = and 02 (1 1)n uP P n N⋅ = ≤ ≤ − . ......................................................................................................... 166
Figure 7.21 BER performance for enhanced RLS receiver and near–far effect under impulsive noise with
4R = , 10uN = and 02 (1 1)n uP P n N⋅ = ≤ ≤ − . ............................................................................................ 167

List of Tables xvii
List of Tables
List of Tables
Table 2.1 Conducted emission limits (<30 MHz) ................................................................................................ 22
Table 2.2 Conducted emission limits (>30 MHz) ................................................................................................ 23
Table 2.3 Comparison between 802.11b - HomePlug 1.0 [Lee et al., 2002] ..................................................... 31
Table 2.4 Comparison between Multimedia and Smart Grid networks [HomeGrid] ....................................... 40
Table 4.1 Pulse power and energy ...................................................................................................................... 82
Table 4.2 Background noise profiles [Benyoucef, 2003] .................................................................................. 94
Table 4.3 RF services [Hrasnica et al., 2004] ..................................................................................................... 95
Table 4.4 Narrowband noise profiles [Benyoucef, 2003] .................................................................................. 96
Table 4.5 Single pulse (Nv = 1) statistical parameters [Degardin et al., 2003] and [Val et al., 2007] .............. 99
Table 4.6 Burst pulse statistical parameters [Degardin et al., 2003] and [Val et al., 2007] ............................ 99
Table 5.1 Gold preferred pairs........................................................................................................................... 105
Table 6.1 Average cross–correlation performance ......................................................................................... 131
Table 7.1 Receiver vs. sequences performance comparison ......................................................................... 167


Chapter 1. Introduction 1
1 Introduction
Chapter 1
Introduction
1.1 POWER LINES FOR COMMUNICATION
For several years there has been a great deal of interest in the utilization of power
lines as an information transmission medium. Initially, powerline communications (PLC)
technologies have been used for narrowband low data rate (<30 kbps) communication links
in the lower frequency bands using simple modulation schemes. In outdoor environment,
power distribution automation and remote meter reading [Hosono, 1982] were the target
applications for PLC, mainly in the high and medium voltage (HV and MV) lines. For in–home
network in the low voltage (LV) section, the main application was the home automation.
In PLC no additional cabling is necessary, since most industrial, office or residential
infrastructures have a very large electrical grid and wall outlets that are easy to access
throughout a building. This gives the advantage of good flexibility in use, since electronic
systems that will be connected to it, will almost always use power supply from the mains

Chapter 1. Introduction
2
network, too. However, the use of power lines for broadband applications was dismissed
because the channel was considered too noisy and unpredictable.
Figure 1.1 European power delivery grid topology
Powerline networks are not designed for communications and they do not present a
favorable transmission medium. Consequently, power lines are a very hostile medium for
communications. A power line network topology composed of large number of connections,
branches and lines with unmatched impedances gives, as a result, a received signal affected
by the multipath effect [Zimmermann and Dostert, 2002b]. Thus, the PLC transmission
channel is characterized by a large and frequency–dependent attenuation, changing
impedance and fading as well as unfavorable noise conditions. Various noise sources, acting
from the supply network, due to different electric devices being connected to the network,
and from the network environment, can negatively influence a PLC system, causing
disturbances in error–free data transmission [Zimmermann and Dostert, 2002a].
Figure 1.2 PLC signal under impulsive noise [Echelon]
After the deregulation of the European telecommunications market in a large number
of countries, new business possibilities opened for PLC technology. An alternative solution to

Chapter 1. Introduction
3
digital subscriber lines (DSL) and cable services for the realization of the access networks is
offered by the PLC technology using the MV/LV power supply grids for so–called “last mile”
communications networks. However, there is a strong competition between these providers
although PLC is a cost–effective solution.
Due to the increasing importance of networking at homes, offices and industrial
buildings, indoor PLC is considered as a candidate medium for high data rate transmissions.
Nowadays the use of high speed transmission networks is widespread inside home
environments, operating in the higher bands of the spectrum, for audio and video diffusion
as well as for personal computer data sharing. In order to utilize the in–building power
distribution grid to implement a local area network (LAN), competing directly against existing
in–home technologies such as well–known Wi–Fi and Ethernet networks.
Figure 1.3 Home area network [HomeGrid]
Unfortunately, a PLC network acts as an antenna producing electromagnetic radiation
in its environment and disturbs other services working in the same frequency range.
Therefore, the regulatory bodies specify very strong limits regarding the electromagnetic
emission from the PLC networks, with the result that PLC networks have to operate with a
limited signal power, causing performance losses.
Additionally, alternative PLC scenarios have been proposed recently, such as in–vehicle
PLC [Lienard et al., 2008] using the power supply cables of the vehicle, not only limited to
cars, but also for railway and lift systems may be possible. The idea is basically reducing costs
removing kilometers of dedicated communication cables.
Chapter 1. Introduction
4
Unlike the telephone network used by DSL, a power line network does not consist of a
point–to–point connection between two nodes. Thus, a PLC network represents a shared
transmission medium used by all nodes independently. Accordingly, the capacity of PLC
networks is furthermore reduced, requiring effective multiple–access techniques and dealing
with multiuser environments.
1.2 SMART GRID
A new concept for power delivering, named Smart Grid [Massoud Amin and
Wollenberg, 2005], is growing up during the last years, which has been promoted by many
governments as a way of addressing energy independence, global warming and emergency
resilience issues. Smart Grid refers to an improved electricity supply chain that runs from a
major power plant all the way inside your home. In short, there are thousands of power
plants throughout the country that generate electricity using wind energy, nuclear energy,
coal, hydro, natural gas, and a variety of other resources. These generating stations produce
electricity at a certain electrical voltage. This electrical energy goes through several steps
increasing and decreasing the voltage in order to transport it more efficiently.
In many countries, the electricity delivery system is getting old and worn out. In
addition, population growth in some areas has caused the entire transmission system to be
over used and fragile, taking also into account that electrical appliances are getting more
sensitive to electrical variations. Adding new transmission lines will help the utilities get
more energy from the power plants to the user. However, many communities do not want
new power lines in their areas. In addition, adding new capacity, although needed, will not
increase the reliability of all the old electrical equipment reaching the end of its useful life.
What is needed is a new approach that significantly increases the efficiency of the entire
electrical delivery system. This approach will not only increase reliability, but will also reduce
energy in the delivery process and thereby reduce greenhouse house emissions. We call this
new approach Smart Grid.
The concept of Smart Grid is to add monitoring, analysis, control, and communication
capabilities to the electrical delivery system to maximize the throughput of the system while
reducing the energy consumption. The Smart Grid will allow utilities to move electricity
around the system as efficiency and economically as possible. It will also allow the user and
business to use electricity as economically as possible, having the choice and flexibility to
manage your electrical use while minimizing the costs. Smart Grid benefits can be
categorized into 5 types [EPRI, 2009]:

Chapter 1. Introduction
5
• Power reliability and power quality: The Smart Grid provides a reliable power
supply with fewer and briefer outages, “cleaner” power, and self–healing
power systems, through the use of digital information, automated control, and
autonomous systems.
• Safety and cyber security benefits: The Smart Grid continuously monitors itself
to detect unsafe or insecure situations that could detract from its high
reliability and safe operation. Higher cyber security is built in to all systems and
operations including physical plant monitoring, cyber security, and privacy
protection of all users and customers.
• Energy efficiency benefits: The Smart Grid is more efficient, providing reduced
total energy use, reduced peak demand, reduced energy losses, and the ability
to induce end–user use reduction instead of new generation in power system
operations.
• Environmental and conservation benefits: The Smart Grid is “green”. It helps
reduce greenhouse gases (GHG) and other pollutants by reducing generation
from inefficient energy sources, supports renewable energy sources, and
enables the replacement of gasoline–powered vehicles with plug–in electric
vehicles.
• Direct financial benefits: The Smart Grid offers direct economic benefits.
Operations costs are reduced or avoided. Customers have pricing choices and
access to energy information. Entrepreneurs accelerate technology
introduction into the generation, distribution, storage, and coordination of
energy.
A smart grid is made possible by applying sensing, measurement and control devices
with two–way communications to electricity production, transmission, distribution and
consumption parts of the power grid that communicate information about grid condition to
system users, operators and automated devices, making it possible to dynamically respond
to changes in grid condition.
A home area network (HAN), shown in the Figure 1.3, extends some of the Smart Grid
capabilities into the home using powerline communications networking and/or extending
the network using wireless standards such as ZigBee, INSTEON, Zwave, WiFi or others. A
Chapter 1. Introduction
6
home area network includes an intelligent monitoring system that keeps track of all
electricity flowing in the system. When power is least expensive the user can allow the smart
grid to turn on selected home automation appliances such as washing machines or industrial
processes that can run at arbitrary hours. At peak times it could turn off selected appliances
to reduce demand.
Figure 1.4 Smart Grid device complexity [HomeGrid]
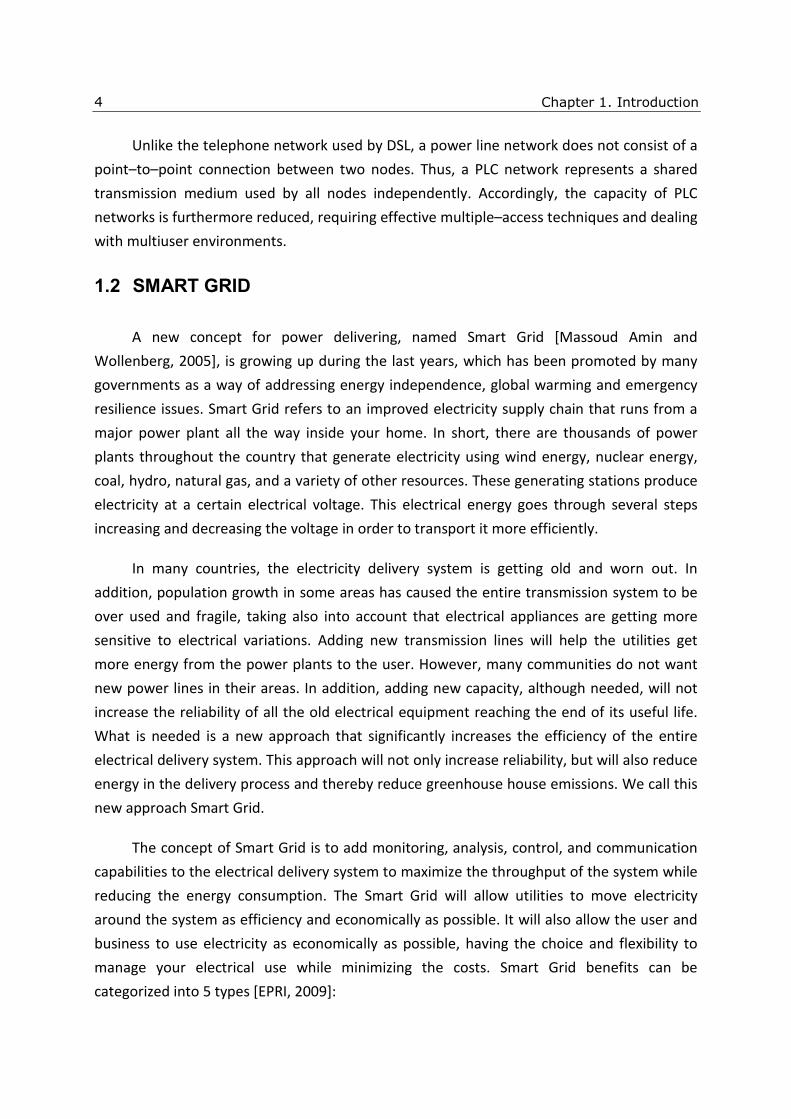
The Figure 1.4 shows the comparison of two different PLC approaches for low
complexity and high performance devices. The device power consumption and complexity is
roughly related to the supported data throughput, which is proportional to the useful
bandwidth, spectral efficiency and duty cycle of the PLC device. This performance ratio
between these two approaches establishes the difference of a Smart Grid device with the
multimedia oriented powerline modem. The most important requirements of Smart Grid
devices for HAN are for lower power, robustness, reliability, smaller size and less costly Bill
of Materials.

Chapter 1. Introduction
7
1.3 OBJECTIVES
The main objective of this thesis is to propose a multi–user powerline communications
system, which suits with the definition of a Smart Grid home device presented above. In
order to accomplish this objective, there have been defined the following particular
objectives:
i. Powerline impulsive noise measurements in order to complete a powerline
channel model and analyze the noise effect over a transmitted signal, obtaining
a closed–form probability error function.
ii. Theoretical and simulation study of asynchronous multiple–access systems with
single–carrier and multi–carrier modulations.
iii. Compare the performance of different families of spreading sequences with
several receivers’ structures and multiple–access systems in asynchronous
environments under powerline impulsive noise.
1.4 OUTLINE OF THE THESIS
The previously defined objectives will be addressed in the following chapters of this
thesis, which is organized as follows. This chapter presents the research framework in which
this work will be developed.
Chapter 2 reviews the state of the art of first powerline communication systems and
presents the current ongoing standardization processes.
Chapter 3 reviews different modulations and multiple–access techniques proposed in
the literature for powerline communication systems. Their suitability for asynchronous and
hostile environments is analyzed.
Chapter 4 presents the powerline channel measurement campaign done and propose
a channel model with background, narrowband and impulsive noise.
In the Chapter 5, a theoretical analysis is done for two asynchronous multiple–access
systems under impulsive noise, obtaining closed–form performance expression.

Chapter 1. Introduction
8
Chapter 6 analyses the performance of the previous systems with different long
spreading sequences, and Chapter 7 validates the previous analysis results with Monte Carlo
simulations under impulsive noise. In this chapter, an adaptive structure in proposed with
improved performance.
Finally, Chapter 8 gives the concluding remarks of the achievements obtained in this
thesis, and the future lines.

Chapter 2. State of the Art Review 9
2 State of the Art Review
Chapter 2
State of the Art Review
The indoor powerline is a promising medium for building in–home networks. The in–
home PLC has been drawing attention lately. There are a large number of power outlets in
any room. Therefore, we can immediately access the PLC networks by plugging the PLC
devices into power outlets without any new wiring. It has been shown that PLC technology
offers a cost–effective alternative for the realization of the access networks. On the other
hand, electrical supply networks are not designed for communications and therefore, the
transmission characteristics of powerline channels, are not entirely suited for data transfer.
There are some specific performance problems limiting the application of PLC technology
and several solutions have been presented to overcome these problems [Hrasnica et al.,
2004]:
- The powerline cables are divided in an asymmetric star topology, having many irregular
connections between network sections and transitions between overhead and
underground cables. The cable transitions cause reflections and changing characteristic
impedance, resulting in multipath signal propagation, with a frequency–selective fading
Chapter 2. State of the Art Review
10
[Zimmermann and Dostert, 2002b]. Additionally, a PLC network changes its structure,
e.g., by plugging and unplugging devices from the network [Cortes et al., 2005]. PLC
suffers from attenuation, which depends on the line, length and changing characteristic
impedance of the transmission line [Zimmermann and Dostert, 2002b].
- The low–voltage supply networks used as a transmission medium for PLC access systems
act as an antenna by producing electromagnetic radiation. On the other hand, the PLC
systems could use a frequency spectrum of up to 30-40 MHz. This frequency range is
reserved for various radio services (e.g. amateur radio) and they may be disturbed by PLC
systems. The regulatory bodies specify the limits for electromagnetic emission that is
allowed to be produced by PLC systems operating out of the frequency range defined by
the CENELEC standard [CENELEC].
- As the signal power is limited, PLC networks become more sensitive to the disturbances.
The disturbances affecting the PLC network environment are caused by other services
(e.g. shortwave radio) operating in the frequency range below 30-40 MHz [Benyoucef,
2003]. There are also disturbances coming from the PLC network itself, such as electro–
motors which could cause impulsive noise [Zimmermann and Dostert, 2002a].
- PLC access systems have to provide a very good network utilization of the shared
transmission medium and, simultaneously, a satisfactory quality of service (QoS). Both
requirements can be achieved by the application of an efficient medium access control
(MAC) layer. The task of the MAC layer is to organize the medium access between
multiple users using various services. MAC protocols for PLC systems have to achieve a
maximum utilization of the limited network capacity and realize time–critical
telecommunication services.
The following sections review the main features of the power line medium in greater
depth, gathering knowledge of the main problems involved in the use of these kinds of
networks. On the other hand, several PLC standards used in the past, present and future will
be listed.
2.1 POWERLINE CHANNEL
Users might experience unexpected trouble while they are communicating with one
another through the indoor powerline. Such trouble would be caused by significant signal

Chapter 2. State of the Art Review
11
attenuation through the power distribution board, colored and impulsive noise generated
from electrical appliances, impedance mismatching due to the absence of electrical
terminations across the frequency band for the in–home PLC, and time–varying channel
responses synchronized to twice the electrical power frequency. The technical problems
encountered in the in–home PLC have been reported: multipath effect caused by impedance
mismatching [Zimmermann and Dostert, 2002b], colored background [Philipps, 1998],
narrowband [Benyoucef, 2003], impulsive noise [Umehara et al., 2006; Zimmermann and
Dostert, 2002a], and periodically time–varying channel frequency response [Barmada et al.,
2006; Canete et al., 2006; Cortes et al., 2005; Sancha et al., 2007].
2.1.1 Topology of the network
Unlike the telephone copper loop, the powerline in–home network does not consist of
point–to–point connections between outlets, but represents a line bus. A typical link
between two outlets consists of the distributor cable, or a series connection of distributor
cables, and the branching house connection cables, which can be modeled from the point of
view of the access network by complex termination impedance [Zimmermann and Dostert,
2002b]. Numerous reflections are caused by the joints of the house service cables, house
connection boxes, and the joints at series connections of cables with different characteristic
impedance.
Figure 2.1 In–home powerline topology
2.1.2 Frequency response
The PLC propagation medium can be seen as a transmission line. The propagation of
signals over powerline produces an attenuation, which increases with the length of the line
and the frequency. This attenuation is a function of the powerline characteristic impedance
LZ and the propagation constantγ . These two parameters can be defined by the primary
Z1
Z2
Z3
Z4
Z5 Z6
Z7
Z8
Z9
Z10 Z11
ZL4 ZL3
ZL1
ZL5
ZL7
N1
ZL6 ZL2

Chapter 2. State of the Art Review
12
resistance R′ per unit length, the conductance G′ per unit length, the inductance L′ per
unit length and the capacitance C′ per unit length, which are generally frequency
dependent. The characteristic impedance is represented by the well–known expression
( ) ( )( ) ( )
2
2L
R f j L fZ
G f j C f
ππ
′ ′+=
′ ′+ (2.1)
and the propagation constant by
( ) ( ) ( )f f j fγ α β= + (2.2)
( ) ( ) ( )( ) ( ) ( )( )2 2f R f j L f G f j C fγ π π′ ′ ′ ′= + ⋅ + . (2.3)
Considering a matched transmission line, which is equivalent to regarding only the
propagation of the wave from source to destination, the transfer function of a line with
length l can be formulated as follows
( ) ( ) ( ) ( )f l f j fH f e e
γ α β− ⋅ − −= = . (2.4)
After different investigations and measurements of the properties of the energy
cables, it has been concluded that ( ) ( )2R f fL fπ′ ′<< and ( ) ( )2G f fC fπ′ ′<< expressions
are suitable for a considered frequency bandwidth (1–40MHz). Thus, the dependency of
L′ and C′ on frequency is neglected so that the characteristic impedance LZ and the
propagation constant γ can be determined using the following approximations
[Zimmermann and Dostert, 2002b]:
L
LZ
C
′=
′ (2.5)
and

Chapter 2. State of the Art Review
13
( ) ( ) ( )1 12
2 2L
L
R ff G f Z j f L C
Zγ π
′′ ′ ′= ⋅ + ⋅ ⋅ + (2.6)
In order to simplify (2.6), the measurements have shown that ( )G f f′ ∼ , and ( )R f′
can be substituted by
( ) 0
2R f f
r
πµκ
′ = (2.7)
Then, the propagation constant γ is formulated as follows
( ) 0
2
12
2 2
L
L
Zf f f j f L C
Z r
πµγ π
κ′ ′= + + (2.8)
( ) ( )1 2 3f k f k f jk fγ = + + (2.9)
An approximation, as a result of different measurements, of the real part of the
propagation constant was done in order to get an equation representing the real
propagation loss behavior in frequency domain, which is expressed as
( ) 0 1Re kf a a fα γ= = + ⋅ (2.10)
Thus, by means of a suitable selection of the attenuation parameters 0a , 1a and k , the
powerline attenuation, representing the amplitude of the channel transfer function
[Zimmermann and Dostert, 2002b], can be defined by
( ) ( ) ( )0 1
,ka a f lf l
A f l e eα − + ⋅ ⋅− ⋅= = (2.11)
The PLC channel can be described by means of a discrete–time impulse response ( )h t
[Zimmermann and Dostert, 2002b] as

Chapter 2. State of the Art Review
14
( ) ( )1
N
i i
i
h t C tδ τ=
= ⋅ −∑ (2.12)
where the channel is represented by N paths, and each path has a time delay iτ with a path
gain iC . The transformation in the frequency domain is given as
( ) 2
1
i
Nj
i
i
H f C eπτ−
=
= ⋅∑ (2.13)
From (2.3), the transfer function in the frequency domain can be rewritten as
( ) ( ) 2
1
, i
Nj
i i
i
H f g A f l eπτ−
=
= ⋅ ⋅∑ (2.14)
where ig is a weighting factor (product of transmission and reflection factors), which gets
smaller with more transitions and reflections along the path. The path delay iτ is related
with the length il of the cables by means of
ii
P
l
vτ = (2.15)
where Pv is the velocity of propagation of the wave in the cable. Using (2.11), the channel
transfer function is
( ) ( )0 1 2
1
ki i
Na a f l j
i
i
H f g e eπτ− + ⋅ ⋅ −
=
= ⋅ ⋅∑ (2.16)
The final equation of the PLC channel model is mainly composed of the weighting
term, an attenuation term and the delay term.
Chapter 2. State of the Art Review
15
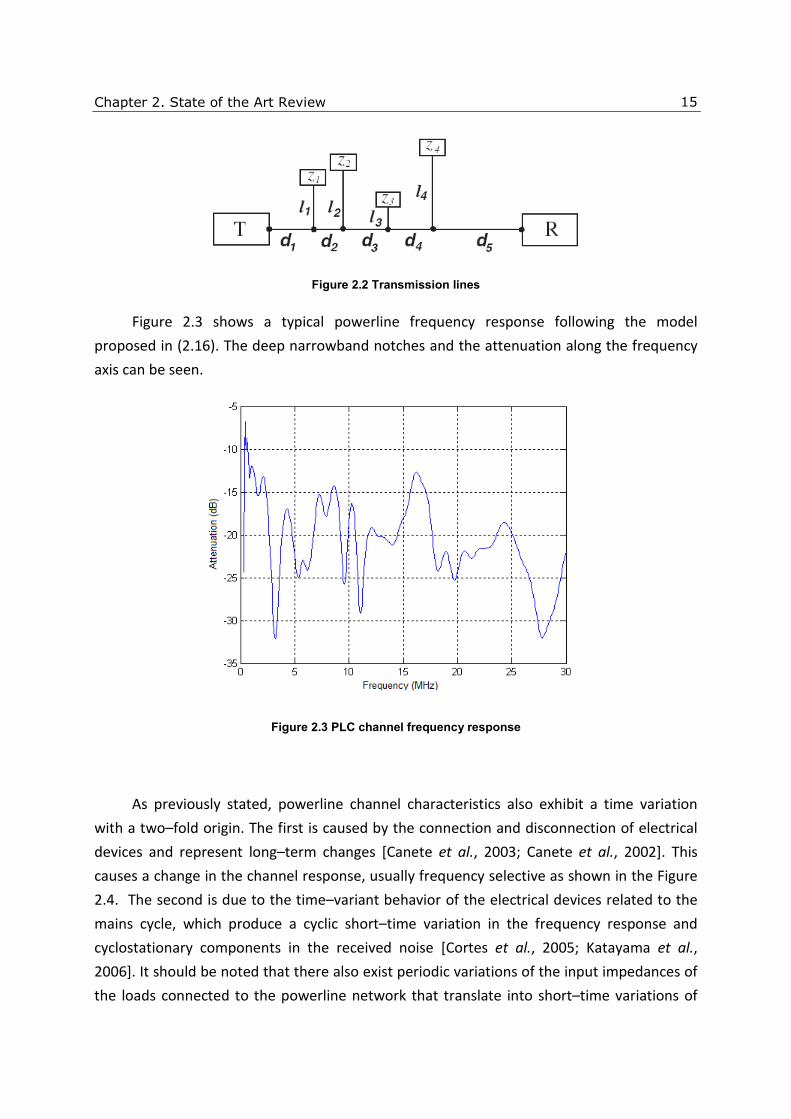
Figure 2.2 Transmission lines
Figure 2.3 shows a typical powerline frequency response following the model
proposed in (2.16). The deep narrowband notches and the attenuation along the frequency
axis can be seen.
Figure 2.3 PLC channel frequency response
As previously stated, powerline channel characteristics also exhibit a time variation
with a two–fold origin. The first is caused by the connection and disconnection of electrical
devices and represent long–term changes [Canete et al., 2003; Canete et al., 2002]. This
causes a change in the channel response, usually frequency selective as shown in the Figure
2.4. The second is due to the time–variant behavior of the electrical devices related to the
mains cycle, which produce a cyclic short–time variation in the frequency response and
cyclostationary components in the received noise [Cortes et al., 2005; Katayama et al.,
2006]. It should be noted that there also exist periodic variations of the input impedances of
the loads connected to the powerline network that translate into short–time variations of

Chapter 2. State of the Art Review
16
the transfer function. Time variations in the channel response are usually characterized by
measuring the spectral broadening experienced by a sinusoid after traversing the channel. In
mobile radio channels this figure is usually referred to as Doppler spread.
Figure 2.4 Time variant PLC channel frequency response due to connection and disconnection of
electrical devices
Powerline communications channels are frequency selective and time variant.
Measurements have shown that they can be modeled as a linear periodically time varying
(LPTV) filter with the presence of additive cyclostationary colored noise as well [Canete et
al., 2006; Katayama et al., 2006].
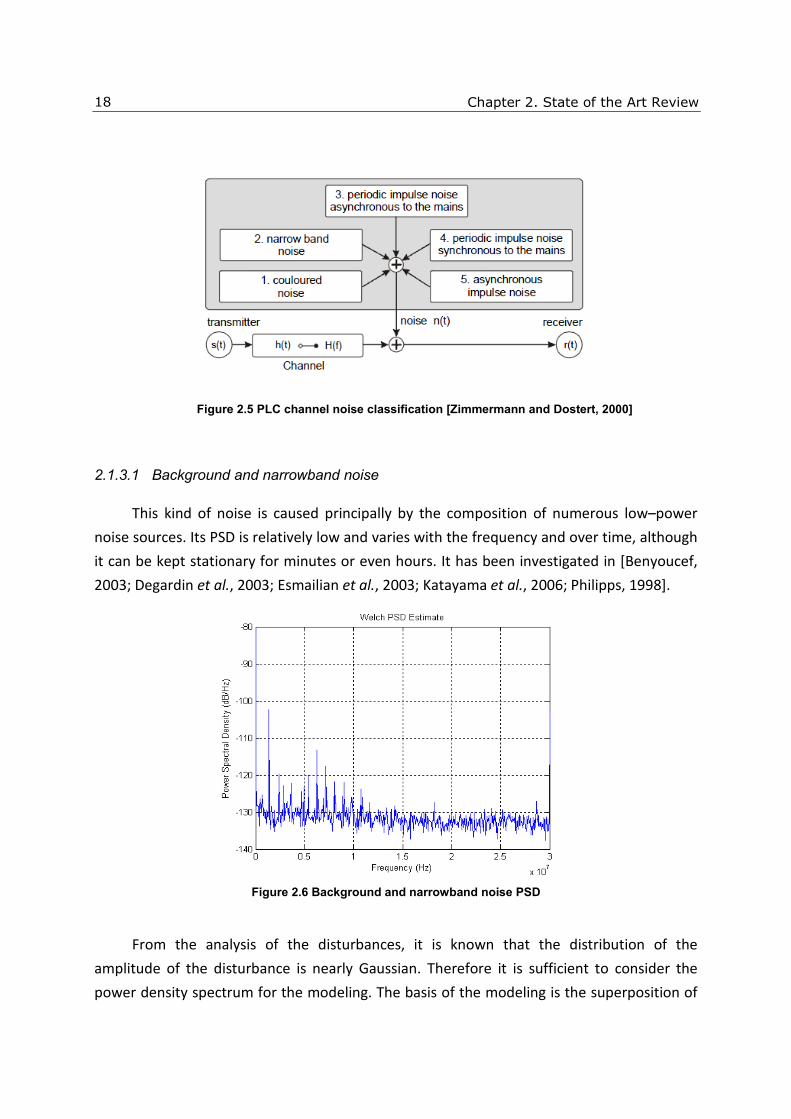
2.1.3 Channel Noise
Apart from the distortion of the information signal, owing to cable losses and
multipath propagation, noise superposed on the utile signal energy make correct reception
of information more difficult. Unlike the other wireless channels, the powerline channel
does not represent an Additive White Gaussian Noise (AWGN), whose power spectral
density is constant over the whole transmission spectrum. Numerous investigations and
measurements were carried out in order to provide a detailed description of the noise
characteristics in a PLC environment. An interesting description is given in [Zimmermann and
Dostert, 2000], which classifies the noise as a superposition of five noise types, distinguished
by their origin, time duration, spectrum occupancy and intensity:

Chapter 2. State of the Art Review
17
• Colored background noise: whose power spectral density (PSD) is relatively lower and
decreases with frequency. This type of noise is mainly caused by a superposition of
numerous noise sources of lower intensity. Contrary to the white noise, which is a
random noise having a continuous and uniform spectral density that is substantially
independent of the frequency over the specified frequency range, the colored
background noise shows strong dependency on the considered frequency. The
parameters of this noise vary over time in terms of minutes and hours.
• Narrowband noise: which most of the time has a sinusoidal form, with modulated
amplitudes. This type occupies several sub–bands, which are relatively small and
continuous over the frequency spectrum. This noise is mainly caused by the ingress
of broadcast stations over medium– and shortwave broadcast bands. Their amplitude
generally varies during the daytime, becoming higher by night when the reflection
properties of the atmosphere become stronger.
• Periodic impulsive noise, asynchronous to the main frequency: with a form of
impulses that usually has a repetition rate between 50 and 200 kHz, and which
results in the spectrum with discrete lines with frequency spacing according to the
repetition rate. This type of noise is mostly caused by switching power supplies. A
power supply is a buffer circuit that is placed between an incompatible source and
load in order to make them compatible. Because of its high repetition rate, this noise
occupies frequencies that are too close to each other, and builds frequency bundles
that are usually approximated by narrow bands.
• Periodic impulsive noise, synchronous to the main frequency: these are impulses with
a repetition rate of 50 or 100 Hz and are synchronous with the main powerline
frequency. Such impulses have a short duration, in the order of microseconds, and
have a power spectral density that decreases with the frequency. This type of noise is
generally caused by the power supply operating synchronously with the main
frequency, such as the power converters connected to the mains supply.
• Asynchronous impulsive noise: whose impulses are mainly caused by switching
transients in the networks. These impulses have durations of some microseconds up
to a few milliseconds with an arbitrary inter–arrival time. Their power spectral
density can reach values of more than 50 dB above the level of the background noise,
making them the principal cause of error occurrences in the digital communication
over PLC networks.
Chapter 2. State of the Art Review
18
Figure 2.5 PLC channel noise classification [Zimmermann and Dostert, 2000]
2.1.3.1 Background and narrowband noise
This kind of noise is caused principally by the composition of numerous low–power
noise sources. Its PSD is relatively low and varies with the frequency and over time, although
it can be kept stationary for minutes or even hours. It has been investigated in [Benyoucef,
2003; Degardin et al., 2003; Esmailian et al., 2003; Katayama et al., 2006; Philipps, 1998].
Figure 2.6 Background and narrowband noise PSD
From the analysis of the disturbances, it is known that the distribution of the
amplitude of the disturbance is nearly Gaussian. Therefore it is sufficient to consider the
power density spectrum for the modeling. The basis of the modeling is the superposition of

Chapter 2. State of the Art Review
19
background noise and the narrow band disturbances [Benyoucef, 2003] (Figure 2.6). In this
case, no difference is made between the shortwave radios and the other narrowband
disturbances in the form of spectral lines, because normally the spectral lines are found in
bundled form. For the modeling, these bundles of disturbers are approximated by their
envelope.
Background noise ( )NBn t is caused mainly by the composition of several low–power
noise sources, and its PSD function ( )BGS f decreases exponentially with frequency, as
shown in the following expression
0/
0 1( )f F
BGS f N N e−= + (2.17)
where 0N , 1N and 0F parameters are taken from [Benyoucef, 2003]. The average power
density of this kind of noise usually falls between a range of –160 dBV2/Hz and –120
dBV2/Hz. Narrowband noise ( )NBn t is mostly sinusoidal with modulated amplitudes This type
of noise is caused by multiple broadcast RF emissions coupled in the electrical cables
[Benyoucef, 2003]. Along the day, it may vary depending on atmospheric conditions enabling
a more propitious propagation of RF waves. Each radio emission has a Gaussian shaped PSD
[Benyoucef, 2003] and the sum ( )NBS f can be written as
2
2
( )
2
1
( )
i
i
f fN
B
NB i
i
S f A e
−−
=
= ⋅∑ (2.18)
where iA is the power density, if is the centre frequency, and iB is the narrowband
interferer bandwidth.
2.1.3.2 Impulsive noise
Impulsive noise is composed of strong peaks whose duration can vary from
microseconds to a few milliseconds. The time between occurrence events could be periodic
with electrical network frequency or totally asynchronous. Impulsive noise ( )In t has its
source in switching power electronics components and may cause burst errors in the
transmitted data. In [Zimmermann and Dostert, 2002a], the impulsive noise model is based
on classification according to different parameters such as pulse duration and inter arrival
time. This parameters are measured at the receiver side, whereas the author in [Tlich et al.,

Chapter 2. State of the Art Review
20
2009] studies the noise directly at their source output and filtering it by the channel
frequency. From the statistical point of view, this work considers that both models have the
same effect. Then, the baseband equivalent impulsive noise in the time domain is defined as
( )
,
( ) sin(2 ) ( )k kt T kI k k k
k imp k
t Tn t A e f t T rect
T
ζ π∞
− −
=−∞
−= ⋅ ⋅ − ⋅∑ (2.19)
where ( )rect ⋅ function is a rectangular shape which is uniform in the interval [0,1]. kA ,
kζ , kf , ,imp kT , and kT are the pulse amplitude, time attenuation constant, oscillation
frequency, pulse length, and start time of the kth pulse, respectively. The parameter inter
arrival time (IAT) is defined as the time between two pulse events, i.e. , 1IAT k k kT T T −= − .
Figure 2.7 Impulse noise parameters
Each of these variables follows a statistical distribution, and they have been
investigated and modeled in [Degardin et al., 2003; Umehara et al., 2006; Zimmermann and
Dostert, 2002a]. And they will be examined more in detail in the Chapter 4.
2.1.4 EMC constrains and interferences
Powerline communications technology uses the power grid for the transmission of
information signals and from the electromagnetic point of view, the injection of the

Chapter 2. State of the Art Review
21
electrical PLC signal into the power cables results in the radiation of an electromagnetic field
in the environment, where the power cables begin acting like antennas in transmission and
reception mode. This field is seen as a disturbance for the environment and for this reason
its level must not exceed a certain limit, in order to realize the so–called electromagnetic
compatibility. Electromagnetic compatibility means that the PLC system has to operate in an
environment without disturbing the functionality of other systems existing in this
environment. Electromagnetic immunity and radio electric disturbance are regulated by the
European regulatory standards EN 55024 [CENELEC, 1998] and EN 55022 [CENELEC, 1994],
respectively.
Figure 2.8 Electromagnetic compatibility areas [Hrasnica et al., 2004]
To be able to describe the real electromagnetic influence of the PLC system on its
environment, several measurements have been carried out. The measurements were a
starting point of the standardization efforts for PLC systems for fixing the limits of the
permitted electric (and also the magnetic in some cases) radiated field in their
environments.
PLC is not intended to communicate via radiated signals. However, a demonstration
reported in [Stott, 2004] shows that even so, a PLC in–home system does indeed do so. The
author describes the experiment as follows: a PLC network was established. One terminal
was a laptop PC using a PLC device. The latter was plugged into a mains extension lead and
from there into the mains wall socket. A set of Christmas–tree lights was also plugged into
the same mains extension lead. The PLC network functioned as expected, communicating
with a second terminal that was plugged in elsewhere. When the mains extension lead was
then unplugged from the wall, so that the laptop PC's PLC device was no longer physically
connected to the mains, the network nevertheless continued to function. It was now
functioning in effect as a wireless local area network (WLAN), using the HF frequency
spectrum. The lights acted as an antenna for the first terminal. This is possible since the
mains wiring acted as the antenna for the second terminal.

Chapter 2. State of the Art Review
22
Figure 2.9 CENELEC Regulation for narrowband PLC
The narrowband powerline communications over the electrical power supply networks
is specified in the European standard CENELEC EN 50065 [CENELEC, 1991], providing a
frequency spectrum from 3 to 148.5 kHz for powerline communications (Figure 2.9). The
CENELEC norm significantly differs from American and Japanese standards (FCC Part 15
Subpart B and IEC 61000-3), which specify a frequency range of up to 500 kHz for the
application of powerline communications services.
Frequency in MHz Quasi-peak Average
0.15 to 0,50 66 to 56 dBµV 56 to 46 dBµV
0.50 to 5 56 dBµV 46 dBµV
5 a 30 60 dBµV 50 dBµV
Table 2.1 Conducted emission limits (<30 MHz)
On the other hand, any broadband PLC technology that requires a good signal to noise
ratio to operate must inherently generate emissions that may be in excess of the current
limits allowed. They must guarantee compliance with the regulation for emissions from
radio frequency devices valid in Europe, namely EN55022, which is the European version of
the international standard CISPR 22 [IEC, 2008]. In the USA and Canada, the regulations
concerning electromagnetic compatibility are provided by the standard FCC Part 15 [FCC,
2001]. This standard specifies limits for conducted emissions at mains ports and
telecommunication ports for frequencies up to 30 MHz (see Table 2.1) as well as limits for
radiated emissions between 30 MHz and 1000 MHz (see Table 2.2).

Chapter 2. State of the Art Review
23
Table 2.2 Conducted emission limits (>30 MHz)
The generally accepted power level for adequate operation of a PLC system is -50 to -
40 dBm/Hz. Measured in a 9 kHz bandwidth, as is standard for interference measurements
at these frequencies, this implies a power level of around -10 to 0 dBm, which across the
differential 100 ohm impedance of the power network is 100 – 110 dBµV. This compares
with the permitted levels for conducted emissions in the domestic environment, with which
most if not all electronic product designers are familiar, of 60 dBµV in a comparable
frequency range between each phase and earth (Table 2.1).
Figure 2.10 Occupation band 150 kHz–30 MHz
Notching is the capability of using only certain parts of the spectrum. But the
technique of notching raises a further question, which is that of inter–modulation. When
multiple radio frequency signals are applied to a non–linear system (and the mains supply
network, with all its connected electronic equipment, will certainly include non–linearities)
they inter–modulate to produce frequencies that were not present in the original spectrum.
Thus although the PLC signal itself may be confined to certain parts of the spectrum and
avoid others, at the receiver the system inter–modulation effects may create interference
signals within the supposedly protected bands. Although this phenomenon has been
accepted as a possibility, there is little research available.
Another technique which can be applied in PLC modems is power management.
Widely used in the mobile phone context, it simply means that the system intelligently uses

Chapter 2. State of the Art Review
24
only the minimum power needed over a given part of the spectrum to achieve reliable
communication. So although a figure can be quoted as above for the power level needed for
adequate operation in all kinds of mains environments, in practice this can be adjusted
downwards in any given spectrum sub–band depending on the noise level that the modem
finds, in real time, in that sub–band.
Nowadays, there is no PLC emission limit standard, but there are some PLC modems
already on the market in Europe and are CE Marked, which means that their manufacturers
believe that they meet the essential requirements of the EMC Directive. But there are no
standards specifically for such devices and for the present, no such device could actually
meet the general standard for RF emissions from IT equipment. This is because the level of
RF voltage that is put onto the mains connection is far in excess of the levels which are
allowed for conducted emissions from all such PLC modems.
The CISPR/I PLT project team are attempting to find a way to publish an amendment to
the CISPR 22 which could be applied to PLC modems. But after the failure of the PLC
amendment of CISPR 22 to reach the Committee Draft for Vote (CDV) stage, the European
Commission has asked the CENELEC to produce a European standard for emission limits for
PLC devices. This will be a stand–alone standard rather than an amendment to EN 55022
that can be listed in the Official Journal of the European Union under the EMC and R&TTE
Directives and give a presumption of agreement for emissions requirements under those
directives.
The intention is to produce two parts to the standard: part 1 for in–house apparatus
and part 2 for access apparatus. These parts will describe test methods and limits relating to
the PLC aspects, the remaining aspects will still be covered by EN 55022, which will be
referenced from the new standard. Such a standard would also allow the wired network
standard, the EN 50529 series, to be completed. Parts 1 and 2, dealing with telephone lines
and co–axial cables respectively, have recently received a positive vote, but the third part,
dealing with mains networks, cannot be completed until a standard for the terminal
apparatus is available.
The new standard will therefore fulfill the joint functions of providing a standard for
apparatus, and enabling the network standard to be completed. Timescales are tight; the
intention is for the draft for in–house apparatus to be ready for vote by July 2011 and the
draft for access apparatus to be ready for vote by December 2011.

Chapter 2. State of the Art Review
25
It is clear that EMC is a key element for the development of PLC systems: EMC
regulations directly impact the transmitted power level, and consequently performance.
Therefore, the specification of a regulatory framework for PLC is needed.

Chapter 2. State of the Art Review
26
2.2 NARROWBAND POWERLINE
In the 1930s, ripple carrier signaling was introduced on the medium and low voltage
distribution networks. For many years the search continued for a low–cost bi–directional
technology suitable for applications such as remote meter reading. For example, the Tokyo
Electric Power Company ran experiments in the 1970s which reported successful bi–
directional operation with several hundred units [Hosono, 1982]. Since the mid–1980s, there
has been a surge of interest in using the potential of digital communications techniques and
digital signal processing. The drive is to produce a reliable system which is cheap enough to
be widely installed and able to compete cost effectively with wireless solutions. But the
narrowband powerline communications channel presents many technical challenges.
Figure 2.11 Home automation using narrowband EIB-PLC
Approximately 30 years ago the typically home–control powerline communication
devices were operating by modulating in a carrier wave of between 20 and 200 kHz into the
household wiring at the transmitter. The carrier is modulated by digital signals. Each receiver
in the system has an address and can be individually commanded by the signals transmitted
over the household wiring and decoded at the receiver. These devices may be either plugged
into regular power outlets, or permanently wired in place. Since the carrier signal may
propagate to nearby homes (or apartments) on the same distribution system, these control
schemes have a "house address" that designates the owner.
Initially, the only way of building a home automation installation (Figure 2.11) was with
the use of sensors and actuators that were joined via a centralized architecture to a PLC or

Chapter 2. State of the Art Review
27
controller loaded with all the intelligence required in the home. They were almost always
inflexible proprietary systems that made any attempt to increase their performance very
difficult and costly.
Thanks to the drastic fall in the price of electronic hardware, it is possible to build
sensors and actuators with sufficient intelligence to implement a distributed control local
area network using a distributed architecture and with the support of carrier current
technologies, such as X-10, European Installation Bus (EIB) and Lonworks technologies,
among others. In the case of home automation, the use of the installation became easier,
more flexible, more modular and with greater interconnectivity, in addition to reducing its
costs. But its use was not only limited to the field of home automation, it left the door open
as an alternative to wired or wireless data networks within a local environment or interiors.
Figure 2.12 X-10 coding in a three–phase network
2.2.1 X-10 Protocol
X-10 is one of the oldest protocols used in home automation devices. It was designed
in Scotland between 1976 and 1978 in order to transmit data via low voltage lines at a very
low speed (60 bps in the United States and 50 bps in Europe) and with a very low cost. The
X-10 protocol uses a very simple modulation compared with those that use other carrier
wave control protocols. The X-10 transceiver waits for the passes through zero of the 50 Hz
sine wave, typical of the electricity supply, to insert just after a very short signal burst at a
fixed frequency. This signal can be inserted in the positive and negative semicycle of the sine
wave.
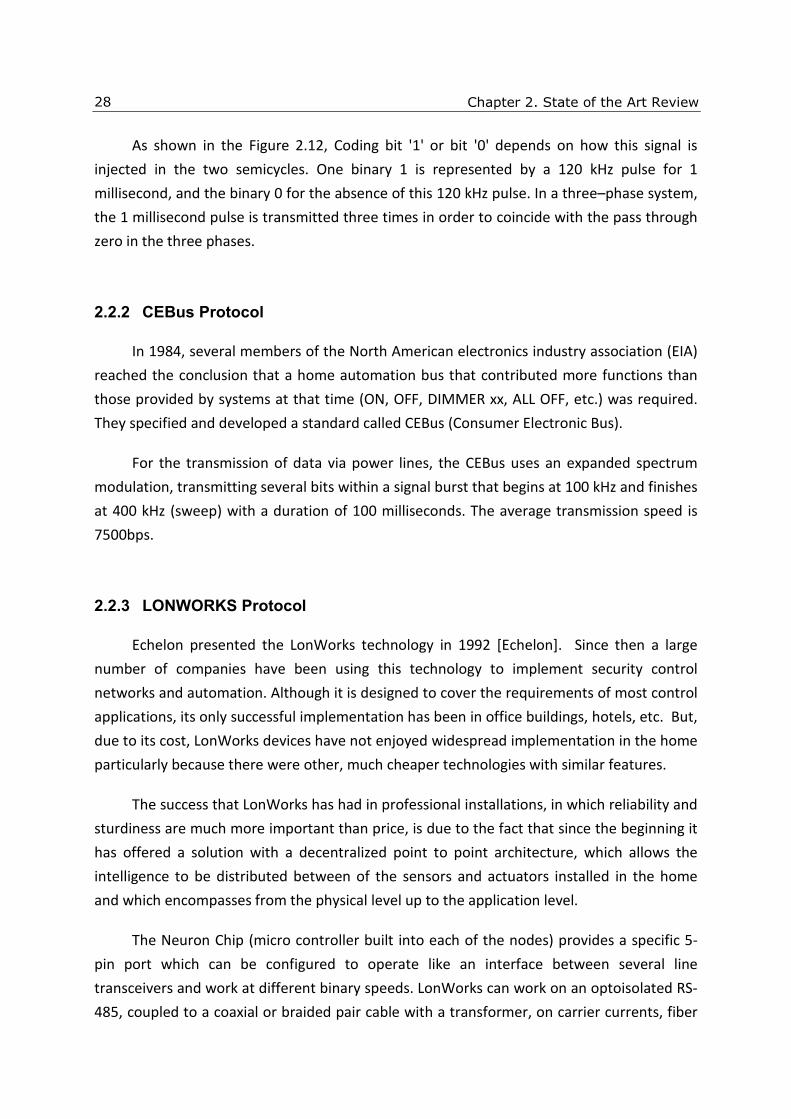
Chapter 2. State of the Art Review
28
As shown in the Figure 2.12, Coding bit '1' or bit '0' depends on how this signal is
injected in the two semicycles. One binary 1 is represented by a 120 kHz pulse for 1
millisecond, and the binary 0 for the absence of this 120 kHz pulse. In a three–phase system,
the 1 millisecond pulse is transmitted three times in order to coincide with the pass through
zero in the three phases.
2.2.2 CEBus Protocol
In 1984, several members of the North American electronics industry association (EIA)
reached the conclusion that a home automation bus that contributed more functions than
those provided by systems at that time (ON, OFF, DIMMER xx, ALL OFF, etc.) was required.
They specified and developed a standard called CEBus (Consumer Electronic Bus).
For the transmission of data via power lines, the CEBus uses an expanded spectrum
modulation, transmitting several bits within a signal burst that begins at 100 kHz and finishes
at 400 kHz (sweep) with a duration of 100 milliseconds. The average transmission speed is
7500bps.
2.2.3 LONWORKS Protocol
Echelon presented the LonWorks technology in 1992 [Echelon]. Since then a large
number of companies have been using this technology to implement security control
networks and automation. Although it is designed to cover the requirements of most control
applications, its only successful implementation has been in office buildings, hotels, etc. But,
due to its cost, LonWorks devices have not enjoyed widespread implementation in the home
particularly because there were other, much cheaper technologies with similar features.
The success that LonWorks has had in professional installations, in which reliability and
sturdiness are much more important than price, is due to the fact that since the beginning it
has offered a solution with a decentralized point to point architecture, which allows the
intelligence to be distributed between of the sensors and actuators installed in the home
and which encompasses from the physical level up to the application level.
The Neuron Chip (micro controller built into each of the nodes) provides a specific 5-
pin port which can be configured to operate like an interface between several line
transceivers and work at different binary speeds. LonWorks can work on an optoisolated RS-
485, coupled to a coaxial or braided pair cable with a transformer, on carrier currents, fiber

Chapter 2. State of the Art Review
29
optics or even radio. Among the different transceivers that are available, the so–called PLT-
22 should be highlighted in this regard, which reaches a maximum data rate of 5.4 kbps.
2.2.4 EHS Protocol
The European home system (EHS) standard was another of the attempts made by
European industry (1984), under the auspices of the European Commission, to create a
technology that would allow the implementation of home automation in the residential
market on a massive scale. The result was the specification of the EHS in 1992. It is based on
an open system interconnection (OSI) levels topology and the following levels are specified:
physical, data link, network and application.
During the period 1992 - 1995, the EHSA (EHS Association) sponsored the development
of electronic components that would implement the first specification. This led to the
creation of the integrated circuit of ST-Microelectronics (ST7537HS1) which allowed data to
be transmitted via an asynchronous serial channel via domestic low voltage lines. This
technology, based on FSK modulation, attains speeds of up to 2400 bps.
2.2.5 KONNEX Protocol
In order to create a single European standard for the automation of homes and offices,
capable of competing with regard to quality, features and price level with other North
American systems such as Lonworks and CEBus, Konnex is the initiative of three European
associations:
• EIBA (European Installation Bus Association).
• Batibus Club International.
• EHSA (European Home System Association).
2.3 BROADBAND POWERLINE
A current snapshoot of the PLC industry reveals several consortiums and
standardization bodies. No such PLC standard has been approved yet, but the
standardization bodies institute of electrical and electronics engineers (IEEE) and
Chapter 2. State of the Art Review
30
international telecommunication union (ITU) are currently working on two proposals, P1901
and G.hn, respectively.
Several competing organizations have developed in–home PLC specifications, including
the homeplug powerline alliance (HPA), the universal powerline association (UPA) and the
high definition PLC (HD-PLC) alliance. ITU-T adopted Recommendation G.hn as a standard for
high–speed powerline, coax and phone line communications. On the other hand, IEEE P1901
is an IEEE working group developing the global standard for high speed powerline
communications. In July 2009, the working group approved its "IEEE 1901 Draft Standard for
Broadband over Power Line Networks: Medium Access Control and Physical Layer
Specifications" as an IEEE draft standard for broadband over power lines defining medium
access control and physical layer specifications. The IEEE 1901 Draft Standard was published
by the IEEE in January 2010 and the final standard is expected to be published and ratified in
September or October of 2010.
The most established and widely deployed powerline networking standard for these
powerline modems comes from the HomePlug Powerline Alliance. HomePlug AV is the most
current of the HomePlug specifications (HomePlug 1.0, HomePlug AV and the new HomePlug
Green PHY comprise the set of published specifications) and it has been adopted by the IEEE
P1901 group as a baseline technology for their standard; it is due to be published and
ratified in September or October of 2010. Other organizations back different specifications
for power line in–home networking and these include the Universal Powerline Association,
the HD-PLC Alliance and the ITU-T’s G.hn specification.
Within homes, the HomePlug AV and IEEE P1901 standards specify how, globally,
existing AC wires should be employed for data purposes. The IEEE 1901 includes HomePlug
AV as a baseline technology, so any future IEEE 1901 products will be fully interoperable
with HomePlug AV, HomePlug Green PHY or the forthcoming HomePlug AV2 specification
(under development now and expected to be approved in Q1 2011).
2.3.1 HOMEPLUG POWERLINE ALLIANCE
The HomePlug Powerline Alliance is the largest powerline networking alliance with
over 70 members, and has developed a succession of specifications for broadband
applications such as in–home distribution of TV, gaming, broadband Internet and other
content. It also developed a high–reliability, low–power and extended temperature

Chapter 2. State of the Art Review
31
specification to support in–home communications between electric systems and appliances
and smart meters to support the build–out of the smart grid.
2.3.1.1 HOMEPLUG 1.0
HomePlug 1.0 [HomePlug, 2001] is the first specification of the alliance for connecting
devices via power lines in the home. It provides a peak PHY–rate of 14 Mbps. It was first
introduced in June, 2001 and has since been replaced by a new specification named
HomePlug AV. In May 2008, the telecommunications industry association (TIA) incorporated
HomePlug 1.0 powerline technology into the newly published TIA-1113 international
standard. TIA-1113 specifies modem operations on user–premises electrical wiring. The new
standard was the world's first multi–megabit powerline communications standard approved
by an American National Standards Institute (ANSI) accredited organization.
Table 2.3 Comparison between 802.11b - HomePlug 1.0 [Lee et al., 2002]
The physical level is based on Orthogonal frequency–division multiplexing (OFDM)
modulation, which is widely used in digital subscriber line (DSL) technology. Over OFDM is
used differential modulation, in order to eliminate the equalization step, but losing
performance. The technical characteristics of the specification are as follows:
• Frequency band: 4.5 MHz–21 MHz.
• OFDM Modulation: 128 carriers (84 for data).
• Forward error correction: Viterbi and Reed Solomon.
• Carrier modulations supported: DQPSK, DBPSK y ROBO (robust-OFDM).
• Adaptive modulation, 3 degrees of freedom:
o Selection of carriers to be used.
o Selection of DQPSK and DBPSK modulation.
o Selection of convolutional code ½ and ¾.

Chapter 2. State of the Art Review
32
• Access method supported: CSMA/CA.
Several performance tests have been done to modems based on HomePlug 1.0 [Lee et
al., 2002]. The results (Table 2.3) show a similar performance compared with an 802.11b
wireless link. Moreover, the PLC modem may work in places where there is no wireless
signal.
There are Turbo adapters for HomePlug 1.0 that may be found on the market. These
comply with the HomePlug 1.0 specification but feature a faster and proprietary mode that
increases the peak PHY–rate to 85 Mbps.
2.3.1.2 HOMEPLUG AV
The HomePlug AV specification [HomePlug, 2007] was introduced in August 2005 and
was designed to provide sufficient bandwidth for applications such as high definition TV
(HDTV) and voice over internet protocol (VoIP). Utilizing adaptive modulation on up to 1155
OFDM sub–carriers and turbo convolution codes for error correction, HomePlug AV can
almost achieve the theoretical maximum bandwidth across a given transmission path. Thus,
HomePlug AV is capable of reaching speeds of up to 200 Mbps in the physical level. Key
distribution techniques and the use of 128 bit AES encryption are specified as mandatory in
the specification. Furthermore, even the interception of encrypted data exchanged between
HomePlug AV devices poses a "significant challenge" for an attacker due to the adaptive
techniques used to modulate the signal between two given points.
According to the HomePlug AV specification, HomePlug AV devices may interoperate
with Homeplug 1.0 devices, but this support is optional. It is mandatory for HomePlug AV
devices to coexist with HomePlug 1.0 devices.
2.3.1.3 HOMEPLUG Green PHY
HomePlug Green PHY is a new specification that is a subset of HomePlug AV and is
specifically designed for the requirements of the Smart Grid market. It has peak rates of 10
Mbps and is designed to go into smart meters and smaller appliances such as thermostats,
home appliances and plug–in electric hybrid vehicles. For these applications, there is no
great need for high capacity broadband; the most important requirements are: for lower
power, robust, reliable coverage throughout the home, smaller size and less costly Bill of

Chapter 2. State of the Art Review
33
Materials. HomePlug Green PHY–based products will be fully interoperable with products
based on HomePlug AV, IEEE P1901 or the upcoming HomePlug AV2 specification.
2.3.1.4 HOMEPLUG AV2
The HomePlug AV2 project is currently under development and is the prospective next
generation for the HomePlug line. According to current estimates, it will operate upon a 600
Mbps transfer capability. HomePlug AV2 is fully interoperable with HomePlug AV and will be
brought into the IEEE P1901 standard once that standard is ratified in 2010. HomePlug AV2
offers Gigabit speed at the physical layer and 600 Mbps+ at the MAC layer. The AV2 spec is
expected to be completed in late 2010. Completion of the HomePlug AV2 Marketing
Requirements Document was announced in November 2009.
2.3.2 UNIVERSAL POWERLINE ASSOCIATION
The Universal Powerline Association (UPA) is an International not–for–profit trade
association working to promote global standards and regulations in the fast developing
Powerline communications market. The UPA aims to catalyze the growth of Powerline
technology by delivering UPA plugtested and certified products that comply with these
specified standards and regulations. All products and applications designed around UPA
guidelines will communicate, from simple coexistence to full interoperability. The UPA
provides all Powerline players the opportunity to respond to key customer expectations with
open standards, based on interoperability, security and coexistence and supported by
exclusive and independent certifications; it is the only global guarantee of quality and
confidence for high–speed power line technology available today.
Members of the UPA include: AcBel Polytech Inc. Ambient Corporation, Arteche, BPL
Global, Buffalo, Comtrend, Corinex Communications Corp., Current Technologies
International, Cypress Semiconductor, D-Link, DS2, Duke Energy, Schneider Electric
Powerline Communications, Itochu Corporation, Logitec Corporation, Netgear, PCN
Technology, Pirelli Broadband, Planex, Sumitomo Electric Industries, Toshiba Electronics
Europe GmbH, Touba Telecom, TOYO Network Systems and Watteco.
The main technology provider is DS2, and the UPA digital home standard (DHS)
specification main features are:
• 1536 carrier-OFDM modulation

Chapter 2. State of the Art Review
34
• Adaptive bit–loading, with physical layer data rate of 200 Mbps
• Collision–free and flexible TDMA MAC
• Master/slave control architecture
• Peer–to–peer data transmission architecture
• Flexible PSD mask allowing frequency band notching dynamically and remotely
• 3DES encryption
• Advanced QoS with 8 priority levels
2.3.3 HD POWERLINE COMMUNICATIONS
HD-PLC Alliance was established in 2007 to promote the world–wide adoption of HD-
PLC high–speed power line communication technology, and the interoperability of devices
that use that technology. HD-PLC Alliance is a non–profit association of more than 20
members including leading industrial organizations. The alliance encourages Japanese and
foreign companies who develop products and provide services based on HD-PLC standards,
as well as companies interested in HD-PLC to join.
Members of the HD-PLC alliance include: Panasonic, ACN, I-O DATA DEVICE, AOPEN,
APTEL, BUFFALO, Egretcom, Icron Technologies, IGRS Engineering Lab, Kawasaki
Microelectronics, Murata, OKI, OMURON NOHGATA and Qool Technologies. The main
technology provider is Panasonic, and the HD-PLC specification main features are:
• Frequency Band 4-28 MHz
• Modulation Wavelet-OFDM
• Transmission PHY Rate Maximum 190 Mbps
• Access Method CSMA/CA TDMA
• Error Correction Reed-Solomon Encoder/Decoder and Convolutional
Encoder/Viterbi
• Decoder Encryption AES 128-bit Encryption
2.3.4 HOMEGRID FORUM
The HomeGrid Forum [HomeGrid] is a global, non–profit trade group promoting the
International Telecommunication Union’s G.hn standardization efforts for next–generation
home networking. HomeGrid Forum promotes the adoption of G.hn through technical and

Chapter 2. State of the Art Review
35
marketing efforts, it addresses certification and interoperability of G.hn–compliant products,
and cooperates with complementary industry alliances.
HomeGrid Forum members are Intel, Lantiq, Panasonic, Best Buy, British Telecom,
Texas Instruments, K-Micro, Ikanos Communications, Aware, DS2, Gigle Networks, Sigma
Designs, University of New Hampshire InterOperability Laboratory (UNH-IOL), LAN S.A.R.L, IC
Plus Corp, Korea Electrotechnology Research Institute (KERI) and Polaris Networks.
2.3.5 STANDARDISATION
As stated above, the in–home powerline networking market is badly fragmented.
There are multiple incompatible powerline technologies, where there is a lack of
interoperability and coexistence between them (UPA, HD-PLC and HomePlug devices).
Moreover, there is no interoperability between HomePlug devices. In order to solve this
problem, several initiatives are already underway in standardization proposals such as IEEE
P1901 and ITU G.hn.
Figure 2.13 PLC standardization map
2.3.5.1 IEEE P1901
The IEEE P1901, established in 2005, is an IEEE working group developing the global
standard for in–home high speed powerline communications. It was joined by both
HomePlug and the UPA, who proposed their respective powerline technologies for P1901's

Chapter 2. State of the Art Review
36
LAN component. In 2007 the working group completed the down selection process and the
final proposal selected by the group was a combined Homeplug/Panasonic (HD-PLC)
proposal. In 2010, the working group published its "IEEE 1901 Draft Standard for Broadband
over Power Line Networks: Medium Access Control and Physical Layer Specifications" as an
IEEE draft standard for broadband over powerline networks defining medium access control
and physical layer specifications.
The P1901 Draft Standard includes two different physical layers, one based on fast
Fourier transform (FFT) OFDM modulation and another based on Wavelet-OFDM
modulation. Each PHY is optional, and implementers of the specification may include both,
but are not required to do so. Devices that use the OFDM physical layer only would not
interoperate with devices based on Wavelet physical layer. A small minority of members of
the P1901 maintain that this lack of interoperability defeats the purpose of having a
standard. The FFT-OFDM physical layer is derived from HomePlug AV technology the wavelet
physical layer comes from HD-PLC technology. The standard is expected to be approved in
2010.
2.3.5.2 ITU G.hn
In 2008, the International Telecommunication Union gave its support to G.hn, a
proposed standard for domestic networks over a range of different cable types. G.hn's goal
is to unite coax, phone lines and mains cabling into a single network capable of hosting
multiple multimedia streams over gigabit bandwidths around the home. The standard is
promoted by the HomeGrid Forum and several other organizations.
ITU Recommendation G.9960, which received approval in 2009, specifies the physical
layer and the architecture of G.hn. The data link layer specification was approved in 2010.
Over 20 companies participated regularly, representing a broad cross section of the
communications industry including some of the world's largest telephone companies, major
communication equipment companies, and some of the leading home networking
technology companies.
Unlike the P1901 standard, G.hn specifies a single physical layer based on FFT-OFDM
modulation and low–density parity–check code (LDPC) forward error correction (FEC) code.
G.hn includes the capability of notching specific frequency bands to prevent interference
with amateur radio bands and other licensed radio services. G.hn includes mechanisms to
prevent interference with legacy home networking technologies and also with other wireline

Chapter 2. State of the Art Review
37
systems such as very high digital subscriber 2 (VDSL2) or other types of DSL used to access
the home.
Nevertheless, G.hn has been criticized because this technology is incompatible with
the established technologies on the market like HomePlug AV. Some claim that the G.hn
specification is not sufficient as a next generation technology and that G.hn will be
outperformed. HomePlug proponents say that their standard addresses such issues and that
the performance of future G.hn–based products will be in line with, or lower than, current
HomePlug AV or IEEE1901 performance.
2.4 SMART GRID
The term “Smart Grid” [Massoud Amin and Wollenberg, 2005] refers to a
modernization of the electricity delivery system so it monitors, protects and automatically
optimizes the operation of its interconnected elements – from the central and distributed
generator through the high–voltage network and distribution system, to industrial users and
building automation systems, to energy storage installations and to end–use consumers and
their thermostats, electric vehicles, appliances and other household devices.
Figure 2.14 Overview of Smart Grid [EPRI, 2009]

Chapter 2. State of the Art Review
38
The Smart Grid is characterized by a two–way flow of electricity and information to
create an automated, widely distributed energy delivery network. It incorporates into the
grid the benefits of distributed computing and communications to deliver real–time
information and enable the near–instantaneous balance of supply and demand at the device
level. Smart Grid benefits can be categorized into 5 types [EPRI, 2009]:
• Power reliability and power quality: The Smart Grid provides a reliable power
supply with fewer and briefer outages, “cleaner” power, and self–healing
power systems, through the use of digital information, automated control, and
autonomous systems.
• Safety and cyber security benefits: The Smart Grid continuously monitors itself
to detect unsafe or insecure situations that could detract from its high
reliability and safe operation. Higher cyber security is built in to all systems and
operations including physical plant monitoring, cyber security, and privacy
protection of all users and customers.
• Energy efficiency benefits: The Smart Grid is more efficient, providing reduced
total energy use, reduced peak demand, reduced energy losses, and the ability
to induce end–user use reduction instead of new generation in power system
operations.
• Environmental and conservation benefits: The Smart Grid is “green”. It helps
reduce GHG and other pollutants by reducing generation from inefficient
energy sources, supports renewable energy sources, and enables the
replacement of gasoline–powered vehicles with plug–in electric vehicles.
• Direct financial benefits: The Smart Grid offers direct economic benefits.
Operations costs are reduced or avoided. Customers have pricing choices and
access to energy information. Entrepreneurs accelerate technology
introduction into the generation, distribution, storage, and coordination of
energy.
Technical challenges are listed below [EPRI, 2009]:
• Smart equipment: Smart equipment refers to all field equipment which is
computer–based or microprocessor–based, including controllers, remote

Chapter 2. State of the Art Review
39
terminal units (RTUs), intelligent electronic devices (IEDs). It includes the actual
power equipment, such as switches, capacitor banks, or breakers. It also refers
to the equipment inside homes, buildings and industrial facilities. This
embedded computing equipment must be robust to handle future applications
for many years without being replaced.
• Communication systems: Communication systems refer to the media and to
the developing communication protocols. These technologies are in various
stages of maturity. The smart grid must be robust enough to accommodate
new media as they emerge from the communications industries and while
preserving interoperable, secured systems.
• Data management: Data management refers to all aspects of collecting,
analyzing, storing, and providing data to users and applications, including the
issues of data identification, validation, accuracy, updating, time–tagging,
consistency across databases, etc. Data management methods which work well
for small amounts of data often fail or become too burdensome for large
amounts of data—and distribution automation and customer information
generate lots of data. Data management is among the most time–consuming
and difficult task in many of the functions and must be addressed in a way that
will scale to immense size.
• Cyber Security: Cyber security addresses the prevention of damage to,
unauthorized use of, exploitation of, and, if needed, the restoration of
electronic information and communications systems and services (and the
information contained therein) to ensure confidentiality, integrity, and
availability.
• Information/data privacy: The protection and stewardship of privacy is a
significant concern in a widely interconnected system of systems that is
represented by the Smart Grid. Additionally, care must be taken to ensure that
access to information is not an all or nothing at all choice since various
stakeholders will have differing rights to information from the Smart Grid.
• Software applications: Software applications refer to programs, algorithms,
calculations, and data analysis. Applications range from low level control
algorithms to massive transaction processing. Application requirements are
becoming more sophisticated to solve increasingly complex problems, are

Chapter 2. State of the Art Review
40
demanding ever more accurate and timely data, and must deliver results more
quickly and accurately. Software engineering at this scale and rigor is still
emerging as a discipline. Software applications are at the core of every function
and node of the Smart Grid.
A home area network (HAN), extends some of these capabilities into the home using
powerline networking and/or RF using standards such as ZigBee, INSTEON, Zwave, WiFi or
others. A home area network includes an intelligent monitoring system that keeps track of
all electricity flowing in the system. When power is least expensive the user can allow the
smart grid to turn on selected home automation appliances such as washing machines or
industrial processes that can run at arbitrary hours. At peak times it could turn off selected
appliances to reduce demand.
Table 2.4 Comparison between Multimedia and Smart Grid networks [HomeGrid]
The Table 2.4 summarizes the comparison between a smart grid PLC modem with a
multimedia oriented PLC system. Taking into account the above description, it can be
concluded that PLC is a suitable communication technology that can be used in a Home Grid.
These PLC modems should have specific characteristics in order to meet the requirements of
Home Grid communication devices. That is, complexity, cost and consumption must be as
low as possible, while the robustness against the disturbances found in the powerline
channel is maximized.
The two principal PLC associations, HomePlug Alliance and HomeGrid forum, started
defining their PLC modem devices for Smart Grid market. These new specifications comprise

Chapter 2. State of the Art Review
41
a subset of previous PLC device characteristics. From HPA, HomePlug Green PHY (see
2.3.1.3) is their Smart Grid solution, which is based on the high performance HomePlug AV
specification. Whereas the HomeGrid forum has a G.hn Smart Grid profile (profile 1). Both
systems have the same characteristics: low data rates, low power consumption, low device
complexity and low cost.


Chapter 3. Statement of the problem 43
3 Statement of the Problem
Chapter 3
Statement of the Problem
A multiple–access scheme establishes a method of dividing the transmission resources
into accessible sections, which are used by multiple users using various services. A multiple–
access scheme is applied to a transmission medium within a particular frequency spectrum,
which can be used for information transfer. In the case of multiple users using a shared
transmission medium, signals from individual users have to be transmitted within separated
accessible sections, provided by a multiple–access scheme, ensuring error–free
communications. For this purpose, the signals from different users, when they are
transmitted over a shared medium, have to be orthogonal to each other [Proakis, 2000].
Focusing on a multiuser environment, several multiple–access strategies can be
employed to share the powerline network among different users, with the requisite of
allowing full asynchronism between the users and trying to achieve a robust solution that is
as simple as possible. Multiple–access schemes are used to allow many simultaneous users
to use the same fixed bandwidth spectrum and coordinate access between multiple users.
But the bandwidth that is allocated to it is always limited. Packet mode methods, like the
carrier sense multiple–access with collision avoidance (CSMA/CA) adopted in the HomePlug
1.0 PLC standards [HomePlug, 2001], do not take into account the channel characteristics of
the different users, which may be quite different. The same applies to other methods like
Aloha, Token passing or Polling. Moreover, they are not appropriate for providing the

Chapter 3. Statement of the problem
44
latency, jitter and guaranteed bandwidth needed by some streaming and industrial control
applications. These quality of service (QoS) requirements can be fulfilled by channelization
methods using time–division multiple–access (TDMA), frequency–division multiple–access
(FDMA) or code–division multiple–access (CDMA) schemes in which a centralized manager
modifies the time slots, frequency bands and codes assigned to each user. CDMA, TDMA and
FDMA have exactly the same spectral efficiency, but in practice each has its own challenges:
power control in the case of CDMA, timing in the case of TDMA, and frequency
generation/filtering in the case of FDMA.
Figure 3.1 TDMA time slots scheduling
The following are the four major methods of sharing the available bandwidth to
multiple users. There are also many extensions and hybrid techniques for these methods,
which will be listed in this chapter. However, an understanding of the four major methods is
required for understanding any extensions to these methods.
3.1 TDMA
TDMA is a type of Time–division multiplexing (TDM), with the special feature that
instead of having one transmitter connected to one receiver, there are multiple transmitters.
It is where a specific node, the central coordinator (CCo) or scheduler, has the responsibility
of coordinating the nodes of the network [Anastasiadou and Antonakopoulos, 2004]. The

Chapter 3. Statement of the problem
45
time on the channel is divided into time slots, which are generally of fixed size. Each node of
the network is allocated a certain number of slots from where it can transmit. Slots are
usually organized in a frame, which is repeated on a regular basis. The CCo specifies the
organization of the frame in the beacon (a management frame). Each node just needs to
follow the instruction of the CCo blindly. Very often, the frame is organized as downlink
(base station to node) and uplink (node to base station) slots. A service slot allows a node to
request the allocation of a connection, by sending a connection request message in it. In
some standards, uplink and downlink frames are on different frequencies, and the service
slots could also be a separate channel.
TDMA is widely used in digital 2G cellular systems such as Global System for Mobile
Communications (GSM), IS-136 (USA), Personal Digital Cellular (Japan), iDEN (USA and
Canada), and in the Digital Enhanced Cordless Telecommunications (DECT) standard for
portable phones. It is also used extensively in satellite and military systems.
On the powerline side, the use of a TDMA scheme can be practical due to its simplicity
and reliability [Bumiller, 2001; Galda et al., 1999]. It is implemented in the current
generation of broadband powerline modems, such as HomePlug AV standard [HomePlug,
2007], which is oriented towards multimedia contents transmission, and the quality of
service (QoS) required for this kind of applications can be fulfilled with the use of a Hybrid
MAC scheme as the one employed in HomePlug AV. It can support both the connection
oriented traffic and the best effort traffic. Services that require high QoS can be offered
using a contention free MAC technique based on TDMA, while best effort traffic can be
offered using a contention based scheme as CSMA/CA. HomePlug AV uses a dynamic TDMA
scheme to satisfy the QoS based traffic. In dynamic TDMA, a scheduling algorithm
dynamically reserves a variable number of time slots in each frame for variable bit–rate data
streams, based on the traffic demand of each data stream.
A major advantage of TDMA is that the powerline modem only needs to listen and
broadcast for its own time slot. For the rest of the time, it can carry out measurements on
the network, detecting surrounding transmitters on different frequencies. This allows safe
inter frequency handovers, something which is difficult in CDMA systems. For PLC, dynamic
TDMA schemes are proposed in [Bumiller, 2001; Galda et al., 1999; Tonello et al., 2009],
where the network resources are allocated for each user in order to satisfy the QoS
parameters. In [Tonello et al., 2009], the author has studied the resource allocation problem
in an indoor PLC system with a medium access control scheme and an adaptive TDMA
region, where the presented results have been obtained by taking both the cyclostationary
noise and the cyclic behavior of the channel response into account. The system is assumed

Chapter 3. Statement of the problem
46
to have a node in the network that acts as a CCo, which is responsible for allocating
resources by collecting information regarding the network state, i.e., number of users,
channel conditions, QoS required by each user request, etc. Once the CCo has collected all
the information needed, it allocates the resources among the users dynamically.
In order to mitigate the frequency selectivity of the powerline channel, the current
systems employ orthogonal frequency division multiplexing (OFDM) as the modulation
technique [Bingham, 1990; Kaiser, 2002], which can easily adapt to severe channel
conditions without complex equalization. The sub–carrier frequencies are chosen so that the
sub–carriers are orthogonal to each other, meaning that cross–talk between the sub–
channels is eliminated and inter–carrier guard bands are not required. This greatly simplifies
the design of both the transmitter and the receiver; unlike conventional frequency division
multiplexing (FDM), a separate filter for each sub–channel is not required. It is also robust
against inter–symbol interference (ISI) and fading caused by multipath propagation using an
interval guard in the form of CP. In such systems, when orthogonal frequency division
multiplexing (OFDM) modulation is used with TDMA, users sequentially share the available
radio resources and all carriers are assigned to the same user during a given OFDM symbol.
The TDMA approach combined with physical layer based on OFDM modulation for indoor
PLC has been studied in [Ahn and Lee, 2003; Ayyagari and Wai-chung, 2005; Bumiller, 2001;
Galda et al., 1999; Lampe, 2001; Tonello et al., 2009].
Figure 3.2 OFDM modulation
On the other hand, dynamic resource allocation strategies have been proposed for
wireless as well as wireline networks to combat the rate loss caused by interference in a
multiuser scenario. A successful example is the level–2 dynamic spectrum management
(DSM) algorithms proposed for digital subscriber–lines (DSL) [Baccarelli et al., 2002;
Papandriopoulos and Evans, 2006]. PLC has many features similar to DSL; consequently, its

Chapter 3. Statement of the problem
47
multi–user resource allocation strategy can benefit from existing research results for DSL
networks. However, the differences in the topology between PLC and DSL need to be taken
into account. In PLC, all users transmit their signals on the same wire, while DSL users
typically transmit on separate twisted–pairs.
Figure 3.3 Bit loading over an OFDM symbol (3072 bits)
Like OFDM, discrete multi–tone (DMT) modulation is based on multi–carrier
modulation but historically comes from the DSL community [Baccarelli et al., 2002;
Papandriopoulos and Evans, 2006], and in the essence both techniques are the same.
Indeed, OFDM / DMT has many well known advantages: among others, a low complexity
channel equalizer, good resistance to narrowband noise, and the possibility to approach the
Shannon capacity by implementing coding techniques, the so–called bit–loading (or water
filling) technique. OFDM carries out energy and bit distribution across the subcarriers
yielding significant performance improvements as demonstrated in many pieces of work
[Campello, 1999; Fasano, 2003]. This is an attractive feature of OFDM, allowing practical
implementation of the water filling principle by allocating the power across the sub–
channels affected by different attenuations due to the channel frequency selectivity [Tonello
et al., 2009]. However, in the context of powerline communications, the existence, too, of
periodic variations in the input impedances of the loads connected to the network that
translate into short–time variations of the transfer function [Cortes et al., 2005] should be
noted. This behavior must in fact be incorporated in the channel state information (CSI)
which needs to be refreshed periodically. However, bit–loading is appropriate, assuming CSI
at the transmitter, because the channel is invariant for a period of time that is long in
comparison with the OFDM symbol duration [Zimmermann and Dostert, 2002b]. For indoor

Chapter 3. Statement of the problem
48
PLC, a bit loading technique is proposed for a TDMA / OFDM system in [Ayyagari and Wai-
chung, 2005].
In [Lampe, 2001], there is discussion on the issue of medium access signaling for
powerline networks with TDMA, where all subscribers are synchronized to a TDMA framing
structure provided by a CCo. The author presents the design of transmit sequences and
signal processing of the received signal for robust medium access signaling, allowing wide
collision resolvability. As transmission request signals do not carry any payload, their
frequency and their duration should be kept as low as possible. Conversely, to ensure quality
of service, transmission requests have to be processed with high probability and short delay
by the master. These requirements prohibit the assignment of different signaling slots to
each subscriber, which in turn implies that collisions of transmission requests are possible.
Taking into account all this aspects, OFDM / DMT scheme is known to be more
efficient than single carrier schemes under frequency selective powerline channel condition
[Ahn and Lee, 2003; Galda et al., 1999; Lampe, 2001; Langfeld, 2000; Ma et al., 2005; Tlili et
al., 2003]. However, OFDM systems also show a weakness in their sensitivity to
synchronization errors. They require very accurate frequency synchronization between the
receiver and the transmitter. Thus, the major drawback of the OFDM schemes is that they
are sensitive to time misalignments and frequency offsets: ISI (channel dispersion and
asynchronous uplink links) and inter carrier interference (ICI) (cross–talk between the
subcarriers) arise and limit the performance [Tonello et al., 2000]. For this reason most of
the work on OFDM has been done for the synchronous link [Ahn and Lee, 2003; Ayyagari and
Wai-chung, 2005; Bumiller, 2001; Galda et al., 1999; Lampe, 2001; Tonello et al., 2009],
where the asynchronous links are not very suitable for this kind of modulation [Kyunbyoung
et al., 2006].
On the other hand, there are alternative propositions to the combination of FFT and
OFDM modulation. The discrete wavelet multitone (DWMT) is a type of wavelet transform
technique that has been developed recently, which is also called Wavelet-OFDM [Galli et al.,
2008] and adopted for IEEE P1901 PLC standard. This method uses a cosine modulated filter
bank (CMFB), with overlapped filters that introduce better selectivity. Wavelet-OFDM does
not need a guard interval to maintain the orthogonal characteristics between each
subcarrier, and so the spectral efficiency is better than that of FFT-OFDM using a guard
interval. In [Karamehmedovic et al., 2008], the sensitivity of DWMT transmission scheme to
the frequency offset and phase noise is addressed. The simulations performed in this piece
of work show performance comparison under frequency offset and phase noise
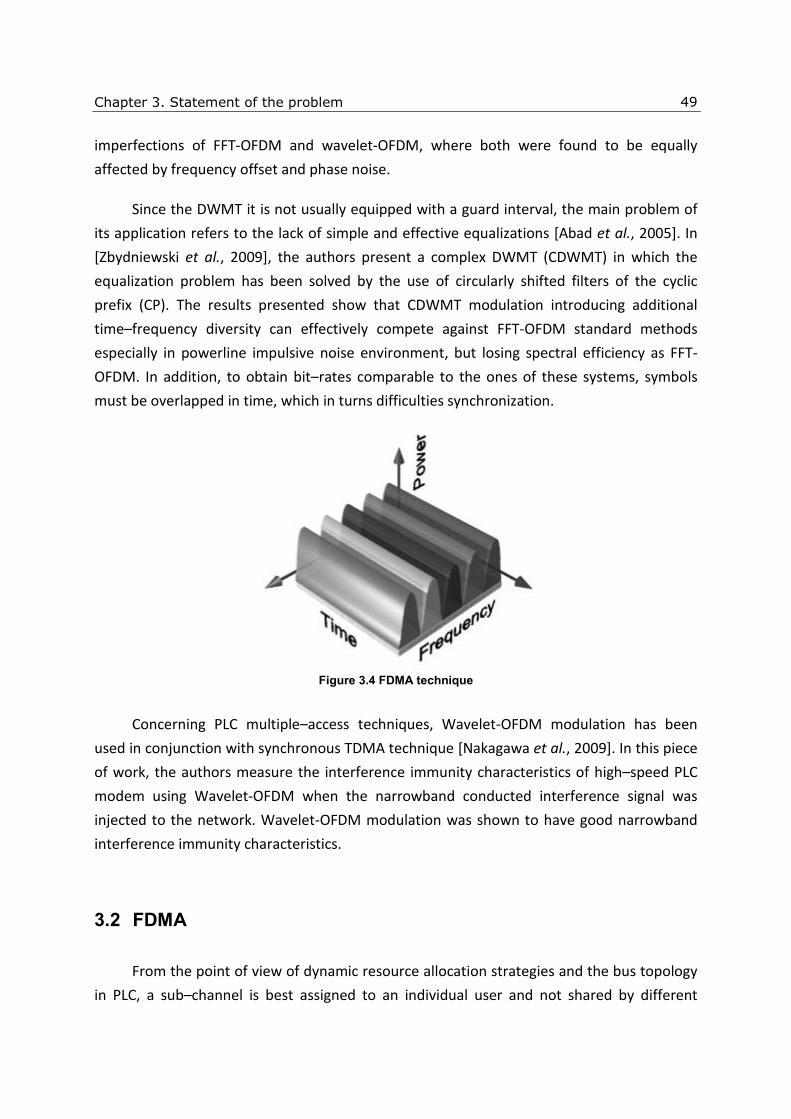
Chapter 3. Statement of the problem
49
imperfections of FFT-OFDM and wavelet-OFDM, where both were found to be equally
affected by frequency offset and phase noise.
Since the DWMT it is not usually equipped with a guard interval, the main problem of
its application refers to the lack of simple and effective equalizations [Abad et al., 2005]. In
[Zbydniewski et al., 2009], the authors present a complex DWMT (CDWMT) in which the
equalization problem has been solved by the use of circularly shifted filters of the cyclic
prefix (CP). The results presented show that CDWMT modulation introducing additional
time–frequency diversity can effectively compete against FFT-OFDM standard methods
especially in powerline impulsive noise environment, but losing spectral efficiency as FFT-
OFDM. In addition, to obtain bit–rates comparable to the ones of these systems, symbols
must be overlapped in time, which in turns difficulties synchronization.
Figure 3.4 FDMA technique
Concerning PLC multiple–access techniques, Wavelet-OFDM modulation has been
used in conjunction with synchronous TDMA technique [Nakagawa et al., 2009]. In this piece
of work, the authors measure the interference immunity characteristics of high–speed PLC
modem using Wavelet-OFDM when the narrowband conducted interference signal was
injected to the network. Wavelet-OFDM modulation was shown to have good narrowband
interference immunity characteristics.
3.2 FDMA
From the point of view of dynamic resource allocation strategies and the bus topology
in PLC, a sub–channel is best assigned to an individual user and not shared by different

Chapter 3. Statement of the problem
50
users. FDMA is a channel access method used in multiple–access protocols as a
channelization protocol. FDMA gives users an individual allocation of one or several subsets
of subcarriers, or narrower band channels, where the available bandwidth is shared among
the different users. Each user is allocated a unique frequency band, or is dynamically
assigned one in which to transmit and receive. This kind of multiple–access technique is not
vulnerable to the timing problems that TDMA has. Since a predetermined frequency band is
available for the entire period of communication, stream data (a continuous flow of data
that may not be packetized) can easily be used with FDMA. Due to the frequency filtering, it
is not sensitive to the near–far problem which is pronounced for CDMA, but requires high–
performing filters in the transmitter / receiver hardware, in contrast to TDMA and CDMA.
This process turns out to be particularly inefficient unless it employs an OFDM / DMT
modulation, since the bands assigned to the different users overlap. Moreover, since in
FDMA the protocol data units length is no longer limited by the time slots duration, the
transmitted overhead is reduced. Recent researches have focused on OFDM and FDMA
systems, where this modulation combination with the multiple–access technique is known
as DMT-FDMA [Sartenaer et al., 2000] or orthogonal frequency division multiple–access
(OFDMA) [Sari and Karam, 1998; Sofer and Segal, 2005], which is widely considered to be
one of the most efficient techniques for providing broadband services [Barbarossa et al.,
2002; Cheong Yui et al., 1999; Koffman and Roman, 2002; Li and Sollenberger, 2001; Sari and
Karam, 1998]. A different number of subcarriers can be assigned to different users, with a
view to supporting differentiated QoS, and to controlling the data rate and error probability
individually for each user. Recently, OFDM–based networks in combination with TDMA and
FDMA have become a popular choice for such an endeavor. The IEEE 802.16 standard, for
instance, has adopted OFDM-TDMA and OFDMA (OFDM-FDMA) as two transmission
schemes at the 2–11 GHz band [Eklund et al., 2002]. Indeed, it is demonstrated by analysis
and simulation that OFDMA outperforms OFDM-TDMA in terms of several QoS metrics [Yu-
Jung et al., 2007]. In addition, a QoS framework in the MAC layer has also been integrated
into the multiple–access transmission systems in the IEEE 802.16 standard [Wongthavarawat
and Ganz, 2003]. Moreover, OFDMA has been adopted in downlink by 3rd Generation
Partnership Project (3GPP) for it next generation cellular system, called Long–Term Evolution
(LTE) [ETSI].
In TDMA, each user has a number of time slots, and they can be dynamically assigned
according to its QoS requirements. During these time slots, which last several symbols, only
one user occupies the available bandwidth. Since unused carriers in one link may experience
acceptable signal–to–noise ratio (SNR) in other links, because of their low SNR, this strategy
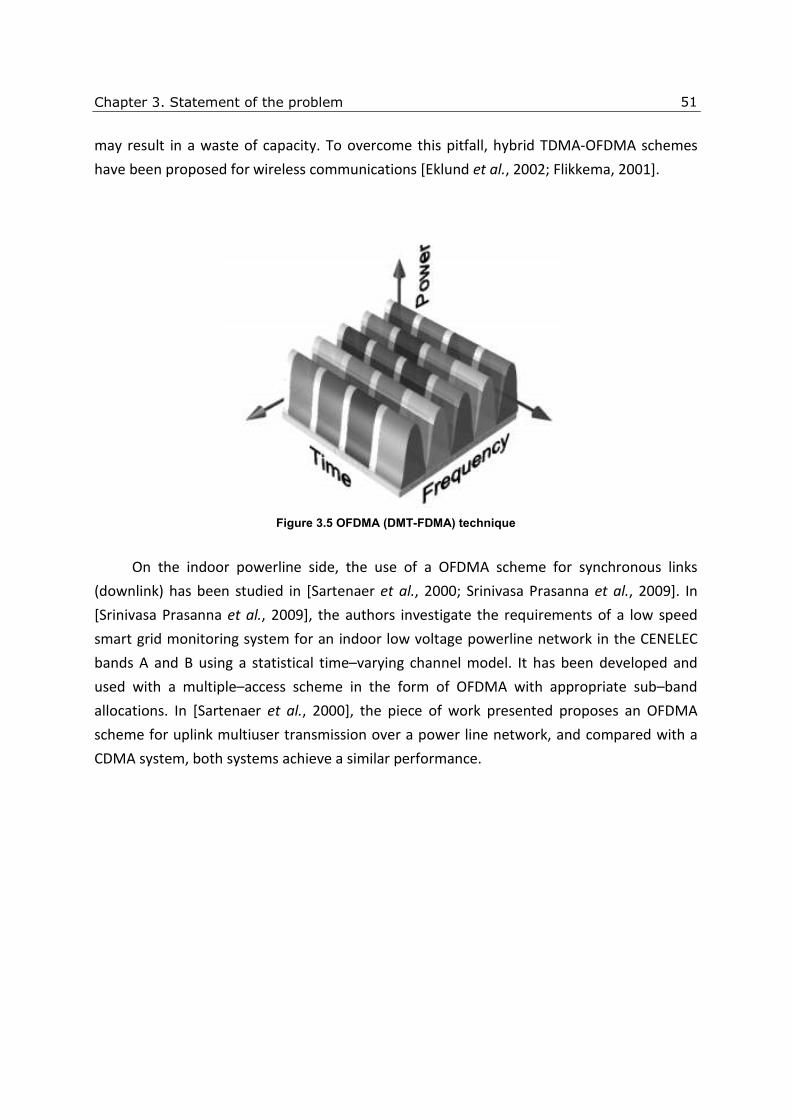
Chapter 3. Statement of the problem
51
may result in a waste of capacity. To overcome this pitfall, hybrid TDMA-OFDMA schemes
have been proposed for wireless communications [Eklund et al., 2002; Flikkema, 2001].
Figure 3.5 OFDMA (DMT-FDMA) technique
On the indoor powerline side, the use of a OFDMA scheme for synchronous links
(downlink) has been studied in [Sartenaer et al., 2000; Srinivasa Prasanna et al., 2009]. In
[Srinivasa Prasanna et al., 2009], the authors investigate the requirements of a low speed
smart grid monitoring system for an indoor low voltage powerline network in the CENELEC
bands A and B using a statistical time–varying channel model. It has been developed and
used with a multiple–access scheme in the form of OFDMA with appropriate sub–band
allocations. In [Sartenaer et al., 2000], the piece of work presented proposes an OFDMA
scheme for uplink multiuser transmission over a power line network, and compared with a
CDMA system, both systems achieve a similar performance.

Chapter 3. Statement of the problem
52
Figure 3.6 Comparison between TDMA/OFDMA and TDMA techniques (each color represents an user)
In [Ayyagari and Wai-chung, 2005; Gault et al., 2005; Hao et al., 2008; Hayasaki et al.,
2009], the authors propose a bit loading algorithm which maximizes the bit rate by
optimizing not only the bit quantity on each subcarrier but also the whole code rate subject
to constraints on the total bit error rate (BER) and transmission power on each subcarrier.
Furthermore, they investigate the OFDMA scheme as a multiple–access scheme to improve
the throughput of PLC for point–to–multipoint communications. The piece of work of
[Ayyagari and Wai-chung, 2005] investigates the capacity trade–off between TDMA-OFDM
and OFDMA in an in–home powerline network, with a clear coverage improvement over the
latter system.
In [Hayasaki et al., 2009], the author evaluates an OFDMA scheme as a multiple–access
scheme with the bit loading algorithm for point–to–multipoint communications, and
proposes a bit loading algorithm which maximizes the total bit quantity on the OFDM symbol
by optimizing the data rate subject to constraints on the BER and transmission power on
each subcarrier. As a result, the proposed OFDMA scheme is superior to the conventional
TDMA scheme in terms of throughput. The work in [Hao et al., 2008] proposes a PLC
resources allocation algorithm with an FDMA constraint for multiuser OFDMA by
reformulating the weighted–sum–rate OFDMA problem into an equivalent–interference
channel problem. How the performance of TDMA degrades rapidly when multiple QoS
connections are requested is shown. The paper from [Gault et al., 2005] describes an
OFDMA based modem for multiple–access PLC over the low voltage distribution network. It
concerns in particular the data frame structure, sub–carrier allocation to users, and the bit–
loading algorithm used for symbol coding. The proposed system is evaluated through

Chapter 3. Statement of the problem
53
simulations carried out using a simplified noise model in both downlink and uplink
directions.
In [Ser Wah et al., 2009], the throughput performance of several multiple–access
schemes is analyzed and compared with the powerline communication Homeplug 1.0
standard. This piece of work shows a modified CSMA/CA cognitive PLC system which allows
multiple users transmission at the same time. Combining with OFDMA and a cognitive
property, it could dynamically allocate subcarriers to different users in the system for
simultaneous transmissions. The proposed channel access mechanism aims to improve the
overall channel throughput by introducing subcarrier level multiple–access with cognitive
technology capability.
The previous pieces of work on PLC works were focused on synchronous systems, but
asynchronously received signals containing ISI produce ICI. It is known that OFDMA is known
to suffer from multiple–access interference (MAI) when the multiple–access channel is
asynchronous, potentially degrading the asynchronous/uplink system performance, i.e., the
users signals are received with distinct propagation delays in excess of the CP [Kaiser and
Krzymien, 1999; Tonello et al., 2000]. On the other hand, timing synchronization
requirements are much more stringent for mitigating ISI and ICI, and it requires symbol and
frequency synchronization of all terminals is required to prevent MAI among users [Cortes et
al., 2006; Sjoberg et al., 1999; van de Beek et al., 1999].
Mitigating asynchronous effects can be done with a guard period provided inherently
in the CP [Sari et al., 1995]. The CP is able to cope with ISI from frequency–selective fading,
as well as possible timing errors from all uplink users. Unfortunately, to obtain this benefit, a
long timing duration is required, which results in some reduction in data throughput.
Another mitigation approach is a downlink synchronization scheme [Kaiser and Krzymien,
1999], where an uplink user first estimates the starting point of the downlink frame by
means of a specially designed preamble or embedded redundancy (such as a CP), and then
adjusts the uplink transmission accordingly.
The feasibility performance for OFDMA uplink systems can be obtained even in high
dispersive channels. A prerequisite for this performance can be an uplink synchronization
technique at the CCo with feedback control channel to uplink users, which guarantees that
timing misalignments reside within the guard interval [Myonghee et al., 2010].
This problem associated with asynchronous OFDMA uplink systems can be addressed
in two different ways: the first focuses on mitigation/estimation of asynchronous timing

Chapter 3. Statement of the problem
54
errors [Kaiser and Krzymien, 1999; 2004; Sari et al., 1995; van de Beek et al., 1999], and the
second involves performance evaluation: several recent papers have studied the effect of
asynchronous timing errors [El-Tanany et al., 2001; Myonghee et al., 2003; Wei and Schlegel,
1995]. Interference canceling receivers to alleviate the detrimental effects of large frequency
and timing offsets in uplink OFDMA have been proposed [Haung and Lataief, 2005;
Raghunath and Chockalingam, 2009b].
Coming back to powerline communications, in [Cortes et al., 2006], the influence of
the carrier allocation strategy in the performance of synchronous and asynchronous DMT-
FDMA systems is evaluated for an indoor powerline system. It is shown that the bit–rate loss
due to the MAI is negligible in a symbol and frequency synchronized scheme. However, its
performance is extremely sensitive to small asynchronies. System outage may even occur for
fewer than ten samples of symbol misalignment or frequency mismatches of 40ppm.
With respect to previous comments, it is clear that OFDMA is not a valid solution for
asynchronous multiple–access environments. Traditionally, TDMA has been used for
medium access in multi–carrier systems, disregarding the frequency domain for several good
reasons [Ayyagari and Wai-chung, 2005]. The performance of OFDMA is also handicapped by
several factors. Many multi–carrier modulation schemes require guard bands between tones
assigned to multiple users transmitting simultaneously, thereby reducing system capacity.
OFDMA requires significantly higher protocol overhead because users must generate,
exchange with the OFDMA scheduler and regularly maintain “tone maps” that indicate the
Bit Loading Estimate or BLE (modulation density or bit rate for a particular subcarrier). In
[Yu-Jung et al., 2007], the ideal channel state information is assumed to be available at the
CCo or scheduler. This is often achieved by feeding the estimated channel information from
the receiver back to the transmitter through a control channel.
Moreover, OFDMA scheduling is extremely complex and computationally intensive
compared with TDMA, and requires much higher processing power and memory.
Implementation issues, complexity and cost issues do give TDMA an advantage currently in
the marketplace that may not be overcome by the capacity/coverage improvements for
OFDMA [Ayyagari and Wai-chung, 2005].

Chapter 3. Statement of the problem
55
Figure 3.7 Comparison between OFDMA and SC-FDMA techniques
On the other hand, the reduced user signal bandwidth increases sensitivity to
multipath fading, where all carriers assigned to a user may fade simultaneously, losing the
frequency diversity advantage of OFDM modulation. Another drawback of OFDM and
OFDMA systems is the high peak–to–average–power ratio (PAPR), that requires linear
transmitter circuitry, which suffers from poor power efficiency. A greater dynamic range is
required in the AFE (analog front end) making the design complex and costs higher.
In order to alleviate the PAPR problem encountered in uplink OFDMA, single carrier
frequency division multiple–access (SC-FDMA) [Czylwik, 1997; Myung et al.; Sari et al., 1994]
has been adopted for uplink transmission in evolved universal terrestrial radio access (E-
UTRA) LTE [ETSI], where the inherent loss of frequency diversity in OFDMA can be alleviated
by using some form of precoding. SC-FDMA can be viewed as a precoded OFDMA scheme,
where the precoding is done by means of a discrete Fourier transform (DFT) matrix. This M–
point DFT precoding operation at the transmitter results in all M data symbols of a user to be
mounted on all its M subcarriers, and with independent fades on these subcarriers, and
therefore, achieving frequency diversity becomes possible. In addition to providing low PAPR
compared with OFDMA and frequency diversity, SC-FDMA allows flexible sharing of the
spectrum among different users. With the adoption of SC-FDMA in E-UTRA LTE, studies
concerning different aspects of SC-FDMA are increasingly being reported in the recent
literature [Berardinelli et al., 2008; Ciochina et al., 2008; Wang et al., 2008].

Chapter 3. Statement of the problem
56
In [Berardinelli et al., 2008], the author proposes a iterative equalization and decoding
(turbo equalization) scheme, and showed that SC-FDMA with turbo equalizer performed
better than (or the same as) OFDMA for all modulation and coding sets considered. The
author in [Ciochina et al., 2008] presents a peak–to–average power ratio (PAPR) and BER
performance comparison between SC-FDMA, OFDMA and Walsh–Hadamard precoded
OFDMA, where the PAPR advantage of SC-FDMA in the presence of power amplifier non–
linearity has been analyzed.
Large frequency and timing offsets can cause significant MAI in both, uplink OFDMA
and SC-FDMA. In the previous wireless SC-FDMA studies, perfect frequency and timing
alignment has been assumed. However, as in uplink OFDMA [Haung and Lataief, 2005],
carrier frequency offsets and timing offsets are encountered in SC-FDMA as well.
The work by [Raghunath and Chockalingam, 2009a] investigates the effect of large
frequency and time offsets on the uncoded performance of SC-FDMA systems, and
illustrates the effectiveness of the proposed multiuser detection (MUD) multistage parallel
interference canceller (PIC) and the need for such cancellers in SC-FDMA to achieve better
performance than OFDMA, even with large carrier frequency offset (CFO) and time offset
(TO) was shown to be better than that of the ideal OFDMA performance, with perfect
knowledge of frequency/time offsets and channel coefficients.
Although the interference cancellers presented in this piece of work show a good
performance under an asynchronous environment, like OFDMA this solution is extremely
complex and computationally intensive. In [Raghunath and Chockalingam, 2009a], the
author illustrate the degradation in performance due to the self interference and multiuser
interference terms caused in SC-FDMA without MUD, where SC-FDMA performed poorly
compared with OFDMA.
On the other hand, filtered multitone modulation (FMT) is a discrete time
implementation of a multi–carrier system where sub–carriers are uniformly spaced and the
sub–channel pulses are identical. OFDM / DMT can be viewed as an FMT scheme that
deploys rectangular time domain filters [Bingham, 1990; Lee et al., 2000]. The FMT system
can support user multiplexing in a FDMA fashion through the distribution of the available
tones across the users in a similar way to OFDMA, and FMT-FDMA modulation has been
originally proposed for transmission over broadband frequency selective channels both in
VDSL [Cherubini et al., 2002], and more recently in wireless [Costa et al., 2003; Tonello,
2002; Tonello, 2006a] and powerline communication [Tonello and Pecile, 2007; 2009]
scenarios. This multiple–access technique has several advantages over previous systems.
Chapter 3. Statement of the problem
57
Robustness to frequency selective channels and to users asynchronism, sub–channel
spectral containment that makes it robust to narrow band interference, and the possibility
of shaping the spectrum by rendering undesired sub–channels null [Tonello and Pecile,
2009]. In this scenario, FMT has superior performance over OFDMA because of the sub–
channel spectral containment that allows sub–channel orthogonality in the presence of
asynchronous users as well to be mantained [Tonello, 2002; Tonello, 2006a]. FMT achieves a
high level of spectral containment with the result that the ICI is negligible compared with the
other noise signals in the system and the subcarriers can be considered close to orthogonal,
whatever the length of the multipath channel. In this way, FMT does not need the use of the
CP used in OFDM/DMT to maintain subcarrier orthogonality in the presence of multipath,
thereby, improving the total throughput. However, per sub–channel equalization is needed
in order to reduce the remaining ISI [Cherubini et al., 2002].
However, the implementation of FMT can be more complex than OFDMA because
sub–channel filtering is required. An efficient polyphase implementation of the synthesis and
analysis filter bank for single user FMT has been proposed in [Cherubini et al., 2002], and it is
based on FFT and low rate filtering. Its complexity has been evaluated in [Tonello, 2006b].
The main research problems related to FMT are the efficient digital implementation, the
design of the prototype pulse, the development of equalization schemes, the
synchronization problem, and in general the performance analysis and comparison with
other schemes.
3.3 CDMA
To cope with the impairments of powerline hostile channel, PLC systems may apply
robust and efficient modulation techniques such as spread–spectrum (SS) schemes [Biglieri,
2003]. Spread–spectrum techniques are methods by which a signal generated in a particular
bandwidth is deliberately spread in the frequency domain, resulting in a signal with a wider
bandwidth. These techniques are used for a variety of reasons, including the establishment
of secure communications, increasing resistance to natural interference and jamming.
Frequency–hopping spread spectrum (FHSS), direct–sequence spread spectrum (DSSS),
time–hopping spread spectrum (THSS) and combinations of these techniques are forms of
spread spectrum modulations. Each of these techniques employs orthogonal or
pseudorandom number sequences to determine and control the spreading pattern of the
signal across the allocated bandwidth.

Chapter 3. Statement of the problem
58
CDMA is a spread spectrum multiple–access technique that uses neither frequency
channels nor time slots [Fazel and Kaiser, 2003]. One of the basic concepts in data
communication is the idea of allowing several transmitters to send information
simultaneously over a single communication channel. This allows several users to share a
bandwidth of different frequencies. This concept is called multiplexing. CDMA employs SS
technology and a special coding scheme (where each transmitter is assigned a code) to allow
multiple users to be multiplexed over the same physical channel. By contrast, TDMA divides
access by time, while FDMA divides it by frequency. CDMA is a form of spread–spectrum
signaling, since the modulated coded signal has a much higher data bandwidth than the data
being communicated. With CDMA, the narrow band signal is spread by a large bandwidth
signal that is a code. All users in a CDMA system use the same frequency band and transmit
simultaneously. The transmitted signal is recovered by correlating the received signal with
the orthogonal code used by the transmitter.
Figure 3.8 CDMA technique
Following the previous classification done in spread spectrum technology modulations
of FHSS, DSSS, and THSS, these technologies can be combined with CDMA multi–access
technique. FHSS is a method of transmitting signals by rapidly switching a carrier among
many frequency channels, using a pseudorandom sequence known to both transmitter and
receiver. It is utilized as a multiple–access method in the frequency–hopping code division
multiple–access (FH-CDMA) scheme. In DSSS the data signal is multiplied by a large
bandwidth signal that is a orthogonal or pseudo random noise code. Its basic principle is that
each user is allocated by a code and can communicate at any time on any frequency, where
other users interference is considered as additional channel noise. The transmitted signal is
recovered by correlating the received signal with the sequence code used by the transmitter.
This method is known as direct sequence code division multiple–access (DS-CDMA) [Verdú,

Chapter 3. Statement of the problem
59
1998]. In THSS an orthogonal or pseudo noise sequence defines the transmission moment.
For multiple–access, time hopping code division multiple–access (TH-CDMA) uses the whole
wideband spectrum for short periods instead of parts of the spectrum all of the time.
DS-CDMA has been used widely in wireless communications and it has also been
selected by a number of standardization bodies, for instance, in third generation mobile
cellular systems like IS–95 [TIA/EIA, May 1995], 3GPP2 IS–2000 (CDMA2000) [ETSI, 2002a]
and 3GPP wideband CDMA (W-CDMA) [ETSI, 2002b] standards. It has also been used for
satellite navigation systems such as global positioning system (GPS) and the future European
Galileo.
Many multiple–access spread spectrum techniques have been proposed in the
literature for powerline communications, which include an analog spread spectrum chaotic
modulation system [Surendran and Leung, 2005]. The first synchronous DS-CDMA attempts
began in the lower frequencies (bands A and B) of the powerline channel [Okazaki and
Kawashima, 1998; van der Gracht and Donaldson, 1985]. In higher frequency bands of the
channel (1–40MHz), constrained minimum output energy (CMOE) receiver [Zsoldos et al.,
2001], maximum ratio combining (MRC) RAKE receiver [Del Re et al., 2003; Hensen and
Schulz, 1997], suboptimum minimum mean square error (MMSE) single user detection (SUD)
receiver [Hachem et al., 2001], interference cancellation detector [Tonello et al., 2004], and
multiuser detection techniques [Dai and Poor, 2003; Sartenaer et al., 2000; Tonello, 2006c]
have been used. In [Dai and Poor, 2003; Hachem et al., 2001; Sartenaer et al., 2000], users
can access the media synchronously using orthogonal binary short spreading codes, which
are optimal when all the users are synchronized. In an asynchronous environment, this is not
possible due to poor cross–correlation properties of these codes. Ignoring short–time
channel variations, powerline frequency response between two outlets may remain static
for a time changes [Canete et al., 2003; Canete et al., 2002]. So it should be pointed out that
successive symbols from the same user are spread with the same code; so for a set of users
within a relatively static channel situation, the interference signal seen by a receiver does
not change from symbol to symbol. Therefore, some users are at a disadvantage with
respect to other users [Milstein, 2001]. In pseudo–random long sequences, the interference
changes from symbol to symbol, providing higher MAI rejection and reducing its
cyclostationary statistics from symbol period to chip period. Short sequences have good
correlation properties under the assumption that the users are perfectly synchronized,
which is incorrect in this case. Therefore periodic long sequences are desirable. Some
comparisons between short and long sequences can be found in [Parkvall, 2000; Vembu and
Viterbi, 1996]. One of the most popular pseudo–random long binary sequence used in

Chapter 3. Statement of the problem
60
wireless DS-CDMA are the Gold codes [Gold, 1967], which are used in [Zsoldos et al., 2001]
for a synchronous system. Binary pseudo–random sequences are used in [Del Re et al., 2003;
Tonello, 2006c]. Besides the binary codes, there are also other families of pseudo–random
complex–valued polyphase codes widely used in Radar systems: their correlation properties
have been shown to be better than those of classical binary sequences [Luke, 1997;
Oppermann and Vucetic, 1997; Park et al., 2002], and therefore better MAI, IQ cross–talk
and powerline narrowband noise suppression.
On the other hand, asynchronous TH-CDMA and DS-CDMA schemes based on ultra
wide band (UWB) pulses are analyzed in [Tonello et al., 2004] using orthogonal short
spreading codes, where the UWB pulses are followed by a guard time to cope with the
channel time dispersion, and consequently making the equalization easier. In [Tonello,
2006c], the author analyzes an iterative MUD frequency domain equalizer for the same
system.
Various combinations of multi–carrier and spread spectrum schemes (MC-SS), like
multi–carrier CDMA (MC-CDMA) have been introduced since 1993 [Hara and Prasad, 1997;
Yee et al., 1993]. MC-SS schemes have shown very good performances in the case of
multiuser communications in difficult environments and have been proposed for beyond 3rd
generation (3G) mobile cellular systems [Hélard et al., 2001; Kaiser, 2002]. These hybrid
techniques have also been investigated in studies in DSL context [Mallier et al., 2002], and
also represent as well potential solutions for powerline communications [Tlili et al., 2003].
MC-CDMA has been widely researched in powerline communications and takes
advantage of OFDM, which has shown very good performance in wireless and powerline
communications [Pavlidou et al., 2003]. Synchronous MC-CDMA systems are evaluated in
[Assimakopoulos and Pavlidou, 2002; Crussiere et al., 2004; Huang et al., 2008; Katsis et al.,
2003; Sartenaer et al., 2000] using short spreading codes in a powerline channel without
impulsive noise. Analytical approaches for synchronous MC-CDMA systems have been
proposed in [Huang et al., 2008] and [Navidpour et al., 2006]. However, a zero–mean
Gaussian model is used for impulsive noise in [Navidpour et al., 2006], and [Assimakopoulos
and Pavlidou, 2002] models impulsive noise with a Middleton’s class A filter. In [Zsoldos et
al., 2001], long Gold sequences have been used instead of short codes for synchronous
system without impulsive noise model. The performance of asynchronous MC-CDMA
scheme has been analyzed widely for wireless communication systems [Kyunbyoung et al.,
2006; Kyunbyoung et al., 2002; Won Mee and Moon Woo, 2006; Zhang and Guan, 2004],
where the channel conditions are different from the powerline channel. Only in [Hoque et
al., 2007], an asynchronous MC-CDMA system for powerline is proposed but without CP,

Chapter 3. Statement of the problem
61
which is used to improve the OFDM system performance avoiding ISI and ICI caused by the
multipath effect. In [Ma et al., 2005], the background plus impulsive noise is modeled as
zero–mean Gaussian noise for the performance analysis under impulsive noise of a OFDM
system with CP, whereas the additive white Gaussian noise (AWGN) was considered as
background noise.
On the other hand, multi–carrier direct sequence code division multiple–access (MC-
DS-CDMA) system results in multi–carrier modulation applied to CDMA signal. The MC-DS-
CDMA transmitter modulates the data sub–streams on subcarriers with a carrier spacing
proportional to the inverse of the chip rate to guarantee the orthogonality between
spectrums of the sub–streams after spreading [Kondo and Milstein, 1993]. In [Crussiere et
al., 2006b], the author proposes an adaptive MC-DS-CDMA system suitable for synchronous
powerline networks. This work analyzes the performance of the system and compares the
results to those obtained with the DMT system, where it can be highlighted that for well–
chosen spreading factors, the proposed adaptive system was able to transmit higher rates
than DMT.
However, there is also the possibility of combine SS and FDMA techniques. Spread–
spectrum multi–carrier multiple–access (SS-MC-MA) [Kaiser and Krzymien, 1999] is a multi–
carrier modulation that combines SS and FDMA, which can be classified as particular linearly
precoded DMT method. The FDMA component is based on the transmission of several
subsets of subcarriers in parallel, each subset being exclusively assigned to a specific user.
The SS component allows each user to multiplex several symbols within the same subset by
spreading them in the frequency domain. For the synchronous uplink, SS-MC-MA has been
proposed to appropriately exploit the advantages of MC-CDMA evident on the downlink.
The work by [Crussiere et al., 2006a] proposes that an adaptive bit–loading algorithm
be applied to the SS-MC-MA synchronous scheme, where for well–chosen spreading factors,
it can be concluded that the proposed adaptive system was able to transmit higher rates
than DMT. In [Jingtao and Matolak, 2008], the author compares the performance of an
OFDMA, SS-MC-MA and MC-CDMA systems for a wireless synchronous uplink scenario,
showing a similar performance of these schemes under the same channel conditions.

Chapter 3. Statement of the problem
62
3.4 ScDMA
The work by [Haumonte and Deneire, 2007] presents a method to multiplex digital
streams over powerline networks called scattering division multiple–access (ScDMA). The
principle relies on using reflections as a way to discriminate the information sent by several
transmitters. A unique feature is that the transmitter does not actually send any physical
signal, but translates the digital information to be sent directly into an impedance value. The
receiver reads the information displayed by all the transmitters by analyzing the network
scattering parameters.
This method has many advantages over TDMA methods traditionally used in cable
network multiplexing systems. Its continuous and simultaneous demodulation ability
generates very advantageous end–to–end message delays as well as a low system
complexity leading to increased robustness.
One of the key advantages of ScDMA is the fact that all transmitters send their own
data streams simultaneously and continuously. The bus is available 100% of the time for all
the transmitters at the same time. That is why the bus access is instantaneous and there is
absolutely no message request latency. Compared with existing protocols, there is no need
to define message priorities since all messages go through at the same time. Therefore there
is no message collision and no contention arbitration is needed.
This method is oriented towards low data rate transfers, such as industrial control, and
it is not scalable like other multiple–access techniques in order to satisfy quality of service
requisites.
3.5 SUMMARY AND CONTRIBUTIONS
As a summary, the following section will discuss the different advantages and
disadvantages of multiple–access schemes reviewed above for an asynchronous scenario
approach.
TDMA systems must carefully synchronize the transmission times of all the users to
ensure that they are received in the correct timeslot and do not cause interference. Since
this cannot be perfectly controlled in a multipath environment, each timeslot must have a

Chapter 3. Statement of the problem
63
guard–time, which reduces the probability that users will interfere, but decreases the
spectral efficiency.
FDMA schemes spread user's data in the frequency dimension, so that in a multipath
channel the frequency diversity may be lost. Similar to TDMA, FDMA systems must use a
guard–band between adjacent channels, due to the frequency offsets of the signal
spectrum. The guard–bands will reduce the probability that adjacent channels will interfere,
but decrease the utilization of the spectrum.
On the other hand, most of the multi–carrier based multiple–access schemes
(Wavelet-OFDM/TDMA, FFT-OFDM/TDMA, DMT-FDMA and OFDMA) have been developed
for the synchronous downlink, due to time misalignments and frequency offset sensibility. It
is known that OFDM/DMT based schemes suffer from MAI when the multiple–access
channel is asynchronous, potentially degrading the asynchronous uplink system
performance.
Another drawback of OFDM systems is the high PAPR, requiring linear transmitter
circuitry, which suffers from poor power efficiency. SC-FDMA solves this problem, but it still
suffers from time and frequency offsets, requiring complex MUD techniques at the receiver.
Figure 3.9 Multiple–access schemes
Spread spectrum schemes take advantage of the frequency diversity in multipath
fading channels. It has been shown that MC-CDMA is a promising multiple–access scheme
for the synchronous downlink of a PLC system where it enables the deployment of efficient,
low complexity receivers employing simple channel estimation. However, this aspect does
not apply to the uplink and asynchronous environments, where more complex multiuser
Chapter 3. Statement of the problem
64
detection techniques are necessary to counteract the MAI, since in the uplink orthogonal
spreading codes cannot be used to reduce the MAI.
On a synchronous uplink SS-MC-MA is an interesting alternative to other multi–carrier
multiple–access schemes such as OFDMA, OFDM/TDMA and MC-CDMA, as discussed in
[Kaiser, 1998]. MC-DS-CDMA is of special interest for the asynchronous uplink of mobile
radio systems, due to its close relation to asynchronous single–carrier DS-CDMA systems. On
the one hand, the synchronization of users can be avoided, but, on the other hand, the
spectral efficiency of the system decreases due to asynchronism, losing the frequency
diversity advantage. [Fazel and Kaiser, 2003].
Bit loading techniques applied to QoS requirements have been discussed. However, it
should be noted that there also exist periodic variations of the input impedances of the
loads connected to the powerline network that translate into short–time variations of the
transfer function. This behavior must in fact be incorporated in the CSI which needs to be
refreshed periodically. Some studies have advantageously applied loading principles to
spread spectrum systems [Holtzman, 2000; Terré et al., 2003], but among the existing
adaptive schemes, DMT used for DSL communications is the most popular. These techniques
require a centralized manager or CCo assuming CSI at the transmitter, which adds more
complexity to the system. Current PLC devices compliant with Smart Grid requirements
(HomePlug Green PHY and G.hn Smart Grid profile) are based on multi–carrier modulations
and TDMA schemes, which is not valid for asynchronous transmission links.
Recently proposed multiple–access schemes have been based on multi–carrier
modulations, which have demonstrated a very good performance and efficiency in
synchronous environments. But TDMA and FDMA have the drawback of being extremely
sensitive to timing/frequency asynchronism, where the behavior of some spread spectrum
multiple–access techniques could be better in an asynchronous environment. Since THSS
and FHSS are directly related to time and frequency synchronization, DSSS multiple–access
(DS-CDMA) is a logical choice taking into account its proven robustness against hostile
channels. CDMA has several advantages and disadvantages over multi–carrier methods in
hostile and asynchronous environments:
• DS-CDMA can effectively reject narrowband interference, which can be found
in powerline networks in the form of RF couplings in the wirelines. Since
narrowband interference affects only a small portion of the spread spectrum
signal, it can be ignored or easily removed through notch filtering without
much loss of information.

Chapter 3. Statement of the problem
65
• Most modulation schemes try to minimize the signal bandwidth, since
bandwidth is a limited resource in powerline networks. However, spread
spectrum techniques use a transmission bandwidth that is several orders of
magnitude greater than the minimum required signal bandwidth. One of the
initial reasons for doing this was military applications, in order to achieve
security and resistance to jamming.
• DS-CDMA signals are resistant to multipath fading. Since the spread spectrum
signal occupies a large bandwidth only a small portion of this will undergo
fading due to multipath at any given time, through advantage of the frequency
diversity.
• Synchronous TDMA, FDMA and CDMA receivers can in theory completely reject
arbitrarily strong signals using time slots, frequency sub–channels and different
codes due to the orthogonality of these systems. However, time–frequency
misalignments produce severe MAI in these multiple–access methods, where
the asynchronous CDMA system may reject the interference in a better way.
Pseudo–random sequences are used in asynchronous CDMA systems, which
are statistically uncorrelated. That is why a lower correlation of these
sequences implies a lower MAI in the receiver. The signals of other users will
appear as noise to the signal of interest and interfere slightly with the desired
signal in proportion to the number of users. These low correlation sequences
could be polyphase sequences applied to an asynchronous CDMA system.
• The number of simultaneous user is limited by the bit error rate target, since
the signal to interference ratio varies inversely with the number of users.
• The near–far problem is a condition in which a strong signal captures a receiver
and makes it impossible for the receiver to detect a weaker signal. The near–far
problem is particularly difficult in DS-CDMA systems where transmitters share
transmission frequencies and transmission time.
• Since the transmitted signal propagates through a multipath fading channel, it
must be equalized at the receiver. While this is a relatively simple task for
multi–carrier signals, it is not the case for single–carrier signals.
Asynchronous CDMA has been widely researched for wireless Rayleigh fading channels
and additive white Gaussian noise [Mantravadi and Veeravalli, 2002; Mirbagheri and Yoon,
2002; Rapajic and Vucetic, 1994; Tomoya Urushihara, 2005; Wong et al., 1999]. However,

Chapter 3. Statement of the problem
66
there is a lack of work on asynchronous CDMA powerline communications [Tonello et al.,
2004; Tonello, 2006c], and most of the pieces of research conducted on CDMA for powerline
communications are based on orthogonal short binary sequences [Dai and Poor, 2003;
Hachem et al., 2001; Hensen and Schulz, 1997; Okazaki and Kawashima, 1998; Sartenaer et
al., 2000; Tonello et al., 2004]. Moreover, the proposed channel noise models are usually
incomplete or simplified, where the impulsive noise is modeled the Gaussian model [Dai and
Poor, 2003; Tonello et al., 2004; Tonello, 2006c] and the remaining pieces of work simply
ignore the impulsive noise. The narrowband noise is also avoided, and the background noise
is sometimes modeled as AWGN noise [Dai and Poor, 2003; Hachem et al., 2001; Tonello,
2006c]. It must be kept in mind that the powerline noise is an important characteristic of the
network, thus it should not be disregarded.
The work presented here investigates the use of long periodic polyphase sequences in
an asynchronous DS-CDMA system under a powerline channel model with background,
narrowband and impulsive noise, analyzing its effects over CDMA signals. An MMSE receiver
is selected due to its advantage of ease of adaptation, since standard adaptive algorithms
can be employed. In order to compare the performance of such a system, the performance
of an asynchronous multi–carrier scheme is also analyzed. The selection criterion was a
similar system based on a multi–carrier modulation, which is MC-CDMA. Moreover, if the
MC-CDMA receiver does not use MUD techniques, it has been shown that its performance is
similar to OFDMA technique. As stated in previous chapters, one of the requisites of the
target system is that complex structures should be avoided in order to meet Smart Grid
requisites (Table 2.4), and asynchronous systems have been selected in order to a remove
the central coordinator.
SS
CMOEMUD[166]
ASYNCFD MUD UWB
[139]
ASYNCIC UWB
[135]
PIC MUD[34, 124]
TH-CDMAUWB[135]
MMSESUD[54]
RAKE[36, 62]
CHAOTICSS
[128]
LOWER BAND
[105, 150]
DS-CDMA
Figure 3.10 Spread spectrum receivers for PLC

Chapter 3. Statement of the problem
67
Linking with the work description done above and remembering previously remarked
objectives of this thesis:
1. Powerline impulsive noise measurements in order to complete a powerline
channel model and analyze the noise effect over a transmitted signal, obtaining
a closed–form probability error function.
2. Theoretical and simulation study of asynchronous multiple–access systems with
single–carrier and multi–carrier modulations.
3. Compare the performance of different families of spreading sequences with
several receivers’ structures and multiple–access systems in asynchronous
environments under powerline impulsive noise.
This thesis proposes another approach for Smart Grid devices based on single–carrier
modulations with asynchronous user accesses in order to reduce complexity of the overall
system. These PLC modems should have specific characteristics in order to meet the
requirements of HAN communication devices. That is, complexity, cost and power
consumption must be as low as possible.

Chapter 4. Measurement Campaign and Channel Modeling 69
4 Measurement Campaign and Channel Modeling
Chapter 4
Measurement Campaign and Channel Modeling
Nowadays the use of high speed transmission networks is widespread inside home
environments, for audio and video diffusion as well as for data sharing. The powerline
network is an ideal media because all houses are already wired without the need to install
another medium (e.g. Ethernet cable or fiber optic) or depending on the coverage of actual
Wireless LAN modems. Even approximately 30 years ago the powerline network was used
for low speed data transmission (X-10), but these new applications require higher data rates.
To understand the challenges of powerline communication, and to design robust data
transmission systems, one must have a good understanding of the communication channel
characteristics; in particular, the range of channel frequency response, and the
characteristics of the channel noise. These characteristics can be quite diverse among
different buildings, homes and industrial plants because of different wiring structures,
different wire types, and different appliances connected to the electric circuit. It is necessary
to understand the electrical characteristics of the network in order to adapt the transmission
system and parameters to the channel properties, since the network was not designed for
data transmission, just for power transmission.
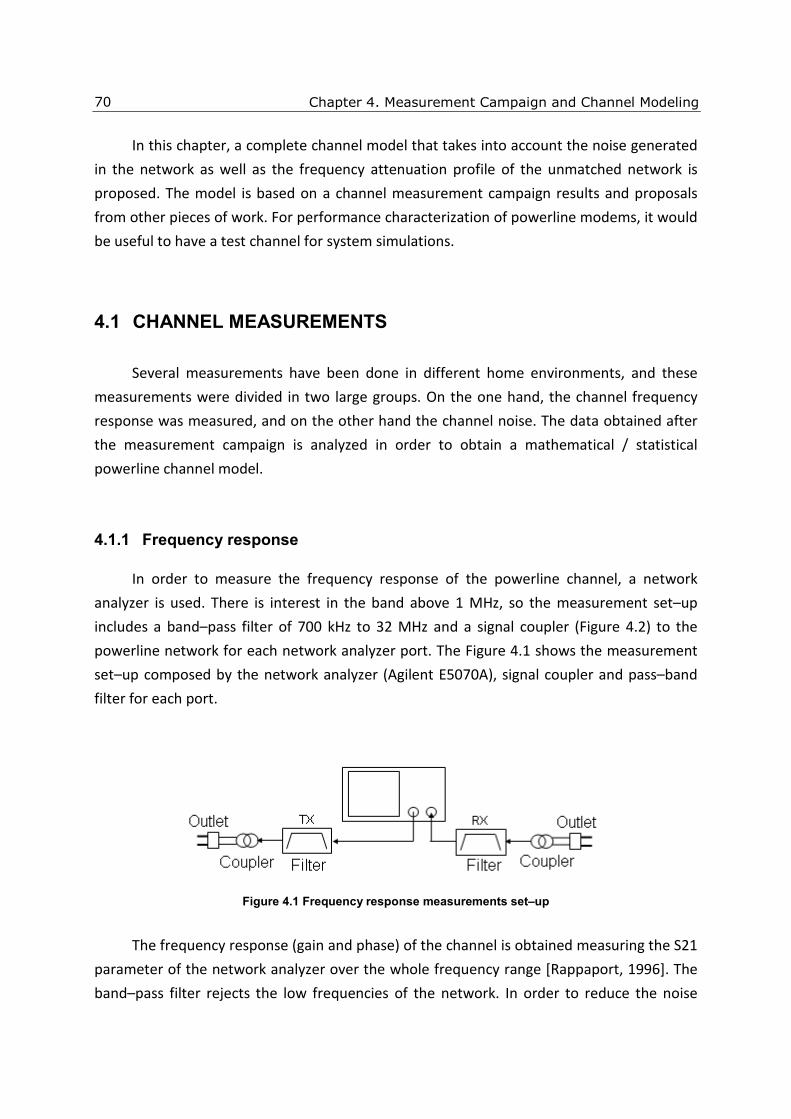
Chapter 4. Measurement Campaign and Channel Modeling
70
In this chapter, a complete channel model that takes into account the noise generated
in the network as well as the frequency attenuation profile of the unmatched network is
proposed. The model is based on a channel measurement campaign results and proposals
from other pieces of work. For performance characterization of powerline modems, it would
be useful to have a test channel for system simulations.
4.1 CHANNEL MEASUREMENTS
Several measurements have been done in different home environments, and these
measurements were divided in two large groups. On the one hand, the channel frequency
response was measured, and on the other hand the channel noise. The data obtained after
the measurement campaign is analyzed in order to obtain a mathematical / statistical
powerline channel model.
4.1.1 Frequency response
In order to measure the frequency response of the powerline channel, a network
analyzer is used. There is interest in the band above 1 MHz, so the measurement set–up
includes a band–pass filter of 700 kHz to 32 MHz and a signal coupler (Figure 4.2) to the
powerline network for each network analyzer port. The Figure 4.1 shows the measurement
set–up composed by the network analyzer (Agilent E5070A), signal coupler and pass–band
filter for each port.
Figure 4.1 Frequency response measurements set–up
The frequency response (gain and phase) of the channel is obtained measuring the S21
parameter of the network analyzer over the whole frequency range [Rappaport, 1996]. The
band–pass filter rejects the low frequencies of the network. In order to reduce the noise

Chapter 4. Measurement Campaign and Channel Modeling
71
effect during the channel measurement, the average of the last 16 measured frequency
responses is taken.
Figure 4.2 Powerline coupling circuit
The fifth order filters from the Figure 4.3 and Figure 4.4 are tuned for a pass band of
700 kHz to 32 MHz, as the band of interests falls in the range of 1MHz to 30MHz. Figure 4.5
shows the frequency response of the band–pass passive filter for the signal reception and
transmission circuits.
Figure 4.3 Transmission pass–band filter

Chapter 4. Measurement Campaign and Channel Modeling
72
Figure 4.4 Reception pass–band filter
The channel measurements have been carried out over power lines several tens of
meters. Figure 4.6 and Figure 4.7 show a frequency response measurement done between
two power outlets in a typical home environment. To remove the effect of the noise in these
measurements, the acquired data is smoothed with the mean operation along the time.
Therefore, the short–term variations are not measured.
Figure 4.5 Pass–band filter frequency response

Chapter 4. Measurement Campaign and Channel Modeling
73
Figure 4.6 Measured channel frequency response (Gain)
Figure 4.7 Measured channel frequency response (Phase)
The channel frequency response corresponds to a low–pass filter, strong phase
nonlinearities are appreciable due to the signal multipath [Zimmermann and Dostert,
2002b]. The effect introduced by the 700 kHz cut–off pass–band filters at the signal couplers
renders the response under the 1 MHz band to be unreliable. This is due to the excessive
attenuation created by the filters in this band, and the network analyzer is incapable of
compensating it correctly. In any case, the band of interest is in the 1-30MHz region. A first
look at the amplitude frequency response of the channel suggests the use of OFDM
modulation as a transmission technique together with bit designation and power bit–loading
algorithms for each sub–channel, in order to combat selective fading.

Chapter 4. Measurement Campaign and Channel Modeling
74
Figure 4.8 shows, two powerline channels superposed; these two channels are
measured between the same outlets, but the network state was different in both cases (for
example, a vacuum cleaner switched on), where the response in some frequencies is
changed. Slight changes are observed in the amplitude response, the most severe of these
being in the 20-25 MHz band.
Figure 4.8 Comparative channel responses in accordance with loads
During the frequency response measurement process of the channel frequency
response, it is possible to observe that it remains stable for a couple of minutes or hours,
and changes when the electrical devices are plugged in and unplugged.
Figure 4.9 Frequency response expansion

Chapter 4. Measurement Campaign and Channel Modeling
75
By performing the inverse discrete Fourier transform (IDFT), an approximation of the
channel impulse response is obtained. This is only an approximation because the network
analyzer only provides information on the frequency domain above 300 kHz, to which it
would be necessary to add the effects of filters up to 1 MHz. In order to resolve the problem,
it is necessary to replace with null frequency components under 1 MHz. The impulse
response obtained does not contain information on the DC - 1MHz band, but it does contain
information on the rest of the band.
Figure 4.10 Channel impulsive response
The result of the IDFT over the frequency response is shown in Figure 4.10, where time
dispersion of the channel is less than 1 microsecond. The impulsive response obtained does
not contain information on the DC-1 MHz, but does contain information on the rest of the
band.
All the simulations are made in the time domain, so it is necessary to make a
transformation in the channel response from the frequency to the time domain, in order to
obtain the impulse response of the channel. The result obtained in the time domain can be
compared with an N–order finite impulse response (FIR) filter, which is convoluted with the
transmitted signal over the powerline media.

Chapter 4. Measurement Campaign and Channel Modeling
76
4.1.2 Channel Noise
The noise is measured with a digital oscilloscope band limited to 20 MHz and attached
to the signal coupler with a 200 kHz cut–off frequency high–pass filter (see Figure 4.11),
where its frequency response is shown in Figure 4.12. The input impedance of the coupler
should be much higher than the impedance seen in the powerline network, which is
unknown, in order not to disturb the network and obtain a reliable measurement. So, the
magnitude measurements done by an oscilloscope or spectrum analyzer should be different
due to their different input impedance (i.e. 1 MΩ and 50Ω respectively). The noise
parameters of interest are the followings.
Figure 4.11 Noise measurement set–up
The impulse noise analysis was performed by setting the oscilloscope to a sampling
rate of 15 million samples per second, while in order to analyze the distance between pulses,
the oscilloscope was set in peak detector mode, with a sampling interval of 14 microseconds,
thus obtaining, in this way, a 40-second window.
Figure 4.12 High–pass filter response

Chapter 4. Measurement Campaign and Channel Modeling
77
4.1.2.1 Background noise
This kind of noise is caused mainly by the composition of several low–power noise
sources [Zimmermann and Dostert, 2002a]. Its PSD is relatively low and varies with
frequency and time. In the absence of impulse noise, background noise samples were
captured with the oscilloscope. The capture time should be as long as possible, taking the
maximum oscilloscope memory into consideration. It must be taken into account that the
capture is done in time domain, in order to get a spectral analysis in the frequency domain.
During the background noise measurement, the noise samples are captured in absence
of impulse noise in a window of 40 milliseconds. The spectral estimation has been made
using the Welch method with a spectral resolution of 48 KHz. In order to represent the
power spectrum density in dBW/Hz, the impedance of the powerline network is needed, due
to the fact that the acquired samples are in Volts. However this parameter is unknown, so a
first approximation could be to assume a network impedance of 1Ω.
Figure 4.13 Background noise PSD
Figure 4.13 shows how the power of the noise decreases exponentially with the
frequency. The narrow band noise sources between the 5 MHz and 11 MHz bands observed
in the Figure 4.13 are RF waves of short–wave radio emissions. Background noise remains
stationary over a long period of time, even for hours. This may vary during the day
depending on the atmospheric characteristics that allow a more propitious propagation of
RF waves. It is clear that the noise produced in the power line network cannot be described
with a additive white Gaussian noise model.

Chapter 4. Measurement Campaign and Channel Modeling
78
4.1.2.2 Impulsive noise
Impulse noise has its source in switching components and devices like silicon
controlled rectifiers (SCR), linear and switching power supplies, and so on. Some of these
pulses are synchronous with the period of the electrical network, and others with the
switching period of the device. A simplified way to characterize the impulse noise is based
on the following parameters [Zimmermann and Dostert, 2002a]: kind of pulse, amplitude,
length and time interval between the pulse events. The first three parameters are captured
as in the background noise case.
In order to analyze the properties of impulsive noise, samples were taken during
several hours in different houses; after that they were processed and analyzed. Again, two
pulses with a distance of under one millisecond are regarded as belonging to a pulse–burst
event.
Figure 4.14 Measured impulsive noise
The time interval between the pulse events parameter is measured with a peak–
detector mode of the oscilloscope, in order to extend as far as possible the time–line horizon
of the measure as far as possible. The oscilloscope is given a time window of 40 seconds with
a peak detection resolution of 40 microseconds. Two pulses with a distance of less than one
millisecond are always regarded as belonging to a pulse–burst event. The probability of time
interval between pulse events decreases exponentially with time. Figure 4.15 shows a
histogram of the time intervals of captured pulses.

Chapter 4. Measurement Campaign and Channel Modeling
79
Figure 4.15 Time between pulses PDF (20s)
To obtain more detail, a zoom of the first 200 milliseconds is done and shown in Figure
4.16. The pulse events occur in a separation of time equal to the multiples of the power line
network working period (20 milliseconds in Europe), and therefore the most probable time
separation between pulses is the network period. The histogram does not show time
distances of under one millisecond because, as commented previously, it is assumed that
these pulses belong to a pulse–burst event. These data shows that there are numerous
devices in the home synchronized with the network, such as linear power supplies.
Figure 4.16 Time between pulses PDF (200ms)

Chapter 4. Measurement Campaign and Channel Modeling
80
Two different types of pulse are classified, percentage–wise, as follows:
• Single pulse noise: 48.22%
• Burst pulse noise: 51.88%
Figure 4.17 shows a measured single pulse with a specific structure mainly composed
of a oscillation attenuated in the time. On the other hand, the PSD of the previous pulse is
shown in Figure 4.18. This spectrum is a composition of background and impulsive noise,
where the pulse energy predominates in the lower frequencies.
Figure 4.17 Measured single pulse noise
Figure 4.18 Measured single pulse noise PSD

Chapter 4. Measurement Campaign and Channel Modeling
81
Figure 4.19 shows two samples of measured burst pulses. These kind of pulses are
composed of several single pulses concatenated in the time domain.
Figure 4.19 Measured pulse–burst noise
The power spectral density of the first pulse (Figure 4.19) is shown in the Figure 4.20. It
is clear that its spectrum is quite similar to the PSD that can be found in the single pulse
sample, since it is a composition of single pulses.

Chapter 4. Measurement Campaign and Channel Modeling
82
Figure 4.20 Measured single pulse noise PSD
The power and energy of a pulse is defined as follow
2
1
1 N
i
i
P xN =
= ∑ (4.1)
2
1
N
i
i
E x=
= ∑ (4.2)
where ix is the sample captured by the oscilloscope and N is number of samples.
Table 4.1 compares the power and energy of pulses shown in Figure 4.17 and Figure 4.19
with background noise. The damaging nature of this kind of noise over the signal transmitted
in the power line network should be noticed.
Length Amplitude Power Energy
Burst pulse A 65 us 0.04V -25.65dBV2 0.38dBV2
Burst pulse B 680 us 0.05V -37.34dBV2 8.57dBV2
Single pulse 4 us 0.2V -41.58dBV2 -5.56dBV2
Background noise Power: -53.04dBV2
Table 4.1 Pulse power and energy

Chapter 4. Measurement Campaign and Channel Modeling
83
From the classification done of pulse kind probability, it can be concluded that half of
the pulse events are highly destructive for the transmitted signal.
On the other hand, the amplitude of the measured impulsive noise is analyzed, and it
shown how it follows a statistical distribution which is a combination of a Rayleigh (β=0.11)
and uniform distribution, where the threshold that switches between statistical functions is
at 0.4V approximately. Figure 4.21 shows the histogram of captured amplitudes and is
compared with the probability density function (PDF) of a Rayleigh statistical distribution.
Figure 4.21 Pulse amplitude PDF
Figure 4.22 compares again the measured cumulative distribution function (CDF) with
the proposed Rayleigh statistical distribution, where both curves are very similar.

Chapter 4. Measurement Campaign and Channel Modeling
84
Figure 4.22 Pulse amplitude CDF
The same tendency can be noticed in the case of the pulse duration for a combination
of a Rayleigh (β=0.076) and uniform distribution, where the threshold that switches between
statistical functions is at approximately 250 microseconds. Figure 4.23 and Figure 4.24
compare the measured burst pulse duration PDF and CDF, respectively.
Figure 4.23 Burst pulse duration PDF

Chapter 4. Measurement Campaign and Channel Modeling
85
Figure 4.24 Burst pulse duration CDF
4.2 CHANNEL MODELING
In order to design a powerline system it is necessary to understand and characterize
the powerline network behavior through mathematical models for design and simulation.
This will allow the transmitter / receiver scheme to be validated, thus optimizing the use of
the powerline network.
Once the frequency response, the background and impulsive noise of the power line
network have been measured, and its behavior is analyzed. A powerline channel model is
proposed in this work; it is based on the measurement results presented here and on those
of other pieces of work, in order to obtain a mathematical model that is as complete as
possible, and which includes impulse response and noise model.
However, the powerline frequency response is varying over the time [Canete et al.,
2006], but the model used in this work will assume that it remains static for the entire
simulation, avoiding the long–term and short–term variations.
4.2.1 Frequency response

Chapter 4. Measurement Campaign and Channel Modeling
86
Due to the impedance mismatch between the load and the cable impedances, the
transmitted signal suffers from reflections, which are propagated through pN paths along
the powerline network. The frequency transfer function of the powerline multipath channel
[Zimmermann and Dostert, 2002b] can be written as
0 12 /( )
1
( )p
ki pi
Nj fd va a f d
i
i
G f g e eπ−− +
=
= ⋅ ⋅∑ (4.3)
where f is the frequency, ig and id are the gain parameter and the distance of each
ith path, which are calculated for a randomly built impedance network shown in Figure 2.1,
defined by cable lengths and outlet/cable impedances. k , 0a and 1a are the cable loss
parameters.
Figure 4.25 Unmatched transmission line
Reflection coefficient ρ and transmission coefficient σ are calculated from (4.4) and
(4.5), respectively.

Chapter 4. Measurement Campaign and Channel Modeling
87
a bb a
a b
Z Z
Z Zρ →
−=
+ (6) (4.4)
21 a
b a b a
a b
Z
Z Zσ ρ→ →= + =
+ (7) (4.5)
Figure 4.25 shows a simple example of multipath signal propagation which can be
easily analyzed. From the point of view of the transmitter with characteristic impedance 1T ,
the link has two branches at the intersection node 1N , one for the receiver ( 3T ) and other
for a device ( 2T ) connected to the network. Each cable segment has its own characteristic
impedance iZ and cable length il . In other words, the network studied here is a perfect
example of unmatched power line network. So, there are reflections in all 1P , 2P , 3P and 1N
junctions. With these assumptions, an infinite number of propagation paths is possible in
principle, due to multiple reflections. Each path has a weighting factor ig , representing the
product of the reflection and transmission factors along the path. All reflection and
transmission factors at power lines are basically less or equal to one. This is due to the fact
that transmission occurs only at junctions, where the load of a parallel connection of two or
more cables leads to a resulting impedance being lower than the characteristic impedance of
the feeding cable.
The path gain ig , shown in (4.3), is the product of iR reflection coefficients ρ and iT
transmission coefficients σ calculated for each ith path
∏∏==
⋅=ii T
l
li
R
l
liig1
,
1
, σρ (4.6)
The reflection coefficient 11,Nρ for a signal propagating from 1Z to the junction 1N in
the impedance network of Figure 4.25 can be written as
1
2 3 2 3 11,
2 3 2 3 1
( )
( )N
Z Z Z Z Z
Z Z Z Z Zρ
+ −=
+ + (4.7)
and the remaining reflection coefficients
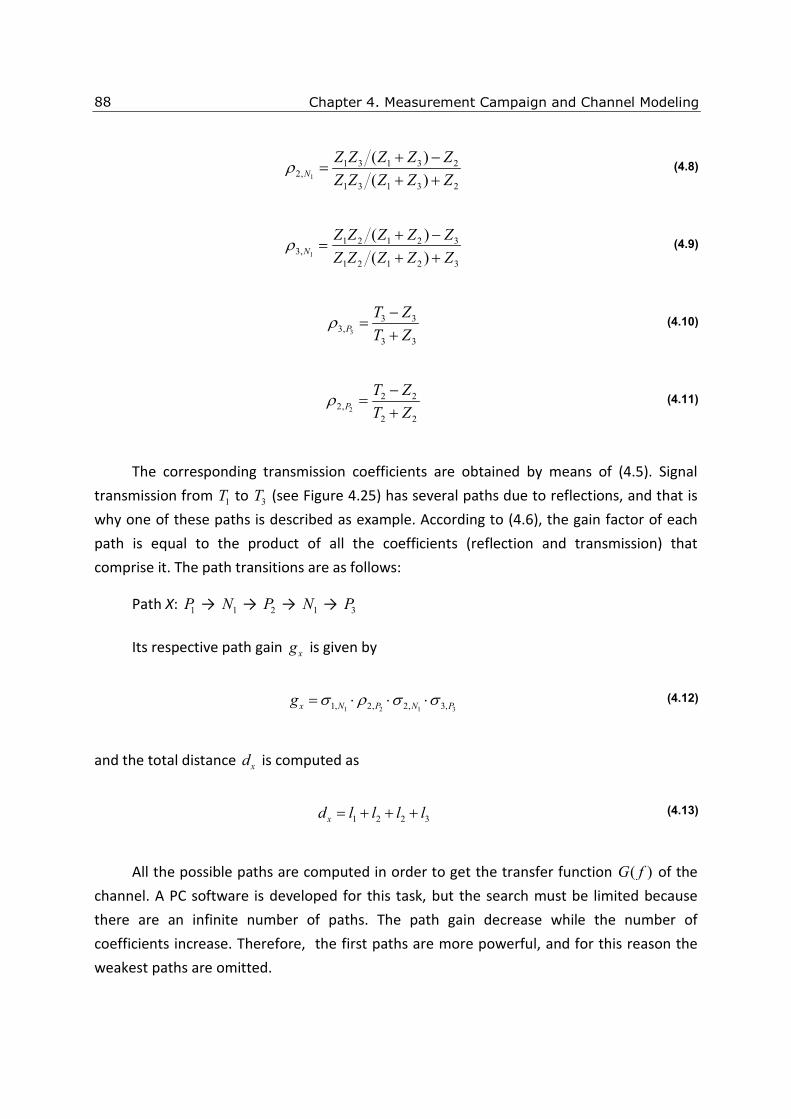
Chapter 4. Measurement Campaign and Channel Modeling
88
1
1 3 1 3 22,
1 3 1 3 2
( )
( )N
Z Z Z Z Z
Z Z Z Z Zρ
+ −=
+ + (4.8)
1
1 2 1 2 33,
1 2 1 2 3
( )
( )N
Z Z Z Z Z
Z Z Z Z Zρ
+ −=
+ + (4.9)
3
3 33,
3 3
P
T Z
T Zρ
−=
+ (4.10)
2
2 22,
2 2
P
T Z
T Zρ
−=
+ (4.11)
The corresponding transmission coefficients are obtained by means of (4.5). Signal
transmission from 1T to 3T (see Figure 4.25) has several paths due to reflections, and that is
why one of these paths is described as example. According to (4.6), the gain factor of each
path is equal to the product of all the coefficients (reflection and transmission) that
comprise it. The path transitions are as follows:
Path X: 1P → 1N → 2P → 1N → 3P
Its respective path gain xg is given by
1 2 1 31, 2, 2, 3,x N P N Pg σ ρ σ σ= ⋅ ⋅ ⋅ (4.12)
and the total distance xd is computed as
1 2 2 3xd l l l l= + + + (4.13)
All the possible paths are computed in order to get the transfer function ( )G f of the
channel. A PC software is developed for this task, but the search must be limited because
there are an infinite number of paths. The path gain decrease while the number of
coefficients increase. Therefore, the first paths are more powerful, and for this reason the
weakest paths are omitted.

Chapter 4. Measurement Campaign and Channel Modeling
89
One must take into account that the expression (4.3) is the frequency–domain ratio of
the channel’s output voltage to the voltage injected into the line by an ideal generator. In
the case of a practical power–line network, as shown in Figure 4.26, calculation of the
transfer function between any two communicating devices involves an additional scaling
factor, which includes the non–ideal characteristics of the transmission system
[Anastasiadou and Antonakopoulos, 2005]. Since the transfer function of a point–to–point
channel represents the ratio of the steady state voltages measured at the two
communicating ends, another scaling factor has to be added, relating the incoming source
voltage to the total voltage measured at the transmission end, which comprises the injected
signal and the sum of all signal components that are reflected toward the source.
Figure 4.26 Non–ideality of the source
As a result, the following expression is derived for the transfer function of the channel,
which is calculated as the ratio of the voltages measured at the two communicating
termination points
11
1 1
( ) ( )rx in
tx in
V Z TZT f G f
V Z T Z
+= = ⋅ ⋅
+ (4.14)
where inZ is the total input impedance seen by the transmitter in steady state. However, the
transfer function is scaled for simulation in order to get a lossless channel, and the scaling
factor can therefore be omitted. Channel impulse response ( )g τ can be written as
[ ] ( )21( ) F ( ) ( ) cj f f
c cg G f f G f f e dfπ ττ +−= + = + ⋅ ⋅∫ (4.15)
where [ ]1F− ⋅ is the inverse Fourier transformation function. For a given signal bandwidth B,
and under the assumption of 2cf B> , the channel impulse response can be expressed as

Chapter 4. Measurement Campaign and Channel Modeling
90
( )2
2
2
( ) 2 ( ) c
B
j f f
c
B
g G f f e dfπ ττ +
−
= ⋅ + ⋅ ⋅∫ (4.16)
From (4.3), the impulse response ( )g τ is written as
( ) ( ) ( )0 1
22 /( ) 2
12
( ) 2k
c i pc i c
B Npj f f d va a f f d j f f
i
iB
g g e e e dfπ π ττ − +− + + +
=
= ⋅ ⋅ ⋅ ⋅ ⋅∑∫ (4.17)
The channel impulse response function can simplified taking the exponent of the
attenuation factor k = 1, then after some operations the impulse response is obtained as
( ) 1
0
2 22
1 2
( ) 2
i ic
pi
d a dBNp j f fv ja d
i
i B
g g e e dfπ τ
πτ
− + + −
− ⋅
=
= ⋅ ⋅ ⋅∑ ∫ (4.18)

Chapter 4. Measurement Campaign and Channel Modeling
91
( ) 1
0
2
22
11
2
( ) 2
22
i ic
p
i
B
d a dj f f
v jNpa d
i
ii i
pB
eg g e
d a dj
v j
π τπ
τ
π τπ
− + + −
− ⋅
=
−
= ⋅ ⋅ − + −
∑ (4.19)
( )
0
11
1
21 2 2
1
2 22 2 2
2
( ) 2
4
i
i i ic i c
p p
ii
Nppa d
i
ii
i
p
dB d a dBf j a d j f
v v j
da d j
vg g e
da d
v
e eπ τ π τ
π
π τ
τ
π τ
− ⋅
=
− − − − + + −
− −
= ⋅ ⋅
+ −
× −
∑
(4.20)
Channel impulse response ( )kh t in the time domain, shown in (4.21), is modeled as a
discretized version of (4.20). Hence, the channel is a L–path lossless baseband equivalent
tap–delay filter where k
lh and k
lτ are the complex tap gain and time delay respectively for
the lth path and kth user.
1
0
( ) ( )L
k k k
l l
l
h t h tδ τ−
=
= ⋅ −∑ (4.21)
where ( )δ ⋅ is the Dirac delta function. The complex tap gain k
lh is obtained from (4.20) for a
given time delay τ :
( )k k
l lh g τ= (4.22)
In order to generate a powerline network topology (Figure 4.27), the load and cable
impedances are randomly defined, where open connections are modeled with an impedance
LZ = 1 MΩ. On the hand, the characteristic impedance of each load and cable branch/stub
are modeled statistically based on a normal distribution with mean value of Z = 70 Ω (house
connection cable of the type NAYY35) and standard deviation σ = 7. The same for
branch/stub cable lengths that follow a uniform statistical distribution for a maximum
distance of d = 15 meters.

Chapter 4. Measurement Campaign and Channel Modeling
92
Branch
Stub
Z
ZL
d
Figure 4.27 Network topology
One powerline network topology randomly generated for six simultaneous
transmitting users is shown in Figure 4.28, where a coded application finds all the possible
paths for each user calculating their time delays and gains (transmission and reflection
coefficients).
Figure 4.28 Random network topology
As a result, Figure 4.29 shows the equivalent baseband frequency responses for each
user xT that are transmitting to a receiver located at the outlet R.. The carrier frequency cf
= 14.8 MHz has been randomly selected for bandwidth B = 20 MHz. The channel attenuation
parameters are fixed to 4 1
0 2 10a m− −= ⋅ and 9
1 10a s m−= .
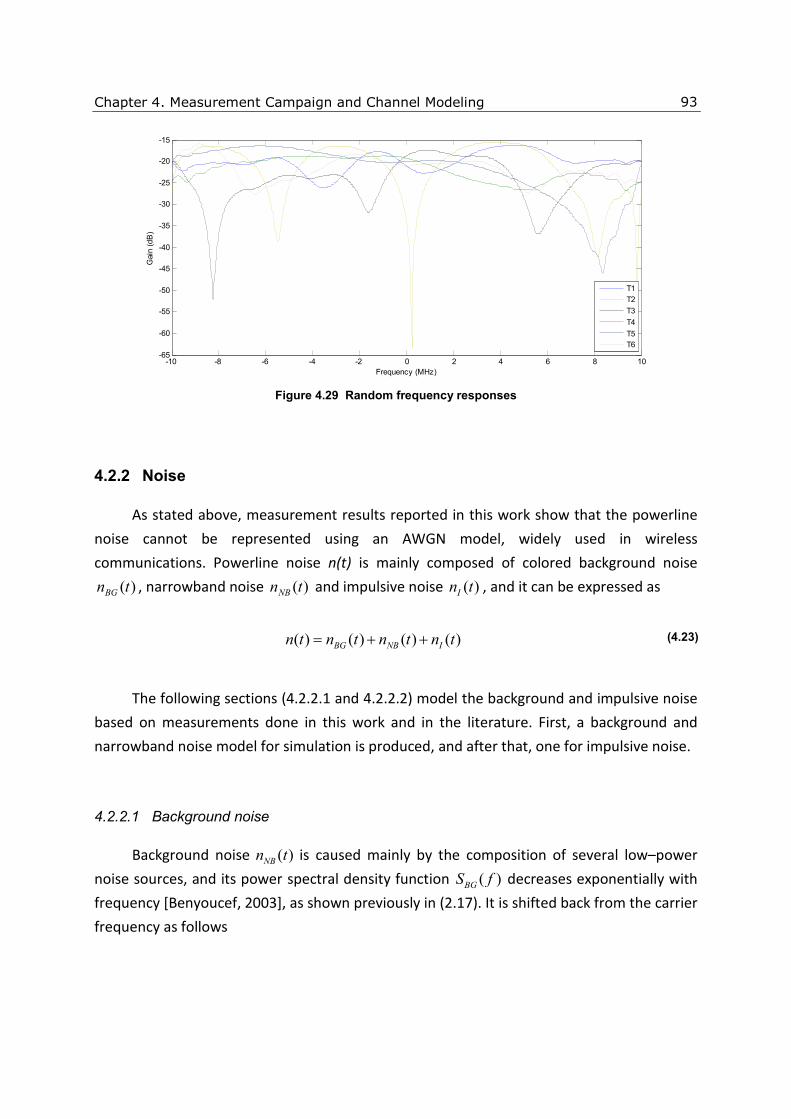
Chapter 4. Measurement Campaign and Channel Modeling
93
-10 -8 -6 -4 -2 0 2 4 6 8 10-65
-60
-55
-50
-45
-40
-35
-30
-25
-20
-15
Frequency (MHz)
Gai
n (d
B)
T1
T2
T3
T4
T5T6
Figure 4.29 Random frequency responses
4.2.2 Noise
As stated above, measurement results reported in this work show that the powerline
noise cannot be represented using an AWGN model, widely used in wireless
communications. Powerline noise n(t) is mainly composed of colored background noise
)(tnBG , narrowband noise )(tnNB and impulsive noise )(tnI , and it can be expressed as
( ) ( ) ( ) ( )BG NB In t n t n t n t= + + (4.23)
The following sections (4.2.2.1 and 4.2.2.2) model the background and impulsive noise
based on measurements done in this work and in the literature. First, a background and
narrowband noise model for simulation is produced, and after that, one for impulsive noise.
4.2.2.1 Background noise
Background noise ( )NBn t is caused mainly by the composition of several low–power
noise sources, and its power spectral density function ( )BGS f decreases exponentially with
frequency [Benyoucef, 2003], as shown previously in (2.17). It is shifted back from the carrier
frequency as follows

Chapter 4. Measurement Campaign and Channel Modeling
94
0/
0 1( ) cf f F
BG cS f f N N e− ++ = + (4.24)
where N0 is the floor constant noise power density, N1 and F0 are the parameters of the
exponential function that are taken from [Benyoucef, 2003], which defines several profiles
depending on the selected scenario.
Table 4.2 Background noise profiles [Benyoucef, 2003]
Table 4.2 summarizes the determined parameters of the background noise as well as
the used probability densities with their values for the regarded environment types
[Benyoucef, 2003].
Narrowband noise ( )NBn t is mostly sinusoidal with modulated amplitudes This type of
noise is caused by multiple broadcast RF emissions coupled in the electrical cables.
Throughout the day, it may vary depending on atmospheric conditions enabling a more
propitious propagation of RF waves. Each radio emission has a Gaussian shaped PSD
[Benyoucef, 2003] and the sum )( fSNB can be written as
2
2
( )
2
1
( )
c i
i
f f fN
B
NB c i
i
S f f A e
+ −−
=
+ = ⋅∑ (4.25)
where iA is the power density, if is the centre frequency, and iB is the interferer
bandwidth. Table 4.3 summarizes some of the already existing services and equipment
operating in the frequency spectrum [1.3–30MHz], where the broadband PLC systems are
also operating. Carrier frequencies if are selected from this data in order to create
narrowband disturbance.

Chapter 4. Measurement Campaign and Channel Modeling
95
Table 4.3 RF services [Hrasnica et al., 2004]
Whereas the power density iA and disturbance bandwidth iB parameters are
summarized in the Table 4.4 with their respective statistical distribution depending on the
scenario and the frequency band, the power spectrum densities of the narrowband and
background noise can be added together as follows
( ) ( ) ( )N NB BGS f S f S f= + (4.26)
2
20
( )
/ 2
0 1
1
( )
c i
c i
f f fN
f f F B
N c i
i
S f f N N e A e
+ −−
− +
=
+ = + + ⋅∑ (4.27)

Chapter 4. Measurement Campaign and Channel Modeling
96
Table 4.4 Narrowband noise profiles [Benyoucef, 2003]
Figure 4.30 shows an example of background and narrowband noise spectrum
composition randomly generated by means of (4.27) and the data provided in Table 4.2,
Table 4.3 and Table 4.4. This kind of noise can be considered as a stationary random process
[Zimmermann and Dostert, 2002a], therefore a linear shift–invariant transformation
of ( )NS f can be applied filtering the signal with spectrum ( )WS f [Therrien, 1992]:
2( ) ( ) ( )N WS f S f H f= (4.28)
The power spectrum density ( )WS f is assumed to be white noise
0( )2
W
NS f = (4.29)
The filter ( )H f is obtained by applying an inverse Fourier transform to the desired
power spectrum density shape by multiplying it by a Hamming window. Figure 4.31 shows

Chapter 4. Measurement Campaign and Channel Modeling
97
the resulting spectrum of the filtered white noise, which matches the model shape from the
Figure 4.30.
0 5 10 15 20 25 30-145
-140
-135
-130
-125
-120
-115
-110
-105
-100
Frequency (MHz)
PS
D (
dBm
/Hz)
Figure 4.30 Randomly generated PSD shape
0 5 10 15 20 25 30-145
-140
-135
-130
-125
-120
-115
-110
-105
-100
PS
D (
dBm
/Hz)
Frequency (MHz)
Figure 4.31 Filtered background noise PSD

Chapter 4. Measurement Campaign and Channel Modeling
98
4.2.2.2 Impulsive noise
Impulsive noise is composed of strong peaks whose duration can vary from
microseconds to a few milliseconds. The time between occurrence events could be periodic
with the electrical network frequency or totally asynchronous. Impulsive noise ( )In t has its
source in switching power electronics components [Zimmermann and Dostert, 2002a] and
may cause burst errors in the transmitted data. Then, the baseband equivalent kth pulse
( )k
In t in the time domain is defined as
,
( ) sin(2 ) ( )ktk
I k k
imp k
tn t A e f t rect
T
ζ π−= ⋅ ⋅ ⋅ (4.30)
where ( )rect ⋅ function is a rectangular shape which is uniform in the interval [0,1],
otherwise is null. kA , kζ , kf , and ,imp kT are the pulse amplitude, time attenuation constant,
oscillation frequency and pulse length, respectively. The parameter inter arrival time ,IAT kT is
defined as the time between two pulse events
, 1IAT k k kT T T −= − (4.31)
where kT and 1kT − are the start time of the kth and (k-1)th pulse, respectively. Its statistical
probability density function (Figure 4.16) is based on the results presented in the section
4.1.2.2, which should be coded as a discrete distribution. The impulsive noise ( )In t of the
impulsive noise is shown in the following expression
2( ) ( ) cj tfk
I I k
k
n t n t T eπ
∞−
=−∞
= − ⋅∑ (4.32)
where cf is the carrier frequency. The pulse is shifted in frequency in order to obtain the
baseband equivalent signal. A binomial probability density function is used to model the
classification of the pulse, as shown in this chapter. A burst pulse ( )k
In t is defined as follows
,
1
( ) ( )vN
k k k
I i imp i
i
n t n t T=
= −∑ (4.33)
where vN is the number of consecutive single pulses, and

Chapter 4. Measurement Campaign and Channel Modeling
99
,
( ) sin(2 ) ( )kitk k
i k i k
imp i
tn t A e f t rect
T
ζ π−= ⋅ ⋅ ⋅ . (4.34)
Parameter Distribution Statistical Parameter
Pulse Kind Binomial p = 0.4812
f (MHz)
Binomial 3f MHz<
p = 0.83
3f MHz≥
p = 0.17
Weibull a = 1.26 b = 2.27
a = 10.91 b = 6.07
A (V) Normal µ = 7.73 σ = 2.97
,imp iT (µs) Weibull a = 5.14 b = 1.22
ζ Normal µ = 0.84
σ = 0.5353
Table 4.5 Single pulse (Nv = 1) statistical parameters [Degardin et al., 2003] and [Val et al., 2007]
Parameter Distribution Statistical Parameter
Pulse Kind Binomial p = 0.5188
vN Uniform discrete /
f (MHz)
Binomial 3if MHz<
p = 0.37
3if MHz≥
p = 0.63
Weibull a = 1.26 b = 2.27
a = 10.91 b = 6.07
i rf F f= ⋅
Normal µ = 1.00 σ = 0.16
A (V) Normal µ = 11.17 σ = 3.87
,imp iT (ms) Rayleigh β = 0.076 / vN
iζ
Weibull
a = 0.60 b = 1.71
Table 4.6 Burst pulse statistical parameters [Degardin et al., 2003] and [Val et al., 2007]

Chapter 4. Measurement Campaign and Channel Modeling
100
Single pulse is a particular case of burst pulse when vN = 1. All the impulsive noise
parameters follow a statistical model obtained from previous measurements done here and
other works. In [Degardin et al., 2003], several impulsive noise measurements have been
carried out, where some results are used to complete the simulation model proposed here.
Figure 4.32 shows the power spectral density of a randomly generated pulse for a
carrier frequency cf = 13.4 MHz and a bandwidth of 16 MHz. It is an example of how these
power levels turn out to be quite damaging for a transmitted signal.
-8 -6 -4 -2 0 2 4 6 8-140
-130
-120
-110
-100
-90
-80
-70
-60
Frequency (MHz)
PS
D (
dBm
/Hz)
Figure 4.32 PSD noise and cf = 13.4MHz

Chapter 4. Measurement Campaign and Channel Modeling
101
4.3 IMPULSIVE NOISE EFFECT
During impulsive noise peaks, information symbols get damaged, so proper coding and
interleaving schemes are needed in order to avoid performance loss. In this work, only
uncoded systems are taken into account. Impulsive noise can be classified into single and
burst pulses, where the latter comprises several single pulses concatenated in time. It is
known that pulse type follows a binomial probability density function defined as
1( ) (1 )x xf x p p −= − (4.35)
where x equal to 0 or 1 represents a single or burst event, respectively, and p is the
probability of being a burst pulse event. The probability of occurrence of impulsive noise
impp is expressed as
[ ]
1 1
, ,
0 0
1 1
, ,
0 0
N N
imp k imp kimpk k
imp N N
IATIAT k IAT k
k k
T T NE T
pE T
T T N
− −
= =− −
= =
= = =∑ ∑
∑ ∑ (4.36)
where impE T and [ ]IATE T are the average time length and inter arrival time of pulse
events. It is reasonable to assume that a user signal PSD is much lower than impulsive noise
PSD. Furthermore, taking into account its high number of harmonics, a pulse event may
affect the entire symbol even if pulse length is shorter than symbol time. The mean time
length of impulsive noise is given by
(1 )BP SP
imp imp impE T pE T p E T′ = + − (4.37)
where BP
impE T and SP
impE T are the average duration time of burst and single pulses,
respectively. In the worst case, each pulse event will destroy at least two symbols as seen in
Figure 4.33. Therefore, this constraint sets an upper bound to the bit error rate. The new
length mean values are
2imp imp SE T E T T′ = + (4.38)

Chapter 4. Measurement Campaign and Channel Modeling
102
Figure 4.33 Impulsive noise effect over received data symbols
The probability of bit error for a powerline system is given as
( ) ( )| (1 ) |e imp impP P e noimpulse event P P e impulse event P= ⋅ − + ⋅ (4.39)
where P(e | no impulse event) is the system probability error in the absence of impulsive
noise, and P(e | impulse event) is the system probability for impulsive noise, which in the
worst case, is equal to one half. Therefore, the BER upper bound can be expressed as
0.5e impP P= .

Chapter 5. Theoretical Analysis 103
5 Theoretical Analysis
Chapter 5
Theoretical Analysis
We consider an uplink asynchronous system with Nu users transmitting simultaneously
over the powerline network. The user delays with respect to the user of interest are
assumed to be i.i.d. and uniformly distributed in [ )0, c cT L and [ )0, s cT L N for DS-CDMA and
MC-CDMA, respectively. Therefore, the received DS-CDMA/MC-CDMA baseband equivalent
signal ( )r t at receiver input is given by
)()()()(1
1
1
0
1
0
0
0 tntxhtxhtruN
k
L
l
klk
k
l
L
l
ll +Λ−−⋅+−⋅= ∑∑∑−
=
−
=
−
=
ττ (5.1)
where kΛ is the time delay of the kth user with respect to the user of interest ( 0 0Λ = ). The
signal comprises the signal of the user of interest (k=0), the MAI term, and the powerline
noise n(t) defined in Chapter 4.

Chapter 5. Theoretical Analysis
104
5.1 SPREADING SEQUENCES
The auto–correlation property of CDMA spreading sequences is an important
parameter to take into account for initial timing synchronization and tracking. However, the
requirement is twofold, because asynchronous CDMA systems need sequences with a
minimum cross–correlation property value to reject the MAI from other users.
Various spreading sequences exist which can be distinguished with respect to
orthogonality and correlation properties, where the selection of the spreading code depends
on the scenario. In the synchronous downlink, orthogonal (or short) spreading codes are of
advantage, since they reduce the multiple–access interference compared with non–
orthogonal sequences. Orthogonal Walsh–Hadamard codes are simple to generate
recursively by using the following Hadamard matrix generation,
2 2
1
2 2
2 , 1, 1L L m
L
L L
C CC L m C
C C
= ∀ = ≥ = −
. (5.2)
The maximum number of available orthogonal spreading codes is L which determines
the maximum number of active users Nu. The Hadamard matrix generation described in (5.2)
can also be used to perform an L–ary Walsh–Hadamard modulation. However, in the
asynchronous link, the orthogonality between the spreading codes gets lost due to different
distortions of the individual codes. Moreover, the degrading effect intensifies in a multipath
environment such as a powerline network.
A short spreading sequence has a periodicity equal to the bit time, while a long
sequence is essentially pseudo–random. In a pseudo–random long code system, the
correlation between the users changes from symbol to symbol, and the MAI therefore
appears to be random in time, causing the performance for different users to be
approximately identical and determined by the average interference level. In other words,
its cyclostationary statistics are reduced from symbol period to chip period. Short codes, on
the other hand, have cross–correlations that remain unchanged over time, and an
unfortunate user might be trapped in an inferior performance scenario due to nontime–
varying cross–correlations. The variability of an asynchronous system performance with
short and long sequences has been studied in [Parkvall, 2000], where the short code system
presents a higher performance variability compared with long code system. As shown in
Chapter 4, powerline frequency response between two outlets may remain static for a time.
Consequently, the interference signal seen by a receiver does not change from symbol to
symbol when short spreading codes are used.
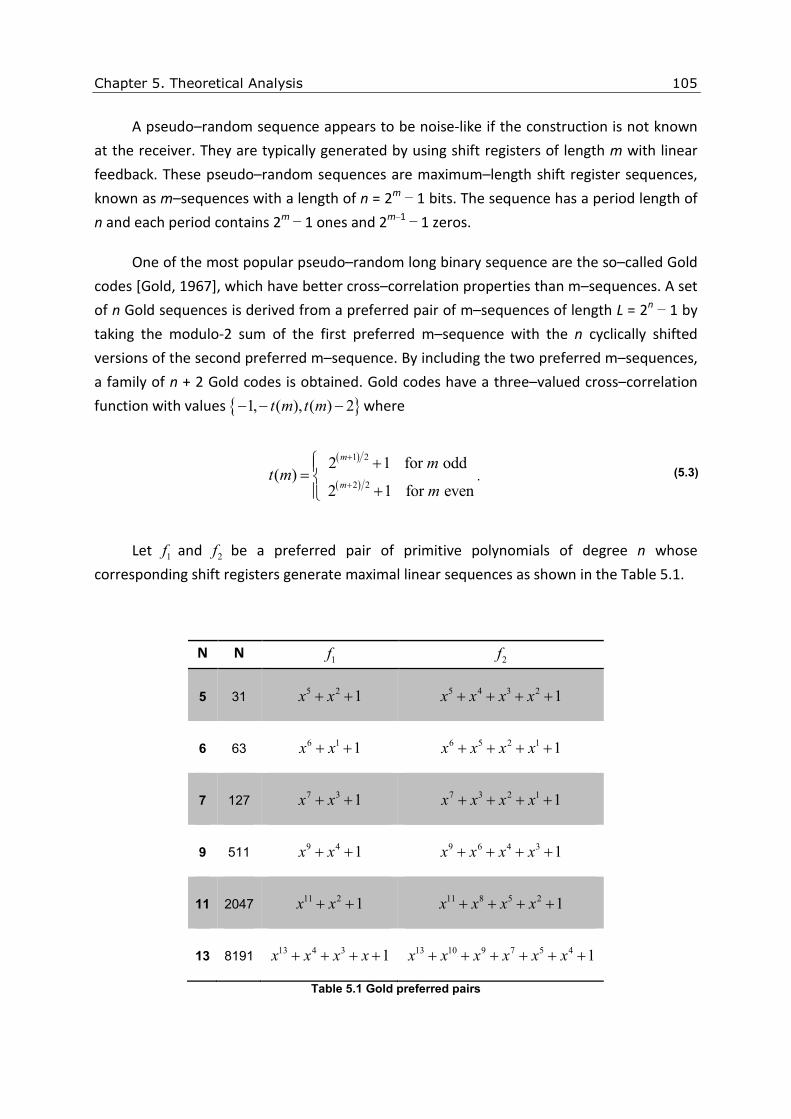
Chapter 5. Theoretical Analysis
105
A pseudo–random sequence appears to be noise-like if the construction is not known
at the receiver. They are typically generated by using shift registers of length m with linear
feedback. These pseudo–random sequences are maximum–length shift register sequences,
known as m–sequences with a length of n = 2m
− 1 bits. The sequence has a period length of
n and each period contains 2m
− 1 ones and 2m−1 − 1 zeros.
One of the most popular pseudo–random long binary sequence are the so–called Gold
codes [Gold, 1967], which have better cross–correlation properties than m–sequences. A set
of n Gold sequences is derived from a preferred pair of m–sequences of length L = 2n − 1 by
taking the modulo-2 sum of the first preferred m–sequence with the n cyclically shifted
versions of the second preferred m–sequence. By including the two preferred m–sequences,
a family of n + 2 Gold codes is obtained. Gold codes have a three–valued cross–correlation
function with values 1, ( ), ( ) 2t m t m− − − where
( )
( )
1 2
2 2
2 1 for odd( )
2 1 for even
m
m
mt m
m
+
+
+= +
. (5.3)
Let 1f and 2f be a preferred pair of primitive polynomials of degree n whose
corresponding shift registers generate maximal linear sequences as shown in the Table 5.1.
N N 1f 2f
5 31 5 2 1x x+ + 5 4 3 2 1x x x x+ + + +
6 63 6 1 1x x+ + 6 5 2 1 1x x x x+ + + +
7 127 7 3 1x x+ + 7 3 2 1 1x x x x+ + + +
9 511 9 4 1x x+ + 9 6 4 3 1x x x x+ + + +
11 2047 11 2 1x x+ + 11 8 5 2 1x x x x+ + + +
13 8191 13 4 3 1x x x x+ + + + 13 10 9 7 5 4 1x x x x x x+ + + + + +
Table 5.1 Gold preferred pairs

Chapter 5. Theoretical Analysis
106
To reduce the MAI, which is one of the main factors decreasing the practical channel
capacity and thus degrading the performance of multiple–access systems, complex
polyphase sequences are better positioned than other binary family codes, such as Walsh
and Gold sequences. These sequences are characterized as having reduced cross–
correlation.
The Song–Park (SP) sequences [Park et al., 2002] are optimized for minimal cross–
correlation value. For each , 1, 2, ,k k L= … , with L an even integer, let consider the
sequence ,0 ,1 , 1, , ,ck k k k Lc c c −=c … of length cL , defined by
cL
lRLlkj
kl ec
)1)2,(()1(22
,
−++
=δ
π
(5.4)
where 0,1, , 1cl L= −… , ( )2 1cL L= + , δ(∙) is the Dirac delta function, and ( , )R a b is the
remainder of a when divided by b . The set 1 2, , , Lc c c… of L sequences is called the
Song–Park (SP) sequence.
On the other hand, the Oppermann (OP) codes [Oppermann and Vucetic, 1997] design
is a trade–off between auto–correlation and cross–correlation properties. Let cL be the
sequence length. Let L take integer values that are relatively prime to cL such that
1 cL L≤ < . For each , 1, 2, ,k k L= … , let consider the sequence ,0 ,1 , 1, , ,ck k k k Lc c c −=c … of
length cL , defined by
, ( 1)
m p n
c
k l lj
Lkl
l kc eπ
+
= − (5.5)
where 0,1, , 1cl L= −… and p, m and n are real numbers. The triple , ,p m n specifies the
sequence set.
Figure 5.1 User even and odd cross–correlation
To fully analyze the performance of a specific kind of sequence coding in a multiuser
environment, one should consider not only the even cross–correlation (ECC) property but
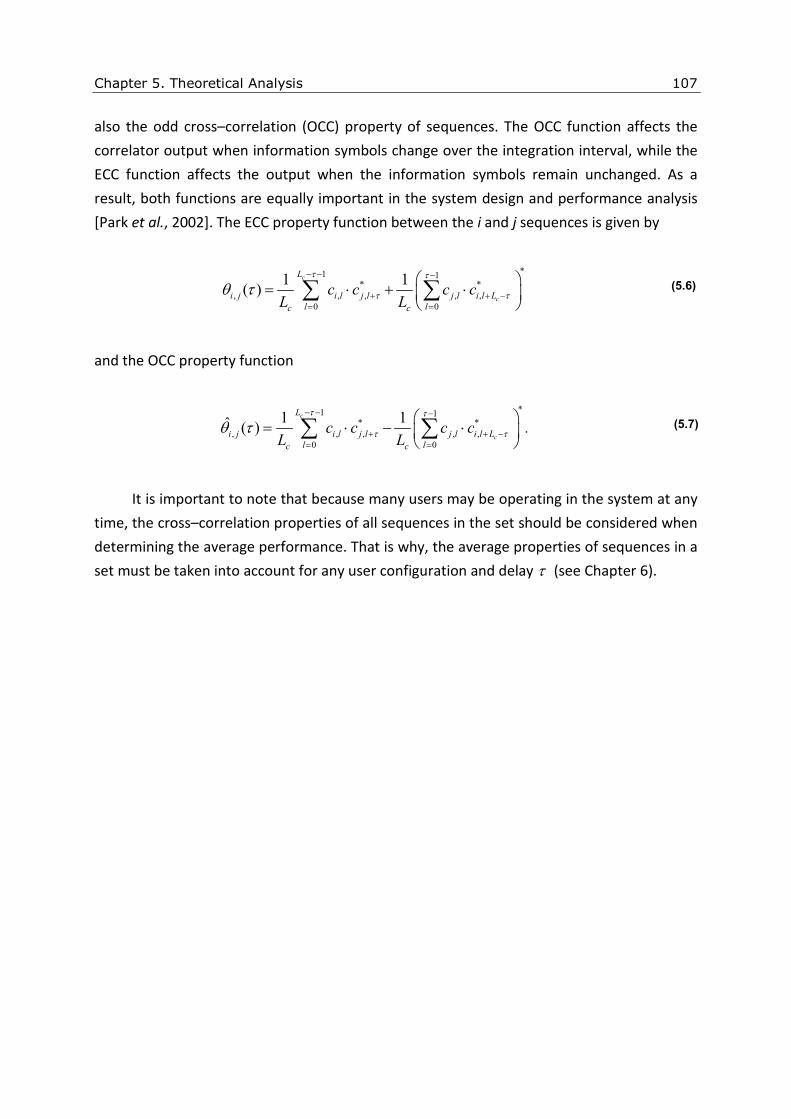
Chapter 5. Theoretical Analysis
107
also the odd cross–correlation (OCC) property of sequences. The OCC function affects the
correlator output when information symbols change over the integration interval, while the
ECC function affects the output when the information symbols remain unchanged. As a
result, both functions are equally important in the system design and performance analysis
[Park et al., 2002]. The ECC property function between the i and j sequences is given by
*1 1* *
, , , , ,
0 0
1 1( )
c
c
L
i j i l j l j l i l L
l lc c
c c c cL L
τ τ
τ τθ τ− − −
+ + −= =
= ⋅ + ⋅
∑ ∑ (5.6)
and the OCC property function
*1 1* *
, , , , ,
0 0
1 1ˆ ( )c
c
L
i j i l j l j l i l L
l lc c
c c c cL L
τ τ
τ τθ τ− − −
+ + −= =
= ⋅ − ⋅
∑ ∑ . (5.7)
It is important to note that because many users may be operating in the system at any
time, the cross–correlation properties of all sequences in the set should be considered when
determining the average performance. That is why, the average properties of sequences in a
set must be taken into account for any user configuration and delay τ (see Chapter 6).

Chapter 5. Theoretical Analysis
108
5.2 ANALYSIS OF ASYNCHRONOUS DS-CDMA SYSTEM
Consider an asynchronous DS-CDMA system with a spreading gain factor cN . The
independent and identically distributed random data symbols of the kth user are mapped on
a QPSK constellation of the vth data multiplex for the mth symbol ,v k
ma with , 1v k
ma = . The
multiple–access scheme is based on joint utilization of short Walsh–Hadamard orthogonal
and long sequences. The data is multiplexed using a set of orthogonal Walsh codes
,1, 2,, , , kV kk kb b b… of length cN for each kth user, and scrambled by means of a long
sequence to better protect them from multipath effects and from interference of other
users. The transmitted DS-CDMA signal of the kth user is expressed by
, ,
,
1
( ) ( )kV
v k v k
k k v m m s
m v
x t P a c t mT∞
=−∞ =
= −∑ ∑ (5.8)
where sT is the symbol time, vkP , is the signal power for the vth data multiplex, and the user
symbol data rate is sk TV . Equation (5.9) shows the sequence waveform of the mth
transmitted symbol for the kth user on the vth data multiplex. The system uses a set of
QNu ≤ sequences 0 1 1, , , Q−c c c… , and each user has a sequence ,0 ,1 , 1, , ,cl l l l Lc c c −=c … of
length cL .
1, ,
,0
( ) ( )c
c
Nv k v k
m p ck p mNp
c t b c g t pT−
+=
= ⋅ −∑ (5.9)
The chip time duration is cT and )(tg is the time–limited transmitter and receiver filter
for the chip pulse shape with a group delay of D/2 chips. The operation k is the modulus
after division of k by the sequence length. The asynchronous DS-CDMA signal analysis for
MMSE receiver is carried out in absence of impulsive noise, which is conducted in the
previous chapter. From (5.1), (5.8) and (5.9) the received DS-CDMA signal ( )r t is as follows
1 1,
,
0 1 0
( ) ( ) ( )u kN V L
k v k k
k v l m l k
k m v l
r t P h c t mT n tτ− ∞ −
= =−∞ = =
= ⋅ − − − Λ +∑ ∑ ∑ ∑ (5.10)
where kΛ is the time delay of the kth user with respect to the user of interest ( 0 0Λ = ),
which are assumed to be i.i.d. and uniformly distributed in [0,LcTc).
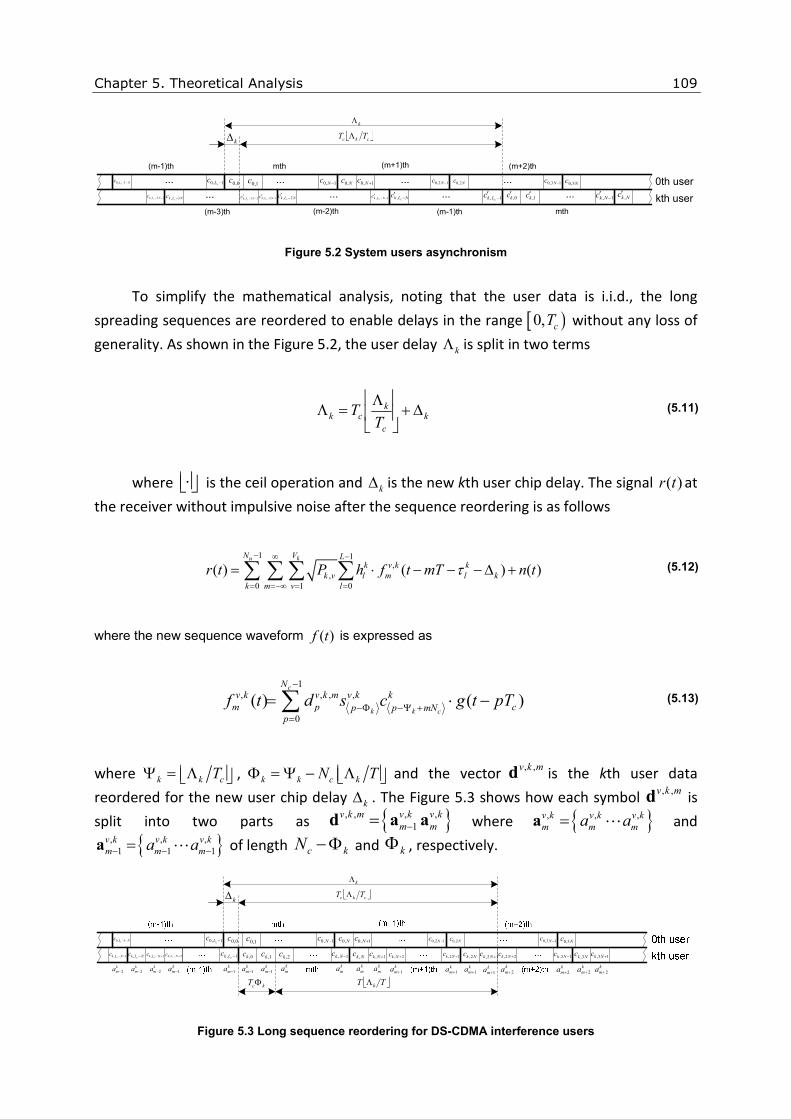
Chapter 5. Theoretical Analysis
109
k∆
... ... ......mth (m+1)th (m+2)th
1,0 −cLc
0,0c 1,0c 1,0 −NcNc ,0 1,0 +Nc 12,0 −Nc Nc 2,0 13,0 −Nc
Nc 3,0
... ... ... ...0,kc′ 1,kc′ 1, −′Nkc Nkc ,
′1, −′
cLkcNLk cc −′
,1, −−′NLk c
cNLk cc 2, −′
ckc TT Λ
kΛ
(m-1)th
NLcc −−1,0
12, −−′NLk c
c22, −−′
NLk ccNLk c
c 3, −13, −− NLk cc
(m-3)th (m-2)th (m-1)th mth
0th user
kth user
Figure 5.2 System users asynchronism
To simplify the mathematical analysis, noting that the user data is i.i.d., the long
spreading sequences are reordered to enable delays in the range [ )0, cT without any loss of
generality. As shown in the Figure 5.2, the user delay kΛ is split in two terms
k
c
kckT
T ∆+
Λ=Λ (5.11)
where ⋅ is the ceil operation and k∆ is the new kth user chip delay. The signal ( )r t at
the receiver without impulsive noise after the sequence reordering is as follows
1 1,
,
0 1 0
( ) ( ) ( )u kN V L
k v k k
k v l m l k
k m v l
r t P h f t mT n tτ− ∞ −
= =−∞ = =
= ⋅ − − − ∆ +∑ ∑ ∑ ∑ (5.12)
where the new sequence waveform ( )f t is expressed as
1, , , ,
0
( ) ( )c
k k c
Nv k v k m v k k
m p cp p mNp
f t d s c g t pT−
−Φ −Ψ +=
= ⋅ −∑ (5.13)
where k k cTΨ = Λ , k k c kN TΦ = Ψ − Λ and the vector , ,v k md is the kth user data
reordered for the new user chip delay k∆ . The Figure 5.3 shows how each symbol , ,v k md is
split into two parts as , , , ,
1
v k m v k v k
m m−=d a a where , , ,v k v k v k
m m ma a=a ⋯ and
, , ,
1 1 1
v k v k v k
m m ma a− − −=a ⋯ of length c kN − Φ and kΦ , respectively.
k∆
k
mak
ma 1−k
mak
ma 1−k
ma 1−k
ma 1−k
ma 2−k
ma 2−k
ma 2−k
mak
ma 1+k
ma
0,kc 1,kc 2,kc 1, −Nkc Nkc
, 1, +Nkc 12, +Nkc Nkc 2, 13, −Nkc1, −cLkc
1,0 −cLc
0,0c 1,0c 1,0 −Nc Nc ,0 1,0 +Nc 12,0 −Nc Nc 2,0 13,0 −NcNc 3,0
Nkc 3,12, +Nkc
k
ma 1+k
ma 1+k
ma 2+k
ma 2+k
ma 2+
ckc TT Λ
kΛ
k
ma 2+k
ma 1+
2, +Nkc 22, +Nkc
NLcc −−1,0
NLk cc −, 1, +−NLk c
c13, +Nkc2, +−NLk c
c1, −−NLk cc
TT kΛkcT Φ
Figure 5.3 Long sequence reordering for DS-CDMA interference users
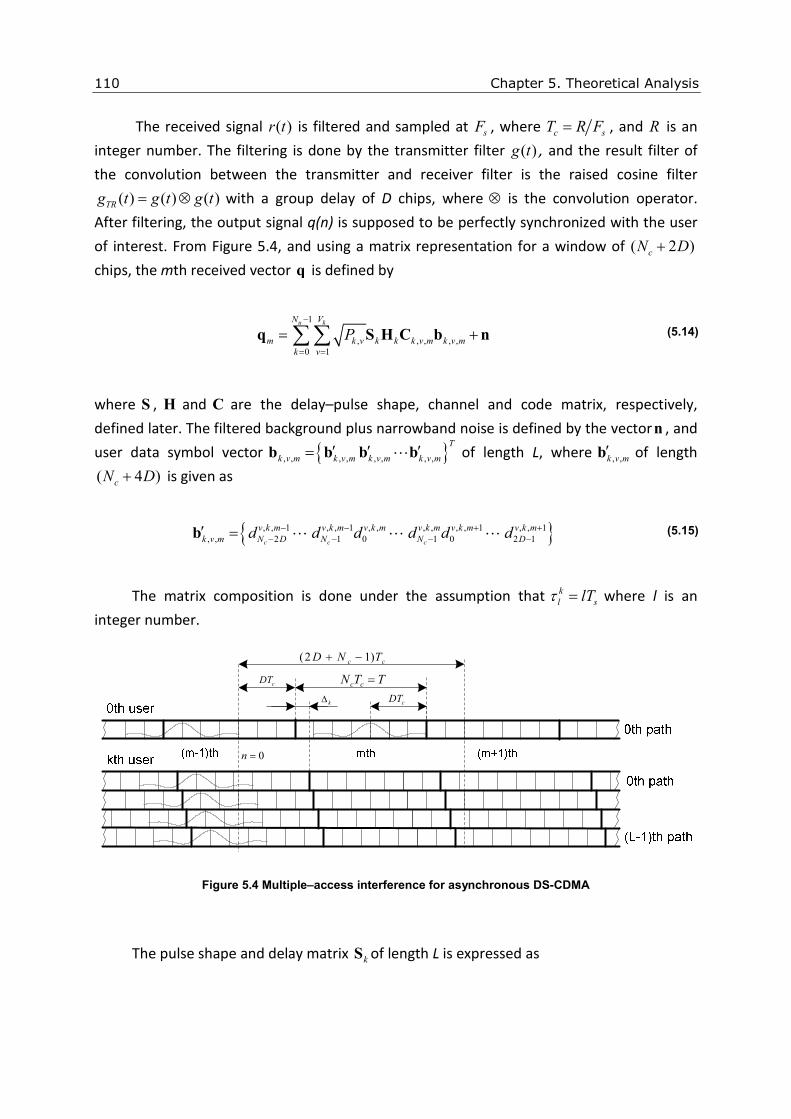
Chapter 5. Theoretical Analysis
110
The received signal ( )r t is filtered and sampled at sF , where c sT R F= , and R is an
integer number. The filtering is done by the transmitter filter ( )g t , and the result filter of
the convolution between the transmitter and receiver filter is the raised cosine filter
( ) ( ) ( )TRg t g t g t= ⊗ with a group delay of D chips, where ⊗ is the convolution operator.
After filtering, the output signal q(n) is supposed to be perfectly synchronized with the user
of interest. From Figure 5.4, and using a matrix representation for a window of ( 2 )cN D+
chips, the mth received vector q is defined by
1
, , , , ,
0 1
u kN V
m k v k k k v m k v m
k v
P−
= =
= +∑ ∑q S H C b n (5.14)
where S , H and C are the delay–pulse shape, channel and code matrix, respectively,
defined later. The filtered background plus narrowband noise is defined by the vectorn , and
user data symbol vector , , , , , , , ,
T
k v m k v m k v m k v m′ ′ ′=b b b b⋯ of length L, where , ,k v m
′b of length
( 4 )cN D+ is given as
, , 1 , , 1 , , , , , , 1 , , 1
, , 2 1 0 1 0 2 1c c c
v k m v k m v k m v k m v k m v k m
k v m N D N N Dd d d d d d− − + +− − − −′ =b ⋯ ⋯ ⋯ (5.15)
The matrix composition is done under the assumption that k
l slTτ = where l is an
integer number.
k∆
cDT
cc TND )12( −+
cDT
TTN cc =
0=n
Figure 5.4 Multiple–access interference for asynchronous DS-CDMA
The pulse shape and delay matrix kS of length L is expressed as
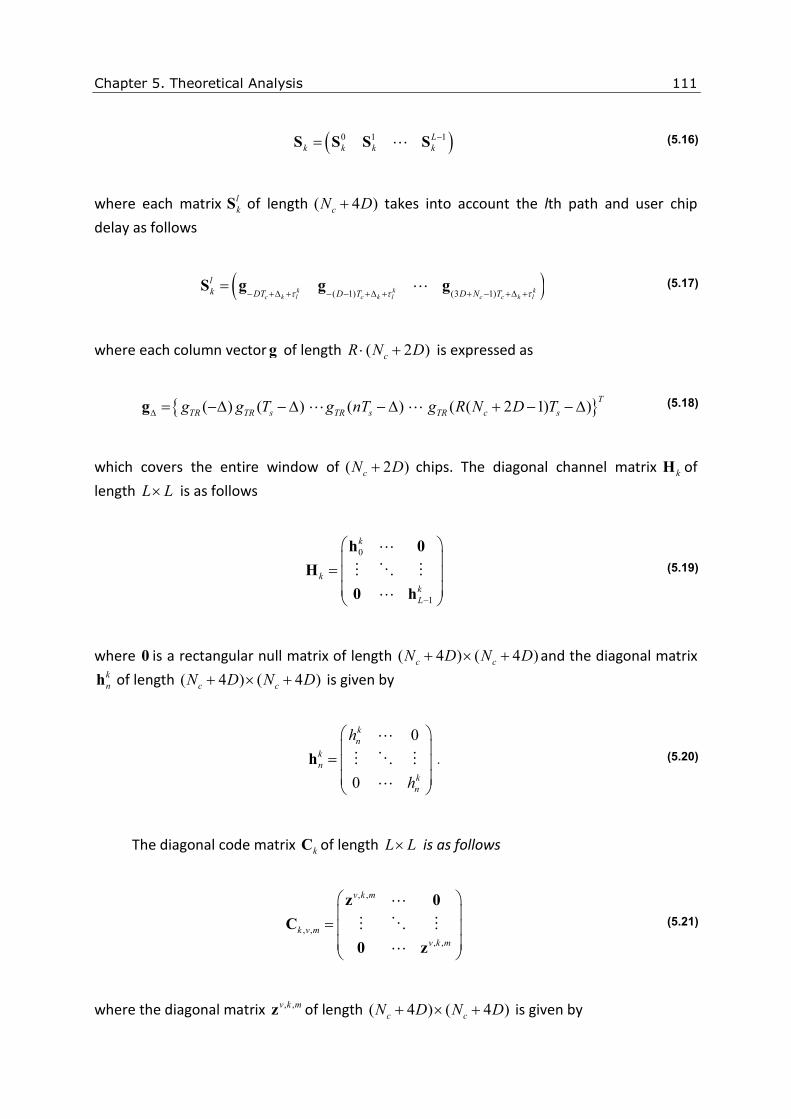
Chapter 5. Theoretical Analysis
111
( )0 1 1L
k k k k
−=S S S S⋯ (5.16)
where each matrix l
kS of length ( 4 )cN D+ takes into account the lth path and user chip
delay as follows
( )( 1) (3 1)k k kc k l c k l c c k l
l
k DT D T D N Tτ τ τ− +∆ + − − +∆ + + − +∆ +=S g g g⋯ (5.17)
where each column vectorg of length ( 2 )cR N D⋅ + is expressed as
( ) ( ) ( ) ( ( 2 1) )T
TR TR s TR s TR c sg g T g nT g R N D T∆ = −∆ − ∆ − ∆ + − − ∆g ⋯ ⋯ (5.18)
which covers the entire window of ( 2 )cN D+ chips. The diagonal channel matrix kH of
length L L× is as follows
0
1
k
k
k
L−
=
h 0
H
0 h
⋯
⋮ ⋱ ⋮
⋯
(5.19)
where 0 is a rectangular null matrix of length ( 4 ) ( 4 )c cN D N D+ × + and the diagonal matrix k
nh of length ( 4 ) ( 4 )c cN D N D+ × + is given by
0
0
k
n
k
n
k
n
h
h
=
h
⋯
⋮ ⋱ ⋮
⋯
. (5.20)
The diagonal code matrix kC of length L L× is as follows
, ,
, ,
, ,
v k m
k v m
v k m
=
z 0
C
0 z
⋯
⋮ ⋱ ⋮
⋯
(5.21)
where the diagonal matrix , ,v k mz of length ( 4 ) ( 4 )c cN D N D+ × + is given by

Chapter 5. Theoretical Analysis
112
, ,
2
, ,
2 1, ,
, ,
2 1
0 0
0 0
0 0c
v k m
D
v k m
Dv k m
v k m
D N
z
z
z
−
− +
− +
=
z
⋯
⋯
⋮ ⋮ ⋱ ⋮
⋯
(5.22)
where , , ,
k k c
v k m v k k
i i i mNz s c−Φ −Ψ += . Since the MMSE receiver equalizes the received signal at chip–
level, thus minimizing the mean square error of the symbol estimation. The cost function J to
minimize is
( )
−=
20,0
mm
H aEJ qww (5.23)
where ( )H⋅ is the Hermitian operation and 0w is the optimal solution given as
2
0 min HE a = − ww w q . (5.24)
Remembering that the user data a is i.i.d., it should be noted that
( ), ,1, for , ,
0, otherwise
Hi k j l
n m
n m i j k lE a a
= = = = . (5.25)
So, by substituting (5.14) in (5.23), it can be shown that
( ) ( ) ( )
( ) ( )
0,0 0,0
0,0 0,0 0,0 0,0
HH H
m m m m
H HH H H H
m m m m m m m m
J E a a
E E a a E a E a
= − ⋅ −
= + − −
w w q w q
w q q w w q q w
. (5.26)
Analyzing the Equation (5.26) term by term, it can be found that
( ) ( ) ( )
( )
10,0 0,0 0,0
, , , ,
0 1
0,0
0 0 0,0, 0,0, 0 0 0,0,
u kN VH H H
m m k k k v m k v m m m
k v
H
m m m m
E a E a E a
E a
−
= =
= +
′= =
∑ ∑q S H C b n
S H C b S H C
(5.27)
and

Chapter 5. Theoretical Analysis
113
10,0 0,0 0,0
, , , ,
0 1
0,0
0,0, 0,0, 0 0 0,0, 0 0
u kN VH H H H H
m m m k v m k v m k k m
k v
H H H H H H H
m m m m
E a E a E a
E a
−
= =
= +
′ = =
∑ ∑q b C H S n
b C H S C H S
(5.28)
where 0,0
0,0, 0,0, 0,0,
H
m m m mE a′ = C C b and the correlation matrix R is given as
1 1
, , , , , , , ,
0 0
u k
H
m m
N VH H H H H
k k k v m k v m k v m k v m k k
k v
E
E E− −
= =
=
= + ∑ ∑
R q q
S H C b b C H S nn (5.29)
where HE nn is the correlation matrix of the filtered background noise. Therefore, by
substituting (5.27), (5.28) and (5.29) in (5.26), the cost function J is shown as
( ) ( )0 0 0,0,1 2HH
mJ ′= + −w w Rw S H C w . (5.30)
From (5.24) and (5.30) the optimal filter solution can be written in the form
( ) 1
0,0 0 0 0,0,( )H
mm −′=w S H C R . (5.31)
The mean square error for a given mth symbol can be written as
( )0,0 0,0 0,0 0 0 0,0, 0,0( ) ( ) 1 2HH
mMSE m J w ′= = + −w Rw S H C w (5.32)
and the relation between the SNR and mean square error (MSE) is given by 1(1 )MSE SNR −= + . Moreover, the standard Gaussian approximation (SGA) is used to
evaluate the BER performance, which relies on the observation that MAI is caused by the
sum of a large number of signals, so the MAI term can be seen as zero mean valued Gaussian
noise, applying the central limit theorem (CLT) to the sums of random variables in the
expression of (5.29). A large number of multipath components and simultaneous users in the
system are necessary to achieve good accuracy with the SGA method. The signal–to–
interference plus noise ratio 0,0SINR at the output of the receiver is presented as
Chapter 5. Theoretical Analysis
114
( )( )
0,0 0,0 0 0 0,0, 0,0
0,0
0,0 0,0 0 0 0,0, 0,0
2( )
1 2
HH
m
HH
m
SINR m′−
=′+ −
w Rw S H C w
w Rw S H C w. (5.33)
Assuming that the long sequences are finite and the MAI term is repeated along the
time, the average probability bit error in absence of impulsive noise is defined as
( ) ( )0,0|P e noimpulse event E Q SINR = (5.34)
where ( )Q ⋅ is given as
2
21
( )2
u
xQ x e du
π
∞ −= ∫ (5.35)
From (4.39), the probability bit error rate for an asynchronous DS-CDMA system under
impulsive noise is as follows
( )[ ]impimpe PPSINRQEP ⋅+−⋅=
2
1)1(0,0 . (5.36)

Chapter 5. Theoretical Analysis
115
5.3 ANALYSIS OF ASYNCHRONOUS MC-CDMA SYSTEM
An asynchronous MC-CDMA system is considered with a spreading gain factor of N ,
which is the number of OFDM subcarriers. The independent and identically distributed
random data symbols of the kth user are mapped on a QPSK constellation of the vth data
multiplex for the mth symbol kv
ma,
with 1, =kv
ma . The same DS-CDMA multiple–access
scheme is used here. The data is multiplexed using a set of N length orthogonal Walsh codes
,1, 2,, , , kV kk kb b b… for each kth user. The transmitted MC-CDMA signal of kth user can be
written as
12 ( ), ,
, ,1 0
1( ) ( )
k
p
V Nj f d tv k v k
k s k v m p k p mNm v p
x t p t mT P a b c eN
π∞ −
+=−∞ = =
= − ⋅ ⋅∑ ∑ ∑ (5.37)
where vkP , is the signal power, )(tp is the rectangular pulse shape in the interval [ )TTG ,− ,
T is the OFDM symbol length, Tpf p = is the frequency of the pth subcarrier, GT is the
guard interval of the symbol which is longer than the maximum multipath channel delay
MAXT , and TTT Gs += is the complete symbol length. The interval guard in the form of CP is
expressed as
+<≤−
<≤−−+=
TmTtmTmTt
mTtTmTmTTttd
sss
sGss)()( (5.38)
The system uses a set of QNu ≤ sequences 0 1 1, , , Q−c c c… , and each user has a
sequence ,0 ,1 , 1, , ,cl l l l Lc c c −=c … of length cL . The user symbol data rate is sk TV . From
(5.1) and (5.37), the received MC-CDMA signal ( )r t is as follows
1 1, ,
20 1 0
12 ( ),
,0
( ) ( )
( )
u k
p l k
N V Lk v v k k
m l l k s
k m v l
Nj f d tv k
p k p mNp
Pr t a h p t mT
N
b c e n tπ τ
τ− ∞ −
= =−∞ = =
−− −Λ
+=
= ⋅ − − Λ −
× ⋅ ⋅ +
∑ ∑ ∑ ∑
∑ (5.39)
where kΛ is the time delay of the kth user with respect to the user of interest ( 0 0Λ = ),
which are assumed to be i.i.d. and uniformly distributed over [ )0, s cT L N . The asynchronous
MC-CDMA analysis is carried out in absence of impulsive noise. To simplify the mathematical
analysis, noting that the user data is i.i.d., the long spreading sequences are reordered to

Chapter 5. Theoretical Analysis
116
enable delays in the range [ )sT,0 without any loss of generality. The user delay is split in two
terms
kk s k
s
TT
ΛΛ = + ∆
(5.40)
where ⋅ is the floor operation and k∆ is the new user delay for a given kth user, as shown
in Figure 5.5.
Previous studies analyzed the effect of MAI on OFDMA [Myonghee et al., 2003] and on
MC-CDMA [Kyunbyoung et al., 2002; Kyunbyoung et al., 2005] using the frequency–domain
channel transfer function. Although this approach simplifies the analysis, it cannot explicitly
present the mechanism relating ISI and ICI to MAI. In contrast to previous studies, this work
analyzes the interference in the time–domain for greater accuracy. From (5.39), after the
sequence reordering, the signal at the receiver without impulsive noise is given as
1 1, ,
20 1 0
12 ( ),
,0
( ) ( )
( )
u k
p l k
k
N V Lk v v k k
m l l k s
k m v l
Nj f d tv k
p k p mNp
Pr t a h p t mT
N
b c e n tπ τ
τ− ∞ −
= =−∞ = =
−− −∆
−Ψ +=
= ⋅ − − ∆ −
× ⋅ ⋅ +
∑ ∑ ∑ ∑
∑
(5.41)
where the code delay skk TN Λ=Ψ .
kΛ
k∆
1,, −+Ψ−Ψ− NLkLk kckccc ⋯
NT ksΨ
1,00,0 −Ncc ⋯ 12,0,0 −NN cc ⋯ 13,02,0 −NN cc ⋯
TGT
Figure 5.5 Long sequence reordering for MC-CDMA interference users
Performance analysis is done for MRC receiver, and equal gain combining (EGC)
receiver is avoided due to its worst performance [Xiang and Tung Sang, 1999]. The MRC
output for the mth symbol in perfect time synchronization with the user of interest (k=0) and
xth multiplex is given by

Chapter 5. Theoretical Analysis
117
( )1 *
2 ( )* ,0
0 0 0,0
( ) ( ) ( )S
i S
S
mT TNj f t mTx x
i i i mNi mT
Z m H f b c r t e dtπ+−
− −+
=
= ⋅∑ ∫ . (5.42)
The signal from (5.41) sampled at TNTc =1 is expressed as
1 1, ,
20 1 0
1 2 ( ),
,0
( ) ( )
( )
u k
c l kc
N V Lk v v k k
m l c l k s
k m v l
pN j d nTNTv k
p k p mNp
Pr n a h p nT mT
N
b c e n nπ τ
τ− ∞ −
= =−∞ = =
− − −∆
+=
= ⋅ − − ∆ −
× ⋅ ⋅ +
∑ ∑ ∑ ∑
∑ (5.43)
and the receiver output is given as
( )11 2
,0
0 0. 0,0
0. ,
( ) ( )
( ) ( ) ( ) ( )
s
S
niN mNN jx x N
i i i mNi n mN
x I x
Z m H b c r n e
D m D m MAI m m
π
η
− +− ∗ −∗+
= =
= ⋅ ⋅ ⋅
= + + +
∑ ∑ (5.44)
where )(, pkpk fHH = , xD .0 is the desired output xth data multiplex, xID , is the interference
from the user of interest data multiplexes, MAI is the interference term from other users,
and η is assumed to be zero mean–valued complex Gaussian noise given by
( )11 2
,0
0. 0,0
( ) ( )S
S
niN mNN jx N
i i i mNi n mN
m H b c n n eπ
η− +− ∗ −∗
+= =
= ⋅ ⋅ ⋅∑ ∑ (5.45)
and the noise variance is expressed as
[ ]1 1
0 0
( ) ( ) ( , ) ( , )N N
k i
Var E n k n i M k m M i mη− −
∗ ∗
= =
= ⋅ ∑∑ (5.46)
where ( ) ( )E n k n i∗ ⋅ is the correlation of the background and narrowband noise from their
PSD defined in Chapter 4, and

Chapter 5. Theoretical Analysis
118
( )1 2
,0
0. 0,0
( , )kiN j
x Ni i i mN
i
M k m H b c eπ− ∗ −∗
+=
= ⋅∑ (5.47)
The desired user signal 0D for the xth data multiplex is expressed as
12
,0
0, 0, 0,
0
( )N
x
x m x p
p
D m a P H−
=
= ∑ (5.48)
and its variance is defined as
21
2
0, 0, 0.
0
N
x x p
p
Var D P H−
=
=
∑ . (5.49)
The data multiplex interference ID for the user of interest is given as
12
,0 ,0 ,0
, 0, 0.
1; 0
( )kV N
v x v
I x m v p p p
v v x p
D m a P b b H−
= ≠ =
= ∑ ∑ (5.50)
and its variance is defined as
21
2,0 ,0
, 0, 0.
1; 0
kV Nx v
I x v p p p
v v x p
Var D P b b H−
= ≠ =
=
∑ ∑ (5.51)
TTG
mth Symbol(m-1)th Symbol (m+1)th Symbol
0th path
(L-1)th path
0th user
kth user
k∆
lτ
2=kl
SmTt =
( ) Gkl T−∆+τ
)(0
1 mMAI
)(0
2 mMAI)(1 mMAI −
0th path
(L-1)th path
Figure 5.6 Multiple–access interference for asynchronous MC-CDMA
From Figure 5.6, the received multiple–access interference MAI can be broken down
into

Chapter 5. Theoretical Analysis
119
)()()()( 10
2
0
1 mMAImMAImMAImMAI −++= (5.52)
where 1−MAI is the ISI from the previous symbol, 0
1MAI and 0
2MAI are the ICI from the
same symbol. These three terms can be expressed as
( )1 1
0 ,0 1
1 0. 0,1 0
( ) ( , )uN N
x
i i ki mNk i
MAI m H b c M m i− − ∗
∗+
= =
= ⋅∑ ∑ (5.53)
( )1 1
0 ,0 2
2 0. 0,1 0
( ) ( , )uN N
x
i i ki mNk i
MAI m H b c M m i− − ∗
∗+
= =
= ⋅∑ ∑ (5.54)
( )1 1
1 ,0 1
0. 0,1 0
( ) ( , )uN N
x
i i ki mNk i
MAI m H b c M m i− − ∗
− ∗ −+
= =
= ⋅∑ ∑ (5.55)
where
1 1 1 2 ( ( ) ),1 , ,
,21 0 0
( , )k k S c l k
c
S
p niV l N mN N j d nTk v NT Nv k k v k
k m l p k p mNv l n mN p
PM m i a h b c e
N
π τ− − + − − −∆ −
+= = = =
= ⋅ ⋅∑ ∑ ∑ ∑ (5.56)
11 1 2 ( ( ) ),2 , ,
,21 ( ) 0
( , )k S c l k
c
k k S
p niV N mNL N j d nTk v NT Nv k k v k
k m l p k p mNv l l n n l mN p
PM m i a h b c e
N
π τ− +− − − −∆ −
+= = = + =
= ⋅ ⋅∑ ∑ ∑ ∑ (5.57)
( ) 11 1 2 ( ( ) ),1 , ,
1 , ( 1)21 0
( , )k k S c l k s
c
k S
p niV n l mNL N j d nT Tk v NT Nv k k v k
k m l p k p m Nv l l n mN p
PM m i a h b c e
N
π τ− +− − − −∆ + −−
− + −= = = =
= ⋅ ⋅∑ ∑ ∑ ∑ (5.58)
It is clear from Figure 5.6 that kl is the channel path that starts introducing ISI,
defined as
1 0
0 0
G k MAX
k G k c G k MAX
G k
L T T
l N T T T
T
− ∆ >
= − ∆ + ≤ − ∆ ≤ − ∆ <
(5.59)
where MAXT is the maximum channel delay defined as )max( k
lMAXT ζ= , GN is the number of
points for the OFDM interval guard expressed as cGG TTN = and )(lnk is the sample where

Chapter 5. Theoretical Analysis
120
there is no more ISI defined as ( )( )k l k c Gn l T Nτ= + ∆ − , with ⋅ as the ceil operation.
The variance of the MAI term is given as
[ ] ( )1 1 1
1 1 2 2 1 1
1 0 0
( ) ( ) ( ) ( ) ( ) ( )uN N N
k k k k k k
k k i
Var MAI M k M i M k M i M k M i− − −
− − ∗ ∗ ∗
= = =
= + +∑ ∑∑ . (5.60)
Assuming that ICI and ISI signals are jointly Gaussian distributed, SGA is used to assess
the BER performance, which relies on the observation that MAI is caused by the sum of a
large number of signals, thus the MAI term can be seen as zero mean–valued Gaussian noise
[Hoque et al., 2007]. The signal–to–interference plus noise ratio 0SINR at the receiver
output for a given powerline network is expressed as
[ ][ ] [ ] [ ]
0
0
I
Var DSINR
Var MAI Var D Var η=
+ + . (5.61)
Assuming that long sequences are periodic, and that the MAI term is repeated through
time, the average probability bit error in the absence of impulsive noise is defined as
( ) ( )0|P e noimpulse event E Q SINR = (5.62)
where )(⋅Q is defined in (5.35). From (4.39), and like in the case of DS-CDMA system, the
probability bit error rate for a MC-CDMA system under impulsive noise is defined as
( )0
1(1 )
2e imp impP E Q SINR P P = ⋅ − + ⋅
. (5.63)

Chapter 6. Performance Analysis 121
6 Performance Analysis
Chapter 6
Performance Analysis
In previous chapters the term Smart Grid was introduced, which leads to the Home
Area Network (Home Grid) in order to communicate among the home appliance devices and
smart grid, where the primary means of communication is powerline networking in
collaboration with fixed wireless links. The powerline communication system must be robust
and reliable in very hostile environments, where the transmitted signal suffers from
multipath distortion, narrowband and impulsive noise. Performance feature must also be
added to the system specification, in order to achieve medium data rates. Table 2.4
summarizes the smart grid PLC modem characteristics.
The power line is a shared medium between all the devices connected to the network.
Therefore, multiple–access techniques must be employed in order to divide transmitted
signals, which have to be orthogonal to each other. there is a need to implement simple
systems, where all the users access the medium asynchronously without the coordination of
any central node, where TDMA, FDMA and multi–carrier schemes are in disadvantage with
respect to single carrier CDMA techniques. In order to compare the performance of such
systems, the performance of a multi–carrier CDMA scheme is also analyzed. So as to
decrease power consumption and overall cost, low complexity systems must be developed.
This work avoids complex joint detection techniques at the receiver, such as multi–user
detection and parallel interference cancellers, and focuses on single–user detection

Chapter 6. Performance Analysis
122
techniques. Concerning the single–carrier CDMA system, an MMSE receiver is selected due
to its advantage of ease of adaptation, since standard adaptive algorithms can be employed.
The first section of this chapter analyzes the cross–correlation properties of the
previously introduced short and long spreading sequences. The second part of the chapter
analyzes the accuracy of the analytical expressions obtained in Chapter 5 for DS-CDMA and
MC-CDMA receivers. The theoretical results are compared with those obtained from Monte
Carlo simulations in order to validate the closed–form bit error rate for asynchronous DS-
CDMA and MC-CDMA systems under coloured narrowband and impulsive noise with
different kind of long polyphase and binary spreading sequences. Finally, both systems are
compared in the same conditions.
6.1 SPREADING SEQUENCES
The performance analysis of a specific kind of spreading sequences in a asynchronous
multiuser environment is done taking into consideration the even cross–correlation and odd
cross–correlation property of sequences. Both functions are equally important in the system
design and performance analysis, as stated in Chapter 5.
From Equation (5.6), the maximum even cross–correlation ,i jθ value between the i and j
sequences is given by
, ,max ( ) , , 0 1i j i j ci j Lτ
θ θ τ τ= ≠ < < − (6.1)
and the maximum odd cross–correlation ,ˆi jθ property is as follows
, ,ˆ ˆmax ( ) , , 0 1i j i j ci j L
τθ θ τ τ= ≠ < < − (6.2)
where max v operation gives the maximum value of a vector v. The correlation is done
between a shifted sequence j of length cL , and several concatenated sequences j (Figure
6.1), where the symbol value changes depending on the desired parameter. It should be
remembered that the asynchronism is present in the uplink due to multipath components.

Chapter 6. Performance Analysis
123
Figure 6.1 ECC and OCC calculation for τ delay
Figure 6.2 and Figure 6.3 show how the OCC and ECC values change depending on the
delay τ for a random pair of short binary Walsh sequences of length cL = 64 chips.
-60 -40 -20 0 20 40 600
0.2
0.4
0.6
0.8
1
1.2
1.4
Delay (chips)
EC
C
Figure 6.2 ECC for Walsh sequences Lc=64
-60 -40 -20 0 20 40 600
0.05
0.1
0.15
0.2
0.25
Delay (chips)
OC
C
Figure 6.3 OCC for Walsh sequences Lc=64

Chapter 6. Performance Analysis
124
The ECC and OCC values for a random Gold pair sequence is shown in the Figure 6.4
and Figure 6.5. They show a considerably lower correlation values in contrast to the Walsh
sequences.
-2000 -1500 -1000 -500 0 500 1000 1500 20000
0.01
0.02
0.03
0.04
0.05
0.06
0.07
0.08
Delay (chips)
OC
C
Figure 6.4 OCC for Gold sequences Lc=2047
-2000 -1500 -1000 -500 0 500 1000 1500 20000
0.005
0.01
0.015
0.02
0.025
0.03
0.035
Delay (chips)
EC
C
Figure 6.5 ECC for Gold sequences Lc=2047
The Song–Park (Figure 6.6 and Figure 6.7) and Oppermann (Figure 6.8 and Figure 6.9)
sequences show better cross–correlation properties than binary sequences for a randomly
selected pair of sequences.

Chapter 6. Performance Analysis
125
-2000 -1500 -1000 -500 0 500 1000 1500 20000
0.2
0.4
0.6
0.8
1
1.2
1.4x 10
-3
Delay (chips)
OC
C
Figure 6.6 OCC for Song–Park sequences Lc=2048
-2000 -1500 -1000 -500 0 500 1000 1500 20004
4.5
5
5.5
6
6.5x 10
-15
Delay (chips)
EC
C
Figure 6.7 ECC for Song–Park sequences Lc=2048
The Oppermann sequence results shown here have been obtained for design
parameters p=1, m=0.975 and n=1.575, which specify the sequence set [Oppermann and
Vucetic, 1997].

Chapter 6. Performance Analysis
126
-2000 -1500 -1000 -500 0 500 1000 1500 20003
3.5
4
4.5
5
5.5
6
6.5x 10
-4
Delay (chips)
EC
C
Figure 6.8 ECC for Oppermann sequences Lc=2039
-2000 -1500 -1000 -500 0 500 1000 1500 20000
0.2
0.4
0.6
0.8
1
1.2
1.4x 10
-3
Delay (chips)
OC
C
Figure 6.9 OCC for Oppermann sequences Lc=2039
Comparing both families of polyphase sequences with the binary ones, it is clear how
the latter are outperformed by the polyphase sequences in the cross–correlation sense. On
the other hand, many users may be operating in the system asynchronously at any time, so
the cross–correlation properties of all sequences in the set need to be considered when
determining the average performance.
The Figure 6.10 and Figure 6.11 represent the maximum even cross–correlation ,i jθ
and odd cross–correlation ,ˆi jθ parameters surface for a Walsh sequence set of Nu = 20 users
in the worst case. In order to avoid symmetries ( , ,i j j iθ θ= ), the first ten users are correlated
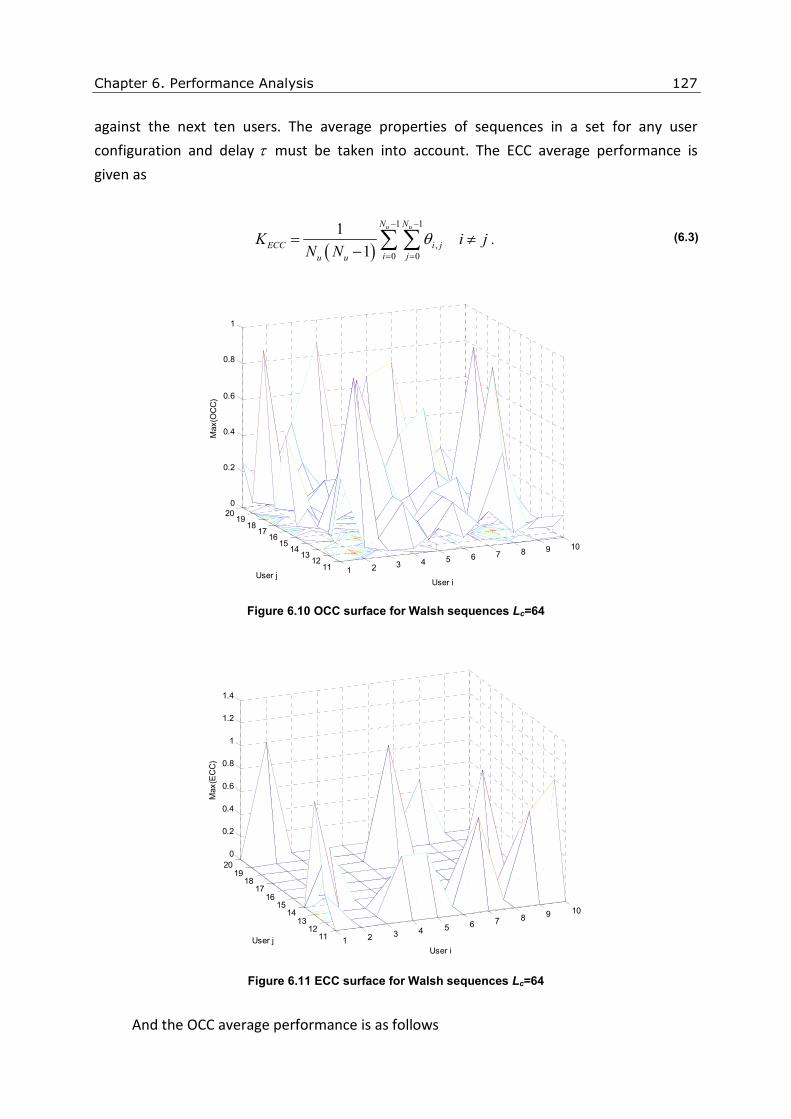
Chapter 6. Performance Analysis
127
against the next ten users. The average properties of sequences in a set for any user
configuration and delay τ must be taken into account. The ECC average performance is
given as
( )
1 1
,
0 0
1
1
u uN N
ECC i j
i ju u
K i jN N
θ− −
= =
= ≠− ∑ ∑ . (6.3)
1 2 3 4 5 6 7 8 9 10
1112
1314
1516
1718
1920
0
0.2
0.4
0.6
0.8
1
User iUser j
Max
(OC
C)
Figure 6.10 OCC surface for Walsh sequences Lc=64
1 2 3 4 5 6 7 8 9 10
1112
1314
1516
1718
1920
0
0.2
0.4
0.6
0.8
1
1.2
1.4
User iUser j
Max
(EC
C)
Figure 6.11 ECC surface for Walsh sequences Lc=64
And the OCC average performance is as follows
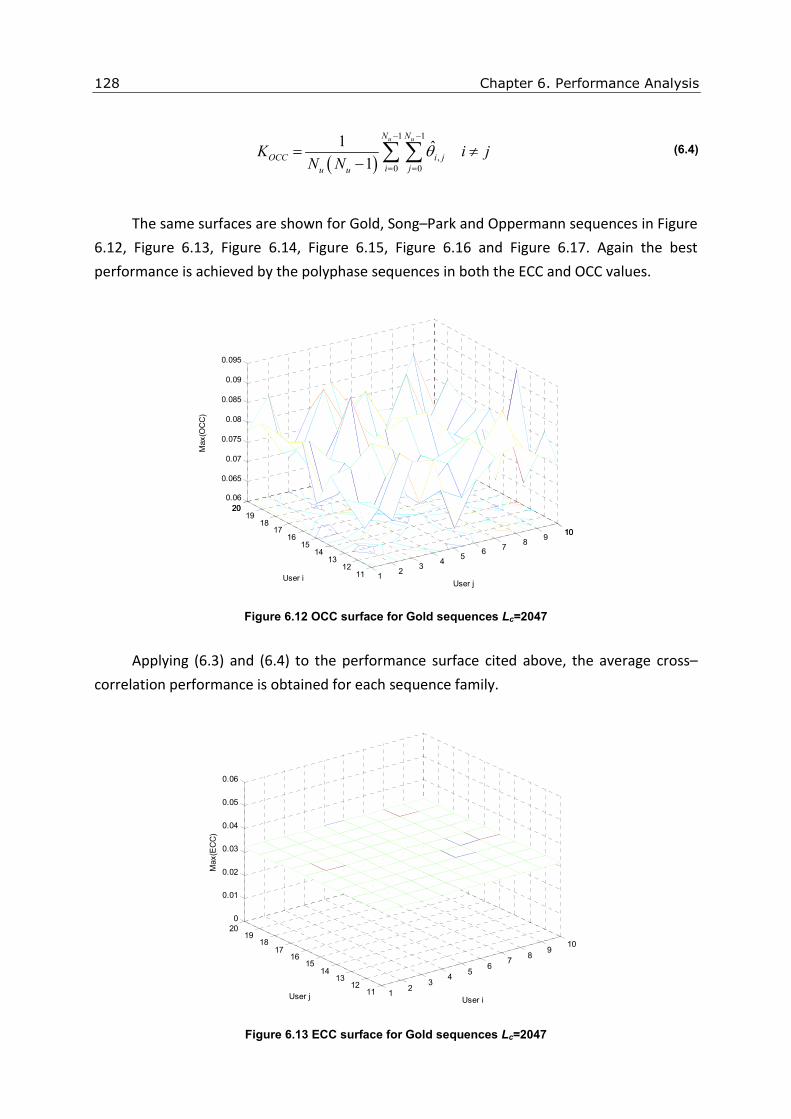
Chapter 6. Performance Analysis
128
( )
1 1
,
0 0
1 ˆ1
u uN N
OCC i j
i ju u
K i jN N
θ− −
= =
= ≠− ∑ ∑ (6.4)
The same surfaces are shown for Gold, Song–Park and Oppermann sequences in Figure
6.12, Figure 6.13, Figure 6.14, Figure 6.15, Figure 6.16 and Figure 6.17. Again the best
performance is achieved by the polyphase sequences in both the ECC and OCC values.
12
34
56 7
89
1010
1112
1314
1516
1718
192020
0.06
0.065
0.07
0.075
0.08
0.085
0.09
0.095
User jUser i
Max
(OC
C)
Figure 6.12 OCC surface for Gold sequences Lc=2047
Applying (6.3) and (6.4) to the performance surface cited above, the average cross–
correlation performance is obtained for each sequence family.
12
34
56
78
910
1112
1314
1516
1718
19200
0.01
0.02
0.03
0.04
0.05
0.06
User iUser j
Max
(EC
C)
Figure 6.13 ECC surface for Gold sequences Lc=2047

Chapter 6. Performance Analysis
129
1 2 3 4 5 6 7 8 9 10
1112
1314
1516
1718
1920
0
2
4
6
8
x 10-3
User i
User j
M
ax(O
CC
)
Figure 6.14 OCC surface for Song–Park sequences Lc=2048
12
34
56
78
910
1112
1314
1516
1718
19200
0.5
1
1.5
2
2.5
3
x 10-14
User iUser j
Max
(EC
C)
Figure 6.15 ECC surface for Song–Park sequences Lc=2048

Chapter 6. Performance Analysis
130
1 2 3 4 5 6 7 8 9 10
1112
1314
1516
1718
1920
0
0.005
0.01
0.015
0.02
User iUser j
Max
(OC
C)
Figure 6.16 OCC surface for Oppermann sequences Lc=2039
1 2 3 4 5 6 7 8 9 10
1112
1314
1516
1718
1920
0
0.005
0.01
0.015
0.02
User iUser j
Max
(EC
C)
Figure 6.17 ECC surface for Oppermann sequences Lc=2039
Table 6.1 summarizes all the results, where the best performance is for polyphase
Song–Park sequences and the worst results are for Walsh sequences, as expected.

Chapter 6. Performance Analysis
131
Sequence family ECCK OCCK
Walsh 0.1027 0.2243
Gold 0.0318 0.0736
Song–Park 154.1 10−⋅ 0.0019
Oppermann 0.0025 0.0021
Table 6.1 Average cross–correlation performance
As summary, the polyphase sequences have a superior cross–correlation properties
when compared with other binary sequence families

Chapter 6. Performance Analysis
132
6.2 NUMERICAL RESULTS
This section presents the numerical results in two parts. First, the Monte Carlo
simulation results that verify the theoretical analysis of the previous chapter (Chapter 5). The
results demonstrate the accuracy of the derived probability error expressions for the MC-
CDMA and DS-CDMA receivers based on the SGA method. After that, the probability error
performance of the MC-CDMA receiver is compared with that of the DS-CDMA system.
In order to assess the performance of the previously analyzed systems, several
analytical calculations have been carried out under the powerline channel model proposed
in Chapter 4, where the carrier frequency cf has been randomly selected for each
simulation (4-20 MHz). The channel topology and noise profiles are randomly selected for
each simulation.
0 2 4 6 8 10 12 14 16 18 2010
-6
10-5
10-4
10-3
10-2
10-1
100
Eb/No (dB)
Bit
Err
or P
roba
bilit
y
MMSE-Song-Park
MMSE-Gold
MMSE-Oppermann
QPSK bound
Figure 6.18 Theoretical BER performance for asynchronous DS-CDMA system without impulsive noise
with 10uN = , 4=R and 0 (1 1)n uP P n N= ≤ ≤ − .
For a code gain 64cN = in the DS-CDMA system, the single user data rate is 128 kbps
for each multiplex. The chip pulse )(tg is the square root raised cosine pulse with α = 22%,
which gives a signal bandwidth of 5 MHz. DS-CDMA MMSE receiver processes the
oversampled signal R = 4 times the chip rate, taking advantage of the cyclostationary

Chapter 6. Performance Analysis
133
property of the DS-CDMA signal [Adlard et al., 1998; Milstein, 2000; Parkvall, 2000]. The
performance is evaluated in terms of BER averaged over several scenarios against Eb/N0 at
the receiver input, where N0 is the equivalent mean noise power density of the colored
background noise ( )BGS f (not including narrowband noise). The media is interfered by 10
users transmitting asynchronously and one multiplex 1kV = , assuming that all the interferers
transmit the same power 0 (1 1)n uP P n N= ≤ ≤ − . Each user delay kΛ is randomly selected from
uniform distribution over [0,LcTc). The simulations were conducted for a set of Gold,
Oppermann and Song–Park sequences randomly selected with lengths of 2047, 2039 and
2048 chips, respectively.
Figure 6.18 shows the simulation results of the analytical expression of (5.34) for a
MMSE receiver in absence of impulsive noise. It is possible to conclude from the results that
Gold sequences perform better (around 5 dB) than polyphase sequences. This can be
explained from the point of view of their random nature, coding more effectively the
channel.
0 2 4 6 8 10 12 14 16 18 20
10-3
10-2
10-1
100
Eb/No (dB)
Bit
Err
or P
roba
bilit
y
MMSE-Song-Park
MMSE-Gold
MMSE-Oppermann
BER Upper bound
Figure 6.19 Theoretical and Monte Carlo BER performance for asynchronous DS-CDMA system under
impulsive noise with 10uN = , 4=R and 0 (1 1)n uP P n N= ≤ ≤ − . Monte Carlo simulations marked
with∗ .

Chapter 6. Performance Analysis
134
The analytical results are compared with an ideal BER bound for a QPSK receiver under
AWGN, where the Gold–based receiver is 2 dB worse due to the effect of MAI and
narrowband noise. In order to evaluate the accuracy of the expression (5.34), a Monte Carlo
simulation is done for a specific scenario with Gold and Song–Park sequences. The
simulation is limited to one scenario due to the complexity in calculating the filter for each
symbol and the extremely long–time simulations. Taking a random scenario for a set of Gold
codes, frequency responses, carrier frequency, background noise and user delays, the
analytical probability error Pe is 3.39·10-5
. with Eb/N0 = 10 dB. The same random parameters
are used for a Monte Carlo simulation, obtaining a 98% confidence interval of [2.87·10-5
,
3.97·10-5
]. For Song–Park sequences, the analytical expression returns Pe = 2.28·10-3
,
whereas the Monte Carlo simulation shows a 98% confidence interval of [2.25·10-3
, 2.41·10-
3]. Therefore, the accuracy of the expression (5.34) is shown to be adequate.
0 5 10 15 20 2510
-3
10-2
10-1
100
Eb/No (dB)
Bit
Err
or P
roba
bilit
y
MC-CDMA-Gold-TH
MC-CDMA-Song-Park-TH
MC-CDMA-Walsh-TH
Figure 6.20 Theoretical BER performance for asynchronous MC-CDMA system with 10uN = and
0 (1 1)n uP P n N= ≤ ≤ − .
The previous simulations have been done in absence of impulsive noise, where the
presented curves are transformed by means of the expression (5.36). Several Monte Carlo
simulations are carried out to validate the analytical probability error expressions of the DS-

Chapter 6. Performance Analysis
135
CDMA under impulsive noise, where Figure 6.19 shows that the analytical expression of
(5.36) accurately predicts the simulation results. The BER bound (Pe = 7.58·10-4
) due to
impulsive noise is correctly predicted using the expression (4.36). Following the noise model
presented in Chapter 4, the probability error Pe is 7.58·10-4
with an average length time 49.2938 10impE T −′ = ⋅ and average inter arrival time of pulse events [ ] 0558.0=IATTE .
The MC-CDMA system uses 64 subcarriers ( 64cN = ) for a bandwidth of 4,096 MHz,
using an interval guard of 16 samples (i.e. 3.9 microseconds), which is smaller than the
maximum spreading delay of the multipath channel (see Chapter 4). Again, the performance
of MC-CDMA receivers is evaluated in terms of BER averaged over theoretical calculations
against Eb/N0 at the receiver input. The media is interfered by 10 users transmitting
asynchronously and one multiplex 1kV = , assuming that all the interferers transmit the same
power 0 (1 1)n uP P n N= ≤ ≤ − .
0 5 10 15 20 25
10-3
10-2
10-1
100
Eb/No (dB)
Bit
Err
or P
roba
bilit
y
MC-CDMA-Gold-TH
MC-CDMA-Song-Park-TH
MC-CDMA-Walsh-TH
OFDM-TH
BER Upper bound
Figure 6.21 Theoretical and Monte Carlo BER performance for asynchronous MC-CDMA under impulsive
noise with 10uN = and 0 (1 1)n uP P n N= ≤ ≤ − . Monte Carlo simulations marked with∗ .
Each user delay kΛ is randomly selected from uniform distribution over [ )0, s cT L N .
The simulations were conducted for a set of Walsh, Gold and Song–Park sequences
randomly selected with lengths of 64, 2047 and 2048 chips, respectively. Taking the
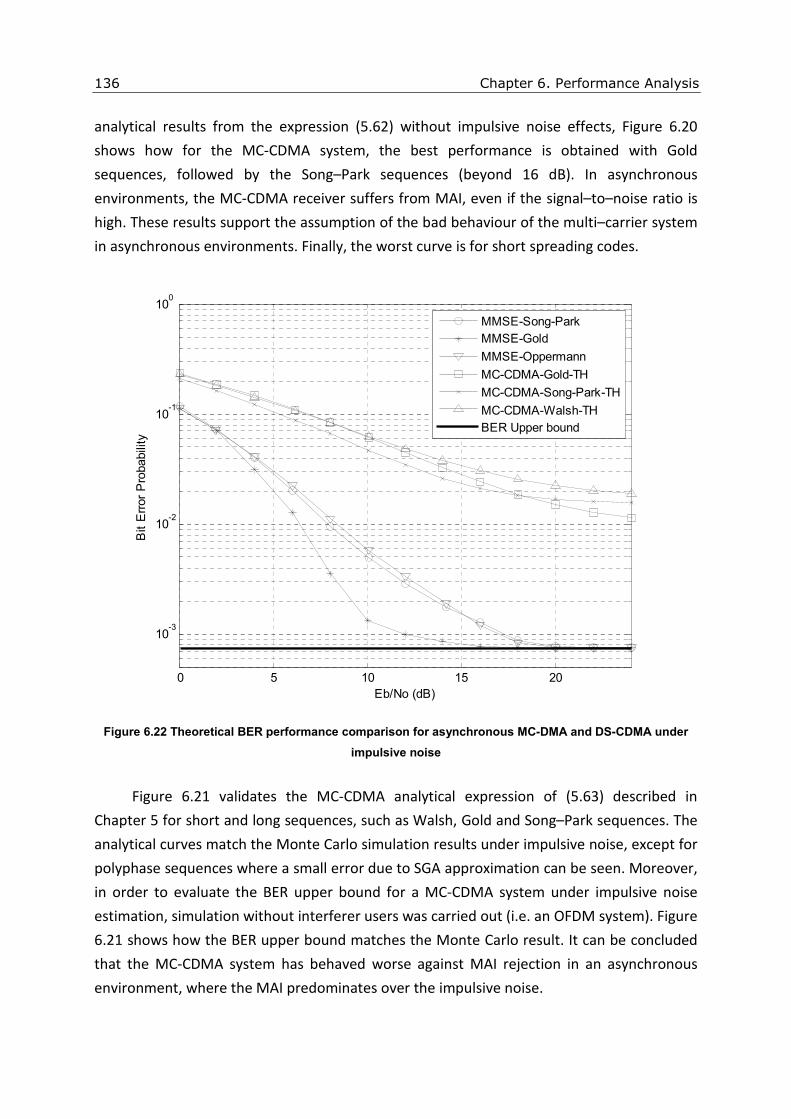
Chapter 6. Performance Analysis
136
analytical results from the expression (5.62) without impulsive noise effects, Figure 6.20
shows how for the MC-CDMA system, the best performance is obtained with Gold
sequences, followed by the Song–Park sequences (beyond 16 dB). In asynchronous
environments, the MC-CDMA receiver suffers from MAI, even if the signal–to–noise ratio is
high. These results support the assumption of the bad behaviour of the multi–carrier system
in asynchronous environments. Finally, the worst curve is for short spreading codes.
0 5 10 15 20
10-3
10-2
10-1
100
Eb/No (dB)
Bit
Err
or P
roba
bilit
y
MMSE-Song-Park
MMSE-Gold
MMSE-Oppermann
MC-CDMA-Gold-TH
MC-CDMA-Song-Park-TH
MC-CDMA-Walsh-TH
BER Upper bound
Figure 6.22 Theoretical BER performance comparison for asynchronous MC-DMA and DS-CDMA under
impulsive noise
Figure 6.21 validates the MC-CDMA analytical expression of (5.63) described in
Chapter 5 for short and long sequences, such as Walsh, Gold and Song–Park sequences. The
analytical curves match the Monte Carlo simulation results under impulsive noise, except for
polyphase sequences where a small error due to SGA approximation can be seen. Moreover,
in order to evaluate the BER upper bound for a MC-CDMA system under impulsive noise
estimation, simulation without interferer users was carried out (i.e. an OFDM system). Figure
6.21 shows how the BER upper bound matches the Monte Carlo result. It can be concluded
that the MC-CDMA system has behaved worse against MAI rejection in an asynchronous
environment, where the MAI predominates over the impulsive noise.

Chapter 6. Performance Analysis
137
6.3 SUMMARY
The closed–form analytical probability error expressions of the DS-CDMA and MC-
CDMA receiver in (5.36) and (5.63) have been validated with their respective Monte Carlo
simulations, where the SGA approximation for a large number of users is correct, although in
the case of MC-CDMA and polyphase sequences there is a small error.
Figure 6.22 shows the BER performance for MC-CDMA and DS-CDMA systems using
different families of sequences in an asynchronous environment under impulsive noise,
where the best MC-CDMA curve is outperformed by the worst DS-CDMA curve (by nearly 15
dB), which takes advantage of the cyclostationary properties of the transmitted signal. In
asynchronous environments, the MAI is much more damaging for a multi–carrier system, as
has been stated in the results presented. The impulsive noise effect has also been studied,
showing how it limits the receiver performance. However, the implementation of the MMSE
receiver is not feasible in a practical case. Thus, the next chapter will be showing simpler
adaptive implementations of the MMSE receiver.


Chapter 7. Algorithmic Research 139
7 Algorithmic Research
Chapter 7
Algorithmic Research
The implementation of the previously presented MMSE DS-CDMA receiver (Chapter 5)
requires many parameters from other interferers that are not accessible from the receiver
side. Moreover, its extremely high computational complexity does not fit in with the Smart
Grid definition, as stated above.
However, the MMSE receiver has the advantage of ease of adaptation, since standard
algorithms such as least mean squares (LMS) or recursive least squares (RLS) can be
employed [Haykin, 2002]. On the other hand, it suffers from the disadvantage of requiring
the use of short spreading sequences, since the interference must have cyclostationary
statistics in order for the adaptation algorithms to function. That is, the statistics of the MAI
should be periodic in the update interval, which is typically once every symbol [Milstein,
2000]. Moreover, unlike high–order statistics, cyclostationarity can be exploited by means of
linear filtering.
Long sequences do not possess the cyclostationarity that makes possible many of the
advanced signal processing techniques used for blind multiuser detection and adaptive
channel estimation. However, MAI in long sequence DS-CDMA systems remains to be a
wide-sense cyclostationary (WSCS) process with its period reduced from one symbol interval
to one chip interval [Wong et al., 1999].

Chapter 7. Algorithmic Research
140
On the other hand, communications signals can be cyclostationary with cyclic
frequencies related to the carrier frequency, symbol rate, chip rate or certain combinations
of them [Gardner, 1993]. In the frequency domain this cyclostationarity manifests itself as
spectral correlation, that is, the signal is correlated with itself after frequency shifting by one
of its cyclic frequencies. It is important to note that if a signal is cyclostationary, to maintain
its spectral correlation, a sufficiently high sampling frequency must be used. A signal
sampled at one sample per symbol cannot exhibit symbol or chip rate related spectral
correlation so any processing which exploits cyclostationarity must be performed at a higher
sampling rate [Adlard et al., 1998].
In a fractionally spaced equalizer (FSE), the equalizer taps are spaced more closely than
the reciprocal of the symbol rate [Haykin, 2002]. An FSE has the capacity of compensating
for delay distortion much more effectively than a conventional synchronous equalizer does.
Another advantage of the FSE is the fact that data transmission may begin with an arbitrary
sampling phase. However, mathematical analysis of the FSE is much more complicated than
that of a conventional synchronous equalizer. Cyclostationarity introduced at the receiver by
fractional sampling is exploited by adaptive algorithms and blind equalization techniques
without resorting to higher order statistics.
7.1 ADAPTIVE RECEIVER
This section describes the proposed adaptive receiver and the error signals used by the
pilot aided LMS and RLS updating algorithms, which means that these algorithms need to be
trained during the initialization process of the receiver [Haykin, 2002]. Although the time–
varying powerline channels are not studied in this work, the use of adaptive filters may
result favourable for tracking the channel changes along the time.
From (5.1), (5.8) and (5.9), the received signal ( )r t from an asynchronous DS-CDMA
system is expressed as
1 1, ,
,
0 1 0
( ) ( ) ( )u kN V L
v k k v k k
k v m l m s l k
k m v l
r t P a h c t mT n tτ− ∞ −
= =−∞ = =
= ⋅ − − − ∆ +∑ ∑ ∑ ∑ (7.1)
which is filtered and sampled at the sampling frequency sF , where c sT R F= , and R is an
integer number. The output signal ( )q n is represented as

Chapter 7. Algorithmic Research
141
*( ) ( ) ( )sq n r t g nT t dt= −∫ (7.2)
where * denotes the complex conjugate operation. After filtering, the output signal ( )q n is
perfectly synchronized with the user of interest. The FSE comprises a (2W+1) length v
mw
filter, centred on the chip pulse. Therefore, sW F must be at least greater than the channel
delay spread. The FSE output for mth symbol and vth multiplex is given by
( )∑ ∑−
= −=+ ⋅=
1
0
**
,0
0,
0 ),()(1
)(c
c
N
p
m
W
Wi
v
mmNp
v
p
c
v ipuiwcbN
mZ (7.3)
where the input signal um is defined as
)(),( ipRmRNqipu cm ++= . (7.4)
The adaptive algorithms need the error v
mε between the FSE output )(0 mZ v and either
the training symbol v
mT (training mode) or estimated symbol ˆvma after hard–decision (blind
mode), which is given by
0
0
ˆ( ) (Blind mode)
( ) (Training mode)
v v
v m
m v v
m
Z m a
Z m Tε
−=
−. (7.5)
Starting with the LMS algorithm, it operates by adjusting the tap weights of the FSE
towards the direction of an estimate for the negative gradient of MSE. It has a low
computational complexity but leaves a relative steady–state excess MSE component above
the MMSE solution and is slow in convergence. However, an adaptive equalizer
implemented with the LMS algorithm may have better narrowband interference cancelling
capabilities than the corresponding MMSE filter due to its nonlinear effects [Reuter and
Zeidler, 1999]. On the other hand, the received signal power may vary significantly due to
powerline cable loss [Zimmermann and Dostert, 2002b], thus a normalized variation of LMS
algorithm (NLMS) based on long sequences has been selected. For the NLMS adaptive
algorithm, the FSE tap weight update is defined as

Chapter 7. Algorithmic Research
142
*
1 2
vv v v mm m m
v
m
µ ε+ = + ⋅q
w wq
(7.6)
where μ is the NLMS update step size. The NLMS input signal vector instead of being the
instantaneous value, is a time–averaged 2W+1 length vector v
mq covering the incoming mth
symbol, as suggested in [Mirbagheri and Yoon, 2002], and is given by
( ) [ ]1 *
,0
0,0
1( , ), ( , )
c
c
NTv x
m p m mp mNpc
b c u p W u p WN
−
+=
= ⋅ −∑q ⋯ . (7.7)
From [Haykin, 2002], the NLMS filter will converge to a solution if the step size
parameter follows the condition
2
20
vMAXm
µλ
< <q
(7.8)
where MAXλ is the maximum eigenvalue from the correlation matrix R of the input signal
vector q. From the eigen decomposition theory, the trace of matrix R is equal to the sum of
eigenvalues, and since the eigenvalues are all positive and real, we have
( )2 1
1
trW
i MAX
i
λ λ+
=
= >∑R . (7.9)
The correlation matrix R is nonnegative definite and Toeplitz, with all of the elements
on its main diagonal equal to r(0). Since r(0) is itself equal to the mean square value of the
input at each tap in the filter:
( ) ( ) ( ) 2tr 2 1 0 mW r E = + = R q . (7.10)
In practice, MAXλ is not known, so the expression from (7.8) is rewritten as

Chapter 7. Algorithmic Research
143
2 2
20
v vm mE
µ< <
q q. (7.11)
On the other hand, in [Haykin, 2002], it is shown that the ensemble–averaged learning
curve of the NLMS algorithm is approximated by a single exponential with time constant τ
where
2
2
v
m
av
τµλ
≈q
(7.12)
where avλ is the average eigenvalue for the correlation matrix R, which is given as
2 12
1
1 1
2 1 2 1
W
av i m
i
EW W
λ λ+
=
= = + +∑ q . (7.13)
The convergence time constant τ can be considered as a lower bound, but in the same
way that the step size has been calculated, it can be shown that
2 2
2max2 2
v v
m m
mEτ
µλ µ≈ =
q q
q (7.14)
where the Figure 7.1 shows the comparison of the convergence rate estimated from (7.14)
and the real convergence transient of a NLMS algorithm. During the first iterations, the
fastest modes dominate the behaviour of the algorithm.

Chapter 7. Algorithmic Research
144
0 50 100 1500
0.1
0.2
0.3
0.4
0.5
0.6
0.7
0.8
0.9
1
Iterations
MS
E
Aprox,
Real
Figure 7.1 Approximated convergence rate compared with real (simulation) transient for step size µ = 0.03
On the other hand, the RLS update algorithm is described in a similar way, which is
based on the method of exponentially weighted least–squares which seeks to minimize the
cost function
2
1
( ) ( )m
m i
i
J m iλ ε−
=
= ⋅∑ . (7.15)
where λ is the forgetting factor [Haykin, 2002] or exponential weighting factor, chosen in the
range 0 1λ< ≤ . Instead of a single step size for the tap weight vector, the RLS algorithm
assigns a step size to every element of wm and corrects them accordingly. Hence, its speed of
convergence is much faster compared with that of the NLMS algorithm at the expense of
increased computational complexity, of order O(n2). However, there are several proposals
that reduce the computational complexity to the order of O(n) [Montazeri and Poshtan,
2009], which is equal to that of NLMS. The tap weights are updated using the following
algorithm
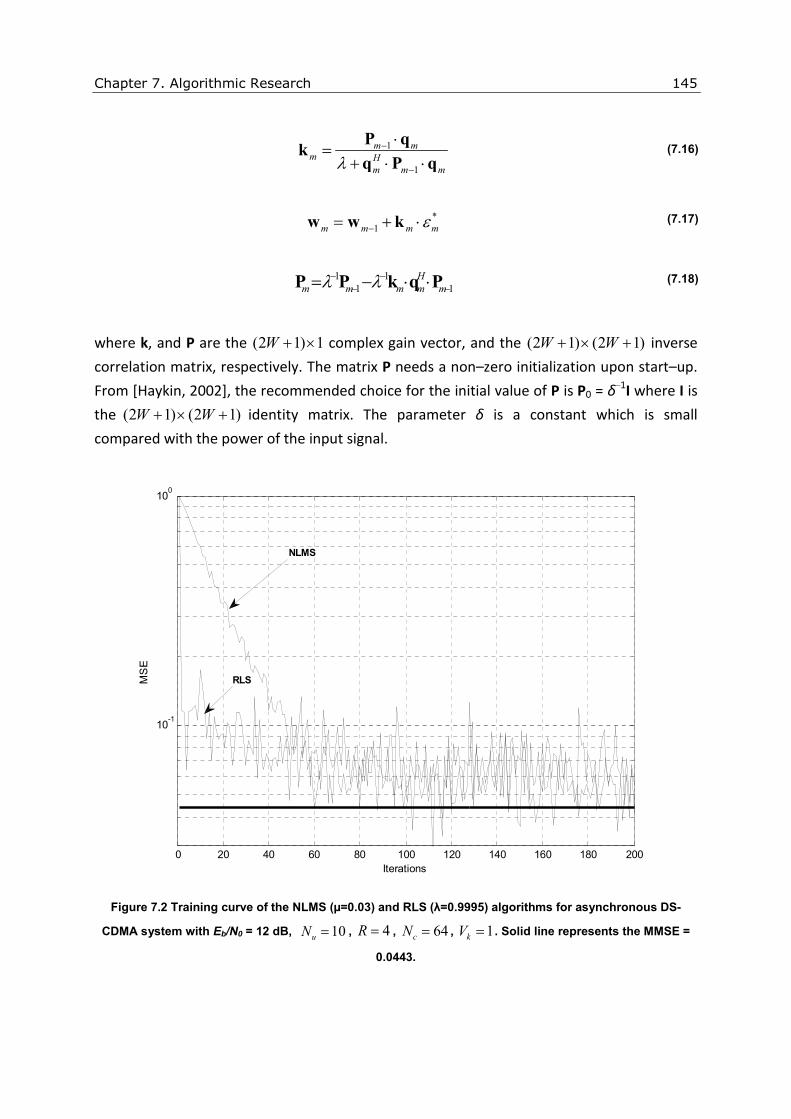
Chapter 7. Algorithmic Research
145
1
1
m mm H
m m mλ−
−
⋅=
+ ⋅ ⋅P q
kq P q
(7.16)
*
1m m m mε−= + ⋅w w k (7.17)
1 1
1 1
H
m m m m mλ λ− −− −= − ⋅ ⋅P P k q P (7.18)
where k, and P are the (2 1) 1W + × complex gain vector, and the (2 1) (2 1)W W+ × + inverse
correlation matrix, respectively. The matrix P needs a non–zero initialization upon start–up.
From [Haykin, 2002], the recommended choice for the initial value of P is P0 = δ−1I where I is
the (2 1) (2 1)W W+ × + identity matrix. The parameter δ is a constant which is small
compared with the power of the input signal.
0 20 40 60 80 100 120 140 160 180 200
10-1
100
Iterations
MS
E
NLMS
RLS
Figure 7.2 Training curve of the NLMS (µ=0.03) and RLS (λ=0.9995) algorithms for asynchronous DS-
CDMA system with Eb/N0 = 12 dB, 10uN = , 4R = , 64cN = , 1kV = . Solid line represents the MMSE =
0.0443.

Chapter 7. Algorithmic Research
146
By invoking the independence theory, the RLS algorithm is proven in [Haykin, 2002] to
stabilize near the MMSE solution after 2(2 1)W + iterations where (2 1)W + is the number of
FSE tap weights. This can again be considered as a lower bound for convergence time of the
RLS algorithm although simulation results show that more iterations are required for the RLS
to converge.
The output SNR of the ideal MMSE receiver is formulated with the expression (5.33), or
equivalently, the MSE in (5.32). It serves as a lower bound for the performance of the
adaptive algorithms presented above. Figure 7.2 and Figure 7.3 show the averaged training
curves for both adaptive algorithms in the case of Eb/N0 = 12 dB and Eb/N0 = 22 dB,
respectively, in the same scenario. The system has 10 interferers transmitting
asynchronously using Song–Park polyphase sequences and one multiplex 1kV = , assuming
that all the interferers transmit the same power 0 (1 1)n uP P n N= ≤ ≤ − .
0 50 100 150 200 250
10-2
10-1
100
Iterations
MS
E
RLS
NLMS
Figure 7.3 Training curve of the NLMS (µ=0.03) and RLS (λ=0.9995) algorithms for asynchronous DS-
CDMA system with Eb/N0 = 22 dB, 10uN = , 4R = , 64cN = , 1kV = . Solid line represents the MMSE =
0.0055.

Chapter 7. Algorithmic Research
147
The adaptive FSE receiver processes the oversampled signal R = 4 times the chip rate,
taking advantage of the cyclostationary property signal. The performance is evaluated in
terms of MSE and compared with the target solution from the ideal MMSE receiver from
Chapter 5. At lower SNR (Figure 7.2), both algorithms converge to nearly same solution,
where the relative excess MSE at the steady state for the adaptive MMSE receiver is about
44%.
0 0.5 1 1.5 2 2.5 3 3.5 4
x 104
-6
-4
-2
0
2
4
6
8x 10
10
Coe
f va
lue
Transmitted Symbols
Figure 7.4 RLS based FSE coefficients divergence under impulsive noise
The RLS algorithm, for the high SNR case shown in the Figure 7.3, converges more
accurately to the MMSE solution with a relative excess MSE of about 36%, whereas the
NLMS algorithm has a relative excess MSE of about 290%. Therefore, the RLS algorithm
based receiver has better performance, but in absence of impulsive noise. At a first
approach, the convergence rate of the RLS algorithm is superior to that of NLMS, but it
suffers from the disadvantage of being more vulnerable to the impulsive noise of the
powerline channel. Figure 7.4 shows the evolution of several RLS based filter coefficients
after the training process (blind mode) affected by powerline impulsive noise
2.3 2.4 2.5 2.6 2.7 2.8 2.9
x 103
700
600
500
400
300
200
100 0 5 0 0 1 0 0 0 1 5 0 0 2 0 0 0 2 5 0 0 3 0 0 0
- 2
0
2
4
6
8
1 0
x 1 0
7

Chapter 7. Algorithmic Research
148
In order to avoid this fatal effect over the tap filter update, the RLS algorithm can be
stopped each time that impulsive noise is detected in the received signal. This simple
solution does not improve the performance of the receiver under impulsive noise, but it
does enhance its robustness by isolating the impulsive noise from the filter update algorithm
behaviour.
The condition for detecting impulsive noise presence is defined by
2 2
1
2 2
1
0 100
1 100
m m
m m
K−
−
> ⋅=
≤ ⋅
q q
q q (7.19)
where the parameter K determines whether the filter update must be stopped. The
expression (7.19) uses the norm of the input vector q in order to have a relative estimation
of the input energy, and it is compared with the previous iteration. Afterwards, the update is
disabled until the impulsive noise disappears from the input signal, which is determined by
2 2
1
2 2
1
0 0.01
1 0.01
m m
m m
K−
−
> ⋅=
≤ ⋅
q q
q q . (7.20)
Therefore, the modified FSE tap weight update for RLS algorithm is defined as
*
1m m m mK ε+ = + ⋅ ⋅w w g . (7.21)
This section has presented two well–known adaptive algorithms and a robustness
enhancement proposal for RLS algorithm under powerline impulsive noise. Moreover, due to
its low computational complexity, these algorithms can be easily implemented in a Home
Grid modem solution for an asynchronous and hostile powerline communications
environment, where the performance and complexity need to be balanced.

Chapter 7. Algorithmic Research
149
7.2 NUMERICAL RESULTS
Monte Carlo simulation results are presented in this section, where three multiple–
access systems are evaluated. The first two systems have been previously discussed: DS-
CDMA and MC-CDMA. Additionally, a third MC-DS-CDMA multiple–access technique is
simulated in order to compare their performances with each other. For the DS-CDMA system
evaluation, RAKE, NLMS-FSE, RLS-FSE receivers plus a suboptimum MMSE-FSE receivers have
been selected, where the latter was based on the work presented in [Hachem et al., 2001].
Several simulations have been carried out under a powerline channel model with
impulsive noise, following the model proposed in the Chapter 4, where the carrier frequency
(4-20 MHz), channel topology and noise profiles were selected randomly for each
simulation. The performance is evaluated in terms of BER averaged over several scenarios
against Eb/N0 at the receiver input, where N0 is the equivalent mean noise power density of
the coloured background noise ( )BGS f (not including narrowband noise).
For a code gain 64cN = in the DS-CDMA system, the single user data rate is 128 kbps
for each multiplex. The chip pulse )(tg is the square root raised cosine pulse with α = 22%,
which gives a signal bandwidth of 5 MHz. The receiver processes the incoming oversampled
signal R times the chip rate.
In a RAKE receiver, one RAKE finger is assigned to each multipath, thus maximizing the
amount of received signal energy. Each of these different paths are combined to form a
composite signal that is expected to have substantially better characteristics for the purpose
of demodulation than just the a single path. RAKE receiver structure performs a MRC of the
received signal for one multiplex, by means of a filter matched to the channel impulse
response ( )kh t from (4.21), which maximizes the signal–to–noise ratio. The RAKE receiver
output sampled to the chip rate (R=1) and correlated with the spreading sequence is given
as
( )1 1 *
0 ,0
0, 0,0 0
1( ) ( )
c
c
N LRAKE v
v c l p p mNp lc
Z m q l p mN h b cN
− −
+= =
= + +∑ ∑ (7.22)
where in order to combine the different paths meaningfully, the RAKE receiver needs the
knowledge of channel parameters such as, number of paths, their location k
lτ and
attenuation 0
lh , under the assumption that k
l cTτ = . The received symbol estimation a is
done by the decision function [ ]D ⋅ in order to locate the symbol inside the constellation, as
shown in

Chapter 7. Algorithmic Research
150
,0
1,ˆ ( )v RAKE
m va D Z m = . (7.23)
The suboptimum MMSE receiver [Hachem et al., 2001] equalizes the received signal at
chip–level by minimizing the mean square error of the symbol estimation. The cost function
J to minimize is
−−⋅= ∑2
* )()( m
n
c anmRNwnqEJ (7.24)
where w is the Wiener filter solution [Verdú, 1998]. This paper contributes to the findings of
[Hachem et al., 2001] in evaluating the performance of the same receiver in an
asynchronous environment with impulse, narrowband and colored background noise. The
author in [Hachem et al., 2001] transforms the cost function (7.25) in a new cost function J’
(7.26) based on a training data frame 0 1 1NTT T T −=T ⋯ , in order to simplify the
optimization problem,
12
1
1
0
' ( )NT
M
m
m
J Z m T−
=
= −∑ (7.25)
1* *
1 1, ( , )
0
1( ) ( ) ( )
c
c c
NM
M p mN L c
p nc
Z m c q n w pR mRN nN
−
+=
= ⋅ + −∑ ∑ (7.26)
where NT is the number of training symbols. Focusing this optimization problem as a linear
regression, the filter w of length (2W+1) can be solved as
* 1( )H H −=w TX XX . (7.27)
The reader can find further details about the filter w and matrix X calculation in
[Hachem et al., 2001] for the cost function (7.26).
On the other hand, an asynchronous MC-DS-CDMA system is considered. The MC-DS-
CDMA transmitter modulates the data sub–streams on subcarriers with a carrier spacing
proportional to the inverse of the chip rate to guarantee orthogonality between the
spectrums of the sub–streams after spreading.

Chapter 7. Algorithmic Research
151
A mth sequence of N independent and identically distributed random complex–
valued data symbols k
pa , 0,1, , 1p N= −… , of the user k is serial–to–parallel converted into
N sub–streams, with a symbol rate of 1 cN T . Each symbol k
pa is mapped on a QPSK
constellation with 1k
pa = . The transmitted MC-DS-CDMA signal of kth user can be written as
( )1
2
0
1( ) ( ) p
Nj f tk
k c k p mN k
m p
x t p t mTN P a c t eN
π∞ −
+=−∞ =
= − ⋅ ⋅∑ ∑ (7.28)
with
( ) ( )1
,0
c
c
N
k k i mNi
c t c g t iT−
+=
= ⋅ −∑ (7.29)
where cN is the spreading gain factor, kP is the signal power, )(tp is the rectangular pulse
shape in the interval [ )0, cTN , T is the OFDM symbol length, Tpf p = is the frequency of
the pth subcarrier, and ( )g t is the chip pulse shape. The data symbol rate becomes 1 T for
cN N= . The system uses a set of QNu ≤ sequences 0 1 1, , , Q−c c c… , and each user has a
sequence ,0 ,1 , 1, , ,cl l l l Lc c c −=c … of length cL . The operation k is the modulus after
division of k by the sequence length. The received MC-DS-CDMA signal ( )r t is as follows
1 1
0 0
( ) ( ) ( )uN L
k
l k l k c
k l
r t h x t mTN n tτ− −
= =
= ⋅ − − Λ − +∑∑ (7.30)
where kΛ is the time delay of the kth user with respect to the user of interest ( 0 0Λ = ),
which are assumed to be i.i.d. and uniformly distributed over [ )0, cTL . The MRC output for
the mth sequence of the pth sub–stream in perfect time synchronization with the user of
interest (k=0) is given by
( )( 1)1 *
2 ( )*
0 0 0,0
( ) ( ) ( )cc
p c
c
m TNNj f t mTNp
p i mNi mTN
Z m H f c r t e dtπ
+−− −
+=
= ⋅∑ ∫ . (7.31)
The received symbol estimation a is done by the decision function [ ]D ⋅ in order to
locate the symbol inside the constellation, as shown in

Chapter 7. Algorithmic Research
152
0
0ˆ ( )p
pa D Z m = . (7.32)
7.2.1 SPREADING SEQUENCES COMPARISON
The comparison of several receivers for Gold, Oppermann and Song–Park sequences is
shown in this section when the media is interfered by 10 users transmitting asynchronously
and one multiplex 1kV = , assuming that all the interferers transmit the same power
0 (1 1)n uP P n N= ≤ ≤ − . Each user delay kΛ is randomly selected from uniform distribution over
[ )0, c cT L . The simulations were conducted for a set of Gold, Oppermann, Song–Park and
Walsh sequences randomly selected with lengths cL of 2047, 2039, 2048 and 64 chips,
respectively.
0 2 4 6 8 10 12 14 16 18 20 22
10-3
10-2
10-1
100
Eb/No (dB)
Bit
Err
or P
roba
bilit
y
RAKE-Song-Park
RAKE-Oppermann
RAKE-Gold
BER bound
Figure 7.5 BER performance for asynchronous DS-CDMA RAKE receiver under impulsive noise with
10uN = , 1R = and 0 (1 1)n uP P n N= ≤ ≤ − .
Figure 7.5 illustrates the performance of a RAKE receiver with different kind of long
spreading sequences. The solid horizontal line is BER performance bound due to impulsive
noise effect based on statistics shown in the Chapter 4. The curves converge to the limit
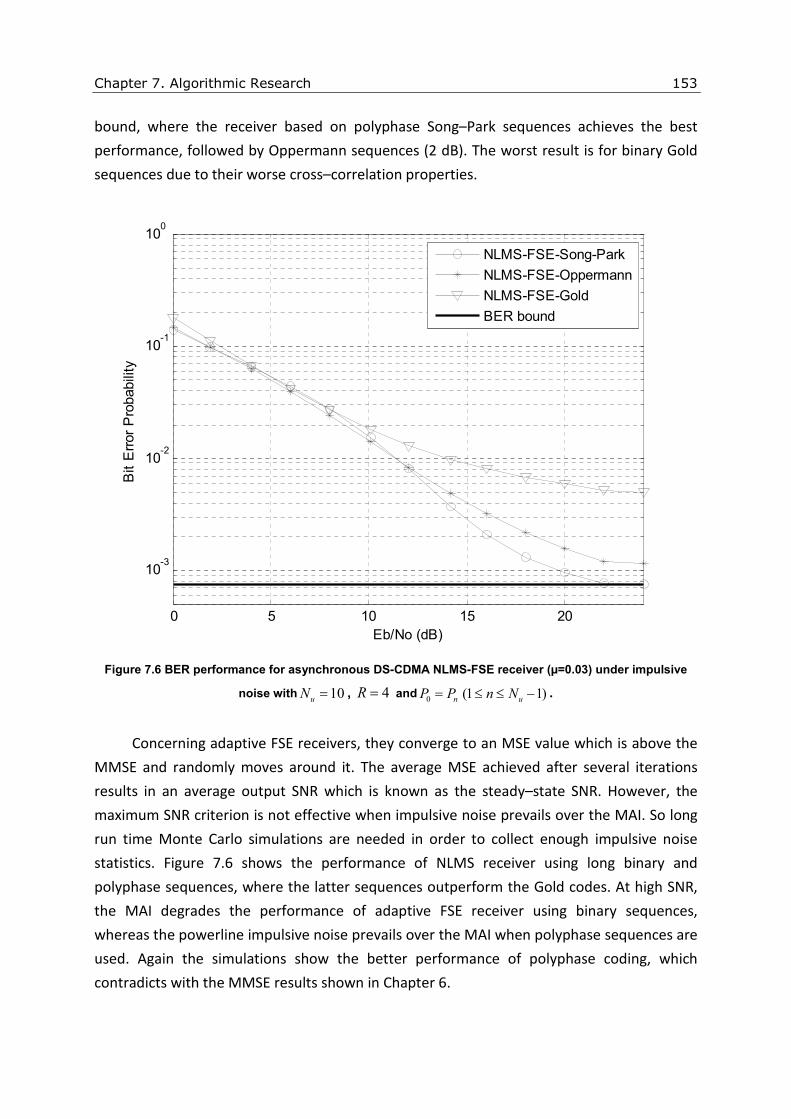
Chapter 7. Algorithmic Research
153
bound, where the receiver based on polyphase Song–Park sequences achieves the best
performance, followed by Oppermann sequences (2 dB). The worst result is for binary Gold
sequences due to their worse cross–correlation properties.
0 5 10 15 20
10-3
10-2
10-1
100
Eb/No (dB)
Bit
Err
or P
roba
bilit
y
NLMS-FSE-Song-Park
NLMS-FSE-Oppermann
NLMS-FSE-Gold
BER bound
Figure 7.6 BER performance for asynchronous DS-CDMA NLMS-FSE receiver (µ=0.03) under impulsive
noise with 10uN = , 4R = and0 (1 1)n uP P n N= ≤ ≤ − .
Concerning adaptive FSE receivers, they converge to an MSE value which is above the
MMSE and randomly moves around it. The average MSE achieved after several iterations
results in an average output SNR which is known as the steady–state SNR. However, the
maximum SNR criterion is not effective when impulsive noise prevails over the MAI. So long
run time Monte Carlo simulations are needed in order to collect enough impulsive noise
statistics. Figure 7.6 shows the performance of NLMS receiver using long binary and
polyphase sequences, where the latter sequences outperform the Gold codes. At high SNR,
the MAI degrades the performance of adaptive FSE receiver using binary sequences,
whereas the powerline impulsive noise prevails over the MAI when polyphase sequences are
used. Again the simulations show the better performance of polyphase coding, which
contradicts with the MMSE results shown in Chapter 6.

Chapter 7. Algorithmic Research
154
0 2 4 6 8 10 12 14 16 18 20 22
10-3
10-2
10-1
100
Eb/No (dB)
Bit
Err
or P
roba
bilit
y
NLMS-FSE,R=1
NLMS-FSE,R=2
NLMS-FSE,R=4
NLMS-FSE,R=8
BER bound
Figure 7.7 BER performance with different oversampling ratios for asynchronous DS-CDMA NLMS-FSE
receiver (µ=0.03) under impulsive noise with 10uN = and 0 (1 1)n uP P n N= ≤ ≤ − .
Figure 7.7 shows the comparison between different oversampling ratios R at the
receiver side for a NLMS algorithm using Oppermann sequences. An increment on the
sampling rate implies a performance gain due to the advantage of cyclostationary property
of the transmitted signals. At higher SNR the difference is not so appreciable, but at lower
SNR the improvement can be up to 2 dB.
Figure 7.8 illustrates the performance curves for the RLS receiver using the filter
adaption from the expression (7.17). The effect of the impulsive noise over the RLS algorithm
performance, which is more sensitive on polyphase sequences is clear. Moreover, the
system based on binary sequences is not apparently affected by the impulsive noise. In the
previous section, an enhanced version of the RLS algorithm has been formulated in order to
prevent parameters divergence due to impulsive noise disturbance.
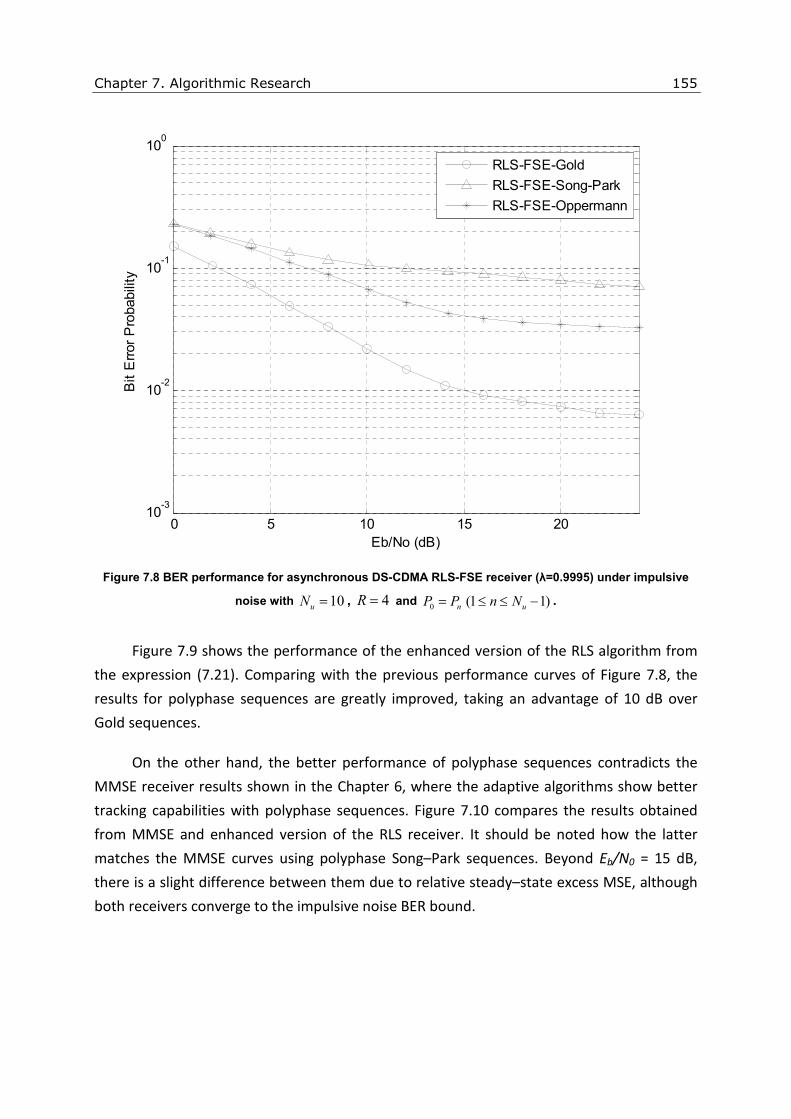
Chapter 7. Algorithmic Research
155
0 5 10 15 2010
-3
10-2
10-1
100
Eb/No (dB)
Bit
Err
or P
roba
bilit
y
RLS-FSE-Gold
RLS-FSE-Song-Park
RLS-FSE-Oppermann
Figure 7.8 BER performance for asynchronous DS-CDMA RLS-FSE receiver (λ=0.9995) under impulsive
noise with 10uN = , 4R = and 0 (1 1)n uP P n N= ≤ ≤ − .
Figure 7.9 shows the performance of the enhanced version of the RLS algorithm from
the expression (7.21). Comparing with the previous performance curves of Figure 7.8, the
results for polyphase sequences are greatly improved, taking an advantage of 10 dB over
Gold sequences.
On the other hand, the better performance of polyphase sequences contradicts the
MMSE receiver results shown in the Chapter 6, where the adaptive algorithms show better
tracking capabilities with polyphase sequences. Figure 7.10 compares the results obtained
from MMSE and enhanced version of the RLS receiver. It should be noted how the latter
matches the MMSE curves using polyphase Song–Park sequences. Beyond Eb/N0 = 15 dB,
there is a slight difference between them due to relative steady–state excess MSE, although
both receivers converge to the impulsive noise BER bound.
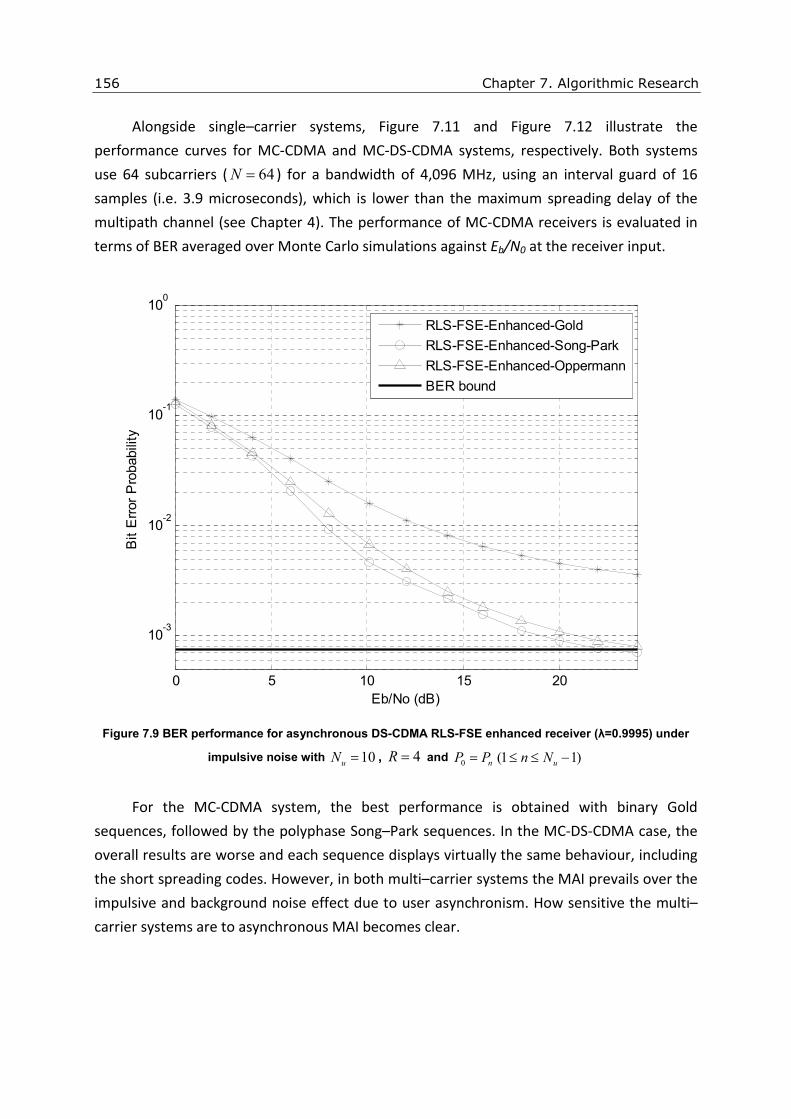
Chapter 7. Algorithmic Research
156
Alongside single–carrier systems, Figure 7.11 and Figure 7.12 illustrate the
performance curves for MC-CDMA and MC-DS-CDMA systems, respectively. Both systems
use 64 subcarriers ( 64N = ) for a bandwidth of 4,096 MHz, using an interval guard of 16
samples (i.e. 3.9 microseconds), which is lower than the maximum spreading delay of the
multipath channel (see Chapter 4). The performance of MC-CDMA receivers is evaluated in
terms of BER averaged over Monte Carlo simulations against Eb/N0 at the receiver input.
0 5 10 15 20
10-3
10-2
10-1
100
Eb/No (dB)
Bit
Err
or P
roba
bilit
y
RLS-FSE-Enhanced-Gold
RLS-FSE-Enhanced-Song-Park
RLS-FSE-Enhanced-Oppermann
BER bound
Figure 7.9 BER performance for asynchronous DS-CDMA RLS-FSE enhanced receiver (λ=0.9995) under
impulsive noise with 10uN = , 4R = and 0 (1 1)n uP P n N= ≤ ≤ −
For the MC-CDMA system, the best performance is obtained with binary Gold
sequences, followed by the polyphase Song–Park sequences. In the MC-DS-CDMA case, the
overall results are worse and each sequence displays virtually the same behaviour, including
the short spreading codes. However, in both multi–carrier systems the MAI prevails over the
impulsive and background noise effect due to user asynchronism. How sensitive the multi–
carrier systems are to asynchronous MAI becomes clear.

Chapter 7. Algorithmic Research
157
0 5 10 15 20
10-3
10-2
10-1
100
Eb/No (dB)
Bit
Err
or P
roba
bilit
y
MMSE-Song-Park
MMSE-Gold
MMSE-Oppermann
RLS-Enhanced-GoldRLS-Enhanced-Song-Park
RLS-Enhanced-Oppermann
BER Upper bound
Figure 7.10 MMSE and adaptive MMSE performance comparison for asynchronous DS-CDMA system
under impulsive noise with 10uN = , 4=R and 0 (1 1)n uP P n N= ≤ ≤ − .
MC-CDMA is a promising multiple–access scheme for the synchronous downlink of a
PLC system where it enables the deployment of efficient, low complexity receivers
employing simple channel estimation. However, it has been shown that this statement does
not apply to the uplink and asynchronous environments, where more complex multiuser
detection techniques are necessary to counteract the MAI, since the uplink orthogonal
spreading codes cannot be used to reduce the MAI.
Finally, MC-DS-CDMA was of special interest for the asynchronous uplink of mobile
radio systems due to its close relation to asynchronous single–carrier DS-CDMA systems.
However, the spectral efficiency of the system decreases due to asynchronism, and the
frequency diversity advantage is thus lost.

Chapter 7. Algorithmic Research
158
0 5 10 15 20 25
10-3
10-2
10-1
100
Eb/No (dB)
Bit
Err
or P
roba
bilit
y
MC-CDMA-Gold
MC-CDMA-Song-Park
MC-CDMA-Walsh
MC-CDMA-Oppermann
BER Upper bound
Figure 7.11 BER performance for asynchronous MC-CDMA MRC receiver under impulsive noise with
10uN = and 0 (1 1)n uP P n N= ≤ ≤ − .
0 2 4 6 8 10 12 14 16 18 20 2210
-2
10-1
100
Eb/No
Bit
Err
or P
roba
bilit
y
MC-DS-CDMA-Song-Park
MC-DS-CDMA-Walsh
MC-DS-CDMA-Gold
MC-DS-CDMA-Oppermann
Figure 7.12 BER performance for asynchronous MC-DS-CDMA MRC receiver under impulsive noise with
10uN = and 0 (1 1)n uP P n N= ≤ ≤ − .

Chapter 7. Algorithmic Research
159
7.2.2 RECEIVERS COMPARISON
The comparison of several multiple–access system receivers for Walsh, Gold,
Oppermann and Song–Park spreading sequences is shown in Figure 7.13, Figure 7.14, Figure
7.15 and Figure 7.16, respectively. The media is interfered by 10 users transmitting
asynchronously and one multiplex 1kV = , assuming that all the interferers transmit the same
power 0 (1 1)n uP P n N= ≤ ≤ − . Each user delay kΛ is randomly selected from uniform
distribution over [0,LcTc).
0 2 4 6 8 10 12 14 16 18 20 22
10-3
10-2
10-1
100
Eb/No (dB)
Bit
Err
or P
roba
bilit
y
MC-CDMA-MRC
MC-DS-CDMA-MRC
DS-CDMA-MMSE-Suboptimum-FSE
BER bound
Figure 7.13 BER performance comparison under impulsive noise for Walsh spreading sequences for
64cL = and 0 (1 1)n uP P n N= ≤ ≤ − .
The simulations were conducted for a set of Gold, Oppermann, Song–Park and Walsh
sequences randomly selected with lengths cL of 2047, 2039, 2048 and 64 chips,
respectively. Figure 7.13 illustrates three systems that use short spreading codes, where the
suboptimum MMSE receiver achieves the best results, but its performance is limited by the
asynchronous MAI, which prevails at higher SNR.

Chapter 7. Algorithmic Research
160
0 2 4 6 8 10 12 14 16 18 20 22
10-3
10-2
10-1
100
Eb/No (dB)
Bit
Err
or P
roba
bilit
y
DS-CDMA-NLMS-FSEDS-CDMA-RLS-FSE-Enhanced
DS-CDMA-RAKE
DS-CDMA-RLS-FSE
MC-CDMA-MRC
MC-DS-CDMA-MRC
BER bound
Figure 7.14 BER performance comparison under impulsive noise for Gold spreading sequences for
2047cL = and 0 (1 1)n uP P n N= ≤ ≤ − .
From the rest of the figures, it can be concluded that the enhanced version of the RLS
receiver achieves the best results for the same channel conditions and under impulsive
noise. In the Figure 7.14, the receivers using Gold sequences are still restricted by the MAI,
although the best results are for adaptive structure receivers in which a gain of 10 dB
approximately is obtained.
According to Figure 7.15, the enhanced RLS receiver outperforms the NLMS and RAKE
DS-CDMA receivers by 2 dB and 4 dB, respectively. The worst results are for multi–carrier
systems and the classic RLS algorithm, which is vulnerable to the impulsive noise influence
when using polyphase spreading sequences.

Chapter 7. Algorithmic Research
161
0 2 4 6 8 10 12 14 16 18 20 22
10-3
10-2
10-1
100
Eb/No (dB)
Bit
Err
or P
roba
bilit
y
DS-CDMA-NLMS-FSE
DS-CDMA-RLS-FSE-Enhanced
DS-CDMA-RAKE
DS-CDMA-RLS-FSE
MC-CDMA-MRC
MC-DS-CDMA-MRC
BER bound
Figure 7.15 BER performance comparison under impulsive noise for Oppermann spreading sequences
for 2039cL = and 0 (1 1)n uP P n N= ≤ ≤ − .
These results are improved by the use of Song–Park spreading sequences, as stated in
the Figure 7.16. The adaptive algorithms reach the performance bound due to impulsive
noise, which involves a good MAI rejection in asynchronous environments. Moreover, the
combination of Song–Park spreading sequences with the enhanced RLS algorithm
outperforms any other system with a margin of at least 3 dB at low signal–to–noise ratio.
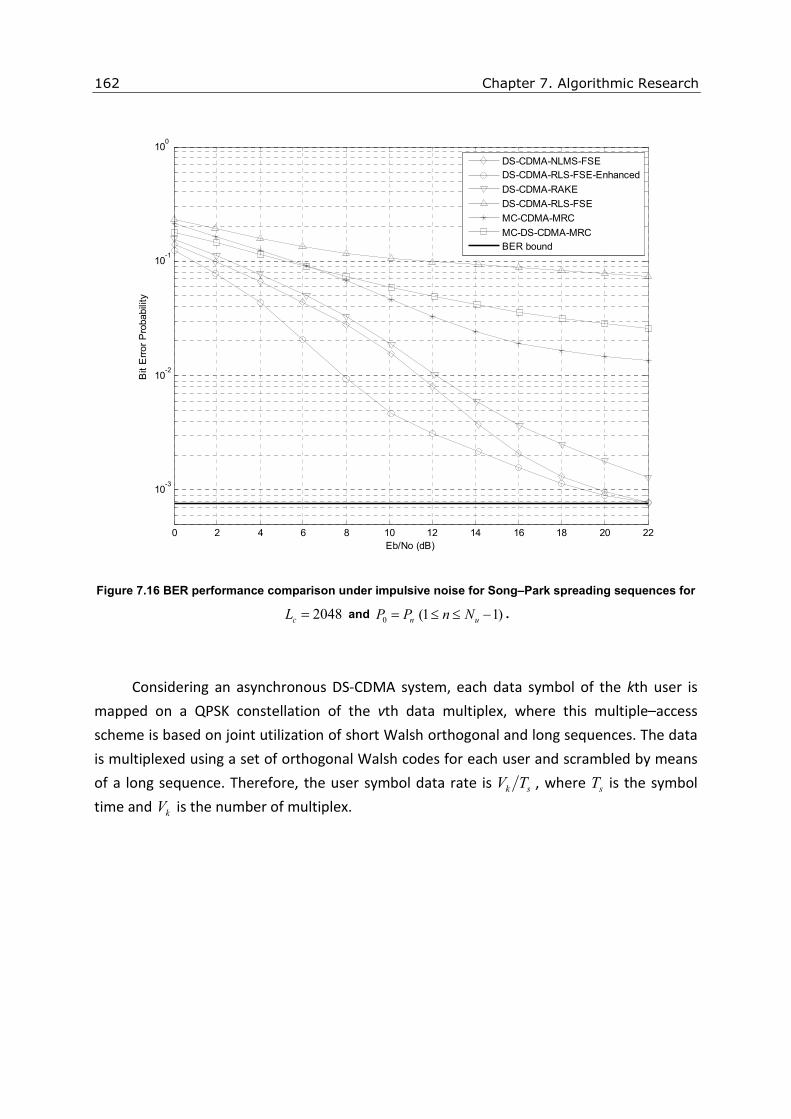
Chapter 7. Algorithmic Research
162
0 2 4 6 8 10 12 14 16 18 20 22
10-3
10-2
10-1
100
Eb/No (dB)
Bit
Err
or P
roba
bilit
y
DS-CDMA-NLMS-FSE
DS-CDMA-RLS-FSE-Enhanced
DS-CDMA-RAKE
DS-CDMA-RLS-FSE
MC-CDMA-MRC
MC-DS-CDMA-MRC
BER bound
Figure 7.16 BER performance comparison under impulsive noise for Song–Park spreading sequences for
2048cL = and 0 (1 1)n uP P n N= ≤ ≤ − .
Considering an asynchronous DS-CDMA system, each data symbol of the kth user is
mapped on a QPSK constellation of the vth data multiplex, where this multiple–access
scheme is based on joint utilization of short Walsh orthogonal and long sequences. The data
is multiplexed using a set of orthogonal Walsh codes for each user and scrambled by means
of a long sequence. Therefore, the user symbol data rate is sk TV , where sT is the symbol
time and kV is the number of multiplex.
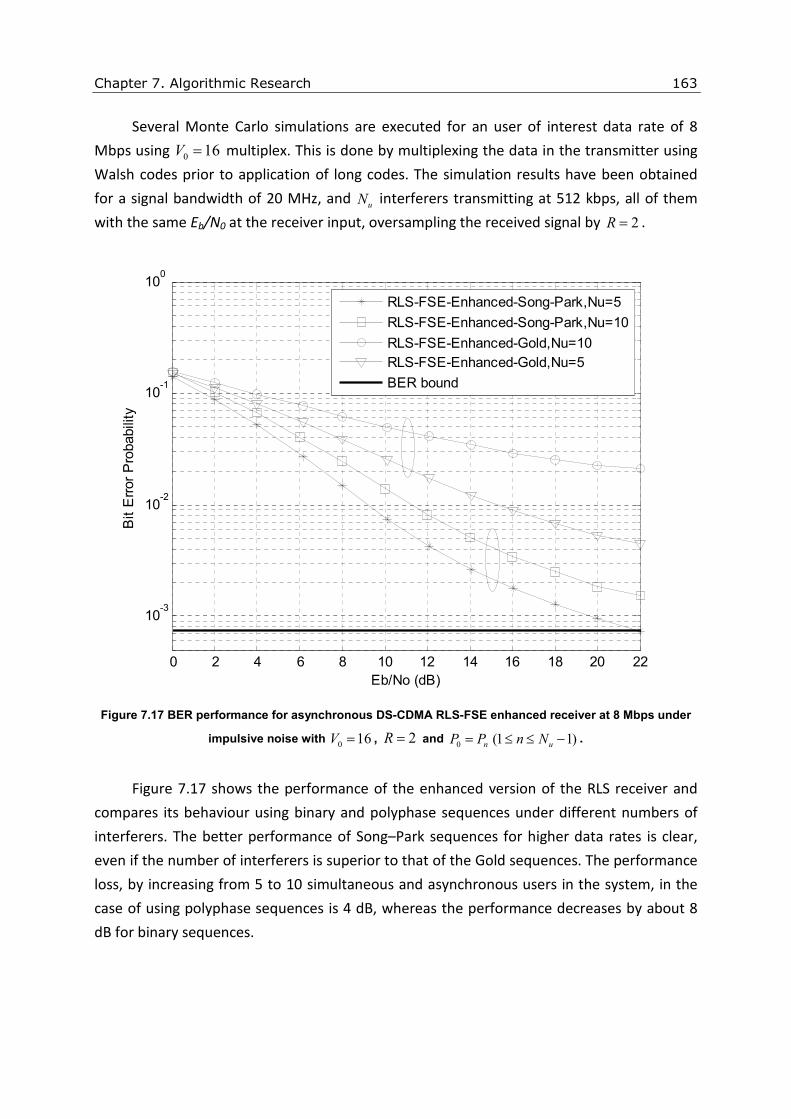
Chapter 7. Algorithmic Research
163
Several Monte Carlo simulations are executed for an user of interest data rate of 8
Mbps using 0 16V = multiplex. This is done by multiplexing the data in the transmitter using
Walsh codes prior to application of long codes. The simulation results have been obtained
for a signal bandwidth of 20 MHz, and uN interferers transmitting at 512 kbps, all of them
with the same Eb/N0 at the receiver input, oversampling the received signal by 2R = .
0 2 4 6 8 10 12 14 16 18 20 22
10-3
10-2
10-1
100
Eb/No (dB)
Bit
Err
or P
roba
bilit
y
RLS-FSE-Enhanced-Song-Park,Nu=5
RLS-FSE-Enhanced-Song-Park,Nu=10
RLS-FSE-Enhanced-Gold,Nu=10RLS-FSE-Enhanced-Gold,Nu=5
BER bound
Figure 7.17 BER performance for asynchronous DS-CDMA RLS-FSE enhanced receiver at 8 Mbps under
impulsive noise with 0 16V = , 2R = and
0 (1 1)n uP P n N= ≤ ≤ − .
Figure 7.17 shows the performance of the enhanced version of the RLS receiver and
compares its behaviour using binary and polyphase sequences under different numbers of
interferers. The better performance of Song–Park sequences for higher data rates is clear,
even if the number of interferers is superior to that of the Gold sequences. The performance
loss, by increasing from 5 to 10 simultaneous and asynchronous users in the system, in the
case of using polyphase sequences is 4 dB, whereas the performance decreases by about 8
dB for binary sequences.

Chapter 7. Algorithmic Research
164
0 2 4 6 8 10 12 14 16 18 20 22
10-3
10-2
10-1
100
Eb/No (dB)
Bit
Err
or P
roba
bilit
y
NLMS-FSE-Song-Park,Nu=5
NLMS-FSE-Song-Park,Nu=10
NLMS-FSE-Gold,Nu=5NLMS-FSE-Gold,Nu=10
BER bound
Figure 7.18 BER performance for asynchronous DS-CDMA NLMS-FSE receiver at 8 Mbps under impulsive
noise with 0 16V = , 2R = and
0 (1 1)n uP P n N= ≤ ≤ − .
Figure 7.18 illustrates the performance comparison of binary and polyphase sequences
for a NLMS receiver. As shown in the previous figure, in this case the polyphase sequences
obtain better results, and its gain loss due to users increment is about 3-4 dB. However, if
the system uses binary Gold sequences, it loses around 9 dB. On the other hand, Figure 7.19
merges the last two figures for 10 interferers, showing how the polyphase sequences
outperform the binary codes using adaptive FSE algorithms by rejecting interference under
impulsive and narrowband noise.
7.2.3 NEAR–FAR EFFECT
The near–far problem is a condition in which a strong signal captures a receiver making
it impossible for the receiver to detect a weaker signal. The near–far problem is particularly
difficult in DS-CDMA systems where transmitters share transmission frequencies and
transmission time. Figure 7.20 shows the performance curves for a NLMS FSE receiver using
binary and polyphase long sequences in a system with 10uN = simultaneous users, where

Chapter 7. Algorithmic Research
165
the interferers transmit twice the power of the user of interest, that is,
02 (1 1)n uP P n N⋅ = ≤ ≤ − .
0 2 4 6 8 10 12 14 16 18 20 22
10-3
10-2
10-1
100
Eb/No (dB)
Bit
Err
or P
roba
bilit
y
NLMS-FSE-Gold
RLS-FSE-Enhanced-Gold
NLMS-FSE-Song-Park
RLS-FSE-Enhanced-Song-Park
BER bound
Figure 7.19 BER performance comparison for asynchronous DS-CDMA receiver at 8 Mbps under
impulsive noise with 0 16V = , 2R = , 10uN = and
0 (1 1)n uP P n N= ≤ ≤ − .
Rejecting the near–far effect, the polyphase sequences (Oppermann and Song–Park) obtain
a better result than pseudo–random binary sequences, where the latter has a performance
loss of 12 dB approximately. On the other hand, the polyphase sequences lose around 6 dB,
which can be considered to be of a large magnitude.
Figure 7.21 illustrates the behaviour of the enhanced RLS receiver using both polyphase and
binary sequences, mitigating the near–far effect from the asynchronous DS-CDMA system.
The performance loss for Song–Park sequences is less than 1 dB, whereas the Gold
sequences suffer from a gain loss of about 10 dB. The Figure 7.21 also shows the curves for a
suboptimum MMSE receiver from the expression (7.27) using short spreading codes, which
shows a performance loss of 2 dB approximately.

Chapter 7. Algorithmic Research
166
0 2 4 6 8 10 12 14 16 18 20 22
10-3
10-2
10-1
100
Eb/No (dB)
Bit
Err
or P
roba
bilit
y
NLMS-FSE-Song-Park
NLMS-FSE-Oppermann
NLMS-FSE-Gold
NLMS-FSE-Song-Park-Ix2
NLMS-FSE-Oppermann-Ix2
NLMS-FSE-Gold-Ix2
BER bound
Figure 7.20 BER performance for NLMS receiver and near-far effect under impulsive noise with 4R = ,
10uN = and 02 (1 1)n uP P n N⋅ = ≤ ≤ − .
7.3 SUMMARY
This chapter examines adaptive implementation of the proposed MMSE receiver in
Chapter 5. What is proposed is an adaptive receiver which is based on an FSE whose tap
weights are updated by an adaptive algorithm; it has the capability of performing multiple-
access interference and narrowband noise suppression by taking advantage of the
cyclostationary properties of the transmitted signals. It is shown that the adaptive receiver
requires the knowledge of fewer parameters compared with the MMSE and RAKE receiver.
Only an estimate of the arrival delay of the first path of the desired user is needed as all
other multipath parameters are estimated by the adaptive FSE.
Two pilot-aided adaptive algorithms are examined: one is a slow but simple steepest
descent structure, and the other a fast but complex recursive structure, which are the well-
known NLMS and RLS algorithms, respectively. Due to the fast convergence rate of the
latter, it suffers from power line impulsive noise, falling in the tap weight update instability.

Chapter 7. Algorithmic Research
167
An enhancement of the RLS algorithm is proposed in order to perform correctly under
impulsive noise.
0 5 10 15 20
10-3
10-2
10-1
100
Eb/No (dB)
Bit
Err
or P
roba
bilit
y
RLS-FSE-Enhanced-GoldRLS-FSE-Enhanced-Song-Park
MMSE-Suboptimum-FSE
RLS-FSE-Enhanced-Gold-Ix2
RLS-FSE-Enhanced-Song-Park-Ix2
MMSE-Suboptimum-FSE-Ix2BER bound
Figure 7.21 BER performance for enhanced RLS receiver and near–far effect under impulsive noise with
4R = , 10uN = and 02 (1 1)n uP P n N⋅ = ≤ ≤ − .
Sequence
Receiver Walsh Gold Song–Park Oppermann
NLMS-FSE
Low Medium Medium
RLS-FSE
Low Low Low
Proposed RLS-FSE
Medium High High
RAKE
Low Medium Medium
MC-CDMA Low Low Low Low
MC-DS-CDMA Low Low Low Low
Table 7.1 Receiver vs. sequences performance comparison
Simulation results are presented to examine the convergence rate and steady–state
MSE performance of the proposed algorithms. Performance results are also presented to
compare single–carrier and multi–carrier multiple–access systems under impulsive noise

Chapter 7. Algorithmic Research
168
with a different set of binary and polyphase sequences. Table 7.1 shows a performance
comparison between several receivers using different families of spreading sequences,
whose BER curves have been shown in the previous performance figures. From this table,
the best performance is obtained with the proposed enhanced RLS-FSE receiver using
polyphase sequences. Within the Smart Grid framework, the computational complexity is an
important factor. However, there are smart implementations for RLS algorithms, which
reduce the computational complexity order.

Chapter 8. Conclusions 169
8 Conclusions
Chapter 8
Conclusions
8.1 WORK SUMMARY
This thesis examines the design and implementation of a Smart Grid powerline
communication device for a Home Area Network environment, where the communication
link robustness and reliability are a requirement. The power line network represents a
shared transmission medium used by all nodes independently. Therefore, multiple–access
techniques must be employed in order to divide transmitted signals, which have to be
orthogonal to each other. In addition to this, system computational complexity, cost and
power consumption need to be taken into account during the design phase. So, simple
systems need to be implemented, so that all the users access the medium asynchronously
without the coordination of any central node.
To understand the challenges of power line communication, and to design robust data
transmission systems, one must have a good understanding of the communication channel
characteristics; in particular, the range of channel frequency response, and the
characteristics of the channel noise. In this thesis, a complete power line channel model is
proposed; it takes into account the noise generated in the network as well as the frequency
attenuation profile of the unmatched network. The proposed model is based on the results
of a channel measurement campaign and proposals from other pieces of work. An analysis

Chapter 8. Conclusions
170
of the impulsive noise effect over transmitted signals reveals a performance bound at the
receiver side, which depends on impulsive noise statistics. The results of these
measurements have been published in [Val et al., 2007].
High data rate multi–carrier systems have shown successful performance under
multipath channels, while their multiple–access extensions MC-CDMA and OFDMA have
produced good results under synchronous powerline communications environments.
Current PLC devices compliant with Smart Grid requirements (HomePlug Green PHY and
G.hn Smart Grid profile) are based on multi–carrier modulations and TDMA schemes, which
is not valid for asynchronous transmission links. The thesis examines the performance of
some multiple–access techniques in asynchronous powerline communications environments
using long binary and complex–valued polyphase spreading sequences, instead of short
orthogonal codes due to their worse cross–correlation properties in asynchronous
environments. Moreover, ignoring the short–term variations, powerline frequency response
between two outlets may remain static for a time. So it is worth pointing out that when
successive symbols from the same user are spread with the same code for a set of users
within a relatively static channel situation, the interference signal seen by a receiver does
not change from symbol to symbol. Therefore, some users are at a disadvantage with
respect to others.
The performance of the single user detector symbol-level MMSE receiver in
asynchronous long sequences of DS-CDMA systems has been analysed and compared with
that of the MC-CDMA receiver by employing an interval guard in the form of a CP. The
performance analysis was based on the SGA method, and validated for a large number of
simultaneous nodes with Monte Carlo simulations under power line impulsive noise, and
using different kinds of long sequences. From the results of the analysis, the superior
performance rejecting the MAI of the single-carrier multiple–access technique in
asynchronous environments was shown. Monte Carlo simulations also confirmed the BER
bound due to impulsive noise. The achieved results have been published in [Val et al., 2010;
Val and Casajús, 2009]
An adaptive architecture is proposed for the practical implementation of the MMSE
receiver, which requires several parameters that are difficult to estimate from the receiver
side. The adaptive receiver is based on an FSE whose tap weights are updated by an adaptive
algorithm, having the capability of performing multiple-access interference and narrowband
noise suppression by taking advantage of the cyclostationary properties of the transmitted
signals; this requires the knowledge of fewer parameters compared with the MMSE and
RAKE receiver. Monte Carlo simulations revealed the good performance of adaptive FSE
receivers in asynchronous DS-CDMA systems compared with MC-CDMA and MC-DS-CDMA

Chapter 8. Conclusions
171
systems, especially using polyphase long sequences. Two well-known pilot-aided NLMS and
RLS adaptive algorithms are examined. The latter suffers from power line impulsive noise,
and a fall in the tap weight update instability. Accordingly, an enhanced version of the RLS
algorithm less vulnerable to the impulsive noise is proposed. At high signal-to-noise ratio,
the MAI degrades the performance of the adaptive FSE receiver using binary long sequences,
whereas the power line impulsive noise prevails over the MAI when using polyphase long
sequences, which achieves the best performance in combination with the enhanced RLS
receiver. The adaptive algorithms show better tracking capabilities and good near-far
interference rejection with long polyphase sequences. The simulation results have been
published in [Val and Casajus-Quiros, 2008].
This thesis avoids complex joint detection techniques at the receiver, such as multi–
user detection and parallel interference cancellers, and focuses on single–user detection
techniques. Concerning single–carrier CDMA system, an MMSE receiver is selected due to its
advantage of ease of adaptation, since standard adaptive algorithms can be employed.
Within the Smart Grid framework, the computational complexity is an important factor.
However, there are smart implementations which can reduce the computational complexity
order of the RLS algorithms.
To summarize, the main contribution of this thesis is an adaptive FSE receiver
architecture based on an enhanced RLS algorithm in an asynchronous DS-CDMA system for a
powerline network under narrowband and impulsive noise. The classic RLS algorithm is
modified in order to improve its performance under powerline impulsive noise. On the other
hand, the DS-CDMA system is based on the use of long polyphase sequences, with which the
overall performance is enhanced. Thus, by means of the modified RLS-FSE algorithm (which
takes advantage of the cyclostationary properties of the signal) and long polyphase
sequences, the MAI and narrowband noise rejection is considerably improved in an
asynchronous network without any cooperation between the transmitting users.

Chapter 8. Conclusions
172
8.2 FUTURE WORK
Some of the topics worthy of further research are highlighted as follows:
a) The work presented here does not take into account the time–varying behavior
of the powerline channel due to network changes. An analysis of the adaptive
algorithms performance tracking the frequency response variations might be
interesting.
b) In addition to user asynchronism, further work should research the
impairments due to time and frequency offset combined with the use of long
polyphase spreading sequences.
References
173
References
References
[1] ABAD, J., L. M. TORRES, and J. C. RIVEIRO, "OFDM and wavelets performance comparison in power line channels," in Power Line Communications and Its Applications, 2005 International Symposium on, 2005, pp. 341-345.
[2] ADLARD, J. F., T. C. TOZER, and A. G. BURR, "Application of frequency-shift filtering to the removal of adjacent channel interference in VLF communications," in GLOBECOM 98, 1998, pp. 3515-3520 vol.6.
[3] AHN, E.-W. and Y.-H. LEE, "Timing synchronization in OFDM-TDMA based power line communication systems," in Power Line Communications and Its Applications, 2003. ISPLC 2003. IEEE International Symposium on, 2003.
[4] ANASTASIADOU, D. and T. ANTONAKOPOULOS, "Broadband communications in the indoor power line environment: The pDSL concept," in Power Line Communications and Its Applications, 2004. ISPLC 2004. IEEE International Symposium on, 2004.
[5] ANASTASIADOU, D. and T. ANTONAKOPOULOS, "Multipath characterization of indoor power-line networks," Power Delivery, IEEE Transactions on, vol. 20, pp. 90-99, 2005.
[6] ASSIMAKOPOULOS, C. and F. N. PAVLIDOU, "Performance evaluation of a recursive LA/IR protocol for MC-CDMA power line communications," in Spread Spectrum Techniques and Applications, 2002 IEEE Seventh International Symposium on, 2002, pp. 677-681 vol.3.
[7] AYYAGARI, D. and C. WAI-CHUNG, "Comparison of TDM and OFDMA access methods for powerline OFDM systems," in Consumer Communications and Networking Conference, 2005. CCNC. 2005 Second IEEE, 2005, pp. 364-368.

References
174
[8] BACCARELLI, E., A. FASANO, and M. BIAGI, "Novel efficient bit-loading algorithms for peak-energy-limited ADSL-type multicarrier systems," Signal Processing, IEEE Transactions on, vol. 50, pp. 1237-1247, 2002.
[9] BARBAROSSA, S., M. POMPILI, and G. B. GIANNAKIS, "Channel-independent synchronization of orthogonal frequency division multiple access systems," Selected Areas in Communications, IEEE Journal on, vol. 20, pp. 474-486, 2002.
[10] BARMADA, S., A. MUSOLINO, and M. RAUGI, "Innovative model for time-varying power line communication channel response evaluation," Selected Areas in Communications, IEEE Journal on, vol. 24, pp. 1317-1326, 2006.
[11] BENYOUCEF, D., "A new statistical model of the noise power density spectrum for powerline communications," in ISPLC2003, Kyoto, Japan, 2003, pp. 136-141.
[12] BERARDINELLI, G., B. E. PRIYANTO, T. B. SORENSEN, and P. MOGENSEN, "Improving SC-FDMA performance by Turbo equalization in UTRA LTE uplink," in Proc. IEEE VTC’2008 (Spring), 2008, pp. 2557-2561.
[13] BIGLIERI, E., "Coding and modulation for a horrible channel," Communications Magazine, IEEE, vol. 41, pp. 92-98, 2003.
[14] BINGHAM, J. A. C., "Multicarrier modulation for data transmission: an idea whose time has come," Communications Magazine, IEEE, vol. 28, pp. 5-14, 1990.
[15] BUMILLER, G., "Network Management System for Telecommunication and Internet Application," in Power Line Communications and Its Applications, 2001. ISPLC 2001. IEEE International
Symposium on, 2001, pp. 129-133.
[16] CAMPELLO, J., "Practical bit loading for DMT," in Communications, 1999. ICC '99. 1999 IEEE International Conference on, 1999, pp. 801-805 vol.2.
[17] CANETE, F. J., J. A. C. ARRABAL, L. D. DEL RIO, and J. T. E. MUNOZ, "Analysis of the cyclic short-term variation of indoor power line channels," Selected Areas in Communications, IEEE Journal on, vol. 24, pp. 1327-1338, 2006.
[18] CANETE, F. J., J. A. CORTES, L. DIEZ, and J. T. ENTRAMBASAGUAS, "Modeling and evaluation of the indoor power line transmission medium," Communications Magazine, IEEE, vol. 41, pp. 41-47, 2003.
[19] CANETE, F. J., L. DIEZ, J. A. CORTES, and J. T. ENTRAMBASAGUAS, "Broadband modelling of indoor power-line channels," Consumer Electronics, IEEE Transactions on, vol. 48, pp. 175-183, 2002.
[20] CENELEC, "Signalling on low-voltage electrical installations in the frequency range 3 kHz to 148.5 kHz," EN 50065, 1991
[21] CENELEC, "Limits and methods of measurement of radio disturbance characteristics of information technology equipment," EN 55022, 1994
[22] CENELEC, "Information technology equipment - Immunity characteristics - Limits and methods of measurement," EN 55024, 1998
[23] CENELEC, "Emission requirements for household appliances, electric tools and similar apparatus," EN 55014, 2000

References
175
[24] CIOCHINA, C., D. MOTTIER, and H. SARI, "An analysis of three multiple access techniques for the uplink of future cellular mobile systems," European transactions on telecommunications, vol. 19, pp. 581-588, 2008.
[25] CORTES, J. A., F. J. CANETE, L. DIEZ, and J. T. ENTRAMBASAGUAS, "Characterization of the cyclic short-time variation of indoor power-line channels response," in Power Line Communications and Its Applications, 2005 International Symposium on, 2005, pp. 326-330.
[26] CORTES, J. A., L. DIEZ, F. J. CANETE, and J. T. ENTRAMBASAGUAS, "Analysis of DMT-FDMA as a multiple access scheme for broadband indoor power-line communications," Consumer Electronics, IEEE Transactions on, vol. 52, pp. 1184-1192, 2006.
[27] COSTA, E., A. FILIPPI, S. OMETTO, M. WECKERLE, and E. SCHULZ, "Asynchronous uplink transmission in FMT-FDMA systems," in Personal, Indoor and Mobile Radio Communications, 2003. PIMRC 2003. 14th IEEE Proceedings on, 2003, pp. 1090-1094 vol.2.
[28] CRUSSIERE, M., J. Y. BAUDAIS, and J. F. HELARD, "A novel joint and iterative scheme for synchronization and channel estimation in MC-CDMA power line communications," in Vehicular Technology Conference, 2004. VTC2004-Fall. 2004 IEEE 60th, 2004, pp. 1723-1727 Vol. 3.
[29] CRUSSIERE, M., J. Y. BAUDAIS, and J. F. HELARD, "Adaptive spread-spectrum multicarrier multiple-access over wirelines," Selected Areas in Communications, IEEE Journal on, vol. 24, pp. 1377-1388, 2006a.
[30] CRUSSIERE, M., J. Y. BAUDAIS, and J. F. HELARD, "Improved throughput over wirelines with adaptive MC-DS-CDMA," in IEEE International Symposium on Spread Spectrum Techniques and Applications, 2006b, pp. 143-147.
[31] CZYLWIK, A., "Comparison between adaptive OFDM and single carrier modulation with frequency domain equalization," in Proc. IEEE VTC’97, 1997, pp. 865-869.
[32] CHEONG YUI, W., R. S. CHENG, K. B. LATAIEF, and R. D. MURCH, "Multiuser OFDM with adaptive subcarrier, bit, and power allocation," Selected Areas in Communications, IEEE Journal on, vol. 17, pp. 1747-1758, 1999.
[33] CHERUBINI, G., E. ELEFTHERIOU, and S. OLCER, "Filtered multitone modulation for very high-speed digital subscriber lines," Selected Areas in Communications, IEEE Journal on, vol. 20, pp. 1016-1028, 2002.
[34] DAI, H. and H. V. POOR, "Iterative Multiuser Detection for DS-CDMA/MC-CDMA Powerline Communications," in CISS'2003, Baltimore (USA), 2003.
[35] DEGARDIN, V., M. LIENARD, and P. DEGAUQUE, "Transmission on indoor power lines: from a stochastic channel model to the optimization and performance evaluation of multicarrier systems," International Journal of Communication Systems, vol. 16, pp. 363-379, 2003.
[36] DEL RE, E., R. FANTACCI, S. MOROSI, and R. SERAVALLE. (2003, 4). Comparison of CDMA and OFDM techniques for downstream power-line communications on low voltage grid.
[37] ECHELON. Available: http://www.echelon.com
[38] EKLUND, C., R. B. MARKS, K. L. STANWOOD, and S. WANG, "IEEE standard 802.16: a technical overview of the WirelessMAN air interface for broadband wireless access," Communications Magazine, IEEE, vol. 40, pp. 98-107, 2002.

References
176
[39] EL-TANANY, M. S., W. YIYAN, and L. HAZY, "OFDM uplink for interactive broadband wireless: analysis and simulation in the presence of carrier, clock and timing errors," Broadcasting, IEEE Transactions on, vol. 47, pp. 3-19, 2001.
[40] EPRI, "Report to NIST on the Smart Grid Interoperability Standards Roadmap," 2009.
[41] ESMAILIAN, T., F. R. KSCHISCHANG, and P. G. GULAK, "In-building power lines as high-speed communication channels: Channel characterization and a test channel ensemble," International Journal of Communication Systems, vol. 16, pp. 381-400, 2003.
[42] ETSI, "3GPP2. Physical Layer Standard for cdma2000 Spread Spectrum Systems " C.S0002-C, v1.0, 2002a
[43] ETSI, "3GPP. Technical Specification Group Radio Access Network; Multiplexing and Channel Coding (FDD)," TS25.212 v5.1.0, 2002b
[44] ETSI, "3GPP. Evolved Universal Terrestrial Radio Access (E-UTRA); Physical Channels and Modulation," TS 36.211, 2007
[45] FASANO, A., "On the optimal discrete bit loading for multicarrier systems with constraints," in Vehicular Technology Conference, 2003. VTC 2003-Spring. The 57th IEEE Semiannual, 2003, pp. 915-919 vol.2.
[46] FAZEL, K. and S. KAISER, Multi-Carrier and Spread Spectrum Systems: John Wiley, 2003.
[47] FCC, "Code of Federal Regulations Title 47 Telecommunication: Chapter I FCC Part 15 - Radio Frequency Devices," 2001
[48] FLIKKEMA, P. G., "On multiple access and capacity in frequency-selective channels," in Information Technology: Coding and Computing, 2001. Proceedings. International Conference on, 2001, pp. 178-182.
[49] GALDA, D., T. GIEBEL, U. ZOLZER, and H. ROHLING, "An Experimental OFDM-Modem for the CENELEC B-Band," in Power Line Communications and Its Applications, 1999. ISPLC 1999. IEEE International Symposium on, 1999, pp. 139-146.
[50] GALLI, S., H. KOGA, and N. KODAMA, "Advanced signal processing for PLCs: Wavelet-OFDM," in Power Line Communications and Its Applications, 2008. ISPLC 2008. IEEE International
Symposium on, 2008, pp. 187-192.
[51] GARDNER, W. A., "Cyclic Wiener filtering: theory and method," Communications, IEEE Transactions on, vol. 41, pp. 151-163, 1993.
[52] GAULT, S., P. CIBLAT, and W. HACHEM, "An OFDMA based modem for powerline communications over the low voltage distribution network," in Power Line Communications and Its Applications, 2005 International Symposium on, 2005, pp. 42-46.
[53] GOLD, R., "Optimal binary sequences for spread spectrum multiplexing," Information Theory, IEEE Transactions on, vol. 13, pp. 619-621, 1967.
[54] HACHEM, W., P. LOUBATON, S. MARCOS, and R. SAMY, "Multiple access communication over the power line channel: a CDMA approach," in Global Telecommunications Conference, 2001. GLOBECOM '01. IEEE, 2001, pp. 420-424 vol.1.

References
177
[55] HAO, Z., S. JAGANNATHAN, and J. M. CIOFFI, "Multiuser OFDMA Resource Allocation Algorithms for In-Home Power-Line Communications," in Global Telecommunications Conference, 2008. IEEE GLOBECOM 2008. IEEE, 2008, pp. 1-5.
[56] HARA, S. and R. PRASAD, "Overview of multicarrier CDMA," Communications Magazine, IEEE, vol. 35, pp. 126-133, 1997.
[57] HAUMONTE, L. and L. DENEIRE, "Scattering Division Multiple Access," in Power Line Communications and Its Applications, 2007. ISPLC '07. IEEE International Symposium on, 2007, pp. 476-481.
[58] HAUNG, D. and K. B. LATAIEF, "An interference cancellation scheme for carrier frequency offsets correction in OFDMA systems," IEEE Trans. Commun., vol. 53, pp. 1155-1165, 2005.
[59] HAYASAKI, T., D. UMEHARA, S. DENNO, and M. MORIKURA, "A bit-Loaded OFDMA for in-home power line communications," in Power Line Communications and Its Applications, 2009. ISPLC 2009. IEEE International Symposium on, 2009, pp. 171-176.
[60] HAYKIN, S., Adaptive Filter Theory, Fourth Edition: Prentice Hall, 2002.
[61] HÉLARD, M., R. LE GOUABLE, J. F. HÉLARD, and J. Y. BAUDAIS, "Multicarrier CDMA for future wideband wireless networks," Annales des télécommunications, vol. 56, pp. 260-274, 2001.
[62] HENSEN, C. and W. SCHULZ, "High rate data communication via power distribution network using DS-CDMA technique," in Universal Personal Communications Record, 1997. Conference Record., 1997 IEEE 6th International Conference on, 1997, pp. 805-808 vol.2.
[63] HOLTZMAN, J. M., "CDMA forward link waterfilling power control," in Vehicular Technology Conference Proceedings, 2000. VTC 2000-Spring Tokyo. 2000 IEEE 51st, 2000, pp. 1663-1667 vol.3.
[64] HOMEGRID. Available: http://www.homegridforum.org
[65] HOMEPLUG, "HomePlug 1.0 specification," 2001
[66] HOMEPLUG, "HomePlug AV baseline specification," 2007
[67] HOQUE, K. M. R., L. DEBIASI, and F. G. B. DE NATALE, "Performance analysis of MC-CDMA power line communication system," in 4th IEEE and IFIP International Conference on Wireless and Optical Communications Networks, WOCN 2007, 2007.
[68] HOSONO, M., "Improved Automatic meter reading and load control system and its operational achievement," in 4th international conference on metering, apparatus and tariffs for electricity supply, 1982, pp. 90-94.
[69] HRASNICA, H., A. HAIDINE, and R. LEHNERT, Broadband Powerline Communications Networks-Network Design: John Wiley & Sons, Ltd, 2004.
[70] HUANG, Y.-F., T.-H. TAN, C.-H. CHENG, and N.-C. WANG, "Performance of partial parallel interference cancellation with MC-CDMA transmission techniques for power line communication systems," WTOC, vol. 7, pp. 729-738, 2008.
[71] IEC, "CISPR 22, Information Technology Equipment – Radio disturbance characteristics – Limits and methods of measurement, Sixth Edition," 2008

References
178
[72] JINGTAO, Z. and D. W. MATOLAK, "Performance evaluation of OFDMA and multicarrier CDMA systems on airport surface area channels," in Integrated Communications, Navigation and Surveillance Conference, 2008. ICNS 2008, 2008, pp. 1-8.
[73] KAISER, S., "MC-FDMA and MC-TDMA versus MC-CDMA and SS-MC-MA: performance evaluation for fading channels," in Spread Spectrum Techniques and Applications, 1998. Proceedings., 1998 IEEE 5th International Symposium on, 1998, pp. 200-204 vol.1.
[74] KAISER, S., "OFDM code-division multiplexing in fading channels," Communications, IEEE Transactions on, vol. 50, pp. 1266-1273, 2002.
[75] KAISER, S. and W. A. KRZYMIEN, "Performance effects of the uplink asynchronism in a spread spectrum multi-carrier multiple access system," European transactions on
telecommunications, vol. 10, pp. 399-406, 1999.
[76] KARAMEHMEDOVIC, D., M. K. LAKSHMANAN, and H. NIKOOKAR, "Performance of Wavelet Packet Modulation and OFDM in the presence of carrier frequency and phase noise," in Wireless Technology, 2008. EuWiT 2008. European Conference on, 2008, pp. 166-169.
[77] KATAYAMA, M., T. YAMAZATO, and H. OKADA, "A mathematical model of noise in narrowband power line communication systems," Selected Areas in Communications, IEEE Journal on, vol. 24, pp. 1267-1276, 2006.
[78] KATSIS, P. L., G. D. PAPADOPOULOS, and F. N. PAVLIDOU, "Coded MC-CDMA systems for power line communications," in Telecommunications in Modern Satellite, Cable and Broadcasting Service, 2003. TELSIKS 2003. 6th International Conference on, 2003, pp. 153-156 vol.1.
[79] KOFFMAN, I. and V. ROMAN, "Broadband wireless access solutions based on OFDM access in IEEE 802.16," Communications Magazine, IEEE, vol. 40, pp. 96-103, 2002.
[80] KONDO, S. and L. MILSTEIN, "On the use of multicarrier direct sequence spread spectrum systems," in Military Communications Conference, 1993. MILCOM '93. Conference record. 'Communications on the Move'., IEEE, 1993, pp. 52-56 vol.1.
[81] KYUNBYOUNG, K., P. MYONGHEE, and H. DAESIK, "Performance analysis of asynchronous MC-CDMA systems with a guard period in the form of a cyclic prefix," Communications, IEEE Transactions on, vol. 54, pp. 216-220, 2006.
[82] KYUNBYOUNG, K., K. TAEYOUNG, C. SOOYONG, K. CHANGEON, and H. DAESIK, "Performance analysis of asynchronous MC-CDMA systems with a cyclic prefix," in MILCOM 2002. Proceedings, 2002, pp. 558-561 vol.1.
[83] KYUNBYOUNG, K., K. TAEYOUNG, C. SOOYONG, and H. DAESIK, "Semianalytical approach of asynchronous MC-CDMA systems with a cyclic prefix," Communications Letters, IEEE, vol. 9, pp. 142-144, 2005.
[84] LAMPE, L. H.-J., "Medium Access Scheme for TDMA," in Power Line Communications and Its Applications, 2001. ISPLC 2001. IEEE International Symposium on, 2001.
[85] LANGFELD, P. J., "OFDM System Synchronization for Powerline Communication," in Power Line Communications and Its Applications, 2000. ISPLC 2000. IEEE International Symposium on, 2000, pp. 15-24.

References
179
[86] LEE, M. K., H. A. LATCHMAN, R. E. NEWMAN, S. KATAR, and L. YONGE, "Field performance comparison of IEEE 802.11b and HomePlug 1.0," in Local Computer Networks, 2002. Proceedings. LCN 2002. 27th Annual IEEE Conference on, 2002, pp. 598-599.
[87] LEE, M. K., R. E. NEWMAN, H. A. LATCHMAN, S. KATAR, and L. YONGE, "HomePlug 1.0 Powerline Communication LANs – Protocol Description and Performance Results version 5.4," International Journal of Communication Systems, pp. 1-21, 2000.
[88] LI, Y. G. and N. R. SOLLENBERGER, "Clustered OFDM with channel estimation for high rate wireless data," Communications, IEEE Transactions on, vol. 49, pp. 2071-2076, 2001.
[89] LIENARD, M., M. O. CARRION, V. DEGARDIN, and P. DEGAUQUE, "Modeling and Analysis of In-Vehicle Power Line Communication Channels," Vehicular Technology, IEEE Transactions on, vol. 57, pp. 670-679, 2008.
[90] LUKE, H. D., "Almost-perfect polyphase sequences with small phase alphabet," Information Theory, IEEE Transactions on, vol. 43, pp. 361-363, 1997.
[91] MA, Y. H., P. L. SO, and E. GUNAWAN, "Performance analysis of OFDM systems for broadband power line communications under impulsive noise and multipath effects," Power Delivery, IEEE Transactions on, vol. 20, pp. 674-682, 2005.
[92] MALLIER, S., F. NOUVEL, J. Y. BAUDAIS, D. GARDAN, and A. ZEDDAM, "Multi-carrier CDMA over copper lines - comparison of performances with the ADSL system," in Electronic Design, Test and Applications, 2002. Proceedings. The First IEEE International Workshop on, 2002, pp. 450-452.
[93] MANTRAVADI, A. and V. V. VEERAVALLI, "MMSE detection in asynchronous CDMA systems: an equivalence result," Information Theory, IEEE Transactions on, vol. 48, pp. 3128-3137, 2002.
[94] MASSOUD AMIN, S. and B. F. WOLLENBERG, "Toward a smart grid: power delivery for the 21st century," Power and Energy Magazine, IEEE, vol. 3, pp. 34-41, 2005.
[95] MILSTEIN, L. B., "Wideband code division multiple access," Selected Areas in Communications, IEEE Journal on, vol. 18, pp. 1344-1354, 2000.
[96] MILSTEIN, L. B., "Wideband code division multiple access," in Radio and Wireless Conference, 2001. RAWCON 2001. IEEE, 2001, pp. 1-3.
[97] MIRBAGHERI, A. and Y. C. YOON, "A linear MMSE receiver for multipath asynchronous random-CDMA with chip pulse shaping," Vehicular Technology, IEEE Transactions on, vol. 51, pp. 1072-1086, 2002.
[98] MONTAZERI, A. and J. POSHTAN, "Reducing the Computational Complexity of an RLS-Based Adaptive Controller in ANVC Applications," in Advances in Computer Science and Engineering. vol. 6, SARBAZI-AZAD, H., B. PARHAMI, S.-G. MIREMADI, and S. HESSABI, Eds., ed: Springer Berlin Heidelberg, 2009, pp. 259-266.
[99] MORELLI, M., "Timing and Frequency Synchronization for the Uplink of an OFDMA System," Communications, IEEE Transactions on, vol. 52, pp. 166-166, 2004.
[100] MYONGHEE, P., K. KYUNBYOUNG, P. BYUNGJOON, and H. DAESIK, "Effects of asynchronous MAI on average SEP performance of OFDMA uplink systems over frequency-selective Rayleigh fading channels," Communications, IEEE Transactions on, vol. 58, pp. 586-599, 2010.

References
180
[101] MYONGHEE, P., K. KYUNBYOUNG, Y. HWASUN, and H. DAESIK, "Performance analysis of OFDMA uplink systems with symbol timing misalignment," Communications Letters, IEEE, vol. 7, pp. 376-378, 2003.
[102] MYUNG, H. G., J. LIM, and D. J. GOODMAN, "Single carrier FDMA for uplink wireless transmission," IEEE Veh. Tech. Mag, vol. 1, pp. 30-38, September 2006.
[103] NAKAGAWA, K., S. HOSOYA, M. TOKUDA, and Y. IGATA, "Narrowband interference wave immunity characteristics of high-speed PLC with Wavelet-OFDM," in Power Line Communications and Its Applications, 2009. ISPLC 2009. IEEE International Symposium on, 2009, pp. 113-118.
[104] NAVIDPOUR, S. M., P. AMIRSHAHI, and M. KAVEHRAD, "Performance analysis of coded MC-CDMA in powerline communication channel with implusive noise," in 2006 IEEE International Symposium on Power Line Communications and Its Applications, ISPLC'06, 2006, pp. 267-272.
[105] OKAZAKI, H. and M. KAWASHIMA, "A transmitting and receiving method for CDMA communications over indoor electrical power lines," in Circuits and Systems, 1998. ISCAS '98. Proceedings of the 1998 IEEE International Symposium on, 1998, pp. 522-528 vol.6.
[106] OPPERMANN, J. and B. S. VUCETIC, "Complex spreading sequences with a wide range of correlation properties," Communications, IEEE Transactions on, vol. 45, pp. 365-375, 1997.
[107] PAPANDRIOPOULOS, J. and J. S. EVANS, "Low-Complexity Distributed Algorithms for Spectrum Balancing in Multi-User DSL Networks," in Proc. IEEE ICC, 2006, pp. 3270–3275.
[108] PARK, S. R., I. SONG, S. YOON, and J. LEE, "A new polyphase sequence with perfect even and good odd cross-correlation functions for DS/CDMA systems," Vehicular Technology, IEEE Transactions on, vol. 51, pp. 855-866, 2002.
[109] PARKVALL, S., "Variability of user performance in cellular DS-CDMA-long versus short spreading sequences," Communications, IEEE Transactions on, vol. 48, pp. 1178-1187, 2000.
[110] PAVLIDOU, N., A. J. HAN VINCK, J. YAZDANI, and B. HONARY, "Power line communications: state of the art and future trends," Communications Magazine, IEEE, vol. 41, pp. 34-40, 2003.
[111] PHILIPPS, H., "Performance measurements of power-line channels at high frequencies," in Proc. of the International Symposium on Power-Line Communications and its Applications
(ISPLCA), Tokyo, 1998, pp. 229-237.
[112] PROAKIS, J. G., Digital Communications, 4th ed. New York: McGraw-Hill, 2000.
[113] RAGHUNATH, K. and A. CHOCKALINGAM, "SC-FDMA Versus OFDMA: Sensitivity to Large Carrier Frequency and Timing Offsets on the Uplink," in Global Telecommunications Conference, 2009. GLOBECOM 2009. IEEE, 2009a, pp. 1-6.
[114] RAGHUNATH, K. and A. CHOCKALINGAM, "SIR analysis and interference cancellation in uplink OFDMA with large carrier frequency and timing offsets," IEEE Trans. Wireless Commun., vol. 8, pp. 2202-2208, 2009b.
[115] RAPAJIC, P. B. and B. S. VUCETIC, "Adaptive receiver structures for asynchronous CDMA systems," Selected Areas in Communications, IEEE Journal on, vol. 12, pp. 685-697, 1994.
[116] RAPPAPORT, T. S., Wireless Communications Principles and Practice: Prentice Hall, 1996.
References
181
[117] REUTER, M. and J. R. ZEIDLER, "Nonlinear effects in LMS adaptive equalizers," Signal Processing, IEEE Transactions on, vol. 47, pp. 1570-1579, 1999.
[118] SANCHA, S., F. J. CANETE, L. DIEZ, and J. T. ENTRAMBASAGUAS, "A Channel Simulator for Indoor Power-line Communications," in Power Line Communications and Its Applications, 2007. ISPLC '07. IEEE International Symposium on, 2007, pp. 104-109.
[119] SARI, H. and G. KARAM, "Orthogonal frequency-division multiple access and its application to CATV networks," Eur. Trans. Telecommun., vol. 9, pp. 507–516, 1998.
[120] SARI, H., G. KARAM, and I. JEANCLAUDE, "Frequency domain equalization of mobile radio and terrestrial broadcast channels," in Global Telecommunications Conference, 1994. GLOBECOM 1994. IEEE, 1994.
[121] SARI, H., G. KARAM, and I. JEANCLAUDE, "Transmission techniques for digital terrestrial TV broadcasting," Communications Magazine, IEEE, vol. 33, pp. 100-109, 1995.
[122] SARTENAER, T., F. HORLIN, and L. VANDENDORPE, "Multiple access techniques for wideband upstream powerline communications: CAP-CDMA and DMT-FDMA," in ICC 2000, 2000, pp. 1064-1068.
[123] SER WAH, O., C. YING LAY, N. KHIAN NAM, M. RONGHONG, M. YINGHUI, Z. YONGHONG, and A. A. SYED NAVEEN, "Cognitive power line communication system for multiple channel access," in Power Line Communications and Its Applications, 2009. ISPLC 2009. IEEE International
Symposium on, 2009, pp. 47-52.
[124] SJOBERG, F., R. NILSSON, M. ISAKSSON, P. ODLING, and P. O. BORJESSON, "Asynchronous Zipper [subscriber line duplex method]," in Communications, 1999. ICC '99. 1999 IEEE International Conference on, 1999, pp. 231-235 vol.1.
[125] SOFER, E. and Y. SEGAL, "Tutorial on multi-access OFDM (OFDMA) technology," DOC: IEEE 802.22-05-0005r0., 2005.
[126] SRINIVASA PRASANNA, G. N., A. LAKSHMI, S. SUMANTH, V. SIMHA, J. BAPAT, and G. KOOMULLIL, "Data communication over the smart grid," in Power Line Communications and Its Applications, 2009. ISPLC 2009. IEEE International Symposium on, 2009, pp. 273-279.
[127] STOTT, J., "PLT and broadcasting – can they co-exist?," presented at the EMCUK 2004, Newbury, 2004.
[128] SURENDRAN, K. S. and H. LEUNG, "An analog spread-spectrum interface for power-line data communication in home networking," Power Delivery, IEEE Transactions on, vol. 20, pp. 80-89, 2005.
[129] TERRÉ, M., L. FÉTY, D. FILHO, and H. N., "Waterfilling for CDMA," in Proc. IEEE OFDM Int. Workshop, 2003, pp. 85-88.
[130] THERRIEN, C. W., Discrete random signal and statistical signal processing. Monterey, CA: Pretince Hall, 1992.
[131] TIA/EIA, "Mobile station-base station compatibility standard for dual-mode wide band spread spectrum cellular system," May 1995.
References
182
[132] TLICH, M., H. CHAOUCHE, A. ZEDDAM, and P. PAGANI, "Novel approach for PLC impulsive noise modelling," in Power Line Communications and Its Applications, 2009. ISPLC 2009. IEEE International Symposium on, 2009, pp. 20-25.
[133] TLILI, F., F. ROUISSI, and A. GHAZEL, "Precoded OFDM for power line broadband communication," in Circuits and Systems, 2003. ISCAS '03. Proceedings of the 2003 International Symposium on, 2003, pp. II-109-II-112 vol.2.
[134] TOMOYA URUSHIHARA, H. S., "Multiuser detection with decorrelating detector for asynchronous CDMA systems," Electronics and Communications in Japan (Part I: Communications), vol. 88, pp. 32-43, 2005.
[135] TONELLO, A., R. RINALDO, and L. SCAREL, "Detection algorithms for wide band impulse modulation based systems over power line channels," Proceedings of ISPLC 2004, 2004.
[136] TONELLO, A. M., "Asynchronous multicarrier multiple access: Optimal and sub-optimal detection and decoding," Bell Labs Technical Journal, vol. 7, pp. 191-217, 2002.
[137] TONELLO, A. M., "A concatenated multitone multiple-antenna air-interface for the asynchronous multiple-access channel," Selected Areas in Communications, IEEE Journal on, vol. 24, pp. 457-469, 2006a.
[138] TONELLO, A. M., "Time Domain and Frequency Domain Implementations of FMT Modulation Architectures," in Acoustics, Speech and Signal Processing, 2006. ICASSP 2006 Proceedings. 2006 IEEE International Conference on, 2006b, pp. IV-IV.
[139] TONELLO, A. M., "A Wide Band Modem Based on Impulse Modulation and Frequency Domain Signal Processing for Powerline Communication," in Global Telecommunications Conference, 2006. GLOBECOM '06. IEEE, 2006c, pp. 1-6.
[140] TONELLO, A. M., J. A. CORTES, and S. D'ALESSANDRO, "Optimal time slot design in an OFDM-TDMA system over power-line time-variant channels," in Power Line Communications and Its Applications, 2009. ISPLC 2009. IEEE International Symposium on, 2009, pp. 41-46.
[141] TONELLO, A. M., N. LAURENTI, and S. PUPOLIN, "Analysis of the uplink of an asynchronous multi-user DMT OFDMA system impaired by time offsets, frequency offsets, and multi-path fading," in Vehicular Technology Conference, 2000. IEEE VTS-Fall VTC 2000. 52nd, 2000, pp. 1094-1099 vol.3.
[142] TONELLO, A. M. and F. PECILE, "A Filtered Multitone Modulation Modem for Multiuser Power Line Communications with an Efficient Implementation," in Power Line Communications and Its Applications, 2007. ISPLC '07. IEEE International Symposium on, 2007, pp. 155-160.
[143] TONELLO, A. M. and F. PECILE, "Efficient Architectures for Multiuser FMT Systems and Application to Power Line Communications," Communications, IEEE Transactions on, vol. 57, pp. 1275-1279, 2009.
[144] UMEHARA, D., S. HIRATA, S. DENNO, and Y. MORIHIRO, "Modeling of impulse noise for indoor broadband power line communications," in Proc. ISITA 2006, Seoul (Korea), 2006, pp. 195-200.
[145] VAL, I. and F. J. CASAJUS-QUIROS, "Long polyphase sequences for adaptive MMSE detector in asynchronous CDMA PLC system," Electronics Letters, vol. 44, pp. 918-919, 2008.

References
183
[146] VAL, I., F. J. CASAJUS-QUIROS, and A. ARRIOLA, "Performance analysis of asynchronous multicarrier code division multiple access against direct sequence code division multiple access and long polyphase sequences for uplink powerline communication systems with impulsive noise," Communications, IET, vol. 4, pp. 606-617, 2010.
[147] VAL, I. and F. J. CASAJÚS, "Performance Analysis of Asynchronous MC-CDMA Long Sequences for PLC Systems with Impulsive Noise," in WSPLC'2009, Udine (Italy), 2009, pp. 60-63.
[148] VAL, I., F. J. CASAJÚS, J. BILBAO, and A. ARRIOLA, "Measuring and Modeling an Indoor Powerline Channel," in SPECTS'2007, San Diego (USA), 2007, pp. 521-526.
[149] VAN DE BEEK, J. J., P. O. BORJESSON, M. L. BOUCHERET, D. LANDSTROM, J. M. ARENAS, P. ODLING, C. OSTBERG, M. WAHLQVIST, and S. K. WILSON, "A time and frequency synchronization scheme for multiuser OFDM," Selected Areas in Communications, IEEE Journal on, vol. 17, pp. 1900-1914, 1999.
[150] VAN DER GRACHT, P. and R. DONALDSON, "Communication Using Pseudonoise Modulation on Electric Power Distribution Circuits," Communications, IEEE Transactions on vol. 33, pp. 964 - 974 1985.
[151] VEMBU, S. and A. J. VITERBI, "Two different philosophies in CDMA-a comparison," in Vehicular Technology Conference, 1996. 'Mobile Technology for the Human Race'., IEEE 46th, 1996, pp. 869-873 vol.2.
[152] VERDÚ, S., Multiuser Detection. Cambridge, UK: Cambridge University Press, 1998.
[153] WANG, H., X. YOU, B. JIANG, and X. GAO, "Performance analysis of frequency domain equalization in SC-FDMA systems," in Proc. ICC’2008, 2008, pp. 4342-4347.
[154] WEI, L. and C. SCHLEGEL, "Synchronization requirements for multi-user OFDM on satellite mobile and two-path Rayleigh fading channels," Communications, IEEE Transactions on, vol. 43, pp. 887-895, 1995.
[155] WON MEE, J. and L. MOON WOO, "Asynchronous uplink MC-CDMA with multiuser detection and frequency offset," in Advanced Communication Technology, 2006. ICACT 2006. The 8th International Conference, 2006, p. 6 pp.
[156] WONG, T. F., T. M. LOK, and J. S. LEHNERT, "Asynchronous multiple-access interference suppression and chip waveform selection with aperiodic random sequences," Communications, IEEE Transactions on, vol. 47, pp. 103-114, 1999.
[157] WONGTHAVARAWAT, K. and A. GANZ, "IEEE 802.16 based last mile broadband wireless military networks with quality of service support," in Military Communications Conference, 2003. MILCOM 2003. IEEE, 2003, pp. 779-784 Vol.2.
[158] XIANG, G. and N. TUNG SANG, "Performance of asynchronous orthogonal multicarrier CDMA system in frequency selective fading channel," Communications, IEEE Transactions on, vol. 47, pp. 1084-1091, 1999.
[159] YEE, N., J. P. LINNARTZ, and G. FETTWEIS, "Multi-carrier CDMA in indoor wireless radio networks," in Proc. IEEE Pers., Indoor, Mobile Radio Commun. Symp., 1993, pp. 109-113.
[160] YU-JUNG, C., C. FENG-TSUN, and C. C. J. KUO, "Cross-layer QoS Analysis of Opportunistic OFDM-TDMA and OFDMA Networks," Selected Areas in Communications, IEEE Journal on, vol. 25, pp. 657-666, 2007.

References
184
[161] ZBYDNIEWSKI, L., T. P. ZIELINSKI, and P. TURCZA, "Influence of time-frequency tiling on BER performance in Discrete Wavelet Multitone power line transmission," in Power Line Communications and Its Applications, 2009. ISPLC 2009. IEEE International Symposium on, 2009, pp. 182-187.
[162] ZHANG, K. and Y. L. GUAN, "Performance of asynchronous MC-CDMA systems with maximal ratio combining in frequency-selective fading channels," Eurasip Journal on Applied Signal Processing, vol. 2004, pp. 1595-1603, 2004.
[163] ZIMMERMANN, M. and K. DOSTERT, "An Analysis of the Broadband Noise Scenario in Powerline Networks," in Proc. 4th Int'l. Symp. Powerline Commun. and Its Apps., 2000, pp. 131-138.
[164] ZIMMERMANN, M. and K. DOSTERT, "Analysis and modeling of impulsive noise in broad-band powerline communications," Electromagnetic Compatibility, IEEE Transactions on, vol. 44, pp. 249-258, 2002a.
[165] ZIMMERMANN, M. and K. DOSTERT, "A multipath model for the powerline channel," Communications, IEEE Transactions on, vol. 50, pp. 553-559, 2002b.
[166] ZSOLDOS, G., F. BALÁZS, S. IMRE, and L. PAP, "Performance Comparison of Different Powerline Telecommunication Architectures," in INOWO'2001, Hamburg (Germany), 2001.

References
185
Publications related to the thesis
Journal Publications
VAL, I. and F. J. CASAJUS-QUIROS, "Long polyphase sequences for adaptive MMSE detector in asynchronous CDMA PLC system," Electronics Letters, vol. 44, pp. 918-919, 2008.
VAL, I., F. J. CASAJUS-QUIROS, and A. ARRIOLA, "Performance analysis of asynchronous multicarrier code division multiple access against direct sequence code division multiple access and long polyphase sequences for uplink powerline communication systems with impulsive noise," Communications, IET, vol. 4, pp. 606-617, 2010.
VAL, I., and F. J. CASAJUS-QUIROS, " Performance analysis of MMSE receiver for asynchronous DS-CDMA using long polyphase sequences in powerline smart grid appliances under impulsive noise," Eurasip Journal on Advances in Signal Processing (Under revision).
Conference Papers
VAL, I. and F. J. CASAJÚS, "Performance Analysis of Asynchronous MC-CDMA Long Sequences for PLC Systems with Impulsive Noise," in WSPLC'2009, Udine (Italy), 2009, pp. 60-63.
VAL, I., F. J. CASAJÚS, J. BILBAO, and A. ARRIOLA, "Measuring and Modeling an Indoor Powerline Channel," in SPECTS'2007, San Diego (USA), 2007, pp. 521-526.
VAL, I. and F. J. CASAJÚS, " Long spreading sequences for asynchronous multiple-access systems in powerline smart grid appliances under impulsive noise," in SmartGridComm'2011 (Under revision).