Embed Size (px)
Citation preview

UNITED STATES
SECURITIES AND EXCHANGE COMMISSIONWASHINGTON, D.C. 20549
____________________________________
FORM 10-K_____________________________________
x ANNUAL REPORT PURSUANT TO SECTION 13 OR 15(d) OF THE SECURITIES EXCHANGE ACT OF 1934For the Fiscal Year Ended December 31, 2015
-OR-
¨ TRANSITION REPORT FILED PURSUANT TO SECTION 13 OR 15(d) OF THESECURITIES EXCHANGE ACT OF 1934
COMMISSION FILE NUMBER 1-12291
THE AES CORPORATION(Exact name of registrant as specified in its charter)
Delaware 54 1163725(State or other jurisdiction of
incorporation or organization) (I.R.S. Employer
Identification No.)4300 Wilson Boulevard Arlington, Virginia 22203
(Address of principal executive offices) (Zip Code)
Registrant's telephone number, including area code: (703) 522-1315Securities registered pursuant to Section 12(b) of the Act:
Title of Each Class Name of Each Exchange on Which RegisteredCommon Stock, par value $0.01 per share New York Stock Exchange
AES Trust III, $3.375 Trust Convertible Preferred Securities New York Stock ExchangeSecurities registered pursuant to Section 12(g) of the Act:
NoneIndicate by check mark if the Registrant is a well-known seasoned issuer, as defined in Rule 405 of the Securities Act. Yes x No oIndicate by check mark if the Registrant is not required to file reports pursuant to Section 13 or Section 15 (d) of the Act. Yes o No xIndicate by check mark whether the registrant (1) has filed all reports required to be filed by Section 13 or 15(d) of the Securities Exchange Act of 1934 during the
preceding 12 months (or for such shorter period that the registrant was required to file such reports), and (2) has been subject to such filing requirements for the past90 days. Yes x No o
Indicate by check mark whether the registrant has submitted electronically and posted on its corporate Web site, if any, every Interactive Data File required to be submittedand posted pursuant to Rule 405 of Regulation S-T during the preceding 12 months (or for such shorter period that the registrant was required to submit and post suchfiles). Yes x No o
Indicate by check mark if disclosure of delinquent filers pursuant to Item 405 of Regulation S-K is not contained herein, and will not be contained, to the best of registrant'sknowledge, in definitive proxy or information statements incorporated by reference in Part III of this Form 10-K or any amendment to this Form 10-K. x
Indicate by check mark whether the registrant is a large accelerated filer, an accelerated filer, a non-accelerated filer or a smaller reporting company. See the definitions of“large accelerated filer,” “accelerated filer” and “smaller reporting company” in Rule 12b-2 of the Exchange Act. (Check one):
Large accelerated filer x Accelerated filer o Non-accelerated filer o Smaller reporting company o
(Do not check if a smaller
reporting company) Indicate by check mark whether the Registrant is a shell company (as defined in Rule 12b-2 of the Exchange Act). Yes o No xThe aggregate market value of the voting and non-voting common equity held by non-affiliates on June 30, 2015 , the last business day of the Registrant's most recently
completed second fiscal quarter (based on the adjusted closing sale price of $12.88 of the Registrant's Common Stock, as reported by the New York Stock Exchange on suchdate) was approximately $8.79 billion .
The number of shares outstanding of Registrant's Common Stock, par value $0.01 per share, on February 18, 2016 was 659,733,335
DOCUMENTS INCORPORATED BY REFERENCE
Portions of Registrant's Proxy Statement for its 2016 annual meeting of stockholders are incorporated by reference in Parts II and III

THE AES CORPORATION FISCAL YEAR 2015 FORM 10-KTABLE OF CONTENTS
Glossary of Terms 1PART I 4
ITEM 1. BUSINESS 5ITEM 1A. RISK FACTORS 55ITEM 1B. UNRESOLVED STAFF COMMENTS 70ITEM 2. PROPERTIES 70ITEM 3. LEGAL PROCEEDINGS 70ITEM 4. MINE SAFETY DISCLOSURES 75
PART II 76ITEM 5. MARKET FOR REGISTRANT’S COMMON EQUITY, RELATED STOCKHOLDER MATTERS AND ISSUER PURCHASES OF EQUITY SECURITIES 76ITEM 6. SELECTED FINANCIAL DATA 77ITEM 7. MANAGEMENT’S DISCUSSION AND ANALYSIS OF FINANCIAL CONDITION AND RESULTS OF OPERATIONS 78
Overview of 2015 Results and Strategic Performance 78Review of Consolidated Results of Operations 80SBU Performance Analysis 85Key Trends and Uncertainties 96Capital Resources and Liquidity 99Critical Accounting Policies and Estimates 113
ITEM 7A. QUANTITATIVE AND QUALITATIVE DISCLOSURES ABOUT MARKET RISK 116ITEM 8. FINANCIAL STATEMENTS AND SUPPLEMENTARY DATA 120
Consolidated Balance Sheets 121Consolidated Statements of Operations 122Consolidated Statements of Comprehensive Income 123Consolidated Statements of Changes in Equity 124Consolidated Statements of Cash Flows 125Note 1 - General and Summary of Significant Accounting Policies 126Note 2 - Inventory 136Note 3 - Property, Plant and Equipment 136Note 4 - Fair Value 137Note 5 - Investments in Marketable Securities 141Note 6 - Derivative Instruments and Hedging Activities 141Note 7 - Financing Receivables 143Note 8 - Investments in and Advances to Affiliates 144Note 9 - Other Non-Operating Expense 146Note 10 - Goodwill and Other Intangible Assets 147Note 11 - Regulatory Assets and Liabilities 149Note 12 - Debt 150Note 13 - Commitments 153Note 14 - Contingencies 154Note 15 - Benefit Plans 155Note 16 - Equity 158Note 17 - Segment and Geographic Information 161Note 18 - Share-Based Compensation 163Note 19 - Redeemable Stock of Subsidiaries 166Note 20 - Other Income and Expense 167Note 21 - Asset Impairment Expense 167Note 22 - Income Taxes 169Note 23 - Discontinued Operations 171Note 24 - Dispositions and Held-For-Sale Businesses 172Note 25 - Acquisitions 173Note 26 - Earnings Per Share 173Note 27 - Risks and Uncertainties 174Note 28 - Related Party Transactions 176Note 29 - Selected Quarterly Financial Data (Unaudited) 176Note 30 - Subsequent Events 177
ITEM 9. CHANGES IN AND DISAGREEMENTS WITH ACCOUNTANTS ON ACCOUNTING AND FINANCIAL DISCLOSURE 178ITEM 9A. CONTROLS AND PROCEDURES 178ITEM 9B. OTHER INFORMATION 179
PART III 180ITEM 10. DIRECTORS, EXECUTIVE OFFICERS AND CORPORATE GOVERNANCE 180ITEM 11. EXECUTIVE COMPENSATION 180ITEM 12. SECURITY OWNERSHIP OF CERTAIN BENEFICIAL OWNERS AND MANAGEMENT AND RELATED STOCKHOLDER MATTERS 180ITEM 13. CERTAIN RELATIONSHIPS AND RELATED PARTY TRANSACTIONS, AND DIRECTOR INDEPENDENCE 181ITEM 14. PRINCIPAL ACCOUNTANT FEES AND SERVICES 181
PART IV - ITEM 15. EXHIBITS AND FINANCIAL STATEMENT SCHEDULES 182SIGNATURES 185

GLOSSARY OF TERMSWhen the following terms and abbreviations appear in the text of this report, they have the meanings indicated below:
Adjusted EPS Adjusted Earnings Per Share, a non-GAAP measureAdjusted PTC Adjusted Pretax Contribution, a non-GAAP measure of operating performanceAES The Parent Company and its subsidiaries and affiliates
AFUDC Allowance for Funds Used During ConstructionANEEL Brazilian National Electric Energy AgencyAOCL Accumulated Other Comprehensive LossASC Accounting Standards CodificationASEP National Authority of Public ServicesBACT Best Available Control TechnologyBART Best Available Retrofit TechnologyBNDES Brazilian Development BankBOT Build, Operate and TransferBOT Company AES-VCM Mong Duong Power Company LimitedBTA Best Technology AvailableCAA United States Clean Air ActCAMMESA Wholesale Electric Market Administrator in ArgentinaCCGT Combined Cycle Gas TurbineCDEC Economic Load Dispatch CenterCDI Brazilian equivalent to LIBORCDPQ La Caisse de depot et placement du QuebecCDEEE Dominican Corporation of State Electrical CompaniesCEO Chief Executive OfficerCERCLA Comprehensive Environmental Response, Compensation and Liability Act of 1980 (also known as "Superfund")CESCO Central Electricity Supply Company of Orissa Ltd.CFB Circulating Fluidized Bed BoilerCFE Federal Commission of ElectricityCND National Dispatch CenterCNE National Energy CommissionCOD Commercial Operation DateCOFINS Contribuição para o Financiamento da Seguridade SocialCO 2 Carbon DioxideCOSO Committee of Sponsoring Organizations of the Treadway CommissionCP Capacity PerformanceCPCN Certificate of Public Convenience and NecessityCPI United States Consumer Price IndexCRES Competitive Retail Electric ServiceCSAPR Cross-State Air Pollution RuleCWA U.S. Clean Water ActDG Comp Directorate-General for Competition of the European CommissionDodd-Frank Act Dodd-Frank Wall Street Reform and Consumer Protection ActDP&L The Dayton Power & Light CompanyDPL DPL Inc.DPLE DPL Energy, LLC, a wholly-owned subsidiary of DPL (renamed AES Ohio Generation, LLC effective 2/1/2016)DPLER DPL Energy Resources, Inc.DPP Dominican Power PartnersEBITDA Earnings before Interest, Taxes, Depreciation & AmortizationECCRA Environmental Compliance Cost Recovery AdjustmentEGCO Group Electricity Generating Public Company LimitedELV Emission Limit ValuesEMIR European Market Infrastructure RegulationEOOD Single person private limited liability company in BulgariaEPA United States Environmental Protection AgencyEPC Engineering, Procurement, and Construction

EPIRA Electric Power Industry Reform Act of 2001ERC Energy Regulatory CommissionESO Electricity System OperatorESP Electric Security PlanEU ETS European Union Greenhouse Gas Emission Trading SchemeEURIBOR Euro Inter Bank Offered RateEUSGU Electric Utility Steam Generating UnitEVN Electricity of Vietnam
1

EVP Executive Vice PresidentEWG Exempt Wholesale GeneratorsFAC Fuel Adjustment ChargesFASB Financial Accounting Standards BoardFCA Federal Court of AppealsFERC Federal Energy Regulatory CommissionFONINVEMEM Fund for the Investment Needed to Increase the Supply of Electricity in the Wholesale MarketFPA Federal Power ActFX Foreign ExchangeG&A General and AdministrativeGAAP Generally Accepted Accounting Principles in the United StatesGEL General Electricity LawGHG Greenhouse GasGNPIPD Gross National Product - Implicit Price DeflatorGSA Gas Supply AgreementGWh Gigawatt HoursHLBV Hypothetical Liquidation Book ValueHTA Heads of Terms AgreementICC International Chamber of CommerceICM Industrial and Commerce MinistryIDEM Indiana Department of Environmental ManagementIED Industrial Emission DirectiveIFC International Finance CorporationIOA Investment Obligation AgreementIPALCO IPALCO Enterprises, Inc.IPL Indiana, Indianapolis Power & Light CompanyIPP Independent Power ProducersIRT Annual Tariff Adjustment in BrazilISO Independent System OperatorIURC Indiana Utility Regulatory CommissionKPI Key Performance IndicatorkWh Kilowatt HoursLIBOR London Inter Bank Offered RateLNG Liquefied Natural GasMACT Maximum Achievable Control TechnologyMATS Mercury and Air Toxics StandardsMISO Midcontinent Independent System Operator, Inc.MME Ministry of Mines and EnergyMRE Energy Reallocation MechanismMW MegawattsMWh Megawatt HoursNCI Noncontrolling InterestNCRE Non-conventional Renewable EnergyNEK Natsionalna Elektricheska Kompania (state-owned electricity public supplier in Bulgaria)NERC North American Electric Reliability CorporationNGCC Natural Gas Combined CycleNOV Notice of ViolationNO X Nitrogen DioxideNPDES National Pollutant Discharge Elimination SystemNSPS New Source Performance StandardsNSR New Source ReviewNYISO New York Independent System Operator, Inc.NYSE New York Stock ExchangeO&M Operations and MaintenanceONS National System Operator

OPGC Odisha Power Generation Corporation, Ltd.Parent Company The AES CorporationPCB Polychlorinated biphenylPet Coke Petroleum CokePIS Partially Integrated SystemPJM PJM Interconnection, LLCPM Particulate MatterPPA Power Purchase Agreement
2

PREPA Puerto Rico Electric Power AuthorityPRP Potentially Responsible PartiesPSU Performance Stock UnitPUCO The Public Utilities Commission of OhioPURPA Public Utility Regulatory Policies ActQF Qualifying FacilityRCOA Retail Competition & Open AccessRGGI Regional Greenhouse Gas InitiativeRMRR Routine Maintenance, Repair and ReplacementROE Return on EquityRPM Reliability Pricing ModelRSU Restricted Stock UnitRTO Regional Transmission OrganizationSADI Argentine Interconnected SystemSAIDI System Average Interruption Duration IndexSAIFI System Average Interruption Frequency IndexSBU Strategic Business UnitSCE Southern California EdisonSEC United States Securities and Exchange CommissionSEM Single Electricity MarketSEN National Power SystemSEWRC Bulgaria's State Energy and Water Regulatory CommissionSIC Central Interconnected Electricity SystemSIE Superintendence of ElectricitySIN National Interconnected SystemSING Northern Interconnected Electricity SystemSIP State Implementation PlanSNE National Secretary of EnergySO 2 Sulfur DioxideSPP Southwest Power Pool Electric Energy NetworkSSO Standard Service OfferSSR Service Stability RiderTA Transportation AgreementTECONS Term Convertible Preferred SecuritiesTIPRA Tax Increase Prevention and Reconciliation Act of 2005TNP Transitional National PlanTSR Total Shareholder ReturnUPME Mining and Energetic Planning UnitU.S. United StatesVAT Value Added TaxVIE Variable Interest EntityVinacomin Vietnam National Coal-Mineral Industries Holding Corporation Ltd.WACC Weighted Average Cost of CapitalWECC Western Electric Coordinating CouncilWESM Wholesale Electricity Spot Market
3
PART I
In this Annual Report the terms “AES,” “the Company,” “us,” or “we” refer to The AES Corporation and all of its subsidiaries and affiliates, collectively.The terms “The AES Corporation” and “Parent Company” refer only to the parent, publicly held holding company, The AES Corporation, excluding itssubsidiaries and affiliates.
FORWARD-LOOKING INFORMATION
In this filing we make statements concerning our expectations, beliefs, plans, objectives, goals, strategies, and future events or performance. Such statementsare “forward-looking statements” within the meaning of the Private Securities Litigation Reform Act of 1995. Although we believe that these forward-lookingstatements and the underlying assumptions are reasonable, we cannot assure you that they will prove to be correct.
Forward-looking statements involve a number of risks and uncertainties, and there are factors that could cause actual results to differ materially from thoseexpressed or implied in our forward-looking statements. Some of those factors (in addition to others described elsewhere in this report and in subsequent securitiesfilings) include:
• the economic climate, particularly the state of the economy in the areas in which we operate, including the fact that the global economy faces considerableuncertainty for the foreseeable future, which further increases many of the risks discussed in this Form 10-K;
• changes in inflation, demand for power, interest rates and foreign currency exchange rates, including our ability to hedge our interest rate and foreigncurrency risk;
• changes in the price of electricity at which our generation businesses sell into the wholesale market and our utility businesses purchase to distribute totheir customers, and the success of our risk management practices, such as our ability to hedge our exposure to such market price risk;
• changes in the prices and availability of coal, gas and other fuels (including our ability to have fuel transported to our facilities) and the success of our riskmanagement practices, such as our ability to hedge our exposure to such market price risk, and our ability to meet credit support requirements for fuel andpower supply contracts;
• changes in and access to the financial markets, particularly changes affecting the availability and cost of capital in order to refinance existing debt andfinance capital expenditures, acquisitions, investments and other corporate purposes;
• our ability to manage liquidity and comply with covenants under our recourse and non-recourse debt, including our ability to manage our significantliquidity needs and to comply with covenants under our senior secured credit facility and other existing financing obligations;
• changes in our or any of our subsidiaries' corporate credit ratings or the ratings of our or any of our subsidiaries' debt securities or preferred stock, andchanges in the rating agencies' ratings criteria;
• our ability to purchase and sell assets at attractive prices and on other attractive terms;• our ability to compete in markets where we do business;• our ability to manage our operational and maintenance costs, the performance and reliability of our generating plants, including our ability to reduce
unscheduled down times;• our ability to locate and acquire attractive "greenfield" or "brownfield" projects and our ability to finance, construct and begin operating our "greenfield"
or "brownfield" projects on schedule and within budget;• our ability to enter into long-term contracts, which limit volatility in our results of operations and cash flow, such as PPAs, fuel supply, and other
agreements and to manage counterparty credit risks in these agreements;• variations in weather, especially mild winters and cooler summers in the areas in which we operate, the occurrence of difficult hydrological conditions for
our hydropower plants, as well as hurricanes and other storms and disasters, and low levels of wind or sunlight for our wind and solar facilities;• our ability to meet our expectations in the development, construction, operation and performance of our new facilities, whether greenfield, brownfield or
investments in the expansion of existing facilities;• the success of our initiatives in other renewable energy projects, as well as GHG emissions reduction projects and energy storage projects;• our ability to keep up with advances in technology;• the potential effects of threatened or actual acts of terrorism and war;• the expropriation or nationalization of our businesses or assets by foreign governments, with or without adequate compensation;• our ability to achieve reasonable rate treatment in our utility businesses;• changes in laws, rules and regulations affecting our international businesses;
4

• changes in laws, rules and regulations affecting our North America business, including, but not limited to, regulations which may affect competition, theability to recover net utility assets and other potential stranded costs by our utilities;
• changes in law resulting from new local, state, federal or international energy legislation and changes in political or regulatory oversight or incentivesaffecting our wind business and solar projects, our other renewables projects and our initiatives in GHG reductions and energy storage, including taxincentives;
• changes in environmental laws, including requirements for reduced emissions of sulfur, nitrogen, carbon, mercury, hazardous air pollutants and othersubstances, GHG legislation, regulation and/or treaties and coal ash regulation;
• changes in tax laws and the effects of our strategies to reduce tax payments;• the effects of litigation and government and regulatory investigations;• our ability to maintain adequate insurance;• decreases in the value of pension plan assets, increases in pension plan expenses and our ability to fund defined benefit pension and other postretirement
plans at our subsidiaries;• losses on the sale or write-down of assets due to impairment events or changes in management intent with regard to either holding or selling certain assets;• changes in accounting standards, corporate governance and securities law requirements;• our ability to maintain effective internal controls over financial reporting;• our ability to attract and retain talented directors, management and other personnel, including, but not limited to, financial personnel in our foreign
businesses that have extensive knowledge of accounting principles generally accepted in the United States; and• information security breaches.
These factors in addition to others described elsewhere in this Form 10-K, including those described under Item 1A.— Risk Factors , and in subsequentsecurities filings, should not be construed as a comprehensive listing of factors that could cause results to vary from our forward-looking information.
We undertake no obligation to publicly update or revise any forward-looking statements, whether as a result of new information, future events, or otherwise.If one or more forward-looking statements are updated, no inference should be drawn that additional updates will be made with respect to those or other forward-looking statements.
ITEM 1. BUSINESS
Overview
We were incorporated in 1981 and are a diversified power generation and utility company organized into six market-oriented SBUs: US (United States),Andes (Chile, Colombia, and Argentina), Brazil , MCAC (Mexico, Central America and Caribbean), Europe , and Asia .
Item 1.— Business is an outline of our strategy and our businesses by SBU, including key financial drivers. Additional items that may have an impact on ourbusinesses are discussed in Item 1A.— Risk Factors and Item 3.— Legal Proceedings .
Business Lines & SBUs — Within our six SBUs mentioned above, we have two lines of business. The first business line is generation, where we own and/oroperate power plants to generate and sell power to customers, such as utilities, industrial users, and other intermediaries. The second business line is utilities, wherewe own and/or operate utilities to generate or purchase, distribute, transmit and sell electricity to end-user customers in the residential, commercial, industrial andgovernmental sectors within a defined service area. In certain circumstances, our utilities also generate and sell electricity on the wholesale market. For each SBU,the following table summarizes our generation and utility businesses by capacity, number of facilities, utility customers and utility GWh sold.
SBU Business Line Generation Capacity (Gross MW) Generation Facilities Utility Customers Utility GWh Utility Businesses
US — Generation 5,604 18 Utilities 6,524 16 1.0 million 34,797 2Andes — Generation 8,141 33 Brazil — Generation 3,298 13 Utilities 8.2 million 56,861 2MCAC — Generation 3,239 16 Utilities 1.3 million 3,754 4Europe — Generation 6,781 12 Asia — Generation 2,290 3 35,876 (1) 111 10.5 million 95,412 8
(1) 26,912 proportional MW. Proportional MW is equal to gross MW of a generation facility multiplied by AES' equity ownership percentage in such facility.
5

Strategy
In September 2011, we implemented a new strategy to maximize value for our shareholders and over the last four years we have made significant progresstowards our goals by executing on the following pillars:
• Reducing Complexity. By exiting businesses and markets where we do not have a competitive advantage, we have simplified our portfolio and reduced risk.Over the past four years, we have sold assets to generate $3.4 billion in equity proceeds for AES, decreasing the total number of countries where we haveoperations from 28 to 17. We exited Sri Lanka early in 2016, by selling our generation business, Kelanitissa, for $18 million. We exited several of thesemarkets, including Ukraine, Turkey and Africa, at opportune times, as risks for these businesses have increased since the sales, which we believe wouldhave adversely impacted the valuations of such businesses. In 2015, we announced or closed $787 million in asset sales proceeds.
• Leveraging Our Platforms. We are focusing our growth on platform expansions in markets where we already operate and have a competitive advantage torealize attractive risk-adjusted returns. We currently have 5,620 MW under construction. These projects represent $7 billion in total capital expenditures,with 85% of AES' $1.2 billion in equity already funded, and we expect the majority of these projects to come on-line through 2018. In 2015, we broughton-line five projects for a total of 1,484 MW. This capacity includes the 1,240 MW coal-fired Mong Duong 2 facility in Vietnam, which we completed sixmonths early and under budget.
• Performance Excellence. We strive to be a low-cost manager of a portfolio of international energy assets and to derive synergies and scale from ourbusinesses. In 2011, we set a goal to reduce our G&A expenses by $200 million by 2015, and in 2014, we achieved these reductions one year early. Werecently launched a $150 million cost reduction and revenue enhancement initiative. This initiative will include overhead reductions, procurementefficiencies and operational improvements. We expect to achieve at least $50 million in savings in 2016, ramping up to $150 million, including modestrevenue enhancements, in 2018.
• Expanding Access to Capital. We have raised $2.5 billion in proceeds to AES by building strategic partnerships at the project and business level. Throughthese partnerships, we aim to optimize our risk-adjusted returns in our existing businesses and growth projects. By selling down portions of certainbusinesses, we can adjust our global exposure to commodity, fuel, country and macroeconomic risks. Partial sell-downs of our assets can serve to highlightthe value of businesses in our portfolio.
• Allocating Capital in a Disciplined Manner. Our top priority is to maximize risk-adjusted returns to our shareholders, which we achieve by investing ourdiscretionary cash and recycling the capital we receive from asset sales and strategic partnerships. To that end, since September 2011 we have repurchased$1.5 billion of our shares and benefited from a low interest rate environment, by transacting on $24 billion in debt deals at the Parent and our subsidiaries.These debt transactions represent $14 billion in refinancing and $10 billion in new financing, and we extended the maturities on $3.4 billion in Parent debt.
Note: Investments in subsidiaries excludes $2.3 billion investment in DPL.
Most recently, we increased our quarterly dividend by 10% to $0.11 per share beginning in the first quarter of 2016. This dividend increase reflects ourexpectation that we will maintain 10% annual growth in our dividend.
6

Generation
We currently own and/or operate a generation portfolio of 29,352 MW, excluding the generation capabilities of our integrated utilities. Our generation fleet isdiversified by fuel type. See discussion below under Fuel Costs .
Performance drivers of our generation businesses include types of electricity sales agreements, plant reliability and flexibility, fuel costs, fixed-costmanagement, sourcing and competition.
Electricity Sales Contracts — Our generation businesses sell electricity under medium- or long-term contracts ("contract sales") or under short-termagreements in competitive markets ("short-term sales").
Contract Sales — Most of our generation fleet sells electricity under contracts. Our medium-term contract sales have a term of 2 to 5 years, while our long-term contracts have a term of more than 5 years. Across our portfolio, the average remaining contract term is 7 years.
In contract sales, our generation businesses recover variable costs including fuel and variable O&M costs, either through direct or indexation-basedcontractual pass-throughs or tolling arrangements. When the contract does not include a fuel pass-through, we typically hedge fuel costs or enter into fuel supplyagreements for a similar contract period (see discussion under the Fuel Costs section below). These contracts are intended to reduce exposure to the volatility offuel prices and electricity prices by linking the business's revenues and costs. These contracts also help us to fund a significant portion of the total capital cost of theproject through long-term non-recourse project-level financing.
Capacity Payments and Contract Sales — Most of our contract sales include a capacity payment that covers projected fixed costs of the plant, includingfixed O&M expenses and a return on capital invested. In addition, most of our contracts require that the majority of the capacity payment be denominated in thecurrency matching our fixed costs, including debt and return on capital invested. Although our project debt may consist of both fixed and floating rate debt, wetypically hedge a significant portion of our exposure to variable interest rates. For foreign exchange, we generally structure the revenue of the business to match thecurrency of the debt and fixed costs. Some of our contracted businesses also receive a regulated market-based capacity payment, which is discussed in more detailin the Capacity Payments and Short-Term Sales section below.
Thus, these contracts, or other related commercial arrangements, significantly mitigate our exposure to changes in power and fuel prices, currencyfluctuations and changes in interest rates. In addition, these contracts generally provide for a recovery of our fixed operating expenses and a return on ourinvestment, as long as we operate the plant to the reliability and efficiency standards required in the contract.
Short-Term Sales — Our other generation businesses sell power and ancillary services under short-term contracts with an average term of less than 2 years,including spot sales, directly in the short-term market, or, in some cases, at regulated prices. The short-term markets are typically administered by a systemoperator to coordinate dispatch. Short-term markets generally operate on merit order dispatch, where the least expensive generation facilities, based upon variablecost or bid price, are dispatched first and the most expensive facilities are dispatched last. The short-term price is typically set at the marginal cost of energy or bidprice (the cost of the last plant required to meet system demand). As a result, the cash flows and earnings associated with these businesses are more sensitive tofluctuations in the market price for electricity. In addition, many of these wholesale markets include markets for ancillary services to support the reliable operationof the transmission system. Across our portfolio, we provide a wide array of ancillary services, including voltage support, frequency regulation and spinningreserves.
In certain markets, such as Argentina and Kazakhstan, a regulator establishes the prices for electricity and fuel and adjusts them periodically for inflation,changes in fuel prices and other factors. In these cases, our businesses are particularly sensitive to changes in regulation.
Capacity Payments and Short-Term Sales — Many of the markets in which we operate include regulated capacity markets. These capacity markets areintended to provide additional revenue based upon availability without reliance on the energy margin from the merit order dispatch. Capacity markets are typicallypriced based on the cost of a new entrant and the system capacity relative to the desired level of reserve margin (generation available in excess of peak demand).Our generating facilities selling in the short-term markets typically receive capacity payments based on their availability in the market. Our most significantcapacity revenues are earned by our generation capacity in Ohio and Northern Ireland.
Plant Reliability and Flexibility — Our contract and short-term sales provide incentives to our generation plants to optimally manage availability, operatingefficiency and flexibility. Capacity payments under contract sales are frequently tied to meeting minimum standards. In short-term sales, our plants must be reliableand flexible to capture peak market prices and to maximize market-based revenues. In addition, our flexibility allows us to capture ancillary service revenue whilemeeting local market needs.
Fuel Costs — For our thermal generation plants, fuel is a significant component of our total cost of generation. For contract sales, we often enter into fuelsupply agreements to match the contract period, or we may hedge our fuel costs. Some
7
of our contracts have periodic adjustments for changes in fuel cost indices. In those cases, we have fuel supply agreements with shorter terms to match thoseadjustments. For certain projects, we have tolling arrangements where the power offtaker is responsible for the supply and cost of fuel to our plants.
In short-term sales, we sell power at market prices that are generally reflective of the market cost of fuel at the time, and thus procure fuel supply on a short-term basis, generally designed to match up with our market sales profile. Since fuel price is often the primary determinant for power prices, the economics ofprojects with short-term sales are often subject to volatility of relative fuel prices. For further information regarding commodity price risk please see Item 7A.—Quantitative and Qualitative Disclosures about Market Risk in this Form 10-K.
34% of our generation fleet is coal-fired. In the U.S., most of our plants are supplied from domestic coal. At our non-U.S. generation plants and at our plantin Hawaii, we source coal internationally. Across our fleet, we utilize our global sourcing program to maximize the purchasing power of our fuel procurement.
33% of our generation plants are fueled by natural gas. Generally, we use gas from local suppliers in each market. A few exceptions to this are AES Gener inChile, where we purchase imported gas from third parties, and our plants in the Dominican Republic, where we import LNG to utilize in the local market.
28% of our generation plants are fueled by renewables, including hydro, wind and energy storage, which do not have significant fuel costs.
5% of our generation fleet utilizes oil, diesel and petroleum coke ("pet coke") for fuel. Oil and diesel are sourced locally at prices linked to internationalmarkets, while pet coke is largely sourced from Mexico and the U.S.
Renewable Generation Facilities — We currently own and operate 8,145 MW (4,237 proportional MW) of renewable generation, including hydro, wind,energy storage, solar, biomass and landfill gas.
Seasonality, Weather Variations and Economic Activity — Our generation businesses are affected by seasonal weather patterns throughout the year and,therefore, operating margin is not generated evenly by month during the year. Additionally, weather variations, including temperature, solar and wind resources,and hydrological conditions, may also have an impact on generation output at our renewable generation facilities. See Item 7.— Management's Discussion andAnalysis — Key Trends and Uncertainties of this Form 10-K for further details of the impact of dry hydrological conditions. In competitive markets for power,local economic activity can also have an impact on power demand and short-term prices for power.
Fixed-Cost Management — In our businesses with long-term contracts, the majority of the fixed operating and maintenance costs are recovered through thecapacity payment. However, for all generation businesses, managing fixed costs and reducing them over time is a driver of business performance.
Competition — For our businesses with medium- or long-term contracts, there is limited competition during the term of the contract. For short-term sales,plant dispatch and the price of electricity are determined by market competition and local dispatch and reliability rules.
Utilities
AES' eight utility businesses distribute power to 10.5 million people in three countries. AES' two utilities in the U.S. also include generation capacity totaling6,524 MW. The utility businesses have a variety of structures, ranging from integrated utility to pure transmission and distribution businesses.
In general, our utilities sell electricity directly to end-users, such as homes and businesses, and bill customers directly. Key performance drivers for utilitiesinclude the regulated rate of return and tariff, seasonality, weather variations, economic activity, reliability of service and competition.
Regulated Rate of Return and Tariff — In exchange for the exclusive right to sell or distribute electricity in a franchise area, our utility businesses are subjectto government regulation. This regulation sets the prices ("tariffs") that our utilities are allowed to charge retail customers for electricity and establishes servicestandards that we are required to meet.
Our utilities are generally permitted to earn a regulated rate of return on assets, determined by the regulator based on the utility's allowed regulatory assetbase, capital structure and cost of capital. The asset base on which the utility is permitted a return is determined by the regulator and is based on the amount ofassets that are considered used and useful in serving customers. Both the allowed return and the asset base are important components of the utility's earning power.The allowed rate of return and operating expenses deemed reasonable by the regulator are recovered through the regulated tariff that the utility charges to itscustomers.
The tariff may be reviewed and reset by the regulator from time to time depending on local regulations, or the utility may seek a change in its tariffs. Thetariff is generally based upon a certain usage level and may include a pass-through to the customer of costs that are not controlled by the utility, such as the costs offuel (in the case of integrated utilities) and/or the
8

costs of purchased energy. In addition to fuel and purchased energy, other types of costs may be passed through to customers via an existing mechanism, such ascertain environmental expenditures that are covered under an environmental tracker at our utility in Indiana, IPL. Components of the tariff that are directly passedthrough to the customer are usually adjusted through a summary regulatory process or an existing formula-based mechanism. In some regulatory regimes,customers with demand above an established level are unregulated and can choose to contract with other retail energy suppliers directly and pay a wheeling andother non-bypassable fees, which are fees to the distribution company for use of its distribution system.
The regulated tariff generally recognizes that our utility businesses should recover certain operating and fixed costs, as well as manage uncollectibleamounts, quality of service and non-technical losses. Utilities, therefore, need to manage costs to the levels reflected in the tariff, or risk non-recovery of costs ordiminished returns.
Seasonality, Weather Variations and Economic Activity — Our utility businesses are affected by seasonal weather patterns throughout the year and, therefore,the operating revenues and associated operating expenses are not generated evenly by month during the year. Additionally, weather variations may also have animpact based on the number of customers, temperature variances from normal conditions and customers' historic usage levels and patterns. The retail kWh sales,after adjustments for weather variations, are affected by changes in local economic activity, energy efficiency and distributed generation initiatives, as well as thenumber of retail customers.
Reliability of Service — Our utility businesses must meet certain reliability standards, such as duration and frequency of outages. Those standards may bespecific with incentives or penalties for performance against these standards. In other cases, the standards are implicit and the utility must operate to meet customerexpectations.
Competition — Our integrated utilities, such as IPL and DP&L, operate as the sole distributor of electricity within their respective jurisdictions. Ourbusinesses own and operate all of the businesses and facilities necessary to generate, transmit and distribute electricity. Competition in the regulated electricbusiness is primarily from the on-site generation for industrial customers; however, in Ohio, customers in our service territory have the ability to switch toalternative suppliers for their generation service. Our integrated utilities, particularly DP&L, are exposed to the volatility in wholesale prices to the extent ourgenerating capacity exceeds the native load served under the regulated tariff and short-term contracts. See the full discussion under the US SBU.
At our pure transmission and distribution businesses, such as those in Brazil and El Salvador, we face relatively limited competition due to significantbarriers to entry. At many of these businesses, large customers, as defined by the relevant regulator, have the option to both leave and return to regulated service.
Development and Construction
We develop and construct new generation facilities. For our utility businesses, new plants may be built in response to customer needs or to comply withregulatory developments and are developed subject to regulatory approval that permits recovery of our capital cost and a return on our investment. For ourgeneration businesses, our priority for development is platform expansion opportunities, where we can add on to our existing facilities in our key platform marketswhere we have a competitive advantage. We make the decision to invest in new projects by evaluating the project returns and financial profile against a fair risk-adjusted return for the investment and against alternative uses of capital, including corporate debt repayment and share buybacks.
In some cases, we enter into long-term contracts for output from new facilities prior to commencing construction. To limit required equity contributions fromThe AES Corporation, we also seek non-recourse project debt financing and other sources of capital, including partners where it is commercially attractive. Forconstruction, we typically contract with a third party to manage construction, although our construction management team supervises the construction work andtracks progress against the project's budget and the required safety, efficiency and productivity standards.
Environmental Matters
We are subject to various international, federal, state, and local regulations in all of our markets. These regulations govern such items as the determination ofthe market mechanism for setting the system marginal price for energy and the establishment of guidelines and incentives for the addition of new capacity.
We are also subject to various federal, state, regional and local environmental protection and health and safety laws and regulations governing, among otherthings, the generation, storage, handling, use, disposal and transportation of hazardous materials; the emission and discharge of hazardous and other materials intothe environment; and the health and safety of our employees. These laws and regulations often require a lengthy and complex process of obtaining and renewingpermits and other governmental authorizations from federal, state and local agencies. Violation of these laws, regulations or permits can result in substantial fines,other sanctions, suspension or revocation of permits and/or facility shutdowns. See later in Item 1.— Business — Environmental and Land-Use Regulations forfurther regulatory and environmental discussion.
9
SBUs
All SBUs include generation facilities and three include utility businesses. The Company measures the operating performance of its SBUs using AdjustedPTC and Proportional Free Cash Flow, both of which are non-GAAP measures (see definitions below).
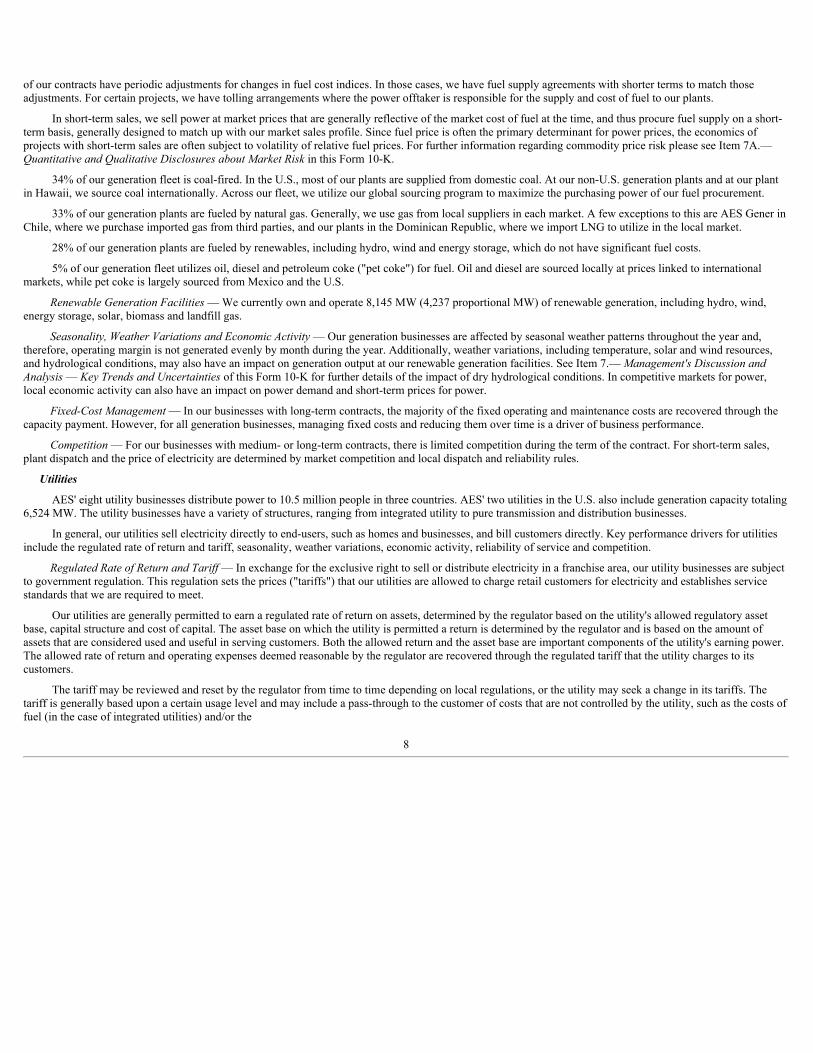
AES' primary sources of Revenue, Operating Margin, Adjusted PTC and Proportional Free Cash Flow are from generation and utility businesses. TheAdjusted PTC and Proportional Free Cash Flow by SBU for the year ended December 31, 2015 are shown below. The percentages for Adjusted PTC are thecontribution by each SBU to the gross metric, i.e., the total Adjusted PTC by SBU, before deductions for Corporate. See Item 8.— Financial Statements andSupplementary Data of this Form 10-K for reconciliation.
In 2015 , approximately 80% of Adjusted PTC and Proportional Free Cash Flow was contributed by our businesses in the Americas — including the US,
Andes, Brazil and MCAC SBUs.We define Adjusted PTC as pretax income from continuing operations attributable to AES excluding gains or losses due to (a) unrealized gains or losses
related to derivative transactions, (b) unrealized foreign currency gains or losses, (c) gains or losses due to dispositions and acquisitions of business interests,(d) losses due to impairments, and (e) costs due to the early retirement of debt. Adjusted PTC in each SBU includes the effect of intercompany transactions withother SBUs other than interest and charges for certain management services.
We define Proportional Free Cash Flow as cash flows from operating activities excluding capital expenditures related to service concession assets, lessmaintenance and non-recoverable environmental capital costs, adjusted for the estimated impact of noncontrolling interests. Proportional Free Cash Flow in eachSBU includes the effect of intercompany transactions with other SBUs except for interest, tax sharing, charges for management fees and transfer pricing.
Our Organization and Segments
The segment reporting structure uses the Company's management reporting structure as its foundation to reflect how the Company manages the businessinternally and is organized by geographic regions which provide better socio-political-economic understanding of our business. The management reportingstructure is organized along six SBUs — US, Andes, Brazil, MCAC, Europe, and Asia — which are led by our SBU Presidents.
Corporate and Other — For financial reporting purposes, the Company's corporate activities are reported within "Corporate and Other" because they do notrequire separate disclosure under segment reporting accounting guidance. "Corporate and Other" also includes costs related to corporate overhead which are notdirectly associated with the operations of our six reportable segments and other intercompany charges such as self-insurance premiums which are fully eliminatedin consolidation. See Item 7.— Management's Discussion and Analysis of Financial Condition and Results of Operations and Note 17 — Segment and GeographicInformation included in Item 8.— Financial Statements and Supplementary Data of this Form 10-K for further discussion of the Company's segment structure(including information on revenue from external customers, Adjusted PTC—a non-GAAP measure, Proportional Free Cash Flow—a non-GAAP measure, and totalassets by segment) used for financial reporting purposes.
The following describes our businesses within our six SBUs:
US SBU
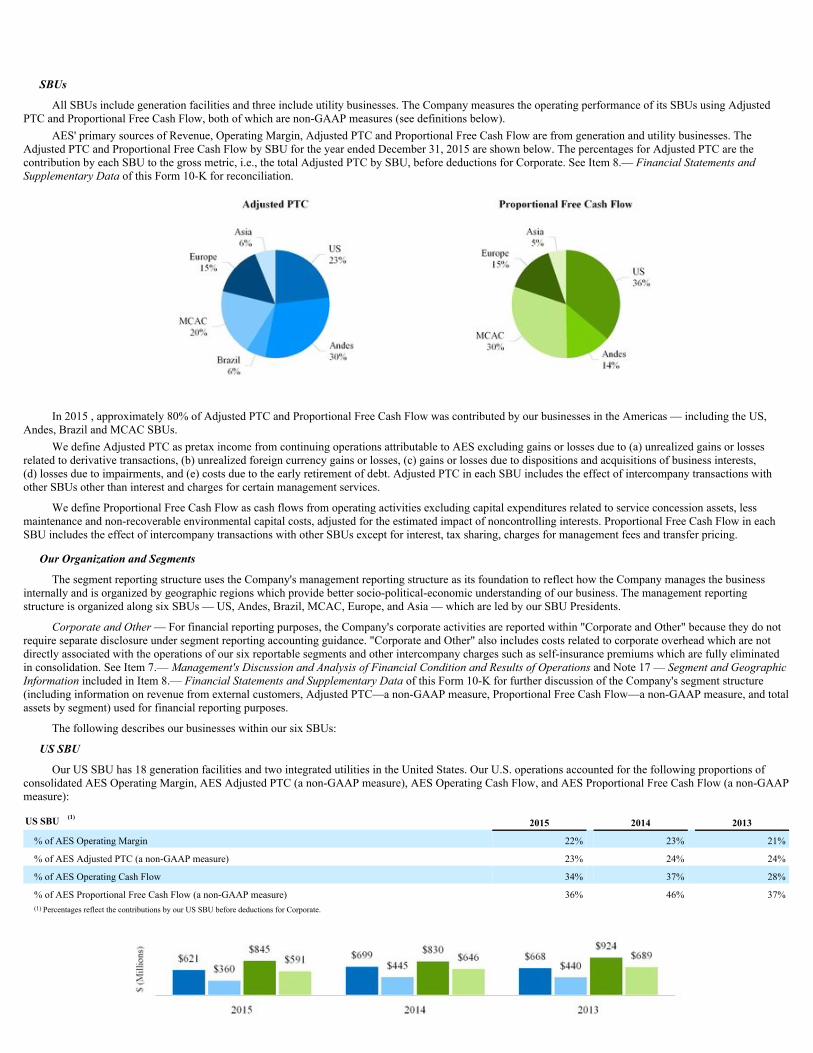
Our US SBU has 18 generation facilities and two integrated utilities in the United States. Our U.S. operations accounted for the following proportions ofconsolidated AES Operating Margin, AES Adjusted PTC (a non-GAAP measure), AES Operating Cash Flow, and AES Proportional Free Cash Flow (a non-GAAPmeasure):
US SBU (1)2015 2014 2013
% of AES Operating Margin 22% 23% 21%
% of AES Adjusted PTC (a non-GAAP measure) 23% 24% 24%
% of AES Operating Cash Flow 34% 37% 28%
% of AES Proportional Free Cash Flow (a non-GAAP measure) 36% 46% 37%(1) Percentages reflect the contributions by our US SBU before deductions for Corporate.

The following table provides highlights of our US operations:
Generation Capacity 12,128 gross MW (11,260 proportional MW)Generation Facilities 19 (1 under construction)
Key Generation Businesses Southland, Hawaii and US WindUtilities Penetration 1,002,000 customers (31,112 GWh)
Utility Businesses 2 integrated utilities (includes 18 generation plants, 4 under construction)Key Utility Businesses IPL and DPL
10

Operating installed capacity of our US SBU totals 12,128 MW. IPL's parent, IPALCO Enterprises, Inc., and DPL Inc. are voluntary SEC registrants, and assuch, follow public filing requirements of the Securities Exchange Act of 1934. Presented in the table below is a list of our U.S. generation facilities:
Business Location Fuel GrossMW
AES EquityOwnership (%
Rounded) Year Acquired orBegan Operation Contract
Expiration Date Customer(s)
Southland—Alamitos U.S.-CA Gas 2,075 100% 1998 2018 Southern California EdisonSouthland—Redondo Beach U.S.-CA Gas 1,392 100% 1998 2018 Southern California EdisonSouthland—Huntington Beach U.S.-CA Gas 474 100% 1998 2018 Southern California EdisonShady Point U.S.-OK Coal 360 100% 1991 2018 Oklahoma Gas & Electric
Buffalo Gap II (1),(2) U.S.-TX Wind 233 100% 2007 2017 Direct EnergyHawaii U.S.-HI Coal 206 100% 1992 2022 Hawaiian Electric Co.Warrior Run U.S.-MD Coal 205 100% 2000 2030 First Energy
Buffalo Gap III (1) U.S.-TX Wind 170 100% 2008
Buffalo Gap I (1) U.S.-TX Wind 121 100% 2006 2021 Direct EnergyLaurel Mountain U.S.-WV Wind 98 100% 2011 Mountain View I & II (1) U.S.-CA Wind 67 100% 2008 2021 Southern California Edison
Distributed PV - Commercial (3)
U.S.-Various
Solar
56
80%-97%
2009-2015
2029-2041
Utility, Municipality, Education, Non-
ProfitMountain View IV U.S.-CA Wind 49 100% 2012 2032 Southern California Edison
Tehachapi U.S.-CA Wind 35 100% 2006 2016 Southern California Edison
Laurel Mountain ES U.S.-WV Energy Storage 32 100% 2011 Tait ES U.S.-OH Energy Storage 20 100% 2013 Distributed PV - Residential (3) U.S.-Various Solar 9 95% 2012-2015 2037-2040 Residential
Advancion Applications Center U.S.-PA Energy Storage 2 100% 2013 5,604
(1) AES owns these assets together with third-party tax equity investors with variable ownership interests. The tax equity investors receive a portion of the economic attributes of the facilities, including tax attributes, that vary over thelife of the projects. The proceeds from the issuance of tax equity are recorded as noncontrolling interest in the Company's Consolidated Balance Sheets.
(2) Power Purchase Agreement with Direct Energy is for 80% of annual expected energy output.(3) AES operates these facilities located throughout the U.S. through management or O&M agreements as of 12/31/15.
Under construction — The following table lists our plants under construction in the US SBU:
Business Location Fuel Gross MW AES Equity Interest (% Rounded) Expected Date of Commercial Operations
IPL MATS (1) U.S.-IN Coal 1,713 75% 1H 2016Eagle Valley CCGT (1) U.S.-IN Gas 671 75% 1H 2017Harding Street Units 5-7 (1) U.S.-IN Gas 630 75% 1H 2016Harding Street ES (1) U.S.-IN Energy Storage 20 75% 1H 2016Warrior Run ES U.S.-MD Energy Storage 10 100% 1H 2016
US Total 3,044 (1) In the first quarter of 2015, La Caisse de depot et placement du Quebec ("CDPQ") invested $247 million for a 15% interest in AES US Investments, Inc. (AES US Investments), a subsidiary of AES that owns IPALCO Enterprises,
Inc. ("IPALCO"). In the second quarter of 2015, CDPQ invested an additional $214 million and we expect CDPQ to invest an additional $134 million in IPALCO by 2016. After completion of this investment, CDPQ's direct andindirect interests in IPALCO will total 30%, AES will own 85% of AES US Investments, and AES US Investments will own 82.35% of IPALCO.
Presented below are our U.S. utilities and their generation facilities:
Business Location Approximate Number of Customers Served as of12/31/2015 GWh Sold in 2015 Fuel Gross MW AES Equity Interest (%
Rounded) Year Acquired or BeganOperation
DPL (1) U.S.-OH 517,000 16,714 Coal/Gas/Oil 3,066 100% 2011
IPL (2) U.S.-IN 485,000 14,398 Coal/Gas/Oil 3,458 75% 2001 1,002,000 31,112 6,524
(1) DPL subsidiary DP&L has the following plants: Tait Units 1-3 and diesels, Yankee Street, Yankee Solar, Monument and Sidney. DP&L jointly owned plants: Conesville Unit 4, Killen, Miami Fort Units 7 & 8, Stuart and Zimmer.In addition to the above, DP&L also owns a 4.9% equity ownership in OVEC ("Ohio Valley Electric Corporation"), an electric generating company. OVEC has two plants in Cheshire, Ohio and Madison, Indiana with a combinedgeneration capacity of approximately 2,109 MW. DP&L's share of this generation capacity is approximately 103 MW. DPL Energy, LLC plants: Tait Units 4-7 and Montpelier Units 1-4.
(2) In the first quarter of 2015, CDPQ invested $247 million for a 15% interest in AES US Investments, Inc. (AES US Investments), a subsidiary of AES that owns IPALCO. In the second quarter of 2015, CDPQ invested anadditional $214 million and we expect CDPQ to invest an additional $134 million in IPALCO by 2016. After completion of this investment, CDPQ's direct and indirect interests in IPALCO will total 30%, AES will own 85% ofAES US Investments, and AES US Investments will own 82.35% of IPALCO. IPL plants: Eagle Valley, Georgetown, Harding Street and Petersburg.
11

The following map illustrates the location of our U.S. facilities:
U.S. Businesses
U.S. Utilities
IPALCO
Business Description — IPALCO owns all of the outstanding common stock of IPL. IPL is engaged primarily in generating, transmitting, distributing andselling electric energy to approximately 485,000 retail customers in the city of Indianapolis and neighboring areas within the state of Indiana. IPL has an exclusiveright to provide electric service to those customers. IPL's service area covers about 528 square miles with an estimated population of approximately 934,000. IPLowns and operates four generating stations. Two of the generating stations are primarily coal-fired; however, one of these stations is in the process of beingconverted to natural gas and will be fully converted in 2016. The third station has a combination of units that use coal (baseload capacity), natural gas and/or oil(peaking capacity) for fuel to produce electricity. The fourth station is a small peaking station that uses gas-fired combustion turbine technology for the productionof electricity. IPL's net electric generation capacity for winter is 3,233 MW and net summer capacity is 3,115 MW.
On December 15, 2014, the Company executed an agreement with CDPQ, a long-term institutional investor headquartered in Quebec, Canada. Pursuant tothe agreement, CDPQ purchased 15% of AES US Investments, Inc. ("AES US Investments"), a wholly-owned subsidiary of AES that owns 100% of IPALCO, for$247 million. This transaction closed on February 11, 2015. In addition, in April 2015, IPALCO received an equity capital contribution of $214 million from theissuance of 11,818,828 shares of common stock to CDPQ for funding needs primarily related to IPL's environmental construction program, which IPALCO thenmade the same investment in IPL. After the April investment, CDPQ's direct and indirect ownership interests in IPALCO totaled 25%. CDPQ has committed toapproximately $134 million of additional investments in IPALCO through 2016, which will be used primarily to help fund existing environmental and replacementgeneration projects at IPL. Upon completion of these transactions, CDPQ's direct and indirect interests in IPALCO will total 30%, AES will own 85% of AES USInvestments, and AES US Investment will own 82.35% of IPALCO. There will be no change in management or operational control of AES US Investments orIPALCO as a result of these transactions.
Market Structure — IPL is one of many transmission system owner members in the MISO. MISO is a RTO, which maintains functional control over thecombined transmission systems of its members and manages one of the largest energy and ancillary services markets in the U.S. IPL offers the available electricityproduction of each of its generation assets into the MISO day-ahead and real-time markets. MISO operates on a merit order dispatch, considering transmissionconstraints and other reliability issues to meet the total demand in the MISO region.
Regulatory Framework — Retail Ratemaking — In addition to the regulations referred to below in Other Regulatory Matters , IPL is subject to regulation bythe IURC with respect to IPL's services and facilities; retail rates and charges; the
12

issuance of long-term securities; and certain other matters. The regulatory power of the IURC over IPL's business is both comprehensive and typical of thetraditional form of regulation generally imposed by state public utility commissions. IPL's tariff rates for electric service to retail customers consist of basic ratesand charges, which are set and approved by the IURC after public hearings. The IURC gives consideration to all allowable costs for ratemaking purposes includinga fair return on the fair value of the utility property used and useful in providing service to customers. In addition, IPL's rates include various adjustmentmechanisms including, but not limited to: (i) a rider to reflect changes in fuel and purchased power costs to meet IPL's retail load requirements, referred to as theFAC, and (ii) a rider for the timely recovery of costs incurred to comply with environmental laws and regulations referred to as ECCRA. These componentsfunction somewhat independently of one another, but the overall structure of IPL's rates and charges would be subject to review at the time of any review of IPL'sbasic rates and charges. IPL's basic rates and charges were last adjusted in 1996; however, IPL filed a petition with the IURC on December 29, 2014 for authorityto increase its basic rates and charges. IPL's proposed rate increase, filed as part of IPL's rebuttal testimony in this proceeding, is $63.3 million, or 5.2%. An orderon this proceeding will likely be issued by the IURC early in 2016.
Environmental Matters — MATS — In April 2012, the EPA's rule to establish maximum achievable control technology standards for each hazardous airpollutant regulated under the CAA emitted from coal and oil-fired power plants, known as MATS, became effective. On August 14, 2013, the IURC approvedIPL's MATS plan, which includes investing up to $511 million in the installation of new pollution control equipment on IPL's five largest baseload generatingunits. These coal-fired units are located at IPL's Petersburg and Harding Street generating stations. The IURC also approved IPL's request to recover operating andconstruction costs for this equipment, including a return, through a rate adjustment mechanism with certain stipulations. Funding for these capital expenditures isexpected to be obtained from additional debt financing at IPL; equity contributions; borrowing capacity on IPL's committed credit facilities; and cash generatedfrom operating activities.
Replacement Generation — IPL has several generating units that are expected to retire or refuel by 2017. These units are primarily coal-fired and represent472 MW of net capacity in total. To replace this generation, IPL filed a petition and case-in-chief with the IURC in April 2013 seeking a CPCN to build a 550 to725 MW CCGT at its Eagle Valley Station site in Indiana and to refuel Harding Street Station Units 5 and 6 from coal to natural gas (approximately 100 MW netcapacity each). In May 2014, IPL received an order on the CPCN from the IURC authorizing the refueling project and granting approval to build a 644 to 685 MWCCGT at a total budget of $649 million. The current estimated cost of these projects is $632 million. IPL requested and was granted authority to accrue post in-service allowance for debt and equity funds used during construction, and to defer the recognition of depreciation expense of the CCGT and refueling project untilsuch time that IPL is allowed to collect both a return and depreciation expense of the CCGT and refueling projects. The CCGT is expected to be placed into servicein April 2017, and the refueling project is expected to be completed by early 2016. The costs to build and operate the CCGT and for the refueling project, otherthan fuel costs, will not be recoverable by IPL through rates until the conclusion of a base rate case proceeding with the IURC after the assets have been placed inservice. In October 2014, IPL filed a petition and case-in-chief with the IURC seeking a CPCN to refuel Harding Street Station Unit 7 from coal to natural gas(about 410 MW net capacity). On July 29, 2015 IPL received approval for this CPCN from the IURC. This conversion is part of IPL's overall wastewatercompliance plan for its power plants and is expected to be completed in 2016 (as discussed in Environmental Wastewater Requirements below).
Environmental Wastewater Requirements — In August 2012, the IDEM issued NPDES permits to the IPL Petersburg, Harding Street, and Eagle Valleygenerating stations, which became effective in October 2012. In April 2013, IPL received an extension to the compliance deadline through September 2017 forIPL's Harding Street and Petersburg facilities through agreed orders with IDEM. IPL conducted studies to determine the operational changes and/or controlequipment necessary to comply with the new limitations. On October 16, 2014, IPL filed its wastewater compliance plans with the IURC. On July 29, 2015, IPLreceived approval for a CPCN from the IURC to convert Unit 7 at the Harding Street Station from coal-fired to natural gas-fired, and also to install and operatewastewater treatment technologies at Harding Street Station and Petersburg Generation Station in southern Indiana. IPL plans to invest $326 million in theseprojects to help ensure compliance with the wastewater treatment requirements by 2017. Recovery of these costs is expected through an Indiana statute whichallows for 80% recovery of qualifying costs through a rate adjustment mechanism with the remainder recorded as a regulatory asset to be considered for recoveryin the next basic rate case proceeding; however, there can be no assurances that IPL would be successful in that regard.
Key Financial Drivers — IPL's financial results are driven primarily by retail demand and rate base growth. Retail demand is influenced by localmacroeconomic conditions. In addition, weather, energy efficiency and wholesale prices could also impact financial results. IPL's rate base growth is influenced bythe timely recovery of capital expenditures, as well as passage of new legislation or implementation of regulations.
Construction and Development — IPL's construction program is composed of capital expenditures necessary for prudent utility operations and compliancewith environmental laws and regulations, along with discretionary investments designed to replace aging equipment or improve overall performance. Please seeabove for a description of our major construction projects.
13

DPL Inc. ("DPL")
Business Description — DPL is an energy holding company whose principal subsidiaries include DP&L, DPLE, and DPLER.
DP&L generates, transmits, distributes and sells electricity to approximately 517,000 customers in a 6,000 square mile area of West Central Ohio. DP&L,solely or through jointly owned facilities, owns 2,510 MW of generation capacity and numerous transmission facilities.
DPLE owns peaking generation units representing 556 MW located in Ohio and Indiana.
DPLER, a competitive retail marketer, sells retail electricity to more than 124,000 retail customers in Ohio and Illinois. Approximately 110,000 of thesecustomers are also distribution customers of DP&L in Ohio. On January 1, 2016, DPL closed on the sale of DPLER to Interstate Gas Supply, Inc. (IGS).
Market Structure — Since January 2001, electric customers within Ohio have been permitted to choose to purchase power under a contract with a CRESProvider or to continue to purchase power from their local utility under SSO rates established by the tariff. DP&L and other Ohio utilities continue to have theexclusive right to provide delivery service in their state certified territories, and DP&L had the obligation to supply retail generation service to customers that donot choose an alternative supplier. Beginning in 2014, a portion of the SSO generation supply is no longer supplied by DP&L but is provided by third partiesthrough a competitive bid process. A total of 10% and 60% of the SSO load was sourced through competitive bid in 2014 and 2015, respectively, and 100% will besourced in this manner beginning in 2016, respectively. The PUCO maintains jurisdiction over DP&L's delivery of electricity, SSO and other retail electricservices. The PUCO has issued extensive rules on how and when a customer can switch generation suppliers, how the local utility will interact with CRESProviders and customers, including for billing and collection purposes, and which elements of a utility's rates are "bypassable" (i.e., avoided by a customer thatelects a CRES Provider) and which elements are "non-bypassable" (i.e., charged to all customers receiving a distribution service irrespective of what entityprovides the retail generation service).
PJM Operations — DP&L is a member of PJM. The PJM RTO operates the transmission systems owned by utilities operating in all or parts ofPennsylvania, New Jersey, Maryland, Delaware, D.C., Virginia, Ohio, West Virginia, Kentucky, North Carolina, Tennessee, Indiana and Illinois. PJM has anintegrated planning process to identify potential needs for additional transmission to be built to avoid future reliability problems. PJM also runs the day-ahead andreal-time energy markets, ancillary services market and forward capacity market for its members.
As a member of PJM, DP&L is also subject to charges and costs associated with PJM operations as approved by the FERC. Prior to 2015, the RPM wasPJM's capacity construct. In 2015, PJM implemented a new Capacity Price ("CP") program, replacing the RPM model. The CP program offers the potential forhigher capacity revenues, combined with substantially increased penalties for non-performance or under-performance during certain periods identified as "capacityperformance hours." This linkage between non- or under-performance during certain specific hours means that a generation unit that is generally performing wellon an annual basis, may incur substantial penalties if it happens to be unavailable for service during some capacity performance hours. Similarly, a generation unitthat is generally performing poorly on an annual basis may avoid such penalties if its outages happen to occur only during hours that are not capacity performancehours. An annual “stop-loss” provision exists that limits the size of penalties to 150% of the net cost of new entry, which is a value computed by PJM. This level islikely to be larger than the capacity price established under the CP program, so that the potential exists that participation in the CP program could result in capacitypenalties that exceed capacity revenues. The purpose of the RPM and CP Program is to enable PJM to obtain sufficient resources to reliably meet the needs ofelectric customers within the PJM footprint. PJM conducts an auction to establish the price by zone.
The PJM CP auctions are held three years in advance for a period covering 12 months starting from June 1. Auctions for the period covering June 1, 2019through May 30, 2020 are expected to take place in May 2016. Future auction results are dependent upon various factors including the demand and supplysituation, capacity additions and retirements and any changes in the current auction rules related to bidding for demand response and energy efficiency resources inthe capacity auctions. For DPL-owned generation, applicable capacity prices through the auction year 2018/19 are as follows:
Auction Year (June 01-May 31) 2018/19 2017/18 2016/17 2015/16 2014/15 2013/14
Capacity Clearing Price ($/MW-Day) $165 $152 $134 $136 $126 $28
The computed average capacity prices by calendar year are as follows:
Year 2018 2017 2016 2015 2014
Computed Average Capacity Price ($/MW-Day) $159 $145 $135 $132 $85
The above tables reflect the capacity prices after the transitional auctions discussed earlier. Substantially all of DP&L's capacity cleared in the CPauction. The results of these auctions could have a significant effect on DP&L's revenues in the future.
14

According to the terms of DP&L's RPM rider, a portion of the capacity revenue is credited to SSO customers primarily based on the load still being served tothe SSO customers. However, with the transition to market, no amount will be credited beginning January 1, 2016.
Regulatory Framework — Retail Regulation — DP&L is subject to regulation by the PUCO, for its distribution services and facilities, retail rates andcharges, reliability of service, compliance with renewable energy portfolio, energy efficiency program requirements and certain other matters. DP&L's rates forelectric service to retail customers consist of basic rates and charges that are set and approved by the PUCO after public hearings. In addition, DP&L's rates includevarious adjustment mechanisms including, but not limited to, those to reflect changes in fuel costs to generate electricity or purchased power prices, and the timelyrecovery of costs incurred to comply with alternative energy, renewables, energy efficiency, and economic development costs. These components functionindependently of one another, but the overall structure of DP&L's retail rates and charges are subject to the rules and regulations established by the PUCO.
Retail Rate Structure — Since Ohio is deregulated and allows customers to choose retail generation providers, DP&L is required to provide retail generationservice at SSO rates to any customer that has not signed a contract with a CRES provider. SSO rates are subject to rules and regulations of the PUCO and areestablished based on DP&L's Electric Security Plan ("ESP") filing. DP&L's wholesale transmission rates are regulated by the FERC. DP&L's distribution rates areregulated by the PUCO and are established through a traditional cost-based rate-setting process. DP&L is permitted to recover its costs of providing distributionservice as well as earn a regulated rate of return on assets, determined by the regulator, based on the utility's allowed regulated asset base, capital structure and costof capital.
The terms and conditions of DP&L's current SSO are provided under the ESP filed in 2012 and approved by the PUCO order dated September 4, 2013("2012 ESP"). The 2012 ESP has been in effect since January 2014 and allows DP&L to collect a non-bypassable Service Stability Rider ("SSR") equal to $110million per year from 2014 - 2016. It allowed for DP&L to recover its PJM-related transmission charges, alternative energy costs, fuel and purchased power costs,and established a SEET ("Significant Excessive Earnings Test") threshold of 12% ROE. It also required DP&L to conduct competitive bid auctions to procuregeneration supply for SSO service. DP&L's own generation was phased-out of supplying SSO service over the three year period. Beginning January 1, 2016DP&L's SSO will be 100% sourced through the competitive bid. For calendar years 2012 - 2014, DP&L was subject to a SEET threshold and was required to applygeneral rules for calculating earnings and comparing them to a comparable group to determine whether there were significantly excessive earnings during a givencalendar year. Through the 2012 ESP, the PUCO established DP&L's ROE SEET threshold at 12%. On May 15, 2014, DP&L filed its application to demonstratethat it did not have significantly excessive earnings for calendar year 2013. A stipulation was reached with the PUCO staff agreeing that DP&L did not exceed theSEET threshold for 2014. A hearing was held and the PUCO issued an order approving the SEET stipulation. In future years, the SEET could have a material effecton results of operations, financial condition and cash flows.
On October 30, 2015 DP&L publicly announced its intent to file an application to increase its distribution rates at the PUCO. On November 30, 2015 DP&Lfiled its distribution rate case using a 12-month test year of June 1, 2015 to May 31, 2016 to measure revenue and expenses and a date certain of September 30,2015 to measure its asset base. The Company is seeking an increase to distribution revenues of $66 million per year. The Company has asked for recovery ofcertain regulatory assets as well as two new riders that would allow the Company to recover certain costs on an ongoing basis. It has proposed a modified straight-fixed variable rate design in an effort to decouple distribution revenues from electric sales. If approved as filed the rates are expected to have a total bill impact ofapproximately 4% on a typical residential customer.
On February 22, 2016 DP&L filed an ESP that would be in effect beginning January 1, 2017. As part of this filing, DP&L is seeking a Reliable ElectricityRider for 10 years, based on the variance between the proposed revenue requirement and the actual revenues net of operating costs of the generation units. Thisplan establishes the terms and conditions for DP&L's Standard Service Offer (SSO) beginning June 1, 2017 to customers that do not choose a competitive retailelectric supplier. In its plan, DP&L recommends including renewable energy attributes as part of the product that is competitively bid, and seeks recovery ofapproximately $10 million of regulatory assets. The plan also proposes a new Distribution Investment Rider to allow DP&L to recover costs associated with futuredistribution equipment and infrastructure needs. Additionally, the plan establishes new riders set initially at zero, related to energy reductions from DP&L's energyefficiency programs, and certain environmental liabilities the Company may incur. There can be no assurance that the ESP will be approved as filed or on a timelybasis, and if the ESP is not approved on a timely basis or the final ESP provides for terms that are more adverse than those submitted in DP&L’s application, theCompany's consolidated results of operations, financial condition and cash flows could be materially impacted.
Environmental Matters — In relation to MATS, 3,066 MW of DPL's generation capacity is largely compliant with MATS, and DPL does not expect to incurmaterial capital expenditures to ensure compliance with MATS. For more information see Item 1. — United States Environmental and Land-Use Legislation andRegulations .
15

Key Financial Drivers — Although recent ESP and Generation Separation decisions provide some clarity on the underlying drivers through 2016, challengesremain for DPL beyond 2016 including the potential impacts of retail demand, weather, energy efficiency and wholesale prices on financial results. In addition,through 2016, DPL financial results are likely to be driven by many factors including, but not limited to, the following:
• PJM capacity prices auctioned already• Non-bypassable revenue: $110 million in 2014 and 2015 and allowed to earn $110 million annually in 2016• Operational performance of generation facilities
Beyond 2016, DPL financial drivers include many factors, such as the following:
• PJM capacity prices• Recovery in the power market, particularly as it relates to an expansion in dark spreads• Sale or transfer to a DPL affiliate of DP&L generation assets• DPL's ability to reduce its cost structure
See Item 1A.— Risk Factors for additional discussion on DPL.
Construction and Development — Planned construction additions primarily relate to new investments in and upgrades to DP&L's power plant equipment andtransmission and distribution system. Capital projects are subject to continuing review and are revised in light of changes in financial and economic conditions,load forecasts, legislative and regulatory developments and changing environmental standards, among other factors.
DPL is projecting to spend an estimated $439 million in capital projects for the period 2016 through 2018 with 61% attributable to Transmission andDistribution. DPL's ability to complete capital projects and the reliability of future service will be affected by its financial condition, the availability of internalfunds and the reasonable cost of external funds. We expect to finance these construction additions with a combination of cash on hand, short-term financing, long-term debt and cash flows from operations.
U.S. Generation
Business Description — In the U.S., we own a diversified generation portfolio in terms of geography, technology and fuel source. The principal markets andlocations where we are engaged in the generation and supply of electricity (energy and capacity) are the WECC, PJM, SPP and Hawaii. AES Southland, in theWECC, is our most significant generating business.
AES Southland
Business Description — In terms of aggregate installed capacity, AES Southland is one of the largest generation operators in California, with an installedcapacity of 3,941 MW, accounting for approximately 5% of the state's installed capacity and 17% of the peak demand of Southern California Edison. The threecoastal power plants comprising AES Southland are in areas that are critical for local reliability and play an important role in integrating the increasing amounts ofrenewable generation resources in California.
Market Structure — All of AES Southland's capacity is contracted through a long-term agreement (the “Tolling Agreement”), which expires in mid-2018.Under the Tolling Agreement, AES Southland's largest revenue driver is unit availability, as approximately 97% of its revenue comes from availability-relatedpayments. Historically, AES Southland has generally met or exceeded its contractual availability requirements under the Tolling Agreement and may capturebonuses for exceeding availability requirements in peak periods.
The offtaker under the Tolling Agreement provides gas to the three facilities at no cost; therefore, AES Southland is not exposed to significant fuel price risk.AES Southland does, however, guarantee the efficiency of each unit so that any fuel consumed in excess of what would have been consumed had the guaranteedefficiency been achieved is paid for by AES Southland. Additionally, if the units operate at an efficiency better than the guaranteed efficiency, AES Southland getscredit for the gas that is not consumed. The business is also exposed to the cost of replacement power for a limited time period if any of the plants are dispatched bythe offtaker and are not able to meet the required dispatch schedule for generation of electric energy.
AES Southland delivers electricity into the California ISO's market through its Tolling Agreement counterparty.
Re-powering — In October 2014, AES Southland was awarded 20-year contracts by SCE to provide 1,284 MW of combined cycle gas-fired generation and100 MW of interconnected battery-based energy storage. In addition to replacing older gas-fired plants with more efficient gas-fired capacity, SCE chose advancedenergy storage as a cost effective way to ensure critical power system reliability. This new storage resource will provide unmatched operational flexibility, enablingthe most
16

efficient dispatch of other generating plants, lowering cost and emissions and supporting the on-going addition of renewable power sources.
This new capacity will be built at the Company's existing power plant sites in Huntington Beach and Alamitos Beach. For the gas-fired capacity, financingagreements are expected to be finalized in 2016 with construction expected to begin in 2017, and commercial operation scheduled for 2020. For the energy storagecapacity, commercial operation is scheduled for 2021.
AES is pursuing permits to build both the gas-fired and energy storage capacity and will complete the licensing process before financial close. The total costfor these projects is expected to be approximately $1.9 billion, which will be funded with a combination of non-recourse debt and AES equity.
Regulatory Framework — Environmental Matters — For a discussion of environmental regulatory matters affecting U.S. Generation, see Item 1. —UnitedStates Environmental and Land-Use Legislation and Regulations.
Key Financial Drivers — AES Southland's contractual availability is the single most important driver of operations. Its units are generally required toachieve at least 86% availability in each contract year. AES Southland has historically met or exceeded its contractual availability.
Additional U.S. Generation Businesses
Business Description — Additional businesses include thermal and wind generating facilities, of which AES Hawaii and our U.S. wind generation businessare the most significant.
Many of our U.S. generation plants provide baseload operations and are required to maintain a guaranteed level of availability. Any change in availability hasa direct impact on financial performance. The plants are generally eligible for availability bonuses on an annual basis if they meet certain requirements. In additionto plant availability, fuel cost is a key business driver for some of our facilities.
AES Hawaii — AES Hawaii receives a fuel payment from its offtaker under a PPA expiring in 2022, which is based on a fixed rate indexed to the GNPIPD.Since the fuel payment is not directly linked to market prices for fuel, the risk arising from fluctuations in market prices for coal is borne by AES Hawaii.
To mitigate the risk from such fluctuations, AES Hawaii has entered into fixed-price coal purchase commitments that end in December 2018; the businesscould be subject to variability in coal pricing beginning in January 2019. To mitigate fuel risk beyond December 2018, AES Hawaii plans to seek additional fuelpurchase commitments on favorable terms. However, if market prices rise and AES Hawaii is unable to procure coal supply on favorable terms, the financialperformance of AES Hawaii could be materially and adversely affected.
US Wind — AES has 773 MW of wind capacity in the U.S., located in California, Texas and West Virginia. In July 2015, AES sold its interest in ArmeniaMountain, a wind project located in Pennsylvania with an installed capacity of 101 MW. Typically, these facilities sell under long-term PPAs. AES financed mostof these projects with tax equity structures. The tax equity investors receive a portion of the economic attributes of the facilities, including tax attributes that varyover the life of the projects. Based on certain liquidation provisions of the tax equity structures, this could result in a net loss to AES consolidated results in periodsin which the facilities report net income. These non cash net losses will be expected to reverse during the life of the facilities. Some of the wind projects areexposed to the volatility of energy prices and their revenue may change materially as energy prices fluctuate in their respective markets of operations.
Buffalo Gap is located in Texas and is comprised of three wind projects with an aggregate generation capacity of 524 MW. Each wind project operates itsown PPA with the exception of Buffalo Gap III whose PPA expired in December 2015. The energy price of the entire production of Buffalo Gap I is guaranteed bya PPA expiring in 2021. The PPA of Buffalo Gap II guarantees the energy price of 80% of the installed capacity while the energy price for the remaining 20% isdictated by the prices in the ERCOT market. The PPA of Buffalo Gap II expires in December 2017. Once the PPAs expire, the entire installed capacity of BuffaloGap will be exposed to the volatility of energy prices in the ERCOT market which could adversely affect revenues.
Laurel Mountain is a wind project located in West Virginia with an installed capacity of 98 MW. Laurel Mountain does not operate under a long-termcontract and sells its entire capacity and power generated into the PJM market. The volatility and fluctuations of energy prices in PJM have a direct impact in theresults of Laurel Mountain.
AES manages the wind portfolio as part of its broader investments in the U.S., leveraging operational and commercial resources to supplement theexperienced subject matter experts in the wind industry to achieve optimal results.
Market Structure — Coal is one of the primary fuels used by our U.S. generation facilities that has international prices set by market factors, although theprice of the other primary fuel, natural gas is generally set domestically. Price variations for these fuels can change the composition of generation costs and energyprices in our generation businesses, and the prices of these fuels have been subject to volatility in recent years. Many of these generation businesses have enteredinto long-term
17

PPAs with utilities or other offtakers. Some coal-fired power plant businesses in the U.S. with PPAs have mechanisms to recover fuel costs from the offtaker,including an energy payment that is partially based on the market price of coal. In addition, these businesses often have an opportunity to increase or decreaseprofitability from payments under their PPAs depending on such items as plant efficiency and availability, heat rate, ability to buy coal at lower costs through AES'global sourcing program and fuel flexibility. Revenue may change materially as prices in fuel markets fluctuate, but the variable margin or profitability should notbe materially changed when market price fluctuations in fuel are borne by the offtaker.
Regulatory Framework — Several of our generation businesses in the U.S. currently operate as QFs as defined under the PURPA. These businesses enteredinto long-term contracts with electric utilities that had a mandatory obligation under PURPA requirements to purchase power from QFs at the utility's avoided cost(i.e., the likely costs for both energy and capital investment that would have been incurred by the purchasing utility if that utility had to provide its own generatingcapacity or purchase it from another source). To be a QF, a cogeneration facility must produce electricity and useful thermal energy for an industrial or commercialprocess or heating or cooling applications in certain proportions to the facility's total energy output and meet certain efficiency standards. To be a QF, a smallpower production facility must generally use a renewable resource as its energy input and meet certain size criteria.
Our non-QF generation businesses in the U.S. currently operate as EWG as defined under EPAct 1992. These businesses, subject to approval of FERC, havethe right to sell power at market-based rates, either directly to the wholesale market or to a third-party offtaker such as a power marketer or utility/industrialcustomer. Under the FPA and FERC's regulations, approval from FERC to sell wholesale power at market-based rates is generally dependent upon a showing toFERC that the seller lacks market power in generation and transmission, that the seller and its affiliates cannot erect other barriers to market entry and that there isno opportunity for abusive transactions involving regulated affiliates of the seller. To prevent market manipulation, FERC requires sellers with market-based rateauthority to file certain reports, including a triennial updated market power analysis for markets in which they control certain threshold amounts of generation.
Other Regulatory Matters — The U.S. wholesale electricity market consists of multiple distinct regional markets that are subject to both federal regulation,as implemented by the U.S. FERC, and regional regulation as defined by rules designed and implemented by the RTOs, non-profit corporations that operate theregional transmission grid and maintain organized markets for electricity. These rules for the most part govern such items as the determination of the marketmechanism for setting the system marginal price for energy and the establishment of guidelines and incentives for the addition of new capacity. See Item 1A.—Risk Factors for additional discussion on U.S. regulatory matters.
Our businesses are subject to emission regulations, which may result in increased operating costs or the purchase of additional pollution control equipment ifemission levels are exceeded. Our businesses periodically review their obligations for compliance with environmental laws, including site restoration andremediation. Because of the uncertainties associated with environmental assessment and remediation activities, future costs of compliance or remediation could behigher or lower than the amount currently accrued, if any. For a discussion of environmental laws and regulations affecting the U.S. business, see Item 1.— USEnvironmental and Land-Use Legislation and Regulations .
Key Financial Drivers — U.S. Generation's financial results are driven by fuel costs and outages. The Company has entered into long-term fuel contracts tomitigate the risks associated with fluctuating prices. In addition, major maintenance requiring units to be off-line is performed during periods when power demandis typically lower. The financial results of US Wind are primarily driven by increased production due to faster and less turbulent wind, and reduced turbine outages.In addition, PJM and ERCOT power prices impact financial results for the wind projects that are operating without long-term contracts for all or some of theircapacity.
Construction and Development — Planned capital projects include the AES Southland re-powering described above. In addition to the new constructionprojects, U.S. Generation performs capital projects related to major plant maintenance, repairs, and upgrades to be compliant with new environmental laws andregulations.
Andes SBU
Our Andes SBU has generation facilities in three countries — Chile, Colombia and Argentina. AES Gener, which owns all of our assets in Chile, Chivor inColombia and TermoAndes in Argentina, as detailed below, is a publicly listed company in Chile. AES has a 66.7% ownership interest in AES Gener and thisbusiness is consolidated in our financial statements.
Our Andes operations accounted for the following proportions of consolidated AES Operating Margin, AES Adjusted PTC (a non-GAAP measure), AESOperating Cash Flow, and AES Proportional Free Cash Flow (a non-GAAP measure):
Andes SBU (1)2015 2014 2013
% of AES Operating Margin 22% 19% 17%
% of AES Adjusted PTC (a non-GAAP measure) 30% 23% 19%
% of AES Operating Cash Flow 18% 16% 11%
% of AES Proportional Free Cash Flow (a non-GAAP measure) 14% 13% 10%
18

(1) Percentages reflect the contributions by our Andes SBU before deductions for Corporate.
The following table provides highlights of our Andes operations:
Countries Chile, Colombia and ArgentinaGeneration Capacity 8,141 gross MW (6,008 proportional MW)Generation Facilities 38 (including 5 under construction)Key Generation Businesses AES Gener Chile, Chivor and AES Argentina
Operating installed capacity of our Andes SBU totals 8,141 MW, of which 44%, 44% and 12% is located in Argentina, Chile and Colombia, respectively.Presented in the table below is a list of our Andes SBU generation facilities:
Business Location Fuel Gross MW AES EquityInterest (%Rounded) Year Acquired or
Began Operation ContractExpiration Date Customer(s)
Chivor Colombia Hydro 1,000 67% 2000 Short-term VariousColombia Subtotal 1,000 Electrica Santiago (1) Chile Gas/Diesel 750 67% 2000 Gener - SIC (2) Chile Hydro/Coal/Diesel/Biomass 692 67% 2000 2020-2037 Various
Guacolda (3) Chile Coal/Pet Coke 760 33% 2000 2017-2032 VariousElectrica Angamos
Chile
Coal
558
67%
2011
2026-2037
Minera Escondida, Minera Spence,
Quebrada BlancaGener - SING (4)
Chile
Coal/Pet Coke
277
67%
2000
2016-2037
Minera Escondida, Codelco, SQM,
Quebrada Blanca
Electrica Ventanas (5) Chile Coal 272 67% 2010 2025 Gener
Electrica Campiche (6) Chile Coal 272 67% 2013 2020 Gener
Electrica Angamos ES Chile Energy Storage 20 67% 2011
Gener - Norgener ES (Los Andes) Chile Energy Storage 12 67% 2009 Chile Subtotal 3,613
TermoAndes (7) Argentina Gas/Diesel 643 67% 2000 Short-term VariousAES Gener Subtotal 5,256 Alicura Argentina Hydro 1,050 100% 2000 2017 VariousParaná-GT Argentina Gas/Diesel 845 100% 2001 San Nicolás Argentina Coal/Gas/Oil 675 100% 1993 Los Caracoles (8)
Argentina
Hydro
125
—%
2009
2019
Energia Provincial Sociedad del
Estado (EPSE)Cabra Corral Argentina Hydro 102 100% 1995
Ullum Argentina Hydro 45 100% 1996 Sarmiento Argentina Gas/Diesel 33 100% 1996 El Tunal Argentina Hydro 10 100% 1995 Argentina Subtotal 2,885 Andes Total 8,141
(1) Electrica Santiago plants: Nueva Renca, Renca, Los Vientos and Santa Lidia.(2) Gener - SIC plants: Alfalfal, Laguna Verde, Laguna Verde Turbogas, Laja, Maitenes, Queltehues, Ventanas 1, Ventanas 2 and Volcán.(3) Guacolda plants: Guacolda 1, 2, 3, 4, and 5. Unconsolidated entities for which the results of operations are reflected in Equity in Earnings of Affiliates. The Company's ownership in Guacolda is held through AES Gener, a 67%-
owned consolidated subsidiary. AES Gener owns 50% of Guacolda, resulting in an AES effective ownership in Guacolda of 33%.(4) Gener - SING plants: Norgener 1 and Norgener 2.(5) Electrica Ventanas plant: Ventanas 3.(6) Electrica Campiche plant: Ventanas 4.(7) TermoAndes is located in Argentina, but is connected to both the SING in Chile and the SADI in Argentina.(8) AES operates these facilities through management or O&M agreements and owns no equity interest in these businesses.
19

Under Construction — The following table lists our plants under construction in the Andes SBU:
Business Location Fuel Gross MW AES Equity Interest (% Rounded) Expected Year of Commercial Operations
Cochrane Chile Coal 532 40% 2H 2016Alto Maipo Chile Hydro 531 40% 2H 2018/1H 2019Andes Solar Chile Solar 21 67% 1H 2016Cochrane ES Chile Energy Storage 20 40% 2H 2016Chile Subtotal 1,104 Tunjita Colombia Hydro 20 67% 1H 2016Colombia Subtotal 20 Andes Total 1,124
The following map illustrates the location of our Andes facilities:
Andes Businesses
Chile
Business Description — In Chile, through AES Gener, we are engaged in the generation and supply of electricity (energy and capacity) in the two principalmarkets: the SIC and SING. In terms of aggregate installed capacity, AES Gener is the second largest generation operator in Chile with a calculated installedcapacity of 3,581 MW, excluding energy storage and TermoAndes, and a market share of 17.7% as of December 31, 2015.
AES Gener owns a diversified generation portfolio in Chile in terms of geography, technology, customers and fuel source. AES Gener's installed capacity islocated near the principal electricity consumption centers, including Santiago, Valparaiso and Antofagasta. AES Gener's diverse generation portfolio, composed ofhydroelectric, coal, gas, diesel and biomass facilities, allows the businesses to operate under a variety of market and hydrological conditions, manage AES Gener'scontractual obligations with regulated and unregulated customers and, as required, provide backup spot market energy. AES Gener has experienced significantgrowth in recent years responding to market opportunities with the completion of nine generation projects totaling approximately 1,861 MW, including the 152MW Unit 5 of Guacolda completed in December 2015, and increasing AES Gener's installed capacity by 55% from 2006 to 2015. Additionally, we areconstructing an additional 1,104 MW, comprised of the 21 MW Andes Solar and 20 MW Cochrane Energy Storage in the SING, the 532 MW coal-fired Cochraneplant in the SING and the 531 MW Alto Maipo run-of-the-river hydroelectric plant in the SIC.
In Chile, we align AES Gener's contracts to reduce the risk and improve margins, contracting a significant portion of their baseload capacity, currently coaland hydroelectric, under long-term contracts with a diversified customer base, including both regulated and unregulated customers. AES Gener reserves its highervariable cost units as designated backup facilities, principally the diesel- and gas-fired units in Chile, for sales to the spot market during scarce system supplyconditions, such as
20

dry hydrological conditions and plant outages. In Chile, sales on the spot market are made only to other generation companies that are members of the relevantCDEC at the system marginal cost.
AES Gener currently has long-term contracts, with average terms of 13 to 16 years, with regulated distribution companies and unregulated customers, suchas mining and industrial companies. In general, these long-term contracts include both fixed and variable payments along with indexation mechanisms thatperiodically adjust prices based on the generation cost structure related to the CPI, the international price of coal, and in some cases, with pass-through of fuel andregulatory costs, including changes in law.
In addition to energy payments, AES Gener also receives firm capacity payments for contributing to the system's ability to meet peak demand. Thesepayments are added to the final electricity price paid by both unregulated and regulated customers. In each system, the CDEC annually determines the firmcapacity amount allocated to each power plant. A plant's firm capacity is defined as the capacity that it can guarantee at peak hours during critical conditions, suchas droughts, taking into account statistical information regarding maintenance periods and water inflows in the case of hydroelectric plants. The capacity price isfixed by the CNE in the semiannual node price report and indexed to the CPI and other relevant indices.
During November, 2015, AES successfully completed the sale of 4% interest in AES Gener S.A. through its direct shareholder Inversiones Cachagua S.p.A.("Cachagua") through a private auction. The strategic rationale of this sale was to increase the liquidity of the AES Gener's Share and its exposure on internationalmarkets. As a result of this transaction AES now owns 66.7% of AES Gener.
Market Structure — Chile has two main power systems, largely as a result of its geographic shape and size. The SIC is the largest of these systems, with aninstalled capacity of 15,911 MW as of December 31, 2015. The SIC serves approximately 92% of the Chilean population, including the densely populated SantiagoMetropolitan Region, and represents 74% of the country's electricity demand. The SING serves about 6% of the Chilean population, representing 25% of Chile'selectricity consumption, and is mostly oriented toward mining companies.
In 2015, thermoelectric generation represented 62% of the total generation in Chile. In the SIC, thermoelectric generation represents 50% of installedcapacity, required to fulfill demand not satisfied by hydroelectric output and is critical to guaranteeing reliable and dependable electricity supply under dryhydrological conditions. In the SING, which includes the Atacama Desert, the driest desert in the world, thermoelectric capacity represents 96% of installedcapacity. The fuels used for generation, mainly coal, diesel and LNG, are indexed to international prices.
In the SIC, where hydroelectric plants represent a large part of the system's installed capacity, hydrological conditions largely influence plant dispatch and,therefore, spot market prices, given that river flow volumes, melting snow and initial water levels in reservoirs largely determine the dispatch of the system'shydroelectric and thermoelectric generation plants. Rainfall and snowfall occur in Chile principally in the southern cone winter season (June to August) and duringthe remainder of the year precipitation is scarce. When rain is abundant, energy produced by hydroelectric plants can amount to more than 70% of total generation.In 2015 hydroelectric generation represented 45% of total energy production.
Regulatory Framework — Electricity Regulation — The government entity that has primary responsibility for the Chilean electricity system is the Ministryof Energy, acting directly or through the CNE and the Superintendency of Electricity and Fuels. The electricity sector is divided into three segments: generation,transmission and distribution. In general terms, generation and transmission expansion are subject to market competition, while transmission operation anddistribution, are subject to price regulation. The transmission segment consists of companies that transmit the electricity produced by generation companies at highvoltage. Companies that are owners of a trunk transmission system, generally high voltage transmission lines with capacity of 220 Kv and higher (with bi-directional flows and relevant number of users), cannot participate in the generation or distribution segments.
Companies in the SIC and the SING that possess generation, transmission, sub-transmission or additional transmission facilities, as well as unregulatedcustomers directly connected to transmission facilities, are coordinated through the CDEC, which minimizes the operating costs of the electricity system, whilemeeting all service quality and reliability requirements. The principal purpose of the CDEC is to ensure that the most efficient electricity generation available tomeet demand is dispatched to customers. The CDEC dispatches plants in merit order based on their variable cost of production which allows for electricity to besupplied at the lowest available cost.
All generators can commercialize energy through contracts with distribution companies for their regulated and unregulated customers or directly withunregulated customers. Unregulated customers are customers whose connected capacity is higher than 2 MW. By law, both regulated and unregulated customersare required to purchase all of their electricity requirements under contract. Generators may also sell energy to other power generation companies on a short-termbasis. Power generation companies may engage in contracted sales among themselves at negotiated prices outside the spot market. Electricity prices in Chile, undercontract and on the spot market, are denominated in U.S. Dollars, although payments are made in Chilean Pesos.
21

Other Regulatory Considerations — In 2011, a regulation on air emission standards for thermoelectric power plants became effective. This regulationprovides for stringent limits on emission of PM and gases produced by the combustion of solid and liquid fuels, particularly coal. For existing plants, includingthose currently under construction, the new limits for PM emissions went into effect at the end of 2013, and the new limits for SO 2 , NO x and mercury emissionwill begin to apply in mid-2016, except for those plants operating in zones declared saturated or latent zones (areas at risk of or affected by excessive air pollution),where these emission limits will become effective by June 2015. In order to comply with the new emission standards, AES Gener initiated investments in Chile atits older coal facilities (Ventanas I and II and Norgener I and II, constructed between 1964 and 1997) in 2012. As of December 31, 2015, AES Gener has concludedinvestments of approximately $229 million in order to comply within the required time frame. Additionally, its equity method investee Guacolda started theinstallation of new equipment during 2013, spending approximately $185 million (Guacolda I, II and IV) as of December 31, 2015 with the remaining $37 millionto be invested in 2016.
Chilean law requires every electricity generator to supply a certain portion of its total contractual obligations with NCREs. In October 2013, the NCRE lawwas amended, increasing the NCRE requirements. The law distinguishes between energy contracts executed before and after July 1, 2013. For contracts executedbetween August 31, 2007 and July 1, 2013, the NCRE requirement is equal to 5% in 2014 with annual contract increases of 0.5% until reaching 10% in 2024. TheNCRE requirement for contracts executed after July 1, 2013 is equal to 5% in 2013, with annual increases of 1% thereafter until reaching 12% in 2020, andsubsequently annual increases of 1.5% until it is equal to 20% in 2025. Generation companies are able to meet this requirement by developing their own NCREgeneration capacity (wind, solar, biomass, geothermal and small hydroelectric technology), purchasing NCREs from qualified generators or by paying theapplicable fines for non-compliance. AES Gener currently fulfills the NCRE requirements by utilizing AES Gener's own biomass power plants and by purchasingNCREs from other generation companies. It has sold certain water rights to companies that are developing small hydro projects, entering into power purchaseagreements with these companies in order to promote development of these projects, while at the same time meeting the NCRE requirements. At present, AESGener is in the process of negotiating additional NCRE supply contracts to meet the future requirements.
In September 2014 a new tax law was enacted. The new law introduces an emission tax, or "green tax", that assesses the emissions of PM, SO 2 , NO x andCO 2 produced for installations with an installed capacity over 50 MW. The first annual payment shall be made in April 2018, regarding the emissions producedduring year 2017. In the case of CO 2 , the tax will be equivalent to $5 per ton emitted. In the SING, all PPAs have "change of law" clauses, which would allow thecompany to transfer this cost to customers. In the SIC, costs can only be passed through to unregulated customers, as existing PPAs with discos do not have changeof law clauses. According to its PPAs, the company is currently discussing the pass-through mechanism with each client. Additionally, new tax laws were enactedin February 2016 in Chile which will increase the statutory income tax rate for most of our Chilean businesses from 25% to 25.5% in 2017 and to 27% for 2018and future years. See Item 7— Management's Discussion and Analysis of Financial Condition and Results of Operations — Critical Accounting Policies andEstimates — Income Taxes for further details of the impacts of these new laws.
In June 2015, the Chilean government published Decree N°7/2015, which allowed energy exportation to Argentina using the transmission line whichconnects the SING (Chilean Northern Grid) with the SADI (Argentine Grid). The AES transmission line has a capacity of approximately 600MW, but will beoperated at 200 MW according to technical studies. AES Gener signed an agreement with CAMMESA and other generators (Gas Atacama and ECL) in order toexport electricity to Argentina.
Key Financial Drivers — Hedge levels at Gener provide some certainty and clarity on the underlying financial drivers through 2016. However, some risksremain through 2016, including, but not limited to, the following:
• Dry hydrology scenarios reduce hydro generation (See Item 7.— Key Trends and Uncertainties — Operational — Weather sensitivity for furtherdiscussion)
• Forced outages may impact earnings
• Changes in current regulatory rulings could alter the ability to pass through or recover certain costs
• AES is exposed to the fluctuation of the Chilean peso, which may pose a risk to earnings; our hedging strategy reduces this risk, but some residual risk toearnings remains
• Tax policy changes
Beyond 2016, financial drivers include all of the above factors, but also:
• Current legislation is trending towards promoting renewable energy and strengthening regulations on thermal generation assets, posing a risk to future coalmargins
• Market price risk when re-contracting
22

Construction and Development — Since 2007, AES Gener has constructed and initiated commercial operations of approximately 1,830 MW of new capacity,representing a significant portion of the increase in installed capacity and investment in the SIC and SING during the period. In Chile, AES Gener has a 21 MWsolar project with a scheduled COD in the first half of 2016 and the 532 MW Cochrane project in the SING, expected to begin operations in 2016. The Cochraneproject has an adjacent 20 MW energy storage project, which is also scheduled to initiate operations in 2016.
Additionally, in the SIC, AES Gener initiated construction of the 531 MW two unit Alto Maipo run-of-river hydroelectric project in December 2013,adjacent to our existing Alfalfal power plant, located 50 km from Santiago. Alto Maipo is the largest project in construction in the SIC market and it includes 67kilometers of tunnel works, 2 caverns, 17 km of transmission lines as part of the construction, and is 90% underground. Alto Maipo has three main contractors andcovers three adjacent valleys in the Chilean Andes. As of today, the project employs 4,100 people and expects to reach a peak close to 4,500 in the second half of2017. The project units are scheduled to reach commercial operation in the second half of 2018 and the first half of 2019.
Colombia
Business Description — Chivor, a subsidiary of AES Gener, owns a hydroelectric facility with installed capacity of 1,000 MW, located approximately 160km east of Bogota. As of December 31, 2015, AES Gener's net power production in Colombia was 4,112 GWh. The installed capacity represents approximately6.2% of system capacity as of December 31, 2015. The plant consists of eight 125 MW dam-based hydroelectric generating units in two separate sub-facilities. Allof Chivor's installed capacity in Colombia is hydroelectric and is therefore dependent on the prevailing hydrological conditions in the region in which it operates.Hydrological conditions largely influence generation and the spot prices at which Chivor sells its non-contracted generation in Colombia.
Chivor's commercial strategy focuses a significant portion of the expected output under contracts, principally with distribution companies, in order to providecash flow stability. These bilateral contracts with distribution companies are awarded in public bids and normally last from one to three years. The remaininggeneration is sold on the spot market to other generation and trading companies at the system marginal cost, allowing us to maximize the operating margin.
Additionally, Chivor receives reliability payments for the availability and reliability of Chivor's reservoir during periods of scarcity, such as adversehydrological conditions. These payments, referred to as "reliability charge payments" are designed to compensate generation companies for the firm energy thatthey are capable of providing to the system during critical periods of low supply in order to prevent electricity shortages.
Market Structure — Electricity supply in Colombia is concentrated in one main system, the SIN. The SIN encompasses one-third of Colombia's territory,providing coverage to 96% of the country's population. The SIN's installed capacity totaled 16,221 MW as of December 31, 2015, comprised of 69.0%hydroelectric generation, 30.4% thermoelectric generation and 0.6% other. The dominance of hydroelectric generation and the marked seasonal variations inColombia's hydrology result in price volatility in the short-term market. In 2015, 68.2% of total energy demand was supplied by hydroelectric plants with theremaining supply from thermoelectric generation (31.0%) and cogeneration and self-generation power (0.8%). From 2003 to 2015, electricity demand in the SINhas grown at a compound annual growth rate of 3.1% and the UPME projects an average compound annual growth rate in electricity demand of 2.8% per year forthe next ten years.
Regulatory Framework — Electricity Regulation — Since 1994, the electricity sector in Colombia has operated under a competitive market framework forthe generation and sale of electricity and a regulated framework for transmission and distribution. The distinct activities of the electricity sector are governed byvarious laws and the regulations and technical standards issued by the CREG. Other government entities that play an important role in the electricity industryinclude the MME, which defines the government's policy for the energy sector; the Public Utility Superintendency of Colombia, which is in charge of overseeingand inspecting the utility companies; and the UPME, which is in charge of planning the expansion of the generation and transmission network.
The generation sector is organized on a competitive basis with companies selling their generation in the wholesale market at the short-term price or underbilateral contracts with other participants, including distribution companies, generators and traders, and unregulated customers at freely negotiated prices.Generation companies must submit price bids and report the quantity of energy available on a daily basis. The National Dispatch Center dispatches generators inmerit order based on bid offers in order to ensure that demand will be satisfied by the lowest cost combination of available generating units.
Other Regulatory Considerations — In the past few years, Colombian authorities have discussed proposals to make certain regulatory changes, which havenot been implemented as of December 2015. One proposal is to replace or complement the current public auction system in which each distribution company holdsan auction for its specific requirements and subsequently executes bilateral contracts with generation or trading companies, with a centralized auction in which themarket administrator purchases energy for all distribution companies. During 2015, regulators developed rules to implement Law 1715 passed in 2014 regardingthe participation of renewables sources in the electric sector and the rules for negotiation of excess of energy from self-generators. Due to very high spot prices inthe market, the regulator implemented a temporary "spot price cap"
23

equivalent to the 75% of the first step of rationing cost. At the end of 2015, CREG assigned new firm energy obligations for the next 3 years (2017-2019).Additionally, regulation for emergency energy situations, such as severe drought conditions, was introduced in 2014 with the objective of avoiding shortages andother negative economic impacts. For 2016, the most probable changes in regulation will relate to the AGC ancillary services market as well as a general revisionof the reliability charge scheme.
Key Financial Drivers — Hydrological conditions largely influence Chivor's generation level. Maintaining the appropriate contract level, while working tomaximize revenue, through sale of excess generation, is key to Chivor's results of operations (see Item 7.— Key Trends and Uncertainties — Operational —Weather sensitivity for further discussion). Hedge levels at Chivor provide certainty and clarity on the underlying financial drivers, hedging the net cash flows ofChivor, up to 90%. However, some risks remain beyond 2016. In addition to hydrology, through 2016, financial results are likely to be driven by many factorsincluding, but not limited to, the following:
• Forced outages may impact earnings• AES is exposed to fluctuation of the Colombian peso, which pose a risk to earnings; our hedging strategy reduces this risk, but some residual risk to
earnings remains
Beyond 2016, financial drivers include all of the above factors, but also:
• Chivor has exposure to the spot market as hedge levels are lower in the future
Construction and Development — In Colombia, AES Gener is currently constructing the 20 MW Tunjita run-of-river hydroelectric project, which isscheduled to start operations in the first half of 2016.
Argentina
Business Description — As of December 31, 2015, AES Argentina operates 3,528 MW which represents 10.5% of the country's total installed capacity. Theinstalled capacity in the SADI includes the TermoAndes plant, a subsidiary of AES Gener, which is connected both to the SADI and the Chilean SING. AESArgentina has a diversified generation portfolio of ten generation facilities, comprised of 62% thermoelectric and 38% hydroelectric capacity. All of thethermoelectric capacity has the capability to burn alternative fuels. Approximately 69% of the thermoelectric capacity can operate alternatively with natural gas ordiesel oil, and the remaining 31% can operate alternatively with natural gas, fuel oil, or coal.
AES Argentina primarily sells its production to the wholesale electric market where prices are largely regulated. In 2015, approximately 93% of the energywas sold in the wholesale electric market and 7% was sold under contract, as a result of the Energy Plus sales made by TermoAndes. Market prices are determinedin Argentine Pesos by CAMMESA, the wholesale electric market administrator.
All of the thermoelectric facilities not affected by the Resolution 95/2013, a regulation passed in March 2013 discussed below, including the portion ofTermoAndes plant committed to Energy Plus Contracts, are able to use natural gas and receive gas supplied through contracts with Argentine producers. In recentyears, gas supply restrictions in Argentina, particularly during the winter season, have affected some of the plants, such as the TermoAndes plant which isconnected to the SING by a transmission line owned by AES Gener. The TermoAndes plant commenced operations in 2000, selling exclusively into the ChileanSING. In 2008, following requirements from the Argentine authorities, TermoAndes connected its two gas turbines to the SADI, while maintaining its steamturbine connected to the SING. However, since mid-December 2011, TermoAndes has been selling the plant's full capacity in the SADI. TermoAndes' electricitypermit to export to the SING expired on January 31, 2013 and its potential renewal is being evaluated.
Market Structure — The SADI electricity market is managed by CAMMESA. As of December 31, 2015, the installed capacity of the SADI totaled 33,480MW. In 2015, 64% of total energy demand was supplied by thermoelectric plants, 31% by hydroelectric plants and 6% from nuclear, wind and solar plants.
Thermoelectric generation in the SADI is principally fueled by natural gas. However, since 2004 due to natural gas shortages, in addition to increasingelectricity demand, the use of alternative fuels in thermoelectric generation, such as oil and coal, has increased. Given the importance of hydroelectric facilities inthe SADI, hydrological conditions determining river flow volumes and initial water levels in reservoirs largely influence hydroelectric and thermoelectric plantdispatch. Rainfall occurs principally in the southern cone winter season (June to August).
Regulatory Framework — Electricity Regulation — The Argentine regulatory framework divides the electricity sector into generation, transmission anddistribution. The wholesale electric market is made up of generation companies, transmission companies, distribution companies and large customers who areallowed to buy and sell electricity. Generation companies can sell their output in the short-term market or to customers in the contract market. CAMMESA isresponsible for dispatch coordination and determination of short-term prices. The Electricity National Regulatory Agency is in charge of regulating
24
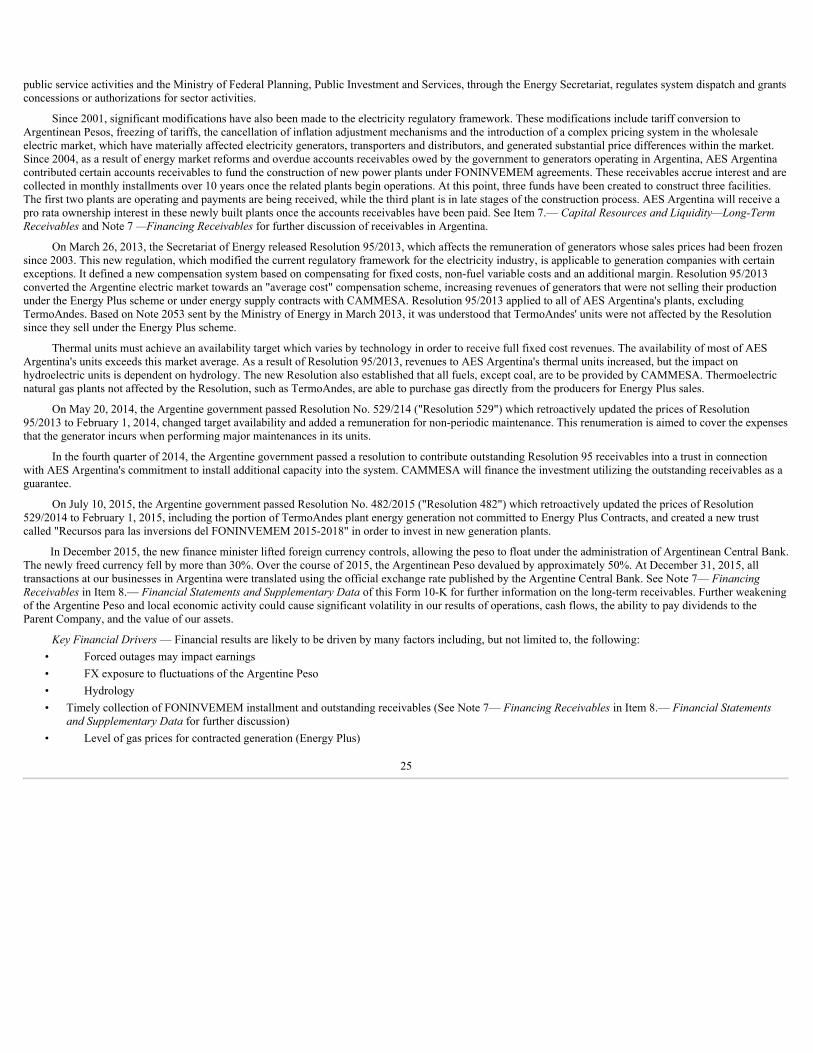
public service activities and the Ministry of Federal Planning, Public Investment and Services, through the Energy Secretariat, regulates system dispatch and grantsconcessions or authorizations for sector activities.
Since 2001, significant modifications have also been made to the electricity regulatory framework. These modifications include tariff conversion toArgentinean Pesos, freezing of tariffs, the cancellation of inflation adjustment mechanisms and the introduction of a complex pricing system in the wholesaleelectric market, which have materially affected electricity generators, transporters and distributors, and generated substantial price differences within the market.Since 2004, as a result of energy market reforms and overdue accounts receivables owed by the government to generators operating in Argentina, AES Argentinacontributed certain accounts receivables to fund the construction of new power plants under FONINVEMEM agreements. These receivables accrue interest and arecollected in monthly installments over 10 years once the related plants begin operations. At this point, three funds have been created to construct three facilities.The first two plants are operating and payments are being received, while the third plant is in late stages of the construction process. AES Argentina will receive apro rata ownership interest in these newly built plants once the accounts receivables have been paid. See Item 7.— Capital Resources and Liquidity—Long-TermReceivables and Note 7 —Financing Receivables for further discussion of receivables in Argentina.
On March 26, 2013, the Secretariat of Energy released Resolution 95/2013, which affects the remuneration of generators whose sales prices had been frozensince 2003. This new regulation, which modified the current regulatory framework for the electricity industry, is applicable to generation companies with certainexceptions. It defined a new compensation system based on compensating for fixed costs, non-fuel variable costs and an additional margin. Resolution 95/2013converted the Argentine electric market towards an "average cost" compensation scheme, increasing revenues of generators that were not selling their productionunder the Energy Plus scheme or under energy supply contracts with CAMMESA. Resolution 95/2013 applied to all of AES Argentina's plants, excludingTermoAndes. Based on Note 2053 sent by the Ministry of Energy in March 2013, it was understood that TermoAndes' units were not affected by the Resolutionsince they sell under the Energy Plus scheme.
Thermal units must achieve an availability target which varies by technology in order to receive full fixed cost revenues. The availability of most of AESArgentina's units exceeds this market average. As a result of Resolution 95/2013, revenues to AES Argentina's thermal units increased, but the impact onhydroelectric units is dependent on hydrology. The new Resolution also established that all fuels, except coal, are to be provided by CAMMESA. Thermoelectricnatural gas plants not affected by the Resolution, such as TermoAndes, are able to purchase gas directly from the producers for Energy Plus sales.
On May 20, 2014, the Argentine government passed Resolution No. 529/214 ("Resolution 529") which retroactively updated the prices of Resolution95/2013 to February 1, 2014, changed target availability and added a remuneration for non-periodic maintenance. This renumeration is aimed to cover the expensesthat the generator incurs when performing major maintenances in its units.
In the fourth quarter of 2014, the Argentine government passed a resolution to contribute outstanding Resolution 95 receivables into a trust in connectionwith AES Argentina's commitment to install additional capacity into the system. CAMMESA will finance the investment utilizing the outstanding receivables as aguarantee.
On July 10, 2015, the Argentine government passed Resolution No. 482/2015 ("Resolution 482") which retroactively updated the prices of Resolution529/2014 to February 1, 2015, including the portion of TermoAndes plant energy generation not committed to Energy Plus Contracts, and created a new trustcalled "Recursos para las inversions del FONINVEMEM 2015-2018" in order to invest in new generation plants.
In December 2015, the new finance minister lifted foreign currency controls, allowing the peso to float under the administration of Argentinean Central Bank.The newly freed currency fell by more than 30%. Over the course of 2015, the Argentinean Peso devalued by approximately 50%. At December 31, 2015, alltransactions at our businesses in Argentina were translated using the official exchange rate published by the Argentine Central Bank. See Note 7— FinancingReceivables in Item 8.— Financial Statements and Supplementary Data of this Form 10-K for further information on the long-term receivables. Further weakeningof the Argentine Peso and local economic activity could cause significant volatility in our results of operations, cash flows, the ability to pay dividends to theParent Company, and the value of our assets.
Key Financial Drivers — Financial results are likely to be driven by many factors including, but not limited to, the following:• Forced outages may impact earnings• FX exposure to fluctuations of the Argentine Peso• Hydrology• Timely collection of FONINVEMEM installment and outstanding receivables (See Note 7— Financing Receivables in Item 8.— Financial Statements
and Supplementary Data for further discussion)• Level of gas prices for contracted generation (Energy Plus)
25

• Regulatory changes from new government (See Item 7.— Key Trends and Uncertainties—Macroeconomics— Argentina for further discussion)
Brazil SBU
Our Brazil SBU has generation and distribution businesses. Eletropaulo and Tietê are publicly listed companies in Brazil. AES has a 16% economic interestin Eletropaulo and a 24% economic interest in Tietê, and these businesses are consolidated in our financial statements as we maintain control over their operations.Our Brazil operations accounted for the following proportions of consolidated AES Operating Margin, AES Adjusted PTC (a non-GAAP measure), AES OperatingCash Flow, and AES Proportional Free Cash Flow (a non-GAAP measure):
26
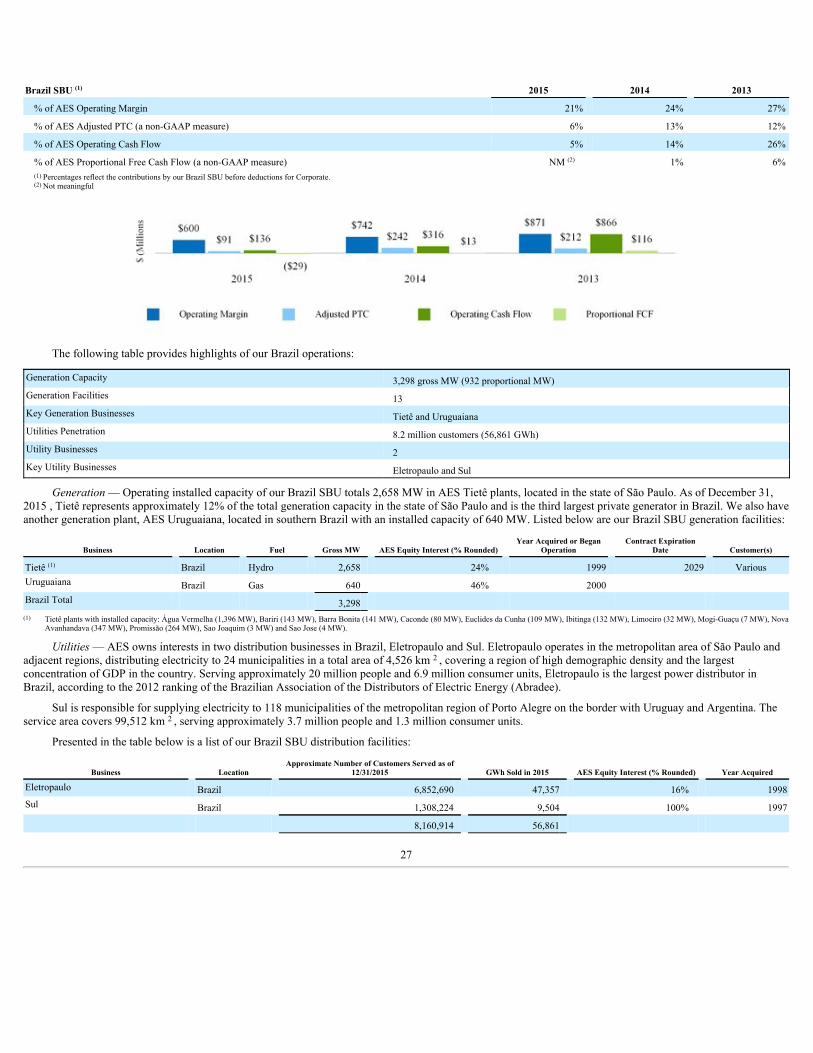
Brazil SBU (1) 2015 2014 2013
% of AES Operating Margin 21% 24% 27%
% of AES Adjusted PTC (a non-GAAP measure) 6% 13% 12%
% of AES Operating Cash Flow 5% 14% 26%
% of AES Proportional Free Cash Flow (a non-GAAP measure) NM (2) 1% 6%(1) Percentages reflect the contributions by our Brazil SBU before deductions for Corporate.(2) Not meaningful
The following table provides highlights of our Brazil operations:
Generation Capacity 3,298 gross MW (932 proportional MW)Generation Facilities 13Key Generation Businesses Tietê and UruguaianaUtilities Penetration 8.2 million customers (56,861 GWh)Utility Businesses 2Key Utility Businesses Eletropaulo and Sul
Generation — Operating installed capacity of our Brazil SBU totals 2,658 MW in AES Tietê plants, located in the state of São Paulo. As of December 31,2015 , Tietê represents approximately 12% of the total generation capacity in the state of São Paulo and is the third largest private generator in Brazil. We also haveanother generation plant, AES Uruguaiana, located in southern Brazil with an installed capacity of 640 MW. Listed below are our Brazil SBU generation facilities:
Business Location Fuel Gross MW AES Equity Interest (% Rounded) Year Acquired or BeganOperation Contract Expiration
Date Customer(s)
Tietê (1) Brazil Hydro 2,658 24% 1999 2029 VariousUruguaiana Brazil Gas 640 46% 2000 Brazil Total 3,298
(1) Tietê plants with installed capacity: Água Vermelha (1,396 MW), Bariri (143 MW), Barra Bonita (141 MW), Caconde (80 MW), Euclides da Cunha (109 MW), Ibitinga (132 MW), Limoeiro (32 MW), Mogi-Guaçu (7 MW), NovaAvanhandava (347 MW), Promissão (264 MW), Sao Joaquim (3 MW) and Sao Jose (4 MW).
Utilities — AES owns interests in two distribution businesses in Brazil, Eletropaulo and Sul. Eletropaulo operates in the metropolitan area of São Paulo andadjacent regions, distributing electricity to 24 municipalities in a total area of 4,526 km 2 , covering a region of high demographic density and the largestconcentration of GDP in the country. Serving approximately 20 million people and 6.9 million consumer units, Eletropaulo is the largest power distributor inBrazil, according to the 2012 ranking of the Brazilian Association of the Distributors of Electric Energy (Abradee).
Sul is responsible for supplying electricity to 118 municipalities of the metropolitan region of Porto Alegre on the border with Uruguay and Argentina. Theservice area covers 99,512 km 2 , serving approximately 3.7 million people and 1.3 million consumer units.
Presented in the table below is a list of our Brazil SBU distribution facilities:
Business Location Approximate Number of Customers Served as of12/31/2015 GWh Sold in 2015 AES Equity Interest (% Rounded) Year Acquired
Eletropaulo Brazil 6,852,690 47,357 16% 1998Sul Brazil 1,308,224 9,504 100% 1997 8,160,914 56,861
27

The following map illustrates the location of our Brazil facilities:
Brazil Generation Businesses
Business Description — Tietê has a portfolio of 12 hydroelectric power plants with total installed capacity of 2,658 MW in the state of São Paulo. Tietê wasprivatized in 1999 under a 30-year concession expiring in 2029. AES owns a 24% economic interest in Tietê, our partner, the BNDES, owns 28% and theremaining shares are publicly held or held by government-related entities. AES is the controlling shareholder and manages and consolidates this business.
Tietê sold nearly 100% of its assured capacity, approximately 11,1194 GWh, to Eletropaulo under a long-term PPA, which expired in December 2015. Thecontract was price-adjusted annually for inflation, and as of December 31, 2015, the price was R$218/MWh. After the expiration of contract with Eletropaulo,Tietê's strategy is to contract most of its Assured Energy, as described in Regulatory Framework section below, in the free market and sell the remaining portion inthe spot market. Tietê's strategy is reassessed from time to time according to changes in market conditions, hydrology and other factors. Tietê has beencontinuously selling its available energy from 2016 forward through medium-term bilateral contracts (3-5 years).
As of December 31, 2015, Tietê's contracted portfolio position is 95% and 88% with average prices of R$149/MWh and R$150/MWh for 2016 and 2017,respectively. As Brazil is mostly a hydro-based country with energy prices highly tied to the hydrological situation, the deterioration of the hydrology since thebeginning of 2014 caused an increase in energy prices going forward. Tietê is closely monitoring and analyzing system supply conditions to support energycommercialization decisions. In 2015, 12 new contracts were signed at an average price of approximately R$154/MWh.Tietê's strategy is to contract most of itsphysical guarantee in the free market while the remaining portion provides flexibility to either protect against low hydrology or potentially capture higher spotprices in the future. As Brazil does not have a developed market with hedge and options instruments for the energy sector, Tietê does not assume any hedgingstrategy for its portfolio.
Under the concession agreement, Tietê has an obligation to increase its capacity by 15%. Tietê as well as other concessionaire generators have not yet metthis requirement due to regulatory, environmental, hydrological and fuel constraints. Sao Paulo state does not have a good potential for wind power and also only asmall remaining potential for hydro projects, directing the new increase in the state for thermal capacity. With the high complexity process to get an environmentallicense for coal projects, Tietê decided to fulfill obligation with gas-fired projects in line with Federal government plans. As Petrobras refuses to supply natural gasand to offer capacity in its pipelines and regasification terminals and there are no regulations for natural gas swaps in place, up to now, it is unfeasible to bringnatural gas to AES Tietê. A legal case has been initiated by the State of São Paulo requiring the investment to be performed. Tietê is in the process of analyzingoptions to meet the obligation.
Uruguaiana is a 640 MW gas-fired combined cycle power plant located in the town of Uruguaiana in the state of Rio Grande do Sul, commissioned inDecember 2000. AES manages and has a 46% economic interest in the plant with the remaining interest held by BNDES. The plant's operations were suspended inApril 2009 due to the unavailability of gas. AES has evaluated several alternatives to bring gas supply on a competitive basis to Uruguaiana. One of the challengesis the
28

capacity restrictions on the Argentinean pipeline, especially during the winter season when gas demand in Argentina is very high. The plant operated on a short-term basis in 2013 during February and March, in 2014 during March, April, and May, and in 2015 during February, Mach, April and May due to the short-termsupply of LNG for the facility. Uruguaiana continues to work toward securing gas on a long-term basis.
Market Structure — Brazil has installed capacity of 140,272 MW, which is 65% hydroelectric, 21.6% thermal and 13.4% renewable (biomass and wind).Brazil's national grid is divided into four subsystems. Tietê is in the Southeast subsystem of the national grid, while Uruguaiana is in the South.
Regulatory Framework — In Brazil, the MME determines the maximum amount of energy that a plant can sell, called Assured Energy, which represents thelong-term average expected energy production of the plant. Under current rules, a generation plant's Assured Energy can be sold to distribution companies throughlong-term (regulated) auctions or under unregulated bilateral contracts with large consumers or energy trading companies.
The ONS is responsible for coordinating and controlling the operation of the national grid. The ONS dispatches generators based on hydrological conditions,reservoir levels, electricity demand and the prices of fuel and thermal generation. Given the importance of hydro generation in the country, the ONS sometimesreduces dispatch of hydro facilities and increases dispatch of thermal facilities to protect reservoir levels in the system.
In Brazil, the system operator controls all hydroelectric generation dispatch and reservoir levels, and a mechanism known as MRE was created to sharehydrological risk across all hydro generators. If the hydro system generates less than total Assured Energy of the system, hydro generators may need to purchaseenergy in the short-term market to fulfill their contract obligations. When total hydro generation is higher than the total MRE Assured Energy, the surplus isproportionally shared among its participants and they are able to make extra revenue selling the excess energy on the spot market. The consequences of unfavorablehydrology are (i) thermal plants (more expensive to the system) being dispatched, (ii) lower hydropower generation with deficits in the MRE and (iii) high spotprices.
Due to lower than expected hydrology during 2014, from February to April the spot price was at the cap of R$822/MWh and the average spot price of 2014was R$689/MWh. During October and November 2014, the ANEEL conducted a public hearing to define a new spot price cap, changing it from R$822/MWh toR$388/MWh from January 2015 until December 2015. The lower cap price resulted in a meaningful reduction on the expenses of the agents that were negativelyexposed to the spot price in 2015. However, due to improved hydrology in the second half of 2015 spot prices were below the cap with the average price ofR$287/MWh. For 2016, ANEEL has already defined the new spot price cap, changing it from R$388/MWh to R$423/MWh from January 2016 forward.
Key Financial Drivers — As the system is highly dependent on hydroelectric generation, Tietê and Uruguaiana (more likely to generate during lowhydrology) are affected by the hydrology in the overall sector, as well as the availability of Tietê's plants and reliability of the Uruguaiana facility. The availabilityof gas for continued operations is a driver for Uruguaiana.
Through and beyond 2016, Tietê's financial results are likely to be driven by many factors including, but not limited to, the following:• Hydrology, impacting quantity of energy generated• Demand growth• Re-contracting price• Asset management and plant availability• Cost management• Ability to execute on its growth strategy
Through and beyond 2016, Uruguaiana's financial results are likely to be driven by many factors including, but not limited to, the following:• Arbitration settlement with YPF (see Item 3.— Legal Proceedings )• Secure long-term gas solution
Brazil Utility Businesses
Business Description — Eletropaulo distributes electricity to the greater São Paulo area, Brazil's main economic and financial center. Eletropaulo is thelargest electric power distributor in Latin America in terms of both revenues and volume of energy distribution.
AES owns 16% of the economic interest in Eletropaulo, our partner, BNDES, owns 19% and the remaining shares are publicly held or held by government-related entities. AES is the controlling shareholder and manages and consolidates this business. Eletropaulo holds a 30-year concession that expires in 2028.
29

AES owns 100% of Sul. Sul distributes electricity in the metropolitan region of Porto Alegre up to the frontier with Uruguay and Argentina, respectively, inthe municipalities of Santana do Livramento and Uruguaiana/São Borja at the extreme west of the state of Rio Grande do Sul. AES manages Sul under a 30-yearconcession expiring in 2027.
Regulatory Framework — In Brazil, ANEEL, a government agency, sets the tariff for each distribution company based on a Return on Asset Basemethodology, which also benchmarks operational costs against other distribution companies.
The tariff charged to regulated customers consists of two elements: (i) pass-through of non-manageable costs under a determined methodology ("Parcel A"),including energy purchase costs, sector charges and transmission and distribution system expenses; and (ii) a manageable cost component ("Parcel B"), includingoperation and maintenance costs (defined by ANEEL), recovery of investments and a component for a return to the distributor. The return to distributors iscalculated as the net asset base multiplied by the Regulatory WACC, which is set for all industry participants during each tariff reset cycle. The current RegulatoryWACC for Eletropaulo, after tax, is 8.1%. This WACC is effective for three years and as such will be updated again in the next tariff review for Sul in April 2018.
Each year ANEEL reviews each distributor's tariff for an annual tariff adjustment. The annual tariff adjustments allow for pass-through of Parcel A costs andinflation impacts on Parcel B costs, adjusted for expected efficiency gains and quality performances. Distribution companies are required to contract between 100%and 105% of anticipated energy needs through the regulated auction market. If contracted levels fall below required levels distribution companies may be subject tolimitations on the pass-through treatment of energy purchase costs as well as penalties. As the costs incurred on energy purchases by our distribution companies arepassed through to customers with adjustments on a yearly basis, working capital will be sensitive to significant increases in energy prices. In order to reducepotential working capital needs, in February 2015, ANEEL opened two public hearings (i) to discuss an Extraordinary Tariff Review ("ETR") requested bydistribution companies and ii) to discuss adjustments to a tariff flag mechanism that may change the tariff to customers on a monthly basis depending on energyprices. These items were approved by ANEEL and made effective on March 2, 2015. The ETR represented an average tariff increase of 32% in AES Eletropauloand 39% at AES Sul. The tariff flag mechanism, a temporary measure in response to higher energy prices due to dry hydrological conditions, was improved byincorporating i) a higher tariff increase depending on the energy purchase costs and (ii) resources collected by the tariff flag being centralized in an account andshared among distribution companies in proportion to their respective involuntary exposure. Most recently, ANEEL approved the Annual Readjustment for AESSul on April 14, 2015 representing an average tariff increase of 5.46%.
Every four to five years, ANEEL resets each distributor's tariff to incorporate the revised Regulatory WACC and determination of the distributor's net assetbase. Eletropaulo's tariff reset occurs every four years and the next tariff reset will be in July 2019. Sul's tariff is reset every five years and the next tariff reset isexpected in April 2018. The 4 th Tariff Reset for AES Eletropaulo occurred on July 4, 2015, representing an average tariff increase of 15.23%.
ANEEL challenged the parameters of a tariff reset for Eletropaulo implemented in July 2012 and retroactive to 2011. ANEEL asserted that during the periodbetween 2007 and 2011, certain assets that were included in the regulatory asset base should not have been included and that Eletropaulo should refund customersfor the return on the disputed assets earned during this period. On December 17, 2013, ANEEL determined, at the administrative level, that Eletropaulo shouldadjust the prior (2007-2011) regulatory asset base and refund customers in the amount of $269 million (R$630 million) over a period of up to four tariff processesbeginning in July 2014. Eletropaulo filed for an administrative appeal requesting ANEEL to reconsider its decision and requested that the decision be suspendeduntil the appeal process was completed. On January 28, 2014, ANEEL denied Eletropaulo's request to suspend the effects of the previous decision. On January 29,2014, Eletropaulo requested and received from the Federal Court of Brazil an injunction for the suspension of the effects of ANEEL's previous decision. AsANEEL had confirmed the original decision and the related refund to customers, the injunction no longer became effective. The Company recognized a regulatoryliability of approximately $269 million in the Company's 2013 fourth quarter results of operations since ANEEL had compelled the Company to refund customers.Eletropaulo started reimbursing customers in July 2014.
On December 18, 2014, the effects of the injunction were restored and on January 5, 2015, during a public hearing, ANEEL resolved to follow the legaldecision. However, on January 7, 2015 ANEEL requested the suspension of the injunction. While the final legal decision has yet not been taken, ANEEL released anew tariff for Eletropaulo on January 8, 2015, not considering the reimbursement to customers, which is immediately effective. On June 30, 2015, ANEELincluded in Eletropaulo's tariff reset the reimbursement of amounts previously refunded to customers from July 2014 through early January 2015. In addition toANEEL's failure thus far to suspend the injunction through the appeals process in the Brazilian courts, the tariff reset resulted in management's reassessment of theprobability of refunding customers these disputed amounts. The Company now considers it only reasonably possible that Eletropaulo will be required to refundthese amounts to customers prior to the ultimate resolution of the pending court case. As a result, during the second quarter of 2015, the Company reversed theremaining regulatory liability for this contingency of $161 million. Eletropaulo believes it has meritorious arguments on this matter and will continue to pursue itsobjections to ANEEL's rulings vigorously, however there can be no assurance that Eletropaulo will prevail.
30
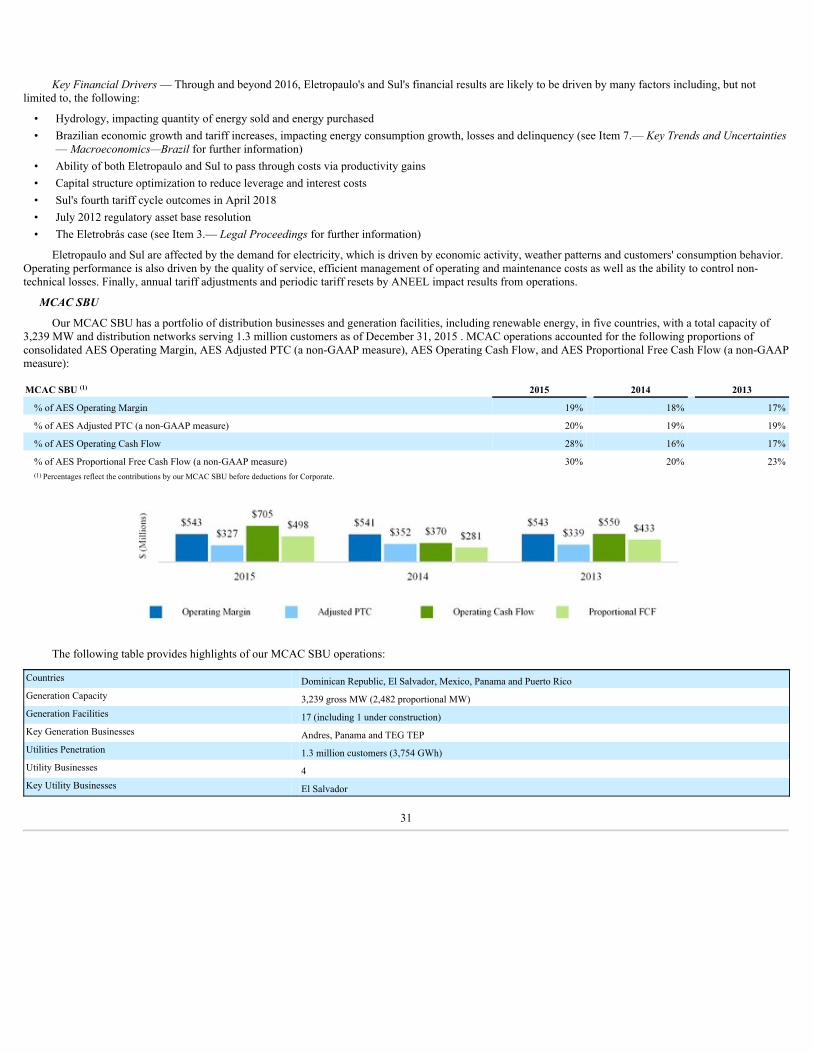
Key Financial Drivers — Through and beyond 2016, Eletropaulo's and Sul's financial results are likely to be driven by many factors including, but notlimited to, the following:
• Hydrology, impacting quantity of energy sold and energy purchased• Brazilian economic growth and tariff increases, impacting energy consumption growth, losses and delinquency (see Item 7.— Key Trends and Uncertainties
— Macroeconomics—Brazil for further information)• Ability of both Eletropaulo and Sul to pass through costs via productivity gains• Capital structure optimization to reduce leverage and interest costs• Sul's fourth tariff cycle outcomes in April 2018• July 2012 regulatory asset base resolution• The Eletrobrás case (see Item 3.— Legal Proceedings for further information)
Eletropaulo and Sul are affected by the demand for electricity, which is driven by economic activity, weather patterns and customers' consumption behavior.Operating performance is also driven by the quality of service, efficient management of operating and maintenance costs as well as the ability to control non-technical losses. Finally, annual tariff adjustments and periodic tariff resets by ANEEL impact results from operations.
MCAC SBU
Our MCAC SBU has a portfolio of distribution businesses and generation facilities, including renewable energy, in five countries, with a total capacity of3,239 MW and distribution networks serving 1.3 million customers as of December 31, 2015 . MCAC operations accounted for the following proportions ofconsolidated AES Operating Margin, AES Adjusted PTC (a non-GAAP measure), AES Operating Cash Flow, and AES Proportional Free Cash Flow (a non-GAAPmeasure):
MCAC SBU (1) 2015 2014 2013
% of AES Operating Margin 19% 18% 17%
% of AES Adjusted PTC (a non-GAAP measure) 20% 19% 19%
% of AES Operating Cash Flow 28% 16% 17%
% of AES Proportional Free Cash Flow (a non-GAAP measure) 30% 20% 23%(1) Percentages reflect the contributions by our MCAC SBU before deductions for Corporate.
The following table provides highlights of our MCAC SBU operations:
Countries Dominican Republic, El Salvador, Mexico, Panama and Puerto RicoGeneration Capacity 3,239 gross MW (2,482 proportional MW)Generation Facilities 17 (including 1 under construction)Key Generation Businesses Andres, Panama and TEG TEPUtilities Penetration 1.3 million customers (3,754 GWh)Utility Businesses 4Key Utility Businesses El Salvador
31
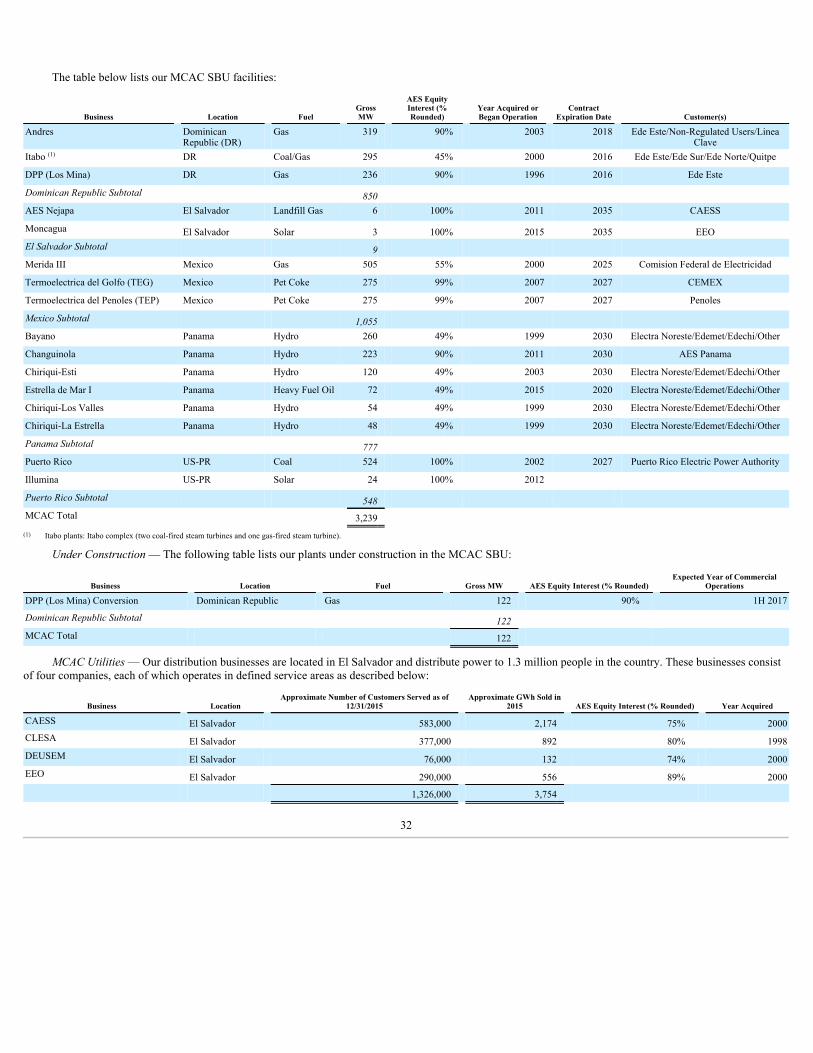
The table below lists our MCAC SBU facilities:
Business Location Fuel GrossMW
AES EquityInterest (%Rounded) Year Acquired or
Began Operation ContractExpiration Date Customer(s)
Andres
DominicanRepublic (DR)
Gas
319
90%
2003
2018
Ede Este/Non-Regulated Users/LineaClave
Itabo (1) DR Coal/Gas 295 45% 2000 2016 Ede Este/Ede Sur/Ede Norte/Quitpe
DPP (Los Mina) DR Gas 236 90% 1996 2016 Ede Este
Dominican Republic Subtotal 850 AES Nejapa El Salvador Landfill Gas 6 100% 2011 2035 CAESS
Moncagua El Salvador Solar 3 100% 2015 2035 EEOEl Salvador Subtotal 9 Merida III Mexico Gas 505 55% 2000 2025 Comision Federal de Electricidad
Termoelectrica del Golfo (TEG) Mexico Pet Coke 275 99% 2007 2027 CEMEX
Termoelectrica del Penoles (TEP) Mexico Pet Coke 275 99% 2007 2027 Penoles
Mexico Subtotal 1,055 Bayano Panama Hydro 260 49% 1999 2030 Electra Noreste/Edemet/Edechi/Other
Changuinola Panama Hydro 223 90% 2011 2030 AES Panama
Chiriqui-Esti Panama Hydro 120 49% 2003 2030 Electra Noreste/Edemet/Edechi/Other
Estrella de Mar I Panama Heavy Fuel Oil 72 49% 2015 2020 Electra Noreste/Edemet/Edechi/Other
Chiriqui-Los Valles Panama Hydro 54 49% 1999 2030 Electra Noreste/Edemet/Edechi/Other
Chiriqui-La Estrella Panama Hydro 48 49% 1999 2030 Electra Noreste/Edemet/Edechi/Other
Panama Subtotal 777 Puerto Rico US-PR Coal 524 100% 2002 2027 Puerto Rico Electric Power Authority
Illumina US-PR Solar 24 100% 2012 Puerto Rico Subtotal 548 MCAC Total 3,239
(1) Itabo plants: Itabo complex (two coal-fired steam turbines and one gas-fired steam turbine).
Under Construction — The following table lists our plants under construction in the MCAC SBU:
Business Location Fuel Gross MW AES Equity Interest (% Rounded) Expected Year of CommercialOperations
DPP (Los Mina) Conversion Dominican Republic Gas 122 90% 1H 2017
Dominican Republic Subtotal 122 MCAC Total 122
MCAC Utilities — Our distribution businesses are located in El Salvador and distribute power to 1.3 million people in the country. These businesses consistof four companies, each of which operates in defined service areas as described below:
Business Location Approximate Number of Customers Served as of12/31/2015 Approximate GWh Sold in
2015 AES Equity Interest (% Rounded) Year Acquired
CAESS El Salvador 583,000 2,174 75% 2000CLESA El Salvador 377,000 892 80% 1998DEUSEM El Salvador 76,000 132 74% 2000EEO El Salvador 290,000 556 89% 2000 1,326,000 3,754
32
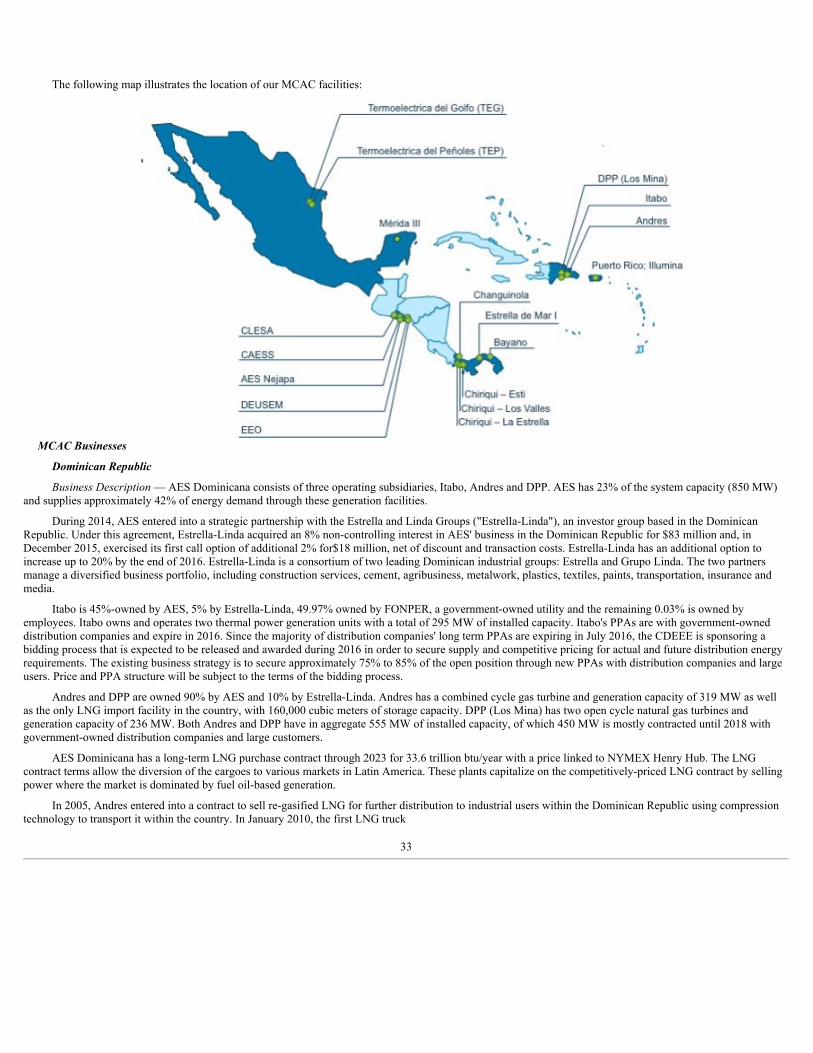
The following map illustrates the location of our MCAC facilities:
MCAC Businesses
Dominican Republic
Business Description — AES Dominicana consists of three operating subsidiaries, Itabo, Andres and DPP. AES has 23% of the system capacity (850 MW)and supplies approximately 42% of energy demand through these generation facilities.
During 2014, AES entered into a strategic partnership with the Estrella and Linda Groups ("Estrella-Linda"), an investor group based in the DominicanRepublic. Under this agreement, Estrella-Linda acquired an 8% non-controlling interest in AES' business in the Dominican Republic for $83 million and, inDecember 2015, exercised its first call option of additional 2% for$18 million, net of discount and transaction costs. Estrella-Linda has an additional option toincrease up to 20% by the end of 2016. Estrella-Linda is a consortium of two leading Dominican industrial groups: Estrella and Grupo Linda. The two partnersmanage a diversified business portfolio, including construction services, cement, agribusiness, metalwork, plastics, textiles, paints, transportation, insurance andmedia.
Itabo is 45%-owned by AES, 5% by Estrella-Linda, 49.97% owned by FONPER, a government-owned utility and the remaining 0.03% is owned byemployees. Itabo owns and operates two thermal power generation units with a total of 295 MW of installed capacity. Itabo's PPAs are with government-owneddistribution companies and expire in 2016. Since the majority of distribution companies' long term PPAs are expiring in July 2016, the CDEEE is sponsoring abidding process that is expected to be released and awarded during 2016 in order to secure supply and competitive pricing for actual and future distribution energyrequirements. The existing business strategy is to secure approximately 75% to 85% of the open position through new PPAs with distribution companies and largeusers. Price and PPA structure will be subject to the terms of the bidding process.
Andres and DPP are owned 90% by AES and 10% by Estrella-Linda. Andres has a combined cycle gas turbine and generation capacity of 319 MW as wellas the only LNG import facility in the country, with 160,000 cubic meters of storage capacity. DPP (Los Mina) has two open cycle natural gas turbines andgeneration capacity of 236 MW. Both Andres and DPP have in aggregate 555 MW of installed capacity, of which 450 MW is mostly contracted until 2018 withgovernment-owned distribution companies and large customers.
AES Dominicana has a long-term LNG purchase contract through 2023 for 33.6 trillion btu/year with a price linked to NYMEX Henry Hub. The LNGcontract terms allow the diversion of the cargoes to various markets in Latin America. These plants capitalize on the competitively-priced LNG contract by sellingpower where the market is dominated by fuel oil-based generation.
In 2005, Andres entered into a contract to sell re-gasified LNG for further distribution to industrial users within the Dominican Republic using compressiontechnology to transport it within the country. In January 2010, the first LNG truck
33
tanker loading terminal started operations. With this investment, AES is capturing demand from industrial and commercial customers.
Market Structure
Electricity Market — The Dominican Republic has one main interconnected system with approximately 3,742 MW of installed capacity, composed primarilyof thermal generation (82%), hydroelectric power plants (16%) and wind plants (2%).
Natural Gas Market — The natural gas market in the Dominican Republic started developing in 2001 when AES entered into a long-term contract for LNGand constructed AES Dominicana's LNG regasification terminal.
Regulatory Framework — The regulatory framework in the Dominican Republic consists of a decentralized industry including generation, transmission anddistribution, where generation companies can earn revenue through short- and long-term PPAs, ancillary services and a competitive wholesale generation market.All electric companies (generators, transmission and distributors), are subject to and regulated by the GEL.
Two main agencies are responsible for monitoring and ensuring compliance with the GEL, the CNE and the SIE. CNE is in charge of drafting andcoordinating the legal framework and regulatory legislation, proposing and adopting policies and procedures to assure best practices, drafting plans to ensure theproper functioning and development of the energy sector and promoting investment. SIE's main responsibilities include monitoring and supervising compliancewith legal provisions and rules, monitoring compliance with the technical procedures governing generation, transmission, distribution and commercialization ofelectricity and supervising electric market behavior in order to avoid monopolistic practices.
The electricity tariff applicable to regulated customers is subject to regulation within the concessions of the distribution companies. Clients with demandabove 1.0 MW are classified as unregulated customers and their tariffs are unregulated.
Fuels and hydrocarbons are regulated by a specific law which establishes prices to end customers and a tax on consumption of fossil fuels. For natural gasthere are regulations related to the procedures to be followed to grant licenses and concessions: i) distribution, including loading, transportation and compressionplants; ii) the installation and operation of natural gas stations, including consumers and potential modifications of existing facilities; and iii) conversion equipmentsuppliers for vehicles. The regulation is administered by the ICM who supervises commercial and industrial activities in the Dominican Republic as well as thefuels and natural gas commercialization to the end users.
Key Financial Drivers — Financial results are likely to be driven by many factors including, but not limited to, the following:• Spot prices are mainly driven by the fluctuations in commodity prices due to the dependency of the Dominican Republic on oil-based thermal generation.
Since the fuel component is a pass-through cost under the PPAs, any variation in the oil prices will mainly impact the spot sales for both Andres and Itabo,which are expected to be net sellers in the upcoming years. Current contracting level for 2016 is close to 90%. Supply shortages in the near term (next 2 to 3years) may provide opportunities for upside but new generation is expected to come online from 2018.
• Additional sales derived from natural gas domestic demand are expected to continue providing an income stream and growth based on the entry of futureprojects and the fees from the infrastructure service.
In addition, the financial weakness of the three state-owned distribution companies due to low collection rates and high levels of non-technical losses has ledto delays in payments for the electricity supplied by generators. At times when outstanding receivable balances have accumulated, AES Dominicana has acceptedpayment through other means, such as government bonds, in order to reduce the balance. There can be no guarantee that alternative collection methodologies willalways be an avenue available for payment options.
Construction and Development — DPP is converting its existing plant from open cycle to combined cycle. The project will recycle DPP's heat emissions andincrease total power output by approximately 114 MW of gross capacity at an estimated cost of $260 million, fully financed with non-recourse debt. The EPCcontract was signed on July 2, 2014, and the additional capacity is expected to become operational in in the first half of 2017. Based on the increased capacity, AESDominicana executed a PPA for 270 MW for a 6.5 years term beginning on August 1, 2016.
Panama
Business Description — AES owns and operates five hydroelectric plants and one thermoelectric power plant, Estrella del Mar I, which commencedoperations in March 2015, representing 705 MW and 72 MW of hydro and thermal capacity respectively, for a total of 777 MW equivalent to 25% of the installedcapacity in Panama. The majority of hydro sources in Panama are based on run-of-river technology, with the exception of the 260 MW Bayano plant.
A portion of the PPAs with distribution companies will expire on December 2018 reducing the total contracted capacity of the company from 496 MW to430 MW. Another portion contracted through Estrella del Mar I will expire on June 2020, reducing the total contracted capacity to 350 MW until December 2030.
34

Market Structure — Panama's current total installed capacity is 3,068 MW, of which 56% is hydroelectric, 3% wind and the remaining 41% thermalgeneration from diesel, bunker fuel and coal.
The Panamanian power sector is composed of three distinct operating business units: generation, distribution and transmission, all of which are governed byElectric Law 6 enacted in 1997.
Generators can enter into long-term PPAs with distributors or unregulated consumers. In addition, generators can enter into alternative supply contracts witheach other. Outside of the PPA market, generators may buy and sell energy in the short-term market.
The CND implements the economic dispatch of electricity in the wholesale market. The CND's objectives are to minimize the total cost of generation andmaintain the reliability and security of the electric power system, taking into account the price of water, which determines the dispatch of hydro plants withreservoirs. Short-term power prices are determined on an hourly basis by the last dispatched generating unit.
In Panama, dry hydrological conditions remained during 2015 affecting the generation output from hydroelectric facilities as in the prior year. AES Panamahad to purchase energy on the spot market to fulfill its contract obligations as its generation output was below contract levels. The drop in the commodities priceshelped to reduce the replacement cost and the financial impact of spot purchases compared to the prior year. Despite the hydrology conditions, spot prices weredown to $90/MWh from $217/MWh in 2014, impacting also the amount recognized through the 2014-2016 Government Compensation Agreement to only $5.8million out of the $30 million for 2015. On March 31, 2014, the government of Panama agreed to reduce the financial impact of spot electricity purchases andtransmission constraints equivalent to a 70 MW reduction in contracted capacity for the period 2014-2016 by compensating AES Panama for spot purchases up to$40 million in 2014, $30 million in 2015 and $30 million in 2016.
Regulatory Framework — The SNE has the responsibilities of planning, supervising and controlling policies of the energy sector within Panama. With theseresponsibilities, the SNE proposes laws and regulations to the executive agencies that promote the procurement of electrical energy, hydrocarbons and alternativeenergy for the country.
The regulator of public services, known as the ASEP, is an autonomous agency of the government. ASEP is responsible for the control and oversight ofpublic services including electricity and the transmission and distribution of natural gas utilities and the companies that provide such services.
Generators can only contract their firm capacity. Physical generation of energy is determined by the CND regardless of contractual arrangements.
Key Financial Drivers — Financial results are likely to be driven by many factors including, but not limited to, the following:• Lower hydrology resulting in low generation and additional energy purchases to fulfill contracts, partially mitigated by additional generation from Estrella
del Mar I, lower spot prices driven by the drop in commodities, and the compensation amount from the Government Compensation Agreement.• In addition to spot prices being driven by hydrology since Panama is highly dependent on hydro generation (~56%), the fluctuations in commodity prices,
mainly oil prices, affect the thermal generation cost impacting the spot prices and the opportunity cost of water. In the event of low hydrology, highcommodity prices will increase the business exposure and the cost of replacement power to back up our contractual commitment.
• Constraints imposed by the capacity of the transmission line connecting the west side of the country with the load center are expected to continue until theend of 2016 keeping surplus power trapped, particularly during the wet season.
• Country demand as GDP growth is expected to remain strong over the short and medium term.
Given that most of AES' portfolio is run-of-river, hydrological conditions have an important influence on its profitability. Variations in actual hydrology canresult in excess or a short energy balance relative to our contract obligations. During the low inflow period (January to May), generation tends to be lower and AESPanama may purchase energy in the short-term market to cover contractual obligations. During the remainder of the year (June to December), generation tends tobe higher and energy generated in excess of contract volumes is sold to the short-term market. In addition to hydrological conditions, commodity prices affectshort-term electricity prices. See Item 7.— Key Trends and Uncertainties — Operational — Sensitivity to Dry Hydrological Conditions for further information.
Construction and Development — Continuing with the strategy to reduce reliance on hydrology started with the acquisition of the power barge, Estrella delMar I, in August 2015 AES executed a partnership agreement with Deeplight Corporation, a minority partner, with the purpose to construct, operate and maintain anatural gas power generation plant and a liquefied natural gas terminal, in order to purchase and sell energy and capacity as well as commercialize natural gas andother ancillary activities related to natural gas. As of December 31, 2015, amounts capitalized include $7 million recorded in Construction in Progress and theproject is scheduled to initiate operations in the first half of 2018.
35
Mexico
Business Description — AES has 1,055 MW of installed capacity in Mexico, including the 550 MW Termoeléctrica del Golfo ("TEG") and TermoeléctricaPeñoles ("TEP") facilities and Merida III ("Merida"), a 505 MW generation facility.
The TEG and TEP pet coke-fired plants, located in San Luis Potosi, supply power to their offtakers under long-term PPAs expiring in 2027 with a 90%availability guarantee. TEG and TEP secure their fuel under a long-term contract.
Merida is a CCGT, located in Merida, on Mexico's Yucatan Peninsula. Merida sells power to the CFE under a capacity and energy based long-term PPAthrough 2025. Additionally, the plant purchases natural gas and diesel fuel under a long-term contract, the cost of which is then passed through to CFE under theterms of the PPA.
In line with AES' strategy of building strategic partnerships, on January 18, 2016 the 50/50 Joint Venture partnership agreement with Grupo BAL was fullyexecuted. The Joint Venture will co-invest in power and related infrastructure projects in Mexico.
Market Structure — Mexico has a single national electricity grid, the SEN, covering nearly all of Mexico's territory. Mexico has an installed capacity totaling65 GW with a generation mix of 74% thermal, 19% hydroelectric and 7% other. Electricity consumption is split between the following end users: industrial (58%),residential (26%) and commercial and service (16%).
Regulatory Framework — Following the constitutional changes approved in December 2013, during 2014 and 2015 the Mexican government issued apackage of secondary regulations, including the Electricity Law, and operational dispositions, with the objective to start the implementation of a new regulatoryframework which foresees:
• The energy market liberalization in January 2016 through the implementation of: wholesale electricity market (day ahead and real time market), ancillaryservices, capacity, Clean Energy Certificates, and Financial Transmission Rights market.
• CFE's, former state-owned electric monopoly, vertical and horizontal disintegration into different segments of the value chain: generation, transmission,distribution and commercialization.
• CENACE as new ISO is responsible for managing the wholesale electricity market, transmission and distribution infrastructure, planning the networkdevelopments, guaranteeing open access to network infrastructure, executing competitive mechanisms to cover regulated demand, and setting transmissioncharges.
• Implementation of annual mid and long term auctions to secure supply for the regulated demand, establishing a PPA with CFE as the Basic Supplier.
According to the new regulatory framework, new assets developed under the new framework or assets transferred to the new regime and in operation afterthe approval of the Electricity Law (August 2014) are eligible to participate in the new markets. Additionally, projects developed and operated under the ElectricPublic Service Law (self-supply framework) like TEG TEP, could choose to participate. Until the new framework is further analyzed, AES will continue operatingunder the same conditions. Merida III and TEG/TEP will continue providing power under long-term contracts and selling any excess or surplus energy produced toCFE.
Key Financial Drivers — Operational performance is the key business driver as the companies are fully contracted and better performance providesadditional financial benefits including performance incentives and/or excess energy sales (in the case of TEG/TEP). The energy prices of TEG/TEP for the sales inexcess over its long-term contracts are driven by the average production cost of CFE which is highly dependent on natural gas and oil. If the average productioncost of CFE is higher than the cost of generating with pet coke, our businesses in Mexico will benefit provided that they are able to sell energy in excess of theirPPAs.
Other MCAC Businesses
Puerto Rico
Business Description — AES Puerto Rico owns and operates a coal-fired cogeneration plant and a recently acquired solar plant of 524 MW and 24 MW,respectively, representing approximately 9% of the installed capacity in Puerto Rico. Both plants have long-term PPAs expiring in 2027 and 2032, respectively,with PREPA, a state-owned entity that supplies virtually all of the electric power consumed in Puerto Rico and generates, transmits and distributes electricity to1.4 million customers. On April 29, 2015, AES completed the acquisition of 100% of the common stock of the solar plant, AES Illumina. Its results of operationshave been included in AES' consolidated results of operations from the date of acquisition. See Item 7.— Key Trends and Uncertainties—Macroeconomic andPolitical—Puerto Rico for further discussion of the long-term PPA with PREPA. In addition, AES Puerto Rico has ongoing litigation regarding the disposal of ashin the Dominican Republic. See Item 3.— Legal Proceedings.
36

El Salvador
Business Description — AES is the majority owner of four of the five distribution companies operating in El Salvador. The distribution companies areoperated by AES on an integrated basis under a single management team. AES El Salvador's territory covers 77% of the country. AES El Salvador accounted for3,730 GWh of market energy purchases during 2015, or about 64% market share of the country's total energy purchases.
AES El Salvador also owns AES Nejapa, a 6 MW power plant generating electricity with methane gas from a landfill, fully contracted with CAESS. During2015, AES El Salvador began operations of a AES Moncagua, a 2.5 MW solar facility located in the east of the country, which is fully contracted with EEO.
The sector is governed by the General Electricity Law and the general and specific orders are issued by Superintendencia General de Electricidad yTelecomunicacions ("SIGET" or "The Regulator"). The Regulator, jointly with the distribution companies in El Salvador, completed the tariff reset process inDecember 2012 and defined the tariff calculation to be applicable for the next five years (2013-2017).
Europe SBU
Our Europe SBU has generation facilities in five countries. Our European operations accounted for the following proportions of consolidated AES OperatingMargin, AES Adjusted PTC (a non-GAAP measure), AES Operating Cash Flow, and AES Proportional Free Cash Flow (a non-GAAP measure):
Europe SBU (1) 2015 2014 2013
% of AES Operating Margin 11% 13% 13%
% of AES Adjusted PTC (a non-GAAP measure) 15% 19% 19%
% of AES Operating Cash Flow 14% 13% 15%
% of AES Proportional Free Cash Flow (a non-GAAP measure) 15% 14% 18%(1) Percentages reflect the contributions by our Europe SBU before deductions for Corporate.
The following table provides highlights of our Europe operations:
Countries Bulgaria, Jordan, Kazakhstan, Netherlands and United KingdomGeneration Capacity 6,781gross MW (5,009 proportional MW)Generation Facilities 12Key Generation Businesses Maritza, Kilroot, Ballylumford, and Kazakhstan
37

Operating installed capacity of our Europe SBU totaled 6,781 MW. Presented in the table below is a list of our Europe SBU generation facilities:
Business Location Fuel GrossMW
AES EquityInterest (%Rounded) Year Acquired or
Began Operation ContractExpiration Date Customer(s)
Maritza Bulgaria Coal 690 100% 2011 2026 Natsionalna Elektricheska
St. Nikola Bulgaria Wind 156 89% 2010 2025 Natsionalna Elektricheska
Bulgaria Subtotal 846 Amman East Jordan Gas 380 37% 2009 2033-2034 National Electric Power Company
IPP4
Jordan
Heavy FuelOil/Gas
247
60%
2014
2039
National Electric Power Company
Jordan Subtotal 627 Ust-Kamenogorsk CHP Kazakhstan Coal 1,372 100% 1997 Short-term Various
Shulbinsk HPP (1) Kazakhstan Hydro 702 —% 1997 Short-term VariousUst-Kamenogorsk HPP (1) Kazakhstan Hydro 331 —% 1997 Short-term Various
Sogrinsk CHP Kazakhstan Coal 345 100% 1997 Short-term VariousKazakhstan Subtotal 2,750 Elsta (2)
Netherlands
Gas
630
50%
1998
2018
Dow Benelux/Delta/Nutsbedrijven/ Essent
EnergyNetherlands ES Netherlands Energy Storage 10 100% 2015 Netherlands Subtotal 640 Ballylumford United Kingdom Gas 1,246 100% 2010 2023 Power NI/Single Electricity Market (SEM)
Kilroot (3) United Kingdom Coal/Oil 662 99% 1992 SEM
Kilroot ES United Kingdom Energy Storage 10 100% 2015 United Kingdom Subtotal 1,918 Europe Total 6,781
(1) AES operates these facilities under concession agreements until 2017.(2) Unconsolidated entity, the results of operations of which are reflected in Equity in Earnings of Affiliates.(3) Includes Kilroot Open Cycle Gas Turbine ("OCGT").
The following map illustrates the location of our European facilities:
Europe Businesses
Bulgaria
Business Description — Our Maritza plant is a 690 MW lignite fuel plant that was commissioned in June 2011. Maritza is fully compliant with the EUIndustrial Emission Directive, which came into force in January 2016. Maritza's entire power output is contracted with NEK under a 15-year PPA expiring in 2026,capacity and energy based, with a fuel pass-though. The lignite and limestone are supplied under a 15-year fuel supply contract.
38

AES also owns an 89% economic interest in the St. Nikola wind farm with 156 MW of installed capacity. St. Nikola was commissioned in March 2010. Itsentire power output is contracted with NEK under a 15-year PPA expiring in March 2025.
Market Structure — The maximum market capacity in 201 5 was approximately 13.6 GW. Thermal generation, which is mostly coal-fired, and nuclearpower plants account for 64% of the installed capacity.
Regulatory Framework — The electricity sector in Bulgaria operates under the Energy Act of 2004 that allows the sale of electricity to take place freely atnegotiated prices, at regulated prices between parties or on the organized market. In 2015 the government of Bulgaria has made advances toward marketliberalization and has engaged with the World Bank to develop a model for a fully liberalized electricity market in Bulgaria. The final report with recommendationsfrom the World Bank is expected in May 2016. The Independent Bulgarian Energy Exchange started commercial operation of the power exchange on January 19,2016 after successful test sessions were held in December 2015.
Our investments in Bulgaria rely on long-term PPAs with NEK, the state-owned electricity public supplier and energy trading company. NEK is facing someliquidity issues and has been delayed in making payments under the PPAs with Maritza and St. Nikola. In May and June 2014, SEWRC issued decisionsprecluding the ability of NEK to pass-through to the regulated market certain costs incurred by NEK pursuant to the PPA with Maritza, which impacted NEK'sliquidity and its ability to make payments under the PPA. SEWRC also instructed NEK and Maritza to begin negotiating amendments to the PPA. Maritza hasengaged in negotiations with NEK and other Bulgarian state bodies concerning these matters. In August 2015, the ninth amendment of Maritza's PPA was executedunder which Maritza and NEK would reduce the capacity payment to Maritza under the PPA by 14% through the PPA Term, without impacting the energy pricecomponent. In exchange, NEK would pay Maritza its overdue receivables. The amendment will become effective upon full payment of the overdue receivables byNEK, which is expected in 2016. In 2014 SEWRC announced that it has asked the DG Comp to review NEK's respective PPAs with Maritza and a separategenerator pursuant to European state aid rules, and to suspend the PPAs pending the completion of that review. DG Comp has not contacted Maritza about theSEWRC's request to date.
In March 2015, changes to the Energy Act were enacted. Changes included a limitation on electricity purchases from co-generators at preferential prices, theallocation of the proceeds from the sale of state CO 2 allowances to NEK, and an increase in the Regulator's independence through appointment of its members bythe Parliament rather than by the Council of Ministers. In July 2015, additional measures were voted by the Parliament to complement the first measures taken inMarch 2015. An Electricity Security Fund was created to help NEK meet its obligations with energy producers, financed with a 5% contribution from all energyproducers on their energy revenues as well as with proceeds from the sale of state CO 2 allowances. Maritza is able to pass-through this additional contribution toNEK since it falls under a change in law provision under the PPA. Following the Energy Act amendments on July 31, 2015 the regulator approved new regulatedprices that led to 0.11% decrease for household electricity prices and increased the non-household prices between 0% and 20% for the various segments. OnNovember 1, 2015 the regulator decreased the non-household prices 2.5% on average as result of the falling gas prices. All these actions are expected to improveNEK's liquidity. At this time, it is difficult to predict the impact of the political conditions and regulatory changes on our businesses in Bulgaria.
Maritza has experienced ongoing delays in the collection of outstanding receivables from NEK. As of December 31, 2015 , Maritza had an outstandingreceivables balance of $351 million including $44 million of current receivables, $82 million of receivables overdue by less than 90 days and $225 million ofreceivables overdue by more than 90 days. See Key Trends and Uncertainties — Macroeconomics and Political — Bulgaria in Item 7.— Management'sDiscussion and Analysis to this Form 10-K for further information.
NEK has failed to maintain a minimum rating pursuant to the Government Support Letter issued in 2005. As a result, the PPA could be terminated at thediscretion of Maritza and the lenders. See Item 1A.— Risk Factors — We may not be able to enter into long-term contracts, which reduce volatility in our resultsof operations . As a result of any of the foregoing events, we may face a loss of earnings and/or cash flows from the affected businesses (or be unable to exerciseremedies for a breach of the PPA) and may have to provide loans or equity to support affected businesses or projects, restructure them, write down their valueand/or face the possibility that these projects cannot continue operations or provide returns consistent with our expectations, any of which could have a materialimpact on the Company.
Key Financial Drivers — Both businesses, Maritza and St. Nikola, operate under PPA contracts. For the duration of the PPA, the financial results areprimarily driven by, but not limited to: the availability of the operating units; the level of wind resource for St. Nikola; and NEK's ability to meet the terms of thePPA contract.
United Kingdom
Business Description — AES' generation businesses in the United Kingdom operate in the Irish Single Electricity Market (SEM) for the businesses located inNorthern Ireland (1,918 MW). During 2015, AES sold its interests in wind development pipelines of 115 MW in Scotland.
39

The Northern Ireland generation facilities consist of two plants within the Greater Belfast region. Our Kilroot plant is a 662 MW coal-fired plant with 10MW of energy storage facility and our Ballylumford plant is a 1,246 MW gas-fired plant. These plants provide approximately 70% of the Northern Ireland installedcapacity and 18% of the combined installed capacity for the island of Ireland.
Kilroot is a merchant plant that bids into the SEM market. Kilroot derives its value from the variable margin when scheduled in merit and the margin fromconstrained dispatch (when dispatched out of merit to support the system in relation to the wind generation, voltage and transmission constraints) and capacitypayments paid through the SEM Capacity Payment Mechanism. In addition to the above, value is also secured from ancillary services.
Ballylumford is partially contracted for 600 MW under a PPA with PPB that expires in 2018, with an extension at the offtaker's option through 2023, withthe remaining capacity bid into the SEM market. Ballylumford's key sources of revenue are availability payments received under the PPA and capacity paymentsoffered through the SEM Capacity Payment Mechanism. Additionally, Ballylumford receives revenue from constrained dispatch through which the costs ofoperation are recovered from the market and also from the ancillary services market.
Market Structure — The majority of the generation capacity in the SEM is represented by gas-fired power plants, which results in market sensitivity to gasprices. Wind generation capacity represents approximately 18% of the total generation capacity. The governments of Northern Ireland and the Republic of Irelandplan further increases in renewables. Market availability and liquidity of hedging products are weak, reflecting the limited size and immaturity of the market, thepredominance of vertical integration and lack of forward pricing. There are essentially three products (baseload, mid-merit and peaking) which are traded betweenthe generators and suppliers.
Regulatory Framework — Electricity Regulation — The SEM is an energy market established in 2007 and is based on a gross mandatory pool within whichall generators with a capacity higher than 10 MW must trade the physical delivery of power. Generators are centrally dispatched based on merit order and physicalconstraints of the system.
In addition, there is a capacity payment mechanism to ensure that sufficient generating capacity is offered to the market. The capacity payment is derivedfrom a regulated Euro-based capacity payment pool, established a year ahead by the regulatory authority. Capacity payments are based on the declared availabilityof a unit and have a degree of volatility to reflect seasonal influences, demand and the actual out-turn of generation declared available over each trading period.
Environmental Regulation — The European Commission adopted in 2011 the Industrial Emissions Directive ("IED") that establishes the Emission LimitValues ("ELV") for SO 2 , NO x and dust emissions to be complied with starting from January 1, 2016. Both Ballylumford and Kilroot are required to comply withthe IED. The Ballylumford C Station is compliant without the need for investment. Both Ballylumford B Station and Kilroot required investment to be incompliance.
The IED provides for two options that may be implemented by the EU member states other than compliance with the new ELV's- the Transitional NationalPlan ("TNP") or Limited Life Time Derogation ("LLTD").
Kilroot has opted into the TNP and this allows the plant to operate between 2016-2020, being exempt from compliance with ELVs, but observing a ceilingset for maximum annual emissions that is based on the last 10 years average emissions and operating hours. Kilroot has invested approximately $10 million inUmbrella Selective Non Catalytic Reduction ("USNCR") technology, which reduces the plant's NO x emissions enabling the plant to increase its capacity factorwithin the ceiling of NO x emissions and earn energy margin. Further technical modifications are being evaluated which could make the plant fully compliant withIED from 2020.
Without investment, the Ballylumford B station of 540 MW would not meet the standards of the IED following 2015. In 2014, AES competed to secure aLocal Reserve Services Agreement ("LRSA") with the Transmission System Operator ("TSO") to refurbish two of the three units to be compliant with ELVs underIED, providing at least 250 MW of capacity from 2016 to 2018 with an option to extend to 2020 by the TSO. These units will also qualify for capacity paymentsunder the SEM.
Key Financial Drivers — For our businesses in the SEM market, the financial results will be driven by, but not limited to, the following, and may change in2017 due to regulatory changes to the market structure and payment mechanism:
• Availability of the operating units• Commodity prices (gas, coal and CO 2 ) and sufficient market liquidity to hedge prices in the short-term• Electricity demand in the SEM
Kazakhstan
Business Description — Our businesses account for approximately 6% of the total annual generation in Kazakhstan. Of the total capacity of 2,750 MW,1,033 MW is hydroelectric and operates under a concession agreement until the beginning of October 2017 and 1,717 MW of coal-fired capacity is owned outright.The thermal plants are designed to produce heat with electricity as a co- or by-product.
40
The Kazakhstan businesses act as merchant plants for electricity sales by entering into bilateral contracts directly with consumers for periods of generally nomore than one year. There are no opportunities for the plants to be in contracted status, as there is no central offtaker, and the few businesses that could take awhole plant's generation tend to have in-house generation capacity. The 2015 amendments to the Electricity Law state that a centrally organized capacity marketwill be established by 2019, but the capacity offtaker still only signs annual contracts.
The hydroelectric plants are run-of-river and rely on river flow and precipitation, particularly snow. Due to the presence of a large multi-year storage damupstream and a growing season minimum river flow rate agreement with Russia downstream, the plants are protected against significant downside risk to theirvolume in years with low precipitation. AES does not control water flow which impacts our generation.
Ust Kamenogorsk CHP provides heat to the city of Ust Kamenogorsk through the city heat network company (Ust Kamenogorsk Heat Nets). UstKamenogorsk CHP is their only source of supply.
Market Structure — The Kazakhstan electricity market totals approximately 20,657 MW, of which 17,421 MW is available. The bulk of the generatingcapacity in Kazakhstan is thermal with coal as the main fuel. As coal is abundantly available in Kazakhstan, most plants are designed to burn local coal. Thegeographical remoteness of Kazakhstan, in combination with its abundant resources, results in coal prices that are not reflective of world coal prices, currentdelivered cost is less than $18 per metric ton. In addition, the government closely monitors coal prices, due to their impact on the price of socially necessaryheating and on electricity tariffs.
Regulatory Framework — All Kazakhstan generating companies sell electricity at or below their respective tariff-cap level. These tariff-cap levels have beenfixed by the Kazakhstan government for the period 2009-2018 for each of the fifteen groups of generators. These groups were determined by the Ministry ofEnergy, previously Ministry of Industry and New Technologies, based on a number of factors including plant type and fuel used.
In July 2012, Kazakhstan enacted various amendments to its Electricity Law. Among the amendments was a requirement to reinvest all profits generated byelectricity producers during the years 2013-2015. Accordingly, the business will be unable to pay dividends for the period 2013-2015. Under the amendedElectricity Law, electricity producers must, on an annual basis, enter into Investment Obligation Agreements ("IOAs") with the Ministry of Energy. These annualIOAs must equal the sum of the upcoming year's planned depreciation and profit. Selection of investment projects for the IOAs is at the discretion of electricityproducers, but the Ministry of Energy has the right to reject submitted IOA proposals. An electricity producer without an IOA executed by the Ministry of Energymay not charge tariffs exceeding its incremental cost of production, excluding depreciation. In December 2014, the Ministry of Energy executed IOAs with all fourAES generators in Kazakhstan, which allow revenue at the tariff-cap level, but all generated cash will need to be reinvested.
In November 2015, Kazakhstan enacted amendments to its Electricity Law to extend price cap regulation till the end of2018 and postpone the introduction of capacity market till 2019. In addition, the obligation for power plants to sign annual IOAs has been eliminated for 2016-2018. During 2013-2015, IOAs required businesses to reinvest the sum of all profits and depreciation on an annual basis, limiting the ability to send dividends.Beginning in 2016 Kazakhstan no longer has a restriction on sending dividends.
Heat production in Kazakhstan is also regulated as a natural monopoly. The heat tariffs are set on a cost-plus basis by making an application to the Regulator(Committee of Natural Monopoly Regulation and Competition Protection). Currently, tariffs are only for multi-year periods, but with some annual adjustments forfuel cost.
Key Financial Drivers — The financial results for assets in Kazakhstan are driven by many factors including, but not limited to: availability of the operatingunits; regulated electricity tariff-cap levels; regulated heat tariff levels; and weather conditions, but may change in 2016 due to regulatory changes to the marketstructure and payment mechanism.
• Availability of the operating units• Regulated electricity tariff-cap levels• Weather conditions• Cost of coal• Kazakhstan currency exchange rate fluctuation
Other Europe Businesses
In Jordan, AES has a 37% controlling interest in Amman East, a 380 MW (gross) oil/gas-fired plant fully contracted with the national utility under a 25-yearPPA. We also have a 60% controlling interest in the IPP4 plant in Jordan, a 247 MW (gross)oil/gas-fired peaker plant which commenced operations in July 2014,fully contracted with the national utility under a 25-year PPA. As we have controlling interest in these businesses, we consolidate the results in our operations.
41

On July 2, 2014, the Company closed the sale of its 50% ownership interest in Silver Ridge Power ("SRP") for a purchase price of $179 million, excludingthe Company's indirect ownership interests in SRP's solar generation businesses in Italy and Spain ("Solar Italy" and "Solar Spain," respectively). On February 9,2015, SRP distributed its ownership interest in Solar Spain to a joint venture of AES and a third party. After this date, AES' only remaining economic interest underSRP ownership was in Solar Italy. The previous buyer of our interest in SRP also had an option to purchase the Company's indirect 50% interest in Solar Italy foran additional consideration of $42 million by August 2015. That buyer exercised its option to purchase Solar Italy on August 31, 2015, and the sale was completedon October 1, 2015. At this point, the Company ceased having continuing involvement not only with Solar Italy but also with SRP, its parent, and the Companyrecognized a gain of $5 million on the overall sale of SRP. On September 24, 2015, the Company completed the sale of Solar Spain, an equity method investmentwith 31 MW peak capacity. Net proceeds from the sale transaction were $31 million and the Company recognized a pretax gain on sale of less than $1 million.
Asia SBU
Our Asia SBU has generation facilities in four countries. Our Asia operations accounted for the following proportions of consolidated AES OperatingMargin, AES Adjusted PTC (a non-GAAP measure), AES Operating Cash Flow, and AES Proportional Free Cash Flow (a non-GAAP measure):
Asia SBU (1)2015 2014 2013
% of AES Operating Margin 5% 2% 5%
% of AES Adjusted PTC (a non-GAAP measure) 6% 2% 8%
% of AES Operating Cash Flow 1% 5% 3%
% of AES Proportional Free Cash Flow (a non-GAAP measure) 5% 6% 5%(1) Percentages reflect the contributions by our Asia SBU before deductions for Corporate.
The following table provides highlights of our Asia operations:
Countries India, Philippines and VietnamGeneration Capacity 2,290 gross MW (1,159 proportional MW)Generation Facilities 5 (including 2 under construction)Key Businesses Masinloc, OPGC I and Mong Duong II
Operating installed capacity totals 2,290 MW. Presented below in the table is a list of our Asia SBU generation facilities:
Business Location Fuel Gross MW AES Equity Interest (%Rounded) Year Acquired or Began
Operation Contract Expiration Date Customer(s)
OPGC (1) India Coal 420 49% 1998 2026 GRID Corporation Ltd.
India Subtotal 420
Masinloc Philippines Coal 630 51% 2008 Mid and long-term VariousPhilippines Subtotal 630 Mong Duong 2 Vietnam Coal 1,240 51% 2015 2040 EVN
Vietnam Subtotal 1,240 Asia Total 2,290
(1) Unconsolidated entity for which the results of operations are reflected in Equity in Earnings of Affiliates.
Under Construction
Business Location Fuel Gross MW AES Equity Interest (% Rounded) Expected Date of Commercial Operation
OPGC II India Coal 1,320 49% 1H 2018India Subtotal 1,320 Masinloc ES Philippines Energy Storage 10 100% 1H 2016Philippines Subtotal 10 Asia Total 1,330
42

The following map illustrates the location of our Asia facilities:
Asia Businesses
India
Business Description — OPGC is a 420 MW coal-fired generation facility located in the state of Odisha. OPGC has a 30-year PPA with GRIDCO Limited, astate utility, expiring in 2026. The PPA is composed of a capacity payment based on fixed parameters and a variable component, including a pass-through of actualfuel costs. OPGC is an unconsolidated entity and results are reported as Equity in Earnings of Affiliates in our consolidated results of operations.
Construction and Development — As noted above, AES has one coal-fired project under development with a total capacity of 1,320 MW which is anexpansion of our existing OPGC business. The project started construction in April 2014 and is currently expected to begin operations in 2018. As of December 31,2015 , total capitalized costs at the project level were $336 million (AES share of $165 million), while at the AES level capitalized costs were $13.6 million.Currently, 50% of the expansion capacity is contracted with the state offtaker, GRIDCO, for a period of 25 years, with a normative after-tax rate of return of 15.5%with an opportunity to capture additional 0.5% tied to timely completion of the project. The contract is subject to Central Electricity Regulatory Commission("CERC") approval, which is responsible for publishing tariff determination norms every five years. The rest of the capacity is expected to be sold throughcompetitive bid or regulated Power Purchase Agreements and a small component in the Indian merchant market.
In August 2014, the Supreme Court of India invalidated the allocation of captive coal blocks. The government of India has subsequently enacted new lawsallowing coal block allocation to companies with limited levels of private ownership, based on which the coal blocks have been allocated to a subsidiary of OPGC,Odisha Coal and Power Ltd. ("OCPL"), which is an OPGC joint venture with another company wholly-owned by the government of Odisha. This new companymeets the lower private ownership stipulations for allocation of mines.
Environmental Regulation — The Ministry of Environment Forest and Climate Change in India has recently amended the Environment (Protection) Ruleswith stricter emission limits for new as well as existing thermal power plants via their notification dated December 7, 2015. All existing plants installed beforeDecember 31, 2003 are required to meet revised emission limits within two years and any new thermal power plants that will be operational from January 1, 2017are required to operate with the revised emission limits. An FGD system needs to be installed in the existing units of OPGC for complying with SO 2 emissionsrequirements. The business is evaluating the options and the cost implications. The required design modification and scheduled implications for the expansionproject are currently being evaluated. The impacts of these amendments are still under review, but we believe the cost of complying with the new environmentalregulations will be a pass-through in the GRIDCO tariff for both existing and expansion units. Ministry of Power has issued revised Tariff Policy in January 2016to bring more regulatory certainty, attract private investment, ensure distribution efficiency and promote renewable energy.
Philippines
Business Description — The Masinloc power project in the Philippines is a 630 (gross) MW coal-fired plant located in Zambales, Philippines and isinterconnected to the Luzon Grid. AES acquired 92% of Masinloc in 2008 (IFC is an 8% non-controlling shareholder in Masinloc). In July 2014, AES reduced itsownership to 51% through a sale to the EGCO Group, a Thailand-based power company. More than 95% of Masinloc's peak capacity and variable margin arecontracted through
43

medium to long-term bilateral contracts primarily with Meralco, the largest distribution company in the Philippines, several electric cooperatives and industrialcustomers.
In January 2013, Masinloc entered into a new Power Supply Agreement ("PSA") with its main customer, Meralco, as the previous Transition Supply Contract("TSA") expired in December 2012. The PSA is for 7 years, with an additional 3-year extension clause dependent on mutual agreement. Payments are primarilycapacity-based. The PSA is primarily priced in U.S. Dollars, aligning the revenues with the majority of variable and fixed costs (fuel, debt, insurance) andminimizing currency exchange risks. Masinloc's remaining contracts expire between 2016 and 2026.
Construction and Development — In December 2015, financial close was achieved for 335 MW (gross) expansion unit adjacent to the existing 630 MWplant. The project, which will employ supercritical technology is expected to be commercially operating in 2019. The additional capacity is targeted for sale todistribution utilities, electric cooperatives, and industrial and commercial customers in the Luzon and Visayas grids. 40% of this additional capacity has alreadybeen contracted with an expectation to have 80% capacity contracted by the date of commercial operations.
Market Structure — The Philippine power market is divided into three grids representing the country's three major island groups — Luzon, Visayas andMindanao. Luzon (which includes Manila and is the country's largest island) has limited interconnection with Visayas and represents 85% of the total demand ofboth regions. Luzon and Visayas together have an installed capacity of 16,093 MW.
There is diversity in the mix of the Luzon — Visayas generation, with coal accounting for 37%, natural gas for 17%, hydroelectric for 15%, geothermalgeneration for 10%, and the remaining 21% from other generating plants such as oil, wind, biomass, and solar (priority dispatch with feed-in tariff).
The primary customers for electricity are private distribution utilities, electric cooperatives, and large contestable (industrial and commercial)customers. Approximately 90%-94% of the system's total energy requirement is currently being sold/purchased through medium (3-5 years) to long (6-10 years)term bilateral contracts. The remaining 6%-10% of energy is sold through the WESM, which is the real-time, bid-based and hourly market for energy where thesellers and the buyers adjust their differences between their production/demand and their contractual commitments.
Environmental Regulation — The Renewable Energy Act of 2008 was enacted to promote the development, utilization and commercialization of renewableenergy resources, such as solar, wind, small hydroelectric and biomass energies. Under Chapter III, Section 6, the Renewable Portfolio Standard (RPS) wasintroduced mandating all stakeholders in the electric power industry to contribute to the growth of the renewable energy industry of the country. Under the currentdraft of the RPS, certain customers (e.g. distribution utilities and retail electricity suppliers) will be required to source a certain percentage of their supply fromeligible renewable energy sources. The National Renewable Energy Board ("NREB") is currently developing and implementing regulations for the RPS, includingmechanisms for compliance by actual purchase of renewable energy or equivalent renewable energy certificates. If the regulations are implemented, our RetailElectricity Supply business in the Philippines could be affected by the RPS requirement.
Regulatory Framework
Electricity Regulation — The Philippines has divided its power sector into generation, transmission, distribution and supply under the EPIRA act. TheEPIRA primarily aims to increase private sector participation in the power sector and to privatize the Philippine government's generation and transmission assets.Generation and supply are open and competitive sectors, while transmission and distribution are regulated sectors. Sale of power is conducted primarily throughmedium or long-term bilateral contracts between generation companies and distribution utilities specifying the volume, price and conditions for the sale of energyand capacity, which are approved by the ERC. Power is traded in the WESM which operates under a gross pool, central dispatch and net settlement protocols.Parties to bilateral contracts settle their transactions outside of the WESM and distribution companies or electricity cooperatives buy their imbalance (i.e., powerrequirements not covered by bilateral contracts) from the WESM. Distribution utilities and electric cooperatives are allowed to pass on to their end-users thebilateral contract rates, including WESM purchases, approved by the ERC.
Other Regulatory Considerations — Pursuant to EPIRA, RCOA commenced on June 26, 2013, under which retail electricity suppliers, who are duly licensedby the ERC, may supply directly to contestable customers (end-users with an average demand of at least 1 MW), with distribution companies or electricitycooperatives providing non-discriminatory wire services. Bilateral contracts with contestable customers do not require ERC approval to be implemented. Masinlochas obtained a retail electricity supplier license from the ERC and currently markets power to contestable customers. On June 16, 2015, ERC released a draft forthe rules on mandatory contestability. According to this draft, all contestable customers with an average peak demand of more 750 kW are mandated to enter intopower supply contracts by June 2016, at which point contestable customers shall be required to purchase power from licensed generation or retail suppliers insteadof their local distribution utility.
44

Vietnam
Business Description — The Mong Duong II power project is a 1,240 MW gross coal-fired plant located in Quang Ninh Province of Vietnam and wasconstructed under a BOT contract (the project will be transferred to Vietnamese government after 25 years). AES-VCM Mong Duong Power Company Limited("the BOT Company") is a limited liability joint venture owned by affiliates of AES (51%), Posco Energy Corporation (30%) and China Investment Corporation(19%). This is the first and largest coal-fired BOT project using pulverized coal fired boiler technology in Vietnam. The BOT Company has entered a PPA withEVN, the national utility, and a Coal Supply Agreement ("CSA") with Vinacomin, a state owned entity, both with a 25 year term starting from CommercialOperation Date.
Since April 22, 2015, both units of the Power Facility have been in commercial operations, six months earlier than the committed schedule with theVietnamese government. The BOT Company makes available the dependable capacity and delivers electrical energy to EVN and, in return, EVN makes paymentsto the BOT Company.
Market Structure — The Vietnam Power market is divided into three regions (North, Central and South), with current total installed capacity of 37,604 MW,an 11% increase from 2014 (33,970 MW). The total demand in year 2015 was 141.8 billion kWh with the highest demand of 70 billion kWh in the South and 60billion kWh in the North.
The fuel mix in Vietnam is comprised of hydropower 35% (priority dispatch with low tariff), coal 35%, gas 20%, diesel and small hydro generation 5%, oil1% (dispatched during emergencies or during peak demand), thermo-gas 1% and the remaining 3% imported from China and Lao. The government has a plan toincrease thermal power capacity, primarily with coal, to reduce the dependence on hydroelectricity. According to the Master Plan VII, the total targeted installedcapacity for 2020 is approximately 75,000 MW, in which coal-fired power will account for 48%, hydropower 23%, pumped storage hydropower 2%, gas-firedthermo-power 17%, renewable energy 6%, nuclear power 1% and imported power 3%.
EVN owns 58% of installed generation capacity followed by Petro Vietnam ("PVN") 12%, Vinacomin 4%, BOT projects 8% and others 18%. EVN is astate-owned company that is solely in charge of buying and selling electricity all over Vietnam. The government is planning to decrease EVN's ownership andincrease private sector participation in the power market.
Regulatory Framework
Electricity Regulation — The electricity sector is overseen by several key government entities, including the National Assembly, the Prime Minister, theMinistry of Industry & Trade ("MOIT") and the Electricity Regulatory Agency of Vietnam ("ERAV"), which is under the supervision of the MOIT. These entitiesare responsible for the issuance of laws, guidance, and implementing regulations for the sector. The MOIT, in particular, is responsible for formulating a programto restructure the power industry, develop the electricity market and promulgating electricity market regulations.
Generation, transmission and distribution are currently dominated by the EVN, despite recent inclusion of other players. Transmission and distributioncompanies are wholly-owned by EVN and it also owns 58% of the total installed capacity as noted above. The fuel supply is owned by the government throughVinacomin and PVN. The government plans to equitize EVN-owned generation companies and separate generation, System and Market Provider ("SMP") anddistribution into three different independent operations in order to establish the competitive power market.
Other Regulatory Considerations — According to Decision 63/2013/QÐ-TTG dated November 8, 2013, the roadmap of the power market of Vietnamconsists of three phases. The first phase in relation to establishment of a competitive electricity market was finished at the end of 2014. The second phase: (i)period of 2015-2016 for establishment of a pilot competitive wholesale electricity market; and (ii) period of 2017-2021 for implementation of a competitivewholesale electricity market. The third phase: (i) period of 2022-2023 for establishment of a pilot competitive retail electricity market; and (ii) from 2013 onwardfor implementation of competitive retail electricity market. EVN as a long standing monopoly in the whole chain of generation, transmission and distribution, isbeing restructured to allow spin-off of several subsidiaries into either independent state-owned enterprises or joint stock companies. The BOT power plants will notparticipate in the power market; alternatively the single buyer will bid the tariff on the power pool on their behalf.
Environmental Regulation — Mong Duong II BOT Power Plant complies strictly with environmental requirements involving local regulations and IFCEnvironmental, Health and Safety Guidelines for Thermal Power Plants.
The revised Environmental Act was enacted, effective from January 1, 2015 establishing new rules in relation to, discarded materials and hazardous wastemanagement. Additionally, new regulations on the registration of effluent and emission waste will be put into effect from the beginning of 2018 with no materialimpact to AES.
According to Decision No. 1696/QÐ-TTG dated September 23, 2014 on re-using of ash and gypsum discharged from coal power plants for constructionmaterial, the power plants need to propose investment and construction plans (or co-operative investment) to convert ash into construction material before 2020.There is no material impact to AES.
45

Sri Lanka
Business Description — AES closed the sale of Kelanitissa, a 168 MW oil-fired business with 90% ownership, on January 27, 2016 with proceeds of $18million, with the potential to receive up to an additional $1.3 million overdue receivable from CEB.
Financial Data by Country
See the table with our consolidated operations for each of the three years ended December 31, 2015 , 2014 and 2013 , and property, plant and equipment asof December 31, 2015 and 2014 , by country, in Note 17 — Segment and Geographic Information included in Item 8.— Financial Statements and SupplementaryData of this Form 10-K for further information.
46

Environmental and Land-Use Regulations
The Company faces certain risks and uncertainties related to numerous environmental laws and regulations, including existing and potential GHG legislationor regulations, and actual or potential laws and regulations pertaining to water discharges, waste management (including disposal of coal combustion residuals),and certain air emissions, such as SO 2 , NO X , PM, mercury and other hazardous air pollutants. Such risks and uncertainties could result in increased capitalexpenditures or other compliance costs which could have a material adverse effect on certain of our U.S. or international subsidiaries, and our consolidated resultsof operations. For further information about these risks, see Item 1A.— Risk Factors — Our businesses are subject to stringent environmental laws andregulations; Our businesses are subject to enforcement initiatives from environmental regulatory agencies; and Regulators, politicians, non-governmentalorganizations and other private parties have expressed concern about greenhouse gas, or GHG, emissions and the potential risks associated with climate changeand are taking actions which could have a material adverse impact on our consolidated results of operations, financial condition and cash flows in this Form 10-K.For a discussion of the laws and regulations of individual countries within each SBU where our subsidiaries operate, see discussion within Item 1.— Business ofthis Form 10-K under the applicable SBUs.
Many of the countries in which the Company does business also have laws and regulations relating to the siting, construction, permitting, ownership,operation, modification, repair and decommissioning of, and power sales from, electric power generation or distribution assets. In addition, international projectsfunded by the International Finance Corporation, the private sector lending arm of the World Bank, or many other international lenders are subject to World Bankenvironmental standards or similar standards, which tend to be more stringent than local country standards. The Company often has used advanced generationtechnologies in order to minimize environmental impacts, such as CFB boilers and advanced gas turbines, and environmental control devices such as flue gasdesulphurization for SO 2 emissions and selective catalytic reduction for NO x emissions.
Environmental laws and regulations affecting electric power generation and distribution facilities are complex, change frequently and have become morestringent over time. The Company has incurred and will continue to incur capital costs and other expenditures to comply with these environmental laws andregulations. See Item 7 .—Management's Discussion and Analysis of Financial Condition and Results of Operations—Environmental Capital Expenditures in thisForm 10-K for more detail. The Company and its subsidiaries may be required to make significant capital or other expenditures to comply with these regulations.There can be no assurance that the businesses operated by the subsidiaries of the Company will be able to recover any of these compliance costs from theircounterparties or customers such that the Company's consolidated results of operations, financial condition and cash flows would not be materially affected.
Various licenses, permits and approvals are required for our operations. Failure to comply with permits or approvals, or with environmental laws, can resultin fines, penalties, capital expenditures, interruptions or changes to our operations. Certain subsidiaries of the Company are subject to litigation or regulatory actionrelating to environmental permits or approvals. See Item 3. —Legal Proceedings in this Form 10-K for more detail with respect to environmental litigation andregulatory action.
United States Environmental and Land-Use Legislation and Regulations
In the U.S. the CAA and various state laws and regulations regulate emissions of air pollutants, including SO 2 , NO X , PM, GHGs, mercury and otherhazardous air pollutants. Certain applicable rules are discussed in further detail below.
CSAPR — The CSAPR requires significant reductions in SO 2 and NO X emissions from power plants in many states in which subsidiaries of the Companyoperate. Once fully implemented, the rule requires SO 2 emission reductions of 73%, and NO X reductions of 54%, from 2005 levels. The CSAPR is implemented,in part, through a market-based program under which compliance may be achievable through the acquisition and use of emissions allowances created by the EPA.The CSAPR contemplates limited interstate and unlimited intra-state trading of emissions allowances by covered sources. Initially, the EPA issued emissionsallowances to affected power plants based on state emissions budgets established by the EPA under the CSAPR. The Company is required to comply with theCSAPR in several states, including Ohio, Indiana, Oklahoma and Maryland. The Company complies with CSAPR through operation of existing controls andpurchases of allowances on the open market, as needed. While the Company's 2015 CSAPR compliance costs were immaterial, the future availability of and cost topurchase allowances to meet the emission reduction requirements is uncertain at this time.
The EPA issued an interim final rule establishing the following deadlines for implementation of the CSAPR:• January 1, 2015: Phase 1 (2015 and 2016) began for annual trading programs. Existing units must have begun monitoring and reporting SO 2 and NO x
emissions.• May 1, 2015: Phase 1 began for ozone-season NO x trading program. Existing units must have begun monitoring and reporting NO x emissions.• December 1, 2015 (and each Dec. 1 thereafter): Date by which sources must demonstrate compliance with ozone-season NO x trading program (i.e.,
allowance transfer deadline).
47

• March 1, 2016 (and each March 1 thereafter): Date by which sources must demonstrate compliance with annual trading programs (i.e., allowance transferdeadline).
• January 1, 2017: Phase 2 (2017 and beyond) begins for annual trading programs. Assurance provisions in effect.• May 1, 2017: Phase 2 (2017 and beyond) begins for ozone-season NO x trading program. Assurance provisions in effect.
The EPA has released a proposed rule that would further reduce the amount of ozone season NO X allowances that would be available under the market-basedprogram, starting in 2017. This proposed rule would not affect annual SO 2 and NO X allowances. We cannot predict at this time the impact that implementation ofthe revised CSAPR will have on the Company. Certain of the Company's subsidiaries could be required to increase their capital expenditures, make operationalchanges or purchase additional allowances on the open market resulting in additional compliance costs to fully comply with the CSAPR, which expenditures andcosts could be material.
MATS — Pursuant to Section 112 of the CAA, the EPA published a final rule in 2012 called the MATS establishing National Emissions Standards forHazardous Air Pollutants from coal and oil-fired electric utility steam generating units. The rule required all coal-fired power plants to comply with the applicableMATS standards by April 2015, with the possibility of obtaining a one year extension, if needed, to complete the installation of necessary controls. To comply withthe rule, many coal-fired power plants may need to install additional control technology to control acid gases, mercury or PM, or they may need to repower with analternate fuel or retire operations. Most of the Company's U.S. coal-fired plants operated by the Company's subsidiaries comply with MATS as of April 16, 2015using existing control technologies. However, in some cases additional time for compliance was needed in order to make necessary capital and operational changes,particularly for older facilities lacking advanced control technologies. For a discussion of the deactivation and planned deactivation of certain units owned orpartially owned by IPL and DP&L as a result of existing and expected environmental regulations, including MATS, see Unit Retirement and ReplacementGeneration below.
IPL required additional time for compliance beyond April 16, 2015. In December 2012, IDEM granted an extension to April 16, 2016 covering all coal-firedunits at Harding Street and Eagle Valley, in addition to Unit 3 and Unit 4 at Petersburg. In February 2013, IDEM granted a three-month extension on PetersburgUnit 2 to July 16, 2015, and that unit, as well as Petersburg Unit 1, which did not receive an extension, is currently in compliance with MATS.
On August 14, 2013, the IURC approved IPL's MATS plan, which included investing up to $511 million in the installation of new pollution controlequipment on IPL's five largest base load generating units. These coal-fired units are located at IPL's Petersburg and Harding Street generating stations. The IURCalso approved IPL's request to recover operating and construction costs for this equipment (including a return) through a rate adjustment mechanism, with certainstipulations. IPL plans to spend a total of $454 million for this project as approximately $57 million of costs will largely be avoided as a result of the approval forIPL's plans to refuel Harding Street Station Unit 7 from coal to natural gas.
Several lawsuits challenging the MATS rule were filed by other parties and consolidated into a single proceeding before the United States Court of Appealsfor the District of Columbia Circuit (the "D.C Circuit"). On April 15, 2014, the D.C. Circuit denied the challenges. On June 29, 2015, the U.S. Supreme Courtreversed the D.C. Circuit's decision, and remanded MATS to the D.C. Circuit for further proceedings. On December 15, 2015, the D.C. Circuit issued an orderremanding MATS to the EPA without vacatur while the EPA works to comply with the U.S. Supreme Court's decision. The EPA published its revised appropriateand necessary finding on December 1, 2015 and plans to finalize it by April 15, 2016. Further proceedings are expected; however, in the meantime MATS remainsin effect. We currently cannot predict the outcome of this litigation, or its impact, if any, on our MATS compliance planning or ultimate costs.
New Source Review ("NSR") — The NSR requirements under the CAA impose certain requirements on major emission sources, such as electric generatingstations, if changes are made to the sources that result in a significant increase in air emissions. Certain projects, including power plant modifications, are excludedfrom these NSR requirements, if they meet the RMRR exclusion of the CAA. There is ongoing uncertainty, and significant litigation, regarding which projects fallwithin the RMRR exclusion. The EPA has pursued a coordinated compliance and enforcement strategy to address NSR compliance issues at the nation's coal-firedpower plants. The strategy has included both the filing of suits against power plant owners and the issuance of NOVs to a number of power plant owners allegingNSR violations. See Item 3.— Legal Proceedings in this Form 10-K for more detail with respect to environmental litigation and regulatory action, including aNOV issued by the EPA against IPL concerning NSR and prevention of significant deterioration issues under the CAA.
DP&L's Stuart Station and Hutchings Station have received NOVs from the EPA alleging that certain activities undertaken in the past are outside the scopeof the RMRR exclusion. Additionally, generation units partially owned by DP&L but operated by other utilities have received such NOVs relating to equipmentrepairs or replacements alleged to be outside the RMRR exclusion. The NOVs issued to DP&L-operated plants have not been pursued through litigation by theEPA.
If NSR requirements were imposed on any of the power plants owned by the Company's subsidiaries, the results could have a material adverse impact on theCompany's business, financial condition and results of operations. In connection with the
48

imposition of any such NSR requirements on IPL, the utility would seek recovery of any operating or capital expenditures related to air pollution controltechnology to reduce regulated air emissions, but not fines or penalties; however, there can be no assurances that they would be successful in that regard.
Regional Haze Rule — The EPA's "Regional Haze Rule" is intended to reduce haze and protect visibility in designated federal areas, and sets guidelines fordetermining BART at affected plants and how to demonstrate "reasonable progress" towards eliminating man-made haze by 2064. The Regional Haze Rulerequired states to consider five factors when establishing BART for sources, including the availability of emission controls, the cost of the controls and the effect ofreducing emission on visibility in Class I areas (including wilderness areas, national parks and similar areas). The statute requires compliance within five yearsafter the EPA approves the relevant SIP or issues a federal implementation plan, although individual states may impose more stringent compliance schedules.
EPA previously determined that states included in the CSAPR would not be required to make source-specific BART determinations for BART-affectedelectric generating units, reasoning that the emissions reductions required by the CSAPR were "better than BART." Concurrently, EPA also finalized a limiteddisapproval of certain states' plans — including Ohio's — that previously relied on the EPA's Clean Air Interstate Rule to improve visibility and substituted aFederal Implementation Plan that relies on the CSAPR. Environmental groups have challenged EPA's determination than the CSAPR is "better than BART." Thechallenge currently is proceeding in the D.C. Circuit.
National Ambient Air Quality Standards ("NAAQS") — Under the CAA, the EPA sets NAAQS for six principal pollutants considered harmful to publichealth and the environment, including ozone, particulate matter, NO x and SO 2 , which result from coal combustion. Areas meeting the NAAQS are designated"attainment areas" while those that do not meet the NAAQS are considered "nonattainment areas." Each state must develop a plan to bring nonattainment areas intocompliance with the NAAQS, which may include imposing operating limits on individual plants. The EPA is required to review NAAQS at five-year intervals.
Based on the current and potential future ambient standards, certain of the states in which the Company's subsidiaries operate have determined or will berequired to determine whether certain areas within such states meet the NAAQS. Some of these states may be required to modify their State Implementation Plansto detail how the states will regain their attainment status. As part of this process, it is possible that the applicable state environmental regulatory agency or the EPAmay require reductions of emissions from our generating stations to reach attainment status for ozone, fine particulate matter, NO x or SO 2 . The compliance costsof the Company's U.S. subsidiaries could be material.
On September 30, 2015, IDEM published its final rule establishing reduced SO 2 limits for IPL facilities in accordance with a new one-hour standard of 75parts per billion, for the areas in which IPL's Harding Street, Petersburg, and Eagle Valley Generating Stations operate. The expected compliance date for theserequirements is January 1, 2017. No impact is expected for Eagle Valley or Harding Street Generating Stations because these facilities will cease coal combustionprior to the compliance date. It is expected that improvements to the existing FGDs at Petersburg will be required in order to comply. IPL has engaged anengineering firm to further assess potential compliance measures and associated costs and timing. While costs associated with the proposed rule cannot accuratelybe predicted at this time, they could be material.
Greenhouse Gas Emissions — In January 2011, the EPA began regulating GHG emissions from certain stationary sources under the so-called "TailoringRule." The regulations are being implemented pursuant to two CAA programs: the Title V Operating Permit program and the program requiring a permit ifundergoing certain new construction or major modifications, known as the Prevention of Significant Deterioration ("PSD"). Obligations relating to Title V permitsinclude record-keeping and monitoring requirements. Sources subject to PSD can be required to implement BACT. In June 2014, the U.S. Supreme Court ruledthat the EPA had exceeded its statutory authority in issuing the Tailoring Rule by regulating under the PSD program sources based solely on their GHG emissions.However, the U.S. Supreme Court also held that the EPA could impose GHG BACT requirements for sources already required to implement PSD for certain otherpollutants. Therefore, if future modifications to our U.S.-based businesses' sources require PSD review for other pollutants, it may trigger GHG BACTrequirements. The EPA has issued guidance on what BACT entails for the control of GHG and has now proposed new source performance standards ("NSPS") formodified and reconstructed units (see below) that will serve as a floor (maximum emission rate) for future BACT requirements. Individual states are now requiredto determine what controls are required for facilities within their jurisdiction on a case-by-case basis. The ultimate impact of the BACT requirements applicable tous on our operations cannot be determined at this time as our U.S.-based businesses will not be required to implement BACT until one of them constructs a newmajor source or makes a major modification of an existing major source. However, the cost of compliance could be material.
On October 23, 2015, the EPA's rule establishing new source performance standards ("NSPS") for new electric generating units became effective. The NSPSestablish CO 2 emissions standards of 1400 lbs/MWh for newly constructed coal-fueled electric generating plants, which reflects the partial capture and storage ofCO 2 emissions from the plants. The NSPS for large, newly constructed NGCC facilities is 1,000 lbs/MWh. These standards apply to any electric generating unitwith construction
49

commencing after January 8, 2014. The EPA also promulgated NSPS applicable to modified and reconstructed electric generating units, which will serve as a floorfor future BACT determinations for such units. The NSPS applicable to modified and reconstructed coal-fired units will be 1,800 lbs CO 2 /MWh for sources withheat input greater than 2,000 MMBtu per hour. For smaller sources, below 2,000 MMBtu per hour, the standard is 2,000 lbs CO 2 /MWh. The NSPS could have animpact on the Company's plans to construct and/or reconstruct electric generating units in some locations.
On December 22, 2015, the EPA's final CO 2 emission rules for existing power plants under Clean Air Act Section 111(d) (called the Clean Power Plan (the"CPP")) also became effective. The CPP provides for interim emissions performance rates that must be achieved beginning in 2022 and final emissionsperformance rates that must be achieved starting in 2030. Under the CPP, states are required to meet state-wide emission rate standards or equivalent mass-basedstandards, with the goal being a 32% reduction in total U.S. power sector emissions from 2005 levels by 2030. The CPP requires states to submit, by 2016,implementation plans to meet the standards or a request for an extension to 2018. If a state fails to develop and submit an approvable implementation plan, the EPAwill finalize a federal plan for that state. The full impact of the CPP will depend on the following:
• whether and how the states in which the Company's U.S. businesses operate respond to the CPP;
• whether the states adopt an emissions trading regime and, if so, which trading regime; • how other states respond to the CPP, which will affect the size and robustness of any emissions trading market; and • how other companies may respond in the face of increased carbon costs.
Several states and industry groups filed petitions in the D.C. Circuit challenging the CPP and requested a stay of the rule while the challenge was considered.The D.C. Circuit denied the stay and granted requests to consider the challenges on an expedited basis. As a result, the D.C. Circuit may issue an opinion on thesechallenges prior to the end of 2016. On February 9, 2016, the U.S. Supreme Court issued orders staying implementation of the CPP pending resolution ofchallenges to the rule.
Because we likely will not know the answers to the above questions regarding the CPP until 2018 or later, because the first compliance period will not enduntil 2025, and because we cannot predict whether the CPP will survive the legal challenges, it is too soon to determine the CPP's potential impact on our business,operations or financial condition, but any such impact could be material.
Cooling Water Intake — The Company's facilities are subject to a variety of rules governing water use and discharge. In particular, the Company's U.S.facilities are subject to the CWA Section 316(b) rule issued by the EPA that seeks to protect fish and other aquatic organisms by requiring existing steam electricgenerating facilities to utilize the Best Technology Available ("BTA") for cooling water intake structures. On August 15, 2014, the EPA published its finalstandards to protect fish and other aquatic organisms drawn into cooling water systems at large power plants and other industrial facilities. These standards requiresubject facilities that utilize at least 25% of the withdrawn water exclusively for cooling purposes and have a design intake flow of greater than two million gallonsper day to choose among seven BTA options to reduce fish impingement. In addition, facilities that withdraw at least 125 million gallons per day for coolingpurposes must conduct studies to assist permitting authorities to determine whether and what site-specific controls, if any, would be required to reduce entrainmentof aquatic organisms. This decision-making process would include public input as part of permit renewal or permit modification. It is possible this process couldresult in the need to install closed-cycle cooling systems (closed-cycle cooling towers), or other technology. Finally, the standards require that new units added toan existing facility to increase generation capacity are required to reduce both impingement and entrainment that achieves one of two alternatives under nationalBTA standards for entrainment. It is not yet possible to predict the total impacts of this recent final rule at this time, including any challenges to such final rule andthe outcome of any such challenges. However, if additional capital expenditures are necessary, they could be material.
AES Southland's current plan to comply with the California State Water Resources Board's regulations will see all once-through-cooled generating unitsretired from service by December 31, 2020. New air-cooled combined cycle gas turbine generators and battery energy storage systems will be constructed at theAES Alamitos and AES Huntington Beach generating stations. The execution of the Implementation Plan is entirely dependent on the Company's ability to executeon long-term power purchase agreements to support project financing of the replacement units. The SWRCB is currently reviewing the Implementation Plan andlatest update information to evaluate the impact on electrical system reliability. Power purchase agreements for the new generating capacity are currently underreview by the California Public Utilities Commission.
Power plants will be required to comply with the more stringent of state or federal requirements. At present, the California state requirements are morestringent and have earlier compliance dates than the federal EPA requirements, and are therefore applicable to the Company's California assets. Challenges to thefederal EPA's rule have been consolidated in the U.S. Court of Appeals for the Second Circuit, although implementation of the rule has not been stayed while thechallenges proceed. The Company anticipates once-through cooling and CWA Section 316(b) compliance regulations and costs would have a material impact onour consolidated financial condition or results of operations.
50

Water Discharges — Certain of the Company's U.S.-based businesses are subject to National Pollutant Discharge Elimination System permits that regulatespecific industrial waste water and storm water discharges to the waters of the U.S. under the CWA. On June 29, 2015, the EPA and the U.S. Army Corps ofEngineers published a final rule defining federal jurisdiction over waters of the U.S.. This rule, which became effective on August 28, 2015, may expand orotherwise change the number and types of waters or features subject to federal permitting. On October 9, 2015, the U.S. Court of Appeals for the Sixth Circuitissued an order to temporarily stay the "Waters of the U.S." rule nationwide while that court determines whether it has authority to hear the challenges to therule. The order was in response to challenges brought by 18 states and followed an August 2015 court decision in the U.S. District Court of North Dakota to staythe rule in 13 other states. We cannot predict the duration of the nationwide or partial stay of the rule or the outcome of this litigation; however, if the ruleultimately survives the legal challenges, it could have a material impact on our business, financial condition or results of operations.
On January 7, 2013, the Ohio Environmental Protection Agency issued an NPDES permit for J.M. Stuart Station. The primary issues involve the temperatureand thermal discharges from the Station including the point at which the water quality standards are applied, i.e., whether water quality standards apply at the pointwhere the Station discharge canal discharges into the Ohio River, or whether, as the EPA alleges, the discharge canal is an extension of Little Three Mile Creek andthe water quality standards apply at the point where water enters the discharge canal. In addition, there are a number of other water-related permit requirementsestablished with respect to metals and other materials contained in the discharges from the Station. The NPDES permit establishes interim standards related to thethermal discharge for 54 months that are comparable to current levels of discharge by Stuart Station. Permanent standards for both temperature and overall thermaldischarges are established as of 55 months after the permit is effective, except that an additional transitional period of approximately 22 months is allowed ifcompliance with the permanent standards is to be achieved through a plan of construction and various milestones on the construction schedule are met. It isbelieved that compliance with the permit as written will require capital expenses that will be material to DP&L. The cost of compliance and the timing of suchcosts is uncertain and may vary considerably depending on a compliance plan that would need to be developed, the type of capital projects that may be necessary,and the uncertainties that may arise in the likely event that permits and approvals from other governmental entities would likely be required to construct andoperate any such capital project. DP&L has appealed various aspects of the final permit to the Environmental Review Appeals Commission and a hearing has beenscheduled for March 2016. The compliance schedule in the final permit has been modified to accommodate the timing of the hearing. The outcome of such appealis uncertain.
On August 28, 2012, the IDEM issued NPDES permits to the IPL Petersburg, Harding Street and Eagle Valley generating stations, which became effective inOctober 2012. NPDES permits regulate specific industrial wastewater and storm water discharges to the waters of Indiana under Sections 402 and 405 of the U.S.Clean Water Act. These permits set new water quality-based effluent discharge limits for the Harding Street and Petersburg facilities, as well as monitoring andother requirements designed to protect aquatic life, with full compliance required by October 2015. IPL received an extension to the compliance deadline throughSeptember 29, 2017 for IPL's Harding Street and Petersburg facilities through agreed orders with IDEM. IPL conducted studies to determine the operationalchanges and control equipment necessary to comply with the new limitations. In October 2014, IPL filed its wastewater compliance plans for its power plants withthe IURC. On July 29, 2015, the IURC approved a Certificate of Public Convenience and Necessity to convert Unit 7 at the Harding Street Station from coal-firedto natural gas-fired (about 410 MW net capacity), and also to install and operate wastewater treatment technologies at Harding Street Station and PetersburgGeneration Station. IPL plans to invest $319 million in these projects to ensure compliance with the wastewater treatment requirements by September 29, 2017.
On November 3, 2015, the EPA published its final ELG rule to reduce toxic pollutants discharged into waters of the U.S. by power plants. These effluentlimitations for existing and new sources include dry handling of fly ash, closed-loop or dry handling of bottom ash and more stringent effluent limitations for fluegas de-sulfurization wastewater. Compliance time lines for existing sources will be established by the applicable permitting authorities and will be set as soon asdetermined possible, but no sooner than November 1, 2018 and no later than December 31, 2023. Challenges to this rule are being consolidated in the U.S. Court ofAppeals for the Fifth Circuit. IPL expects to recover through its environmental rate adjustment mechanism any operating or capital expenditures related tocompliance with the effluent limitations requirements. Recovery of these costs is sought through an Indiana statute that allows for 80% recovery of qualifying coststhrough a rate adjustment mechanism with the remainder recorded as a regulatory asset to be considered for recovery in the next base rate case proceeding;however, there can be no assurances that IPL will be successful in that regard. In light of the uncertainties at this time, we cannot predict the impact of theseregulations on our consolidated results of operations, cash flows, or financial condition, but it could be material.
Waste Management — In the course of operations, the Company's facilities generate solid and liquid waste materials requiring eventual disposal orprocessing. With the exception of coal combustion residuals ("CCR"), the wastes are not usually physically disposed of on our property, but are shipped off site forfinal disposal, treatment or recycling. CCR, which consists of bottom ash, fly ash and air pollution control wastes, is disposed of at some of our coal-fired powergeneration plant sites using engineered, permitted landfills. Waste materials generated at our electric power and distribution facilities may include CCR, oil, scrapmetal, rubbish, small quantities of industrial hazardous wastes such as spent solvents, tree and land clearing wastes and PCB contaminated liquids and solids. TheCompany endeavors to ensure that all of its solid and liquid wastes are
51

disposed of in accordance with applicable national, regional, state and local regulations. On October 19, 2015, an EPA rule regulating CCR under the ResourceConservation and Recovery Act became effective. The rule established nationally applicable minimum criteria for the disposal of CCR in new and currentlyoperating landfills and surface impoundments, and may impose closure and/or corrective action requirements for existing CCR landfills and impoundments undercertain specified conditions. The primary enforcement mechanisms under this regulation would be actions commenced by the states and private lawsuits. TheCompany's U.S. subsidiaries are still analyzing the potential impact and compliance cost associated with this final rule, and there can be no assurance that theCompany's businesses, financial condition or results of operations would not be materially and adversely affected by such rule.
Senate Bill 251 — In May 2011, Senate Bill 251 became a law in the state of Indiana. Senate Bill 251 is a comprehensive bill that, among other things,provides Indiana utilities, including IPL, with a means for recovering 80% of costs incurred to comply with federal mandates through a periodic retail rateadjustment mechanism. This includes costs to comply with regulations from the EPA, FERC, the North American Electric Reliability Corporation, Department ofEnergy, etc., including capital intensive requirements and/or proposals described herein, such as cooling water intake regulations, waste management and coalcombustion byproducts, wastewater effluent, MISO transmission expansion costs and polychlorinated biphenyls. It does not change existing legislation that allowsfor 100% recovery of clean coal technology designed to reduce air pollutants.
Some of the most important features of Senate Bill 251 to IPL are as follows. Any energy utility in Indiana seeking to recover federally mandated costsincurred in connection with a compliance project shall apply to the IURC for a CPCN for the compliance project. It presents certain factors that the IURC mustconsider in determining whether to grant a CPCN. It further specifies that if the IURC approves a proposed compliance project and the projected federallymandated costs associated with the project, the following apply: (i) 80% of the approved costs shall be recovered by the energy utility through a periodic retail rateadjustment mechanism; (ii) 20% of the approved costs shall be deferred and recovered by the energy utility as part of the next general rate case filed with theIURC; and (iii) actual costs exceeding the projected federally mandated costs of the approved compliance project by more than 25% shall require specificjustification and approval before being authorized in the energy utility's next general rate case. Senate Bill 251 also requires the IURC to adopt rules to establish avoluntary clean energy portfolio standard program. Such program will provide incentives to participating electricity suppliers to obtain specified percentages ofelectricity from clean energy sources in accordance with clean portfolio standard goals, including requiring at least 50% of the clean energy to originate fromIndiana suppliers. The goals can also be met by purchasing clean energy credits.
CERCLA — The Comprehensive Environmental Response, Compensation and Liability Act of 1980 (aka "Superfund") may be the source of claims againstcertain of the Company's U.S. subsidiaries from time to time. There is ongoing litigation at a site known as the South Dayton Landfill where a group of companiesalready recognized as potentially responsible parties ("PRPs") have sued DP&L and other unrelated entities seeking a contribution toward the costs of assessmentand remediation. DP&L is actively opposing such claims. In 2003, DP&L received notice that the EPA considers DP&L to be a PRP at the Tremont City landfillSuperfund site. EPA has taken no further action with respect to DP&L since 2003 regarding the Tremont City landfill. The Company is unable to determinewhether there will be any liability, or the size of any liability that may ultimately be assessed against DP&L at these two sites, but any such liability could bematerial to DP&L.
Unit Retirement and Replacement Generation — In the second quarter of 2013, IPL retired in place five oil-fired peaking units with an average life ofapproximately 61 years (approximately 168 MW net capacity in total), as such units were not equipped with the advanced environmental control technologiesneeded to comply with existing and expected environmental regulations. Although these units represented approximately 5% of IPL's generating capacity, theywere seldom dispatched by Midcontinent Independent System Operator, Inc. in recent years due to their relatively higher production cost and in some instancesrepairs were needed. In addition to these recently retired units, IPL has several other generating units that it expects to retire or refuel by 2017. These units areprimarily coal-fired and represent 472 MW of net capacity in total. To replace this generation, in April 2013, IPL filed a petition and case-in-chief with the IURCin April 2013 seeking a CPCN to build a 550 to 725 MW CCGT at its Eagle Valley Station site in Indiana and to refuel Harding Street Station Units 5 and 6 fromcoal to natural gas (106 MW net capacity each). In May 2014, the IURC issued an order on the CPCN authorizing the refueling project and granting approval tobuild a 644 to 685 MW CCGT at a total budget of $649 million. The current estimated cost of these projects is $632 million. IPL was granted authority to accruepost in-service allowance for debt and equity funds used during construction and to defer the recognition of depreciation expense of the CCGT and refuelingproject until such time that we are allowed to collect both a return and depreciation expense on the CCGT and refueling project. The CCGT is expected to beplaced into service in April 2017, and the refueling project was completed in December 2015. The costs to build and operate the CCGT and for the refuelingproject, other than fuel costs, will not be recoverable by IPL through rates until the conclusion of a base rate case proceeding with the IURC after the assets havebeen placed in service.
As a result of existing and expected environmental regulations, including MATS, DP&L notified PJM of its plan to retire the six coal-fired units aggregatingapproximately 360 MW at its wholly-owned Hutchings Generation Station. Hutchings Unit 4 was retired in June 2013. In conjunction with administrativeagreements reached in 2013 with the EPA and Ohio's Regional
52

Air Pollution Control Authority that resolved alleged violations of air quality standards, DP&L accelerated its plans with respect to Hutchings Units 1, 2, 3, 5 and 6and those units were each retired by June 2015. DP&L removed equipment from such units so that combustion of coal was not possible after September 2013.Conversion of the coal-fired units to natural gas was investigated, but the cost of investment exceeded the expected return. In addition, DP&L ownedapproximately 207 MW of coal-fired generation at Beckjord Unit 6, which was operated by Duke Energy Ohio. Beckjord Unit 6 was retired effective October 1,2014. At this time, DP&L does not have plans to replace the units that have been or will be retired.
International Environmental Regulations
For a discussion of the material environmental regulations applicable to the Company's businesses located outside of the U.S., see Environmental Regulationunder the discussion of the various countries in which the Company's subsidiaries operate in Business—Our Organization and Segments, above.
Customers — We sell to a wide variety of customers. No individual customer accounted for 10% or more of our 2015 total revenue. In our generation business,we own and/or operate power plants to generate and sell power to wholesale customers such as utilities and other intermediaries. Our utilities sell to end-usercustomers in the residential, commercial, industrial and governmental sectors in a defined service area.
Employees — As of December 31, 2015 , we employed approximately 21,000 people.
Executive Officers — The following individuals are our executive officers:
Michael Chilton , 56 years old, was named Senior Vice President, Construction & Engineering, for the Company in December 2014. Prior to his current role,Mr. Chilton was the Managing Director of Construction from 2009 to 2011 and Vice President, Operations Support from 2012 to 2014. Before joining AES, Mr.Chilton held various leadership roles in Kennametal and GE, including: Regional Director for Kennametal Asia (2006-2009), with GE as President & CEO ofXinhua Controls Solutions based in China (2005-2006), Managing Director for Contractual Services Asia based in Singapore (2001-2005), Quality Leader forEnergy Services based in Atlanta (1999-2001), Master Black Belt for Energy Sales based in Tokyo (1998-1999) and President of Joint Conversion company inNuclear Energy based in Wilmington (1995-1998). Mr. Chilton has a BS in Chemical Engineering from University of Missouri, a MBA from University ofArkansas and a JD from Kaplan University.
Bernerd Da Santos , 52 years old, was appointed Chief Operating Officer and Senior Vice President in December 2014. Previously, Mr. Da Santos heldseveral positions at the Company including Chief Financial Officer, Global Finance Operations (2012-2014), Chief Financial Officer of Global Utilities (2011-2012), Chief Financial Officer of Latin America and Africa (2009-2011), Chief Financial Officer of Latin America (2007-2009), Managing Director of Finance forLatin America (2005-2007) and VP and Controller of EDC (Venezuela). Prior to joining AES in 2000, Mr. Da Santos held a number of financial leadershippositions at EDC. Mr. Da Santos is a member of the Board of Directors of Companhia Brasiliana de Energia, AES Tietê, AES Eletropaulo, AES Gener, Companhiade Alumbrado Electrico de San Salvador ("CAESS"), Empresa Electrica de Oriente ("EEO"), Companhia de Alumbrado Electrico de Santa Ana, AES Chivor &Cia S.C.A. E.S.P. and Indianapolis Power & Light. Mr. Da Santos holds a Bachelor's degree with Cum Laude distinction in Business Administration and PublicAdministration from Universidad José Maria Vargas, a Bachelor's degree with Cum Laude distinction in Business Management and Finance, and an MBA withCum Laude distinction from Universidad José Maria Vargas.
Andrés R. Gluski , 58 years old, has been President, CEO and a member of our Board of Directors since September 2011 and is Chairman of the Strategyand Investment Committee of the Board. Prior to assuming his current position, Mr. Gluski served as Executive Vice President ("EVP") and Chief OperatingOfficer ("COO") of the Company since March 2007. Prior to becoming the COO of AES, Mr. Gluski was EVP and the Regional President of Latin America from2006 to 2007. Mr. Gluski was Senior Vice President ("SVP") for the Caribbean and Central America from 2003 to 2006, CEO of La Electricidad de Caracas("EDC") from 2002 to 2003 and CEO of AES Gener (Chile) in 2001. Prior to joining AES in 2000, Mr. Gluski was EVP and Chief Financial Officer ("CFO") ofEDC, EVP of Banco de Venezuela (Grupo Santander), Vice President ("VP") for Santander Investment, and EVP and CFO of CANTV (subsidiary of GTE).Mr. Gluski has also worked with the International Monetary Fund in the Treasury and Latin American Departments and served as Director General of the Ministryof Finance of Venezuela. Mr. Gluski currently serves on President Obama's Export Council, the US-Brazil CEO Forum and the US-India CEO Forum. He is amember of the Board of Waste Management, and is Chairman of AES Gener in Chile and AES Brasiliana in Brazil. Mr. Gluski is also Chairman of the AmericasSociety/Council of the Americas, and Director of the Edison Electric Institute and the US-Philippines Society. Mr. Gluski is a magna cum laude graduate of WakeForest University and holds an M.A. and a Ph.D. in Economics from the University of Virginia.
Elizabeth Hackenson , 55 years old, was named Chief Information Officer ("CIO") and SVP of AES in October 2008. Prior to assuming her current position,Ms. Hackenson was the SVP and CIO at Alcatel-Lucent from 2006 to 2008, where she managed the development of technology programs for Applications,Operations and Infrastructure. Previously, she also served as the EVP and CIO for MCI from 2004 to 2006. Her corporate tenure has spanned several Fortune 100companies
53

including, British Telecom (Concert), AOL (UUNET) and EDS. She served in a variety of senior management positions, working on the management and deliveryof information technology services to support business needs across a corporate-wide enterprise. Ms. Hackenson serves on the Boards of Dayton Power & Light("DP&L") and its parent company DPL, Inc. AES Cochrane and AES Chivor. She also serves as a Director on the Greater Washington Board of Trade and Red 5Security and is a Strategic Advisor to the Paladin Group. Ms. Hackenson earned her degree from New York State University.
Tish Mendoza , 40 years old, is Chief Human Resources Officer and Senior Vice President, Global Human Resources and Internal Communications. Prior toassuming her current position, Ms. Mendoza was the Vice President of Human Resources, Global Utilities from 2011 to 2012 and Vice President of GlobalCompensation, Benefits and HRIS, including Executive Compensation, from 2008 to 2011 and acted in the same capacity as the Director of the function from 2006to 2008. In 2015, Ms. Mendoza was appointed a member of the Boards of AES Chivor S.A. and DP&L, and sits on AES' compensation and benefits committees.She is also currently serving as co-chair of Evanta Global HR, and is part of its governing body in Washington, DC. Prior to joining AES, Ms. Mendoza was VicePresident of Human Resources for a product company in the Treasury Services division of JP Morgan Chase and Vice President of Human Resources andCompensation and Benefits at Vastera, Inc, a former technology and managed services company. Ms. Mendoza earned certificates in leadership and humanresource management, and a Bachelor's degree in Business Administration and Human Resources.
Brian A. Miller , 50 years old, is an EVP of the Company, General Counsel, and Corporate Secretary. Mr. Miller joined the Company in 2001 and has servedin various positions including VP, Deputy General Counsel, Corporate Secretary, General Counsel for North America and Assistant General Counsel. Mr. Millerserved on the Boards of AES Entek, a joint venture between AES and Koc Holdings in Turkey, from 2010 through 2014; and Silver Ridge Power, a joint venturebetween AES and Riverstone Holdings LLC, from 2008 through July of 2014. Mr. Miller is the chairman of Indianapolis Power and Light Board and DP&L. Mr.Miller also serves as a member of the Board of DPL, Inc. and AES Chivor. Prior to joining AES, he was an attorney with the law firm Chadbourne & Parke, LLP.Mr. Miller received a Bachelor's degree in History and Economics from Boston College and holds a Juris Doctorate from the University of Connecticut School OfLaw.
Thomas M. O'Flynn , 56 years old, has served as EVP and CFO of the Company since September 2012. Previously, Mr. O'Flynn served as Senior Advisorto the Private Equity Group of Blackstone, an investment and advisory group and held this position from 2010 to 2012. During this period, Mr. O'Flynn also servedas COO and CFO of Transmission Developers, Inc. ("TDI"), a Blackstone-controlled company that develops innovative power transmission projects in anenvironmentally responsible manner. From 2001 to 2009, he served as the CFO of PSEG, a New Jersey-based merchant power and utility company. He also servedas President of PSEG Energy Holdings from 2007 to 2009. From 1986 to 2001, Mr. O'Flynn was in the Global Power and Utility Group of Morgan Stanley. Heserved as a Managing Director for his last five years and as head of the North American Power Group from 2000 to 2001. He was responsible for senior clientrelationships and led a number of large merger, financing, restructuring and advisory transactions. Mr. O'Flynn is the chairman of the IPALCO and AES USInvestments Boards and serves as a member of the Boards of DP&L and its parent company, DPL, Inc. Mr. O'Flynn served on the Board of Silver Ridge Power, ajoint venture between AES and Riverstone Holdings LLC from September 2012 through July 2014. He is also currently on the Board of Directors of the NewJersey Performing Arts Center and is Chairman of the Institute for Sustainability and Energy at Northwestern University. Mr. O'Flynn has a BA in Economics fromNorthwestern University and an MBA in Finance from the University of Chicago.
How to Contact AES and Sources of Other Information
Our principal offices are located at 4300 Wilson Boulevard, Arlington, Virginia 22203. Our telephone number is (703) 522-1315. Our website address ishttp://www.aes.com . Our annual reports on Form 10-K, quarterly reports on Form 10-Q and current reports on Form 8-K and any amendments to such reports filedpursuant to Section 13(a) or Section 15(d) of the Securities Exchange Act of 1934 (the "Exchange Act") are posted on our website. After the reports are filed with,or furnished to the SEC, they are available from us free of charge. Material contained on our website is not part of and is not incorporated by reference in thisForm 10-K. You may also read and copy any materials we file with the SEC at the SEC's Public Reference Room at 100 F Street, N.E., Washington, D.C. 20549.You may obtain information about the operation of the Public Reference Room by calling the SEC at 1-800-SEC-0330. The SEC maintains an internet website thatcontains the reports, proxy and information statements and other information that we file electronically with the SEC at www.sec.gov .
Our CEO and our CFO have provided certifications to the SEC as required by Section 302 of the Sarbanes-Oxley Act of 2002. These certifications areincluded as exhibits to this Annual Report on Form 10-K.
Our CEO provided a certification pursuant to Section 303A of the New York Stock Exchange Listed Company Manual on May 26, 2015.
Our Code of Business Conduct ("Code of Conduct") and Corporate Governance Guidelines have been adopted by our Board of Directors. The Code ofConduct is intended to govern, as a requirement of employment, the actions of everyone who works at AES, including employees of our subsidiaries and affiliates.Our Ethics and Compliance Department provides training, information, and certification programs for AES employees related to the Code of Conduct. The Ethicsand
54

Compliance Department also has programs in place to prevent and detect criminal conduct, promote an organizational culture that encourages ethical behavior anda commitment to compliance with the law, and to monitor and enforce AES policies on corruption, bribery, money laundering and associations with terroristsgroups. The Code of Conduct and the Corporate Governance Guidelines are located in their entirety on our website. Any person may obtain a copy of the Code ofConduct or the Corporate Governance Guidelines without charge by making a written request to: Corporate Secretary, The AES Corporation, 4300 WilsonBoulevard, Arlington, VA 22203. If any amendments to, or waivers from, the Code of Conduct or the Corporate Governance Guidelines are made, we will disclosesuch amendments or waivers on our website.
ITEM 1A. RISK FACTORS
You should consider carefully the following risks, along with the other information contained in or incorporated by reference in this Form 10-K. Additionalrisks and uncertainties also may adversely affect our business and operations including those discussed in Item 7.—Management's Discussion and Analysis ofFinancial Condition and Results of Operations in this Form 10-K. If any of the following events actually occur, our business, financial results and financialcondition could be materially adversely affected.
We routinely encounter and address risks, some of which may cause our future results to be different, sometimes materially different, than we presentlyanticipate. The categories of risk we have identified in Item 1A.— Risk Factors of this Form 10-K include the following:
• risks related to our high level of indebtedness;• risks associated with our ability to raise needed capital;• external risks associated with revenue and earnings volatility;• risks associated with our operations; and• risks associated with governmental regulation and laws.
These risk factors should be read in conjunction with Item 7.— Management's Discussion and Analysis of Financial Condition and Results of Operations ,and the Consolidated Financial Statements and related notes included elsewhere in this report.
Risks Related to our High Level of Indebtedness
We have a significant amount of debt, a large percentage of which is secured, which could adversely affect our business and the ability to fulfill ourobligations.
As of December 31, 2015 , we had approximately $20.8 billion of outstanding indebtedness on a consolidated basis. All outstanding borrowings under TheAES Corporation's senior secured credit facility are secured by certain of our assets, including the pledge of capital stock of many of The AES Corporation'sdirectly held subsidiaries. Most of the debt of The AES Corporation's subsidiaries is secured by substantially all of the assets of those subsidiaries. Since we havesuch a high level of debt, a substantial portion of cash flow from operations must be used to make payments on this debt. Furthermore, since a significantpercentage of our assets are used to secure this debt, this reduces the amount of collateral that is available for future secured debt or credit support and reduces ourflexibility in dealing with these secured assets. This high level of indebtedness and related security could have other important consequences to us and ourinvestors, including:
• making it more difficult to satisfy debt service and other obligations at the holding company and/or individual subsidiaries;• increasing the likelihood of a downgrade of our debt, which could cause future debt costs and/or payments to increase under our debt and related hedging
instruments and consume an even greater portion of cash flow;• increasing our vulnerability to general adverse industry and economic conditions, including but not limited to adverse changes in foreign exchange rates
and commodity prices;• reducing the availability of cash flow to fund other corporate purposes and grow our business;• limiting our flexibility in planning for, or reacting to, changes in our business and the industry;• placing us at a competitive disadvantage to our competitors that are not as highly leveraged; and• limiting, along with the financial and other restrictive covenants relating to such indebtedness, among other things, our ability to borrow additional funds as
needed or take advantage of business opportunities as they arise, pay cash dividends or repurchase common stock.
The agreements governing our indebtedness, including the indebtedness of our subsidiaries, limit, but do not prohibit the incurrence of additionalindebtedness. To the extent we become more leveraged, the risks described above would increase. Further, our actual cash requirements in the future may begreater than expected. Accordingly, our cash flows may not be sufficient to repay at maturity all of the outstanding debt as it becomes due and, in that event, wemay not be able to borrow
55

money, sell assets, raise equity or otherwise raise funds on acceptable terms or at all to refinance our debt as it becomes due. See Note 12 —Debt included inItem 8. of this Form 10-K for a schedule of our debt maturities.
The AES Corporation is a holding company and its ability to make payments on its outstanding indebtedness, including its public debt securities, isdependent upon the receipt of funds from its subsidiaries by way of dividends, fees, interest, loans or otherwise.
The AES Corporation is a holding company with no material assets other than the stock of its subsidiaries. All of The AES Corporation's revenue isgenerated through its subsidiaries. Accordingly, almost all of The AES Corporation's cash flow is generated by the operating activities of its subsidiaries.Therefore, The AES Corporation's ability to make payments on its indebtedness and to fund its other obligations is dependent not only on the ability of itssubsidiaries to generate cash, but also on the ability of the subsidiaries to distribute cash to it in the form of dividends, fees, interest, tax sharing payments, loans orotherwise.
However, our subsidiaries face various restrictions in their ability to distribute cash to The AES Corporation. Most of the subsidiaries are obligated, pursuantto loan agreements, indentures or non-recourse financing arrangements, to satisfy certain restricted payment covenants or other conditions before they may makedistributions to The AES Corporation. In addition, the payment of dividends or the making of loans, advances or other payments to The AES Corporation may besubject to other contractual, legal or regulatory restrictions or may be prohibited altogether. Business performance and local accounting and tax rules may limit theamount of retained earnings that may be distributed to us as a dividend. Subsidiaries in foreign countries may also be prevented from distributing funds to The AESCorporation as a result of foreign governments restricting the repatriation of funds or the conversion of currencies. Any right that The AES Corporation has toreceive any assets of any of its subsidiaries upon any liquidation, dissolution, winding up, receivership, reorganization, bankruptcy, insolvency or similarproceedings (and the consequent right of the holders of The AES Corporation's indebtedness to participate in the distribution of, or to realize proceeds from, thoseassets) will be effectively subordinated to the claims of any such subsidiary's creditors (including trade creditors and holders of debt issued by such subsidiary).
The AES Corporation's subsidiaries are separate and distinct legal entities and, unless they have expressly guaranteed any of The AES Corporation'sindebtedness, have no obligation, contingent or otherwise, to pay any amounts due pursuant to such debt or to make any funds available whether by dividends, fees,loans or other payments.
Even though The AES Corporation is a holding company, existing and potential future defaults by subsidiaries or affiliates could adversely affect TheAES Corporation.
We attempt to finance our domestic and foreign projects primarily under loan agreements and related documents which, except as noted below, require theloans to be repaid solely from the project's revenues and provide that the repayment of the loans (and interest thereon) is secured solely by the capital stock,physical assets, contracts and cash flow of that project subsidiary or affiliate. This type of financing is usually referred to as non-recourse debt or "non-recoursefinancing." In some non-recourse financings, The AES Corporation has explicitly agreed to undertake certain limited obligations and contingent liabilities, most ofwhich by their terms will only be effective or will be terminated upon the occurrence of future events. These obligations and liabilities take the form of guarantees,indemnities, letter of credit reimbursement agreements and agreements to pay, in certain circumstances, the project lenders or other parties.
As of December 31, 2015 , we had approximately $20.8 billion of outstanding indebtedness on a consolidated basis, of which approximately $5.0 billion wasrecourse debt of The AES Corporation and approximately $15.8 billion was non-recourse debt. In addition, we have outstanding guarantees, indemnities, letters ofcredit, and other credit support commitments which are further described in this Form 10-K in Item 7.— Management's Discussion and Analysis of FinancialCondition and Results of Operations — Capital Resources and Liquidity — Parent Company Liquidity .
Some of our subsidiaries are currently in default with respect to all or a portion of their outstanding indebtedness. The total debt classified as current in ourConsolidated Balance Sheets related to such defaults was $1.0 billion as of December 31, 2015 . While the lenders under our non-recourse financings generally donot have direct recourse to The AES Corporation (other than to the extent of any credit support given by The AES Corporation), defaults thereunder can still haveimportant consequences for The AES Corporation, including, without limitation:
• reducing The AES Corporation's receipt of subsidiary dividends, fees, interest payments, loans and other sources of cash since the project subsidiary willtypically be prohibited from distributing cash to The AES Corporation during the pendency of any default;
• under certain circumstances, triggering The AES Corporation's obligation to make payments under any financial guarantee, letter of credit or other creditsupport which The AES Corporation has provided to or on behalf of such subsidiary;
• causing The AES Corporation to record a loss in the event the lender forecloses on the assets;
56
• triggering defaults in The AES Corporation's outstanding debt and trust preferred securities. For example, The AES Corporation's senior secured creditfacility and outstanding senior notes include events of default for certain bankruptcy related events involving material subsidiaries. In addition, The AESCorporation's senior secured credit facility includes certain events of default relating to accelerations of outstanding material debt of material subsidiariesor any subsidiaries that in the aggregate constitute a material subsidiary;
• the loss or impairment of investor confidence in the Company; or• foreclosure on the assets that are pledged under the non-recourse loans, therefore eliminating any and all potential future benefits derived from those
assets.
None of the projects that are currently in default are owned by subsidiaries that individually or in the aggregate meet the applicable standard of materiality inThe AES Corporation's senior secured credit facility or other debt agreements in order for such defaults to trigger an event of default or permit acceleration undersuch indebtedness. However, as a result of future mix of distributions, write-down of assets, dispositions and other matters that affect our financial position andresults of operations, it is possible that one or more of these subsidiaries, individually or in the aggregate, could fall within the applicable standard of materialityand thereby upon an acceleration of such subsidiary's debt, trigger an event of default and possible acceleration of the indebtedness under The AES Corporation'ssenior secured credit facility or other indebtedness of The AES Corporation.
Risks Associated with our Ability to Raise Needed Capital
The AES Corporation, or the Parent Company, has significant cash requirements and limited sources of liquidity.
The AES Corporation requires cash primarily to fund:
• principal repayments of debt;• interest and preferred dividends;• acquisitions;• construction and other project commitments;• other equity commitments, including business development investments;• equity repurchases and/or cash dividends on our common stock;• taxes; and• Parent Company overhead costs.
The AES Corporation's principal sources of liquidity are:
• dividends and other distributions from its subsidiaries;• proceeds from debt and equity financings at the Parent Company level; and• proceeds from asset sales.
For a more detailed discussion of The AES Corporation's cash requirements and sources of liquidity, please see Item 7.— Management's Discussion andAnalysis of Financial Condition and Results of Operations — Capital Resources and Liquidity in this Form 10-K.
While we believe that these sources will be adequate to meet our obligations at the Parent Company level for the foreseeable future, this belief is based on anumber of material assumptions, including, without limitation, assumptions about our ability to access the capital or commercial lending markets, the operating andfinancial performance of our subsidiaries, exchange rates, our ability to sell assets, and the ability of our subsidiaries to pay dividends. Any number of assumptionscould prove to be incorrect, and, therefore there can be no assurance that these sources will be available when needed or that our actual cash requirements will notbe greater than expected. For example, in recent years, certain financial institutions have gone bankrupt. In the event that a bank who is party to our senior securedcredit facility or other facilities goes bankrupt or is otherwise unable to fund its commitments, we would need to replace that bank in our syndicate or risk areduction in the size of the facility, which would reduce our liquidity. In addition, our cash flow may not be sufficient to repay at maturity the entire principaloutstanding under our credit facility and our debt securities and we may have to refinance such obligations. There can be no assurance that we will be successful inobtaining such refinancing on terms acceptable to us or at all and any of these events could have a material effect on us.
Our ability to grow our business could be materially adversely affected if we were unable to raise capital on favorable terms.
From time to time, we rely on access to capital markets as a source of liquidity for capital requirements not satisfied by operating cash flows. Our ability toarrange for financing on either a recourse or non-recourse basis and the costs of such capital are dependent on numerous factors, some of which are beyond ourcontrol, including:
57

• general economic and capital market conditions;• the availability of bank credit;• investor confidence;• the financial condition, performance and prospects of The AES Corporation in general and/or that of any subsidiary requiring the financing as well as
companies in our industry or similar financial circumstances; and• changes in tax and securities laws which are conducive to raising capital.
Should future access to capital not be available to us, we may have to sell assets or decide not to build new plants or expand or improve existing facilities,either of which would affect our future growth, results of operations or financial condition.
A downgrade in the credit ratings of The AES Corporation or its subsidiaries could adversely affect our ability to access the capital markets which couldincrease our interest costs or adversely affect our liquidity and cash flow.
If any of the credit ratings of The AES Corporation or its subsidiaries were to be downgraded, our ability to raise capital on favorable terms could beimpaired and our borrowing costs could increase. Furthermore, depending on The AES Corporation's credit ratings and the trading prices of its equity and debtsecurities, counterparties may no longer be as willing to accept general unsecured commitments by The AES Corporation to provide credit support. Accordingly,with respect to both new and existing commitments, The AES Corporation may be required to provide some other form of assurance, such as a letter of creditand/or collateral, to backstop or replace any credit support by The AES Corporation. There can be no assurance that such counterparties will accept such guaranteesor that AES could arrange such further assurances in the future. In addition, to the extent The AES Corporation is required and able to provide letters of credit orother collateral to such counterparties, it will limit the amount of credit available to The AES Corporation to meet its other liquidity needs.
We may not be able to raise sufficient capital to fund developing projects in certain less developed economies which could change or in some casesadversely affect our growth strategy.
Part of our strategy is to grow our business by developing businesses in less developed economies where the return on our investment may be greater thanprojects in more developed economies. Commercial lending institutions sometimes refuse to provide non-recourse project financing in certain less developedeconomies, and in these situations we have sought and will continue to seek direct or indirect (through credit support or guarantees) project financing from alimited number of multilateral or bilateral international financial institutions or agencies. As a precondition to making such project financing available, the lendinginstitutions may also require governmental guarantees of certain project and sovereign related risks. There can be no assurance, however, that project financingfrom the international financial agencies or that governmental guarantees will be available when needed, and if they are not, we may have to abandon the project orinvest more of our own funds which may not be in line with our investment objectives and would leave less funds for other projects.
External Risks Associated with Revenue and Earnings Volatility
Our businesses may incur substantial costs and liabilities and be exposed to price volatility as a result of risks associated with the wholesale electricitymarkets, which could have a material adverse effect on our financial performance.
Some of our businesses sell electricity in the spot markets in cases where they operate at levels in excess of their power sales agreements or retail loadobligations. Our businesses may also buy electricity in the wholesale spot markets. As a result, we are exposed to the risks of rising and falling prices in thosemarkets. The open market wholesale prices for electricity can be volatile and often reflect the fluctuating cost of fuels such as coal, natural gas or oil derivativefuels in addition to other factors described below. Consequently, any changes in the supply and cost of coal, natural gas, or oil derivative fuels may impact the openmarket wholesale price of electricity.
Volatility in market prices for fuel and electricity may result from among other things:• plant availability in the markets generally;• availability and effectiveness of transmission facilities owned and operated by third parties;• competition;• electricity usage;• seasonality;• foreign exchange rate fluctuation;• availability and price of emission credits;• hydrology and other weather conditions;• illiquid markets;• transmission or transportation constraints or inefficiencies;
58

• availability of competitively priced renewables sources;• increased adoption of distributed generation;• available supplies of natural gas, crude oil and refined products, and coal;• generating unit performance;• natural disasters, terrorism, wars, embargoes, and other catastrophic events;• energy, market and environmental regulation, legislation and policies;• geopolitical concerns affecting global supply of oil and natural gas;• general economic conditions in areas where we operate which impact energy consumption; and• bidding behavior and market bidding rules.
Our financial position and results of operations may fluctuate significantly due to fluctuations in currency exchange rates experienced at our foreignoperations.
Our exposure to currency exchange rate fluctuations results primarily from the translation exposure associated with the preparation of the ConsolidatedFinancial Statements, as well as from transaction exposure associated with transactions in currencies other than an entity's functional currency. While theConsolidated Financial Statements are reported in U.S. Dollars, the financial statements of many of our subsidiaries outside the U.S. are prepared using the localcurrency as the functional currency and translated into U.S. Dollars by applying appropriate exchange rates. As a result, fluctuations in the exchange rate of theU.S. Dollar relative to the local currencies where our subsidiaries outside the U.S. report could cause significant fluctuations in our results. In addition, while ourexpenses with respect to foreign operations are generally denominated in the same currency as corresponding sales, we have transaction exposure to the extentreceipts and expenditures are not denominated in the subsidiary's functional currency. Moreover, the costs of doing business abroad may increase as a result ofadverse exchange rate fluctuations. Our financial position and results of operations could be affected by fluctuations in the value of a number of currencies. SeeItem 7A. —Quantitative and Qualitative Disclosures about Market Risk to this Form 10-K for further information.
We may not be adequately hedged against our exposure to changes in commodity prices or interest rates.
We routinely enter into contracts to hedge a portion of our purchase and sale commitments for electricity, fuel requirements and other commodities to lowerour financial exposure related to commodity price fluctuations. As part of this strategy, we routinely utilize fixed price or indexed forward physical purchase andsales contracts, futures, financial swaps, and option contracts traded in the over-the-counter markets or on exchanges. We also enter into contracts which help usmanage our interest rate exposure. However, we may not cover the entire exposure of our assets or positions to market price or interest rate volatility, and thecoverage will vary over time. Furthermore, the risk management practices we have in place may not always perform as planned. In particular, if prices ofcommodities or interest rates significantly deviate from historical prices or interest rates or if the price or interest rate volatility or distribution of these changesdeviates from historical norms, our risk management practices may not protect us from significant losses. As a result, fluctuating commodity prices or interest ratesmay negatively impact our financial results to the extent we have unhedged or inadequately hedged positions. In addition, certain types of economic hedgingactivities may not qualify for hedge accounting under U.S. GAAP, resulting in increased volatility in our net income. The Company may also suffer lossesassociated with "basis risk" which is the difference in performance between the hedge instrument and the targeted underlying exposure. Furthermore, there is a riskthat the current counterparties to these arrangements may fail or are unable to perform part or all of their obligations under these arrangements.
Our coal-fired facilities in the US continue to face substantial challenges as a result of high coal prices relative to natural gas, particularly those which aremerchant plants that are exposed to market risk and those that have hybrid merchant risk, meaning those businesses that have a PPA in place but purchase fuel atmarket prices or under short term contracts. For our businesses with PPA pricing that does not perfectly pass through our fuel costs, the businesses attempt tomanage the exposure through flexible fuel purchasing and timing of entry and terms of our fuel supply agreements; however, these risk management efforts maynot be successful and the resulting commodity exposure could have a material impact on these businesses and/or our results of operations.
Supplier and/or customer concentration may expose the Company to significant financial credit or performance risks.
We often rely on a single contracted supplier or a small number of suppliers for the provision of fuel, transportation of fuel and other services required for theoperation of certain of our facilities. If these suppliers cannot perform, we would seek to meet our fuel requirements by purchasing fuel at market prices, exposingus to market price volatility and the risk that fuel and transportation may not be available during certain periods at any price, which could adversely impact theprofitability of the affected business and our results of operations, and could result in a breach of agreements with other counterparties, including, withoutlimitation, offtakers or lenders.
59

At times, we rely on a single customer or a few customers to purchase all or a significant portion of a facility's output, in some cases under long-termagreements that account for a substantial percentage of the anticipated revenue from a given facility. We have also hedged a portion of our exposure to power pricefluctuations through forward fixed price power sales. Counterparties to these agreements may breach or may be unable to perform their obligations. We may not beable to enter into replacement agreements on terms as favorable as our existing agreements, or at all. If we were unable to enter into replacement PPAs, thesebusinesses may have to sell power at market prices. A breach by a counterparty of a PPA or other agreement could also result in the breach of other agreements,including, without limitation, the debt documents of the affected business.
The failure of any supplier or customer to fulfill its contractual obligations to The AES Corporation or our subsidiaries could have a material adverse effecton our financial results. Consequently, the financial performance of our facilities is dependent on the credit quality of, and continued performance by, suppliers andcustomers.
The market pricing of our common stock has been volatile and may continue to be volatile in future periods.
The market price for our common stock has been volatile in the past, and the price of our common stock could fluctuate substantially in the future. Stockprice movements on a quarter-by-quarter basis for the past two years are presented in Item 5.— Market — Market Information of this Form 10-K. Factors thatcould affect the price of our common stock in the future include general conditions in our industry, in the power markets in which we participate and in the world,including environmental and economic developments, over which we have no control, as well as developments specific to us, including, risks that could result inrevenue and earnings volatility as well as other risk factors described in Item 1A.— Risk Factors and those matters described in Item 7.— Management'sDiscussion and Analysis of Financial Conditions and Results of Operations .
Risks Associated with our Operations
We do a significant amount of business outside the United States, including in developing countries, which presents significant risks.
A significant amount of our revenue is generated outside the United States and a significant portion of our international operations is conducted indeveloping countries. Part of our growth strategy is to expand our business in certain developing countries in which AES has an existing presence as such countriesmay have higher growth rates and offer greater opportunities to expand from our platforms, with potentially higher returns than in some more developed countries.International operations, particularly the operation, financing and development of projects in developing countries, entail significant risks and uncertainties,including, without limitation:
• economic, social and political instability in any particular country or region;• adverse changes in currency exchange rates;• government restrictions on converting currencies or repatriating funds;• unexpected changes in foreign laws and regulations or in trade, monetary or fiscal policies;• high inflation and monetary fluctuations;• restrictions on imports of coal, oil, gas or other raw materials required by our generation businesses to operate;• threatened or consummated expropriation or nationalization of our assets by foreign governments;• risks relating to the failure to comply with the U.S. Foreign Corrupt Practices Act, United Kingdom Bribery Act or other anti-bribery laws applicable to our
operations;• difficulties in hiring, training and retaining qualified personnel, particularly finance and accounting personnel with GAAP expertise;• unwillingness of governments and their agencies, similar organizations or other counterparties to honor their contracts;• unwillingness of governments, government agencies, courts or similar bodies to enforce contracts that are economically advantageous to subsidiaries of the
Company and economically unfavorable to counterparties, against such counterparties, whether such counterparties are governments or private parties;• inability to obtain access to fair and equitable political, regulatory, administrative and legal systems;• adverse changes in government tax policy;• difficulties in enforcing our contractual rights or enforcing judgments or obtaining a favorable result in local jurisdictions; and• potentially adverse tax consequences of operating in multiple jurisdictions.
Any of these factors, by itself or in combination with others, could materially and adversely affect our business, results of operations and financial condition.Our operations may experience volatility in revenues and operating margin which have caused and are expected to cause significant volatility in our results ofoperations and cash flows. The volatility is caused by regulatory and economic difficulties, political instability and currency devaluations being experienced inmany of these
60

countries. This volatility reduces the predictability and enhances the uncertainty associated with cash flows from these businesses. A number of our businesses arefacing challenges associated with regulatory changes.
The operation of power generation, distribution and transmission facilities involves significant risks that could adversely affect our financial results. Weand/or our subsidiaries may not have adequate risk mitigation and/or insurance coverage for liabilities.
We are in the business of generating and distributing electricity, which involves certain risks that can adversely affect financial and operating performance,including:
• changes in the availability of our generation facilities or distribution systems due to increases in scheduled and unscheduled plant outages, equipmentfailure, failure of transmission systems, labor disputes, disruptions in fuel supply, poor hydrologic and wind conditions, inability to comply withregulatory or permit requirements or catastrophic events such as fires, floods, storms, hurricanes, earthquakes, dam failures, explosions, terrorist acts,cyber attacks or other similar occurrences; and
• changes in our operating cost structure including, but not limited to, increases in costs relating to gas, coal, oil and other fuel; fuel transportation;purchased electricity; operations, maintenance and repair; environmental compliance, including the cost of purchasing emissions offsets and capitalexpenditures to install environmental emission equipment; transmission access; and insurance.
Our businesses require reliable transportation sources (including related infrastructure such as roads, ports and rail), power sources and water sources toaccess and conduct operations. The availability and cost of this infrastructure affects capital and operating costs and levels of production and sales. Limitations, orinterruptions in this infrastructure or at the facilities of our subsidiaries, including as a result of third parties intentionally or unintentionally disrupting thisinfrastructure or the facilities of our subsidiaries, could impede their ability to produce electricity. This could have a material adverse effect on our businesses'results of operations, financial condition and prospects.
In addition, a portion of our generation facilities were constructed many years ago. Older generating equipment may require significant capital expendituresfor maintenance. The equipment at our plants, whether old or new, is also likely to require periodic upgrading, improvement or repair, and replacement equipmentor parts may be difficult to obtain in circumstances where we rely on a single supplier or a small number of suppliers. The inability to obtain replacementequipment or parts may impact the ability of our plants to perform and could, therefore, have a material impact on our business and results of operations.Breakdown or failure of one of our operating facilities may prevent the facility from performing under applicable power sales agreements which, in certainsituations, could result in termination of a power purchase or other agreement or incurrence of a liability for liquidated damages and/or other penalties.
As a result of the above risks and other potential hazards associated with the power generation, distribution and transmission industries, we may from time totime become exposed to significant liabilities for which we may not have adequate risk mitigation and/or insurance coverage. Power generation involves hazardousactivities, including acquiring, transporting and unloading fuel, operating large pieces of rotating equipment and delivering electricity to transmission anddistribution systems. In addition to natural risks, such as earthquakes, floods, lightning, hurricanes and wind, hazards, such as fire, explosion, collapse andmachinery failure, are inherent risks in our operations which may occur as a result of inadequate internal processes, technological flaws, human error or actions ofthird parties or other external events. The control and management of these risks depend upon adequate development and training of personnel and on the existenceof operational procedures, preventative maintenance plans and specific programs supported by quality control systems which reduce, but do not eliminate, thepossibility of the occurrence and impact of these risks.
The hazards described above, along with other safety hazards associated with our operations, can cause significant personal injury or loss of life, severedamage to and destruction of property, plant and equipment, contamination of, or damage to, the environment and suspension of operations. The occurrence of anyone of these events may result in our being named as a defendant in lawsuits asserting claims for substantial damages, environmental cleanup costs, personal injuryand fines and/or penalties. We maintain an amount of insurance protection that we believe is customary, but there can be no assurance that our insurance will besufficient or effective under all circumstances and against all hazards or liabilities to which we may be subject. A claim for which we are not fully insured orinsured at all could hurt our financial results and materially harm our financial condition. Further, due to the cyclical nature of the insurance markets, we cannotprovide assurance that insurance coverage will continue to be available on terms similar to those presently available to us or at all. Any losses not covered byinsurance could have a material adverse effect on our financial condition, results of operations or cash flows.
Our businesses' insurance does not cover every potential risk associated with its operations. Adequate coverage at reasonable rates is not always obtainable.In addition, insurance may not fully cover the liability or the consequences of any business interruptions such as equipment failure or labor dispute. The occurrenceof a significant adverse event not fully or partially covered by insurance could have a material adverse effect on the Company's business, results or operations,financial condition and prospects.
61
Any of the above risks could have a material adverse effect on our business and results of operations.
Our inability to attract and retain skilled people could have a material adverse effect on our operations.
Our operating success and ability to carry out growth initiatives depends in part on our ability to retain executives and to attract and retain additionalqualified personnel who have experience in our industry and in operating a company of our size and complexity, including people in our foreign businesses. Theinability to attract and retain qualified personnel could have a material adverse effect on our business, because of the difficulty of promptly finding qualifiedreplacements. For example, we routinely are required to assess the financial impacts of complicated business transactions which occur on a worldwide basis. Theseassessments are dependent on hiring personnel on a worldwide basis with sufficient expertise in U.S. GAAP to timely and accurately comply with U.S. reportingobligations. An inability to maintain adequate internal accounting and managerial controls and hire and retain qualified personnel could have an adverse effect onour financial and tax reporting.
We have contractual obligations to certain customers to provide full requirements service, which makes it difficult to predict and plan for loadrequirements and may result in increased operating costs to certain of our businesses.
We have contractual obligations to certain customers to supply power to satisfy all or a portion of their energy requirements. The uncertainty regarding theamount of power that our power generation and distribution facilities must be prepared to supply to customers may increase our operating costs. A significantunder- or over-estimation of load requirements could result in our facilities not having enough or having too much power to cover their obligations, in which casewe would be required to buy or sell power from or to third parties at prevailing market prices. Those prices may not be favorable and thus could increase ouroperating costs.
We may not be able to enter into long-term contracts, which reduce volatility in our results of operations. Even when we successfully enter into long-termcontracts, our generation businesses are often dependent on one or a limited number of customers and a limited number of fuel suppliers.
Many of our generation plants conduct business under long-term sales and supply contracts, which helps these businesses to manage risks by reducing thevolatility associated with power and input costs and providing a stable revenue and cost structure. In these instances, we rely on power sales contracts with one or alimited number of customers for the majority of, and in some cases all of, the relevant plant's output and revenues over the term of the power sales contract. Theremaining terms of the power sales contracts of our generation plants range from one to 25 years. In many cases, we also limit our exposure to fluctuations in fuelprices by entering into long-term contracts for fuel with a limited number of suppliers. In these instances, the cash flows and results of operations are dependent onthe continued ability of customers and suppliers to meet their obligations under the relevant power sales contract or fuel supply contract, respectively. Some of ourlong-term power sales agreements are at prices above current spot market prices and some of our long-term fuel supply contracts are at prices below current marketprices. The loss of significant power sales contracts or fuel supply contracts, or the failure by any of the parties to such contracts that prevents us from fulfilling ourobligations thereunder, could adversely impact our strategy by resulting in costs that exceed revenue, which could have a material adverse impact on our business,results of operations and financial condition. In addition, depending on market conditions and regulatory regimes, it may be difficult for us to secure long-termcontracts, either where our current contracts are expiring or for new development projects. The inability to enter into long-term contracts could require many of ourbusinesses to purchase inputs at market prices and sell electricity into spot markets, which may not be favorable.
We have sought to reduce counterparty credit risk under our long-term contracts in part by entering into power sales contracts with utilities or othercustomers of strong credit quality and by obtaining guarantees from certain sovereign governments of the customer's obligations. However, many of our customersdo not have, or have failed to maintain, an investment-grade credit rating, and our generation business cannot always obtain government guarantees and if they do,the government does not always have an investment grade credit rating. We have also sought to reduce our credit risk by locating our plants in different geographicareas in order to mitigate the effects of regional economic downturns. However, there can be no assurance that our efforts to mitigate this risk will be successful.
Competition is increasing and could adversely affect us.
The power production markets in which we operate are characterized by numerous strong and capable competitors, many of whom may have extensive anddiversified developmental or operating experience (including both domestic and international) and financial resources similar to or greater than ours. Further, inrecent years, the power production industry has been characterized by strong and increasing competition with respect to both obtaining power sales agreements andacquiring existing power generation assets. In certain markets, these factors have caused reductions in prices contained in new power sales agreements and, inmany cases, have caused higher acquisition prices for existing assets through competitive bidding practices. The evolution of competitive electricity markets andthe development of highly efficient gas-fired power plants have also caused, or are anticipated to cause, price pressure in certain power markets where we sell orintend to sell power. These competitive factors could have a material adverse effect on us.
62

Some of our subsidiaries participate in defined benefit pension plans and their net pension plan obligations may require additional significantcontributions.
Certain of our subsidiaries have defined benefit pension plans covering substantially all of their respective employees. Of the thirty one such defined benefitplans, five are at U.S. subsidiaries and the remaining plans are at foreign subsidiaries. Pension costs are based upon a number of actuarial assumptions, including anexpected long-term rate of return on pension plan assets, the expected life span of pension plan beneficiaries and the discount rate used to determine the presentvalue of future pension obligations. Any of these assumptions could prove to be wrong, resulting in a shortfall of pension plan assets compared to pensionobligations under the pension plan. The Company periodically evaluates the value of the pension plan assets to ensure that they will be sufficient to fund therespective pension obligations. The Company's exposure to market volatility is mitigated to some extent due to the fact that the asset allocations in our largest plansinclude a significant weighting of investments in fixed income securities that are less volatile than investments in equity securities. Future downturns in the debtand/or equity markets, or the inaccuracy of any of our significant assumptions underlying the estimates of our subsidiaries' pension plan obligations, could result inan increase in pension expense and future funding requirements, which may be material. Our subsidiaries who participate in these plans are responsible forsatisfying the funding requirements required by law in their respective jurisdiction for any shortfall of pension plan assets compared to pension obligations underthe pension plan. This may necessitate additional cash contributions to the pension plans that could adversely affect the Parent Company and our subsidiaries'liquidity.
For additional information regarding the funding position of the Company's pension plans, see Item 7.— Management's Discussion and Analysis of FinancialCondition and Results of Operations — Critical Accounting Policies and Estimates — Pension and Other Postretirement Plans and Note 15— Benefit Plansincluded in Item 8.— Financial Statements and Supplementary Data included in this Form 10-K.
Our business is subject to substantial development uncertainties.
Certain of our subsidiaries and affiliates are in various stages of developing and constructing power plants, some but not all of which have signed long-termcontracts or made similar arrangements for the sale of electricity. Successful completion depends upon overcoming substantial risks, including, but not limited to,risks relating to siting, financing, engineering and construction, permitting, governmental approvals, commissioning delays, or the potential for termination of thepower sales contract as a result of a failure to meet certain milestones. For additional information regarding our projects under construction see, Item 1.— Business— Our Organization and Segments included in this Form 10-K.
In certain cases, our subsidiaries may enter into obligations in the development process even though the subsidiaries have not yet secured financing, powerpurchase arrangements, or other aspects of the development process. For example, in certain cases, our subsidiaries may instruct contractors to begin theconstruction process or seek to procure equipment even where they do not have financing or a power purchase agreement in place (or conversely, to enter into apower purchase, procurement or other agreement without financing in place). If the project does not proceed, our subsidiaries may remain obligated for certainliabilities even though the project will not proceed. Development is inherently uncertain and we may forgo certain development opportunities and we mayundertake significant development costs before determining that we will not proceed with a particular project. We believe that capitalized costs for projects underdevelopment are recoverable; however, there can be no assurance that any individual project will be completed and reach commercial operation. If thesedevelopment efforts are not successful, we may abandon a project under development and write off the costs incurred in connection with such project. At the timeof abandonment, we would expense all capitalized development costs incurred in connection therewith and could incur additional losses associated with any relatedcontingent liabilities.
In some of our joint venture projects and businesses, we have granted protective rights to minority shareholders or we own less than a majority of theequity in the project or business and do not manage or otherwise control the project or business, which entails certain risks.
We have invested in some joint ventures where our subsidiaries share operational, management, investment and/or other control rights with our joint venturepartners. In many cases, we may exert influence over the joint venture pursuant to a management contract, by holding positions on the board of the joint venturecompany or on management committees and/or through certain limited governance rights, such as rights to veto significant actions. However, we do not alwayshave this type of influence over the project or business in every instance and we may be dependent on our joint venture partners or the management team of thejoint venture to operate, manage, invest or otherwise control such projects or businesses. Our joint venture partners or the management team of our joint venturesmay not have the level of experience, technical expertise, human resources, management and other attributes necessary to operate these projects or businessesoptimally, and they may not share our business priorities. In some joint venture agreements where we do have majority control of the voting securities, we haveentered into shareholder agreements granting protective minority rights to the other shareholders.
The approval of joint venture partners also may be required for us to receive distributions of funds from jointly owned entities or to transfer our interest inprojects or businesses. The control or influence exerted by our joint venture partners may
63

result in operational management and/or investment decisions which are different from the decisions our subsidiaries would make if they operated independentlyand could impact the profitability and value of these joint ventures. In addition, in the event that a joint venture partner becomes insolvent or bankrupt or isotherwise unable to meet its obligations to the joint venture or its share of liabilities at the joint venture, we may be subject to joint and several liability for thesejoint ventures, if and to the extent provided for in our governing documents or applicable law.
Our renewable energy projects and other initiatives face considerable uncertainties including, development, operational and regulatory challenges.
Wind generation, our solar projects and our investments in projects such as energy storage are subject to substantial risks. Projects of this nature have beendeveloped through advancement in technologies which may not be proven or whose commercial application is limited, and which are unrelated to our corebusiness. Some of these business lines are dependent upon favorable regulatory incentives to support continued investment, and there is significant uncertaintyabout the extent to which such favorable regulatory incentives will be available in the future.
Furthermore, production levels for our wind and solar projects may be dependent upon adequate wind or sunlight resulting in volatility in production levelsand profitability. For example, for our wind projects, wind resource estimates are based on historical experience when available and on wind resource studiesconducted by an independent engineer, and are not expected to reflect actual wind energy production in any given year.
As a result, these types of renewable energy projects face considerable risk relative to our core business, including the risk that favorable regulatory regimesexpire or are adversely modified. In addition, because certain of these projects depend on technology outside of our expertise in generation and utility businesses,there are risks associated with our ability to develop and manage such projects profitably. Furthermore, at the development or acquisition stage, because of thenascent nature of these industries or the limited experience with the relevant technologies, our ability to predict actual performance results may be hindered and theprojects may not perform as predicted. There are also risks associated with the fact that some of these projects exist in markets where long-term fixed pricecontracts for the major cost and revenue components may be unavailable, which in turn may result in these projects having relatively high levels of volatility. Evenwhere available, many of our renewable projects sell power under a Feed-in-Tariff, which may be eliminated or reduced, which can impact the profitability of theseprojects, or make money through the sale of Emission Reductions products, such as Certified Emissions Reductions, Renewable Energy Certificates or RenewableObligation Certificates, and the price of these products may be volatile.
These projects can be capital-intensive and generally are designed with a view to obtaining third party financing, which may be difficult to obtain. As aresult, these capital constraints may reduce our ability to develop these projects or obtain third party financing for these projects. These risks may be exacerbatedby the current global economic crisis, including our management's increased focus on liquidity, which may also result in slower growth in the number of projectswe can pursue. The economic downturn could also impact the value of our assets in these countries and our ability to develop these projects. If the value of theseassets decline, this could result in a material impairment or a series of impairments which are material in the aggregate, which would adversely affect our financialstatements.
Impairment of goodwill or long-lived assets would negatively impact our consolidated results of operations and net worth.
As of December 31, 2015 , the Company had approximately $1.2 billion of goodwill, which represented approximately 3.1% of the total assets on itsConsolidated Balance Sheets. Goodwill is not amortized, but is evaluated for impairment at least annually, or more frequently if impairment indicators are present.We may be required to evaluate the potential impairment of goodwill outside of the required annual evaluation process if we experience situations, including butnot limited to: deterioration in general economic conditions, or our operating or regulatory environment; increased competitive environment; increase in fuel costs,particularly when we are unable to pass through the impact to customers; negative or declining cash flows; loss of a key contract or customer, particularly when weare unable to replace it on equally favorable terms; divestiture of a significant component of our business; or adverse actions or assessments by a regulator. Thesetypes of events and the resulting analyses could result in goodwill impairment, which could substantially affect our results of operations for those periods.Additionally, goodwill may be impaired if our acquisitions do not perform as expected. See the risk factor Our acquisitions may not perform as expected for furtherdiscussion.
Long-lived assets are initially recorded at fair value and are amortized or depreciated over their estimated useful lives. Long-lived assets are evaluated forimpairment only when impairment indicators are present whereas goodwill is evaluated for impairment on an annual basis or more frequently if potentialimpairment indicators are present. Otherwise, the recoverability assessment of long-lived assets is similar to the potential impairment evaluation of goodwillparticularly as it relates to the identification of potential impairment indicators, and making estimates and assumptions to determine fair value, as described above.
64

Certain of our businesses are sensitive to variations in weather.
Our businesses are affected by variations in general weather patterns and unusually severe weather. Our businesses forecast electric sales on the basis ofnormal weather, which represents a long-term historical average. While we also consider possible variations in normal weather patterns and potential impacts onour facilities and our businesses, there can be no assurance that such planning can prevent these impacts, which can adversely affect our business. Generally,demand for electricity peaks in winter and summer. Typically, when winters are warmer than expected and summers are cooler than expected, demand for energy islower, resulting in less demand for electricity than forecasted. Significant variations from normal weather where our businesses are located could have a materialimpact on our results of operations.
In addition, we are dependent upon hydrological conditions prevailing from time to time in the broad geographic regions in which our hydroelectricgeneration facilities are located. If hydrological conditions result in droughts or other conditions that negatively affect our hydroelectric generation business, ourresults of operations could be materially adversely affected.
Information security breaches could harm our business.
A security breach of our information technology systems or plant control systems used to manage and monitor operations could impact the reliability of ourgeneration fleets and/or the reliability of our transmission and distribution systems. A security breach that impairs our technology infrastructure could disruptnormal business operations and affect our ability to control our transmission and distribution assets, access customer information and limit our communicationswith third parties. Our security measures may not prevent such security breaches. Any loss or corruption of confidential or proprietary data through a breach couldimpair our reputation, expose us to legal claims, or impact our ability to make collections or otherwise impact our operations, and materially adversely affect ourbusiness and results of operations.
Our acquisitions may not perform as expected.
Historically, acquisitions have been a significant part of our growth strategy. We may continue to grow our business through acquisitions. Although acquiredbusinesses may have significant operating histories, we will have a limited or no history of owning and operating many of these businesses and possibly limited orno experience operating in the country or region where these businesses are located. Some of these businesses may have been government owned and some may beoperated as part of a larger integrated utility prior to their acquisition. If we were to acquire any of these types of businesses, there can be no assurance that:
• we will be successful in transitioning them to private ownership;• such businesses will perform as expected;• integration or other one-time costs will not be greater than expected;• we will not incur unforeseen obligations or liabilities;• such businesses will generate sufficient cash flow to support the indebtedness incurred to acquire them or the capital expenditures needed to develop
them; or• the rate of return from such businesses will justify our decision to invest capital to acquire them.
Risks associated with Governmental Regulation and Laws
Our operations are subject to significant government regulation and our business and results of operations could be adversely affected by changes in thelaw or regulatory schemes.
Our ability to predict, influence or respond appropriately to changes in law or regulatory schemes, including any ability to obtain expected or contractedincreases in electricity tariff or contract rates or tariff adjustments for increased expenses, could adversely impact our results of operations or our ability to meetpublicly announced projections or analysts' expectations. Furthermore, changes in laws or regulations or changes in the application or interpretation of regulatoryprovisions in jurisdictions where we operate, particularly at our utilities where electricity tariffs are subject to regulatory review or approval, could adversely affectour business, including, but not limited to:
• changes in the determination, definition or classification of costs to be included as reimbursable or pass-through costs to be included in the rates wecharge our customers, including but not limited to costs incurred to upgrade our power plants to comply with more stringent environmental regulations;
• changes in the determination of what is an appropriate rate of return on invested capital or a determination that a utility's operating income or the rates itcharges customers are too high, resulting in a reduction of rates or consumer rebates;
• changes in the definition or determination of controllable or non-controllable costs;• adverse changes in tax law;
65

• changes in law or regulation which limit or otherwise affect the ability of our counterparties (including sovereign or private parties) to fulfill theirobligations (including payment obligations) to us or our subsidiaries;
• changes in environmental law which impose additional costs or limit the dispatch of our generating facilities within our subsidiaries;• changes in the definition of events which may or may not qualify as changes in economic equilibrium;• changes in the timing of tariff increases;• other changes in the regulatory determinations under the relevant concessions;• other changes related to licensing or permitting which affect our ability to conduct business; or• other changes that impact the short or long term price-setting mechanism in the markets where we operate.
Any of the above events may result in lower margins for the affected businesses, which can adversely affect our business.
In many countries where we conduct business, the regulatory environment is constantly changing and it may be difficult to predict the impact of theregulations on our businesses. On July 21, 2010, President Obama signed the Dodd-Frank Act. While the bulk of regulations contained in the Dodd-Frank Actregulate financial institutions and their products, there are several provisions related to corporate governance, executive compensation, disclosure and other matterswhich relate to public companies generally. The types of provisions described above are currently not expected to have a material impact on the Company or itsresults of operations. Furthermore, while the Dodd-Frank Act substantially expands the regulation regarding the trading, clearing and reporting of derivativetransactions, the Dodd-Frank Act provides for commercial end-user exemptions which may apply to our derivative transactions. However, even with theexemption, the Dodd-Frank Act could still have a material adverse impact on the Company, as the regulation of derivatives (which includes capital and marginrequirements for non-exempt companies), could limit the availability of derivative transactions that we use to reduce interest rate, commodity and currency risks,which would increase our exposure to these risks. Even if derivative transactions remain available, the costs to enter into these transactions may increase, whichcould adversely (1) affect the operating results of certain projects; (2) cause us to default on certain types of contracts where we are contractually obligated tohedge certain risks, such as project financing agreements; (3) prevent us from developing new projects where interest rate hedging is required; (4) cause theCompany to abandon certain of its hedging strategies and transactions, thereby increasing our exposure to interest rate, commodity and currency risk; (5) and/orconsume substantial liquidity by forcing the Company to post cash and/or other permitted collateral in support of these derivatives. In addition to the Dodd-FrankAct, in 2012, the EMIR became effective. EMIR includes regulations related to the trading, reporting and clearing of derivatives and the impacts described abovecould also result from our (or our subsidiaries') efforts to comply with EMIR. It is also possible that additional similar regulations may be passed in otherjurisdictions where we conduct business. Any of these outcomes could have a material adverse effect on the Company.
Our business in the United States is subject to the provisions of various laws and regulations administered in whole or in part by the FERC and NERC,including PURPA, the Federal Power Act, and the EPAct 2005. Actions by the FERC, NERC and by state utility commissions can have a material effect on ouroperations.
EPAct 2005 authorizes the FERC to remove the obligation of electric utilities under Section 210 of PURPA to enter into new contracts for the purchase orsale of electricity from or to QFs if certain market conditions are met. Pursuant to this authority, the FERC has instituted a rebuttable presumption that utilitieslocated within the control areas of the Midwest Independent Transmission System Operator, Inc., PJM Interconnection, L.L.C., ISO New England, Inc., the NYISOand the Electric Reliability Council of Texas, Inc. are not required to purchase or sell power from or to QFs above a certain size. In addition, the FERC isauthorized under EPAct 2005 to remove the purchase/sale obligations of individual utilities on a case-by-case basis. While this law does not affect existingcontracts, as a result of the changes to PURPA, our QFs may face a more difficult market environment when their current long-term contracts expire.
EPAct 2005 repealed PUHCA 1935 and enacted PUHCA 2005 in its place. PUHCA 1935 had the effect of requiring utility holding companies to operate ingeographically proximate regions and therefore limited the range of potential combinations and mergers among utilities. By comparison, PUHCA 2005 has no suchrestrictions and simply provides the FERC and state utility commissions with enhanced access to the books and records of certain utility holding companies. Therepeal of PUHCA 1935 removed barriers to mergers and other potential combinations which could result in the creation of large, geographically dispersed utilityholding companies. These entities may have enhanced financial strength and therefore an increased ability to compete with us in the United States generationmarket.
In accordance with Congressional mandates in the EPAct 1992 and now in EPAct 2005, the FERC has strongly encouraged competition in wholesale electricmarkets. Increased competition may have the effect of lowering our operating margins. Among other steps, the FERC has encouraged RTOs and ISOs to developdemand response bidding programs as a mechanism for responding to peak electric demand. These programs may reduce the value of our peaking assets which relyon very high prices during a relatively small number of hours to recover their costs. Similarly, the FERC is encouraging the
66

construction of new transmission infrastructure in accordance with provisions of EPAct 2005. Although new transmission lines may increase market opportunities,they may also increase the competition in our existing markets.
While the FERC continues to promote competition, some state utility commissions have reversed course and begun to encourage the construction ofgeneration facilities by traditional utilities to be paid for on a cost-of-service basis by retail ratepayers. Such actions have the effect of reducing sale opportunities inthe competitive wholesale generating markets in which we operate.
FERC has civil penalty authority over violations of any provision of Part II of the FPA which concerns wholesale generation or transmission, as well as anyrule or order issued thereunder. FERC is authorized to assess a maximum civil penalty of $1 million per violation for each day that the violation continues. TheFPA also provides for the assessment of criminal fines and imprisonment for violations under the FPA. This penalty authority was enhanced in EPAct 2005. Withthis expanded enforcement authority, violations of the FPA and FERC's regulations could potentially have more serious consequences than in the past.
Pursuant to EPAct 2005, the NERC has been certified by FERC as the Electric Reliability Organization (ERO) to develop mandatory and enforceable electricsystem reliability standards applicable throughout the U.S. to improve the overall reliability of the electric grid. These standards are subject to FERC review andapproval. Once approved, the reliability standards may be enforced by FERC independently, or, alternatively, by the ERO and regional reliability organizationswith responsibility for auditing, investigating and otherwise ensuring compliance with reliability standards, subject to FERC oversight. Monetary penalties of up to$1 million per day per violation may be assessed for violations of the reliability standards.
Our utility businesses in the U.S. face significant regulation by their respective state utility commissions. The regulatory discretion is reasonably broad inboth Indiana and Ohio and includes regulation as to services and facilities, the valuation of property, the construction, purchase, or lease of electric generatingfacilities, the classification of accounts, rates of depreciation, the increase or decrease in retail rates and charges, the issuance of certain securities, the acquisitionand sale of some public utility properties or securities and certain other matters. These businesses face the risk of unexpected or adverse regulatory action whichcould have a material adverse effect on our results of operations, financial condition, and cash flows. See Item 1.— Business — US SBU — U.S. Businesses —U.S. Utilities for further information on the regulation faced by our U.S. utilities.
Our businesses are subject to stringent environmental laws and regulations.
Our businesses are subject to stringent environmental laws and regulations by many federal, regional, state and local authorities, international treaties andforeign governmental authorities. These laws and regulations generally concern emissions into the air, effluents into the water, use of water, wetlands preservation,remediation of contamination, waste disposal, endangered species and noise regulation, among others. Failure to comply with such laws and regulations or toobtain or comply with any necessary environmental permits pursuant to such laws and regulations could result in fines or other sanctions. Environmental laws andregulations affecting power generation and distribution are complex and have tended to become more stringent over time. Congress and other domestic and foreigngovernmental authorities have either considered or implemented various laws and regulations to restrict or tax certain emissions, particularly those involving airemissions and water discharges. See the various descriptions of these laws and regulations contained in Item 1.— Business of this Form 10-K. These laws andregulations have imposed, and proposed laws and regulations could impose in the future, additional costs on the operation of our power plants. We have incurredand will continue to incur significant capital and other expenditures to comply with these and other environmental laws and regulations. Changes in, or newdevelopment of, environmental restrictions may force the Company to incur significant expenses or expenses that may exceed our estimates. There can be noassurance that we would be able to recover all or any increased environmental costs from our customers or that our business, financial condition, includingrecorded asset values or results of operations, would not be materially and adversely affected by such expenditures or any changes in domestic or foreignenvironmental laws and regulations.
Our businesses are subject to enforcement initiatives from environmental regulatory agencies.
The EPA has pursued an enforcement initiative against coal-fired generating plants alleging wide-spread violations of the new source review and preventionof significant deterioration provisions of the CAA. The EPA has brought suit against a number of companies and has obtained settlements with many of thesecompanies over such allegations. The allegations typically involve claims that a company made major modifications to a coal-fired generating unit without properpermit approval and without installing best available control technology. The principal, but not exclusive, focus of this EPA enforcement initiative is emissions ofSO 2 and NO x . In connection with this enforcement initiative, the EPA has imposed fines and required companies to install improved pollution controltechnologies to reduce emissions of SO 2 and NO x . There can be no assurance that foreign environmental regulatory agencies in countries in which oursubsidiaries operate will not pursue similar enforcement initiatives under relevant laws and regulations.
67

Regulators, politicians, non-governmental organizations and other private parties have expressed concern about greenhouse gas, or GHG, emissions andthe potential risks associated with climate change and are taking actions which could have a material adverse impact on our consolidated results of operations,financial condition and cash flows.
As discussed in Item 1.— Business , at the international, federal and various regional and state levels, rules are in effect and policies are under developmentto regulate GHG emissions, thereby effectively putting a cost on such emissions in order to create financial incentives to reduce them. In 2015 , the Company'ssubsidiaries operated businesses which had total CO 2 emissions of approximately 67.6 million metric tonnes, approximately 27.4 million of which were emitted bybusinesses located in the U.S. (both figures ownership adjusted). The Company uses CO 2 emission estimation methodologies supported by "The Greenhouse GasProtocol" reporting standard on GHG emissions. For existing power generation plants, CO 2 emissions data are either obtained directly from plant continuousemission monitoring systems or calculated from actual fuel heat inputs and fuel type CO 2 emission factors. The estimated annual CO 2 emissions from fossil fuelelectric power generation facilities of the Company's subsidiaries that are in construction or development and have received the necessary air permits forcommercial operations are approximately 7.8 million metric tonnes (ownership adjusted). This overall estimate is based on a number of projections andassumptions which may prove to be incorrect, such as the forecasted dispatch, anticipated plant efficiency, fuel type, CO 2 emissions rates and our subsidiaries'achieving completion of such construction and development projects. However, it is certain that the projects under construction or development when completedwill increase emissions of our portfolio and therefore could increase the risks associated with regulation of GHG emissions. Because there is significant uncertaintyregarding these estimates, actual emissions from these projects under construction or development may vary substantially from these estimates.
The non-utility, generation subsidiaries of the Company often seek to pass on any costs arising from CO 2 emissions to contract counterparties, but there canbe no assurance that such subsidiaries of the Company will effectively pass such costs onto the contract counterparties or that the cost and burden associated withany dispute over which party bears such costs would not be burdensome and costly to the relevant subsidiaries of the Company. The utility subsidiaries of theCompany may seek to pass on any costs arising from CO 2 emissions to customers, but there can be no assurance that such subsidiaries of the Company willeffectively pass such costs to the customers, or that they will be able to fully or timely recover such costs.
Foreign, federal, state or regional regulation of GHG emissions could have a material adverse impact on the Company's financial performance. The actualimpact on the Company's financial performance and the financial performance of the Company's subsidiaries will depend on a number of factors, including amongothers, the degree and timing of GHG emissions reductions required under any such legislation or regulation, the cost of emissions reduction equipment and theprice and availability of offsets, the extent to which market based compliance options are available, the extent to which our subsidiaries would be entitled to receiveGHG emissions allowances without having to purchase them in an auction or on the open market and the impact of such legislation or regulation on the ability ofour subsidiaries to recover costs incurred through rate increases or otherwise. As a result of these factors, our cost of compliance could be substantial and couldhave a material adverse impact on our results of operations.
In January 2005, based on European Community "Directive 2003/87/EC on Greenhouse Gas Emission Allowance Trading," the EU ETS commencedoperation as the largest multi-country GHG emission trading scheme in the world. On February 16, 2005, the Kyoto Protocol became effective. The Kyoto Protocolrequires all developed countries that have ratified it to substantially reduce their GHG emissions, including CO 2 . However, the United States never ratified theKyoto Protocol and, to date, compliance with the Kyoto Protocol and the EU ETS has not had a material adverse effect on the Company's consolidated results ofoperations, financial condition and cash flows.
In December 2015, the Parties to the United Nations Framework Convention on Climate Change ("UNFCCC") convened for the 21st Conference of theParties in Paris, France. The result was the so-called Paris Agreement. We anticipate that the Paris Agreement will continue the trend towards the efforts to de-carbonize the global economy and to further limit GHG emissions, including in those countries where the Company does business. It is difficult to predict thenature, timing and scope of such regulation but it could have a material adverse effect on the Company's financial performance.
In the U.S., there currently is no federal legislation imposing a mandatory GHG emission reduction programs (including for CO 2 ) affecting the electricpower generation facilities of the Company's subsidiaries. However, the EPA has adopted regulations pertaining to GHG emissions that require new sources ofGHG emissions of over 100,000 tons per year, and existing sources planning physical changes that would increase their GHG emissions by more than 75,000 tonsper year, to obtain new source review permits from the EPA prior to construction or modification. Additionally, the EPA has promulgated a rule establishing NewSource Performance Standards for CO 2 emissions for newly constructed and modified/reconstructed fossil-fueled EUSGUs larger than 25 MW. The EPA has alsopromulgated a rule, the Clean Power Plan ("CPP"), that requires existing EUSGUs to begin reducing GHG emissions starting in 2022 with the full reductionrequirement in 2030. Under the CPP, states are required to develop and submit plans that establish performance standards or, through emissions trading programs,otherwise meet a state-wide emissions rate average or mass-based goal. For further discussion of the regulation of GHG emission, including the U.S. SupremeCourt's recently issued orders staying implementation of the CPP, see Item 1. —
68
Business—Environmental and Land-Use Regulations—United States Environmental and Land-Use Legislation and Regulations—Greenhouse Gas Emissionsabove.
Such regulations, and in particular regulations applying to modified or existing EUSGUs, could increase our costs directly and indirectly and have a materialadverse effect on our business and/or results of operations. See Item 1.— Business of this Form 10-K for further discussion about these environmental agreements,laws and regulations.
At the state level, the RGGI, a cap-and-trade program covering CO 2 emissions from electric power generation facilities in the Northeast, became effective inJanuary 2009, and California has adopted comprehensive legislation and regulation that requires mandatory GHG reductions from several industrial sectors,including the electric power generation industry. At this time, other than with regard to RGGI (further described below) and proposed Hawaii regulations relatingto the collection of fees on GHG emissions, the impact of both of which we do not expect to be material, the Company cannot estimate the costs of compliancewith United States federal, regional or state GHG emissions reduction legislation or initiatives, due to the fact that most of these proposals are not being activelypursued or are in the early stages of development and any final regulations or laws, if adopted, could vary drastically from current proposals; in the case ofCalifornia, we anticipate no material impact due to the fact that we expect such costs will be passed through to our offtakers under the terms of existing tollingagreements.
The regional auctions of RGGI allowances needed to be acquired by power generators to comply with state programs implementing RGGI occurapproximately every quarter. Our subsidiary in Maryland is our only subsidiary that was subject to RGGI in 2015 . Of the approximately 27.4 million metric tonnesof CO 2 emitted in the United States by our subsidiaries in 2015 (ownership adjusted), approximately 1.4 million metric tonnes were emitted by our subsidiary inMaryland. The Company estimates that the RGGI compliance costs could be approximately $3.4 million for 2016 . There is a risk that our actual compliance costsunder RGGI will differ from our estimates by a material amount and that our model could underestimate our costs of compliance.
In addition to government regulators, other groups such as politicians, environmentalists and other private parties have expressed increasing concern aboutGHG emissions. For example, certain financial institutions have expressed concern about providing financing for facilities which would emit GHGs, which canaffect our ability to obtain capital, or if we can obtain capital, to receive it on commercially viable terms. Further, rating agencies may decide to downgrade ourcredit ratings based on the emissions of the businesses operated by our subsidiaries or increased compliance costs which could make financing unattractive. Inaddition, plaintiffs have brought tort lawsuits against the Company because of its subsidiaries' GHG emissions. Unless the United States Congress acts to preemptsuch suits as part of comprehensive federal legislation, additional lawsuits may be brought against the Company or its subsidiaries in the future. While the litigationmentioned has been dismissed, it is impossible to predict whether similar future lawsuits are likely to prevail or result in damages awards or other relief.Consequently, it is impossible to determine whether such lawsuits are likely to have a material adverse effect on the Company's consolidated results of operationsand financial condition.
Furthermore, according to the Intergovernmental Panel on Climate Change, physical risks from climate change could include, but are not limited to,increased runoff and earlier spring peak discharge in many glacier and snow-fed rivers, warming of lakes and rivers, an increase in sea level, changes andvariability in precipitation and in the intensity and frequency of extreme weather events. Physical impacts may have the potential to significantly affect theCompany's business and operations, and any such potential impact may render it more difficult for our businesses to obtain financing. For example, extremeweather events could result in increased downtime and operation and maintenance costs at the electric power generation facilities and support facilities of theCompany's subsidiaries. Variations in weather conditions, primarily temperature and humidity also would be expected to affect the energy needs of customers. Adecrease in energy consumption could decrease the revenues of the Company's subsidiaries. In addition, while revenues would be expected to increase if the energyconsumption of customers increased, such increase could prompt the need for additional investment in generation capacity. Changes in the temperature of lakes andrivers and changes in precipitation that result in drought could adversely affect the operations of the fossil fuel-fired electric power generation facilities of theCompany's subsidiaries. Changes in temperature, precipitation and snow pack conditions also could affect the amount and timing of hydroelectric generation.
In addition to potential physical risks noted by the Intergovernmental Panel on Climate Change, there could be damage to the reputation of the Company andits subsidiaries due to public perception of GHG emissions by the Company's subsidiaries, and any such negative public perception or concerns could ultimatelyresult in a decreased demand for electric power generation or distribution from our subsidiaries. The level of GHG emissions made by subsidiaries of the Companyis not a factor in the compensation of executives of the Company.
If any of the foregoing risks materialize, costs may increase or revenues may decrease and there could be a material adverse effect on the electric powergeneration businesses of the Company's subsidiaries and on the Company's consolidated results of operations, financial condition and cash flows.
69

Tax legislation initiatives or challenges to our tax positions could adversely affect our results of operations and financial condition.
Our subsidiaries have operations in the U.S. and various non-U.S. jurisdictions. As such, we are subject to the tax laws and regulations of the U.S. federal,state and local governments and of many non-U.S. jurisdictions. From time to time, legislative measures may be enacted that could adversely affect our overall taxpositions regarding income or other taxes. There can be no assurance that our effective tax rate or tax payments will not be adversely affected by these legislativemeasures.
For example, the U.S. is considering corporate tax reform that may significantly change U.S. international tax rules and corporate tax rates. Additionally,longstanding international tax norms that determine how and where cross-border international trade is subjected to tax are evolving. The Organization forEconomic Cooperation and Development ("OECD"), in coordination with the G8 and G20, recently concluded its Base Erosion and Profit Shifting project(“BEPS") with a series of recommendations that many tax jurisdictions have adopted, or may adopt in the future, as law. As these and other tax laws, relatedregulations and double-tax conventions change, our financial results could be materially impacted. Given the unpredictability of these possible changes and theirpotential interdependency, it is very difficult to assess whether the overall effect of such potential tax changes would be cumulatively positive or negative for ourearnings and cash flow, but such changes could adversely impact our results of operations.
In addition, United States federal, state and local, as well as non-United States, tax laws and regulations are extremely complex and subject to varyinginterpretations. There can be no assurance that our tax positions will be sustained if challenged by relevant tax authorities and if not sustained, there could be amaterial impact on our results of operations.
We and our affiliates are subject to material litigation and regulatory proceedings.We and our affiliates are parties to material litigation and regulatory proceedings. See Item 3.— Legal Proceedings below. There can be no assurances that
the outcome of such matters will not have a material adverse effect on our consolidated financial position.
ITEM 1B. UNRESOLVED STAFF COMMENTS
None.
ITEM 2. PROPERTIES
We maintain offices in many places around the world, generally pursuant to the provisions of long- and short-term leases, none of which we believe arematerial. With a few exceptions, our facilities, which are described in Item 1 —Business of this Form 10-K, are subject to mortgages or other liens or encumbrancesas part of the project's related finance facility. In addition, the majority of our facilities are located on land that is leased. However, in a few instances, noaccompanying project financing exists for the facility, and in a few of these cases, the land interest may not be subject to any encumbrance and is owned outrightby the subsidiary or affiliate.
ITEM 3. LEGAL PROCEEDINGS
The Company is involved in certain claims, suits and legal proceedings in the normal course of business. The Company has accrued for litigation and claimswhere it is probable that a liability has been incurred and the amount of loss can be reasonably estimated. The Company believes, based upon information itcurrently possesses and taking into account established reserves for estimated liabilities and its insurance coverage, that the ultimate outcome of these proceedingsand actions is unlikely to have a material adverse effect on the Company's financial statements. It is reasonably possible, however, that some matters could bedecided unfavorably to the Company and could require the Company to pay damages or make expenditures in amounts that could be material but cannot beestimated as of December 31, 2015.
In 1989, Centrais Elétricas Brasileiras S.A. ("Eletrobrás") filed suit in the Fifth District Court in the state of Rio de Janeiro ("FDC") against EletropauloEletricidade de São Paulo S.A. ("EEDSP") relating to the methodology for calculating monetary adjustments under the parties' financing agreement. In April 1999,the FDC found for Eletrobrás and in September 2001, Eletrobrás initiated an execution suit in the FDC to collect approximately R$1.8 billion ( $458 million ) fromEletropaulo (as estimated by Eletropaulo (or approximately R$2.2 billion ( $571 million )) plus legal costs according to Eletrobrás as of June 2015 and a lesseramount from an unrelated company, Companhia de Transmissão de Energia Elétrica Paulista ("CTEEP") (Eletropaulo and CTEEP were spun off of EEDSPpursuant to its privatization in 1998). In November 2002, the FDC rejected Eletropaulo's defenses in the execution suit. On appeal, the case was remanded to theFDC for further proceedings to determine whether Eletropaulo is liable for the debt. In December 2012, the FDC issued a decision that Eletropaulo is liable for thedebt. However, that decision was annulled on appeal and the case was remanded to the FDC for further proceedings. On remand at the FDC, the FDC appointed anaccounting expert to analyze the issues in the case. In September 2015, the expert issued a preliminary report that concluded that Eletropaulo is liable for the debt,without quantifying the debt. Eletropaulo has submitted questions to the expert and reports rebutting the expert's preliminary report. The expert will issue a finalreport in the near future. Thereafter, a decision will be issued by the FDC, which will be free to reject or adopt in whole or in part the expert's
70

final report. If the FDC again determines that Eletropaulo is liable for the debt, Eletrobrás will be entitled to resume the execution suit in the FDC. If Eletrobrásdoes so, after the amount of the alleged debt is determined, Eletropaulo will be required to provide security for its alleged liability. In that case, if Eletrobrásrequests the seizure of such security and the FDC grants such request, Eletropaulo's results of operations may be materially adversely affected and, in turn, theCompany's results of operations could be materially adversely affected. In addition, in February 2008, CTEEP filed a lawsuit in the FDC against Eletrobrás andEletropaulo seeking a declaration that CTEEP is not liable for any debt under the financing agreement. Eletropaulo believes it has meritorious defenses to theclaims asserted against it and will defend itself vigorously in these proceedings; however, there can be no assurances that it will be successful in its efforts.
In September 1996, a public civil action was asserted against Eletropaulo and Associação Desportiva Cultural Eletropaulo (the "Associação") relating toalleged environmental damage caused by construction of the Associação near Guarapiranga Reservoir. The initial decision that was upheld by the Appellate Courtof the state of São Paulo in 2006 found that Eletropaulo should repair the alleged environmental damage by demolishing certain construction and reforesting thearea, and either sponsor an environmental project which would cost approximately R$1.8 million ( $461 thousand ) as of December 31, 2015, or pay anindemnification amount of approximately R$15 million ( $4 million ). Eletropaulo has appealed this decision to the Supreme Court and the Supreme Courtaffirmed the decision of the Appellate Court. Following the Supreme Court's decision, the case has been remanded to the court of first instance for furtherproceedings and to monitor compliance by the defendants with the terms of the decision. In January 2014, Eletropaulo informed the court that it intended to complywith the court's decision by donating a green area inside a protection zone and restore watersheds, the aggregate cost of which is expected to be approximatelyR$1.8 million ( $461 thousand ). Eletropaulo also requested that the court add the current owner of the land where the Associação facilities are located, EmpresaMetropolitana de Águas e Energia S.A. ("EMAE"), as a party to the lawsuit and order EMAE to perform the demolition and reforestation aspects of the court'sdecision. In July 2014, the court requested the Secretary of the Environment for the State of São Paulo to notify the court of its opinion regarding the acceptabilityof the green areas to be donated by Eletropaulo to the State of São Paulo. In January 2015, the Secretary of the Environment for the State of São Paulo notifiedEletropaulo and the court that it would not accept Eletropaulo's proposed green areas donation. Instead of such green areas donation, the Secretary of theEnvironment proposed in March 2015 that Eletropaulo undertake an environmental project to offset the alleged environmental damage. Since March 2015,Eletropaulo and the Secretary of Environment have been working together to define an environmental project, which will be submitted for approval by the PublicProsecutor. The cost of such project is currently estimated to be R$2 million ( $512 thousand ).
In December 2001, Gridco Ltd. ("Gridco") served a notice to arbitrate pursuant to the Indian Arbitration and Conciliation Act of 1996 on the Company, AESOrissa Distribution Private Limited ("AES ODPL"), and Jyoti Structures ("Jyoti") pursuant to the terms of the shareholders agreement between Gridco, theCompany, AES ODPL, Jyoti and the Central Electricity Supply Company of Orissa Ltd. ("CESCO"), an affiliate of the Company. In the arbitration, Gridcoasserted that a comfort letter issued by the Company in connection with the Company's indirect investment in CESCO obligates the Company to provide additionalfinancial support to cover all of CESCO's financial obligations to Gridco. Gridco appeared to be seeking approximately $189 million in damages, plus undisclosedpenalties and interest, but a detailed alleged damage analysis was not filed by Gridco. The Company counterclaimed against Gridco for damages. In June 2007, a 2-to-1 majority of the arbitral tribunal rendered its award rejecting Gridco's claims and holding that none of the respondents, the Company, AES ODPL, or Jyoti, hadany liability to Gridco. The respondents' counterclaims were also rejected. A majority of the tribunal later awarded the respondents, including the Company, someof their costs relating to the arbitration. Gridco filed challenges of the tribunal's awards with the local Indian court. Gridco's challenge of the costs award has beendismissed by the court, but its challenge of the liability award remains pending. The Company believes that it has meritorious defenses to the claims assertedagainst it and will defend itself vigorously in these proceedings; however, there can be no assurances that it will be successful in its efforts.
In March 2003, the office of the Federal Public Prosecutor for the State of São Paulo, Brazil (“MPF”) notified Eletropaulo that it had commenced an inquiryinto the BNDES financings provided to AES Elpa and AES Transgás, the rationing loan provided to Eletropaulo, changes in the control of Eletropaulo, sales ofassets by Eletropaulo, and the quality of service provided by Eletropaulo to its customers. The MPF requested various documents from Eletropaulo relating to thesematters. In July 2004, the MPF filed a public civil lawsuit in the Federal Court of São Paulo (“FCSP”) alleging that BNDES violated Law 8429/92 (theAdministrative Misconduct Act) and BNDES's internal rules by (1) approving the AES Elpa and AES Transgás loans; (2) extending the payment terms on the AESElpa and AES Transgás loans; (3) authorizing the sale of Eletropaulo's preferred shares at a stock-market auction; (4) accepting Eletropaulo's preferred shares tosecure the loan provided to Eletropaulo; and (5) allowing the restructurings of Light Serviços de Eletricidade S.A. and Eletropaulo. The MPF also named AES Elpaand AES Transgás as defendants in the lawsuit because they allegedly benefited from BNDES's alleged violations. In May 2006, the FCSP ruled that the MPFcould pursue its claims based on the first, second, and fourth alleged violations noted above. The MPF subsequently filed an interlocutory appeal with the FederalCourt of Appeals (“FCA”) seeking to require the FCSP to consider all five alleged violations. In April 2015, the FCA issued a decision holding that the FCSPshould consider all five alleged violations. AES Elpa and AES Brasiliana (the successor of AES Transgás) have appealed to the Superior Court of Justice. Thelawsuit remains pending before the FCSP, but it will remain suspended until the
71

interlocutory appeal has been finally decided. AES Elpa and AES Brasiliana believe they have meritorious defenses to the allegations asserted against them andwill defend themselves vigorously in these proceedings; however, there can be no assurances that they will be successful in their efforts.
Pursuant to their environmental audit, AES Sul and AES Florestal discovered 200 barrels of solid creosote waste and other contaminants at a pole factorythat AES Florestal had been operating. The conclusion of the audit was that a prior operator of the pole factory, Companhia Estadual de Energia ("CEEE"), hadbeen using those contaminants to treat the poles that were manufactured at the factory. On their initiative, AES Sul and AES Florestal communicated with Brazilianauthorities and CEEE about the adoption of containment and remediation measures. In March 2008, the State Attorney of the state of Rio Grande do Sul, Brazilfiled a public civil action against AES Sul, AES Florestal and CEEE seeking an order requiring the companies to recover the contaminated area located on thegrounds of the pole factory and an indemnity payment of approximately R$6 million ( $2 million ) to the state's Environmental Fund. In October 2011, the StateAttorney Office filed a request for an injunction ordering the defendant companies to contain and remove the contamination immediately. The court grantedinjunctive relief on October 18, 2011, but determined only that defendant CEEE was required to proceed with the removal work. In May 2012, CEEE began theremoval work in compliance with the injunction. The removal costs are estimated to be approximately R$60 million ( $15 million ) and the work was completed inFebruary 2014. In parallel with the removal activities, a court-appointed expert investigation took place, which was concluded in May 2014. The court-appointedexpert final report was presented to the State Attorneys in October 2014, and in January 2015 to the defendant companies. In March 2015, AES Sul and AESFlorestal submitted comments and supplementary questions regarding the expert report. The Company believes that it has meritorious defenses to the claimsasserted against it and will defend itself vigorously in these proceedings; however, there can be no assurances that it will be successful in its efforts.
In March 2009, AES Uruguaiana Empreendimentos S.A. ("AESU") in Brazil initiated arbitration in the ICC against YPF S.A. ("YPF") seeking damages andother relief relating to YPF's breach of the parties' gas supply agreement ("GSA"). Thereafter, in April 2009, YPF initiated arbitration in the ICC against AESU andtwo unrelated parties, Companhia de Gas do Estado do Rio Grande do Sul and Transportador de Gas del Mercosur S.A. ("TGM"), claiming that AESU wrongfullyterminated the GSA and caused the termination of a transportation agreement ("TA") between YPF and TGM ("YPF Arbitration"). YPF sought an unspecifiedamount of damages from AESU, a declaration that YPF's performance was excused under the GSA due to certain alleged force majeure events, or, in thealternative, a declaration that the GSA and the TA should be terminated without a finding of liability against YPF because of the allegedly onerous obligationsimposed on YPF by those agreements. In addition, in the YPF Arbitration, TGM asserted that if it was determined that AESU was responsible for the terminationof the GSA, AESU was liable for TGM's alleged losses, including losses under the TA. In April 2011, the arbitrations were consolidated into a single proceeding.The hearing on liability issues took place in December 2011. In May 2013, the arbitral tribunal issued a liability award in AESU's favor. YPF thereafter challengedthe award in Argentine court. In December 2015, an Argentine court issued a decision purporting to annul the liability award. AESU has sought reconsideration ofthat decision. The damages hearing in the arbitration took place on November 16-17, 2015. The tribunal has not issued a damages award to date. AESU believes ithas meritorious claims and defenses and will assert them vigorously; however, there can be no assurances that it will be successful in its efforts.
In April 2009, the Antimonopoly Agency in Kazakhstan initiated an investigation of certain power sales of Ust-Kamenogorsk HPP ("UK HPP") andShulbinsk HPP, hydroelectric plants under AES concession (collectively, the "Hydros"). The Antimonopoly Agency determined that the Hydros had abused theirmarket position and charged monopolistically high prices for power from January-February 2009. Administrative proceedings followed, but were later suspendeddue to the initiation of related criminal proceedings against officials of the Hydros. Recently, the Antimonopoly Agency terminated its investigation of the Hydrosdue to the expiration of the relevant statute of limitations.
In October 2009, AES Mérida III, S. de R.L. de C.V. ("AES Mérida"), one of our businesses in Mexico, initiated arbitration against its fuel supplier andelectricity offtaker, Comisión Federal de Electricidad ("CFE"), seeking a declaration that CFE breached the parties' PPA by supplying gas that did not comply withthe PPA's specifications. Alternatively, AES Mérida requested a declaration that the supply of such gas by CFE is a force majeure event under the PPA. CFEdisputed the claims. Although it did not assert counterclaims, in its closing brief CFE asserted that it is entitled to a partial refund of the capacity charge paymentsthat it made for power generated with the out-of-specification gas. In July 2012, the arbitral tribunal issued an award in AES Mérida's favor. In December 2012,CFE initiated an action in Mexican court seeking to nullify the award. AES Mérida opposed the request and asserted a counterclaim to confirm the award. InFebruary 2014, the court rejected CFE's claims and granted AES Mérida's request to confirm the award. CFE has appealed the court's decision. The appeal ispending before the Mexican Supreme Court. AES Mérida believes it has meritorious grounds to defeat that action; however, there can be no assurances that it willbe successful.
In October 2009, IPL received a NOV and Finding of Violation from the EPA pursuant to the CAA Section 113(a). The NOV alleges violations of the CAAat IPL's three primarily coal-fired electric generating facilities dating back to 1986. The alleged violations primarily pertain to the Prevention of SignificantDeterioration and nonattainment New Source Review
72
requirements under the CAA. Since receiving the letter, IPL management has met with EPA staff regarding possible resolutions of the NOV. At this time, wecannot predict the ultimate resolution of this matter. However, settlements and litigated outcomes of similar cases have required companies to pay civil penalties,install additional pollution control technology on coal-fired electric generating units, retire existing generating units, and invest in additional environmentalprojects. A similar outcome in this case could have a material impact to IPL and could, in turn, have a material impact on the Company. IPL would seek recoveryof any operating or capital expenditures related to air pollution control technology to reduce regulated air emissions; however, there can be no assurances that itwould be successful in that regard.
In November 2009, April 2010, December 2010, April 2011, June 2011, August 2011, November 2011, and October 2014, substantially similar personalinjury lawsuits were filed by a total of 50 residents and decedent estates in the Dominican Republic against the Company, AES Atlantis, Inc., AES Puerto Rico, LP,AES Puerto Rico, Inc., and AES Puerto Rico Services, Inc., in the Superior Court for the state of Delaware. In each lawsuit, the plaintiffs allege that the coalcombustion by-products of AES Puerto Rico's power plant were illegally placed in the Dominican Republic from October 2003 through March 2004 andsubsequently caused the plaintiffs' birth defects, other personal injuries, and/or deaths. The plaintiffs did not quantify their alleged damages, but generally allegedthat they are entitled to compensatory and punitive damages. The AES defendants moved for partial dismissal of both the November 2009 and April 2010 lawsuitson various grounds. In July 2011, the Superior Court dismissed the plaintiffs' international law and punitive damages claims, but held that the plaintiffs had statedintentional tort, negligence, and strict liability claims under Dominican law, which the Superior Court found governed the lawsuits. The Superior Court granted theplaintiffs leave to amend their complaints in accordance with its decision, and in September 2011, the plaintiffs in the November 2009 and April 2010 lawsuits didso. In November 2011, the AES defendants again moved for partial dismissal of those amended complaints, and in both lawsuits, the Superior Court dismissed theplaintiffs' claims for future medical monitoring expenses but declined to dismiss their claims under Dominican Republic Law 64-00. The AES defendants filed ananswer to the November 2009 lawsuit in June 2012. The Superior Court has stayed all lawsuits but the November 2009 lawsuit. In that lawsuit, discovery iscomplete on causation and exposure issues, but is ongoing on other liability issues as well as damages issues. Based on the information they have disclosed duringdiscovery, the plaintiffs in the November 2009 lawsuit appear to be seeking a total of approximately $30 million for life care assistance and lost earnings,additional but unspecified amounts for moral damages, and additional but unspecified damages for loss of consortium and deaths. Also, in the November 2009lawsuit, trial is scheduled for April 2016. The AES defendants believe they have meritorious defenses and will defend themselves vigorously; however, there canbe no assurances that they will be successful in their efforts.
On February 11, 2011, Eletropaulo received a notice of violation from São Paulo State's Environmental Authorities for allegedly destroying 0.32 hectares ofnative vegetation at the Conservation Park of Serra do Mar ("Park"), without previous authorization or license. The notice of violation asserted a fine ofapproximately R$1 million ( $256 thousand ) and the suspension of Eletropaulo activities in the Park. As a response to this administrative procedure before the SãoPaulo State Environmental Authorities ("São Paulo EA"), Eletropaulo timely presented its defense on February 28, 2011 seeking to vacate the NOV or reduce thefine. In December 2011, the São Paulo EA declined to vacate the NOV but reduced the fine to R$757 thousand ( $194 thousand ) and recognized the possibility ofan additional 40% reduction of the fine if Eletropaulo agrees to recover the affected area with additional vegetation. Eletropaulo did not appeal the decision anddiscussed the terms of a possible settlement with the São Paulo EA, including a plan to recover the affected area by primarily planting additional trees. In March2012, the state of São Paulo Prosecutor's Office of São Bernardo do Campo initiated a Civil Proceeding to review the compliance by Eletropaulo with the terms ofany possible settlement. The Park Administrator subsequently approved an area for the recovery project different from the affected area, which was no longeravailable. On January 23, 2015, AES Eletropaulo entered into a Recovery and Compensation Agreement with the Coordenadoria de Fiscaliz a ção Ambiental("CFA") to restore 3.2 hectares during the course of two years, which restoration is currently estimated to cost R$592 thousand ( $152 thousand ). In June 2015, thestate of São Paulo Prosecutor's Office of São Bernardo do Campo decided to close its Civil Proceeding, subject to the approval of the Superior Counsel of thePublic Prosecutor's Office. Upon completion of the recovery project as approved and established in the Recovery and Compensation Agreement, AES will beentitled to a 40% reduction ( R$303 thousand or $78 thousand ) of the fine as legally provided.
In June 2011, the São Paulo Municipal Tax Authority (the "Tax Authority") filed 60 tax assessments in São Paulo administrative court against Eletropaulo,seeking to collect services tax ("ISS") that allegedly had not been paid on revenues for services rendered by Eletropaulo. Eletropaulo challenged the assessments onthe ground that the revenues at issue were not subject to ISS. In October 2013, the First Instance Administrative Court determined that Eletropaulo was liable forISS, interest, and related penalties totaling approximately R$3.3 billion ( $843 million ) as estimated by Eletropaulo. Eletropaulo thereafter appealed to the SecondInstance Administrative Court ("SIAC"). In January 2016, the Tax Authority reduced the total amount of the ISS assessments to approximately R$228 million ($58 million ). The reduced amount of ISS remains under consideration by the SIAC. No tax is due while the appeal is pending. Eletropaulo believes it hasmeritorious defenses and will defend itself vigorously in these proceedings; however, there can be no assurances that it will be successful in its efforts.
73

In January 2012, the Brazil Federal Tax Authority issued an assessment alleging that AES Tietê paid PIS and COFINS taxes from 2007 to 2010 at a lowerrate than the tax authority believed was applicable. AES Tietê challenged the assessment on the ground that the tax rate was set in the applicable legislation. InApril 2013, the First Instance Administrative Court determined that AES Tietê should have calculated the taxes at the higher rate and that AES Tietê was liable forunpaid taxes, interest and penalties totaling approximately R$910 million ( $233 million ) as estimated by AES Tietê. AES Tietê appealed to the Second InstanceAdministrative Court (“SIAC”). In January 2015, the SIAC issued a decision in AES Tietê's favor, finding that AES Tietê was not liable for unpaid taxes. Thepublic prosecutor subsequently filed an appeal, which was denied as untimely. The Tax Authority thereafter filed a motion for clarification of the SIAC's decision,which motion remains pending. AES Tietê believes it has meritorious defenses to the claim and will defend itself vigorously in these proceedings; however, therecan be no assurances that it will be successful in its efforts.
In August 2012, Fondo Patrimonial de las Empresas Reformadas (“FONPER”) (the Dominican instrumentality that holds the Dominican Republic's shares inEmpresa Generadora de Electricidad Itabo, S.A. (“Itabo”)) filed a criminal complaint against certain current and former employees of AES. The criminalproceedings include a related civil component initiated against, among others, Coastal Itabo, Ltd. (“Coastal”) (the AES affiliate shareholder of Itabo) and NewCaribbean Investment, S.A. (“NC”) (the AES affiliate that manages Itabo). FONPER asserts claims relating to the alleged mismanagement of Itabo and seeksapproximately $270 million in damages. The Dominican District Attorney (“DA”) thereafter admitted the criminal complaint and requested that the DominicanRepublic's Cámara de Cuentas (“Cámara”) perform an audit of the allegations in the criminal complaint. In October 2015, the Cámara issued its final report,determining that the contested actions of the AES employees were in accordance with Dominican law. Further, in August 2012, Coastal and NC initiated aninternational arbitration proceeding against FONPER and the Dominican Republic (“Respondents”), seeking a declaration that Coastal and NC have acted bothlawfully and in accordance with the relevant contracts with the Respondents in relation to the management of Itabo. Coastal and NC also seek a declaration that thecriminal complaint is a breach of the relevant contracts between the parties, including the obligation to arbitrate disputes. Coastal and NC further seek damagesfrom the Respondents resulting from their breach of contract. The Respondents have denied the claims and challenged the jurisdiction of the arbitral tribunal. InFebruary 2015, the Respondents made an application requesting that the tribunal rule on their jurisdictional objections prior to giving any consideration to themerits of the claims of Coastal and NC. In August 2015, the tribunal rejected the application. The tribunal has established the procedural schedule for thearbitration, but has not yet scheduled dates for the final evidentiary hearing. At the parties' request, the Tribunal has suspended the arbitration until July 30, 2016.The AES parties believe they have meritorious claims and defenses, which they will assert vigorously; however, there can be no assurances that they will besuccessful in their efforts.
In July 2015, BTG Pactual (“BTG”) initiated arbitration against AES Tietê under the parties' PPA. BTG claims that AES Tietê breached the PPA bypurchasing more power than it was entitled to take under the PPA. BTG seeks to recover the payments that AES Tietê received from its spot-market sales of BTG'spower, totaling approximately R$30 million ( $8 million ). BTG also seeks to terminate the PPA and to collect a termination payment of approximately R$560million ( $143 million ). AES Tietê has placed R$30 million ( $8 million ) into escrow, with a full reservation of rights. AES Tietê has responded to the arbitrationdemand, contesting the claims against it. AES Tietê believes it has meritorious defenses to the claims asserted against it and will defend itself vigorously in thisproceeding; however, there can be no assurances that it will be successful in its efforts.
In September 2015, AES Southland Development, LLC and AES Redondo Beach, LLC filed a lawsuit against the California Coastal Commission (the“CCC”) over the CCC's determination that the site of AES Redondo Beach included approximately 5.93 acres of CCC-jurisdictional wetlands. The CCC hasasserted that AES Redondo Beach has improperly installed and operated water pumps affecting the alleged wetlands in violation of the California Coastal Act andRedondo Beach Local Coastal Program and has ordered AES Redondo Beach to restore the site. Additional potential outcomes of the CCC determination couldinclude an order requiring AES Redondo Beach to fund a wetland mitigation project and/or pay fines or penalties. AES Redondo Beach believes that it hasmeritorious arguments and intends to vigorously prosecute such lawsuit, but there can be no assurances that it will be successful.
In October 2015, Ganadera Guerra, S.A. (“GG”) and Constructora Tymsa, S.A. (“CT”) filed separate lawsuits against AES Panama in the local courts ofPanama. The claimants allege that AES Panama profited from a hydropower facility (La Estrella) being partially located on land owned first by GG and later byCT, and that AES Panama must pay compensation for its use of the land. The damages sought from AES Panama are approximately $680 million (GG) and $100million (CT). AES Panama believes it has meritorious defenses to the claims asserted against it and will defend itself vigorously in the lawsuits; however, there canbe no assurances that it will be successful in its efforts.
In January 2015, DPL received NOVs from the EPA alleging violations of opacity at Stuart and Killen Stations, and in October 2015, IPL received a similarNOV alleging violations at Petersburg Station. In February 2016, IPL received an NOV from the EPA alleging violations of NSR and other CAA regulations, theIndiana SIP, and the Title V operating permit at Petersburg Station. It is too early to determine whether the NOVs could have a material impact on our business,financial
74

condition or results of our operations. We would seek recovery of any operating or capital expenditures for IPL, but not fines or penalties, related to air pollutioncontrol technology to reduce regulated air emissions; however, there can be no assurances that we would be successful in this regard.ITEM 4. MINE SAFETY DISCLOSURES
Not applicable.
75

PART IIITEM 5. MARKET FOR REGISTRANT'S COMMON EQUITY, RELATED STOCKHOLDER MATTERS AND ISSUER PURCHASES OF EQUITY
SECURITIES
Recent Sales of Unregistered Securities
None.
Purchases of Equity Securities by the Issuer and Affiliated Purchasers
Stock Repurchase Program
In October 2015, the Company's Board of Directors approved an increase of $400 million to the stock repurchase program (the "Program") under which theCompany can repurchase AES common stock. The Board authorization permits the Company to repurchase stock through a variety of methods, including openmarket repurchases and/or privately negotiated transactions. There can be no assurances as to the amount, timing or prices of repurchases, which may vary basedon market conditions and other factors. The Program does not have an expiration date and can be modified or terminated by the Board of Directors at any time.During the year ended December 31, 2015 , the Company repurchased 39.7 million shares of its common stock at a total cost of $482 million under the existingstock repurchase program. The cumulative repurchase from the commencement of the Program in July 2010 through December 31, 2015 is 145.6 million shares ata total cost of $1.8 billion , at an average price per share of $12.31 (including a nominal amount of commissions).
The following table presents information regarding repurchases made by The AES Corporation of its common stock in the fourth quarter of 2015 .
Repurchase Period Total Number of SharesPurchased Average Price Paid Per
Share Total Number of Shares Repurchased as Part of a PubliclyAnnounced Purchase Plan Dollar Value of Maximum Number of Shares to be
Purchased Under the Plan
10/1/2015 - 10/31/15 1,598,910 $ 10.03 1,598,910 $ 400,312,942
11/1/2015 - 11/30/15 1,584,932 (1) 10.02 1,564,682 385,040,330
12/1/2015 - 12/31/15 4,495,268 9.35 4,495,268 343,035,214
Total 7,679,110 7,658,860 (1) Includes 20,250 shares purchased by an executive of the Company in November 2015 that were not under the publicly announced stock repurchase program.
Market Information
Our common stock is currently traded on the NYSE under the symbol "AES." The closing price of our common stock as reported by the NYSE onFebruary 18, 2016 , was $9.70 per share. The Company repurchased 39,684,131 , 21,900,246, and 25,297,042 shares of its common stock in 2015 , 2014 and 2013 ,respectively. The following tables present the high and low intraday sale prices of our common stock and cash dividends declared for the periods indicated:
2015 2014
Sales Price Cash Dividends Sales Price Cash Dividends
High Low Declared High Low DeclaredFirst Quarter $ 13.87 $ 11.53 $ — $ 14.94 $ 13.42 $ —Second Quarter 14.02 12.64 0.10 15.65 13.42 0.05Third Quarter 13.40 9.42 0.10 15.64 14.01 0.05Fourth Quarter 11.21 8.76 0.21 14.49 12.38 0.15
Dividends
The Company commenced a quarterly cash dividend of $0.04 per share beginning in the fourth quarter of 2012, which increased to $0.05 per share beginningin the fourth quarter of 2013, and increased to $0.10 per share in the fourth quarter of 2014. During the fourth quarter of 2015, the Board of Directors voted toincrease the quarterly dividend to $0.11 per share, beginning in the first quarter of 2016 . There can be no assurance that the AES Board will declare a dividend inthe future or, if declared, the amount of any dividend. Our ability to pay dividends will also depend on receipt of dividends from our various subsidiaries across ourportfolio.
Under the terms of our senior secured credit facility, which we entered into with a commercial bank syndicate, we have limitations on our ability to pay cashdividends and/or repurchase stock. Our subsidiaries' ability to declare and pay cash dividends to us is also subject to certain limitations contained in the projectloans, governmental provisions and other agreements to which our subsidiaries are subject. See the information contained under Item 12.— Security Ownership ofCertain Beneficial Owners and Management and Related Stockholder Matters — Securities Authorized for Issuance under Equity Compensation Plans of thisForm 10-K.
Holders
As of February 18, 2016 , there were approximately 4,702 record holders of our common stock.
76

Performance GraphTHE AES CORPORATION
PEER GROUP INDEX/STOCK PRICE PERFORMANCE
Source: Bloomberg
We have selected the Standard and Poor's ("S&P") 500 Utilities Index as our peer group index. The S&P 500 Utilities Index is a published sector indexcomprising the 31 electric and gas utilities included in the S&P 500.
The five year total return chart assumes $100 invested on December 31, 2010 in AES Common Stock, the S&P 500 Index and the S&P 500 Utilities Index.The information included under the heading Performance Graph shall not be considered "filed" for purposes of Section 18 of the Securities Exchange Act of 1934or incorporated by reference in any filing under the Securities Act of 1933 or the Securities Exchange Act of 1934.
ITEM 6. SELECTED FINANCIAL DATA
The following table presents our selected financial data as of the dates and for the periods indicated. You should read this data together with Item 7.—Management's Discussion and Analysis of Financial Condition and Results of Operations and the Consolidated Financial Statements and the notes thereto includedin Item 8.— Financial Statements and Supplementary Data of this Form 10-K. The selected financial data for each of the years in the five year period endedDecember 31, 2015 have been derived from our audited Consolidated Financial Statements. Prior period amounts have been restated to reflect discontinuedoperations in all periods presented. Effective July 1, 2014, the Company adopted new accounting guidance on discontinued operations. Please refer to Note 1 inItem 8.— Financial Statements and Supplementary Data of this Form 10-K for further explanation. Our historical results are not necessarily indicative of ourfuture results.
Acquisitions, disposals, reclassifications and changes in accounting principles affect the comparability of information included in the tables below. Pleaserefer to the Notes to the Consolidated Financial Statements included in Item 8.— Financial Statements and Supplementary Data of this Form 10-K for furtherexplanation of the effect of such activities. Please also refer to Item 1A.— Risk Factors of this Form 10-K and Note 27 — Risks and Uncertainties to theConsolidated Financial Statements included in Item 8.— Financial Statements and Supplementary Data of this Form 10-K for certain risks and uncertainties thatmay cause the data reflected herein not to be indicative of our future financial condition or results of operations.
77

SELECTED FINANCIAL DATA
2015 2014 2013 2012 2011 (1)
Statement of Operations Data for the Years Ended December 31: (in millions, except per share amounts)
Revenue $ 14,963 $ 17,146 $ 15,891 $ 17,164 $ 16,098
Income (loss) from continuing operations (2) 762 1,176 730 (420) 1,602Income (loss) from continuing operations attributable to The AES Corporation, net of tax 306 789 284 (960) 506Discontinued operations, net of tax — (20) (170) 48 (448)
Net income (loss) attributable to The AES Corporation $ 306 $ 769 $ 114 $ (912) $ 58
Per Common Share Data Basic earnings (loss) per share:
Income (loss) from continuing operations attributable to The AES Corporation, net of tax $ 0.45 $ 1.10 $ 0.38 $ (1.27) $ 0.65Discontinued operations, net of tax — (0.03) (0.23) 0.06 (0.58)Basic earnings (loss) per share $ 0.45 $ 1.07 $ 0.15 $ (1.21) $ 0.07
Diluted earnings (loss) per share: Income (loss) from continuing operations attributable to The AES Corporation, net of tax $ 0.44 $ 1.09 $ 0.38 $ (1.27) $ 0.65Discontinued operations, net of tax — (0.03) (0.23) 0.06 (0.58)Diluted earnings (loss) per share $ 0.44 $ 1.06 $ 0.15 $ (1.21) $ 0.07
Dividends Declared Per Common Share $ 0.41 0.25 0.17 0.08 —
Cash Flow Data for the Years Ended December 31: Net cash provided by operating activities $ 2,134 $ 1,791 $ 2,715 $ 2,901 $ 2,884Net cash used in investing activities (2,366) (656) (1,774) (895) (4,906)Net cash provided by (used in) financing activities 28 (1,262) (1,136) (1,867) 1,412Total (decrease) increase in cash and cash equivalents (277) (103) (258) 276 (736)Cash and cash equivalents, ending 1,262 1,539 1,642 1,900 1,624
Balance Sheet Data at December 31: Total assets $ 36,850 $ 38,966 $ 40,411 $ 41,830 $ 45,346Non-recourse debt (noncurrent) 13,263 13,618 13,318 12,265 13,261Non-recourse debt (noncurrent)—Discontinued operations — — 124 322 1,369Recourse debt (noncurrent) 5,015 5,107 5,551 5,951 6,180Redeemable stock of subsidiaries 538 78 78 78 78Retained earnings (accumulated deficit) 143 512 (150) (264) 678The AES Corporation stockholders' equity 3,149 4,272 4,330 4,569 5,946
(1) On November 28, 2011, AES completed the acquisition of 100% of the common stock of DPL Inc. Its results of operations have been included in AES's consolidated results of operations from the date of acquisition.(2) Includes pretax impairment expense of $602 million , $383 million , $596 million , $1.9 billion , and $272 million for the years ended December 31, 2015 , 2014 , 2013 , 2012 and 2011 , respectively. See Note 9— Other Non-
Operating Expense , Note 10— Goodwill and Other Intangible Assets and Note 21— Asset Impairment Expense included in Item 8.— Financial Statements and Supplementary Data of this Form 10-K for further information.
ITEM 7. MANAGEMENT'S DISCUSSION AND ANALYSIS OF FINANCIAL CONDITION AND RESULTS OF OPERATIONS
Key Topics in Management's Discussion and Analysis
Our discussion covers the following:• Strategic Performance and Overview of 2015 Results• Review of Consolidated Results of Operations• SBU Performance Analysis• Key Trends and Uncertainties• Capital Resources and Liquidity
Overview of 2015 Results and Strategic PerformanceIn 2015, we faced tough macroeconomic headwinds, including up to 30% devaluation in some of our key currencies, including the Brazilian Real, Colombian
Peso and Euro. We also saw more than 40% declines in oil and natural gas prices, which have an impact on our businesses in the Dominican Republic, Ohio andNorthern Ireland. Additionally, Brazil's GDP continued to contract. Despite these continuing challenging conditions, we did what we are good at — adapted to thechanges in circumstances and took actions to mitigate their impact on our businesses and on our financial results. We successfully executed on our strategy andachieved the majority of our objectives by: delivering Proportional Free Cash Flow of $1,241 million , up 39% compared to 2014, and Adjusted EPS of $1.22 ;prudently allocating our capital; and advancing select platform expansion projects across our portfolio.
Management's Strategic Priorities
Management is focused on the following priorities:
78

• Reducing complexity: By exiting businesses and markets where we do not have a competitive advantage, we are simplifying our portfolio and reducingrisk. During 2015, we announced or closed $787 million in equity proceeds from the sales or sell-downs of seven businesses.
• Leveraging our platforms: We are focusing our growth on platform expansions in markets where we already operate and have a competitive advantage torealize attractive risk-adjusted returns. We currently have 5,620 MW under construction, representing $7 billion in total capital expenditures, with 85% ofAES' $1.2 billion in equity already funded. We expect the majority of these projects to come on-line through 2018. Beyond the projects we currently haveunder construction, we will continue to advance select projects from our development pipeline.
• Performance excellence: We strive to be the low-cost manager of a portfolio of assets and to derive synergies and scale from our businesses. InNovember, we launched a $150 million cost reduction and revenue enhancement initiative. This initiative will include overhead reductions, procurementefficiencies and operational improvements. We expect to achieve at least $50 million in savings in 2016, ramping up to $150 million, including modestrevenue enhancements, in 2018.
• Expanding access to capital: We are building strategic partnerships at the project and business level. Through these partnerships, we aim to optimize ourrisk-adjusted returns in our existing businesses and growth projects. By selling down portions of certain businesses, we can adjust our global exposure tocommodity, fuel, country and other macroeconomic risks. Partial sell-downs of our assets can also serve to highlight or enhance the value of businesses inour portfolio.
• Allocating capital in a disciplined manner: Our top priority is to maximize risk-adjusted returns to our shareholders, which we achieve by investing ourdiscretionary cash and recycling the capital we receive from asset sales and strategic partnerships. In 2015, we generated substantial cash by executing onour strategy, which we allocated in line with our capital allocation framework:◦ Used $345 million to prepay and refinance Parent debt;◦ returned $757 million to shareholders through share repurchases and quarterly dividends;
▪ increased our quarterly dividend by 10%, to $0.11 per share, beginning in the first quarter of 2016;◦ invested $114 million in our subsidiaries, largely for projects that are currently under construction.
2015 Strategic Performance
Earnings Per Share and Proportional Free Cash Flow Results in 2015 (in millions, except per share amounts)
Years Ended December 31, 2015 2014 2013Diluted earnings per share from continuing operations $ 0.44 $ 1.09 $ 0.38
Adjusted earnings per share (a non-GAAP measure) (1) 1.22 1.30 1.29Net cash provided by operating activities 2,134 1,791 2,715
Proportional Free Cash Flow (a non-GAAP measure) (1) 1,241 891 1,271_____________________________
(1) See reconciliation and definition under Non-GAAP Measures.
Diluted earnings per share from continuing operations decreased by 60% to $0.44 primarily due to higher impairment expense and lower gains from sales ofbusinesses, partially offset by lower debt extinguishment expense.
Adjusted EPS, a non-GAAP measure, decreased by 6% to $1.22 primarily due to the devaluation of foreign currencies in Latin America and Europe, theimpact of lower commodity prices in certain markets, and lower demand in Brazil. These negative impacts were partially offset by a 5% reduction in sharesoutstanding, lower Parent interest expense, improved hydrological conditions in Panama, and contributions from new businesses, including Mong Duong inVietnam.
Net cash provided by operating activities increased by 19% to $2.1 billion primarily due to the timing of collections in the Dominican Republic as well asincreases at the Parent Company primarily driven by lower interest payments and lower payments for capital expenditures, partially offset by collections on lowermargins resulting from economic slowdown, timing of energy purchases and higher interest payments in Brazil.
Proportional free cash flow increased by 39% to $1.2 billion primarily due to the timing of collections in the Dominican Republic as well as increases at theParent Company primarily driven by lower interest payments and lower payments for maintenance capital expenditures.
Safe Operations
Safety is our first value and a top priority. We consistently analyze and evaluate our safety performance in order to capture lessons learned and strengthenmitigation plans that improve our safety performance.
79

Review of Consolidated Results of OperationsYears Ended December 31, 2015 2014 2013 % Change 2015 vs. 2014 % Change 2014 vs. 2013
Results of operations (in millions, except per share amounts) Revenue:
US SBU $ 3,593 $ 3,826 $ 3,630 -6 % 5 %Andes SBU 2,489 2,642 2,639 -6 % — %Brazil SBU 4,666 6,009 5,015 -22 % 20 %MCAC SBU 2,353 2,682 2,713 -12 % -1 %Europe SBU 1,191 1,439 1,347 -17 % 7 %Asia SBU 684 558 550 23 % 1 %
Corporate and Other 31 15 7 107 % 114 %
Intersegment eliminations (44) (25) (10) -76 % -150 %Total Revenue 14,963 17,146 15,891 -13 % 8 %Operating Margin:
US SBU 621 699 668 -11 % 5 %Andes SBU 618 587 533 5 % 10 %Brazil SBU 600 742 871 -19 % -15 %MCAC SBU 543 541 543 — % — %Europe SBU 303 403 415 -25 % -3 %Asia SBU 149 76 169 96 % -55 %
Corporate and Other 33 53 25 -38 % 112 %
Intersegment eliminations (1) (13) 23 92 % -157 %Total Operating Margin 2,866 3,088 3,247 -7 % -5 %General and administrative expenses (196) (187) (220) 5 % -15 %Interest expense (1,436) (1,471) (1,482) -2 % -1 %Interest income 524 365 275 44 % 33 %Loss on extinguishment of debt (186) (261) (229) -29 % 14 %Other expense (65) (68) (76) -4 % -11 %Other income 83 124 125 -33 % -1 %Gain on sale of businesses 29 358 26 -92 % NMGoodwill impairment expense (317) (164) (372) 93 % -56 %Asset impairment expense (285) (91) (95) 213 % -4 %Foreign currency transaction gains (losses) 105 11 (22) 855 % 150 %Other non-operating expense — (128) (129) -100 % -1 %Income tax expense (465) (419) (343) 11 % 22 %Net equity in earnings of affiliates 105 19 25 453 % -24 %INCOME FROM CONTINUING OPERATIONS 762 1,176 730 -35 % 61 %Income (loss) from operations of discontinued businesses — 27 (27) -100 % 200 %Net loss from disposal and impairments of discontinued operations — (56) (152) -100 % -63 %NET INCOME 762 1,147 551 -34 % 108 %Noncontrolling interests: (Income) from continuing operations attributable to noncontrolling interests (456) (387) (446) 18 % -13 %Loss from discontinued operations attributable to noncontrolling interests — 9 9 -100 % — %NET INCOME ATTRIBUTABLE TO THE AES CORPORATION $ 306 $ 769 $ 114 -60 % 575 %AMOUNTS ATTRIBUTABLE TO THE AES CORPORATION COMMONSTOCKHOLDERS: Income from continuing operations, net of tax $ 306 $ 789 $ 284 -61 % 178 %Loss from discontinued operations, net of tax — (20) (170) -100 % -88 %Net income $ 306 $ 769 $ 114 -60 % 575 %Net cash provided by operating activities $ 2,134 $ 1,791 $ 2,715 19 % -34 %DIVIDENDS DECLARED PER COMMON SHARE $ 0.41 $ 0.25 $ 0.17 64 % 47 %_____________________________
NM — Not meaningful
Components of Revenue, Cost of Sales and Operating Margin — Revenue includes revenue earned from the sale of energy from our utilities and the

production of energy from our generation plants, which are classified as regulated and non-regulated on the Consolidated Statements of Operations, respectively.Revenue also includes the gains or losses on derivatives associated with the sale of electricity.
Cost of sales includes costs incurred directly by the businesses in the ordinary course of business. Examples include electricity and fuel purchases, O&Mcosts, depreciation and amortization expense, bad debt expense and recoveries, general administrative and support costs (including employee-related costs directlyassociated with the operations of the business). Cost of sales also includes the gains or losses on derivatives (including embedded derivatives other than foreigncurrency embedded derivatives) associated with the purchase of electricity or fuel.
Operating margin is defined as revenue less cost of sales.
80

Consolidated Revenue and Operating Margin — Executive Summary(in millions)
Year Ended December 31, 2015
Consolidated Revenue — Revenue decrease d $2.2 billion , or 13% , to $15.0 billion in 2015 compared to $17.1 billion in 2014 . This decrease was primarilydriven by unfavorable FX impacts of $2.5 billion , primarily in Brazil ($2.2 billion) and Colombia ($179 million). Additionally, there were lower volumes at theUS Utilities, primarily at DPL, and outages, milder weather, and lower demand at IPL. Finally, there were lower prices in the Dominican Republic and El Salvador(primarily resulting from lower pass-through costs). These decreases were partially offset by higher tariffs at Eletropaulo and Sul (including higher pass-throughcosts), the reversal of a contingent regulatory liability at Eletropaulo, higher capacity prices at DPL, and the commencement of principal operations at Mong Duongin April 2015.
Consolidated Operating margin — Operating margin decrease d $222 million , or 7% , to $2.9 billion in 2015 compared to $3.1 billion in 2014 . Thisdecrease was driven by unfavorable FX impacts of $368 million , primarily in Brazil ($235 million) and Colombia ($83 million). In addition, Brazil was impactedby lower demand, lower hydrology, and higher fixed costs and the Dominican Republic was impacted by lower commodities and lower availability. Thesedecreases were partially offset by the impact of higher tariffs in Brazil as discussed above, lower spot prices on energy purchases at Tietê, higher generation andlower energy purchases driven by improved hydrological conditions in Panama, higher prices at Chivor driven by a strong El Niño, and higher availability at Generand Masinloc.
Year Ended December 31, 2014
Consolidated Revenue — Revenue increase d $1.3 billion , or 8% , to $17.1 billion in 2014 compared to $15.9 billion in 2013. This increase was driven byhigher tariffs (primarily pass-through costs) at the Brazil Utilities and at IPL, higher spot prices at Tietê, and regulatory retail rate increases at DPL. These increaseswere partially offset by unfavorable FX impacts of $752 million , primarily in Brazil ($630 million), Argentina ($69 million) and Colombia ($30 million).
Consolidated Operating Margin — Operating margin decrease d $159 million , or 5% , to $3.1 billion in 2014 compared to $3.2 billion in 2013. Thisdecrease was driven by unfavorable FX impacts of $124 million , primarily in Brazil ($97 million). In addition, margins were negatively impacted by higher fixedcosts at Eletropaulo, lower hydrology and higher spot purchase prices Tietê, and lower availability at Kilroot, Maritza, and Masinloc. These decreases werepartially offset by higher tariffs and a non-recurring 2013 charge related to the recognition of a contingent regulatory liability at Eletropaulo, and higher generationvolumes and prices at Chivor.
See Item 7. —SBU Performance Analysis of this Form 10-K for additional discussion and analysis of operating results for each SBU.
Consolidated Results of Operations — OtherGeneral and administrative expenses
General and administrative expenses include expenses related to corporate staff functions and/or initiatives, executive management, finance, legal, humanresources and information systems, as well as global development costs.
General and administrative expenses increase d $9 million , or 5% , to $196 million in 2015 from 2014 primarily due to increased business development costsand employee-related costs partially offset by decreased professional fees.
General and administrative expenses decrease d $33 million , or 15% , to $187 million in 2014 from 2013 primarily due to lower employee-related costs andbusiness development costs.
81

Interest expense
Interest expense decrease d $35 million , or 2% , to $1.4 billion in 2015 from $1.5 billion in 2014 . The decrease was primarily attributable to lower interestexpense of $63 million at the Parent Company due to a reduction in debt principal, and a $64 million reversal of interest expense previously recognized on acontingent regulatory liability at Eletropaulo. These decreases were partially offset by an increase at Mong Duong as the plant commenced operations in the firsthalf of 2015 and ceased capitalizing interest, as well as the impact of the 2014 contingent interest reversal at Sul discussed below.
Interest expense decrease d $ 11 million , or 1% , to $1.5 billion in 2014 from $1.5 billion in 2013 . This decrease was primarily attributable to lower interestexpense of $53 million at the Parent Company due to a reduction in debt principal, and a $48 million reversal of contingent interest accruals associated withdisputed purchased energy obligations at Sul for which it was determined, based on developments during the second quarter of 2014, that the likelihood of anunfavorable outcome for the payment of interest on the disputed obligation was no longer probable. These decreases were partially offset by income of $34 millionin the prior year resulting from the ineffectiveness on derivative interest rate swaps accounted for as cash flow hedges at Puerto Rico, and higher interest expenseof $24 million at Gener due to an increase in debt principal.
Interest income
Interest income increase d $159 million , or 44% , to $524 million in 2015 from $365 million in 2014 . The increase was primarily due to interest income of$114 million recognized in 2015 on the financing element of the service concession arrangement at Muong Duong, as well as an increase of $54 million atEletropaulo and Sul resulting from higher interest rates and an increase in regulatory assets.
Interest income increase d $90 million , or 33% , to $365 million in 2014 from $275 million in 2013 . The increase was primarily due to interest income of$59 million recognized on FONINVEMEM III receivables in Argentina, which satisfied the criteria for revenue recognition in the fourth quarter of 2014, as well asan increase of $23 million at Eletropaulo resulting from higher interest rates and an increase in regulatory assets. See Note 7 — Financing Receivables included inItem 8.— Financial Statements and Supplementary Data of this Form 10-K for further information.
Loss on extinguishment of debt
Loss on extinguishment of debt was $186 million for the year ended December 31, 2015 . This loss was primarily related to expense of $105 million, $22million, and $19 million recognized on debt extinguishments at the Parent Company, IPL, and the Dominican Republic, respectively.
Loss on extinguishment of debt was $261 million for the year ended December 31, 2014 . This loss was primarily related to expense of $193 million, $31million, and $20 million recognized on debt extinguishments at the Parent Company, DPL, and Gener, respectively.
Loss on extinguishment of debt was $229 million for the year ended December 31, 2013. This was primarily related to debt extinguishments at the ParentCompany and at Masinloc. See Note 12 — Debt included in Item 8.— Financial Statements and Supplementary Data of this Form 10-K for further information.
Other income and expense
Other income was $83 million , $124 million , and $125 million for the years ended December 31, 2015 , 2014 , and 2013 , respectively. Other expense was$65 million , $68 million , and $76 million for the years ended December 31, 2015 , 2014 , and 2013 , respectively. See Note 20 — Other Income and Expenseincluded in Item 8.— Financial Statements and Supplementary Data of this Form 10-K for further information.
Gain on sale of businesses
Gain on sale of businesses was $29 million for the year ended December 31, 2015 , which was primarily related to the sale of Armenia Mountain.
Gain on sale of businesses was $358 million for the year ended December 31, 2014 , which was primarily related to the sale of 45% of the Company'sinterest in Masinloc, as well as the sale of U.K. Wind (Operating Projects).
Gain on disposal and sale of investments for the year ended December 31, 2013 was $26 million , which was primarily related to the sale of our remaining20% interest in Cartagena as well as the sale of our 10% equity interest in Trinidad Generation Unlimited. See Note 8 — Investments in and Advances to Affiliates,Note 16 — Equity, and Note 24 — Dispositions and Held-For-Sale Businesses included in Item 8.— Financial Statements and Supplemental Data of this Form 10-K for further information.
Goodwill impairment expense
The Company recognized goodwill impairment expense of $317 million , $164 million , and $372 million for the years
82

ended December 31, 2015 , 2014 , and 2013 , respectively. See Note 10 — Goodwill and Other Intangible Assets included in Item 8.— Financial Statements andSupplementary Data of this Form 10-K for further information.
Asset impairment expense
The Company recognized asset impairment expense of $285 million , $91 million and $95 million for the years ended December 31, 2015 , 2014 , and 2013 ,respectively. See Note 21 — Asset Impairment Expense included in Item 8.— Financial Statements and Supplementary Data of this Form 10-K for furtherinformation.
Income tax expense
Income tax expense increase d $46 million , or 11% , to $465 million in 2015 . The Company's effective tax rates were 41% and 27% for the years endedDecember 31, 2015 and 2014 , respectively.
The net increase in the 2015 effective tax rate was due, in part, to the current year nondeductible impairment of goodwill at our U.S. utility, DPL and Chileanwithholding taxes offset by the release of valuation allowance at certain of our businesses in Brazil, Vietnam and the U.S. Further, the 2014 rate was impacted bythe items described below.
Income tax expense increase d $76 million , or 22% , to $419 million in 2014 . The Company's effective tax rates were 27% and 33% for the years endedDecember 31, 2014 and 2013 , respectively.
The net decrease in the 2014 effective tax rate was due, in part, to the 2014 sale of approximately 45% of the Company's interest in Masin AES Pte Ltd.,which owns the Company's business interests in the Philippines, and the 2014 sale of the Company's interests in four U.K. wind operating projects. Neither of thesetransactions gave rise to income tax expense. Further, the 2014 effective tax rate benefited from the release of valuation allowance against U.S. capital losscarryforwards and a change in tax status at a subsidiary operating in the Dominican Republic. Offsetting these items is the unfavorable impact of Chilean incometax law reform enacted in the third quarter of 2014. See Note 16 — Equity for additional information regarding the sale of approximately 45% of the Company'sinterest in Masin-AES Pte Ltd. See Note 24 — Dispositions and Held-for-Sale Businesses for additional information regarding the sale of the Company's interestsin four U.K wind operating projects.
Our effective tax rate reflects the tax effect of significant operations outside the U.S., which are generally taxed at rates lower than the U.S. statutory rate of35%. A future proportionate change in the composition of income before income taxes from foreign and domestic tax jurisdictions could impact our periodiceffective tax rate. The Company also benefits from reduced tax rates in certain countries as a result of satisfying specific commitments regarding employment andcapital investment. See Note 22 — Income Taxes for additional information regarding these reduced rates.
Foreign currency transaction gains (losses)
Foreign currency transaction gains (losses) in millions were as follows:
Years Ended December 31, 2015 2014 2013Argentina $ 124 $ 66 $ 2Colombia 29 17 6United Kingdom 11 12 2Philippines 8 11 (10)Brazil (6) (4) (12)Mexico (6) (14) —Chile (18) (30) (20)AES Corporation (31) (34) 5Other (6) (13) 5
Total (1) $ 105 $ 11 $ (22)
___________________________________________(1) Includes gains of $247 million , $172 million and $60 million on foreign currency derivative contracts for the years ended December 31, 2015 , 2014 and 2013 , respectively.
The Company recognized a net foreign currency transaction gain of $105 million for the year ended December 31, 2015 primarily due to gains of:
• $124 million in Argentina, due to the favorable impact from foreign currency derivatives related to government receivables, partially offset by losses fromthe devaluation of the Argentine Peso associated with U.S. Dollar denominated debt, and losses at Termoandes (a U.S. Dollar functional currencysubsidiary) primarily associated with cash and accounts receivable balances in local currency,
• $29 million in Colombia, primarily due to the depreciation of the Colombian Peso, positively impacting Chivor (a U.S. Dollar functional currencysubsidiary) due to liabilities denominated in Colombian Pesos,
• $11 million in the United Kingdom, primarily due to the depreciation of the Pound Sterling, resulting in gains at Ballylumford Holdings (a U.S. Dollarfunctional currency subsidiary) associated with intercompany notes payable
83

denominated in Pound Sterling, and
These gains were partially offset by losses of:
• $31 million at The AES Corporation primarily due to decreases in the valuation of intercompany notes receivable denominated in foreign currency,resulting from the weakening of the Euro and British Pound during the year, partially offset by gains related to foreign currency option purchases, and
• $18 million in Chile primarily due to the devaluation of the Chilean Peso at Gener (a U.S. Dollar functional currency subsidiary) from working capitaldenominated in Chilean Pesos, partially offset by gains on foreign currency derivatives.
The Company recognized a net foreign currency transaction gain of $11 million for the year ended December 31, 2014 primarily due to gains of:
• $66 million in Argentina, due to the favorable impact from foreign currency derivatives related to government receivables, partially offset by losses fromthe devaluation of the Argentine Peso associated with U.S. Dollar denominated debt, and losses at Termoandes (a U.S. Dollar functional currencysubsidiary) primarily associated with cash and accounts receivable balances in local currency, and the purchase of Argentine sovereign bonds,
• $17 million in Colombia, primarily due to a 23% depreciation of the Colombian Peso, positively impacting Chivor (a U.S. Dollar functional currencysubsidiary) due to liabilities denominated in Colombian Pesos, primarily income tax payable and accounts payable,
• $12 million in the United Kingdom, primarily due to a 6% depreciation of the Pound Sterling, resulting in gains at Ballylumford Holdings (a U.S. Dollarfunctional currency subsidiary) associated with intercompany notes payable denominated in Pound Sterling, and gains related to foreign currencyderivatives, and
• $11 million in the Philippines, primarily due to amortization of frozen embedded derivatives and a 4% appreciation of the Philippine Peso against the U.S.Dollar, resulting in a revaluation of cash accounts, customer receivables, and deferred tax asset.
These gains were partially offset by losses of:
• $34 million at The AES Corporation primarily due to decreases in the valuation of intercompany notes receivable denominated in foreign currency,resulting from the weakening of the Euro and British Pound during the year, partially offset by gains related to foreign currency option purchases,
• $30 million in Chile primarily due to a 16% devaluation of the Chilean Peso, resulting in a $39 million loss at Gener (a U.S. Dollar functional currencysubsidiary) from working capital denominated in Chilean Pesos, primarily cash, accounts receivable and VAT receivables, partially offset by income of$9 million on foreign currency derivatives, and
• $14 million in Mexico, primarily due to a 13% devaluation of the Mexican Peso, resulting in a loss at TEGTEP and Merida (U.S. Dollar functionalcurrency subsidiaries) from working capital denominated in Pesos (primarily cash, recoverable tax, and VAT).
The Company recognized a net foreign currency transaction loss of $22 million for the year ended December 31, 2013 primarily due to losses of:
• $20 million in Chile, primarily due to a 9% weakening of the Chilean Peso, resulting in losses at Gener (a U.S. Dollar functional currency subsidiary)associated with net working capital denominated in Chilean Pesos, mainly cash, accounts receivables and tax receivables, partially offset by gains relatedto foreign currency derivatives,
• $12 million in Brazil, primarily due to a 15% weakening of the Brazilian Real resulting in losses mainly associated with U.S. Dollar denominatedliabilities, and
• $10 million in the Philippines (a U.S. Dollar functional currency subsidiary beginning in 2013), primarily due to the 8% weakening of the Philippine Peso,resulting in revaluation of cash accounts, customer receivables and deferred tax assets.
Other non-operating expense
Other non-operating expense was zero , $128 million and $129 million for the years ended December 31, 2015 , 2014 and 2013 , respectively. See Note 9 —Other Non-Operating Expense included in Item 8.— Financial Statements and Supplementary Data of this Form 10-K for further information.
Net equity in earnings of affiliates
Net equity in earnings of affiliates increase d $86 million , or 453% , to $105 million in 2015 from $19 million in 2014 . The increase was primarily due tothe 2015 restructuring of Guacolda in Chile, which increased the Company's equity investment and resulted in additional equity earnings, as well as the 2014impairment at Elsta discussed below.
84

Net equity in earnings of affiliates decrease d $6 million to $19 million in 2014 from $25 million in 2013 . The decrease was primarily a result of an assetimpairment charge at Elsta due to long lived assets that were determined to not be recoverable of which our share was $41 million. These items were partiallyoffset by a $22 million lower loss recognized at Entek on an embedded foreign currency derivative and a $19 million increase as a result of the sale of equityinterests in SRP. See Note 8 — Investments in and Advances to Affiliates included in Item 8.— Financial Statements and Supplementary Data of this Form 10-Kfor further information.
Income from continuing operations attributable to noncontrolling interests
Income from continuing operations attributable to noncontrolling interests increase d $69 million , or 18% , to $456 million in 2015 from $387 million in2014 as a result of:
• an increase at Mong Duong due to commencement of operations in the current year,
• an increase at Gener primarily due to the restructuring of Guacolda,• an increase at Masinloc due to increased earnings and the 2014 sale of a noncontrolling interest in that business
Partially offset by
• a decrease at Buffalo Gap III resulting from the asset impairment expense allocation to the tax equity partner, and• a decease at Eletropaulo resulting from unfavorable foreign exchange and lower demand.
Income from continuing operations attributable to noncontrolling interests decrease d $59 million , or 13% , to $387 million in 2014 from $446 million in2013 as a result of:
• a decrease at Tietê due to lower earnings resulting from poor hydrology and increased prices for purchased energy,• a decrease at Uruguaiana due to a favorable arbitration settlement in 2013, and• a decrease at Panama related to poor hydrology.
Loss from discontinued operations
Total loss from discontinued operations was zero , $29 million , and $179 million for the years ended December 31, 2015 , 2014 and 2013 , respectively. SeeNote 23 — Discontinued Operations included in Item 8.— Financial Statements and Supplementary Data of this Form 10-K for further information.
Net income attributable to The AES Corporation
Net income attributable to The AES Corporation decrease d $463 million to $306 million in 2015 from $769 million in 2014 . The key drivers of the decreaseincluded:
• Higher impairment expense• Lower gains from the sale of businesses
These increases were partially offset by:
• Lower debt extinguishment expense
Net income attributable to The AES Corporation increased $655 million to $769 million in 2014 from $114 million in 2013 . The key drivers of the increaseincluded:
• Higher gains from the sale of businesses
• Lower impairment expense
• Lower general and administrative expenses
SBU Performance AnalysisNon-GAAP Measures
Adjusted Operating Margin, Adjusted PTC, Adjusted EPS, and Proportional Free Cash Flow are non-GAAP supplemental measures that are used bymanagement and external users of our consolidated financial statements such as investors, industry analysts and lenders.
Adjusted Operating Margin — Operating Margin is defined as revenue less cost of sales. Cost of sales includes costs incurred directly by the businesses inthe ordinary course of business, such as Electricity and fuel purchases; O&M costs; Depreciation and amortization expense; Bad debt expense & recoveries;General administrative & support costs at the businesses; and Gains or losses on derivatives associated with the purchase and sale of electricity or fuel.
We define Adjusted Operating Margin as Operating Margin, adjusted for the impact of noncontrolling interests, excluding
85

unrealized gains or losses related to derivative transactions.
The GAAP measure most comparable to Adjusted Operating Margin is Operating Margin. We believe that Adjusted Operating Margin better reflects theunderlying business performance of the Company. Factors in this determination include the impact of noncontrolling interests, where AES consolidates the resultsof a subsidiary that is not wholly-owned by the Company, as well as the variability due to unrealized derivatives gains or losses. Adjusted Operating Margin shouldnot be construed as an alternative to Operating Margin, which is determined in accordance with GAAP.
Adjusted PTC and Adjusted EPS — We define Adjusted PTC as pretax income from continuing operations attributable to The AES Corporation excludinggains or losses due to (a) unrealized gains or losses related to derivative transactions, (b) unrealized foreign currency gains or losses, (c) gains or losses due todispositions and acquisitions of business interests, (d) losses due to impairments, and (e) costs due to the early retirement of debt.
Adjusted PTC reflects the impact of noncontrolling interests and excludes the items specified in the definition above. In addition to the revenue and cost ofsales reflected in Operating Margin, Adjusted PTC includes the other components of our income statement, such as General and administrative expense in thecorporate segment, as well as business development costs; Interest expense and interest income; Other expense and other income; Realized foreign currencytransaction gains and losses; and Net equity in earnings of affiliates.
We define Adjusted EPS as diluted earnings per share from continuing operations excluding gains or losses due to (a) unrealized gains or losses related toderivative transactions, (b) unrealized foreign currency gains or losses, (c) gains or losses due to dispositions and acquisitions of business interests, (d) losses due toimpairments, and (e) costs due to the early retirement of debt.
The GAAP measure most comparable to Adjusted PTC is income from continuing operations attributable to The AES Corporation. The GAAP measure mostcomparable to Adjusted EPS is diluted earnings per share from continuing operations. We believe that Adjusted PTC and Adjusted EPS better reflect theunderlying business performance of the Company and are considered in the Company's internal evaluation of financial performance. Factors in this determinationinclude the variability due to unrealized gains or losses related to derivative transactions, unrealized foreign currency gains or losses, losses due to impairments andstrategic decisions to dispose of or acquire business interests or retire debt, which affect results in a given period or periods. In addition, for Adjusted PTC, earningsbefore tax represents the business performance of the Company before the application of statutory income tax rates and tax adjustments, including the effects of taxplanning, corresponding to the various jurisdictions in which the Company operates. Adjusted PTC and Adjusted EPS should not be construed as alternatives toincome from continuing operations attributable to The AES Corporation and diluted earnings per share from continuing operations, which are determined inaccordance with GAAP.
Proportional Free Cash Flow — Refer to Item 7— Management's Discussion and Analysis of Financial Condition and Results of Operations—CapitalResources and Liquidity—Proportional Free Cash Flow (A non-GAAP Measure) for the discussion and reconciliation of Proportional Free Cash Flow to its nearestGAAP measure.
Reconciliations of Non-GAAP Measures
Adjusted Operating Margin (in millions) Years Ended December 31,
2015 2014 2013
US $ 598 $ 711 $ 684
Andes 466 444 402
Brazil 136 235 271
MCAC 438 482 472
Europe 276 373 392
Asia 70 51 159
Corp/Other 33 53 25
Intersegment eliminations (1) (13) 23
Total Adjusted Operating Margin 2,016 2,336 2,428
Noncontrolling interests adjustment 869 760 833
Derivatives adjustment (19) (8) (14)
Operating Margin $ 2,866 $ 3,088 $ 3,247
86

Adjusted PTC (in millions)Year Ended December 31,
Total Adjusted PTC Intersegment External Adjusted PTC
2015 2014 2013 2015 2014 2013 2015 2014 2013US SBU $ 360 $ 445 440 $ 12 $ 10 11 $ 372 $ 455 $ 451Andes SBU 482 421 353 17 6 19 499 427 372Brazil SBU 91 242 212 2 3 3 93 245 215MCAC SBU 327 352 339 18 26 12 345 378 351Europe SBU 235 348 345 5 5 7 240 353 352Asia SBU 96 46 142 3 2 2 99 48 144Corporate and Other (441) (533) (624) (57) (52) (54) (498) (585) (678)Total Adjusted Pretax Contribution 1,150 1,321 1,207 — — — 1,150 1,321 1,207
Reconciliation to income from continuing operations, net of tax, attributable to The AES Corporation: Non-GAAP Adjustments: Unrealized derivative gains 166 135 57Unrealized foreign currency losses (96) (110) (41)Disposition/acquisition gains 42 361 30Impairment losses (504) (416) (588)Loss on extinguishment of debt (183) (274) (225)Pre-tax contribution 575 1,017 440Income tax expense attributable to The AES Corporation 269 228 156Income from continuing operations, net of tax, attributable to The AES Corporation $ 306 $ 789 $ 284
Adjusted EPS Years Ended December 31, 2015 2014 2013
Diluted earnings per share from continuing operations $ 0.44 $ 1.09 $ 0.38
Unrealized derivative (gains) (1) (0.16) (0.12) (0.05)
Unrealized foreign currency transaction losses (2) 0.12 0.14 0.02 Disposition/acquisition (gains) (0.03) (3) (0.59) (4) (0.03) (5)
Impairment losses 0.67 (6) 0.53 (7) 0.75 (8)
Loss on extinguishment of debt 0.18 (9) 0.25 (10) 0.22 (11)
Adjusted EPS $ 1.22 $ 1.30 $ 1.29 _____________________________(1) Unrealized derivatives were net of income tax expense per share of $ (0.08) , $ (0.07) and $ (0.02) in 2015 , 2014 , and 2013 , respectively.(2) Unrealized foreign currency transaction losses were net of income tax benefit per share of $ 0.03 , $ 0.02 and $ 0.02 in 2015 , 2014 , and 2013 , respectively.(3) Amount primarily relates to the gain from the sale of Solar Spain and Solar Italy of $ 7 million ($ 20 million, or $ 0.03 per share, including income tax benefit per share of $ 0.02 ), the gain from the sale of Armenia Mountain of $
22 million ($ 14 million, or $ 0.02 per share, net of income tax expense per share of $ 0.01 ), and the loss from the tax consequences associated with the sale of a noncontrolling interest in Gener of $ 25 million, or $ 0.04 per share.(4) Amount primarily relates to the gain from the sale of a noncontrolling interest in Masinloc of $ 283 million ($ 0.39 per share, net of income tax per share of $ 0.00 ), the gain from the sale of the U.K. wind projects of $ 78 million
($ 0.11 per share, net of income tax per share of $ 0.00 ), the loss from the liquidation of AgCert International of $ 1 million (net benefit of $ 18 million, or $ 0.03 per share, including income tax benefit per share of $ 0.03 ), the taxbenefit of $ 24 million ($ 0.03 per share) related to the Silver Ridge Power transaction, and the tax benefit of $ 18 million ($ 0.02 per share) associated with the agreement executed in December 2014 to sell a noncontrollinginterest in IPALCO .
(5) Amount primarily relates to the gain from the sale of Cartagena of $ 20 million ($ 15 million, or $ 0.02 per share, net of income tax benefit per share of $ 0.01 ).(6) Amount primarily relates to the goodwill impairment at DPL of $317 million ( $0.46 per share, net of income tax per share of $0.00 ) and asset impairments at Kilroot of $ 121 million ($ 95 million, or $ 0.14 per share, net of
income tax benefit per share of $ 0.03 ), at U.K. Wind (Development Projects) of $ 38 million ($ 24 million, or $ 0.04 per share, net of income tax benefit per share of $ 0.01 ), and at Buffalo Gap III of $ 116 million ($ 18 million,or $ 0.03 per share, net of income tax benefit per share of $ 0.01 ).
(7) Amount primarily relates to the goodwill impairments at DPLER of $ 136 million ($ 0.19 per share, net of income tax per share of $ 0.00 ), and at Buffalo Gap of $ 28 million ($ 0.04 per share, net of income tax per share of $ 0.00), and asset impairments at Ebute of $ 67 million ($ 64 million, or $ 0.09 per share, net of income tax benefit per share of $ 0.00 ), and at Elsta of $ 41 million ($ 31 million, or $ 0.04 per share, net of income tax benefit per share of$ 0.01 ), and the other-than-temporary impairments at Silver Ridge Power of $ 42 million ($ 27 million, or $ 0.04 per share, net of income tax benefit per share of $ 0.02 ), and at Entek of $ 86 million ($ 0.12 per share, net ofincome tax benefit per share of $ 0.00 ).
(8) Amount primarily relates to the goodwill impairments at DPL of $ 307 million ($ 0.41 per share, net of income tax per share of $ 0.00 ) and at Ebute of $ 58 million ($ 0.08 per share, net of income tax per share of $ 0.00 ), theother-than-temporary impairment at Elsta of $ 129 million ($ 128 million, or $ 0.17 per share, net of income tax benefit per share of $ 0.00 ) and the asset impairments at Beaver Valley of $ 46 million ($ 30 million, or $ 0.04 pershare, net of income tax benefit per share of $ 0.02 ), and at DPL of $ 26 million ($ 17 million, or $ 0.02 per share, net of income tax benefit per share of $ 0.01 ).
(9) Amount primarily relates to the loss on early retirement of debt at the Parent Company of $ 116 million ($ 75 million, or $ 0.11 per share, net of income tax benefit per share of $ 0.06 ) and at IPL of $ 22 million ($ 11 million, or $0.02 per share, net of income tax benefit per share of $ 0.01 ).
(10) Amount primarily relates to the loss on early retirement of debt at the Parent Company of $ 200 million ($ 130 million, or $ 0.18 per share, net of income tax benefit per share of $ 0.10 ), at DPL of $ 31 million ($ 20 million, or $0.03 per share, net of income tax benefit per share of $ 0.02 ), at Electrica Angamos of $ 20 million ($ 11 million, or $ 0.02 per share, net of income tax benefit per share of $ 0.00 ), at U.K. wind projects of $ 18 million ($ 15million, or $ 0.02 per share, net of income tax benefit per share of $ 0.00 ).
(11) Amount primarily relates to the loss on early retirement of debt at Parent Company of $ 165 million ($ 107 million, or $ 0.14 per share, net of income tax benefit per share of $ 0.08 ), at Masinloc of $ 43 million ($ 39 million, or $0.05 per share, net of income tax per share of $ 0.00 ) and at Changuinola of $ 14 million ($ 10 million, or $ 0.01 per share, net of income tax benefit per share of $ 0.01 ).
87

US SBUA summary of Operating Margin, Adjusted Operating Margin, Adjusted PTC, and Proportional Free Cash Flow ($ in millions) is as follows:
For the Years Ended December 31, 2015 2014 2013 $ Change 2015 vs.2014 $ Change 2014 vs.
2013 % Change 2015 vs.2014 % Change 2014 vs.
2013
Operating Margin $ 621 $ 699 $ 668 $ (78) $ 31 -11 % 5 %Noncontrolling Interests Adjustment (38) — — Derivatives Adjustment 15 $ 12 16
Adjusted Operating Margin $ 598 $ 711 $ 684 $ (113) $ 27 -16 % 4 %Adjusted PTC $ 360 $ 445 $ 440 $ (85) $ 5 -19 % 1 %Proportional Free Cash Flow $ 591 $ 646 $ 689 $ (55) $ (43) -9 % -6 %
Fiscal year 2015 versus 2014
Operating margin decrease d $78 million , or 11% , which was driven primarily by the following:
DPL Impact of more of DP&L's generation being sold in the wholesale market at lower prices in 2015 compared to supplying DP&L retail customers in 2014, lower generationdriven by plant outages in 2015, and unfavorable weather; partially offset by the impact of outages and lower gas availability occurring in Q1 2014 $ (53)Increase in capacity margin due to increase in PJM capacity price 26
Total DPL Decrease(27)
IPL Lower wholesale margin due to lower market prices of electricity and outages (26)Higher retail margins 20Higher fixed costs primarily due to higher maintenance expense attributed to plant outages and higher depreciation expense due to MATS assets (18)Other (1)
Total IPL Decrease(25)
US Generation
Lower production and prices across the US Wind businesses(20)
Lower availability and dispatch at Hawaii (10)
Other4
Total US Generation Decrease(26)
Total US SBU Operating Margin Decrease $ (78)
Adjusted Operating Margin decrease d $113 million for the US SBU due to the drivers above, excluding the impact of unrealized derivative gains and lossesand proportional share adjustments. AES owns 100% of its businesses in the US with the exception of IPL with ownership of 85% beginning in February 2015 and75% beginning in April 2015. AES owned 100% of IPL prior to February 2015.
Adjusted PTC decrease d $85 million driven by the decrease of $113 million in Adjusted Operating Margin described above and a decrease in the Company'sshare of earnings under the HLBV allocation of noncontrolling interest at Buffalo Gap, partially offset by IPL due to lower interest expense related to the impact ofthe sell down and increased AFUDC, and DPL due to lower interest expense.
Proportional Free Cash Flow decreased $55 million , which includes the $113 million decrease in Adjusted Operating Margin as described above as well as a$22 million increase in maintenance and non-recoverable capital expenditures, partially offset by the collection of previously deferred storm costs, a one-timepayment in 2014 to terminate an unfavorable coal contract, higher collections and the timing of inventory payments at DPL. Cash was also favorably impacted bythe timing of collections and payments for energy at IPL as well as a reduction in interest payments.
88

Fiscal year 2014 versus 2013
Operating margin increase d by $31 million , or 5% , which was driven primarily by the following:
U.S. Generation
Increased availability at Hawaii$ 11
Increased market prices at Laurel Mountain 8
Completion of the Tait energy storage project in September 20138
Other(1)
Total US Generation Increase26
IPL Higher wholesale margin 14Lower fixed costs, primarily due to lower pension expense 11
Other(1)
Total IPL Increase24
DPL
Impact from the timing of outages, resulting in higher purchased power and related costs, lower gas availability and higher demand during the peak of cold weather in Q1 2014,as well as increased customer switching to third party CRES providers
(71)Higher rates resulting from increased retail prices, lower fuel costs, and higher capacity prices 57
Other(5)
Total DPL Decrease(19)
Total US SBU Operating Margin Increase $ 31
Adjusted Operating Margin increase d $27 million due to the drivers above, excluding the impact of unrealized derivative gains and losses. AES owned 100%of its businesses in the US in 2014, so there is no adjustment for noncontrolling interests.
Adjusted PTC increase d $5 million driven by net gains of $53 million recognized resulting from the early termination of the PPA and coal supply contract atBeaver Valley during the first quarter of 2013, largely offset by an increase of $27 million in Adjusted Operating Margin described above as well as an increase inthe Company's share of earnings under the HLBV allocation of noncontrolling interest at Buffalo Gap and Armenia Wind of $13 million and settlements at LaurelMountain of $6 million.
Proportional Free Cash Flow decreased $43 million driven by the one-time cash receipt in 2013 upon the early termination of the PPA at Beaver Valley aswell as the timing of legal settlements at Laurel Mountain as described above. Additionally, cash was unfavorably impacted by the timing of payments at IPL forenergy, maintenance and inventory and a one-time payment at DPL in the fourth quarter of 2014 to terminate an unfavorable coal contract. These unfavorableimpacts were partially offset by the $27 million increase in Adjusted Operating Margin as described above, a $ 51 million reduction in maintenance capitalexpenditures, primarily at our Utility businesses, as well as the timing of fuel payments and a reduction in interest payments at DPL.
ANDES SBUA summary of Operating Margin, Adjusted Operating Margin, Adjusted PTC, and Proportional Free Cash Flow ($ in millions) is as follows:
For the Years Ended December 31, 2015 2014 2013 $ Change 2015 vs.2014 $ Change 2014 vs.
2013 % Change 2015 vs.2014 % Change 2014 vs.
2013
Operating Margin $ 618 $ 587 $ 533 $ 31 $ 54 5% 10 %Noncontrolling Interests Adjustment (152) (143) (131)
Adjusted Operating Margin $ 466 $ 444 $ 402 $ 22 $ 42 5% 10 %Adjusted PTC $ 482 $ 421 $ 353 $ 61 $ 68 14% 19 %Proportional Free Cash Flow $ 224 $ 176 $ 188 $ 48 $ (12) 27% -6 %
89

Fiscal year 2015 versus 2014
Including the unfavorable impact of foreign currency translation and remeasurement of $87 million , operating margin increase d $31 million , or 5% , whichwas driven primarily by the following:
Gener Higher margins associated to Nueva Renca Plant tolling agreement $ 26Higher volume of energy sales mainly related to higher availability 21Other (2)
Total Gener Increase45
Argentina Higher rates driven by an annual price review and additional contributions introduced by Resolution 482 49Higher fixed costs primarily driven by higher inflation and by higher maintenance cost (45)Unfavorable FX remeasurement impacts (4)Other 4
Total Argentina Increase4
Chivor Unfavorable FX remeasurement impacts (83)Higher rates driven by a strong El Niño impact on prices 60Higher volume of energy sales mainly associated to higher generation 12Other (7)
Total Chivor Decrease(18)
Total Andes SBU Operating Margin Increase $ 31
Adjusted Operating Margin increase d $22 million for the year due to the drivers above, adjusted for the impact of noncontrolling interests. AES owned 71%of Gener and Chivor prior to sell down effective December 2015 which resulted in ownership of 67%. AES Argentina is owned 100%. The Alto Maipo andCochrane plants under construction are owned 40%.
Adjusted PTC increase d $61 million , driven by a restructuring of Guacolda in Chile which increased our equity investment and resulted in additional equityin earnings of $46 million, realized FX gains, lower interest expense at Chivor and the increase of $22 million in Adjusted Operating Margin described above. Thiswas partially offset by lower equity earnings at Guacolda of $16 million (excluding restructuring impact above) mainly driven by a 2014 gain on sale of atransmission line.
Proportional Free Cash Flow increased $48 million , primarily driven by higher VAT refunds at Cochrane and Alto Maipo, the timing of non-recurringmaintenance collections at Alicura, a decrease in interest payments as well as a $17 million net reduction in maintenance and non-recoverable environmentalcapital expenditures. Excluding the $22 million collection delay resulting from the various resolutions passed by the Argentine government (as discussed in Note 7— Financing Receivables ), Adjusted Operating Margin decreased by $4 million due to the drivers discussed above. Additionally, cash flow was negativelyimpacted by higher tax payments and lower collections from contract customers at Chivor as well as a one-time swap termination payment at Ventanas.
Fiscal year 2014 versus 2013
Including the unfavorable impact of foreign currency translation and remeasurement of $14 million , operating margin for 2013 increase d $54 million , or10% , which was driven primarily by the following:
Chivor
Higher generation, higher spot and contract prices, and higher ancillary services$ 72
Higher maintenance costs(12)
Unfavorable FX impacts (9)Other 4
Total Chivor Increase55
Argentina Higher rates as a result of the impact of Resolution 529 30Higher generation and availability 13Higher fixed costs driven by higher inflation (27)Unfavorable FX impacts (5)Other (3)

Total Argentina Increase8
Gener Lower contract prices, spot prices in the SADI, and lower Energy Plus margin (32)Lower availability (9)Contributions from Ventanas IV, which commenced operations in March 2013 10Lower fixed costs, primarily lower maintenance and salaries 19Other 3
Total Gener Decrease(9)
Total Andes SBU Operating Margin Increase $ 54
90

Adjusted Operating Margin increase d $42 million for the year due to the drivers above, adjusted for the impact of noncontrolling interests. AES owned 71%of Gener and Chivor and 100% of AES Argentina.
Adjusted PTC increase d $68 million driven by the increase of $42 million in Adjusted Operating Margin described above, and a net benefit of $45 millionrelated to FONINVEMEM interest income on receivables in 2014 and 2013, partially offset by realized FX losses at Gener as well as non-recurring equity taxreversal of $8 million at Chivor in 2013.
Proportional Free Cash Flow decreased $12 million driven by an increase in interest payments, higher payments for VAT at our Cochrane plant, a one-timeswap termination payment at Angamos as well as a $3 million net increase in maintenance and non-recoverable environmental capital expenditures. Theseunfavorable impacts were partially offset by the $42 million increase in Adjusted Operating Margin as described above as well a reduction in tax payments atChivor and Gener.
BRAZIL SBUA summary of Operating Margin, Adjusted Operating Margin, Adjusted PTC, and Proportional Free Cash Flow ($ in millions) is as follows:
For the Years Ended December 31, 2015 2014 2013 $ Change 2015 vs.2014 $ Change 2014 vs.
2013 % Change 2015 vs.2014 % Change 2014 vs.
2013
Operating Margin $ 600 $ 742 $ 871 $ (142) $ (129) -19 % -15 %Noncontrolling Interests Adjustment (464) (507) (600)
Adjusted Operating Margin $ 136 $ 235 $ 271 $ (99) $ (36) -42 % -13 %Adjusted PTC $ 91 $ 242 $ 212 $ (151) $ 30 -62 % 14 %Proportional Free Cash Flow $ (29) $ 13 $ 116 $ (42) $ (103) -323 % -89 %
Fiscal year 2015 versus 2014
Including the unfavorable impact of foreign currency translation of $235 million , operating margin decrease d $142 million , or 19% , which was drivenprimarily by the following:
Sul
Lower volumes due to economic decline and higher technical and non-technical losses$ (68)
Higher fixed costs, primarily due to higher bad debt and regulatory penalties due to storms as well as higher depreciation expenses(44)
Higher tariffs19
Other(6)
Total Sul Decrease(99)
Eletropaulo Higher fixed costs, primarily due to higher bad debt expense, storms and employee-related costs (142)Unfavorable FX impacts (74)Contingency related to performance indicators (59)Lower volumes due to lower demand (35)Reversal of a contingent regulatory liability (excluding FX) 135Higher tariffs 82
Total Eletropaulo Decrease(93)
Tietê
Energy purchases at lower rates primarily due to lower spot prices311
Unfavorable FX impacts(152)
Higher volume purchased on the spot market due to higher assured energy requirement (113)Other (8)
Total Tietê Increase38
Uruguaiana Higher generation from a longer period of temporary restart of operations 11
Total Uruguaiana Increase11
Other Business Drivers1

Total Brazil SBU Operating Margin Decrease $ (142)
Adjusted Operating Margin decrease d $99 million primarily due to the drivers discussed above, adjusted for the impact of noncontrolling interests. AESowns 16% of Eletropaulo, 46% of Uruguaiana, 100% of Sul and 24% of Tietê.
Adjusted PTC decrease d $151 million , driven by the decrease of $99 million in Adjusted Operating Margin described above, a reversal of $47 million incontingent interest accruals in 2014 as well as higher debt and interest rates in 2015 at Sul. These results were partially offset by favorable net interest incomerecognized on receivables at Eletropaulo and Sul.
Proportional Free Cash Flow decreased $42 million , which includes the $99 million decrease in Adjusted Operating Margin as described above as well as anincrease in interest payments, partially offset by the timing of energy purchases and regulatory charges, lower tax payments as well as a $25 million reduction inmaintenance capital expenditures.
91

Fiscal year 2014 versus 2013
Including the unfavorable impact of foreign currency translation of $97 million , operating margin decrease d $129 million , or 15% , which was drivenprimarily by the following:
Tietê
Net impact of lower hydrology, which led to lower generation and an increase in energy purchases at higher prices, partially offset by higher spot sales in the first half of 2014due to lower contracted volumes of energy sold
$ (252)
Unfavorable FX impacts(58)
Other (5)
Total Tietê Decrease(315)
Uruguaiana Extinguishment of a liability based on a favorable arbitration decision in the second quarter of 2013, partially offset by higher generation in 2014 during the period of temporaryrestart of operations (53)Other 2
Total Uruguaiana Decrease(51)
Eletropaulo Non-recurring 2013 charge related to the recognition of a contingent regulatory liability related to potential customer refunds 198Higher rates driven by a higher tariff 124Higher volumes 46Higher fixed costs and depreciation, primarily related to personnel and pension costs (133)Unfavorable FX impacts (28)
Total Eletropaulo Increase207
Sul Higher volumes and rates 52Higher fixed costs and depreciation (11)Unfavorable FX impacts (10)
Total Sul Increase31
Other Business Drivers(1)
Total Brazil SBU Operating Margin Decrease $ (129)
Adjusted Operating Margin decreased $36 million primarily due to the drivers discussed above, adjusted for the impact of noncontrolling interests. AES owns16% of Eletropaulo, 46% of Uruguaiana, 100% of Sul and 24% of Tietê.
Adjusted PTC increased $30 million , driven by the reversal of a loss contingency resulting from a change in estimate related to interest expense of $47million and 2014 municipalities settlement interest of $12 million at Sul, partially offset by the decrease of $36 million in Adjusted Operating Margin describedabove, and higher interest rates and debt.
Proportional Free Cash Flow decreased $103 million , which includes the $36 million decrease in Adjusted Operating Margin as described above with theexception of the non-recurring 2013 charge related to potential customer refunds as that balance was not fully paid. The Brazil SBU was also unfavorably impactedby an increase in tax payments at Sul and Eletropaulo, the timing of collections of regulatory assets and settlement of regulatory liabilities at Eletropaulo and anincrease in interest payments at Sul as noted above. These decreases were partially offset by a $19 million reduction in maintenance capital expenditures as well asthe timing of energy purchases at Tietê.
MCAC SBUA summary of Operating Margin, Adjusted Operating Margin, Adjusted PTC, and Proportional Free Cash Flow ($ in millions) is as follows:
For the Years Ended December 31, 2015 2014 2013 $ Change 2015 vs.2014 $ Change 2014 vs.
2013 % Change 2015 vs.2014 % Change 2014 vs.
2013
Operating Margin $ 543 $ 541 $ 543 $ 2 $ (2) — % — %Noncontrolling Interests Adjustment (106) (59) (69) Derivatives Adjustment 1 — (2)
Adjusted Operating Margin $ 438 $ 482 $ 472 $ (44) $ 10 -9 % 2 %Adjusted PTC $ 327 $ 352 $ 339 $ (25) $ 13 -7 % 4 %Proportional Free Cash Flow $ 498 $ 281 $ 433 $ 217 $ (152) 77 % -35 %

92
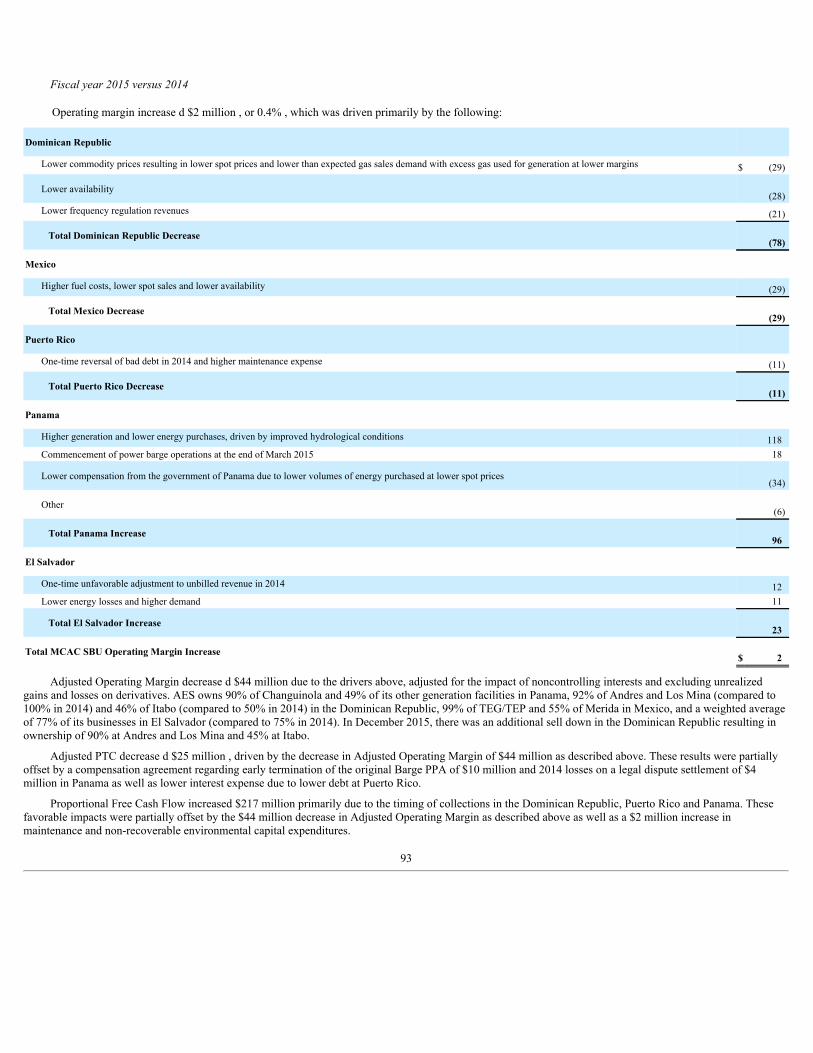
Fiscal year 2015 versus 2014
Operating margin increase d $2 million , or 0.4% , which was driven primarily by the following:
Dominican Republic Lower commodity prices resulting in lower spot prices and lower than expected gas sales demand with excess gas used for generation at lower margins $ (29)
Lower availability(28)
Lower frequency regulation revenues (21)
Total Dominican Republic Decrease(78)
Mexico Higher fuel costs, lower spot sales and lower availability (29)
Total Mexico Decrease(29)
Puerto Rico One-time reversal of bad debt in 2014 and higher maintenance expense (11)
Total Puerto Rico Decrease(11)
Panama Higher generation and lower energy purchases, driven by improved hydrological conditions 118Commencement of power barge operations at the end of March 2015 18
Lower compensation from the government of Panama due to lower volumes of energy purchased at lower spot prices(34)
Other(6)
Total Panama Increase96
El Salvador One-time unfavorable adjustment to unbilled revenue in 2014 12Lower energy losses and higher demand 11
Total El Salvador Increase23
Total MCAC SBU Operating Margin Increase $ 2
Adjusted Operating Margin decrease d $44 million due to the drivers above, adjusted for the impact of noncontrolling interests and excluding unrealizedgains and losses on derivatives. AES owns 90% of Changuinola and 49% of its other generation facilities in Panama, 92% of Andres and Los Mina (compared to100% in 2014) and 46% of Itabo (compared to 50% in 2014) in the Dominican Republic, 99% of TEG/TEP and 55% of Merida in Mexico, and a weighted averageof 77% of its businesses in El Salvador (compared to 75% in 2014). In December 2015, there was an additional sell down in the Dominican Republic resulting inownership of 90% at Andres and Los Mina and 45% at Itabo.
Adjusted PTC decrease d $25 million , driven by the decrease in Adjusted Operating Margin of $44 million as described above. These results were partiallyoffset by a compensation agreement regarding early termination of the original Barge PPA of $10 million and 2014 losses on a legal dispute settlement of $4million in Panama as well as lower interest expense due to lower debt at Puerto Rico.
Proportional Free Cash Flow increased $217 million primarily due to the timing of collections in the Dominican Republic, Puerto Rico and Panama. Thesefavorable impacts were partially offset by the $44 million decrease in Adjusted Operating Margin as described above as well as a $2 million increase inmaintenance and non-recoverable environmental capital expenditures.
93
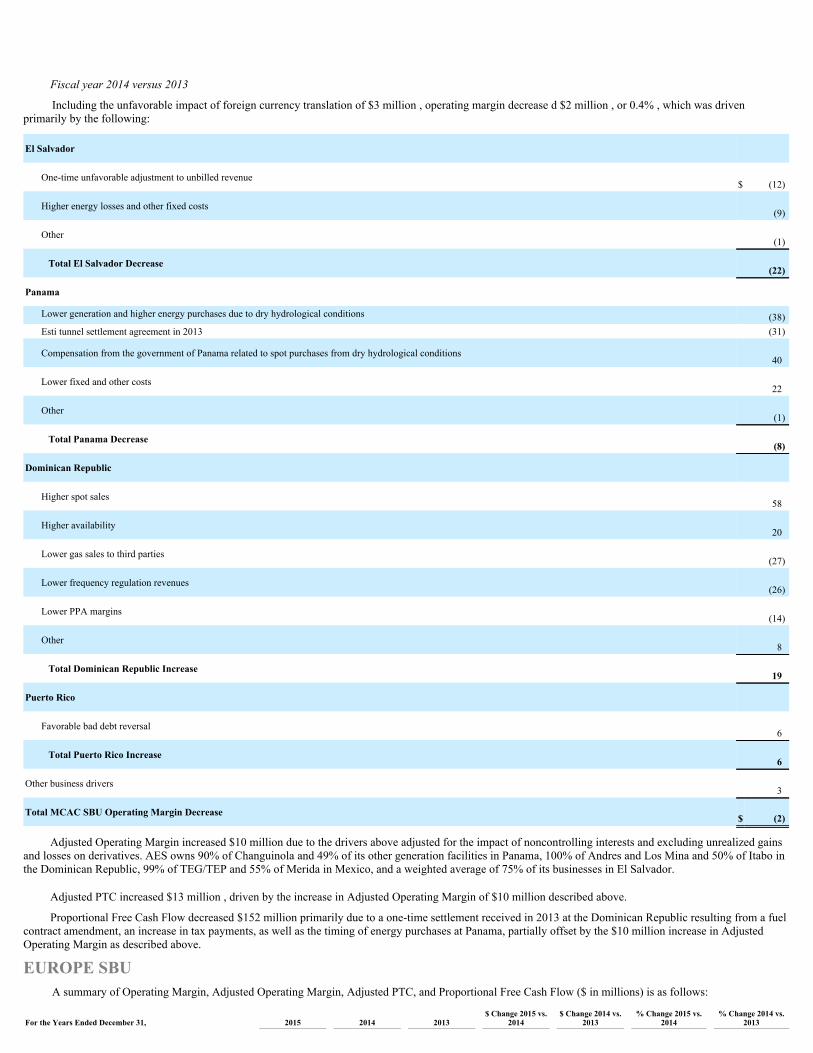
Fiscal year 2014 versus 2013
Including the unfavorable impact of foreign currency translation of $3 million , operating margin decrease d $2 million , or 0.4% , which was drivenprimarily by the following:
El Salvador
One-time unfavorable adjustment to unbilled revenue$ (12)
Higher energy losses and other fixed costs(9)
Other(1)
Total El Salvador Decrease(22)
Panama Lower generation and higher energy purchases due to dry hydrological conditions (38)Esti tunnel settlement agreement in 2013 (31)
Compensation from the government of Panama related to spot purchases from dry hydrological conditions40
Lower fixed and other costs22
Other(1)
Total Panama Decrease(8)
Dominican Republic
Higher spot sales58
Higher availability20
Lower gas sales to third parties(27)
Lower frequency regulation revenues(26)
Lower PPA margins(14)
Other8
Total Dominican Republic Increase19
Puerto Rico
Favorable bad debt reversal6
Total Puerto Rico Increase6
Other business drivers3
Total MCAC SBU Operating Margin Decrease $ (2)
Adjusted Operating Margin increased $10 million due to the drivers above adjusted for the impact of noncontrolling interests and excluding unrealized gainsand losses on derivatives. AES owns 90% of Changuinola and 49% of its other generation facilities in Panama, 100% of Andres and Los Mina and 50% of Itabo inthe Dominican Republic, 99% of TEG/TEP and 55% of Merida in Mexico, and a weighted average of 75% of its businesses in El Salvador.
Adjusted PTC increased $13 million , driven by the increase in Adjusted Operating Margin of $10 million described above.
Proportional Free Cash Flow decreased $152 million primarily due to a one-time settlement received in 2013 at the Dominican Republic resulting from a fuelcontract amendment, an increase in tax payments, as well as the timing of energy purchases at Panama, partially offset by the $10 million increase in AdjustedOperating Margin as described above.
EUROPE SBUA summary of Operating Margin, Adjusted Operating Margin, Adjusted PTC, and Proportional Free Cash Flow ($ in millions) is as follows:
For the Years Ended December 31, 2015 2014 2013 $ Change 2015 vs.2014 $ Change 2014 vs.
2013 % Change 2015 vs.2014 % Change 2014 vs.
2013

Operating Margin $ 303 $ 403 $ 415 $ (100) $ (12) -25 % -3 %Noncontrolling Interests Adjustment (30) (26) (23) Derivatives Adjustment 3 (4) —
Adjusted Operating Margin $ 276 $ 373 $ 392 $ (97) $ (19) -26 % -5 %Adjusted PTC $ 235 $ 348 $ 345 $ (113) $ 3 -32 % 1 %Proportional Free Cash Flow $ 238 $ 197 $ 345 $ 41 $ (148) 21 % -43 %
Fiscal year 2015 versus 2014
Including the unfavorable impact of foreign currency translation of $47 million , operating margin decrease d $100 million , or 25% , which was drivenprimarily by the following:
Maritza
Unfavorable FX impacts due to Euro depreciation against USD$ (30)
Lower rates due to non-operating costs passed through the tariff(8)
Higher availability in 20158
Total Maritza Decrease(30)
Kilroot
Lower dispatch and lower market prices due to gas/coal spread as well as lower capacity prices(23)
Higher fixed costs primarily driven by maintenance cost due to timing of outages(3)
Lower depreciation due to impairment in Q3 20157
Other1
Total Kilroot Decrease(18)
Ballylumford Lower availability and lower capacity prices (8)Write down of non-primary fuel inventory (4)
Total Ballylumford Decrease(12)
Other
Reduction due to the sale of Ebute in 2014(34)
Lower Heat Rate margin at Jordan(6)
Total Europe SBU Operating Margin Decrease $ (100)
Adjusted Operating Margin decreased $97 million due to the drivers above adjusted for noncontrolling interests and excluding unrealized gains and losses onderivatives. AES owns 89% of St. Nikola in Bulgaria, and 37% and 60%, respectively, of the Amman East and IPP4 projects in Jordan.
Adjusted PTC decreased $113 million , driven primarily by the decrease of $97 million in Adjusted Operating Margin described above and by higherdepreciation and unfavorable FX impact from Elsta as well as unfavorable impact due to the reversal of a liability in 2014 in Kazakhstan. These results partiallyoffset by lower interest expenses in Bulgaria.
Proportional Free Cash Flow increased $41 million , which is primarily driven by higher collections at Maritza and Kavarna in Bulgaria, IPP4 in Jordan andat Ballylumford, partially offset by the $97 million decrease in Adjusted Operating Margin as described above.
Fiscal year 2014 versus 2013
Including the unfavorable impact of foreign currency translation of $10 million , operating margin decrease d $12 million , or 3% , which was drivenprimarily by the following:
94

Kilroot
Lower dispatch and higher outages and related maintenance costs$ (46)
Higher rates, including income from energy price hedges and favorable FX rates13
Other 2
Total Kilroot Decrease(31)
Maritza Higher outages and related maintenance costs (32)Impact of higher rates 10
Other5
Total Maritza Decrease(17)
Jordan
Commencement of operations at the IPP4 plant in July 201417
Total Jordan Increase17
Kazakhstan
Higher volumes and rates29
Unfavorable FX impacts(13)
Other(5)
Total Kazakhstan Increase11
Other Business Drivers8
Total Europe SBU Operating Margin Decrease $ (12)
Adjusted Operating Margin decreased $19 million due to the drivers above adjusted for noncontrolling interests, primarily Jordan with Amman East at 36%and IPP4 at 60%, and excluding unrealized gains and losses on derivatives.
Adjusted PTC increased $3 million , driven by the decrease of $19 million in Adjusted Operating Margin described above, offset by the reversal of a liabilityof $18 million in Kazakhstan from the expiration of a statute of limitations for the Republic of Kazakhstan to claim payment from AES.
Proportional Free Cash Flow decreased $148 million , which includes the $19 million decrease in Adjusted Operating Margin as described above as well asthe loss of cash flow resulting from the sale of our businesses in Cameroon and the Ukraine. Cash was also unfavorably impacted by the timing of collections atMaritza, Ballylumford and Jordan as well as pension plan contributions at Kilroot. These drivers were partially offset by an increase in dividends received at Elsta,our equity method investment in the Netherlands.
ASIA SBUA summary of Operating Margin, Adjusted Operating Margin, Adjusted PTC, and Proportional Free Cash Flow ($ in millions) is as follows:
For the Years Ended December 31, 2015 2014 2013 $ Change 2015 vs.2014 $ Change 2014 vs.
2013 % Change 2015 vs.2014 % Change 2014 vs.
2013
Operating Margin $ 149 $ 76 $ 169 $ 73 $ (93) 96% -55 %Noncontrolling Interests Adjustment (79) (25) (10)
Adjusted Operating Margin $ 70 $ 51 $ 159 $ 19 $ (108) 37% -68 %Adjusted PTC $ 96 $ 46 $ 142 $ 50 $ (96) 109% -68 %Proportional Free Cash Flow $ 87 $ 82 $ 101 $ 5 $ (19) 6% -19 %
Fiscal year 2015 versus 2014
Operating margin increase d $73 million , or 96% , which was driven primarily by the following:
Masinloc

Higher availability$ 27
One-time unfavorable impact in 2014 due to market operator's retrospective adjustment to energy prices in Nov and Dec 201315
Lower fixed costs and lower tax assessments in 2015 relative to 20147
Other3
Total Masinloc Increase52
Mong Duong
Commencement of principal operations in April 201524
Total Mong Duong Increase24
Other(3)
Total Asia SBU Operating Margin Increase $ 73
Adjusted Operating Margin increase d $19 million due to the drivers above adjusted for the impact of noncontrolling interests resulting primarily from thesell-down of our ownership in Masinloc from 92% to 51% in mid-July 2014. AES also owns 90% of Kelanitissa and 51% of Mong Duong.
Adjusted PTC increase d $50 million , driven by the increase of $19 million in Adjusted Operating Margin described above, and the additional net impact of$28 million at Mong Duong due to a component of service concession revenue recognized as interest income, net of higher interest expense as interest is no longercapitalized. See Note 1— General and Summary of Significant Accounting Policies in Part II.—Item 8.— Financial Statements and Supplementary Data forfurther information regarding the accounting for service concession arrangements.
Proportional Free Cash Flow increased $5 million , driven by the collection of service concession revenue at Mong Duong noted above (which is not includedin operating margin) as well as the $19 million increase in Adjusted Operating Margin, but excluding the retrospective adjustment to energy prices as describedabove. These favorable drivers were partially offset by the timing of collections at Masinloc which were negatively impacted by our sell-down of ownershipinterest in 2014.
Fiscal year 2014 versus 2013
Operating margin decrease d $93 million , or 55% , which was driven primarily by the following:
Masinloc
Lower plant availability$ (33)
Net decrease from lower spot sales, partially offset by higher volumes(21)
Philippine market operator's adjustment in the first quarter of 2014 to retrospectively recalculate energy prices related to an unprecedented increase in spot energy prices inNovember and December 2013
(15)
Higher maintenance costs(4)
Other(6)
Total Masinloc Decrease(79)
Kelanitissa
Impact of the step-down in the contracted PPA price(17)
Total Kelanitissa Decrease(17)
Other Business Drivers3
Total Asia SBU Operating Margin Decrease $ (93)
95

Adjusted Operating Margin decreased $108 million due to the drivers above adjusted for the impact of noncontrolling interests and excluding unrealizedgains on derivatives. AES owned 92% of Masinloc until July 2014 when AES reduced its ownership to 51%.
Adjusted PTC decreased $96 million , driven by the decrease of $108 million in Adjusted Operating Margin described above, partially offset by the impact oflower proportional interest expense at Masinloc and gains on foreign currency.
Proportional Free Cash Flow decreased $19 million , which includes the $108 million decrease in Adjusted Operating Margin as described above, excludingthe retrospective adjustment to energy prices, partially offset by the timing of collections and payments for coal at Masinloc as well as a decrease in payments forinterest and taxes.
Key Trends and UncertaintiesDuring 2016 and beyond, we expect to face the following challenges at certain of our businesses. Management expects that improved operating performance
at certain businesses, growth from new businesses and global cost reduction initiatives may lessen or offset their impact. If these favorable effects do not occur, orif the challenges described below and elsewhere in this section impact us more significantly than we currently anticipate, or if volatile foreign currencies andcommodities move more unfavorably, then these adverse factors (or other adverse factors unknown to us) may impact our operating margin, net incomeattributable to The AES Corporation and cash flows. We continue to monitor our operations and address challenges as they arise. For the risk factors related to ourbusiness, see Item 1.— Business and Item 1A.— Risk Factors of this Form 10-K.
Operational
Sensitivity to Dry Hydrological Conditions — Our hydroelectric generation facilities are sensitive to changes in the weather, particularly the level of waterinflows into generation facilities. Since 2013, dry hydrological conditions in Panama, Brazil, Colombia and Chile have presented challenges for our businesses inthese markets. Low rainfall and water inflows have caused reservoir levels to be below historical levels, reduced generation output, and increased prices forelectricity. If hydrological conditions do not improve and our hydroelectric generation facilities cannot generate sufficient energy to meet contractual arrangements,we may need to purchase energy to fulfill our obligations, which could have a material adverse impact on our results of operations.
According to the National Oceanic and Atmospheric Administration ("NOAA") a strong El Niño has been declared and is forecasted through the spring of2016. According to local hydrological forecasts in Panama, below historical average inflows are expected to persist through the dry season of 2016 (ending inApril). The effects of the El Niño phenomena could potentially intensify the dry hydrology conditions during this period. AES Panama has to purchase energy onthe spot market to fulfill its contract obligations when its generation output is below contract levels. However, with declines in oil prices the cost of purchasingreplacement power is reduced. In addition, lower hydrology results in less energy available to sell in the spot market after fulfilling contract obligations. We expectthis trend to continue through the dry season of 2016, which will continue to impact our results of operations.
The El Niño brought some relief to the dry conditions in Brazil as it brought rain to the South and Southeast regions. The Southeast region has a significantportion of the country's reservoir capacity. At the beginning of 2016, we expect the system operator in Brazil to continue to pursue a more conservative reservoirmanagement strategy to recover the reservoirs. Higher inflows are expected along with an impact on reservoir level recovery and lower spot prices. AES Sul, whichis in the South of Brazil, could be negatively impacted by higher hydrology causing floods and other damage which could disrupt service and require emergencyrepairs. Additionally, higher hydrology could reduce the need for demand to provide irrigation services during the warm season.
Impacts in Colombia are uncertain since it will depend strongly upon the behavior pattern of the El Niño and can lead to better hydrology for just the areawhere our plant, Chivor, is located or the country as a whole. More extreme behavior can have an opposite impact and leave the Chivor basin dryer but theremainder of the country with better hydrology.
In the case of Chile, the hydrological year starts in April, and given that the El Niño phenomenon is not highly correlated with hydrological conditions inChile, projection are made considering the average of all hydrological conditions. For the first quarter 2016, projections are made considering 2015 snowpackinformation which shows hydrological condition lower than average.
The exact behavior pattern and strength of El Niño cannot be definitively known at this time and therefore the impacts could vary from those describedabove. Even if rainfall and water inflows return to historical averages, in some cases high market prices and low generation could persist until reservoir levels arefully recovered.
Macroeconomic and Political
During the past few years, economic conditions in some countries where our subsidiaries conduct business have deteriorated. Global economic conditionsremain volatile and could have an adverse impact on our businesses in the event these
96

recent trends continue.
Brazil — In Brazil, economic conditions remain unfavorable, as indicated by such factors as a negative GDP growth for 2015 and expectation for the same in2016 and flat for 2017, higher interest rates and inflation, and increasing unemployment. As a consequence, our distribution businesses have experienced a declinein demand. If these economic conditions persist or worsen, there could be a material impact on our businesses and AES's results of operations, particularly in ourdistribution businesses in Brazil, AES Sul and AES Eletropaulo.
In the case of AES Sul, at December 31, 2015, debt in the amount of $333 million is classified as current due to a failure to meet required debt covenantsrelated to earnings for two consecutive quarters. This default is primarily due to the economic conditions noted above, an increase in regulatory assets due to sectorcharges and higher priced energy purchases, increase in delinquency rates, and higher costs due to unfavorable hydrology in Brazil and severe weather conditions,particularly in AES Sul's service area. AES Sul is in negotiations with its creditors and has obtained a waiver for a period of two months, that ends in February2016, when the Company expects to close the renegotiation of the whole debt, involving extending the debt maturities and additional equity contributions ofapproximately $75 million. Following the debt renegotiations, the Company will assess all strategic alternatives for AES Sul. If the negotiation is unsuccessful,we may face a loss of earnings and/or cash flows from Sul and may have to provide loans or equity to support the business, and/or restructure the business, any ofwhich could have a material impact on the Company. In addition, AES Sul has recorded net deferred tax assets ("DTA") of $133 million relating primarily to netoperating loss carryforwards, which are not subject to expiration. Realization is dependent on generating sufficient taxable income. Although realization is notassured, management believes it is more likely than not that all of the DTA will be realized. The amount of DTA that is considered realizable, however, could bereduced in the near term if estimates of future taxable income are reduced.
Argentina — In November 2015, Argentina held presidential elections in which centrist candidate Mauricio Macri was elected president. During hiscampaign, Mauricio Macri emphasized that energy would be a key factor in the government's agenda and that a long-term state policy would be required to addressthe country's energy crisis. Also, the elected President signed, together with the opposition candidates, a statement of commitment addressed to the previousadministration, that included several guidelines to reactivate the sector including the implementation of a strategic long-term energy plan, that a fair and reasonablecustomer tariffs be set for generation, transport and distribution costs, as well as reductions in subsidies and the introduction of a social tariff.
In line with these statements, the Energy and Mining Minister published Resolution 6/2016 and 7/2016 in January 2016 that outlines planned increases to theend consumers of energy that will be effective starting on February 1, 2016. These resolutions contemplate an increase in tariffs of up to 300% for energy pass-through, grant Distribution Value Added ("DVA") increases for Distribution Companies, provide a regulatory framework for an Integral Tariff Review andintroduce subsidies for low income consumers. These increases are intended to lessen the burden on the government to subsidize the energy industry.
In 2001, Argentina defaulted on its public debt, when it stopped making payments of approximately $100 billion of debt amid a deep economic crisis. In 2005and 2010, Argentina restructured its defaulted bonds into new securities valued at about 33 cents on the dollar. Between the two transactions, 93% of thebondholders agreed to exchange their defaulted bonds for new bonds. The remaining 7% did not accept the restructured deal. Since then, a certain group of the"hold-out" bondholders have been in judicial proceedings with Argentina regarding payment and the U.S. District Court ruled that Argentina would need to makepayments to such hold-out bondholders according to the original applicable terms. Despite intense negotiations with the hold-out bondholders through the U.S.District Court appointed Special Master, on July 30, 2014 the parties failed to reach a settlement agreement and consequently (as referred by S&P and Fitchratings) Argentina fell into a selective default resulting from failure to make interest payments on its Discount Bonds maturing in December 2033. The newadministration started conversations to negotiate a solution with the bondholders which could resolve this situation and let Argentina return to the credit markets inthe near future. Although this situation remains unresolved, it has not caused any significant changes that impact our current exposures, and the long-termreceivables in Argentina for the plants that commenced commercial operations in 2010 are being actively collected. For further information, see Note 7 —Financing Receivables in Item 8.— Financial Statements and Supplementary Data of the 2015 Form 10-K.
Bulgaria — Our investments in Bulgaria rely on long-term PPAs with NEK, the state-owned electricity public supplier and energy trading company. NEK isfacing some liquidity issues and has been delayed in making payments under the PPAs with Maritza and St. Nikola. In August 2015, the ninth amendment ofMaritza's PPA was executed under which Maritza and NEK would reduce the capacity payment to Maritza under the PPA by 14% through the PPA Term, withoutimpacting the energy price component. In exchange, NEK would pay Maritza its overdue receivables. The amendment will become effective upon full payment ofthe overdue receivables by NEK, which is expected in 2016. For the period October through December 2015, NEK paid a total of $64 million, which is $16 millionmore than payments received in the previous year. As of December 31, 2015, Maritza's total outstanding receivables were $351 million , of which $44 million werecurrent and $307 million were overdue. Total receivables increased by $89 million from $262 million in December 31, 2014. See additional background withinPart I.—Item 1— Business — Our Organization and Segments — Europe — Bulgaria — Regulatory Framework.
97

As of June 30, 2015, we concluded that the HTA signed with NEK in April is considered an indicator of an impairment of the long-lived assets in Bulgariafor Maritza. Therefore, a test of recoverability was performed and management believes the carrying amount of the asset groups was recoverable as of June 30,2015. Management does not believe that an indicator of an impairment existed as of December 31, 2015. As of December 31, 2015, Maritza had long-lived assetsof $1.2 billion and total debt of $559 million . Long-lived assets for St. Nikola were $210 million and total debt of $140 million .
Unless and until a complete and binding resolution is in place, there remains a risk that we may still face a loss of earnings and/or cash flows from theaffected businesses (or be unable to exercise remedies for a breach of the PPA) and may have to provide loans or equity to support affected businesses or projects,restructure them, write down their value and/or face the possibility that these projects cannot continue operations or provide returns consistent with ourexpectations, any of which could have a material impact on the Company.
Puerto Rico — Our subsidiaries in Puerto Rico have long term PPAs with PREPA, a state-owned entity. Due to the ongoing economic situation in thecountry, PREPA faces significant financial challenges.
On June 28, 2014, the Puerto Rico Public Corporation Debt Enforcement and Recovery Act (the "Recovery Act") was signed into law, which allows publiccorporations, including PREPA, to adjust their debts. As a result of this event, on July 6, 2014, PREPA entered into a Forbearance Agreement with its lenders inorder to permit an opportunity for negotiation of a possible financial restructuring of PREPA. In February 2015, the negotiating position of PREPA was weakenedwhen the federal court deemed the Recovery Act unconstitutional. Despite this setback, PREPA managed to extend the expiration of the Forbearance Agreementseveral times, achieving in December of 2015 certain preliminary restructuring agreements, called Restructuring Support Agreements ("RSAs"), with most of thebondholders and bank lenders, which involved reductions of capital and interest rates and options to either convert existing credits to term loans or to exchangetheir principal for new securitized bonds. The RSA is conditional to a series of future related milestones, the more important being the passing of a bill that wouldallow an increase in tariffs.
There has been no adverse impacts to AES Puerto Rico due to PREPA's financial challenges. AES Puerto Rico's receivables balance as of December 31, 2015is $65 million , of which $21 million was overdue. Subsequent to December 31, 2015 , the full overdue amount has been collected. If the situation declines, therecould be a material impact on the Company.
Macroeconomic and Political — Conclusion If economic conditions deteriorate further, it could affect the prices we receive for the electricity we generate ortransmit. Utility regulators or parties to our generation contracts may seek to lower our prices based on prevailing market conditions pursuant to PPAs, concessionagreements or other contracts as they come up for renewal or reset. In addition, rising fuel and other costs coupled with contractual price or tariff decreases couldrestrict our ability to operate profitably in a given market. Each of these factors, as well as those discussed above, could result in a decline in the value of our assetsincluding those at the businesses we operate, our equity investments and projects under development and could result in asset impairments that could be material toour operations. We continue to monitor our projects and businesses.
Foreign Exchange and Commodities
Our businesses are exposed to and proactively manage market risk. Our primary market risk exposure is to the price of commodities, particularly electricity,oil, natural gas, coal and environmental credits. In 2015, there were more than 40% declines in oil and natural gas prices, which have an impact on our businessesin the Dominican Republic, Ohio and Northern Ireland. Since we operate in multiple countries and as such are subject to volatility in exchange rates at varyingdegrees at the subsidiary level and between our functional currency, the U.S. Dollar, and currencies of the countries in which we operate. In 2015, we hadsignificant devaluations in the Argentine Peso, Brazilian Real, Colombian Peso, and Kazakhstan Tenge, which had a significant impact on our 2015 results. In2016, our results could be materially impacted if the U.S. Dollar continues to appreciate. For additional information, refer to Item 7A.— Quantitative andQualitative Disclosures About Market Risk.
Impairments
Long-lived Assets — During the year ended December 31, 2015 , the Company recognized asset impairments of $285 million . See Note 21 — AssetImpairment Expense in this Form 10-K for further information.
Additionally, in the third quarter of 2015, the Company tested the recoverability of its long-lived assets at Ballylumford in Northern Ireland and Buffalo GapI and II. Impairment indicators were identified at Ballylumford, primarily based on an unfavorable capacity reduction proposed by the Utility regulator in NorthernIreland, and at Buffalo Gap, based on a decline in forward power curves coupled with the near term expiration of favorable contracted cash flows. As of September30, 2015, the Company determined that the carrying amount of the long-lived asset groups at Ballylumford and Buffalo Gap I and II, which totaled $92 million and$371 million, respectively, were recoverable, and no impairment expense was recognized. Buffalo Gap
98

I and II have PPAs that will expire at the end of 2021 and 2017, respectively. Once the PPAs expire, the entire installed capacity of Buffalo Gap will be exposed tothe volatility of energy prices in the ERCOT market which could adversely affect revenues. No impairment indicators were identified in the fourth quarter of 2015.
Events or changes in circumstances that may necessitate further recoverability tests and potential impairments of long-lived assets may include, but are notlimited to, adverse changes in the regulatory environment, unfavorable changes in power prices or fuel costs, increased competition due to additional capacity inthe grid, technological advancements, declining trends in demand, or an expectation that it is more likely than not that the asset will be disposed of before the endof its previously estimated useful life.
Goodwill — During 2015 , the Company recognized total goodwill impairment expense of $317 million , which resulted from the annual goodwillimpairment test performed in the fourth quarter of 2015 at its DP&L reporting unit ("DP&L"). As of December 31, 2015 , there was no remaining goodwill balanceat DP&L. See Note 10 — Goodwill and Other Intangible Assets in Item 8.— Financial Statements and Supplementary Data for further information.
The Company currently has no reporting units considered to be "at risk." A reporting unit is considered "at risk" when its fair value is not higher than itscarrying amount by more than 10%. The Company monitors its reporting units at risk of Step 1 failure on an ongoing basis. It is possible that the Company mayincur goodwill impairment charges at any reporting units containing goodwill in future periods if adverse changes in their business or operating environmentsoccur.
Capital Resources and LiquidityOverview — As of December 31, 2015 , the Company had unrestricted cash and cash equivalents of $1.3 billion , of which $400 million was held at the
Parent Company and qualified holding companies. The Company also had $484 million in short term investments, held primarily at subsidiaries. In addition, wehad restricted cash and debt service reserves of $860 million . The Company also had non-recourse and recourse aggregate principal amounts of debt outstanding of$15.8 billion and $5.0 billion , respectively. Of the approximately $2.5 billion of our current non-recourse debt, $1.5 billion was presented as such because it is duein the next twelve months and $1.0 billion relates to debt considered in default due to covenant violations. The defaults are not payment defaults, but are insteadtechnical defaults triggered by failure to comply with other covenants and/or other conditions such as (but not limited to) failure to meet information covenants,complete construction or other milestones in an allocated time, meet certain minimum or maximum financial ratios, or other requirements contained in the non-recourse debt documents of the Company.
We expect such current maturities will be repaid from net cash provided by operating activities of the subsidiary to which the debt relates or throughopportunistic refinancing activity or some combination thereof. None of our recourse debt matures within the next twelve months. From time to time, we may electto repurchase our outstanding debt through cash purchases, privately negotiated transactions or otherwise when management believes that such securities areattractively priced. Such repurchases, if any, will depend on prevailing market conditions, our liquidity requirements and other factors. The amounts involved inany such repurchases may be material.
We rely mainly on long-term debt obligations to fund our construction activities. We have, to the extent available at acceptable terms, utilized non-recoursedebt to fund a significant portion of the capital expenditures and investments required to construct and acquire our electric power plants, distribution companies andrelated assets. Our non-recourse financing is designed to limit cross default risk to the Parent Company or other subsidiaries and affiliates. Our non-recourse long-term debt is a combination of fixed and variable interest rate instruments. Generally, a portion or all of the variable rate debt is fixed through the use of interest rateswaps. In addition, the debt is typically denominated in the currency that matches the currency of the revenue expected to be generated from the benefiting project,thereby reducing currency risk. In certain cases, the currency is matched through the use of derivative instruments. The majority of our non-recourse debt is fundedby international commercial banks, with debt capacity supplemented by multilaterals and local regional banks.
Given our long-term debt obligations, the Company is subject to interest rate risk on debt balances that accrue interest at variable rates. When possible, theCompany will borrow funds at fixed interest rates or hedge its variable rate debt to fix its interest costs on such obligations. In addition, the Company hashistorically tried to maintain at least 70% of its consolidated long-term obligations at fixed interest rates, including fixing the interest rate through the use of interestrate swaps. These efforts apply to the notional amount of the swaps compared to the amount of related underlying debt. Presently, the Parent Company's onlymaterial un-hedged exposure to variable interest rate debt relates to indebtedness under its senior secured credit facility and floating rate senior unsecured notes due2019. On a consolidated basis, of the Company's $15.8 billion of total non-recourse debt outstanding as of December 31, 2015 , approximately $3.8 billion boreinterest at variable rates that were not subject to a derivative instrument which fixed the interest rate.
In addition to utilizing non-recourse debt at a subsidiary level when available, the Parent Company provides a portion, or in certain instances all, of theremaining long-term financing or credit required to fund development, construction or acquisition of a particular project. These investments have generally takenthe form of equity investments or intercompany loans, which are subordinated to the project's non-recourse loans. We generally obtain the funds for theseinvestments from our cash flows from operations, proceeds from the sales of assets and/or the proceeds from our issuances of debt, common stock and othersecurities. Similarly, in certain of our businesses, the Parent Company may provide financial guarantees or other credit support for the benefit of counterpartieswho have entered into contracts for the purchase or sale of electricity, equipment or other services with our subsidiaries or lenders. In such circumstances, if abusiness defaults on its payment or supply obligation, the Parent Company will be responsible for the business' obligations up to the amount provided for in therelevant guarantee or other credit support. At December 31, 2015 , the Parent Company had provided outstanding financial and performance-related guarantees orother credit support commitments to or for the benefit of our businesses, which were limited by the terms of the agreements, of approximately $396 million inaggregate (excluding those collateralized by letters of credit and other obligations discussed below).
As a result of the Parent Company's below investment grade rating, counterparties may be unwilling to accept our general unsecured commitments to providecredit support. Accordingly, with respect to both new and existing commitments, the Parent Company may be required to provide some other form of assurance,such as a letter of credit, to backstop or replace our credit support. The Parent Company may not be able to provide adequate assurances to such counterparties. Tothe extent we are required and able to provide letters of credit or other collateral to such counterparties, this will reduce the amount of credit available to us to meetour other liquidity needs. At December 31, 2015 , we had $62 million in letters of credit outstanding, provided under our senior secured credit facility, and $32million in cash collateralized letters of credit outstanding outside of
99

our senior secured credit facility. These letters of credit operate to guarantee performance relating to certain project development activities and business operations.During the year ended December 31, 2015 , the Company paid letter of credit fees ranging from 0.2% to 2.5% per annum on the outstanding amounts.
We expect to continue to seek, where possible, non-recourse debt financing in connection with the assets or businesses that we or our affiliates may develop,construct or acquire. However, depending on local and global market conditions and the unique characteristics of individual businesses, non-recourse debt may notbe available on economically attractive terms or at all. If we decide not to provide any additional funding or credit support to a subsidiary project that is underconstruction or has near-term debt payment obligations and that subsidiary is unable to obtain additional non-recourse debt, such subsidiary may become insolvent,and we may lose our investment in that subsidiary. Additionally, if any of our subsidiaries lose a significant customer, the subsidiary may need to withdraw from aproject or restructure the non-recourse debt financing. If we or the subsidiary choose not to proceed with a project or are unable to successfully complete arestructuring of the non-recourse debt, we may lose our investment in that subsidiary.
Many of our subsidiaries depend on timely and continued access to capital markets to manage their liquidity needs. The inability to raise capital on favorableterms, to refinance existing indebtedness or to fund operations and other commitments during times of political or economic uncertainty may have material adverseeffects on the financial condition and results of operations of those subsidiaries. In addition, changes in the timing of tariff increases or delays in the regulatorydeterminations under the relevant concessions could affect the cash flows and results of operations of our businesses.
Long-Term Receivables — As of December 31, 2015 , the Company had approximately $296 million and $63 million of accounts receivable classified asNoncurrent assets—other and Current assets—Accounts receivable , respectively, related to certain of its generation businesses in Argentina and the U.S. and itsutility businesses in Brazil. The noncurrent portion primarily consists of accounts receivable in Argentina that, pursuant to amended agreements or governmentresolutions, have collection periods that extend beyond December 31, 2016 , or one year from the latest balance sheet date. The majority of Argentinian receivableshave been converted into long-term financing for the construction of power plants. See Note 7 — Financing Receivables included in Item 8.— FinancialStatements and Supplementary Data and Item 1.— Business — Regulatory Matters—Argentina of this Form 10-K for further information.
Consolidated Cash FlowsFor the years ended December 31, 2015 and 2014 cash and cash equivalents decreased $277 million and $ 103 million , respectively. The table below reflects
the changes in cash flows for the comparative periods (in millions).
December 31, $ Change
Cash flows provided by (used in): 2015 2014 2013 2015 vs. 2014 2014 vs. 2013
Operating activities $ 2,134 $ 1,791 $ 2,715 $ 343 $ (924)
Investing activities (2,366) (656) (1,774) (1,710) 1,118
Financing activities 28 (1,262) (1,136) 1,290 (126)
Effect of exchange rate changes on cash (52) (51) (59) (1) 8Decrease (increase) in cash of discontinued businesses — 75 (4) (75) 79Cash at held-for-sale businesses (21) — — (21) —
Net (decrease) increase in cash and cash equivalents (277) (103) (258) (174) 155
Cash and cash equivalents at beginning of period 1,539 1,642 1,900 (103) (258)
Cash and cash equivalents at end of period 1,262 1,539 1,642 (277) (103)
100

Operating Activities
Net cash provided by operating activities for the periods indicated was driven by (in millions):
December 31, $ Change
2015 2014 2013 2015 vs. 2014 2014 vs. 2013
Net Income $ 762 $ 1,147 $ 551 $ (385) $ 596
Depreciation and amortization 1,144 1,245 1,294 (101) (49)
Impairment expenses 602 383 661 219 (278)
Loss on the extinguishment of debt 186 261 229 (75) 32
Other adjustments to net income (123) (223) 324 100 (547)
Adjusted net income $ 2,571 $ 2,813 $ 3,059 $ (242) $ (246)
Net change in operating assets and liabilities (1) $ (437) $ (1,022) $ (344) $ 585 $ (678)
Net cash provided by operating activities (2) $ 2,134 $ 1,791 $ 2,715 $ 343 $ (924)(1) Refer to tables below for driver explanations by operating assets and liabilities.(2) Refer to below operating cash flow discussion by SBU for further information about the key drivers.
Fiscal Year 2015 versus 2014
The net change in operating assets and liabilities for the year ended December 31, 2015 compared to the year ended December 31, 2014 was driven by (inmillions):
$ Change
Decrease in prepaid expenses and other current assets primarily at Eletropaulo, Gener and DPL $ 728
Decrease in accounts receivable primarily in the Dominican Republic, DPL and Puerto Rico, partially offset by increases at Mong Duong and Chivor 142Increase in income tax payables, net and other tax payables primarily in Brazil and at Gener 142
Increase in accounts payable and other current liabilities primarily at Eletropaulo, Sul and Mong Duong, partially offset by decreases at Tietê and Gener 116
Increase in other assets primarily regulatory assets at Eletropaulo and Sul as well as service concession assets at Mong Duong (582)
Other operating assets and liabilities 39 $ 585
Fiscal Year 2014 versus 2013
The net change in operating assets and liabilities for the year ended December 31, 2014 compared to the year ended December 31, 2013 was driven by (inmillions):
$ Change
Increase in accounts receivable primarily at Eletropaulo, Sul and Maritza, partially offset by a decrease at Masinloc $ (666)
Increase in other assets primarily regulatory assets at Eletropaulo, IPL, DPL and Sul (620)
Increase in prepaid expenses and other current assets primarily regulatory assets at Eletropaulo as well as increases at the Dominican Republic, Gener and Kilroot (431)Decrease in income tax payables, net and other tax payables primarily in Brazil and the U.S. as well as our sold businesses in Africa and the Ukraine, partially offset by an increaseat Chivor (184)
Increase in accounts payable and other current liabilities primarily at Eletropaulo, Tietê, Sul and Uruguaiana 673
Increase in other liabilities primarily regulatory liabilities at Eletropaulo and pension liabilities at IPL 614
Other operating assets and liabilities (64) $ (678)
Investing Activities
Fiscal Year 2015 versus 2014
Changes to net cash used in investing activities for the year ended December 31, 2015 compared to December 31, 2014 were driven by (in millions):
$ Change
Increase in capital expenditures primarily due to Andes SBU generation growth projects (1) $ (292)
Decrease in cash paid for acquisitions primarily related to Guacolda for $728 million in Andes SBU in 2014 711
Decrease in proceeds from sales of business primarily related to $730 million for Guacolda and $436 million for Masinloc in Andes and Asia SBUs, respectively in 2014. (1,669)
Increase in restricted cash, debt service and other assets (578)
Other 118 $ (1,710)

(1) Refer to tables below for capital expenditure types and other business drivers.
101

The following table summarizes the Company's capital expenditures for growth investments, maintenance and environmental for the periods indicated ($ inmillions):
December 31, 2015 2014 $ Change % Change
Growth Investments $ (1,401) $ (1,151) $ (250) 22 %Maintenance (606) (645) 39 -6 %Environmental (2)
(301) (220) (81) 37 %Total capital expenditures $ (2,308) $ (2,016) $ (292) 14 %
(2) Includes both recoverable and non-recoverable environmental capital expenditures. See Non GAAP Proportional Free Cash Flow for more information.
Changes to cash used for capital expenditures for growth investments, maintenance, and environmental for the year ended December 31, 2015 compared toDecember 31, 2014 were driven by (in millions):
$ Change
Increase primarily due to growth expenditures at Gener, IPALCO and Los Mina in Andes, US and MCAC SBUs, respectively $ (601)Decrease in growth expenditures at Mong Duong in Asia SBU due to service concession accounting adoption in 2015, and at Jordan in Europe SBU due to completion of IPP4plant construction 344
Increase in maintenance and environmental expenditures at IPALCO and DPL businesses in US SBU (41)Other business drivers 6 $ (292)
Fiscal Year 2014 versus 2013
Changes to net cash used in investing activities for the year ended December 31, 2014 compared to December 31, 2013 were driven by (in millions):
$ Change
Increase in capital expenditures primarily due to US SBU generation growth projects (1) $ (28)
Increase in cash paid for acquisitions primarily related to Guacolda for $728 million in Andes SBU (721)
Increase in proceeds from sales of business primarily related to $730 million for Guacolda and $436 million for Masinloc in Andes and Asia SBUs, respectively 1,637
Decrease in restricted cash, debt service and other assets 375
Other (145) $ 1,118
(1) Refer to tables below for capital expenditure types and other business drivers.
The following table summarizes the Company's capital expenditures for growth investments, maintenance and environmental for the periods indicated ($ inmillions):
December 31, 2014 2013 $ Change % Change
Growth Investments $ (1,151) $ (1,054) $ (97) 9 %Maintenance (645) (751) 106 -14 %Environmental (2)
(220) (183) (37) 20 %Total capital expenditures $ (2,016) $ (1,988) $ (28) 1 %
(2) Includes both recoverable and non-recoverable environmental capital expenditures. See Non-GAAP Proportional Free Cash Flow for more information.
Changes to cash used for capital expenditures for growth investments, maintenance, and environmental for the year ended December 31, 2014 compared toDecember 31, 2013 were driven by (in millions):
$ Change
Increase primarily due to growth expenditures at IPALCO, Gener, and Mong Duong in US, Andes and Asia SBUs, respectively $ (287)Decrease in growth expenditures at Jordan and Eletropaulo in Europe and Brazil SBUs, respectively 205
Decrease in maintenance and environmental expenditures at Eletropaulo in Brazil SBU 48Other business drivers 6 $ (28)
102

Financing Activities
Net cash used in financing activities were driven by ($ in millions):
December 31, $ Change
2015 2014 2013 2015 vs. 2014 2014 vs. 2013
Issuances and repayments of recourse debt:
Corporate — Parent Company issuances $ 575 $ 1,525 $ 750 $ (950) $ 775
Corporate — Parent Company repayments (915) (2,117) (1,210) 1,202 (907)
Net repayments of recourse debt $ (340) $ (592) $ (460) $ 252 $ (132)
Issuances and repayments of non-recourse debt:
US — IPALCO issuances $ 847 $ 130 $ 170 $ 717 $ (40)
US — IPALCO repayments (602) — (110) (602) 110
US — DPL issuances 325 200 645 125 (445)
US — DPL repayments (475) (364) (948) (111) 584
US — Generation Holdings, Shady Point, Warrior Run and Hawaii issuances — 337 86 (337) 251
US — Hawaii, Southland, Warrior Run, Shady Point repayments (33) (417) (190) 384 (227)
Other business drivers (11) (12) (13) 1 1
US SBU net subtotal 51 (126) (360) 177 234
Andes — Gener issuances 1,131 1,934 707 (803) 1,227
Andes — Gener repayments (423) (1,714) (67) 1,291 (1,647)
Andes — Chivor repayments — (165) — 165 (165)
Other business drivers 22 5 (21) 17 26
Andes SBU net subtotal 730 60 619 670 (559)
Brazil — Sul issuances 513 185 153 328 32
Brazil — Sul repayments (486) (58) (44) (428) (14)
Brazil — Eletropaulo issuances 354 253 8 101 245
Brazil — Eletropaulo repayments (211) (110) (26) (101) (84)
Brazil — Tietê issuances 153 318 496 (165) (178)
Brazil — Tietê repayments (226) (132) (396) (94) 264
Other business drivers (1) — — (1) —
Brazil SBU net subtotal 96 456 191 (360) 265
MCAC — Panama issuances 300 137 — 163 137
MCAC — Panama repayments (287) (35) — (252) (35)
MCAC — Andres Issuances 180 — — 180 —
MCAC — Andres Repayments (176) — — (176) —
MCAC — Changuinola and Caess - EEO issuances — — 730 — (730)
MCAC — Changuinola and Caess - EEO repayments (10) (10) (713) — 703
Other business drivers (35) (26) (99) (9) 73
MCAC SBU net subtotal (28) 66 (82) (94) 148
Asia — Mong Duong issuances 203 363 472 (160) (109)
Asia — Masinloc issuances 31 26 500 5 (474)
Asia — Masinloc repayments (32) (31) (560) (1) 529
Other business drivers (21) 1 (3) (22) 4
Asia SBU net subtotal 181 359 409 (178) (50)
Europe — UK Wind issuances — 132 18 (132) 114
Europe —UK Wind repayments — (139) (26) 139 (113)
Europe — Maritza repayments (62) (65) (57) 3 (8)
Europe — Jordan Levant issuances — — 180 — (180)
Other business drivers (35) (45) (5) 10 (40)
Europe SBU net subtotal (97) (117) 110 20 (227)
Corporate SBU net subtotal 3 — — 3 —
Net issuances of non-recourse debt $ 936 $ 698 $ 887 $ 238 $ (189)
Proceeds from the sale of redeemable stock of subsidiaries:
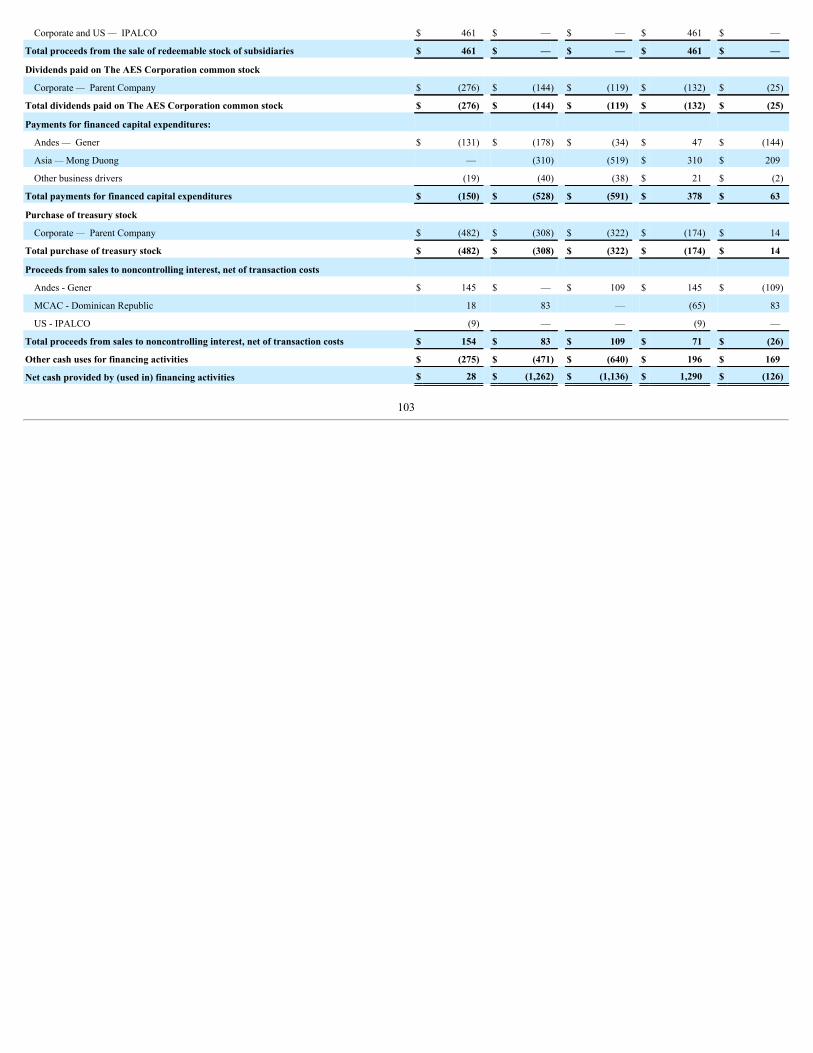
Corporate and US — IPALCO $ 461 $ — $ — $ 461 $ —
Total proceeds from the sale of redeemable stock of subsidiaries $ 461 $ — $ — $ 461 $ —
Dividends paid on The AES Corporation common stock
Corporate — Parent Company $ (276) $ (144) $ (119) $ (132) $ (25)
Total dividends paid on The AES Corporation common stock $ (276) $ (144) $ (119) $ (132) $ (25)
Payments for financed capital expenditures:
Andes — Gener $ (131) $ (178) $ (34) $ 47 $ (144)
Asia — Mong Duong — (310) (519) $ 310 $ 209
Other business drivers (19) (40) (38) $ 21 $ (2)
Total payments for financed capital expenditures $ (150) $ (528) $ (591) $ 378 $ 63
Purchase of treasury stock
Corporate — Parent Company $ (482) $ (308) $ (322) $ (174) $ 14
Total purchase of treasury stock $ (482) $ (308) $ (322) $ (174) $ 14
Proceeds from sales to noncontrolling interest, net of transaction costs
Andes - Gener $ 145 $ — $ 109 $ 145 $ (109)
MCAC - Dominican Republic 18 83 — (65) 83
US - IPALCO (9) — — (9) —
Total proceeds from sales to noncontrolling interest, net of transaction costs $ 154 $ 83 $ 109 $ 71 $ (26)
Other cash uses for financing activities $ (275) $ (471) $ (640) $ 196 $ 169
Net cash provided by (used in) financing activities $ 28 $ (1,262) $ (1,136) $ 1,290 $ (126)
103
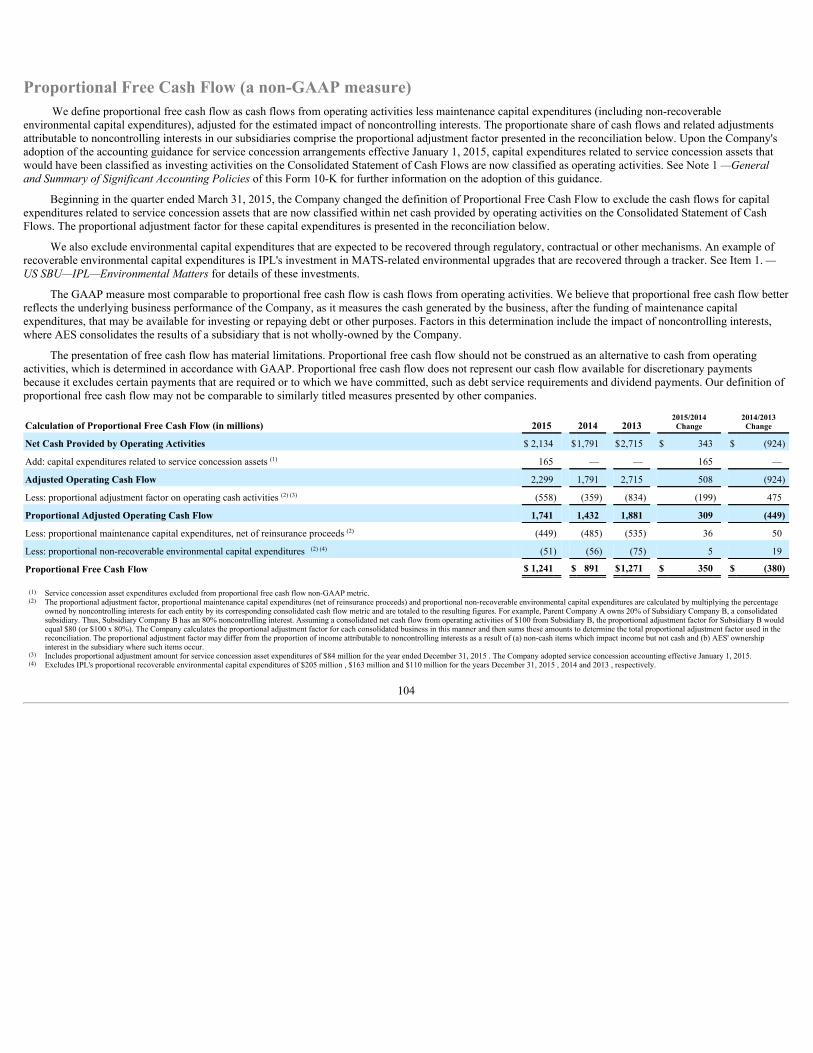
Proportional Free Cash Flow (a non-GAAP measure)We define proportional free cash flow as cash flows from operating activities less maintenance capital expenditures (including non-recoverable
environmental capital expenditures), adjusted for the estimated impact of noncontrolling interests. The proportionate share of cash flows and related adjustmentsattributable to noncontrolling interests in our subsidiaries comprise the proportional adjustment factor presented in the reconciliation below. Upon the Company'sadoption of the accounting guidance for service concession arrangements effective January 1, 2015, capital expenditures related to service concession assets thatwould have been classified as investing activities on the Consolidated Statement of Cash Flows are now classified as operating activities. See Note 1 —Generaland Summary of Significant Accounting Policies of this Form 10-K for further information on the adoption of this guidance.
Beginning in the quarter ended March 31, 2015, the Company changed the definition of Proportional Free Cash Flow to exclude the cash flows for capitalexpenditures related to service concession assets that are now classified within net cash provided by operating activities on the Consolidated Statement of CashFlows. The proportional adjustment factor for these capital expenditures is presented in the reconciliation below.
We also exclude environmental capital expenditures that are expected to be recovered through regulatory, contractual or other mechanisms. An example ofrecoverable environmental capital expenditures is IPL's investment in MATS-related environmental upgrades that are recovered through a tracker. See Item 1. —US SBU—IPL—Environmental Matters for details of these investments.
The GAAP measure most comparable to proportional free cash flow is cash flows from operating activities. We believe that proportional free cash flow betterreflects the underlying business performance of the Company, as it measures the cash generated by the business, after the funding of maintenance capitalexpenditures, that may be available for investing or repaying debt or other purposes. Factors in this determination include the impact of noncontrolling interests,where AES consolidates the results of a subsidiary that is not wholly-owned by the Company.
The presentation of free cash flow has material limitations. Proportional free cash flow should not be construed as an alternative to cash from operatingactivities, which is determined in accordance with GAAP. Proportional free cash flow does not represent our cash flow available for discretionary paymentsbecause it excludes certain payments that are required or to which we have committed, such as debt service requirements and dividend payments. Our definition ofproportional free cash flow may not be comparable to similarly titled measures presented by other companies.
Calculation of Proportional Free Cash Flow (in millions) 2015 2014 2013 2015/2014Change 2014/2013
Change
Net Cash Provided by Operating Activities $ 2,134 $1,791 $2,715 $ 343 $ (924)
Add: capital expenditures related to service concession assets (1) 165 — — 165 —
Adjusted Operating Cash Flow 2,299 1,791 2,715 508 (924)
Less: proportional adjustment factor on operating cash activities (2) (3) (558) (359) (834) (199) 475
Proportional Adjusted Operating Cash Flow 1,741 1,432 1,881 309 (449)
Less: proportional maintenance capital expenditures, net of reinsurance proceeds (2) (449) (485) (535) 36 50
Less: proportional non-recoverable environmental capital expenditures (2) (4) (51) (56) (75) 5 19
Proportional Free Cash Flow $ 1,241 $ 891 $1,271 $ 350 $ (380)
(1) Service concession asset expenditures excluded from proportional free cash flow non-GAAP metric.(2) The proportional adjustment factor, proportional maintenance capital expenditures (net of reinsurance proceeds) and proportional non-recoverable environmental capital expenditures are calculated by multiplying the percentage
owned by noncontrolling interests for each entity by its corresponding consolidated cash flow metric and are totaled to the resulting figures. For example, Parent Company A owns 20% of Subsidiary Company B, a consolidatedsubsidiary. Thus, Subsidiary Company B has an 80% noncontrolling interest. Assuming a consolidated net cash flow from operating activities of $100 from Subsidiary B, the proportional adjustment factor for Subsidiary B wouldequal $80 (or $100 x 80%). The Company calculates the proportional adjustment factor for each consolidated business in this manner and then sums these amounts to determine the total proportional adjustment factor used in thereconciliation. The proportional adjustment factor may differ from the proportion of income attributable to noncontrolling interests as a result of (a) non-cash items which impact income but not cash and (b) AES' ownershipinterest in the subsidiary where such items occur.
(3) Includes proportional adjustment amount for service concession asset expenditures of $84 million for the year ended December 31, 2015 . The Company adopted service concession accounting effective January 1, 2015.(4) Excludes IPL's proportional recoverable environmental capital expenditures of $205 million , $163 million and $110 million for the years December 31, 2015 , 2014 and 2013 , respectively.
104

Operating Cash Flow and Proportional Free Cash Flow Analysis (1)
Operating Cash Flow by SBU Proportional Free Cash Flow by SBU
2015 2014 2013 2015/2014 Change 2014/2013 Change 2015 2014 2013 2015/2014 Change 2014/2013 Change
US $ 845 $ 830 $ 924 $ 15 $ (94) $ 591 $ 646 $ 689 $ (55) $ (43)
Andes 462 359 373 103 (14) 224 176 188 48 (12)
Brazil 136 316 866 (180) (550) (29) 13 116 (42) (103)
MCAC 705 370 550 335 (180) 498 281 433 217 (152)
Europe 339 292 486 47 (194) 238 197 345 41 (148)
Asia 15 105 111 (90) (6) 87 82 101 5 (19)
Corporate (368) (481) (595) 113 114 (368) (504) (601) 136 97
Total SBUs $ 2,134 $ 1,791 $ 2,715 $ 343 $ (924) $ 1,241 $ 891 $ 1,271 $ 350 $ (380)(1) Operating cash flow and proportional free cash flow as presented above include the effect of intercompany transactions with other segments except for interest, tax sharing, charges for management fees and transfer pricing.
US SBU
The following table summarizes Operating Cash Flow and Proportional Free Cash Flow (in millions) for our US SBU for the periods indicated:
Calculation of Proportional Free Cash Flow (in millions) 2015 2014 2013 2015/2014Change 2014/2013
Change
Net Cash Provided by Operating Activities $ 845 $ 830 $ 924 $ 15 $ (94)
Less: proportional adjustment factor on operating cash activities (48) — — (48) —
Proportional Adjusted Operating Cash Flow 797 830 924 (33) (94)
Less: proportional maintenance capital expenditures, net of reinsurance proceeds (199) (180) (231) (19) 51
Less: proportional non-recoverable environmental capital expenditures (1) (7) (4) (4) (3) —
Proportional Free Cash Flow $ 591 $ 646 $ 689 $ (55) $ (43)(1) Excludes IPL's proportional recoverable environmental capital expenditures of $205 million , $163 million and $110 million for the years ended December 31, 2015 , 2014 and 2013, respectively.
105

Fiscal Year 2015 versus 2014
Operating Cash Flow for the year ended December 31, 2015 compared to the year ended December 31, 2014 increased $15 million , driven primarily by thefollowing businesses (in millions):
US SBU Amount
While operating margin decreased at DPL, operating cash flow increased primarily due to the collection of previously deferred storm costs, a one-time payment in 2014 toterminate an unfavorable coal contract, higher collections and the timing of inventory payments $ 65
Decrease at U.S. Wind primarily due to a decrease in operating margin as well as the timing of collections (38)
Other business drivers (12)
Total $ 15
Proportional Free Cash Flow for the year ended December 31, 2015 compared to the year ended December 31, 2014 decreased $55 million , due to thedrivers above, as well as a $22 million increase in maintenance and non-recoverable capital expenditures and adjusted for the impact of noncontrolling interest as aresult of the sell-down of IPL in 2015.
Fiscal Year 2014 versus 2013
Operating Cash Flow for the year ended December 31, 2014 compared to the year ended December 31, 2013 decreased $94 million , driven primarily by thefollowing businesses (in millions):
US SBU Amount
Decrease at DPL primarily due to a decrease in operating margin, the timing of fuel payments as well as a one-time payment in the fourth quarter of 2014 to terminate anunfavorable coal contract, partially offset by a reduction in interest payments $ (74)
Decrease at Beaver Valley primarily due to one-time contract termination proceeds received in 2013 (54)
Increase at Hawaii primarily due to an increase in operating margin 13
Increase at Southland primarily due to an increase in operating margin as well as the timing of collections 12
Other business drivers 9
Total $ (94)
Proportional Free Cash Flow for the year ended December 31, 2014 compared to the year ended December 31, 2013 decreased $43 million , due to thedrivers above, partially offset by a $ 51 million reduction in maintenance capital expenditures, primarily at our Utility businesses.
ANDES SBUThe following table summarizes Operating Cash Flow and Proportional Free Cash Flow (in millions) for our Andes SBU for the periods indicated:
Calculation of Proportional Free Cash Flow ($ in millions) 2015 2014 2013 2015/2014Change 2014/2013
Change
Net Cash Provided by Operating Activities $ 462 $ 359 $ 373 $ 103 $ (14)
Less: proportional adjustment factor on operating cash activities (145) (73) (78) (72) 5
Proportional Adjusted Operating Cash Flow 317 286 295 31 (9)
Less: proportional maintenance capital expenditures, net of reinsurance proceeds (70) (63) (45) (7) (18)
Less: proportional non-recoverable environmental capital expenditures (23) (47) (62) 24 15
Proportional Free Cash Flow $ 224 $ 176 $ 188 $ 48 $ (12)
Fiscal Year 2015 versus 2014
Operating Cash Flow for the year ended December 31, 2015 compared to the year ended December 31, 2014 increased $103 million , driven primarily by thefollowing businesses (in millions):
Andes SBU Amount
Increase at Gener primarily due to an increase in VAT refunds related to the construction of our Cochrane and Alto Maipo plants as well as an increase in operating margin,partially offset by a swap termination payment at Ventanas $ 178
Decrease at Chivor primarily due to an increase in tax payments, lower collections on contract sales and a decrease in operating margin, partially offset by a decrease ininterest payments (73)

Other business drivers (2)
Total $ 103
Proportional Free Cash Flow for the year ended December 31, 2015 compared to the year ended December 31, 2014 increased $48 million , due to thedrivers above, as well as a $17 million net reduction in maintenance and non-recoverable environmental capital expenditures and adjusted for the impact ofnoncontrolling interest.
Fiscal Year 2014 versus 2013
Operating Cash Flow for the year ended December 31, 2014 compared to the year ended December 31, 2013 decreased $14 million , driven primarily by thefollowing businesses (in millions):
106

Andes SBU Amount
Decrease at Gener primarily due to higher payments for interest, higher payments for VAT at our Cochrane plant, a one-time swap termination payment as well as a reductionin operating margin, partially offset by a reduction in tax payments $ (82)
Decrease at Argentina Generation primarily due to an increase in interest and tax payments as well as the negative impact of exchange rates on collections, partially offset byan increase in operating margin (27)
Increase at Chivor primarily due to higher operating margin as well as a reduction in tax payments 95
Total $ (14)
Proportional Free Cash Flow for the year ended December 31, 2014 compared to the year ended December 31, 2013 decreased $12 million , due to thedrivers above as well as a $3 million net increase in maintenance and non-recoverable environmental capital expenditures and adjusted for the impact ofnoncontrolling interest.
BRAZIL SBUThe following table summarizes Operating Cash Flow and Proportional Free Cash Flow (in millions) for our Brazil SBU for the periods indicated:
Calculation of Proportional Free Cash Flow 2015 2014 2013 2015/2014Change 2014/2013
Change
Net Cash Provided by Operating Activities $ 136 $ 316 $ 866 $ (180) $ (550)
Less: proportional adjustment factor on operating cash activities (102) (215) (643) 113 428
Proportional Adjusted Operating Cash Flow 34 101 223 (67) (122)
Less: proportional maintenance capital expenditures, net of reinsurance proceeds (63) (88) (107) 25 19
Less: proportional non-recoverable environmental capital expenditures — — — — —
Proportional Free Cash Flow $ (29) $ 13 $ 116 $ (42) $ (103)
Fiscal Year 2015 versus 2014
Operating Cash Flow for the year ended December 31, 2015 compared to the year ended December 31, 2014 decreased $180 million , driven primarily by thefollowing businesses (in millions):
Brazil SBU Amount
Decrease at Eletropaulo primarily due to the timing of collections, higher payments for interest and taxes as well as a decrease in operating margin, partially offset by thetiming of payments for energy and regulatory charges as well as the favorable impact of exchange rates on cash payments $ (90)
Decrease at Tietê primarily due to the timing of energy purchases and higher interest payments, partially offset by lower income tax payments and an increase in operatingmargin (62)
Decrease at Sul primarily driven by a decrease in operating margin and an increase in interest payments, partially offset by the timing energy purchases and regulatory charges (30)
Other business drivers 2
Total $ (180)
Proportional Free Cash Flow for the year ended December 31, 2015 compared to the year ended December 31, 2014 decreased $42 million , due to thedrivers above, partially offset by a $25 million reduction in maintenance capital expenditures and adjusted for the impact of noncontrolling interest.
Fiscal Year 2014 versus 2013
Operating Cash Flow for the year ended December 31, 2014 compared to the year ended December 31, 2013 decreased $550 million , driven primarily by thefollowing businesses (in millions):
Brazil SBU Amount
Decrease at Eletropaulo primarily due to the timing of collections on regulatory assets and settlement of regulatory liabilities as well as higher interest and tax payments in2014, partially offset by an increase in operating margin $ (397)
Decrease at Tietê primarily due to a decrease in operating margin, partially offset by the timing of payments for energy purchased in the spot market as well as lower taxpayments (133)
Decrease at Sul primarily due to higher payments for taxes and interest, partially offset by an increase in operating margin (44)
Other business drivers 24

Total $ (550)
Proportional Free Cash Flow for the year ended December 31, 2014 compared to the year ended December 31, 2013 decreased $103 million , due to thedrivers above, partially offset by a $ 19 million reduction in maintenance capital expenditures and adjusted for the impact of noncontrolling interest.
107

MCAC SBUThe following table summarizes Operating Cash Flow and Proportional Free Cash Flow (in millions) for our MCAC SBU for the periods indicated:
Calculation of Proportional Free Cash Flow 2015 2014 2013 2015/2014Change 2014/2013
Change
Net Cash Provided by Operating Activities $ 705 $ 370 $ 550 $ 335 $ (180)
Less: proportional adjustment factor on operating cash activities (143) (27) (44) (116) 17
Proportional Adjusted Operating Cash Flow 562 343 506 219 (163)
Less: proportional maintenance capital expenditures, net of reinsurance proceeds (61) (60) (71) (1) 11
Less: proportional non-recoverable environmental capital expenditures (3) (2) (2) (1) —
Proportional Free Cash Flow $ 498 $ 281 $ 433 $ 217 $ (152)
Fiscal Year 2015 versus 2014
Operating Cash Flow for the year ended December 31, 2015 compared to the year ended December 31, 2014 increased $335 million , driven primarily by thefollowing business drivers (in millions):
MCAC SBU Amount
Increase in Panama primarily due to an increase in operating margin as well as higher collections on contract sales $ 137
Increase in the Dominican Republic primarily due to the timing of collections of outstanding accounts receivable and lower tax payments, partially offset by a decrease inoperating margin 119
Increase in El Salvador primarily due to the timing of energy purchases as well as an increase in operating margin, excluding an unbilled revenue adjustment, which did notimpact operating cash flow 45
Excluding the impact of the 2014 non-cash bad debt reversal, operating margin in Puerto Rico remained flat, however operating cash flow increased primarily due to thetiming of collections from the off-taker 34
Total $ 335
Proportional Free Cash Flow for the year ended December 31, 2015 compared to the year ended December 31, 2014 increased $217 million , due to thedrivers above, partially offset by a $2 million increase in maintenance and non-recoverable environmental capital expenditures and adjusted for the impact ofnoncontrolling interest.
Fiscal Year 2014 versus 2013
Operating Cash Flow for the year ended December 31, 2014 compared to the year ended December 31, 2013 decreased $180 million , driven primarily by thefollowing SBUs and key operating drivers (in millions):
MCAC SBU Amount
Decrease in the Dominican Republic primarily due to a one-time settlement received in 2013 related to a fuel contract amendment as well as an increase in tax payments,partially offset by an increase in operating margin $ (99)
Decrease in Panama primarily due to the timing of energy purchases as well as a decrease in operating margin (55)
Decrease in El Salvador primarily due to a decrease in operating margin (26)
Total $ (180)
Proportional Free Cash Flow for the year ended December 31, 2014 compared to the year ended December 31, 2013 decreased $152 million , due to thedrivers above, partially offset by an $11 million reduction in maintenance capital expenditures and adjusted for the impact of noncontrolling interest.
EUROPE SBUThe following table summarizes Operating Cash Flow and Proportional Free Cash Flow (in millions) for our Europe SBU for the periods indicated:
Calculation of Proportional Free Cash Flow 2015 2014 2013 2015/2014 Change 2014/2013Change
Net Cash Provided by Operating Activities $ 339 $ 292 $ 486 $ 47 $ (194)
Less: proportional adjustment factor on operating cash activities (32) (27) (66) (5) 39
Proportional Adjusted Operating Cash Flow 307 265 420 42 (155)
Less: proportional maintenance capital expenditures, net of reinsurance proceeds (51) (65) (68) 14 3
Less: proportional non-recoverable environmental capital expenditures (18) (3) (7) (15) 4
Proportional Free Cash Flow $ 238 $ 197 $ 345 $ 41 $ (148)

Fiscal Year 2015 versus 2014
Operating Cash Flow for the year ended December 31, 2015 compared to the year ended December 31, 2014 increased $47 million , driven primarily by thefollowing business drivers (in millions):
108

Europe SBU Amount
While operating margin decreased at Maritza, operating cash flow increased primarily due to higher collections from the off-taker. (Refer to the Key Trends and Uncertaintiesdiscussion for further information regarding the collection of outstanding receivables) $ 69
Increase at IPP4 in Jordan primarily due to the commencement of operations in July 2014 as well as the timing of customer collections 38
Decrease in operating cash as a result of the sale of our Africa businesses and U.K. Wind (Operating Projects) in 2014 (52)
Other business drivers (8)
Total $ 47
Proportional Free Cash Flow for the year ended December 31, 2015 compared to the year ended December 31, 2014 increased $41 million , due to thedrivers above, partially offset by a $1 million net increase in maintenance and non-recoverable environmental capital expenditures and adjusted for the impact ofnoncontrolling interest.
Fiscal Year 2014 versus 2013
Operating Cash Flow for the year ended December 31, 2014 compared to the year ended December 31, 2013 decreased $194 million , driven primarily by thefollowing business drivers (in millions):
Europe SBU Amount
Decrease in operating cash as a result of the sale of our businesses in Africa and the Ukraine as well as our U.K. Wind (Operating Projects) $ (100)
Decrease at Maritza primarily due to a decrease in operating margin as well as timing of collections from the off-taker (58)
Decrease at Kilroot primarily due to a decrease in operating margin as well as an increase in pension contributions (45)
Increase at Elsta in the Netherlands primarily driven by the timing of dividends received from our equity method investment 29
Other business drivers (20)
Total $ (194)
Proportional Free Cash Flow for the year ended December 31, 2014 compared to the year ended December 31, 2013 decreased $148 million , due to thedrivers above, partially offset by a $7 million reduction in maintenance and non-recoverable environmental capital expenditures and adjusted for the impact ofnoncontrolling interest.
ASIA SBU
The following table summarizes Operating Cash Flow and Proportional Free Cash Flow (in millions) for our Asia SBU for the periods indicated:
Calculation of Proportional Free Cash Flow 2015 2014 2013 2015/2014Change 2014/2013
Change
Net Cash Provided by Operating Activities $ 15 $ 105 $ 111 $ (90) $ (6)
Add: capital expenditures related to service concession assets (1) 165 — — 165 —
Adjusted Operating Cash Flow 180 105 111 75 (6)
Less: proportional adjustment factor on operating cash activities (2) (88) (17) (3) (71) (14)
Proportional Adjusted Operating Cash Flow 92 88 108 4 (20)
Less: proportional maintenance capital expenditures, net of reinsurance proceeds (5) (6) (7) 1 1
Less: proportional non-recoverable environmental capital expenditures — — — — —
Proportional Free Cash Flow $ 87 $ 82 $ 101 $ 5 $ (19)(1) Service concession asset expenditures excluded from proportional free cash flow non-GAAP metric.(2) Includes proportional adjustment amount for service concession asset expenditures of $84 million for the year ended December 31, 2015 . The Company adopted service concession accounting effective January 1, 2015.
Fiscal Year 2015 versus 2014
Operating Cash Flow for the year ended December 31, 2015 compared to the year ended December 31, 2014 decreased $90 million , driven primarily by thefollowing business drivers (in millions):
Asia SBU Amount
Decrease at Mong Duong in Vietnam primarily driven by payment for service concession assets, partially offset by an increase in operating cash due to commencement ofoperations in April 2015 $ (85)

Other business drivers (5)
Total $ (90)
Proportional Free Cash Flow for the year ended December 31, 2015 compared to the year ended December 31, 2014 increased $5 million , due to the driversabove and adjusted for the impact of noncontrolling interest as well as $ 84 million of proportional service concession assets, which are excluded from thecalculation of proportional free cash flow.
Fiscal Year 2014 versus 2013
Operating Cash Flow for the year ended December 31, 2014 compared to the year ended December 31, 2013 decreased $6 million , driven primarily by thefollowing business drivers (in millions):
109

Asia SBU Amount
Decrease at Kelanitissa primarily due to lower operating margin and collections as a result of the step-down in the contracted PPA price $ (21)
Increase at Masinloc primarily due to the timing of collections (despite the market operator's price adjustment) and payments for coal purchases as well as decreases in cashpaid for interest and taxes, partially offset by a decrease in operating margin 16
Other business drivers (1)
Total $ (6)
Proportional Free Cash Flow for the year ended December 31, 2014 compared to the year ended December 31, 2013 decreased $19 million , due to thedrivers above, partially offset by a $1 million reduction in maintenance capital expenditures and adjusted for the impact of noncontrolling interest.
CORPORATEThe following table summarizes Operating Cash Flow and Proportional Free Cash Flow (in millions) for Corporate for the periods indicated:
Calculation of Proportional Free Cash Flow 2015 2014 2013 2015/2014Change 2014/2013
Change
Net Cash Provided by Operating Activities $ (368) $ (481) $ (595) $ 113 $ 114
Proportional Adjusted Operating Cash Flow (368) (481) (595) 113 114
Less: proportional maintenance capital expenditures, net of reinsurance proceeds — (23) (6) 23 (17)
Proportional Free Cash Flow $ (368) $ (504) $ (601) $ 136 $ 97
Fiscal Year 2015 versus 2014
Operating Cash Flow for the year ended December 31, 2015 compared to the year ended December 31, 2014 increased $113 million , driven primarily by thefollowing business drivers (in millions):
Corporate Amount
Increase primarily at the Parent Company driven by lower interest payments, prior year swap termination payments upon refinance of debt, a reduction in incentive paymentsand the collection of realized gains resulting from the Company's corporate hedging program $ 113
Total $ 113
Proportional Free Cash Flow for the year ended December 31, 2015 compared to the year ended December 31, 2014 increased $136 million , due to thedrivers above as well as an $ 23 million reduction in maintenance capital expenditures.
Fiscal Year 2014 versus 2013
Operating Cash Flow for the year ended December 31, 2014 compared to the year ended December 31, 2013 increased $114 million , driven primarily by thefollowing business drivers (in millions):
Corporate Amount
Increase primarily at the Parent Company driven by lower interest payments $ 114
Total $ 114
Proportional Free Cash Flow for the year ended December 31, 2014 compared to the year ended December 31, 2013 increased $97 million , due to thedrivers above, partially offset by a $17 million increase in maintenance capital expenditures.
Parent Free Cash Flow (a non-GAAP measure)
The Company defines Parent Free Cash Flow as dividends and other distributions received from our operating businesses less certain cash costs at the ParentCompany level, primarily interest payments, overhead, and development costs. Parent Free Cash Flow is used to fund shareholder dividends, share repurchases,growth investments, recourse debt repayments, and other uses by the Parent Company. Refer to Item 1— Business — Overview for further discussion of the ParentCompany's capital allocation strategy.
Parent Company Liquidity
The following discussion of Parent Company Liquidity has been included because we believe it is a useful measure of the liquidity available to The AESCorporation, or the Parent Company, given the non-recourse nature of most of our indebtedness. Parent Company Liquidity as outlined below is a non-GAAPmeasure and should not be construed as an alternative to cash and cash equivalents which are determined in accordance with GAAP, as a measure of liquidity.Cash and cash equivalents are disclosed in the consolidated statements of cash flows. Parent Company Liquidity may differ from similarly titled measures used byother companies. The principal sources of liquidity at the Parent Company level are dividends and other distributions from our subsidiaries, including refinancingproceeds; proceeds from debt and equity financings at the Parent Company level, including availability under our credit facility; and proceeds from asset sales.Cash requirements at the Parent Company level are primarily to fund interest; principal repayments of debt; construction commitments; other equity commitments;common stock repurchases; acquisitions; taxes; Parent Company overhead and development costs; and dividends on common stock.

110

The Company defines Parent Company Liquidity as cash available to the Parent Company plus available borrowings under existing credit facility. The cashheld at qualified holding companies represents cash sent to subsidiaries of the Company domiciled outside of the U.S.. Such subsidiaries have no contractualrestrictions on their ability to send cash to the Parent Company. Parent Company Liquidity is reconciled to its most directly comparable U.S. GAAP financialmeasure, Cash and cash equivalents , at December 31, 2015 and 2014 as follows:
Parent Company Liquidity (in millions) 2015 2014Consolidated cash and cash equivalents $ 1,262 $ 1,539
Less: Cash and cash equivalents at subsidiaries 862 1,032Parent and qualified holding companies' cash and cash equivalents 400 507Commitments under Parent credit facility 800 800
Less: Letters of credit under the credit facilities (62) (61)Borrowings available under Parent credit facilities 738 739Total Parent Company Liquidity $ 1,138 $ 1,246
The Company paid dividends of $0.40 per share to its common stockholders during the year ended December 31, 2015 . While we intend to continuepayment of dividends and believe we will have sufficient liquidity to do so, we can provide no assurance that we will continue to pay dividends, or if continued, theamount of such dividends.
Recourse Debt — Our recourse debt at year-end was approximately $5.0 billion and $5.3 billion in 2015 and 2014 , respectively. See Note 12 — Debt inItem 8.— Financial Statements and Supplementary Data of this Form 10-K for additional detail.
While we believe that our sources of liquidity will be adequate to meet our needs for the foreseeable future, this belief is based on a number of materialassumptions, including, without limitation, assumptions about our ability to access the capital markets (see Key Trends and Uncertainties — Global EconomicConditions ), the operating and financial performance of our subsidiaries, currency exchange rates, power market pool prices, and the ability of our subsidiaries topay dividends. In addition, our subsidiaries' ability to declare and pay cash dividends to us (at the Parent Company level) is subject to certain limitations containedin loans, governmental provisions and other agreements. We can provide no assurance that these sources will be available when needed or that the actual cashrequirements will not be greater than anticipated. See Item 1A.— Risk Factors — The AES Corporation is a holding company and its ability to make payments onits outstanding indebtedness, including its public debt securities, is dependent upon the receipt of funds from its subsidiaries by way of dividends, fees, interest,loans or otherwise, of this Form 10-K.
Various debt instruments at the Parent Company level, including our senior secured credit facility, contain certain restrictive covenants. The covenantsprovide for — among other items — limitations on other indebtedness, liens, investments and guarantees; limitations on dividends, stock repurchases and otherequity transactions; restrictions and limitations on mergers and acquisitions, sales of assets, leases, transactions with affiliates and off-balance sheet and derivativearrangements; maintenance of certain financial ratios; and financial and other reporting requirements.
As of December 31, 2015 , we were in compliance with these covenants at the Parent Company level.
Non-Recourse Debt — While the lenders under our non-recourse debt financings generally do not have direct recourse to the Parent Company, defaultsthereunder can still have important consequences for our results of operations and liquidity, including, without limitation:
• reducing our cash flows as the subsidiary will typically be prohibited from distributing cash to the Parent Company during the time period of any default;• triggering our obligation to make payments under any financial guarantee, letter of credit or other credit support we have provided to or on behalf of such
subsidiary;• causing us to record a loss in the event the lender forecloses on the assets; and• triggering defaults in our outstanding debt at the Parent Company.
For example, our senior secured credit facility and outstanding debt securities at the Parent Company include events of default for certain bankruptcy relatedevents involving material subsidiaries. In addition, our revolving credit agreement at the Parent Company includes events of default related to payment defaults andaccelerations of outstanding debt of material subsidiaries.
Some of our subsidiaries are currently in default with respect to all or a portion of their outstanding indebtedness. The total non-recourse debt classified ascurrent in the accompanying Consolidated Balance Sheets amounts to $2.5 billion . The portion of current debt related to such defaults was $1.0 billion atDecember 31, 2015 , all of which was non-recourse debt related to four subsidiaries — Maritza, Sul, Kavarna, and Sogrinsk. See Note 12 — Debt in Item 8.—Financial Statements and Supplementary Data of this Form 10-K for additional detail.
None of the subsidiaries that are currently in default are subsidiaries that met the applicable definition of materiality under AES' corporate debt agreements asof December 31, 2015 in order for such defaults to trigger an event of default or permit acceleration under AES' indebtedness. However, as a result of additionaldispositions of assets, other significant reductions in asset carrying values or other matters in the future that may impact our financial position and results ofoperations or the financial position of the individual subsidiary, it is possible that one or more of these subsidiaries could fall within the definition of a "materialsubsidiary" and thereby upon an acceleration trigger an event of default and possible acceleration of the indebtedness under the Parent Company's outstanding debtsecurities. A material subsidiary is defined in the Company's senior secured revolving credit facility as any business that contributed 20% or more of the ParentCompany's total cash distributions from businesses for the four most recently completed fiscal quarters. As of December 31, 2015 , none of the defaults listedabove individually or in the aggregate results in or is at risk of triggering a cross-default under the recourse debt of the Company.
111

Contractual Obligations and Parent Company Contingent Contractual Obligations
A summary of our contractual obligations, commitments and other liabilities as of December 31, 2015 is presented in the table below, which excludes anybusinesses classified as discontinued operations or held-for-sale (in millions):
Contractual Obligations Total Less than 1 year 1-3 years 3-5 years More than 5 years Other FootnoteReference (5)
Debt Obligations (1) $ 20,807 $ 2,529 $ 2,562 $ 3,624 $ 12,092 $ — 12
Interest Payments on Long-Term Debt (2) 7,897 1,233 2,131 1,552 2,981 — n/a
Capital Lease Obligations (3) 147 14 23 20 90 — 13
Operating Lease Obligations (3) 1,291 77 157 159 898 — 13
Electricity Obligations (3) 37,594 2,623 5,078 5,717 24,176 — 13
Fuel Obligations (3) 5,253 1,120 1,367 625 2,141 — 13
Other Purchase Obligations (3) 9,383 1,332 2,128 1,528 4,395 — 13Other Long-Term Liabilities
Reflected on AES' Consolidated Balance Sheet under GAAP (4) 696 — 220 35 406 35 n/aTotal $ 83,068 $ 8,928 $ 13,666 $ 13,260 $ 47,179 $ 35
(1) Includes recourse and non-recourse debt presented on the Consolidated Balance Sheet. See Note 12 — Debt to the Consolidated Financial Statements included in Item 8— Financial Statements and Supplementary Data of thisForm 10-K which provides additional disclosure regarding these obligations. These amounts exclude capital lease obligations which are included in the capital lease category, see (3) below.
(2) Interest payments are estimated based on final maturity dates of debt securities outstanding at December 31, 2015 and do not reflect anticipated future refinancing, early redemptions or new debt issuances. Variable rate interestobligations are estimated based on rates as of December 31, 2015 .
(3) See Note 13 — Commitments to the Consolidated Financial Statements included in Item 8 of this Form 10-K for further information.(4) These amounts do not include current liabilities on the Consolidated Balance Sheet except for the current portion of uncertain tax obligations. Noncurrent uncertain tax obligations are reflected in the "Other" column of the table
above as the Company is not able to reasonably estimate the timing of the future payments. In addition, the amounts do not include: (1) regulatory liabilities (See Note 11 — Regulatory Assets and Liabilities ), (2) contingencies (SeeNote 14 — Contingencies ), (3) pension and other post retirement employee benefit liabilities (see Note 15 — Benefit Plans ) or (4) any taxes (See Note 22 — Income Taxes ) except for uncertain tax obligations, as the Company isnot able to reasonably estimate the timing of future payments. See the indicated notes to the Consolidated Financial Statements included in Item 8 of this Form 10-K for additional information on the items excluded. Derivatives (SeeNote 6 — Derivative Instruments and Hedging Activities ) and incentive compensation are excluded as the Company is not able to reasonably estimate the timing or amount of the future payments.
(5) For further information see the note referenced below in Item 8.— Financial Statements and Supplementary Data of this Form 10-K.
The following table presents our Parent Company's contingent contractual obligations as of December 31, 2015 :
Contingent contractual obligations ($ in millions) Amount Number of Agreements Maximum Exposure Range for Each Agreement
Guarantees and commitments $ 369 14 $1 - 53Asset sale related indemnities (1) 27 1 27Cash collateralized letters of credit 32 4 $1 - 15Letters of credit under the senior secured credit facility 62 7 <$1 - 29Total $ 490 26
(1) Excludes normal and customary representations and warranties in agreements for the sale of assets (including ownership in associated legal entities) where the associated risk is considered to be nominal.
As of December 31, 2015 , the Company had no commitments to invest in subsidiaries under construction and to purchase related equipment that were notincluded in the letters of credit disclosed above.
We have a diverse portfolio of performance-related contingent contractual obligations. These obligations are designed to cover potential risks and onlyrequire payment if certain targets are not met or certain contingencies occur. The risks associated with these obligations include change of control, constructioncost overruns, subsidiary default, political risk, tax indemnities, spot market power prices, sponsor support and liquidated damages under power sales agreementsfor projects in development, in operation and under construction. In addition, we have an asset sale program through which we may have customary indemnityobligations under certain assets sale agreements. While we do not expect that we will be required to fund any material amounts under these contingent contractualobligations beyond 2015 , many of the events which would give rise to such obligations are beyond our control. We can provide no assurance that we will be ableto fund our obligations under these contingent contractual obligations if we are required to make substantial payments thereunder.
112
Critical Accounting Policies and Estimates
The Consolidated Financial Statements of AES are prepared in conformity with U.S. GAAP, which requires the use of estimates, judgments and assumptionsthat affect the reported amounts of assets and liabilities at the date of the financial statements and the reported amounts of revenue and expenses during the periodspresented. AES' significant accounting policies are described in Note 1 — General and Summary of Significant Accounting Policies to the Consolidated FinancialStatements included in Item 8 of this Form 10-K.
An accounting estimate is considered critical if the estimate requires management to make assumptions about matters that were highly uncertain at the timethe estimate was made; different estimates reasonably could have been used; or the impact of the estimates and assumptions on financial condition or operatingperformance is material.
Management believes that the accounting estimates employed are appropriate and the resulting balances are reasonable; however, actual results couldmaterially differ from the original estimates, requiring adjustments to these balances in future periods. Management has discussed these critical accounting policieswith the Audit Committee, as appropriate. Listed below are the Company's most significant critical accounting estimates and assumptions used in the preparation ofthe Consolidated Financial Statements.
Income Taxes — We are subject to income taxes in both the U.S. and numerous foreign jurisdictions. Our worldwide income tax provision requiressignificant judgment and is based on calculations and assumptions that are subject to examination by the Internal Revenue Service and other taxing authorities. TheCompany and certain of its subsidiaries are under examination by relevant taxing authorities for various tax years. The Company regularly assesses the potentialoutcome of these examinations in each tax jurisdiction when determining the adequacy of the provision for income taxes. Accounting guidance for uncertainty inincome taxes prescribes a more likely than not recognition threshold. Tax reserves have been established, which the Company believes to be adequate in relation tothe potential for additional assessments. Once established, reserves are adjusted only when there is more information available or when an event occursnecessitating a change to the reserves. While the Company believes that the amounts of the tax estimates are reasonable, it is possible that the ultimate outcome ofcurrent or future examinations may be materially different than the reserve amounts.
Because we have a wide range of statutory tax rates in the multiple jurisdictions in which we operate, any changes in our geographical earnings mix couldmaterially impact our effective tax rate. Furthermore, our tax position could be adversely impacted by changes in tax laws, tax treaties or tax regulations or theinterpretation or enforcement thereof and such changes may be more likely or become more likely in view of recent economic trends in certain of the jurisdictionsin which we operate. As an example, new tax laws were enacted in February 2016 in Chile which will increase the statutory income tax rate for most of our Chileanbusinesses from 25% to 25.5% in 2017 and to 27% for 2018 and future years. Accordingly, in 2016 our net Chilean deferred tax liabilities will be remeasured to thenew rates. The remeasurement amount and other potential future impacts of the changes in tax law may be material to continuing operations.
The Company's provision for income taxes could be adversely impacted by changes to the U.S. taxation of earnings of our foreign subsidiaries. Since 2006,the Company has benefited from the Controlled Foreign Corporation look-through rule, originally enacted in the TIPRA of 2005, subject to five temporaryextensions, including the most recent five year retroactive extension enacted on December 18, 2015 in the H.R.2029 - Consolidated Appropriations Act, 2016.There can be no assurance that this provision will continue to be extended beyond December 31, 2019. Further, the U.S. is considering corporate tax reform thatmay significantly change the U.S. international tax rules and corporate tax rates. Our expected effective tax rate could increase by amounts that may be material tothe Company should such reforms be enacted.
In addition, U.S. income taxes and foreign withholding taxes have not been provided on undistributed earnings for certain of our non-U.S. subsidiaries to theextent such earnings are considered to be indefinitely reinvested in the operations of those subsidiaries.
Deferred tax assets and liabilities are recognized for the future tax consequences attributable to differences between the financial statement carrying amountsof the existing assets and liabilities, and their respective income tax bases. The Company establishes a valuation allowance when it is more likely than not that allor a portion of a deferred tax asset will not be realized.
Sales of Noncontrolling Interests — The accounting for a sale of noncontrolling interests under the accounting standards depends on whether the sale isconsidered to be a sale of in-substance real estate (as opposed to an equity transaction), where the gain (loss) on sale would be recognized in earnings rather thanwithin stockholders' equity. If management's estimation process determines that there is no significant value beyond the in-substance real estate, the gain (loss) onthe sale of the noncontrolling interest is recognized in earnings. However, if it is determined that significant value likely exists beyond the in-substance real estate,the gain (loss) on the sale of the noncontrolling interest would be recognized within stockholders' equity. In-substance real estate is comprised of land plusimprovements and integral equipment. The determination of whether property, plant and equipment is integral equipment is based on the significance of the coststo remove the equipment from its existing location (including the cost of repairing damage resulting from the removal), combined with the decrease in the fair
113
value of the equipment as a result of those removal activities. When the combined total of removal costs and the decrease in fair value of the equipment exceeds10% of the fair value of the equipment, the equipment is considered integral equipment. The accounting standards specifically identify power plants as an exampleof in-substance real estate. Where the consolidated entity in which noncontrolling interests have been sold contains in-substance real estate, management estimatesthe extent to which the total fair value of the assets of the entity is represented by the in-substance real estate and whether significant value exists beyond the in-substance real estate. This estimation considers all qualitative and quantitative factors relevant for each sale and, where appropriate, includes making quantitativeestimates about the fair value of the entity and its identifiable assets and liabilities (including any favorable or unfavorable contracts) by analogy to the accountingstandards on business combinations. As such, these estimates may require significant judgment and assumptions, similar to the critical accounting estimatesdiscussed below for impairments and fair value.
Impairments — Our accounting policies on goodwill and long-lived assets are described in detail in Note 1 — General and Summary of SignificantAccounting Policies , included in Item 8 of this Form 10-K. The Company makes considerable judgments in its impairment evaluations of goodwill and long-livedassets; however, the fair value determination is typically the most judgmental part in an impairment evaluation.
The Company determines the fair value of a reporting unit or a long-lived asset (asset group) by applying the approaches prescribed under the fair valuemeasurement accounting framework. Generally, the market approach and income approach are most relevant in the fair value measurement of our reporting unitsand long-lived assets; however, due to the lack of available relevant observable market information in many circumstances, the Company often relies on theincome approach. The Company may engage an independent valuation firm to assist management with the valuation. The decision to engage an independentvaluation firm considers all relevant facts and circumstances, including a cost-benefit analysis and the Company's internal valuation knowledge of the long-livedasset (asset group) or business. The Company develops the underlying assumptions consistent with its internal budgets and forecasts for such valuations.Additionally, the Company uses an internal discounted cash flow valuation model (the "DCF model"), based on the principles of present value techniques, toestimate the fair value of its reporting units or long-lived assets under the income approach. The DCF model estimates fair value by discounting our internalbudgets and cash flow forecasts, adjusted to reflect market participant assumptions, to the extent necessary, at an appropriate discount rate.
Management applies considerable judgment in selecting several input assumptions during the development of our internal budgets and cash flow forecasts.Examples of the input assumptions that our budgets and forecasts are sensitive to include macroeconomic factors such as growth rates, industry demand, inflation,exchange rates, power prices and commodity prices. Whenever appropriate, management obtains these input assumptions from observable market data sources(e.g., Economic Intelligence Unit) and extrapolates the market information if an input assumption is not observable for the entire forecast period. Many of theseinput assumptions are dependent on other economic assumptions, which are often derived from statistical economic models with inherent limitations such asestimation differences. Further, several input assumptions are based on historical trends which often do not recur. The input assumptions most significant to ourbudgets and cash flows are based on expectations of macroeconomic factors which have been volatile recently. It is not uncommon that different market datasources have different views of the macroeconomic factor expectations and related assumptions. As a result, macroeconomic factors and related assumptions areoften available in a narrow range; however, in some situations these ranges become wide and the use of a different set of input assumptions could producesignificantly different budgets and cash flow forecasts.
A considerable amount of judgment is also applied in the estimation of the discount rate used in the DCF model. To the extent practical, inputs to thediscount rate are obtained from market data sources (e.g., Bloomberg, Capital IQ, etc.). The Company selects and uses a set of publicly traded companies from therelevant industry to estimate the discount rate inputs. Management applies judgment in the selection of such companies based on its view of the most likely marketparticipants. It is reasonably possible that the selection of a different set of likely market participants could produce different input assumptions and result in the useof a different discount rate.
Fair value of a reporting unit or a long-lived asset (asset group) is sensitive to both input assumptions to our budgets and cash flow forecasts and the discountrate. Further, estimates of long-term growth and terminal value are often critical to the fair value determination. As part of the impairment evaluation process,management analyzes the sensitivity of fair value to various underlying assumptions. The level of scrutiny increases as the gap between fair value and carryingamount decreases. Changes in any of these assumptions could result in management reaching a different conclusion regarding the potential impairment, whichcould be material. Our impairment evaluations inherently involve uncertainties from uncontrollable events that could positively or negatively impact the anticipatedfuture economic and operating conditions.
Further discussion of the impairment charges recognized by the Company can be found within Note 10 — Goodwill and Other Intangible Assets, Note 21 —Asset Impairment Expense and Note 9 — Other Non-Operating Expense to the Consolidated Financial Statements included in Item 8 of this Form 10-K.
114
Fair Value
Fair Value Hierarchy — The Company uses valuation techniques and methodologies that maximize the use of observable inputs and minimize the use ofunobservable inputs. Where available, fair value is based on observable market prices or parameters or derived from such prices or parameters. Where observableprices are not available, valuation models are applied to estimate the fair value using the available observable inputs. The valuation techniques involve some levelof management estimation and judgment, the degree of which is dependent on the price transparency for the instruments or market and the instruments' complexity.
To increase consistency and enhance disclosure of the fair value of financial instruments, the fair value measurement standard includes a fair value hierarchyto prioritize the inputs used to measure fair value into three categories. An asset or liability's level within the fair value hierarchy is based on the lowest level ofinput significant to the fair value measurement, where Level 1 is the highest and Level 3 is the lowest. For more information regarding the fair value hierarchy, seeNote 1— General and Summary of Significant Accounting Policies included in Item 8 of this Form 10-K.
Fair Value of Financial Instruments — A significant number of the Company's financial instruments are carried at fair value with changes in fair valuerecognized in earnings or other comprehensive income each period. The Company makes estimates regarding the valuation of assets and liabilities measured at fairvalue in preparing the Consolidated Financial Statements. These assets and liabilities include short and long-term investments in debt and equity securities,included in the balance sheet line items Short-term investments and Other assets (Noncurrent) , derivative assets, included in Other current asset s and Other assets(Noncurrent) and derivative liabilities, included in Accrued and other liabilities (current) and Other long-term liabilities . Investments are generally fair valuedbased on quoted market prices or other observable market data such as interest rate indices. The Company's investments are primarily certificates of deposit,government debt securities and money market funds. Derivatives are valued using observable data as inputs into internal valuation models. The Company'sderivatives primarily consist of interest rate swaps, foreign currency instruments, and commodity and embedded derivatives. Additional discussion regarding thenature of these financial instruments and valuation techniques can be found in Note 4 — Fair Value included in Item 8 of this Form 10-K.
Fair Value of Nonfinancial Assets and Liabilities — Significant estimates are made in determining the fair value of long-lived tangible and intangible assets(i.e., property, plant and equipment, intangible assets and goodwill) during the impairment evaluation process. In addition, the majority of assets acquired andliabilities assumed in a business combination are required to be recognized at fair value under the relevant accounting guidance. In determining the fair value ofthese items, management makes several assumptions as discussed in the Impairments section above.
Accounting for Derivative Instruments and Hedging Activities — We enter into various derivative transactions in order to hedge our exposure to certainmarket risks. We primarily use derivative instruments to manage our interest rate, commodity and foreign currency exposures. We do not enter into derivativetransactions for trading purposes.
In accordance with the accounting standards for derivatives and hedging, we recognize all derivatives as either assets or liabilities in the balance sheet andmeasure those instruments at fair value except where derivatives qualify and are designated as "normal purchase/normal sale" transactions. Changes in fair value ofderivatives are recognized in earnings unless specific hedge criteria are met. Income and expense related to derivative instruments are recognized in the samecategory as that generated by the underlying asset or liability. See Note 6 — Derivative Instruments and Hedging Activities included in Item 8 of this Form 10-Kfor further information on the classification.
The accounting standards for derivatives and hedging enable companies to designate qualifying derivatives as hedging instruments based on the exposurebeing hedged. These hedge designations include fair value hedges and cash flow hedges. Changes in the fair value of a derivative that is highly effective and isdesignated and qualifies as a fair value hedge, are recognized in earnings as offsets to the changes in fair value of the exposure being hedged. The Company has nofair value hedges at this time. Changes in the fair value of a derivative that is highly effective and is designated as and qualifies as a cash flow hedge, are deferredin accumulated other comprehensive income and are recognized into earnings as the hedged transactions occur. Any ineffectiveness is recognized in earningsimmediately. For all hedge contracts, the Company provides formal documentation of the hedge and effectiveness testing in accordance with the accountingstandards for derivatives and hedging.
The fair value measurement accounting standard provides additional guidance on the definition of fair value and defines fair value as the price that would bereceived to sell an asset or paid to transfer a liability in an orderly transaction between market participants at the measurement date, or exit price. The fair valuemeasurement standard requires the Company to consider and reflect the assumptions of market participants in the fair value calculation. These factors includenonperformance risk (the risk that the obligation will not be fulfilled) and credit risk, both of the reporting entity (for liabilities) and of the counterparty (for assets).Due to the nature of the Company's interest rate swaps, which are typically associated with non-recourse debt, credit risk for AES is evaluated at the subsidiarylevel rather than at the Parent Company level. Nonperformance
115
risk on the Company's derivative instruments is an adjustment to the initial asset/liability fair value position that is derived from internally developed valuationmodels that utilize observable market inputs.
As a result of uncertainty, complexity and judgment, accounting estimates related to derivative accounting could result in material changes to our financialstatements under different conditions or utilizing different assumptions. As a part of accounting for these derivatives, we make estimates concerningnonperformance, volatilities, market liquidity, future commodity prices, interest rates, credit ratings (both ours and our counterparty's), and future exchange rates.Refer to Note 4 — Fair Value included in Item 8 of this Form 10-K for additional details.
The fair value of our derivative portfolio is generally determined using internal valuation models, most of which are based on observable market inputsincluding interest rate curves and forward and spot prices for currencies and commodities. The Company derives most of its financial instrument marketassumptions from market efficient data sources (e.g., Bloomberg, Reuters and Platt's). In some cases, where market data is not readily available, management usescomparable market sources and empirical evidence to derive market assumptions to determine a financial instrument's fair value. In certain instances, the publishedcurve may not extend through the remaining term of the contract and management must make assumptions to extrapolate the curve. Specifically, where there islimited forward curve data with respect to foreign exchange contracts, beyond the traded points the Company utilizes the purchasing power parity approach toconstruct the remaining portion of the forward curve using relative inflation rates. Additionally, in the absence of quoted prices, we may rely on "indicativepricing" quotes from financial institutions to input into our valuation model for certain of our foreign currency swaps. These indicative pricing quotes do notconstitute either a bid or ask price and therefore are not considered observable market data. For individual contracts, the use of different valuation models orassumptions could have a material effect on the calculated fair value.
Regulatory Assets — Management continually assesses whether the regulatory assets are probable of future recovery by considering factors such asapplicable regulatory changes, recent rate orders applicable to other regulated entities and the status of any pending or potential deregulation legislation. If futurerecovery of costs ceases to be probable, any asset write-offs would be required to be recognized in operating income.
Consolidation — The Company has recently entered into several transactions whereby the Company sells an interest in its controlled subsidiaries and/orequity method investments. In connection with each transaction, the Company must determine whether the sale of the interest impacts the Company's consolidationconclusion by first determining whether the transaction should be evaluated under the variable interest model or the voting model. In determining whichconsolidation model applies to the transaction, the Company is required to make judgments about how the entity operates, the most significant of which arewhether (i) the entity has sufficient equity to finance its activities, (ii) the equity holders, as a group, have the characteristics of a controlling financial interest, and(iii) whether the entity has non-substantive voting rights.
If the entity is determined to be a variable interest entity, the most significant judgment in determining whether the Company must consolidate the entity iswhether the subsidiary, including its related parties and de facto agents, collectively have power and benefits. If AES is determined to have power and benefits, theentity will be consolidated by AES.
Alternatively, if the entity is determined to be a voting model entity, the most significant judgments involve determining whether the non-AES shareholdershave substantive participating rights. The assessment of shareholder rights and whether they are substantive participating rights requires significant judgment sincethe rights provided under shareholders' agreements may include selecting, terminating, and setting the compensation of management responsible for implementingthe subsidiary's policies and procedures, establishing operating and capital decisions of the entity, including budgets, in the ordinary course of business. On theother hand, if shareholder rights are only protective in nature (referred to as protective rights) then such rights would not overcome the presumption that the ownerof a majority voting interest shall consolidate its investee. Significant judgment is required to determine whether minority rights represent substantive participatingrights or protective rights that do not affect the evaluation of control. While both represent an approval or veto right, a distinguishing factor is the underlyingactivity or action to which the right relates.
Pension and Other Postretirement Plans — Effective January 1, 2016 the Company will apply a disaggregated discount rate approach for determiningservice cost and interest cost for its defined benefit pension plans and post-retirement plans in the U.S. and U.K. Refer to Note 1 — General and Summary ofSignificant Accounting Policies included in Item 8 of this Form 10-K for further information.
New Accounting Pronouncements — See Note 1 — General and Summary of Significant Accounting Policies included in Item 8 of this Form 10-K for furtherinformation about new accounting pronouncements adopted during 2015 and accounting pronouncements issued but not yet effective.
ITEM 7A. QUANTITATIVE AND QUALITATIVE DISCLOSURES ABOUT MARKET RISK
Overview Regarding Market Risks — Our businesses are exposed to and proactively manage market risk. Our primary market risk exposure is to the priceof commodities, particularly electricity, oil, natural gas, coal and environmental credits. We
116
operate in multiple countries and as such are subject to volatility in exchange rates at varying degrees at the subsidiary level and between our functional currency,the U.S. Dollar, and currencies of the countries in which we operate. We are also exposed to interest rate fluctuations due to our issuance of debt and relatedfinancial instruments.
The disclosures presented in this Item 7A are based upon a number of assumptions; actual effects may differ. The safe harbor provided in Section 27A of theSecurities Act of 1933 and Section 21E of the Securities Exchange Act of 1934 shall apply to the disclosures contained in this Item 7A. For further informationregarding market risk, see Item 1A.— Risk Factors , Our financial position and results of operations may fluctuate significantly due to fluctuations in currencyexchange rates experienced at our foreign operations , Our businesses may incur substantial costs and liabilities and be exposed to price volatility as a result ofrisks associated with the electricity markets, which could have a material adverse effect on our financial performance, and We may not be adequately hedgedagainst our exposure to changes in commodity prices or interest rates of this 2015 Form 10-K.
Commodity Price Risk — Although we prefer to hedge our exposure to the impact of market fluctuations in the price of electricity, fuels and environmentalcredits, some of our generation businesses operate under short-term sales or under contract sales that leave an unhedged exposure on some of our capacity orthrough imperfect fuel pass-throughs. In our utility businesses, we may be exposed to commodity price movements depending on our excess or shortfall ofgeneration relative to load obligations and sharing or pass-through mechanisms. These businesses subject our operational results to the volatility of prices forelectricity, fuels and environmental credits in competitive markets. We employ risk management strategies to hedge our financial performance against the effectsof fluctuations in energy commodity prices. The implementation of these strategies can involve the use of physical and financial commodity contracts, futures,swaps and options. At our generation businesses for 2016-2018, 80% to 85% of our variable margin is hedged against changes in commodity prices. At our utilitybusinesses for 2016-2018, 85% to 90% of our variable margin is insulated from changes in commodity prices.
The portion of our sales and purchases that are not subject to such agreements or contracted businesses where indexation is not perfectly matched to businessdrivers will be exposed to commodity price risk. When hedging the output of our generation assets, we utilize contract sales that lock in the spread per MWhbetween variable costs and the price at which the electricity can be sold.
AES businesses will see changes in variable margin performance as global commodity prices shift. For 2016, we project pretax earnings exposure on a 10%move in commodity prices would be approximately $25 million for U.S. power (DPL), less than $5 million for natural gas, $5 million for oil and $10 million forcoal. Our estimates exclude correlation of oil with coal or natural gas. For example, a decline in oil or natural gas prices can be accompanied by a decline in coalprice if commodity prices are correlated. In aggregate, the Company's downside exposure occurs with lower oil, lower natural gas, and higher coal prices.Exposures at individual businesses will change as new contracts or financial hedges are executed, and our sensitivity to changes in commodity prices generallyincreases in later years with reduced hedge levels at some of our businesses.
Commodity prices affect our businesses differently depending on the local market characteristics and risk management strategies. Spot power prices, contractindexation provisions and generation costs can be directly or indirectly affected by movements in the price of natural gas, oil and coal. We have some naturaloffsets across our businesses such that low commodity prices may benefit certain businesses and be a cost to others. Exposures are not perfectly linear orsymmetric. The sensitivities are affected by a number of local or indirect market factors. Examples of these factors include hydrology, local energy marketsupply/demand balances, regional fuel supply issues, regional competition, bidding strategies and regulatory interventions such as price caps. Operationalflexibility changes the shape of our sensitivities. For instance, certain power plants may limit downside exposure by reducing dispatch in low market environments.Volume variation also affects our commodity exposure. The volume sold under contracts or retail concessions can vary based on weather and economic conditionsresulting in a higher or lower volume of sales in spot markets. Thermal unit availability and hydrology can affect the generation output available for sale and canaffect the marginal unit setting power prices.
In the US SBU, the generation businesses are largely contracted but may have residual risk to the extent contracts are not perfectly indexed to the businessdrivers. IPL sells power at wholesale once retail demand is served, so retail sales demand may affect commodity exposure. Additionally, at DPL, open accessallows our retail customers to switch to alternative suppliers; falling energy prices may increase the rate of switching; DPL sells generation in excess of its retaildemand under short-term sales. Given that natural gas-fired generators set power prices for many markets, higher natural gas prices expand margins. The positiveimpact on margins will be moderated if natural gas-fired generators set the market price only during peak periods.
In the Andes SBU, our business in Chile owns assets in the central and northern regions of the country and has a portfolio of contract sales in both. In thecentral region, the contract sales generally cover the efficient generation from our coal-fired and hydroelectric assets. Any residual spot price risk will primarily bedriven by the amount of hydrological inflows. In the case of low hydroelectric generation, spot price exposure is capped by the ability to dispatch our naturalgas/diesel assets the price of which depends on fuel pricing at the time required. There is a small amount of coal generation in the northern region that is notcovered by the portfolio of contract sales and therefore subject to spot price risk. In both regions, generators with oil or oil-
117
linked fuel generally set power prices. In Colombia, we operate under a short-term sales strategy and have commodity exposure to unhedged volumes. Because weown hydroelectric assets there, contracts are not indexed to fuel.
In the Brazil SBU, the hydroelectric generating facility is covered by contract sales. Under normal hydrological volatility, spot price risk is mitigated througha regulated sharing mechanism across all hydroelectric generators in the country. Under drier conditions, the sharing mechanism may not be sufficient to cover thebusiness' contract position, and therefore it may have to purchase power at spot prices driven by the cost of thermal generation.
In the MCAC SBU, our businesses have commodity exposure on unhedged volumes. Panama is highly contracted under a portfolio of fixed volume contractsales. To the extent hydrological inflows are greater than or less than the contract sales volume, the business will be sensitive to changes in spot power prices whichmay be driven by oil prices in some time periods. In the Dominican Republic, we own natural gas-fired assets contracted under a portfolio of contract sales and acoal-fired asset contracted with a single contract, and both contract and spot prices may move with commodity prices. Additionally, the contract levels do notalways match our generation availability and our assets may be sellers of spot prices in excess of contract levels or a net buyer in the spot market to satisfy contractobligations.
In the Europe SBU, our Kilroot facility operates on a short-term sales strategy. To the extent that sales are unhedged, the commodity risk at our Kilrootbusiness is to the clean dark spread, which is the difference between electricity price and our coal-based variable dispatch cost including emissions. Natural gas-fired generators set power prices for many periods, so higher natural gas prices generally expand margins and higher coal or emissions prices reduce them.Similarly, increased wind generators displaces higher cost generation, reducing Kilroot's margins, and vice versa.
In the Asia SBU, our Masinloc business is a coal-fired generation facility which hedges its output under a portfolio of contract sales that are indexed to fuelprices, with generation in excess of contract volume or shortfalls of generation relative to contract volumes settled in the spot market. Low oil prices may be adriver of margin compression since oil affects spot power sale prices sold in the spot market. Low oil prices may be a driver of margin compression since oilaffects spot power sale prices. Our Mong Duong business has minimal exposure to commodity price risk as it has no merchant exposure and fuel is subject to apass-through mechanism.
Foreign Exchange Rate Risk — In the normal course of business, we are exposed to foreign currency risk and other foreign operations risks that arise frominvestments in foreign subsidiaries and affiliates. A key component of these risks stems from the fact that some of our foreign subsidiaries and affiliates utilizecurrencies other than our consolidated reporting currency, the U.S. Dollar ("USD"). Additionally, certain of our foreign subsidiaries and affiliates have entered intomonetary obligations in the USD or currencies other than their own functional currencies. We have varying degrees of exposure to changes in the exchange ratebetween the USD and the following currencies: Argentine Peso, British Pound, Brazilian Real, Chilean Peso, Colombian Peso, Dominican Peso, Euro, IndianRupee, Kazakhstan Tenge, Mexican Peso and Philippine Peso. These subsidiaries and affiliates have attempted to limit potential foreign exchange exposure byentering into revenue contracts that adjust to changes in foreign exchange rates. We also use foreign currency forwards, swaps and options, where possible, tomanage our risk related to certain foreign currency fluctuations.
We have entered into hedges to partially mitigate the exposure of earnings translated into the USD to foreign exchange volatility. The largest foreignexchange risks over a 12-month forward-looking period stem from the following currencies: Argentine Peso, British Pound, Brazilian Real, Colombian Peso, Euroand Kazakhstan Tenge. As of December 31, 2015 , assuming a 10% USD appreciation, adjusted pretax earnings attributable to foreign subsidiaries exposed tomovement in the exchange rate of the Argentine Peso, Brazilian Real, Colombian Peso, Euro and Kazakhstan Tenge relative to the USD are projected to bereduced by approximately $5 million, British Pound — less than $5 million for 2016. These numbers have been produced by applying a one-time 10% USDappreciation to forecasted exposed pretax earnings for 2016 coming from the respective subsidiaries exposed to the currencies listed above, net of the impact ofoutstanding hedges and holding all other variables constant. The numbers presented above are net of any transactional gains/losses. These sensitivities may changein the future as new hedges are executed or existing hedges are unwound. Additionally, updates to the forecasted pretax earnings exposed to foreign exchange riskmay result in further modification. The sensitivities presented do not capture the impacts of any administrative market restrictions or currency inconvertibility.
Interest Rate Risks — We are exposed to risk resulting from changes in interest rates as a result of our issuance of variable and fixed-rate debt, as well asinterest rate swap, cap, floor and option agreements.
Decisions on the fixed-floating debt mix are made to be consistent with the risk factors faced by individual businesses or plants. Depending on whether aplant's capacity payments or revenue stream is fixed or varies with inflation, we partially hedge against interest rate fluctuations by arranging fixed-rate or variable-rate financing. In certain cases, particularly for non-recourse financing, we execute interest rate swap, cap and floor agreements to effectively fix or limit theinterest rate exposure on the underlying financing. Most of our interest rate risk is related to non-recourse financings at our businesses.
As of December 31, 2015 , the portfolio's pretax earnings exposure for 2016 to a 100-basis-point increase in interest rates
118

for our Argentine Peso, Brazilian Real, Colombian Peso, Euro, Kazakhstani Tenge and USD denominated debt would be approximately $30 million based on theimpact of a one time,100-basis-point upward shift in interest rates on interest expense for the debt denominated in these currencies. These amounts do not take intoaccount the historical correlation between these interest rates.
119

ITEM 8. FINANCIAL STATEMENTS AND SUPPLEMENTARY DATA
REPORT OF INDEPENDENT REGISTERED PUBLIC ACCOUNTING FIRM
The Board of Directors and Stockholders of The AES Corporation:
We have audited the accompanying consolidated balance sheets of The AES Corporation as of December 31, 2015 and 2014, and the related consolidatedstatements of operations, comprehensive income, changes in equity, and cash flows for each of the three years in the period ended December 31, 2015. Our auditsalso included the financial statement schedules listed in the index at Item 15(a). These financial statements and schedules are the responsibility of the Company’smanagement. Our responsibility is to express an opinion on these financial statements and schedules based on our audits.
We conducted our audits in accordance with the standards of the Public Company Accounting Oversight Board (United States). Those standards require thatwe plan and perform the audit to obtain reasonable assurance about whether the financial statements are free of material misstatement. An audit also includesexamining, on a test basis, evidence supporting the amounts and disclosures in the financial statements. An audit also includes assessing the accounting principlesused and significant estimates made by management, as well as evaluating the overall financial statement presentation. We believe that our audits provide areasonable basis for our opinion.
In our opinion, the financial statements referred to above present fairly, in all material respects, the consolidated financial position of The AES Corporation atDecember 31, 2015 and 2014, and the consolidated results of its operations and its cash flows for each of the three years in the period ended December 31, 2015, inconformity with U.S. generally accepted accounting principles. Also, in our opinion, the related financial statement schedules, when considered in relation to thebasic financial statements taken as a whole, present fairly, in all material respects, the information set forth therein.
As discussed in Note 1 to the consolidated financial statements, the Company changed its requirements for reporting discontinued operations as a result of theadoption of the amendments to the FASB Accounting Standards Codification resulting from Accounting Standards Update No. 2014-08, “Reporting DiscontinuedOperations and Disclosures of Disposals of Components of an Entity,” effective July 1, 2014. Also, the Company changed its accounting for service concessionarrangements as a result of the adoption of the amendments to the FASB Accounting Standards Codification resulting from Accounting Standards Update No.2014-05, “Service Concession Arrangements,” effective January 1, 2015. Lastly, the Company changed its classification of all deferred tax assets and liabilities asa result of the adoption of the amendments to the FASB Accounting Standards Codification resulting from Accounting Standards Update No. 2015-17, “IncomeTaxes,” effective December 31, 2015.
We also have audited, in accordance with the standards of the Public Company Accounting Oversight Board (United States), The AES Corporation’s internalcontrol over financial reporting as of December 31, 2015, based on criteria established in Internal Control-Integrated Framework issued by the Committee ofSponsoring Organizations of the Treadway Commission (2013 framework) and our report dated February 23, 2016 expressed an unqualified opinion thereon.
/s/ Ernst & Young LLP
McLean, VirginiaFebruary 23, 2016
120

THE AES CORPORATIONCONSOLIDATED BALANCE SHEETS
DECEMBER 31, 2015 AND 2014
2015 2014 (in millions, except share and per share data)
ASSETS CURRENT ASSETS
Cash and cash equivalents $ 1,262 $ 1,539Restricted cash 295 283Short-term investments 484 709Accounts receivable, net of allowance for doubtful accounts of $95 and $96, respectively 2,473 2,709Inventory 675 702Deferred income taxes — 275Prepaid expenses 108 175Other current assets 1,473 1,434Assets of held-for-sale businesses 96 —
Total current assets 6,866 7,826NONCURRENT ASSETS Property, Plant and Equipment:
Land 711 870Electric generation, distribution assets and other 28,491 30,459Accumulated depreciation (9,449) (9,962)Construction in progress 3,063 3,784
Property, plant and equipment, net 22,816 25,151Other Assets:
Investments in and advances to affiliates 610 537Debt service reserves and other deposits 565 411Goodwill 1,157 1,458Other intangible assets, net of accumulated amortization of $97 and $158, respectively 214 281Deferred income taxes 543 662Service concession assets, net of accumulated amortization of $34 1,543 —Other noncurrent assets 2,536 2,640
Total other assets 7,168 5,989TOTAL ASSETS $ 36,850 $ 38,966
LIABILITIES AND EQUITY CURRENT LIABILITIES
Accounts payable $ 1,721 $ 2,278Accrued interest 251 260Accrued and other liabilities 2,436 2,326Recourse debt — 151Non-recourse debt, including $163 and $240, respectively, related to variable interest entities 2,529 1,982Liabilities of held-for-sale businesses 13 —
Total current liabilities 6,950 6,997NONCURRENT LIABILITIES
Recourse debt 5,015 5,107Non-recourse debt, including $760 and $1,030, respectively, related to variable interest entities 13,263 13,618Deferred income taxes 1,090 1,277Pension and other post-retirement liabilities 927 1,342Other noncurrent liabilities 2,896 3,222
Total noncurrent liabilities 23,191 24,566Commitments and Contingencies (see Notes 13 and 14) Redeemable stock of subsidiaries 538 78

EQUITY THE AES CORPORATION STOCKHOLDERS’ EQUITY
Common stock ($0.01 par value, 1,200,000,000 shares authorized; 815,846,621 issued and 666,808,790 outstanding at December 31, 2015and 814,539,146 issued and 703,851,297 outstanding at December 31, 2014) 8 8Additional paid-in capital 8,718 8,409Retained earnings 143 512Accumulated other comprehensive loss (3,883) (3,286)Treasury stock, at cost (149,037,831 shares at December 31, 2015 and 110,687,849 shares at December 31, 2014) (1,837) (1,371)
Total AES Corporation stockholders’ equity 3,149 4,272NONCONTROLLING INTERESTS 3,022 3,053
Total equity 6,171 7,325TOTAL LIABILITIES AND EQUITY $ 36,850 $ 38,966
See Accompanying Notes to Consolidated Financial Statements.
121

THE AES CORPORATIONCONSOLIDATED STATEMENTS OF OPERATIONS
YEARS ENDED DECEMBER 31, 2015 , 2014 , AND 2013
2015 2014 2013 (in millions, except per share amounts)
Revenue: Regulated $ 7,660 $ 8,874 $ 8,056Non-regulated 7,303 8,272 7,835
Total revenue 14,963 17,146 15,891Cost of sales:
Regulated (6,564) (7,530) (6,837)Non-regulated (5,533) (6,528) (5,807)
Total cost of sales (12,097) (14,058) (12,644)Operating margin 2,866 3,088 3,247General and administrative expenses (196) (187) (220)Interest expense (1,436) (1,471) (1,482)Interest income 524 365 275Loss on extinguishment of debt (186) (261) (229)Other expense (65) (68) (76)Other income 83 124 125Gain on sale of businesses 29 358 26Goodwill impairment expense (317) (164) (372)Asset impairment expense (285) (91) (95)Foreign currency transaction gains (losses) 105 11 (22)Other non-operating expense — (128) (129)INCOME FROM CONTINUING OPERATIONS BEFORE TAXES AND EQUITY IN EARNINGS OF AFFILIATES 1,122 1,576 1,048Income tax expense (465) (419) (343)Net equity in earnings of affiliates 105 19 25INCOME FROM CONTINUING OPERATIONS 762 1,176 730Income (loss) from operations of discontinued businesses, net of income tax expense of $0, $23, and $24, respectively — 27 (27)Net loss from disposal and impairments of discontinued operations, net of income tax expense (benefit) of $0, $4, and $(15), respectively — (56) (152)NET INCOME 762 1,147 551
Noncontrolling interests: Less: (Income) from continuing operations attributable to noncontrolling interests (456) (387) (446)Plus: Loss from discontinued operations attributable to noncontrolling interests — 9 9Total net income attributable to noncontrolling interests (456) (378) (437)NET INCOME ATTRIBUTABLE TO THE AES CORPORATION $ 306 $ 769 $ 114
AMOUNTS ATTRIBUTABLE TO THE AES CORPORATION COMMON STOCKHOLDERS: Income from continuing operations, net of tax $ 306 $ 789 $ 284Loss from discontinued operations, net of tax — (20) (170)Net income $ 306 $ 769 $ 114
BASIC EARNINGS PER SHARE:
Income from continuing operations attributable to The AES Corporation common stockholders, net of tax $ 0.45 $ 1.10 $ 0.38Loss from discontinued operations attributable to The AES Corporation common stockholders, net of tax — (0.03) (0.23)NET INCOME ATTRIBUTABLE TO THE AES CORPORATION COMMON STOCKHOLDERS $ 0.45 $ 1.07 $ 0.15
DILUTED EARNINGS PER SHARE:
Income from continuing operations attributable to The AES Corporation common stockholders, net of tax $ 0.44 $ 1.09 $ 0.38Loss from discontinued operations attributable to The AES Corporation common stockholders, net of tax — (0.03) (0.23)NET INCOME ATTRIBUTABLE TO THE AES CORPORATION COMMON STOCKHOLDERS $ 0.44 $ 1.06 $ 0.15
DIVIDENDS DECLARED PER COMMON SHARE $ 0.41 $ 0.25 $ 0.17
See Accompanying Notes to Consolidated Financial Statements.

122

THE AES CORPORATIONCONSOLIDATED STATEMENTS OF COMPREHENSIVE (LOSS) INCOME
YEARS ENDED DECEMBER 31, 2015 , 2014 , AND 2013
2015 2014 2013 (in millions)
NET INCOME $ 762 $ 1,147 $ 551Foreign currency translation activity:
Foreign currency translation adjustments, net of income tax benefit (expense) of $1, $(7), and $10, respectively (1,019) (491) (375)Reclassification to earnings, net of $0 income tax for all periods — (3) 41
Total foreign currency translation adjustments (1,019) (494) (334)Derivative activity:
Change in derivative fair value, net of income tax benefit (expense) of $16, $72 and $(31), respectively (57) (358) 108Reclassification to earnings, net of income tax (expense) of $(11), $(26) and $(41), respectively 66 99 139
Total change in fair value of derivatives 9 (259) 247Pension activity:
Change in pension adjustments due to prior service cost, net of $0 income tax for all periods 1 — —Change in pension adjustments due to net actuarial gain (loss) for the period, net of income tax (expense) benefit of $(29), $27, and $(198),respectively 60 (49) 379Reclassification to earnings due to amortization of net actuarial loss, net of income tax (expense) of $(9), $(7), and $(26), respectively 16 29 52
Total pension adjustments 77 (20) 431OTHER COMPREHENSIVE (LOSS) INCOME (933) (773) 344COMPREHENSIVE (LOSS) INCOME (171) 374 895Less: Comprehensive (income) attributable to noncontrolling interests (133) (49) (743)COMPREHENSIVE (LOSS) INCOME ATTRIBUTABLE TO THE AES CORPORATION $ (304) $ 325 $ 152
See Accompanying Notes to Consolidated Financial Statements.
123
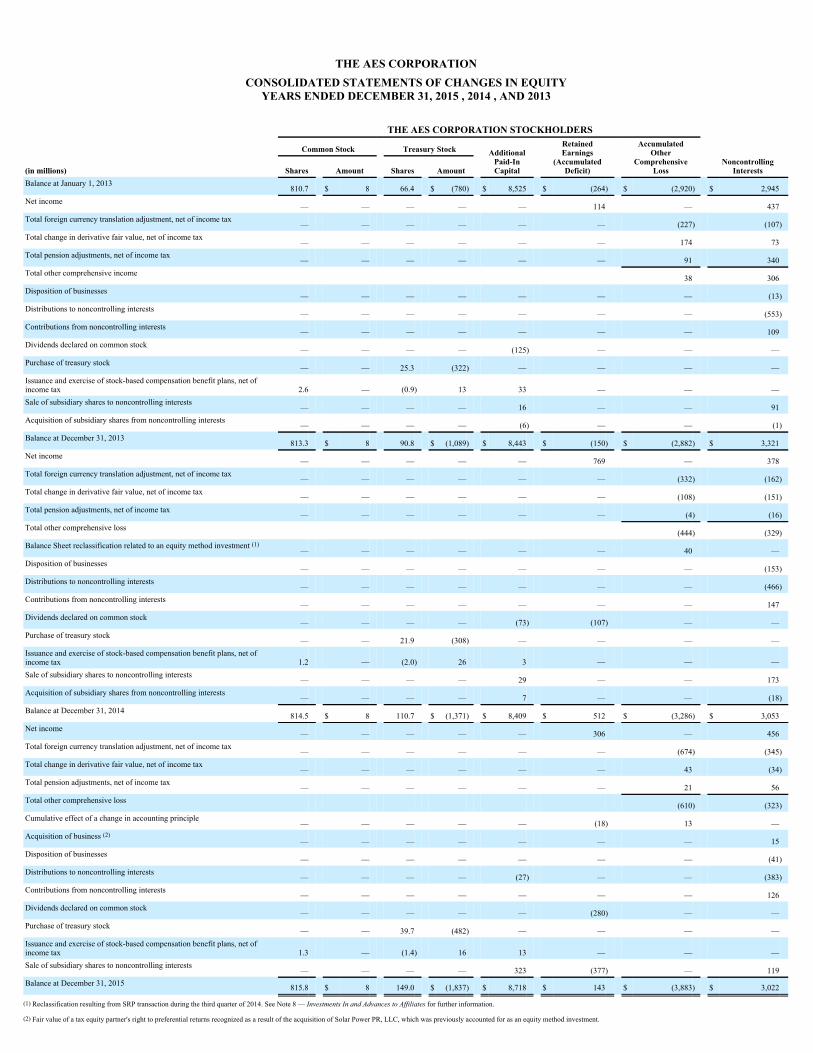
THE AES CORPORATIONCONSOLIDATED STATEMENTS OF CHANGES IN EQUITY
YEARS ENDED DECEMBER 31, 2015 , 2014 , AND 2013
THE AES CORPORATION STOCKHOLDERS Common Stock Treasury Stock
AdditionalPaid-InCapital
RetainedEarnings
(AccumulatedDeficit)
AccumulatedOther
ComprehensiveLoss Noncontrolling
Interests(in millions) Shares Amount Shares Amount Balance at January 1, 2013
810.7 $ 8 66.4 $ (780) $ 8,525 $ (264) $ (2,920) $ 2,945Net income
— — — — — 114 — 437Total foreign currency translation adjustment, net of income tax
— — — — — — (227) (107)Total change in derivative fair value, net of income tax
— — — — — — 174 73Total pension adjustments, net of income tax
— — — — — — 91 340Total other comprehensive income 38 306Disposition of businesses
— — — — — — — (13)Distributions to noncontrolling interests
— — — — — — — (553)Contributions from noncontrolling interests
— — — — — — — 109Dividends declared on common stock
— — — — (125) — — —Purchase of treasury stock
— — 25.3 (322) — — — —Issuance and exercise of stock-based compensation benefit plans, net ofincome tax 2.6 — (0.9) 13 33 — — —Sale of subsidiary shares to noncontrolling interests
— — — — 16 — — 91Acquisition of subsidiary shares from noncontrolling interests
— — — — (6) — — (1)Balance at December 31, 2013
813.3 $ 8 90.8 $ (1,089) $ 8,443 $ (150) $ (2,882) $ 3,321Net income
— — — — — 769 — 378Total foreign currency translation adjustment, net of income tax
— — — — — — (332) (162)Total change in derivative fair value, net of income tax
— — — — — — (108) (151)Total pension adjustments, net of income tax
— — — — — — (4) (16)Total other comprehensive loss (444) (329)Balance Sheet reclassification related to an equity method investment (1)
— — — — — — 40 —Disposition of businesses
— — — — — — — (153)Distributions to noncontrolling interests
— — — — — — — (466)Contributions from noncontrolling interests
— — — — — — — 147Dividends declared on common stock
— — — — (73) (107) — —Purchase of treasury stock
— — 21.9 (308) — — — —Issuance and exercise of stock-based compensation benefit plans, net ofincome tax 1.2 — (2.0) 26 3 — — —Sale of subsidiary shares to noncontrolling interests
— — — — 29 — — 173Acquisition of subsidiary shares from noncontrolling interests
— — — — 7 — — (18)Balance at December 31, 2014
814.5 $ 8 110.7 $ (1,371) $ 8,409 $ 512 $ (3,286) $ 3,053Net income
— — — — — 306 — 456Total foreign currency translation adjustment, net of income tax
— — — — — — (674) (345)Total change in derivative fair value, net of income tax
— — — — — — 43 (34)Total pension adjustments, net of income tax
— — — — — — 21 56Total other comprehensive loss (610) (323)Cumulative effect of a change in accounting principle
— — — — — (18) 13 —Acquisition of business (2)
— — — — — — — 15Disposition of businesses
— — — — — — — (41)Distributions to noncontrolling interests
— — — — (27) — — (383)Contributions from noncontrolling interests
— — — — — — — 126Dividends declared on common stock
— — — — — (280) — —Purchase of treasury stock
— — 39.7 (482) — — — —Issuance and exercise of stock-based compensation benefit plans, net ofincome tax 1.3 — (1.4) 16 13 — — —Sale of subsidiary shares to noncontrolling interests
— — — — 323 (377) — 119Balance at December 31, 2015 815.8 $ 8 149.0 $ (1,837) $ 8,718 $ 143 $ (3,883) $ 3,022
(1) Reclassification resulting from SRP transaction during the third quarter of 2014. See Note 8 — Investments In and Advances to Affiliates for further information.
(2) Fair value of a tax equity partner's right to preferential returns recognized as a result of the acquisition of Solar Power PR, LLC, which was previously accounted for as an equity method investment.

See Accompanying Notes to Consolidated Financial Statements
124
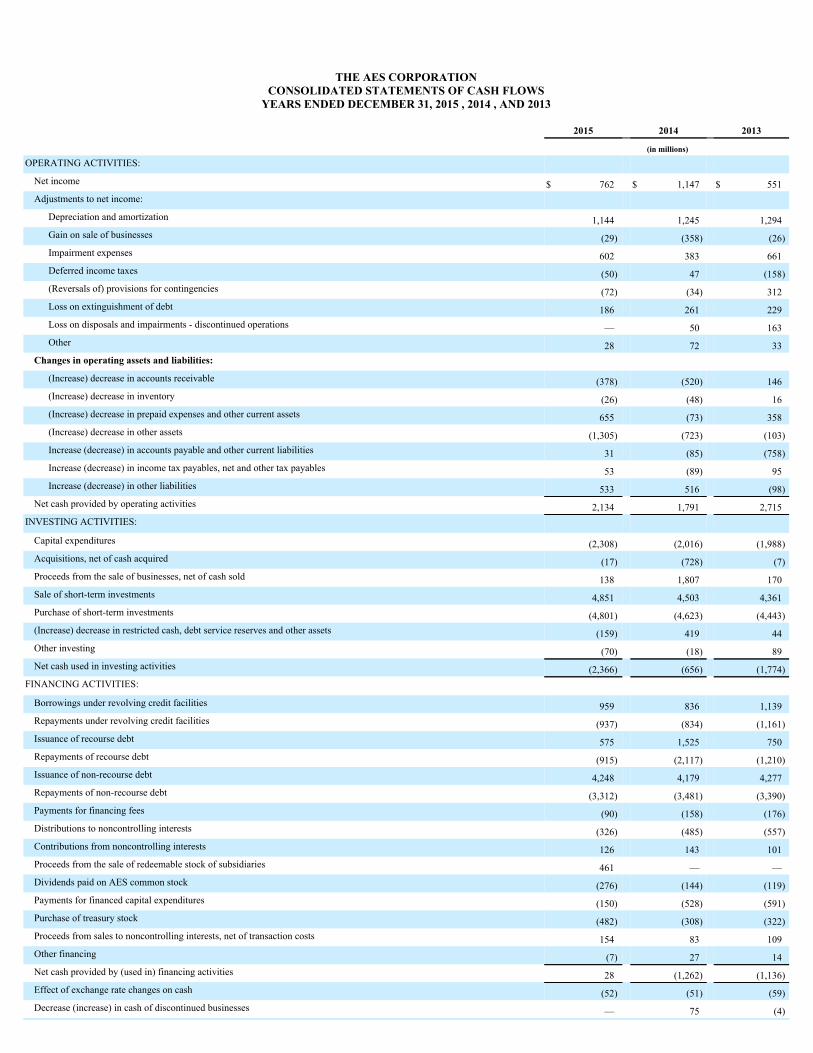
THE AES CORPORATIONCONSOLIDATED STATEMENTS OF CASH FLOWS
YEARS ENDED DECEMBER 31, 2015 , 2014 , AND 2013
2015 2014 2013 (in millions)
OPERATING ACTIVITIES: Net income $ 762 $ 1,147 $ 551Adjustments to net income:
Depreciation and amortization 1,144 1,245 1,294Gain on sale of businesses (29) (358) (26)Impairment expenses 602 383 661Deferred income taxes (50) 47 (158)(Reversals of) provisions for contingencies (72) (34) 312Loss on extinguishment of debt 186 261 229Loss on disposals and impairments - discontinued operations — 50 163Other 28 72 33
Changes in operating assets and liabilities: (Increase) decrease in accounts receivable (378) (520) 146(Increase) decrease in inventory (26) (48) 16(Increase) decrease in prepaid expenses and other current assets 655 (73) 358(Increase) decrease in other assets (1,305) (723) (103)Increase (decrease) in accounts payable and other current liabilities 31 (85) (758)Increase (decrease) in income tax payables, net and other tax payables 53 (89) 95Increase (decrease) in other liabilities 533 516 (98)
Net cash provided by operating activities 2,134 1,791 2,715INVESTING ACTIVITIES:
Capital expenditures (2,308) (2,016) (1,988)Acquisitions, net of cash acquired (17) (728) (7)Proceeds from the sale of businesses, net of cash sold 138 1,807 170Sale of short-term investments 4,851 4,503 4,361Purchase of short-term investments (4,801) (4,623) (4,443)(Increase) decrease in restricted cash, debt service reserves and other assets (159) 419 44Other investing (70) (18) 89Net cash used in investing activities (2,366) (656) (1,774)
FINANCING ACTIVITIES: Borrowings under revolving credit facilities 959 836 1,139Repayments under revolving credit facilities (937) (834) (1,161)Issuance of recourse debt 575 1,525 750Repayments of recourse debt (915) (2,117) (1,210)Issuance of non-recourse debt 4,248 4,179 4,277Repayments of non-recourse debt (3,312) (3,481) (3,390)Payments for financing fees (90) (158) (176)Distributions to noncontrolling interests (326) (485) (557)Contributions from noncontrolling interests 126 143 101Proceeds from the sale of redeemable stock of subsidiaries 461 — —Dividends paid on AES common stock (276) (144) (119)Payments for financed capital expenditures (150) (528) (591)Purchase of treasury stock (482) (308) (322)Proceeds from sales to noncontrolling interests, net of transaction costs 154 83 109Other financing (7) 27 14Net cash provided by (used in) financing activities 28 (1,262) (1,136)Effect of exchange rate changes on cash (52) (51) (59)Decrease (increase) in cash of discontinued businesses — 75 (4)
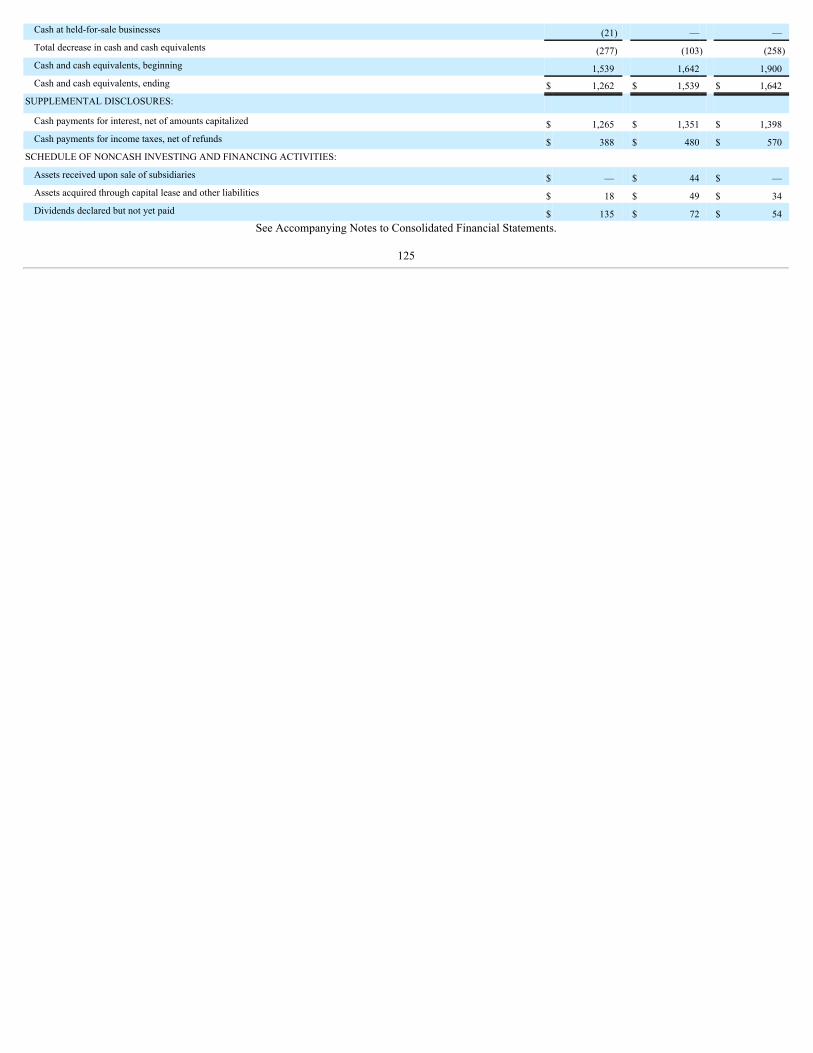
Cash at held-for-sale businesses (21) — —Total decrease in cash and cash equivalents (277) (103) (258)Cash and cash equivalents, beginning 1,539 1,642 1,900Cash and cash equivalents, ending $ 1,262 $ 1,539 $ 1,642
SUPPLEMENTAL DISCLOSURES: Cash payments for interest, net of amounts capitalized $ 1,265 $ 1,351 $ 1,398Cash payments for income taxes, net of refunds $ 388 $ 480 $ 570
SCHEDULE OF NONCASH INVESTING AND FINANCING ACTIVITIES: Assets received upon sale of subsidiaries $ — $ 44 $ —Assets acquired through capital lease and other liabilities $ 18 $ 49 $ 34Dividends declared but not yet paid $ 135 $ 72 $ 54
See Accompanying Notes to Consolidated Financial Statements.
125

THE AES CORPORATIONNOTES TO CONSOLIDATED FINANCIAL STATEMENTS
DECEMBER 31, 2015, 2014, AND 2013
1 . GENERAL AND SUMMARY OF SIGNIFICANT ACCOUNTING POLICIES
The AES Corporation is a holding company (the "Parent Company") that through its subsidiaries and affiliates, (collectively, "AES" or "the Company")operates a geographically diversified portfolio of electricity generation and distribution businesses. Generally, given this holding company structure, the liabilitiesof the individual operating entities are non-recourse to the parent and are isolated to the operating entities. Most of our operating entities are structured as limitedliability entities, which limit the liability of shareholders. The structure is generally the same regardless of whether a subsidiary is consolidated under a voting orvariable interest model.
PRINCIPLES OF CONSOLIDATION — The Consolidated Financial Statements of the Company include the accounts of The AES Corporation and itssubsidiaries, which are the entities that it controls. Furthermore, variable interest entities ("VIEs") in which the Company has a variable interest have beenconsolidated when the Company is the primary beneficiary and thus controls the VIE. Intercompany transactions and balances are eliminated in consolidation.Investments in entities where the Company has the ability to exercise significant influence, but not control, are accounted for using the equity method ofaccounting.
DP&L, our utility in Ohio, has undivided interests in five generation facilities and numerous transmission facilities. These undivided interests in jointly-owned facilities are accounted for on a pro-rata basis in our consolidated financial statements. Certain expenses, primarily fuel costs for the generating units, areallocated to the joint owners based on their energy usage. The remaining expenses, investments in fuel inventory, plant materials and operating supplies and capitaladditions are allocated to the joint owners in accordance with their respective ownership interests. See Note 3 — Property, Plant and Equipment for additionaldetails.
USE OF ESTIMATES — The preparation of these consolidated financial statements in conformity with accounting principles generally accepted in theUnited States of America ("GAAP") requires the Company to make estimates and assumptions that affect reported amounts of assets and liabilities and disclosuresof contingent assets and liabilities at the date of the consolidated financial statements, as well as the reported amounts of revenue and expenses during the reportingperiod. Actual results could differ from those estimates. Items subject to such estimates and assumptions include: the carrying amount and estimated useful lives oflong-lived assets; asset retirement obligations; impairment of goodwill, long-lived assets and equity method investments; valuation allowances for receivables anddeferred tax assets; the recoverability of regulatory assets; the estimation of regulatory liabilities; the fair value of financial instruments; the fair value of assets andliabilities acquired in a business combination; the measurement of noncontrolling interest using the hypothetical liquidation at book value ("HLBV") method forcertain renewable generation partnerships; the determination of whether a sale of noncontrolling interests is considered to be a sale of in-substance real estate (asopposed to an equity transaction); pension liabilities; environmental liabilities; and potential litigation claims and settlements.
DISCONTINUED OPERATIONS AND HELD-FOR-SALE BUSINESSES — Effective July 1, 2014, the Company prospectively adopted AccountingStandards Update ("ASU") No. 2014-08, Presentation of Financial Statements (Topic 205) and Property, Plant, and Equipment (Topic 360): Reportingdiscontinued Operations and Disclosures of Disposals of Components of an Entity , which significantly changed the prior accounting guidance on discontinuedoperations. Under ASU No. 2014-08, only those disposals of components of an entity that represent a strategic shift that has (or will have) a major effect on anentity's operations and financial results are reported as discontinued operations. Amongst other changes: equity method investments that were previously scoped-out of the discontinued operations accounting guidance are now included in the scope; a business can meet the criteria to be classified as held-for-sale uponacquisition and be reported in discontinued operations; and components where an entity retains significant continuing involvement or where operations and cashflows will not be eliminated from ongoing operations as a result of a disposal transaction can meet the definition of discontinued operations. Additionally, wheresummarized amounts are presented on the face of the financial statements, reconciliations of those amounts to major classes of line items are also required. ASUNo. 2014-08 requires additional disclosures for individually material components that do not meet the definition of discontinued operations. Under the previousaccounting guidance, DPLER and Kelanitissa (which both met the Held-for-Sale criteria in 2015) and the Armenia Mountain, U.K. Wind (Operating Projects), andEbute disposals would have met the discontinued operations criteria and would have been reclassified accordingly. See Note 24 — Dispositions and Held-for-SaleBusinesses for further information.
Prior to July 1, 2014, a discontinued operation was a component of the Company that either had been disposed of or was classified as held for sale and wherethe Company did not expect to have significant cash flows from or significant continuing involvement with the component as of one year after its disposal or sale.A component was comprised of operations and cash flows that could be clearly distinguished, operationally and for financial reporting purposes, from the rest ofthe Company. Before the Company's adoption of ASU No. 2014-08, prior period amounts were retrospectively revised to reflect the
126

THE AES CORPORATIONNOTES TO CONSOLIDATED FINANCIAL STATEMENTS—(Continued)
DECEMBER 31, 2015, 2014, AND 2013
businesses determined to be discontinued operations. For components that had been determined to be discontinued operations and held for sale businesses under theold standard, the related cash flows are included within the relevant categories within operating, investing and financing activities. The aggregate amount of cashflows is offset by the net increase or decrease in cash of discontinued and held for sale businesses, which is presented as a separate line item in the ConsolidatedStatements of Cash Flows.
When an operation is classified as held for sale, the Company recognizes impairment expense, if any, at the consolidated financial statement level which alsoincludes noncontrolling interests. However, any gain or loss on the completion of a disposal transaction is recognized only for the Company's ownership interest.Upon adoption of ASU No. 2014-08 on July 1, 2014, the Company no longer recasts prior period results related to operations classified as held for sale. All assetsand liabilities of held-for-sale businesses are classified as current as they are expected to be disposed of within twelve months.
RECLASSIFICATIONS — Certain prior period amounts in the consolidated financial statements have been reclassified to conform to the currentpresentation. Non-cash impacts related to a regulatory liability at Eletropaulo were reclassified from the Increase (decrease) in accounts payable and other currentliabilities and Increase (decrease) in other liabilities lines to the (Reversals of) provisions for contingencies line on the Consolidated Statement of Cash Flows forthe year ended December 31, 2013. Additionally, amounts related to certain transactions pertaining to noncontrolling interests were reclassified from theContributions from noncontrolling interest line to the Proceeds from sales to noncontrolling interests, net of transaction costs line on the Consolidated Statementof Cash flows for the years ended December 31, 2014 and 2013.
FAIR VALUE — Fair value is the price that would be received to sell an asset or paid to transfer a liability in an orderly, hypothetical transaction betweenmarket participants at the measurement date, or exit price. The Company applies the fair value measurement accounting guidance to financial assets and liabilitiesin determining the fair value of investments in marketable debt and equity securities, included in the Consolidated Balance Sheet line items Short-term investmentsand Other assets (noncurrent) ; derivative assets, included in Other current assets and Other assets (noncurrent) ; and, derivative liabilities, included in Accruedand other liabilities (current) and Other long-term liabilities . The Company applies the fair value measurement guidance to nonfinancial assets and liabilities uponthe acquisition of a business or in conjunction with the measurement of an asset retirement obligation or a potential impairment loss on an asset group or goodwillunder the accounting guidance for the impairment of long-lived assets or goodwill.
The Company makes assumptions about what market participants would assume in valuing an asset or liability based on the best information available.These factors include nonperformance risk (the risk that the obligation will not be fulfilled) and credit risk of the subsidiary (for liabilities) and of the counterparty(for assets). The Company is prohibited from including transaction costs and any adjustments for blockage factors in determining fair value. The principal or mostadvantageous market is considered from the perspective of the subsidiary owning the asset or with the liability.
Fair value is based on observable market prices where available. Where they are not available, specific valuation models and techniques are applieddepending on what is being fair valued. These models and techniques maximize the use of observable inputs and minimize the use of unobservable inputs. Theprocess involves varying levels of management judgment, the degree of which is dependent on price transparency and complexity. An asset's or liability's levelwithin the fair value hierarchy is based on the lowest level of input significant to the fair value measurement, where Level 1 is the highest and Level 3 is the lowest.The three levels are defined as follows:
• Level 1 — unadjusted quoted prices in active markets accessible by the Company for identical assets or liabilities. Active markets are those in whichtransactions for the asset or liability occur with sufficient frequency and volume to provide pricing information on an ongoing basis.
• Level 2 — pricing inputs other than quoted market prices included in Level 1 which are based on observable market data, that are directly or indirectlyobservable for substantially the full term of the asset or liability. These include quoted market prices for similar assets or liabilities, quoted market pricesfor identical or similar assets in markets that are not active, adjusted quoted market prices, inputs from observable data such as interest rate and yieldcurves, volatilities or default rates observable at commonly quoted intervals or inputs derived from observable market data by correlation or other means.
• Level 3 — pricing inputs that are unobservable from objective sources. Unobservable inputs are only used to the extent observable inputs aren't available.These inputs maintain the concept of an exit price from the perspective of a market participant and reflect assumptions of other market participants. TheCompany considers all market participant assumptions that are available without unreasonable cost and effort. These are given the lowest priority and aregenerally used in internally developed methodologies to generate management's best estimate of the fair value when no observable market data isavailable.
127

THE AES CORPORATIONNOTES TO CONSOLIDATED FINANCIAL STATEMENTS—(Continued)
DECEMBER 31, 2015, 2014, AND 2013
Any transfers between all levels within the fair value hierarchy levels are recognized at the end of the reporting period.
CASH AND CASH EQUIVALENTS — The Company considers unrestricted cash on hand, deposits in banks, certificates of deposit and short-termmarketable securities with original maturities of three months or less to be cash and cash equivalents. The carrying amounts of such balances approximate fairvalue.
RESTRICTED CASH AND DEBT SERVICE RESERVES — These include cash balances which are restricted as to withdrawal or usage by thesubsidiary that owns the cash. The nature of restrictions includes restrictions imposed by financing agreements such as security deposits kept as collateral, debtservice reserves, maintenance reserves, contractual terms and others, as well as restrictions imposed by agreements related to the sales of businesses or long-termPPAs.
INVESTMENTS IN MARKETABLE SECURITIES — The Company's marketable investments are primarily unsecured debentures, certificates ofdeposit, government debt securities and money market funds. Short-term investments consist of marketable equity securities and debt securities with originalmaturities in excess of three months with remaining maturities of less than one year.
Marketable debt securities that the Company has both the positive intent and ability to hold to maturity are classified as held-to-maturity and are carried atamortized cost. Other marketable securities that the Company does not intend to hold to maturity are classified as available-for-sale or trading and are carried at fairvalue. Available-for-sale investments are fair valued at the end of each reporting period where the unrealized gains or losses are reflected in accumulated othercomprehensive loss ("AOCL"), a separate component of equity.
Investments classified as trading are fair valued at the end of each reporting period through the Consolidated Statements of Operations. Interest and dividendson investments are reported in interest income and other income , respectively. Gains and losses on sales of investments are determined using the specificidentification method.
ACCOUNTS AND NOTES RECEIVABLE AND ALLOWANCE FOR DOUBTFUL ACCOUNTS — Accounts and notes receivable are carried atamortized cost. The Company periodically assesses the collectability of accounts receivable, considering factors such as specific evaluation of collectability,historical collection experience, the age of accounts receivable and other currently available evidence of the collectability, and records an allowance for doubtfulaccounts for the estimated uncollectible amount as appropriate. Certain of our businesses charge interest on accounts receivable either under contractual terms orwhere charging interest is a customary business practice. In such cases, interest income is recognized on an accrual basis. When the collection of such interest isnot reasonably assured, interest income is recognized as cash is received. Individual accounts and notes receivable are written off when they are no longer deemedcollectible.
INVENTORY — Inventory primarily consists of fuel and other raw materials used to generate power, and spare parts and supplies used to maintain powergeneration and distribution facilities. Inventory is carried at lower of cost or market. Cost is the sum of the purchase price and incidental expenditures and chargesincurred to bring the inventory to its existing condition or location. Costs of inventory are valued primarily using the average cost method. Generally, cost isreduced to market value if the market value of inventory has declined and it is probable that the utility of inventory, in its disposal in the ordinary course ofbusiness, will not be recovered through revenue earned from the generation of power.
LONG-LIVED ASSETS — Long-lived assets include property, plant and equipment, assets under capital leases and intangible assets subject toamortization (i.e., finite-lived intangible assets).
Property, plant and equipment — Property, plant and equipment are stated at cost, net of accumulated depreciation. The cost of renewals and improvementsthat extend the useful life of property, plant and equipment are capitalized.
Construction progress payments, engineering costs, insurance costs, salaries, interest and other costs directly relating to construction in progress arecapitalized during the construction period, provided the completion of the project is deemed probable, or expensed at the time the Company determines thatdevelopment of a particular project is no longer probable. The continued capitalization of such costs is subject to ongoing risks related to successful completion,including those related to government approvals, site identification, financing, construction permitting and contract compliance. Construction-in-progress balancesare transferred to electric generation and distribution assets when an asset group is ready for its intended use. Government subsidies, liquidated damages recoveredfor construction delays and income tax credits are recorded as a reduction to property, plant and equipment and reflected in cash flows from investing activities.
Depreciation, after consideration of salvage value and asset retirement obligations, is computed primarily using the straight-line method over the estimateduseful lives of the assets, which are determined on a composite or component basis. Maintenance and repairs are charged to expense as incurred. Capital spareparts, including rotable spare parts, are included in electric generation and distribution assets. If the spare part is considered a component, it is depreciated over itsuseful life after
128
THE AES CORPORATIONNOTES TO CONSOLIDATED FINANCIAL STATEMENTS—(Continued)
DECEMBER 31, 2015, 2014, AND 2013
the part is placed in service. If the spare part is deemed part of a composite asset, the part is depreciated over the composite useful life even when being held as aspare part.
The Company's Brazilian subsidiaries, which include both generation and distribution companies, operate under concession contracts. Certain estimates areutilized to determine depreciation expense for the Brazilian subsidiaries, including the useful lives of the property, plant and equipment and the amounts to berecovered at the end of the concession contract. The amounts to be recovered under these concession contracts are based on estimates that are inherently uncertainand actual amounts recovered may differ from those estimates. These concession contracts are not within the scope of ASC 853— Service ConcessionArrangements .
Intangible Assets Subject to Amortization — Finite-lived intangible assets are amortized over their useful lives which range from 1 – 50 years. TheCompany accounts for purchased emission allowances as intangible assets and records an expense when utilized or sold. Granted emission allowances are valued atzero.
Impairment of Long-lived Assets — When circumstances indicate that the carrying amount of long-lived assets (asset group) held-for-use may not berecoverable, the Company evaluates the assets for potential impairment using internal projections of undiscounted cash flows expected to result from the use andeventual disposal of the assets. Events or changes in circumstances that may necessitate a recoverability evaluation may include, but are not limited to, adversechanges in the regulatory environment, unfavorable changes in power prices or fuel costs, increased competition due to additional capacity in the grid,technological advancements, declining trends in demand, or an expectation that it is more likely than not that the asset will be disposed of before the end of itspreviously estimated useful life. If the carrying amount of the assets exceeds the undiscounted cash flows and exceeds any fair value of the assets, an impairmentexpense is recognized for the excess up to the carrying amount of the long-lived assets (but up to any fair value for any individual long-lived asset that isdeterminable without undue cost and effort). For regulated assets where recovery through approved rates is probable, an impairment expense could be reduced bythe establishment of a regulatory asset. For other regulated assets and for non-regulated assets, impairment is recognized as an expense. When long-lived assetsmeet the criteria to be classified as held-for-sale and the carrying amount of the disposal group exceeds its fair value less costs to sell, an impairment expense isrecognized for the excess up to the carrying amount of the long-lived assets; if the fair value of the disposal group subsequently exceeds the carrying amount whilethe disposal group is still held-for-sale, any impairment expense previously recognized will be reversed up to the lower of the prior expense or the subsequentexcess.
SERVICE CONCESSION ASSETS — Service concession assets are stated at cost, net of accumulated amortization, in accordance with ASC 853. Serviceconcession assets represent the cost of all infrastructure to be transferred to the public-sector entity grantors at the end of the concession. These costs primarilyrepresent construction progress payments, engineering costs, insurance costs, salaries, interest and other costs directly relating to construction of the serviceconcession infrastructure. Government subsidies, liquidated damages recovered for construction delays and income tax credits are recorded as a reduction toService Concession Assets. Service concession assets are amortized and recognized in earnings as a cost of goods sold. Amortization is recorded ratably as buildrevenue is recognized.
For additional details regarding the impact of service concession accounting on certain of the Company's businesses, see New Accounting PronouncementsAdopted — ASU No. 2014-05, Service Concession Arrangements (Topic 853) below.
DEFERRED FINANCING COSTS — Costs incurred in connection with the issuance of long-term debt are deferred and amortized over the relatedfinancing period using the effective interest method. Make-whole payments in connection with early debt retirements are classified as cash flows used in financingactivities.
EQUITY METHOD INVESTMENTS — Investments in entities over which the Company has the ability to exercise significant influence, but not control,are accounted for using the equity method of accounting and reported in Investments in and advances to affiliates on the Consolidated Balance Sheets. TheCompany periodically assesses if there is an indication that the fair value of an equity method investment is less than its carrying amount. When an indicator exists,any excess of the carrying amount over its estimated fair value is recognized as impairment when the loss in value is deemed other-than-temporary and included inOther non-operating expense in the Consolidated Statements of Operations. The difference between the carrying amount and our underlying equity in the net assetsof the investee are accounted for as if the investee were a consolidated subsidiary, except that the portion that represents equity method goodwill is not reviewedfor impairment like consolidated goodwill. Upon acquiring the investment, we determine the fair value of the identifiable assets and assumed liabilities and thebasis difference between each fair value and the carrying amount of the corresponding asset or liability in the financial statements of the investee are recognized inour net equity in earnings of affiliates over the life of the asset or liability.
The Company discontinues the application of the equity method when an investment is reduced to zero and the Company is not otherwise committed toprovide further financial support to the investee. The Company resumes the application of the
129

THE AES CORPORATIONNOTES TO CONSOLIDATED FINANCIAL STATEMENTS—(Continued)
DECEMBER 31, 2015, 2014, AND 2013
equity method if the investee subsequently reports net income to the extent that the Company's share of such net income equals the share of net losses notrecognized during the period in which the equity method of accounting was suspended.
GOODWILL AND INDEFINITE-LIVED INTANGIBLE ASSETS — The Company evaluates goodwill and indefinite-lived intangible assets forimpairment on an annual basis and whenever events or changes in circumstances necessitate an evaluation for impairment. The Company's annual impairmenttesting date is October 1.
Goodwill — The Company evaluates goodwill impairment at the reporting unit level, which is an SBU (i.e. an operating segment as defined in the segmentreporting accounting guidance), or a component (i.e., one level below an operating segment). In determining its reporting units, the Company starts with itsmanagement reporting structure. Operating segments are identified and then analyzed to identify components which make up these operating segments. Two ormore components are combined into a single reporting unit if they are economically similar. Assets and liabilities are allocated to a reporting unit if the assets willbe employed by or a liability relates to the operations of the reporting unit or would be considered by a market participant in determining its fair value. Goodwillresulting from an acquisition is assigned to the reporting units that are expected to benefit from the synergies of the acquisition. Generally, each AES business witha goodwill balance constitutes a reporting unit as they are not reported to segment management together with other businesses and are not similar to otherbusinesses in a segment.
Goodwill is evaluated for impairment either under the qualitative assessment option or the two-step test approach depending on facts and circumstances of areporting unit, including the excess of fair value over carrying amount in the last valuation or changes in business environment. If the Company qualitativelydetermines it is more likely than not that the fair value of a reporting unit is greater than its carrying amount, the two-step impairment test is unnecessary.Otherwise, goodwill is evaluated for impairment using the two-step test, where the carrying amount of a reporting unit is compared to its fair value in Step 1; if thefair value exceeds the carrying amount, Step 2 is unnecessary. If the carrying amount exceeds the reporting unit's fair value, this could indicate potentialimpairment and Step 2 of the goodwill evaluation process is required to determine if goodwill is impaired and to measure the amount of impairment loss torecognize, if any. When Step 2 is necessary, the fair value of individual assets and liabilities is determined using valuations (which in some cases may be based inpart on third party valuation reports) or other observable sources of fair value, as appropriate. If the carrying amount of goodwill exceeds its implied fair value, theexcess is recognized as an impairment loss up to the carrying amount of the goodwill.
Most of the Company's reporting units are not publicly traded. Therefore, the Company estimates the fair value of its reporting units using internal budgetsand forecasts, adjusted for any market participants' assumptions and discounted at the rate of return required by a market participant. The Company considers bothmarket and income-based approaches to determine a range of fair value, but typically concludes that the value derived using an income-based approach is morerepresentative of fair value due to the lack of direct market comparables. The Company utilizes market data, when available, to corroborate and determine thereasonableness of the fair value derived from the income-based discounted cash flow analysis.
Indefinite-Lived Intangible Assets — The Company's indefinite-lived intangible assets primarily include land-use rights and water rights. These are tested forimpairment on an annual basis or whenever events or changes in circumstances necessitate an evaluation for impairment. If the carrying amount of an intangibleasset exceeds its fair value, the excess is recognized as impairment expense. When deemed appropriate, the Company uses the qualitative assessment option underthe accounting guidance on goodwill and intangible assets to determine whether the existence of events or circumstances indicate that it is more likely than not thatan intangible asset is impaired. If, after assessing the totality of events and circumstances, the Company determines that it is not more likely than not that anintangible asset is impaired, no further action is taken. The accounting guidance provides the option to bypass the qualitative assessment for any intangible asset inany period and proceed directly to performing the quantitative impairment test.
ACCOUNTS PAYABLE AND OTHER ACCRUED LIABILITIES — Accounts payable consists of amounts due to trade creditors related to theCompany's core business operations. These payables include amounts owed to vendors and suppliers for items such as energy purchased for resale, fuel,maintenance, inventory and other raw materials. Other accrued liabilities include items such as income taxes, regulatory liabilities, legal contingencies andemployee-related costs including payroll, benefits and related taxes.
REGULATORY ASSETS AND LIABILITIES — The Company records assets and liabilities that result from the regulated ratemaking process that arenot recognized under GAAP for non-regulated entities. Regulatory assets generally represent incurred costs that have been deferred due to the future recovery incustomer rates being probable. Generally, returns earned on regulatory assets are reflected on the Consolidated Statement of Operations within Interest Income .Regulatory liabilities generally represent obligations to make refunds to customers. Management continually assesses whether the regulatory assets are probable offuture recovery and regulatory of liabilities are probable of future payment by considering factors such as applicable regulatory changes, recent rate ordersapplicable to other regulated entities and the status of any
130
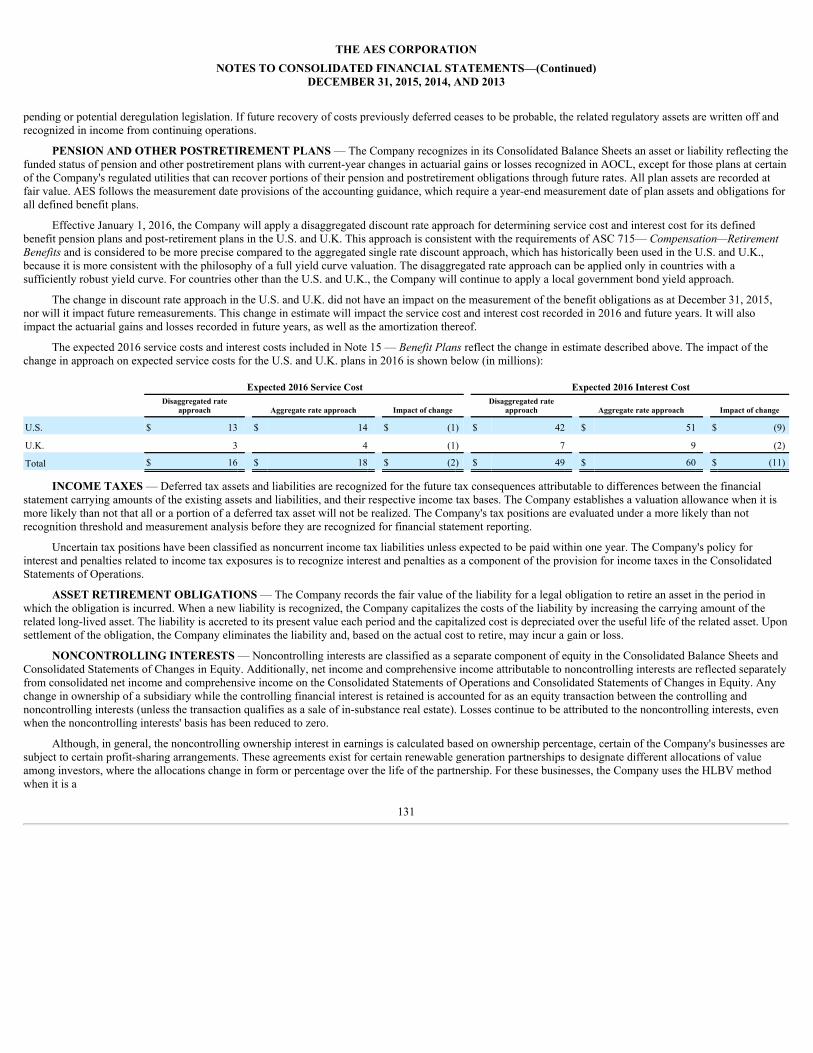
THE AES CORPORATIONNOTES TO CONSOLIDATED FINANCIAL STATEMENTS—(Continued)
DECEMBER 31, 2015, 2014, AND 2013
pending or potential deregulation legislation. If future recovery of costs previously deferred ceases to be probable, the related regulatory assets are written off andrecognized in income from continuing operations.
PENSION AND OTHER POSTRETIREMENT PLANS — The Company recognizes in its Consolidated Balance Sheets an asset or liability reflecting thefunded status of pension and other postretirement plans with current-year changes in actuarial gains or losses recognized in AOCL, except for those plans at certainof the Company's regulated utilities that can recover portions of their pension and postretirement obligations through future rates. All plan assets are recorded atfair value. AES follows the measurement date provisions of the accounting guidance, which require a year-end measurement date of plan assets and obligations forall defined benefit plans.
Effective January 1, 2016, the Company will apply a disaggregated discount rate approach for determining service cost and interest cost for its definedbenefit pension plans and post-retirement plans in the U.S. and U.K. This approach is consistent with the requirements of ASC 715— Compensation—RetirementBenefits and is considered to be more precise compared to the aggregated single rate discount approach, which has historically been used in the U.S. and U.K.,because it is more consistent with the philosophy of a full yield curve valuation. The disaggregated rate approach can be applied only in countries with asufficiently robust yield curve. For countries other than the U.S. and U.K., the Company will continue to apply a local government bond yield approach.
The change in discount rate approach in the U.S. and U.K. did not have an impact on the measurement of the benefit obligations as at December 31, 2015,nor will it impact future remeasurements. This change in estimate will impact the service cost and interest cost recorded in 2016 and future years. It will alsoimpact the actuarial gains and losses recorded in future years, as well as the amortization thereof.
The expected 2016 service costs and interest costs included in Note 15 — Benefit Plans reflect the change in estimate described above. The impact of thechange in approach on expected service costs for the U.S. and U.K. plans in 2016 is shown below (in millions):
Expected 2016 Service Cost Expected 2016 Interest Cost
Disaggregated rateapproach Aggregate rate approach Impact of change Disaggregated rate
approach Aggregate rate approach Impact of change
U.S. $ 13 $ 14 $ (1) $ 42 $ 51 $ (9)
U.K. 3 4 (1) 7 9 (2)
Total $ 16 $ 18 $ (2) $ 49 $ 60 $ (11)
INCOME TAXES — Deferred tax assets and liabilities are recognized for the future tax consequences attributable to differences between the financialstatement carrying amounts of the existing assets and liabilities, and their respective income tax bases. The Company establishes a valuation allowance when it ismore likely than not that all or a portion of a deferred tax asset will not be realized. The Company's tax positions are evaluated under a more likely than notrecognition threshold and measurement analysis before they are recognized for financial statement reporting.
Uncertain tax positions have been classified as noncurrent income tax liabilities unless expected to be paid within one year. The Company's policy forinterest and penalties related to income tax exposures is to recognize interest and penalties as a component of the provision for income taxes in the ConsolidatedStatements of Operations.
ASSET RETIREMENT OBLIGATIONS — The Company records the fair value of the liability for a legal obligation to retire an asset in the period inwhich the obligation is incurred. When a new liability is recognized, the Company capitalizes the costs of the liability by increasing the carrying amount of therelated long-lived asset. The liability is accreted to its present value each period and the capitalized cost is depreciated over the useful life of the related asset. Uponsettlement of the obligation, the Company eliminates the liability and, based on the actual cost to retire, may incur a gain or loss.
NONCONTROLLING INTERESTS — Noncontrolling interests are classified as a separate component of equity in the Consolidated Balance Sheets andConsolidated Statements of Changes in Equity. Additionally, net income and comprehensive income attributable to noncontrolling interests are reflected separatelyfrom consolidated net income and comprehensive income on the Consolidated Statements of Operations and Consolidated Statements of Changes in Equity. Anychange in ownership of a subsidiary while the controlling financial interest is retained is accounted for as an equity transaction between the controlling andnoncontrolling interests (unless the transaction qualifies as a sale of in-substance real estate). Losses continue to be attributed to the noncontrolling interests, evenwhen the noncontrolling interests' basis has been reduced to zero.
Although, in general, the noncontrolling ownership interest in earnings is calculated based on ownership percentage, certain of the Company's businesses aresubject to certain profit-sharing arrangements. These agreements exist for certain renewable generation partnerships to designate different allocations of valueamong investors, where the allocations change in form or percentage over the life of the partnership. For these businesses, the Company uses the HLBV methodwhen it is a
131

THE AES CORPORATIONNOTES TO CONSOLIDATED FINANCIAL STATEMENTS—(Continued)
DECEMBER 31, 2015, 2014, AND 2013
reasonable approximation of the profit-sharing arrangement. HLBV uses a balance sheet approach, which measures the Company's equity in income or loss bycalculating the change in the amount of net worth the partners are legally able to claim based on a hypothetical liquidation of the entity at the beginning of areporting period compared to the end of that period.
FOREIGN CURRENCY TRANSLATION — A business's functional currency is the currency of the primary economic environment in which the businessoperates and is generally the currency in which the business generates and expends cash. Subsidiaries and affiliates whose functional currency is a currency otherthan the U.S. Dollar translate their assets and liabilities into U.S. Dollars at the current exchange rates in effect at the end of the fiscal period. The revenue andexpense accounts of such subsidiaries and affiliates are translated into U.S. Dollars at the average exchange rates that prevailed during the period. Translationadjustments are included in AOCL. Gains and losses on intercompany foreign currency transactions that are long-term in nature and which the Company does notintend to settle in the foreseeable future, are also recognized in AOCL. Gains and losses that arise from exchange rate fluctuations on transactions denominated in acurrency other than the functional currency are included in determining net income. Accumulated foreign currency translation adjustments are reclassified to netincome only when realized upon sale or upon complete or substantially complete liquidation of the investment in a foreign entity. The accumulated adjustments areincluded in carrying amounts in impairment assessments where the Company has committed to a plan that will cause the accumulated adjustments to bereclassified to earnings.
REVENUE RECOGNITION — Revenue from utilities is classified as regulated in the Consolidated Statements of Operations. Revenue from the sale ofenergy is recognized in the period during which the sale occurs. The calculation of revenue earned but not yet billed is based on the number of days not billed in themonth, the estimated amount of energy delivered during those days and the estimated average price per customer class for that month. Differences between actualand estimated unbilled revenue are usually immaterial. The Company has businesses where it sells and purchases power to and from Independent System Operators("ISOs") and Regional Transmission Organizations ("RTOs"). In those instances, the Company accounts for these transactions on a net hourly basis because thetransactions are settled on a net hourly basis. Revenue from generation businesses is classified as non-regulated and is recognized based upon output delivered andcapacity provided, at rates as specified under contract terms or prevailing market rates. Certain of the Company PPAs meet the definition of an operating lease orcontain similar arrangements. Typically, minimum lease payments from such PPAs are recognized as revenue on a straight-line basis over the lease term whereascontingent rentals are recognized when earned. Revenue is recorded net of any taxes assessed on and collected from customers, which are remitted to thegovernmental authorities.
SHARE-BASED COMPENSATION — The Company grants share-based compensation in the form of stock options, restricted stock units, andperformance stock units. The expense is based on the grant-date fair value of the equity or liability instrument issued and is recognized on a straight-line basis overthe requisite service period, net of estimated forfeitures. The Company uses a Black-Scholes option pricing model to estimate the fair value of stock optionsgranted to its employees.
GENERAL AND ADMINISTRATIVE EXPENSES — General and administrative expenses include corporate and other expenses related to corporatestaff functions and initiatives, primarily executive management, finance, legal, human resources and information systems, which are not directly allocable to ourbusiness segments. Additionally, all costs associated with corporate business development efforts are classified as general and administrative expenses.
DERIVATIVES AND HEDGING ACTIVITIES — Under the accounting standards for derivatives and hedging, the Company recognizes all contracts thatmeet the definition of a derivative, except those designated as normal purchase or normal sale at inception, as either assets or liabilities in the Consolidated BalanceSheets and measures those instruments at fair value. See the Company's fair value policy and Note 4— Fair Value for additional discussion regarding thedetermination of the fair value. The PPAs and fuel supply agreements entered into by the Company are evaluated to determine if they meet the definition of aderivative or contain embedded derivatives, either of which require separate valuation and accounting. To be a derivative under the accounting standards forderivatives and hedging, an agreement would need to have a notional and an underlying, require little or no initial net investment and could be net settled.Generally, these agreements do not meet the definition of a derivative, often due to the inability to be net settled. On a quarterly basis, we evaluate the markets forthe commodities to be delivered under these agreements to determine if facts and circumstances have changed such that the agreements could then be net settledand meet the definition of a derivative.
Derivatives primarily consist of interest rate swaps, cross-currency swaps, foreign currency instruments, and commodity derivatives. The Company entersinto various derivative transactions in order to hedge its exposure to certain market risks, primarily interest rate, foreign currency and commodity price risks.Regarding interest rate risk, the Company and our subsidiaries generally utilize variable rate debt financing for construction projects and operations so interest rateswap, lock, cap, and floor agreements are entered into to manage interest rate risk by effectively fixing or limiting the interest rate exposure on the underlyingfinancing and are typically designated as cash flow hedges. Regarding foreign currency risk, we are exposed to it as a result of our investments in foreignsubsidiaries and affiliates that may be impacted by significant fluctuations in
132

THE AES CORPORATIONNOTES TO CONSOLIDATED FINANCIAL STATEMENTS—(Continued)
DECEMBER 31, 2015, 2014, AND 2013
foreign currency exchange rates so foreign currency options and forwards are utilized, where deemed appropriate, to manage the risk related to these fluctuations.Cross-currency swaps are utilized in certain instances to manage the risk related to certain foreign currencies and the associated impact on interest and loanprincipal payments. In addition, certain of our subsidiaries have entered into contracts which contain embedded derivatives as a portion of the contracts primarilythat are denominated in a currency other than the functional or local currency of that subsidiary or the currency of the item. Regarding commodity price risk, weare exposed to the impact of market fluctuations in the price of electricity, fuel and environmental credits. Although we primarily consist of businesses with long-term contracts or retail sales concessions (which provide our distribution businesses with a franchise to serve a specific geographic region), a portion of our currentand expected future revenues are derived from businesses without significant long-term purchase or sales contracts. We use an overall hedging strategy, not justderivatives, to hedge our financial performance against the effects of fluctuations in commodity prices.
The accounting standards for derivatives and hedging enable companies to designate qualifying derivatives as hedging instruments based on the exposurebeing hedged. The Company only has cash flow hedges at this time. Changes in the fair value of a derivative that is highly effective, designated and qualifies as acash flow hedge are deferred in AOCL and are recognized into earnings as the hedged transactions affect earnings. Any ineffectiveness is recognized in earningsimmediately. For all designated and qualifying hedges, the Company maintains formal documentation of the hedge and effectiveness testing in accordance with theaccounting standards for derivatives and hedging. If AES determines that the derivative is no longer highly effective as a hedge, hedge accounting will bediscontinued prospectively. For cash flow hedges of forecasted transactions, AES estimates the future cash flows of the forecasted transactions and evaluates theprobability of the occurrence and timing of such transactions. Changes in conditions or the occurrence of unforeseen events could require discontinuance of hedgeaccounting or could affect the timing of the reclassification of gains or losses on cash flow hedges from AOCL into earnings.
While derivative transactions are not entered into for trading purposes, some contracts are not eligible for hedge accounting. Changes in the fair value ofderivatives not designated and qualifying as cash flow hedges are immediately recognized in earnings. Regardless of when gains or losses on derivatives (includingall those where the fair value measurement is classified as Level 3) are recognized in earnings, they are generally classified as follows: interest expense for interestrate and cross-currency derivatives, foreign currency transaction gains or losses for foreign currency derivatives, and non-regulated revenue or non-regulated costof sales for commodity and other derivatives. However, gains and losses on interest rate and cross-currency derivatives are classified as foreign currencytransaction gains and losses if they offset the remeasurement of the foreign currency-denominated debt being hedged by the cross-currency swaps and the amountreclassified from AOCL to cost of sales to offset depreciation where the variable-rate interest capitalized as part of the asset was hedged during its construction.Cash flows arising from derivatives are included in the Consolidated Statements of Cash Flows as an operating activity given the nature of the underlying riskbeing economically hedged and the lack of significant financing elements, except that cash flows on designated and qualifying hedges of variable-rate interestduring construction are classified as an investing activity.
The Company has elected not to offset net derivative positions in the financial statements. Accordingly, the Company does not offset such derivativepositions against the fair value of amounts (or amounts that approximate fair value) recognized for the right to reclaim cash collateral (a receivable) or theobligation to return cash collateral (a payable) under master netting arrangements.
NEW ACCOUNTING PRONOUNCEMENTS ADOPTED
ASU No. 2015-17, Income Taxes (Topic 740): Balance Sheet Classification of Deferred Taxes
Effective December 31, 2015, the Company prospectively adopted ASU No. 2015-17, which requires that all deferred tax assets and liabilities, along withany related valuation allowance, be classified as noncurrent on the balance sheet. As a result, each jurisdiction will now only have one net noncurrent deferred taxasset or liability. The guidance does not change the existing requirement that only permits offsetting within a jurisdiction; that is, companies will remain prohibitedfrom offsetting deferred tax liabilities from one jurisdiction against deferred tax assets of another jurisdiction. Additionally, the current requirement that deferredtax liabilities and assets of a tax-paying component of an entity be offset and presented as a single amount is not affected by the update. As the Company elected toapply this ASU prospectively, prior periods were not adjusted.
ASU No. 2015-13, Derivatives and Hedging (Topic 815): Application of the Normal Purchases and Normal Sales Scope Exception to Certain ElectricityContracts within Nodal Energy Markets
In August 2015, the FASB issued ASU No. 2015-13, which resolves the diversity in practice resulting from determining whether certain contracts qualify forthe normal purchases and normal sales scope exception under ASC Topic 815— Derivatives and Hedging . This standard clarifies that entities would not beprecluded from applying the normal purchases and normal sales exception to certain forward contracts that necessitate the transmission of electricity through, ordelivery to a
133

THE AES CORPORATIONNOTES TO CONSOLIDATED FINANCIAL STATEMENTS—(Continued)
DECEMBER 31, 2015, 2014, AND 2013
location within, a nodal energy market. The standard is effective upon issuance and should be applied prospectively. As the Company had designated qualifyingcontracts as normal purchase or normal sales, there was no impact on the Company's consolidated financial statements upon adoption of this standard.
ASU No. 2014-05, Service Concession Arrangements (Topic 853)
Effective January 1, 2015, the Company adopted ASU No. 2014-05, which states that certain service concession arrangements with public-sector entitygrantors are not in scope of ASC 840— Leases, and that entities should not recognize the related infrastructure as property, plant and equipment, but should applyother GAAP. The Company has a small number of entities that fall within the scope of this guidance, with the Company's Mong Duong generation facility inVietnam being the most significant.
Mong Duong is based on a build, operate and transfer agreement with the Vietnamese government. Management concluded there were two deliverablesincluded within the arrangement, as well as a financing element. Due to the contingent nature of the revenue stream, no amounts of revenue could be recognizedduring the build phase of the contract. All amounts billed during the operate phase are recognized as revenue when billed, with amounts allocated between thefinancing element and build and operate deliverables. The financing element is recognized as interest income using the effective interest method as payments forconstruction of the plant are received over the life of the contract. Costs are expensed as incurred. As the related infrastructure is no longer considered property,plant and equipment, there are no longer any capitalizable expenses beyond those related to the initial build, and accordingly these will be expensed as incurred. Allcash flows for these arrangements, excluding those related to the debt incurred by AES, will be reflected in cash flows from operating activities on the Company'sConsolidated Statements of Cash Flows prospectively.
The guidance was applied on a modified retrospective basis to service concession arrangements in existence at January 1, 2015. Upon adoption of thisstandard, the impact to the Company's Consolidated Balance Sheet as of January 1, 2015 resulted in a reclassification of $1.5 billion from property, plant andequipment to service concession assets, as well as a cumulative adjustment to retained earnings and cumulative translation adjustment of $(18) million , net of tax,and $13 million , respectively.
ACCOUNTING PRONOUNCEMENTS ISSUED BUT NOT YET EFFECTIVE — The following accounting standards have been issued, but are not yeteffective for, and have not been adopted in these financial statements by AES.
ASU No. 2016-01, Financial Instruments — Overall (Topic 825-10): Recognition and Measurement of Financial Assets and Financial Liabilities
In January 2016, the FASB issued ASU 2016-01, which was designed to improve the recognition and measurement of financial instruments through targetedchanges to existing GAAP. The guidance requires equity investments (except those that are accounted for under the equity method of accounting or result inconsolidation of the investee) to be measured at fair value with changes in fair value recognized in net income; that entities use the exit price notion whenmeasuring financial instrument fair values; that an entity separate presentation of financial assets and liabilities by measurement category and form of financialasset on the Balance Sheets or Notes to the financial statements; that an entity present separately in other comprehensive income the portion of the total change inthe fair value of a liability resulting from a change in the instrument-specific credit risk (or "own credit") when the entity has elected to measure the liability at fairvalue in accordance with the fair value option for financial instruments. Also, the standard eliminates the requirement for public entities to disclose the methodsand significant assumptions used to estimate the fair value required to be disclosed for financial instruments measured at amortized cost on the Balance Sheets. Thestandard is effective beginning with interim periods starting after December 31, 2017 and cannot be applied early. The Company is currently evaluating theapplicability and materiality of the standard, but does not anticipate a material impact on the Company's consolidated financial statements.
ASU No. 2015-16, Business Combinations (Topic 805): Simplifying the Accounting for Measurement-Period Adjustments
In September 2015, the FASB issued ASU 2015-16, which simplifies the measurement-period adjustments in business combinations. It eliminates therequirement that an acquirer in a business combination account for measurement-period adjustments retrospectively. An acquirer will recognize a measurement-period adjustment during the period in which it determines the amount of the adjustment. The standard is effective for public entities for annual reporting periodsbeginning after December 15, 2015, and interim periods therein. Early adoption is permitted for financial statements that have not been issued. The new guidanceshould be applied prospectively to adjustments to provisional amounts that occur after the effective date of this standard. The Company will adopt this standard onJanuary 1, 2016, which is not expected to have a material impact on the Company's consolidated financial statements.
134

THE AES CORPORATIONNOTES TO CONSOLIDATED FINANCIAL STATEMENTS—(Continued)
DECEMBER 31, 2015, 2014, AND 2013
ASU No. 2015-15, Interest — Imputation of Interest (Subtopic 835-30) : Presentation and Subsequent Measurement of Debt Issuance Costs Associated withLine-of-Credit Arrangements
In August 2015, the FASB issued ASU No. 2015-15, which clarifies that the SEC Staff would not object to an entity presenting debt issuance costs related toline-of-credit arrangements as an asset that is subsequently amortized ratably over the term of the line-of-credit arrangement, regardless of whether there are anyoutstanding borrowings on the line-of-credit arrangement. This standard should be adopted concurrent with adoption of ASU 2015-03 (see below). As ofDecember 31, 2015 , the Company had deferred financing costs related to lines-of-credit of approximately $2 million recorded within other current assets and $24million recorded within other noncurrent assets that would not be reclassified upon adoption of this standard.
ASU No. 2015-11, Inventory (Topic 330): Simplifying the Measurement of Inventory
In July 2015, the FASB issued ASU No. 2015-11, which simplifies the subsequent measurement of inventory. It replaces the current lower of cost or markettest with a lower of cost or net realizable value test. The standard is effective for public entities for annual reporting periods beginning after December 15, 2016,and interim periods therein. Early adoption is permitted. The new guidance must be applied prospectively. The Company is currently evaluating the impact ofadopting the standard on its consolidated financial statements.
ASU No. 2015-05, Intangibles — Goodwill and Other — Internal-Use Software (Subtopic 350-40): Customer's Accounting for Fees Paid in a CloudComputing Arrangement
In April 2015, the FASB issued ASU No. 2015-05, which clarifies how customers in cloud computing arrangements should determine whether thearrangement includes a software license and eliminates the existing requirement for customers to account for software licenses they acquired by analogizing to theaccounting guidance on leases. The standard is effective for annual reporting periods beginning after December 15, 2015 and interim periods therein. Earlyadoption is permitted. The standard permits the use of a prospective or retrospective approach. The Company expects to utilize the prospective approach uponadoption of this standard, which is not expected to have a material impact on its consolidated financial statements.
ASU No. 2015-03, Interest — Imputation of Interest (Subtopic 835-30)
In April 2015, the FASB issued ASU No. 2015-03, which simplifies the presentation of debt issuance costs by requiring that debt issuance costs related to arecognized debt liability be presented in the balance sheet as a direct deduction from the carrying amount of that debt liability, consistent with debt discounts. Therecognition and measurement guidance for debt issuance costs are not affected by the amendments in this update. The standard is effective for annual reportingperiods beginning after December 15, 2015 and interim periods therein, and requires the use of the full retrospective approach. Early adoption is permitted forfinancial statements that have not been previously issued. As of December 31, 2015 , the Company had deferred financing costs of approximately $24 millionclassified within other current assets and $356 million classified within other noncurrent assets that would be reclassified to reduce the related debt liabilities uponadoption of this standard.
ASU No. 2015-02, Consolidation — Amendments to the Consolidation Analysis (Topic 810)
In February 2015, the FASB issued ASU 2015-02, which makes targeted amendments to the current consolidation guidance and ends the deferral granted toinvestment companies from applying the VIE guidance. The standard amends the evaluation of whether (1) fees paid to a decision-maker or service providersrepresent a variable interest, (2) a limited partnership or similar entity has the characteristics of a VIE and (3) a reporting entity is the primary beneficiary of a VIE.The standard is effective for annual periods beginning after December 15, 2015 and interim periods therein. Early adoption is permitted. Based on the Company'spreliminary analysis, no change in consolidation is expected although additional disclosures may be required.
ASU No. 2014-09, Revenue from Contracts with Customers (Topic 606)
In May 2014, the FASB issued ASU No. 2014-09, which clarifies principles for recognizing revenue and will result in a common revenue standard for U.S.GAAP and International Financial Reporting Standards. The objective of the new standard is to provide a single and comprehensive revenue recognition model forall contracts with customers to improve comparability. The revenue standard contains principles that an entity will apply to determine the measurement of revenueand timing of when it is recognized. The standard requires an entity to recognize revenue to depict the transfer of goods or services to customers at an amount thatthe entity expects to be entitled to in exchange for those goods or services. In August 2015, the FASB issued ASU No. 2015-14, Revenue from Contracts withCustomers (Topic 606): Deferral of the Effective Date , which deferred the effective date of ASU 2014-09 by one year, resulting in the new revenue standard beingeffective for annual reporting periods beginning after December 15, 2017 and interim periods therein. Early adoption is now permitted only as of the originaleffective date for public entities (that is, no earlier than 2017 for calendar year-end entities). The standard permits the use of
135

THE AES CORPORATIONNOTES TO CONSOLIDATED FINANCIAL STATEMENTS—(Continued)
DECEMBER 31, 2015, 2014, AND 2013
either a full retrospective or modified retrospective approach. The Company has not yet selected a transition method and is currently evaluating the impact ofadopting the standard on its consolidated financial statements.
2 . INVENTORY
Inventory is valued primarily using the average-cost method. The following table summarizes the Company's inventory balances (in millions) as of the datesindicated:
December 31, 2015 2014Fuel and other raw materials $ 343 $ 357Spare parts and supplies 332 345Total $ 675 $ 702
3 . PROPERTY, PLANT AND EQUIPMENT
The following table summarizes the components of the electric generation and distribution assets and other property, plant and equipment (in millions) withtheir estimated useful lives (in years). The amounts are stated net of all prior asset impairment losses recognized.
December 31,
Estimated Useful Life 2015 2014Electric generation and distribution facilities 5 - 68 $ 25,427 $ 27,488Other buildings 3 - 53 1,868 1,694Furniture, fixtures and equipment 2 - 31 305 307Other 1 - 50 891 970Total electric generation and distribution assets and other 28,491 30,459Accumulated depreciation (9,449) (9,962)Net electric generation and distribution assets and other (1) $ 19,042 $ 20,497
(1) Net electric generation and distribution assets and other include unamortized internal-use software costs of $83 million and $115 million as of December 31, 2015 and 2014 , respectively.
The following table summarizes depreciation expense (including the amortization of assets recorded under capital leases), amortization of internal-usesoftware and interest capitalized during development and construction on qualifying assets for the periods indicated (in millions):
Year Ended December 31, 2015 2014 2013Depreciation expense (including amortization of assets recorded under capital leases) $ 1,104 $ 1,204 $ 1,193Amortization of internal-use software 29 33 36Interest capitalized during development and construction 90 120 84
Property, plant and equipment, net of accumulated depreciation, of $12 billion and $15 billion was mortgaged, pledged or subject to liens as of December 31,2015 and 2014 , respectively.
The following table summarizes regulated and non-regulated generation and distribution property, plant and equipment and accumulated depreciation inmillions as of the periods indicated:
December 31, 2015 2014Regulated generation, distribution assets and other, gross $ 11,818 $ 13,103Regulated accumulated depreciation (4,351) (4,841)Regulated generation, distribution assets and other, net 7,467 8,262Non-regulated generation, distribution assets and other, gross 16,673 17,356Non-regulated accumulated depreciation (5,098) (5,121)Non-regulated generation, distribution assets and other, net 11,575 12,235Net electric generation, distribution assets and other $ 19,042 $ 20,497
The next table presents amounts recognized related to asset retirement obligations in millions for the periods indicated:
2015 2014Balance at January 1 $ 209 $ 142Additional liabilities incurred 43 51Liabilities settled (6) (11)Accretion expense 13 12Change in estimated cash flows (7) 15Other (5) —Balance at December 31 $ 247 $ 209

136

THE AES CORPORATIONNOTES TO CONSOLIDATED FINANCIAL STATEMENTS—(Continued)
DECEMBER 31, 2015, 2014, AND 2013
The Company's asset retirement obligations covered by the relevant guidance primarily include active ash landfills, water treatment basins and the removalor dismantlement of certain plants and equipment. There were $2 million of legally restricted assets for the year ended December 31, 2015 and none for the yearended December 31, 2014 for purposes of settling asset retirement obligations.
Ownership of Certain Coal-Fired Facilities
DP&L has undivided ownership interests in five coal-fired generation facilities jointly owned with other utilities. DP&L's share of the operating costs of suchfacilities is included in Cost of Sales in the Consolidated Statements of Operations and its share of investment in the facilities is included in Property, Plant andEquipment in the Consolidated Balance Sheets. DP&L's undivided ownership interest in such facilities at December 31, 2015 is as follows:
DP&L Share DP&L Investment
Ownership Gross Plant In Service Accumulated Depreciation Construction Work In Process
Production units: ($ in millions)
Conesville Unit 4 17% $ 26 $ 4 $ 1Killen Station 67% 342 29 2Miami Fort Units 7 and 8 36% 219 32 6Stuart Station 35% 236 19 18Zimmer Station 28% 188 44 12
Transmission various 43 8 —Total $ 1,054 $ 136 $ 39
4 . FAIR VALUE
The fair value of current financial assets and liabilities, debt service reserves and other deposits approximate their reported carrying amounts. The estimatedfair values of the Company's assets and liabilities have been determined using available market information. By virtue of these amounts being estimates and basedon hypothetical transactions to sell assets or transfer liabilities, the use of different market assumptions and/or estimation methodologies may have a material effecton the estimated fair value amounts.
Valuation Techniques — The fair value measurement accounting guidance describes three main approaches to measuring the fair value of assets andliabilities: (1) market approach, (2) income approach and (3) cost approach. The market approach uses prices and other relevant information generated from markettransactions involving identical or comparable assets or liabilities. The income approach uses valuation techniques to convert future amounts to a single presentvalue amount. The measurement is based on current market expectations of the return on those future amounts. The cost approach is based on the amount thatwould currently be required to replace an asset. The Company measures its investments and derivatives at fair value on a recurring basis. Additionally, inconnection with annual or event-driven impairment evaluations, certain nonfinancial assets and liabilities are measured at fair value on a nonrecurring basis. Theseinclude long-lived tangible assets (i.e., property, plant and equipment), goodwill and intangible assets (e.g., sales concessions, land use rights and water rights,etc.). In general, the Company determines the fair value of investments and derivatives using the market approach and the income approach, respectively. In thenonrecurring measurements of nonfinancial assets and liabilities, all three approaches are considered; however, the value estimated under the income approach isoften the most representative of fair value.
Investments — The Company's investments measured at fair value generally consist of marketable debt and equity securities. Equity securities are measured atfair value primarily using quoted market prices, which are considered Level 1 measurements in the fair value hierarchy. Debt securities primarily consist ofunsecured debentures, certificates of deposit and government debt securities held by our Brazilian subsidiaries. Returns and pricing on these instruments aregenerally indexed to the CDI (Brazilian equivalent to London Inter Bank Offered Rate, or LIBOR, a benchmark interest rate widely used by banks in the interbanklending market) or Selic (overnight borrowing rate) rates in Brazil. For the equity securities which are not considered Level 1 measurements and for the debtsecurities, fair value is determined from comparisons to market data obtained for similar assets and are considered Level 2 measurements in the fair valuehierarchy.
Derivatives — Any Level 1 derivative instruments are exchange-traded commodity futures for which the pricing is observable in active markets, and as such,these are not expected to transfer to other levels. There have been no transfers between Level 1 and Level 2.
For all derivatives, with the exception of any classified as Level 1, the income approach is used, which consists of forecasting future cash flows based oncontractual notional amounts and applicable and available market data as of the valuation date. The most common market data inputs used in the income approachinclude volatilities, spot and forward benchmark interest rates (such as LIBOR and Euro Inter Bank Offered Rate ("EURIBOR")), foreign exchange rates andcommodity prices. Forward rates with the same tenor as the derivative instrument being valued are generally obtained from published sources, with these forwardrates being assessed quarterly at a portfolio-level for reasonableness versus comparable published information provided from another source. When significantinputs are not observable, the Company uses relevant techniques to determine the inputs, such as regression analysis or prices for similarly traded instrumentsavailable in the market.
For derivatives for which there is a standard industry valuation model, the Company uses a third-party derivative accounting and valuation service providerthat uses a standard model and observable inputs to estimate the fair value. For these derivatives, the Company performs analytical procedures and makescomparisons to other third-party information in order to assess the reasonableness of the fair value. For derivatives for which there is not a standard industryvaluation model (such as PPAs and fuel supply agreements that are derivatives or include embedded derivatives), the Company has created internal valuationmodels to estimate the fair value, using observable data to the extent available. At each quarter-end, the models for the commodity and foreign currency-basedderivatives are generally prepared and reviewed by employees who globally manage the respective commodity and foreign currency risks and are analyticallyreviewed independent of those employees.

Those cash flows are then discounted using the relevant spot benchmark interest rate (such as LIBOR or EURIBOR). The Company then makes a creditvaluation adjustment ("CVA") by further discounting the cash flows for nonperformance or credit risk based on the observable or estimated debt spread of theCompany's subsidiary or its counterparty and the tenor of the respective derivative instrument. The CVA for potential future scenarios in which the derivative is inan asset is based on the counterparty's credit ratings, credit default swap spreads, and debt spreads, as available. The CVA for potential future scenarios in whichthe derivative is a liability is based on the Parent Company's or the subsidiary's current debt spread. In the absence of readily obtainable credit information, theParent Company's or the subsidiary's estimated credit rating (based on applying a standard industry model to historical financial information and then consideringother relevant information) and spreads of
137

THE AES CORPORATIONNOTES TO CONSOLIDATED FINANCIAL STATEMENTS—(Continued)
DECEMBER 31, 2015, 2014, AND 2013
comparably rated entities or the respective country's debt spreads are used as a proxy. All derivative instruments are analyzed individually and are subject to uniquerisk exposures.
The Company's methodology to fair value its derivatives is to start with any observable inputs; however, in certain instances the published forward rates orprices may not extend through the remaining term of the contract and management must make assumptions to extrapolate the curve, which necessitates the use ofunobservable inputs, such as proxy commodity prices or historical settlements to forecast forward prices. Specifically, where there is limited forward curve datawith respect to foreign exchange contracts, beyond the traded points the Company utilizes the purchasing power parity approach to construct the remaining portionof the forward curve using relative inflation rates. In addition, in certain instances, there may not be market or market-corroborated data readily available, requiringthe use of unobservable inputs. Similarly, in certain instances, the spread that reflects the credit or nonperformance risk is unobservable requiring us to utilizeproxy yield curves of similar credit quality. The fair value hierarchy of an asset or a liability is based on the level of significance of the input assumptions. An inputassumption is considered significant if it affects the fair value by at least 10%. Assets and liabilities are classified as Level 3 when the use of unobservable inputs issignificant. When the use of unobservable inputs is insignificant, assets and liabilities are classified as Level 2. Transfers between Level 3 and Level 2 aredetermined as of the end of the reporting period and result from changes in significance of unobservable inputs used to calculate the CVA.
Debt — Recourse and non-recourse debt are carried at amortized cost. The fair value of recourse debt is estimated based on quoted market prices. The fair valueof non-recourse debt is estimated differently based upon the type of loan. In general, the carrying amount of variable rate debt is a close approximation of its fairvalue. For fixed rate loans, the fair value is estimated using quoted market prices or discounted cash flow ("DCF") analyses. In the DCF analysis, the discount rateis based on the credit rating of the individual debt instruments, if available, or the credit rating of the subsidiary. If the subsidiary's credit rating is not available, asynthetic credit rating is determined using certain key metrics, including cash flow ratios and interest coverage, as well as other industry-specific factors. Forsubsidiaries located outside the U.S., in the event that the country rating is lower than the credit rating previously determined, the country rating is used forpurposes of the DCF analysis. The fair value of recourse and non-recourse debt excludes accrued interest at the valuation date. The fair value was determined usingavailable market information as of December 31, 2015 . The Company is not aware of any factors that would significantly affect the fair value amounts subsequentto December 31, 2015 .
Nonrecurring Measurements — For nonrecurring measurements derived using the income approach, fair value is determined using valuation models based onthe principles of DCF. The income approach is most often used in the impairment evaluation of long-lived tangible assets, equity method investments, goodwill,and intangible assets. The Company uses its internally developed DCF valuation models as the primary means to determine nonrecurring fair value measurementsthough other valuation approaches prescribed under the fair value measurement accounting guidance are also considered. Depending on the complexity of avaluation, an independent valuation firm may be engaged to assist management in the valuation process. A few examples of input assumptions to such valuationsinclude macroeconomic factors such as growth rates, industry demand, inflation, exchange rates and power and commodity prices. Whenever possible, theCompany attempts to obtain market observable data to develop input assumptions. Where the use of market observable data is limited or not available for certaininput assumptions, the Company develops its own estimates using a variety of techniques such as regression analysis and extrapolations.
For nonrecurring measurements derived using the market approach, recent market transactions involving the sale of identical or similar assets are considered.The use of this approach is limited because it is often difficult to identify sale transactions of identical or similar assets. This approach is used in impairmentevaluations of certain intangible assets. Otherwise, it is used to corroborate the fair value determined under the income approach.
For nonrecurring measurements derived using the cost approach, fair value is typically based upon a replacement cost approach. Under this approach, thedepreciated replacement cost of assets is derived by first estimating the current replacement cost of assets and then applying the remaining useful life percentagesto such costs. Further adjustments for economic and functional obsolescence are made to the depreciated replacement cost. This approach involves a considerableamount of judgment, which is why its use is limited to the measurement of long-lived tangible assets. Like the market approach, this approach is also used tocorroborate the fair value determined under the income approach.
Fair Value Considerations — In determining fair value, the Company considers the source of observable market data inputs, liquidity of the instrument, thecredit risk of the counterparty and the risk of the Company's or its counterparty's nonperformance. The conditions and criteria used to assess these factors are:
138

THE AES CORPORATIONNOTES TO CONSOLIDATED FINANCIAL STATEMENTS—(Continued)
DECEMBER 31, 2015, 2014, AND 2013
Sources of market assumptions — The Company derives most of its market assumptions from market efficient data sources (e.g., Bloomberg and Reuters). Todetermine fair value, where market data is not readily available, management uses comparable market sources and empirical evidence to develop its own estimatesof market assumptions.
Market liquidity — The Company evaluates market liquidity based on whether the financial or physical instrument, or the underlying asset, is traded in anactive or inactive market. An active market exists if the prices are fully transparent to market participants, can be measured by market bid and ask quotes, themarket has a relatively large proportion of trading volume as compared to the Company's current trading volume and the market has a significant number of marketparticipants that will allow the market to rapidly absorb the quantity of assets traded without significantly affecting the market price. Another factor the Companyconsiders when determining whether a market is active or inactive is the presence of government or regulatory controls over pricing that could make it difficult toestablish a market-based price when entering into a transaction.
Nonperformance risk — Nonperformance risk refers to the risk that an obligation will not be fulfilled and affects the value at which a liability is transferred oran asset is sold. Nonperformance risk includes, but may not be limited to, the Company or its counterparty's credit and settlement risk. Nonperformance riskadjustments are dependent on credit spreads, letters of credit, collateral, other arrangements available and the nature of master netting arrangements. The Companyand its subsidiaries are parties to various interest rate swaps and options; foreign currency options and forwards; and derivatives and embedded derivatives, whichsubject the Company to nonperformance risk. The financial and physical instruments held at the subsidiary level are generally non-recourse to the Parent Company.
Nonperformance risk on the investments held by the Company is incorporated in the fair value derived from quoted market data to mark the investments tofair value.
Recurring Measurements
The following table presents, by level within the fair value hierarchy, as described in Note 1— General and Summary of Significant Accounting Policies, theCompany's financial assets and liabilities (in millions) that were measured at fair value on a recurring basis as of the periods indicated:
December 31, 2015 December 31, 2014
Level 1 Level 2 Level 3 Total Level 1 Level 2 Level 3 TotalAssets AVAILABLE FOR SALE:
Debt securities: (1) Unsecured debentures $ — $ 327 $ — $ 327 $ — $ 501 $ — $ 501Certificates of deposit — 135 — 135 — 151 — 151Government debt securities — 28 — 28 — 57 — 57Subtotal — 490 — 490 — 709 — 709
Equity securities: Mutual funds — 15 — 15 — 25 — 25Subtotal — 15 — 15 — 25 — 25
Total available for sale — 505 — 505 — 734 — 734TRADING:
Equity securities: Mutual funds 15 — — 15 15 — — 15
Total trading 15 — — 15 15 — — 15DERIVATIVES:
Foreign currency derivatives — 35 292 327 — 18 218 236Commodity derivatives — 41 7 48 — 37 7 44
Total derivatives — 76 299 375 — 55 225 280TOTAL ASSETS $ 15 $ 581 $ 299 $ 895 $ 15 $ 789 $ 225 $ 1,029
Liabilities DERIVATIVES:
Interest rate derivatives $ — $ 54 $ 304 $ 358 $ — $ 206 $ 210 $ 416Cross currency derivatives — 43 — 43 — 29 — 29Foreign currency derivatives — 41 15 56 — 43 9 52Commodity derivatives — 29 4 33 — 16 1 17
Total derivatives — 167 323 490 — 294 220 514TOTAL LIABILITIES $ — $ 167 $ 323 $ 490 $ — $ 294 $ 220 $ 514
_____________________________(1) Amortized cost approximated fair value at December 31, 2015 and 2014 .

The following tables present a reconciliation of net derivative assets and liabilities measured at fair value on a recurring basis using significant unobservableinputs (Level 3) for the years ended December 31, 2015 and 2014 (presented net by type of derivative in millions). Transfers between Level 3 and Level 2 aredetermined as of the end of the reporting period and principally result from changes in the significance of unobservable inputs used to calculate the credit valuationadjustment.
139

THE AES CORPORATIONNOTES TO CONSOLIDATED FINANCIAL STATEMENTS—(Continued)
DECEMBER 31, 2015, 2014, AND 2013
Year Ended December 31, 2015 Interest Rate Foreign Currency Commodity Total
Balance at January 1 $ (210) $ 209 $ 6 $ 5Total gains (losses) (realized and unrealized):
Included in earnings (1) 198 (1) 196Included in other comprehensive income - derivative activity (31) — — (31)Included in other comprehensive income - foreign currency translation activity 9 (103) — (94)Included in regulatory (assets) liabilities — — (18) (18)
Settlements 24 (7) 16 33Transfers of assets (liabilities) into Level 3 (95) (1) — (96)Transfers of (assets) liabilities out of Level 3 — (19) — (19)
Balance at December 31 $ (304) $ 277 $ 3 $ (24)Total gains (losses) for the period included in earnings attributable to the change in unrealized gains (losses)relating to assets and liabilities held at the end of the period $ — $ 187 $ (1) $ 186
Year Ended December 31, 2014 Interest Rate Foreign Currency Commodity Total
Balance at January 1 $ (101) $ 93 $ 4 $ (4)Total gains (losses) (realized and unrealized):
Included in earnings 2 134 1 137Included in other comprehensive income - derivative activity (154) (2) — (156)Included in other comprehensive income - foreign currency translation activity 13 (25) — (12)Included in regulatory (assets) liabilities — — 16 16
Settlements 30 (4) (15) 11Transfers of assets (liabilities) into Level 3 — 10 — 10Transfers of (assets) liabilities out of Level 3 — 3 — 3
Balance at December 31 $ (210) $ 209 $ 6 $ 5Total gains (losses) for the period included in earnings attributable to the change in unrealized gains (losses)relating to assets and liabilities held at the end of the period $ 2 $ 130 $ (1) $ 131
The following table summarizes the significant unobservable inputs used for the Level 3 derivative assets (liabilities) as of December 31, 2015 :
Type of Derivative Fair Value Unobservable Input Amount or Range(Weighted Average)
(in millions) Interest rate $ (304) Subsidiaries’ credit spreads 2.88%-8.88% (5.42%)Foreign currency:
Argentine Peso 291 Argentine Peso to U.S. Dollar currency exchange rate after 1 year 17.51 - 35.44 (26.05)Euro (14) Subsidiary's credit spread 8.88%
Commodity: Other 3
Total $ (24)
Changes in the above significant unobservable inputs that lead to a significant and unusual impact to current-period earnings are disclosed to the FinancialAudit Committee. For interest rate derivatives, and foreign currency derivatives, increases (decreases) in the estimates of the Company's own credit spreads woulddecrease (increase) the value of the derivatives in a liability position. For foreign currency derivatives, increases (decreases) in the estimate of the above exchangerate would increase (decrease) the value of the derivative.
Nonrecurring Measurements — When evaluating impairment of goodwill, long-lived assets, discontinued operations and held-for-sale businesses, andequity method investments, the Company measures fair value using the applicable fair value measurement guidance. Impairment expense is measured bycomparing the fair value at the evaluation date to their then-latest available carrying amount. The following table summarizes major categories of assets andliabilities measured at fair value on a nonrecurring basis during the period and their level within the fair value hierarchy (in millions):
Measurement
Date
Carrying Amount Fair Value
PretaxLossYear Ended December 31, 2015 Level 1 Level 2 Level 3
Assets
Long-lived assets held and used: (1)
Kilroot 08/28/2015 $ 191 $ — $ — $ 70 $ 121
Buffalo Gap III 09/30/2015 234 — — 118 116
U.K. Wind (Development Projects) 06/30/2015 38 — 1 — 37

Other Various 32 — 21 — 11
Equity method investments (3)
Solar Spain 02/09/2015 29 — — 29 —
Goodwill (5)
DP&L 10/01/2015 317 — — — 317
140
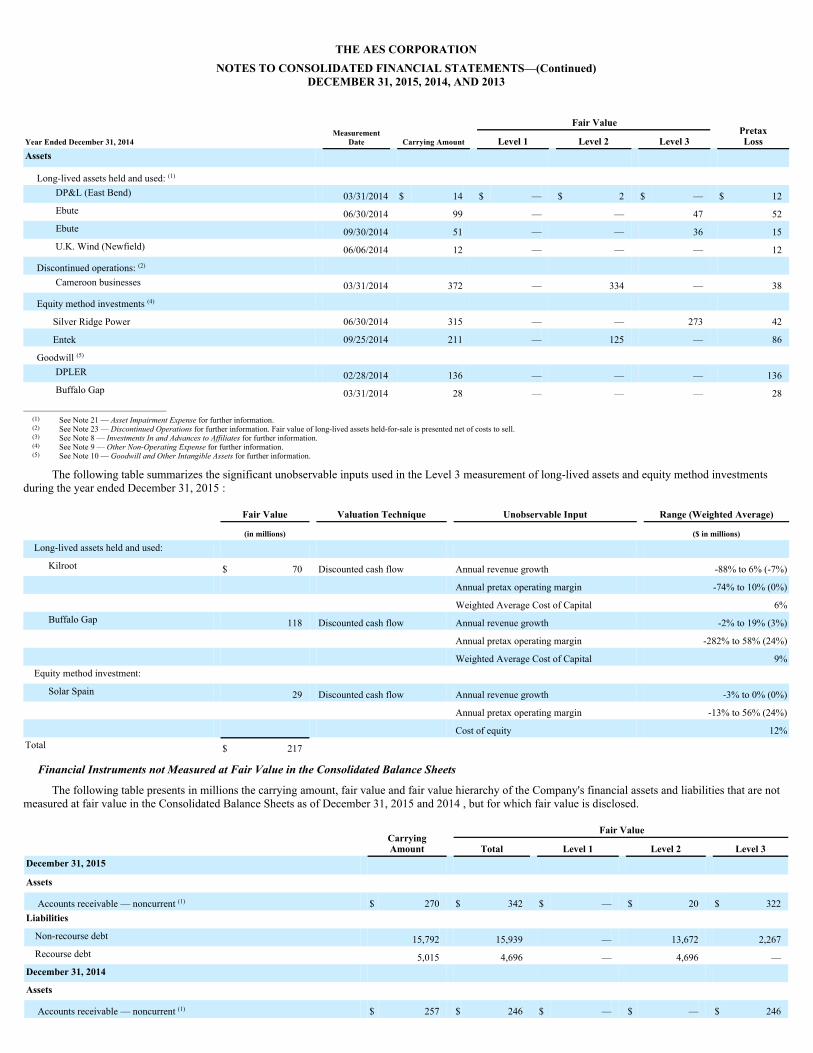
THE AES CORPORATIONNOTES TO CONSOLIDATED FINANCIAL STATEMENTS—(Continued)
DECEMBER 31, 2015, 2014, AND 2013
Measurement
Date
Carrying Amount Fair Value
PretaxLossYear Ended December 31, 2014 Level 1 Level 2 Level 3
Assets
Long-lived assets held and used: (1) DP&L (East Bend) 03/31/2014 $ 14 $ — $ 2 $ — $ 12Ebute 06/30/2014 99 — — 47 52Ebute 09/30/2014 51 — — 36 15U.K. Wind (Newfield) 06/06/2014 12 — — — 12
Discontinued operations: (2) Cameroon businesses 03/31/2014 372 — 334 — 38
Equity method investments (4)
Silver Ridge Power 06/30/2014 315 — — 273 42
Entek 09/25/2014 211 — 125 — 86
Goodwill (5) DPLER 02/28/2014 136 — — — 136Buffalo Gap 03/31/2014 28 — — — 28
_____________________________(1) See Note 21 — Asset Impairment Expense for further information.(2) See Note 23 — Discontinued Operations for further information. Fair value of long-lived assets held-for-sale is presented net of costs to sell.(3) See Note 8 — Investments In and Advances to Affiliates for further information.(4) See Note 9 — Other Non-Operating Expense for further information.(5) See Note 10 — Goodwill and Other Intangible Assets for further information.
The following table summarizes the significant unobservable inputs used in the Level 3 measurement of long-lived assets and equity method investmentsduring the year ended December 31, 2015 :
Fair Value Valuation Technique Unobservable Input Range (Weighted Average)
(in millions) ($ in millions)
Long-lived assets held and used: Kilroot $ 70 Discounted cash flow Annual revenue growth -88% to 6% (-7%)
Annual pretax operating margin -74% to 10% (0%) Weighted Average Cost of Capital 6%
Buffalo Gap 118 Discounted cash flow Annual revenue growth -2% to 19% (3%) Annual pretax operating margin -282% to 58% (24%) Weighted Average Cost of Capital 9%
Equity method investment: Solar Spain 29 Discounted cash flow Annual revenue growth -3% to 0% (0%)
Annual pretax operating margin -13% to 56% (24%) Cost of equity 12%Total $ 217
Financial Instruments not Measured at Fair Value in the Consolidated Balance Sheets
The following table presents in millions the carrying amount, fair value and fair value hierarchy of the Company's financial assets and liabilities that are notmeasured at fair value in the Consolidated Balance Sheets as of December 31, 2015 and 2014 , but for which fair value is disclosed.
CarryingAmount
Fair Value
Total Level 1 Level 2 Level 3December 31, 2015 Assets
Accounts receivable — noncurrent (1) $ 270 $ 342 $ — $ 20 $ 322Liabilities
Non-recourse debt 15,792 15,939 — 13,672 2,267Recourse debt 5,015 4,696 — 4,696 —
December 31, 2014 Assets
Accounts receivable — noncurrent (1) $ 257 $ 246 $ — $ — $ 246
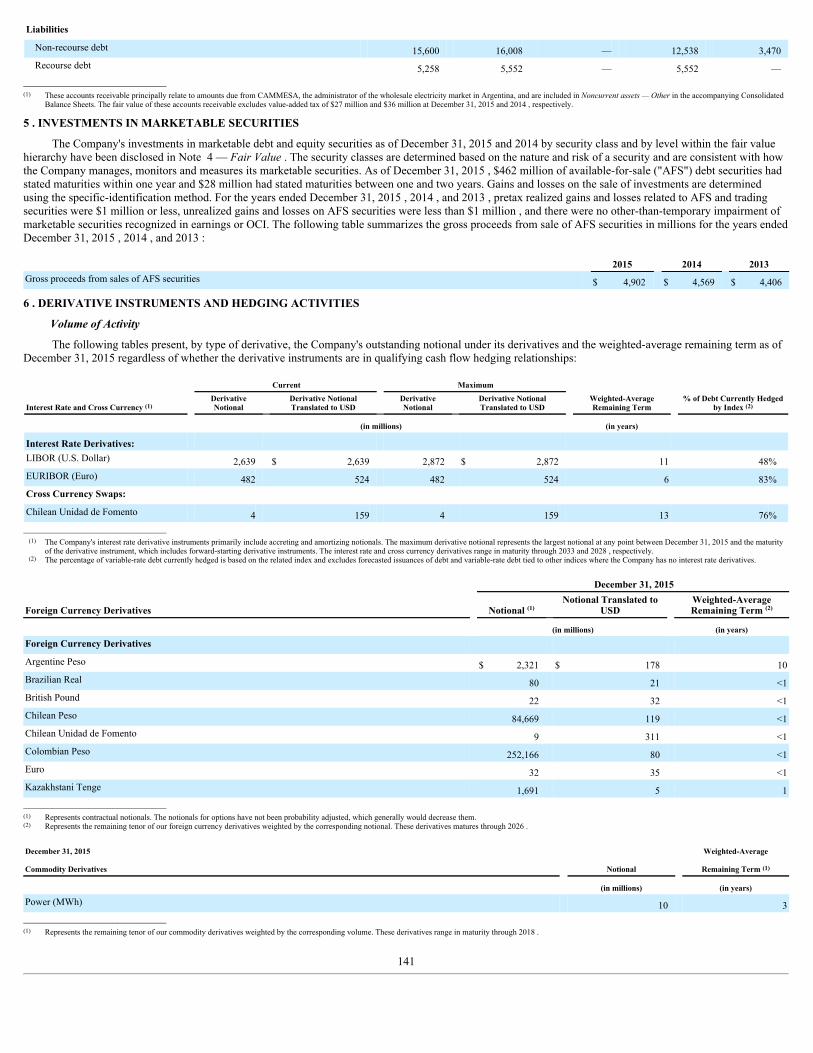
Liabilities Non-recourse debt 15,600 16,008 — 12,538 3,470Recourse debt 5,258 5,552 — 5,552 —
_____________________________(1) These accounts receivable principally relate to amounts due from CAMMESA, the administrator of the wholesale electricity market in Argentina, and are included in Noncurrent assets — Other in the accompanying Consolidated
Balance Sheets. The fair value of these accounts receivable excludes value-added tax of $27 million and $36 million at December 31, 2015 and 2014 , respectively.
5 . INVESTMENTS IN MARKETABLE SECURITIES
The Company's investments in marketable debt and equity securities as of December 31, 2015 and 2014 by security class and by level within the fair valuehierarchy have been disclosed in Note 4 — Fair Value . The security classes are determined based on the nature and risk of a security and are consistent with howthe Company manages, monitors and measures its marketable securities. As of December 31, 2015 , $462 million of available-for-sale ("AFS") debt securities hadstated maturities within one year and $28 million had stated maturities between one and two years. Gains and losses on the sale of investments are determinedusing the specific-identification method. For the years ended December 31, 2015 , 2014 , and 2013 , pretax realized gains and losses related to AFS and tradingsecurities were $1 million or less, unrealized gains and losses on AFS securities were less than $1 million , and there were no other-than-temporary impairment ofmarketable securities recognized in earnings or OCI. The following table summarizes the gross proceeds from sale of AFS securities in millions for the years endedDecember 31, 2015 , 2014 , and 2013 :
2015 2014 2013Gross proceeds from sales of AFS securities $ 4,902 $ 4,569 $ 4,406
6 . DERIVATIVE INSTRUMENTS AND HEDGING ACTIVITIES
Volume of Activity
The following tables present, by type of derivative, the Company's outstanding notional under its derivatives and the weighted-average remaining term as ofDecember 31, 2015 regardless of whether the derivative instruments are in qualifying cash flow hedging relationships:
Current Maximum
Interest Rate and Cross Currency (1) DerivativeNotional Derivative Notional
Translated to USD DerivativeNotional Derivative Notional
Translated to USD Weighted-AverageRemaining Term % of Debt Currently Hedged
by Index (2)
(in millions) (in years)
Interest Rate Derivatives: LIBOR (U.S. Dollar) 2,639 $ 2,639 2,872 $ 2,872 11 48%EURIBOR (Euro) 482 524 482 524 6 83%Cross Currency Swaps: Chilean Unidad de Fomento 4 159 4 159 13 76%
_____________________________(1) The Company's interest rate derivative instruments primarily include accreting and amortizing notionals. The maximum derivative notional represents the largest notional at any point between December 31, 2015 and the maturity
of the derivative instrument, which includes forward-starting derivative instruments. The interest rate and cross currency derivatives range in maturity through 2033 and 2028 , respectively.(2) The percentage of variable-rate debt currently hedged is based on the related index and excludes forecasted issuances of debt and variable-rate debt tied to other indices where the Company has no interest rate derivatives.
December 31, 2015
Foreign Currency Derivatives Notional (1) Notional Translated to
USD Weighted-AverageRemaining Term (2)
(in millions) (in years)
Foreign Currency Derivatives Argentine Peso $ 2,321 $ 178 10Brazilian Real 80 21 <1British Pound 22 32 <1Chilean Peso 84,669 119 <1Chilean Unidad de Fomento 9 311 <1Colombian Peso 252,166 80 <1Euro 32 35 <1Kazakhstani Tenge 1,691 5 1_____________________________(1) Represents contractual notionals. The notionals for options have not been probability adjusted, which generally would decrease them.(2) Represents the remaining tenor of our foreign currency derivatives weighted by the corresponding notional. These derivatives matures through 2026 .
December 31, 2015 Weighted-Average
Commodity Derivatives Notional Remaining Term (1)
(in millions) (in years)
Power (MWh) 10 3_____________________________(1) Represents the remaining tenor of our commodity derivatives weighted by the corresponding volume. These derivatives range in maturity through 2018 .
141

THE AES CORPORATIONNOTES TO CONSOLIDATED FINANCIAL STATEMENTS—(Continued)
DECEMBER 31, 2015, 2014, AND 2013
Accounting and Reporting
Assets and Liabilities
The following tables present in millions the Company's derivative instruments as of the periods indicated, first by whether or not they are designated hedginginstruments, then by whether they are current or noncurrent to the extent they are subject to master netting agreements or similar agreements (where the rights toset-off relate to settlement of amounts receivable and payable under those derivatives) and by balances no longer accounted for as derivatives.
December 31, 2015 December 31, 2014
Designated Not Designated Total Designated Not Designated TotalAssets
Foreign currency derivatives $ 8 $ 319 $ 327 $ 6 $ 230 $ 236Commodity derivatives 30 18 48 25 19 44
Total assets $ 38 $ 337 $ 375 $ 31 $ 249 $ 280Liabilities
Interest rate derivatives $ 358 $ — $ 358 $ 416 $ — $ 416Cross currency derivatives 43 — 43 29 — 29Foreign currency derivatives 35 21 56 38 14 52Commodity derivatives 12 21 33 7 10 17
Total liabilities $ 448 $ 42 $ 490 $ 490 $ 24 $ 514
December 31, 2015 December 31, 2014
Assets Liabilities Assets LiabilitiesCurrent $ 86 $ 144 $ 77 $ 148Noncurrent 289 346 203 366
Total $ 375 $ 490 $ 280 $ 514Derivatives subject to master netting agreement or similar agreement:
Gross amounts recognized in the balance sheet $ 57 $ 467 $ 53 $ 507Gross amounts of derivative instruments not offset (18) (18) (10) (10)Gross amounts of cash collateral received/pledged not offset — (38) — (26)Net amount $ 39 $ 411 $ 43 $ 471
Other balances that had been, but are no longer, accounted for as derivatives that are to be amortized toearnings over the remaining term of the associated PPA $ 147 $ 166 $ 161 $ 180
Effective Portion of Cash Flow Hedges — The following tables present (in millions) the pretax gains (losses) recognized in AOCL and earnings related to theeffective portion of derivative instruments in qualifying cash flow hedging relationships (including amounts that were reclassified from AOCL as interest expenserelated to interest rate derivative instruments that previously, but no longer, qualify for cash flow hedge accounting), as defined in the accounting standards forderivatives and hedging, for the periods indicated:
Years Ended December 31, Gains (Losses) Recognized in AOCL Classification in Consolidated Statements of
Operations
Gains (Losses) Reclassifiedfrom AOCL into Earnings
Type of Derivative 2015 2014 2013 2015 2014 2013Interest rate derivatives $ (103) $ (421) $ 155 Interest expense $ (108) $ (139) $ (127) Non-regulated cost of sales (2) (2) (5) Net equity in earnings of affiliates (2) (3) (6) Gain on sale of investments (4) — (21)Cross currency derivatives (20) (25) (18) Interest expense (4) — (10) Foreign currency transaction gains (losses) (20) (23) (18)Foreign currency derivatives 10 (28) — Foreign currency transaction gains (losses) 32 14 12Commodity derivatives 40 44 2 Non-regulated revenue 43 30 (3) Non-regulated cost of sales (12) (2) (2)Total $ (73) $ (430) $ 139 $ (77) $ (125) $ (180)
The pretax accumulated other comprehensive income (loss) expected to be recognized as an increase (decrease) to income from continuing operations beforeincome taxes over the next twelve months as of December 31, 2015 is $(106) million for interest rate hedges, $(3) million for cross currency swaps, $12 million forforeign currency hedges, and $16 million for commodity and other hedges.
For the year ended December 31, 2014, pretax losses of $6 million , net of noncontrolling interests were reclassified into earnings as a result of thediscontinuance of a cash flow hedge because it was probable that the forecasted transaction would not occur by the end of the originally specified time period (asdocumented at the inception of the hedging relationship) or within an additional two -month time period thereafter. There was no such item for the years ended

December 31, 2015 and 2013.
142

THE AES CORPORATIONNOTES TO CONSOLIDATED FINANCIAL STATEMENTS—(Continued)
DECEMBER 31, 2015, 2014, AND 2013
Ineffective Portion of Cash Flow Hedges — The following table presents (in millions) the pretax gains (losses) recognized in earnings related to the ineffectiveportion of derivative instruments in qualifying cash flow hedging relationships, as defined in the accounting standards for derivatives and hedging, for the periodsindicated:
Gains (Losses) Recognized in Earnings
Classification in Consolidated Statements of Operations
Years Ended December 31,
Type of Derivative 2015 2014 2013
Interest rate derivatives Interest expense $ (4) $ — $ 42 Net equity in earnings of affiliates — (1) 1Foreign currency derivatives Foreign currency transaction gains (losses) (3) (2) —Cross currency derivatives Interest expense 1 (1) —Total $ (6) $ (4) $ 43
Not Designated for Hedge Accounting — The next table presents (in millions) the gains (losses) recognized in earnings related to derivative instruments notdesignated as hedging instruments under the accounting standards for derivatives and hedging, and amortization of balances that had been, but are no longer,accounted for as derivatives, for the periods indicated:
Gains (Losses) Recognized in Earnings
Classification in Consolidated Statements of Operations Years Ended December 31,
Type of Derivative 2015 2014 2013Interest rate derivatives Interest expense $ — $ (3) $ (1) Net equity in earnings of affiliates — — (6)Foreign currency derivatives Foreign currency transaction gains (losses) 211 146 64 Net equity in earnings of affiliates — (2) (24)Commodity and other derivatives Non-regulated revenue (8) 5 11 Non-regulated cost of sales (16) (3) 1 Regulated cost of sales (5) (6) 2 Income (loss) from operations of discontinued businesses — (7) (18) Net gain (loss) from disposal and impairments of discontinued operations — 72 —Total $ 182 $ 202 $ 29
Credit Risk-Related Contingent Features
DP&L has certain over-the-counter commodity derivative contracts under master netting agreements that contain provisions that require DP&L to maintainan investment-grade issuer credit rating from credit rating agencies. Since DP&L's rating has fallen below investment grade, certain of the counterparties to thederivative contracts have requested immediate and ongoing full overnight collateralization of the mark-to-market loss (fair value excluding credit valuationadjustments), which was $28 million and $12 million as of December 31, 2015 and 2014 , respectively, for all derivatives with credit risk-related contingentfeatures. As of December 31, 2015 and 2014 , DP&L had posted $8 million and $5 million , respectively, of cash collateral directly with third parties and in abroker margin account and DP&L held no cash collateral from counterparties to its derivative instruments that were in an asset position. After consideration of thenetting of counterparty assets, DP&L could have been required to, but did not, provide additional collateral of $2 million and $1 million as of December 31, 2015and 2014 , respectively.
7 . FINANCING RECEIVABLES
Financing receivables are defined as receivables that have contractual maturities of greater than one year. The Company has financing receivables pursuant toamended agreements or government resolutions that are due from certain Latin American governmental bodies, primarily in Argentina. The table below presentsthe breakdown of financing receivables in millions by country as of the periods indicated:
December 31, 2015 2014
Argentina $ 237 $ 278Cameroon (1) — 44United States 20 —Brazil 39 15
Total long-term financing receivables $ 296 $ 337_____________________________
(1) Represents non-contingent consideration to be received in 2016 from the sale of the Cameroon businesses in 2014. Balance is classified as short-term as of December 31, 2015. See Note 23 —Discontinued Operations.
Argentina — Collection of the principal and interest on these receivables is subject to various business risks and uncertainties including, but not limited to,the completion and operation of power plants which generate cash for payments of these receivables, regulatory changes that could impact the timing and amountof collections, and economic conditions in Argentina. The Company monitors these risks including the credit ratings of the Argentine government on a quarterlybasis to assess the collectability of these receivables. The Company accrues interest on these receivables once the recognition criteria have been met. The

Company's collection estimates are based on assumptions that it believes to be reasonable, but are inherently uncertain. Actual future cash flows could differ fromthese estimates.
FONINVEMEM Agreements
As a result of energy market reforms in 2004 and 2010, AES Argentina entered into three agreements with the Argentine government, referred to as theFONINVEMEM Agreements, to contribute a portion of their accounts receivable into a fund for financing the construction of combined cycle and gas-fired plants.These receivables accrue interest and are collected in monthly installments over 10 years once the related plant begins operations. In addition, AES Argentinareceives an ownership interest in these newly built plants once the receivables have been fully repaid.
143
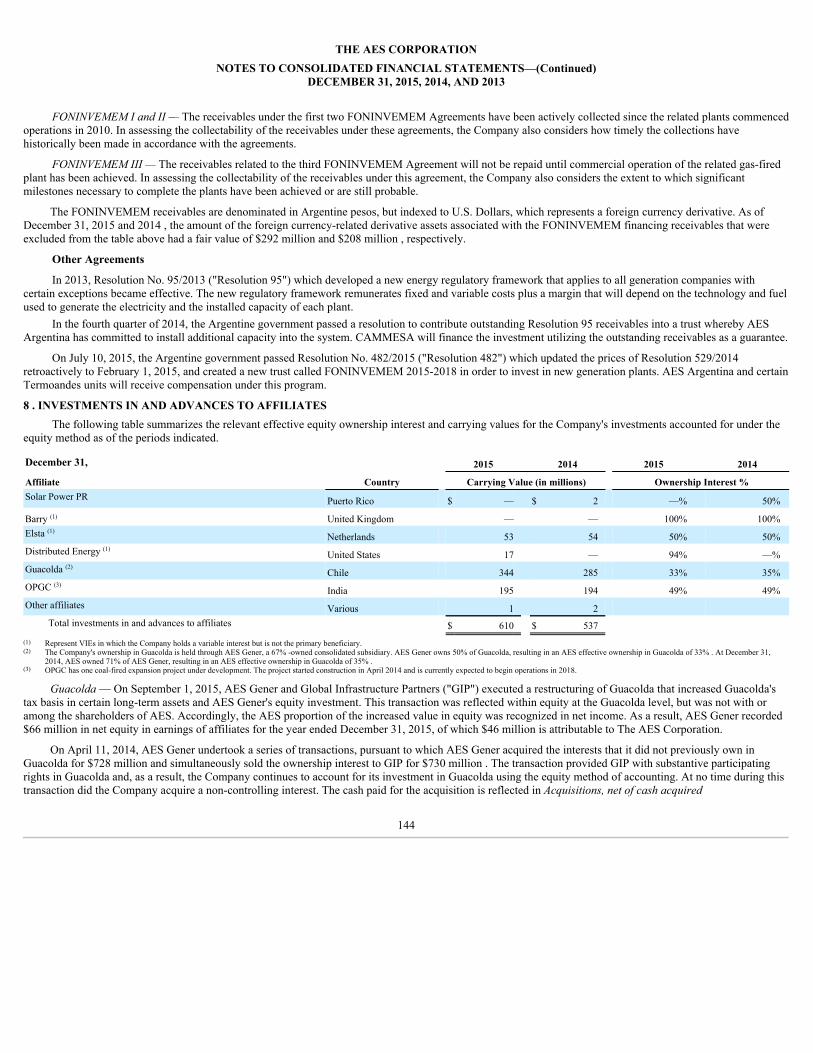
THE AES CORPORATIONNOTES TO CONSOLIDATED FINANCIAL STATEMENTS—(Continued)
DECEMBER 31, 2015, 2014, AND 2013
FONINVEMEM I and II — The receivables under the first two FONINVEMEM Agreements have been actively collected since the related plants commencedoperations in 2010. In assessing the collectability of the receivables under these agreements, the Company also considers how timely the collections havehistorically been made in accordance with the agreements.
FONINVEMEM III — The receivables related to the third FONINVEMEM Agreement will not be repaid until commercial operation of the related gas-firedplant has been achieved. In assessing the collectability of the receivables under this agreement, the Company also considers the extent to which significantmilestones necessary to complete the plants have been achieved or are still probable.
The FONINVEMEM receivables are denominated in Argentine pesos, but indexed to U.S. Dollars, which represents a foreign currency derivative. As ofDecember 31, 2015 and 2014 , the amount of the foreign currency-related derivative assets associated with the FONINVEMEM financing receivables that wereexcluded from the table above had a fair value of $292 million and $208 million , respectively.
Other Agreements
In 2013, Resolution No. 95/2013 ("Resolution 95") which developed a new energy regulatory framework that applies to all generation companies withcertain exceptions became effective. The new regulatory framework remunerates fixed and variable costs plus a margin that will depend on the technology and fuelused to generate the electricity and the installed capacity of each plant.
In the fourth quarter of 2014, the Argentine government passed a resolution to contribute outstanding Resolution 95 receivables into a trust whereby AESArgentina has committed to install additional capacity into the system. CAMMESA will finance the investment utilizing the outstanding receivables as a guarantee.
On July 10, 2015, the Argentine government passed Resolution No. 482/2015 ("Resolution 482") which updated the prices of Resolution 529/2014retroactively to February 1, 2015, and created a new trust called FONINVEMEM 2015-2018 in order to invest in new generation plants. AES Argentina and certainTermoandes units will receive compensation under this program.
8 . INVESTMENTS IN AND ADVANCES TO AFFILIATESThe following table summarizes the relevant effective equity ownership interest and carrying values for the Company's investments accounted for under the
equity method as of the periods indicated.
December 31, 2015 2014 2015 2014
Affiliate Country Carrying Value (in millions) Ownership Interest %Solar Power PR Puerto Rico $ — $ 2 —% 50%
Barry (1) United Kingdom — — 100% 100%Elsta (1)
Netherlands 53 54 50% 50%Distributed Energy (1)
United States 17 — 94% —%Guacolda (2)
Chile 344 285 33% 35%OPGC (3)
India 195 194 49% 49%Other affiliates Various 1 2
Total investments in and advances to affiliates $ 610 $ 537 (1) Represent VIEs in which the Company holds a variable interest but is not the primary beneficiary.(2) The Company's ownership in Guacolda is held through AES Gener, a 67% -owned consolidated subsidiary. AES Gener owns 50% of Guacolda, resulting in an AES effective ownership in Guacolda of 33% . At December 31,
2014, AES owned 71% of AES Gener, resulting in an AES effective ownership in Guacolda of 35% .(3) OPGC has one coal-fired expansion project under development. The project started construction in April 2014 and is currently expected to begin operations in 2018.
Guacolda — On September 1, 2015, AES Gener and Global Infrastructure Partners ("GIP") executed a restructuring of Guacolda that increased Guacolda'stax basis in certain long-term assets and AES Gener's equity investment. This transaction was reflected within equity at the Guacolda level, but was not with oramong the shareholders of AES. Accordingly, the AES proportion of the increased value in equity was recognized in net income. As a result, AES Gener recorded$66 million in net equity in earnings of affiliates for the year ended December 31, 2015, of which $46 million is attributable to The AES Corporation.
On April 11, 2014, AES Gener undertook a series of transactions, pursuant to which AES Gener acquired the interests that it did not previously own inGuacolda for $728 million and simultaneously sold the ownership interest to GIP for $730 million . The transaction provided GIP with substantive participatingrights in Guacolda and, as a result, the Company continues to account for its investment in Guacolda using the equity method of accounting. At no time during thistransaction did the Company acquire a non-controlling interest. The cash paid for the acquisition is reflected in Acquisitions, net of cash acquired
144
THE AES CORPORATIONNOTES TO CONSOLIDATED FINANCIAL STATEMENTS—(Continued)
DECEMBER 31, 2015, 2014, AND 2013
and the cash proceeds from the sale of these ownership interests to GIP is reflected in Proceeds from the sale of businesses, net of cash sold on the ConsolidatedStatement of Cash Flows for the period ended December 31, 2014.
Distributed Energy — On February 18, 2015, the Company completed the acquisition of 100% of the common stock of Main Street Power Company, Inc.,which has been renamed to Distributed Energy Inc. As part of this acquisition, the Company obtained additional investments accounted for under the equitymethod.
Silver Ridge Power — On July 1, 2014, the Puerto Rico solar business, Solar Power PR, LLC, was distributed by Silver Ridge Power, LLC ("SRP") to AESand Riverstone Holdings LLC and was accounted for as a direct equity method investment. On April 29, 2015, the Company purchased the remaining 50% of thecommon stock of Solar Power PR, LLC and now consolidates this entity. On July 2, 2014, the Company closed the sale of its 50% ownership interest in SRP for apurchase price of $179 million , excluding the Company's indirect ownership interests in SRP's solar generation businesses in Italy and Spain ("Solar Italy" and"Solar Spain," respectively). The buyer also had an option to purchase the Company's indirect 50% interest in the Italy solar generation business for an additionalconsideration of $42 million by August 2015. The buyer exercised its option to purchase Solar Italy on August 31, 2015, and the sale was completed on October 1,2015.
In 2014, the sale of the Company's 50% ownership interest in SRP did not qualify as a sale for accounting purposes as the Company had continuinginvolvement in the business operations. As of July 2, 2014, the Company no longer retained an equity interest in SRP. As such, the then-remaining investmentbalance of $32 million related to Italy and Spain and the AOCL balance of $40 million were reclassified to Other noncurrent assets on the Consolidated BalanceSheets. As of December 31, 2014 , the carrying value of these investments recorded in Other noncurrent assets was $64 million .
Solar Spain — On September 24, 2015, the Company completed the sale of Solar Spain, an equity method investment. Net proceeds from the sale transactionwere $31 million and the Company recognized a pretax gain on sale of less than $1 million .
Upon the completion of the Solar Spain and Solar Italy sale transactions noted above, the Company ceased its involvement in SRP's business operations andaccounted for these transactions as sales of real estate. Accordingly, as of December 31, 2015 , the carrying value of these investments recorded in Othernoncurrent assets was zero .
AES Barry Ltd. — The Company holds a 100% ownership interest in AES Barry Ltd. ("Barry"), a dormant entity in the U.K. that disposed of its generationand other operating assets. Due to a debt agreement, no material financial or operating decisions can be made without the banks' consent, and the Company doesnot control Barry. As of December 31, 2015 and 2014 , other long-term liabilities included $49 million and $52 million related to this debt agreement.
Elsta — In 2014, long lived assets within Elsta were determined to not be recoverable and an impairment charge of approximately $82 million wasrecognized. The Company recognized its 50% share, or $41 million , through its proportion of the equity earnings in Elsta.
Entek — In September 2014, the Company executed an agreement, subject to the approval of the Company's Board of Directors, to sell its equity interest inAES Entek. Based on this agreement, during the third quarter of 2014, the Company determined there was an other-than-temporary decline in the fair value of itsequity method investment in AES Entek and recognized a pretax impairment loss of $18 million in other non-operating expense. On October 13, 2014, theCompany entered into a binding agreement to sell its 49.62% ownership interest in Entek for a purchase price of $125 million . This resulted in the recognition ofan additional other-than-temporary impairment of $68 million due to the inclusion of the cumulative translation adjustment in the carrying value of the investment.For additional information see Note 9— Other Non-Operating Expense. The sale represents 100% of the Company's interest in assets in Turkey. On December 18,2014, the transaction closed which resulted in a final loss on sale of $4 million . Entek does not meet the criteria to be reported as discontinued operations underASU No. 2014-08, which was adopted by the Company on July 1, 2014. Accordingly, AES' proportion of Entek's results are reflected in the ConsolidatedStatements of Operations within continuing operations. Excluding the loss on sale, Entek's pretax loss attributable to AES was $9 million and $29 million for theyears ended December 31, 2014 and 2013, respectively.
Summarized Financial Information
The following tables summarize financial information of the Company's 50%-or-less-owned affiliates and majority-owned unconsolidated subsidiaries thatare accounted for using the equity method in millions.
145

THE AES CORPORATIONNOTES TO CONSOLIDATED FINANCIAL STATEMENTS—(Continued)
DECEMBER 31, 2015, 2014, AND 2013
50%-or-less Owned Affiliates Majority-Owned Unconsolidated Subsidiaries
Years ended December 31, 2015 2014 2013 2015 2014 2013Revenue $ 641 $ 928 $ 1,099 $ 24 $ 2 $ 2Operating margin 152 206 295 11 — —Net income (loss) 210 59 53 6 — — December 31, 2015 2014 2015 2014 Current assets $ 376 $ 450 $ 20 $ — Noncurrent assets 2,132 1,748 211 15 Current liabilities 435 299 21 — Noncurrent liabilities 1,044 935 153 67 Noncontrolling interests — 17 — — Stockholders' equity 1,029 947 57 (52)
At December 31, 2015 , retained earnings included $244 million related to the undistributed earnings of the Company's 50%-or-less owned affiliates.Distributions received from these affiliates were $18 million , $28 million , and $6 million for the years ended December 31, 2015 , 2014 , and 2013 , respectively.As of December 31, 2015 , the aggregate carrying amount of our investments in equity affiliates exceeded the underlying equity in their net assets by $162 million .
9 . OTHER NON-OPERATING EXPENSE
Years Ended December 31, 2014 2013 (in millions)
Entek $ 86 $ —Silver Ridge 42 —Elsta — 129Total other non-operating expense $ 128 $ 129
There was no other non-operating expense for the year ended December 31, 2015 .
Entek — During 2014, the Company executed an agreement to sell its 49.62% interest in Entek, an investment accounted for under the equity method, for$125 million . Entek consists of natural gas and hydroelectric generation facilities, plus a coal-fired development project. The Company determined that there wasan other-than-temporary decline in the fair value of its equity method investment in Entek and recognized pretax impairment expense of $86 million . The sale ofthe Company's interest in Entek closed on December 18, 2014. See Note 8— Investments in and Advances to Affiliates of this Form 10-K for further information.
Silver Ridge — During 2014, the Company determined that there was a decline in the fair value of its equity method investment in SRP that was other-than-temporary based on indications about the fair value of the projects in Italy and Spain that resulted from actual and proposed changes to their tariffs. Accordingly,the Company recognized pretax impairment expense of $42 million . The transaction related to our 50% ownership interest in SRP closed on July 2, 2014 for $179million . See Note 8— Investments in and Advances to Affiliates of this Form 10-K for further information.
Elsta — During 2013, the Company identified an impairment indicator at Elsta, a combined cycle gas-fired plant in the Netherlands that is accounted forunder the equity method, resulting from negative pricing indications noted during negotiations with its offtakers for an extension of the existing PPA. TheCompany recognized pretax impairment expense of $129 million by reducing the carrying value of $240 million to the estimated fair value of $111 million . TheCompany estimated fair value using probability-weighted outcomes which contemplated various scenarios involving the amendments to the existing PPA.
146

THE AES CORPORATIONNOTES TO CONSOLIDATED FINANCIAL STATEMENTS—(Continued)
DECEMBER 31, 2015, 2014, AND 2013
10 . GOODWILL AND OTHER INTANGIBLE ASSETS
Goodwill — The following table summarizes the changes in the carrying amount of goodwill, by reportable segment for the years ended December 31, 2015 and2014 in millions.
US Andes MCAC Europe Asia TotalBalance as of December 31, 2013
Goodwill $ 2,658 $ 899 $ 149 $ 180 $ 68 $ 3,954Accumulated impairment losses (2,152) — — (180) — (2,332)
Net balance 506 899 149 — 68 1,622Impairment losses (164) — — — — (164)
Balance as of December 31, 2014 Goodwill 2,658 899 149 122 (1) 68 3,896Accumulated impairment losses (2,316) — — (122) — (2,438)
Net balance 342 899 149 — 68 1,458Impairment losses (317) — — — — (317)Goodwill acquired during the year 16 — — — — 16
Balance as of December 31, 2015 Goodwill 2,674 899 149 122 68 3,912Accumulated impairment losses (2,633) — — (122) — (2,755)
Net balance $ 41 $ 899 $ 149 $ — $ 68 $ 1,157_____________________________
(1) Both the gross carrying amount and the accumulated impairment losses of the Europe segment have been reduced by $58 million with no impact on the net carrying amount for the segment. This relates to Ebute, which had fullyimpaired goodwill of $58 million and was sold in 2014.
DP&L — During the fourth quarter of 2015, the Company performed the annual goodwill impairment test at its DP&L reporting unit ("DP&L") andrecognized a goodwill impairment expense of $317 million . The reporting unit failed Step 1 as its fair value was less than its carrying amount, which wasprimarily due to a decrease in forecasted dark spreads that were driven by decreases in projected forward power prices, and lower than expected revenues from anew Capacity Performance ("CP") product. The fair value of the reporting unit was determined under the income approach using a discounted cash flow valuationmodel. The significant assumptions included within the discounted cash flow valuation model were forward commodity price curves, the amount of non-bypassable charges from the pending ESP, expected revenues from the new CP product, and planned environmental expenditures. In Step 2, goodwill wasdetermined to have an implied negative fair value after the hypothetical purchase price allocation under the accounting guidance for business combinations;therefore, a full impairment of the remaining goodwill balance of $317 million was recognized. DP&L is reported in the US SBU reportable segment.
Main Street Power — During the first quarter of 2015, the Company completed the acquisition of 100% of the common stock of Main Street PowerCompany, Inc. The transaction included recognition of $16 million of Goodwill. See Note 25 — Acquisitions for additional information.
Buffalo Gap — During the first quarter of 2014, the Company recognized an $18 million impairment of its goodwill at its Buffalo Gap reporting unit, whichis comprised of three wind projects in Texas. During the fourth quarter of 2014, the Company performed the annual goodwill impairment test at its Buffalo Gapreporting unit. The reporting unit failed Step 1 and Step 2 was performed to measure the amount of goodwill impairment. In Step 2, after the hypothetical purchaseprice allocation under the relevant accounting guidance, the implied fair value of goodwill was negative. As a result, a full impairment of goodwill of $10 millionwas recognized. Buffalo Gap is reported in the US SBU reportable segment.
DPLER — During the first quarter of 2014, the Company performed an interim impairment test on the $136 million in goodwill at its DPLER reporting unit,a competitive retail marketer selling retail electricity to customers in Ohio and Illinois. The DPLER reporting unit was identified as being "at risk" during the fourthquarter of 2013. The impairment indicators arose based on market information available regarding actual and proposed sales of competitive retail marketers, whichindicated a significant decline in valuations during the first quarter of 2014.
In Step 1 of the interim impairment test, the fair value of the reporting unit was determined to be less than its carrying amount under both the marketapproach and the income approach using a discounted cash flow valuation model. The significant assumptions included commodity price curves, estimatedelectricity to be demanded by its customers, changes in its customer base through attrition and expansion, discount rates, the assumed tax structure and the level ofworking capital required to run the business.
In Step 2 of the interim impairment test, the goodwill was determined to have an implied fair value of zero after the hypothetical purchase price allocationand the Company accordingly recognized a full impairment of the $136 million in goodwill at the DPLER reporting unit. DPLER is reported in the US SBUreportable segment.
147
THE AES CORPORATIONNOTES TO CONSOLIDATED FINANCIAL STATEMENTS—(Continued)
DECEMBER 31, 2015, 2014, AND 2013
Other Intangible Assets — The following table summarizes the balances comprising other intangible assets in the accompanying Consolidated Balance Sheets(in millions) as of the periods indicated:
December 31, 2015 December 31, 2014
Gross Balance Accumulated Amortization Net Balance Gross Balance Accumulated Amortization Net Balance
Subject to Amortization
Project development rights (1) $ 4 $ (1) $ 3 $ 28 $ (1) $ 27Sales concessions 71 (19) 52 86 (41) 45
Contractual payment rights (2) 66 (46) 20 69 (40) 29Management rights 24 (10) 14 33 (13) 20Land use rights 28 — 28 25 — 25Contracts 29 (12) 17 36 (19) 17Customer contracts and relationships (3)
6 (6) — 63 (39) 24
Other (4) 15 (3) 12 22 (5) 17Subtotal 243 (97) 146 362 (158) 204
Indefinite-Lived Intangible Assets Land use rights 38 — 38 37 — 37Water rights 17 — 17 20 — 20Other 13 — 13 20 — 20
Subtotal 68 — 68 77 — 77Total $ 311 $ (97) $ 214 $ 439 $ (158) $ 281_____________________________
(1) 2014 balance includes U.K. Wind operations. In August 2014 these assets were sold, but did not meet the criteria to be reported as discontinued operations and their results are reflected within continuing operations. See Note 24— Dispositions and Held-for-Sale Businesses for further information.
(2) Represent legal rights to receive system reliability payments from the regulator.(3) 2014 balance includes DPLER which is considered held-for-sale as of December 31, 2015. See Note 24 — Dispositions and Held-for-Sale Businesses for further information.(4) Includes renewable energy certificates, emission allowances and various other intangible assets none of which is individually significant.
The following tables summarize, by category, other intangible assets acquired during the period indicated ($ in millions):
December 31, 2015
Amount Subject to Amortization/Indefinite-Lived Weighted Average Amortization Period(in years) Amortization Method
Contracts $ 22 Subject to Amortization 5 Straight-lineLand-use rights 13 Subject to Amortization N/A N/AOther 5 Various N/A N/ATotal $ 40
December 31, 2014
Amount Subject to Amortization/Indefinite-Lived Weighted Average
Amortization Period (in years) AmortizationMethod
Renewable energy certificates $ 3 Indefinite N/A N/ALand-use rights 16 Subject to Amortization N/A N/ATotal $ 19
The following table summarizes the estimated amortization expense by intangible asset category for 2016 through 2020 :
(in millions) 2016 2017 2018 2019 2020
Sales concessions 7 7 7 7 7All other 4 4 4 3 3Total $ 11 $ 11 $ 11 $ 10 $ 10
Intangible asset amortization expense was $25 million , $26 million and $29 million for the years ended December 31, 2015 , 2014 and 2013 , respectively.
148

THE AES CORPORATIONNOTES TO CONSOLIDATED FINANCIAL STATEMENTS—(Continued)
DECEMBER 31, 2015, 2014, AND 2013
11 . REGULATORY ASSETS AND LIABILITIES
The Company has recorded regulatory assets and liabilities (in millions) that it expects to pass through to its customers in accordance with, and subject to,regulatory provisions as follows:
December 31, 2015 2014 Recovery/Refund PeriodREGULATORY ASSETS
Current regulatory assets:
Brazil tariff recoveries: (1) Energy purchases/sales $ 416 $ 424 Annually as part of the tariff adjustmentTransmission costs, regulatory fees and other 264 63 Annually as part of the tariff adjustment
El Salvador tariff recoveries (2) 43 92 Quarterly as part of the tariff adjustment
Other (3) 23 58 VariousTotal current regulatory assets 746 637 Noncurrent regulatory assets:
Defined benefit pension obligations at IPL and DPL (4)(5) 227 329 Various
Income taxes recoverable from customers (4)(6) 36 74 Various
Brazil tariff recoveries: (1) Energy purchases/sales 147 266 Annually as part of the tariff adjustmentTransmission costs, regulatory fees and other 140 14 Annually as part of the tariff adjustment
Deferred Midwest ISO costs (7) 129 111 To be determined
Other (3) 239 78 VariousTotal noncurrent regulatory assets 918 872
TOTAL REGULATORY ASSETS $ 1,664 $ 1,509 REGULATORY LIABILITIES
Current regulatory liabilities:
Brazil tariff reset adjustment (8) $ — $ 76 Two years
Efficiency program costs (9) 12 22 Annually as part of the tariff adjustment
Brazil regulatory asset base adjustment (13) 169 123 Up to four tariff periods
Brazil tariff refunds: (1) Energy purchases/sales 105 144 Annually as part of the tariff adjustmentTransmission costs, regulatory fees and other 120 174 Annually as part of the tariff adjustment
Other (10) 59 66 VariousTotal current regulatory liabilities 465 605 Noncurrent regulatory liabilities:
Asset retirement obligations (11) 759 727 Over life of assets
Brazil regulatory asset base adjustment (13) 86 61 Up to four tariff periods
Brazil special obligations (12) 370 484 To be determined
Brazil tariff refunds: (1) Energy purchases/sales 30 128 Annually as part of the tariff adjustmentTransmission costs, regulatory fees and other 29 97 Annually as part of the tariff adjustment
Efficiency program costs (9) 5 11 Annually as part of the tariff adjustment
Other (10) 7 1 VariousTotal noncurrent regulatory liabilities 1,286 1,509
TOTAL REGULATORY LIABILITIES $ 1,751 $ 2,114 _____________________________
(1) Recoverable or refundable per Brazilian National Electric Energy Agency ("ANEEL") regulations through the Annual Tariff Adjustment ("IRT"). These costs are generally non-controllable and primarily consist of purchasedelectricity, energy transmission, and sector costs that are considered volatile. The costs are passed through for a period of 12 months as part of the IRT. Any remaining balance is considered in the subsequent IRT, which results ina total of 24 months to recover or refund the costs. Favorable spot market sales are also subject to customer refunds through the IRT over the course of these time periods.
(2) Deferred fuel costs incurred by our El Salvador subsidiaries associated with purchase of energy from the El Salvador spot market and power generation plants. In El Salvador, the deferred fuel adjustment represents the variancebetween the actual fuel costs and the fuel costs recovered in the tariffs. The variance is recovered quarterly in the tariff reset period.
(3) Includes assets with and without a rate of return. Other current regulatory assets that did not earn a rate of return were $8 million and $22 million , as of December 31, 2015 and 2014 , respectively. Other noncurrent regulatoryassets that did not earn a rate of return were $237 million and $73 million , as of December 31, 2015 and 2014 , respectively. Other current and noncurrent regulatory assets primarily consist of:
▪ Unamortized losses on long-term debt reacquired or redeemed in prior periods at IPL and DPL, which are amortized over the lives of the original issues in accordance with the Federal Energy Regulatory Commission("FERC") and PUCO rules.
▪ Unamortized carrying charges and certain other costs related to Petersburg unit 4 at IPL.

▪ Deferred storm costs incurred primarily in 2008 to repair storm damage at DPL; recovery was approved via order from the PUCO on December 17, 2014 and began January 2015.
▪ Additional Regulatory Asset Base ("RAB") from a favorable decision on tariff reset (administrative appeal) at Eletropaulo.
(4) Past expenditures on which the Company does not earn a rate of return.
(5) The regulatory accounting standards allow the defined pension and postretirement benefit obligation to be recorded as a regulatory asset equal to the previously unrecognized actuarial gains and losses and prior service costs thatare expected to be recovered through future rates. Pension expense is recognized based on the plan's actuarially determined pension liability. Recovery of costs is probable, but not yet determined. Pension contributions made byour Brazilian subsidiaries are not included in regulatory assets as those contributions are not covered by the established tariff in Brazil.
(6) Probable recovery through future rates, based upon established regulatory practices, which permit the recovery of current taxes. This amount is expected to be recovered,
149

THE AES CORPORATIONNOTES TO CONSOLIDATED FINANCIAL STATEMENTS—(Continued)
DECEMBER 31, 2015, 2014, AND 2013
without interest, over the period as book-tax temporary differences reverse and become current taxes.
(7) Transmission service costs and other administrative costs from IPL's participation in the Midwest ISO market, which are recoverable but do not earn a rate of return. Recovery of costs is probable, but the timing is not yetdetermined.
(8) In July 2012, the Brazilian energy regulator (the "Regulator") approved the periodic review and reset of a component of Eletropaulo's regulated tariff, which determines the margin to be earned by Eletropaulo. The review andreset of this tariff component was retroactive to July 2011 and applied to customers' invoices from July 2012 to June 2015. From July 2011 through June 2012, Eletropaulo invoiced customers under the then-existing tariff rate, asrequired by the Regulator. As the new tariff rate was lower than the previous rate, Eletropaulo was required to reduce customer tariffs for the difference over the next year. Accordingly, from July 2011 through June 2012,Eletropaulo recognized a regulatory liability for the estimated future refunds, subsequently adjusted as of June 30, 2012 upon the finalization of the new tariff with the Regulator. The refund to customers was considered in the2013 tariff adjustment, which contemplated an amortization of 67.55% from July 4, 2013. The remaining balance, representing 32.45% , was considered in the next annual tariff adjustment. There was no recorded currentregulatory liability at Eletropaulo as of December 31, 2015 .
(9) Amounts received for costs expected to be incurred to improve the efficiency of our plants in Brazil as part of the IRT.
(10) Other current and noncurrent regulatory liabilities primarily consist of liabilities owed to electricity generators due to variance in energy prices during rationing periods ("Free Energy"). Our Brazilian subsidiaries are authorizedto refund this cost associated with monthly energy price variances between the wholesale energy market prices owed to the power generation plants producing Free Energy and the capped price reimbursed by the localdistribution companies which are passed through to the final customers through energy tariffs. The balance excludes asset retirement obligations that were reclassified out of Other.
(11) Obligations for removal costs which do not have an associated legal retirement obligation as defined by the accounting standards on asset retirement obligations.
(12) Obligations established by ANEEL in Brazil associated with electric utility concessions and represent amounts received from customers or donations not subject to return. These donations are allocated to support energy networkexpansion and to improve utility operations to meet customers' needs. The term of the obligation is established by ANEEL. Settlement shall occur when the concession ends.
(13) Represents adjustments to the RAB resulting from an administrative ruling in December 2013 compelling Eletropaulo to refund customers beginning July 2014.
The current regulatory assets and liabilities are recorded in Other current assets and Accrued and other liabilities , respectively, on the accompanyingConsolidated Balance Sheets. The noncurrent regulatory assets and liabilities are recorded in Other noncurrent assets and Other noncurrent liabilities ,respectively, in the accompanying Consolidated Balance Sheets. The following table summarizes regulatory assets and liabilities by reportable segment in millionsas of the periods indicated:
December 31, 2015 2014
Regulatory Assets Regulatory Liabilities Regulatory Assets Regulatory LiabilitiesBrazil SBU $ 971 $ 932 $ 787 $ 1,347US SBU 650 819 631 767MCAC SBU (El Salvador) 43 — 91 —
Total $ 1,664 $ 1,751 $ 1,509 $ 2,114
12 . DEBTNON-RECOURSE DEBT — The next table summarizes the carrying amount (in millions) and terms of non-recourse debt as of the periods indicated:
NON-RECOURSE DEBTWeighted Average
Interest Rate Maturity December 31,
2015 2014
VARIABLE RATE: (1) Bank loans 4.37% 2016 – 2033 $ 2,352 $ 1,893Notes and bonds 14.98% 2016 – 2022 1,474 1,912
Debt to (or guaranteed by) multilateral, export credit agencies or development banks (2) 2.39% 2021 – 2034 3,078 2,375Other 12.65% 2016 – 2043 47 668FIXED RATE: Bank loans 5.11% 2016 – 2032 558 750Notes and bonds 5.54% 2016 – 2073 7,948 7,654
Debt to (or guaranteed by) multilateral, export credit agencies or development banks (2) 5.39% 2023 – 2034 309 259Other 8.66% 2016 – 2049 26 89SUBTOTAL 15,792 15,600Less: Current maturities (2,529) (1,982)TOTAL $ 13,263 $ 13,618
(1) The interest rate on variable rate debt represents the total of a variable component that is based on changes in an interest rate index and of a fixed component. The Company has interest rate swaps and option agreements in anaggregate notional principal amount of approximately $3.2 billion on non-recourse debt outstanding at December 31, 2015 . These agreements economically fix the variable component of the interest rates on the portion of thevariable-rate debt being hedged so that the total interest rate on that debt has been fixed at rates ranging from approximately 2.87% to 8.24% . These agreements expire at various dates from 2016 through 2033 .
(2) Multilateral loans include loans funded and guaranteed by bilaterals, multilaterals, development banks and other similar institutions.
Non-recourse debt (in millions) as of December 31, 2015 is scheduled to reach maturity as presented in the table below:
December 31, Annual Maturities2016 $ 2,5292017 1,0222018 1,3592019 9502020 1,431Thereafter 8,501Total non-recourse debt $ 15,792

150

THE AES CORPORATIONNOTES TO CONSOLIDATED FINANCIAL STATEMENTS—(Continued)
DECEMBER 31, 2015, 2014, AND 2013
As of December 31, 2015 , AES subsidiaries with facilities under construction had a total of approximately $2.6 billion of committed but unused creditfacilities available to fund construction and other related costs. Excluding these facilities under construction, AES subsidiaries had approximately $2.4 billion in anumber of available but unused committed credit lines to support their working capital, debt service reserves and other business needs. These credit lines can beused for borrowings, letters of credit, or a combination of these uses.
Significant transactions
During the year ended December 31, 2015 , we had the following significant debt transactions at our subsidiaries:
• Gener issued new debt of $1.1 billion , offset by repayments of $423 million which includes a loss on extinguishment of debt of $19 million ;• IPALCO issued new debt of $847 million , offset by repayments of $602 million which includes a loss on extinguishment of debt of $22 million ;• Sul issued new debt of $513 million , offset by repayments of $486 million which includes a loss on extinguishment of debt of $4 million ;• Eletropaulo issued new debt of $354 million ; offset by repayments of $211 million ;• DPL issued new debt of $325 million ; more than offset by repayments of $475 million which includes a loss on extinguishment of debt of $2 million ;• Panama issued new debt of $300 million , offset by repayments of $287 million which includes a loss on extinguishment of debt of $15 million ;• Mong Duong drew $203 million under its construction loan facility;• Tietê issued new debt of $153 million , more than offset by repayments of $226 million ;• Andres issued new debt of $180 million , offset by repayments of $176 million which includes a loss on extinguishment of debt of $11 million ; and• Itabo made repayments of $123 million which includes a loss on extinguishment of debt of $8 million .
Non-Recourse Debt Covenants, Restrictions and Defaults — The terms of the Company's non-recourse debt include certain financial and non-financialcovenants. These covenants are limited to subsidiary activity and vary among the subsidiaries. These covenants may include, but are not limited to, maintenance ofcertain reserves and financial ratios, minimum levels of working capital and limitations on incurring additional indebtedness.
As of December 31, 2015 and 2014 , approximately $513 million and $245 million , respectively, of restricted cash was maintained in accordance withcertain covenants of the non-recourse debt agreements, and these amounts were included within Restricted cash and Debt service reserves and other deposits in theaccompanying Consolidated Balance Sheets.
Various lender and governmental provisions restrict the ability of certain of the Company's subsidiaries to transfer their net assets to the Parent Company.Such restricted net assets of subsidiaries amounted to approximately $2 billion at December 31, 2015 .
The following table summarizes the Company's subsidiary non-recourse debt in default (in millions) as of December 31, 2015 . Due to the defaults, theseamounts are included in the current portion of non-recourse debt:
Primary Nature
of Default December 31, 2015
Subsidiary Default Net Assets
Maritza (Bulgaria) Covenant $ 559 $ 657Sul (Brazil) Covenant 333 439Kavarna (Bulgaria) Covenant 140 74Sogrinsk (Kazakhstan) Covenant $ 6 8Total $ 1,038
As of December 31, 2015 , none of the defaults are payment defaults. All of the subsidiary non-recourse defaults were triggered by failure to comply withother covenants and/or conditions such as (but not limited to) failure to meet information covenants, complete construction or other milestones in an allocated time,meet certain minimum or maximum financial ratios, or other requirements contained in the non-recourse debt documents of the applicable subsidiary.
In the event that there is a default, bankruptcy or maturity acceleration at a subsidiary or group of subsidiaries that meets the applicable definition ofmateriality under the corporate debt agreements of The AES Corporation, there could be a cross-default to the Company's recourse debt. Materiality is defined inthe Parent's senior secured credit facility as having provided 20% or more of the Parent Company's total cash distributions from businesses for the four mostrecently completed fiscal
151

THE AES CORPORATIONNOTES TO CONSOLIDATED FINANCIAL STATEMENTS—(Continued)
DECEMBER 31, 2015, 2014, AND 2013
quarters. As of December 31, 2015 , none of the defaults listed above individually or in the aggregate result in or are at risk of triggering a cross-default under therecourse debt of the Parent Company. In the event the Parent Company is not in compliance with the financial covenants of its senior secured revolving creditfacility, restricted payments will be limited to regular quarterly shareholder dividends at the then-prevailing rate. Payment defaults and bankruptcy defaults wouldpreclude the making of any restricted payments.
Interest Expense — Interest expense for the year ended December 31, 2015 was reduced by $64 million related to the reversal of a monetary correctionpreviously recognized as interest expense at Eletropaulo. This interest expense was on a contingent regulatory liability that was also reversed in the current period.Interest expense for the year ended December 31, 2014 was reduced by approximately $48 million related to reversing contingent interest accruals associated withdisputed purchased energy obligations at Sul for which it was determined, based on developments during 2014, that the likelihood of an unfavorable outcome forthe payment of interest on the disputed obligations was no longer probable. Interest expense for the year ended December 31, 2013 was reduced by approximately$34 million related to the recognition of ineffectiveness on derivative interest rate swaps accounted for as cash flow hedges.
RECOURSE DEBT — The table below summarizes the carrying amount (in millions) and terms of recourse debt of the Company as of the periods indicated:
RECOURSE DEBT Interest Rate Final Maturity December 31, 2015 December 31, 2014Senior Unsecured Note 7.75% 2015 $ — $ 151Senior Unsecured Note 9.75% 2016 — 164Senior Unsecured Note 8.00% 2017 181 525Senior Unsecured Note LIBOR + 3% 2019 775 775Senior Unsecured Note 8.00% 2020 469 625Senior Unsecured Note 7.38% 2021 1,000 1,000Senior Unsecured Note 4.88% 2023 750 750Senior Unsecured Note 5.50% 2024 750 750Senior Unsecured Note 5.50% 2025 575 —Term Convertible Trust Securities 6.75% 2029 517 517Unamortized (Discounts)/Premiums (2) 1SUBTOTAL 5,015 5,258
Less: Current maturities — (151)Total $ 5,015 $ 5,107
The table below summarizes the principal amounts due, net of unamortized discounts, under our recourse debt for the next five years and thereafter inmillions:
December 31, Net Principal Amounts Due2016 $ —2017 1812018 —2019 7742020 469Thereafter 3,591Total recourse debt $ 5,015
In April 2015, the Company issued $575 million aggregate principal amount of 5.50% senior notes due 2025. Concurrent with this offering, the Companyredeemed via tender offers $344 million aggregate principal of its existing 8.00% senior unsecured notes due 2017, and $156 million of its existing 8.00% seniorunsecured notes due 2020. As a result of the latter transaction, the Company recognized a loss on extinguishment of debt of $82 million that is included in theConsolidated Statement of Operations.
In March 2015, the Company redeemed in full the $151 million balance of its 7.75% senior unsecured notes due October 2015 and the $164 million balanceof its 9.75% senior unsecured notes due April 2016. As a result of these transactions, the Company recognized a loss on extinguishment of debt of $23 million thatis included in the Consolidated Statement of Operations.
In February 2014, the Company redeemed in full the $110 million balance of its 7.75% senior unsecured notes due March 2014. On March 7, 2014, theCompany issued $750 million aggregate principal amount of 5.50% senior notes due 2024. Concurrent with this offering, the Company redeemed via tender offers$625 million aggregate principal of its existing 8.00% senior unsecured notes due 2017. As a result of the latter transaction, the Company recognized a loss onextinguishment of debt of $132 million that is included in the Consolidated Statements of Operations.
On May 20, 2014, the Company issued $775 million aggregate principal amount of senior unsecured floating rate notes due June 2019. The notes bearinterest at a rate of 3% above three-month LIBOR, reset quarterly. Concurrent with this offering,
152

THE AES CORPORATIONNOTES TO CONSOLIDATED FINANCIAL STATEMENTS—(Continued)
DECEMBER 31, 2015, 2014, AND 2013
the Company repaid $767 million of its existing senior secured term loan due 2018. As a result of the latter transaction, the Company recognized a loss onextinguishment of debt of $10 million that is included in the Consolidated Statement of Operations. On June 16, 2014, the Company repaid in full the remainingbalance of approximately $29 million of its senior secured term loan due 2018.
On July 25, 2014, the Company issued two notices to call $320 million aggregate principal amount of unsecured notes, $160 million of which was used toretire notes due in 2015 and $160 million of which was used to retire notes due in 2016. The Company closed these transactions on August 25, 2014. As a result ofthis transaction, the Company recognized a loss on extinguishment of debt of $40 million that is included in the Consolidated Statement of Operations.
Recourse Debt Covenants and Guarantees — The Company's obligations under the senior secured credit facility are subject to certain exceptions, secured by (i)all of the capital stock of domestic subsidiaries owned directly by the Company and 65% of the capital stock of certain foreign subsidiaries owned directly orindirectly by the Company; and (ii) certain intercompany receivables, certain intercompany notes and certain intercompany tax sharing agreements.
The senior secured credit facility is subject to mandatory prepayment under certain circumstances, including the sale of certain assets. In such a situation, thenet cash proceeds from the sale must be applied pro rata to repay the term loan, if any, using 60% of net cash proceeds, reduced to 50% when and if the parent'srecourse debt to cash flow ratio is less than 5:1 . The lenders have the option to waive their pro rata redemption.
The senior secured credit facility contains customary covenants and restrictions on the Company's ability to engage in certain activities, including, but notlimited to, limitations on other indebtedness, liens, investments and guarantees; limitations on restricted payments such as shareholder dividends and equityrepurchases; restrictions on mergers and acquisitions, sales of assets, leases, transactions with affiliates and off-balance sheet or derivative arrangements; and otherfinancial reporting requirements.
The senior secured credit facility also contains financial covenants requiring the Company to maintain certain financial ratios including a cash flow to interestcoverage ratio, calculated quarterly, which provides that a minimum ratio of the Company's adjusted operating cash flow to the Company's interest charges relatedto recourse debt of 1.3 × must be maintained at all times and a recourse debt to cash flow ratio, calculated quarterly, which provides that the ratio of the Company'stotal recourse debt to the Company's adjusted operating cash flow must not exceed a maximum of 7.5 ×.
The terms of the Company's senior unsecured notes and senior secured credit facility contain certain covenants including, without limitation, limitation onthe Company's ability to incur liens or enter into sale and leaseback transactions.
TERM CONVERTIBLE TRUST SECURITIES — In 1999, AES Trust III, a wholly-owned special purpose business trust and a VIE, issued approximately10.35 million of $50 par value Term Convertible Preferred Securities ("TECONS") with a quarterly coupon payment of $0.844 for total proceeds of $517 millionand concurrently purchased $517 million of 6.75% Junior Subordinated Convertible Debentures due 2029 (the "6.75% Debentures") issued by AES. The Companyconsolidates AES Trust III in its consolidated financial statements and classifies the TECONS as recourse debt on its Consolidated Balance Sheet. The Company'sobligations under the 6.75% Debentures and other relevant trust agreements, in aggregate, constitute a full and unconditional guarantee by the Company of theTECON Trusts' obligations. As of December 31, 2015 and 2014 , the sole assets of AES Trust III are the 6.75% Debentures.
AES, at its option, can redeem the 6.75% Debentures which would result in the required redemption of the TECONS issued by AES Trust III, currently for$50 per TECON. The TECONS must be redeemed upon maturity of the 6.75% Debentures. The TECONS are convertible into the common stock of AES at eachholder's option prior to October 15, 2029 at the rate of 1.4216 , representing a conversion price of $35.17 per share. The maximum number of shares of commonstock AES would be required to issue should all holders decide to convert their securities would be 14.7 million shares.
Dividends on the TECONS are payable quarterly at an annual rate of 6.75% . The Trust is permitted to defer payment of dividends for up to 20 consecutivequarters, provided that the Company has exercised its right to defer interest payments under the corresponding debentures or notes. During such deferral periods,dividends on the TECONS would accumulate quarterly and accrue interest, and the Company may not declare or pay dividends on its common stock. AES has notexercised the option to defer any dividends at this time and all dividends due under the Trust have been paid.
13 . COMMITMENTS
LEASES —The Company and its subsidiaries enter into long-term non-cancelable lease arrangements which, for accounting purposes, are classified aseither an operating lease or capital lease. Operating leases primarily include certain transmission lines, office rental and site leases. Operating lease rental expensefor the years ended December 31, 2015 , 2014 , and 2013 was $67 million , $58 million and $46 million , respectively. Capital leases primarily includetransmission lines at our
153

THE AES CORPORATIONNOTES TO CONSOLIDATED FINANCIAL STATEMENTS—(Continued)
DECEMBER 31, 2015, 2014, AND 2013
subsidiaries in Brazil, vehicles, and office and other operating equipment. Capital leases are recognized in Property, Plant and Equipment within "Electricgeneration and distribution assets." The gross value of the capital lease assets as of December 31, 2015 and 2014 was $72 million and $80 million , respectively.The table below presents the future minimum lease payments under operating and capital leases for continuing operations together with the present value of the netminimum lease payments under capital leases as of December 31, 2015 for 2016 through 2020 and thereafter, in millions:
Future Commitments for
December 31, Capital Leases Operating Leases2016 $ 14 $ 772017 12 782018 11 792019 10 802020 10 79Thereafter 90 898Total 147 $ 1,291Less: Imputed interest 90 Present value of total minimum lease payments $ 57
CONTRACTS — The Company's operating subsidiaries enter into long-term contracts for construction projects, maintenance and service, transmission ofelectricity, operations services and purchase of electricity and fuel. In general, these contracts are subject to variable quantities or prices and are terminable inlimited circumstances only. Electricity purchase contracts primarily include energy auction agreements at our Brazil subsidiaries with extended terms from 2013through 2028. The table below presents the future minimum commitments for continuing operations under these contracts as of December 31, 2015 for 2016through 2020 and thereafter. Actual purchases under these contracts for the years ended December 31, 2015 , 2014 , and 2013 are also presented, in millions:
Actual purchases during the year ended December 31, Electricity Purchase Contracts Fuel Purchase Contracts Other Purchase Contracts2013 $ 2,665 $ 1,590 $ 1,7432014 3,104 1,521 1,3862015 2,592 1,262 2,121
Future commitments for the year ending December 31, 2016 $ 2,623 $ 1,120 $ 1,3322017 2,444 835 1,0472018 2,634 532 1,0812019 2,799 314 8732020 2,918 311 655Thereafter 24,176 2,141 4,395Total $ 37,594 $ 5,253 $ 9,383
14 . CONTINGENCIES
Guarantees, Letters of Credit — In connection with certain project financing, acquisition and dispositions, power purchase and other agreements, theParent Company has expressly undertaken limited obligations and commitments, most of which will only be effective or will be terminated upon the occurrence offuture events. In the normal course of business, the Parent Company has entered into various agreements, mainly guarantees and letters of credit, to providefinancial or performance assurance to third parties on behalf of AES businesses. These agreements are entered into primarily to support or enhance thecreditworthiness otherwise achieved by a business on a stand-alone basis, thereby facilitating the availability of sufficient credit to accomplish their intendedbusiness purposes. Most of the contingent obligations relate to future performance commitments which the Company or its businesses expect to fulfill within thenormal course of business. The expiration dates of these guarantees vary from less than one year to more than 19 years.
The following table summarizes the Parent Company's contingent contractual obligations as of December 31, 2015 . Amounts presented in the table belowrepresent the Parent Company's current undiscounted exposure to guarantees and the range of maximum undiscounted potential exposure. The maximum exposureis not reduced by the amounts, if any, that could be recovered under the recourse or collateralization provisions in the guarantees. The amounts include obligationsmade by the Parent Company for the direct benefit of the lenders associated with the non-recourse debt of its businesses of $14 million .
Contingent Contractual Obligations Amount Number of Agreements Maximum Exposure Range for Each Agreement
(in millions) (in millions)
Guarantees and commitments $ 369 14 $1 - 53Asset sale related indemnities (1) 27 1 27Cash collateralized letters of credit 32 4 $1 - 15Letters of credit under the senior secured credit facility 62 7 <$1 - 29Total $ 490 26
(1) Excludes normal and customary representations and warranties in agreements for the sale of assets (including ownership in associated legal entities) where the associated risk is considered to be nominal.

As of December 31, 2015 , the Parent Company had no commitments to invest in subsidiaries under construction and to purchase related equipment that werenot included in the letters of credit discussed above. During the year ended December 31, 2015 , the Company paid letter of credit fees ranging from 0.2% to 2.5% per annum on the outstanding amounts of letters of credit.
Environmental — The Company periodically reviews its obligations as they relate to compliance with environmental laws, including site restoration andremediation. As of December 31, 2015 and 2014 the Company had recognized liabilities of $10 million and $12 million , respectively, for projected environmentalremediation costs. Due to the uncertainties associated with environmental assessment and remediation activities, future costs of compliance or remediation could behigher or lower than the amount currently accrued. Moreover, where no liability has been recognized, it is reasonably possible that the Company may be requiredto incur remediation costs or make expenditures in amounts that could be material but could not be estimated as of December 31, 2015 . In aggregate, the Companyestimates that the range of potential losses related to environmental matters, where estimable, to be up to $1 million . The amounts considered reasonably possibledo not include amounts accrued as discussed above.
Litigation — The Company is involved in certain claims, suits and legal proceedings in the normal course of business. The Company accrues for litigationand claims when it is probable that a liability has been incurred and the amount of loss can be reasonably estimated. The Company has evaluated claims inaccordance with the accounting guidance for contingencies that it deems both probable and reasonably estimable and, accordingly, has recorded aggregateliabilities for all claims of approximately $189 million and $199 million as of December 31, 2015 and 2014 , respectively. These amounts are reported on theConsolidated Balance Sheets within Accrued and other liabilities and Other noncurrent liabilities . A significant portion of these accrued liabilities relate toemployment, non-income tax and customer disputes in international jurisdictions (principally Brazil). Certain of the Company's subsidiaries, principally in Brazil,are defendants in a number of labor and employment lawsuits. The complaints generally seek unspecified monetary damages, injunctive relief, or other relief. Thesubsidiaries have denied any liability and intend to vigorously defend themselves in all of these proceedings. There can be no assurance that these accruedliabilities will be adequate to cover all existing and future claims or that we will have the liquidity to pay such claims as they arise.
The Company believes, based upon information it currently possesses and taking into account established accruals for liabilities and its insurance coverage,that the ultimate outcome of these proceedings and actions is unlikely to have a material effect on the Company's consolidated financial statements. However,where no accrued liability has been recognized, it is reasonably possible that some matters could be decided unfavorably to the Company and could require theCompany to pay damages or make expenditures in amounts that could be material but could not be estimated as of December 31, 2015 . The material contingencieswhere a loss is reasonably possible primarily include claims under financing agreements; disputes with offtakers, suppliers and EPC contractors; alleged violationof monopoly laws and regulations; income tax and non-income tax matters with tax authorities; and regulatory matters. In aggregate, the Company estimates thatthe range of potential losses, where estimable, related to these reasonably possible material contingencies to be between $1.1 billion and $1.4 billion . The amountsconsidered reasonably possible do not include amounts accrued, as discussed above. These material contingencies do not include income tax-related contingencieswhich are considered part of our uncertain tax positions.
Regulatory — During 2013, the Company recognized a regulatory liability of $269 million for a contingency related to an administrative ruling whichrequired Eletropaulo to refund customers' amounts related to the regulatory asset base. In 2014, Eletropaulo started refunding customers as part of the tariff. InJanuary 2015, ANEEL updated the tariff to exclude any further customer refunds. On June 30, 2015, ANEEL included in the tariff reset the reimbursement toEletropaulo of these amounts previously refunded to customers to begin in July 2015. During 2015, as a result of favorable events, management reassessed thecontingency and determined that it no longer meets the recognition criteria under ASC 450 — Contingencies . Management believes that it is now only reasonablypossible that Eletropaulo will have to refund these amounts to customers. Accordingly, the Company reversed the remaining regulatory liability for thiscontingency of $161 million in 2015, which increased Regulated Revenue by $97 million and reduced Interest Expense by $64 million . Amounts related to thiscase are now included
154

THE AES CORPORATIONNOTES TO CONSOLIDATED FINANCIAL STATEMENTS—(Continued)
DECEMBER 31, 2015, 2014, AND 2013
as part of our reasonably possible contingent range mentioned in the preceding paragraph.
15 . BENEFIT PLANS
Defined Contribution Plan — The Company sponsors four defined contribution plans ("the Plans"). Two are for U.S. non-union employees, of which one is foremployees of the Parent Company and certain U.S. SBU businesses and one is for DPL employees. One plan includes both union and non-union employees at IPL.One defined contribution plan is for union employees at DPL. The Plans are qualified under section 401 of the Internal Revenue Code. All U.S. employees of theCompany are eligible to participate in the appropriate Plan except for those employees who are covered by a collective bargaining agreement, unless suchagreement specifically provides that the employee is considered an eligible employee under a Plan. The Plans provide matching contributions in AES commonstock or cash, other contributions at the discretion of the Compensation Committee of the Board of Directors in AES common stock or cash and discretionary taxdeferred contributions from the participants. Participants are fully vested in their own contributions and the Company's matching contributions. Participants vest inother company contributions ratably over a five -year period ending on the fifth anniversary of their hire date. For the year ended December 31, 2015 , theCompany's contributions to the defined contribution plans were approximately $18 million , and for the years ended December 31, 2014 and 2013 , contributionswere $22 million and $23 million per year, respectively.
Defined Benefit Plans — Certain of the Company's subsidiaries have defined benefit pension plans covering substantially all of their respective employees.Pension benefits are based on years of credited service, age of the participant and average earnings. Of the 33 active defined benefit plans as of December 31, 2015, 5 are at U.S. subsidiaries and the remaining plans are at foreign subsidiaries .
The following table reconciles the Company's funded status, both domestic and foreign, as of the periods indicated:
December 31, 2015 2014
(in millions) U.S. Foreign U.S. ForeignCHANGE IN PROJECTED BENEFIT OBLIGATION: Benefit obligation as of January 1 $ 1,235 $ 4,363 $ 1,059 $ 4,749Service cost 16 15 14 16Interest cost 48 351 50 489Employee contributions — 3 — 4Plan amendments 5 2 8 (3)Plan settlements (3) — — —Benefits paid (61) (300) (59) (415)Actuarial (gain) loss (68) (160) 163 87Effect of foreign currency exchange rate changes — (1,301) — (564)Benefit obligation as of December 31 $ 1,172 $ 2,973 $ 1,235 $ 4,363CHANGE IN PLAN ASSETS: Fair value of plan assets as of January 1 $ 1,061 $ 3,272 $ 941 $ 3,605Actual return on plan assets (7) 182 123 360Employer contributions 31 89 56 135Employee contributions — 3 — 4Plan settlements (3) — — —Benefits paid (61) (300) (59) (415)Effect of foreign currency exchange rate changes — (962) — (417)Fair value of plan assets as of December 31 $ 1,021 $ 2,284 $ 1,061 $ 3,272RECONCILIATION OF FUNDED STATUS Funded status as of December 31 $ (151) $ (689) $ (174) $ (1,091)
The following table summarizes the amounts recognized on the Consolidated Balance Sheets in millions related to the funded status of the plans, bothdomestic and foreign, as of the periods indicated:
December 31, 2015 2014AMOUNTS RECOGNIZED ON THE CONSOLIDATED BALANCE SHEETS U.S. Foreign U.S. ForeignNoncurrent assets $ — $ 67 $ — $ 51Accrued benefit liability—current — (5) — (4)Accrued benefit liability—noncurrent (151) (751) (174) (1,138)Net amount recognized at end of year $ (151) $ (689) $ (174) $ (1,091)
155

THE AES CORPORATIONNOTES TO CONSOLIDATED FINANCIAL STATEMENTS—(Continued)
DECEMBER 31, 2015, 2014, AND 2013
The next table summarizes the Company's U.S. and foreign accumulated benefit obligation as of the periods indicated (in millions):
December 31, 2015 2014 U.S. Foreign U.S. Foreign Accumulated Benefit Obligation $ 1,150 $ 2,931 $ 1,208 $ 4,301
Information for pension plans with an accumulated benefit obligation in excess of plan assets: Projected benefit obligation $ 1,172 $ 2,683 $ 1,235 $ 4,021 Accumulated benefit obligation 1,150 2,656 1,208 3,979 Fair value of plan assets 1,021 1,931 1,061 2,885
Information for pension plans with a projected benefit obligation in excess of plan assets: Projected benefit obligation $ 1,172 $ 2,697 (1) $ 1,235 $ 4,038 (1)
Fair value of plan assets 1,021 1,942 (1) 1,061 2,897 (1)
(1) $686 million and $1.1 billion of the total net unfunded projected benefit obligation is due to Eletropaulo in Brazil as of December 31, 2015 and 2014, respectively.
The table below summarizes the significant weighted average assumptions used in the calculation of benefit obligation and net periodic benefit cost, bothdomestic and foreign, as of the periods indicated:
December 31, 2015 2014 U.S. Foreign U.S. Foreign Benefit Obligation: Discount rates 4.44% 11.37% (2) 4.04% 10.47% (2)
Rates of compensation increase 3.34% (1) 6.32% 3.94% (1) 6.41% Periodic Benefit Cost: Discount rate 4.04% 10.47% 4.89% 10.80% Expected long-term rate of return on plan assets 6.67% 9.77% 6.92% 10.44% Rate of compensation increase 3.94% (1) 6.41% 3.94% (1) 6.44%
(1) A U.S. subsidiary of the Company has defined benefit obligations of $6 million and $748 million as of December 31, 2015 and 2014 , respectively, for which salary bands, rather than rates of compensation increases, are used todetermine future benefit costs. Rates of compensation increases in the table above do not include amounts related to these specific defined benefit plans. A plan with a defined benefit obligation of $742 million at December 31,2014 and which used salary bands at that date is using a rate of compensation increase as at December 31, 2015. The rate of compensation increase for this plan is included in the weighted average in the above table forcalculating the benefit obligation as at December 31, 2015, but is not included in the weighted average for calculating the benefit obligation as at December 31, 2014 or the periodic benefit cost for 2014 or 2015.
(2) Includes an inflation factor that is used to calculate future periodic benefit cost, but is not used to calculate the benefit obligation.
The Company establishes its estimated long-term return on plan assets considering various factors, which include the targeted asset allocation percentages,historic returns and expected future returns.
The measurement of pension obligations, costs and liabilities is dependent on a variety of assumptions. These assumptions include estimates of the presentvalue of projected future pension payments to all plan participants, taking into consideration the likelihood of potential future events such as salary increases anddemographic experience. These assumptions may have an effect on the amount and timing of future contributions.
The assumptions used in developing the required estimates include the following key factors: discount rates; salary growth; retirement rates; inflation;expected return on plan assets; and mortality rates.
The effects of actual results differing from the Company's assumptions are accumulated and amortized over future periods and, therefore, generally affect theCompany's recognized expense in such future periods.
Effective January 1, 2016 the Company will apply a disaggregated discount rate approach for determining service cost and interest cost for its defined benefitpension plans and post-retirement plans in the U.S. and U.K. Refer to Note 1 — General and Summary of Significant Accounting Policies for further informationrelating to this change in estimate.
Sensitivity of the Company's pension funded status to the indicated increase or decrease in the discount rate and long-term rate of return on plan assetsassumptions is shown below. Note that these sensitivities may be asymmetric and are specific to the base conditions at year-end 2015 . They also may not beadditive, so the impact of changing multiple factors simultaneously cannot be calculated by combining the individual sensitivities shown. The funded status as ofDecember 31, 2015 is affected by the assumptions as of that date. Pension expense for 2015 is affected by the December 31, 2014 assumptions. The impact onpension expense from a one percentage point change in these assumptions is shown in the table below (in millions):
Increase of 1% in the discount rate $ (32)Decrease of 1% in the discount rate 27Increase of 1% in the long-term rate of return on plan assets (36)Decrease of 1% in the long-term rate of return on plan assets 36
156
THE AES CORPORATIONNOTES TO CONSOLIDATED FINANCIAL STATEMENTS—(Continued)
DECEMBER 31, 2015, 2014, AND 2013
The following table summarizes the components of the net periodic benefit cost in millions, both domestic and foreign, for the years indicated:
December 31, 2015 2014 2013
Components of Net Periodic Benefit Cost: U.S. Foreign U.S. Foreign U.S. ForeignService cost $ 16 $ 15 $ 14 $ 16 $ 16 $ 26Interest cost 48 351 50 489 46 515Expected return on plan assets (70) (247) (67) (362) (64) (484)Amortization of prior service cost 7 — 6 (1) 5 —Amortization of net loss 20 28 13 37 23 77Settlement gain recognized — — — 1 — —Total pension cost $ 21 $ 147 $ 16 $ 180 $ 26 $ 134
The following table summarizes in millions the amounts reflected in AOCL including AOCL attributable to noncontrolling interests, on the ConsolidatedBalance Sheet as of December 31, 2015 , that have not yet been recognized as components of net periodic benefit cost and amounts expected to be reclassified toearnings in the next fiscal year:
December 31, 2015 Accumulated Other Comprehensive Income (Loss) Amounts expected to be reclassified to earnings in next fiscalyear
U.S. Foreign U.S. Foreign
Prior service cost $ — $ (5) $ — $ —Unrecognized net actuarial gain (loss) (6) (1,092) — (18)Total $ (6) $ (1,097) $ — $ (18)
The following table summarizes the Company's target allocation for 2015 and pension plan asset allocation, both domestic and foreign, as of the periodsindicated:
Percentage of Plan Assets as of December 31,
Target Allocations 2015 2014
Asset Category U.S. Foreign U.S. Foreign U.S. Foreign
Equity securities 46% 15% -29% 44.76% 13.23% 44.02% 16.28%Debt securities 50% 60% - 85% 50.05% 81.10% 50.90% 78.85%Real estate 2% 0% - 3% 2.94% 3.24% 2.45% 3.15%Other 2% 0% - 5% 2.25% 2.43% 2.63% 1.72%Total pension assets 100.00% 100.00% 100.00% 100.00%
The U.S. plans seek to achieve the following long-term investment objectives:
• maintenance of sufficient income and liquidity to pay retirement benefits and other lump sum payments;• long-term rate of return in excess of the annualized inflation rate;• long-term rate of return, net of relevant fees, that meets or exceeds the assumed actuarial rate; and• long-term competitive rate of return on investments, net of expenses, that equals or exceeds various benchmark rates.
The asset allocation is reviewed periodically to determine a suitable asset allocation which seeks to manage risk through portfolio diversification and takesinto account, among other possible factors, the above-stated objectives, in conjunction with current funding levels, cash flow conditions and economic and industrytrends. The following table summarizes the Company's U.S. plan assets by category of investment and level within the fair value hierarchy in millions as of theperiods indicated:
December 31, 2015 December 31, 2014
U.S. Plans Level 1 Level 2 Level 3 Total Level 1 Level 2 Level 3 TotalEquity securities—
Mutual funds457 — — 457 467 — — 467
Debt securities — Government debt securities 53 — — 53 67 — — 67 Mutual funds (1) 458 — — 458 473 — — 473Real Estate — Real Estate — 30 — 30 — 26 — 26Other — Cash and cash equivalents — — — — 4 — — 4 Other investments — 23 — 23 — 24 — 24 Total plan assets $ 968 $ 53 $ — $ 1,021 $ 1,011 $ 50 $ — $ 1,061
(1) Mutual funds categorized as debt securities consist of mutual funds for which debt securities are the primary underlying investment.
157

THE AES CORPORATIONNOTES TO CONSOLIDATED FINANCIAL STATEMENTS—(Continued)
DECEMBER 31, 2015, 2014, AND 2013
The investment strategy of the foreign plans seeks to maximize return on investment while minimizing risk. The assumed asset allocation has less exposureto equities in order to closely match market conditions and near term forecasts. The following table summarizes the Company's foreign plan assets by category ofinvestment and level within the fair value hierarchy in millions as of the periods indicated:
December 31, 2015 December 31, 2014
Foreign Plans Level 1 Level 2 Level 3 Total Level 1 Level 2 Level 3 TotalEquity securities — Common stock $ 9 $ — $ — $ 9 $ 21 $ — $ — $ 21 Mutual funds 167 — — 167 274 — — 274 Private equity (1) — — 126 126 — — 237 237Debt securities — Certificates of deposit — 2 — 2 — 3 — 3 Unsecured debentures — 5 — 5 — 10 — 10 Government debt securities 11 79 — 90 12 98 — 110 Mutual funds (2) 218 1,535 — 1,753 215 2,236 — 2,451 Other debt securities — 2 — 2 — 6 — 6Real estate — Real estate (1) — — 74 74 — — 103 103Other — Cash and cash equivalents — — — — 1 — — 1 Participant loans (3) — — 37 37 — — 52 52 Other assets 16 — 3 19 — — 4 4 Total plan assets $ 421 $ 1,623 $ 240 $ 2,284 $ 523 $ 2,353 $ 396 $ 3,272
(1) Plan assets of our Brazilian subsidiaries are invested in private equities and commercial real estate through the plan administrator in Brazil. The fair value of these assets is determined using the income approach through annualappraisals based on a discounted cash flow analysis.
(2) Mutual funds categorized as debt securities consist of mutual funds for which debt securities are the primary underlying investment.(3) Loans to participants are stated at cost, which approximates fair value.
The following table presents a reconciliation of all plan assets measured at fair value using significant unobservable inputs (Level 3) in millions for theperiods indicated:
December 31, 2015 2014Balance at January 1 $ 396 $ 530
Actual return on plan assets: Returns relating to assets still held at reporting date (36) (87)
Purchases, sales and settlements, net — 1Transfers of (assets) liabilities into Level 3 — 5Change due to exchange rate changes (120) (53)
Balance at December 31 $ 240 $ 396
The following table summarizes the estimated cash flows for U.S. and foreign expected employer contributions and expected future benefit payments, bothdomestic and foreign in millions:
U.S. ForeignExpected employer contribution in 2016 $ 22 $ 100Expected benefit payments for fiscal year ending: 2016 65 2682017 67 2772018 69 2892019 71 2992020 73 3092021 - 2025 380 1,686
16 . EQUITY
Equity Transactions with Noncontrolling Interests
Brazil Reorganization — In 2015, the Company completed a restructuring of AES Brasiliana. This transaction resulted in no change of ownership or control.The $27 million impact of this equity transaction was recognized in additional paid-in capital.
Gener — On November 18, 2015, the Company sold a 4% stake in AES Gener S.A. ("Gener") through its 99.9% owned subsidiary inversions CachaguaS.p.A ("Cachagua") for $145 million , net of transaction costs. The sale was of previously issued common shares of Gener to certain institutional investors and isnot a sale of in-substance real estate. While the sale decreased Parent ownership interest from 70.7% to 66.7% , the Parent continues to retain its controllingfinancial interest in the subsidiary. The difference of $24 million between the fair value of the consideration received, net of taxes and transaction costs, and theamount by which the NCI is adjusted was recognized in additional paid-in capital. No pretax gain or loss was recognized in net income as a result of this

transaction.
158

THE AES CORPORATIONNOTES TO CONSOLIDATED FINANCIAL STATEMENTS—(Continued)
DECEMBER 31, 2015, 2014, AND 2013
Jordan — On March 15, 2015, the Company executed an agreement to sell 40% of its interest in a wholly-owned subsidiary in Jordan that owns a controllinginterest in the Jordan IPP4 gas-fired plant for $30 million . The sale was completed on February 18, 2016. See Note 30 — Subsequent Events for furtherinformation.
IPALCO — In February 2015, La Caisse de depot et placement du Quebec ("CDPQ") purchased 15% of AES US Investment, Inc., a wholly-ownedsubsidiary that owns 100% of IPALCO Enterprises, Inc. ("IPALCO"), for $247 million , with an option to invest an additional $349 million in IPALCO through2016 in exchange for a 17.65% equity stake. In April 2015, CDPQ invested $214 million of the $349 million in IPALCO, which resulted in CDPQ's combinedequity interest in IPALCO to be 24.90% . Upon investing the remaining commitment of $135 million , CDPQ's equity interests in IPALCO will total 30% .
As a result of these transactions, $84 million in taxes and transaction costs were recognized as a net decrease to equity. The Company also recognized anincrease of $377 million to additional paid-in capital and a reduction to retained earnings of $377 million for the excess of the fair value of the shares over theirbook value. Since the noncontrolling interest is contingently redeemable, the fair value of the consideration received of $460 million , net of proportionaldividends, is classified in temporary equity as redeemable stock of subsidiaries on the Consolidated Balance Sheets. No gain or loss was recognized in net incomeas the sale was not considered to be a sale of in-substance real estate. Any subsequent adjustments to allocate earnings and dividends to CDPQ will be classified asnoncontrolling interest within permanent equity and adjustments to the amount in temporary equity will occur only if and when it is probable that the shares willbecome redeemable. As the Company maintained control after the sale, IPALCO continues to be accounted for as a consolidated subsidiary within the US SBUreportable segment.
Dominican Republic — In December 2014 Estrella and Linda Groups, an investor-based group in the Dominican Republic acquired 8% noncontrollinginterest in our businesses in the Dominican Republic for $83 million , net of transaction costs, with options to acquire an additional 2% for $24 million at any timebetween the closing date and December 31, 2015, and an additional 10% for $125 million at any time between the closing date and December 31, 2016. InDecember 2015, Estrella and Linda Groups exercised its first call option of additional 2% for $18 million , net of discount and transaction costs. This resulted inEstrella and Linda Groups having a total of 10% noncontrolling interest in our businesses in the Dominican Republic.
As a result of these transactions, $29 million and $7 million , net of taxes and transaction costs, was recognized in additional paid-in capital at December 31,2014 and 2015, respectively. No gain or loss was recognized in net income as the sale is not considered to be a sale of in-substance real estate. As the Companymaintained control after the sale, our businesses in the Dominican Republic continue to be consolidated by the Company within the MCAC SBU reportablesegment.
Masinloc — On June 25, 2014, the Company executed an agreement to sell approximately 45% of its interest in Masin-AES Pte Ltd., a wholly-ownedsubsidiary that owns the Company's business interests in the Philippines, for $453 million , subject to certain purchase price adjustments. On July 15, 2014, theCompany completed the Masinloc sale transaction and received cumulative net proceeds of $436 million , including $23 million contingent upon the achievementof certain restructuring efficiencies. The transaction was accounted for as a sale of in-substance real estate. Noncontrolling interest of $130 million and a pretaxgain on sale of investment of approximately $283 million , net of transaction costs, were recognized during the third quarter of 2014. The portion of the proceedsrelated to the contingency has been deferred.
After completion of the sale, the Company owns a 51% net ownership interest in Masinloc and will continue to manage and operate the plant, with 41%owned by Electricity Generating Public Company Limited and 8% owned by the International Finance Corporation. As the Company maintained control after thesale, Masinloc continues to be accounted for as a consolidated subsidiary within the Asia SBU reportable segment.
The following table summarizes the net income attributable to The AES Corporation and all transfers (to) from noncontrolling interests in millions for theperiods indicated:
December 31,
2015 2014
Net income attributable to The AES Corporation $ 306 $ 769
Transfers from the noncontrolling interest:
Net increase in The AES Corporation's paid-in capital for sale of subsidiary shares 323 29
Additional paid-in capital, IPALCO shares, transferred to redeemable stock of subsidiaries (1) (377) —
Increase in The AES Corporation's paid-in capital for purchase of subsidiary shares — 7
Net transfers (to) from noncontrolling interest (54) 36
Change from net income attributable to The AES Corporation and transfers (to) from noncontrolling interests $ 252 $ 805(1) See Note 19 — Redeemable stock of subsidiaries for further information on increase in paid-in capital transferred to redeemable stock of subsidiaries.
159

THE AES CORPORATIONNOTES TO CONSOLIDATED FINANCIAL STATEMENTS—(Continued)
DECEMBER 31, 2015, 2014, AND 2013
Accumulated Other Comprehensive Loss
The changes in AOCL by component, net of tax and noncontrolling interests in millions for the year ended December 31, 2015 were as follows:
Foreign currency translationadjustment, net Unrealized derivative
losses, net Unfunded pensionobligations, net Total
Balance at the beginning of the period $ (2,595) $ (396) $ (295) $ (3,286)Other comprehensive (loss) income before reclassifications (674) (5) 19 (660)Amount reclassified to earnings $ — $ 48 $ 2 50
Other comprehensive (loss) income (674) 43 21 (610)Cumulative effect of a change in accounting principle $ 13 $ — $ — $ 13
Balance at the end of the period (3,256) (353) (274) (3,883)
Reclassifications out of AOCL for the periods indicated were as follows (in millions):
Details About December 31,AOCL Components Affected Line Item in the Consolidated Statements of Operations 2015 2014 2013
Foreign currency translation adjustment, net Gain on sale of businesses $ — $ 4 $ (2) Net loss from disposal and impairments of discontinued operations — (38) (35) Net income attributable to The AES Corporation $ — $ (34) $ (37)Unrealized derivative gains (losses), net Non-regulated revenue $ 43 $ 30 $ (3) Non-regulated cost of sales (14) (4) (7) Interest expense (112) (139) (137) Gain on sale of businesses (4) — (21) Foreign currency transaction gains (losses) 12 (9) (6) Income from continuing operations before taxes and equity in earnings of affiliates (75) (122) (174) Income tax expense 11 26 41 Net equity in earnings of affiliates (2) (3) (6) Income from continuing operations (66) (99) (139) Less: (Income) from continuing operations attributable to noncontrolling interests 18 27 11 Net income attributable to The AES Corporation $ (48) $ (72) $ (128)Amortization of defined benefit pension actuarial loss, net Regulated cost of sales $ (25) $ (33) $ (73) Non-regulated cost of sales 2 (5) (4) General and administrative expenses (2) — (1) Income from continuing operations before taxes and equity in earnings of affiliates (25) (38) (78) Income tax expense 9 7 26 Income from continuing operations (16) (31) (52) Net loss from disposal and impairments of discontinued operations — 2 — Net Income (16) (29) (52) Less: (Income) from continuing operations attributable to noncontrolling interests 14 19 39 Net income attributable to The AES Corporation $ (2) $ (10) $ (13)Total reclassifications for the period, net of income tax and noncontrolling interests $ (50) $ (116) $ (178)_____________________________
(1) Amounts in parentheses indicate debits to the Consolidated Statements of Operations.
Common Stock Dividends — The Company paid dividends of $0.10 per outstanding share to its common stockholders during the first, second, third and fourthquarters of 2015 for dividends declared in December 2014, April 2015, July 2015 and October 2015.
On December 11, 2015, the Board of Directors declared a quarterly common stock dividend of $0.11 per share payable on February 16, 2016 to shareholdersof record at the close of business on February 2, 2016.
Secondary Offering and Concurrent Stock Repurchase — On May 18, 2015, the Parent Company completed an underwritten secondary public offering (the"Offering") of approximately 60 million shares of its common stock by the Terrific Investment Corporation (the "Selling Stockholder"), a subsidiary controlled byChina Investment Corporation at a price of $13.25 per share. Of the 60 million shares, 40 million were sold to the market and 20 million were reserved to berepurchased by the Parent Company. The Parent Company did not receive any of the proceeds from the Offering and the Selling Stockholder has fully sold its stakein AES common stock. Concurrent with this offering, on May 18, 2015, the Parent Company completed the repurchase of the 20 million shares of its common

stock from the Selling Stockholder at a price per share of $13.07 , for an aggregate purchase price of $261 million .
160

THE AES CORPORATIONNOTES TO CONSOLIDATED FINANCIAL STATEMENTS—(Continued)
DECEMBER 31, 2015, 2014, AND 2013
Stock Repurchase Program — In October 2015, the Company's Board of Directors authorized an increase to the Company's common stock repurchase program(the "Program") for up to an additional $400 million of repurchases of the Company's common stock, bringing the cumulative total of authorized repurchases underthe Program to $2.1 billion.
During the year ended December 31, 2015 , the Company repurchased 39.7 million shares of its common stock under the Program at a total cost of $482million under the existing stock repurchase program. The cumulative repurchase from the commencement of the Program in July 2010 through December 31, 2015totaled 145.6 million shares for a total cost of $1.8 billion , at an average price per share of $12.31 (including a nominal amount of commissions). As ofDecember 31, 2015 , $343 million remained available for repurchase under the Program.
The common stock repurchased has been classified as treasury stock and accounted for using the cost method. A total of 149,037,831 and 110,687,849 shareswere held as treasury stock at December 31, 2015 and 2014 , respectively. Restricted stock units under the Company's employee benefit plans are issued fromtreasury stock. The Company has not retired any common stock repurchased since it began the Program in July 2010.
17 . SEGMENTS AND GEOGRAPHIC INFORMATION
The segment reporting structure uses the Company's organizational structure as its foundation to reflect how the Company manages the businesses internally,and is organized by geographic regions which provide better socio-political-economic understanding of our business. The Company is organized by six SBUs ledby our President and Chief Executive Officer: US, Andes, Brazil, MCAC, Europe, and Asia SBUs. Using the accounting guidance on segment reporting, theCompany determined that it has six operating and six reportable segments corresponding to its SBUs.
Corporate and Other — Corporate overhead costs which are not directly associated with the operations of our six reportable segments are included in"Corporate and Other." Also included are certain intercompany charges such as self-insurance premiums which are fully eliminated in consolidation.
The Company uses Adjusted PTC as its primary segment performance measure. Adjusted PTC, a non-GAAP measure, is defined by the Company as pretaxincome from continuing operations attributable to AES excluding unrealized gains or losses related to derivative transactions, unrealized foreign currency gains orlosses, gains or losses due to dispositions and acquisitions of business interests, losses due to impairments and costs due to the early retirement of debt. TheCompany has concluded that Adjusted PTC best reflects the underlying business performance of the Company and is the most relevant measure considered in theCompany's internal evaluation of the financial performance of its segments. Additionally, given its large number of businesses and complexity, the Companyconcluded that Adjusted PTC is a more transparent measure that better assists investors in determining which businesses have the greatest impact on the Company'sresults.
Revenue and Adjusted PTC before intersegment eliminations includes the effect of intercompany transactions with other segments except for interest,charges for certain management fees, and the write-off of intercompany balances, as applicable. All intra-segment activity has been eliminated within the segment.Inter-segment activity has been eliminated within the total consolidated results.
The following tables present financial information by segment for the periods indicated (in millions):
RevenueYear Ended December 31,
Total Revenue Intersegment External Revenue
2015 2014 2013 2015 2014 2013 2015 2014 2013US SBU $ 3,593 $ 3,826 $ 3,630 $ — $ — $ — $ 3,593 $ 3,826 $ 3,630Andes SBU 2,489 2,642 2,639 (10) (4) (1) 2,479 2,638 2,638Brazil SBU 4,666 6,009 5,015 — — — 4,666 6,009 5,015MCAC SBU 2,353 2,682 2,713 (2) (2) (1) 2,351 2,680 2,712Europe SBU 1,191 1,439 1,347 (4) (6) — 1,187 1,433 1,347Asia SBU 684 558 550 — — — 684 558 550Corporate and Other 31 15 7 (28) (13) (8) 3 2 (1)Total Revenue $ 15,007 $ 17,171 $ 15,901 $ (44) $ (25) $ (10) $ 14,963 $ 17,146 $ 15,891
Adjusted Pretax Contribution Year Ended December 31,
Total Adjusted PTC Intersegment External Adjusted PTC
2015 2014 2013 2015 2014 2013 2015 2014 2013US SBU $ 360 $ 445 440 $ 12 $ 10 11 $ 372 $ 455 $ 451Andes SBU 482 421 353 17 6 19 499 427 372Brazil SBU 91 242 212 2 3 3 93 245 215MCAC SBU 327 352 339 18 26 12 345 378 351Europe SBU 235 348 345 5 5 7 240 353 352Asia SBU 96 46 142 3 2 2 99 48 144Corporate and Other (441) (533) (624) (57) (52) (54) (498) (585) (678)Total Adjusted Pretax Contribution 1,150 1,321 1,207 — — — 1,150 1,321 1,207
Reconciliation to Income from Continuing Operations before Taxes and Equity Earnings of Affiliates: Non-GAAP Adjustments: Unrealized derivative gains 166 135 57Unrealized foreign currency losses (96) (110) (41)

Disposition/acquisition gains 42 361 30Impairment losses (504) (416) (588)Loss on extinguishment of debt (183) (274) (225)Pre-tax contribution 575 1,017 440Add: Income from continuing operations before taxes, attributable to noncontrolling interests 652 578 633Less: Net equity in earnings of affiliates 105 19 25Income from continuing operations before taxes and equity in earnings of affiliates $ 1,122 $ 1,576 $ 1,048
161

THE AES CORPORATIONNOTES TO CONSOLIDATED FINANCIAL STATEMENTS—(Continued)
DECEMBER 31, 2015, 2014, AND 2013
Total Assets Depreciation and Amortization Capital Expenditures
Year Ended December 31, 2015 2014 2013 2015 2014 2013 2015 2014 2013US SBU $ 9,844 $ 10,062 $ 9,952 $ 443 $ 450 $ 440 $ 861 $ 534 $ 426Andes SBU 8,744 7,888 7,356 175 182 186 949 702 471Brazil SBU 6,422 8,439 8,388 185 260 259 299 416 588MCAC SBU 4,830 4,948 5,075 155 144 145 201 192 111Europe SBU 3,127 3,525 4,191 134 154 155 118 228 341Asia SBU 3,197 2,972 2,810 32 32 33 13 429 576Assets held-for-sale 96 — 1,718 — (1) 55 — 13 52Corporate and Other 590 1,132 921 20 24 21 17 30 14Total $ 36,850 $ 38,966 $ 40,411 $ 1,144 $ 1,245 $ 1,294 $ 2,458 $ 2,544 $ 2,579
Interest Income Interest Expense
Year Ended December 31, 2015 2014 2013 2015 2014 2013US SBU $ — $ — $ — $ 262 $ 285 $ 290Andes SBU 77 87 37 154 160 135Brazil SBU 299 249 210 349 331 364MCAC SBU 30 26 20 179 178 138Europe SBU 1 1 2 73 98 80Asia SBU 115 2 6 85 25 30Corporate and Other 2 — — 334 394 445Total $ 524 $ 365 $ 275 $ 1,436 $ 1,471 $ 1,482
Investments in and Advances to Affiliates Equity in Earnings (Losses)
Year Ended December 31, 2015 2014 2013 2015 2014 2013US SBU $ 1 $ 1 $ 1 $ — $ — $ —Andes SBU 345 287 248 83 42 44Brazil SBU — — — — — —MCAC SBU — — — — — 4Europe SBU 53 54 286 10 (25) (5)Asia SBU 195 194 186 8 10 10Corporate and Other 16 1 289 4 (8) (28)Total $ 610 $ 537 $ 1,010 $ 105 $ 19 $ 25
The table below presents information, by country, about the Company's consolidated operations for each of the three years ended December 31, 2015 , 2014 ,and 2013 , and as of December 31, 2015 and 2014 in millions. Revenue is recorded in the country in which it is earned and assets are recorded in the country inwhich they are located.
Revenue Property, Plant & Equipment, net
Year Ended December 31, 2015 2014 2013 2015 2014
United States (1) $ 3,597 $ 3,828 $ 3,630 $ 8,028 $ 7,713Non-U.S.:
Brazil 4,666 6,009 5,015 3,286 4,725Chile 1,523 1,624 1,569 4,596 4,012
El Salvador 736 832 860 318 304Dominican Republic 632 802 832 783 702Colombia 557 552 523 446 430Philippines 406 451 497 736 752Argentina 399 463 545 193 222United Kingdom 396 533 558 191 324Mexico 383 434 440 716 733
Bulgaria 382 410 422 1,259 1,457Puerto Rico 302 348 328 599 551

Panama 297 263 250 1,028 1,030Jordan 248 262 142 470 484Vietnam (2)
233 — — 2 1,491Kazakhstan 155 161 156 146 206Sri Lanka 45 107 53 — 7Cameroon (3)
— — — — —Ukraine (4)
— — — — —
Other Non-U.S. (5) 6 67 71 19 8Total Non-U.S. 11,366 13,318 12,261 14,788 17,438Total $ 14,963 $ 17,146 $ 15,891 $ 22,816 $ 25,151
(1) Excludes revenue of $2 million and $ 23 million for the years ended December 31, 2014 and 2013 , respectively, related to Condon and Mid-West Wind, which are reflected as discontinued operations in the accompanyingConsolidated Statements of Operations.
(2)
Property, plant & equipment as of December 31, 2015 includes the impact of adopting ASU No. 2014-05, Service Concession Arrangements , on a modified retrospective basis as of January 1, 2015. See Note 1 — General andSummary of Significant Accounting Policies for more information.
(3) Excludes revenue of $ 230 million and $ 473 million for the years ended December 31, 2014 and 2013 , respectively, related to Sonel, which is reflected as discontinued
162

THE AES CORPORATIONNOTES TO CONSOLIDATED FINANCIAL STATEMENTS—(Continued)
DECEMBER 31, 2015, 2014, AND 2013
operations in the accompanying Consolidated Statements of Operations.(4) Excludes revenue of $ 187 million for the years ended December 31, 2013 related to Kievoblenergo and Rivnooblenergo, which are reflected as discontinued operations in the accompanying Consolidated Statements of Operations.(5) Excludes revenue of $ 6 million for the years ended December 31, 2013 related to Saurashtra, which is reflected as discontinued operations in the accompanying Consolidated Statements of Operations.
18 . SHARE-BASED COMPENSATION
STOCK OPTIONS — AES grants options to purchase shares of common stock under stock option plans to employees and non-employee directors. Underthe terms of the plans, the Company may issue options to purchase shares of the Company's common stock at a price equal to 100% of the market price at the datethe option is granted. Stock options are generally granted based upon a percentage of an employee's base salary. Stock options issued under these plans in 2015 ,2014 and 2013 have a three -year vesting schedule and vest in one-third increments over the three -year period. The stock options have a contractual term of tenyears. At December 31, 2015 , approximately 16 million shares were remaining for award under the plans. In all circumstances, stock options granted by AES donot entitle the holder the right, or obligate AES, to settle the stock option in cash or other assets of AES.
The following table presents the weighted average fair value of each option grant and the underlying weighted average assumptions, as of the grant date,using the Black-Scholes option-pricing model:
December 31, 2015 2014 2013
Expected volatility 25% 24% 23%Expected annual dividend yield 3% 1% 1%Expected option term (years) 7 6 6Risk-free interest rate 1.86% 1.86% 1.13%Fair value at grant date $ 2.07 $ 3.26 $ 2.23
The Company does not discount the grant date fair values to estimate post-vesting restrictions. Post-vesting restrictions include black-out periods when theemployee is not able to exercise stock options based on their potential knowledge of information prior to the release of that information to the public.
163

THE AES CORPORATIONNOTES TO CONSOLIDATED FINANCIAL STATEMENTS—(Continued)
DECEMBER 31, 2015, 2014, AND 2013
The following table summarizes the components of stock-based compensation related to employee stock options recognized in the Company's consolidatedfinancial statements in millions:
December 31, 2015 2014 2013
Pretax compensation expense $ 3 $ 3 $ 2Tax benefit (1) (1) (1)Stock options expense, net of tax $ 2 $ 2 $ 1Total intrinsic value of options exercised $ 1 $ 1 $ 5Total fair value of options vested 3 2 2Cash received from the exercise of stock options 5 3 13
No cash was used to settle stock options or compensation cost capitalized as part of the cost of an asset for the years ended December 31, 2015 , 2014 and2013 . As of December 31, 2015 , $4 million of total unrecognized compensation cost related to stock options is expected to be recognized over a weighted averageperiod of 1.8 years.
A summary of the option activity for the year ended December 31, 2015 follows (number of options in thousands, dollars in millions except per optionamounts):
Options Weighted AverageExercise Price Weighted Average Remaining
Contractual Term (in years) Aggregate Intrinsic Value
Outstanding at December 31, 2014 7,062 $ 14.83 Exercised (419) 10.76 Forfeited and expired (1,347) 17.49 Granted 1,859 11.89 Outstanding at December 31, 2015 7,155 $ 13.81 6 $ 1Vested and expected to vest at December 31, 2015 6,771 $ 13.88 5.8 $ 1Eligible for exercise at December 31, 2015 4,292 $ 14.70 4.1 $ 1
The aggregate intrinsic value in the table above represents the total pre-tax intrinsic value (the difference between the Company's closing stock price on thelast trading day of 2015 and the exercise price, multiplied by the number of in-the-money options) that would have been received by the option holders had alloption holders exercised their options on December 31, 2015 . The amount of the aggregate intrinsic value will change based on the fair market value of theCompany's stock.
The Company initially recognizes compensation cost on the estimated number of instruments for which the requisite service is expected to be rendered. In2015 , AES has estimated a weighted average forfeiture rate of 15.28% for stock options granted in 2015 . This estimate will be revised if subsequent informationindicates that the actual number of instruments forfeited is likely to differ from previous estimates. Based on the estimated forfeiture rate, the Company expects toexpense $3.3 million on a straight-line basis over a three year period (approximately $1.1 million per year) related to stock options granted during the year endedDecember 31, 2015 .
RESTRICTED STOCK
Restricted Stock Units — The Company issues restricted stock units ("RSUs") under its long-term compensation plan. The RSUs are generally grantedbased upon a percentage of the participant's base salary. The units have a three -year vesting schedule and vest in one-third increments over the three -year period.Units granted prior to 2011 are required to be held for an additional two years before they can be converted into shares, and thus become transferable. There is nosuch requirement for units granted in 2011 and afterwards. In all circumstances, restricted stock units granted by AES do not entitle the holder the right, or obligateAES, to settle the restricted stock unit in cash or other assets of AES.
For the years ended December 31, 2015 , 2014 , and 2013 , RSUs issued had a grant date fair value equal to the closing price of the Company's stock on thegrant date. The Company does not discount the grant date fair values to reflect any post-vesting restrictions. RSUs granted to employees during the years endedDecember 31, 2015 , 2014 , and 2013 had grant date fair values per RSU of $12.03 , $14.60 and $11.19 , respectively.
The following table summarizes the components of the Company's stock-based compensation related to its employee RSUs recognized in the Company'sconsolidated financial statements in millions:
December 31, 2015 2014 2013RSU expense before income tax $ 13 $ 12 $ 12Tax benefit (3) (3) (3)RSU expense, net of tax $ 10 $ 9 $ 9
Total value of RSUs converted (1) $ 16 $ 25 $ 10Total fair value of RSUs vested $ 12 $ 13 $ 12
(1) Amount represents fair market value on the date of conversion.
There was no cash used to settle RSUs or compensation cost capitalized as part of the cost of an asset for the years ended
164

THE AES CORPORATIONNOTES TO CONSOLIDATED FINANCIAL STATEMENTS—(Continued)
DECEMBER 31, 2015, 2014, AND 2013
December 31, 2015 , 2014 , and 2013 . As of December 31, 2015 , $16 million of total unrecognized compensation cost related to RSUs is expected to berecognized over a weighted average period of approximately 1.9 years. There were no modifications to RSU awards during the year ended December 31, 2015 .
A summary of the activity of RSUs for the year ended December 31, 2015 follows (number of RSUs in thousands):
RSUs Weighted Average Grant Date
Fair Values Weighted Average Remaining
Vesting TermNonvested at December 31, 2014 1,997 $ 13.20 Vested (954) 13.01 Forfeited and expired (236) 12.71 Granted 1,585 12.03 Nonvested at December 31, 2015 2,392 $ 12.55 1.7Vested at December 31, 2015 — $ — Vested and expected to vest at December 31, 2015 2,105 $ 12.55
The Company initially recognizes compensation cost on the estimated number of instruments for which the requisite service is expected to be rendered. In2015 , AES has estimated a weighted average forfeiture rate of 13.53% for RSUs granted in 2015 . This estimate will be revised if subsequent information indicatesthat the actual number of instruments forfeited is likely to differ from previous estimates. Based on the estimated forfeiture rate, the Company expects to expense$16 million on a straight-line basis over a three year period related to RSUs granted during the year ended December 31, 2015 .
The table below summarizes the RSUs that vested and were converted during the years ended December 31, 2015 , 2014 , and 2013 (number of RSUs inthousands):
2015 2014 2013RSUs vested during the year 954 1,037 942RSUs converted during the year, net of shares withheld for taxes 1,238 1,734 905Shares withheld for taxes 549 796 407
Performance Stock Units — The Company issues performance stock units ("PSUs") to officers under its long-term compensation plan. PSUs are restrictedstock units of which 50% of the units awarded include a market condition and the remaining 50% include a performance condition. Vesting will occur if theapplicable continued employment conditions are satisfied and (a) for the units subject to the market condition the Total Stockholder Return ("TSR") onAES common stock exceeds the TSR of the Standard and Poor's 500 Utilities Sector Index over the three -year measurement period beginning on January 1 of thegrant year and ending on December 31 of the third year and (b) for the units subject to the performance condition if the Company's actual Adjusted EBITDA meetsthe performance target over the three -year measurement period beginning on January 1 of the grant year and ending on December 31 of the third year. The marketand performance conditions determine the vesting and final share equivalent per PSU and can result in earning an award payout range of 0% to 200% , dependingon the achievement. In all circumstances, PSUs granted by AES do not entitle the holder the right, or obligate AES, to settle the restricted stock unit in cash orother assets of AES.
The effect of the market condition on PSUs issued to officers of the Company during 2015 is reflected in the award's fair value on the grant date. The resultsof the valuation estimated the fair value at $8.22 per share, equating to 69% of the Company's closing stock price on the date of grant. PSUs that included a marketcondition granted during the year ended December 31, 2015 , 2014 , and 2013 had a grant date fair value per RSU of $8.22 , $15.19 and $13.28 , respectively. Thefair value of the PSUs with a performance condition had a grant date fair value of $11.89 equal to the closing price of the Company's stock on the grant date. TheCompany believes that it is probable that the performance condition will be met; this will continue to be evaluated throughout the performance period. If the fairvalue of the market condition was not applied to PSUs issued to officers, the total grant date fair value of PSUs granted during the year ended December 31, 2015would have increased by $1.1 million .
Restricted stock units with a market condition awarded to officers of the Company prior to 2011 contained only the market condition measuring the TSR onAES common stock. These units were required to be held for an additional two years subsequent to vesting before they could be converted into shares and becometransferable. There is no such requirement for the shares granted during 2011 and afterwards.
165

THE AES CORPORATIONNOTES TO CONSOLIDATED FINANCIAL STATEMENTS—(Continued)
DECEMBER 31, 2015, 2014, AND 2013
The following table summarizes the components of the Company's stock-based compensation related to its PSUs recognized in the Company's consolidatedfinancial statements in millions:
December 31, 2015 2014 2013PSU expense before income tax $ 5 $ 6 $ 4Tax benefit (1) (2) (1)PSU expense, net of tax $ 4 $ 4 $ 3
Total value of PSUs converted (1) $ 1 $ 4 $ —Total fair value of PSUs vested 3 1 —
(1) Amount represents fair market value on the date of conversion.
There was no cash used to settle PSUs or compensation cost capitalized as part of the cost of an asset for the years ended December 31, 2015 , 2014 , and2013 . As of December 31, 2015 , $7 million of total unrecognized compensation cost related to PSUs is expected to be recognized over a weighted average periodof approximately 1.7 years. There were no modifications to PSU awards during the year ended December 31, 2015 .
A summary of the activity of PSUs for the year ended December 31, 2015 follows (number of PSUs in thousands):
PSUs Weighted Average Grant DateFair Values Weighted Average Remaining
Vesting Term
Nonvested at December 31, 2014 1,331 $ 14.27 Vested (161) 16.73 Forfeited and expired (245) 15.27 Granted 626 10.06 Nonvested at December 31, 2015 1,551 $ 12.16 1.2Vested at December 31, 2015 — $ — Vested and expected to vest at December 31, 2015 1,298 11.92
The Company initially recognizes compensation cost on the estimated number of instruments for which the requisite service is expected to be rendered. In2015 , AES has estimated a forfeiture rate of 15.28% for PSUs granted in 2015. This estimate will be revised if subsequent information indicates that the actualnumber of instruments forfeited is likely to differ from previous estimates. Based on the estimated forfeiture rate, the Company expects to expense $5 million on astraight-line basis over a three year period (approximately $1.8 million per year) related to PSUs granted during the year ended December 31, 2015 .
The table below summarizes the PSUs that vested and were converted during the years ended December 31, 2015 , 2014 , and 2013 (number of PSUs inthousands):
2015 2014 2013PSUs vested during the year 161 85 —PSUs converted during the year, net of shares withheld for taxes 96 287 —Shares withheld for taxes 65 141 —
19 . REDEEMABLE STOCK OF SUBSIDIARIES
The following table summarizes the Company's redeemable stock of subsidiaries balances as of the periods indicated:
December 31,
Redeemable stock of subsidiaries (in millions) 2015 2014
Additional paid-in capital, IPALCO shares $ 377 $ —
Book value, IPALCO shares - noncontrolling interest 83 —
Total fair value of consideration received (1) 460 —
IPL cumulative preferred stock 60 60
DPL cumulative preferred stock 18 18
Total cumulative preferred stock of subsidiaries (2) 78 78
Total redeemable stock of subsidiaries $ 538 $ 78(1) See Note 16— Equity for further information on IPALCO equity transactions with noncontrolling interests.(2) Refer below for further information on outstanding shares of cumulative preferred stock of subsidiaries.
Our subsidiaries IPL and DPL had outstanding shares of cumulative preferred stock of $78 million at December 31, 2015 and 2014 .
IPL — IPL had $60 million of cumulative preferred stock outstanding at December 31, 2015 and 2014 , which represented five series of preferred stock. Thetotal annual dividend requirements were approximately $3 million at December 31, 2015 and 2014 . Certain series of the preferred stock were redeemable solely atthe option of the issuer at prices between $100 and $118 per share. Holders of the preferred stock are entitled to elect a majority of IPL's board of directors if IPLhas not paid dividends
166
THE AES CORPORATIONNOTES TO CONSOLIDATED FINANCIAL STATEMENTS—(Continued)
DECEMBER 31, 2015, 2014, AND 2013
to its preferred stockholders for four consecutive quarters. Based on the preferred stockholders' ability to elect a majority of IPL's board of directors in thiscircumstance, the redemption of the preferred shares is considered to be not solely within the control of the issuer and the preferred stock is considered temporaryequity and presented in the mezzanine level of the Consolidated Balance Sheets in accordance with relevant accounting guidance for noncontrolling interests andredeemable securities.
DPL — DPL had $18 million of cumulative preferred stock outstanding at December 31, 2015 and 2014 , which represented three series of preferred stockissued by DP&L, a wholly-owned subsidiary of DPL. The total annual dividend requirements were approximately $1 million at December 31, 2015 and 2014. TheDP&L preferred stock may be redeemed at DP&L's option as determined by its board of directors at per-share redemption prices between $101 and $103 per share,plus cumulative preferred dividends. In addition, DP&L's Amended Articles of Incorporation contain provisions that permit preferred stockholders to electmembers of the DP&L Board of Directors in the event that cumulative dividends on the preferred stock are in arrears in an aggregate amount equivalent to at leastfour full quarterly dividends. Based on the preferred stockholders' ability to elect members of DP&L's board of directors in this circumstance, the redemption of thepreferred shares is considered to be not solely within the control of the issuer and the preferred stock is considered temporary equity and presented in themezzanine level of the Consolidated Balance Sheets in accordance with the relevant accounting guidance for noncontrolling interests and redeemable securities.
20 . OTHER INCOME AND EXPENSE
Other Income — Other income generally includes gains on asset sales and liability extinguishments, favorable judgments on contingencies, gains on contractterminations, and other income from miscellaneous transactions. The components are summarized as follows (in millions):
Years Ended December 31, 2015 2014 2013Contract termination $ 20 $ — $ 60Gain on sale of assets 19 68 12Allowance for Funds Used During Construction (US Utilities) 17 9 6Contingency reversal — 18 10Gain on extinguishment of tax and other liabilities — — 9Other 27 29 28Total other income $ 83 $ 124 $ 125
Other Expense — Other expense generally includes losses on asset sales and dispositions, losses on legal contingencies, and losses from other miscellaneoustransactions. The components are summarized as follows (in millions):
Years Ended December 31, 2015 2014 2013Loss on sale and disposal of assets $ 48 $ 47 $ 51Legal contingency 9 11 9Contract termination — — 7Other 8 10 9Total other expense $ 65 $ 68 $ 76
21 . ASSET IMPAIRMENT EXPENSE
Years ended December 31, 2015 2014 2013 (in millions)
Kilroot $ 121 $ — $ —Buffalo Gap III 116 — —U.K. Wind 37 12 —Ebute — 67 —East Bend (DP&L) — 12 —Beaver Valley — — 46Conesville (DP&L) — — 26Itabo (San Lorenzo) — — 16Other 11 — 7Total asset impairment expense $ 285 $ 91 $ 95
Kilroot — During 2015, the Company tested the recoverability of long-lived assets at Kilroot, a coal- and oil-fired plant in the U.K., when the regulatorestablished lower capacity prices for the Irish Single Electricity Market. The Company determined that the carrying amount of the asset group was not recoverable.The Kilroot asset group was determined to have a fair value of $70 million using the income approach. As a result, the Company recognized asset impairmentexpense of $121 million . Kilroot is reported in the Europe SBU reportable segment.
167
THE AES CORPORATIONNOTES TO CONSOLIDATED FINANCIAL STATEMENTS—(Continued)
DECEMBER 31, 2015, 2014, AND 2013
Buffalo Gap III — During 2015, the Company tested the recoverability of its long-lived assets at Buffalo Gap III, a wind farm in Texas. Impairmentindicators were identified based on a decline in forward power curves coupled with the near term expiration of favorable contracted cash flows. The Companydetermined that the carrying amount was not recoverable. The Buffalo Gap III asset group was determined to have a fair value of $118 million using the incomeapproach. As a result, the Company recognized asset impairment expense of $116 million . Buffalo Gap III is reported in the US SBU reportable segment.
U.K. Wind (Development Projects) — During 2015, the Company decided to no longer pursue two wind projects in the U.K. based on recent regulatoryclarifications specific to these projects, resulting in a full impairment. Impairment indicators were also identified at four other wind projects based on their currentdevelopment status and a reassessment of the likelihood that each project would be pursued given aviation concerns, regulatory changes, economic considerationsand other factors. The Company determined that the carrying amounts of each of these asset groups, which totaled $38 million , were not recoverable. In aggregate,the asset groups were determined to have a fair value of $1 million using the market approach and, as a result, the Company recognized asset impairment expenseof $37 million . The U.K. Wind (Development Projects) are reported in the Europe SBU reportable segment.
Ebute — During 2014, the Company identified impairment indicators at Ebute in Nigeria, resulting from the continued lack of gas supply, the increasedlikelihood of selling the asset group before the end of its useful life, and indications about the potential proceeds that could be received from a future sale. TheCompany determined that the carrying amount of the asset group was not recoverable. The Company recognized asset impairment of $67 million , which representsthe difference between the carrying amount of $103 million and fair value less cost to sell of $36 million . In November 2014, the Company completed the sale ofits interest in Ebute. See Note 24 — Dispositions for additional details. Prior to its sale, Ebute was reported in the Europe SBU reportable segment.
U.K. Wind (Newfield) — During 2014, the Company tested the recoverability of long-lived assets at its Newfield wind development project in the U.K. aftertheir government refused to grant a permit necessary for the project to continue. The Company determined that the carrying amount of the asset group was notrecoverable. The Newfield asset group was determined to have no fair value using the income approach. As a result, the Company recognized asset impairmentexpense of $12 million . U.K. Wind (Newfield) is reported in the Europe SBU reportable segment.
East Bend (DP&L) — During 2014, the Company identified impairment indicators at East Bend, a coal-fired plant in Ohio jointly owned by DP&L, resultingfrom the increased likelihood that the asset group would be disposed prior to the end of its useful life. The Company determined that the carrying amount of theasset group was not recoverable. The East Bend asset group was determined to have a fair value of $2 million using the market approach, and the Companyrecognized asset impairment expense of $12 million . The Company's interest in East Bend was sold in December 2014. Prior to its sale, East Bend was reported inthe US SBU reportable segment.
Beaver Valley — During 2013, Beaver Valley, a wholly-owned coal-fired plant in Pennsylvania, entered into an agreement to early terminate its PPA withthe offtaker in exchange for a lump-sum payment of $60 million . The termination of the PPA resulted in a significant reduction in the future cash flows of the assetgroup and was considered an impairment indicator. The carrying amount of the asset group was not recoverable. The carrying amount of the asset group exceededthe fair value of the asset group, resulting in asset impairment expense of $46 million . Beaver Valley is reported in the US SBU reportable segment.
Conesville (DP&L) — During 2013, the Company tested the recoverability of long-lived assets at Conesville, a coal-fired plant in Ohio jointly-owned byDP&L. Gradual decreases in power prices as well as lower estimates of future capacity prices in conjunction with the DP&L reporting unit failing Step 1 of theannual goodwill impairment test were determined to be impairment indicators. The Company performed a long-lived asset impairment test and determined that thecarrying amount of the asset group was not recoverable. The Conesville asset group was determined to have zero fair value using discounted cash flows under theincome approach. As a result, the Company recognized asset impairment expense of $26 million . Conesville is reported in the US SBU reportable segment.
Itabo (San Lorenzo) — During 2013, the Company tested the recoverability of long-lived assets at San Lorenzo, a LNG fueled plant of Itabo. Itabo wasinformed by Super-Intendencia de Electridad ("SIE"), the system regulator in the Dominican Republic, that it would not receive capacity revenue going forward.This communication in combination with current adverse market conditions were determined to be an impairment indicator. The Company performed a long-livedasset impairment test considering different scenarios and determined that, based on undiscounted cash flows, the carrying amount of San Lorenzo was notrecoverable. The fair value of San Lorenzo was determined using the market approach based on a broker quote and it was determined that its carrying amount of$23 million exceeded the estimated fair value of $7 million . As a result, the Company recognized asset impairment expense of $16 million . Itabo is reported in theMCAC SBU reportable segment.
168

THE AES CORPORATIONNOTES TO CONSOLIDATED FINANCIAL STATEMENTS—(Continued)
DECEMBER 31, 2015, 2014, AND 2013
22 . INCOME TAXES
Income Tax Provision — The next table summarizes the expense for income taxes on continuing operations in millions for the periods indicated:
December 31, 2015 2014 2013Federal — Current $ 9 $ — $ (28) Deferred (56) (121) (110)State — Current 1 1 1 Deferred (5) 1 1Foreign — Current 505 457 509 Deferred 11 81 (30)
Total $ 465 $ 419 $ 343
Effective and Statutory Rate Reconciliation — The following table summarizes a reconciliation of the U.S. statutory federal income tax rate to theCompany's effective tax rate, as a percentage of income from continuing operations before taxes for the periods indicated:
December 31, 2015 2014 2013Statutory Federal tax rate 35 % 35 % 35 %State taxes, net of Federal tax benefit (5)% (1)% (3)%Taxes on foreign earnings 3 % (14)% (4)%Valuation allowance (5)% (1)% — %Uncertain tax positions — % — % (5)%Bad debt deduction — % — % (3)%Change in tax law — % 4 % (1)%Goodwill impairment 10 % 4 % 12 %Other—net 3 % — % 2 %Effective tax rate 41 % 27 % 33 %
Included in the favorable (14)% 2014 taxes on foreign earnings percentage above is approximately (8)% related to the sale of approximately 45% of theCompany's interest in Masin AES Pte Ltd., which owns the Company's interests in the Philippines, and the sale of the Company's interests in four U.K. windprojects. Neither of these transactions gave rise to income tax expense.
Income Tax Receivables and Payables — The current income taxes receivable and payable are included in Other Current Assets and Accrued and OtherLiabilities , respectively, on the accompanying Consolidated Balance Sheets. The noncurrent income taxes receivable and payable are included in Other NoncurrentAssets and Other Noncurrent Liabilities, respectively, on the accompanying Consolidated Balance Sheets. The next table summarizes the income taxes receivableand payable in millions as of December 31, 2015 and 2014 :
2015 2014Income taxes receivable—current $ 167 $ 217
Total income taxes receivable $ 167 $ 217Income taxes payable—current $ 264 $ 299Income taxes payable—noncurrent 35 2
Total income taxes payable $ 299 $ 301
Deferred Income Taxes — Deferred income taxes reflect the net tax effects of (a) temporary differences between the carrying amounts of assets andliabilities for financial reporting purposes and the amounts used for income tax purposes and (b) operating loss and tax credit carryforwards. These items are statedat the enacted tax rates that are expected to be in effect when taxes are actually paid or recovered.
As of December 31, 2015 , the Company had federal net operating loss carryforwards for tax purposes of approximately $3.5 billion expiring in years 2021to 2034. Approximately $87 million of the net operating loss carryforward related to stock option deductions will be recognized in additional paid-in capital whenrealized. The Company also had federal general business tax credit carryforwards of approximately $18 million expiring primarily from 2021 to 2035, and federalalternative minimum tax credits of approximately $5 million that carry forward without expiration. The Company had state net operating loss carryforwards as ofDecember 31, 2015 of approximately $8.4 billion expiring in years 2016 to 2035. As of December 31, 2015 , the Company had foreign net operating losscarryforwards of approximately $3.5 billion that expire at various times beginning in 2016 and some of which carry forward without expiration, and tax creditsavailable in foreign jurisdictions of approximately $32 million , $24 million of which expire in 2021 and $8 million of which carryforward without expiration.
169

THE AES CORPORATIONNOTES TO CONSOLIDATED FINANCIAL STATEMENTS—(Continued)
DECEMBER 31, 2015, 2014, AND 2013
Valuation allowances decreased $103 million during 2015 to $894 million at December 31, 2015 . This net decrease was primarily the result of foreignexchange losses and valuation allowance releases at certain of our Brazil and Vietnam subsidiaries.
Valuation allowances decreased $93 million during 2014 to $997 million at December 31, 2014 . This net decrease was primarily the result of valuationallowance activity at certain of our Brazil subsidiaries and the release of valuation allowance against U.S. capital loss carryforwards.
The Company believes that it is more likely than not that the net deferred tax assets as shown below will be realized when future taxable income is generatedthrough the reversal of existing taxable temporary differences and income that is expected to be generated by businesses that have long-term contracts or a historyof generating taxable income. The Company continues to monitor the utilization of its deferred tax asset for its U.S. consolidated net operating loss carryforward.Although management believes it is more likely than not that this deferred tax asset will be realized through generation of sufficient taxable income prior toexpiration of the loss carryforwards, such realization is not assured.
The following table summarizes the deferred tax assets and liabilities in millions, as of December 31, 2015 and 2014 :
2015 2014Differences between book and tax basis of property $ (2,240) $ (2,364)Other taxable temporary differences (299) (302)Total deferred tax liability (2,539) (2,666)Operating loss carryforwards 2,206 2,224Capital loss carryforwards 66 137Bad debt and other book provisions 191 221Retirement costs 149 275Tax credit carryforwards 55 58Other deductible temporary differences 219 363Total gross deferred tax asset 2,886 3,278Less: valuation allowance (894) (997)Total net deferred tax asset 1,992 2,281Net deferred tax (liability) $ (547) $ (385)
The Company considers undistributed earnings of certain foreign subsidiaries to be indefinitely reinvested outside of the U.S. and, accordingly, noU.S. deferred taxes have been recorded with respect to such earnings in accordance with the relevant accounting guidance for income taxes. Should the earnings beremitted as dividends, the Company may be subject to additional U.S. taxes, net of allowable foreign tax credits. It is not practicable to estimate the amount of anyadditional taxes which may be payable on the undistributed earnings.
Income from operations in certain countries is subject to reduced tax rates as a result of satisfying specific commitments regarding employment and capitalinvestment. The Company's income tax benefits related to the tax status of these operations are estimated to be $21 million , $38 million and $70 million for theyears ended December 31, 2015 , 2014 and 2013 , respectively. The per share effect of these benefits after noncontrolling interests was $0.02 , $0.04 and $0.09 forthe years ended December 31, 2015 , 2014 and 2013 , respectively.
The Company's business in Vietnam began commercial operations in 2015. As part of its power purchase contract with the Vietnam government, thebusiness will be subject to the following reduced income tax rates: 0% for four years, followed by 5% for nine years, followed by 10% for the remaining life of thecontract term. See Item 1 . — Business — Our Organization and Segments for additional information regarding the power purchase contract.
The benefit related to our operations in Vietnam is estimated to be $8 million for the year ended December 31, 2015. The per share effect of these benefitsafter noncontrolling interest was $0.01 for the year ended December 31, 2015.
The following table summarizes the income (loss) from continuing operations, before income taxes, net equity in earnings of affiliates and noncontrollinginterests in millions, for the years ended December 31, 2015 , 2014 and 2013 :
2015 2014 2013U.S. $ (612) $ (560) $ (575)Non-U.S. 1,734 2,136 1,623
Total $ 1,122 $ 1,576 $ 1,048
Uncertain Tax Positions — Uncertain tax positions have been classified as noncurrent income tax liabilities unless expected to be paid in one year. TheCompany's policy for interest and penalties related to income tax exposures is to recognize interest and penalties as a component of the provision for income taxesin the Consolidated Statements of Operations.
170

THE AES CORPORATIONNOTES TO CONSOLIDATED FINANCIAL STATEMENTS—(Continued)
DECEMBER 31, 2015, 2014, AND 2013
As of December 31, 2015 and 2014 , the total amount of gross accrued income tax related interest included in the Consolidated Balance Sheets was $8million and $14 million , respectively. The total amount of gross accrued income tax related penalties included in the Consolidated Balance Sheets as ofDecember 31, 2015 and 2014 was $0 million and $1 million , respectively.
The total expense (benefit) for interest related to unrecognized tax benefits for the years ended December 31, 2015 , 2014 and 2013 amounted to $0 million ,$3 million and $(4) million , respectively. For the years ended December 31, 2015 , 2014 and 2013 , the total expense (benefit) for penalties related tounrecognized tax benefits amounted to $0 million , $0 million and $(3) million , respectively.
We are potentially subject to income tax audits in numerous jurisdictions in the U.S. and internationally until the applicable statute of limitations expires. Taxaudits by their nature are often complex and can require several years to complete. The following is a summary of tax years potentially subject to examination inthe significant tax and business jurisdictions in which we operate:
Jurisdiction Tax Years Subject to ExaminationArgentina 2009-2015Brazil 2010-2015Chile 2012-2015Colombia 2013-2015Dominican Republic 2012-2015El Salvador 2012-2015Netherlands 2013-2015Philippines 2012-2015United Kingdom 2010-2015United States (Federal) 2011-2015
As of December 31, 2015 , 2014 and 2013 , the total amount of unrecognized tax benefits was $373 million , $395 million and $392 million , respectively.The total amount of unrecognized tax benefits that would benefit the effective tax rate as of December 31, 2015 , 2014 and 2013 is $343 million , $366 million and$360 million , respectively, of which $24 million , $24 million and $26 million , respectively, would be in the form of tax attributes that would warrant a fullvaluation allowance.
The total amount of unrecognized tax benefits anticipated to result in a net decrease to unrecognized tax benefits within 12 months of December 31, 2015 isestimated to be between $15 million and $25 million , primarily relating to statute of limitation lapses and tax exam settlements.
Next is a reconciliation of the beginning and ending amounts of unrecognized tax benefits in millions for the periods indicated:
December 31, 2015 2014 2013Balance at January 1 $ 395 $ 392 $ 475Additions for current year tax positions 6 8 7Additions for tax positions of prior years 12 14 10Reductions for tax positions of prior years (7) (2) (3)Effects of foreign currency translation (7) (3) —Settlements (19) (2) (65)Lapse of statute of limitations (7) (12) (32)Balance at December 31 $ 373 $ 395 $ 392
The Company and certain of its subsidiaries are currently under examination by the relevant taxing authorities for various tax years. The Company regularlyassesses the potential outcome of these examinations in each of the taxing jurisdictions when determining the adequacy of the amount of unrecognized tax benefitrecorded. While it is often difficult to predict the final outcome or the timing of resolution of any particular uncertain tax position, we believe we haveappropriately accrued for our uncertain tax benefits. However, audit outcomes and the timing of audit settlements and future events that would impact ourpreviously recorded unrecognized tax benefits and the range of anticipated increases or decreases in unrecognized tax benefits are subject to significant uncertainty.It is possible that the ultimate outcome of current or future examinations may exceed our provision for current unrecognized tax benefits in amounts that could bematerial, but cannot be estimated as of December 31, 2015 . Our effective tax rate and net income in any given future period could therefore be materiallyimpacted.
23 . DISCONTINUED OPERATIONSAs discussed in Note 1— General and Summary of Significant Accounting Policies , effective July 1, 2014, the Company prospectively adopted ASU No.
2014-08. There have been no businesses classified as discontinued operations subsequent to
171

THE AES CORPORATIONNOTES TO CONSOLIDATED FINANCIAL STATEMENTS—(Continued)
DECEMBER 31, 2015, 2014, AND 2013
this ASU adoption. Discontinued operations prior to adoption of ASU No. 2014-08 include the results of the following businesses:
• Cameroon (sold in June 2014)• Saurashtra (sold in February 2014)• U.S. wind projects (sold in January 2014)• Poland wind projects (sold in November 2013)• Ukraine utilities (sold in April 2013)
The following table summarizes revenue, income from operations, income tax expense, and impairment and loss on disposal of all discontinued operationsprior to the adoption of ASU No. 2014-08 for the periods indicated (in millions):
Years Ended December 31, 2014 2013Revenue $ 233 $ 689Income (loss) from operations of discontinued businesses, before income tax $ 50 $ (3)Income tax expense (23) (24)Income (loss) from operations of discontinued businesses, after income tax $ 27 $ (27)Net loss from disposal and impairments of discontinued businesses, after income tax $ (56) $ (152)
Cameroon — In September 2013, the Company executed agreements for the sale of its 56% equity interests in three businesses in Cameroon: Sonel, anintegrated utility, Kribi, a gas and light fuel oil plant, and Dibamba, a heavy fuel oil plant. The sale was completed in June 2014. Net proceeds from the saletransaction were $200 million , with $156 million received and non-contingent consideration of $44 million to be received in 2016. Between meeting the held-for-sale criteria in September 2013 and completing the sale in June 2014, the Company recognized impairments of $101 million and an additional loss on sale of $7million . These businesses were previously reported in the Europe SBU reportable segment.
Saurashtra — In October 2013, the Company executed an agreement for the sale of Saurashtra, a wind project in India. The sale transaction was completedin February 2014 and net proceeds of $8 million were received. Saurashtra was previously reported in the Asia SBU reportable segment.
U.S. wind projects — In November 2013, the Company executed an agreement for the sale of its 100% membership interests in three wind projects: Condonin California, Lake Benton I in Minnesota and Storm Lake II in Iowa. Upon meeting the held-for-sale criteria for these three projects, the Company recognizedimpairment expense of $47 million (of which $7 million was attributable to noncontrolling interests held by tax equity partners) representing the differencebetween their aggregate carrying amount of $77 million and the fair value less costs to sell of $30 million . The sale transaction closed in January 2014 and netproceeds of $27 million were received. These businesses were previously reported in the US SBU reportable segment.
Under the terms of the sale agreement, the buyer was provided an option to purchase the Company's 100% interest in Armenia Mountain, a wind project inPennsylvania at a fixed price of $75 million . Approximately $3 million of the $27 million net proceeds was deferred and allocated to this option. The buyerexercised the option in March 2015 and the sale was completed in July 2015. See Note 24 —Dispositions and Held-For-Sale Businesses for further information.
Poland wind projects — In November 2013, the Company completed the sale of Poland Wind, a wholly-owned subsidiary with ownership interests rangingbetween 61% – 89% in ten wind development projects. Net proceeds from the sale transaction were $7 million and a loss on disposal of $2 million was recognized.In the third quarter of 2013, the Company recognized impairments of $65 million on these projects when they were classified as held and used. Poland Wind waspreviously reported in the Europe SBU reportable segment.
Ukraine utilities — In April 2013, the Company completed the sale of its two utility businesses in Ukraine and received net proceeds of $113 million . TheCompany sold its 89.1% equity interest in Kyivoblenergo and its 84.6% equity interest in Rivneoblenergo. The Company recognized net impairments of $38million during 2013. These businesses were previously reported in the Europe SBU reportable segment.
24 . DISPOSITIONS AND HELD-FOR-SALE BUSINESSES
Dispositions
Armenia Mountain — On July 1, 2015, the Company completed the sale of its interest in Armenia Mountain, a wind project in Pennsylvania. Net proceedsfrom the sale were $64 million and the Company recognized a pretax gain on sale of $22 million . As Armenia Mountain does not meet the criteria to be reportedas a discontinued operation, its results are reflected within continuing operations in the Consolidated Statements of Operations. Excluding the gain on sale,Armenia Mountain's
172

THE AES CORPORATIONNOTES TO CONSOLIDATED FINANCIAL STATEMENTS—(Continued)
DECEMBER 31, 2015, 2014, AND 2013
pretax income attributable to AES was $6 million , $7 million , and $4 million for the years ended December 31, 2015, 2014, and 2013, respectively. Prior to itssale, Armenia Mountain was reported in the US SBU reportable segment. See Note 23 — Discontinued Operations for more information about transactionspreceding the sale.
Ebute — On November 20, 2014, the Company completed the sale of its interest in Ebute, which included its 95% interest in AES Nigeria Barge Limited andits 100% interest in AES Nigeria Barge Operations Limited. Proceeds from the sale were $22 million and the Company recognized a $6 million loss on the sale inthe fourth quarter of 2014. As Ebute does not meet the criteria to be reported as a discontinued operation, its results are reflected within continuing operations inthe Consolidated Statements of Operations. Excluding the loss on sale, Ebute's pretax (loss) attributable to AES was $(27) million and $(29) million for the yearsended December 31, 2014 and 2013, respectively. Prior to its sale, Ebute was reported in the Europe SBU reportable segment.
U.K. Wind (Operating Projects) — On August 22, 2014, the Company sold 100% of its interests in four operating wind projects located in the U.K.. Total netproceeds from the sale were $158 million and the Company recognized a pretax gain on sale of $78 million . As these wind projects do not meet the criteria to bereported as discontinued operations, their results are reflected within continuing operations in the Consolidated Statements of Operations. Excluding the gain onsale, the pretax income (loss) attributable to AES for these disposed projects was $(18) million and $3 million for the years ended December 31, 2014 and 2013,respectively. Prior to the sale, U.K. Wind (Operating Projects) were reported in the Europe SBU reportable segment.
Cartagena — On April 26, 2013, the Company sold its remaining interest in Cartagena, a gas-fired generation business in Spain, upon the exercise of apurchase option included in the 2012 sale agreement where the Company sold its majority interest in the business. Net proceeds from the exercise of the optionwere approximately $24 million and the Company recognized a pretax gain of $20 million during the second quarter of 2013. Prior to its sale, Cartagena wasreported in the Europe SBU reportable segment.
Held-For-Sale Businesses
DPLER — In December 2015, the Company executed an agreement for the sale of its ownership interest in DPLER, a competitive retail marketer sellingelectricity to customers in Ohio. Accordingly, DPLER has been classified as held-for-sale as of December 31, 2015, but does not meet the criteria to be reported asa discontinued operation. DPLER's results are therefore reflected within continuing operations in the Consolidated Statements of Operations. DPLER's pretaxincome attributable to AES was $11 million , $(129) million and $6 million for the years ended December 31, 2015, 2014 and 2013, respectively. The sale ofDPLER was completed on January 1, 2016 and proceeds of $76 million were received on December 31, 2015. The proceeds were classified as restricted cash witha corresponding amount recorded in accrued and other liabilities in the Consolidated Balance Sheet as of December 31, 2015. DPLER is reported in the US SBUreportable segment.
Kelanitissa — In August 2015, the Company executed an agreement for the sale of its 90% ownership interest in Kelanitissa, a diesel-fired generation plantin Sri Lanka. Accordingly, Kelanitissa has been classified as held-for-sale as of December 31, 2015, but does not meet the criteria to be reported as a discontinuedoperation. Kelanitissa's results are therefore reflected within continuing operations in the Consolidated Statements of Operations. Kelanitissa's pretax income (loss)attributable to AES was $(7) million , $1 million , and $16 million for the years ended December 31, 2015, 2014 and 2013, respectively. The sale of Kelanitissawas completed on January 27, 2016 and proceeds of $18 million were received. Kelanitissa is reported in the Asia SBU reportable segment.
25 . ACQUISITIONS
Main Street Power — On February 18, 2015, the Company completed the acquisition of 100% of the common stock of Main Street Power Company, Inc. forapproximately $25 million , pursuant to the terms and conditions of a definitive agreement dated January 24, 2015. The purchase consideration was composed of$20 million cash and the fair value of earn-out payments of $5 million . At December 31, 2015, the assets acquired (including $4 million cash) and liabilitiesassumed at the acquisition date were recorded at fair value based on the final purchase price allocation, which resulted in the recognition of $16 million ofgoodwill. Subsequent changes to the fair value of earn-out payments will be reflected in earnings.
26 . EARNINGS PER SHARE
Basic and diluted earnings per share are based on the weighted-average number of shares of common stock and potential common stock outstanding duringthe period. Potential common stock, for purposes of determining diluted earnings per share, includes the effects of dilutive restricted stock units, stock options andconvertible securities. The effect of such potential common stock is computed using the treasury stock method or the if-converted method, as applicable.
The following table is a reconciliation of the numerator and denominator of the basic and diluted earnings per share
173
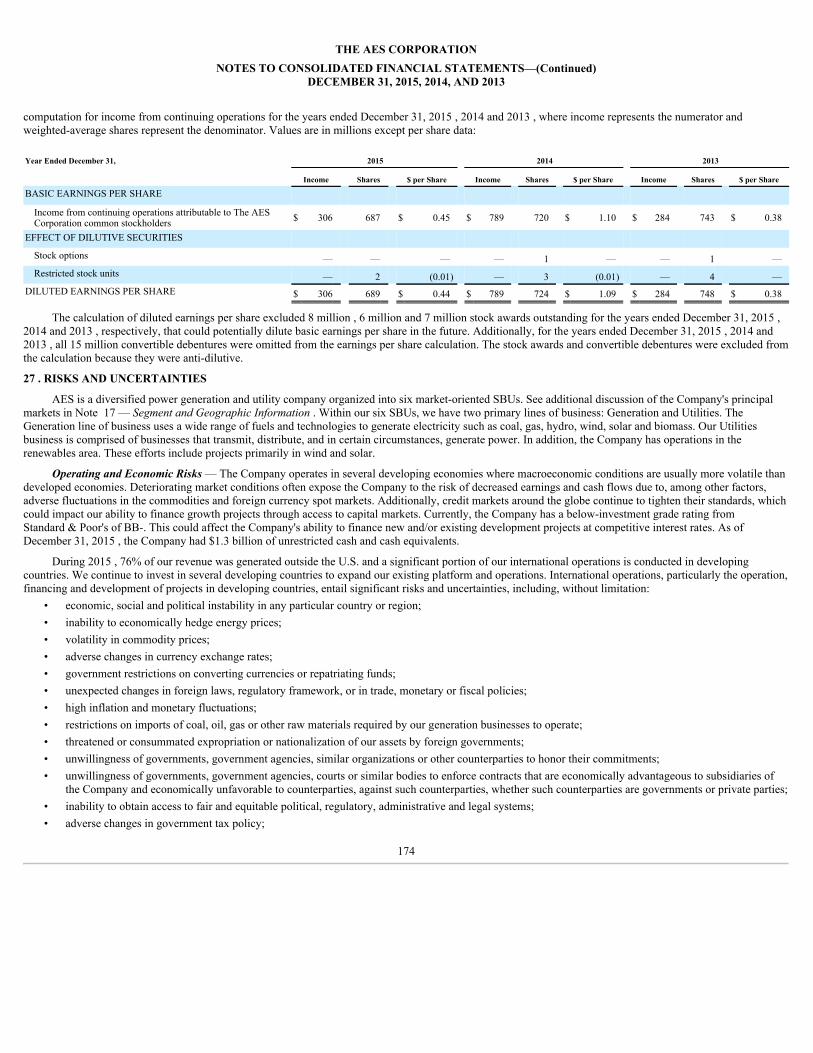
THE AES CORPORATIONNOTES TO CONSOLIDATED FINANCIAL STATEMENTS—(Continued)
DECEMBER 31, 2015, 2014, AND 2013
computation for income from continuing operations for the years ended December 31, 2015 , 2014 and 2013 , where income represents the numerator andweighted-average shares represent the denominator. Values are in millions except per share data:
Year Ended December 31, 2015 2014 2013
Income Shares $ per Share Income Shares $ per Share Income Shares $ per Share
BASIC EARNINGS PER SHARE Income from continuing operations attributable to The AESCorporation common stockholders $ 306 687 $ 0.45 $ 789 720 $ 1.10 $ 284 743 $ 0.38
EFFECT OF DILUTIVE SECURITIES Stock options — — — — 1 — — 1 —Restricted stock units — 2 (0.01) — 3 (0.01) — 4 —
DILUTED EARNINGS PER SHARE $ 306 689 $ 0.44 $ 789 724 $ 1.09 $ 284 748 $ 0.38
The calculation of diluted earnings per share excluded 8 million , 6 million and 7 million stock awards outstanding for the years ended December 31, 2015 ,2014 and 2013 , respectively, that could potentially dilute basic earnings per share in the future. Additionally, for the years ended December 31, 2015 , 2014 and2013 , all 15 million convertible debentures were omitted from the earnings per share calculation. The stock awards and convertible debentures were excluded fromthe calculation because they were anti-dilutive.
27 . RISKS AND UNCERTAINTIES
AES is a diversified power generation and utility company organized into six market-oriented SBUs. See additional discussion of the Company's principalmarkets in Note 17 — Segment and Geographic Information . Within our six SBUs, we have two primary lines of business: Generation and Utilities. TheGeneration line of business uses a wide range of fuels and technologies to generate electricity such as coal, gas, hydro, wind, solar and biomass. Our Utilitiesbusiness is comprised of businesses that transmit, distribute, and in certain circumstances, generate power. In addition, the Company has operations in therenewables area. These efforts include projects primarily in wind and solar.
Operating and Economic Risks — The Company operates in several developing economies where macroeconomic conditions are usually more volatile thandeveloped economies. Deteriorating market conditions often expose the Company to the risk of decreased earnings and cash flows due to, among other factors,adverse fluctuations in the commodities and foreign currency spot markets. Additionally, credit markets around the globe continue to tighten their standards, whichcould impact our ability to finance growth projects through access to capital markets. Currently, the Company has a below-investment grade rating fromStandard & Poor's of BB-. This could affect the Company's ability to finance new and/or existing development projects at competitive interest rates. As ofDecember 31, 2015 , the Company had $1.3 billion of unrestricted cash and cash equivalents.
During 2015 , 76% of our revenue was generated outside the U.S. and a significant portion of our international operations is conducted in developingcountries. We continue to invest in several developing countries to expand our existing platform and operations. International operations, particularly the operation,financing and development of projects in developing countries, entail significant risks and uncertainties, including, without limitation:
• economic, social and political instability in any particular country or region;• inability to economically hedge energy prices;• volatility in commodity prices;• adverse changes in currency exchange rates;• government restrictions on converting currencies or repatriating funds;• unexpected changes in foreign laws, regulatory framework, or in trade, monetary or fiscal policies;• high inflation and monetary fluctuations;• restrictions on imports of coal, oil, gas or other raw materials required by our generation businesses to operate;• threatened or consummated expropriation or nationalization of our assets by foreign governments;• unwillingness of governments, government agencies, similar organizations or other counterparties to honor their commitments;• unwillingness of governments, government agencies, courts or similar bodies to enforce contracts that are economically advantageous to subsidiaries of
the Company and economically unfavorable to counterparties, against such counterparties, whether such counterparties are governments or private parties;• inability to obtain access to fair and equitable political, regulatory, administrative and legal systems;• adverse changes in government tax policy;
174

THE AES CORPORATIONNOTES TO CONSOLIDATED FINANCIAL STATEMENTS—(Continued)
DECEMBER 31, 2015, 2014, AND 2013
• difficulties in enforcing our contractual rights, enforcing judgments, or obtaining a just result in local jurisdictions; and• potentially adverse tax consequences of operating in multiple jurisdictions.
Any of these factors, individually or in combination with others, could materially and adversely affect our business, results of operations and financialcondition. In addition, our Latin American operations experience volatility in revenue and earnings which have caused and are expected to cause significantvolatility in our results of operations and cash flows. The volatility is caused by regulatory and economic difficulties, political instability, indexation of certainPPAs to fuel prices, and currency fluctuations being experienced in many of these countries; particularly in Argentina, where $124 million in net foreign currencytransaction gains were recognized in 2015 primarily from foreign currency derivatives related to government receivables. This volatility reduces the predictabilityand enhances the uncertainty associated with cash flows from these businesses.
Our inability to predict, influence or respond appropriately to changes in law or regulatory schemes, including any inability to obtain reasonable increases intariffs or tariff adjustments for increased expenses, could adversely impact our results of operations or our ability to meet publicly announced projections oranalysts' expectations. Furthermore, changes in laws or regulations or changes in the application or interpretation of regulatory provisions in jurisdictions where weoperate, particularly our Utility businesses where electricity tariffs are subject to regulatory review or approval, could adversely affect our business, including, butnot limited to:
• changes in the determination, definition or classification of costs to be included as reimbursable or pass-through costs;• changes in the definition or determination of controllable or noncontrollable costs;• adverse changes in tax law;• changes in the definition of events which may or may not qualify as changes in economic equilibrium;• changes in the timing of tariff increases;• other changes in the regulatory determinations under the relevant concessions; or• changes in environmental regulations, including regulations relating to GHG emissions in any of our businesses.
Any of the above events may result in lower margins for the affected businesses, which can adversely affect our results of operations.
Foreign Currency Risks — AES operates businesses in many foreign countries and such operations could be impacted by significant fluctuations in foreigncurrency exchange rates. Fluctuations in currency exchange rate between U.S. Dollar and the following currencies could create significant fluctuations to earningsand cash flows: the Argentine peso, the Brazilian real, the Dominican Republic peso, the Euro, the Chilean peso, the Colombian peso, the Philippine peso and theKazakhstan tenge.
Argentina — In December 2015, the Argentine government lifted foreign currency controls, which resulted in a depreciation of the Argentine peso againstthe US dollar by approximately 30%. Over the course of 2015, the Argentinean Peso devalued by approximately 50% against the US dollar. Our businesses inArgentina are dependent on the solvency of the Argentine government with which we have long-term receivables. See Note 7 — Financing Receivables for furtherinformation on the long-term receivables. Further weakening of the Argentine Peso and local economic activity could cause significant volatility in our results ofoperations, cash flows, and the value of our assets.
Concentrations — Due to the geographical diversity of its operations, the Company does not have any significant concentration of customers or sources offuel supply. Several of the Company's generation businesses rely on PPAs with one or a limited number of customers for the majority of, and in some cases all of,the relevant businesses' output over the term of the PPAs. However, no single customer accounted for 10% or more of total revenue in 2015 , 2014 or 2013 .
The cash flows and results of operations of our businesses depend on the credit quality of their customers and the continued ability of their customers andsuppliers to meet their obligations under PPAs and fuel supply agreements. If a substantial portion of the Company's long-term PPAs and/or fuel supply weremodified or terminated, the Company would be adversely affected to the extent that it would be unable to replace such contracts at equally favorable terms.
Bulgaria — Maritza, the Company's generation facility in Bulgaria, has experienced ongoing delays in the collection of outstanding receivables as a result ofliquidity issues faced by our offtaker, NEK. As of December 31, 2015 , Maritza's outstanding accounts receivable were $351 million , of which $307 million wereoverdue. No allowance has been recognized on the receivables as the Company continues to assert that collection is probable.
The Bulgarian government elected in 2014 has undertaken an initiative to reform its energy sector, which is necessary to restore NEK's liquidity. NEK'scredit rating was downgraded and its transmission license was revoked by the Bulgarian Regulator, which are events of default under the PPA and triggeredadditional events of default by Maritza under the project
175

THE AES CORPORATIONNOTES TO CONSOLIDATED FINANCIAL STATEMENTS—(Continued)
DECEMBER 31, 2015, 2014, AND 2013
debt agreements.
Although Maritza continued to collect overdue receivables throughout 2015, collections continue to be at risk, which could result in an allowance to berecorded against the remaining receivables and exacerbate liquidity problems at Maritza if the situation were to deteriorate significantly.
28 . RELATED PARTY TRANSACTIONSCertain of our businesses in Panama, the Dominican Republic and Kazakhstan are partially owned by governments either directly or through state-owned
institutions. In the ordinary course of business, these businesses enter into energy purchase and sale transactions, and transmission agreements with other state-owned institutions which are controlled by such governments. At two of our generation businesses in Mexico, the offtakers exercise significant influence, but notcontrol, through representation on these businesses' Boards of Directors. These offtakers are also required to hold a nominal ownership interest in such businesses.In Chile, we provide capacity and energy under contractual arrangements to our investment which is accounted for under the equity method of accounting.Additionally, the Company provides certain support and management services to several of its affiliates under various agreements.
The Company's Consolidated Statements of Operations included the following transactions with related parties in millions for the periods indicated:
Years Ended December 31, 2015 2014 2013Revenue—Non-Regulated $ 1,099 $ 1,188 $ 1,110Cost of Sales—Non-Regulated 330 331 276Interest Income 25 17 20Interest Expense 33 9 8
The following table summarizes the balances receivable from and payable to related parties included in the Company's Consolidated Balance Sheets inmillions as of the periods indicated:
December 31, 2015 2014Receivables from related parties $ 181 $ 349Accounts and notes payable to related parties 524 567
China Investment Corporation ("CIC") Transaction — On May 18, 2015, the Parent Company completed the repurchase of 20 million shares of its commonstock from Terrific Investment Corporation, at a price per share of $13.07 , for an aggregate purchase price of $261 million . Terrific Investment Corporation is asubsidiary controlled by CIC, a previously significant shareholder of The AES corporation. See Note 16 — Equity for additional information.
29 . SELECTED QUARTERLY FINANCIAL DATA (UNAUDITED)
Quarterly Financial Data — The following tables summarize the unaudited quarterly Condensed Consolidated Statements of Operations for the Companyfor 2015 and 2014 (amounts in millions, except per share data). Amounts have been restated to reflect discontinued operations in all periods presented and reflectall adjustments necessary in the opinion of management for a fair statement of the results for interim periods.
Quarter Ended 2015 Mar 31 June 30 Sept 30 Dec 31Revenue $ 3,984 $ 3,858 $ 3,721 $ 3,400Operating margin 721 754 673 718
Income from continuing operations, net of tax (1) 254 264 203 41Discontinued operations, net of tax — — — —Net income $ 254 $ 264 $ 203 $ 41Net income (loss) attributable to The AES Corporation $ 142 $ 69 $ 180 $ (85)Basic income (loss) per share:
Income (loss) from continuing operations attributable to The AES Corporation, net of tax $ 0.20 $ 0.10 $ 0.27 $ (0.13)
Discontinued operations attributable to The AES Corporation, net of tax — — — —
Basic income (loss) per share attributable to The AES Corporation $ 0.20 $ 0.10 $ 0.27 $ (0.13)Diluted income (loss) per share:
Income (loss) from continuing operations attributable to The AES Corporation, net of tax $ 0.20 $ 0.10 $ 0.26 $ (0.13)
Discontinued operations attributable to The AES Corporation, net of tax — — — —
Diluted income (loss) per share attributable to The AES Corporation $ 0.20 $ 0.10 $ 0.26 $ (0.13)Dividends declared per common share $ — $ 0.10 $ 0.10 $ 0.21
176

THE AES CORPORATIONNOTES TO CONSOLIDATED FINANCIAL STATEMENTS—(Continued)
DECEMBER 31, 2015, 2014, AND 2013
Quarter Ended 2014 Mar 31 June 30 Sept 30 Dec 31Revenue $ 4,262 $ 4,311 $ 4,441 $ 4,132Operating margin 794 819 767 708
Income (loss) from continuing operations, net of tax (2,3) 89 281 508 298Discontinued operations, net of tax (23) (6) — —Net income (loss) $ 66 $ 275 $ 508 $ 298Net income (loss) attributable to The AES Corporation $ (58) $ 133 $ 488 $ 206Basic income (loss) per share:
Income (loss) from continuing operations attributable to The AES Corporation, net of tax $ (0.07) $ 0.20 $ 0.68 $ 0.29
Discontinued operations attributable to The AES Corporation, net of tax (0.01) (0.02) — —
Basic income (loss) per share attributable to The AES Corporation $ (0.08) $ 0.18 $ 0.68 $ 0.29Diluted income (loss) per share:
Income (loss) from continuing operations attributable to The AES Corporation, net of tax $ (0.07) $ 0.20 $ 0.67 $ 0.29
Discontinued operations attributable to The AES Corporation, net of tax (0.01) (0.02) — —
Diluted income (loss) per share attributable to The AES Corporation $ (0.08) $ 0.18 $ 0.67 $ 0.29Dividends declared per common share $ — $ 0.05 $ 0.05 $ 0.15
(1) Includes pretax impairment expense of $8 million , $37 million , $231 million and $ 326 million , for the first, second, third and fourth quarters of 2015 , respectively. See Note 9 — Other Non-Operating Expense, Note 10 —Goodwill and Other Intangible Assets, and Note 21 — Asset Impairment Expense for further discussion.
(2) Includes a pretax gain of approximately $283 million for the third quarter of 2014 related to the sale of a noncontrolling interest in Masinloc. See Note 16 — Equity for further discussion. Includes pretax gain of approximately $78million for the third quarter of 2014 related to the sale of the U.K. wind projects. See Note 24 — Dispositions and Held-for-Sale Businesses for further discussion. Includes pretax interest income of $59 million recognized onFONIVEMEM III receivables at AES Argentina in the fourth quarter of 2014. Also includes a pretax foreign currency derivative gain of $106 million recognized on the FONIVEMEM III receivables in the fourth quarter of 2014.See Note 7 — Financing Receivables for further discussion. Includes pretax loss of $41 million recognized in Net equity in earnings of affiliates corresponding to the Company's share of an asset impairment at Elsta in the fourthquarter of 2014. See Note 8 — Investments In And Advances To Affiliates for further discussion.
(3) Includes pretax impairment expense of $166 million , $107 million , $31 million and $79 million , for the first, second, third and fourth quarters of 2014 , respectively. See Note 9 — Other Non-Operating Expense, Note 10 —Goodwill and Other Intangible Assets, and Note 21 — Asset Impairment Expense for further discussion.
30 . SUBSEQUENT EVENTS
Stock Repurchase Program — Subsequent to December 31, 2015 , the Parent Company repurchased an additional 8.7 million shares at a cost of $79 million ,bringing the cumulative repurchases total from July 2010 through February 23, 2016 to 154.3 million shares for a total cost of $1.9 billion , at an average price pershare of $12.12 (including a nominal amount of commissions). As of February 23, 2016, $264 million remains available under the Program. See Note 16 — Equityfor additional information regarding the Company's common stock repurchase program.
DPLER — On December 29, 2015, the Company entered into an agreement for the sale of DPLER. This transaction closed January 1, 2016. See Note 24 —Dispositions and Held-for-Sale Businesses for further information.
Recourse Debt — Subsequent to December 31, 2015 , the Parent Company repurchased $125 million of its outstanding senior notes.
Kelanitissa — On January 27, 2016, the Company completed the sale of Kelanitissa for $18 million . See Note 24 — Dispositions and Held-For-SaleBusinesses for additional information. The Company expects to recognize an immaterial loss on this transaction during the first quarter of 2016.
IPP4 — On February 18, 2016, the Company completed the sale of a noncontrolling interest in its Jordan IPP4 gas-fired plant for $21 million . Uponcompletion of the sale, the Company continues to hold a 36% ownership interest in IPP4 and will continue to manage and operate the plant. IPP4 is reported in theEurope SBU reportable segment.
177

ITEM 9. CHANGES IN AND DISAGREEMENTS WITH ACCOUNTANTS ON ACCOUNTING AND FINANCIAL DISCLOSURE
None.
ITEM 9A. CONTROLS AND PROCEDURES
Conclusion Regarding the Effectiveness of Disclosure Controls and Procedures
The Company maintains disclosure controls and procedures that are designed to ensure that information required to be disclosed in the reports that theCompany files or submits under the Securities Exchange Act of 1934, as amended (the "Exchange Act") is recorded, processed, summarized and reported withinthe time periods specified in the SEC's rules and forms, and that such information is accumulated and communicated to the CEO and CFO, as appropriate, to allowtimely decisions regarding required disclosures.
The Company carried out the evaluation required by Rules 13a-15(b) and 15d-15(b), under the supervision and with the participation of our management,including the CEO and CFO, of the effectiveness of our “disclosure controls and procedures” (as defined in the Exchange Act Rules 13a-15(e) and 15d-15(e)).Based upon this evaluation, the CEO and CFO concluded that as of December 31, 2015, our disclosure controls and procedures were effective.
Management's Report on Internal Control over Financial Reporting
Management of the Company is responsible for establishing and maintaining adequate internal control over financial reporting, as defined in Rule 13a-15(f)under the Exchange Act. The Company's internal control over financial reporting is a process designed to provide reasonable assurance regarding the reliability offinancial reporting and the preparation of financial statements for external purposes in accordance with GAAP and includes those policies and procedures that:
• pertain to the maintenance of records that in reasonable detail, accurately and fairly reflect the transactions and dispositions of the assets of the Company;• provide reasonable assurance that transactions are recorded as necessary to permit preparation of financial statements in accordance with GAAP, and that
receipts and expenditures of the Company are being made only in accordance with authorizations of management and directors of the Company; and• provide reasonable assurance that unauthorized acquisition, use or disposition of the Company's assets that could have a material effect on the financial
statements are prevented or detected timely.
Management, including our CEO and CFO, does not expect that our internal controls will prevent or detect all errors and all fraud. A control system, nomatter how well designed and operated, can provide only reasonable, not absolute, assurance that the objectives of the control system are met. Further, the designof a control system must reflect the fact that there are resource constraints, and the benefits of controls must be considered relative to their costs. In addition, anyevaluation of the effectiveness of controls is subject to risks that those internal controls may become inadequate in future periods because of changes in businessconditions, or that the degree of compliance with the policies or procedures deteriorates.
Management assessed the effectiveness of our internal control over financial reporting as of December 31, 2015 . In making this assessment, managementused the criteria established in Internal Control—Integrated Framework issued by the Committee of Sponsoring Organizations of the Treadway Commission("COSO") in 2013. Based on this assessment, management believes that the Company maintained effective internal control over financial reporting as ofDecember 31, 2015 .
The effectiveness of the Company's internal control over financial reporting as of December 31, 2015 , has been audited by Ernst & Young LLP, anindependent registered public accounting firm, as stated in their report, which appears herein.
Changes in Internal Control Over Financial Reporting:
There were no changes that occurred during the quarter ended December 31, 2015 that have materially affected, or are reasonably likely to materially affect,our internal control over financial reporting.
178

REPORT OF INDEPENDENT REGISTERED PUBLIC ACCOUNTING FIRM
The Board of Directors and Stockholders of The AES Corporation:
We have audited The AES Corporation's internal control over financial reporting as of December 31, 2015, based on criteria established in Internal Control-Integrated Framework issued by the Committee of Sponsoring Organizations of the Treadway Commission (2013 Framework) (the COSO criteria). The AESCorporation's management is responsible for maintaining effective internal control over financial reporting, and for its assessment of the effectiveness of internalcontrol over financial reporting included in the accompanying Management's Report on Internal Control over Financial Reporting. Our responsibility is to expressan opinion on the Company's internal control over financial reporting based on our audit.
We conducted our audit in accordance with the standards of the Public Company Accounting Oversight Board (United States). Those standards require thatwe plan and perform the audit to obtain reasonable assurance about whether effective internal control over financial reporting was maintained in all materialrespects. Our audit included obtaining an understanding of internal control over financial reporting, assessing the risk that a material weakness exists, testing andevaluating the design and operating effectiveness of internal control based on the assessed risk, and performing such other procedures as we considered necessaryin the circumstances. We believe that our audit provides a reasonable basis for our opinion.
A company's internal control over financial reporting is a process designed to provide reasonable assurance regarding the reliability of financial reporting andthe preparation of financial statements for external purposes in accordance with generally accepted accounting principles. A company's internal control overfinancial reporting includes those policies and procedures that (1) pertain to the maintenance of records that, in reasonable detail, accurately and fairly reflect thetransactions and dispositions of the assets of the company; (2) provide reasonable assurance that transactions are recorded as necessary to permit preparation offinancial statements in accordance with generally accepted accounting principles, and that receipts and expenditures of the company are being made only inaccordance with authorizations of management and directors of the company; and (3) provide reasonable assurance regarding prevention or timely detection ofunauthorized acquisition, use, or disposition of the company's assets that could have a material effect on the financial statements.
Because of its inherent limitations, internal control over financial reporting may not prevent or detect misstatements. Also, projections of any evaluation ofeffectiveness to future periods are subject to the risk that controls may become inadequate because of changes in conditions, or that the degree of compliance withthe policies or procedures may deteriorate.
In our opinion, The AES Corporation maintained, in all material respects, effective internal control over financial reporting as of December 31, 2015, basedon the COSO criteria.
We also have audited, in accordance with the standards of the Public Company Accounting Oversight Board (United States), the consolidated balance sheetsof The AES Corporation as of December 31, 2015 and 2014, and the related consolidated statements of operations, comprehensive income, changes in equity, andcash flows for each of the three years in the period ended December 31, 2015 of The AES Corporation and our report dated February 23, 2016 expressed anunqualified opinion thereon.
/s/ Ernst & Young LLP
McLean, VirginiaFebruary 23, 2016
ITEM 9B. OTHER INFORMATION
None.
179
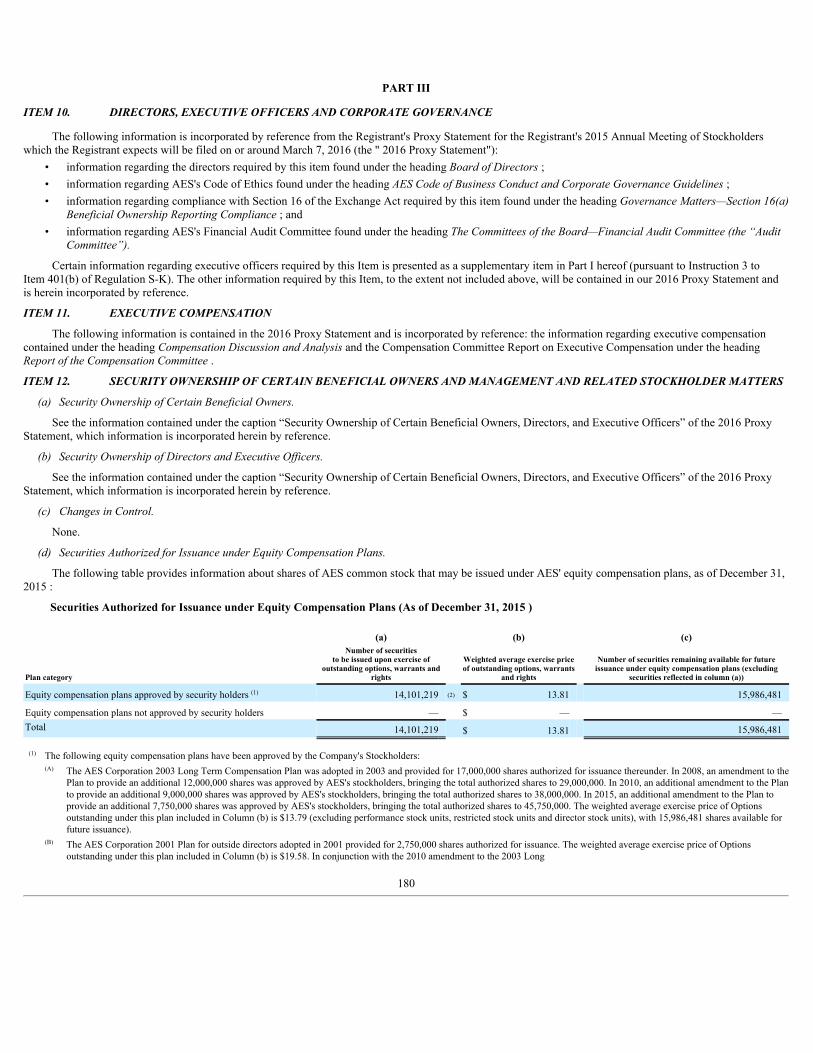
PART III
ITEM 10. DIRECTORS, EXECUTIVE OFFICERS AND CORPORATE GOVERNANCE
The following information is incorporated by reference from the Registrant's Proxy Statement for the Registrant's 2015 Annual Meeting of Stockholderswhich the Registrant expects will be filed on or around March 7, 2016 (the " 2016 Proxy Statement"):
• information regarding the directors required by this item found under the heading Board of Directors ;• information regarding AES's Code of Ethics found under the heading AES Code of Business Conduct and Corporate Governance Guidelines ;• information regarding compliance with Section 16 of the Exchange Act required by this item found under the heading Governance Matters—Section 16(a)
Beneficial Ownership Reporting Compliance ; and• information regarding AES's Financial Audit Committee found under the heading The Committees of the Board—Financial Audit Committee (the “Audit
Committee”).
Certain information regarding executive officers required by this Item is presented as a supplementary item in Part I hereof (pursuant to Instruction 3 toItem 401(b) of Regulation S-K). The other information required by this Item, to the extent not included above, will be contained in our 2016 Proxy Statement andis herein incorporated by reference.
ITEM 11. EXECUTIVE COMPENSATION
The following information is contained in the 2016 Proxy Statement and is incorporated by reference: the information regarding executive compensationcontained under the heading Compensation Discussion and Analysis and the Compensation Committee Report on Executive Compensation under the headingReport of the Compensation Committee .
ITEM 12. SECURITY OWNERSHIP OF CERTAIN BENEFICIAL OWNERS AND MANAGEMENT AND RELATED STOCKHOLDER MATTERS
(a) Security Ownership of Certain Beneficial Owners.
See the information contained under the caption “Security Ownership of Certain Beneficial Owners, Directors, and Executive Officers” of the 2016 ProxyStatement, which information is incorporated herein by reference.
(b) Security Ownership of Directors and Executive Officers.
See the information contained under the caption “Security Ownership of Certain Beneficial Owners, Directors, and Executive Officers” of the 2016 ProxyStatement, which information is incorporated herein by reference.
(c) Changes in Control.
None.
(d) Securities Authorized for Issuance under Equity Compensation Plans.
The following table provides information about shares of AES common stock that may be issued under AES' equity compensation plans, as of December 31,2015 :
Securities Authorized for Issuance under Equity Compensation Plans (As of December 31, 2015 )
(a) (b) (c)
Plan category
Number of securitiesto be issued upon exercise of
outstanding options, warrants andrights
Weighted average exercise priceof outstanding options, warrants
and rights Number of securities remaining available for future
issuance under equity compensation plans (excludingsecurities reflected in column (a))
Equity compensation plans approved by security holders (1) 14,101,219 (2) $ 13.81 15,986,481
Equity compensation plans not approved by security holders — $ — —Total 14,101,219 $ 13.81 15,986,481
(1) The following equity compensation plans have been approved by the Company's Stockholders:(A) The AES Corporation 2003 Long Term Compensation Plan was adopted in 2003 and provided for 17,000,000 shares authorized for issuance thereunder. In 2008, an amendment to the
Plan to provide an additional 12,000,000 shares was approved by AES's stockholders, bringing the total authorized shares to 29,000,000. In 2010, an additional amendment to the Planto provide an additional 9,000,000 shares was approved by AES's stockholders, bringing the total authorized shares to 38,000,000. In 2015, an additional amendment to the Plan toprovide an additional 7,750,000 shares was approved by AES's stockholders, bringing the total authorized shares to 45,750,000. The weighted average exercise price of Optionsoutstanding under this plan included in Column (b) is $13.79 (excluding performance stock units, restricted stock units and director stock units), with 15,986,481 shares available forfuture issuance).
(B) The AES Corporation 2001 Plan for outside directors adopted in 2001 provided for 2,750,000 shares authorized for issuance. The weighted average exercise price of Optionsoutstanding under this plan included in Column (b) is $19.58. In conjunction with the 2010 amendment to the 2003 Long
180

Term Compensation plan, ongoing award issuance from this plan was discontinued in 2010. Any remaining shares under this plan, which are not reserved for issuance underoutstanding awards, are not available for future issuance and thus the amount of 2,069,035 shares is not included in Column (c) above.
(C) The AES Corporation Second Amended and Restated Deferred Compensation Plan for directors provided for 2,000,000 shares authorized for issuance. Column (b) excludes theDirector stock units granted thereunder. In conjunction with the 2010 amendment to the 2003 Long Term Compensation Plan, ongoing award issuance from this plan wasdiscontinued in 2010 as Director stock units will be issued from the 2003 Long Term Compensation Plan. Any remaining shares under this plan, which are not reserved for issuanceunder outstanding awards, are not available for future issuance and thus the amount of 105,341 shares is not included in Column (c) above.
(2) Includes 5,494,311 (of which 1,067,734 are vested and 4,426,577 are unvested) shares underlying PSU and RSU awards (assuming performance at a maximum level), 1,451,533 sharesunderlying Director stock unit awards, and 7,155,375 shares issuable upon the exercise of Stock Option grants, for an aggregate number of 14,101,219 shares.
ITEM 13. CERTAIN RELATIONSHIPS AND RELATED PARTY TRANSACTIONS, AND DIRECTOR INDEPENDENCE
The information regarding related party transactions required by this item is included in the 2016 Proxy Statement found under the headings Transactionswith Related Persons, Proposal I: Election of Directors and The Committees of the Board and are incorporated herein by reference.
ITEM 14. PRINCIPAL ACCOUNTANT FEES AND SERVICES
The information concerning principal accountant fees and services included in the 2016 Proxy Statement contained under the heading Information RegardingThe Independent Registered Public Accounting Firm's Fees, Services and Independence and is incorporated herein by reference.
181

PART IVITEM 15. EXHIBITS AND FINANCIAL STATEMENT SCHEDULES
(a) Financial Statements.
Financial Statements and Schedules: Page
Consolidated Balance Sheets as of December 31, 2015 and 2014 121Consolidated Statements of Operations for the years ended December 31, 2015, 2014 and 2013 122Consolidated Statements of Comprehensive Income for the years ended December 31, 2015, 2014 and 2013 123Consolidated Statements of Changes in Equity for the years ended December 31, 2015, 2014 and 2013 124Consolidated Statements of Cash Flows for the years ended December 31, 2015, 2014 and 2013 125Notes to Consolidated Financial Statements 126Schedules S-2-S-7
(b) Exhibits.
3.1
Sixth Restated Certificate of Incorporation of The AES Corporation is incorporated herein by reference to Exhibit 3.1 of the Company's Form 10-K for the year endedDecember 31, 2008.
3.2 By-Laws of The AES Corporation, as amended and incorporated herein by reference to Exhibit 3.1 of the Company's Form 8-K/A filed on December 2, 2015.
4
There are numerous instruments defining the rights of holders of long-term indebtedness of the Registrant and its consolidated subsidiaries, none of which exceeds ten percent ofthe total assets of the Registrant and its subsidiaries on a consolidated basis. The Registrant hereby agrees to furnish a copy of any of such agreements to the Commission uponrequest. Since these documents are not required filings under Item 601 of Regulation S-K, the Company has elected to file certain of these documents as Exhibits 4.(a)—4.(r).
4.(a)
Junior Subordinated Indenture, dated as of March 1, 1997, between The AES Corporation and Wells Fargo Bank, National Association, as successor to Bank One, NationalAssociation (formerly known as The First National Bank of Chicago) is incorporated herein by reference to Exhibit 4.(a) of the Company's Form 10-K for the year endedDecember 31, 2008.
4.(b)
Third Supplemental Indenture, dated as of October 14, 1999, between The AES Corporation and Wells Fargo Bank, National Association, as successor to Bank One, NationalAssociation is incorporated herein by reference to Exhibit 4.(b) of the Company's Form 10-K for the year ended December 31, 2008.
4.(c)
Senior Indenture, dated as of December 8, 1998, between The AES Corporation and Wells Fargo Bank, National Association, as successor to Bank One, National Association(formerly known as The First National Bank of Chicago) is incorporated herein by reference to Exhibit 4.01 of the Company's Form 8-K filed on December 11, 1998 (SEC FileNo. 001-12291).
4.(d)
Form of Second Supplemental Indenture, dated as of June 11, 1999, between The AES Corporation and Wells Fargo Bank, National Association, as successor to Bank One,National Association (formerly known as The First National Bank of Chicago) is incorporated herein by reference to Exhibit 4.01 of the Company's Form 8-K filed on June 11,1999 (SEC File No. 001-12291).
4.(e)
Third Supplemental Indenture, dated as of September 12, 2000, between The AES Corporation and Wells Fargo Bank, National Association, as successor to Bank One, NationalAssociation is incorporated herein by reference to Exhibit 4.(e) of the Company's Form 10-K for the year ended December 31, 2008.
4.(f)
Form of Fifth Supplemental Indenture, dated as of February 9, 2001, between The AES Corporation and Wells Fargo Bank, National Association, as successor to Bank One,National Association is incorporated herein by reference to Exhibit 4.1 of the Company's Form 8-K filed on February 8, 2001 (SEC File No. 001-12291).
4.(g)
Form of Sixth Supplemental Indenture, dated as of February 22, 2001, between The AES Corporation and Wells Fargo Bank, National Association, as successor to Bank One,National Association is incorporated herein by reference to Exhibit 4.1 of the Company's Form 8-K filed on February 21, 2001 (SEC File No. 001-12291).
4.(h)
Ninth Supplemental Indenture, dated as of April 3, 2003, between The AES Corporation and Wells Fargo Bank, National Association (as successor by consolidation to WellsFargo Bank Minnesota, National Association) is incorporated herein by reference to Exhibit 4.6 of the Company's Form S-4 filed on December 7, 2007.
4.(i)
Form of Tenth Supplemental Indenture, dated as of February 13, 2004, between The AES Corporation and Wells Fargo Bank, National Association (as successor byconsolidation to Wells Fargo Bank Minnesota, National Association) is incorporated herein by reference to Exhibit 4.1 of the Company's Form 8-K filed on February 13, 2004(SEC File No. 001-12291).
4.(j)
Eleventh Supplemental Indenture, dated as of October 15, 2007, between The AES Corporation and Wells Fargo Bank, National Association is incorporated herein by referenceto Exhibit 4.7 of the Company's Form S-4 filed on December 7, 2007.
4.(k)
Twelfth Supplemental Indenture, dated as of October 15, 2007, between The AES Corporation and Wells Fargo Bank, National Association is incorporated herein by referenceto Exhibit 4.8 of the Company's Form S-4 filed on December 7, 2007.
4.(l)
Thirteenth Supplemental Indenture, dated as of May 19, 2008, between The AES Corporation and Wells Fargo Bank, National Association is incorporated herein by reference toExhibit 4.(l) of the Company's Form 10-K for the year ended December 31, 2008.
4.(m)
Fourteenth Supplemental Indenture, dated as of April 2, 2009, between The AES Corporation and Wells Fargo Bank, National Association is incorporated herein by reference toExhibit 99.1 of the Company's Form 8-K filed on April 2, 2009.
4.(n)
Fifteenth Supplemental Indenture, dated as of June 15, 2011, between The AES Corporation and Wells Fargo Bank, National Association is incorporated herein by reference toExhibit 4.3 of the Company's Form 8-K filed on June 15, 2011.
4.(o)
Indenture, dated October 3, 2011, between Dolphin Subsidiary II, Inc. and Wells Fargo Bank, National Association is incorporated herein by reference to Exhibit 4.1 of theCompany's Form 8-K filed on October 5, 2011.
4.(p)
Sixteenth Supplemental Indenture, dated April 30, 2013, between The AES Corporation and Wells Fargo Bank, N.A., as Trustee is incorporated herein by reference to Exhibit4.1 of the Company's Form 8-K filed on April 30, 2013 (SEC File No. 001-12291).
4.(q)
Seventeenth Supplemental Indenture, dated March 7, 2014, between The AES Corporation and Wells Fargo Bank, N.A. as Trustee is incorporated herein by reference to Exhibit4.1 of the Company's Form 8-K filed on March 7, 2014.
4.(r)
Eighteenth Supplemental Indenture, dated May 20, 2014, between The AES Corporation and Wells Fargo Bank, N.A. as Trustee is incorporated herein by reference to Exhibit4.1 of the Company's Form 8-K filed on May 20, 2014.
4.(s)
Nineteenth Supplemental Indenture, dated April 6, 2015, between The AES Corporation and Wells Fargo Bank, N.A. as Trustee is incorporated herein by reference to Exhibit4.1 of the Company's Form 8-K filed on April 6, 2015.
10.1
The AES Corporation Profit Sharing and Stock Ownership Plan are incorporated herein by reference to Exhibit 4(c)(1) of the Registration Statement on Form S-8 (RegistrationNo. 33-49262) filed on July 2, 1992.
10.2
The AES Corporation Incentive Stock Option Plan of 1991, as amended, is incorporated herein by reference to Exhibit 10.30 of the Company's Form 10-K for the year endedDecember 31, 1995 (SEC File No. 00019281).
182

10.3
Applied Energy Services, Inc. Incentive Stock Option Plan of 1982 is incorporated herein by reference to Exhibit 10.31 of the Registration Statement on Form S-1 (RegistrationNo. 33-40483).
10.4
Deferred Compensation Plan for Executive Officers, as amended, is incorporated herein by reference to Exhibit 10.32 of Amendment No. 1 to the Registration Statement onForm S-1 (Registration No. 33-40483).
10.5
Deferred Compensation Plan for Directors, as amended and restated, on February 17, 2012 is incorporated herein by reference to Exhibit 10.5 of the Company's Form 10-K forthe year ended December 31, 2012.
10.6
The AES Corporation Stock Option Plan for Outside Directors, as amended and restated, on December 7, 2007 is incorporated herein by reference to Exhibit 10.6 of theCompany's Form 10-K for the year ended December 31, 2012.
10.7
The AES Corporation Supplemental Retirement Plan is incorporated herein by reference to Exhibit 10.63 of the Company's Form 10-K for the year ended December 31, 1994(SEC File No. 00019281).
10.7A
Amendment to The AES Corporation Supplemental Retirement Plan, dated March 13, 2008 is incorporated herein by reference to Exhibit 10.9.A of the Company's Form 10-Kfor the year ended December 31, 2007.
10.8
The AES Corporation 2001 Stock Option Plan is incorporated herein by reference to Exhibit 10.12 of the Company's Form 10-K for the year ended December 31, 2000 (SECFile No. 001-12291).
10.9
Second Amended and Restated Deferred Compensation Plan for Directors is incorporated herein by reference to Exhibit 10.13 of the Company's Form 10-K for the year endedDecember 31, 2000 (SEC File No. 001-12291).
10.10
The AES Corporation 2001 Non-Officer Stock Option Plan is incorporated herein by reference to Exhibit 10.12 of the Company's Form 10-K for the year ended December 31,2002 (SEC File No. 001-12291).
10.10A
Amendment to the 2001 Stock Option Plan and 2001 Non-Officer Stock Option Plan, dated March 13, 2008 is incorporated herein by reference to Exhibit 10.12.A of theCompany's Form 10-K for the year ended December 31, 2007.
10.11
The AES Corporation 2003 Long Term Compensation Plan, as Amended and Restated, dated April 23, 2015, is incorporated herein by reference to Exhibit 99.1 of theCompany's Form 8-K filed on April 23, 2015.
10.12
Form of AES Nonqualified Stock Option Award Agreement under The AES Corporation 2003 Long Term Compensation Plan (Outside Directors) is incorporated herein byreference to Exhibit 10.2 of the Company's Form 8-K filed on April 27, 2010.
10.13 Form of AES Performance Stock Unit Award Agreement under The AES Corporation 2003 Long Term Compensation Plan (filed herewith).
10.14 Form of AES Restricted Stock Unit Award Agreement under The AES Corporation 2003 Long Term Compensation Plan (filed herewith).
10.15 Form of AES Performance Unit Award Agreement under The AES Corporation 2003 Long Term Compensation Plan (filed herewith).
10.16
Form of AES Nonqualified Stock Option Award Agreement under The AES Corporation 2003 Long Term Compensation Plan is incorporated herein by reference to Exhibit10.4 of the Company's Form 10-Q for the quarter ended June 30, 2015.
10.17 Form of AES Performance Cash Unit Award Agreement under The AES Corporation 2003 Long Term Compensation Plan (filed herewith).
10.18
The AES Corporation Restoration Supplemental Retirement Plan, as amended and restated, dated December 29, 2008 is incorporated herein by reference to Exhibit 10.15 of theCompany's Form 10-K for the year ended December 31, 2008.
10.18A
Amendment to The AES Corporation Restoration Supplemental Retirement Plan, dated December 9, 2011 is incorporated herein by reference to Exhibit 10.17A of theCompany's Form 10-K for the year ended December 31, 2012.
10.19
The AES Corporation International Retirement Plan, as amended and restated on December 29, 2008 is incorporated herein by reference to Exhibit 10.16 of the Company'sForm 10-K for the year ended December 31, 2008.
10.19A
Amendment to The AES Corporation International Retirement Plan, dated December 9, 2011 is incorporated herein by reference to Exhibit 10.18A of the Company's Form 10-Kfor the year ended December 31, 2012.
10.20
The AES Corporation Severance Plan, as amended and restated on April 23, 2015 is incorporated herein by reference to Exhibit 10.6 of the Company's Form 10-Q for thequarter ended June 30, 2015.
10.21
The AES Corporation Amended and Restated Executive Severance Plan dated April 23, 2015 is incorporated herein by reference to Exhibit 10.5 of the Company's Form 10-Qfor the period ended June 30, 2015.
10.22
The AES Corporation Performance Incentive Plan, as Amended and Restated on April 23, 2015 is incorporated herein by reference to Exhibit 99.2 of the Company's Form 8-Kfiled on April 23, 2015.
10.23
The AES Corporation Deferred Compensation Program For Directors dated February 17, 2012 is incorporated herein by reference to Exhibit 10.22 of the Company's Form 10-Kfiled on December 31, 2011.
10.24 The AES Corporation Employment Agreement with Andrés Gluski is incorporated herein by reference to Exhibit 99.3 of the Company's Form 8-K filed on December 31, 2008.10.25
Mutual Agreement, between Andrés Gluski and The AES Corporation dated October 7, 2011 is incorporated herein by reference to Exhibit 10.2 of the Company's Form 10-Qfor the period ended September 30, 2011.
10.26
Form of Retroactive Consent to Provide for Double-Trigger IN Change-In-Control Transactions is incorporated herein by reference to Exhibit 10.7 of the Company's Form 10-Qfor the period ended June 30, 2015.
10.27
Amendment No. 3, dated as of July 26, 2013 to the Fifth Amended and Restated Credit and Reimbursement Agreement, dated as of July 29, 2010 is incorporated herein byreference to Exhibit 10.1 of the Company's Form 8-K filed on July 29, 2013.
10.27A
Sixth Amended and Restated Credit and Reimbursement Agreement dated as of July 26, 2013 among The AES Corporation, a Delaware corporation, the Banks listed on thesignature pages thereof, Citibank, N.A., as Administrative Agent and Collateral Agent, Citigroup Global Markets Inc., as Lead Arranger and Book Runner, Banc of AmericaSecurities LLC, as Lead Arranger and Book Runner and Co-Syndication Agent, Barclays Capital, as Lead Arranger and Book Runner and Co-Syndication Agent, RBSSecurities Inc., as Lead Arranger and Book Runner and Co-Syndication Agent and Union Bank, N.A., as Lead Arranger and Book Runner and Co-Syndication Agent isincorporated herein by reference to Exhibit 10.1.A of the Company's Form 8-K filed on July 29, 2013.
10.27B
Appendices and Exhibits to the Sixth Amended and Restated Credit and Reimbursement Agreement, dated as of July 29, 2013 is incorporated herein by reference to Exhibit10.1.B of the Company's Form 8-K filed on July 29, 2013.
10.28
Collateral Trust Agreement dated as of December 12, 2002 among The AES Corporation, AES International Holdings II, Ltd., Wilmington Trust Company, as corporate trusteeand Bruce L. Bisson, an individual trustee is incorporated herein by reference to Exhibit 4.2 of the Company's Form 8-K filed on December 17, 2002 (SEC File No. 001-12291).
10.29
Security Agreement dated as of December 12, 2002 made by The AES Corporation to Wilmington Trust Company, as corporate trustee and Bruce L. Bisson, as individualtrustee is incorporated herein by reference to Exhibit 4.3 of the Company's Form 8-K filed on December 17, 2002 (SEC File No. 001-12291).
10.30
Charge Over Shares dated as of December 12, 2002 between AES International Holdings II, Ltd. and Wilmington Trust Company, as corporate trustee and Bruce L. Bisson, asindividual trustee is incorporated herein by reference to Exhibit 4.4 of the Company's Form 8-K filed on December 17, 2002 (SEC File No. 001-12291).
10.31
Agreement and Plan of Merger, dated April 19, 2011, by and among The AES Corporation, DPL Inc. and Dolphin Sub, Inc. is incorporated herein by reference to Exhibit 2.1 ofthe Company's Form 8-K filed on April 20, 2011.
10.32
Credit Agreement dated as of May 27, 2011 among The AES Corporation, as borrower, the banks listed therein and Bank of America, N.A., as administrative agent isincorporated herein by reference to Exhibit 10.1 of the Company's Form 8-K filed on June 1, 2011.
183

10.32A
Amendment No.1 dated February 27, 2013 to the Credit Agreement dated as of May 27, 2011 among The AES Corporation, as borrower, the banks listed therein and Bank ofAmerica N.A., as administrative agent is incorporated herein by reference to exhibit 10.1 of the Company's Form 10-Q for the period ending March 31, 2013.
10.33
Common Stock Repurchase Agreement, dated as of December 11, 2013, by and between The AES Corporation and Terrific Investment Corporation is incorporated herein byreference to Exhibit 10.1 of the Company's Form 8-K filed on December 13, 2013.
12 Statement of computation of ratio of earnings to fixed charges (filed herewith).21 Subsidiaries of The AES Corporation (filed herewith).23.1 Consent of Independent Registered Public Accounting Firm, Ernst & Young LLP (filed herewith).24 Powers of Attorney (filed herewith).31.1 Rule 13a-14(a)/15d-14(a) Certification of Andrés Gluski (filed herewith).31.2 Rule 13a-14(a)/15d-14(a) Certification of Thomas M. O'Flynn (filed herewith).32.1 Section 1350 Certification of Andrés Gluski (filed herewith).32.2 Section 1350 Certification of Thomas M. O'Flynn (filed herewith).101.INS XBRL Instance Document (filed herewith).101.SCH XBRL Taxonomy Extension Schema Document (filed herewith).101.CAL XBRL Taxonomy Extension Calculation Linkbase Document (filed herewith).101.DEF XBRL Taxonomy Extension Definition Linkbase Document (filed herewith).101.LAB XBRL Taxonomy Extension Label Linkbase Document (filed herewith).101.PRE XBRL Taxonomy Extension Presentation Linkbase Document (filed herewith).
(c) SchedulesSchedule I—Financial Information of RegistrantSchedule II—Valuation and Qualifying Accounts
184

SIGNATURES
Pursuant to the requirements of Section 13 or 15(d) of the Securities Exchange Act of 1934, as amended, the Company has duly caused this report to besigned on its behalf by the undersigned, thereunto duly authorized.
THE AES CORPORATION(Company)
Date: February 23, 2016 By: /s/ A NDRÉS G LUSKI
Name: Andrés Gluski
President, Chief Executive Officer
Pursuant to the requirements of the Securities Exchange Act of 1934, as amended, this report has been signed below by the following persons on behalf ofthe Company and in the capacities and on the dates indicated.
Name Title Date
* President, Chief Executive Officer (Principal Executive Officer) and Director
Andrés Gluski February 23, 2016
* Director
Charles L. Harrington February 23, 2016* Director
Kristina M. Johnson February 23, 2016
* Director
Tarun Khanna February 23, 2016
* Director
Holly K. Koeppel February 23, 2016
* Director
Philip Lader February 23, 2016
* Director
James H. Miller February 23, 2016
* Director
John B. Morse February 23, 2016
* Director
Moises Naim February 23, 2016
* Chairman of the Board and Lead Independent Director
Charles O. Rossotti February 23, 2016
/s/ T HOMAS M. O'F LYNN Executive Vice President and Chief Financial Officer (Principal Financial Officer) Thomas M. O'Flynn February 23, 2016
/s/ FABIAN E. SOUZA Vice President and Controller (Principal Accounting Officer)
Fabian E. Souza February 23, 2016
*By: /s/ BRIAN A. MILLER February 23, 2016 Attorney-in-fact
185

THE AES CORPORATION AND SUBSIDIARIES
INDEX TO FINANCIAL STATEMENT SCHEDULES
Schedule I—Condensed Financial Information of Registrant S-2Schedule II—Valuation and Qualifying Accounts S-7
Schedules other than those listed above are omitted as the information is either not applicable, not required, or has been furnished in the financial statementsor notes thereto included in Item 8 hereof.
See Notes to Schedule I
S-1

THE AES CORPORATION
SCHEDULE I CONDENSED FINANCIAL INFORMATION OF PARENTBALANCE SHEETS
December 31,
2015 2014 (in millions)
ASSETS Current Assets: Cash and cash equivalents $ 186 $ 511Restricted cash 32 81Accounts and notes receivable from subsidiaries 264 380Deferred income taxes — 142Prepaid expenses and other current assets 26 57Total current assets 508 1,171Investment in and advances to subsidiaries and affiliates 7,764 9,063Office Equipment: Cost 135 157Accumulated depreciation (112) (114)Office equipment, net 23 43Other Assets: Deferred financing costs (net of accumulated amortization of $75 and $81, respectively) 49 61Deferred income taxes 1,028 872Other Assets 1 1Total other assets 1,078 934
Total $ 9,373 $ 11,211LIABILITIES AND STOCKHOLDERS' EQUITY
Current Liabilities: Accounts payable $ 16 $ 25Accounts and notes payable to subsidiaries 97 80Accrued and other liabilities 204 212Senior notes payable—current portion — 151Total current liabilities 317 468Long-term Liabilities: Senior notes payable 4,498 4,590Junior subordinated notes and debentures payable 517 517Accounts and notes payable to subsidiaries 873 1,352Other long-term liabilities 19 12Total long-term liabilities 5,907 6,471Stockholders' equity: Common stock 8 8Additional paid-in capital 8,718 8,409Retained Earnings 143 512Accumulated other comprehensive loss (3,883) (3,286)Treasury stock (1,837) (1,371)Total stockholders' equity 3,149 4,272
Total $ 9,373 $ 11,211
See Notes to Schedule I.
S-2

THE AES CORPORATION
SCHEDULE I CONDENSED FINANCIAL INFORMATION OF PARENTSTATEMENTS OF OPERATIONS
For the Years Ended December 31, 2015 2014 2013 (in millions)
Revenue from subsidiaries and affiliates $ 24 $ 29 $ 32Equity in earnings of subsidiaries and affiliates 859 1,313 498Interest income 24 59 66General and administrative expenses (154) (161) (171)Other Income 24 8 14Other Expense (6) (30) (11)Loss on extinguishment of debt (105) (193) (165)Interest expense (364) (422) (436)Income (loss) before income taxes 302 603 (173)Income tax benefit 4 166 287Net income $ 306 $ 769 $ 114
See Notes to Schedule I.
S-3
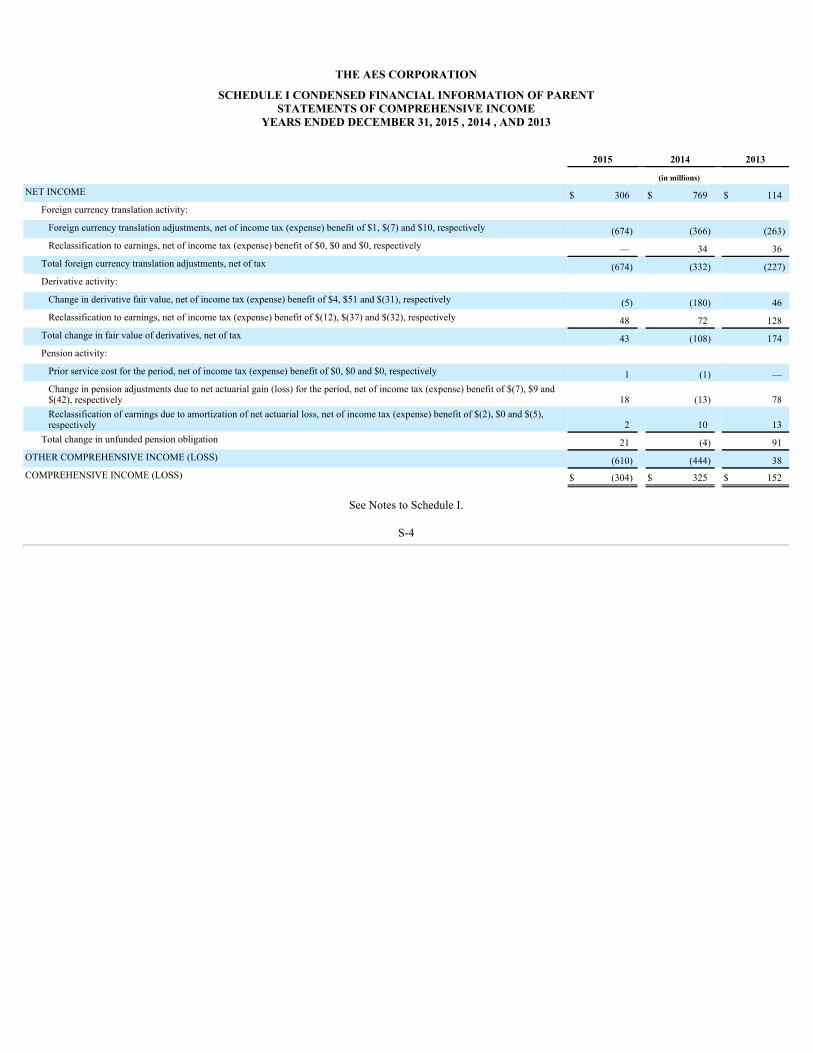
THE AES CORPORATION
SCHEDULE I CONDENSED FINANCIAL INFORMATION OF PARENTSTATEMENTS OF COMPREHENSIVE INCOME
YEARS ENDED DECEMBER 31, 2015 , 2014 , AND 2013
2015 2014 2013 (in millions)
NET INCOME $ 306 $ 769 $ 114Foreign currency translation activity:
Foreign currency translation adjustments, net of income tax (expense) benefit of $1, $(7) and $10, respectively (674) (366) (263)Reclassification to earnings, net of income tax (expense) benefit of $0, $0 and $0, respectively — 34 36
Total foreign currency translation adjustments, net of tax (674) (332) (227)Derivative activity:
Change in derivative fair value, net of income tax (expense) benefit of $4, $51 and $(31), respectively (5) (180) 46Reclassification to earnings, net of income tax (expense) benefit of $(12), $(37) and $(32), respectively 48 72 128
Total change in fair value of derivatives, net of tax 43 (108) 174Pension activity:
Prior service cost for the period, net of income tax (expense) benefit of $0, $0 and $0, respectively 1 (1) —Change in pension adjustments due to net actuarial gain (loss) for the period, net of income tax (expense) benefit of $(7), $9 and$(42), respectively 18 (13) 78Reclassification of earnings due to amortization of net actuarial loss, net of income tax (expense) benefit of $(2), $0 and $(5),respectively 2 10 13
Total change in unfunded pension obligation 21 (4) 91OTHER COMPREHENSIVE INCOME (LOSS) (610) (444) 38COMPREHENSIVE INCOME (LOSS) $ (304) $ 325 $ 152
See Notes to Schedule I.
S-4

THE AES CORPORATION
SCHEDULE I CONDENSED FINANCIAL INFORMATION OF PARENTSTATEMENTS OF CASH FLOWS
For the Years Ended December 31, 2015 2014 2013 (in millions)
Net cash provided by operating activities $ 475 $ 449 $ 418Investing Activities:
Expenses related to asset sales — (4) (5)Investment in and net advances to subsidiaries (221) (69) 201Return of capital 501 740 230Decrease in restricted cash 49 96 50Additions to property, plant and equipment (11) (31) (11)(Purchase) sale of short term investments, net — (1) 1
Net cash provided by (used in) investing activities 318 731 466Financing Activities:
Borrowings (payments) under the revolver, net — — —Borrowings of notes payable and other coupon bearing securities 575 1,525 750Repayments of notes payable and other coupon bearing securities (915) (2,117) (1,210)Loans (to) from subsidiaries — 263 (152)Purchase of treasury stock (482) (308) (322)Proceeds from issuance of common stock 4 1 13Common stock dividends paid (276) (144) (119)Payments for deferred financing costs (6) (20) (17)Other Financing (18) — —
Net cash (used in) provided by financing activities (1,118) (800) (1,057)Effect of exchange rate changes on cash — — (1)Increase (decrease) in cash and cash equivalents (325) 380 (174)Cash and cash equivalents, beginning 511 131 305Cash and cash equivalents, ending $ 186 $ 511 $ 131Supplemental Disclosures:
Cash payments for interest, net of amounts capitalized $ 314 $ 373 $ 442Cash payments for income taxes, net of refunds $ — $ (2) $ 11
See Notes to Schedule I.
S-5
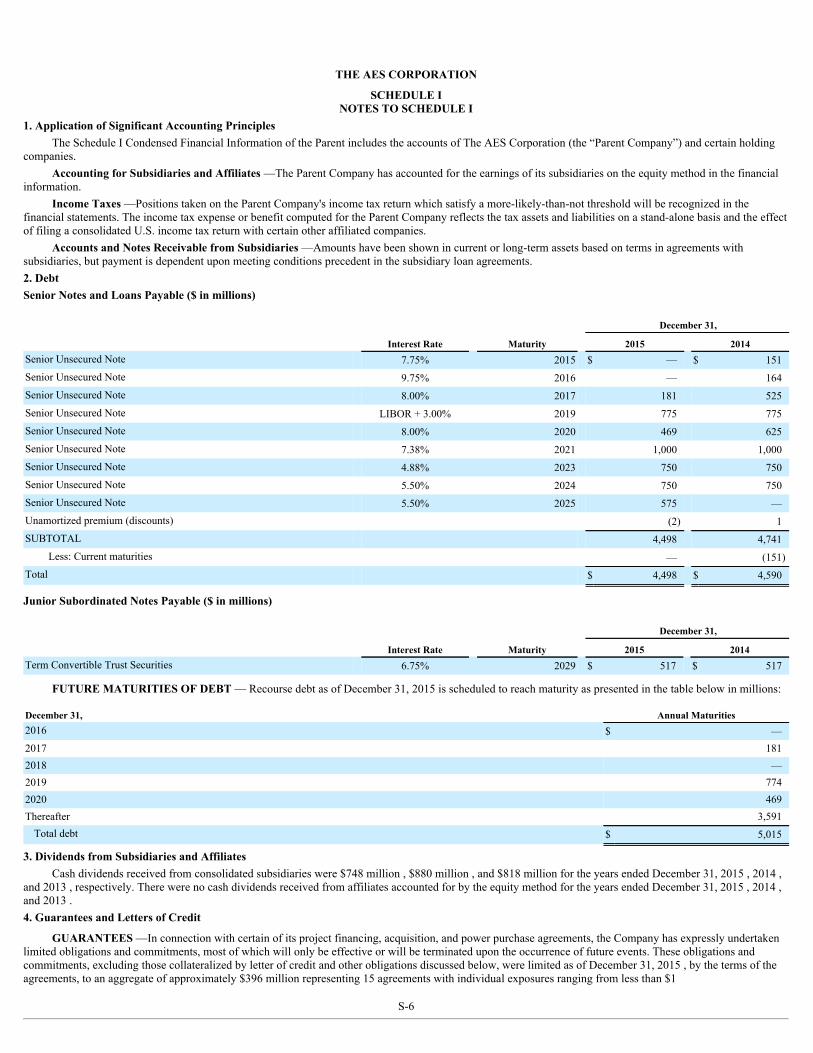
THE AES CORPORATION
SCHEDULE INOTES TO SCHEDULE I
1. Application of Significant Accounting PrinciplesThe Schedule I Condensed Financial Information of the Parent includes the accounts of The AES Corporation (the “Parent Company”) and certain holding
companies.Accounting for Subsidiaries and Affiliates —The Parent Company has accounted for the earnings of its subsidiaries on the equity method in the financial
information.Income Taxes —Positions taken on the Parent Company's income tax return which satisfy a more-likely-than-not threshold will be recognized in the
financial statements. The income tax expense or benefit computed for the Parent Company reflects the tax assets and liabilities on a stand-alone basis and the effectof filing a consolidated U.S. income tax return with certain other affiliated companies.
Accounts and Notes Receivable from Subsidiaries —Amounts have been shown in current or long-term assets based on terms in agreements withsubsidiaries, but payment is dependent upon meeting conditions precedent in the subsidiary loan agreements.2. DebtSenior Notes and Loans Payable ($ in millions)
December 31,
Interest Rate Maturity 2015 2014Senior Unsecured Note 7.75% 2015 $ — $ 151Senior Unsecured Note 9.75% 2016 — 164Senior Unsecured Note 8.00% 2017 181 525Senior Unsecured Note LIBOR + 3.00% 2019 775 775Senior Unsecured Note 8.00% 2020 469 625Senior Unsecured Note 7.38% 2021 1,000 1,000Senior Unsecured Note 4.88% 2023 750 750Senior Unsecured Note 5.50% 2024 750 750Senior Unsecured Note 5.50% 2025 575 —Unamortized premium (discounts) (2) 1SUBTOTAL 4,498 4,741
Less: Current maturities — (151)Total $ 4,498 $ 4,590
Junior Subordinated Notes Payable ($ in millions)
December 31,
Interest Rate Maturity 2015 2014Term Convertible Trust Securities 6.75% 2029 $ 517 $ 517
FUTURE MATURITIES OF DEBT — Recourse debt as of December 31, 2015 is scheduled to reach maturity as presented in the table below in millions:
December 31, Annual Maturities2016 $ —2017 1812018 —2019 7742020 469Thereafter 3,591
Total debt $ 5,015
3. Dividends from Subsidiaries and AffiliatesCash dividends received from consolidated subsidiaries were $748 million , $880 million , and $818 million for the years ended December 31, 2015 , 2014 ,
and 2013 , respectively. There were no cash dividends received from affiliates accounted for by the equity method for the years ended December 31, 2015 , 2014 ,and 2013 .4. Guarantees and Letters of Credit
GUARANTEES —In connection with certain of its project financing, acquisition, and power purchase agreements, the Company has expressly undertakenlimited obligations and commitments, most of which will only be effective or will be terminated upon the occurrence of future events. These obligations andcommitments, excluding those collateralized by letter of credit and other obligations discussed below, were limited as of December 31, 2015 , by the terms of theagreements, to an aggregate of approximately $396 million representing 15 agreements with individual exposures ranging from less than $1
S-6

million up to $53 million . These amounts exclude normal and customary representations and warranties in agreements for the sale of assets (including ownershipin associated legal entities) where the associated risk is considered to be nominal.
LETTERS OF CREDIT —At December 31, 2015 , the Company had $62 million in letters of credit outstanding under the senior unsecured credit facilityrepresenting 7 agreements with individual exposures ranging from less than $1 million up to $29 million , which operate to guarantee performance relating tocertain project development and construction activities and subsidiary operations. At December 31, 2015 , the Company had $32 million in cash collateralizedletters of credit outstanding representing 4 agreements with individual exposures ranging from $1 million up to $15 million , which operate to guaranteeperformance relating to certain project development and construction activities and subsidiary operations. During 2015 , the Company paid letter of credit feesranging from 0.2% to 2.5% per annum on the outstanding amounts.
SCHEDULE IIVALUATION AND QUALIFYING ACCOUNTS
(in millions)Balance at Beginning of the
Period Charged to Cost
and Expense Amounts Written off TranslationAdjustment
Balance at the End of thePeriod
Allowance for accounts receivables (current and noncurrent)
Year Ended December 31, 2013 $ 195 $ 38 $ (77) $ (22) $ 134Year Ended December 31, 2014 134 61 (88) (11) 96Year Ended December 31, 2015 96 88 (60) (29) 95
S-7

PERFORMANCE STOCK UNIT AWARD AGREEMENTPURSUANT TO
THE AES CORPORATION 2003 LONG TERM COMPENSATION PLAN
The AES Corporation, a Delaware corporation (the “Company”), grants to the Employee named below, pursuant to The AESCorporation 2003 Long Term Compensation Plan, as amended (the “Plan”), and this Performance Stock Unit Award Agreement(this “Agreement”), this Award of Performance Stock Units (“PSUs”) upon the terms and conditions set forth herein. Capitalizedterms not otherwise defined herein will each have the meaning assigned to them in the Plan.
1. This Award of PSUs is subject to all terms and conditions of this Agreement and the Plan, the terms of which are incorporatedherein by reference:
Name of Employee:
Fidelity System ID:
Grant Date:
Grant Price:
Target Number of PSUs Granted:
2. Each PSU represents a right to receive one Share on the Payment Date (as defined below) in accordance with the terms of this
Agreement.
3. Unless otherwise determined by the Committee, each PSU shall also represent a right to receive an additional amount,payable in cash, equal to the accumulated cash dividends paid by the Company on the PSU between the Grant Date andpayout of the PSU (if any). The additional dividend amounts that are accumulated subject to a PSU will be subject to the sameterms and conditions (including, without limitation, any applicable vesting requirements and forfeiture provisions) as the PSUto which they relate under the Award. Any payment due to the Employee under this Agreement shall be made promptlyfollowing the date vested PSUs become earned and payable under paragraph 5(a), paragraph 6 or paragraph 7 of thisAgreement, as applicable (the “Payment Date”), but in no event later than March 15th of the calendar year following thecalendar year containing the Payment Date.
4. A PSU carries no voting rights and the holder of a PSU will not have an equity interest in the Company or any shareholderrights, unless the vesting and performance conditions of the PSU are met and the PSU is paid out.
5. This Award of PSUs will vest, in accordance with and subject to the terms of this Agreement, in three equal installments onDecember 31st in each year during the Performance Period (each a “Vesting Date”), provided, however, that if:
(a) the Employee Separates from Service prior to the end of the Performance Period by reason of the Employee’s death or a
Separation from Service on account of Disability, all PSUs that have not previously vested shall vest and the Employee’sPSUs referenced in the chart above shall be paid to the Employee at the rate of one Share for each PSU;
(b) if (i) the Employee Separates from Service prior to the Payment Date by reason of a Separation from Service by theCompany for Cause (as defined in the Plan and as may otherwise be determined by the Committee in its sole discretion)or (ii) the Employee Separates from Service prior to the final Vesting Date by reason of a voluntary Separation fromService by the Employee (including any retirement other than a Qualified Retirement (as defined below)), this Award ofPSUs (including any time-vested portion) shall immediately upon such termination be cancelled and forfeited withoutpayment or further obligation by the Company; and
(c) if the Employee Separates from Service for any other reason, including, but not limited to, on account of a QualifiedRetirement, by reason of a death or Disability subsequent to the end of the Performance Period, or by reason of aSeparation from Service by the Company other than for Cause (other than for Cause, voluntarily by the Employee not aspart of a Qualified Retirement or due to death or Disability as provided in paragraphs 5(a) and 5(b)), the Employee willbe eligible to receive the value of his or her vested PSUs, as of the date of the Separation from Service, on the PaymentDate in accordance with and subject to the terms set forth in paragraph 6 below.
Any PSUs that have not vested prior to the date that an Employee Separates from Service for any reason (other than byreason of death or Disability as provided in paragraph 5(a)), (i) will not subsequently vest; and (ii) will be immediatelycancelled and forfeited without payment or further obligation by the Company or any Affiliate. In addition, the Employee’sright to receive Shares in respect of vested PSUs that have not been forfeited will be paid on the Payment Date if, and only if,all relevant performance conditions are met, in accordance with the terms and conditions of this Agreement and the Plan. Forpurposes of this Agreement, “Qualified Retirement” means the Employee’s retirement at a time when such Employee is atleast 60 years of age and has had at least seven years of service as an employee of the Company and/or one or more of itsAffiliates.
6. The Company will issue and deliver Shares in satisfaction of vested PSUs subject to and conditioned upon the attainment of
the performance conditions set forth below, as approved by the Committee at the time of grant; provided, however,notwithstanding the performance level achieved, the Committee may reduce the number of PSUs earned or terminate this
2
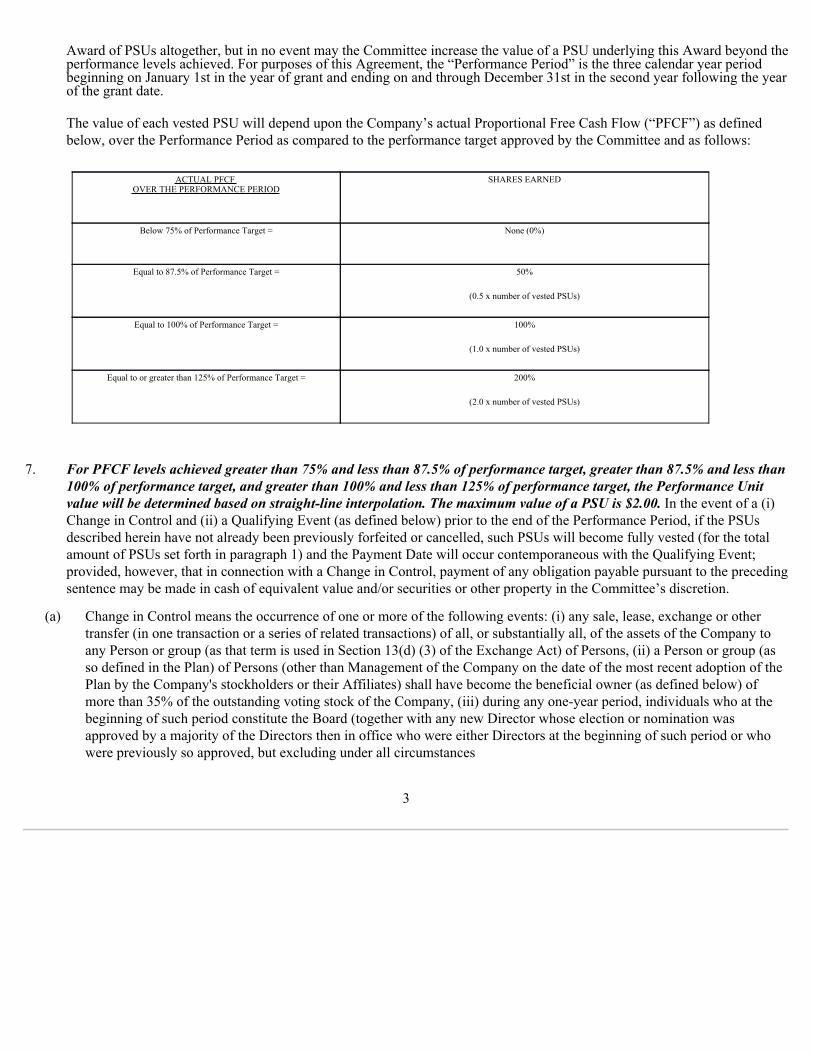
Award of PSUs altogether, but in no event may the Committee increase the value of a PSU underlying this Award beyond theperformance levels achieved. For purposes of this Agreement, the “Performance Period” is the three calendar year periodbeginning on January 1st in the year of grant and ending on and through December 31st in the second year following the yearof the grant date.
The value of each vested PSU will depend upon the Company’s actual Proportional Free Cash Flow (“PFCF”) as definedbelow, over the Performance Period as compared to the performance target approved by the Committee and as follows:
ACTUAL PFCF OVER THE PERFORMANCE PERIOD
SHARES EARNED
Below 75% of Performance Target = None (0%)
Equal to 87.5% of Performance Target = 50%
(0.5 x number of vested PSUs)
Equal to 100% of Performance Target = 100%
(1.0 x number of vested PSUs)
Equal to or greater than 125% of Performance Target = 200%
(2.0 x number of vested PSUs)
7. For PFCF levels achieved greater than 75% and less than 87.5% of performance target, greater than 87.5% and less than100% of performance target, and greater than 100% and less than 125% of performance target, the Performance Unitvalue will be determined based on straight-line interpolation. The maximum value of a PSU is $2.00. In the event of a (i)Change in Control and (ii) a Qualifying Event (as defined below) prior to the end of the Performance Period, if the PSUsdescribed herein have not already been previously forfeited or cancelled, such PSUs will become fully vested (for the totalamount of PSUs set forth in paragraph 1) and the Payment Date will occur contemporaneous with the Qualifying Event;provided, however, that in connection with a Change in Control, payment of any obligation payable pursuant to the precedingsentence may be made in cash of equivalent value and/or securities or other property in the Committee’s discretion.
(a) Change in Control means the occurrence of one or more of the following events: (i) any sale, lease, exchange or othertransfer (in one transaction or a series of related transactions) of all, or substantially all, of the assets of the Company toany Person or group (as that term is used in Section 13(d) (3) of the Exchange Act) of Persons, (ii) a Person or group (asso defined in the Plan) of Persons (other than Management of the Company on the date of the most recent adoption of thePlan by the Company's stockholders or their Affiliates) shall have become the beneficial owner (as defined below) ofmore than 35% of the outstanding voting stock of the Company, (iii) during any one-year period, individuals who at thebeginning of such period constitute the Board (together with any new Director whose election or nomination wasapproved by a majority of the Directors then in office who were either Directors at the beginning of such period or whowere previously so approved, but excluding under all circumstances
3

any such new Director whose initial assumption of office occurs as a result of an actual or threatened election contest orother actual or threatened solicitation of proxies or consents by or on behalf of any individual, corporation, partnership orother entity or group, including through the use of proxy access procedures as may be provided in the Company’s bylaws)cease to constitute a majority of the Board, or (iv) the consummation of a merger, consolidation, business combination orsimilar transaction involving the Company unless securities representing 65% or more of the then outstanding votingstock of the corporation resulting from such transaction are held subsequent to such transaction by the Person or Personswho were the beneficial owners of the outstanding voting stock of the Company immediately prior to such transaction insubstantially the same proportions as their ownership immediately prior to such transaction. Notwithstanding theforegoing or any provision to the contrary, if an Award is subject to Section 409A (and not excepted therefrom) and aChange in Control is a distribution event for purposes of an Award, the foregoing definition of Change in Control shall beinterpreted, administered and construed in a manner necessary to ensure that the occurrence of any such event shall resultin a Change in Control only if such event qualifies as a change in the ownership or effective control of a corporation, or achange in the ownership of a substantial portion of the assets of a corporation, as applicable, within the meaning of Treas.Reg. § 1.409A-3(i)(5). For purposes of this Agreement, “beneficial owner(s)” shall have the meaning set forth in Rule13d-3 of the Exchange Act.
(b) Qualifying Event means the occurrence of one or more of the following events: (i) immediately upon the consummationof a Change in Control Event, failure of the successor company in a Change in Control event to provide SubstituteAwards that are substantially similar in both nature and terms (including having an equivalent realizable pre-tax value tooutstanding awards assuming vesting and delivery at the consummation of the Change in Control); (ii) within two years ofthe consummation of a Change in Control event, an involuntary termination without Cause of the Employee; or (iii)within two years of the consummation of a Change in Control event, a Good Reason Termination (as defined below) bythe Employee.
(c) Good Reason Termination means, without an Employee’s written consent, the Separation From Service (for reasons otherthan death, Disability or Cause) by an Employee due to any of the following events occurring within two years of theconsummation of a Change in Control: (i) the relocation of an Employee’s principal place of employment to a locationthat is more than 50 miles from the principal place of employment in effect immediately prior to such Change in Control;(ii) a material diminution in the duties or responsibilities of an Employee from those in place immediately prior to suchChange in Control; and (iii) a material reduction in the base salary or annual incentive opportunity of an Employee fromwhat was in place immediately prior to such Change in Control.
In order for Employee to terminate for Good Reason, (i) Employee must notify the successor entity in writing, withinninety (90) days of the event constituting Good Reason, of the Employee’s intent to terminate employment for GoodReason, that
4
specifically identifies in reasonable detail the manner of the Good Reason event, (ii) the event must remain uncorrectedfor thirty (30) days following the date that Employee notifies the successor entity in writing of Employee’s intent toterminate employment for Good Reason (the “Notice Period”), and (iii) the termination date must occur within sixty (60)days after expiration of the Notice Period.
8. It is intended that under current U.S. federal income tax laws, the Employee will not be subject to income tax unless and untilShares are delivered to the Employee on the Payment Date, at which time the Fair Market Value of the Shares will bereportable as ordinary income, and subject to income tax withholding as well as social security and Medicare (FICA) taxes.The Employee must pay all applicable Federal and state income and employment withholding taxes when due in such manneras approved by the Committee or the Plan Administrator. The Employee should consult his or her personal advisor todetermine the effect of this Award of PSUs on his or her own tax situation.
9. Notices hereunder and under the Plan, if to the Company, will be delivered to the Plan Administrator (as so designated by theCompany) or mailed to the Company’s principal office, 4300 Wilson Boulevard, Arlington, VA 22203, attention of the PlanAdministrator, or, if to the Employee, will be delivered to the Employee, which may include electronic delivery, or mailed tohis or her address as the same appears on the records of the Company.
10. All decisions and interpretations made by the Board of Directors or the Committee with regard to any question arisinghereunder or under the Plan will be binding and conclusive on all persons. Unless otherwise specifically provided herein, inthe event of any inconsistency between the terms of this Agreement and the Plan, the Plan will govern.
11. By accepting this Award of PSUs, the Employee acknowledges receipt of a copy of the Plan and the prospectus relating tothis Award of PSUs, and agrees to be bound by the terms and conditions set forth in this Agreement and the Plan, as in effectand/or amended from time to time.
The Employee further acknowledges that the Plan and related documents, which may include the Plan prospectus, may bedelivered electronically. Such means of delivery may include the delivery of a link to a Company intranet site or the internetsite of a third party involved in administering the Plan, the delivery of the documents via e-mail or CD-ROM or such otherdelivery determined at the Plan Administrator’s discretion. The Employee acknowledges that the Employee may receive fromthe Company a paper copy of any documents delivered electronically at no cost if the Employee contacts the HumanResources department of the Company by telephone at (703) 682-6553 or by mail to 4300 Wilson Boulevard, Suite 1100,Arlington, Virginia 22203. The Employee further acknowledges that the Employee will be provided with a paper copy of anydocuments delivered electronically if electronic delivery fails.
12. This Award is intended to be excepted from coverage under Section 409A of the Code and shall be administered, interpretedand construed accordingly. The Employee shall have no right to designate the date of any payment under this Agreement.Each payment under this
5

Agreement is intended to be excepted under the short-term deferral exception as specified in Treas. Reg. § 1.409A-1(b)(4).The Company may, in its sole discretion and without the Employee’s consent, modify or amend the terms and conditions ofthis Award, impose conditions on the timing and effectiveness of the issuance of the Shares, or take any other action it deemsnecessary or advisable, to cause this Award to comply with Section 409A of the Code (or an exception thereto).
Notwithstanding, the Employee recognizes and acknowledges that Section 409A of the Code may impose upon the Employeecertain taxes or interest charges for which the Employee is and shall remain solely responsible.
13. Notwithstanding any other provisions in this Agreement, any PSUs subject to recovery under any law, government regulation,stock exchange listing requirement, or Company policy, shall be subject to such deductions, recoupment and clawback as maybe required to be made pursuant to such law, government regulation, stock exchange listing requirement or Company policy,as may be in effect from time to time, and which may operate to create additional rights for the Company with respect to thisAward and recovery of amounts relating thereto. By accepting this Award, Employee agrees and acknowledges that he or sheis obligated to cooperate with, and provide any and all assistance necessary to, the Company to recover, recoup or recapturethis Award or amounts paid under the Plan pursuant to such law, government regulation, stock exchange listing requirementor Company policy. Such cooperation and assistance shall include, but is not limited to, executing, completing and submittingany documentation necessary to recover, recoup or recapture this Award or amounts paid under the Plan from Employee’saccounts, or pending or future compensation or other grants.
14. This Agreement will be governed by the laws of the State of Delaware without giving effect to its choice of law provisions.
The AES CORPORATION
By:
Tish MendozaSenior Vice President and Chief Human Resources Officer
6
RESTRICTED STOCK UNIT AWARD AGREEMENT PURSUANT TO
THE AES CORPORATION 2003 LONG TERM COMPENSATION PLAN
The AES Corporation, a Delaware corporation (the “Company”), grants to the Employee named below, pursuant to The AESCorporation 2003 Long Term Compensation Plan, as amended (the “Plan”), and this Restricted Stock Unit Award Agreement (this“Agreement”), this Award of Restricted Stock Units (“RSUs”) upon the terms and conditions set forth herein. Capitalized terms nototherwise defined herein will each have the meaning assigned to them in the Plan.
1. This Award of RSUs is subject to all terms and conditions of this Agreement and the Plan, the terms of which areincorporated herein by reference:
Name of Employee:
Fidelity System ID:
Grant Date:
Grant Price:
Total Number of RSUs Granted:
2.Each RSU represents a right to receive one Share on the appropriate Vesting Date (as defined below) in accordance with the termsof this Agreement.
3.Unless otherwise determined by the Committee, each RSU shall also represent a right to receive an additional amount, payable incash, equal to the accumulated cash dividends paid by the Company on the RSU between the Grant Date and the VestingDate (as defined below) for the RSU. The additional dividend amounts that are accumulated subject to an RSU will besubject to the same terms and conditions (including, without limitation, any applicable vesting requirements and forfeitureprovisions) as the RSU to which they relate under the Award. Any payment due to the Employee under this Agreementshall be made promptly following the date the RSUs vest under paragraph 4
1
or 5 of this Agreement, but in no event later than March 15th of the calendar year following the calendar year in which theRSUs vest.
4.An RSU carries no voting rights and the holder will not have an equity interest in the Company or any shareholder rights, unlessthe vesting conditions of the RSU are met and the RSU is paid out with Shares.
5.This Award of RSUs will vest, in accordance with and subject to the terms of this Agreement, in three equal installments on eachof the first three anniversaries of the grant date (each a “Vesting Date”) provided, however, that if:
(A) the Employee Separates from Service prior to the applicable Vesting Date due to the Employee’s death or aSeparation from Service on account of Disability, all RSUs that have not previously vested shall vest and be paid tothe Employee; and
(B) if the Employee Separates from Service prior to the applicable Vesting Date for any reason other than the Employee’sdeath or Disability , including, but not limited to, voluntarily by the Employee, on account of Retirement, or byreason of a Separation from Service by the Company with or without Cause ( as defined in the Plan and as mayotherwise be determined by the Committee in its sole discretion ), all RSUs that have not previously vested shall beimmediately cancelled and forfeited without payment or further obligation by the Company or any Affiliate.
6.In the event of a (i) Change in Control and (ii) a Qualifying Event (as defined below) prior to the applicable Vesting Date, if theRSUs described herein have not already been previously forfeited or cancelled, such RSUs will become fully vestedcontemporaneous with the Qualifying Event; provided, however, that in connection with a Change in Control, payment ofany obligation payable pursuant to the preceding sentence may be made in cash of equivalent value and/or securities orother property in the Committee’s discretion.
(A) Change in Control means the occurrence of one or more of the following events: (i) any sale, lease, exchange or othertransfer (in one transaction or a series of related transactions) of all, or substantially all, of the assets ofthe Company to any Person or group (as that term is used in Section 13(d) (3) of the Exchange Act) ofPersons, (ii) a Person or group (as so defined in the Plan) of Persons (other than Management of theCompany on the date of the most recent adoption of the Plan by the Company's stockholders or theirAffiliates) shall have become the beneficial owner (as defined below) of more than 35% of theoutstanding voting stock of the Company, (iii) during any one-year period, individuals who at
2

the beginning of such period constitute the Board (together with any new Director whose election or nomination wasapproved by a majority of the Directors then in office who were either Directors at the beginning of such period orwho were previously so approved, but excluding under all circumstances any such new Director whose initialassumption of office occurs as a result of an actual or threatened election contest or other actual or threatenedsolicitation of proxies or consents by or on behalf of any individual, corporation, partnership or other entity or group,including through the use of proxy access procedures as may be provided in the Company’s bylaws) cease toconstitute a majority of the Board, or (iv) the consummation of a merger, consolidation, business combination orsimilar transaction involving the Company unless securities representing 65% or more of the then outstanding votingstock of the corporation resulting from such transaction are held subsequent to such transaction by the Person orPersons who were the beneficial owners of the outstanding voting stock of the Company immediately prior to suchtransaction in substantially the same proportions as their ownership immediately prior to such transaction.Notwithstanding the foregoing or any provision to the contrary, if an Award is subject to Section 409A (and notexcepted therefrom) and a Change in Control is a distribution event for purposes of an Award, the foregoingdefinition of Change in Control shall be interpreted, administered and construed in a manner necessary to ensure thatthe occurrence of any such event shall result in a Change in Control only if such event qualifies as a change in theownership or effective control of a corporation, or a change in the ownership of a substantial portion of the assets of acorporation, as applicable, within the meaning of Treas. Reg. § 1.409A-3(i)(5). For purposes of this Agreement,“beneficial owner(s)” shall have the meaning set forth in Rule 13d-3 of the Exchange Act.
(B) Qualifying Event means the occurrence of one or more of the following events: (i) immediately upon theconsummation of a Change in Control Event, failure of the successor company in a Change in Controlevent to provide Substitute Awards that are substantially similar in both nature and terms (includinghaving an equivalent realizable pre-tax value to outstanding Awards assuming vesting and delivery atthe consummation of the Change in Control); (ii) within two years of the consummation of a Change inControl event, an involuntary termination without Cause of the Employee; or (iii) within two years ofthe consummation of a Change in Control event, a Good Reason Termination (as defined below) bythe Employee.
(C) Good Reason Termination means, without an Employee’s written consent, the Separation From Service (for reasonsother than death, Disability or Cause) by an
3

Employee due to any of the following events occurring within two years of the consummation of a Change in Control:(i) the relocation of an Employee’s principal place of employment to a location that is more than 50 miles from theprincipal place of employment in effect immediately prior to such Change in Control; (ii) a material diminution in theduties or responsibilities of an Employee from those in place immediately prior to such Change in Control; and (iii) amaterial reduction in the base salary or annual incentive opportunity of an Employee from what was in placeimmediately prior to such Change in Control.
In order for Employee to terminate for Good Reason, (i) Employee must notify the successor entity in writing, withinninety (90) days of the event constituting Good Reason, of the Employee’s intent to terminate employment for GoodReason, that specifically identifies in reasonable detail the manner of the Good Reason event, (ii) the event mustremain uncorrected for thirty (30) days following the date that Employee notifies the successor entity in writing ofEmployee’s intent to terminate employment for Good Reason (the “Notice Period”), and (iii) the termination datemust occur within sixty (60) days after expiration of the Notice Period.
7.It is intended that under current U.S. federal income tax laws, the Employee will not be subject to income tax unless and untilShares and/or cash are delivered to the Employee on the Vesting Date, at which time the Fair Market Value of the Sharesand/or cash will be reportable as ordinary income, and subject to income tax withholding as well as social security andMedicare (FICA) taxes. The Employee must pay all applicable federal and state income and employment withholding taxeswhen due in such manner as approved by the Committee or Plan Administrator. The Employee should consult his or herpersonal advisor to determine the effect of this Award of RSUs on his or her own tax situation.
8.Notices hereunder and under the Plan, if to the Company, will be delivered to the Plan Administrator (as so designated by theCompany) or mailed to the Company’s principal office, 4300 Wilson Boulevard, Arlington, VA 22203, attention of thePlan Administrator, or, if to the Employee, will be delivered to the Employee, which may include electronic delivery, ormailed to his or her address as the same appears on the records of the Company.
9.All decisions and interpretations made by the Board of Directors or the Committee with regard to any question arising hereunder orunder the Plan will be binding and conclusive on all persons. Unless otherwise specifically provided herein, in the event ofany inconsistency between the terms of this Agreement and the Plan, the Plan will govern.
4

10.By accepting this Award of RSUs, the Employee acknowledges receipt of a copy of the Plan and the prospectus relating to thisAward of RSUs, and agrees to be bound by the terms and conditions set forth in this Agreement and the Plan, as in effectand/or amended from time to time.
The Employee further acknowledges that the Plan and related documents, which may include the Plan prospectus, may bedelivered electronically. Such means of delivery may include the delivery of a link to a Company intranet site or theinternet site of a third party involved in administering the Plan, the delivery of the documents via e-mail or CD-ROM orsuch other delivery determined at the Plan Administrator’s discretion. The Employee acknowledges that the Employeemay receive from the Company a paper copy of any documents delivered electronically at no cost if the Employeecontacts the Human Resources department of the Company by telephone at (703) 682-6553 or by mail to 4300 WilsonBoulevard, Suite 1100, Arlington, Virginia 22203. The Employee further acknowledges that the Employee will beprovided with a paper copy of any documents delivered electronically if electronic delivery fails.
11.This Award is intended to be excepted from coverage under Section 409A of the Code and shall be administered, interpreted andconstrued accordingly. The Employee shall have no right to designate the date of any payment under this Agreement.Each payment under this Agreement is intended to be excepted under the short-term deferral exception as specified inTreas. Reg. § 1.409A-1(b)(4). The Company may, in its sole discretion and without the Employee’s consent, modify oramend the terms and conditions of this Award, impose conditions on the timing and effectiveness of the issuance of theShares, or take any other action it deems necessary or advisable, to cause this Award to comply with Section 409A of theCode (or an exception thereto). Notwithstanding, the Employee recognizes and acknowledges that Section 409A of theCode may impose upon the Employee certain taxes or interest charges for which the Employee is and shall remain solelyresponsible.
12.Notwithstanding any other provisions in this Agreement, any RSUs subject to recovery under any law, government regulation,stock exchange listing requirement, or Company policy, shall be subject to such deductions, recoupment and clawback asmay be required to be made pursuant to such law, government regulation, stock exchange listing requirement or Companypolicy, as may be in effect from time to time, and which may operate to create additional rights for the Company withrespect to this Award and recovery of amounts relating thereto. By accepting this Award, Employee agrees andacknowledges that he or she is obligated to cooperate with, and provide any and all assistance necessary to, the Companyto recover, recoup or recapture this Award or amounts paid under the Plan pursuant to such law, government regulation,stock
5

exchange listing requirement or Company policy. Such cooperation and assistance shall include, but is not limited to,executing, completing and submitting any documentation necessary to recover, recoup or recapture this Award or amountspaid under the Plan from Employee’s accounts, or pending or future compensation or other grants.
13.This Agreement will be governed by the laws of the State of Delaware without giving effect to its choice of law provisions.
The AES CORPORATION
By: Tish Mendoza Senior Vice President and Chief Human Resources Officer
6

PERFORMANCE UNIT AWARD AGREEMENT PURSUANT TO
THE AES CORPORATION 2003 LONG TERM COMPENSATION PLAN
The AES Corporation, a Delaware Corporation (the “Company”), grants to the Employee named below, pursuant to The AESCorporation 2003 Long Term Compensation Plan, as amended (the “Plan”), and this Performance Unit Award Agreement (this“Agreement”), this Award of Performance Units (“Performance Units”), the value of which is related to and contingent upon theachievement of a predetermined performance targets (as set forth herein). Capitalized terms not otherwise defined herein shall eachhave the meaning assigned to them in the Plan.
1. This Award of Performance Units is subject to all terms and conditions of this Agreement and the Plan, the terms of whichare incorporated herein by reference:
Name of Employee:
Fidelity System ID:
Grant Date:
Target Number of Performance Units:
Target Value:
Notwithstanding any provision of the Plan to the contrary, this Award of Performance Units is subject to the terms andconditions of this Agreement and the Plan regardless of whether the Employee is a Covered Person, as defined in the Plan.
2. The Employee is hereby granted an Award of the total number of Performance Units (at target) set forth above. ThePerformance Units will be reflected in a book account by the Company during the Performance Period (as defined below).Contingent upon achieving or exceeding 75% or more of the Performance Target, the value of vested Performance Units, willbe paid in cash in the calendar year following the completion of the

Performance Period (the “Payment Date”), as soon as administratively practicable following the end of the PerformancePeriod.
3. The “Performance Period” is the three calendar year period beginning on January 1st in the year of grant and ending on andthrough December 31st in the second year following the year of the grant date.
4. Except as otherwise provided in this Agreement, this Award of Performance Units will vest, in accordance with and subjectto the terms of this Agreement, in three equal installments on December 31st in each year during the Performance Period(each a “Vesting Date”); provided, however, that if:
(A) the Employee Separates from Service prior to the end of the Performance Period by reason of the Employee’s deathor a Separation from Service on account of Disability, all Performance Units referenced in the chart above shall veston such termination date and a cash amount equal to $1 for each Performance Unit shall be paid to the Employee onthe date of Separation from Service (or as soon as practicable thereafter); provided, however, any payment due to theEmployee by reason of a Separation from Service on account of Disability shall be delayed to the extent required bySection 14(k)(i) of the Plan;
(B) (i) the Employee Separates from Service prior to the Payment Date by reason of a Separation from Service by theCompany for Cause (as defined in the Plan and as may otherwise be determined by the Committee in its solediscretion for all purposes of this Agreement) or (ii) the Employee Separates from Service prior to the final VestingDate by reason of a voluntary Separation from Service by the Employee (including any retirement other than aQualified Retirement (as defined below)), this Award of Performance Units (including any vested portion) will beforfeited in full and cancelled by the Company, and shall cease to be outstanding, upon such termination date; and
(C) the Employee Separates from Service for any other reason, including on account of a Qualified Retirement, by reasonof death or Disability subsequent to the end of the Performance Period, or by reason of a Separation from Service bythe Company (other than for cause, voluntarily by the Employee not as part of a Qualified Retirement or due to deathor Disability as provided in paragraphs 4(A) and 4(B)), the Employee will be eligible to receive the value of his or hervested Performance Units, as of the date of the Separation from Service, on the Payment Date in accordance with andsubject to the terms set forth in paragraph 5 below. For purposes of this Agreement, “Qualified Retirement” means theEmployee’s retirement at a time when such Employee is at least 60 years of age and has at
2

least seven years of service as an employee of the Company and/or one or more of its Affiliates.
Any Performance Units that have not vested on or before the date that an Employee Separates from Service for any reason(other than by reason of death or Disability as provided in Paragraph 4A), (i) will not subsequently vest; and (ii) will beimmediately cancelled and forfeited without payment or further obligation by the Company or any Affiliate. In addition, theEmployee’s right to receive the applicable Performance Unit value in respect of vested Performance Units that have not beenforfeited will be paid on the Payment Date, if, and only if, all relevant performance conditions are met, in accordance withthe terms and conditions of this Agreement and the Plan.
5. Each Performance Unit represents a right to receive the applicable Performance Unit value in the chart below, in cash on thePayment Date, if and only if, such Performance Unit (i) has not been forfeited prior to its Vesting Date and (ii) has vested inaccordance with the terms of this Agreement.
The value of each Performance Unit will depend upon the Company’s actual Proportional Free Cash Flow (“PFCF”) asdefined below, over the Performance Period as compared to the performance target approved by the Committee and asfollows:
ACTUAL PFCF OVER THE PERFORMANCE PERIOD
PERFORMANCE UNITVALUE
Below 75% of Performance Target = USD$0.00Equal to 87.5% of Performance Target = USD$0.50Equal to 100% of Performance Target = USD$1.00
Equal to or greater than 125% of Performance Target = USD$2.00For PFCF levels achieved greater than 75% and less than 87.5% of performance target, greater than 87.5% and less than100% of performance target, and greater than 100% and less than 125% of performance target, the Performance Unitvalue will be determined based on straight-line interpolation. The maximum value of a Performance Unit is $2.00.
Notwithstanding the performance level achieved, the Committee may reduce or terminate the Performance Units altogether,but in no event may the Committee increase the value of a Performance Unit underlying this Award of Performance Unitsbeyond the performance levels achieved.
6. Notwithstanding the foregoing, in the event of a (i) Change in Control (as defined below) and (ii) a Qualifying Event (asdefined below) prior to the end of the Performance Period, if the Performance Units described herein have not already beenpreviously forfeited or
3

cancelled, such Performance Units shall become fully vested (for the total number of Performance Units set forth inparagraph 1) and payable in a cash amount equal to $1.00 for each Performance Unit and the Payment Date will occurcontemporaneous with the Qualifying Event; provided, however, that in connection with a Change in Control, payment ofany obligation payable pursuant to the preceding sentence may be made in cash of equivalent value and/or securities or otherproperty in the Committee’s discretion.
(A) Change in Control means the occurrence of one or more of the following events: (i) any sale, lease, exchange or othertransfer (in one transaction or a series of related transactions) of all, or substantially all, of the assets of the Companyto any Person or group (as that term is used in Section 13(d) (3) of the Exchange Act) of Persons, (ii) a Person orgroup (as so defined in the Plan) of Persons (other than Management of the Company on the date of the most recentadoption of the Plan by the Company's stockholders or their Affiliates) shall have become the beneficial owner (asdefined below) of more than 35% of the outstanding voting stock of the Company, (iii) during any one-year period,individuals who at the beginning of such period constitute the Board (together with any new Director whose electionor nomination was approved by a majority of the Directors then in office who were either Directors at the beginningof such period or who were previously so approved, but excluding under all circumstances any such new Directorwhose initial assumption of office occurs as a result of an actual or threatened election contest or other actual orthreatened solicitation of proxies or consents by or on behalf of any individual, corporation, partnership or other entityor group, including through the use of proxy access procedures as may be provided in the Company’s bylaws) ceaseto constitute a majority of the Board, or (iv) the consummation of a merger, consolidation, business combination orsimilar transaction involving the Company unless securities representing 65% or more of the then outstanding votingstock of the corporation resulting from such transaction are held subsequent to such transaction by the Person orPersons who were the beneficial owners of the outstanding voting stock of the Company immediately prior to suchtransaction in substantially the same proportions as their ownership immediately prior to such transaction.Notwithstanding the foregoing or any provision to the contrary, if an Award is subject to Section 409A (and notexcepted therefrom) and a Change in Control is a distribution event for purposes of an Award, the foregoingdefinition of Change in Control shall be interpreted, administered and construed in a manner necessary to ensure thatthe occurrence of any such event shall result in a Change in Control only if such event qualifies as a change in theownership or effective control of a corporation, or a change in the ownership of a substantial portion of the assets of acorporation,
4

as applicable, within the meaning of Treas. Reg. § 1.409A-3(i)(5). For purposes of this Agreement, “beneficialowner(s)” shall have the meaning set forth in Rule 13d-3 of the Exchange Act.
(B) Qualifying Event means the occurrence of one or more of the following events: (i) immediately upon theconsummation of a Change in Control event, failure of the successor company in a Change in Control event toprovide Substitute Awards that are substantially similar in both nature and terms (including having an equivalentrealizable pre-tax value to the outstanding Awards assuming vesting and delivery at the consummation of the Changein Control); (ii) within two years of the consummation of a Change in Control event, an involuntary terminationwithout Cause of the Employee; or (iii) within two years of the consummation of a Change in Control event, a GoodReason Termination (as defined in Section 6(C) below) by the Employee.
(C) Good Reason Termination means, without an Employee’s written consent, the Separation from Service (for reasonsother than death, Disability or Cause) by an Employee due to any of the following events occurring within two yearsof the consummation of a Change in Control: (i) the relocation of an Employee’s principal place of employment to alocation that is more than 50 miles from the principal place of employment in effect immediately prior to suchChange in Control; (ii) a material diminution in the duties or responsibilities of an Employee from those in placeimmediately prior to such Change in Control; and (iii) a material reduction in the base salary or annual incentiveopportunity of an Employee from what was in place immediately prior to such Change in Control.
In order for an Employee to have a Good Reason Termination, (i) an Employee must notify the successor entity inwriting, within ninety (90) days of the event constituting Good Reason of the Employee’s intent to terminateemployment for Good Reason, that specifically identifies in reasonable detail the manner of the Good Reason event,(ii) the event must remain uncorrected for thirty (30) days following the date that an Employee notifies the successorentity in writing of the Employee’s intent to terminate employment for Good Reason (the “Notice Period”), and (iii)the termination date must occur within sixty (60) days after expiration of the Notice Period.
7. Notices hereunder and under the Plan, if to the Company, shall be delivered to the Plan Administrator (as so designated bythe Company) or mailed to the Company’s principal office, 4300 Wilson Boulevard, Arlington, VA 22203 (or assubsequently designated by the Company), attention of the Plan Administrator, or, if to the Employee, shall be
5

delivered to the Employee, which may include electronic delivery, or mailed to his or her address as the same appears on therecords of the Company.
8. All decisions and interpretations made by the Board of Directors or the Committee with regard to any question arisinghereunder or under the Plan shall be binding and conclusive on all persons. Unless otherwise specifically provided herein, inthe event of any inconsistency between the terms of the Plan and this Agreement, the terms of the Plan will govern.
9. By accepting this Award of Performance Units, the Employee acknowledges receipt of a copy of the Plan and the prospectusrelating to this Award of Performance Units, and agrees to be bound by the terms and conditions set forth in the Plan and thisAgreement, as in effect and/or amended from time to time.
The Employee further acknowledges that the Plan and related documents, which may include the Plan prospectus, may bedelivered electronically. Such means of delivery may include the delivery of a link to a Company intranet site or the internetsite of a third party involved in administering the Plan, the delivery of the documents via e-mail or CD-ROM or such otherdelivery determined at the Plan Administrator’s discretion. The Employee acknowledges that the Employee may receive fromthe Company a paper copy of any documents delivered electronically at no cost if the Employee contacts the HumanResources department of the Company by telephone at (703) 682-6553 or by mail to 4300 Wilson Boulevard, Suite 1100,Arlington, Virginia 22203. The Employee further acknowledges that the Employee will be provided with a paper copy of anydocuments delivered electronically if electronic delivery fails.
10. This Award is intended to satisfy the requirements of Section 409A of the Code (or an exception thereto) and shall beadministered, interpreted and construed accordingly. A payment shall be treated as made on the specified date of payment ifsuch payment is made at such date or a later date in the same calendar year or, if later, by the 15th day of the third calendarmonth following the specified date of payment, as provided and in accordance with Treas. Reg. § 1.409A-3(d). The Companymay, in its sole discretion and without the Employee’s consent, modify or amend the terms and conditions of this Award,impose conditions on the timings and effectiveness of the payment of the Performance Units, or take any other action itdeems necessary or advisable, to cause this Award to comply with Section 409A of the Code (or an exception thereto).Notwithstanding, the Employee recognizes and acknowledges that Section 409A of the Code may impose upon the Employeecertain taxes or interest charges for which the Employee is and shall remain solely responsible.
6

11. The Employee acknowledges that any income for federal, state or local income tax purposes that the Employee is required torecognize on account of the vesting of the Performance Units and/or payment in settlement of the Performance Units to theEmployee shall be subject to withholding of tax by the Company. In accordance with administrative procedures establishedby the Company, the Company shall mandatorily satisfy the Employee’s minimum statutory withholding tax obligations, ifany, by withholding from the payment in settlement of the Performance Units to be made to the Employee a sufficientamount equal to the applicable minimum statutory withholding tax obligation.
12. Notwithstanding any other provisions in this Agreement, any Performance Units subject to recovery under any law,government regulation, stock exchange listing requirement, or Company policy, shall be subject to such deductions,recoupment and clawback as may be required to be made pursuant to such law, government regulation, stock exchange listingrequirement or Company policy, as may be in effect from time to time, and which may operate to create additional rights forthe Company with respect to this Award and recovery of amounts relating thereto. By accepting this Award, Employeeagrees and acknowledges that he or she is obligated to cooperate with, and provide any and all assistance necessary to, theCompany to recover, recoup or recapture this Award or amounts paid under the Plan pursuant to such law, governmentregulation, stock exchange listing requirement or Company policy. Such cooperation and assistance shall include, but is notlimited to, executing, completing and submitting any documentation necessary to recover, recoup or recapture this Award oramounts paid under the Plan from Employee’s accounts, or pending or future compensation or other grants.
13. This Agreement will be governed by the laws of the State of Delaware without giving effect to its choice of law provisions.
The AES CORPORATION
By:Tish MendozaSenior Vice President and Chief Human Resources Officer
7
PERFORMANCE CASH UNIT AWARD AGREEMENT PURSUANT TO
THE AES CORPORATION 2003 LONG TERM COMPENSATION PLAN
The AES Corporation, a Delaware Corporation (the “Company”), grants to the Employee named below, pursuant to The AESCorporation 2003 Long Term Compensation Plan, as amended (the “Plan”), and this Performance Cash Unit Award Agreement (this“Agreement”), this Award of Performance Cash Units (“PCUs”), the value of which is related to and contingent upon theachievement of predetermined performance target (as set forth herein). Capitalized terms not otherwise defined herein shall eachhave the meaning assigned to them in the Plan.
1. This Award of PCUs is subject to all terms and conditions of this Agreement and the Plan, the terms of which areincorporated herein by reference:
Name of Employee:
Fidelity System ID:
Grant Date:
Target Number of PCUs:
Target Value:
Notwithstanding any provision of the Plan to the contrary, this Award of PCUs is subject to the terms and conditions of thisAgreement and the Plan regardless of whether the Employee is a Covered Person, as defined in the Plan.
2. The Employee is hereby granted an Award of the Target number of PCUs set forth above. The PCUs will be reflected in abook account by the Company during the Performance Period (as defined below). Contingent upon achieving requiredperformance levels, the value of vested PCUs, will be paid in cash in the calendar year following the completion of thePerformance Period (the “Payment Date”), as soon as administratively practicable following the end of the PerformancePeriod.

3. The “Performance Period” is the three calendar year period beginning on January 1st in the year of grant and ending on andthrough December 31st in the second year following the year of the grant date.
4. Except as otherwise provided in this Agreement, this Award of PCUs will vest, in accordance with and subject to the terms ofthis Agreement, in three equal installments on December 31st in each year during the Performance Period (each a “VestingDate”); provided, however, that if:
(A) the Employee Separates from Service prior to the end of the Performance Period by reason of the Employee’s deathor a Separation from Service on account of Disability, all PCUs referenced in the chart above shall vest on suchtermination date and a cash amount equal to $1 for each PCU shall be paid to the Employee on the date of Separationfrom Service (or as soon as practicable thereafter); provided, however, any payment due to the Employee by reason ofa Separation from Service on account of Disability shall be delayed to the extent required by Section 14(k)(i) of thePlan;
(B) (i) the Employee Separates from Service prior to the Payment Date by reason of a Separation from Service by theCompany for Cause (as defined in the Plan and as may otherwise be determined by the Committee in its solediscretion for all purposes of this Agreement) or (ii) the Employee Separates from Service prior to the final VestingDate by reason of a voluntary Separation from Service by the Employee (including any retirement other than aQualified Retirement (as defined below)), this Award of PCUs (including any vested portion) will be forfeited in fulland cancelled by the Company, and shall cease to be outstanding, upon such termination date; and
(C) the Employee Separates from Service for any other reason, including on account of a Qualified Retirement, by reasonof death or Disability subsequent to the end of the Performance Period, or by reason of a Separation from Service bythe Company (other than for Cause, voluntarily by the Employee not as part of a Qualified Retirement or due to deathor Disability as provided in paragraphs 4(A) and 4(B)), the Employee will be eligible to receive the value of his or hervested PCUs, as of the date of Separation from Service, on the Payment Date in accordance with and subject to theterms set forth in paragraph 5 below. For purposes of this Agreement, “Qualified Retirement” means the Employee’sretirement at a time when such Employee is at least 60 years of age and has at least seven years of service as anemployee of the Company and/or one or more of its Affiliates.
2

Any PCUs that have not vested on or before the date that an Employee Separates from Service for any reason (other than byreason of death or Disability as provided in paragraph 4(A)), (i) will not subsequently vest; and (ii) will be immediatelycancelled and forfeited without payment or further obligation by the Company or any Affiliate. In addition, the Employee’sright to receive the applicable PCU value in respect of vested PCUs that have not been forfeited will be paid on the PaymentDate, if, and only if, all relevant performance conditions are met, in accordance with the terms and conditions of thisAgreement and the Plan.
5. Each PCU represents a right to receive the applicable PCU value in the chart below, in cash on the Payment Date, if and onlyif, such PCU (i) has not been forfeited prior to its Vesting Date and (ii) has vested in accordance with the terms of thisAgreement.
The value of each PCU will depend upon the performance of the Total Shareholder Return of AES common stock (“AESTSR”) as compared to the Total Shareholder Return of companies in the peer groups listed below over the PerformancePeriod:
PEER GROUP INDEX PROPORTIONAL WEIGHTING
S&P Utilities Index 50%
S&P 500 Index 25%
MSCI Emerging Markets Index 25%
ACTUAL AES-TSR COMPARED TOEACH PEER GROUP INDEX FOR THE
PERFORMANCE PERIODINDEX SCORE
Below 30 th Percentile 0% Equal to the 30 th Percentile 50% Equal to the 50 th Percentile 100% Equal to or the 70 th Percentile 150%
Equal to or greater than 90 th Percentile 200%
For AES TSR levels achieved greater than the 30th percentile and less than the 50th percentile, greater than 50thpercentile and less than 70th percentile, and greater than the 70th percentile and less than the 90th percentile, the IndexScore will be determined based on straight-line interpolation. The maximum Index Score is 200%.
3

The AES TSR will be evaluated against each of the separate peer group indices separately to determine the three indexscores. The overall performance value for a PCU will be equal to:
The number of vested PCUs x $1.00 x [(S&P 500 Utilities Index Score x 50%) + (S&P 500 Index Score x 25%) + (MSCIEmerging Markets Index Score x 25%)] = Total Earned PCU Value
Notwithstanding the performance level achieved, the Committee may reduce or terminate the PCUs altogether, but in noevent may the Committee increase the value of a PCU underlying this Award beyond the performance levels achieved.
6. Notwithstanding the foregoing, in the event of a (i) Change in Control (as defined below) and (ii) a Qualifying Event (asdefined below) prior to the end of the Performance Period, if the PCUs described herein have not already been previouslyforfeited or cancelled, such PCUs shall become fully vested (for the Target number of PCUs set forth in paragraph 1) andpayable in a cash amount equal to $1.00 for each PCU, and the Payment Date will occur contemporaneous with theQualifying Event; provided, however, that in connection with a Change in Control, payment of any obligation payablepursuant to the preceding sentence may be made in cash of equivalent value and/or securities or other property in theCommittee’s discretion.
(A) Change in Control means the occurrence of one or more of the following events: (i) any sale, lease, exchange or othertransfer (in one transaction or a series of related transactions) of all, or substantially all, of the assets of the Companyto any Person or group (as that term is used in Section 13(d) (3) of the Exchange Act) of Persons, (ii) a Person orgroup (as defined in the Plan) of Persons (other than Management of the Company on the date of the most recentadoption of the Plan by the Company's stockholders or their Affiliates) shall have become the beneficial owner (asdefined below) of more than 35% of the outstanding voting stock of the Company, (iii) during any one-year period,individuals who at the beginning of such period constitute the Board (together with any new Director whose electionor nomination was approved by a majority of the Directors then in office who were either Directors at the beginningof such period or who were previously so approved, but excluding under all circumstances any such new Directorwhose initial assumption of office occurs as a result of an actual or threatened election contest or other actual orthreatened solicitation of proxies or consents by or on behalf of any individual, corporation, partnership or other entityor group, including through the use of proxy access procedures as may be provided in the Company’s bylaws) ceaseto constitute a majority of the Board, or
4

(iv) the consummation of a merger, consolidation, business combination or similar transaction involving the Companyunless securities representing 65% or more of the then outstanding voting stock of the corporation resulting from suchtransaction are held subsequent to such transaction by the Person or Persons who were the beneficial owners of theoutstanding voting stock of the Company immediately prior to such transaction in substantially the same proportionsas their ownership immediately prior to such transaction. Notwithstanding the foregoing or any provision to thecontrary, if an Award is subject to Section 409A (and not excepted therefrom) and a Change in Control is adistribution event for purposes of an Award, the foregoing definition of Change in Control shall be interpreted,administered and construed in a manner necessary to ensure that the occurrence of any such event shall result in aChange in Control only if such event qualifies as a change in the ownership or effective control of a corporation, or achange in the ownership of a substantial portion of the assets of a corporation, as applicable, within the meaning ofTreas. Reg. § 1.409A-3(i)(5). For purposes of this Agreement, “beneficial owner(s)” shall have the meaning set forthin Rule 13d-3 of the Exchange Act.
(B) Qualifying Event means the occurrence of one or more of the following events: (i) immediately upon theconsummation of a Change in Control event, failure of the successor company in a Change in Control event toprovide Substitute Awards that are substantially similar in both nature and terms (including having an equivalentrealizable pre-tax value to outstanding Awards assuming vesting and delivery at the consummation of the Change inControl); (ii) within two years of the consummation of a Change in Control event, an involuntary termination withoutCause of the Employee; or (iii) within two years of the consummation of a Change in Control event, a Good ReasonTermination (as defined in Section 6(C) below) by the Employee.
(C) Good Reason Termination means, without an Employee’s written consent, the Separation from Service (for reasonsother than death, Disability or Cause) by an Employee due to any of the following events occurring within two yearsof the consummation of a Change in Control: (i) the relocation of an Employee’s principal place of employment to alocation that is more than 50 miles from the principal place of employment in effect immediately prior to suchChange in Control; (ii) a material diminution in the duties or responsibilities of an Employee from those in placeimmediately prior to such Change in Control; and (iii) a material reduction in the base salary or annual incentiveopportunity of an Employee from what was in place immediately prior to such Change in Control.
5

In order for an Employee to have a Good Reason Termination, (i) an Employee must notify the successor entity inwriting, within ninety (90) days of the event constituting Good Reason of the Employee’s intent to terminateemployment for Good Reason, that specifically identifies in reasonable detail the manner of the Good Reason event,(ii) the event must remain uncorrected for thirty (30) days following the date that an Employee notifies the successorentity in writing of the Employee’s intent to terminate employment for Good Reason (the “Notice Period”), and (iii)the termination date must occur within sixty (60) days after expiration of the Notice Period.
7. Notices hereunder and under the Plan, if to the Company, shall be delivered to the Plan Administrator (as so designated bythe Company) or mailed to the Company’s principal office, 4300 Wilson Boulevard, Arlington, VA 22203 (or assubsequently designated by the Company), attention of the Plan Administrator, or, if to the Employee, shall be delivered tothe Employee, which may include electronic delivery, or mailed to his or her address as the same appears on the records ofthe Company.
8. All decisions and interpretations made by the Board of Directors or the Committee with regard to any question arisinghereunder or under the Plan shall be binding and conclusive on all persons. Unless otherwise specifically provided herein, inthe event of any inconsistency between the terms of the Plan and this Agreement, the terms of the Plan will govern.
9. By accepting this Award of PCUs, the Employee acknowledges receipt of a copy of the Plan and the prospectus relating tothis Award of PCUs, and agrees to be bound by the terms and conditions set forth in the Plan and this Agreement, as in effectand/or amended from time to time.
The Employee further acknowledges that the Plan and related documents, which may include the Plan prospectus, may bedelivered electronically. Such means of delivery may include the delivery of a link to a Company intranet site or the internetsite of a third party involved in administering the Plan, the delivery of the documents via e-mail or CD-ROM or such otherdelivery determined at the Plan Administrator’s discretion. The Employee acknowledges that the Employee may receive fromthe Company a paper copy of any documents delivered electronically at no cost if the Employee contacts the HumanResources department of the Company by telephone at (703) 682-6553 or by mail to 4300 Wilson Boulevard, Suite 1100,Arlington, Virginia 22203. The Employee further acknowledges that the Employee will be provided with a paper copy of anydocuments delivered electronically if electronic delivery fails.
6
10. This Award is intended to satisfy the requirements of Section 409A of the Code (or an exception thereto) and shall beadministered, interpreted and construed accordingly. A payment shall be treated as made on the specified date of payment ifsuch payment is made at such date or a later date in the same calendar year or, if later, by the 15th day of the third calendarmonth following the specified date of payment, as provided and in accordance with Treas. Reg. § 1.409A-3(d). The Companymay, in its sole discretion and without the Employee’s consent, modify or amend the terms and conditions of this Award,impose conditions on the timings and effectiveness of the payment of the PCUs, or take any other action it deems necessaryor advisable, to cause this Award to comply with Section 409A of the Code (or an exception thereto). Notwithstanding, theEmployee recognizes and acknowledges that Section 409A of the Code may impose upon the Employee certain taxes orinterest charges for which the Employee is and shall remain solely responsible.
11. The Employee acknowledges that any income for federal, state or local income tax purposes that the Employee is required torecognize on account of the vesting of the PCUs and/or payment in settlement of the PCUs to the Employee shall be subjectto withholding of tax by the Company. In accordance with administrative procedures established by the Company, theCompany shall mandatorily satisfy the Employee’s minimum statutory withholding tax obligations, if any, by withholdingfrom the payment in settlement of the PCUs to be made to the Employee a sufficient amount equal to the applicableminimum statutory withholding tax obligation.
12. Notwithstanding any other provisions in this Agreement, any PCUs subject to recovery under any law, governmentregulation, stock exchange listing requirement, or Company policy, shall be subject to such deductions, recoupment andclawback as may be required to be made pursuant to such law, government regulation, stock exchange listing requirement orCompany policy, as may be in effect from time to time, and which may operate to create additional rights for the Companywith respect to this Award and recovery of amounts relating thereto. By accepting this Award, Employee agrees andacknowledges that he or she is obligated to cooperate with, and provide any and all assistance necessary to, the Company torecover, recoup or recapture this Award or amounts paid under the Plan pursuant to such law, government regulation, stockexchange listing requirement or Company policy. Such cooperation and assistance shall include, but is not limited to,executing, completing and submitting any documentation necessary to recover, recoup or recapture this Award or amountspaid under the Plan from Employee’s accounts, or pending or future compensation or other grants.
13. This Agreement will be governed by the laws of the State of Delaware without giving effect to its choice of law provisions.
7

The AES CORPORATION
By:Tish MendozaSenior Vice President and Chief Human Resources Officer
8

Exhibit 12
The AES Corporation and SubsidiariesStatement Re: Calculation of Ratio of Earnings to Fixed Charges
(in millions, unaudited)
2015 2014 2013 2012 2011
Actual:
Computation of earnings:
Income from continuing operations before income taxes and equity in earnings of affiliates $ 1,122 $ 1,576 $ 1,048 $ 230 $ 2,260
Fixed charges 1,559 1,584 1,595 1,693 1,799
Amortization of capitalized interest 19 21 20 18 9
Distributed income of equity investees 16 28 2 5 25
Less:
Capitalized interest (97) (75) (58) (87) (152)
Preference security dividend of consolidated subsidiary (10) (5) (6) (6) (4)
Noncontrolling interests in pretax income of subsidiaries that have not incurred fixed charges (28) (26) (40) (4) (2)
Earnings $ 2,581 $ 3,103 $ 2,561 $ 1,849 $ 3,935
Fixed charges:
Interest expense, debt premium and discount amortization $ 1,430 $ 1,485 $ 1,516 $ 1,581 $ 1,623
Capitalized interest 97 75 58 87 152
Preference security dividend of consolidated subsidiary 10 5 6 6 4
Interest portion of rental expense (1) 22 19 15 19 20
Fixed charges $ 1,559 $ 1,584 $ 1,595 $ 1,693 $ 1,799
Ratio of earnings to fixed charges 1.66 1.96 1.61 1.09 2.19
(1) Calculated as one-third of rental expense, which is deemed to be representative of the interest factor in rental expense.

The AES Corporation2015 Form 10-K Exhibit 21.1
Name Jurisdiction
AES (India) Private Limited India
AES (NI) Limited Northern Ireland
AES Abigail S.a.r.l. Luxembourg
AES Africa Power Company B.V. The Netherlands
AES AgriVerde Holdings, B.V. The Netherlands
AES AgriVerde Services (Ukraine) Limited Liability Company Ukraine
AES Alamitos Development, Inc. Delaware
AES Alamitos Energy, LLC Delaware
AES Alamitos, L.L.C. Delaware
AES Alicura Holdings S.C.A Argentina
AES Americas International Holdings, Limited Bermuda
AES Amsterdam Holdings B.V. The Netherlands
AES Andes Energy, Inc. Delaware
AES Andres (BVI) Ltd. British Virgin Islands
AES Andres BV Spain
AES Andres Dominicana, Ltd. Cayman Islands
AES Andres DR, S.A. Dominican Republic
AES Andres Holdings I, Ltd Cayman Islands
AES Aramtermelo Holdings B.V. The Netherlands
AES Argentina Generación S.A. Argentina
AES Argentina Holdings S.C.A. Uruguay
AES Argentina Investments, Ltd. Cayman Islands
AES Argentina Operations, Ltd. Cayman Islands
AES Argentina, Inc. Delaware
AES Arlington Services, LLC Delaware
AES Armenia Mountain Holdings, LLC Delaware
AES Armenia Mountain Wind 2, LLC Delaware
AES Athens Holdings B.V. The Netherlands
AES Aurora Holdings, Inc. Delaware
AES Aurora, Inc. Delaware
AES Bainbridge Holdings, LLC Delaware
AES Bainbridge, LLC Delaware
AES Ballylumford Holdings Limited England & Wales
AES Ballylumford Limited Northern Ireland
AES Baltic Holdings BV The Netherlands
AES Barka Services, Inc. Delaware
AES Barry Limited United Kingdom
AES Barry Operations Ltd. United Kingdom
AES Beaver Valley, L.L.C. Delaware
AES Belfast West Power Limited Northern Ireland
AES Big Sky, L.L.C. Virginia
AES Borsod CFB Kft Hungary
AES Borsod Energetic Ltd. Hungary
AES Borsod Holdings Limited United Kingdom
AES Botswana Holdings B.V. The Netherlands
AES Brasil Investimentos e Participacoes Ltda. Brazil
AES Brasil Ltda Brazil
AES Brazil International Holdings, Limited Bermuda
AES Brazil Investimento II, LLC Delaware
AES Brazil Investimento III, LLC Delaware
AES Brazil, Inc. Delaware
AES Brazilian Holdings, Ltd. Cayman Islands

AES Bulgaria B.V. The Netherlands
AES Bulgaria Holdings BV The Netherlands

AES Bulgaria Trading EOOD Bulgaria
AES Bussum Holdings BV The Netherlands
AES CAESS Distribution, Inc. Delaware
AES Calaca Pte. Ltd. Singapore
AES Calaca Pte. Ltd. - Philippine Branch Philippines
AES Calgary, Inc. Delaware
AES California Management Co., Inc. Delaware
AES Caracoles SRL Argentina
AES Carbon Exchange, Ltd. Bermuda
AES Carbon Holdings, LLC Virginia
AES Caribbean Finance Holdings, Inc. Delaware
AES Caribbean Investment Holdings, Ltd. Cayman Islands
AES Cartegena Holdings BV The Netherlands
AES Cayman Guaiba, Ltd. Cayman Islands
AES Cayman Islands Holdings, Ltd. Cayman Islands
AES Cayman Pampas, Ltd. Cayman Islands
AES CC&T Holdings LLC Delaware
AES CC&T International, Ltd. British Virgin Islands
AES Central America Electric Light, Ltd. Cayman Islands
AES Central American Holdings, Inc. Delaware
AES Central American Investment Holdings, Ltd. Cayman Islands
AES Central Asia Holdings BV The Netherlands
AES Changuinola, S.R.L. Panama
AES Chhattisgarh Energy Private Limited India
AES Chigen Holdings, Ltd. Cayman Islands
AES China Generating Co. Ltd. Bermuda
AES China Hydropower Investment Co. Pte. Ltd. Singapore
AES Chivor & Cia S.C.A. E.S.P. Colombia
AES Chivor S.A. Colombia
AES CLESA Y Compania, Sociedad en Comandita de Capital Variable El Salvador
AES Climate Solutions Holdings I B.V. The Netherlands
AES Climate Solutions Holdings I, LLC Delaware
AES Climate Solutions Holdings II, LLC Delaware
AES Climate Solutions Holdings, L.P. Bermuda
AES Climate Solutions Holdings, LLC Delaware
AES Columbia Power, LLC Delaware
AES Communications Latin America, Inc. Delaware
AES Communications, Ltd. Cayman Islands
AES Connecticut Management, L.L.C. Delaware
AES Coop Holdings, LLC Delaware
AES Costa Rica Energy SRL Costa Rica
AES Costa Rica Holdings, Ltd. Cayman Islands
AES DE Construction, LLC Colorado
AES DE Holdings I, LLC Colorado
AES DE Holdings II, LLC Delaware
AES DE International Holdings I, LLC Colorado
AES DE Manager, LLC Colorado
AES DE Residential Holdings I, LLC Colorado
AES DE Solar Access Holdings I, LLC Delaware
AES Deepwater, LLC Delaware
AES Desert Power, L.L.C. Delaware
AES Development de Argentina S.A. Argentina
AES Disaster Relief Fund Virginia
AES Distribuidores Salvadorenos Limitada El Salvador

AES Distribuidores Salvadorenos Y Compania S en C de C.V. El Salvador
AES Distributed Energy, Inc. Delaware
AES DPL Holdings, LLC Delaware
AES Drax Financing, Inc. Delaware

AES Drax Power Finance Holdings Limited United Kingdom
AES Eastern Wind, L.L.C. Delaware
AES Ecotek Europe Holdings B.V. The Netherlands
AES EDC Holding, L.L.C. Delaware
AES EEO Distribution, Inc. Delaware
AES El Faro Electric Light, Ltd. Cayman Islands
AES El Faro Generating, Ltd. Cayman Islands
AES El Faro Generation, Inc. Delaware
AES El Salvador Distribution Ventures, Ltd. Cayman Islands
AES El Salvador Electric Light, LLC Virginia
AES El Salvador Trust Panama
AES El Salvador, LLC Virginia
AES El Salvador, S.A. de C.V. El Salvador
AES Electric Ltd. United Kingdom
AES Electroinversora Espana S.L. Spain
AES Elpa S.A. Brazil
AES Elsta BV The Netherlands
AES Empresa Electrica de El Salvador Limitada de Capital Variable El Salvador
AES Endeavor, Inc. Delaware
AES Energia I, Ltd. Cayman Islands
AES Energia II, Ltd. Cayman Islands
AES Energia Mexicana I, S. de R.L. de C.V. Mexico
AES Energy Developments (Pty) Ltd. South Africa
AES Energy Developments, S.L. Spain
AES Energy Services Inc. Ontario
AES Energy Solutions, LLC Delaware
AES Energy Storage Holdings, LLC Delaware
AES Energy Storage Zeeland B.V. The Netherlands
AES Energy Storage, LLC Delaware
AES Energy, Ltd. Bermuda
AES Energy, Ltd. (Argentina Branch) Argentina
AES Engineering, LLC Delaware
AES Engineering, Ltd. Cayman Islands
AES ES Alamitos, LLC Delaware
AES ES Deepwater, LLC Delaware
AES ES Holdings, LLC Delaware
AES ES Tait, LLC Delaware
AES Europe Services EOOD Bulgaria
AES European Holdings BV The Netherlands
AES European Investments Cooperatief U.A. The Netherlands
AES Finance and Development, Inc. Delaware
AES Florestal Ltda. Brazil
AES Fonseca Energia Limitada de C.V. El Salvador
AES Forca, Ltd. Cayman Islands
AES Foreign Energy Holdings, LLC Delaware
AES Gas Supply & Distribution Ltd. Cayman Islands
AES GEI US Finance, Inc. Delaware
AES Gener S.A. Chile
AES Generation Development, LLC Delaware
AES GEO Energy OOD Bulgaria
AES Global African Power (Proprietary) Limited South Africa
AES Global Insurance Company Vermont
AES Global Mobility Services, LLC Delaware
AES Global Power Holdings B.V. The Netherlands

AES GPH Holdings, Inc. Delaware
AES Grand Dominicana, Ltd. Cayman Islands
AES Great Britain Holdings B.V. The Netherlands
AES Grid Stability, LLC Delaware

AES GT Holding Pty Ltd Australia
AES Guaiba II Empreendimentos Ltda Brazil
AES Guayama Holdings BV The Netherlands
AES Hawaii Management Company, Inc. Delaware
AES Hawaii, Inc. Delaware
AES Highgrove Holdings, L.L.C. Delaware
AES Highgrove, L.L.C. Delaware
AES Hispanola Holdings BV The Netherlands
AES Hispanola Holdings II BV The Netherlands
AES Holanda Holdings C.V. The Netherlands
AES Holdings B.V. The Netherlands
AES Holdings B.V. - Vietnam Rep Office Vietnam
AES Holdings Brasil Ltda. Brazil
AES Honduras Generacion, Sociedad en Comandita por Acciones de Capital Variable Honduras
AES Honduras Generation Ventures, Ltd. Cayman Islands
AES Honduras Holdings, Ltd. Cayman Islands
AES Horizons Holdings BV The Netherlands
AES Horizons Investments Limited United Kingdom
AES Hungary Energiaszolgáltató Kft. Hungary
AES Huntington Beach Development, L.L.C. Delaware
AES Huntington Beach Energy, LLC Delaware
AES Huntington Beach, L.L.C. Delaware
AES IB Valley Corporation India
AES Ilumina Holdings, LLC Delaware
AES Ilumina Member, LLC Delaware
AES Ilumina, LLC Puerto Rico
AES India Holdings (Mauritius) Mauritius
AES India, L.L.C. Delaware
AES Indiana Holdings, L.L.C. Delaware
AES Intercon II, Ltd. Cayman Islands
AES Interenergy, Ltd. Cayman Islands
AES International Holdings II, Ltd. British Virgin Islands
AES International Holdings III, Ltd. British Virgin Islands
AES International Holdings, Ltd. British Virgin Islands
AES Investment Chile SpA Chile
AES IPP S. de R.L. de C.V. Mexico
AES Isthmus Energy, S.A. Panama
AES Jordan Holdco Cayman Limited Cayman Islands
AES Jordan Holdco, Ltd. Cayman Islands
AES Jordan PSC Jordan
AES Juniper Point Holdings, LLC Delaware
AES K2 Limited United Kingdom
AES Kalaeloa Venture, L.L.C. Delaware
AES Kelanitissa (Private) Limited Sri Lanka
AES Keystone Wind, L.L.C. Delaware
AES Keystone, L.L.C. Delaware
AES Khanya - Kwazulu Natal (Proprietary) Limited South Africa
AES Khanya - Port Elizabeth (Pty) Ltd. South Africa
AES Kienke Holdings B.V. The Netherlands
AES Kilroot Generating Limited Northern Ireland
AES Kilroot Power Limited Northern Ireland
AES King Harbor, Inc. Delaware
AES Kingston Holdings B.V. The Netherlands
AES Landfill Carbon, LLC Virginia

AES LATAM Energy Development Ltd. Cayman Islands
AES Latin America S. de R.L. Panama
AES Latin American Development, Ltd. Cayman Islands
AES Laurel Mountain, LLC Delaware

AES Levant Holdings B.V. The Netherlands
AES Levant Holdings B.V/ Jordan PSC Jordan
AES Lion Telecom Investments B.V. The Netherlands
AES LNG Holding II, Ltd. Cayman Islands
AES LNG Holding III, Ltd. Cayman Islands
AES LNG Holding IV, Ltd. Cayman Islands
AES LNG Holding, Ltd. Cayman Islands
AES Maastricht Holdings B.V. The Netherlands
AES Maritza East 1 Ltd. Bulgaria
AES Maritza East 1 Services Ltd. Cyprus
AES Maritza East 1 Services Ltd. Bulgaria
AES Masinloc Pte. Ltd. Singapore
AES Mayan Holdings, S. de R.L. de C.V. Mexico
AES Merida B.V. The Netherlands
AES Merida III, S. de R.L. de C.V. Mexico
AES Merida Management Services, S. de R.L. de C.V. Mexico
AES Merida Operaciones SRL de CV Mexico
AES Mexican Holdings, Ltd. Cayman Islands
AES Mexico Farms, L.L.C. Delaware
AES MicroPlanet, Ltd. British Virgin Islands
AES Mid East Holdings 2, Ltd. Cayman Islands
AES Middelzee Holding B.V. The Netherlands
AES Mong Duong Holdings B.V. The Netherlands
AES Mong Duong Project Holdings B.V. The Netherlands
AES Monroe Holdings B.V. The Netherlands
AES Mont Blanc Holdings B.V. The Netherlands
AES Mount Vernon B.V. The Netherlands
AES NA Central, L.L.C. Delaware
AES Nejapa Gas Ltda. de C.V. El Salvador
AES Nejapa Services Ltda. de C.V. El Salvador
AES Netherlands Holdings B.V. The Netherlands
AES New York Capital, L.L.C. Delaware
AES New York Funding, L.L.C. Delaware
AES Nigeria Holdings, Ltd. Cayman Islands
AES Nile Power Finance (Uganda) Limited Uganda
AES Nile Power Holdings Ltd. Guernsey
AES Nile Power Ltd. Uganda
AES Normandy Holdings B.V. The Netherlands
AES North America Development, LLC Delaware
AES Oasis Holdco, Inc. Delaware
AES Oasis Ltd. Cayman Islands
AES Oasis Mauritius Inc Mauritius
AES Ocean Springs Trust Deed Cayman Islands
AES Ocean Springs, Ltd. Cayman Islands
AES Odyssey, L.L.C. Delaware
AES Ohio Generation, LLC Ohio
AES Operadora S.A Argentina
AES OPGC Holding Mauritius
AES Orissa Distribution Private Limited India
AES Overseas Holdings (Cayman) Ltd. Cayman Islands
AES Overseas Holdings Limited United Kingdom
AES Pacific Ocean Holdings B.V. The Netherlands
AES Pacific, Inc. Delaware
AES Pacific, L.L.C. Delaware

AES Pak Holdings, Ltd. British Virgin Islands
AES Pakistan (Pvt) Ltd. Pakistan
AES Pakistan Operations, Ltd. Delaware
AES Panama Holding, Ltd. Cayman Islands
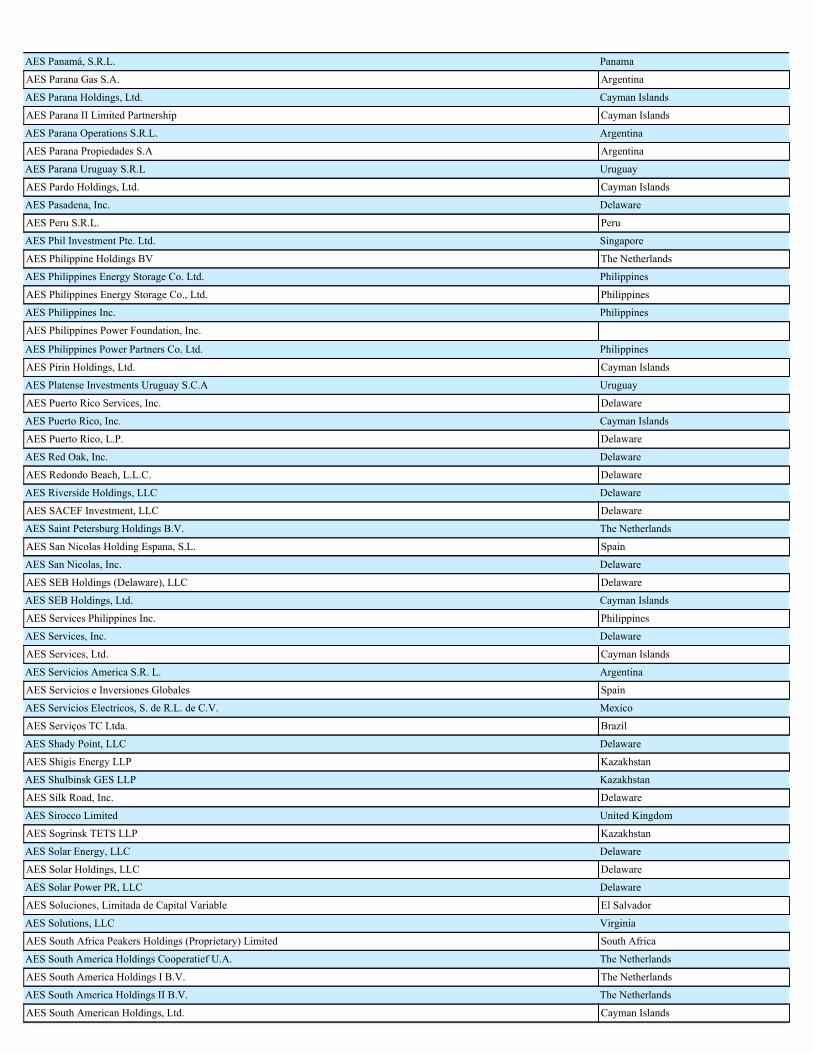
AES Panamá, S.R.L. Panama
AES Parana Gas S.A. Argentina
AES Parana Holdings, Ltd. Cayman Islands
AES Parana II Limited Partnership Cayman Islands
AES Parana Operations S.R.L. Argentina
AES Parana Propiedades S.A Argentina
AES Parana Uruguay S.R.L Uruguay
AES Pardo Holdings, Ltd. Cayman Islands
AES Pasadena, Inc. Delaware
AES Peru S.R.L. Peru
AES Phil Investment Pte. Ltd. Singapore
AES Philippine Holdings BV The Netherlands
AES Philippines Energy Storage Co. Ltd. Philippines
AES Philippines Energy Storage Co., Ltd. Philippines
AES Philippines Inc. Philippines
AES Philippines Power Foundation, Inc. AES Philippines Power Partners Co. Ltd. Philippines
AES Pirin Holdings, Ltd. Cayman Islands
AES Platense Investments Uruguay S.C.A Uruguay
AES Puerto Rico Services, Inc. Delaware
AES Puerto Rico, Inc. Cayman Islands
AES Puerto Rico, L.P. Delaware
AES Red Oak, Inc. Delaware
AES Redondo Beach, L.L.C. Delaware
AES Riverside Holdings, LLC Delaware
AES SACEF Investment, LLC Delaware
AES Saint Petersburg Holdings B.V. The Netherlands
AES San Nicolas Holding Espana, S.L. Spain
AES San Nicolas, Inc. Delaware
AES SEB Holdings (Delaware), LLC Delaware
AES SEB Holdings, Ltd. Cayman Islands
AES Services Philippines Inc. Philippines
AES Services, Inc. Delaware
AES Services, Ltd. Cayman Islands
AES Servicios America S.R. L. Argentina
AES Servicios e Inversiones Globales Spain
AES Servicios Electricos, S. de R.L. de C.V. Mexico
AES Serviços TC Ltda. Brazil
AES Shady Point, LLC Delaware
AES Shigis Energy LLP Kazakhstan
AES Shulbinsk GES LLP Kazakhstan
AES Silk Road, Inc. Delaware
AES Sirocco Limited United Kingdom
AES Sogrinsk TETS LLP Kazakhstan
AES Solar Energy, LLC Delaware
AES Solar Holdings, LLC Delaware
AES Solar Power PR, LLC Delaware
AES Soluciones, Limitada de Capital Variable El Salvador
AES Solutions, LLC Virginia
AES South Africa Peakers Holdings (Proprietary) Limited South Africa
AES South America Holdings Cooperatief U.A. The Netherlands
AES South America Holdings I B.V. The Netherlands
AES South America Holdings II B.V. The Netherlands
AES South American Holdings, Ltd. Cayman Islands

AES South Point, Ltd. Cayman Islands
AES Southland Development, LLC Delaware
AES Southland Energy Holdings, LLC Delaware
AES Southland Energy, LLC Delaware

AES Stonehaven Holding, Inc. Delaware
AES Strategic Equipment Holdings Corporation Delaware
AES Sul Distribuidora Gaucha de Energia S.A. Brazil
AES Sul, L.L.C. Delaware
AES Summit Generation Ltd. United Kingdom
AES Swiss Lake Holdings B.V. The Netherlands
AES Tamuin Development Services S. de R.L. de C.V. Mexico
AES Technology Holdings, LLC Delaware
AES TEG Holdings I, LLC Delaware
AES TEG Holdings, LLC Delaware
AES TEG II Mexican Holdings, S. de R.L. de C.V. Mexico
AES TEG II Mexican Investments, S. de R.L. de C.V. Mexico
AES TEG II Operations, S. de R.L. de C.V. Mexico
AES TEG Management, Inc. Delaware
AES TEG Mexican Holdings, S. de R.L. de C.V. Mexico
AES TEG Mexican Investments S. de R.L. de C.V. Mexico
AES TEG Operations, S. de R.L. de C.V. Mexico
AES TEG Power Investments B.V. The Netherlands
AES TEG Power Investments II B.V. The Netherlands
AES TEGTEP Holdings B.V. The Netherlands
AES TEGTEP Treasury Holdings B.V. The Netherlands
AES Tehachapi Wind, LLC Delaware
AES TEP Holdings I, LLC Delaware
AES TEP Holdings, LLC Delaware
AES TEP Management, Inc. Delaware
AES TEP Power II Investments Limited United Kingdom
AES TEP Power Investments Limited United Kingdom
AES Termosul Empreendimentos Ltda Brazil
AES Termosul I, Ltd. Cayman Islands
AES Termosul II, Ltd. Cayman Islands
AES Terneuzen Holdings B.V. The Netherlands
AES Terneuzen Management Services BV The Netherlands
AES Tesoreria I S. de R.L. de C.V. Mexico
AES Tesoreria II S. de R.L. de C.V. Mexico
AES Texas Funding III, L.L.C. Delaware
AES Thomas Holdings BV The Netherlands
AES Tietê Energia S.A. Brazil
AES Tisza Holdings BV The Netherlands
AES Trade I, Ltd. Cayman Islands
AES Trade II, Ltd. Cayman Islands
AES Transatlantic Holdings B.V. The Netherlands
AES Transgas I, Ltd. Cayman Islands
AES Transpower Private Ltd - Philippines Branch (ROHQ) Philippines
AES Transpower Private Ltd. Singapore
AES Transpower Private Ltd. - Philippines ROHQ Philippines
AES Transpower Pte Ltd -- Hong Kong Branch Hong Kong
AES Treasure Cove, Ltd. Cayman Islands
AES Trinidad Services Unlimited Trinidad and Tobago
AES Trust III Delaware
AES U&K Holdings B.V. The Netherlands
AES U.S. Holdings, LLC Delaware
AES U.S. Investments, Inc. Indiana
AES U.S. Solar, LLC Delaware
AES UCH Holdings (Cayman) Ltd. Cayman Islands

AES UCH Holdings, Ltd. Cayman Islands
AES UK Datacenter Services Limited United Kingdom
AES UK Holdings Limited United Kingdom
AES UK Power Financing II Ltd United Kingdom

AES UK Power Financing Limited United Kingdom
AES UK Power Holdings Limited United Kingdom
AES UK Power Limited United Kingdom
AES UK Power, L.L.C. Delaware
AES Union de Negocios, S.A. de C.V. El Salvador
AES Uruguaiana Empreendimentos S.A. Brazil
AES US Distributed Solar Holdings, LLC Delaware
AES US Generation Holdings, LLC Delaware
AES US Generation, LLC Delaware
AES US Services, LLC Delaware
AES US Wind Development, L.L.C. Delaware
AES Ust-Kamenogorsk GES LLP Kazakhstan
AES Ust-Kamenogorsk TETS LLP Kazakhstan
AES Venezuela Finance United Kingdom
AES Warrior Run, L.L.C. Delaware
AES Western Power Holdings, L.L.C. Delaware
AES Western Power, L.L.C. Delaware
AES Western Wind MV Acquisition, LLC Delaware
AES Western Wind, L.L.C. Delaware
AES Wilson Creek Wind, LLC Delaware
AES Wind Bulgaria EOOD Bulgaria
AES Wind Generation Asset Management Services Limited United Kingdom
AES Wind Generation Limited England & Wales
AES Wind Generation, LLC Delaware
AES Wind Investments I B.V. The Netherlands
AES Wind Investments II B.V. The Netherlands
AES WR Limited Partnership Delaware
AES Yucatan, S. de R.L. de C.V. Mexico
AES ZEG Holdings B.V. The Netherlands
AES Zephyr 2, LLC Delaware
AES Zephyr 3, LLC Delaware
AES Zephyr, Inc. Delaware
AES-3C Maritza East 1 Ltd. Bulgaria
AESCom Sul Ltda. Brazil
AESEBA Trust Deed Cayman Islands
AES-R.E. Services Energy Investment Management Hellas EPE Greece
AES-RS Spanish Holdings, LLC Delaware
AES-RS Sunshine Cooperatief U.A. The Netherlands
AES-RS Sunshine Holdings, LLC Delaware
AES-VCM Mong Duong Power Company Limited Vietnam
AgCert Canada Co. Canada
AgCert Canada Holding, Limited Ireland
AgCert Chile Servicios Ambientales Limitada Chile
AgCert do Brasil Soluções Ambientais Ltda. Brazil
AgCert International, Limited Ireland
AgCert Mexico Servicios Ambientales, Sociedade de Responsibilidad Limitada de Capital Variable Mexico
AgCert Servicios Ambientales S.R.L. Argentina
ALBERICH Beteiligungsverwaltungs GmbH Austria
Alectrona M EPE Greece
Alectrona PV EPE Greece
Alpha Water and Realty Services Corp. Philippines
Altai Power Limited Liability Partnership Kazakhstan
Alto Maipo SpA Chile
Anhui Liyuan - AES Power Co., Ltd. China

ANTURIE Beteiligungsverwaltungs GmbH Austria
Arizona B&GC Solar, LLC Colorado
ARNIKA Beteiligungsverwaltungs GmbH Austria
Atlantic Basin Services, Ltd. Cayman Islands

Aurora Master Funding, LLC Delaware
Aurora Master Holdings, LLC Delaware
AZ Solar I, LLC Colorado
AZ Solar II, LLC Colorado
AZ Solar Phase Zero, LLC Colorado
B.A. Services S.R.L. Argentina
BaiCheng Wind-Power Co., Ltd. China
Branch of Alberich Beteiligungsverwaltungs in Kazakhstan Kazakhstan
Brasiliana Participações S.A. Brazil
Bridgeport Solar, LLC Colorado
Brite Solar Fund Holdco, LLC Delaware
Buffalo Gap Holdings 2, LLC Delaware
Buffalo Gap Holdings 3, L.L.C. Delaware
Buffalo Gap Holdings, LLC Delaware
Buffalo Gap Wind Farm 2, LLC Delaware
Buffalo Gap Wind Farm 3, L.L.C. Delaware
Buffalo Gap Wind Farm 4, L.L.C. Delaware
Buffalo Gap Wind Farm, LLC Delaware
Camille Trust Cayman Islands
Camille, Ltd. Cayman Islands
Cavanal Minerals, LLC Delaware
Cayman Energy Traders Cayman Islands
CCS Telecarrier Cayman Islands
CDEC-SIC LTDA Chile
CDEC-SING Ltda Chile
Cemig II C.V. The Netherlands
Central Electricity Supply Company of Orissa Limited India
Central Termoelectrica Guillermo Brown S.A. Argentina
Cerulean Properties, LLC Delaware
CIA.TRANSMISORA DEL NORTE CHICO S.A. Chile
Clean Wind Energy Ltd. Israel
Cloghan Limited Northern Ireland
Cloghan Point Holdings Limited Northern Ireland
CMS Generation San Nicolas Company Michigan
Coastal Itabo, Ltd. Cayman Islands
Compania de Alumbrado Eletrico de San Salvador, S.A. DE C.V. El Salvador
Costa Norte LNG Terminal S. de R.L. Panama
Daggett Ridge Wind Farm, LLC Delaware
Diamond Development, Inc. Ohio
Distribuidora Electrica de Usulutan, Sociedad Anonima de Capital Variable El Salvador
Dominican Power Partners Cayman Islands
DPL Capital Trust II Delaware
DPL Inc. Ohio
Dublin Solar I, LLC Indiana
Eastern Solar Holdings I, LLC Delaware
Eastern Solar Holdings II, LLC Delaware
Eastern Solar Parent, LLC Delaware
Eletropaulo Metropolitana Eletricidade de Sao Paulo S.A. Brazil
Eloy ESD Solar Holdings, LLC Delaware
Elsta BV The Netherlands
Elsta BV & Co. CV The Netherlands
EMD Ventures BV The Netherlands
Empresa Electrica Angamos S.A. Chile
Empresa Electrica Campiche S.A. Chile

Empresa Electrica Cochrane SpA Chile
Empresa Electrica de Oriente, S.A. de C.V. El Salvador
Empresa Electrica Santiago SpA Chile
Empresa Electrica Ventanas S.A. Chile

Empresa Generadora De Electricidad Itabo, S.A. Dominican Republic
ENERAB, S. de R.L. de C.V. Mexico
ENERGEN S.A. Argentina
Energy Trade and Finance Corporation Cayman Islands
Fundacion AES Dominicana, Inc. Dominican Republic
Gas Natural Atlantico II S. de R.L. Panama
Gas Natural Atlantico S. De R.L. Panama
Gasoducto GasAndes Argentina S.A. Argentina
Gasoducto GasAndes S.A. Chile
Gener Argentina S.A. Argentina
Gener Blue Water, Ltd. Cayman Islands
Genergia Power, Ltd. Cayman Islands
GENERGIA S.A. Chile
Georgia Solar Holdings, LLC Delaware
Georgia Solar Parent, LLC Delaware
Global Energy Holdings C.V. The Netherlands
GNRY Holdings & Investments Limited Israel
Gray Springs Vista Solar, LLC Delaware
Guacolda Energy S.A. Chile
Haddonfield Finance Ltd. Ireland
Health and Welfare Benefit Plans LLC Delaware
Hefei Zhongli Energy Company Ltd. China
Hipotecaria San Miguel Limitada de Capital Variable El Salvador
Hipotecaria Santa Ana Limitada de Capital Variable El Salvador
Hunan Xiangci - AES Hydro Power Company Ltd. China
Indianapolis Power & Light Company Indiana
Indimento Inversiones, S.L. Spain
Instituto AES Brasil Brazil
InterAndes, S.A. Argentina
Inversiones Cachagua SpA Chile
Inversiones Energia Renovable Limitada Chile
Inversiones LK SpA Chile
INVERSIONES NUEVA VENTANAS SpA Chile
Inversiones Termoenergia de Chile Ltda. Chile
Inversora de San Nicolas S.A. Argentina
IPALCO Enterprises, Inc. Indiana
IPL Funding Corporation Indiana
Irtysh Power & Light LLP Kazakhstan
Itabo Dominicana, Ltd. Cayman Islands
Itabo III, S.R.L. Dominican Republic
KA Energy OOD Bulgaria
Kazincbarcikai Iparteruletfejleszt Kft. Hungary
Kilroot Electric Limited Cayman Islands
La Plata II, Ltd. British Virgin Islands
La Plata III C.V. The Netherlands
Lemoore PV 1 LLC California
Little Waver Wind Farm Limited England & Wales
MacGregor Park, Inc. Ohio
Maguan Daliangzi Power Station Co., Ltd. China
Maguan Laqi Power Station Co., Ltd. China
Main Street Power Canada Holdings I, LLC Colorado
Masin-AES Pte. Ltd. Singapore
Masin-AES Pte. Ltd. - Philippine Branch Masinloc AES Partners Company Limited Philippines

Masinloc AES Power Company Limited Philippines
Masinloc Power Partners Co. Ltd. Philippines
MC Squared Energy Services, LLC Illinois
Mercury Cayman Co II, Ltda, Agencia en Chile Chile

Mercury Cayman Co. II, Ltd. Cayman Islands
Mercury Cayman Holdco, Ltd. Cayman Islands
MFP CO Holdings II, LLC Delaware
MFP CO Holdings, LLC Delaware
MFP CO I, LLC Delaware
MFP CO II, LLC Colorado
MFP CO III, LLC Delaware
MFP CO Parent, LLC Delaware
Miami Valley Insurance Company Vermont
Miami Valley Lighting, LLC Ohio
Mid-America Capital Resources, Inc. Indiana
MM Solar Holdings I, LLC Colorado
MM Solar Holdings II, LLC Colorado
MM Solar Parent, LLC Delaware
Mountain Minerals, LLC Delaware
Mountain View Power Partners IV, LLC Delaware
Mountain View Power Partners, LLC Delaware
MSP Master Tenant I, LLC Colorado
MSP Master Tenant II, LLC Colorado
MSP QALICB II, LLC Colorado
MSP QALICB, LLC Colorado
MySolar Finance Holdings, LLC Delaware
MySolar Holdings II, LLC Delaware
MySolar Holdings III, LLC Delaware
MySolar Holdings IV, LLC Delaware
MySolar Holdings, LLC Delaware
MySolar I, LLC Delaware
MySolar II, LLC Delaware
MySolar IIB, LLC Delaware
MySolar IV, LLC Delaware
MySolar IX, LLC Delaware
MySolar V, LLC Delaware
MySolar VI, LLC Delaware
MySolar VII, LLC Delaware
New Caribbean Investments SRL Dominican Republic
Ningde Dagang Hydropower Development Co., Ltd. China
Norgener SpA Chile
Novus Barre Town Solar, LLC Delaware
Nurenergoservice LLP Kazakhstan
Omega SpA Chile
Orissa Power Generation Corporation Limited India
Profilaktoriy Shulbinsky LLP Kazakhstan
Remittance Processing Services, LLC Indiana
Rep Office of AES Silk Road in Almaty Kazakhstan
Rincon Solar I, LLC Georgia
Riverside Canal Power Company California
RMR Solar, LLC Delaware
Rosamond Solar, LLC Colorado
Sagebrush Partner Eighteen, Inc. California
Sagebrush Partner Nineteen, Inc. California
Sagebrush Partner Seventeen, Inc. California
Scituate Solar I, LLC Delaware
Scottsdale Solar Holdings, LLC Delaware
SD Solar I, LLC Colorado

SeaWest Asset Management Services, LLC California
SeaWest Energy Project Associates, LLC Delaware
SeaWest Properties, LLC California
SeaWest Wyoming, LLC Delaware

Shazia S.R.L. Argentina
Solar Access America, LLC Delaware
Solar Access CA, LLC Delaware
Solar Access California, LLC Colorado
Southern Electric Brazil Participacoes, Ltda. Brazil
Store Heat and Produce Energy, Inc. Indiana
Sudbury Ervin GMC Solar, LLC Delaware
Sycarpha Bolton, LLC Delaware
Sycarpha Stow, LLC Delaware
T&T Power Generation Unlimited Trinidad and Tobago
T&T Power Holdings I, SRL Barbados
T&T Power Holdings II, Ltd. Cayman Islands
Tau Power BV The Netherlands
Tecumseh Coal Corporation Indiana
TEG Business Trust Mexico
TEG/TEP Management, LLC Delaware
TEP Business Trust Mexico
TermoAndes S.A. Argentina
Termoelectrica del Golfo, S. de R.L. de C.V. Mexico
Termoelectrica Penoles, S. de R.L. de C.V. Mexico
Terneuzen Cogen B.V. The Netherlands
The AES Barry Foundation United Kingdom
The Dayton Power and Light Company Ohio
Thermo Fuels Company, Inc. California
Tozer Road Solar, LLC Massachusetts
USVI Solar I, LLC Delaware
Village of Waterbury Solar I, LLC Delaware
WE (Earlshaugh) Holdings Limited United Kingdom
WE (Forse) Holdings Ltd United Kingdom
WE (Glencalvie) Holdings Ltd United Kingdom
WE (Hanna) Holdings Ltd United Kingdom
WE (Hearthstanes) Holdings Ltd United Kingdom
WE (Newfield) Holdings Ltd United Kingdom
WE (North Rhins) Holdings Limited United Kingdom
WE (Services) Holdings Ltd United Kingdom
Weixi Longdu Power Station Co., Ltd. China
Wenshan Malutang Electricity Power Co., Ltd. China
Western Solar Parent, LLC Delaware
Wildwood Trust Cayman Islands
Wind Energy (Earlshaugh) Limited United Kingdom
Wind Energy (Forse) Limited United Kingdom
Wind Energy (Glenmorie) Limited United Kingdom
Wind Energy (Hanna) Limited United Kingdom
Wind Energy (Hearthstanes) Limited United Kingdom
Wind Energy (Newfield) Limited United Kingdom
Wind Energy (Services) Limited United Kingdom
Wuhu Shaoda Electric Power Development Co. Ltd. China
WuLanChaBu Jianghe Electricity Power Co., Ltd. China
Yangchun Fuyang Diesel Engine Power Co. Ltd. China
Your Energy Holdings Limited England & Wales
Yunnan Diqing Shangri-la Huarui Electricity Co., Ltd. China
Yunnan Longling Lazhai Hydropower Development Co., Ltd. China
ZhalynEnergo, LLP Kazakhstan


Exhibit 23.1
Consent of Independent Registered Public Accounting Firm
We consent to the incorporation by reference in the following Registration Statements and in the related Prospectuses of The AES Corporation:
(1) Registration Statements No. 333-203684, 333-156242, 333-26225, 333-28883, 333-30352, 333-38535, 333-57482, 333-66952, 333-66954, 333-82306, 333-83574, 333-84008, 333-97707, 333-108297, 333-112331, 333-115028, 333-150508, 333-135128, 333-158767,333-166607, and 333-179701 on Form S-8;
(2) Registration Statements No. 333-64572, 333-161913, and 333-186888 on Form S-3;
(3) Registration Statements No. 333-38924, 333-40870, 333-44698, 333-46564, 333-37924, 333-83767, 333-81953, 333-46189, 333-39857;333-15487, and 333-01286 on Form S-3/A, and
(4) Registration Statements No. 333-45916, 333-49644, 333-43908, 333-44845, 333-147951, 333-33283, 333-22513, and 333-180388 onForm S-4/A;
of our reports dated February 23, 2016, with respect to the consolidated financial statements and schedules of The AES Corporation and the effectiveness ofinternal control over financial reporting of The AES Corporation included in this Annual Report (Form 10-K) of The AES Corporation for the year endedDecember 31, 2015.
/s/ Ernst & Young LLPMcLean, VirginiaFebruary 23, 2016

The AES Corporation (the “Company”)Power of Attorney
The undersigned, acting in the capacity or capacities stated opposite their respective names below, hereby constitute and appoint Thomas O’Flynn and BrianA. Miller and each of them severally, the attorneys-in-fact of the undersigned with full power to them and each of them to sign for and in the name of theundersigned in the capacities indicated below the Company’s 2015 Annual Report on Form 10-K and any and all amendments and supplements thereto. This Powerof Attorney may be executed in one or more counterparts, each of which together shall constitute one and the same instrument.
Name Title Date
/s/ Andrés Gluski Principal Executive Officer and Director February 19, 2016Andrés Gluski
/s/ Charles L. Harrington Director February 19, 2016
Charles L. Harrington
/s/ Kristina M. Johnson Director February 19, 2016Kristina M. Johnson
/s/ Tarun Khanna Director February 19, 2016
Tarun Khanna
/s/ Holly K. Koeppel Director February 19, 2016Holly K. Koeppel
/s/ Philip Lader Director February 19, 2016
Philip Lader
/s/ James H. Miller Director February 19, 2016James H. Miller
/s/ John B. Morse, Jr. Director February 19, 2016
John B. Morse, Jr.
/s/ Moises Naim Director February 19, 2016Moises Naim
/s/ Charles O. Rossotti Chairman and Lead Independent Director February 19, 2016
Charles O. Rossotti

Exhibit 31.1
CERTIFICATIONS
I, Andrés Gluski, certify that:
1. I have reviewed this Form 10-K of The AES Corporation;
2. Based on my knowledge, this report does not contain any untrue statement of a material fact or omit to state a material fact necessary to make thestatements made, in light of the circumstances under which such statements were made, not misleading with respect to the period covered by this report;
3. Based on my knowledge, the financial statements, and other financial information included in this report, fairly present in all material respects thefinancial condition, results of operations and cash flows of the registrant as of, and for, the periods presented in this report;
4. The registrant’s other certifying officer and I are responsible for establishing and maintaining disclosure controls and procedures (as defined in ExchangeAct Rules 13a-15(e) and 15d-15(e)) and internal control over financial reporting (as defined in Exchange Act Rules 13a-15(f) and 15d-15(f)) for theregistrant and have:
a) Designed such disclosure controls and procedures, or caused such disclosure controls and procedures to be designed under our supervision, toensure that material information relating to the registrant, including its consolidated subsidiaries, is made known to us by others within thoseentities, particularly during the period in which this report is being prepared;
b) Designed such internal control over financial reporting, or caused such internal control over financial reporting to be designed under oursupervision, to provide reasonable assurance regarding the reliability of financial reporting and the preparation of financial statements forexternal purposes in accordance with generally accepted accounting principles;
c) Evaluated the effectiveness of the registrant’s disclosure controls and procedures and presented in this report our conclusions about theeffectiveness of the disclosure controls and procedures, as of the end of the period covered by this report based on such evaluation; and
d) Disclosed in this report any change in the registrant’s internal control over financial reporting that occurred during the registrant’s most recentfiscal quarter (the registrant’s fourth fiscal quarter in the case of an annual report) that has materially affected, or is reasonably likely tomaterially affect, the registrant’s internal control over financial reporting.
5. The registrant’s other certifying officer and I have disclosed, based on our most recent evaluation of internal control over financial reporting, to theregistrant’s auditors and the audit committee of the registrant’s board of directors (or persons performing the equivalent functions):
a) All significant deficiencies and material weaknesses in the design or operation of internal control over financial reporting which are reasonablylikely to adversely affect the registrant’s ability to record, process, summarize and report financial information; and
b) Any fraud, whether or not material, that involves management or other employees who have a significant role in the registrant’s internal controlover financial reporting.
Date: February 23, 2016
/ s / A NDRÉS G LUSKI
Name: Andrés GluskiPresident and Chief Executive Officer
Exhibit 31.2
CERTIFICATIONS
I, Thomas M. O’Flynn, certify that:
1. I have reviewed this Form 10-K of The AES Corporation;
2. Based on my knowledge, this report does not contain any untrue statement of a material fact or omit to state a material fact necessary to make thestatements made, in light of the circumstances under which such statements were made, not misleading with respect to the period covered by this report;
3. Based on my knowledge, the financial statements, and other financial information included in this report, fairly present in all material respects thefinancial condition, results of operations and cash flows of the registrant as of, and for, the periods presented in this report;
4. The registrant’s other certifying officer and I are responsible for establishing and maintaining disclosure controls and procedures (as defined in ExchangeAct Rules 13a-15(e) and 15d-15(e)) and internal control over financial reporting (as defined in Exchange Act Rules 13a-15(f) and 15d-15(f)) for theregistrant and have:
a) Designed such disclosure controls and procedures, or caused such disclosure controls and procedures to be designed under our supervision, toensure that material information relating to the registrant, including its consolidated subsidiaries, is made known to us by others within thoseentities, particularly during the period in which this report is being prepared;
b) Designed such internal control over financial reporting, or caused such internal control over financial reporting to be designed under oursupervision, to provide reasonable assurance regarding the reliability of financial reporting and the preparation of financial statements forexternal purposes in accordance with generally accepted accounting principles;
c) Evaluated the effectiveness of the registrant’s disclosure controls and procedures and presented in this report our conclusions about theeffectiveness of the disclosure controls and procedures, as of the end of the period covered by this report based on such evaluation; and
d) Disclosed in this report any change in the registrant’s internal control over financial reporting that occurred during the registrant’s most recentfiscal quarter (the registrant’s fourth fiscal quarter in the case of an annual report) that has materially affected, or is reasonably likely tomaterially affect, the registrant’s internal control over financial reporting.
5. The registrant’s other certifying officer and I have disclosed, based on our most recent evaluation of internal control over financial reporting, to theregistrant’s auditors and the audit committee of the registrant’s board of directors (or persons performing the equivalent functions):
a) All significant deficiencies and material weaknesses in the design or operation of internal control over financial reporting which are reasonablylikely to adversely affect the registrant’s ability to record, process, summarize and report financial information; and
b) Any fraud, whether or not material, that involves management or other employees who have a significant role in the registrant’s internal controlover financial reporting.
Date: February 23, 2016
/s/ T HOMAS M. O’F LYNN
Name: Thomas M. O’FlynnExecutive Vice President and Chief Financial Officer

Exhibit 32.1
CERTIFICATION OF PERIODIC FINANCIAL REPORTS
I, Andrés Gluski, President and Chief Executive Officer of The AES Corporation, certify, pursuant to 18 U.S.C. Section 1350, as adopted pursuant toSection 906 of the Sarbanes-Oxley Act of 2002, that:
(1) the Form 10-K for the year ended December 31, 2015 , (the “Periodic Report”) which this statement accompanies fully complies with therequirements of Section 13(a) or 15(d) of the Securities Exchange Act of 1934 (15 U.S.C. 78m or 78o(d)); and
(2) information contained in the Periodic Report fairly presents, in all material respects, the financial condition and results of operations of The AESCorporation.
Date: February 23, 2016
/ S / A NDRÉS G LUSKI
Name: Andrés GluskiPresident and Chief Executive Officer
Exhibit 32.2
CERTIFICATION OF PERIODIC FINANCIAL REPORTS
I, Thomas M. O’Flynn, Executive Vice President and Chief Financial Officer of The AES Corporation, certify, pursuant to 18 U.S.C. Section 1350, asadopted pursuant to Section 906 of the Sarbanes-Oxley Act of 2002, that:
(1)(1) the Form 10-K for the year ended December 31, 2015 , (the “Periodic Report”) which this statement accompanies fully complies with the
requirements of Section 13(a) or 15(d) of the Securities Exchange Act of 1934 (15 U.S.C. 78m or 78o(d)); and
(2) information contained in the Periodic Report fairly presents, in all material respects, the financial condition and results of operations of The AESCorporation.
Date: February 23, 2016
/s/ T HOMAS M. O’F LYNN
Name: Thomas M. O’FlynnExecutive Vice President and Chief Financial Officer