Embed Size (px)
Citation preview

Table of Contents
UNITED STATESSECURITIES AND EXCHANGE COMMISSION
Washington, D.C. 20549
FORM 10‑‑K☒ ANNUAL REPORT PURSUANT TO SECTION 13 or 15(d) OF THE SECURITIES EXCHANGE ACT OF 1934
For the fiscal year ended December 31, 2018OR
☐ TRANSITION REPORT PURSUANT TO Section 13 or 15(d) OF THE SECURITIES EXCHANGE ACT OF 1934For the transition period from to .
Commission file number: 0000‑‑11688
US ECOLOGY, INC.(Exact name of registrant as specified in its charter)
Delaware (State or other jurisdiction of incorporation or organization)
95‑‑3889638 (I.R.S. Employer Identification No.)
101 S. Capitol Blvd., Suite 1000 Boise, Idaho
(Address of principal executive offices)83702
(Zip Code)
Registrant’s telephone number, including area code: (208) 331‑‑8400
Securities registered pursuant to Section 12(b) of the Act:
Common Stock, $0.01 par value (Title of class)
Securities registered pursuant to Section 12(g) of the Act: None
Indicate by check mark if the registrant is a well‑known seasoned issuer, as defined in Rule 405 of the Securities Act. Yes ☒ No ☐
Indicate by check mark if the registrant is not required to file reports pursuant to Section 13 or Section 15(d) of the Act. Yes ☐ No ☒
Indicate by check mark whether the registrant (1) has filed all reports required to be filed by Section 13 or 15(d) of the Securities Exchange Act of 1934 during the preceding 12 months (or for such shorter period thatthe Registrant was required to file such reports), and (2) has been subject to such filing requirements for the past 90 days. Yes ☒ No ☐
Indicate by check mark whether the registrant has submitted electronically every Interactive Data File required to be submitted pursuant to Rule 405 of Regulation S‑T (§ 232.405 of this chapter) during the preceding12 months (or for such shorter period that the registrant was required to submit such files). Yes ☒ No ☐
Indicate by check mark if disclosure of delinquent filers pursuant to Item 405 of Regulation S‑K (§229.405 of this chapter) is not contained herein, and will not be contained, to the best of registrant’s knowledge, indefinitive proxy or information statements incorporated by reference in Part III of this Form 10‑K or any amendment to this Form 10‑K. ☒
Indicate by check mark whether the registrant is a large accelerated filer, an accelerated filer, a non‑accelerated filer, smaller reporting company, or an emerging growth company. See the definitions of “largeaccelerated filer,” “accelerated filer,” “smaller reporting company,” and “emerging growth company” in Rule 12b‑2 of the Exchange Act.
Large accelerated filer ☒ Accelerated filer ☐ Non‑accelerated filer ☐ Smaller reporting company ☐ Emerging growth company ☐
Indicate by check mark whether the registrant is a shell company (as defined in Rule 12b‑2 of the Act). Yes ☐ No ☒
The aggregate market value of the registrant’s voting stock held by non‑affiliates on June 30, 2018 was approximately $1.39 billion based on the closing price of $63.70 per share as reported on the NASDAQ GlobalMarket System.
At February 20, 2019, there were 22,070,243 shares of the registrant’s Common Stock outstanding.
Documents Incorporated by Reference
Listed hereunder are the documents, any portions of which are incorporated by reference and the Parts of this Form 10‑K into which such portions are incorporated:
1. The registrant’s definitive proxy statement for use in connection with the Annual Meeting of Stockholders to be held on or about May 21, 2019 to be filed within 120 days after the registrant’s fiscal year ended December 31,2018, portions of which are incorporated by reference into Part III of this Form 10‑K.

Table of Contents
US ECOLOGY, INC.
FORM 10‑‑K
TABLE OF CONTENTS
Item PagePART I Cautionary Statement 31. Business 41A. Risk Factors 181B. Unresolved Staff Comments 282. Properties 283. Legal Proceedings 304. Mine Safety Disclosures 30PART II 5. Market for Registrant’s Common Equity, Related Stockholder Matters and Issuer Purchases of Equity Securities 316. Selected Financial Data 337. Management’s Discussion and Analysis of Financial Condition and Results of Operations 337A. Quantitative and Qualitative Disclosures About Market Risk 588. Financial Statements and Supplementary Data 609. Changes in and Disagreements With Accountants on Accounting and Financial Disclosure 1039A. Controls and Procedures 1039B. Other Information 104PART III 10. Directors, Executive Officers and Corporate Governance 10511. Executive Compensation 10512. Security Ownership of Certain Beneficial Owners and Management and Related Stockholder Matters 10513. Certain Relationships and Related Transactions, and Director Independence 10614. Principal Accounting Fees and Services 106PART IV 15. Exhibits, Financial Statement Schedules 10616. Form 10‑K Summary 106SIGNATURES 109
2

Table of Contents
PART I
Cautionary Statement for Purposes of Safe Harbor Provisions of the Private Securities Litigation Reform Act of 1995
This annual report on Form 10‑K contains forward‑looking statements within the meaning of the federal securities laws.Statements that are not historical facts, including statements about the Company’s beliefs and expectations, are forward‑lookingstatements. Forward‑looking statements include statements preceded by, followed by or that include the words “may,” “could,”“would,” “should,” “believe,” “expect,” “anticipate,” “plan,” “estimate,” “target,” “project,” “intend” and similarexpressions. These statements include, among others, statements regarding our financial and operating results, strategicobjectives and means to achieve those objectives, the amount and timing of capital expenditures, repurchases of its stock underapproved stock repurchase plans, the amount and timing of interest expense, the likelihood of our success in expanding ourbusiness, financing plans, budgets, working capital needs and sources of liquidity.
Forward‑looking statements are only predictions and are not guarantees of performance. These statements are based onmanagement’s beliefs and assumptions, which in turn are based on currently available information. Important assumptionsinclude, among others, those regarding demand for Company services, expansion of service offerings geographically or throughnew or expanded service lines, the timing and cost of planned capital expenditures, competitive conditions and general economicconditions. These assumptions could prove inaccurate. Forward‑looking statements also involve known and unknown risks anduncertainties, which could cause actual results to differ materially from those contained in any forward‑looking statement. Manyof these factors are beyond our ability to control or predict. Such factors include an accident at one of our facilities, incidentsresulting from the handling of dangerous substances, the loss or failure to renew significant contracts, competition in ourmarkets, adverse economic conditions, our compliance with applicable laws and regulations, the realization of anticipatedbenefits from acquired operations, our ability to perform under required contracts, limitations on our available cash flow as aresult of our indebtedness, liabilities arising from our participation in multi-employer pension plans, cyber security threats,unanticipated changes in tax rules and regulations, loss of key personnel, a deterioration in our labor relations or labor disputes,our ability to pay dividends or repurchase stock, anti-takeover regulations, stock market volatility, our access to insurance, suretybonds and other financial assurances, our litigation risk not covered by insurance, the replacement of non-recurring eventprojects, our ability to permit and contract for timely construction of new or expanded disposal space, renewals of our operatingpermits or lease agreements with regulatory bodies, our ability or the timing of reconstructing and receiving regulatoryapprovals for the reopening of the Grand View, Idaho treatment facility, the timing or amount of insurance recoveries associatedwith the reconstruction and business interruption losses for the Grand View, Idaho treatment facility, our access to cost-effectivetransportation services, lawsuits, our implementation of new technologies, fluctuations in foreign currency markets and foreignaffairs.
Except as required by applicable law, including the securities laws of the United States and the rules and regulations of theSecurities and Exchange Commission (the “SEC”), we are under no obligation to publicly update or revise any forward‑lookingstatements, whether as a result of new information, future events or otherwise. You should not place undue reliance on ourforward‑looking statements. Although we believe that the expectations reflected in forward‑looking statements are reasonable,we cannot guarantee future results or performance. Before you invest in our common stock, you should be aware that theoccurrence of the events described in the “Risk Factors” section in this report could harm our business, prospects, operatingresults, and financial condition.
Investors should also be aware that while we do, from time to time, communicate with securities analysts, it is against our policyto disclose to them any material non‑public information or other confidential commercial information. Accordingly, stockholdersshould not assume that we agree with any statement or report issued by any analyst irrespective of the content of the statement orreport. Furthermore, we have a policy against issuing or confirming financial forecasts or projections issued by others. Thus, tothe extent that reports issued by securities analysts contain any projections, forecasts or opinions, such reports are not theresponsibility of US Ecology, Inc.
3

Table of Contents
ITEM 1. BUSINESS
General
The table below contains definitions that are used throughout this Annual Report on Form 10‑K.
Term MeaningUS Ecology, the Company, “we,” “our,” “us” US Ecology, Inc., and its subsidiariesAEA Atomic Energy Act of 1954, as amendedCEPA Canadian Environmental Protection Act (1999)CERCLA or “Superfund” Comprehensive Environmental Response, Compensation and
Liability Act of 1980CWA Clean Water Act of 1977LARM Low‑activity radioactive material exempt from federal Atomic
Energy Act regulation for disposalLLRW Low‑level radioactive waste regulated under the federal
Atomic Energy Act for disposalNORM/NARM Naturally occurring and accelerator produced radioactive
materialNRC U.S. Nuclear Regulatory CommissionPCBs Polychlorinated biphenylsQEQA Québec Environmental Quality ActRCRA Resource Conservation and Recovery Act of 1976SEC U. S. Securities and Exchange CommissionTSCA Toxic Substances Control Act of 1976TSDF Treatment, Storage and Disposal FacilityUSACE U.S. Army Corps of EngineersUSEPA U.S. Environmental Protection AgencyWUTC Washington Utilities and Transportation Commission US Ecology, Inc. is a leading North American provider of environmental services to commercial and government entities. TheCompany addresses the complex waste management needs of its customers, offering treatment, disposal and recycling ofhazardous, non‑hazardous and radioactive waste, as well as a wide range of complementary field and industrial services. USEcology’s comprehensive knowledge of the waste business, its collection of waste management facilities and focus on safety,environmental compliance, and customer service enables us to effectively meet the needs of our customers and to buildlong‑lasting relationships. US Ecology and its predecessor companies have been in business for more than 65 years. As ofDecember 31, 2018, we employed approximately 1,700 people.
US Ecology was most recently incorporated as a Delaware corporation in May 1987 as American Ecology Corporation. OnFebruary 22, 2010, the Company changed its name from American Ecology Corporation to US Ecology, Inc. Our filings with theSEC are posted on our website at www.usecology.com or can be obtained by accessing the SEC’s website at www.sec.gov. Theinformation found on our website is not part of this or any other report we file with or furnish to the SEC.
We have fixed facilities and service centers operating in the United States, Canada and Mexico. Our fixed facilities include fiveRCRA subtitle C hazardous waste landfills and one LLRW landfill located near Beatty, Nevada; Richland, Washington;Robstown, Texas; Grand View, Idaho; Detroit, Michigan and Blainville, Québec, Canada. These facilities generate revenue fromfees charged to transport, recycle, treat and dispose of waste and to perform various field and industrial services for ourcustomers.
4

Table of Contents
Our operations are managed in two reportable segments reflecting our internal management reporting structure and nature ofservices offered as follows:
Environmental Services —This segment provides a broad range of hazardous material management services includingtransportation, recycling, treatment and disposal of hazardous, non‑hazardous and radioactive waste at Company‑ownedlandfill, wastewater, deep-well injection and other treatment facilities.
Field & Industrial Services —This segment provides packaging and collection of hazardous waste and total wastemanagement solutions at customer sites and through our 10‑day transfer facilities. Services include on‑site management,waste characterization, transportation and disposal of non‑hazardous and hazardous waste. This segment also providesspecialty field services such as industrial cleaning and maintenance, remediation, lab packs, retail services,transportation, emergency response and other services to commercial and industrial facilities and to government entities.
Environmental Services Segment
Our Environmental Services involve the transportation, treatment, recycling and disposal of hazardous, non‑hazardous andradioactive wastes, and include physical treatment, recycling, landfill and deep-well injection disposal and wastewater treatmentservices.
Waste Treatment & Disposal
We recycle, treat and dispose of hazardous and non‑hazardous industrial wastes. The wastes handled include substances whichare classified as “hazardous” because of their corrosive, ignitable, reactive or toxic properties, and other wastes subject to federal,state and provincial environmental regulation. The wastes we handle come in solid, liquid and sludge form and can be received ina variety of containerized and bulk forms and transported to our facilities by truck and rail.
We own and operate five permitted hazardous waste treatment and disposal landfills in the United States and Canada usedprimarily for the disposal of wastes treated at Company‑owned onsite and offsite treatment facilities. The United States landfillsare regulated under RCRA by the respective states in which they are located and the USEPA while our Canadian landfill isregulated by the Québec Ministry of Environment. We also operate a commercial LLRW landfill in Richland, Washington that islicensed by the Washington Department of Health through delegated authority of the NRC. The WUTC sets disposal rates forLLRW. Rates are set at an amount sufficient to cover operating costs and provide us with a reasonable profit. The current rateagreement with the WUTC was extended in 2013 and is effective until January 1, 2020.
As of December 31, 2018, the capacity used in the calculation of the useful economic lives of our six landfills includesapproximately 45.5 million cubic yards of remaining permitted airspace capacity and approximately 18.1 million cubic yards ofadditional unpermitted airspace capacity included in the footprints of these landfills. We believe it is probable that thisunpermitted airspace capacity will be permitted in the future based on our analysis of site conditions, past regulatory approvals onadjacent property, and our interactions with regulators on applicable regulations, although there can be no assurance that anyadditional unpermitted airspace capacity will be permitted in the future.
Treatment and disposal (“T&D”) revenue can be broken down into two categories, based on the underlying nature of the revenuesource: “Base Business” and “Event Business.”
Base Business consists of waste streams from ongoing industrial activities and tends to be reoccurring in nature. Our strategy is toexpand our Base Business while securing both short-term and extended-duration Event Business. We define Event Business asnon‑recurring projects that are expected to equal or exceed 1,000 tons, with Base Business defined as all other business notmeeting the definition of Event Business. The duration of Event Business projects can last from a several‑week cleanup of acontaminated site to a multiple year cleanup project.
Base Business represented approximately 80% and 78% of disposal revenue (excluding transportation) for the years endedDecember 31, 2018 and 2017, respectively. Event Business contributed approximately 20% and 22% of disposal revenue(excluding transportation) for the years ended December 31, 2018 and 2017, respectively.
5

Table of Contents
When Base Business covers our fixed overhead costs, a significant portion of disposal revenue generated from Event Business isgenerally realized as operating income and net income. This strategy takes advantage of the operating leverage inherent to thelargely fixed‑cost nature of the waste disposal business. Contribution margin is influenced by whether the waste is directlydisposed (“direct disposal”) or requires the application of chemical reagents, absorbents or other additives (variable costs) to treatthe waste prior to disposal.
A significant portion of our T&D revenue is attributable to discrete Event Business projects which vary widely in size, durationand unit pricing. For the year ended December 31, 2018, approximately 20% of our T&D revenue was derived from EventBusiness projects. The one‑time nature of Event Business, diverse spectrum of waste types received and widely varying unitpricing necessarily creates variability in revenue and earnings. This variability may be influenced by general and industry‑specificeconomic conditions, funding availability, changes in laws and regulations, government enforcement actions or court orders,public controversy, litigation, weather, commercial real estate, closed military bases and other project timing, governmentappropriation and funding cycles and other factors. The types and amounts of Base Business waste received also vary quarter toquarter, sometimes significantly, but are generally more predictable than Event Business.
The types of waste received, also referred to as “service mix,” can produce significant quarter‑to‑quarter and year‑to‑yearvariations in revenue, average selling price, gross profit, gross margin, operating profit and net income for both Base Businessand Event Business.
Deep-Well Injection
We operate a caprock injection well in the southern United States with full Class 1 and 2 non-hazardous industrial waste disposalcapabilities. Utilizing proprietary low pressure injection technology, the deep-well asset provides the unique ability to efficientlydispose of difficult to treat non-hazardous industrial waste streams, including high metals, high ammonia, high solids, flammableexempt, and leachate. Based on an independent determination of the injection capacity of the caprock formation in which weinject waste and our own estimates of projected injection volumes, we believe the remaining disposal capacity of the formationwill be sufficient to meet our disposal needs for the foreseeable future.
Wastewater Treatment
We operate wastewater treatment facilities that offer a range of wastewater treatment technologies. These wastewater treatmentoperations involve processing hazardous and non‑hazardous wastes through the use of physical and chemical treatment methods.Our wastewater treatment facilities treat a broad range of industrial liquid and semi‑liquid wastes containing heavy metals,organics and suspended solids.
6

Table of Contents
The following table summarizes the locations and services of our active Environmental Services waste treatment and/or disposalfacilities:
Location Onsite Disposal ServicesBeatty, Nevada Yes Hazardous and non‑hazardous industrial waste treatment, storage and disposal facility permitted
under Subtitle C of RCRA and TSCA to treat and dispose RCRA, TSCA and certain NRC‑exempt(NORM) radioactive waste.
Robstown, Texas Yes Hazardous and non‑hazardous industrial waste treatment, storage and disposal facility permittedunder Subtitle C of RCRA to treat and dispose RCRA, PCB remediation and certain NRC‑exempt(LARM and NORM/NARM) radioactive waste. PCB waste storage for off‑site shipment. Features athermal desorption system permitted as a Subpart X RCRA treatment unit that treats and recyclesorganic materials including recoverable oils and metal catalysts from petroleum wastes. Railtransfer station.
Grand View, Idaho Yes Hazardous and non‑hazardous industrial waste treatment, storage and disposal facility permittedunder Subtitle C of RCRA and TSCA to treat RCRA and TSCA wastes and certain NRC‑exempt(NORM/NARM, Technologically Enhanced NORM (TENORM)) radioactive waste. Rail transferstation.
Belleville, Michigan Yes Hazardous and non‑hazardous industrial waste treatment, storage and disposal facility permittedunder Subtitle C of RCRA to treat and dispose RCRA wastes and certain NRC‑exempt(NORM/NARM, Technologically Enhanced NORM (TENORM)) radioactive waste. Permittedunder TSCA to dispose TSCA wastes. Features a regenerative thermal oxidation air pollutioncontrol system that is compliant with RCRA Subpart CC air emissions standards. Rail transferstation.
Blainville, Québec, Canada Yes Permitted by the Canadian Ministry of Environment and authorized under the EnvironmentalQuality Act by Order‑in‑Council to treat and stabilize inorganic hazardous liquid and solid wasteand contaminated soils to produce a non‑leachable concrete‑like material for disposal in the onsitelandfill. Specializes in processing hard‑to‑treat materials, such as cyanides, mercury compounds,strong acids, non‑organic oxidizers, lab packs, contaminated debris and batteries. Direct rail access.
Richland, Washington Yes LLRW disposal facility accepts Class A, B, and C commercial LLRW from within the NorthwestInterstate and Rocky Mountain Compacts, NORM/NARM and LARM waste including radiumsources produced by customers nationwide. One of only three full‑service Class A, B, and Cdisposal facilities in the nation.
Winnie, Texas Yes Non-hazardous deep-well injection operations for disposal of Class 1 and Class 2 waste water,leachate and solids. Facility is permitted for solid waste processing and storage. Deep-wells areUnder Ground Control (“UIC”) permitted units.
Detroit, Michigan No RCRA Part B and Centralized Wastewater Treatment (“CWT”) permitted industrial hazardous andnon‑hazardous treatment of liquid wastes, stabilization, solidification, chemical oxidation/reductionand deactivation of hazardous and non‑hazardous solid and liquid wastes. Direct rail access.
Canton, Ohio No RCRA Part B and CWT permitted wastewater treatment of hazardous and non‑hazardous liquidwastes and stabilization, solidification, chemical oxidation/reduction, deactivation and metalsrecovery of hazardous and non‑hazardous liquid and solid wastes. Specializes in a delisting processthat converts industrial inorganic wastes into non‑hazardous residuals.
Harvey, Illinois No RCRA Part B and CWT permitted wastewater treatment of hazardous and non‑hazardous liquidwastes and stabilization, solidification, chemical oxidation/reduction, deactivation, metals recoveryof hazardous and non‑hazardous liquid and solid wastes and industrial cleaning. Specializes in adelisting process that converts industrial inorganic wastes into non‑hazardous residuals.
York, Pennsylvania No RCRA Part B and CWT permitted wastewater treatment of hazardous and non‑hazardous liquidwastes and stabilization, solidification, chemical oxidation/reduction, deactivation and metalsrecovery of hazardous and non‑hazardous liquid and solid wastes. Specializes in a delisting processthat converts industrial inorganic wastes into non‑hazardous residuals.
Tulsa, Oklahoma No RCRA Part B and CWT permitted wastewater treatment of hazardous and non‑hazardous liquidwastes and stabilization, solidification, chemical oxidation/reduction and deactivation of hazardousand non‑hazardous liquid and solid wastes.
Tilbury, Ontario, Canada No Hazardous and non‑hazardous industrial waste treatment, storage, and disposal facility permitted bythe Ontario Ministry of Environment. Provides bulking, blending and solidification services.Treatment of non‑hazardous hydrocarbon contaminated solids to industrial re‑use standards. Fulllicensed and permitted fleet of hazardous and non‑hazardous transportation equipment. Alsoprovides heavy industrial cleaning and confined space entry and rescue services along withemergency response.
Vernon, California No RCRA Part B and CWT permitted wastewater treatment of hazardous and non‑hazardous liquidwastes. Storage and consolidation of hazardous and non‑hazardous wastes. California State certifiedlaboratory. Direct rail access.
(1) An explosion occurred at our Grand View, Idaho facility on November 17, 2018, which resulted in the entire facility’s closure through January2019. The Grand View, Idaho facility resumed limited operations in February 2019.
7
(1)

Table of Contents
Recycling Services
We operate recycling technologies designed to reclaim valuable commodities from hazardous waste, including oil‑bearing waste,metal‑bearing waste, batteries, electronics, airport deicing fluid and other solvent‑based wastes for industrial clients. Therecycling and reclamation process involves the treatment of wastes using various recovery methods to effectively removecontaminants from the original material to restore its usefulness and to reduce the volume of waste requiring disposal.
We offer full‑service storm water management and propylene glycol recovery at major airports. Recovered fluids are transportedto our RCRA Part B and CWT permitted chemical recycling facility where they are recycled into a greater than 99% purematerial that is sold to industrial users.
We also operate a thermal desorption unit at our Robstown, Texas facility that recovers oil and metal bearing catalyst fromrefinery and other organic and oil-based waste. The recycled oil and recycled catalyst are sold to third parties.
Transportation
For waste transported by rail from locations distant from our facilities, transportation‑related revenue can vary significantly andcan account for as significant portion of total project revenue. While bundling transportation and disposal services may reduceoverall gross profit as a percentage of total revenue (“gross margin”), this value‑added service has allowed us to win multipleprojects that we believe we could not have otherwise competed for successfully. Our Company‑owned fleet of gondola railcars,which is periodically supplemented with railcars obtained under operating leases, has reduced our transportation expenses bylargely eliminating reliance on more costly short‑term rentals. These Company‑owned railcars also help us to win business duringtimes of demand‑driven railcar scarcity. We also utilize a variety of specially designed and constructed Company‑owned tankertrucks and trailers as well as various third‑party transporters to support this activity. Further, to maximize utilization of our railcarfleet, we periodically deploy available railcars to transport waste from cleanup sites to disposal facilities operated by othercompanies. Such transportation services may also be bundled with logistics and field services support work.
Field & Industrial Services Segment
Our Field & Industrial Services include a wide range of industrial maintenance and specialty services at refineries, chemicalplants, steel and automotive plants, and other government, commercial and industrial facilities. Onsite specialty services includeindustrial cleaning and maintenance, remediation, lab pack, transportation and emergency response. We provide these servicesthrough a network of facilities located throughout the United States that are organized into service lines including Small QuantityGeneration, Remediation Services, Managed Services, Emergency Response, Transfer and Processing, Terminal Services andIndustrial Services.
Small Quantity Generation
Our small quantity generation service offerings consist of retail services, laboratory packing, less than truckload (“LTL”), andhousehold hazardous waste (“HHW”) collection. Retail services, laboratory packing, LTL and HHW are full‑service wastecharacterization, packaging, collection and transportation programs. Services are provided to small, medium and large industrialand commercial customers. These programs are built on our network of service centers, employ highly trained staff and provide ahigh level of service to the customer. As an integral part of our services, we operate a network of service centers that characterize,package and collect hazardous and non‑hazardous wastes from customers and transport such wastes to and between our facilitiesfor treatment or bulking for shipment to final disposal locations. Customers typically accumulate wastes in containers, such as 55gallon drums, bulk storage tanks or 20 cubic yard roll‑off containers. We utilize a variety of specially designed and constructedtank trucks and semi‑trailers as well as third‑party transporters, including railroads. Depending on customer needs andcompetitive economics, transportation services may be offered at or near our cost to help secure new business.
8

Table of Contents
Remediation Services
Our remediation service offerings include project management, RCRA and TSCA closures, excavations, wastewater management,building decontamination, landfill capping and site remediation.
Managed Services
Our managed service offerings consist of total waste management (“TWM”) programs. Through our TWM program, customersoutsource the management of their waste compliance program to us, allowing us to organize and coordinate their wastemanagement disposal activities and environmental compliance.
Emergency Response
Our primary emergency response offerings include spill response, waste analysis and treatment and disposal planning. We alsooffer remediation, product transfers, spill contingency planning and yearly service agreements with first responder status. Trained,experienced professionals operate the Company’s Emergency Response Service 24 hours per day, 7 days per week.
Transfer and Processing
Our transfer and processing stations stage and consolidate non‑bulk loads of hazardous, non‑hazardous and universal waste intofull loads for more efficient shipment to Company‑owned or third‑party treatment and disposal facilities. This allows us to offer abroader geographic presence without having a dedicated, Company‑owned treatment or disposal facility in the region.
Terminal Services
Our terminal services include petroleum and chemical tank cleaning and other services, including emergency response,construction and industrial maintenance. The Company services several major petroleum terminals around New York Harbor.
Industrial Services
Our primary industrial service offerings include industrial cleaning and maintenance for refineries, chemical plants, steel andautomotive plants, as well as tank cleaning and temporary storage.
Waste Services Industry
During the 1970s and 1980s, waste services industry growth in the United States was driven by new environmental laws andactions by federal and state agencies to regulate existing hazardous waste management facilities and direct the cleanup ofcontaminated sites under the federal Superfund law. By the early 1990s, excess hazardous waste management capacity had beenconstructed by the industry. Over this same period, to better manage risk and reduce expenses, many waste generators institutedindustrial process changes and other methods to reduce waste production. These factors led to highly competitive marketconditions that still apply today.
In the U.S., hazardous waste is regulated under the RCRA, which created a cradle‑to‑grave system governing defined hazardouswaste from the point of generation to ultimate disposal. RCRA requires waste generators to distinguish between “hazardous” and“non‑hazardous” wastes, and to treat, store and dispose of hazardous waste in accordance with specific regulations. Generally,entities that treat, store, or dispose of hazardous waste must obtain a permit, either from the USEPA or from a state agency towhich the USEPA has delegated such authority. Similar regulations and management methods apply to hazardous wastegeneration in Canada, which is regulated by the Canada Ministry of Environment and delegated to provincial agencies.
9

Table of Contents
Disposal facilities are typically designed to permanently contain the waste and prevent the release of harmful pollutants into theenvironment. The most common hazardous waste disposal practice is placement in an engineered disposal unit such as a landfill,surface impoundment or deep-well injection. RCRA’s hazardous waste permitting program establishes specific requirements thatmust be followed when managing those wastes.
We believe that a baseline demand for hazardous and non-hazardous waste services will continue into the future with fluctuationsdriven by general and industry‑specific economic conditions, identification and prioritization of new cleanup needs, cleanupproject schedules, funding availability, regulatory changes and other public policy decisions. We will also continue to advanceplans and business lines that promote sustainable recycling technologies and expect the recycling portion of our business todisplace some of our base disposal services over time. We further believe that the ability to deliver specialized niche serviceswhile aggressively competing for large volume cleanup projects and non‑niche commodity business opportunities differentiatessuccessful from less successful companies. We seek to control variable costs, expand service lines, increase waste throughputefficiency, employ innovative treatment techniques, provide complementary transportation and logistics services, build marketshare and increase profitability.
Our Richland, Washington disposal facility, serving the Northwest and Rocky Mountain LLRW Compacts, is one of threeoperating Compact disposal facilities in the U.S. While our Washington disposal facility has substantial unused capacity, it canonly accept LLRW from the 11 western states comprising the two Compacts served. The Barnwell, South Carolina site, operatedby Energy Solutions, Inc. (“Energy Solutions”), exclusively serves the three‑state Atlantic Compact. A third LLRW disposalfacility, licensed by Waste Control Specialists, LLC and located near Andrews, Texas serves the two‑state Texas Compact andapproved out‑of‑compact waste generators. Class A LLRW from states outside the Northwest Compact region may also bedisposed at the commercial disposal site in Clive, Utah, also operated by Energy Solutions.
Increases in pricing at AEA licensed LLRW disposal facilities heightened demand for more cost‑effective disposal options forsoil, debris, consumer products, industrial wastes and other materials containing LARM, including “mixed wastes,” exhibitingboth hazardous and radioactive properties. In addition to commercial demand, a substantial amount of LARM is generated bygovernment cleanup projects. The NRC, USEPA and USACE have authorized the use of hazardous waste disposal facilities todispose of certain LARM, encouraging expansion of this compliant, cost‑effective alternative. We have been successful atexpanding our permits at four of our RCRA hazardous waste facilities to allow acceptance of additional LARM wastes.
Industrial Services Industry
The industrial services industry is highly fragmented with thousands of small companies performing a variety of cleaning,maintenance and other services to industrial based companies such as refineries, chemical plants and steel and automotive plants.We believe customers increasingly desire to shift high fixed costs to lower variable costs by outsourcing waste management andindustrial services. Some companies, such as power generation plants, petroleum refineries and chemical processors, are requiredto perform specialized “turnaround” maintenance only once or twice per year, making it impractical and cost‑prohibitive topurchase expensive, specialized equipment, comply with complex permits and employ full‑time specialized technicians requiredto perform those services. Similarly, the regulatory requirements of characterizing, manifesting, transporting and properlydisposing of waste has led many companies to outsource this function to specialists. Our network of service centers and treatment,recycling and storage facilities provides a national footprint allowing us to serve these customers, while at the same timeinternalizing the waste to our own facilities.
Industrial services generally have low barriers to entry and customers are frequently won based on quality of service, reputation,health and safety record, logistics and price. This low barrier to entry has fostered a fragmented and competitive market place.
Strategy
Our strategy is to capitalize on our difficult‑to‑replicate combination of treatment, recycling and disposal assets andcomplementary service lines to provide a full service offering to customers and increase market share in the diverse markets weserve. We are focused on safety, environmental compliance and a commitment to customer service excellence. In
10

Table of Contents
addition to organic growth initiatives, we actively pursue acquisition opportunities to expand our geographic reach, service linesand customer base. The principal elements of our business strategy are to:
Execute Best‑in‑Class Safety and Environmental Compliance Programs. We pursue best‑in‑class safety and environmentalcompliance at US Ecology. Not only is it the cornerstone of our business, but our customers and regulators rely on our expertisewhen they select us as a vendor or grant us permits and licenses. We deploy significant resources in terms of human capital,programs and facility investment to achieve safe and compliant operations. The Company has dedicated professionals whooversee and manage safety and environmental programs including, but not limited to, employee training, internal and independentexternal audits, incentive programs and the Safety & Health Achievement Recognition Program. Various US Ecology facilitieshave obtained third-party verification of Environmental Health and Safety programs through the Occupational Safety and HealthAdministration’s (“OSHA”) Voluntary Protection Program (“VPP”) or ISO 45001 and ISO 14001 accreditation. Senior managersregularly review and discuss environmental and safety results and performance with operational staff, management and the Boardof Directors to improve our safety results and focus on regulatory compliance.
Leverage Regulatory Expertise to Expand Permit Capabilities and Broaden Cost‑Effective Service Offerings. We have a proventrack record of leveraging more than six decades of regulatory experience to broaden our service offerings. Working withcustomers, we assess market opportunities in relation to existing laws, regulations and permit conditions. Our engineering,operational and regulatory affairs personnel then seek authority to implement innovative processes and technologies and acceptadditional types of waste by modifying our existing permits or obtaining new permits.
Continue to Build on Our Robust Waste Handling Infrastructure to Increase Revenue from Existing Assets. We believe we have adifficult to replicate set of treatment, recycling and disposal assets in the highly regulated hazardous and radioactive wasteindustry. We aim to enhance treatment capabilities at our existing facilities to handle additional waste streams and increasethroughput. We also continue to invest in equipment and infrastructure to ensure that we have ample throughput capacity toexpand our Event Business while continuing to support our Base Business customers.
Execute on Marketing Initiatives to Grow Organically. Our sales team is focused on high margin, niche wastes that ourcompetitors may not be able to obtain the necessary regulatory authorizations for or handle cost‑effectively. We seek to expandinto new markets and offer new services allowing us to cross‑sell or bundle services and ultimately drive incremental volume intoour existing disposal facilities. Our strategy is to have our Base Business cover our fixed overhead costs and deliver a reasonableprofit, which allows the majority of our Event Business revenue to be realized as operating profit. We aim to continue buildingour Base Business while remaining flexible enough to handle large cleanup events.
Deliver Innovative Technological Solutions. We challenge ourselves to identify innovative and technology‑driven solutions tosolve our customers’ waste management challenges. Past examples include leveraging our expertise in developing wastetreatment recipes for organic and metals‑bearing wastes, utilizing waste as a reagent to treat other wastes, beneficial reuse ofselect wastes, partnering with an innovative technology provider to deploy thermal desorption technology to recover oil and metalcatalyst from refinery waste, and stabilizing mercury laden waste and other wastes using patented treatment process.
Pursue a Disciplined Acquisition Strategy to Add Complementary Capabilities. We pursue selective acquisitions to expand ourdisposal network, customer base and geographic footprint. We have had success achieving this in recent years through ourtargeted acquisition strategy, acquiring EQ Holdings, Inc. (“EQ”) in 2014, Environmental Services Inc. (“ESI”) and the Vernon,California based RCRA Part B, liquids and solids waste treatment and storage facility of Evoqua Water Technologies LLC in2016 and ES&H of Dallas, LLC (“ES&H Dallas”) and Ecoserv Industrial Disposal, LLC (“Winnie”) in 2018. The acquisition ofEQ also provided us with an entirely new line of complementary field and industrial service offerings. We continue to seekacquisition opportunities to further expand our service offerings across the hazardous waste value chain while maintaining ourcommitment to compliance, safety and customer service excellence.
Competitive Strengths
Difficult‑to‑Replicate Infrastructure. We consider our disposal facilities to be difficult to replicate due to the longstandingregulatory and public policy environment for hazardous waste processing facilities, which includes the generally high cost
11

Table of Contents
of obtaining permits, multi‑year permitting timeframes, uncertainty of outcome, high initial capital expenditures and the potentialfor both broad‑based and local community opposition to the development of new facilities. As a result, it has been more than20 years since a new hazardous waste landfill has been built in the United States. We operate five of twenty landfills in the U.S.and Canada that are permitted to accept RCRA wastes. Our Richland, Washington LLRW facility is one of only three full‑serviceClass A, B, and C disposal facilities in the U.S. Our personnel have extensive experience safely managing certain radioactivewaste requiring the use of shielding and remote handling devices.
Significant Regulatory and Operating Expertise. We operate in a highly regulated marketplace. The permitting process foroperating disposal assets in our industry is lengthy and complex, requiring a deep understanding of federal and state hazardousand radioactive waste laws and regulations. We maintain a regulatory compliance and permitting program at our disposalfacilities that has allowed us to obtain approvals to expand our service offering in terms of the types, amounts and concentrationsof wastes that we are authorized to accept. Our track record of successfully navigating government regulatory and permittingprocesses has been a consistent competitive advantage.
A Market Leader in Hazardous & Non‑Hazardous Waste Treatment and Disposal. We are a leader in the North Americanhazardous waste services sector with more than six decades of experience. Our collection of disposal assets combined with ourtransportation network provides us with coast‑to‑coast treatment and disposal capabilities, allowing us to serve a diverse mix ofcustomers and industries across the United States, Canada and Mexico.
Comprehensive Waste Services. Our comprehensive waste service offerings allow us to act as a full‑service provider to ourcustomers. Our full‑service orientation creates incremental revenue growth as customers seek to minimize the number of outsidevendors through “one‑stop” service providers.
Diverse Markets and Customer Base. In 2018, we serviced more than 3,500 commercial and governmental entities, such asrefineries, chemical production facilities, heavy manufacturers, steel mills, waste brokers and medical and academic institutions.Our broad range of end‑markets gives us exposure to a variety of industrial cycles, lessening the impact of market volatility.
Solid Safety and Compliance Record. Safety and environmental compliance is a cornerstone of US Ecology’s business. TheCompany has dedicated professionals who oversee and manage safety and environmental programs including, but not limited to,employee training, internal and independent external audits, incentive programs and the Safety & Health AchievementRecognition Program. Various US Ecology facilities have obtained third-party verification of Environmental Health and Safetyprograms through OSHA’s VPP or ISO 45001 and ISO 14001 accreditation. Senior managers regularly review and discussenvironmental and safety results and performance with operational staff, management and the Board of Directors to improve oursafety results and focus on regulatory compliance.
Competition
Our Environmental Services segment competes with large and small companies in each of the commercial markets we serve.While niche services apply, the radioactive, hazardous and non‑hazardous industrial waste management industry is generally verycompetitive. We believe that our primary hazardous waste and PCB disposal competitors are Clean Harbors, Inc., HeritageEnvironmental Services and Waste Management, Inc. Other hazardous waste disposal competitors include, but are not limited to,Envirosafe Services of Ohio, Tradebe, Ross Environmental, Perma‑Fix Environmental Services and Veolia EnvironmentalServices. We believe that our primary radioactive material disposal competitors are Energy Solutions, Inc. and Waste ControlSpecialists, Inc. We believe the principal competitive factors applicable to these businesses are:
· price;
· specialized permits and “niche” service offerings;
· customer service;
· operational efficiency and technical expertise;
12

Table of Contents
· regulatory compliance and worker safety;
· industry reputation and brand name recognition;
· transportation distance; and
· state or province and local community support.
Competition within our Field & Industrial Services segment varies by locality and type of service rendered, with competitioncoming from large national and regional service providers and hundreds of privately‑owned firms that offer field or industrialservices. We believe that our primary field and industrial services competitors are Clean Harbors, Inc., Stericycle, Inc., VeoliaEnvironmental Services and Waste Management, Inc. Each of these competitors is able to provide most if not all of the field andindustrial services we offer.
We believe that we are competitive in all markets we serve and that we offer a unique mix of services, including nichetechnologies and services that favorably distinguish us from competitors. We also believe that our strong brand name recognitionfrom six decades of experience, compliance and safety record, customer service reputation and positive relations with regulatorsand local communities enhance our competitive position. Advantages exist for competitors that are larger in scale or havetechnology, permits or equipment to handle a broader range of waste, that operate in jurisdictions imposing lower disposal feesand/or are located closer to where wastes are generated.
Permits, Licenses and Regulatory Requirements
Obtaining authorization to construct and operate new hazardous or radioactive waste facilities is a lengthy and complex process.We believe we have demonstrated significant expertise in this area over multiple decades. We also believe we possess all permits,licenses and regulatory approvals required to maintain regulatory compliance and operate our facilities and have the specializedexpertise required to obtain additional approvals to continue growing our business in the future.
We incur costs and make capital investments to comply with environmental regulations. These regulations require that we operateour facilities in accordance with permit‑specific requirements. Most of our facilities are also required to provide financialassurance for closure and post‑closure obligations should our facilities cease operations. Both human resource and capitalinvestments are required to maintain compliance with these requirements.
United States Hazardous Waste Regulation
Our hazardous, industrial, non‑hazardous and radioactive waste treatment, disposal and handling business is subject to extensivefederal and state environmental, health, safety, and transportation laws, regulations, permits and licenses. Local governmentcontrols may also apply. The responsible government regulatory agencies regularly inspect our operations to monitor compliance.They have authority to enforce compliance through the suspension or revocation of operating licenses and permits and theimposition of civil or criminal penalties in case of violations. We believe that these laws and regulations, as well as thespecialized services we provide, contribute to demand and create barriers to new competitors seeking to enter the markets weserve.
RCRA provides a comprehensive framework for regulating hazardous waste transportation, treatment, storage and disposal.RCRA regulation is the responsibility of the USEPA, which may delegate authority to state agencies. Chemical compounds andresidues derived from USEPA‑listed industrial processes are subject to RCRA standards unless they are delisted throughrulemaking. RCRA liability may be imposed for improper waste management or failure to take corrective action for releases ofhazardous substances. To the extent wastes are recycled or beneficially reused, regulatory controls and permitting requirementsunder RCRA diminish. LARM and NORM/NARM may also be managed to varying degrees under RCRA permits, as isauthorized for our facilities in Grand View, Idaho; Beatty, Nevada; Belleville, Michigan and Robstown, Texas.
13

Table of Contents
CWA legislation prohibits discharge of pollutants into the waters of the United States without governmental authorization andregulates the discharge of pollutants into surface waters and sewers from a variety of sources, including disposal sites andtreatment facilities. The USEPA has promulgated “pretreatment” regulations under the CWA, which establish pretreatmentstandards for introduction of pollutants into publicly owned treatment works. In the course of the treatment process, ourwastewater treatment facilities generate wastewater, which we discharge to publicly owned treatment works pursuant to permitsissued by the appropriate governmental authority. We are required to obtain discharge permits and conduct sampling andmonitoring programs.
CERCLA and its amendments impose strict, joint and several liability on owners or operators of facilities where a release ofhazardous substances has occurred, on parties who generated hazardous substances released at such facilities and on parties whoarranged for the transportation of hazardous substances. Liability under CERCLA may be imposed if releases of hazardoussubstances occur at treatment, storage or disposal sites. Since waste generators, transporters and those who arrange transportationare subject to the same liabilities, we believe they are motivated to minimize the number of disposal sites used. In addition,hazardous waste generated during the remediation of CERCLA cleanup projects and transferred offsite must be managed by atreatment and disposal facility authorized by EPA to manage CERCLA waste.
TSCA regulates the treatment, storage and disposal of PCBs. U.S. regulation and licensing of PCB wastes is the responsibility ofthe USEPA. Our Grand View, Idaho and Beatty, Nevada facilities have TSCA treatment, storage and disposal permits. OurBelleville, Michigan facility has a TSCA disposal permit. Our Robstown, Texas facility has a TSCA storage permit and maydispose of PCB‑contaminated waste in limited concentrations not requiring a TSCA disposal permit.
The AEA assigns the NRC regulatory authority over receipt, possession, use and transfer of certain radioactive materials,including disposal. The NRC has adopted regulations for licensing commercial LLRW disposal and has delegated regulatoryauthority to certain states including Washington, where our Richland facility is located. The NRC and U.S. Department ofTransportation regulate the transport of radioactive materials. Shippers must comply with both the general requirements forhazardous materials transportation and specific requirements for transporting radioactive materials.
The Energy Policy Act of 2005 amended the AEA to classify discrete (i.e. concentrated versus diffuse) NORM/NARM asbyproduct material. The law does not apply to interstate Compacts ratified by Congress pursuant to the LLRW Policy Act.
Canadian Hazardous Waste Regulation
The Canadian federal government regulates issues of national scope where activities cross provincial boundaries and affectCanada’s relations with other nations. The Provinces retain control over environmental matters within their boundaries includingprimary responsibility for regulation and management of hazardous waste.
The main federal laws governing hazardous waste management are CEPA and the Transportation of Dangerous Goods Act.Environment and Climate Change Canada is the federal agency with responsibility for environmental matters. CEPA chargesEnvironment Canada and Health Canada with the protection of human health and the environment and seeks to control theproduction, importation and use of substances in Canada and their impact on the environment. The Export and Import ofHazardous Waste Regulations under CEPA govern trans‑border movement of hazardous waste and hazardous recyclablematerials. These regulations require that anyone proposing to export or import hazardous waste or hazardous recyclable materialsor transport them through Canada notify the Minister of the Environment and obtain a permit to do so.
Our Stablex facility is located in Blainville, Québec, Canada and is subject to QEQA. This Act, independently developed by theProvince, regulates the generation, characterization, transport, treatment and disposal of hazardous wastes. QEQA also providesfor the establishment of waste management facilities which are controlled by the provincial statutes and regulations governingreleases to air, groundwater and surface water.
Our Tilbury, Ontario, Canada facility is subject to Regulation 347 of the Ontario Environmental Protection Act. Regulation 347,independently developed by the Province, regulates the collection, storage, transportation, treatment, recovery and disposal ofhazardous wastes.
14

Table of Contents
Waste transporters require a permit to operate under the Province’s regulations and are also subject to the requirements of theFederal Transportation of Dangerous Goods law which requires reporting of quantities and disposition of materials shipped.
A major difference between the United States regulatory regime and that in Canada relates to ownership and liability. UnderCanadian federal regulation, ownership changes when waste is transferred to a properly permitted third‑party carrier andsubsequently to an approved treatment and disposal facility. As a result, the generator is no longer liable for proper handling,treatment or disposal. In the United States, joint and several liability is retained by the waste generator as well as the transporterand the treatment and disposal facility.
Insurance, Financial Assurance and Risk Management
We carry a broad range of insurance coverage, including general liability, automobile liability, real and personal property,workers compensation, directors and officers liability, environmental impairment liability, business interruption and othercoverage customary for a company of our size in our business. We purchase primary property, casualty and excess liabilitypolicies through traditional third‑party insurance carriers. We are self‑insured for employee health‑care coverage.
Our domestic casualty insurance program provides coverage for commercial general liability, employer’s liability and automobileliability in the aggregate amount of $36.0 million each, per year, subject to a $100,000 retention per occurrence for ourcommercial general liability; a $350,000 deductible per occurrence for employer’s liability and a $100,000 deductible peroccurrence for our automobile liability. Our workers compensation insurance limits are established by state statutes. OurCanadian casualty insurance program provides primary coverage for commercial general liability and automobile liability in theaggregate amount of $36.0 million each, per year, subject to a $50,000 retention for general liability and no retention forautomobile liability.
Our domestic property program provides coverage for real and personal property, business interruption and contractors’equipment with a loss limit of $35.0 million, subject to a deductibles ranging from $500,000 to $1.0 million per occurrence forproperty and business interruption and $10,000 to $25,000 for contractors’ equipment. The program also includes flood,earthquake and wind coverage within the loss limit with a deductible ranging from $500,000 to $1.0 million subject to apercentage of value that ranges from 2% to 5%. We also maintain a separate boiler and machinery program with a loss limit of$100.0 million for property damage and business interruption subject to a $10,000 deductible or 24-hour waiting period specificto business interruption. For our California facility, we maintain an additional $10.0 million of coverage for earthquakes with adeductible ranging from $25,000 to $50,000 subject to a percentage of value that ranges from 3% to 5%. Our Canadian propertyprogram provides coverage for real and personal property, business interruption and contractors’ equipment with a loss limit of$70.0 million subject to a $50,000 deductible per occurrence. The program also includes flood and earth-movement coveragewithin the loss limits with deductibles of $50,000 for flood and 5% of the value for earth movement, subject to a $250,000minimum per occurrence. We also maintain a separate Canadian boiler and machinery program with a loss limit of $74.0 millionsubject to a $25,000 deductible per occurrence and a 48-hour waiting period for business interruption.
On November 17, 2018, an explosion occurred at our Grand View, Idaho facility, resulting in one employee fatality and injuriesto other employees. The incident severely damaged the facility’s primary waste-treatment building as well as surrounding wastehandling, waste storage, maintenance and administrative support structures, resulting in the closure of the entire facility thatremained in effect through January 2019. We resumed limited operations at our Grand View, Idaho facility in February 2019. Wemaintain workers’ compensation insurance, business interruption insurance and liability insurance for personal injury, propertyand casualty damage. We believe that any potential third-party claims associated with the explosion, in excess of our deductibles,are expected to be resolved primarily through our insurance policies. Although we carry business interruption insurance, adisruption of our business caused by a casualty event, including the full and partial closure of our Grand View, Idaho facility, mayresult in the loss of business, profits or customers during the time of such closure. As a result, our insurance policies may not fullycompensate us for these losses. Federal, state and provincial regulations require financial assurance to cover the cost of final closure and post‑closure obligationsat certain of our operating and non‑operating disposal facilities. Acceptable forms of financial assurance include third‑partystandby letters of credit, surety bonds and insurance. Alternatively, we may be required to collect fees
15

Table of Contents
from waste generators to fund dedicated, state‑controlled escrow or trust accounts during the operating life of the facility.Through December 31, 2018, we have met our financial assurance requirements through insurance, surety bonds, standby lettersof credit and self‑funded restricted trusts. Insurance policies covering our U.S. closure and post‑closure obligations expire inApril 2019 and December 2019. As of December 31, 2018, we have provided collateral of $4.9 million in funded trustagreements, $12.2 million in surety bonds, issued $2.7 million in letters of credit for financial assurance and have insurancepolicies of approximately $87.5 million for closure and post‑closure obligations. We maintain a surety bond for closure costsassociated with the Blainville facility. Our lease agreement with the Province of Québec requires that the surety bond bemaintained for 25 years after the lease expires. At December 31, 2018, we had $715,000 in commercial surety bonds dedicatedfor closure obligations.
Primary casualty insurance programs generally do not cover accidental environmental contamination losses. Our domestic andCanadian pollution liability programs provide coverage for these types of losses in the aggregate amount of $50.0 million and$20.0 million per year, respectively, each subject to a $250,000 deductible per occurrence. We also carry domestic and Canadianprofessional environmental consultant’s liability insurance in the aggregate amount of $25.0 million and $5.0 million per year,respectively. The domestic program is subject to a $100,000 retention per occurrence and the Canadian program is subject to a$25,000 deductible per occurrence. We also have a standalone RCRA site specific pollution liability policy in the aggregateamount of $35.0 million subject to a $250,000 deductible per occurrence.
For nuclear liability coverage, we maintain Facility Form and Workers’ Form nuclear liability insurance provided under thefederal Price Anderson Act. This insurance covers the operations of our facilities, suppliers and transporters.
Significant Customers
No customer accounted for more than 10% of total revenue for the years ended December 31, 2018, 2017, or 2016.
Seasonal Effects
Seasonal fluctuations due to weather and budgetary cycles can influence the timing of customer spending for our services.Typically, in the first quarter of each calendar year there is less demand for our services due to reduced construction activitiesrelated to weather. While large, multi‑year cleanup projects may continue in winter months, the pace of waste shipments may beslower, or stop temporarily, due to weather. Market conditions and federal funding decisions generally have a greater influence onthe business than seasonality.
Personnel
On December 31, 2018, we had approximately 1,700 employees, of which approximately 200 in the United States and 100 inCanada were represented by various labor unions.
Executive Officers of Registrant
The following table sets forth the names, ages and titles, as well as a brief account of the business experience of each person whois an executive officer of US Ecology:
Name Age TitleJeffrey R. Feeler 49 President and Chief Executive OfficerSimon G. Bell 48 Executive Vice President and Chief Operating OfficerEric L. Gerratt 48 Executive Vice President, Chief Financial Officer and TreasurerSteven D. Welling 60 Executive Vice President of Sales and MarketingAndrew P. Marshall 52 Executive Vice President of Regulatory Compliance & Safety Jeffrey R. Feeler was appointed President and Chief Executive Officer in May 2013. Mr. Feeler was previously the Company’ssenior executive as President and Chief Operating Officer from October 2012 to May 2013 and as the Company’s Vice Presidentand Chief Financial Officer from May 2007 to October 2012. He joined US Ecology in 2006 as Vice President, Controller, ChiefAccounting Officer, Treasurer and Secretary. He previously held financial and
16

Table of Contents
accounting management positions with MWI Veterinary Supply, Inc., Albertson’s, Inc. and Hewlett‑Packard Company. From1993 to 2002, he held various accounting and auditing positions for PricewaterhouseCoopers LLP. Mr. Feeler is a Certified PublicAccountant and holds a BBA of Accounting and a BBA of Finance from Boise State University.
Simon G. Bell was appointed Executive Vice President and Chief Operating Officer in November 2016. Mr. Bell previouslyserved as the Company’s Executive Vice President of Operations, Environmental Services from June 2014 to November 2016.From May 2013 to June 2014, he was Executive Vice President of Operations and Technology Development. From August 2007to May 2013, he was Vice President of Operations. From 2005 to August 2007, he was Vice President of Hazardous WasteOperations. From 2002 to 2005, he was our Idaho facility General Manager and Environmental Manager. His 20 years of industryexperience includes service as general manager of a competitor disposal facility and mining industry experience in Idaho, Nevadaand South Dakota. He holds a BS in Geology from Colorado State University.
Eric L. Gerratt was appointed Executive Vice President, Chief Financial Officer and Treasurer in May 2013. Mr. Gerrattpreviously served as the Company’s Vice President, Chief Financial Officer, Treasurer and Chief Accounting Officer fromOctober 2012 to May 2013. He joined US Ecology in August 2007 as Vice President and Controller. He previously held variousfinancial and accounting management positions at SUPERVALU, Inc. and Albertson’s, Inc. From 1997 to 2003, he held variousaccounting and auditing positions for PricewaterhouseCoopers LLP. Mr. Gerratt is a Certified Public Accountant and holds a BSin Accounting from the University of Idaho.
Steven D. Welling was appointed Executive Vice President of Sales and Marketing in May 2013. Mr. Welling previously servedas the Company’s Senior Vice President, Sales and Marketing from January 2010 to May 2013. He joined US Ecology in 2001through the Envirosafe Services of Idaho acquisition. He previously served as National Accounts Manager for EnvirosourceTechnologies and Western Sales Manager for Envirosafe Services of Idaho and before that managed new market developmentand sales for a national bulk chemical transportation company. Mr. Welling holds a BS from California StateUniversity‑Stanislaus.
Andrew P. Marshall was appointed Executive Vice President of Regulatory Compliance and Safety in May 2017. Mr. Marshallpreviously served as the Company’s Senior Vice President, Regulatory Compliance and Safety from December 2014 to May2017. He joined US Ecology in 2010 as Director of Environmental Compliance. He is a Professional Engineer with over 20 yearsof experience assisting companies comply with environmental regulations, including past positions with Kleinfelder, a nationalenvironmental consulting firm, and Boise Cascade Corporation. Mr. Marshall holds a BS in Civil Engineering from SeattleUniversity, an MS in Environmental Engineering from Oregon State University, and an MBA from Northwest NazareneUniversity.
17

Table of Contents
ITEM 1A. RISK FACTORS
In addition to the factors discussed elsewhere in this Form 10‑K, the following are important factors which could cause actualresults or events to differ materially from those contained in any forward‑looking statements made by or on behalf of us.
Risks Affecting All of Our Businesses
An accident at any one of our facilities may result in significant litigation or the imposition of fines as a result of regulatoryinvestigations, as well as the loss of business, profits or customers, which may not be fully covered by our insurance policies.
On November 17, 2018, an explosion occurred at our Grand View, Idaho facility, resulting in one employee fatality and injuriesto other employees. The incident severely damaged the facility’s primary waste-treatment building as well as surrounding wastehandling, waste storage, maintenance and administrative support structures, resulting in the closure of the entire facility thatremained in effect through January 2019. We resumed limited operations at our Grand View, Idaho facility in February 2019. Inaddition to initiating and conducting our own investigation into the incident, we are fully cooperating with the Idaho Departmentof Environmental Quality (“IDEQ”), the USEPA and OSHA to support their comprehensive and independent investigations of theincident. As we continue to investigate the cause of the incident, we are evaluating its impact, but, at this time, we are unable topredict the timing and outcome of the investigation. As such, we cannot presently estimate the potential liability, if any, related tothe incident therefore no amounts related to such claims have been recorded in our financial statements as of December 31, 2018.We have not been named as a defendant in any action relating to the incident. We maintain workers’ compensation insurance,business interruption insurance and liability insurance for personal injury, property and casualty damage. We believe that anypotential third-party claims associated with the explosion, in excess of our deductibles, are expected to be resolved primarilythrough our insurance policies. Although we carry business interruption insurance, a disruption of our business caused by acasualty event, including the full and partial closure of our Grand View, Idaho facility, may result in the loss of business, profitsor customers during the time of such closure. Accordingly, our insurance policies may not fully compensate us for these losses.
Our business requires the handling of dangerous substances. Improper handling of such substances could result in an adverseimpact on our financial condition and results of operations.
We are subject to unexpected occurrences related, or unrelated, to the routine handling of dangerous substances. A fire or otherincident could impair the ability of one or more facilities to continue to perform normal operations, which could have a materialadverse impact on our financial condition and results of operations. Improper handling of these substances could also violate lawsand regulations resulting in fines and/or suspension of operations.
The completion of, loss of or failure to renew one or more significant contracts could adversely affect our profitability.
We provide disposal and transportation services to customers on discrete Event Business (non‑recurring project based work)which varies widely in size, duration and unit pricing. Some of these multi‑year projects can account for a significant portion ofour revenue and profit. The replacement of Event Business revenue and earnings depends on multiple factors, many of which areoutside of our control including, but not limited to, general and industry‑specific economic conditions, capital in the commercialcredit markets, general level of government funding on environmental matters, real estate development and other industrialinvestment opportunities. Our inability to replace the contribution from Event Business projects with new business could result ina material adverse effect on our financial condition and results of operations.
Our market is highly competitive. Failure to compete successfully could have a material adverse effect on our business,financial condition and results of operations.
We face competition from companies with greater resources than us, companies with closer geographic proximity to waste sites,companies with service offerings we do not provide and companies that can provide lower pricing than we can in certaininstances. An increase in the number or location of commercial treatment or disposal facilities for hazardous or
18

Table of Contents
radioactive waste, significant expansion of existing competitor permitted capabilities, acquisitions by competitors or a decrease inthe treatment or disposal fees charged by competitors could materially and adversely affect our results of operations. Our businessis also heavily affected by waste disposal fees imposed by government agencies. These fees, which vary from state to state andare periodically adjusted, may adversely impact the competitive environment in which we operate.
Adverse economic conditions, government funding or competitive pressures affecting our customers could harm our business.
We serve oil refineries, chemical production plants, steel mills, real estate developers, waste brokers/aggregators serving smallmanufacturers and other industrial customers that are, or may be, affected by changing economic conditions and competition.These customers may be significantly impacted by deterioration in the general economy and may curtail waste production and/ordelay spending on plant maintenance, waste cleanup projects and other discretionary work. Spending by government customersmay also be reduced or temporarily suspended due to declining tax revenues that may result from a general deterioration ineconomic conditions or other federal or state fiscal policy. Factors that can impact general economic conditions and the level ofspending by customers include the general level of consumer and industrial spending, increases in fuel and energy costs,residential and commercial real estate and mortgage market conditions, labor and healthcare costs, access to credit, consumerconfidence and other macroeconomic factors affecting spending behavior. Market forces may also compel customers to cease orreduce operations, declare bankruptcy, liquidate or relocate to other countries, any of which could adversely affect our business.
Our operations are significantly affected by the commencement and completion of large and small cleanup projects; potentialseasonal fluctuations due to weather; budgetary decisions and cash flow limitations influencing the timing of customer spendingfor remedial activities; the timing of regulatory agency decisions and judicial proceedings; changes in government regulations andenforcement policies and other factors that may delay or cause the cancellation of cleanup projects. We do not control suchfactors, which can cause our revenue and income to vary significantly from quarter to quarter and year to year.
If we fail to comply with applicable laws and regulations our business could be adversely affected.
The changing regulatory framework governing our business creates significant risks. We could be held liable if our operationscause contamination of air, groundwater or soil or expose our employees or the public to contamination. Under current law, wemay be held liable for damage caused by conditions that existed before we acquired the assets or operations involved. Also, wemay be liable if we arrange for the transportation, disposal or treatment of hazardous substances that cause environmentalcontamination at facilities operated by others, or if a predecessor made such arrangements and we are a successor. Liability forenvironmental damage could have a material adverse effect on our financial condition, results of operations and cash flows.
Stringent regulations of federal, state or provincial governments have a substantial impact on our business. Local governmentcontrols may also apply. Many complex laws, rules, orders and regulatory interpretations govern environmental protection,health, safety, noise, visual impact, odor, land use, zoning, transportation and related matters. Failure to obtain on a timely basisor comply with applicable federal, state, provincial and local governmental regulations, licenses, permits or approvals for ourwaste treatment and disposal facilities could prevent or restrict our ability to provide certain services, resulting in a potentiallysignificant loss of revenue and earnings. Changes in environmental regulations may require us to make significant capital or otherexpenditures, or limit operations. Changes in laws or regulations or changes in the enforcement or interpretation of existing laws,regulations or permitted activities may require us to modify existing operating licenses or permits, or obtain additional approvalsor limit operations. New governmental requirements that raise compliance standards or require changes in operating practices ortechnology may impose significant costs and/or limit operations.
Our revenue is primarily generated as a result of requirements imposed on our customers under federal, state, and provincial lawsand regulations to protect public health and the environment. If requirements to comply with laws and regulations governingmanagement of PCB, hazardous or radioactive waste were relaxed or less vigorously enforced, demand for our services couldmaterially decrease and our revenues and earnings could be significantly reduced.
19

Table of Contents
Failure to realize the anticipated benefits and operational performance from previously acquired operations could lead to animpairment of goodwill or other intangible assets.
As a result of acquisitions since 2010, we have goodwill of $207.2 million, non-amortizing intangible assets of $46.5 million andamortizing intangible assets of $233.2 million at December 31, 2018. We are required to test goodwill and non-amortizingintangible assets at least annually to determine if impairment has occurred. We are also required to test goodwill and intangibleassets if an event occurs or circumstances change that would more likely than not reduce the fair value of a reporting unit belowits carrying amount. The testing of goodwill and other intangible assets for impairment requires us to make significant estimatesabout future performance and cash flows, as well as other assumptions. These estimates can be affected by numerous factors,including potential changes in economic, industry or market conditions, changes in laws or regulations, changes in businessoperations, changes in competition or changes in our stock price and market capitalization. Changes in these factors, or changes inactual performance compared with estimates of our future performance, may affect the fair value of goodwill or other intangibleassets, which may result in an impairment charge.
Based on the results of those tests in 2018, we recorded a $1.4 million goodwill impairment charge in our Mobile Recyclingreporting unit and impairment charges of $1.8 million and $454,000 on the non-amortizing intangible assets and amortizingintangible assets, respectively, of our Mobile Recycling business.
Estimates of the future performance of our reporting units assume a certain level of revenue and earnings growth over theprojection period. The projected revenue and earnings growth is based on various factors and assumptions that we consider to bereasonable, including, but not limited to, growth in the industries served by the Field Services reporting unit, successfulimplementation of our business and marketing strategies for this reporting unit and continuing favorable market conditions for thecustomers we serve. Should any of these assumptions turn out not to be true and the projected growth not occur for these or otherreasons, or the reporting units otherwise fail to meet their current financial plans, or there are changes to any other keyassumptions used in the estimates, the financial performance of these reporting units could result in a future goodwill impairment.
We cannot accurately predict the amount and timing of any impairment of assets. Should the value of goodwill or other intangibleassets become impaired as a result of a failure to realize the anticipated benefits and operational performance of acquiredoperations, our financial condition and results of operations could be adversely impacted.
Failure to perform under our contracts may adversely harm our business.
Certain contracts require us to meet specified performance criteria. Our ability to meet these criteria requires that we expendsignificant resources. If we or our subcontractors are unable to perform as required, we could be subject to substantial monetarypenalties and/or loss of the affected contracts which may adversely affect our business.
Our indebtedness may limit the amount of cash flow available to invest in the ongoing needs of our business, and our creditagreement restricts our ability to engage in certain corporate and financial transactions.
On April 18, 2017, the Company entered into a new senior secured credit agreement (the “2017 Credit Agreement”) with WellsFargo Bank, National Association (“Wells Fargo”), as administrative agent for the lenders, swingline lender and issuing lender,and Bank of America, N.A., as an issuing lender, that provides for a $500.0 million, five-year revolving credit facility (the“Revolving Credit Facility”), including a $75.0 million sublimit for the issuance of standby letters of credit and a $25.0 millionsublimit for the issuance of swingline loans used to fund short-term working capital requirements. The 2017 Credit Agreementalso contains an accordion feature whereby the Company may request up to $200.0 million of additional funds through anincrease to the Revolving Credit Facility, through incremental term loans, or some combination thereof. As of December 31,2018, we had total indebtedness of $364.0 million, comprised entirely of revolving credit loans under the Revolving CreditFacility. These revolving credit loans are due upon the earliest to occur of (a) April 18, 2022 (or, with respect to any lender, suchlater date as requested by us and accepted by such lender), (b) the date of termination of the entire revolving credit commitment(as defined in the 2017 Credit Agreement) by us, and (c) the date of termination of the revolving credit commitment. The 2017Credit Agreement makes us vulnerable to adverse general economic or industry conditions and increases in interest rates, asborrowings under our senior secured credit
20

Table of Contents
facilities are at variable rates; and limits our ability to obtain additional financing in the future for working capital or otherpurposes.
In addition, the 2017 Credit Agreement and related ancillary agreements with our lenders contain certain covenants that, amongother things, restrict our ability to incur additional indebtedness, pay dividends and make other restricted payments, repurchaseshares of outstanding stock, create certain liens and engage in certain types of transactions. Our ability to borrow under the 2017Credit Agreement depends upon our compliance with the restrictions contained in the 2017 Credit Agreement and events beyondour control could affect our ability to comply with these covenants.
Our participation in multi‑‑employer pension plans may subject us to liabilities that could materially adversely affect ourliquidity, cash flows and results of operations.
Certain of the Company’s wholly‑owned subsidiaries participate in multi‑employer defined benefit pension plans under the termsof collective bargaining agreements covering most of the subsidiaries’ union employees. To the extent that those plans areunderfunded, the Employee Retirement Income Security Act of 1974, as amended by the Multi‑Employer Pension PlanAmendments Act of 1980 (“ERISA”), may subject us to substantial liabilities if we withdraw from such multi‑employer plans orif they are terminated. Under current law regarding multi‑employer defined benefit plans, a plan’s termination, an employer’svoluntary partial or complete withdrawal from, or the mass withdrawal of all contributing employers from, an underfundedmulti‑employer defined benefit plan requires participating employers to make payments to the plan for their proportionate shareof the multi‑employer plan’s unfunded vested liabilities. Furthermore, the Pension Protection Act of 2006 added new fundingrules generally applicable to plan years beginning after 2007 for multi‑employer plans that are classified as “endangered,”“seriously endangered,” or “critical” status. If plans in which we participate are in critical status, benefit reductions may applyand/or we could be required to make additional contributions. Contributions to these funds could also increase as a result of futurecollective bargaining with the unions, a shrinking contribution base as a result of the insolvency of other companies who currentlycontribute to these funds, failure of the Plan to meet ERISA’s minimum funding requirements, lower than expected returns onpension fund assets, or other funding deficiencies. Any of the foregoing events could materially adversely affect our liquidity,cash flows and results of operations.
Based upon the information available to us from plan administrators as of April 30, 2018, certain of the multi‑employer pensionplans in which we participate are underfunded. The Pension Protection Act requires that underfunded pension plans improve theirfunding ratios within prescribed intervals based on the level of their underfunding. In addition, if a multi‑employer definedbenefit plan fails to satisfy certain minimum funding requirements, the Internal Revenue Service may impose a nondeductibleexcise tax of 5% on the amount of the accumulated funding deficiency for those employers contributing to the fund. We havebeen notified that certain plans to which our subsidiaries contribute are in “critical” status and these plans may require additionalcontributions in the form of a surcharge on future benefit contributions required for future work performed by union employeescovered by these plans. As a result, we expect our required contributions to these plans to increase in the future. The amount ofadditional funds we may be obligated to contribute in the future cannot be estimated, as such amounts will be based on futurelevels of work that require the specific use of the union employees covered by these plans, investment returns and the level ofunderfunding of such plans.
A cybersecurity incident could negatively impact our business and our relationships with customers.
We use computers in substantially all aspects of our business operations. We also use mobile devices and other online activities toconnect with our employees and our customers. Such uses of technology give rise to cybersecurity risks, including securitybreach, espionage, system disruption, theft and inadvertent release of information. Our business involves the storage andtransmission of numerous classes of sensitive and/or confidential information and intellectual property, including customers’personal information, private information about employees, and financial and strategic information about the Company and itsbusiness partners. Further, if the Company in the future pursues acquisitions or new initiatives that require expanding orimproving our information technologies, this may result in a larger technological presence and corresponding exposure tocybersecurity risk. If we fail to assess and identify cybersecurity risks associated with acquisitions and new initiatives, we maybecome increasingly vulnerable to such risks. Further, despite these security measures, the Company’s computer systems andinfrastructure may be vulnerable to attacks by hackers or breached due to employee error, malfeasance, or other disruptions.Additionally, while we have implemented measures to prevent security breaches and cyber incidents, our preventative measuresand incident response efforts may not be entirely
21

Table of Contents
effective, and our implementation of various procedures and controls to monitor and mitigate security threats and to increasesecurity for our information, facilities and infrastructure may result in increased capital and operating costs. Costs for insurancemay also increase as a result of security threats, and some insurance coverage may become more difficult to obtain, if available atall.
Cybersecurity attacks in particular are becoming more sophisticated. We rely extensively on information technology systems,including internet sites, computer software, data hosting facilities and other hardware and platforms, some of which are hosted bythird parties, to assist in conducting our business. Our technologies systems may become the target of cybersecurity attacks,including without limitation malicious software, attempts to gain unauthorized access to data and systems, and other electronicsecurity breaches that could lead to disruptions in critical systems and materially and adversely affect us in a variety of ways: thetheft, destruction, loss, misappropriation or release of sensitive and/or confidential information or intellectual property, orinterference with our information technology systems or the technology systems of third parties on which we rely, could result inbusiness disruption, negative publicity, brand damage, violation of privacy laws, loss of customers, potential liability andcompetitive disadvantage.
Unanticipated changes in our tax provisions or adverse outcomes resulting from examination of our income tax returns couldadversely affect our results of operations. We are subject to income taxes in the United States, Canada, Mexico, and various state and local jurisdictions. Our effectiveincome tax rate could be adversely affected by changes in tax laws or interpretations of those tax laws, or by changes in thevaluation of our deferred tax assets and liabilities. Additionally, our effective tax rate may be affected by the tax effects ofacquisitions or restructuring activities we may undertake, changes in share-based compensation, newly enacted tax legislation anduncertain tax positions we may take in the short term in response to such legislation. Finally, we are subject to the examination ofour income tax returns by the Internal Revenue Service and other tax authorities which may result in the assessment of additionalincome taxes. We regularly assess the likelihood of adverse outcomes resulting from these examinations to determine theadequacy of our provision for income taxes. However, unanticipated outcomes from examinations could have a material adverseeffect on our business, financial condition and results of operations. Tax laws are dynamic and subject to change as new laws are passed and new interpretations of the law are issued or applied. TheU.S. recently enacted significant tax reform, and certain provisions of the new law may adversely affect us. In addition,governmental tax authorities are increasingly scrutinizing the tax positions of companies. If the U.S. or Canadian tax authoritieschange applicable tax laws, our overall taxes could increase, and our business, financial condition or results of operations may beadversely impacted. Loss of key management or sales personnel could harm our business.
We have an experienced management team including general managers at our operating facilities and rely on the continuedservice of these senior managers to achieve our objectives. Our objective is to retain our present management and sales teams andidentify, hire, train, motivate and retain other highly skilled personnel. The loss of any key management employee or salespersonnel could adversely affect our business and results of operations.
A change or deterioration in labor relations could disrupt our business or increase costs, which could have a material adverseeffect on our business, financial condition and results of operations.
The Company is a party to collective bargaining agreements covering approximately 300, or approximately 20%, of ouremployees. The agreements expire on November 30, 2020, April 30, 2022 and December 31, 2023, respectively. While webelieve the Company will maintain good working relations with its employees on acceptable terms, there can be no assurance thatwe will be able to negotiate the terms of future agreements in a manner acceptable to the Company. Potential work disruptionsfrom labor disputes may disrupt our businesses and adversely affect our financial condition and results of operations.
22

Table of Contents
We may not be able or willing to pay future dividends.
Our ability to pay dividends is subject to our future financial condition and certain conditions such as continued compliance withcovenants contained in the 2017 Credit Agreement. Our Board of Directors must also approve any dividends at their solediscretion. Pursuant to the 2017 Credit Agreement, we may only declare quarterly or annual dividends if on the date ofdeclaration, no event of default has occurred and no other event or condition has occurred that would constitute an event ofdefault due to the payment of the dividend. Unforeseen events or situations could cause non‑compliance with these covenants, orcause the Board of Directors to discontinue or reduce the amount of any future dividend payment.
Future stock issuances could adversely affect common stock ownership interest and rights in comparison with those of othersecurity holders.
Our Board of Directors has the authority to issue additional shares of common stock or preferred stock without stockholderapproval. If additional funds are raised through the issuance of equity or securities convertible into common stock, or we useshares of our common stock to pay a portion of the purchase price in any future acquisition, the percentage of ownership of ourexisting stockholders would be reduced, and these newly issued securities may have rights, preferences or privileges senior tothose of existing stockholders. If we issue additional common stock or securities convertible into common stock, such issuancewould reduce the proportionate ownership and voting power of each other stockholder. In addition, such stock issuances mightresult in a reduction of the book value of our common stock.
Anti‑‑takeover provisions in our organizational documents and under Delaware law may impede or discourage a takeover,which could cause the market price of our common stock to decline.
We are a Delaware corporation, and the anti‑takeover provisions of Delaware law impose various impediments to the ability of athird party to acquire control of us, even if a change in control would be beneficial to our existing stockholders, which, undercertain circumstances, could reduce the market price of our common stock. In addition, protective provisions in our RestatedCertificate of Incorporation and Amended and Restated Bylaws or the implementation by our Board of Directors of a stockholderrights plan could prevent a takeover, which could harm our stockholders.
The price of our common stock has fluctuated in the past and this may make it difficult for stockholders to resell shares ofcommon stock at times or may make it difficult for stockholders to sell shares of common stock at prices they find attractive.
The trading price of our common stock may fluctuate widely as a result of a number of factors, many of which are outside ourcontrol. In addition, the stock market is subject to fluctuations in share prices and trading volumes that affect the market prices ofthe shares of many companies. These broad market fluctuations have adversely affected, and may in the future adversely affect,the market price of our common stock. Among the factors that could affect our stock price are:
· changes in financial estimates and buy/sell recommendations by securities analysts or our failure to meet analysts’ revenue orearnings estimates;
· actual or anticipated variations in our operating results;
· our earnings releases and financial performance;
· market conditions in our industry and the general state of the securities markets;
· fluctuations in the stock price and operating results of our competitors;
· actions by institutional stockholders;
· investor perception of us and the industry and markets in which we operate;
23

Table of Contents
· general economic conditions in the United States and Canada;
· international disorder and instability in foreign financial markets, including but not limited to potential sovereign defaults;and
· other factors described in “Risk Factors.”
Additional Risks of Our Environmental Services Business
If we are unable to obtain at a reasonable cost or under reasonable terms and conditions the necessary levels of insurance andfinancial assurances required for operations, our business and results of operations would be adversely affected.
We are required by law, license, permit and prudence to maintain various insurance instruments and financial assurances. Wecarry a broad range of insurance coverage, including general liability, automobile liability, real and personal property, workerscompensation, directors and officers liability, environmental impairment liability, business interruption and other coveragecustomary for a company of our size in our business. We purchase primary property, casualty and excess liability policies throughtraditional third party insurance carriers to mitigate risk of loss. We are self‑insured for employee health‑care coverage. Stop‑lossinsurance is carried covering liability on claims in excess of $200,000 per individual. Accrued costs related to the self‑insuredhealth care coverage were $826,000 and $1.1 million at December 31, 2018 and 2017, respectively. If our insurers were unable tomeet their obligations, or our own obligations for claims were more than expected, there could be a material adverse effect to ourfinancial condition and results of operation.
Through December 31, 2018, we have met our financial assurance requirements through a combination of insurance policies,commercial surety bonds and trust funds. Our insurance policies covering closure and post‑closure activities expire in April 2019and December 2019 for covered U.S. operating facilities (dedicated state‑controlled closure and post‑closure funds providefinancial assurance for our Washington and Nevada facilities). We continue to use self‑funded trust accounts for our post‑closureobligations at our U.S. non‑operating sites. We use commercial surety bonds for our Canadian operations that expire inNovember and December 2019, respectively. We currently have in place all financial assurance instruments necessary for ouroperations. While we expect to continue renewing these policies and surety bonds, if we were unable to obtain adequate closure,post‑closure or environmental insurance, bonds or other instruments in the future, any partially or completely uninsured claimagainst us, if successful and of sufficient magnitude, could have a material adverse effect on our results of operations and cashflows. Additionally, continued access to casualty and pollution legal liability insurance with sufficient limits, at acceptable terms,is important to obtaining new business. Failure to maintain adequate financial assurance could also result in regulatory actionincluding early closure of facilities. As of December 31, 2018, we have provided collateral of $4.9 million in funded trustagreements, $12.2 million in surety bonds, issued $2.7 million in letters of credit for financial assurance and have insurancepolicies of approximately $87.5 million for closure and post‑closure obligations at covered U.S. operating facilities. We have$715,000 in commercial surety bonds dedicated for closure obligations at our Canadian operating facility.
While we believe we will be able to renew and maintain all our insurance and requisite financial assurance policies at areasonable cost, premium and collateral requirements may materially increase. Such increases could have a material adverseeffect on our financial condition and results of operations.
We are subject to operating and litigation risks that may not be covered by insurance.
Our business operations are subject to all of the operating hazards and risks normally incidental to the handling, storage anddisposal of combustible and other hazardous products. These risks could result in substantial losses due to personal injury and/orloss of life, and severe damage and destruction of property and equipment arising from explosions or other catastrophic events.As a result, we may become a defendant in legal proceedings and litigation arising in the ordinary course of business.Additionally, environmental contamination could result in future legal proceedings. There can be no assurance that our insurancecoverage will be adequate to protect us from all material expenses related to pending and future claims or that such levels ofinsurance would be available in the future at economical prices, as described above.
24

Table of Contents
Although we carry business interruption insurance, a disruption of our business caused by a casualty event, including the full andpartial closure of our Grand View, Idaho facility (described above), may result in the loss of business, profits or customers duringthe time of such closure. As such, our insurance policies may not fully compensate us for these losses.
A significant portion of our business depends upon non‑‑recurring event cleanup projects over which we have no control.
A significant portion of our disposal revenue is attributable to discrete Event Business which varies widely in size, duration andunit pricing. For the year ended December 31, 2018, approximately 20% of our T&D revenue was derived from Event Businessprojects. The one‑time nature of Event Business, diverse spectrum of waste types received and widely varying unit pricingnecessarily creates variability in revenue and earnings. This variability may be influenced by general and industry‑specificeconomic conditions, funding availability, changes in laws and regulations, government enforcement actions or court orders,public controversy, litigation, weather, commercial real estate, closed military bases and other project timing, governmentappropriation and funding cycles and other factors. This variability can cause significant quarter‑to‑quarter and year‑to‑yeardifferences in revenue, gross profit, gross margin, operating income and net income. Also, while we pursue many largeprojects months or years in advance of work performance, both large and small cleanup project opportunities routinely arise withlittle or no prior notice. These market dynamics are inherent to the waste disposal business and are factored into our projectionsand externally communicated business outlook statements. Our projections combine historical experience with identified salespipeline opportunities, new or expanded service line projections and prevailing market conditions. A reduction in the number andsize of new cleanup projects won to replace completed work could have a material adverse effect on our financial condition andresults of operations.
If we are unable to obtain regulatory approvals and contracts for construction of additional disposal space by the time ourcurrent disposal capacity is exhausted, our business would be adversely affected.
Construction of new disposal capacity at our operating disposal facilities beyond currently permitted capacity requires state andprovincial regulatory agency approvals. Administrative processes for such approval reviews vary. There can be no assurance thatwe will be successful in obtaining future expansion approvals in a timely manner or at all. If we are not successful in receivingthese approvals, our disposal capacity could eventually be exhausted, preventing us from accepting additional waste at an affectedfacility. This would have a material adverse effect on our business.
If we are unable to renew our operating permits or lease agreements with regulatory bodies, our business would be adverselyaffected.
Our facilities operate using permits and licenses issued by various regulatory bodies at various state, provincial and federalgovernment levels. In addition, three of our facilities operate on land leased from government agencies. Failure to renew ourpermits and licenses necessary to operate our facilities or failure to renew or maintain compliance with our site lease agreementswould have a material adverse effect on our business. There can be no assurance we will continue to be successful in obtainingtimely permit applications approval, maintaining compliance with our lease agreements and obtaining timely lease renewals.
We may not be able to obtain timely or cost effective transportation services which could adversely affect our profitability.
Revenue at each of our facilities is subject to potential risks from disruptions in rail or truck transportation services relied upon todeliver waste to our facilities. Increases in fuel or labor costs, shortages of qualified drivers and unforeseen events such as labordisputes, public health pandemics, severe weather, natural disasters and other acts of God, war or terror could prevent or delayshipments and reduce both volumes and revenue. Our rail transportation service agreements with our customers generally allowus to pass on fuel surcharges assessed by the railroads. This may decrease or eliminate our exposure to fuel cost increases.Transportation services may be limited by economic conditions, including increased demand for rail or trucking services,resulting in periods of slower service to the point that individual customer needs cannot be met. No assurance can be given thatwe can procure transportation services in a timely manner at competitive rates or pass through fuel cost increases in all cases.Such factors could also limit our ability to achieve revenue and earnings objectives.
25

Table of Contents
The hazardous and radioactive waste industries in which we operate are subject to litigation risk.
The handling of radioactive, PCBs and hazardous material subjects us to potential liability claims by employees, contractors,property owners, neighbors and others. There can be no assurance that our existing liability insurance is adequate to cover claimsasserted against us or that we will be able to maintain adequate insurance in the future. Adverse rulings in judicial oradministrative proceedings could also have a material adverse effect on our financial condition and results of operations.
We may not be able to effectively adopt or adapt to new or improved technologies.
We expect to continue implementing new or improved technologies at our facilities to meet customer service demands andexpand our business. If we are unable to identify and implement new technologies in response to market conditions and customerrequirements in a timely, cost effective manner, our financial condition and results of operations could be adversely impacted.
Our financial results could be adversely affected by foreign exchange fluctuations.
We operate in the United States and Canada but report revenue, costs and earnings in U.S. dollars. Exchange rates between theU.S. dollar and the Canadian dollar are likely to fluctuate from period to period. Because our financial results are reported in U.S.dollars, we are subject to the risk of non‑cash translation losses for reporting purposes. If we continue to expand our internationaloperations, we will conduct more transactions in currencies other than the U.S. dollar. To the extent that foreign revenue andexpense transactions are not denominated in the local currency, we are further subject to the risk of transaction losses. We havenot entered into derivative instruments to offset the impact of foreign exchange fluctuations. Fluctuations in foreign currencyexchange rates could have a material adverse effect on our financial condition and results of operations.
We are subject to risks associated with operating in a foreign country.
Our Canadian subsidiaries’ facilities are located in Blainville, Québec and Tilbury, Ontario, Canada and use the Canadian dollaras their functional currency. International operations are subject to risks that may have material adverse effects on our financialcondition and results of operations. The risks that our international operations are subject to include, among other things:
· difficulties and costs relating to staffing and managing foreign operations;
· foreign labor union relations;
· fluctuations in the value of the Canadian dollar;
· repatriation of cash from Canadian subsidiaries to the United States;
· imposition of additional taxes on our foreign income; and
· regulatory, economic and public policy changes.
Additional Risks of Our Field & Industrial Services Business
A significant portion of our Field & Industrial Services segment depends upon the demand for cleanup of spills and otherremedial projects and regulatory developments over which we have no control.
A significant portion of our Field & Industrial Services segment consists of remediation, recycling, industrial cleaning andmaintenance, transportation, total waste management, technical services, and emergency response services. Demand for theseservices can be affected by the commencement and completion of cleanup of major spills and other events,
26

Table of Contents
customers’ decisions to undertake remedial projects, seasonal fluctuations due to weather and budgetary cycles influencing thetiming of customers’ spending for remedial activities, the timing of regulatory decisions relating to hazardous waste managementprojects, changes in regulations governing the management of hazardous waste, changes in the waste processing industry towardswaste minimization and the propensity for delays in the demand for remedial services, and changes in governmental regulationsrelevant to our diverse operations. We do not control such factors and, as a result, our revenue and income can vary from quarterto quarter or year to year, and past financial performance may not be a reliable indicator of future performance.
Additional Risks of Completed and Potential Acquisitions
Acquisitions that we undertake could be difficult to integrate, disrupt our business, dilute stockholder value and adverselyaffect our results of operations.
Acquisitions involve multiple risks. Our inability to successfully integrate an acquired business could have a material adverseeffect on our financial condition and results of operations. These risks include but are not limited to:
· failure of the acquired company to achieve anticipated revenues, earnings or cash flows;
· assumption of liabilities, including those related to environmental matters, that were not disclosed to us or that exceed ourestimates;
· problems integrating the purchased operations with our own, which could result in substantial costs and delays or otheroperational, technical or financial problems;
· potential compliance issues relating to the protection of health and the environment, compliance with securities laws andregulations, adequacy of internal controls and other matters;
· diversion of management’s attention or other resources from our existing business;
· risks associated with entering markets or product/service areas in which we have limited prior experience;
· increases in working capital investment to fund the growth of acquired operations;
· unexpected capital expenditures to upgrade waste handling or other infrastructure or replace equipment to operate safely andefficiently;
· potential loss of key employees and customers of the acquired company; and
· future write‑offs of intangible and other assets, including goodwill, if the acquired operations fail to generate sufficient cashflows.
If we are not able to achieve these objectives, the anticipated benefits of the acquisition may not be realized fully, if at all, or maytake longer to realize than expected. It is possible that the integration process could result in the loss of key employees, thedisruption of our ongoing business, failure to implement the business plan for the combined businesses, unanticipated issues inintegrating service offerings, logistics information, communications and other systems or other unanticipated issues, expenses andliabilities, any or all of which could adversely affect our ability to maintain relationships with customers and employees or toachieve the anticipated benefits of the acquisition.
In the event that we undertake future acquisitions, we may not be able to successfully execute our acquisition strategy.
We may experience delays in making acquisitions or be unable to make acquisitions we desire for a number of reasons. Suitableacquisition candidates may not be available at purchase prices that are attractive to us or on terms that are acceptable to us. Inpursuing acquisition opportunities, we typically compete with other companies, some of which have
27

Table of Contents
greater financial and other resources than we do. We may not have available funds or common stock with a sufficient marketprice to complete an acquisition. If we are unable to secure sufficient funding for potential acquisitions, we may not be able tocomplete acquisitions that we otherwise find advantageous.
The timing and number of acquisitions we pursue may cause volatility in our financial results.
We are unable to predict the size, timing and number of acquisitions we may complete, if any. In addition, we may incur expensesassociated with sourcing, evaluating and negotiating acquisitions (including those that are not completed), and we also may payfees and expenses associated with financing acquisitions to investment banks and others. Any of these amounts may besubstantial, and together with the size, timing and number of acquisitions we pursue, may negatively impact and cause significantvolatility in our financial results and the price of our common stock.
ITEM 1B. UNRESOLVED STAFF COMMENTS
None.
ITEM 2. PROPERTIES
The following table describes our principal physical properties and facilities at December 31, 2018 owned or leased by us. Webelieve that our existing properties are in good condition and suitable for conducting our business.
Location Segment Function Own/LeaseBeatty, Nevada Environmental Svcs. Waste treatment and landfill disposal LeaseRobstown, Texas Environmental Svcs. Waste treatment, landfill disposal and
recycling Own
Grand View, Idaho Environmental Svcs. Waste treatment and landfill disposal OwnBelleville, Michigan Environmental Svcs. Waste treatment and landfill disposal OwnBlainville, Québec, Canada Environmental Svcs. Waste treatment and landfill disposal Own/LeaseRichland, Washington Environmental Svcs. Landfill disposal SubleaseWinnie, Texas Environmental Svcs. Waste processing and deep-well disposal OwnDetroit, Michigan Environmental Svcs. Waste treatment OwnCanton, Ohio Environmental Svcs. Waste treatment and recycling OwnHarvey, Illinois Environmental Svcs. Waste treatment OwnYork, Pennsylvania Environmental Svcs. Waste treatment OwnTulsa, Oklahoma Environmental Svcs. Waste treatment OwnRomulus, Michigan Environmental Svcs. Recycling OwnMt. Airy, North Carolina Environmental Svcs. Waste treatment OwnTilbury, Ontario, Canada Environmental Svcs. Waste treatment OwnVernon, California Environmental Svcs. Waste treatment OwnSulligent, Alabama Field & Industrial Svcs. Field and industrial waste management OwnTampa, Florida Field & Industrial Svcs. Field and industrial waste management OwnTaylor, Michigan Field & Industrial Svcs. Field and industrial waste management OwnBayonne, New Jersey Field & Industrial Svcs. Field and industrial waste management LeaseAtlanta, Georgia Field & Industrial Svcs. Field and industrial waste management LeaseWrentham, Massachusetts Field & Industrial Svcs. Field and industrial waste management OwnDallas, Texas Field & Industrial Svcs. Field and industrial waste management OwnMidland, Texas Field & Industrial Svcs. Field and industrial waste management OwnBoise, Idaho Corporate Corporate Office LeaseLivonia, Michigan Corporate Regional Office Lease
(1) An explosion occurred at our Grand View, Idaho facility on November 17, 2018, which resulted in the entire facility’sclosure through January 2019. The Grand View, Idaho facility resumed limited operations in February 2019.
28
(1)
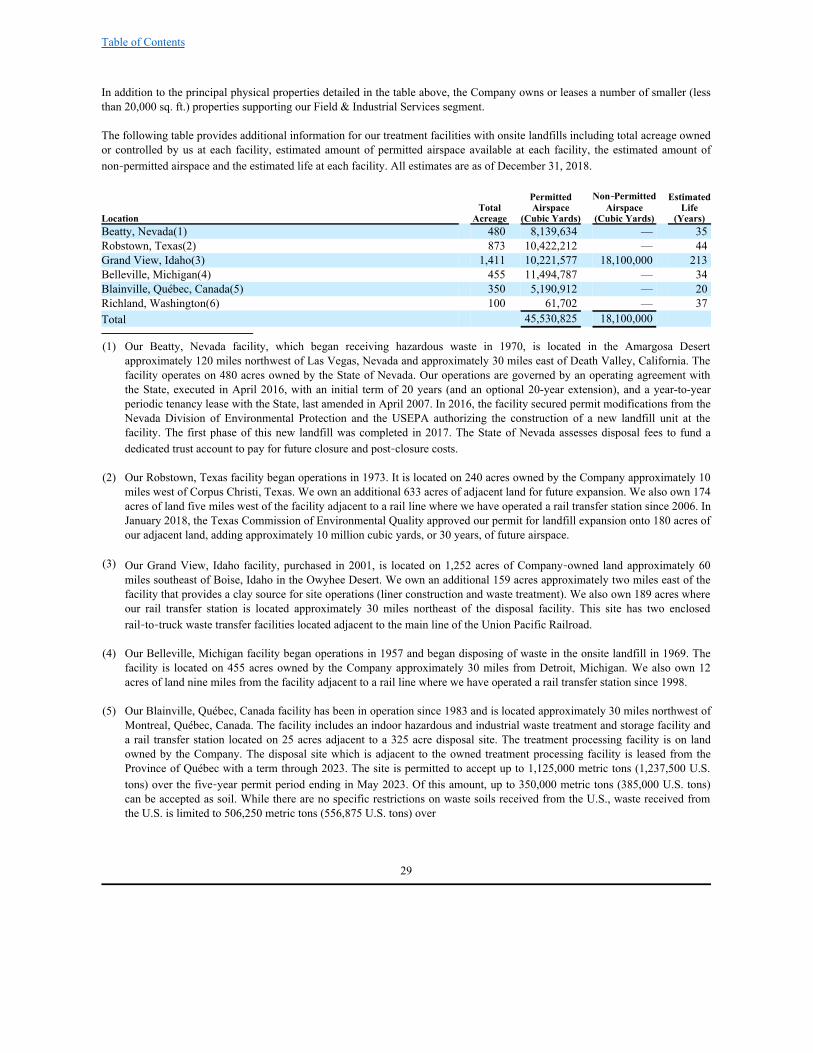
Table of Contents
In addition to the principal physical properties detailed in the table above, the Company owns or leases a number of smaller (lessthan 20,000 sq. ft.) properties supporting our Field & Industrial Services segment.
The following table provides additional information for our treatment facilities with onsite landfills including total acreage ownedor controlled by us at each facility, estimated amount of permitted airspace available at each facility, the estimated amount ofnon‑permitted airspace and the estimated life at each facility. All estimates are as of December 31, 2018.
Permitted Non‑‑Permitted Estimated Total Airspace Airspace LifeLocation Acreage (Cubic Yards) (Cubic Yards) (Years)Beatty, Nevada(1) 480 8,139,634 — 35Robstown, Texas(2) 873 10,422,212 — 44Grand View, Idaho(3) 1,411 10,221,577 18,100,000 213Belleville, Michigan(4) 455 11,494,787 — 34Blainville, Québec, Canada(5) 350 5,190,912 — 20Richland, Washington(6) 100 61,702 — 37Total 45,530,825 18,100,000
(1) Our Beatty, Nevada facility, which began receiving hazardous waste in 1970, is located in the Amargosa Desertapproximately 120 miles northwest of Las Vegas, Nevada and approximately 30 miles east of Death Valley, California. Thefacility operates on 480 acres owned by the State of Nevada. Our operations are governed by an operating agreement withthe State, executed in April 2016, with an initial term of 20 years (and an optional 20-year extension), and a year-to-yearperiodic tenancy lease with the State, last amended in April 2007. In 2016, the facility secured permit modifications from theNevada Division of Environmental Protection and the USEPA authorizing the construction of a new landfill unit at thefacility. The first phase of this new landfill was completed in 2017. The State of Nevada assesses disposal fees to fund adedicated trust account to pay for future closure and post‑closure costs.
(2) Our Robstown, Texas facility began operations in 1973. It is located on 240 acres owned by the Company approximately 10miles west of Corpus Christi, Texas. We own an additional 633 acres of adjacent land for future expansion. We also own 174acres of land five miles west of the facility adjacent to a rail line where we have operated a rail transfer station since 2006. InJanuary 2018, the Texas Commission of Environmental Quality approved our permit for landfill expansion onto 180 acres ofour adjacent land, adding approximately 10 million cubic yards, or 30 years, of future airspace.
(3) Our Grand View, Idaho facility, purchased in 2001, is located on 1,252 acres of Company‑owned land approximately 60miles southeast of Boise, Idaho in the Owyhee Desert. We own an additional 159 acres approximately two miles east of thefacility that provides a clay source for site operations (liner construction and waste treatment). We also own 189 acres whereour rail transfer station is located approximately 30 miles northeast of the disposal facility. This site has two enclosedrail‑to‑truck waste transfer facilities located adjacent to the main line of the Union Pacific Railroad.
(4) Our Belleville, Michigan facility began operations in 1957 and began disposing of waste in the onsite landfill in 1969. Thefacility is located on 455 acres owned by the Company approximately 30 miles from Detroit, Michigan. We also own 12acres of land nine miles from the facility adjacent to a rail line where we have operated a rail transfer station since 1998.
(5) Our Blainville, Québec, Canada facility has been in operation since 1983 and is located approximately 30 miles northwest ofMontreal, Québec, Canada. The facility includes an indoor hazardous and industrial waste treatment and storage facility anda rail transfer station located on 25 acres adjacent to a 325 acre disposal site. The treatment processing facility is on landowned by the Company. The disposal site which is adjacent to the owned treatment processing facility is leased from theProvince of Québec with a term through 2023. The site is permitted to accept up to 1,125,000 metric tons (1,237,500 U.S.tons) over the five‑year permit period ending in May 2023. Of this amount, up to 350,000 metric tons (385,000 U.S. tons)can be accepted as soil. While there are no specific restrictions on waste soils received from the U.S., waste received fromthe U.S. is limited to 506,250 metric tons (556,875 U.S. tons) over
29

Table of Contents
the five‑year permit period. The Province assesses fees to fund a dedicated government trust account to pay for post‑closurecosts at the disposal site.
(6) Our Richland, Washington LLRW facility has been in operation since 1965 and is located on 100 acres of land leased by theState of Washington from the federal government on the U.S. Department of Energy Hanford Reservation approximately 35miles west of Richland, Washington. We sublease this property from the State of Washington. The lease between the State ofWashington and the federal government expires in 2063. We renewed our sublease with the State in 2005 for ten years withfour ten‑year renewal options, giving us control of the property until the year 2055 provided that we meet our obligationsand operate in a compliant manner. The facility’s intended operating life is equal to the period of the sublease. The Stateassesses user fees for local economic development, state regulatory agency expenses and a dedicated trust account to pay forlong‑term care after the facility closes. The State maintains separate, dedicated trust funds for future closure and post‑closurecosts.
ITEM 3. LEGAL PROCEEDINGS
In the ordinary course of business, we are involved in judicial and administrative proceedings involving federal, state, provincialor local governmental authorities, including regulatory agencies that oversee and enforce compliance with permits. Fines orpenalties may be assessed by our regulators for non‑compliance. Actions may also be brought by individuals or groups inconnection with permitting of planned facilities, modification or alleged violations of existing permits, or alleged damagessuffered from exposure to hazardous substances purportedly released from our operated sites, as well as other litigation. Wemaintain insurance intended to cover property and damage claims asserted as a result of our operations. Periodically, managementreviews and may establish reserves for legal and administrative matters, or other fees expected to be incurred in relation to thesematters.
On November 17, 2018, an explosion occurred at our Grand View, Idaho facility, resulting in one employee fatality and injuriesto other employees. The incident severely damaged the facility’s primary waste-treatment building as well as surrounding wastehandling, waste storage, maintenance and administrative support structures, resulting in the closure of the entire facility thatremained in effect through January 2019. We resumed limited operations at our Grand View, Idaho facility in February 2019. Inaddition to initiating and conducting our own investigation into the incident, we are fully cooperating with IDEQ, the USEPA andOSHA to support their comprehensive and independent investigations of the incident. As we continue to investigate the cause ofthe incident, we are evaluating its impact, but, at this time, we are unable to predict the timing and outcome of the investigation.As such, we cannot presently estimate the potential liability, if any, related to the incident therefore no amounts related to suchclaims have been recorded in our financial statements as of December 31, 2018. We have not been named as a defendant in anyaction relating to the incident. We maintain workers’ compensation insurance, business interruption insurance and liabilityinsurance for personal injury, property and casualty damage. We believe that any potential third-party claims associated with theexplosion, in excess of our deductibles, are expected to be resolved primarily through our insurance policies. Although we carrybusiness interruption insurance, a disruption of our business caused by a casualty event, including the full and partial closure ofour Grand View, Idaho facility, may result in the loss of business, profits or customers during the time of such closure.Accordingly, our insurance policies may not fully compensate us for these losses.
Other than described above, we are not currently a party to any material pending legal proceedings and are not aware of any otherclaims that could, individually or in the aggregate, have a materially adverse effect on our financial position, results of operationsor cash flows.
ITEM 4. MINE SAFETY DISCLOSURES
Not applicable.
30
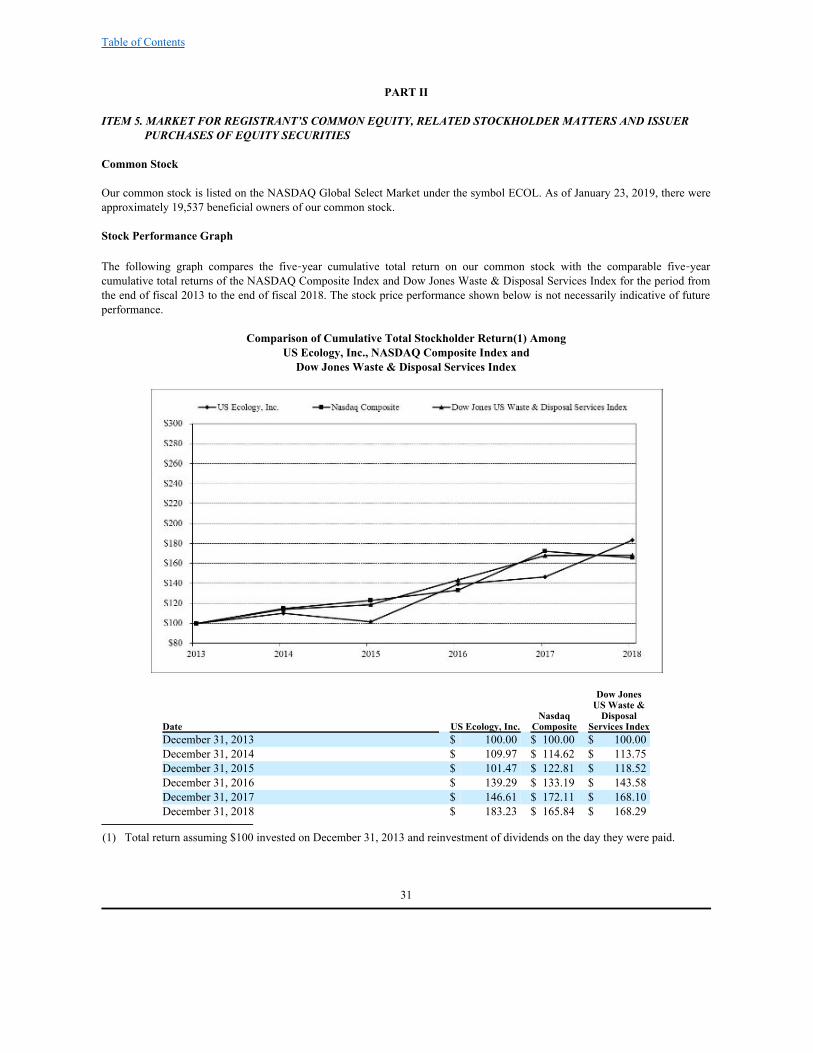
Table of Contents
PART II
ITEM 5. MARKET FOR REGISTRANT’S COMMON EQUITY, RELATED STOCKHOLDER MATTERS AND ISSUERPURCHASES OF EQUITY SECURITIES
Common Stock
Our common stock is listed on the NASDAQ Global Select Market under the symbol ECOL. As of January 23, 2019, there wereapproximately 19,537 beneficial owners of our common stock.
Stock Performance Graph
The following graph compares the five‑year cumulative total return on our common stock with the comparable five‑yearcumulative total returns of the NASDAQ Composite Index and Dow Jones Waste & Disposal Services Index for the period fromthe end of fiscal 2013 to the end of fiscal 2018. The stock price performance shown below is not necessarily indicative of futureperformance.
Comparison of Cumulative Total Stockholder Return(1) AmongUS Ecology, Inc., NASDAQ Composite Index andDow Jones Waste & Disposal Services Index
Dow Jones US Waste & Nasdaq DisposalDate US Ecology, Inc. Composite Services IndexDecember 31, 2013 $ 100.00 $ 100.00 $ 100.00December 31, 2014 $ 109.97 $ 114.62 $ 113.75December 31, 2015 $ 101.47 $ 122.81 $ 118.52December 31, 2016 $ 139.29 $ 133.19 $ 143.58December 31, 2017 $ 146.61 $ 172.11 $ 168.10December 31, 2018 $ 183.23 $ 165.84 $ 168.29
(1) Total return assuming $100 invested on December 31, 2013 and reinvestment of dividends on the day they were paid.
31

Table of Contents
The performance graph above is being furnished solely to accompany this Annual Report on Form 10‑K pursuant toItem 201(e) of Regulation S‑K, is not being filed for purposes of Section 18 of the Exchange Act, and is not to be incorporated byreference into any filing of the Company, whether made before or after the date hereof, regardless of any general incorporationlanguage in such filing.
Securities Authorized for Issuance Under Equity Compensation Plans
Information with respect to compensation plans under which our equity securities are authorized for issuance is discussed inItem 12 of Part III of this Annual Report on Form 10‑K.
Issuer Purchases of Equity Securities
On June 1, 2016, the Company’s Board of Directors authorized the repurchase of $25.0 million of the Company’s outstandingcommon stock. Repurchases may be made from time to time in the open market or through privately negotiated transactions. Thetiming of any repurchases will be based upon prevailing market conditions and other factors. The Company did not repurchaseany shares of common stock under the repurchase program during the year ended December 31, 2018. On May 29, 2018, therepurchase program was extended and will remain in effect until June 6, 2020, unless further extended by our Board of Directors.
The following table summarizes the purchases of shares of our common stock during the year ended December 31, 2018:
Total Number of Approximate Dollar Shares Purchased as Value of Shares that Part of Publicly May Yet be Purchased Total Number of Average Price Announced Plan or Under the Plans orPeriod Shares Purchased Paid per Share Program ProgramsJanuary 1 to 31, 2018 — $ — — $ 25,000,000February 1 to 28, 2018 — — — 25,000,000March 1 to 31, 2018 (1) 5,564 56.20 — 25,000,000April 1 to 30, 2018 — — — 25,000,000May 1 to 31, 2018 — — — 25,000,000June 1 to 30, 2018 — — — 25,000,000July 1 to 31, 2018 — — — 25,000,000August 1 to 31, 2018 — — — 25,000,000September 1 to 30, 2018 — — — 25,000,000October 1 to 31, 2018 — — — 25,000,000November 1 to 30, 2018 — — — 25,000,000December 1 to 31, 2018 — — — 25,000,000Total 5,564 $ 56.20 — $ 25,000,000
(1) Represents shares surrendered or forfeited in connection with certain employees’ tax withholding obligations related to thevesting of shares of restricted stock.
32

Table of Contents
ITEM 6. SELECTED FINANCIAL DATA
This summary should be read in conjunction with the consolidated financial statements and related notes.
$s in thousands, except per share amounts 2018 2017 (3) 2016 2015 (2) 2014 (1) Revenue $565,928 $504,042 $477,665 $563,070 $447,411 Impairment charges 3,666 8,903 — 6,700 — Operating income 74,088 59,758 70,029 71,631 72,450 Foreign currency gain (loss) 55 516 (138) (2,196) (1,499) Income tax (benefit) expense 15,263 (6,395) 21,049 21,244 22,814 Net income $ 49,595 $ 49,365 $ 34,252 $ 25,611 $ 38,236 Earnings per share—basic: $ 2.27 $ 2.27 $ 1.58 $ 1.18 $ 1.78 Earnings per share—diluted: $ 2.25 $ 2.25 $ 1.57 $ 1.18 $ 1.77 Shares used in earnings per share calculation: Basic 21,888 21,758 21,704 21,637 21,537 Diluted 22,047 21,902 21,789 21,733 21,655
Dividends paid per share $ 0.72 $ 0.72 $ 0.72 $ 0.72 $ 0.72 Total assets $947,898 $802,076 $776,400 $771,987 $910,047 Working capital (4) $111,436 $ 81,127 $ 52,774 $ 54,516 $ 76,869 Long‑term debt $364,000 $277,000 $277,362 $293,740 $384,381 Stockholders’ equity $359,217 $324,077 $280,024 $256,135 $251,337 Adjusted EBITDA (5) $124,679 $113,810 $112,786 $125,450 $108,976
(1) 2014 financial data reflects the acquisition of EQ on June 17, 2014.
(2) 2015 financial data reflects the divestiture of Allstate on November 1, 2015.
(3) 2017 financial data reflects a net income tax benefit of $23.8 million, primarily as a result of the re-measurement of certaindeferred tax assets and liabilities following the passage of the Tax Act.
(4) Calculated as current assets minus current liabilities.
(5) We define Adjusted EBITDA as net income before interest expense, interest income, income tax expense, depreciation,amortization, share-based compensation, accretion of closure and post‑closure liabilities, foreign currency gain/loss,non‑cash impairment charges, gain/loss on divestiture and other income/expense. See “Adjusted EBITDA” under Item 7.Management’s Discussion and Analysis of Financial Condition and Results of Operations of this report for further discussionof Adjusted EBITDA and a reconciliation to the most directly comparable GAAP measure, net income.
ITEM 7. MANAGEMENT’S DISCUSSION AND ANALYSIS OF FINANCIAL CONDITION AND RESULTS OFOPERATIONS
General
US Ecology, Inc. is a leading North American provider of environmental services to commercial and government entities. TheCompany addresses the complex waste management needs of its customers, offering treatment, disposal and recycling ofhazardous, non‑hazardous and radioactive waste, as well as a wide range of complementary field and industrial services. USEcology’s comprehensive knowledge of the waste business, its collection of waste management facilities and focus on safety,environmental compliance, and customer service enables us to effectively meet the needs of our customers and to buildlong‑lasting relationships.
We have fixed facilities and service centers operating in the United States, Canada and Mexico. Our fixed facilities include fiveRCRA subtitle C hazardous waste landfills and one LLRW landfill located near Beatty, Nevada; Richland, Washington;Robstown, Texas; Grand View, Idaho; Detroit, Michigan and Blainville, Québec, Canada. These facilities
33

Table of Contents
generate revenue from fees charged to transport, recycle, treat and dispose of waste and to perform various field and industrialservices for our customers.
Our operations are managed in two reportable segments reflecting our internal management reporting structure and nature ofservices offered as follows:
Environmental Services —This segment provides a broad range of hazardous material management services includingtransportation, recycling, treatment and disposal of hazardous, non‑hazardous and radioactive waste at Company‑ownedlandfill, wastewater, deep-well injection and other treatment facilities.
Field & Industrial Services —This segment provides packaging and collection of hazardous waste and total wastemanagement solutions at customer sites and through our 10‑day transfer facilities. Services include on‑site management,waste characterization, transportation and disposal of non‑hazardous and hazardous waste. This segment also providesspecialty field services such as industrial cleaning and maintenance, remediation, lab packs, retail services,transportation, emergency response and other services to commercial and industrial facilities and to government entities.
In order to provide insight into the underlying drivers of our waste volumes and related treatment and disposal (“T&D”) revenues,we evaluate period‑to‑period changes in our T&D revenue for our Environmental Services segment based on the industry of thewaste generator , based on North American Industry Classification System (“NAICS”) codes.
The composition of the Environmental Services segment T&D revenues by waste generator industry for the years endedDecember 31, 2018 and 2017 were as follows:
% of Treatment and Disposal Revenue (1)
for the Years Ended December 31, Generator Industry 2018 2017Chemical Manufacturing 17% 17%Metal Manufacturing 16% 16%Broker / TSDF 13% 13%General Manufacturing 12% 13%Refining 11% 11%Government 7% 6%Utilities 3% 4%Waste Management & Remediation 3% 3%Transportation 3% 2%Mining, Exploration and Production 2% 3%Other (2) 13% 12%
(1) Excludes all transportation service revenue
(2) Includes retail and wholesale trade, rate regulated, construction and other industries
We also categorize our Environmental Services T&D revenue as either “Base Business” or “Event Business” based on theunderlying nature of the revenue source.
Base Business consists of waste streams from ongoing industrial activities and tends to be reoccurring in nature. We define EventBusiness as non‑recurring projects that are expected to equal or exceed 1,000 tons, with Base Business defined as all otherbusiness not meeting the definition of Event Business. The duration of Event Business projects can last from a several-weekcleanup of a contaminated site to a multiple year cleanup project.
During 2018, Base Business revenue growth was up 7% compared to 2017. Base Business revenue was approximately 80% oftotal 2018 T&D revenue, up from 78% in 2017. Our business is highly competitive and no assurance can be given that we willmaintain these revenue levels or increase our market share.
34

Table of Contents
A significant portion of our disposal revenue is attributable to discrete Event Business projects which vary widely in size,duration and unit pricing. For the year ended December 31, 2018, approximately 20% of our T&D revenue was derived fromEvent Business projects. The one‑time nature of Event Business, diverse spectrum of waste types received and widely varyingunit pricing necessarily creates variability in revenue and earnings. This variability may be influenced by general andindustry‑specific economic conditions, funding availability, changes in laws and regulations, government enforcement actions orcourt orders, public controversy, litigation, weather, commercial real estate, closed military bases and other project timing,government appropriation and funding cycles and other factors. The types and amounts of waste received from Base Businessalso vary from quarter to quarter.
This variability can also cause significant quarter‑to‑quarter and year‑to‑year differences in revenue, gross profit, gross margin,operating income and net income. While we pursue many projects months or years in advance of work performance, cleanupproject opportunities routinely arise with little or no prior notice. These market dynamics are inherent to the waste disposalbusiness and are factored into our projections and externally communicated business outlook statements. Our projections combinehistorical experience with identified sales pipeline opportunities, new or expanded service line projections and prevailing marketconditions.
Depending on project‑specific customer needs and competitive economics, transportation services may be offered at or near ourcost to help secure new business. For waste transported by rail from the eastern United States and other locations distant from ourGrand View, Idaho and Robstown, Texas facilities, transportation‑related revenue can account for as much as 75% of total projectrevenue. While bundling transportation and disposal services reduces overall gross profit as a percentage of total revenue (“grossmargin”), this value‑added service has allowed us to win multiple projects that management believes we could not have otherwisecompeted for successfully. Our Company‑owned fleet of gondola railcars, which is periodically supplemented with railcarsobtained under operating leases, has reduced our transportation expenses by largely eliminating reliance on more costlyshort‑term rentals. These Company‑owned railcars also help us to win business during times of demand‑driven railcar scarcity.
The increased waste volumes resulting from projects won through this bundled service strategy further drive operating leveragebenefits inherent to the disposal business, increasing profitability. While waste treatment and other variable costs areproject‑specific, the incremental earnings contribution from large and small projects generally increases as overall disposalvolumes increase. Based on past experience, management believes that maximizing operating income, net income and earningsper share is a higher priority than maintaining or increasing gross margin. We intend to continue aggressively bidding bundledtransportation and disposal services based on this proven strategy.
We serve oil refineries, chemical production plants, steel mills, waste brokers/aggregators serving small manufacturers and otherindustrial customers that are generally affected by the prevailing economic conditions and credit environment. Adverse conditionsmay cause our customers as well as those they serve to curtail operations, resulting in lower waste production and/or delayedspending on off‑site waste shipments, maintenance, waste cleanup projects and other work. Factors that can impact generaleconomic conditions and the level of spending by customers include, but are not limited to, consumer and industrial spending,increases in fuel and energy costs, conditions in the real estate and mortgage markets, labor and healthcare costs, access to credit,consumer confidence and other global economic factors affecting spending behavior. Market forces may also induce customers toreduce or cease operations, declare bankruptcy, liquidate or relocate to other countries, any of which could adversely affect ourbusiness. To the extent business is either government funded or driven by government regulations or enforcement actions, webelieve it is less susceptible to general economic conditions. Spending by government agencies may be reduced due to decliningtax revenues resulting from a weak economy or changes in policy. Disbursement of funds appropriated by Congress may also bedelayed for various reasons.
Geographical Information
For the year ended December 31, 2018, we derived $495.2 million or 87% of our revenue in the United States and $70.8 millionor 13% of our revenue in Canada. For the year ended December 31, 2017, we derived $434.5 million or 86% of our revenue in theUnited States and $69.5 million or 14% of our revenue in Canada. For the year ended December 31, 2016, we derived$428.8 million or 90% of our revenue in the United States and $48.9 million or 10% of our revenue in Canada. Additionalinformation about the geographical areas in which our revenues are derived and in which our assets
35

Table of Contents
are located is presented in Note 4 and Note 21 to the Consolidated Financial Statements in “Part II, Item 8. Financial Statementsand Supplementary Data” of this Annual Report on Form 10‑K.
Significant Events
Our results of operations have been affected by certain significant events during the past three fiscal years including, but notlimited to:
2018 Events
Explosion at Grand View, Idaho Facility: On November 17, 2018, an explosion occurred at our Grand View, Idaho facility,resulting in one employee fatality and injuries to other employees. The incident severely damaged the facility’s primary waste-treatment building as well as surrounding waste handling, waste storage, maintenance and administrative support structures,resulting in the closure of the entire facility that remained in effect through January 2019. O n February 8, 2019, we resumeddirect landfill disposal operations at our Grand View, Idaho facility after receiving a temporary authorization from IDEQ. Wastetreatment activities at the facility remain closed pending the completion of the various investigations, reconstruction of damagedfacilities and authorization from IDEQ. In addition to initiating and conducting our own investigation into the incident, we arefully cooperating with the IDEQ, the USEPA and OSHA to support their comprehensive and independent investigations of theincident. As we continue to investigate the cause of the incident, we are evaluating its impact, but, at this time, we are unable topredict the timing and outcome of the investigation. As such, we cannot presently estimate the potential liability, if any, related tothe incident therefore no amounts related to such claims have been recorded in our financial statements as of December 31, 2018.We believe that any potential third-party claims associated with the explosion, in excess of our deductibles, are expected to beresolved primarily through our insurance policies. Although we carry business interruption insurance, a disruption of our businesscaused by a casualty event, including the full and partial closure of our Grand View, Idaho facility, may result in the loss ofbusiness, profits or customers during the time of such closure. Accordingly, our insurance policies may not fully compensate usfor these losses during our facility closures.
Acquisition of Ecoserv Industrial Disposal, LLC: On November 14, 2018, the Company acquired Ecoserv Industrial Disposal,LLC (“Winnie”), which provides non-hazardous industrial wastewater disposal solutions and employs deep-well injectiontechnology in the southern United States. The total purchase price was $87.1 million and was funded with borrowings under the2017 Credit Agreement of $87.0 million and cash on hand. The purchase price is subject to post-closing adjustments based onagreed upon working capital requirements. Post-closing adjustments are expected to be finalized and settled in 2019. Werecorded $66.6 million of intangible assets and $13.6 million of goodwill on the consolidated balance sheets as a result of theacquisition. Amortizing intangible assets will be amortized over a weighted average life of approximately 52 years. Theacquisition of Winnie was not material to our consolidated financial position or results of operations either individually or whenaggregated with other acquisitions completed in 2018.
Acquisition of ES&H of Dallas, LLC: On August 31, 2018, the Company acquired ES&H of Dallas, LLC (“ES&H Dallas”),which provides emergency and spill response, light industrial services and transportation and logistics for waste disposal andrecycling from locations in Dallas and Midland, Texas. The total purchase price was $21.3 million and was funded with cash onhand. We recorded $4.2 million of intangible assets and $7.1 million of goodwill on the consolidated balance sheets as a result ofthe acquisition. Amortizing intangible assets will be amortized over a weighted average life of approximately 16 years. Theacquisition of ES&H Dallas was not material to our consolidated financial position or results of operations either individually orwhen aggregated with other acquisitions completed in 2018.
Goodwill and Intangible Asset Impairment Charges: Based on the results of the Company’s interim assessment of the goodwilland intangible assets of our Mobile Recycling reporting unit, we recorded a $1.4 million goodwill impairment charge andimpairment charges of $1.8 million and $454,000 on non-amortizing intangible assets and amortizing intangible assets,respectively, associated with our Mobile Recycling business in the third quarter of 2018. See Note 13 to the ConsolidatedFinancial Statements in “Part II, Item 8. Financial Statements and Supplementary Data” of this Annual Report on Form 10-K foradditional information.
36

Table of Contents
2017 Events
Goodwill and Intangible Asset Impairment Charges: Based on the results of the Company’s annual assessment of goodwill andintangible assets, during the fourth quarter we recorded a $5.5 million goodwill impairment charge in our Resource Recoveryreporting unit and a $3.4 million impairment charge on the non-amortizing intangible waste collection, recycling and resalepermit associated with our Resource Recovery business. See Note 13 to the Consolidated Financial Statements in “Part II, Item 8.Financial Statements and Supplementary Data” of this Annual Report on Form 10-K for additional information.
Tax Cuts and Jobs Act of 2017: On December 22, 2017, the Tax Act was signed into law making significant changes to theInternal Revenue Code. Changes include, but are not limited to, a corporate tax rate decrease from 35% to 21% effective for taxyears beginning after December 31, 2017, the transition of U.S. international taxation from a worldwide tax system to a territorialsystem, and a one-time transition tax on the mandatory deemed repatriation of cumulative foreign earnings as of December 31,2017. In accordance with the Tax Act, we recorded $23.8 million as additional income tax benefit in the fourth quarter of 2017,the period in which the legislation was enacted. The total benefit included $25.2 million related to the re-measurement of certaindeferred tax assets and liabilities partially offset by $1.4 million of provisional expense related to one-time transition tax on themandatory deemed repatriation of foreign earnings. Additionally, Staff Accounting Bulletin No. 118 ("SAB 118") was issued toaddress the application of U.S. GAAP in situations when a registrant does not have the necessary information available, prepared,or analyzed (including computations) in reasonable detail to complete the accounting for certain income tax effects of the TaxAct. December 22, 2018 marked the end of the measurement period for purposes of SAB 118. As such, we have completed ouranalysis based on legislative updates relating to the Tax Act currently available, which resulted in a net benefit for measurementperiod adjustments of $193,000 for the year ended December 31, 2018. The total tax provision benefit included a $2.2 millionbenefit related to the re-measurement of certain deferred tax assets and liabilities offset by $2.0 million of expense related toadjustments to the transition tax.
Write-off of Deferred Financing Costs: In connection with the refinancing of the Company’s outstanding debt, we wrote offcertain unamortized deferred financing costs and original issue discount that were to be amortized to interest expense in futureperiods through a one-time charge of $5.5 million to interest expense in the second quarter of 2017. See Note 16 to theConsolidated Financial Statements in “Part II, Item 8. Financial Statements and Supplementary Data” of this Annual Report onForm 10-K for additional information.
2016 Events
Divestiture of Augusta, Georgia Facility: On April 5, 2016, we completed the divestiture of our Augusta, Georgia facility forcash proceeds of $1.9 million. The Augusta, Georgia facility was reported as part of our Environmental Services segment. Sales,net income and total assets of the Augusta, Georgia facility are not material to our consolidated financial position or results ofoperations in any period presented. We recognized a $1.9 million pre‑tax gain on the divestiture of the Augusta, Georgia facility,which is included in Other income (expense) in our consolidated statements of operations for the year ended December 31, 2016.
Acquisition of Environmental Services Inc.: On May 2, 2016, the Company acquired 100% of the outstanding shares ofEnvironmental Services Inc., (“ESI”), an environmental services company based in Tilbury, Ontario, Canada. The total purchaseprice was $4.9 million, net of cash acquired, and was funded with cash on hand. Revenues and total assets of ESI are not materialto our consolidated financial position or results of operations. We recorded $1.5 million of intangible assets and $1.0 million ofgoodwill on the consolidated balance sheets as a result of the acquisition. Amortizing intangible assets will be amortized over aweighted average life of approximately 14 years.
Acquisition of Vernon, California Facility: On October 1, 2016, the Company acquired the Vernon, California based RCRAPart B, liquids and solids waste treatment and storage facility of Evoqua Water Technologies LLC. The total purchase price was$5.0 million and was funded with cash on hand. Revenues and total assets of the Vernon, California facility are not material toour consolidated financial position or results of operations. We recorded $3.2 million of intangible assets and $354,000 ofgoodwill on the consolidated balance sheets as a result of the acquisition. Amortizing intangible assets will be amortized over aweighted average life of approximately 20 years.
37

Table of Contents
Results of Operations
Our operating results and percentage of revenues for the years ended December 31, 2018, 2017 and 2016 were as follows:
Year Ended December 31, 2018 vs. 2017 2017 vs. 2016 $s in thousands 2018 % 2017 % 2016 % $ Change % Change $ Change % Change Revenue Environmental Services $400,678 71 % $366,308 73 % $337,771 71 % $ 34,370 9 % $ 28,537 8 %Field & Industrial Services 165,250 29 % 137,734 27 % 139,894 29 % 27,516 20 % (2,160) (2)%Total 565,928 100 % 504,042 100 % 477,665 100 % 61,886 12 % 26,377 6 %
Gross Profit Environmental Services 147,475 37 % 134,968 37 % 126,818 38 % 12,507 9 % 8,150 6 %Field & Industrial Services 22,619 14 % 18,159 13 % 20,777 15 % 4,460 25 % (2,618) (13)%Total 170,094 30 % 153,127 30 % 147,595 31 % 16,967 11 % 5,532 4 %
Selling, General &Administrative Expenses Environmental Services 22,542 6 % 24,185 7 % 21,418 6 % (1,643) (7)% 2,767 13 %Field & Industrial Services 10,742 7 % 9,278 7 % 10,115 7 % 1,464 16 % (837) (8)%Corporate 59,056 n/m 51,003 n/m 46,033 n/m 8,053 16 % 4,970 11 %Total 92,340 16 % 84,466 17 % 77,566 16 % 7,874 9 % 6,900 9 %
Adjusted EBITDA Environmental Services 160,526 40 % 146,371 40 % 139,698 41 % 14,155 10 % 6,673 5 %Field & Industrial Services 18,456 11 % 14,709 11 % 16,342 12 % 3,747 25 % (1,633) (10)%Corporate (54,303) n/m (47,270) n/m (43,254) n/m (7,033) 15 % (4,016) 9 %Total $124,679 22 % $113,810 23 % $112,786 24 % $ 10,869 10 % $ 1,024 1 %
Management uses Adjusted EBITDA as a financial measure to assess segment performance. Adjusted EBITDA is defined as netincome before interest expense, interest income, income tax expense, depreciation, amortization, share-based compensation,accretion of closure and post‑closure liabilities, foreign currency gain/loss, non‑cash impairment charges, gain/loss on divestitureand other income/expense. The reconciliation of Net income to Adjusted EBITDA for the years ended December 31, 2018, 2017and 2016 is as follows:
Year Ended December 31, 2018 vs. 2017 2017 vs. 2016 $s in thousands 2018 2017 2016 $ Change % Change $ Change % Change Net income $ 49,595 $ 49,365 $ 34,252 $ 230 0 % $ 15,113 44 %Income tax (benefit) expense 15,263 (6,395) 21,049 21,658 (339)% (27,444) (130)%Interest expense 12,130 18,157 17,317 (6,027) (33)% 840 5 %Interest income (215) (62) (96) (153) 247 % 34 (35)%Foreign currency (gain) loss (55) (516) 138 461 (89)% (654) (474)%Gain on divestiture — — (2,034) — n/m 2,034 (100)%Other income (2,630) (791) (597) (1,839) 232 % (194) 32 %Impairment charges 3,666 8,903 — (5,237) (59)% 8,903 n/m Depreciation and amortization of plantand equipment 29,207 28,302 25,304 905 3 % 2,998 12 %Amortization of intangibles 9,645 9,888 10,575 (243) (2)% (687) (6)%Share-based compensation 4,366 3,933 2,925 433 11 % 1,008 34 %Accretion and non-cash adjustment ofclosure & post-closure liabilities 3,707 3,026 3,953 681 23 % (927) (23)%
Adjusted EBITDA $124,679 $113,810 $112,786 $10,869 10 % $ 1,024 1 % Adjusted EBITDA is a complement to results provided in accordance with accounting principles generally accepted in the UnitedStates (“GAAP”) and we believe that such information provides additional useful information to analysts, stockholders and otherusers to understand the Company’s operating performance. Since Adjusted EBITDA is not a measurement determined inaccordance with GAAP and is thus susceptible to varying calculations, Adjusted EBITDA as presented may not be comparable toother similarly titled measures of other companies. Items excluded from Adjusted
38

Table of Contents
EBITDA are significant components in understanding and assessing our financial performance. Adjusted EBITDA should not beconsidered in isolation or as an alternative to, or substitute for, net income, cash flows generated by operations, investing orfinancing activities, or other financial statement data presented in the consolidated financial statements as indicators of financialperformance or liquidity.
Adjusted EBITDA has limitations as an analytical tool and should not be considered in isolation or a substitute for analyzing ourresults as reported under GAAP. Some of the limitations are:
· Adjusted EBITDA does not reflect changes in, or cash requirements for, our working capital needs;
· Adjusted EBITDA does not reflect our interest expense, or the requirements necessary to service interest or principalpayments on our debt;
· Adjusted EBITDA does not reflect our income tax expenses or the cash requirements to pay our taxes;
· Adjusted EBITDA does not reflect our cash expenditures or future requirements for capital expenditures or contractualcommitments; and
· Although depreciation and amortization charges are non‑cash charges, the assets being depreciated and amortized will oftenhave to be replaced in the future, and Adjusted EBITDA does not reflect any cash requirements for such replacements.
2018 Compared to 2017
Revenue
Total revenue increased 12% to $565.9 million in 2018, compared with $504.0 million in 2017.
Environmental Services
Environmental Services segment revenue increased 9% to $400.7 million in 2018, compared to $366.3 million in 2017. T&Drevenue increased 7% in 2018 compared to 2017, primarily as a result of a 7% increase in Base Business revenue, partially offsetby a 3% decrease in project‑based Event Business revenue. Transportation and logistics service revenue increased 18% in 2018compared to 2017, reflecting more Event Business projects utilizing the Company’s transportation and logistics services. Tons ofwaste disposed of or processed increased 2% in 2018 compared to 2017.
T&D revenue from recurring Base Business waste generators increased 7% in 2018 compared to 2017 and comprised 80% oftotal T&D revenue. The increase in Base Business T&D revenue compared to the prior year primarily reflects higher T&Drevenue from the chemical manufacturing, broker/TSDF, “Other,” metal manufacturing and refining industry groups.
T&D revenue from Event Business waste generators decreased 3% in 2018 compared to 2017 and comprised 20% of total T&Drevenue. The decrease in Event Business T&D revenue compared to the prior year primarily reflects lower T&D revenue from thegeneral manufacturing, mining, exploration and production and refining industry groups, partially offset by higher T&D revenuefrom the government and “Other” industry groups.
39

Table of Contents
The following table summarizes combined Base Business and Event Business T&D revenue growth, within the EnvironmentalServices segment, by waste generator industry for 2018 compared to 2017:
T&D Revenue Growth 2018 vs. 2017 Government 19% Transportation 13% Waste Management & Remediation 12% Other 11% Chemical Manufacturing 9% Broker / TSDF 8% Metal Manufacturing 4% Refining 1% General Manufacturing -2% Utilities -10% Mining and E&P -25%
Field & Industrial Services
Field & Industrial Services segment revenue increased 20% to $165.3 million in 2018 compared with $137.7 million in 2017. Theincrease in Field & Industrial Services segment revenue is primarily attributable to revenue from new facilities in 2018 andstronger overall market conditions.
Gross Profit
Total gross profit increased 11% to $170.1 million in 2018, up from $153.1 million in 2017. Total gross margin was 30% for both2018 and 2017.
Environmental Services
Environmental Services segment gross profit increased 9% to $147.5 million in 2018, up from $135.0 million in 2017. Thisincrease primarily reflects higher T&D volumes in 2018 compared to 2017. Total segment gross margin was 37% for both 2018and 2017. T&D gross margin was 42% for 2018 compared with 40% for 2017. 2017 T&D gross margin reflects the impact of thetemporary closure of one of our treatment facilities due to wind damage and incremental costs associated with the hurricanes inthe Gulf Coast and Florida that impacted our operations in 2017.
Field & Industrial Services
Field & Industrial Services segment gross profit increased 25% to $22.6 million in 2018, up from $18.2 million in 2017. Totalsegment gross margin was 14% for 2018 compared with 13% for 2017. The increase in segment gross margin is primarilyattributable to contract wins and associated revenue in our small quantity generation services and total waste managementbusinesses, stronger market conditions in our remediation business and the contribution from new facilities in 2018.
Selling, General and Administrative Expenses (“SG&A”)
Total SG&A increased to $92.3 million, or 16% of total revenue, in 2018 compared with $84.5 million, or 17% of total revenue,in 2017.
Environmental Services
Environmental Services segment SG&A decreased 7% to $22.5 million, or 6% of segment revenue, in 2018 compared with$24.2 million, or 7% of segment revenue, in 2017, primarily reflecting lower property tax expense and lower amortizationexpense. The decrease in property tax expense in 2018 was the result of a settlement in the second quarter of
40

Table of Contents
2018 on a dispute related to a $1.1 million property tax assessment for tax years 2015 through 2017 associated with our 2014acquisition of EQ Holdings, Inc. recorded in the third quarter of 2017.
Field & Industrial Services
Field & Industrial Services segment SG&A increased 16% to $10.7 million, or 7% of segment revenue, in 2018 compared with$9.3 million, or 7% of segment revenue, in 2017. The increase in segment SG&A primarily reflects incremental costs associatedwith new facilities in 2018.
Corporate
Corporate SG&A was $59.1 million, or 10% of total revenue, in 2018 compared with $51.0 million, or 10% of total revenue, in2017, primarily reflecting higher employee labor costs and higher consulting and professional services expenses in 2018compared to 2017.
Components of Adjusted EBITDA
Income tax expense
Our effective income tax rate for 2018 was 23.5% compared to -14.9% in 2017. The increase was primarily the result of theimpact that the Tax Act, enacted on December 22, 2017, had on our 2017 effective tax rate. Among other provisions, the Tax Actreduces the federal corporate tax rate to 21% from the existing maximum rate of 35%, effective for tax years beginning afterDecember 31, 2017, and imposes a deemed repatriation tax on previously untaxed accumulated earnings and profits of foreignsubsidiaries. As required, in the period of enactment, we re-measured our net deferred tax assets and liabilities and recorded aprovisional benefit of $25.2 million to our income tax expense. We also recorded a provisional charge of $1.4 million to ourincome tax expense for the deemed repatriation transition tax.
Interest expense
Interest expense was $12.1 million in 2018 compared with $18.2 million in 2017. The decrease in interest expense in 2018 wasprimarily the result of a one-time non-cash charge of $5.5 million to interest expense in 2017 related to the refinancing of our2014 Credit Agreement. The remaining decrease is attributable to a lower effective interest rate under our 2017 CreditAgreement, partially offset by additional interest expense on borrowings used to finance the Winnie acquisition.
Foreign currency gain (loss)
We recognized a $55,000 non‑cash foreign currency gain in 2018 compared with a $516,000 non‑cash foreign currency gain in2017. Foreign currency gains and losses reflect changes in business activity conducted in a currency other than the USD, ourfunctional currency. Our Canadian subsidiaries’ facilities are located in Blainville, Québec and Tilbury, Ontario, Canada and usethe Canadian dollar (“CAD”) as their functional currency. Additionally, we established intercompany loans between our Canadiansubsidiaries, whose functional currency is the CAD, and our parent company, US Ecology, as part of a tax and treasurymanagement strategy allowing for repayment of third‑party bank debt. These intercompany loans are payable by our Canadiansubsidiaries to US Ecology in CAD requiring us to revalue the outstanding loan balance through our statements of operationsbased on USD/CAD currency movements from period to period. At December 31, 2018, we had $20.3 million of intercompanyloans subject to currency revaluation.
Other income
Other income was $2.6 million in 2018 compared with other income of $791,000 in 2017, primarily reflecting a $2.0 million gainin 2018 on the issuance of a property easement on a portion of unutilized Company-owned land at one of our operating facilities.
41

Table of Contents
Depreciation and amortization of plant and equipment
Depreciation and amortization expense increased to $29.2 million in 2018 compared with $28.3 million in 2017, primarilyreflecting additional depreciation expense on assets placed in service in 2018, including assets associated with the ES&H Dallasand Winnie acquisitions.
Amortization of intangibles
Intangible assets amortization expense was $9.6 million in 2018 compared with $9.9 million in 2017, primarily reflecting the fullamortization of certain intangible assets in 2017, partially offset by additional amortization of intangible assets recorded as aresult of the ES&H Dallas and Winnie acquisitions.
Share‑based compensation
Share‑based compensation expense increased 11% to $4.4 million in 2018, compared with $3.9 million 2017 as a result of anincrease in equity‑based awards granted to employees.
Accretion and non‑cash adjustment of closure and post‑closure liabilities
Accretion and non‑cash adjustment of closure and post‑closure liabilities increased to $3.7 million in 2018 compared with$3.0 million in 2017, primarily reflecting higher non-cash adjustments to post-closure liabilities recorded in 2017 due to changesin cost estimates and timing associated with closed sites.
Impairment charges
Based on the results of our 2018 interim assessment of the goodwill and intangible assets of our Mobile Recycling reporting unit,which is part of our Environmental Services segment, we recorded impairment charges of $3.7 million in the third quarter of2018. Based on the results of our 2017 annual assessment of goodwill and intangible assets, we recorded impairment charges of$8.9 million in our Resource Recovery reporting unit, which is part of our Environmental Services segment, in the fourth quarterof 2017. See Note 13 to the Consolidated Financial Statements in “Part II, Item 8. Financial Statements and Supplementary Data”of this Annual Report on Form 10-K for additional information.
2017 Compared to 2016
Revenue
Total revenue increased 6% to $504.0 million in 2017, compared with $477.7 million in 2016.
Environmental Services
Environmental Services segment revenue increased 8% to $366.3 million in 2017, compared to $337.8 million in 2016. T&Drevenue increased 8% in 2017 compared to 2016, primarily as a result of a 23% increase in project‑based Event Business revenueand a 5% increase in Base Business revenue. Transportation and logistics service revenue increased 8% in 2017 compared to2016, reflecting more Event Business projects utilizing the Company’s transportation and logistics services. Tons of wastedisposed of or processed increased 7% in 2017 compared to 2016.
T&D revenue from recurring Base Business waste generators increased 5% in 2017 compared to 2016 and comprised 78% oftotal T&D revenue. During 2017, increases in Base Business T&D revenue from the chemical manufacturing, refining, generalmanufacturing, and “Other” industry groups were partially offset by decreases in T&D revenue from Base Business in thebroker/TSDF industry group.
T&D revenue from Event Business waste generators increased 23% in 2017 compared to 2016 and comprised 22% of total T&Drevenue. The increase in Event Business T&D revenue compared to the prior year primarily reflects higher T&D revenue fromthe chemical manufacturing, metal manufacturing, government and “Other” industry groups, partially offset
42

Table of Contents
by lower T&D revenue from the general manufacturing industry group. The increase in revenue from the chemical manufacturingindustry group is primarily attributable to a large East Coast remedial cleanup project.
The following table summarizes combined Base Business and Event Business T&D revenue growth, within the EnvironmentalServices segment, by waste generator industry for 2017 compared to 2016:
T&D Revenue Growth 2017 vs. 2016 Chemical Manufacturing 37% Waste Management & Remediation 23% Government 14% Mining and E&P 12% Refining 11% Other 9% Metal Manufacturing 8% General Manufacturing -2% Transportation -6% Utilities -7% Broker / TSDF -8%
Field & Industrial Services
Field & Industrial Services segment revenue decreased 2% to $137.7 million in 2017 compared with $139.9 million in 2016. Thedecrease in Field & Industrial Services segment revenue is primarily attributable to the expiration of a contract that was notrenewed or replaced and softer overall market conditions for industrial and remediation services.
Gross Profit
Total gross profit increased 4% to $153.1 million in 2017, up from $147.6 million in 2016. Total gross margin was 30% for 2017compared with 31% for 2016.
Environmental Services
Environmental Services segment gross profit increased 6% to $135.0 million in 2017, up from $126.8 million in 2016. Thisincrease primarily reflects higher T&D volumes in 2017 compared to 2016. Total segment gross margin was 37% for 2017compared with 38% for 2016. T&D gross margin was 40% for 2017 compared with 42% for 2016. The decrease in T&D grossmargin is primarily attributable to the impact of the temporary closure of one of our treatment facilities due to wind damage andincremental costs associated with the hurricanes in the Gulf Coast and Florida that impacted our operations in 2017.
Field & Industrial Services
Field & Industrial Services segment gross profit decreased 13% to $18.2 million in 2017, down from $20.8 million in 2016. Totalsegment gross margin was 13% for 2017 compared with 15% for 2016. The decrease in segment gross margin is attributable tolower route density in our small quantity generation services due to a contract that was not renewed in late 2016 and a lessfavorable service mix for our industrial and remediation services in 2017 compared to 2016.
Selling, General and Administrative Expenses (“SG&A”)
Total SG&A increased to $84.5 million, or 17% of total revenue, in 2017 compared with $77.6 million, or 16% of total revenue,in 2016.
43

Table of Contents
Environmental Services
Environmental Services segment SG&A increased 13% to $24.2 million, or 7% of segment revenue, in 2017 compared with$21.4 million, or 6% of segment revenue, in 2016, primarily reflecting higher labor and incentive compensation costs, higherproperty tax expenses and lower gains on sale of assets, partially offset by lower bad debt expense and higher insurance proceedsin 2017 compared to 2016.
Field & Industrial Services
Field & Industrial Services segment SG&A decreased 8% to $9.3 million, or 7% of segment revenue, in 2017 compared with$10.1 million, or 7% of segment revenue, in 2016. The decrease in segment SG&A primarily reflects lower bad debt expense andhigher insurance proceeds, partially offset by higher labor and incentive compensation costs in 2017 compared to 2016.
Corporate
Corporate SG&A was $51.0 million, or 10% of total revenue, in 2017 compared with $46.0 million, or 10% of total revenue, in2016, primarily reflecting higher labor and incentive compensation costs in 2017 compared to 2016.
Components of Adjusted EBITDA
Income tax expense
Our effective income tax rate for 2017 was -14.9% compared to 38.1% in 2016. The decrease was primarily the result of theimpact of the Tax Act, enacted on December 22, 2017 by the U.S. government. Among other provisions, the Tax Act reduced thefederal corporate tax rate to 21% from the existing maximum rate of 35%, effective for tax years beginning after December 31,2017, and imposed a deemed repatriation tax on previously untaxed accumulated earnings and profits of foreign subsidiaries. Were-measured our net deferred tax assets and liabilities and recorded a provisional benefit of $25.2 million to our income taxexpense in 2017. We also recorded a provisional charge of $1.4 million to our income tax expense for the deemed repatriationtransition tax. The decrease in the effective income tax rate was also attributable to a higher proportion of earnings from ourCanadian operations in 2017 which are taxed at a lower corporate tax rate, partially offset by non-recurring non-deductibleimpairment charges as well as a higher effective state tax rate driven by changes in apportionment of income between the variousstates in which we operate.
Interest expense
Interest expense was $18.2 million in 2017 compared with $17.3 million in 2016. The Company wrote off certain unamortizeddeferred financing costs and original issue discount associated with the 2014 Credit Agreement that were to be amortized tointerest expense in future periods through a one-time non-cash charge of $5.5 million to interest expense in the second quarter of2017. This increase is partially offset by a lower effective interest rate under the 2017 Credit Agreement compared to the 2014Credit Agreement and reduced debt levels in 2017 compared to 2016.
Foreign currency gain (loss)
We recognized a $516,000 non‑cash foreign currency gain in 2017 compared with a $138,000 non‑cash foreign currency loss in2016. Foreign currency gains and losses reflect changes in business activity conducted in a currency other than the USD, ourfunctional currency. Our Canadian subsidiaries’ facilities are located in Blainville, Québec and Tilbury, Ontario, Canada and usethe Canadian dollar (“CAD”) as their functional currency. Additionally, we established intercompany loans between our Canadiansubsidiaries, whose functional currency is the CAD, and our parent company, US Ecology, as part of a tax and treasurymanagement strategy allowing for repayment of third‑party bank debt. These intercompany loans are payable by our Canadiansubsidiaries to US Ecology in CAD requiring us to revalue the outstanding loan balance through our statements of operationsbased on USD/CAD currency movements from period to period. At December 31, 2017, we had $21.4 million of intercompanyloans subject to currency revaluation.
44

Table of Contents
Gain on divestiture
Other income in 2016 includes approximately $2.0 million related to the gain on sale of the Augusta, Georgia facility inApril 2016 and final closing adjustments on the Allstate divestiture.
Depreciation and amortization of plant and equipment
Depreciation and amortization expense increased to $28.3 million in 2017 compared with $25.3 million in 2016, primarilyreflecting additional depreciation expense on assets placed in service in 2017.
Amortization of intangibles
Intangible assets amortization expense was $9.9 million in 2017 compared with $10.6 million in 2016.
Share‑based compensation
Share‑based compensation expense increased 34% to $3.9 million in 2017, compared with $2.9 million 2016 as a result of anincrease in equity‑based awards granted to employees.
Accretion and non‑cash adjustment of closure and post‑closure liabilities
Accretion and non‑cash adjustment of closure and post‑closure liabilities decreased to $3.0 million in 2017 compared with$4.0 million in 2016, primarily reflecting non-cash adjustments to post-closure liabilities recorded in 2017 due to changes in costestimates associated with closed sites.
Impairment charges
Based on the results of our 2017 annual assessment of goodwill and intangible assets, we recorded impairment charges of $8.9million in our Resource Recovery reporting unit, which is part of our Environmental Services segment, in the fourth quarter of2017. See Note 13 to the Consolidated Financial Statements in “Part II, Item 8. Financial Statements and Supplementary Data” ofthis Annual Report on Form 10‑K for additional information.
Liquidity and Capital Resources
Our primary sources of liquidity are cash and cash equivalents, cash generated from operations and borrowings under the newsenior secured credit agreement (the “2017 Credit Agreement”). At December 31, 2018, we had $32.0 million in cash and cashequivalents immediately available and $130.3 million of borrowing capacity available under the 2017 Credit Agreement. Weassess our liquidity in terms of our ability to generate cash to fund our operating, investing and financing activities. Our primaryongoing cash requirements are funding operations, capital expenditures, paying principal and interest on our long-term debt, andpaying declared dividends pursuant to our dividend policy. We believe future operating cash flows will be sufficient to meet ourfuture operating, investing and dividend cash needs for the foreseeable future. Furthermore, existing cash balances andavailability of additional borrowings under the 2017 Credit Agreement provide additional sources of liquidity should they berequired. Operating Activities. In 2018, net cash provided by operating activities was $81.5 million. This primarily reflects net income of$49.6 million, non‑cash depreciation, amortization and accretion of $42.6 million, an increase in accounts payable and accruedliabilities of $14.3 million, deferred income taxes of $5.9 million, share-based compensation expense of $4.4 million andnon‑cash impairment charges of $3.7 million, partially offset by an increase in accounts receivable of $32.3 million and anincrease in income taxes receivable of $7.1 million. Impacts on net income are due to the factors discussed above under “Resultsof Operations.” The decrease in accounts payable and accrued liabilities is primarily attributable to the timing of payments tovendors for products and services. The increase in receivables is primarily attributable to the timing of customer payments.Changes in income taxes receivable are primarily attributable to the timing of income tax payments.
45

Table of Contents
Days sales outstanding were 77 days as of December 31, 2018 and 2017.
In 2017, net cash provided by operating activities was $79.7 million. This primarily reflects net income of $49.4 million,non‑cash depreciation, amortization and accretion of $41.2 million, non‑cash impairment charges of $8.9 million, amortizationand write-off of debt issuance costs of $6.0 million, a decrease in income taxes receivable of $4.1 million, share‑basedcompensation expense of $3.9 million, an increase in income taxes payable of $3.9 and an increase in accrued salaries andbenefits of $3.4 million, partially offset by a decrease in deferred income taxes of $25.3 million, an increase in accountsreceivable of $13.9 million, and a decrease in closure and post-closure obligations of $1.8 million. Impacts on net income are dueto the factors discussed above under “Results of Operations.” The increase in receivables is primarily attributable to the timing ofcustomer payments. Changes in income taxes receivable and payable are primarily attributable to the timing of income taxpayments. Changes in deferred income taxes are primarily attributable to the re-measurement of our deferred tax assets andliabilities based on the provisions of the Tax Act.
In 2016, net cash provided by operating activities was $74.0 million. This primarily reflects net income of $34.3 million,non‑cash depreciation, amortization and accretion of $39.8 million, a decrease in accounts receivable of $10.9 million,share‑based compensation expense of $2.9 million, non‑cash amortization of debt issuance costs of $2.0 million, and a decreasein other assets of $1.2 million, partially offset by a decrease in accounts payable and accrued liabilities of $7.7 million, a decreasein deferred income taxes of $2.7 million, the gain recognized on the divestiture of the Augusta, Georgia facility in April 2016,final closing adjustments on the Allstate divestiture of $2.0 million, and an increase in income taxes receivable of $2.0 million.Impacts on net income are due to the factors discussed above under “Results of Operations.” The decrease in receivables isprimarily attributable to the timing of customer payments. Changes in income taxes receivable and payable are primarilyattributable to the timing of income tax payments.
Investing Activities. In 2018, net cash used in investing activities was $148.8 million, primarily related the acquisition of Winniefor $87.1 million, the acquisition of ES&H Dallas for $21.3 million, and capital expenditures of $40.8 million. Significant capitalprojects included continuing construction of additional disposal capacity and railway expansions at our Blainville, Québec,Canada location and infrastructure upgrades at our corporate and operating facilities.
In 2017, net cash used in investing activities was $33.9 million, primarily related to capital expenditures. Significant capitalprojects included construction of additional disposal capacity at our Beatty, Nevada and Blainville, Québec, Canada locations andequipment purchases and infrastructure upgrades at our corporate and operating facilities.
In 2016, net cash used in investing activities was $41.4 million, primarily related to capital expenditures of $35.7 million, thepurchase of the Vernon, California based RCRA Part B, liquids and solids waste treatment and storage facility of Evoqua WaterTechnologies LLC for $5.0 million and the purchase of Environmental Services Inc., (“ESI”), for $4.9 million, net of cashacquired, partially offset by proceeds from the divestiture of our Augusta, Georgia facility for $2.7 million, net of cash divested.Significant capital projects included construction of additional disposal capacity at our Blainville, Québec, Canada, Beatty,Nevada and Robstown, Texas facilities and equipment purchases and infrastructure upgrades at our corporate and operatingfacilities.
Financing Activities. During 2018, net cash provided by financing activities was $72.9 million, consisting primarily of $87.0million in proceeds under the 2017 Credit Agreement to fund the acquisition of Winnie and $2.4 million in proceeds receivedfrom the exercise of stock options, partially offset by $15.8 million of dividend payments to our stockholders. During 2017, net cash used in financing activities was $26.3 million, consisting primarily of $283.0 million of repayment of theCompany’s long-term debt under the 2014 Credit Agreement, $281.0 million of initial proceeds from the borrowing of long-termdebt under the 2017 Credit Agreement, $4.0 million of subsequent repayments of long-term debt under the 2017 CreditAgreement, $15.7 million of dividend payments to our stockholders, $3.0 million of deferred financing costs associated with the2017 Credit Agreement and net payment activity on the Company’s short-term borrowings of $2.2 million. During 2016, net cash used in financing activities was $31.6 million, consisting primarily of $18.0 million of payments on ourTerm Loan and $15.7 million of dividend payments to our stockholders, partially offset by $2.2 million of net proceeds on ourRevolving Credit Facility to fund working capital requirements.
46

Table of Contents
Credit Facility
On April 18, 2017, the Company entered into the 2017 Credit Agreement with Wells Fargo Bank, National Association, asadministrative agent for the lenders, swingline lender and issuing lender, and Bank of America, N.A., as an issuing lender, whichprovides for a $500.0 million, five-year revolving credit facility (the “Revolving Credit Facility”), including a $75.0 millionsublimit for the issuance of standby letters of credit and a $25.0 million sublimit for the issuance of swingline loans used to fundshort-term working capital requirements. The 2017 Credit Agreement also contains an accordion feature whereby the Companymay request up to $200.0 million of additional funds through an increase to the Revolving Credit Facility, through incrementalterm loans, or some combination thereof. Proceeds from the Revolving Credit Facility are restricted solely for working capital andother general corporate purposes (including acquisitions and capital expenditures). Under the Revolving Credit Facility, revolvingcredit loans are available based on a base rate (as defined in the 2017 Credit Agreement) or LIBOR, at the Company’s option,plus an applicable margin which is determined according to a pricing grid under which the interest rate decreases or increasesbased on our ratio of funded debt to consolidated earnings before interest, taxes, depreciation and amortization (as defined in the2017 Credit Agreement). The Company wrote off certain unamortized deferred financing costs and original issue discountassociated with the 2014 Credit Agreement that were to be amortized to interest expense in future periods through a one-timecharge of $5.5 million to interest expense in the second quarter of 2017. At December 31, 2018, the effective interest rate on the Revolving Credit Facility, including the impact of our interest rate swap,was 3.53%. Interest only payments are due either quarterly or on the last day of any interest period, as applicable. In October2014, the Company entered into an interest rate swap agreement, effectively fixing the interest rate on $170.0 million, or 47%, ofthe Revolving Credit Facility borrowings as of December 31, 2018. The Company is required to pay a commitment fee ranging from 0.175% to 0.35% on the average daily unused portion of theRevolving Credit Facility, with such commitment fee to be reduced based upon the Company’s total net leverage ratio (as definedin the 2017 Credit Agreement). The maximum letter of credit capacity under the Revolving Credit Facility is $75.0 million andthe 2017 Credit Agreement provides for a letter of credit fee equal to the applicable margin for LIBOR loans under the RevolvingCredit Facility. At December 31, 2018, there were $364.0 million of borrowings outstanding on the Revolving Credit Facility.These borrowings are due on the revolving credit maturity date (as defined in the 2017 Credit Agreement) and presented as long-term debt in the consolidated balance sheets. The Company has entered into a sweep arrangement whereby day-to-day cash requirements in excess of available cash balancesare advanced to the Company on an as-needed basis with repayments of these advances automatically made from subsequentdeposits to our cash operating accounts (the “Sweep Arrangement”). Total advances outstanding under the Sweep Arrangementare subject to the $25.0 million swingline loan sublimit under the Revolving Credit Facility. The Company’s revolving creditloans outstanding under the Revolving Credit Facility are not subject to repayment through the Sweep Arrangement. As ofDecember 31, 2018, there were no amounts outstanding subject to the Sweep Arrangement. As of December 31, 2018, the availability under the Revolving Credit Facility was $130.3 million with $5.7 million of theRevolving Credit Facility issued in the form of standby letters of credit utilized as collateral for closure and post-closure financialassurance and other assurance obligations. See Note 16 to the Consolidated Financial Statements in “Part II, Item 8. Financial Statements and Supplementary Data” of thisAnnual Report on Form 10‑K for additional information on the Company’s debt.
47

Table of Contents
Contractual Obligations and Guarantees
Contractual Obligations
US Ecology’s contractual obligations at December 31, 2018 become due as follows:
Payments Due by Period$s in thousands Total 2019 2020-2021 2022-2023 ThereafterClosure and post-closure obligations(1) $ 283,085 $ 2,317 $ 13,128 $ 12,251 $ 255,389Operating lease commitments 20,873 5,638 6,828 3,342 5,065Credit agreement obligations(2) 364,000 — — 364,000 —Interest expense(3) 45,527 13,724 27,612 4,191 —Total contractual obligations(4) $ 713,485 $ 21,679 $ 47,568 $ 383,784 $ 260,454
(1) For the purposes of the table above, closure and post‑closure obligations are shown on an undiscounted basis and inflatedusing an estimated annual inflation rate of 2.6%. Cash payments for closure and post‑closure obligation extend to the year2105.
(2) At December 31, 2018, there were $364.0 million of revolving credit loans outstanding on the Revolving Credit Facility.These revolving credit loans are due upon the earliest to occur of (a) April 18, 2022 (or, with respect to any lender, such laterdate as requested by us and accepted by such lender), (b) the date of termination of the entire revolving credit commitment(as defined in the 2017 Credit Agreement) by us, and (c) the date of termination of the revolving credit commitment.
(3) Interest expense has been calculated using the effective interest rate of 3.85% in effect at December 31, 2018 on theunhedged variable rate portion of the Revolving Credit Facility borrowings and 3.67% on the fixed rate hedged portion ofthe Revolving Credit Facility borrowings. The interest expense calculation reflects assumed payments on the RevolvingCredit Facility borrowings consistent with the disclosures in footnote (2) above.
(4) As we are not able to reasonably estimate when we would make any cash payments to settle unrecognized tax benefits of$555,000, such amounts have not been included in the table above. In addition, we have recorded a liability for interest of$15,000 relating to such unrecognized tax benefits but have not included such amounts in the table above.
Guarantees
We enter into a wide range of indemnification arrangements, guarantees and assurances in the ordinary course of business andhave evaluated agreements that contain guarantees and indemnification clauses. These include tort indemnities, tax indemnities,indemnities against third‑party claims arising out of arrangements to provide services to us and indemnities related to the sale ofour securities. We also indemnify individuals made party to any suit or proceeding if that individual was acting as an officer ordirector of US Ecology or was serving at the request of US Ecology or any of its subsidiaries during their tenure as a director orofficer. We also provide guarantees and indemnifications for the benefit of our wholly‑owned subsidiaries to satisfy performanceobligations, including closure and post‑closure financial assurances. It is difficult to quantify the maximum potential liabilityunder these indemnification arrangements; however, we are not currently aware of any material liabilities to the Company or anyof its subsidiaries arising from these arrangements.
Environmental Matters
We maintain funded trusts agreements, surety bonds and insurance policies for future closure and post‑closure obligations at bothcurrent and formerly operated disposal facilities. These funded trust agreements, surety bonds and insurance policies are based onmanagement estimates of future closure and post‑closure monitoring using engineering evaluations and interpretations ofregulatory requirements which are periodically updated. Accounting for closure and post‑closure costs includes final disposal cellcapping and revegetation, soil and groundwater monitoring and routine maintenance and surveillance required after a site isclosed.
48

Table of Contents
We estimate that our undiscounted future closure and post‑closure costs for all facilities was approximately $283.1 million atDecember 31, 2018, with a median payment year of 2063. Our future closure and post‑closure estimates are our best estimate ofcurrent costs and are updated periodically to reflect current technology, cost of materials and services, applicable laws,regulations, permit conditions or orders and other factors. These current costs are adjusted for anticipated annual inflation, whichwe assumed to be 2.6% as of December 31, 2018. These future closure and post‑closure estimates are discounted to their presentvalue for financial reporting purposes using our credit‑adjusted risk‑free interest rate, which approximates our incrementallong‑term borrowing rate in effect at the time the obligation is established or when there are upward revisions to our estimatedclosure and post‑closure costs. At December 31, 2018, our weighted‑average credit‑adjusted risk‑free interest rate was 6.0%. Forfinancial reporting purposes, our recorded closure and post‑closure obligations were $78.4 million and $76.1 million as ofDecember 31, 2018 and 2017, respectively.
Through December 31, 2018, we have met our financial assurance requirements through insurance, surety bonds, standby lettersof credit and self‑funded restricted trusts.
U.S. Operating and Non‑‑Operating Facilities
We cover our closure and post‑closure obligations for our U.S. operating facilities through the use of third‑party insurancepolicies, surety bonds and standby letters of credit. Insurance policies covering our closure and post‑closure obligations expire inApril 2019 and December 2019. Our total policy limits are approximately $87.5 million. At December 31, 2018 our trust accountshad $4.9 million for our closure and post‑closure obligations and are identified as Restricted cash and investments on ourconsolidated balance sheets.
All closure and post‑closure funding obligations for our Beatty, Nevada and Richland, Washington facilities revert to therespective State. Volume based fees are collected from our customers and remitted to state controlled trust funds to cover theestimated cost of closure and post‑closure obligations.
Stablex
We use commercial surety bonds to cover our closure obligations for our Stablex facility located in Blainville, Québec, Canada.Our lease agreement with the Province of Québec requires that the surety bond be maintained for 25 years after the lease expiresin 2023. At December 31, 2018 we had $715,000 in commercial surety bonds dedicated for closure obligations. These bonds wererenewed in November and December 2018 and expire in November and December 2019. Post‑closure funding obligations for theStablex landfill revert back to the Province of Québec through a dedicated trust account that is funded based on a per‑metric‑tondisposed fee by Stablex.
We expect to renew insurance policies and commercial surety bonds in the future. If we are unable to obtain adequate closure,post‑closure or environmental liability insurance and/or commercial surety bonds in future years, any partial or completelyuninsured claim against us, if successful and of sufficient magnitude, could have a material adverse effect on our financialcondition, results of operations or cash flows. Additionally, continued access to casualty and pollution legal liability insurancewith sufficient limits, at acceptable terms, is important to obtaining new business. Failure to maintain adequate financialassurance could also result in regulatory action including early closure of facilities. While we believe we will be able to maintainthe requisite financial assurance policies at a reasonable cost, premium and collateral requirements may materially increase.
Operation of disposal facilities creates operational, closure and post‑closure obligations that could result in unplanned monitoringand corrective action costs. We cannot predict the likelihood or effect of all such costs, new laws or regulations, litigation or otherfuture events affecting our facilities. We do not believe that continuing to satisfy our environmental obligations will have amaterial adverse effect on our financial condition or results of operations.
Seasonal Effects
Seasonal fluctuations due to weather and budgetary cycles can influence the timing of customer spending for our services.Typically, in the first quarter of each calendar year there is less demand for our services due to reduced construction and
49

Table of Contents
business activities related to weather while we experience improvement in our second and third quarters of each calendar year asweather conditions and other business activity improves.
Critical Accounting Policies
Our discussion and analysis of our financial condition and results of operations are based upon our consolidated financialstatements, which have been prepared in accordance with GAAP. The preparation of these financial statements require us to makeestimates and judgments that affect the reported amounts of assets, liabilities, revenues and expenses and related disclosure ofcontingent assets and liabilities. On an ongoing basis, we evaluate our estimates included in our critical accounting policiesdiscussed below and those accounting policies and use of estimates discussed in Notes 2 and 3 to the Consolidated FinancialStatements located in “Part II, Item 8. Financial Statements and Supplementary Data” of this Annual Report on Form 10‑K. Webase our estimates on historical experience and on various assumptions and other factors we believe to be reasonable, the resultsof which form the basis for making judgments about the carrying values of assets and liabilities that are not readily apparent fromother sources. We make adjustments to judgments and estimates based on current facts and circumstances on an ongoing basis.Historically, actual results have not deviated significantly from those determined using the estimates described below or inNotes 2 and 3 to the Consolidated Financial Statements located in “Part II, Item 8. Financial Statements and Supplementary Data”to this Annual Report on Form 10‑K. However, actual amounts could differ materially from those estimated at the time theconsolidated financial statements are prepared.
We believe the following critical accounting policies are important to understand our financial condition and results of operationsand require management’s most difficult, subjective or complex judgments, often as a result of the need to estimate the effect ofmatters that are inherently uncertain.
Revenue Recognition
Revenues are recognized when control of the promised services is transferred to our customers, in an amount that reflects theconsideration we expect to be entitled to in exchange for those services. We recognize revenue from three primary sources: 1) waste treatment, recycling and disposal services, 2) field and industrialwaste management services, and 3) waste transportation services.
Our waste treatment and disposal customers are legally obligated to properly treat and dispose of their waste in accordance withlocal, state, and federal laws and regulations. As our customers do not possess the resources to properly treat and dispose of theirwaste independently, they contract with the Company to perform the services. Waste treatment, recycling, and disposal revenueresults primarily from fixed fees charged to customers for treatment and/or disposal or recycling of specified wastes. Wastetreatment, recycling, and disposal revenue is generally charged on a per-ton or per-yard basis at contracted prices and isrecognized over time as the services are performed. Our treatment and disposal services are generally performed as the waste isreceived and considered complete upon final disposal.
Field and industrial waste management services revenue results primarily from specialty onsite services such as high-pressurecleaning, tank cleaning, decontamination, remediation, transportation, spill cleanup and emergency response at refineries,chemical plants, steel and automotive plants, and other government, commercial and industrial facilities. We also providehazardous waste packaging and collection services and total waste management solutions at customer sites and through our 10-day transfer facilities. These services are provided based on purchase orders or agreements with the customer and include pricesbased upon daily, hourly or job rates for equipment, materials and personnel. Generally, the pricing in these types of contracts isfixed, but the quantity of services to be provided during the contract term is variable and revenues are recognized over the term ofthe agreements or as services are performed. As we have a right to consideration from our customers in an amount thatcorresponds directly with the value to the customer of the Company’s performance completed to date, we have applied thepractical expedient to recognize revenue in the amount to which we have the right to invoice. Revenue is recognized on contractswith retainage when services have been performed and it is probable that a significant reversal in the amount of cumulativerevenue recognized on the contracts will not occur .
Transportation and logistics revenue results from delivering customer waste to a disposal facility for treatment and/or disposal orrecycling. Transportation services are generally not provided on a stand-alone basis and instead are bundled
50

Table of Contents
with other Company services. However, in some instances we provide transportation and logistics services for shipment of wastefrom cleanup sites to disposal facilities operated by other companies. For such arrangements, we allocate revenue to eachperformance obligation based on its relative standalone selling price. We generally determine standalone selling prices based onthe prices charged to customer or using expected cost plus margin. Transportation revenue is recognized over time as the waste istransported.
Taxes and fees collected from customers concurrent with revenue-producing transactions to be remitted to governmentalauthorities are excluded from revenue.
Our Richland, Washington disposal facility is regulated by the Washington Utilities and Transportation Commission (“ WUTC”),which approves our rates for disposal of low-level radioactive waste (“LLRW”). Annual revenue levels are established based on arate agreement with the WUTC at amounts sufficient to cover our costs of operation, including facility maintenance, equipmentreplacement and related costs, and provide us with a reasonable profit. Per-unit rates charged to LLRW customers during the yearare based on our evaluation of disposal volume and radioactivity projections submitted to us by waste generators. Our proposedrates are then reviewed and approved by the WUTC. If annual revenue exceeds the approved levels set by the WUTC, we arerequired to refund excess collections to facility users on a pro-rata basis. Refundable excess collections, if any,are recorded inAccrued liabilities in the consolidated balance sheets. The current rate agreement with the WUTC was extended in 2013 and iseffective until January 1, 2020.
Disposal Facility Accounting
We amortize landfill and disposal assets and certain related permits over their estimated useful lives. The units‑of‑consumptionmethod is used to amortize landfill cell construction and development costs and asset retirement costs. Under theunits‑of‑consumption method, we include costs incurred to date as well as future estimated construction costs in the amortizationbase of the landfill assets. Additionally, where appropriate, as discussed below, we also include probable expansion airspace thathas yet to be permitted in the calculation of the total remaining useful life of the landfill asset. If we determine that expansioncapacity should no longer be considered in calculating the total remaining useful life of a landfill asset, we may be required torecognize an asset impairment or incur significantly higher amortization expense over the remaining estimated useful life of thelandfill asset. If at any time we make the decision to abandon the expansion effort, the capitalized costs related to the expansioneffort would be expensed in the period of abandonment.
Our landfill assets and liabilities fall into the following two categories, each of which require accounting judgments andestimates:
· Landfill assets comprised of capitalized landfill development costs.
· Disposal facility retirement obligations relating to our capping, closure and post‑closure liabilities that result incorresponding retirement assets.
Landfill Assets
Landfill assets include the costs of landfill site acquisition, permits and cell design and construction incurred to date. Landfillcells represent individual disposal areas within the overall treatment and disposal site and may be subject to specific permitrequirements in addition to the general permit requirements associated with the overall site.
To develop, construct and operate a landfill cell, we must obtain permits from various regulatory agencies at the local, state andfederal levels. The permitting process requires an initial site study to determine whether the location is feasible for landfilloperations. The initial studies are reviewed by our environmental management group and then submitted to the regulatoryagencies for approval. During the development stage we capitalize certain costs that we incur after site selection but before thereceipt of all required permits if we believe that it is probable that the landfill cell will be permitted.
Upon receipt of regulatory approval, technical landfill cell designs are prepared. The technical designs, which include the detailedspecifications to develop and construct all components of the landfill cell including the types and quantities of materials that willbe required, are reviewed by our environmental management group. The technical designs are submitted
51

Table of Contents
to the regulatory agencies for approval. Upon approval of the technical designs, the regulatory agencies issue permits to developand operate the landfill cell.
The types of costs that are detailed in the technical design specifications generally include excavation, natural and synthetic liners,construction of leachate collection systems, installation of groundwater monitoring wells, construction of leachate managementfacilities and other costs associated with the development of the site. We review the adequacy of our cost estimates at leastannually. These development costs, together with any costs incurred to acquire, design and permit the landfill cell, includingpersonnel costs of employees directly associated with the landfill cell design, are recorded to the landfill asset on the balancesheet as incurred.
To match the expense related to the landfill asset with the revenue generated by the landfill operations, we amortize the landfillasset on a units‑of‑consumption basis over its operating life, typically on a cubic yard or cubic meter of disposal space consumed.The landfill asset is fully amortized at the end of a landfill cell’s operating life. The per‑unit amortization rate is calculated bydividing the sum of the landfill asset net book value plus estimated future development costs (as described above) for the landfillcell, by the landfill cell’s estimated remaining disposal capacity. Amortization rates are influenced by the original cost basis of thelandfill cell, including acquisition costs, which in turn is determined by geographic location and market values. We have securedsignificant landfill assets through business acquisitions and valued them at the time of acquisition based on fair value.
Included in the technical designs are factors that determine the ultimate disposal capacity of the landfill cell. These factors includethe area over which the landfill cell will be developed, such as the depth of excavation, the height of the landfill cell elevation andthe angle of the side‑slope construction. Landfill cell capacity used in the determination of amortization rates of our landfill assetsincludes both permitted and unpermitted disposal capacity. Unpermitted disposal capacity is included when management believesachieving final regulatory approval is probable based on our analysis of site conditions and interactions with applicable regulatoryagencies.
We review the estimates of future development costs and remaining disposal capacity for each landfill cell at least annually.These costs and disposal capacity estimates are developed using input from independent engineers and internal technical andaccounting managers and are reviewed and approved by our environmental management group. Any changes in future estimatedcosts or estimated disposal capacity are reflected prospectively in the landfill cell amortization rates.
We assess our long‑lived landfill assets for impairment when an event occurs or circumstances change that indicate the carryingamount may not be recoverable. Examples of events or circumstances that may indicate impairment of any of our landfill assetsinclude, but are not limited to, the following:
· Changes in legislative or regulatory requirements impacting the landfill site permitting process making it more difficult andcostly to obtain and/or maintain a landfill permit;
· Actions by neighboring parties, private citizen groups or others to oppose our efforts to obtain, maintain or expand permits,which could result in denial, revocation or suspension of a permit and adversely impact the economic viability of the landfill.As a result of opposition to our obtaining a permit, improved technical information as a project progresses, or changes in theanticipated economics associated with a project, we may decide to reduce the scope of, or abandon, a project, which couldresult in an asset impairment; and
· Unexpected significant increases in estimated costs, significant reductions in prices we are able to charge our customers orreductions in disposal capacity that affect the ongoing economic viability of the landfill.
Disposal Facility Retirement Obligations
Disposal facility retirement obligations include the cost to close, maintain and monitor landfill cells and support facilities. Asindividual landfill cells reach capacity, we must cap and close the cells in accordance with the landfill cell permits. These cappingand closure requirements are detailed in the technical design of each landfill cell and included as part of our approved regulatorypermit. After the entire landfill cell has reached capacity and is certified closed, we must continue to maintain and monitor thelandfill cell for a post‑closure period, which generally extends for 30 years. Costs associated
52

Table of Contents
with closure and post‑closure requirements generally include maintenance of the landfill cell and groundwater systems, and otheractivities that occur after the landfill cell has ceased accepting waste. Costs associated with post‑closure monitoring generallyinclude groundwater sampling, analysis and statistical reports, transportation and disposal of landfill leachate, and erosion controlcosts related to the final cap.
We have a legally enforceable obligation to operate our landfill cells in accordance with the specific requirements, regulationsand criteria set forth in our permits. This includes executing the approved closure/post‑closure plan and closing/capping the entirelandfill cell in accordance with the established requirements, design and criteria contained in the permit. As a result, we record thefair value of our disposal facility retirement obligations as a liability in the period in which the regulatory obligation to retire aspecific asset is triggered. For our individual landfill cells, the required closure and post‑closure obligations under the terms ofour permits and our intended operation of the landfill cell are triggered and recorded when the cell is placed into service andwaste is initially disposed in the landfill cell. The fair value is based on the total estimated costs to close the landfill cell andperform post‑closure activities once the landfill cell has reached capacity and is no longer accepting waste, discounted using acredit‑adjusted risk‑free rate. Retirement obligations are increased each year to reflect the passage of time by accreting thebalance at the weighted average credit‑adjusted risk‑free rate that is used to calculate the recorded liability, with accretioncharged to direct operating costs. Actual cash expenditures to perform closure and post‑closure activities reduce the retirementobligation liabilities as incurred. After initial measurement, asset retirement obligations are adjusted at the end of each period toreflect changes, if any, in the estimated future cash flows underlying the obligation. Disposal facility retirement assets arecapitalized as the related disposal facility retirement obligations are incurred. Disposal facility retirement assets are amortized ona units‑of‑consumption basis as the disposal capacity is consumed.
Our disposal facility retirement obligations represent the present value of current cost estimates to close, maintain and monitorlandfills and support facilities as described above. Cost estimates are developed using input from independent engineers, internaltechnical and accounting managers, as well as our environmental management group’s interpretation of current legal andregulatory requirements, and are intended to approximate fair value. We estimate the timing of future payments based onexpected annual disposal airspace consumption and then inflate the current cost estimate by an inflation rate, estimated atDecember 31, 2018 to be 2.6%. Inflated current costs are then discounted using our credit‑adjusted risk‑free interest rate, whichapproximates our incremental borrowing rate in effect at the time the obligation is established or when there are upward revisionsto our estimated closure and post‑closure costs. Our weighted‑average credit‑adjusted risk‑free interest rate at December 31,2018 was approximately 6.0%. Final closure and post‑closure obligations are currently estimated as being paid through the year2105. During 2018 we updated several assumptions, including estimated costs and timing of closing our disposal cells. Theseupdates resulted in a net decrease to our post‑closure obligations of $523,000.
We update our estimates of future capping, closure and post‑closure costs and of future disposal capacity for each landfill cell onan annual basis. Changes in inflation rates or the estimated costs, timing or extent of the required future activities to close,maintain and monitor landfills and facilities result in both: (i) a current adjustment to the recorded liability and related asset and(ii) a change in accretion and amortization rates which are applied prospectively over the remaining life of the asset. Ahypothetical 1% increase in the inflation rate would increase our closure/post‑closure obligation by $15.2 million. A hypothetical10% increase in our cost estimates would increase our closure/post‑closure obligation by $7.8 million.
Goodwill and Intangible Assets
Goodwill
As of December 31, 2018, the Company’s goodwill balance was $207.2 million. We assess goodwill for impairment during thefourth quarter as of October 1 of each year, and also if an event occurs or circumstances change that would more likely than notreduce the fair value of a reporting unit below its carrying amount. The assessment consists of comparing the fair value of thereporting unit to the carrying value of the net assets assigned to the reporting unit, including goodwill. Some of the factors thatcould indicate impairment include a significant adverse change in legal factors or in the business climate, an adverse action orassessment by a regulator, or failure to generate sufficient cash flows at the reporting unit. For example, field and industrialservices represents an emerging business for the Company and has been the focus of a shift
53

Table of Contents
in strategy since the acquisition of EQ. Failure to execute on planned growth initiatives within this business could lead to theimpairment of goodwill and intangible assets in future periods.
We determine our reporting units by identifying the components of each operating segment, and then aggregate componentshaving similar economic characteristics based on quantitative and/or qualitative factors. At December 31, 2018, we had 15reporting units, 8 of which had allocated goodwill.
Fair values are generally determined by an income approach, discounting projected future cash flows based on our expectations ofthe current and future operating environment, using a market approach, applying a multiple of earnings based on guideline forpublicly traded companies, or a combination thereof. Estimating future cash flows requires significant judgment about factorssuch as general economic conditions and projected growth rates, and our estimates often vary from the cash flows eventuallyrealized. The rates used to discount projected future cash flows reflect a weighted average cost of capital based on our industry,capital structure and risk premiums including those reflected in the current market capitalization. In the event the fair value of areporting unit exceeds its carrying amount, goodwill of the reporting unit is considered not impaired. If the carrying amount of areporting unit exceeds its fair value, goodwill of the reporting unit is considered impaired, and an impairment charge would berecognized during the period in which the determination has been made for the amount by which the carrying amount exceeds thereporting unit’s fair value; however, the loss recognized should not exceed the total amount of goodwill allocated to that reportingunit.
In connection with our annual budgeting process commencing in the third quarter of 2018 and review of the projected future cashflows of our reporting units used in our annual assessment of goodwill, it was determined that the projected future cash flows ofour Mobile Recycling reporting unit (described below), which is part of our Environmental Services segment, indicated that thefair value of the reporting unit may be below its carrying amount. Accordingly, we performed an interim assessment of thereporting unit’s goodwill as of September 30, 2018. Based on the results of that assessment, goodwill was deemed impaired andwe recognized an impairment charge of $1.4 million in the third quarter of 2018, representing the reporting unit’s entire goodwillbalance. Our Mobile Recycling reporting unit operates a fleet of mobile solvent recycling stills that provide on-site recycling servicesthroughout the Eastern United States. The factors contributing to the $1.4 million goodwill impairment charge recorded in 2018principally related to declining business and cash flows, which negatively impacted the reporting unit’s prospective financialinformation in its discounted cash flow model and the reporting unit's estimated fair value as compared to previous estimates. The result of the annual assessment of goodwill undertaken in the fourth quarter of 2018 indicated that the fair value of each ofour reporting units was in excess of its respective carrying value. The result of the annual assessment of goodwill undertaken in the fourth quarter of 2017 indicated that the fair value of each ofour reporting units was in excess of its respective carrying value, with the exception of the Resource Recovery reporting unit.
Our Resource Recovery reporting unit offers full-service storm water management and propylene glycol (“PG”) deicing fluidrecovery at major airports. Recovered fluids are transported to our recycling facility in Romulus, Michigan where they aredistilled and resold to industrial users. The Resource Recovery reporting unit also generates revenues from brokered PG sales andservices revenues for PG collection at the airports we service. Weak PG commodity prices and reduced PG collection volumes atthe airports we service negatively impacted the reporting unit’s prospective financial information in its discounted cash flowmodel and the reporting unit's estimated fair value. A longer-than-expected recovery in PG commodity pricing and PG collectionvolumes became evident during the fourth quarter of 2017 as management completed its 2018 budgeting cycle and updated thelong-term projections for the reporting unit which, as a result, decreased the reporting unit’s anticipated future cash flows ascompared to those estimated previously.
The estimated fair value of the Resource Recovery reporting unit was determined under an income approach using discountedprojected future cash flows and then compared to the reporting unit’s carrying amount as of October 1, 2017. Based on the resultsof that comparison, the carrying amount of the Resource Recovery reporting unit, including $5.5 million of goodwill, exceededthe estimated fair value of the reporting unit by more than $5.5 million and, as a result, we
54

Table of Contents
recognized a $5.5 million impairment charge, representing the reporting unit’s entire goodwill balance, in the fourth quarter of2017.
Non-amortizing Intangible Assets
We review non-amortizing intangible assets for impairment during the fourth quarter as of October 1 of each year. Fair value isgenerally determined by considering an internally developed discounted projected cash flow analysis. Estimating future cashflows requires significant judgment about factors such as general economic conditions and projected growth rates, and ourestimates often vary from the cash flows eventually realized. If the fair value of an asset is determined to be less than the carryingamount of the intangible asset, an impairment in the amount of the difference is recorded in the period in which the annualassessment occurs.
In connection with the interim goodwill impairment assessment of the Mobile Recycling reporting unit, we also assessed thereporting unit’s non-amortizing intangible permit asset for impairment as of September 30, 2018. Based on the results of thatassessment, the carrying amounts of the non-amortizing intangible permit asset exceeded its estimated fair value and, as a result,we recognized a $1.8 million impairment charge in the third quarter of 2018. The factors and timing contributing to the non-amortizing intangible asset charge were the same as the factors and timing described above with regards to the Mobile Recyclingreporting unit goodwill impairment charge.
The results of the annual assessment of non-amortizing intangible assets undertaken in the fourth quarter of 2018 indicated noimpairment charges were required.
The result of the annual assessment of non-amortizing intangible assets undertaken in the fourth quarter of 2017 indicated noimpairment charges were required, with the exception of the non-amortizing intangible waste collection, recycling and resalepermit associated with our Resource Recovery business.
In performing the annual non-amortizing intangible assets impairment test, the estimated fair value of the Resource Recoverybusiness’ waste collection, recycling and resale permit was determined under an income approach using discounted projectedfuture cash flows associated with the permit and then compared to the $3.7 million carrying amount of the permit as of October 1,2017. Based on the results of that evaluation, the carrying amount of the permit exceeded the estimated fair value of the permitand, as a result, we recognized a $3.4 million impairment charge in the fourth quarter of 2017. The factors and timingcontributing to the non-amortizing permit impairment charge were the same as the factors and timing described above withregards to the Resource Recovery reporting unit goodwill impairment charge.
We also review amortizing tangible and intangible assets for impairment whenever events or changes in circumstances indicatethat the carrying value of an asset may not be recoverable. In order to assess whether a potential impairment exists, the assets’carrying values are compared with their undiscounted expected future cash flows. Estimating future cash flows requiressignificant judgment about factors such as general economic conditions and projected growth rates, and our estimates often varyfrom the cash flows eventually realized. Impairments are measured by comparing the fair value of the asset to its carrying value.Fair value is generally determined by considering: (i) the internally developed discounted projected cash flow analysis; (ii) athird‑party valuation; and/or (iii) information available regarding the current market environment for similar assets. If the fairvalue of an asset is determined to be less than the carrying amount of the asset, an impairment in the amount of the difference isrecorded in the period in which the events or changes in circumstances that indicated the carrying value of the asset may not berecoverable occurred.
Amortizing Tangible and Intangible Assets
In connection with the interim goodwill impairment assessment of the Mobile Recycling reporting unit, we also assessed thereporting unit’s amortizing tangible and intangible assets for impairment as of September 30, 2018. Based on the results of thatassessment, the carrying amounts of the amortizing intangible assets exceeded their estimated fair values and, as a result, werecognized a $454,000 impairment charge in the third quarter of 2018. The factors and timing contributing to the amortizingintangible asset impairment charge were the same as the factors and timing described above with regards to the Mobile Recyclingreporting unit goodwill impairment charge. Otherwise, no events or circumstances occurred
55

Table of Contents
during 2018 that would indicate that our amortizing tangible and intangible assets may by impaired, therefore no otherimpairment tests were performed during 2018.
In the fourth quarter of 2017, we performed an assessment of the Resource Recovery business’ amortizing tangible and intangibleassets, as events indicated their carrying values may not be recoverable. The result of the assessment indicated no impairmentcharges were required. Otherwise, no events or circumstances occurred during 2017 that would indicate that our amortizingtangible and intangible assets were impaired, therefore no other impairment tests were performed during 2017.
Our acquired permits and licenses generally have renewal terms of approximately 5‑10 years. We have a history of renewingthese permits and licenses as demonstrated by the fact that each of the sites’ treatment permits and licenses have been renewedregularly since the facility began operations. We intend to continue to renew our permits and licenses as they come up for renewalfor the foreseeable future. Costs incurred to renew or extend the term of our permits and licenses are recorded in Selling, generaland administrative expenses in our consolidated statements of operations.
Share Based Payments
On May 27, 2015, our stockholders approved the Omnibus Incentive Plan (“Omnibus Plan”), which was approved by our Boardof Directors on April 7, 2015. The Omnibus Plan was developed to provide additional incentives through equity ownership in USEcology and, as a result, encourage employees and directors to contribute to our success. The Omnibus Plan provides, amongother things, the ability for the Company to grant restricted stock, performance stock, options, stock appreciation rights, restrictedstock units, performance stock units (“PSUs”) and other share‑based awards or cash awards to officers, employees, consultantsand non‑employee directors. Subsequent to the approval of the Omnibus Plan in May 2015, we stopped granting equity awardsunder our 2008 Stock Option Incentive Plan and our 2006 Restricted Stock Plan (“Previous Plans”), and the Previous Plans willremain in effect solely for the settlement of awards granted under the Previous Plans. No shares that are reserved but unissuedunder the Previous Plans or that are outstanding under the Previous Plans and reacquired by the Company for any reason will beavailable for issuance under the Omnibus Plan. The Omnibus Plan expires on April 7, 2025 and authorizes 1,500,000 shares ofcommon stock for grant over the life of the Omnibus Plan.
As of December 31, 2018, we have PSUs outstanding under the Omnibus Plan. Each PSU represents the right to receive, on thesettlement date, one share of the Company’s common stock. The total number of PSUs each participant is eligible to earn rangesfrom 0% to 200% of the target number of PSUs granted. The actual number of PSUs that will vest and be settled in shares isdetermined at the end of a three‑year performance period, based on total stockholder return relative to a set of peer companies andthe S&P 600. The fair value of the PSUs is determined using a Monte Carlo simulation. Refer to Note 19 to the ConsolidatedFinancial Statements in “Part II, Item 8. Financial Statements and Supplementary Data” of this Annual Report on Form 10‑K fora summary of the assumptions utilized in the Monte Carlo valuation of awards granted during 2018, 2017 and 2016.
As of December 31, 2018, we have stock option awards outstanding under the 2008 Stock Option Incentive Plan (“2008 StockOption Plan”) and the Omnibus Plan. Subsequent to the approval of the Omnibus Plan in May 2015, we stopped granting equityawards under the 2008 Stock Option Plan. The 2008 Stock Option Plan will remain in effect solely for the settlement of awardspreviously granted.
The determination of fair value of stock option awards on the date of grant using the Black‑Scholes model is affected by our stockprice and subjective assumptions. These assumptions include, but are not limited to, the expected term of stock options andexpected stock price volatility over the term of the awards. Refer to Note 19 to the Consolidated Financial Statements in “Part II,Item 8. Financial Statements and Supplementary Data” of this Annual Report on Form 10‑K for a summary of the assumptionsutilized in 2018, 2017 and 2016. Our stock options have characteristics significantly different from those of traded options, andchanges in the assumptions can materially affect the fair value estimates.
The Company has elected to account for forfeitures as they occur, rather than estimate expected forfeitures.
56

Table of Contents
Income Taxes
Income taxes are accounted for using an asset and liability approach whereby we recognize deferred tax assets and liabilities forthe expected future tax consequences of temporary differences between the financial statement and tax basis of assets andliabilities at the applicable tax rates. The effect of a change in tax rates on deferred tax assets and liabilities is recognized in theperiod that includes the enactment date. Deferred tax assets are evaluated for the likelihood of use in future periods. A valuationallowance is recorded against deferred tax assets if, based on the weight of the available evidence, it is more likely than not thatsome or all of the deferred tax assets will not be realized. The determination of the need for a valuation allowance, if any, requiresour judgment and the use of estimates. If we determine that we would be able to realize our deferred tax assets in the future inexcess of their net recorded amount, we would make an adjustment to the deferred tax asset valuation allowance, which wouldreduce the provision for income taxes. As of December 31, 2018, we have deferred tax assets totaling approximately $20.3million, a valuation allowance of $4.8 million and deferred tax liabilities totaling approximately $78.8 million.
The application of income tax law is inherently complex. Tax laws and regulations are voluminous and at times ambiguous andinterpretations of guidance regarding such tax laws and regulations change over time. This requires us to make many subjectiveassumptions and judgments regarding the timing and amounts of deductible and taxable items and the probability of sustaininguncertain tax positions. A liability for uncertain tax positions is recorded in our financial statements on the basis of a two-stepprocess whereby (1) we determine whether it is more likely than not that the tax position taken will be sustained based on thetechnical merits of the position and (2) for those tax positions that meet the more likely than not recognition threshold, werecognize the largest amount of tax benefit that is greater than 50% likely to be realized upon ultimate settlement with the relatedtax authority. At December 31, 2018, our estimated gross unrecognized tax benefits were $555,000, of which $485,000, ifrecognized, would favorably impact our future earnings. Due to uncertainties in any tax audit outcome, our estimates of theultimate settlement of our unrecognized tax positions may change and the actual tax benefits may differ significantly from theestimates. As facts and circumstances change, we reassess these probabilities and record any changes in the financial statementsas appropriate. Changes in our assumptions and judgments can materially affect our financial position, results of operations andcash flows. We recognize interest assessed by taxing authorities or interest associated with uncertain tax positions as a componentof interest expense. We recognize any penalties assessed by taxing authorities or penalties associated with uncertain tax positionsas a component of selling, general and administrative expenses. On December 22, 2017, the Tax Act was signed into law making significant changes to the Internal Revenue Code. Changesinclude, but are not limited to, a corporate tax rate decrease from 35% to 21% effective for tax years beginning after December31, 2017, the transition of U.S. international taxation from a worldwide tax system to a territorial system, and a one-timetransition tax on the mandatory deemed repatriation of cumulative foreign earnings as of December 31, 2017.
In accordance with the Tax Act, we recorded $23.8 million as additional income tax benefit in the fourth quarter of 2017, theperiod in which the legislation was enacted. The total benefit included $25.2 million related to the re-measurement of certaindeferred tax assets and liabilities partially, offset by $1.4 million of provisional expense related to one-time transition tax on themandatory deemed repatriation of foreign earnings. Additionally, Staff Accounting Bulletin No. 118 (“SAB 118”) was issued toaddress the application of U.S. GAAP in situations when a registrant does not have the necessary information available, prepared,or analyzed (including computations) in reasonable detail to complete the accounting for certain income tax effects of the TaxAct. December 22, 2018 marked the end of the measurement period for purposes of SAB 118. As such, we have completed ouranalysis based on legislative updates relating to the Tax Act currently available, which resulted in a net benefit for measurementperiod adjustments of $193,000 for the year ended December 31, 2018. The total tax provision benefit included a $2.2 millionbenefit related to the re-measurement of certain deferred tax assets and liabilities offset by $2.0 million of expense related toadjustments to the transition tax.
See Note 17 to the Consolidated Financial Statements in “Part II, Item 8. Financial Statements and Supplementary Data” of thisAnnual Report on Form 10‑K for additional information regarding income taxes.
57

Table of Contents
Litigation
We have, in the past, been involved in litigation requiring estimates of timing and loss potential whose timing and ultimatedisposition is controlled by the judicial process.
In the ordinary course of business, we are involved in judicial and administrative proceedings involving federal, state, provincialor local governmental authorities, including regulatory agencies that oversee and enforce compliance with permits. Fines orpenalties may be assessed by our regulators for non‑compliance. Actions may also be brought by individuals or groups inconnection with permitting of planned facilities, modification or alleged violations of existing permits, or alleged damagessuffered from exposure to hazardous substances purportedly released from our operated sites, as well as other litigation. Wemaintain insurance intended to cover property and damage claims asserted as a result of our operations. Periodically, managementreviews and may establish reserves for legal and administrative matters, or other fees expected to be incurred in relation to thesematters.
On November 17, 2018, an explosion occurred at our Grand View, Idaho facility, resulting in one employee fatality and injuriesto other employees. The incident severely damaged the facility’s primary waste-treatment building as well as surrounding wastehandling, waste storage, maintenance and administrative support structures, resulting in the closure of the entire facility thatremained in effect through January 2019. We resumed limited operations at our Grand View, Idaho facility in February 2019. Inaddition to initiating and conducting our own investigation into the incident, we are fully cooperating with IDEQ, the USEPA andOSHA to support their comprehensive and independent investigations of the incident. As we continue to investigate the cause ofthe incident, we are evaluating its impact, but, at this time, we are unable to predict the timing and outcome of the investigation.As such, we cannot presently estimate the potential liability, if any, related to the incident therefore no amounts related to suchclaims have been recorded in our financial statements as of December 31, 2018. We have not been named as a defendant in anyaction relating to the incident. We maintain workers’ compensation insurance, business interruption insurance and liabilityinsurance for personal injury, property and casualty damage. We believe that any potential third-party claims associated with theexplosion, in excess of our deductibles, are expected to be resolved primarily through our insurance policies. Although we carrybusiness interruption insurance, a disruption of our business caused by a casualty event, including the full and partial closure ofour Grand View, Idaho facility, may result in the loss of business, profits or customers during the time of such closure.Accordingly, our insurance policies may not fully compensate us for these losses. Other than as described above, we are not currently a party to any material pending legal proceedings and are not aware of anyother claims that could, individually or in the aggregate, have a materially adverse effect on our financial position, results ofoperations or cash flows.
The decision to accrue costs or write-off assets is based on the pertinent facts and our evaluation of present circumstances.
Off Balance Sheet Arrangements
We do not have any off balance sheet arrangements or interests in variable interest entities that would require consolidation. USEcology operates through wholly‑owned subsidiaries.
ITEM 7A. QUANTITATIVE AND QUALITATIVE DISCLOSURES ABOUT MARKET RISK
Interest Rate Risk
We do not maintain equities, commodities, derivatives, or any other similar instruments for trading purposes. We have minimalinterest rate risk on investments or other assets due to our preservation of capital approach to investments. At December 31, 2018,$4.9 million of restricted cash was invested in fixed-income U.S. Treasury and U.S. government agency securities and moneymarket accounts. We are exposed to changes in interest rates as a result of our borrowings under the 2017 Credit Agreement. Under the 2017 CreditAgreement, Revolving Credit Facility borrowings incur interest at a base rate (as defined in the 2017 Credit Agreement) orLIBOR, at the Company’s option, plus an applicable margin which is determined according to a pricing
58

Table of Contents
grid under which the interest rate decreases or increases based on our ratio of funded debt to consolidated earnings before interest,taxes, depreciation and amortization (as defined in the 2017 Credit Agreement). On October 29, 2014, the Company entered intoan interest rate swap agreement with the intention of hedging the Company’s interest rate exposure on a portion of the Company’soutstanding LIBOR-based variable rate debt. Under the terms of the swap, the Company pays interest at the fixed effective rate of2.17% and receives interest at the variable one-month LIBOR rate on an initial notional amount of $250.0 million. As of December 31, 2018, there were $364.0 million of revolving loans outstanding under the 2017 Credit Agreement. If interestrates were to rise and outstanding balances remain unchanged, we would be subject to higher interest payments on ouroutstanding debt. Subsequent to the effective date of the interest rate swap on December 31, 2014, we are subject to higherinterest payments on only the unhedged borrowings under the 2017 Credit Agreement. Based on the outstanding indebtedness of $364.0 million under the 2017 Credit Agreement at December 31, 2018 and the impactof our interest rate hedge, if market rates used to calculate interest expense were to average 1% higher in the next twelve months,our interest expense would increase by approximately $2.0 million for the corresponding period. Foreign Currency Risk
We are subject to currency exposures and volatility because of currency fluctuations. The majority of our transactions are in USD;however, our Canadian subsidiaries conduct business in both Canada and the United States. In addition, contracts for services thatour Canadian subsidiaries provide to U.S. customers are generally denominated in USD. During 2018, our Canadian subsidiariestransacted approximately 72% of their revenue in USD and at any time have cash on deposit in USD and outstanding USD tradereceivables and payables related to these transactions. These USD cash, receivable and payable accounts are subject to non‑cashforeign currency translation gains or losses. Exchange rate movements also affect the translation of Canadian generated profitsand losses into USD.
We established intercompany loans between our Canadian subsidiaries and our parent company, US Ecology, as part of a tax andtreasury management strategy allowing for repayment of third‑party bank debt. These intercompany loans are payable using CADand are subject to mark‑to‑market adjustments with movements in the CAD. At December 31, 2018, we had $20.3 million ofintercompany loans outstanding between our Canadian subsidiaries and US Ecology. During 2018, the CAD weakened ascompared to the USD resulting in a $1.9 million non‑cash foreign currency translation loss being recognized in the Company’sconsolidated statements of operations related to the intercompany loans. Based on intercompany balances as of December 31,2018, a $0.01 CAD increase or decrease in currency rate compared to the USD at December 31, 2018 would have generated again or loss of approximately $203,000 for the year ended December 31, 2018.
We had a total pre‑tax foreign currency gain of $55,000 for the year ended December 31, 2018. We currently have no foreignexchange contracts, option contracts or other foreign currency hedging arrangements. Management evaluates our risk position onan ongoing basis to determine whether foreign exchange hedging strategies should be employed.
59

Table of Contents
ITEM 8. FINANCIAL STATEMENTS AND SUPPLEMENTARY DATA
Page Number
Report of Independent Registered Public Accounting Firm 61Consolidated Balance Sheets as of December 31, 2018 and 2017 63Consolidated Statements of Operations for the years ended December 31, 2018, 2017 and 2016 64Consolidated Statements of Comprehensive Income for the years ended December 31, 2018, 2017 and 2016 65Consolidated Statements of Cash Flows for the years ended December 31, 2018, 2017 and 2016 66Consolidated Statements of Stockholders’ Equity for the years ended December 31, 2018, 2017 and 2016 67Notes to Consolidated Financial Statements 68
60
Table of Contents
REPORT OF INDEPENDENT REGISTERED PUBLIC ACCOUNTING FIRM
To the Board of Directors and Stockholders of US Ecology, Inc.
Opinions on the Financial Statements and Internal Control over Financial Reporting
We have audited the accompanying consolidated balance sheets of US Ecology, Inc. and subsidiaries (the "Company") as ofDecember 31, 2018 and 2017, the related consolidated statements of operations, comprehensive income, stockholders’ equity, andcash flows , for each of the three years in the period ended December 31, 2018, and the related notes (collectively referred to asthe “financial statements”). We also have audited the Company’s internal control over financial reporting as of December 31,2018, based on criteria established in Internal Control — Integrated Framework (2013) issued by the Committee of SponsoringOrganizations of the Treadway Commission (COSO).
In our opinion, the financial statements referred to above present fairly, in all material respects, the financial position of theCompany as of December 31, 2018 and 2017, and the results of its operations and its cash flows for each of the three years in theperiod ended December 31, 2018, in conformity with accounting principles generally accepted in the United States of America.Also, in our opinion, the Company maintained, in all material respects, effective internal control over financial reporting as ofDecember 31, 2018, based on criteria established in Internal Control — Integrated Framework (2013) issued by COSO.
As described in Management’s Annual Report on Internal Controls over Financial Reporting, management excluded from itsassessment the internal control over financial reporting at ES&H Dallas, LLC and Ecoserv Industrial Disposal, LLC, which wereacquired on August 31, 2018 and November 14, 2018, respectively; and whose combined financial statements constitute 3% oftotal assets (excluding goodwill and intangible assets), 2% of revenues, and 3% of net income of the consolidated financialstatement amounts as of and for the year ended December 31, 2018. Accordingly, our audit did not include the internal controlover financial reporting at ES&H Dallas, LLC and Ecoserv Industrial Disposal, LLC.
Basis for Opinions
The Company’s management is responsible for these financial statements, for maintaining effective internal control over financialreporting, and for its assessment of the effectiveness of internal control over financial reporting, included in the accompanyingManagement’s Annual Report on Internal Controls over Financial Reporting. Our responsibility is to express an opinion on thesefinancial statements and an opinion on the Company’s internal control over financial reporting based on our audits. We are apublic accounting firm registered with the Public Company Accounting Oversight Board (United States) (PCAOB) and arerequired to be independent with respect to the Company in accordance with the U.S. federal securities laws and the applicablerules and regulations of the Securities and Exchange Commission and the PCAOB.
We conducted our audits in accordance with the standards of the PCAOB. Those standards require that we plan and perform theaudits to obtain reasonable assurance about whether the financial statements are free of material misstatement, whether due toerror or fraud, and whether effective internal control over financial reporting was maintained in all material respects.
Our audits of the financial statements included performing procedures to assess the risks of material misstatement of the financialstatements, whether due to error or fraud, and performing procedures to respond to those risks. Such procedures includedexamining, on a test basis, evidence regarding the amounts and disclosures in the financial statements. Our audits also includedevaluating the accounting principles used and significant estimates made by management, as well as evaluating the overallpresentation of the financial statements. Our audit of internal control over financial reporting included obtaining an understandingof internal control over financial reporting, assessing the risk that a material weakness exists, and testing and evaluating thedesign and operating effectiveness of internal control based on the assessed risk. Our audits also included performing such otherprocedures as we considered necessary in the circumstances. We believe that our audits provide a reasonable basis for ouropinions.
61

Table of Contents
Definition and Limitations of Internal Control over Financial Reporting
A company’s internal control over financial reporting is a process designed to provide reasonable assurance regarding thereliability of financial reporting and the preparation of financial statements for external purposes in accordance with generallyaccepted accounting principles. A company’s internal control over financial reporting includes those policies and procedures that(1) pertain to the maintenance of records that, in reasonable detail, accurately and fairly reflect the transactions and dispositions ofthe assets of the company; (2) provide reasonable assurance that transactions are recorded as necessary to permit preparation offinancial statements in accordance with generally accepted accounting principles, and that receipts and expenditures of thecompany are being made only in accordance with authorizations of management and directors of the company; and (3) providereasonable assurance regarding prevention or timely detection of unauthorized acquisition, use, or disposition of the company’sassets that could have a material effect on the financial statements.
Because of its inherent limitations, internal control over financial reporting may not prevent or detect misstatements. Also,projections of any evaluation of effectiveness to future periods are subject to the risk that controls may become inadequatebecause of changes in conditions, or that the degree of compliance with the policies or procedures may deteriorate.
/s/ DELOITTE & TOUCHE LLPBoise, Idaho February 28, 2019 We have served as the Company’s auditor since 2009.
62

Table of Contents
US ECOLOGY, INC.
CONSOLIDATED BALANCE SHEETS
(In thousands, except per share amounts)
As of December 31, 2018 2017Assets Current Assets:
Cash and cash equivalents $ 31,969 $ 27,042Receivables, net 144,690 110,777Prepaid expenses and other current assets 10,938 9,138Income taxes receivable 7,071 —Total current assets 194,668 146,957
Property and equipment, net 258,443 234,432Restricted cash and investments 4,941 5,802Intangible assets, net 279,666 222,812Goodwill 207,177 189,373Other assets 3,003 2,700
Total assets $ 947,898 $ 802,076
Liabilities and Stockholders’ Equity Current Liabilities:
Accounts payable $ 17,754 $ 14,868Deferred revenue 10,451 8,532Accrued liabilities 35,524 22,888Accrued salaries and benefits 16,732 14,242Income taxes payable 505 2,970Current portion of closure and post-closure obligations 2,266 2,330Total current liabilities 83,232 65,830
Long-term closure and post-closure obligations 76,097 73,758Long-term debt 364,000 277,000Other long-term liabilities 2,146 3,828Deferred income taxes, net 63,206 57,583
Total liabilities 588,681 477,999
Commitments and contingencies Stockholders’ Equity:
Common stock $0.01 par value, 50,000 authorized; 22,040 and 21,849 shares issued,respectively 220 218Additional paid-in capital 183,834 177,498Retained earnings 189,324 155,533Treasury stock, at cost, 8 and 3 shares, respectively (370) (68)Accumulated other comprehensive loss (13,791) (9,104)Total stockholders’ equity 359,217 324,077
Total liabilities and stockholders’ equity $ 947,898 $ 802,076
The accompanying notes are an integral part of these consolidated financial statements.
63
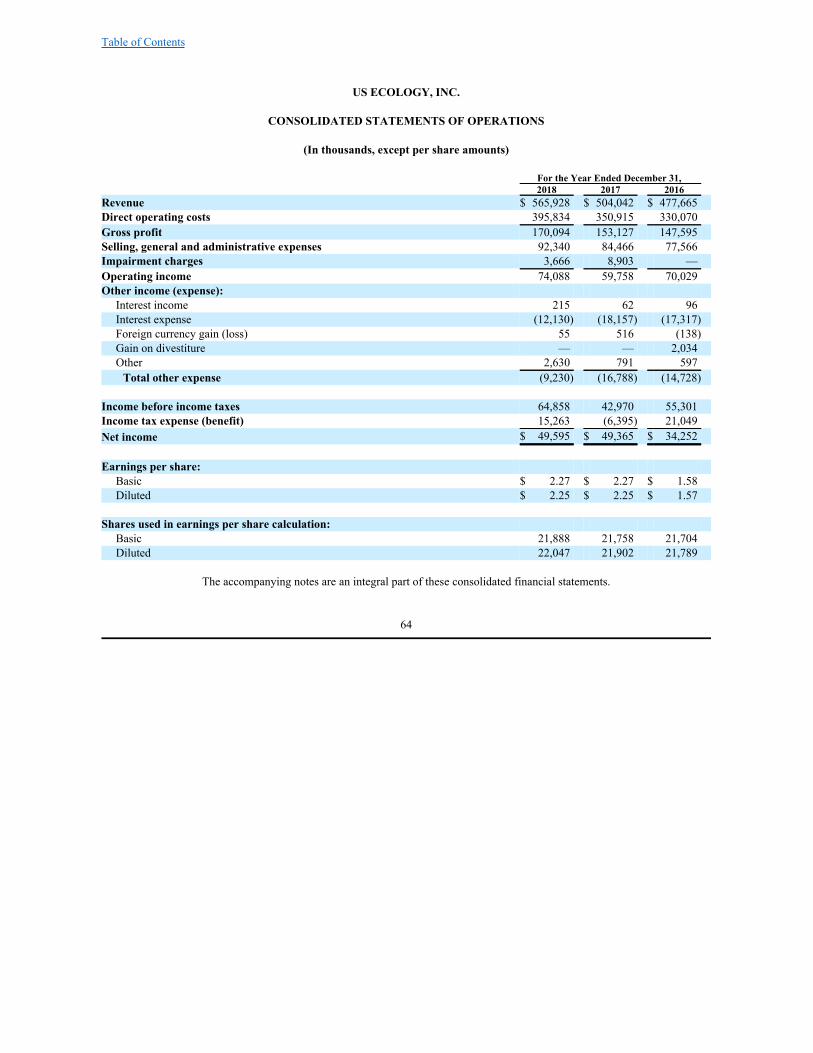
Table of Contents
US ECOLOGY, INC.
CONSOLIDATED STATEMENTS OF OPERATIONS
(In thousands, except per share amounts)
For the Year Ended December 31, 2018 2017 2016 Revenue $ 565,928 $ 504,042 $ 477,665 Direct operating costs 395,834 350,915 330,070 Gross profit 170,094 153,127 147,595 Selling, general and administrative expenses 92,340 84,466 77,566 Impairment charges 3,666 8,903 — Operating income 74,088 59,758 70,029 Other income (expense):
Interest income 215 62 96 Interest expense (12,130) (18,157) (17,317) Foreign currency gain (loss) 55 516 (138) Gain on divestiture — — 2,034 Other 2,630 791 597 Total other expense (9,230) (16,788) (14,728)
Income before income taxes 64,858 42,970 55,301 Income tax expense (benefit) 15,263 (6,395) 21,049 Net income $ 49,595 $ 49,365 $ 34,252 Earnings per share:
Basic $ 2.27 $ 2.27 $ 1.58 Diluted $ 2.25 $ 2.25 $ 1.57
Shares used in earnings per share calculation: Basic 21,888 21,758 21,704 Diluted 22,047 21,902 21,789
The accompanying notes are an integral part of these consolidated financial statements.
64

Table of Contents
US ECOLOGY, INC.
CONSOLIDATED STATEMENTS OF COMPREHENSIVE INCOME
(In thousands)
For the Year Ended December 31, 2018 2017 2016 Net income $ 49,595 $ 49,365 $ 34,252
Other comprehensive income (loss): Foreign currency translation gain (loss) (6,094) 4,046 1,379 Net changes in interest rate hedge, net of taxes of $375, $985, and $517, respectively 1,407 1,575 962
Comprehensive income, net of tax $ 44,908 $ 54,986 $ 36,593
The accompanying notes are an integral part of these consolidated financial statements.
65
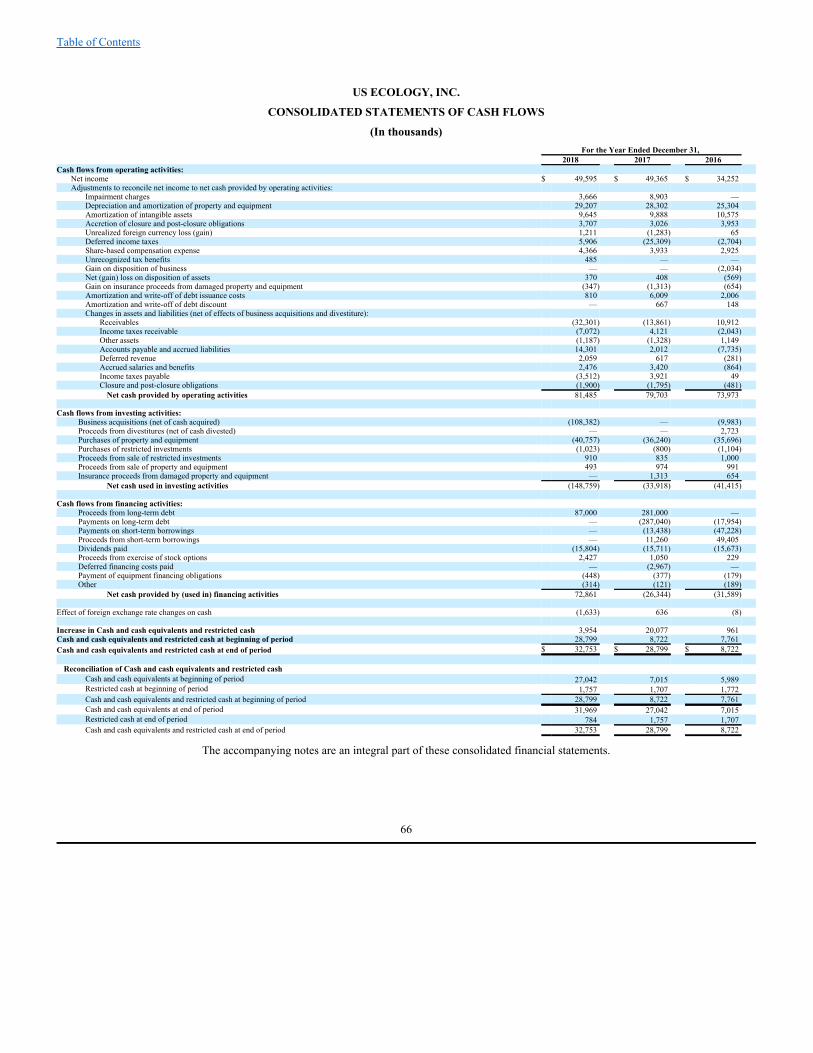
Table of Contents
US ECOLOGY, INC.
CONSOLIDATED STATEMENTS OF CASH FLOWS
(In thousands)
For the Year Ended December 31, 2018 2017 2016 Cash flows from operating activities:
Net income $ 49,595 $ 49,365 $ 34,252 Adjustments to reconcile net income to net cash provided by operating activities:
Impairment charges 3,666 8,903 — Depreciation and amortization of property and equipment 29,207 28,302 25,304 Amortization of intangible assets 9,645 9,888 10,575 Accretion of closure and post-closure obligations 3,707 3,026 3,953 Unrealized foreign currency loss (gain) 1,211 (1,283) 65 Deferred income taxes 5,906 (25,309) (2,704) Share-based compensation expense 4,366 3,933 2,925 Unrecognized tax benefits 485 — — Gain on disposition of business — — (2,034) Net (gain) loss on disposition of assets 370 408 (569) Gain on insurance proceeds from damaged property and equipment (347) (1,313) (654) Amortization and write-off of debt issuance costs 810 6,009 2,006 Amortization and write-off of debt discount — 667 148 Changes in assets and liabilities (net of effects of business acquisitions and divestiture):
Receivables (32,301) (13,861) 10,912 Income taxes receivable (7,072) 4,121 (2,043) Other assets (1,187) (1,328) 1,149 Accounts payable and accrued liabilities 14,301 2,012 (7,735) Deferred revenue 2,059 617 (281) Accrued salaries and benefits 2,476 3,420 (864) Income taxes payable (3,512) 3,921 49 Closure and post-closure obligations (1,900) (1,795) (481) Net cash provided by operating activities 81,485 79,703 73,973
Cash flows from investing activities: Business acquisitions (net of cash acquired) (108,382) — (9,983) Proceeds from divestitures (net of cash divested) — — 2,723 Purchases of property and equipment (40,757) (36,240) (35,696) Purchases of restricted investments (1,023) (800) (1,104) Proceeds from sale of restricted investments 910 835 1,000 Proceeds from sale of property and equipment 493 974 991 Insurance proceeds from damaged property and equipment — 1,313 654
Net cash used in investing activities (148,759) (33,918) (41,415)
Cash flows from financing activities: Proceeds from long-term debt 87,000 281,000 — Payments on long-term debt — (287,040) (17,954) Payments on short-term borrowings — (13,438) (47,228) Proceeds from short-term borrowings — 11,260 49,405 Dividends paid (15,804) (15,711) (15,673) Proceeds from exercise of stock options 2,427 1,050 229 Deferred financing costs paid — (2,967) — Payment of equipment financing obligations (448) (377) (179) Other (314) (121) (189)
Net cash provided by (used in) financing activities 72,861 (26,344) (31,589)
Effect of foreign exchange rate changes on cash (1,633) 636 (8)
Increase in Cash and cash equivalents and restricted cash 3,954 20,077 961 Cash and cash equivalents and restricted cash at beginning of period 28,799 8,722 7,761 Cash and cash equivalents and restricted cash at end of period $ 32,753 $ 28,799 $ 8,722 Reconciliation of Cash and cash equivalents and restricted cash
Cash and cash equivalents at beginning of period 27,042 7,015 5,989 Restricted cash at beginning of period 1,757 1,707 1,772 Cash and cash equivalents and restricted cash at beginning of period 28,799 8,722 7,761 Cash and cash equivalents at end of period 31,969 27,042 7,015 Restricted cash at end of period 784 1,757 1,707 Cash and cash equivalents and restricted cash at end of period 32,753 28,799 8,722
The accompanying notes are an integral part of these consolidated financial statements.
66

Table of Contents
US ECOLOGY, INC.
CONSOLIDATED STATEMENTS OF STOCKHOLDERS’ EQUITY
(In thousands, except share amounts)
Accumulated Common Additional Other Shares Common Paid-In Retained Treasury Comprehensive Issued Stock Capital Earnings Stock Income (Loss) TotalBalance at December 31, 2015 21,743,972 217 169,873 103,300 (189) (17,066) $ 256,135Net income — — — 34,252 — — 34,252Other comprehensive income — — — — — 2,341 2,341Dividend paid — — — (15,673) — — (15,673)Tax benefit of equity based awards — — 85 — — — 85Share-based compensation — — 2,925 — — — 2,925Stock option exercises 11,856 — 229 — — — 229Repurchase of common stock: 6,589 shares — — — — (271) — (271)Issuance of restricted common stock 23,888 1 — — — — 1Issuance of restricted common stock from treasury shares — — (408) — 408 — —Balance at December 31, 2016 21,779,716 218 172,704 121,879 (52) (14,725) 280,024Net income — — — 49,365 — — 49,365Other comprehensive income — — — — — 5,621 5,621Dividend paid — — — (15,711) — — (15,711)Share-based compensation — — 3,933 — — — 3,933Stock option exercises 43,175 — 1,047 — — — 1,047Repurchase of common stock: 2,502 shares — — — — (121) — (121)Issuance of restricted common stock 26,274 — (81) — — — (81)Issuance of restricted common stock from treasury shares — — (105) — 105 — —Balance at December 31, 2017 21,849,165 218 177,498 155,533 (68) (9,104) 324,077Net income — — — 49,595 — — 49,595Other comprehensive loss — — — — — (4,687) (4,687)Dividend paid — — — (15,804) — — (15,804)Share-based compensation — — 4,366 — — — 4,366Stock option exercises 143,220 1 2,428 — — — 2,429Repurchase of common stock: 5,564 shares — — — — (313) — (313)Issuance of restricted common stock 44,949 1 (278) — — — (277)Issuance of performance common stock 2,810 — (169) — — — (169)Issuance of restricted common stock from treasury shares — — (11) — 11 — —Balance at December 31, 2018 22,040,144 $ 220 $ 183,834 $ 189,324 $ (370) $ (13,791) $ 359,217
The accompanying notes are an integral part of these financial statements.
67

Table of Contents
US ECOLOGY, INC.
NOTES TO CONSOLIDATED FINANCIAL STATEMENTS
NOTE 1. DESCRIPTION OF BUSINESS
US Ecology, Inc. was most recently incorporated as a Delaware corporation in May 1987 as American Ecology Corporation. OnFebruary 22, 2010 the Company changed its name from American Ecology Corporation to US Ecology, Inc. US Ecology, Inc.,through its subsidiaries, is a leading North American provider of environmental services to commercial and government entities.The Company addresses the complex waste management needs of its customers, offering treatment, disposal and recycling ofhazardous and radioactive waste, as well as a wide range of complementary field and industrial services. US Ecology, Inc. hasbeen protecting the environment since 1952, with operations in the United States, Canada and Mexico. Throughout these financialstatements words such as “we,” “us,” “our,” “US Ecology” and the “Company” refer to US Ecology, Inc. and its subsidiaries.
Our operations are managed in two reportable segments reflecting our internal reporting structure and nature of services offered:Environmental Services and Field & Industrial Services.
Our Environmental Services segment provides a broad range of hazardous material management services includingtransportation, recycling, treatment and disposal of hazardous, non‑hazardous and radioactive waste at Company‑owned landfill,wastewater, deep-well injection and other treatment facilities.
Our Field & Industrial Services segment provides packaging and collection of hazardous waste and total waste managementsolutions at customer sites and through our 10‑day transfer facilities. Services include on‑site management, wastecharacterization, transportation and disposal of non‑hazardous and hazardous waste. This segment also provides specialty fieldservices such as industrial cleaning and maintenance, remediation, lab packs, retail services, transportation, emergency responseand other services to commercial and industrial facilities and to government entities.
NOTE 2. SUMMARY OF SIGNIFICANT ACCOUNTING POLICIES
Principles of Consolidation
The accompanying financial statements are prepared on a consolidated basis. All inter‑company balances and transactions havebeen eliminated in consolidation. Our year‑end is December 31.
Cash and Cash Equivalents
Cash and cash equivalents consist primarily of cash on deposit, money market accounts or short-term investments with originalmaturities of 90 days or less at the date of acquisition. Cash and cash equivalents totaled $32.0 million and $27.0 million atDecember 31, 2018 and 2017, respectively. At December 31, 2018 and 2017, we had $19.4 million and $18.6 million,respectively, of cash at our operations outside the United States.
Receivables
Our receivables include invoiced and unbilled amounts where the Company has an unconditional right to payment. Receivables are stated at an amount management expects to collect. Based on management’s assessment of the credit history ofthe customers having outstanding balances and factoring in current economic conditions, management has concluded thatpotential unidentified losses on balances outstanding at year‑end will not be material. Unbilled receivables are recorded for work performed under contracts that have not yet been invoiced to customers and arise dueto the timing of billings. Substantially all unbilled receivables at December 31, 2018, were billed in the following month.
68

Table of Contents
Restricted Cash and Investments
Restricted cash and investments of $4.9 million and $5.8 million at December 31, 2018 and 2017, respectively, represent fundsheld in third-party managed trust accounts as collateral for our financial assurance obligations for post-closure activities at ournon-operating facilities. These funds are invested in fixed-income U.S. Treasury and government agency securities and moneymarket accounts. The balances are adjusted monthly to fair market value based on quoted prices in active markets for identical orsimilar assets.
Revenue Recognition
Revenues are recognized when control of the promised services is transferred to our customers, in an amount that reflects theconsideration we expect to be entitled to in exchange for those services. We recognize revenue from three primary sources: 1) waste treatment, recycling and disposal services, 2) field and industrialwaste management services, and 3) waste transportation services.
Our waste treatment and disposal customers are legally obligated to properly treat and dispose of their waste in accordance withlocal, state, and federal laws and regulations. As our customers do not possess the resources to properly treat and dispose of theirwaste independently, they contract with the Company to perform these services. Waste treatment, recycling, and disposal revenueresults primarily from fixed fees charged to customers for treatment and/or disposal or recycling of specified wastes. Wastetreatment, recycling, and disposal revenue is generally charged on a per-ton or per-yard basis based on contracted prices and isrecognized over time as the services are performed. Our treatment and disposal services are generally performed as the waste isreceived and considered complete upon final disposal.
Field and industrial waste management services revenue results primarily from specialty onsite services such as high-pressurecleaning, tank cleaning, decontamination, remediation, transportation, spill cleanup and emergency response at refineries,chemical plants, steel and automotive plants, and other government, commercial and industrial facilities. We also providehazardous waste packaging and collection services and total waste management solutions at customer sites and through our 10-day transfer facilities. These services are provided based on purchase orders or agreements with the customer and include pricesbased upon daily, hourly or job rates for equipment, materials and personnel. Generally, the pricing in these types of contracts isfixed, but the quantity of services to be provided during the contract term is variable and revenues are recognized over the term ofthe agreements or as services are performed. As we have a right to consideration from our customers in an amount thatcorresponds directly with the value to the customer of the Company’s performance completed to date, we have applied thepractical expedient to recognize revenue in the amount to which we have the right to invoice. Revenue is recognized on contractswith retainage when services have been performed and it is probable that a significant reversal in the amount of cumulativerevenue recognized on the contracts will not occur .
Transportation and logistics revenue results from delivering customer waste to a disposal facility for treatment and/or disposal orrecycling. Transportation services are generally not provided on a stand-alone basis and instead are bundled with other Companyservices. However, in some instances we provide transportation and logistics services for shipment of waste from cleanup sites todisposal facilities operated by other companies. For such arrangements, we allocate revenue to each performance obligation basedon its relative standalone selling price. We generally determine standalone selling prices based on the prices charged to customeror using expected cost plus margin. Transportation revenue is recognized over time as the waste is transported.
Taxes and fees collected from customers concurrent with revenue-producing transactions to be remitted to governmentalauthorities are excluded from revenue.
Our Richland, Washington disposal facility is regulated by the Washington Utilities and Transportation Commission (“ WUTC”),which approves our rates for disposal of low-level radioactive waste (“LLRW”). Annual revenue levels are established based on arate agreement with the WUTC at amounts sufficient to cover the costs of operation, including facility maintenance, equipmentreplacement and related costs, and provide us with a reasonable profit. Per-unit rates charged to LLRW customers during the yearare based on our evaluation of disposal volume and radioactivity projections submitted to us by waste generators. Our proposedrates are then reviewed and approved by the WUTC. If annual revenue
69

Table of Contents
exceeds the approved levels set by the WUTC, we are required to refund excess collections to facility users on a pro-rata basis.Refundable excess collections, if any, are recorded in Accrued liabilities in the consolidated balance sheets. The current rateagreement with the WUTC was extended in 2013 and is effective until January 1, 2020.
Deferred Revenue
We record deferred revenue when cash payments are received, or advance billings are charged, prior to performance of services,such as waste that has been received but not yet treated or disposed, and is recognized when these services are performed. Duringthe year ended December 31, 2018, we recognized $8.4 million of revenue that was included in the deferred revenue balance atthe beginning of the year. Property and Equipment
Property and equipment are recorded at cost and depreciated on the straight‑line method over estimated useful lives.Replacements and major repairs of property and equipment are capitalized and retirements are made when assets are disposed ofor when the useful life has been exhausted. Minor components and parts are expensed as incurred. Repair and maintenanceexpenses were $17.5 million, $14.8 million and $11.8 million for the years ended December 31, 2018, 2017 and 2016,respectively.
We assume no salvage value for our depreciable fixed assets. The estimated useful lives for significant property and equipmentcategories are as follows:
Useful LivesVehicles and other equipment 3 to 10 yearsDisposal facility and equipment 3 to 20 yearsBuildings and improvements 5 to 40 yearsRailcars 40 years
Disposal Cell Accounting
Qualified disposal cell development costs such as personnel and equipment costs incurred to construct new disposal cells arerecorded and capitalized at cost. Capitalized cell development costs, net of recorded amortization, are added to estimated futurecosts of the permitted disposal cell to be incurred over the remaining construction of the cell, to determine the amount to beamortized over the remaining estimated cell life. Estimates of future costs are developed using input from independent engineersand internal technical and accounting managers. We review these estimates at least annually. Amortization is recorded on a unitof consumption basis, typically applying cost as a rate per cubic yard disposed. Disposal facility costs are expected to be fullyamortized upon final closure of the facility, as no salvage value applies. Costs associated with ongoing disposal operations arecharged to expense as incurred.
We have material financial commitments for closure and post‑closure obligations for certain facilities we own or operate. Weestimate future cost requirements for closure and post‑closure monitoring based on RCRA and conforming state requirements andfacility permits. RCRA requires that companies provide the responsible regulatory agency acceptable financial assurance forclosure work and subsequent post‑closure monitoring of each facility for 30 years following closure. Estimates for final closureand post‑closure costs are developed using input from our technical and accounting managers as well as independent engineersand are reviewed by management at least annually. These estimates involve projections of costs that will be incurred after thedisposal facility ceases operations, through the required post‑closure care period. The present value of the estimated closure andpost‑closure costs are accreted using the interest method of allocation to direct costs in our consolidated statements of operationsso that 100% of the future cost has been incurred at the time of payment.
Business Combinations
We account for business combinations under the acquisition method of accounting. The cost of an acquired company is assignedto the tangible and identifiable intangible assets purchased and the liabilities assumed on the basis of their fair
70
Table of Contents
values at the date of acquisition. Any excess of purchase price over the fair value of net tangible and intangible assets acquired isassigned to goodwill. The transaction costs associated with business combinations are expensed as they are incurred.
Goodwill
Goodwill represents the excess of the fair value of the consideration transferred over the fair value of the underlying identifiableassets and liabilities acquired. Goodwill is not amortized, but instead is assessed for impairment annually in the fourth quarter asof October 1 and also if an event occurs or circumstances change that may indicate a possible impairment. In the event that wedetermine that the value of goodwill has become impaired, we will incur an accounting charge for the amount of impairmentduring the period in which the determination has been made. See Note 3 for additional information related to the use of estimatesin the Company’s goodwill impairment tests and Note 13 for additional information on the goodwill impairment charges recordedin 2018 and 2017.
Intangible Assets
Intangible assets are stated at the fair value assigned in a business combination net of amortization. We amortize our amortizingintangible assets using the straight‑line method over their estimated economic lives ranging from 1 to 60 years. We reviewintangible assets with indefinite useful lives for impairment during the fourth quarter as of October 1 of each year. We also reviewboth non-amortizing and amortizing intangible assets for impairment whenever events or changes in circumstances indicate thatthe carrying value of an intangible asset may not be recoverable. See Note 3 for additional information related to the use ofestimates in the Company’s intangible assets impairment tests and Note 13 for additional information on the intangible assetimpairment charges recorded in 2018 and 2017.
Our acquired permits and licenses generally have renewal terms of approximately 5-10 years. We have a history of renewingthese permits and licenses as demonstrated by the fact that each of the sites’ treatment permits and licenses have been renewedregularly since the facility began operations. We intend to continue to renew our permits and licenses as they come up forrenewal for the foreseeable future. Costs incurred to renew or extend the term of our permits and licenses are recorded in Selling,general and administrative expenses in our consolidated statements of operations.
Impairment of Long‑Lived Assets
Long-lived assets consist primarily of property and equipment facility development costs and amortizing intangible assets. Therecoverability of long-lived assets is evaluated periodically through analysis of operating results and consideration of othersignificant events or changes in the business environment. If an operating unit had indications of possible impairment, we wouldevaluate whether impairment exists on the basis of undiscounted expected future cash flows from operations over the remainingamortization period. If an impairment loss were to exist, the carrying amount of the related long-lived assets would be reduced totheir estimated fair value.
Deferred Financing Costs
Deferred financing costs are amortized over the life of our new senior secured credit agreement (the “2017 Credit Agreement”).Amortization of deferred financing costs is included as a component of interest expense in the consolidated statements ofoperations.
Deferred financing costs associated with the 2017 Credit Agreement were $2.7 million and $3.4 million, net of accumulatedamortization and have been recorded in Prepaid expenses and other current assets and Other assets in the consolidated balancesheets as of December 31, 2018 and 2017, respectively.
The Company wrote off certain unamortized deferred financing costs and original issue discount associated with the 2014 CreditAgreement that were to be amortized to interest expense in future periods through a one-time charge of $5.5 million to Interestexpense in the second quarter of 2017.
71

Table of Contents
Derivative Instruments
In order to manage interest rate exposure, we entered into an interest rate swap agreement in October 2014 that effectivelyconverts a portion of our variable-rate debt to a fixed interest rate. Changes in the fair value of the interest rate swap are recordedas a component of accumulated other comprehensive income within stockholders' equity, and are recognized in interest expensein the period in which the payment is settled. The interest rate swap has an effective date of December 31, 2014 in an initialnotional amount of $250.0 million. The Company does not hold or issue derivative financial instruments for trading or speculativepurposes.
Foreign Currency
Our Canadian operations’ functional currency is the Canadian dollar (“CAD”). Assets and liabilities are translated to U.S. dollars(“USD”) at the exchange rate in effect at the balance sheet date and revenue and expenses at the average exchange rate for theperiod. Gains and losses from the translation of the consolidated financial statements of our Canadian subsidiaries into USD areincluded in stockholders' equity as a component of Accumulated other comprehensive income. Gains and losses resulting fromforeign currency transactions are recognized in the consolidated statements of operations. Recorded balances that aredenominated in a currency other than the functional currency are re‑measured to the functional currency using the exchange rateat the balance sheet date and gains or losses are recorded in the statements of operations.
Income Taxes
Income taxes are accounted for using an asset and liability approach. This requires the recognition of deferred tax assets andliabilities for the expected future tax consequences of temporary differences between the financial statement and tax basis ofassets and liabilities at the applicable tax rates. The effect of a change in tax rates on deferred tax assets and liabilities isrecognized in the period that includes the enactment date.
We recognize deferred tax assets to the extent that we believe these assets are more likely than not to be realized. In making sucha determination, we consider all available positive and negative evidence, including future reversals of existing taxable temporarydifferences, projected future taxable income, tax‑planning strategies, and results of recent operations. If we determine that wewould be able to realize our deferred tax assets in the future in excess of their net recorded amount, we would make an adjustmentto the deferred tax asset valuation allowance, which would reduce the provision for income taxes.
The application of income tax law is inherently complex. Tax laws and regulations are voluminous and at times ambiguous andinterpretations of guidance regarding such tax laws and regulations change over time. This requires us to make many subjectiveassumptions and judgments regarding the timing and amounts of deductible and taxable items and the probability of sustaininguncertain tax positions. A liability for uncertain tax positions is recorded in our consolidated financial statements on the basis of atwo-step process whereby (1) we determine whether it is more likely than not that the tax position taken will be sustained basedon the technical merits of the position and (2) for those tax positions that meet the more likely than not recognition threshold, werecognize the largest amount of tax benefit that is greater than 50% likely to be realized upon ultimate settlement with the relatedtax authority. We recognize interest assessed by taxing authorities or interest associated with uncertain tax positions as acomponent of interest expense. We recognize any penalties assessed by taxing authorities or penalties associated with uncertaintax positions as a component of selling, general and administrative expenses. At December 31, 2018, our estimated grossunrecognized tax benefits were $555,000, of which $485,000, if recognized, would favorably impact our future earnings. Due touncertainties in any tax audit outcome, our estimates of the ultimate settlement of our unrecognized tax positions may change andthe actual tax benefits may differ significantly from the estimates. As facts and circumstances change, we reassess theseprobabilities and record any changes in the financial statements as appropriate. Our tax returns are subject to audit by the InternalRevenue Service (“IRS”), various states in the U.S. and the Canadian Revenue Agency.
Insurance
Accrued costs for our self‑insured health care coverage were $826,000 and $1.1 million at December 31, 2018 and 2017,respectively.
72

Table of Contents
Earnings Per Share
Basic earnings per share is calculated based on the weighted‑average number of outstanding common shares during the applicableperiod. Diluted earnings per share is based on the weighted‑average number of outstanding common shares plus theweighted‑average number of potential outstanding common shares. Potential common shares that would increase earnings pershare or decrease loss per share are anti‑dilutive and are excluded from earnings per share computations. Earnings per share iscomputed separately for each period presented.
Treasury Stock
Shares of common stock repurchased by us are recorded at cost as treasury stock and result in a reduction of stockholders’ equityin our consolidated balance sheets. Treasury shares are reissued using the weighted average cost method for determining the costof the shares reissued. The difference between the cost of the shares reissued and the issuance price is added or deducted fromadditional paid‑in capital.
Recently Issued Accounting Pronouncements
In February 2018, the Financial Accounting Standards Board (“FASB”) issued Accounting Standards Update (“ASU”) No. 2018-02, Income Statement-Reporting Comprehensive Income (Topic 220) . This ASU allows for an optional one-time reclassificationfrom accumulated other comprehensive income (loss) to retained earnings for the stranded tax effects resulting from the newcorporate tax rate under the Tax Cuts and Jobs Act of 2017 (the “Tax Act”). The new guidance requires additional disclosures,regardless of whether the optional reclassification is elected. This ASU is effective for fiscal years and interim periods beginningafter December 15, 2018, with early adoption permitted, and may be applied retrospectively or as of the beginning of the periodof adoption. The Company has elected not to make this optional reclassification .
On December 22, 2017, the Tax Act was signed into law making significant changes to the Internal Revenue Code. Changesinclude, but are not limited to, a corporate tax rate decrease from 35% to 21% effective for tax years beginning after December31, 2017, the transition of U.S. international taxation from a worldwide tax system to a territorial system, and a one-timetransition tax on the mandatory deemed repatriation of cumulative foreign earnings as of December 31, 2017.
On December 22, 2017, the SEC staff issued Staff Accounting Bulletin No. 118 (“SAB 118”), which provides guidance onaccounting for the tax effects of the Tax Act. SAB 118 provided a measurement period that should not extend beyond one yearfrom the Tax Act enactment date for companies to complete the accounting under Accounting Standards Codification (“ASC”)740. December 22, 2018 marked the end of the measurement period for purposes of SAB 118. As such, we have completed ouranalysis based on legislative updates relating to the Tax Act currently available, which resulted in a net benefit for measurementperiod adjustments of $193,000 for the year ended December 31, 2018. The total tax provision benefit included a $2.2 millionbenefit related to the re-measurement of certain deferred tax assets and liabilities offset by $2.0 million of expense related toadjustments to the transition tax.
The Tax Act also includes provisions to tax Global Intangible Low-Taxed Income (“GILTI”) of foreign subsidiaries in excess of adeemed return on their tangible assets. Pursuant to the Tax Act, corporations are allowed to make an accounting policy election toeither (1) account for GILTI as a component of income tax expense in the period in which the corporation is subject to the rules(the “period cost method”), or (2) account for GILTI in the corporation's measurement of deferred taxes (the “deferred method”).In the fourth quarter of 2018, the Company elected to treat any potential GILTI inclusions as a period cost.
In August 2017, the FASB issued ASU No. 2017-12, Derivatives and Hedging (Topic 815). This ASU amends the guidance inASC 815 to better align an entity’s risk management activities and financial reporting for hedging relationships through changesto both the designation and measurement guidance for qualifying hedging relationships and the presentation of hedge results. Theguidance is effective for annual and interim reporting periods beginning after December 15, 2018, with early adoption permitted.The Company is currently evaluating the impact ASU 2017-12 will have on its consolidated financial statements.
73

Table of Contents
In November 2016, the FASB issued ASU No. 2016-18 , Restricted Cash (Topic 230) . This ASU amends the guidance in ASC230 to add or clarify guidance on the classification and presentation of restricted cash in the statement of cash flows. ASU 2016-18 is based on the Emerging Issues Task Force’s consensuses reached on Issue 16-A. The guidance is effective for annual andinterim periods beginning after December 15, 2017. The Company adopted ASU 2016-18 as of January 1, 2018 using theretrospective adoption method. The impact of retrospective application of ASU 2016-18 is not material, as restricted cash activityfor the years ended December 31, 2018, 2017, and 2016 was not deemed to be significant. Restricted cash is now included withCash and cash equivalents when reconciling the beginning-of-period and end-of-period amounts presented in the Company’sconsolidated statements of cash flows. In August 2016, the FASB issued ASU No. 2016-15, Statements of Cash Flows (Topic 230) . This ASU amends the guidance inASC 230 on the classification of certain cash receipts and payments in the statement of cash flows. The primary purpose of theASU is to reduce the diversity in practice that has resulted from the lack of consistent principles on this topic. The guidance iseffective for annual and interim periods beginning after December 15, 2017. The Company adopted ASU 2016-15 as of January1, 2018 using the retrospective adoption method. The only provision applicable to the Company relates to the treatment ofproceeds from the settlement of insurance claims in connection with damaged property and equipment. The impact ofretrospective application of ASU 2016-15 was a reclassification of insurance proceeds related to damaged property andequipment of $1.3 million and $654,000 from cash flows from operating activities to cash flows from investing activities in thestatement of cash flows for the years ended December 31, 2017 and 2016, respectively. In February 2016, the FASB issued ASU No. 2016-02, Leases (Topic 842) . The ASU significantly changes the accounting modelused by lessees to account for leases, requiring that all material leases be presented on the balance sheet. Lessees will recognizesubstantially all leases on the balance sheet as a right-of-use asset and a corresponding lease liability. The liability will be equal tothe present value of lease payments. The asset will be based on the liability, subject to adjustment, such as for initial direct costs.The guidance is effective for annual and interim periods beginning after December 15, 2018. Early adoption is permitted. In July2018, the FASB issued ASU No. 2018-11 which provides a practical expedient that allows companies to use an optional transitionmethod. Under the optional transition method, a cumulative adjustment to retained earnings during the period of adoption isrecorded and prior periods would not require restatement. The Company will adopt ASU 2016-02 in the first quarter of 2019utilizing this optional transitional method. While we are continuing to assess the potential impacts of ASU 2016-02, the Companyestimates that the adoption of the ASU 2016-02 will result in the recognition of right-of-use assets and lease liabilities foroperating leases of approximately $18 million on its consolidated balance sheets, with no material impact on its consolidatedstatements of operations. In May 2014, the FASB issued ASU No. 2014-09, Revenue from Contracts with Customers (Topic 606) , which providesguidance for revenue recognition. The ASU’s core principle is that a company will recognize revenue when it transfers promisedgoods or services to customers in an amount that reflects the consideration to which the company expects to be entitled inexchange for those goods or services. The Company adopted Topic 606 as of January 1, 2018 using the modified retrospectivetransition method. See Note 4 for additional information.
NOTE 3. USE OF ESTIMATES
The preparation of financial statements in conformity with accounting principles generally accepted in the United States requiresmanagement to make estimates and assumptions that affect the reported amounts of assets and liabilities and the disclosure ofcontingent assets and liabilities at the date of the financial statements, as well as the reported amounts of revenue and expensesduring the reporting period. Listed below are the estimates and assumptions that we consider to be significant in the preparationof our consolidated financial statements.
· Allowance for Doubtful Accounts - We estimate losses for uncollectible accounts based on the aging of the accountsreceivable and an evaluation of the likelihood of success in collecting the receivable.
· Recovery of Long‑Lived Assets - We evaluate the recovery of our long‑lived assets periodically by analyzing our operatingresults and considering significant events or changes in the business environment.
· Income Taxes - We assume the deductibility of certain costs in our income tax filings, estimate our income tax rate
74

Table of Contents
and estimate the future recovery of deferred tax assets.
· Legal and Environmental Accruals - We estimate the amount of potential exposure we may have with respect to litigationand environmental claims and assessments.
· Disposal Cell Development and Final Closure/Post‑Closure Amortization - We expense amounts for disposal cell usage andclosure and post‑closure costs for each cubic yard of waste disposed of at our operating facilities. In determining the amountto expense for each cubic yard of waste disposed, we estimate the cost to develop each disposal cell and the closure andpost‑closure costs for each disposal cell and facility. The expense for each cubic yard is then calculated based on theremaining permitted capacity and total permitted capacity. Estimates for closure and post‑closure costs are developed usinginput from third‑party engineering consultants, and our internal technical and accounting personnel. Management reviewsestimates at least annually. Estimates for final disposal cell closure and post‑closure costs consider when the costs wouldactually be paid and, where appropriate, inflation and discount rates.
· Business Acquisitions - The Company records assets and liabilities of the acquired business at their fair values.Acquisition‑related transaction and restructuring costs are expensed rather than treated as part of the cost of the acquisition.Goodwill represents the excess of the cost of an acquired business over the fair value of the identifiable tangible andintangible assets acquired and liabilities assumed in a business acquisition.
· Goodwill - We assess goodwill for impairment during the fourth quarter as of October 1 of each year or sooner if an eventoccurs or circumstances change that would more likely than not reduce the fair value of a reporting unit below its carryingamount. The assessment consists of comparing the estimated fair value of the reporting unit to the carrying value of the netassets assigned to the reporting unit, including goodwill. Fair values are generally determined by using both the marketapproach, applying a multiple of earnings based on guideline for publicly traded companies, and the income approach,discounting projected future cash flows based on our expectations of the current and future operating environment. The ratesused to discount projected future cash flows reflect a weighted average cost of capital based on our industry, capital structureand risk premiums including those reflected in the current market capitalization. Estimating future cash flows requiressignificant judgment about factors such as general economic conditions and projected growth rates, and our estimates oftenvary from the cash flows eventually realized. Failure to execute on planned growth initiatives within the related reportingunits, coupled with the other factors mentioned above, could lead to the impairment of goodwill and other long-lived assetsin future periods.
· Intangible Assets - We review intangible assets with indefinite useful lives for impairment during the fourth quarter as ofOctober 1 of each year. Fair value is generally determined by considering an internally-developed discounted projected cashflow analysis. If the fair value of an asset is determined to be less than the carrying amount of the intangible asset, animpairment in the amount of the difference is recorded in the period in which the annual assessment occurs.
We also review amortizing intangible assets for impairment whenever events or changes in circumstances indicate that thecarrying value of an intangible asset may not be recoverable. In order to assess whether a potential impairment exists, theassets' carrying values are compared with their undiscounted expected future cash flows. Estimating future cash flowsrequires significant judgment about factors such as general economic conditions and projected growth rates, and ourestimates often vary from the cash flows eventually realized. Impairments are measured by comparing the fair value of theasset to its carrying value. Fair value is generally determined by considering: (i) the internally-developed discountedprojected cash flow analysis; (ii) a third‑party valuation; and/or (iii) information available regarding the current marketenvironment for similar assets. If the fair value is determined to be less than the carrying amount of the intangible assets, animpairment in the amount of the difference is recorded in the period in which the events or changes in circumstances thatindicated the carrying value of the intangible assets may not be recoverable occurred.
Actual results could differ materially from the estimates and assumptions that we use in the preparation of our consolidatedfinancial statements. As it relates to estimates and assumptions in amortization rates and environmental obligations, significantengineering, operations and accounting judgments are required. We review these estimates and assumptions no less than annually.In many circumstances, the ultimate outcome of these estimates and assumptions will not be known for
75

Table of Contents
decades into the future. Actual results could differ materially from these estimates and assumptions due to changes in applicableregulations, changes in future operational plans and inherent imprecision associated with estimating environmental impacts farinto the future.
NOTE 4. REVENUES Adoption of ASC Topic 606, “Revenue from Contracts with Customers” As of January 1, 2018, we adopted Topic 606 using the modified retrospective method applied to those contracts which were notcompleted as of January 1, 2018. Results for reporting periods beginning after January 1, 2018 are presented under Topic 606,while prior period amounts are not adjusted and continue to be reported in accordance with our historic accounting under RevenueRecognition (Topic 605). Adoption of the guidance did not materially affect the timing or amount of revenue recognized, and no cumulative effectadjustment was recognized as a result of initially applying Topic 606. Disaggregation of Revenue Our operations are managed in two reportable segments, Environmental Services and Field & Industrial Services, reflecting ourinternal reporting structure and nature of services offered. The operations not managed through our two reportable segments arerecorded as Corporate. See Note 21 for additional information. Effective December 31, 2018, we changed our presentation of disaggregated revenues to align with changes in how we manageour service lines within our Field & Industrial Services segment. Revenues previously combined and reported as TechnicalServices are now disaggregated into two service lines, Small Quantity Generation (“SQG”) and Total Waste Management(“TWM”) and certain revenues formerly classified as Technical Services were reclassed to Remediation. Also, marine terminalservices revenues, formerly classified as Other, are now included in Industrial Services. Throughout this Annual Report on Form10-K, our disaggregated revenues for all periods presented have been recast to reflect these changes. The following table presents our revenue disaggregated by our reportable segments and service lines:
2018 Field & Environmental Industrial $s in thousands Services Services Total
Treatment & Disposal Revenue (1) $ 319,282 $ 12,865 $ 332,147Services Revenue: Transportation and Logistics (2) 81,396 33,037 114,433Industrial Services (3) — 24,155 24,155Small Quantity Generation (4) — 34,571 34,571Total Waste Management (5) — 41,729 41,729Remediation (6) — 10,139 10,139Other (7) — 8,754 8,754
Revenue $ 400,678 $ 165,250 $ 565,928
76

Table of Contents
2017 Field & Environmental Industrial $s in thousands Services Services Total
Treatment & Disposal Revenue (1) $ 298,871 $ 11,084 $ 309,955Services Revenue: Transportation and Logistics (2) 67,437 21,898 89,335Industrial Services (3) — 19,121 19,121Small Quantity Generation (4) — 29,934 29,934Total Waste Management (5) — 38,628 38,628Remediation (6) — 14,241 14,241Other (7) — 2,828 2,828
Revenue $ 366,308 $ 137,734 $ 504,042
2016 Field & Environmental Industrial $s in thousands Services Services Total
Treatment & Disposal Revenue (1) $ 275,457 $ 12,680 $ 288,137Services Revenue: Transportation and Logistics (2) 62,314 17,812 80,126Industrial Services (3) — 22,440 22,440Small Quantity Generation (4) — 33,043 33,043Total Waste Management (5) — 30,688 30,688Remediation (6) — 21,908 21,908Other (7) — 1,323 1,323
Revenue $ 337,771 $ 139,894 $ 477,665
(1) We categorize our treatment and disposal revenue as either “Base Business” or “Event Business” based on the underlyingnature of the revenue source. We define Event Business as non-recurring projects that are expected to equal or exceed 1,000tons, with Base Business defined as all other business not meeting the definition of Event Business. For the years endedDecember 31, 2018, 2017 and 2016, 20%, 22% and 18%, respectively, of our treatment and disposal revenue was derivedfrom Event Business projects. Base Business revenue accounted for 80%, 78% and 82% of our treatment and disposalrevenue for the years ended December 31, 2018, 2017 and 2016, respectively.
(2) Includes such services as collection and transportation of non-hazardous and hazardous waste.(3) Includes such services as industrial cleaning and maintenance for refineries, chemical plants, steel and automotive plants,
marine terminals and refinery services such as tank cleaning and temporary storage.(4) Includes such services as retail services, laboratory packing, less-than-truck-load service and household hazardous waste
collection. Contracts for Small Quantity Generation may extend beyond one year and a portion of the transaction price canbe fixed.
(5) Through our TWM program, customers outsource the management of their waste compliance program to us, allowing us toorganize and coordinate their waste management disposal activities and environmental compliance. TWM c ontracts mayextend beyond one year and a portion of the transaction price can be fixed.
(6) Includes such services as site assessment, onsite treatment, project management and remedial action planning and execution.Contracts for Remediation may extend beyond one year and a portion of the transaction price can be fixed.
(7) Includes emergency response and other services.
77

Table of Contents
We provide services in the United States and Canada. The following table presents our revenue disaggregated by our reportablesegments and geographic location where the underlying services were performed:
2018 2017 2016 Field & Field & Field & Environmental Industrial Environmental Industrial Environmental Industrial $s in thousands Services Services Total Services Services Total Services Services Total
United States $ 329,918 $ 165,250 $ 495,168 $ 296,777 $ 137,734 $ 434,511 $ 288,884 $ 139,894 $ 428,778Canada 70,760 — 70,760 69,531 — 69,531 48,887 — 48,887
Total revenue $ 400,678 $ 165,250 $ 565,928 $ 366,308 $ 137,734 $ 504,042 $ 337,771 $ 139,894 $ 477,665 Principal versus Agent Considerations The Company commonly contracts with third-parties to perform certain waste-related services that we have promised in ourcustomer contracts. We consider ourselves the principal in these arrangements as we direct the timing, nature and pricing of theservices ultimately provided by the third-party to the customer. Costs to Obtain a Contract The Company pays sales commissions to employees, which qualify as costs to obtain a contract. Sales commissions are expensedas incurred as the commissions are earned by the employee and paid by the Company over time as the related revenue isrecognized. Practical Expedients and Optional Exemptions Our payment terms may vary based on type of service or customer; however, we do not adjust the promised amount ofconsideration in our contracts for the time value of money as payment terms extended to our customers do not exceed one yearand are not considered a significant financing component in our contracts. We do not disclose the value of unsatisfied performance obligations as contracts with an original expected length of more thanone year and contracts for which we do not recognize revenue at the amount to which we have the right to invoice for servicesperformed is insignificant and the aggregate amount of fixed consideration allocated to unsatisfied performance obligations is notmaterial.
78
Table of Contents
NOTE 5. BUSINESS COMBINATIONS
ES&H of Dallas, LLC
On August 31, 2018, the Company acquired ES&H of Dallas, LLC (“ES&H Dallas”), which provides emergency and spillresponse, light industrial services and transportation and logistics for waste disposal and recycling from locations in Dallas andMidland, Texas. The total purchase price was $21.3 million and was funded with cash on hand. The ES&H Dallas facilities arereported as part of our Field and Industrial Services segment. The Company assessed the revenues, net income, earnings per shareand total assets of ES&H Dallas and concluded they are not material to our consolidated financial position or results of operationseither individually or when aggregated with other acquisitions completed in 2018. As such, pro forma financial information hasnot been provided. We allocated the purchase price to the assets acquired based on preliminary estimates of the fair value at the date of acquisition,resulting in $10.0 million allocated to property and equipment and other current assets, $7.1 million allocated to goodwill and$4.2 million allocated to intangible assets (consisting primarily of customer relationships) to be amortized over a weightedaverage life of approximately 13 years. No liabilities were assumed in the acquisition. The purchase price allocation ispreliminary, as estimates and assumptions are subject to change as more information becomes available.
Goodwill of $7.1 million arising from the acquisition is attributable to the assembled workforce and the future economic benefitsof synergies with our other Texas facilities and expansion into new markets. All of the goodwill recognized was assigned to ourField & Industrial Services segment and is expected to be deductible for income tax purposes over a 15-year amortization period.
Ecoserv Industrial Disposal, LLC
On November 14, 2018, the Company acquired Ecoserv Industrial Disposal, LLC (“Winnie”), which provides non-hazardousindustrial wastewater disposal solutions and employs deep-well injection technology in the southern United States. The totalpurchase price was $87.1 million and was funded with $87.0 million in borrowings under the 2017 Credit Agreement and cash onhand. The purchase price is subject to post-closing adjustments based on agreed upon working capital requirements. Post-closingadjustments are expected to be finalized and settled in 2019. Winnie is reported as part of our Environmental Services segment.The Company assessed the revenues, net income, earnings per share and total assets of Winnie and concluded they are notmaterial to our consolidated financial position or results of operations either individually or when aggregated with otheracquisitions completed in 2018. As such, pro forma financial information has not been provided.
79

Table of Contents
We allocated the purchase price to the assets acquired and liabilities assumed based on preliminary estimates of the fair value atthe date of acquisition. The purchase price allocation is preliminary, as estimates and assumptions are subject to change as moreinformation becomes available. The following table summarizes the consideration paid for Winnie and the preliminary fair valueestimates of assets acquired and liabilities assumed recognized at the acquisition date:
Purchase Price
$s in thousands AllocationCurrent assets $ 1,923Property and equipment 6,300Identifiable intangible assets 66,600Current liabilities (755)Other liabilities (512)Total identifiable net assets 73,556Goodwill 13,573
Total purchase price $ 87,129 The preliminary fair value of identifiable intangible assets related to the acquisition of Winnie consisted of $54.8 million inpermits to be amortized over a life of 60 years, and $11.8 million in customer relationships to be amortized over a life of 15 years.
Goodwill of $13.6 million arising from the acquisition is attributable to the future economic benefits of expansion into the deep-well injection market and the assembled workforce. All of the goodwill recognized was assigned to our Environmental Servicessegment and is expected to be deductible for income tax purposes over a 15-year amortization period.
Environmental Services Inc.
On May 2, 2016, the Company acquired 100% of the outstanding shares of Environmental Services Inc., (“ESI”), anenvironmental services company based in Tilbury, Ontario, Canada. ESI is focused primarily on hazardous and non-hazardoustransportation and disposal, hazardous and non-hazardous waste treatment, industrial services, confined space rescue andemergency response work throughout Ontario. The total purchase price was $4.9 million, net of cash acquired, and was fundedwith cash on hand. ESI is reported as part of our Environmental Services segment, however, revenues, net income, earnings pershare and total assets of ESI are not material to our consolidated financial position or results of operations.
We allocated the purchase price to the assets acquired and liabilities assumed based on estimates of the fair value at the date ofthe acquisition, resulting in $1.0 million allocated to goodwill (which is not deductible for tax purposes), $813,000 allocated tointangible assets (primarily customer relationships) to be amortized over a weighted average life of approximately 14 years, and$686,000 allocated to non-amortizing environmental permits. All of the goodwill recognized was assigned to our EnvironmentalServices segment and is expected to be deductible for income tax purposes over a 15-year amortization period.
Acquisition of Vernon, California Facility
On October 1, 2016, we acquired the Vernon, California based RCRA Part B, liquids and solids waste treatment and storagefacility of Evoqua Water Technologies LLC for $5.0 million. The Vernon, California facility is reported as part of ourEnvironmental Services segment, however, revenues, net income, earnings per share and total assets of the Vernon, Californiafacility are not material to our consolidated financial position or results of operations.
We allocated the purchase price to the assets acquired and liabilities assumed based on estimates of the fair value at the date ofthe acquisition, resulting in $354,000 allocated to goodwill, $1.9 million allocated to intangible assets (primarily customerrelationships) to be amortized over a weighted average life of approximately 20 years, and $1.3 million allocated to non-amortizing environmental permits. All of the goodwill recognized was assigned to our Environmental Services segment and isexpected to be deductible for income tax purposes over a 15-year amortization period.
80

Table of Contents
NOTE 6. DIVESTITURES
Divestiture of Augusta, Georgia Facility
On April 5, 2016, we completed the divestiture of our Augusta, Georgia facility for cash proceeds of $1.9 million. The Augusta,Georgia facility was reported as part of our Environmental Services segment. Sales, net income and total assets of the Augusta,Georgia facility are not material to our consolidated financial position or results of operations in any period presented. Werecognized a $1.9 million pre-tax gain on the divestiture of the Augusta, Georgia facility, which is included in Other income(expense) in our consolidated statements of operations for the year ended December 31, 2016.
NOTE 7. ACCUMULATED OTHER COMPREHENSIVE INCOME (LOSS)
Changes in accumulated other comprehensive income (loss) (“AOCI”) consisted of the following:
Foreign Unrealized Gain Currency (Loss) on Interest $s in thousands Translation Rate Hedge TotalBalance at December 31, 2016 $ (12,649) $ (2,076) $ (14,725)Other comprehensive income before reclassifications, net of tax 4,046 45 4,091Amounts reclassified out of AOCI, net of tax (1) — 1,530 1,530Other comprehensive income, net 4,046 1,575 5,621
Balance at December 31, 2017 $ (8,603) $ (501) $ (9,104)Other comprehensive income (loss) before reclassifications, net of tax (6,094) 1,111 (4,983)Amounts reclassified out of AOCI, net of tax (2) — 296 296Other comprehensive income, net (6,094) 1,407 (4,687)
Balance at December 31, 2018 $ (14,697) $ 906 $ (13,791)
(1) Before-tax reclassifications of $2.3 million ($1.5 million after-tax) for the year ended December 31, 2017 were included inInterest expense in the Company’s consolidated statements of operations. Amount relates to the Company’s interest rateswap which is designated as a cash flow hedge. Changes in fair value of the swap recognized in AOCI are reclassified tointerest expense when hedged interest payments on the underlying long-term debt are made.
(2) Before-tax reclassifications of $375,000 ($296,000 after-tax) for the year ended December 31, 2018 were included in Interestexpense in the Company’s consolidated statements of operations. Amount relates to the Company’s interest rate swap whichis designated as a cash flow hedge. Changes in fair value of the swap recognized in AOCI are reclassified to interest expensewhen hedged interest payments on the underlying long-term debt are made. Amounts in AOCI expected to be recognized asa reduction of interest expense over the next 12 months total approximately $229,000 ($181,000 after tax).
81

Table of Contents
NOTE 8. DISCLOSURE OF SUPPLEMENTAL CASH FLOW INFORMATION
For the Year Ended December 31, $s in thousands 2018 2017 2016Income taxes and interest paid:
Income taxes paid, net of receipts $ 19,580 $ 10,714 $ 25,729Interest paid 11,246 11,364 14,304
Non-cash investing and financing activities: Closure/Post-closure retirement asset 99 (352) 426Capital expenditures in accounts payable 1,601 2,302 2,906Acquisition of equipment with financing arrangements 747 531 1,156Restricted stock issuances from treasury shares 11 105 408
NOTE 9. FAIR VALUE MEASUREMENTS
Fair value is defined as the price that would be received to sell an asset or paid to transfer a liability in an orderly transactionbetween market participants at the measurement date. Assets and liabilities recorded at fair value are categorized using definedhierarchical levels directly related to the amount of subjectivity associated with the inputs to fair value measurements, as follows:
Level 1 - Quoted prices in active markets for identical assets or liabilities;
Level 2 - Inputs other than quoted prices included within Level 1 that are either directly or indirectly observable;
Level 3 - Unobservable inputs in which little or no market activity exists, requiring an entity to develop its ownassumptions that market participants would use to value the asset or liability.
The Company’s financial instruments consist of cash and cash equivalents, accounts receivable, restricted cash and investments,accounts payable and accrued liabilities, debt and interest rate swap agreements. The estimated fair value of cash and cashequivalents, accounts receivable, accounts payable and accrued liabilities approximate their carrying value due to the short-termnature of these instruments.
The Company estimates the fair value of its variable-rate debt using Level 2 inputs, such as interest rates, related terms andmaturities of similar obligations. At December 31, 2018, the carrying value of the Company’s variable-rate debt approximates fairvalue due to the short-term nature of the interest rates.
The Company’s assets and liabilities measured at fair value on a recurring basis at December 31, 2018 and 2017 consisted of thefollowing:
2018 Quoted Prices in Other Observable Unobservable Active Markets Inputs Inputs $s in thousands (Level 1) (Level 2) (Level 3) TotalAssets:
Fixed-income securities $ 1,561 $ 2,596 $ — $ 4,157Money market funds 784 — — 784Interest rate swap agreement — 1,147 — 1,147
Total $ 2,345 $ 3,743 $ — $ 6,088
82
(1)
(2)
(3)

Table of Contents
2017 Quoted Prices in Other Observable Unobservable Active Markets Inputs Inputs $s in thousands (Level 1) (Level 2) (Level 3) TotalAssets:
Fixed-income securities $ 1,396 $ 2,649 $ — $ 4,045Money market funds 1,757 — — 1,757
Total $ 3,153 $ 2,649 $ — $ 5,802 Liabilities:
Interest rate swap agreement $ — $ 638 $ — $ 638Total $ — $ 638 $ — $ 638
(1) We invest a portion of our Restricted cash and investments in fixed‑income securities, including U.S. Treasury and U.S.agency securities. We measure the fair value of U.S. Treasury securities using quoted prices for identical assets in activemarkets. We measure the fair value of U.S. agency securities using observable market activity for similar assets. The fairvalue of our fixed‑income securities approximates our cost basis in the investments.
(2) We invest a portion of our Restricted cash and investments in money market funds. We measure the fair value of thesemoney market fund investments using quoted prices for identical assets in active markets. Money market funds areconsidered restricted cash for purposes of reconciling the beginning-of-period and end-of-period amounts presented in theCompany’s consolidated statements of cash flows.
(3) In order to manage interest rate exposure, we entered into an interest rate swap agreement in October 2014 that effectivelyconverts a portion of our variable-rate debt to a fixed interest rate. The swap is designated as a cash flow hedge, with gainsand losses deferred in other comprehensive income to be recognized as an adjustment to interest expense in the same periodthat the hedged interest payments affect earnings. The interest rate swap has an effective date of December 31, 2014 with aninitial notional amount of $250.0 million. The fair value of the interest rate swap agreement represents the difference in thepresent value of cash flows calculated at the contracted interest rates and at current market interest rates at the end of theperiod. We calculate the fair value of the interest rate swap agreement quarterly based on the quoted market price for thesame or similar financial instruments. The fair value of the interest rate swap agreement is included in Other assets andOther long-term liabilities in the Company’s consolidated balance sheets as of December 31, 2018 and 2017, respectively.
NOTE 10. CONCENTRATIONS AND CREDIT RISK
Major Customers
No customer accounted for more than 10% of total revenue for the years ended December 31, 2018, 2017 or 2016.
No customer accounted for more than 10% of total receivables as of December 31, 2018 or 2017.
Credit Risk Concentration
We maintain most of our cash and cash equivalents with nationally recognized financial institutions. Substantially all balancesare uninsured and are not used as collateral for other obligations. Concentrations of credit risk on accounts receivable are believedto be limited due to the number, diversification and character of the obligors and our credit evaluation process.
Labor Concentrations
As of December 31, 2018, 28 employees were represented by the Paper, Allied-Industrial Chemical & Energy WorkersInternational Union, AFL-CIO, CLC (PACE) on behalf of Local 9777 and Local 12-369; 122 employees at our Blainville,Québec, Canada facility were represented by the Communications, Energy and Paperworkers Union of Canada; 143
83
(1)
(2)
(3)

Table of Contents
employees were represented by the Local 324 Operating Engineers Union; and 48 employees were represented by theInternational Brotherhood of Teamsters on behalf of Local 283, Local 560, and Local 728. As of December 31, 2018, our 1,382other employees did not belong to a union.
NOTE 11. RECEIVABLES
Receivables as of December 31, 2018 and 2017 consisted of the following:
$s in thousands 2018 2017Trade $ 118,909 $ 96,760Unbilled revenue 26,538 16,176Other 2,241 637Total receivables 147,688 113,573
Allowance for doubtful accounts (2,998) (2,796)Receivables, net $ 144,690 $ 110,777
The allowance for doubtful accounts is a provision for uncollectible accounts receivable and unbilled receivables. The allowanceis evaluated and adjusted to reflect our collection history and an analysis of the accounts receivables aging. The allowance isdecreased by accounts receivable as they are written off. The allowance is adjusted periodically to reflect actual experience. Thechange in the allowance during 2018, 2017 and 2016 was as follows:
Charged Balance at (Credited) to Recoveries Beginning of Costs and (Deductions/ Balance at$s in thousands Period Expenses Write-offs) Adjustments End of PeriodYear ended December 31, 2018 $ 2,796 $ 436 $ (213) $ (21) $ 2,998Year ended December 31, 2017 $ 2,334 $ 704 $ (255) $ 13 $ 2,796Year ended December 31, 2016 $ 3,226 $ (186) $ (705) $ (1) $ 2,334
NOTE 12. PROPERTY AND EQUIPMENT
Property and equipment as of December 31, 2018 and 2017 consisted of the following:
$s in thousands 2018 2017Cell development costs $ 146,155 $ 142,144Land and improvements 50,481 36,499Buildings and improvements 91,358 87,034Railcars 17,299 17,299Vehicles and other equipment 154,014 122,697Construction in progress 14,554 23,334Total property and equipment 473,861 429,007
Accumulated depreciation and amortization (215,418) (194,575)Property and equipment, net $ 258,443 $ 234,432
Depreciation and amortization expense was $29.2 million, $28.3 million and $25.3 million for the years ended December 31,2018, 2017 and 2016, respectively.
84

Table of Contents
NOTE 13. GOODWILL AND INTANGIBLE ASSETS
Changes in goodwill for the years ended December 31, 2018 and 2017 were as follows:
Field & Environmental Industrial
Services Services Accumulated Accumulated $s in thousands Gross Impairment Gross Impairment TotalBalance at December 31, 2016 $ 149,490 $ — $ 44,131 $ — $ 193,621
Impairment charges — (5,457) — — (5,457)Foreign currency translation and other adjustments 1,209 — — — 1,209
Balance at December 31, 2017 $ 150,699 $ (5,457) $ 44,131 $ — $ 189,373ES&H Dallas acquisition — — 7,100 — 7,100Winnie acquisition 13,573 — — — 13,573Impairment charges — (1,413) — — (1,413)Foreign currency translation (1,456) — — — (1,456)
Balance at December 31, 2018 $ 162,816 $ (6,870) $ 51,231 $ — $ 207,177 We assess goodwill for impairment during the fourth quarter as of October 1 of each year, and also if an event occurs orcircumstances change that would more likely than not reduce the fair value of a reporting unit below its carrying amount. Theassessment consists of comparing the fair value of the reporting unit to the carrying value of the net assets assigned to thereporting unit, including goodwill.
Fair values are generally determined by using a market approach, applying a multiple of earnings based on guideline for publiclytraded companies, an income approach, discounting projected future cash flows based on our expectations of the current andfuture operating environment, or a combination thereof. Estimating future cash flows requires significant judgment about factorssuch as general economic conditions and projected growth rates, and our estimates often vary from the cash flows eventuallyrealized. The rates used to discount projected future cash flows reflect a weighted average cost of capital based on our industry,capital structure and risk premiums including those reflected in the current market capitalization.
In connection with our annual budgeting process commencing in the third quarter of 2018 and review of the projected future cashflows of our reporting units used in our annual assessment of goodwill, it was determined that the projected future cash flows ofour Mobile Recycling reporting unit (described below), which is part of our Environmental Services segment, indicated that thefair value of the reporting unit may be below its carrying amount. Accordingly, we performed an interim assessment of thereporting unit’s goodwill as of September 30, 2018. Based on the results of that assessment, goodwill was deemed impaired andwe recognized an impairment charge of $1.4 million in the third quarter of 2018, representing the reporting unit’s entire goodwillbalance. Our Mobile Recycling reporting unit operates a fleet of mobile solvent recycling stills that provide on-site recycling servicesthroughout the Eastern United States. The factors contributing to the $1.4 million goodwill impairment charge principally relatedto declining business and cash flows, which negatively impacted the reporting unit’s prospective
85
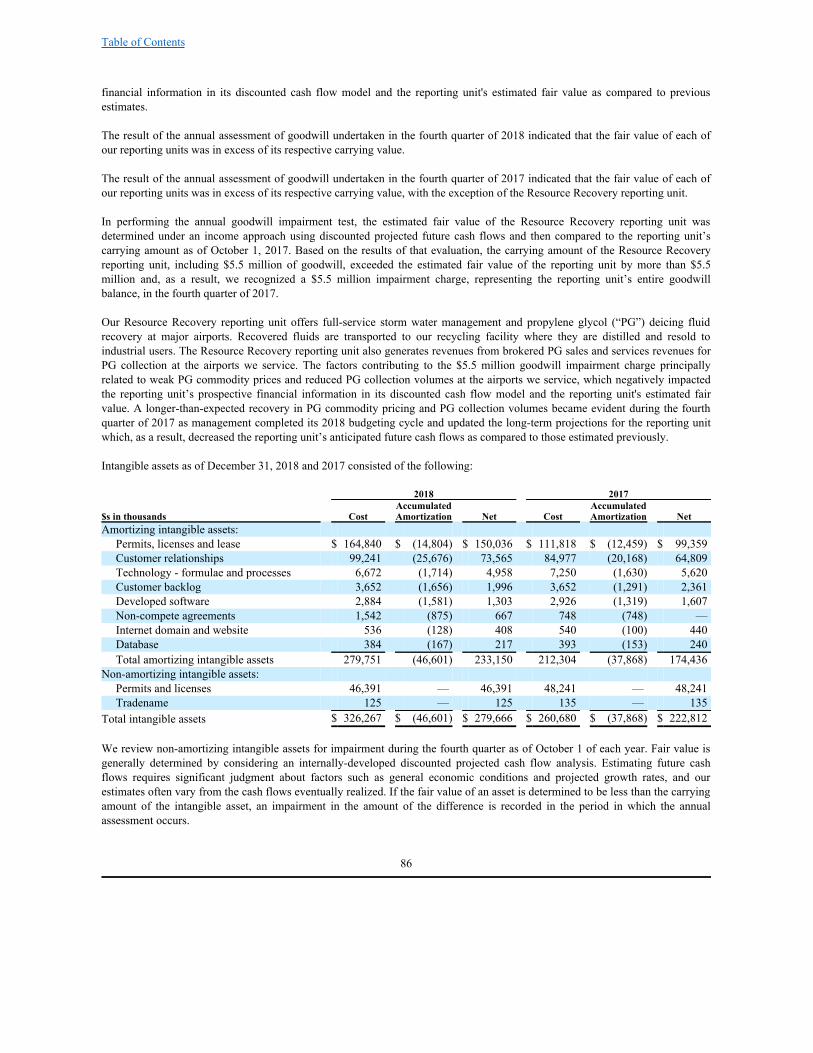
Table of Contents
financial information in its discounted cash flow model and the reporting unit's estimated fair value as compared to previousestimates.
The result of the annual assessment of goodwill undertaken in the fourth quarter of 2018 indicated that the fair value of each ofour reporting units was in excess of its respective carrying value.
The result of the annual assessment of goodwill undertaken in the fourth quarter of 2017 indicated that the fair value of each ofour reporting units was in excess of its respective carrying value, with the exception of the Resource Recovery reporting unit.
In performing the annual goodwill impairment test, the estimated fair value of the Resource Recovery reporting unit wasdetermined under an income approach using discounted projected future cash flows and then compared to the reporting unit’scarrying amount as of October 1, 2017. Based on the results of that evaluation, the carrying amount of the Resource Recoveryreporting unit, including $5.5 million of goodwill, exceeded the estimated fair value of the reporting unit by more than $5.5million and, as a result, we recognized a $5.5 million impairment charge, representing the reporting unit’s entire goodwillbalance, in the fourth quarter of 2017.
Our Resource Recovery reporting unit offers full-service storm water management and propylene glycol (“PG”) deicing fluidrecovery at major airports. Recovered fluids are transported to our recycling facility where they are distilled and resold toindustrial users. The Resource Recovery reporting unit also generates revenues from brokered PG sales and services revenues forPG collection at the airports we service. The factors contributing to the $5.5 million goodwill impairment charge principallyrelated to weak PG commodity prices and reduced PG collection volumes at the airports we service, which negatively impactedthe reporting unit’s prospective financial information in its discounted cash flow model and the reporting unit's estimated fairvalue. A longer-than-expected recovery in PG commodity pricing and PG collection volumes became evident during the fourthquarter of 2017 as management completed its 2018 budgeting cycle and updated the long-term projections for the reporting unitwhich, as a result, decreased the reporting unit’s anticipated future cash flows as compared to those estimated previously.
Intangible assets as of December 31, 2018 and 2017 consisted of the following:
2018 2017 Accumulated Accumulated $s in thousands Cost Amortization Net Cost Amortization NetAmortizing intangible assets:
Permits, licenses and lease $ 164,840 $ (14,804) $ 150,036 $ 111,818 $ (12,459) $ 99,359Customer relationships 99,241 (25,676) 73,565 84,977 (20,168) 64,809Technology - formulae and processes 6,672 (1,714) 4,958 7,250 (1,630) 5,620Customer backlog 3,652 (1,656) 1,996 3,652 (1,291) 2,361Developed software 2,884 (1,581) 1,303 2,926 (1,319) 1,607Non-compete agreements 1,542 (875) 667 748 (748) —Internet domain and website 536 (128) 408 540 (100) 440Database 384 (167) 217 393 (153) 240Total amortizing intangible assets 279,751 (46,601) 233,150 212,304 (37,868) 174,436
Non-amortizing intangible assets: Permits and licenses 46,391 — 46,391 48,241 — 48,241Tradename 125 — 125 135 — 135
Total intangible assets $ 326,267 $ (46,601) $ 279,666 $ 260,680 $ (37,868) $ 222,812 We review non-amortizing intangible assets for impairment during the fourth quarter as of October 1 of each year. Fair value isgenerally determined by considering an internally-developed discounted projected cash flow analysis. Estimating future cashflows requires significant judgment about factors such as general economic conditions and projected growth rates, and ourestimates often vary from the cash flows eventually realized. If the fair value of an asset is determined to be less than the carryingamount of the intangible asset, an impairment in the amount of the difference is recorded in the period in which the annualassessment occurs.
86

Table of Contents
In connection with the interim goodwill impairment assessment of the Mobile Recycling reporting unit, we also assessed thereporting unit’s non-amortizing permit intangible asset and other amortizing tangible and intangible assets for impairment as ofSeptember 30, 2018. Based on the results of that assessment, the carrying amounts of the non-amortizing permit intangible assetand other amortizing intangible assets exceeded their estimated fair values and, as a result, we recognized a $2.3 millionimpairment charge in the third quarter of 2018. The factors and timing contributing to the non-amortizing intangible asset and theother amortizing intangible assets impairment charges were the same as the factors and timing described above with regards to theMobile Recycling reporting unit goodwill impairment charge.
The result of the annual assessment of non-amortizing intangible assets undertaken in the fourth quarter of 2018 indicated noimpairment charges were required.
On August 31, 2018, the Company acquired ES&H Dallas and recorded $7.1 million of goodwill and $4.2 million of amortizingintangible assets (consisting primarily of customer relationships) as a result of the acquisition. See Note 5 for additionalinformation.
On November 14, 2018, the Company acquired Winnie and recorded $13.6 million of goodwill and $66.6 million of amortizingintangible assets (consisting of permits and customer relationships) as a result of the acquisition. See Note 5 for additionalinformation.
The result of the annual assessment of non-amortizing intangible assets undertaken in the fourth quarter of 2017 indicated noimpairment charges were required, with the exception of the non-amortizing intangible waste collection, recycling and resalepermit associated with our Resource Recovery business.
In performing the annual non-amortizing intangible assets impairment test, the estimated fair value of the Resource Recoverywaste collection, recycling and resale permit was determined under an income approach using discounted projected future cashflows associated with the permit and then compared to the $3.7 million carrying amount of the permit as of October 1, 2017.Based on the results of that evaluation, the carrying amount of the permit exceeded the estimated fair value of the permit and, as aresult, we recognized a $3.4 million impairment charge in the fourth quarter of 2017. The factors and timing contributing to thenon-amortizing permit impairment charge were the same as the factors and timing described above with regards to the ResourceRecovery reporting unit goodwill impairment charge.
In the fourth quarter of 2017, we performed an assessment of the Resource Recovery business’ amortizing tangible and intangibleassets, as events indicated their carrying values may not be recoverable. The result of the assessment indicated no impairmentcharges were required.
Amortization expense relating to intangible assets was $9.6 million, $9.9 million and $10.6 million for the years ended December31, 2018, 2017 and 2016, respectively. Foreign intangible asset carrying amounts are affected by foreign currency translation.Future amortization expense of amortizing intangible assets is expected to be as follows:
Expected$s in thousands Amortization2019 $ 11,4062020 11,2732021 11,0062022 11,0062023 10,850Thereafter 177,609 $ 233,150
87

Table of Contents
NOTE 14. EMPLOYEE BENEFIT PLANS
Defined Contribution Plans
We maintain the US Ecology, Inc., 401(k) Savings and Retirement Plan (“the Plan”) for employees who voluntarily contribute aportion of their compensation, thereby deferring income for federal income tax purposes. The Plan covers substantially all of ouremployees in the United States. Participants may contribute a percentage of salary up to the IRS limitations. The Companycontributes a matching contribution equal to 55% of participant contributions up to 6% of eligible compensation. The Companycontributed matching contributions to the Plan of $2.5 million, $2.1 million and $1.9 million in 2018, 2017 and 2016,respectively.
We also maintain the Stablex Canada Inc. Simplified Pension Plan (“the SPP”). This defined contribution plan coverssubstantially all of our employees at our Blainville, Québec facility in Canada. Employees represented by the Communications,Energy and Paperworkers Union of Canada receive a Company contribution equal to 8.5% of eligible compensation. Employeesnot represented by the union receive a base Company contribution equal to 5% of eligible compensation and an additionalmatching contribution in an amount up to 2% of eligible compensation. The Company contributed $653,000, $556,000 and$507,000 to the SPP in 2018, 2017 and 2016, respectively.
Multi-Employer Defined Benefit Pension Plans
Certain of the Company’s wholly-owned subsidiaries participate in three multi-employer defined benefit pension plans under theterms of collective bargaining agreements covering most of the subsidiaries’ union employees. Contributions are determined inaccordance with the provisions of negotiated labor contracts and are generally based on stipulated rates per hours worked.Benefits under these plans are generally based on compensation levels and years of service.
The financial risks of participating in multi-employer plans are different from single employer defined benefit pension plans inthe following respects:
· Assets contributed to the multi-employer plan by one employer may be used to provide benefits to employees of otherparticipating employers.
· If a participating employer discontinues contributions to a plan, the unfunded obligations of the plan may be borne by theremaining participating employers.
· If a participating employer chooses to stop participating in a plan, a withdrawal liability may be created based on theunfunded vested benefits for all employees in the plan.
Information regarding significant multi-employer pension benefit plans in which the Company participates is shown in thefollowing table:
Pension Protection Act
Certified Plan Employer Plan Zone Status
Name of Plan ID Number Number 2018 2017Operating Engineers Local 324 Pension Fund 38-1900637 001 Red Red The Company contributed $1.0 million to the Operating Engineers Local 324 Pension Fund (the “Local 324 Plan”) in both 2018and 2017. The Company also contributed $242,000 and $217,000 to other multi-employer plans in 2018 and 2017, respectively,which are excluded from the table above as they are not individually significant.
Based on information as of April 30, 2018 and 2017, the year end of the Local 324 Plan, the Company's contributions made to theLocal 324 Plan represented less than 5% of total contributions received by the Local 324 Plan during the 2018 and 2017 planyears.
88

Table of Contents
The certified zone status in the table above is defined by the Department of Labor and the Pension Protection Act of 2006 andrepresents the level at which the plan is funded. Plans in the red zone are less than 65% funded; plans in the yellow zone are lessthan 80% funded; and plans in the green zone are at least 80% funded. The certified zone status is as of the Local 324 Plan's yearend of April 30, 2018 and 2017.
A financial improvement or rehabilitation plan, as defined under ERISA, was adopted by the Local 324 Plan on March 17, 2011and the Rehabilitation Period began May 1, 2013.
As of December 31, 2018, 143 employees were employed under union collective bargaining agreements with the Local 324Operating Engineers union. Our three remaining collective bargaining agreements expire on November 30, 2020, April 30, 2022and December 31, 2023.
NOTE 15. CLOSURE AND POST‑‑CLOSURE OBLIGATIONS
Our accrued closure and post-closure liability represents the expected future costs, including corrective actions, associated withclosure and post-closure of our operating and non-operating disposal facilities. We record the fair value of our closure and post-closure obligations as a liability in the period in which the regulatory obligation to retire a specific asset is triggered. For ourindividual landfill cells, the required closure and post-closure obligations under the terms of our permits and our intendedoperation of the landfill cell are triggered and recorded when the cell is placed into service and waste is initially disposed in thelandfill cell. The fair value is based on the total estimated costs to close the landfill cell and perform post-closure activities oncethe landfill cell has reached capacity and is no longer accepting waste. We perform periodic reviews of both non-operating andoperating facilities and revise accruals for estimated closure and post-closure, remediation or other costs as necessary. Recordedliabilities are based on our best estimates of current costs and are updated periodically to include the effects of existingtechnology, presently enacted laws and regulations, inflation and other economic factors.
We do not presently bear significant financial responsibility for closure and/or post-closure care of the disposal facilities locatedon state-owned land at our Beatty, Nevada site; Provincial-owned land in Blainville, Québec; or state-leased federal land on theDepartment of Energy Hanford Reservation near Richland, Washington. The States of Nevada and Washington and the Provinceof Québec collect fees from us based on the waste received on a quarterly or annual basis. Such fees are deposited in dedicated,government-controlled funds to cover the future costs of closure and post-closure care and maintenance. Such fees areperiodically reviewed for adequacy by the governmental authorities. We also maintain a surety bond for closure costs associatedwith the Stablex facility. Our lease agreement with the Province of Québec requires that the surety bond be maintained for25 years after the lease expires. At December 31, 2018 we had $715,000 in commercial surety bonds dedicated for closureobligations.
In accounting for closure and post-closure obligations, which represent our asset retirement obligations, we recognize a liabilityas part of the fair value of future asset retirement obligations and an associated asset as part of the carrying amount of theunderlying asset. This obligation is valued based on our best estimates of current costs and current estimated closure and post-closure costs taking into account current technology, material and service costs, laws and regulations. These cost estimates areincreased by an estimated inflation rate, estimated to be 2.6% at December 31, 2018. Inflated current costs are then discountedusing our credit‑adjusted risk‑free interest rate, which approximates our incremental borrowing rate, in effect at the time theobligation is established or when there are upward revisions to our estimated closure and post‑closure costs. Ourweighted‑average credit‑adjusted risk‑free interest rate at December 31, 2018 approximated 6.0%.
89

Table of Contents
Changes to reported closure and post‑closure obligations for the years ended December 31, 2018 and 2017, were as follows:
$s in thousands 2018 2017Closure and post-closure obligations, beginning of period $ 76,088 $ 75,082
Accretion expense 3,707 3,026Payments (1,388) (1,794)Adjustments 99 (352)Foreign currency translation (143) 126
Closure and post-closure obligations, end of period 78,363 76,088Less current portion (2,266) (2,330)Long-term portion $ 76,097 $ 73,758
Adjustment to the obligations represents changes in the expected timing or amount of cash expenditures based upon actual andestimated cash expenditures. The adjustments in 2018 were primarily attributable to a $1.1 million decrease in closure and post-closure obligations at our Grand View, Idaho operating facility due to a change in closure timing, partially offset by a $511,000increase to the obligation for the acquired deep-well at our Winnie facility and a $472,000 increase to the obligation at ourBelleville, Michigan operating facility due to changes in both estimated closure costs and closure timing. The adjustments in 2017were primarily attributable to an $897,000 decrease in closure and post-closure obligations at our Grand View, Idaho operatingfacility due to a change in closure timing, partially offset by a $545,000 increase to the obligation for our Blainville, Québec,Canada operating facility associated with a newly-constructed disposal cell.
Changes in the reported closure and post‑closure asset, recorded as a component of Property and equipment, net, in theconsolidated balance sheets, for the years ended December 31, 2018 and 2017 were as follows:
$s in thousands 2018 2017Net closure and post-closure asset, beginning of year $ 20,495 $ 22,408
Additions or adjustments to closure and post-closure asset 99 (352)Amortization of closure and post-closure asset (805) (1,757)Foreign currency translation (279) 196
Net closure and post-closure asset, end of year $ 19,510 $ 20,495
NOTE 16. DEBT
Long-term debt consisted of the following:
December 31, $s in thousands 2018 2017Revolving credit facility $ 364,000 $ 277,000Long-term debt $ 364,000 $ 277,000
90

Table of Contents
Future maturities of long-term debt, excluding unamortized discount and debt issuance costs, as of December 31, 2018 consist ofthe following:
$s in thousands Maturities2019 $ —2020 —2021 —2022 364,0002023 —Thereafter — $ 364,000
2017 Credit Agreement On April 18, 2017, the Company entered into a new senior secured credit agreement (the “2017 Credit Agreement”) with WellsFargo Bank, National Association (“Wells Fargo”), as administrative agent for the lenders, swingline lender and issuing lender,and Bank of America, N.A., as an issuing lender, that provides for a $500.0 million, five-year revolving credit facility (the“Revolving Credit Facility”), including a $75.0 million sublimit for the issuance of standby letters of credit and a $25.0 millionsublimit for the issuance of swingline loans used to fund short-term working capital requirements. The 2017 Credit Agreementalso contains an accordion feature whereby the Company may request up to $200.0 million of additional funds through anincrease to the Revolving Credit Facility, through incremental term loans, or some combination thereof. In connection with theCompany’s entry into the 2017 Credit Agreement, the Company terminated its existing credit agreement with Wells Fargo, datedJune 17, 2014 (the “2014 Credit Agreement”). Immediately prior to the termination of the 2014 Credit Agreement, there were$278.3 million of term loans and no revolving loans outstanding under the 2014 Credit Agreement. No early termination penaltieswere incurred as a result of the termination of the 2014 Credit Agreement. The Company wrote off certain unamortized deferredfinancing costs and original issue discount associated with the 2014 Credit Agreement that were to be amortized to interestexpense in future periods through a one-time non-cash charge of $5.5 million to interest expense in the second quarter of 2017. The Revolving Credit Facility provides up to $500.0 million of revolving credit loans or letters of credit with the use of proceedsrestricted solely for working capital and other general corporate purposes (including acquisitions and capital expenditures). Underthe Revolving Credit Facility, revolving credit loans are available based on a base rate (as defined in the 2017 Credit Agreement)or LIBOR, at the Company’s option, plus an applicable margin which is determined according to a pricing grid under which theinterest rate decreases or increases based on our ratio of funded debt to consolidated earnings before interest, taxes, depreciationand amortization (as defined in the 2017 Credit Agreement), as set forth in the table below:
Total Net Leverage Ratio
LIBOR RateLoans Interest
MarginBase Rate LoansInterest Margin
Equal to or greater than 3.25 to 1.00 2.00% 1.00%Equal to or greater than 2.50 to 1.00, but less than 3.25 to 1.00 1.75% 0.75%Equal to or greater than 1.75 to 1.00, but less than 2.50 to 1.00 1.50% 0.50%Equal to or greater than 1.00 to 1.00, but less than 1.75 to 1.00 1.25% 0.25%Less than 1.00 to 1.00 1.00% 0.00%
At December 31, 2018, the effective interest rate on the Revolving Credit Facility, after giving effect to the impact of our interestrate swap, was 3.53%. Interest only payments are due either quarterly or on the last day of any interest period, as applicable. In October 2014, the Company entered into an interest rate swap agreement, effectively fixing the interest rate on $170.0 million,or 47%, of the Revolving Credit Facility borrowings as of December 31, 2018. The interest rate swap agreement continued inplace following the termination of the 2014 Credit Agreement. The critical terms of the interest rate swap and the forecastedtransaction (periodic interest payments on the Company’s variable-rate debt) did not change as a result of
91
Table of Contents
the refinancing therefore the interest rate swap continues to qualify as a highly-effective cash flow hedge, with gains and lossesdeferred in accumulated other comprehensive income to be recognized as an adjustment to interest expense in the same periodthat the hedged interest payments affect earnings. The Company is required to pay a commitment fee ranging from 0.175% to 0.35% on the average daily unused portion of theRevolving Credit Facility, with such commitment fee to be reduced based upon the Company’s total net leverage ratio (as definedin the 2017 Credit Agreement). The maximum letter of credit capacity under the Revolving Credit Facility is $75.0 million andthe 2017 Credit Agreement provides for a letter of credit fee equal to the applicable margin for LIBOR loans under the RevolvingCredit Facility. At December 31, 2018, there were $364.0 million of revolving credit loans outstanding on the Revolving CreditFacility. These revolving credit loans are due upon the earliest to occur of (a) April 18, 2022 (or, with respect to any lender, suchlater date as requested by us and accepted by such lender), (b) the date of termination of the entire revolving credit commitment(as defined in the 2017 Credit Agreement) by us, and (c) the date of termination of the revolving credit commitment and arepresented as long-term debt in the consolidated balance sheets. The Company has entered into a sweep arrangement whereby day-to-day cash requirements in excess of available cash balancesare advanced to the Company on an as-needed basis with repayments of these advances automatically made from subsequentdeposits to our cash operating accounts (the “Sweep Arrangement”). Total advances outstanding under the Sweep Arrangementare subject to the $25.0 million swingline loan sublimit under the Revolving Credit Facility. The Company’s revolving creditloans outstanding under the Revolving Credit Facility are not subject to repayment through the Sweep Arrangement. As ofDecember 31, 2018, there were no amounts outstanding subject to the Sweep Arrangement. As of December 31, 2018, the availability under the Revolving Credit Facility was $130.3 million with $5.7 million of theRevolving Credit Facility issued in the form of standby letters of credit utilized as collateral for closure and post-closure financialassurance and other assurance obligations. The Company may at any time and from time to time prepay revolving credit loans and swingline loans, in whole or in part,without premium or penalty, subject to the obligation to indemnify each of the lenders against any actual loss or expense(including any loss or expense arising from the liquidation or reemployment of funds obtained by it to maintain a LIBOR rateloan (as defined in the 2017 Credit Agreement) or from fees payable to terminate the deposits from which such funds wereobtained) with respect to the early termination of any LIBOR rate loan. The 2017 Credit Agreement provides for mandatoryprepayment at any time if the revolving credit outstanding exceeds the revolving credit commitment (as such terms are defined inthe 2017 Credit Agreement), in an amount equal to such excess. Subject to certain exceptions, the 2017 Credit Agreementprovides for mandatory prepayment upon certain asset dispositions, casualty events and issuances of indebtedness. Pursuant to (i) an unconditional guarantee agreement and (ii) a collateral agreement, each entered into by the Company and itsdomestic subsidiaries on April 18, 2017, the Company’s obligations under the 2017 Credit Agreement are (or will be) jointly andseverally and fully and unconditionally guaranteed on a senior basis by all of the Company’s existing and certain future domesticsubsidiaries and are secured by substantially all of the assets of the Company and the Company’s existing and certain futuredomestic subsidiaries (subject to certain exclusions), including 100% of the equity interests of the Company’s domesticsubsidiaries and 65% of the voting equity interests of the Company’s directly owned foreign subsidiaries (and 100% of the non-voting equity interests of the Company’s directly owned foreign subsidiaries). The 2017 Credit Agreement contains customary restrictive covenants, subject to certain permitted amounts and exceptions,including covenants limiting the ability of the Company to incur additional indebtedness, pay dividends and make other restrictedpayments, repurchase shares of our outstanding stock and create certain liens. Upon the occurrence of an event of default (asdefined in the 2017 Credit Agreement), among other things, amounts outstanding under the 2017 Credit Agreement may beaccelerated and the commitments may be terminated. The 2017 Credit Agreement also contains financial maintenance covenants, a maximum consolidated total net leverage ratio and aconsolidated interest coverage ratio (as such terms are defined in the 2017 Credit Agreement). Our consolidated total net leverageratio as of the last day of any fiscal quarter, commencing with the fiscal quarter ending June 30, 2017, may not exceed 3.50 to1.00, subject to certain exceptions. Our consolidated interest coverage ratio as of the last day of any fiscal quarter, commencingwith the fiscal quarter ending June 30, 2017, may not be less than 3.00 to 1.00.
92

Table of Contents
At December 31, 2018, we were in compliance with all of the financial covenants in the 2017 Credit Agreement. 2014 Credit Agreement On June 17, 2014, the Company entered into a $540.0 million senior secured credit agreement with a syndicate of bankscomprised of a $415.0 million term loan (the “Former Term Loan”) with a maturity date of June 17, 2021 and a $125.0 millionrevolving line of credit (the “Former Revolving Credit Facility”) with a maturity date of June 17, 2019. The Former Term Loan provided an initial commitment amount of $415.0 million and bore interest at a base rate (as defined inthe 2014 Credit Agreement) plus 2.00% or LIBOR plus 3.00%, at the Company’s option. The Former Revolving Credit Facility provided up to $125.0 million of revolving credit loans or letters of credit with the use ofproceeds restricted solely for working capital and other general corporate purposes. Under the Former Revolving Credit Facility,revolving loans were available based on a base rate (as defined in the 2014 Credit Agreement) or LIBOR, at the Company’soption, plus an applicable margin which was determined according to a pricing grid under which the interest rate decreased orincreased based on our ratio of funded debt to consolidated earnings before interest, taxes, depreciation and amortization (asdefined in the 2014 Credit Agreement). The maximum letter of credit capacity under the Former Revolving Credit Facility was$50.0 million and the 2014 Credit Agreement provided for a letter of credit fee equal to the applicable margin for LIBOR loansunder the Former Revolving Credit Facility.
NOTE 17. INCOME TAXES
The domestic and foreign components of income (loss) before income taxes consisted of the following:
$s in thousands 2018 2017 2016Domestic $ 46,147 $ 26,051 $ 47,859Foreign 18,711 16,919 7,442Income before income taxes $ 64,858 $ 42,970 $ 55,301
The components of the income tax expense (benefit) consisted of the following:
$s in thousands 2018 2017 2016Current:
U.S. Federal $ 2,239 $ 11,157 $ 17,866State 2,368 2,482 3,324Foreign 4,746 5,398 2,459
Total current 9,353 19,037 23,649Deferred:
U.S. Federal 5,675 (27,029) (1,790)State 172 2,323 (275)Foreign 63 (726) (535)
Total deferred 5,910 (25,432) (2,600)Income tax (benefit) expense $ 15,263 $ (6,395) $ 21,049
On December 22, 2017, the Tax Act was signed into law making significant changes to the Internal Revenue Code. Changesinclude, but are not limited to, a corporate tax rate decrease from 35% to 21% effective for tax years beginning after December31, 2017, the transition of U.S. international taxation from a worldwide tax system to a territorial system, and a one-timetransition tax on the mandatory deemed repatriation of cumulative foreign earnings as of December 31, 2017. In accordance withthe Tax Act, we recorded $23.8 million as additional income tax benefit in the fourth quarter of 2017, the period in which thelegislation was enacted. The total benefit included $25.2 million related to the re-measurement of certain deferred tax assets andliabilities partially offset by $1.4 million of expense related to one-time transition tax on the mandatory deemed repatriation offoreign earnings. Additionally, Staff Accounting Bulletin No. 118 (“SAB 118”) was issued to address the application of U.S.GAAP in situations when a registrant does not have the
93

Table of Contents
necessary information available, prepared, or analyzed (including computations) in reasonable detail to complete the accountingfor certain income tax effects of the Tax Act. December 22, 2018 marked the end of the measurement period for purposes ofSAB 118. As such, we have completed our analysis based on legislative updates relating to the Tax Act currently available, whichresulted in a net benefit for measurement period adjustments of $193,000 for the year ended December 31, 2018. The total taxprovision benefit included a $2.2 million benefit related to the re-measurement of certain deferred tax assets and liabilities offsetby $2.0 million of expense related to adjustments to the transition tax.
A reconciliation between the effective income tax rate and the applicable statutory federal and state income tax rate is as follows:
2018 2017 2016 Taxes computed at statutory rate 21.0 % 35.0 % 35.0 %Impairment and loss on divestiture 0.5 4.4 — State income taxes (net of federal income tax benefit) 5.1 2.9 3.3 Share-based compensation (1.3) — — Research and development credits (2.0) — — Non-deductible transaction costs — — 0.2 Tax Cuts and Jobs Act of 2017 (0.3) (55.4) — Foreign rate differential 1.7 (2.9) (1.1) Other (1.2) 1.1 0.7 23.5 % (14.9)% 38.1 %
The components of the total net deferred tax assets and liabilities as of December 31, 2018 and 2017 consisted of the following:
$s in thousands 2018 2017Deferred tax assets:
Net operating loss, foreign tax credit and capital loss carry forwards $ 5,165 $ 2,493Accruals, allowances and other 5,041 3,603Environmental compliance and other site related costs 8,580 8,549Unrealized foreign exchange gains and losses 1,550 1,120Unrealized gains and losses on interest rate hedge — 134
Total deferred tax assets 20,336 15,899Less: valuation allowance (4,791) (2,242)
Net deferred tax assets 15,545 13,657Deferred tax liabilities:
Property and equipment (26,145) (18,386)Intangible assets (51,081) (51,575)Unrealized gains and losses on interest rate hedge (241) —Other (1,284) (1,279)
Total deferred tax liabilities (78,751) (71,240)Net deferred tax liability $ (63,206) $ (57,583)
All deferred tax assets and liabilities are recorded in Deferred income taxes, net on the consolidated balance sheets as ofDecember 31, 2018 and 2017. In evaluating its ability to realize the deferred tax assets, the Company considered all availablepositive and negative evidence, including its past operating results and the forecast of future market growth, forecasted earnings,future taxable income, and prudent and feasible tax planning strategies.
As of December 31, 2018, we have no federal NOLs available to offset future income, and have approximately $7.7 million instate and local NOLs for which we maintain a substantial valuation allowance. We have historically recorded a valuationallowance for certain deferred tax assets due to uncertainties regarding future operating results and limitations on utilization ofstate and local NOLs for tax purposes. State and local NOLs expire between 2019 and 2036. At December 31, 2018 and 2017, wemaintained a valuation allowance of approximately $73,000 and $182,000, respectively, for state NOLs that are not expected tobe utilizable prior to expiration.
94
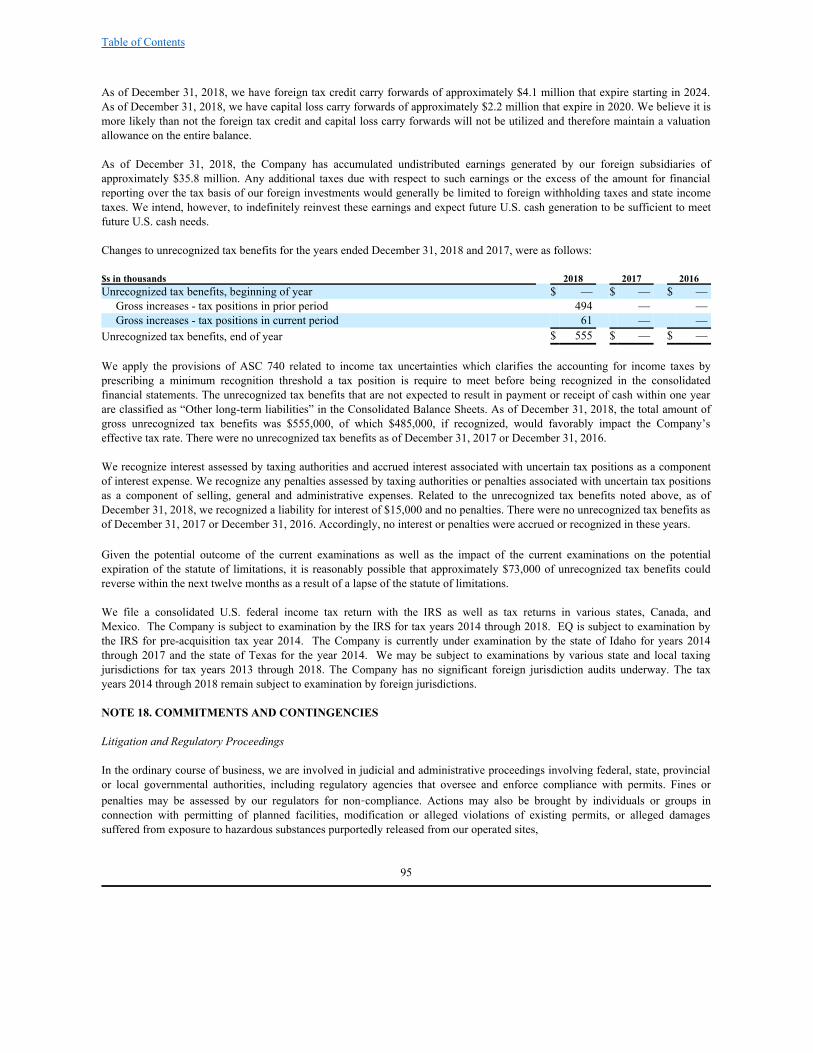
Table of Contents
As of December 31, 2018, we have foreign tax credit carry forwards of approximately $4.1 million that expire starting in 2024.As of December 31, 2018, we have capital loss carry forwards of approximately $2.2 million that expire in 2020. We believe it ismore likely than not the foreign tax credit and capital loss carry forwards will not be utilized and therefore maintain a valuationallowance on the entire balance.
As of December 31, 2018, the Company has accumulated undistributed earnings generated by our foreign subsidiaries ofapproximately $35.8 million. Any additional taxes due with respect to such earnings or the excess of the amount for financialreporting over the tax basis of our foreign investments would generally be limited to foreign withholding taxes and state incometaxes. We intend, however, to indefinitely reinvest these earnings and expect future U.S. cash generation to be sufficient to meetfuture U.S. cash needs.
Changes to unrecognized tax benefits for the years ended December 31, 2018 and 2017, were as follows:
$s in thousands 2018 2017 2016Unrecognized tax benefits, beginning of year $ — $ — $ —
Gross increases - tax positions in prior period 494 — —Gross increases - tax positions in current period 61 — —
Unrecognized tax benefits, end of year $ 555 $ — $ — We apply the provisions of ASC 740 related to income tax uncertainties which clarifies the accounting for income taxes byprescribing a minimum recognition threshold a tax position is require to meet before being recognized in the consolidatedfinancial statements. The unrecognized tax benefits that are not expected to result in payment or receipt of cash within one yearare classified as “Other long-term liabilities” in the Consolidated Balance Sheets. As of December 31, 2018, the total amount ofgross unrecognized tax benefits was $555,000, of which $485,000, if recognized, would favorably impact the Company’seffective tax rate. There were no unrecognized tax benefits as of December 31, 2017 or December 31, 2016.
We recognize interest assessed by taxing authorities and accrued interest associated with uncertain tax positions as a componentof interest expense. We recognize any penalties assessed by taxing authorities or penalties associated with uncertain tax positionsas a component of selling, general and administrative expenses. Related to the unrecognized tax benefits noted above, as ofDecember 31, 2018, we recognized a liability for interest of $15,000 and no penalties. There were no unrecognized tax benefits asof December 31, 2017 or December 31, 2016. Accordingly, no interest or penalties were accrued or recognized in these years. Given the potential outcome of the current examinations as well as the impact of the current examinations on the potentialexpiration of the statute of limitations, it is reasonably possible that approximately $73,000 of unrecognized tax benefits couldreverse within the next twelve months as a result of a lapse of the statute of limitations.
We file a consolidated U.S. federal income tax return with the IRS as well as tax returns in various states, Canada, andMexico. The Company is subject to examination by the IRS for tax years 2014 through 2018. EQ is subject to examination bythe IRS for pre-acquisition tax year 2014. The Company is currently under examination by the state of Idaho for years 2014through 2017 and the state of Texas for the year 2014. We may be subject to examinations by various state and local taxingjurisdictions for tax years 2013 through 2018. The Company has no significant foreign jurisdiction audits underway. The taxyears 2014 through 2018 remain subject to examination by foreign jurisdictions.
NOTE 18. COMMITMENTS AND CONTINGENCIES
Litigation and Regulatory Proceedings
In the ordinary course of business, we are involved in judicial and administrative proceedings involving federal, state, provincialor local governmental authorities, including regulatory agencies that oversee and enforce compliance with permits. Fines orpenalties may be assessed by our regulators for non‑compliance. Actions may also be brought by individuals or groups inconnection with permitting of planned facilities, modification or alleged violations of existing permits, or alleged damagessuffered from exposure to hazardous substances purportedly released from our operated sites,
95

Table of Contents
as well as other litigation. We maintain insurance intended to cover property and damage claims asserted as a result of ouroperations. Periodically, management reviews and may establish reserves for legal and administrative matters, or other feesexpected to be incurred in relation to these matters.
On November 17, 2018, an explosion occurred at our Grand View, Idaho facility, resulting in one employee fatality and injuriesto other employees. The incident severely damaged the facility’s primary waste-treatment building as well as surrounding wastehandling, waste storage, maintenance and administrative support structures, resulting in the closure of the entire facility thatremained in effect through January 2019. We resumed limited operations at our Grand View, Idaho facility in February 2019. Inaddition to initiating and conducting our own investigation into the incident, we are fully cooperating with IDEQ, the USEPA andthe Occupational Safety and Health Administration’s (“OSHA”) to support their comprehensive and independent investigations ofthe incident. As we continue to investigate the cause of the incident, we are evaluating its impact, but, at this time, we are unableto predict the timing and outcome of the investigation. As such, we cannot presently estimate the potential liability, if any, relatedto the incident therefore no amounts related to such claims have been recorded in our financial statements as of December 31,2018. We have not been named as a defendant in any action relating to the incident. We maintain workers’ compensationinsurance, business interruption insurance and liability insurance for personal injury, property and casualty damage. We believethat any potential third-party claims associated with the explosion, in excess of our deductibles, are expected to be resolvedprimarily through our insurance policies. Although we carry business interruption insurance, a disruption of our business causedby a casualty event, including the full and partial closure of our Grand View, Idaho facility, may result in the loss of business,profits or customers during the time of such closure. Accordingly, our insurance policies may not fully compensate us for theselosses. Other than as described above, we are not currently a party to any material pending legal proceedings and are not aware of anyother claims that could, individually or in the aggregate, have a materially adverse effect on our financial position, results ofoperations or cash flows.
Operating Leases
Lease agreements primarily cover railcars, the disposal site at our Stablex facility and corporate office space. Future minimumlease payments on non-cancellable operating leases as of December 31, 2018 are as follows:
$s in thousands Payments2019 $ 5,6382020 3,6442021 3,1842022 1,8852023 1,457Thereafter 5,065 $ 20,873
Rental expense under operating leases was $7.4 million, $7.6 million and $7.8 million for the years ended December 31, 2018,2017 and 2016, respectively.
NOTE 19. EQUITY
Stock Repurchase Program
On June 1, 2016, the Company’s Board of Directors authorized the repurchase of $25.0 million of the Company’s outstandingcommon stock. Repurchases may be made from time to time in the open market or through privately negotiated transactions. Thetiming of any repurchases will be based upon prevailing market conditions and other factors. The Company did not repurchaseany shares of common stock under the repurchase program during 2018. On May 29, 2018, the repurchase program was extendedand will remain in effect until June 6, 2020, unless further extended by our Board of Directors.
96

Table of Contents
Omnibus Incentive Plan
On May 27, 2015, our stockholders approved the Omnibus Incentive Plan (“Omnibus Plan”), which was approved by our Boardof Directors on April 7, 2015. The Omnibus Plan was developed to provide additional incentives through equity ownership in USEcology and, as a result, encourage employees and directors to contribute to our success. The Omnibus Plan provides, amongother things, the ability for the Company to grant restricted stock, performance stock, options, stock appreciation rights, restrictedstock units, performance stock units and other share-based awards or cash awards to officers, employees, consultants and non-employee directors. Subsequent to the approval of the Omnibus Plan in May 2015, we stopped granting equity awards under our2008 Stock Option Incentive Plan and our 2006 Restricted Stock Plan (“Previous Plans”), and the Previous Plans will remain ineffect solely for the settlement of awards granted under the Previous Plans. No shares that are reserved but unissued under thePrevious Plans or that are outstanding under the Previous Plans and reacquired by the Company for any reason will be availablefor issuance under the Omnibus Plan. The Omnibus Plan expires on April 7, 2025 and authorizes 1,500,000 shares of commonstock for grant over the life of the Omnibus Plan. As of December 31, 2018, 1,012,001 shares of common stock remain availablefor grant under the Omnibus Plan.
Performance Stock Units (PSUs)
We have PSU awards outstanding under the Omnibus Plan. Each PSU represents the right to receive, on the settlement date, oneshare of the Company’s common stock. The total number of PSUs each participant is eligible to earn ranges from 0% to 200% ofthe target number of PSUs granted. The actual number of PSUs that will vest and be settled in shares is determined based on totalstockholder return relative to a set of peer companies, over a three-year performance period. Compensation expense is recordedover the awards' three-year vesting period.
A summary of our PSU activity is as follows:
Weighted Average Grant Date Units Fair ValueOutstanding as of December 31, 2017 30,963 $ 53.76
Granted 14,100 63.56Vested (5,863) 65.78Cancelled, expired or forfeited — —
Outstanding as of December 31, 2018 39,200 $ 55.48 The fair value of PSUs is estimated as of the date of grant using a Monte Carlo simulation model. The grant date fair value ofPSUs granted during 2018, 2017 and 2016 was $63.56, $62.45 and $41.22 per unit, respectively. Assumptions used in the MonteCarlo simulation to calculate the fair value of the PSUs granted are as follows:
2018 2017 2016 Stock price on grant date $ 51.00 $ 49.15 $ 35.05 Expected term 3.0 years 3.0 years 3.0 yearsExpected volatility 30 % 31 % 29 % Risk-free interest rate 2.0 % 1.5 % 1.3 % Expected dividend yield 1.4 % 1.5 % 2.1 %
During 2018, 5,863 PSUs vested and PSU holders earned 5,996 shares of the Company’s common stock.
Stock Options
We have stock option awards outstanding under the 2008 Stock Option Incentive Plan (“2008 Stock Option Plan”) and theOmnibus Plan. Subsequent to the approval of the Omnibus Plan in May 2015, we stopped granting equity awards under the 2008Stock Option Plan. The 2008 Stock Option Plan will remain in effect solely for the settlement of awards previously granted. Stockoptions expire ten years from the date of grant and vest over a period ranging from three to five years from the date of grant.Vesting requirements for non-employee directors are contingent on attending a minimum of
97

Table of Contents
75% of regularly scheduled board meetings during the year. Upon the exercise of stock options, common stock is issued fromtreasury stock or, when depleted, from new stock issuances.
A summary of our stock option activity is as follows:
Weighted Weighted Average Average Aggregate Remaining Exercise Intrinsic Contractual Shares Price Value Term (Years)Outstanding as of December 31, 2017 429,729 $ 38.58
Granted 40,900 51.00 Exercised (228,120) 34.12 Cancelled, expired or forfeited (6,006) 42.94
Outstanding as of December 31, 2018 236,503 $ 44.93 $ 4,269 7.1Exercisable as of December 31, 2018 127,851 $ 44.47 $ 2,367 6.3 The weighted average grant date fair value of all stock options granted during 2018, 2017 and 2016 was $11.64, $10.92 and $8.19per share, respectively. The total intrinsic value of stock options exercised during 2018, 2017 and 2016 was $6.6 million, $1.0million and $307,000, respectively. During 2018, option holders tendered 84,901 options in connection with options exercised vianet share settlement.
The fair value of each stock option is estimated as of the date of grant using the Black‑Scholes option‑pricing model. Expectedvolatility is estimated based on an average of actual historical volatility and implied volatility corresponding to the stock option’sestimated expected term. We believe this approach to determine volatility is representative of future stock volatility. The expectedterm of a stock option is estimated based on analysis of stock options already exercised and foreseeable trends or changes inbehavior. The risk‑free interest rates are based on the U.S. Treasury securities maturities as of each applicable grant date. Thedividend yield is based on analysis of actual historical dividend yield.
The significant weighted‑average assumptions relating to the valuation of each option grant are as follows:
2018 2017 2016 Expected life 3.8 years 3.8 years 3.8 yearsExpected volatility 30 % 31 % 31 %Risk-free interest rate 2.0 % 1.5 % 1.1 %Expected dividend yield 1.5 % 1.7 % 1.7 %
Restricted Stock
We have restricted stock awards outstanding under the Omnibus Plan. Generally, restricted stock awards vest annually over athree-year period. Vesting of restricted stock awards to non-employee directors is contingent on the non-employee directorattending a minimum of 75% of regularly scheduled board meetings and 75% of the meetings of each committee of which the non
‐employee director is a member during the year. Upon the vesting of restricted stock awards, common stock is issued from
treasury stock or, when depleted, from new stock issuances.
98

Table of Contents
A summary of our restricted stock activity is as follows:
Weighted Average Grant Date Shares Fair ValueOutstanding as of December 31, 2017 66,701 $ 44.83
Granted 32,700 53.24Vested (24,297) 50.23Cancelled, expired or forfeited (116) 49.97
Outstanding as of December 31, 2018 74,988 $ 46.74 The total fair value of restricted stock vested during 2018, 2017 and 2016 was $2.2 million, $868,000 and $1.4 million,respectively.
Restricted Stock Units
We have restricted stock unit awards outstanding under the Omnibus Plan. Each restricted stock unit represents the right toreceive, on the settlement date, one share of the Company’s common stock. Generally, restricted stock unit awards vest annuallyover a three-year period. Upon the vesting of restricted stock unit awards, common stock is issued from treasury stock or, whendepleted, from new stock issuances.
A summary of our restricted stock unit activity is as follows:
Weighted Average Grant Date Units Fair ValueOutstanding as of December 31, 2017 47,151 $ 45.56
Granted 39,674 59.19Vested (17,732) 44.90Cancelled, expired or forfeited (2,308) 47.30
Outstanding as of December 31, 2018 66,785 $ 53.77
The total fair value of restricted stock units vested during 2018 and 2017 was $967,000 and $314,000, respectively. No restrictedstock units vested in 2016.
Treasury Stock
During 2018, the Company issued 400 shares of restricted stock, under the Omnibus Plan, from our treasury stock at an averagecost of $26.43 per share and repurchased 5,564 shares of the Company's common stock in connection with the net sharesettlement of employee equity awards at an average cost of $56.20 per share.
Share‑Based Compensation Expense
All share‑based compensation is measured at the grant date based on the fair value of the award, and is recognized as an expensein earnings over the requisite service period. The components of pre‑tax share‑based compensation expense
99

Table of Contents
(primarily included in Selling, general and administrative expenses in our consolidated statements of operations) and related taxbenefits were as follows:
$s in thousands 2018 2017 2016Share-based compensation from:
Stock options $ 727 $ 1,141 $ 1,123Restricted stock 1,590 1,505 1,272Restricted stock units 1,324 716 216Performance stock units 725 571 314
Total share-based compensation 4,366 3,933 2,925Income tax benefit (1,027) (1,403) (1,113)
Share-based compensation, net of tax $ 3,339 $ 2,530 $ 1,812 The tax benefits from stock options exercised during 2018, 2017 and 2016 were $1.4 million, $129,000 and $83,000, respectively.
Unrecognized Share‑Based Compensation Expense
As of December 31, 2018, there was $5.5 million of unrecognized compensation expense related to unvested share‑based awardsgranted under our share‑based award plans. The expense is expected to be recognized over a weighted average remaining vestingperiod of approximately two years.
NOTE 20. EARNINGS PER SHARE
2018 2017 2016$s and shares in thousands, except per share amounts Basic Diluted Basic Diluted Basic DilutedNet income $ 49,595 $ 49,595 $ 49,365 $ 49,365 $ 34,252 $ 34,252Weighted average basic shares outstanding 21,888 21,888 21,758 21,758 21,704 21,704 Dilutive effect of share-based awards 159 144 85Weighted average diluted shares outstanding 22,047 21,902 21,789 Earnings per share $ 2.27 $ 2.25 $ 2.27 $ 2.25 $ 1.58 $ 1.57Anti-dilutive shares excluded from calculation 46 103 249
NOTE 21. SEGMENT REPORTING
Financial Information by Segment
Our operations are managed in two reportable segments reflecting our internal reporting structure and nature of services offeredas follows:
Environmental Services —This segment provides a broad range of hazardous material management services includingtransportation, recycling, treatment and disposal of hazardous, non‑hazardous and radioactive waste at Company‑ownedlandfill, wastewater, deep-well injection and other treatment facilities.
Field & Industrial Services —This segment provides packaging and collection of hazardous waste and total wastemanagement solutions at customer sites and through our 10‑day transfer facilities. Services include on‑site management,waste characterization, transportation and disposal of non‑hazardous and hazardous waste. This segment also providesspecialty field services such as industrial cleaning and maintenance, remediation, lab packs, retail services,transportation, emergency response and other services to commercial and industrial facilities and to government entities.
100

Table of Contents
The operations not managed through our two reportable segments are recorded as "Corporate." Corporate selling, general andadministrative expenses include typical corporate items such as legal, accounting and other items of a general corporate nature.Income taxes are assigned to Corporate, but all other items are included in the segment where they originated. Inter-companytransactions have been eliminated from the segment information and are not significant between segments.
Summarized financial information of our reportable segments for the years ended December 31, 2018, 2017 and 2016 is asfollows:
2018 Field & Environmental Industrial $s in thousands Services Services Corporate TotalRevenue $ 400,678 $ 165,250 $ — $ 565,928Depreciation, amortization and accretion $ 35,195 $ 6,304 $ 1,060 $ 42,559Capital expenditures $ 31,735 $ 7,430 $ 1,592 $ 40,757Total assets $ 701,267 $ 169,066 $ 77,565 $ 947,898
2017 Field & Environmental Industrial $s in thousands Services Services Corporate TotalRevenue $ 366,308 $ 137,734 $ — $ 504,042Depreciation, amortization and accretion $ 35,137 $ 5,578 $ 501 $ 41,216Capital expenditures $ 28,783 $ 4,206 $ 3,251 $ 36,240Total assets $ 609,174 $ 125,110 $ 67,792 $ 802,076
2016 Field & Environmental Industrial $s in thousands Services Services Corporate TotalRevenue $ 337,771 $ 139,894 $ — $ 477,665Depreciation, amortization and accretion $ 33,839 $ 5,481 $ 512 $ 39,832Capital expenditures $ 30,098 $ 2,572 $ 3,026 $ 35,696Total assets $ 599,300 $ 119,198 $ 57,902 $ 776,400 Management uses Adjusted EBITDA as a financial measure to assess segment performance. Adjusted EBITDA is defined as netincome before interest expense, interest income, income tax expense, depreciation, amortization, share-based compensation,accretion of closure and post‑closure liabilities, foreign currency gain/loss, non‑cash impairment charges, gain/loss on divestitureand other income/expense. Adjusted EBITDA is a complement to results provided in accordance with GAAP and we believe thatsuch information provides additional useful information to analysts, stockholders and other users to understand the Company’soperating performance. Since Adjusted EBITDA is not a measurement determined in accordance with GAAP and is thussusceptible to varying calculations, Adjusted EBITDA as presented may not be comparable to other similarly titled measures ofother companies. Items excluded from Adjusted EBITDA are significant components in understanding and assessing our financialperformance. Adjusted EBITDA should not be considered in isolation or as an alternative to, or substitute for, net income, cashflows generated by operations, investing or financing activities, or other financial statement data presented in the consolidatedfinancial statements as indicators of financial performance or liquidity. Adjusted EBITDA has limitations as an analytical tooland should not be considered in isolation or a substitute for analyzing our results as reported under GAAP. Some of thelimitations are:
· Adjusted EBITDA does not reflect changes in, or cash requirements for, our working capital needs;
· Adjusted EBITDA does not reflect our interest expense, or the requirements necessary to service interest or principalpayments on our debt;
· Adjusted EBITDA does not reflect our income tax expenses or the cash requirements to pay our taxes;
101

Table of Contents
· Adjusted EBITDA does not reflect our cash expenditures or future requirements for capital expenditures or contractualcommitments; and
· Although depreciation and amortization charges are non-cash charges, the assets being depreciated and amortized will oftenhave to be replaced in the future, and Adjusted EBITDA does not reflect any cash requirements for such replacements.
A reconciliation of Net income to Adjusted EBITDA for the years ended December 31, 2018, 2017 and 2016 is as follows:
$s in thousands 2018 2017 2016Net income $ 49,595 $ 49,365 $ 34,252Income tax (benefit) expense 15,263 (6,395) 21,049Interest expense 12,130 18,157 17,317Interest income (215) (62) (96)Foreign currency (gain) loss (55) (516) 138Gain on divestiture — — (2,034)Other income (2,630) (791) (597)Impairment charges 3,666 8,903 —Depreciation and amortization of plant and equipment 29,207 28,302 25,304Amortization of intangibles 9,645 9,888 10,575Share-based compensation 4,366 3,933 2,925Accretion and non-cash adjustment of closure & post-closure liabilities 3,707 3,026 3,953
Adjusted EBITDA $ 124,679 $ 113,810 $ 112,786 Adjusted EBITDA, by operating segment, for the years ended December 31, 2018, 2017 and 2016 is as follows:
$s in thousands 2018 2017 2016Adjusted EBITDA: Environmental Services $ 160,526 $ 146,371 $ 139,698Field & Industrial Services 18,456 14,709 16,342Corporate (54,303) (47,270) (43,254)
Total $ 124,679 $ 113,810 $ 112,786 Property and Equipment and Intangible Assets Outside of the United States
We provide services in the United States and Canada. Long‑lived assets, comprised of property and equipment and intangibleassets net of accumulated depreciation and amortization, by geographic location as of December 31, 2018 and 2017 are asfollows:
$s in thousands 2018 2017United States $ 480,322 $ 396,066Canada 57,787 61,178Total long-lived assets $ 538,109 $ 457,244
102

Table of Contents
NOTE 22. QUARTERLY FINANCIAL DATA (unaudited)
The unaudited consolidated quarterly results of operations for 2018 and 2017 were as follows:
Three-Months Ended $s and shares in thousands, except per share amounts Mar. 31, June 30, Sept. 30, Dec. 31, Year2018 Revenue $ 120,059 $ 136,912 $ 151,416 $ 157,541 $ 565,928Gross profit 35,671 41,448 47,300 45,675 170,094Operating income 13,439 20,292 19,985 20,372 74,088Net income 9,243 13,220 13,427 13,705 49,595Earnings per share—diluted (1) $ 0.42 $ 0.60 $ 0.61 $ 0.62 $ 2.25Weighted average common shares outstanding used in thediluted earnings per share calculation 21,957 22,024 22,099 22,109 22,047Dividends paid per share $ 0.18 $ 0.18 $ 0.18 $ 0.18 $ 0.722017 Revenue $ 110,234 $ 126,057 $ 134,054 $ 133,697 $ 504,042Gross profit 31,873 35,896 37,733 47,625 153,127Operating income 12,159 15,896 15,289 16,414 59,758Net income 5,185 5,049 8,365 30,766 49,365Earnings per share—diluted (1) $ 0.24 $ 0.23 $ 0.38 $ 1.40 $ 2.25Weighted average common shares outstanding used in thediluted earnings per share calculation 21,845 21,890 21,931 21,927 21,902Dividends paid per share $ 0.18 $ 0.18 $ 0.18 $ 0.18 $ 0.72
(1) Diluted earnings per common share for each quarter presented above are based on the respective weighted average numberof common shares for the respective quarter. The dilutive potential common shares outstanding for each period and the sumof the quarters may not necessarily be equal to the full year diluted earnings per common share amount.
NOTE 23. SUBSEQUENT EVENT
On January 2, 2019, the Company declared a dividend of $0.18 per common share for stockholders of record on January 18,2019. The dividend was paid from cash on hand on January 25, 2019 in an aggregate amount of $4.0 million.
ITEM 9. CHANGES IN AND DISAGREEMENTS WITH ACCOUNTANTS ON ACCOUNTING AND FINANCIALDISCLOSURE
None
ITEM 9A. CONTROLS AND PROCEDURES
An evaluation was performed under the supervision and with the participation of the Company’s management, including both theChief Executive Officer and Chief Financial Officer, of the effectiveness of the Company’s disclosure controls and procedures, assuch term is defined under Rule 13a‑15e under the Securities Exchange Act of 1934, as amended (the “Exchange Act”) as ofDecember 31, 2018. Based on that evaluation, the Company’s management, including the Chief Executive and Chief FinancialOfficer, concluded that the Company’s disclosure controls and procedures are effective to provide reasonable assurance thatinformation required to be disclosed by the Company in reports that it files or submits under the Exchange Act is recorded,processed, summarized and reported as specified in SEC rules and forms and that such information is accumulated andcommunicated to the Company’s management, including the Chief Executive Officer and Chief Financial Officer, or personsperforming similar functions, as appropriate to allow timely decisions regarding required disclosure.
103

Table of Contents
There were no changes in the Company’s internal control over financial reporting identified in connection with the evaluation ofsuch controls that occurred during the Company’s most recent fiscal quarter that has materially affected, or is reasonably likely tomaterially affect, the Company’s internal control over financial reporting.
Management’s Annual Report on Internal Controls over Financial Reporting.
Management is responsible for and maintains a system of internal controls over financial reporting that is designed to providereasonable assurance that its records and filings accurately reflect the transactions engaged in Section 404 of Sarbanes‑Oxley Actof 2002 and related rules issued by the SEC requiring management to issue a report on its internal controls over financialreporting.
There are inherent limitations in the effectiveness of any internal control, including the possibility of human error and thecircumvention or overriding of controls. Accordingly, even effective internal control can provide only reasonable assurance withrespect to financial statement preparation. Further, because of changes in conditions, the effectiveness of internal controls mayvary over time.
Management has conducted an assessment of its internal controls over financial reporting as of December 31, 2018 based oncriteria established in Internal Control—Integrated Framework (2013) issued by the Committee of Sponsoring Organizations(“COSO”) of the Treadway Commission. Based on this assessment, management concluded that our internal controls overfinancial reporting, excluding ES&H of Dallas, LLC (“ES&H Dallas”) and Ecoserv Industrial Disposal, LLC (“Winnie”), wereeffective to provide reasonable assurance regarding the reliability of financial reporting.
SEC guidance permits management to omit an assessment of an acquired business’ internal control over financial reporting frommanagement’s assessment of internal control over financial reporting for a period not to exceed one year from the date ofacquisition. Accordingly, we have assessed neither ES&H Dallas’ nor Winnie’s internal control over financial reporting as ofDecember 31, 2018. ES&H Dallas’ and Winnie’s combined financial statements constitute approximately 3% of total assets(excluding goodwill and intangible assets), 2% of revenues, and 3% of net income of the consolidated financial statements of theCompany as of and for the year ended December 31, 2018.
Our independent registered public accounting firm, Deloitte and Touche LLP, has audited the effectiveness of internal controlover financial reporting as of December 31, 2018, as stated in their report, which is included in Part II, Item 8 of this AnnualReport on Form 10‑K.
ITEM 9B. OTHER INFORMATION
None
104

Table of Contents
PART III
ITEM 10. DIRECTORS, EXECUTIVE OFFICERS AND CORPORATE GOVERNANCE
The information regarding directors and nominees for directors of the Company, including identification of the members of theaudit committee and audit committee financial expert, is presented under the headings “Corporate Governance—Committees ofthe Board of Directors,” and “Election of Directors—Nominees For Directors” in the Company’s definitive proxy statement foruse in connection with the 2019 Annual Meeting of Stockholders (the “Proxy Statement”) to be filed within 120 days after the endof the Company’s fiscal year ended December 31, 2018. The information contained under these headings is incorporated hereinby reference. Information regarding the executive officers of the Company is included in this Annual Report on Form 10‑K underItem 1 of Part I as permitted by Instruction 3 to Item 401(b) of Regulation S‑K.
We have adopted a code of ethics that applies to our Chief Executive Officer and Chief Financial Officer. This code of ethics isavailable on our Web site at www.usecology.com . If we make any amendments to this code other than technical, administrativeor other non‑substantive amendments, or grant any waivers, including implicit waivers, from a provision of this code to our ChiefExecutive Officer or Chief Financial Officer, we will disclose the nature of the amendment or waiver, its effective date and towhom it applies in a report filed with the SEC.
ITEM 11. EXECUTIVE COMPENSATION
Information concerning executive and director compensation is presented under the heading “Compensation Discussion andAnalysis” in the Proxy Statement. The information contained under these headings is incorporated herein by reference.
ITEM 12. SECURITY OWNERSHIP OF CERTAIN BENEFICAL OWNERS AND MANAGEMENT AND RELATEDSTOCKHOLDER MATTERS
Information with respect to security ownership of certain beneficial owners and management is set forth under the heading“Security Ownership of Certain Beneficial Owners and Directors and Officers” in the Proxy Statement. The informationcontained under these headings is incorporated herein by reference.
The following table provides information as of December 31, 2018, about the common stock that has been issued under all of ourequity compensation plans, including the Omnibus Plan and the 2008 Stock Option Incentive Plan. All of these plans have beenapproved by our stockholders. The Omnibus Plan, approved in May 2015, superseded our Previous Plans, and the Previous Plansremain in effect solely for the settlement of awards granted under the Previous Plans. The number of securities remainingavailable for future issuance presented in column (c) in the table below represents securities available under the Omnibus Planonly. No shares that are reserved but unissued under the Previous Plans or that are outstanding under the Previous Plans andreacquired by the Company for any reason will be available for issuance under the Omnibus Plan.
Number of securities remaining available for Number of securities future issuance under to be issued upon Weighted‑‑average equity compensation exercise of exercise price of plans (excluding outstanding options, outstanding options, securities reflected in warrants and rights warrants and rights column (a)) (a)(1) (b)(2) (c)Equity compensation plans approved by security holders 417,476 $ 44.93 1,012,001Equity compensation plans not approved by security holders — — —Total 417,476 $ 44.93 1,012,001
(1) Includes 141,773 shares of unvested restricted stock and restricted stock unit awards and 39,200 performance stock unitawards outstanding under the Omnibus Plan.
105

Table of Contents
(2) The weighted‑average exercise price does not take into account the shares issuable upon vesting of outstanding restrictedstock and restricted stock unit awards, which have no exercise price.
ITEM 13. CERTAIN RELATIONSHIPS AND RELATED TRANSACTIONS, AND DIRECTOR INDEPENDENCE
Information concerning related transactions is presented under the heading “Certain Relationships and Related Transactions” inthe Proxy Statement. The information contained under this heading is incorporated herein by reference.
ITEM 14. PRINCIPAL ACCOUNTING FEES AND SERVICES
Information concerning principal accounting fees and services is presented under the heading “Ratification of Appointment ofIndependent Registered Public Accounting Firm” in the Proxy Statement. The information contained under this heading isincorporated herein by reference.
PART IV
ITEM 15. EXHIBITS, FINANCIAL STATEMENTS AND SCHEDULES
(a) The following documents are filed as part of this report:
1) Consolidated Financial Statements: See Index to Consolidated Financial Statements at Item 8 of this Annual Report.
2) Financial Statement Schedules. Schedules have been omitted because they are not required or because theinformation is included in the financial statements at Item 8 of this Annual Report.
3) Exhibits are incorporated herein by reference or are filed with this Annual Report as set forth in the Index toExhibits on page 107 hereof.
ITEM 16. FORM 10‑‑K SUMMARY
None
106
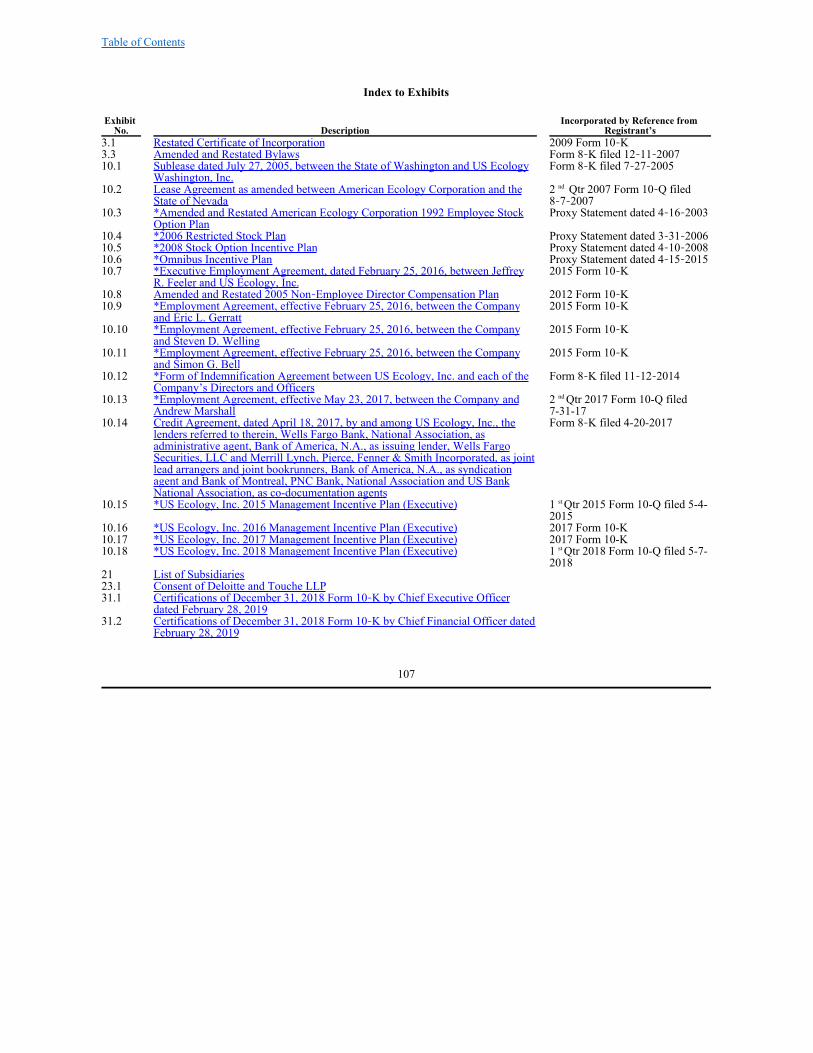
Table of Contents
Index to Exhibits
Exhibit No. Description
Incorporated by Reference from Registrant’s
3.1 Restated Certificate of Incorporation 2009 Form 10‑K3.3 Amended and Restated Bylaws Form 8‑K filed 12‑11‑200710.1 Sublease dated July 27, 2005, between the State of Washington and US Ecology
Washington, Inc. Form 8‑K filed 7‑27‑2005
10.2 Lease Agreement as amended between American Ecology Corporation and theState of Nevada
2 Qtr 2007 Form 10‑Q filed8‑7‑2007
10.3 *Amended and Restated American Ecology Corporation 1992 Employee StockOption Plan
Proxy Statement dated 4‑16‑2003
10.4 *2006 Restricted Stock Plan Proxy Statement dated 3‑31‑200610.5 *2008 Stock Option Incentive Plan Proxy Statement dated 4‑10‑200810.6 *Omnibus Incentive Plan Proxy Statement dated 4‑15‑201510.7 *Executive Employment Agreement, dated February 25, 2016, between Jeffrey
R. Feeler and US Ecology, Inc. 2015 Form 10‑K
10.8 Amended and Restated 2005 Non‑Employee Director Compensation Plan 2012 Form 10‑K10.9 *Employment Agreement, effective February 25, 2016, between the Company
and Eric L. Gerratt 2015 Form 10‑K
10.10 *Employment Agreement, effective February 25, 2016, between the Companyand Steven D. Welling
2015 Form 10‑K
10.11 *Employment Agreement, effective February 25, 2016, between the Companyand Simon G. Bell
2015 Form 10‑K
10.12 *Form of Indemnification Agreement between US Ecology, Inc. and each of theCompany’s Directors and Officers
Form 8‑K filed 11‑12‑2014
10.13 *Employment Agreement, effective May 23, 2017, between the Company andAndrew Marshall
2 Qtr 2017 Form 10-Q filed7-31-17
10.14 Credit Agreement, dated April 18, 2017, by and among US Ecology, Inc., thelenders referred to therein, Wells Fargo Bank, National Association, asadministrative agent, Bank of America, N.A., as issuing lender, Wells FargoSecurities, LLC and Merrill Lynch, Pierce, Fenner & Smith Incorporated, as jointlead arrangers and joint bookrunners, Bank of America, N.A., as syndicationagent and Bank of Montreal, PNC Bank, National Association and US BankNational Association, as co-documentation agents
Form 8‑K filed 4-20-2017
10.15 *US Ecology, Inc. 2015 Management Incentive Plan (Executive) 1 Qtr 2015 Form 10-Q filed 5-4-2015
10.16 *US Ecology, Inc. 2016 Management Incentive Plan (Executive) 2017 Form 10-K10.17 *US Ecology, Inc. 2017 Management Incentive Plan (Executive) 2017 Form 10-K10.18 *US Ecology, Inc. 2018 Management Incentive Plan (Executive) 1 Qtr 2018 Form 10-Q filed 5-7-
201821 List of Subsidiaries 23.1 Consent of Deloitte and Touche LLP 31.1 Certifications of December 31, 2018 Form 10‑K by Chief Executive Officer
dated February 28, 2019
31.2 Certifications of December 31, 2018 Form 10‑K by Chief Financial Officer datedFebruary 28, 2019
107
nd
nd
st
st

Table of Contents
Exhibit No. Description
Incorporated by Reference from Registrant’s
32.1 Certifications of December 31, 2018 Form 10‑K by Chief Executive Officerdated February 28, 2019
32.2 Certifications of December 31, 2018 Form 10‑K by Chief Financial Officer datedFebruary 28, 2019
101 The following materials from the Annual Report on Form 10‑K of USEcology, Inc. for the fiscal year ended December 31, 2018 formatted inExtensible Business Reporting Language (XBRL): (i) Consolidated BalanceSheets, (ii) Consolidated Statements of Operations, (iii) Consolidated Statementsof Comprehensive Income, (iv) Consolidated Statements of Cash Flows,(v) Consolidated Statements of Stockholders’ Equity, and (vi) Notes to theConsolidated Financial Statements
* Identifies management contracts or compensatory plans or arrangements required to be filed as an exhibit hereto.
108

Table of Contents
Signatures
Pursuant to the requirements of Section 13 or 15(d) of the Securities Exchange Act of 1934, the registrant has duly caused thisreport to be signed on its behalf by the undersigned, thereunto duly authorized.
US ECOLOGY, INC. By: /s/ ERIC L. GERRATT Eric L. Gerratt Executive Vice President, Chief Financial Officer and
Treasurer Date: February 28, 2019
Pursuant to the requirements of the Securities Exchange Act of 1934, this report has been signed below by the following personson behalf of the registrant and in the capacities indicated as of February 28, 2019.
/s/ JEFFREY R. FEELER /s/ ERIC L. GERRATTJeffrey R. Feeler Eric L. Gerratt(Director) President and Chief Executive Officer Executive Vice President, Chief Financial Officer and
Treasurer (Principal Financial Officer and PrincipalAccounting Officer)
/s/ SIMON G. BELL /s/ STEVEN D. WELLINGSimon G. Bell Steven D. WellingExecutive Vice President and Chief Operating Officer Executive Vice President of Sales and Marketing /s/ ANDREW P. MARSHALL /s/ RONALD C. KEATINGAndrew P. Marshall Ronald C. KeatingExecutive Vice President of Regulatory Compliance & Safety (Director) /s/ STEPHEN A. ROMANO /s/ JOE F. COLVINStephen A. Romano Joe F. Colvin(Director) (Director) /s/ DANIEL FOX /s/ KATINA DORTONDaniel Fox Katina Dorton(Director) (Director) /s/ JOHN T. SAHLBERG /s/ GLENN A. EISENBERGJohn Sahlberg Glenn A. Eisenberg(Director) (Director)
109

Exhibit 21List of Subsidiaries
Subsidiary Name State of FormationAmerican Ecology Environmental Services Corporation Texas CorporationUS Ecology Houston, Inc. Delaware CorporationStablex Canada Inc. Canadian Federal CorporationUS Ecology Michigan, Inc. Michigan CorporationUS Ecology Thermal Services, Inc. Delaware CorporationUS Ecology Idaho, Inc. Delaware CorporationUS Ecology Illinois, Inc. California CorporationUS Ecology Nevada, Inc. Delaware CorporationUS Ecology Stablex Holdings, Inc. Delaware CorporationUS Ecology Canada Holdings Inc. Canadian Federal CorporationEnvironmental Services Inc. Ontario CorporationUS Ecology Texas, Inc. Delaware CorporationUS Ecology Winnie, LLC Delaware CorporationUS Ecology Transportation Solutions, Inc. Delaware CorporationUS Ecology Washington, Inc. Delaware CorporationUS Ecology Vernon, Inc. Delaware CorporationEQ Parent Company, Inc. Delaware CorporationEQ Holdings, Inc. Delaware CorporationEnvirite Transportation, LLC Ohio Limited Liability CompanyEnvirite of Pennsylvania, Inc. Delaware CorporationEnvirite of Illinois, Inc. Delaware CorporationEnvirite of Ohio, Inc. Delaware CorporationEQ Augusta, Inc. Michigan CorporationUS Ecology Sulligent, Inc. Michigan CorporationEQ Detroit, Inc. Michigan CorporationUS Ecology Tulsa, Inc. Michigan CorporationEQ Industrial Services, Inc. Michigan CorporationUS Ecology Tampa, Inc. Michigan CorporationUS Ecology Livonia, Inc. Michigan CorporationEQ Mobile Recycling, Inc. Michigan CorporationEQ Northeast, Inc. Massachusetts CorporationUS Ecology Romulus, Inc. Michigan CorporationMichigan Disposal, Inc. Michigan CorporationWayne Disposal, Inc. Michigan CorporationWayne Energy Recovery, Inc. Michigan CorporationEQ Metals Recovery, LLC Ohio Limited Liability CompanyUS Ecology Taylor, Inc. Michigan CorporationRTF Romulus, LLC Michigan Limited Liability CompanyEQ de Mexico, Inc. Mexican Corporation
Exhibit 23.1

Exhibit 23.1
CONSENT OF INDEPENDENT REGISTERED PUBLIC ACCOUNTING FIRM
We consent to the incorporation by reference in Registration Statement Nos. 333-157529, 333-68868, 333-93105, 333-140419,333-69863, and 333-207811 on Form S-8, Registration Statement No. 333-211807 on Form S-3, and Registration Statement No.333-187003 on Form S-4, of our report dated February 28, 2019, relating to the consolidated financial statements of US EcologyInc. and subsidiaries, and the effectiveness of US Ecology Inc.’s internal control over financial reporting, appearing in thisAnnual Report on Form 10-K of US Ecology Inc. for the year ended December 31, 2018. /s/ DELOITTE & TOUCHE LLP Boise, IdahoFebruary 28, 2019
Exhibit 31.1

Exhibit 31.1
I, Jeffrey R. Feeler, certify that: 1. I have reviewed this annual report on Form 10‑K of US Ecology, Inc.;
2. Based on my knowledge, this report does not contain any untrue statement of a material fact or omit to state a material
fact necessary to make the statements made, in light of the circumstances under which such statements were made, notmisleading with respect to the period covered by this report;
3. Based on my knowledge, the financial statements, and other financial information included in this report, fairly presentin all material respects the financial condition, results of operations and cash flows of the registrant as of, and for, theperiods presented in this report;
4. The registrant’s other certifying officer and I are responsible for establishing and maintaining disclosure controls andprocedures (as defined in Exchange Act Rules 13a‑15(e) and 15d‑15(e)) and internal control over financial reporting (asdefined in Exchange Act Rules 13a‑15(f) and 15d‑15(f)) for the registrant and have: a) Designed such disclosure controls and procedures, or caused such disclosure controls and procedures to be
designed under our supervision, to ensure that material information relating to the registrant, including itsconsolidated subsidiaries, is made known to us by others within those entities, particularly during the period inwhich this report is being prepared;
b) Designed such internal control over financial reporting, or caused such internal control over financial reporting
to be designed under our supervision, to provide reasonable assurance regarding the reliability of financialreporting and the preparation of financial statements for external purposes in accordance with generallyaccepted accounting principles;
c) Evaluated the effectiveness of the registrant’s disclosure controls and procedures and presented in this report
our conclusions about the effectiveness of the disclosure controls and procedures, as of the end of the periodcovered by this report based on such evaluation; and
d) Disclosed in this report any change in the registrant’s internal control over financial reporting that occurred
during the registrant’s most recent fiscal quarter (the registrant’s fourth fiscal quarter in the case of an annualreport) that has materially affected, or is reasonably likely to materially affect, the registrant’s internal controlover financial reporting; and
5. The registrant’s other certifying officer and I have disclosed, based on our most recent evaluation of internal control over
financial reporting, to the registrant’s auditors and the audit committee of the registrant’s board of directors (or personsperforming the equivalent functions):
a) All significant deficiencies and material weaknesses in the design or operation of internal control over financial
reporting which are reasonably likely to adversely affect the registrant’s ability to record, process, summarizeand report financial information; and
b) Any fraud, whether or not material, that involves management or other employees who have a significant role
in the registrant’s internal control over financial reporting.
/s/ JEFFREY R. FEELER President and Chief Executive Officer February 28, 2019
Exhibit 31.2

Exhibit 31.2
I, Eric L. Gerratt, certify that: 1. I have reviewed this annual report on Form 10‑K of US Ecology, Inc.;
2. Based on my knowledge, this report does not contain any untrue statement of a material fact or omit to state a material
fact necessary to make the statements made, in light of the circumstances under which such statements were made, notmisleading with respect to the period covered by this report;
3. Based on my knowledge, the financial statements, and other financial information included in this report, fairly presentin all material respects the financial condition, results of operations and cash flows of the registrant as of, and for, theperiods presented in this report;
4. The registrant’s other certifying officer and I are responsible for establishing and maintaining disclosure controls andprocedures (as defined in Exchange Act Rules 13a‑15(e) and 15d‑15(e)) and internal control over financial reporting (asdefined in Exchange Act Rules 13a‑15(f) and 15d‑15(f)) for the registrant and have:
a) Designed such disclosure controls and procedures, or caused such disclosure controls and procedures to be
designed under our supervision, to ensure that material information relating to the registrant, including itsconsolidated subsidiaries, is made known to us by others within those entities, particularly during the period inwhich this report is being prepared;
b) Designed such internal control over financial reporting, or caused such internal control over financial reportingto be designed under our supervision, to provide reasonable assurance regarding the reliability of financialreporting and the preparation of financial statements for external purposes in accordance with generallyaccepted accounting principles;
c) Evaluated the effectiveness of the registrant's disclosure controls and procedures and presented in this reportour conclusions about the effectiveness of the disclosure controls and procedures, as of the end of the periodcovered by this report based on such evaluation; and
d) Disclosed in this report any change in the registrant's internal control over financial reporting that occurredduring the registrant's most recent fiscal quarter (the registrant's fourth fiscal quarter in the case of an annualreport) that has materially affected, or is reasonably likely to materially affect, the registrant's internal controlover financial reporting; and
5. The registrant’s other certifying officer and I have disclosed, based on our most recent evaluation of internal control over
financial reporting, to the registrant’s auditors and the audit committee of the registrant’s board of directors (or personsperforming the equivalent functions):
a) All significant deficiencies and material weaknesses in the design or operation of internal control over financial
reporting which are reasonably likely to adversely affect the registrant’s ability to record, process, summarizeand report financial information; and
b) Any fraud, whether or not material, that involves management or other employees who have a significant role
in the registrant’s internal control over financial reporting.
/s/ ERIC L. GERRATT Executive Vice President, Chief Financial Officer and Treasurer February 28, 2019
Exhibit 32.1

Exhibit 32.1
Written Statement of the Chief Executive OfficerPursuant to 18 U.S.C. §1350 Solely for the purposes of complying with 18 U.S.C. §1350, I, the undersigned Chief Executive Officer of US Ecology, Inc., (the“Company”), hereby certify, that to my knowledge, the Annual Report on Form 10‑K of the Company for the period endedDecember 31, 2018 (the “Report”) fully complies with the requirements of Section 13(a) or 15(d) of the Securities Exchange Actof 1934 and that information contained in the Report fairly presents, in all material respects, the financial condition and results ofoperations of the Company as of the dates hereof and for the periods expressed in this Report. /s/ JEFFREY R. FEELER President and Chief Executive Officer February 28, 2019
Exhibit 32.2

Exhibit 32.2
Written Statement of the Chief Financial OfficerPursuant to 18 U.S.C. §1350 Solely for the purposes of complying with 18 U.S.C. §1350, I, the undersigned Chief Financial Officer of US Ecology, Inc., (the“Company”), hereby certify, that to my knowledge, the Annual Report on Form 10‑K of the Company for the period endedDecember 31, 2018 (the “Report”) fully complies with the requirements of Section 13(a) or 15(d) of the Securities Exchange Actof 1934 and that information contained in the Report fairly presents, in all material respects, the financial condition and results ofoperations of the Company as of the dates hereof and for the periods expressed in this Report. /s/ ERIC L. GERRATT Executive Vice President, Chief Financial Officer and Treasurer February 28, 2019