Embed Size (px)
Citation preview

The Pacific Northwest RegionVegetation and InventoryMonitoring SystemTimothy A. Max, Hans T. Schreuder, John W. Hazard,Daniel D. Oswald, John Teply, and Jim Alegria
United StatesDepartment ofAgriculture
Forest Service
Pacific NorthwestResearch Station
Research PaperPNW-RP-493December 1996

Authors TIMOTHY A. MAX is the Station statistician and DANIEL D. OSWALD was a pro-gram manager (now retired), U.S. Department of Agriculture, Forest Service, PacificNorthwest Research Station, P.O. Box 3890, Portland, OR 97208-3890; HANS T.SCHREUDER is a supervisory mathematical statistician, U.S. Department of Ag-riculture, Forest Service, Rocky Mountain Forest and Range Experiment Station,240 W. Prospect Road, Fort Collins, CO 80526-2098; JOHN W. HAZARD is aconsulting statistician, Bend, OR 97701; JOHN TEPLY is an inventory biometrician,U.S. Department of Agriculture, Forest Service, Pacific Northwest Region, P.O. Box3623, Portland, OR 97208-3623; and JIM ALEGRIA is a forester, U.S. Departmentof the Interior, Bureau of Land Management, Oregon State Office, P.O. Box 2965,Portland, OR 97208-2965.

Abstract Max, Timothy A.; Schreuder, Hans T.; Hazard, John W.; Oswald, Daniel D.;Teply, John; Alegria, Jim. 1996. The Pacific Northwest Region vegetationand inventory monitoring system. Res. Pap. PNW-RP-493. Portland, OR: U.S.Department of Agriculture, Forest Service, Pacific Northwest Research Station.22 p.
A grid sampling strategy was adopted for broad-scale inventory and monitoring offorest and range vegetation on National Forest System lands in the Pacific North-west Region, USDA Forest Service. This paper documents the technical details ofthe adopted design and discusses alternative sampling designs that were considered.A less technical description of the selected design will be given elsewhere. The gridconsists of a regular, square spacing with 5.47 kilometers (3.4 mi) between gridpoints. The primary sampling unit (PSU), established at each grid sampling point,consists of a circular, 1-hectare (2.47-acre) plot. The PSU is subsampled with aset of different-sized fixed-area subplots, as well as line transects, to assess allcomponents of vegetation. The design is flexible and can be used with manytypes of maps. The theory of point and change estimation is described, as wellas estimates of variation that assess the statistical precision of estimates.
Keywords: Sampling, plot design, fixed-area plots, line intersect sampling,monitoring, National Forest System, Pacific Northwest.

Contents 1 Introduction
2 Purpose and Objectives
2 Developing Forest Plans
2 Assessing Resources
2 Special Studies
3 Impact Analysis
3 Review of Literature
3 Sampling Designs in Use
4 Estimation and Analysis
7 Analytical Uses of Survey Data
9 Quality Assurance
10 Methods
10 Approach Adopted
11 Mapping
12 Sampling Frame and Plot Design
18 Quality Assurance
19 Data Processing and Estimation
19 Analyses
19 Acknowledgment
19 References
22 Appendix 1
22 Plot Recording Sheet

Introduction In the past, inventories of National Forest System lands (NFS) have been designedprimarily for estimating potential outputs of and managing the forests for woodproducts. Some information on other resources was collected, but it was often in-sufficient to answer complex questions about these resources. In addition, profes-sional groups other than timber managers have conducted surveys of other resourcessuch as wildlife habitat, soils, recreational features, water, and so forth. These effortswere rarely integrated into a comprehensive resource inventory system, plus inventoryand monitoring were rarely considered together.
National Forest System lands are managed for a multitude of objectives includingproviding a wide variety of commodities, uses, and scenic and social values thatpeople derive from them. Inventory and monitoring systems must be designed toprovide comprehensive information about the land and vegetation to answer abroad spectrum of existing and newly developing questions. For example, infor-mation needs on the occurrence, abundance, and distribution of Pacific yew (Taxusbrevifolia Nutt.) or the occurrence of habitat suitable for the northern spotted owl(Strix occidentalis Caurina) would not have been anticipated 10 years ago. Butsuch information is much more likely to be available in a broad land and vegetationdatabase. Such broad inventory and monitoring schemes also must meet theinformational needs of the USDA Forest Service (FS) for periodic national andRegional assessments, Regional and national planning, and developing andimplementing forest plans for NFS lands.
In October 1992, the Washington Office of the FS ordered its western Regionsto establish a grid of plots across all NFS lands that would be compatible with theForest Inventory and Analysis (FIA) grids. In April 1993, the FS established policyimplementing ecosystem management of NFS lands. In June 1993, the WashingtonOffice directed the FIA units to implement mapped plot designs for all FIA plots inthe United States (Robertson 1993). The key idea of this direction was to locateplots exactly on the ground as planned and map them for conditions of interest.Moving some subplots into the same condition class as that of the central sub-plot is not permitted. This direction was expected to be fully implemented in 1994.
Anticipating a need for a scientifically defensible yet practical design for ecologicalpurposes, the Pacific Northwest Region of the NFS (Region 6) convened a panelof survey sampling experts who met in a series of five meetings to plan such aninventory and monitoring (IM) system. This paper summarizes the deliberationsand conclusions of this advisory group, which recommended a comprehensive IMsystem for Region 6. We believe this is a key step in inventorying and monitoringforest land for ecological purposes. Under current monitoring, only large-scalechange is estimated by using sampling units that are periodically remeasured.Various alternatives for implementing remeasurement, such as an annual forestinventory system (AFIS),1 will be explored later. Professional and disciplinarygroups, whether monitoring watersheds or other areas of interest, can use thedatabase developed here as a starting point for their more specific monitoringprojects.
1 Hansen, M.H.; Hahn, J.T.; Schreuder, H.T.; Befort, W.A.AFIS-1: implementation of an annual forest inventory system.Manuscript in preparation.
1

Purpose andObjectives
The purpose of this paper is to present a broad-scale vegetation inventory and mon-itoring system designed to meet the present and future resource information needs ofRegion 6 and the FS. The system must be integrated by capturing basic land infor-mation and describing vegetative structure and productivity in an ecological frame-work. In addition, the system must be responsive to changing needs for spatial andtemporal information at various scales and levels of resolution.
The objectives of the system are to develop and maintain a defensible database ofground resource estimates that can be used to periodically assess vegetation andmonitor change in vegetation over time. The data are compatible with any map basedeveloped for NFS lands in Region 6. The database will be used to develop forestplans and assess resources, special studies, and impact analysis. Each objective isdescribed in more detail below.
For monitoring, it is important to note that we have used the term “monitoring” tomean assessing broad-scale changes in resources over time. The scope is strictlybroad-scale; that is, applying to large areas. Many specific types of monitoring aredefined and used by the FS and other agencies (for example, implementationmonitoring and effectiveness monitoring), and they are not part of the scope ofthis paper. A good discussion of inventory and monitoring, as well as definitions ofspecific types of monitoring, is given in MacDonald and others (1991:6-8). In thispaper, we use the term “sampling strategy” to define sample design plus estimation,where sample design refers to the approach used to select the actual sampling unitlocations (Schreuder and others 1993).
Developing Forest Plans The panel had one critical objective, which was to develop an inventory and mon-itoring system that would meet the needs of forest planning and forest managementdecisionmaking. Major components had to include methods for acquiring repre-sentative data, methods for summarizing data to obtain estimates, and associateddatabase support. Planners now need estimates of both the current status ofresources and changes in resources over time to make planning decisions. Thenew process will be based on incorporating spatial information for current vegetation,potential vegetation, land form, and soils at both Forest and multi-Forest levels.
Assessing Resources Another key objective of the system was broad assessment of resources. Suchassessment provides consistent resource estimates for addressing subregional,regional, and national issues (for example, information required by the nationalResources Planning Act [RPA] 1974) and an initial source of information to RangerDistricts for addressing management issues. Such issues normally are driven byusers’ concerns for the land and for its associated vegetation, both current statusand change over time.
Special Studies The system had to be flexible to allow for implementing broad-scale special studiescompatible with the overall IM design. Examples of such special studies are deter-mining the pattern of root rot occurrence, the frequency and extent of insect epi-demics, and the quantity and spatial distribution of live vegetation and woody debrisas it relates to forest succession. Although such special studies are observational innature, they provide an effective tool for addressing some issues.
2

Impact Analysis An objective becoming increasingly important is impact analysis. Such analysesinvestigate potential relations among response variables, management practices,environmental factors, and other anthropogenic stresses. The acquired vegetationdatabases, both spatial and temporal, must be useful for such analyses. Evaluationsmay include documenting effects of catastrophic events, determining effects of landform on management practices, and monitoring change in vegetation and under-standing why such change occurs.
Review of Literature Surveys traditionally have been planned to provide estimates of current status.Such estimates have been so useful to management that additional objectives haveevolved. The original objective of FIA inventories, for example, was to estimate thearea of forest land by type, stand size, ownership, site quality, and stocking andto estimate merchantable wood volume by tree species and diameter class. Overtime, additional information related to change over time was added, such as growth,mortality, timber removals, and success of regeneration.
Recently, interest has expanded in relations established by using natural resourcesurvey data. Establishing such relations and drawing conclusions based on them istermed “analytical inference.” Such inferential use of sample survey data requiresreliable data. Conclusions drawn by scientists from a comparison of the 1982 andearlier FIA surveys of Georgia and Alabama is a striking example of such inference.In that study, average growth rates in tree diameters decreased (Bechtold and others1991, Ouyang and others 1993, Ruark and others 1991) for a screened data set,but the cause is still not known. Various hypotheses have been proposed, includingregional changes in average stand structure of forests, anthropogenic stresses, andweather. As a result of the ensuing controversy, efforts were made to determinewhether survey data could suggest cause-effect relations, and how they mightmore effectively serve analytical uses.
In the following subsections we briefly review several topics: sampling designs inuse, estimation and analysis, analytical uses of survey data, and quality assuranceof data collected.
Sampling Designs in Use Around the world, many broad-scale forest inventories are based on a systematicarrangement of grids (Köhl 1994). These designs are adopted primarily for practicalreasons of implementing and revisiting plots well distributed over a vast area. Threewell-known examples in the United States are the FIA program, Forest Health Mon-itoring program of the FS, and the National Wetlands Inventory of the U.S. Fish andWildlife Service.
All FIA units use double sampling for stratification. A large number of grid locations,either single points or a cluster of points, is located, typically on available photo-graphy, and locations are classified into strata (the simplest being forest and non-forest) (Birdsey and Schreuder 1992). Permanent, unobtrusively marked sampleplots are then located on the ground on a grid, typically consisting of a cluster of 5 or10 variable-radius plots sampling a 0.4-hectare (1-acre) plot. These plots are thenmeasured for variables of interest, which are sometimes multiresource in nature. Atpresent the timber variables receive the most attention (Birdsey and Schreuder 1992;Hahn and others, 1995). The Forest Health Monitoring program of the FS and theEnvironmental Protection Agency (EPA) uses a cluster of four fixed-area circularsubplots to sample a circular 1-hectare plot; 0.0168-hectare subplots (radius = 7.32meters or 24 ft) are mapped for forest conditions (Messer and others 1991; Scottand Bechtold 1995).
3

Since 1974, the U.S. Fish and Wildlife Service has inventoried the Nation’s wetlandsthrough its National Wetlands Inventory project. The statistical design implemented inthe lower 48 States can be used to obtain reliable estimates for individual states orother geographical areas by intensifying the grid (Hall and others 1994).
Designs are given in Schreuder and others (1993) for sampling recreational use,wildlife populations, regeneration, understory vegetation, and timber variables. Morepractical, objective methods are needed for obtaining information on vegetation pro-files (Schreuder and others 1993) and the biomass of range vegetation (NationalResearch Council 1994).
Estimation and Analysis Traditionally, interest in NFS lands has centered on the area and condition of theresources and how these change over time. Scott and Bechtold (1995) and Williamsand Schreuder (1995) present the relevant estimation theory for mapped designs.The notation used is:
A = Total area in population (hectare).
F = Number of condition classes of interest.
t = Time period t (t = 1, 2).
Atf = Area in condition class f at time t (f = 1, ..., F; t = 1, 2) (hectare).
Yt = Total for variable of interest at time t.
∆Y =Total change in variable Y from time 2 to time 1.
Ytf = Total for variable of interest in condition class f at time t (f = 1, ..., F; t = 1, 2).
k = Number of subplots in a cluster (k = 5 or 10 depending on FIA unit).
M = Number of plots in population.
m = Number of sample plots (clusters).
BAF = Basal area factor in variable radius plot (VRP) sampling = squaremeter/hectare (or ft2/acre) of basal area represented by a tree when tallied at asingle subplot.
Πti = Probability of selecting tree i at time t (t = 1, 2).
rs = Radius of small fixed-area plot.
= Radius of large fixed-area plot.
Yti = Value of variable of interest for tree i at time t (t = 1, 2).
= Estimated total for variable of interest y on sample plot (cluster) h (h = 1, ...,m) at time t (t = 1, 2).
aj(ft) = Approximate area in condition f (= if only one condition occurs) at subplot jand time t (t=1, 2).
dti = Diameter at breast height of tree i at time t.
gti = Basal area of tree i at time t.
i = Used to sum over trees on each subplot.
j = Used to sum over subplots.
rl
$Yth
al
4

h = Used to sum over clusters of plots.
as = Area of small fixed-area plot (hectare).
a = Area of large fixed-area plot (hectare).
Estimating area and change —Estimators giving areas by condition classes [A(f)] inthe population and change in these areas over time [∆A(f)] are:
(1)
and
(2)
with variance estimates
(3)
and
(4)
where for cluster h
(5)
and
(6)
Estimating amount and change —The basic estimator of the total amount Y of anyresource at a given time is:
(7)
with an unbiased estimator of variance
(8)
For estimating change, the following formulae are recommended.
l
$( )( )
A fm k
a f
aAt
j t
j
k
h
m
===
∑∑1 1
11 l
∆A f A f A f∧
= −( ) $( ) $( )2 1
v A f a f A f m mt h t th
m
( $( )) ( $ ( ) $( )) ( )= − −=
∑ 2
1
1l q
v A f v A f v A f A f A f∆∧L
NMOQP
= + −( ) $( ) $( ) cov $( ), $( )2 1 1 22
$ ( )( )
a fk
a f A
ah tj t
j
k
==
∑1
1 l
cov $( ), $( ) $ ( ) $( ) $ ( ) $( ) .A f A f a f A f a f A f m mhh
m
h1 2 1 11
2 2 1= − − −=
∑ b g
$ $Ym
y Y mhi hh
m
hih
Nh
= =∏==
∑∑1
11
v YM m
MY Y m mh
h
m
( $ ) $ $ .=−
− −=
∑a fe j a f
1
2
1
5
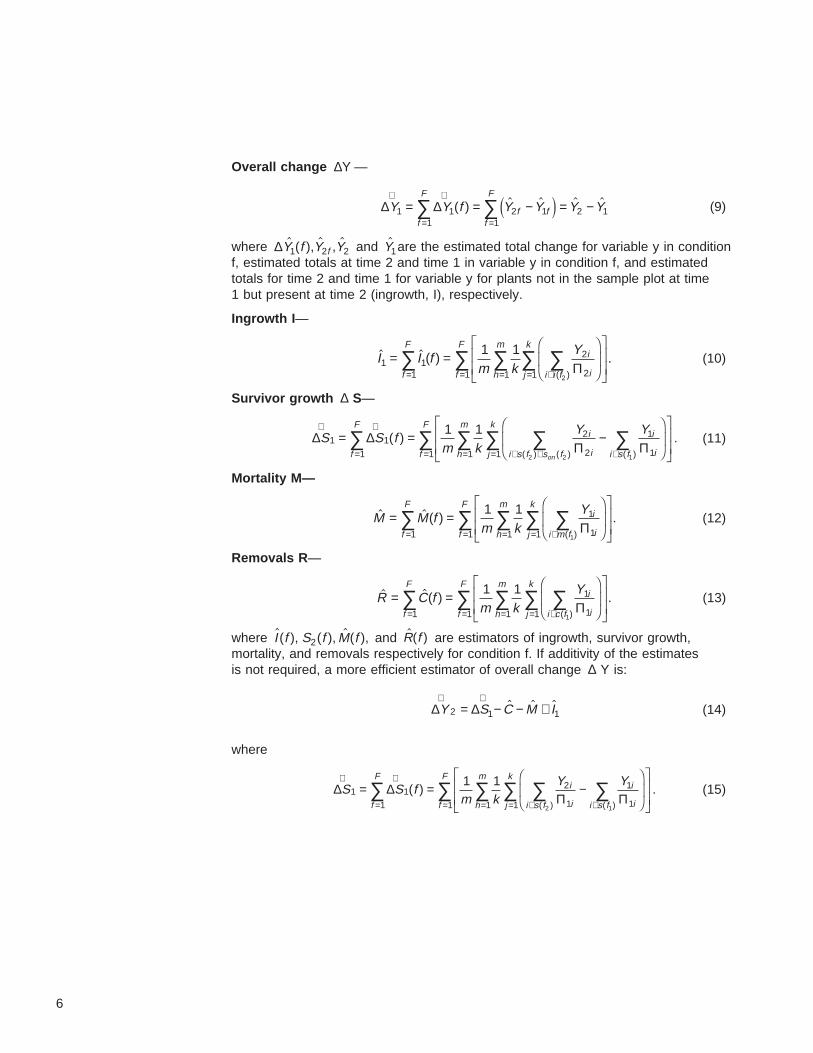
Overall change —
(9)
where and are the estimated total change for variable y in conditionf, estimated totals at time 2 and time 1 in variable y in condition f, and estimatedtotals for time 2 and time 1 for variable y for plants not in the sample plot at time1 but present at time 2 (ingrowth, I), respectively.
Ingrowth I —
(10)
Survivor growth S —
(11)
Mortality M—
(12)
Removals R —
(13)
where and are estimators of ingrowth, survivor growth,mortality, and removals respectively for condition f. If additivity of the estimatesis not required, a more efficient estimator of overall change Y is:
(14)
where
(15)
∆Y
∆ ∆Y Y f Y Y Y Yf ff
F
f
F
1 1 2 1 2 111
∧ ∧
=== = − = −∑∑ ( ) $ $ $ $e j
∆ $ ( ), $ , $Y f Y Yf1 2 2$Y1
$ $ ( ) .( )
I I fm k
Y
f
F
h
mi
ii i fj
k
f
F
1 11 1
2
211
1 1
2
= =F
HG
I
KJ
L
NMM
O
QPP= = ∈==
∑ ∑ ∑∑∑ Π
∆
∆ ∆Π Π
S S fm k
Y Y
f
Fi
i
i
ii s fi s f s fj
k
h
m
f
F
on
∧ ∧
= ∈∈ +==== = −
F
HG
I
KJ
L
NMM
O
QPP∑ ∑∑∑∑∑1 1
1
2
2
1
1111
1 1
12 2
( ) .( )( ) ( )
$ $ ( ) .( )
M M fm k
Y i
ii m fj
k
h
m
f
F
f
F
= =F
HG
I
KJ
L
NMM
O
QPP∈====
∑∑∑∑∑ 1 1 1
11111 1Π
$ $( ) .( )
R C fm k
Y i
ii c fj
k
h
m
f
F
f
F
= =F
HG
I
KJ
L
NMM
O
QPP∈====
∑∑∑∑∑ 1 1 1
11111 1Π
$( ), ( ), $ ( ),I f S f M f2$( )R f
∆
∆ ∆Y S C M I∧ ∧
= − − +2 1 1$ $ $
∆ ∆Π Π
S S fm k
Y Yi
i
i
ii s fi s fj
k
h
m
f
F
f
F∧ ∧
∈∈===== = −
F
HG
I
KJ
L
NMM
O
QPP∑∑∑∑∑∑1 1
2
1
1
11111
1 1
12
( ) .( )( )
6
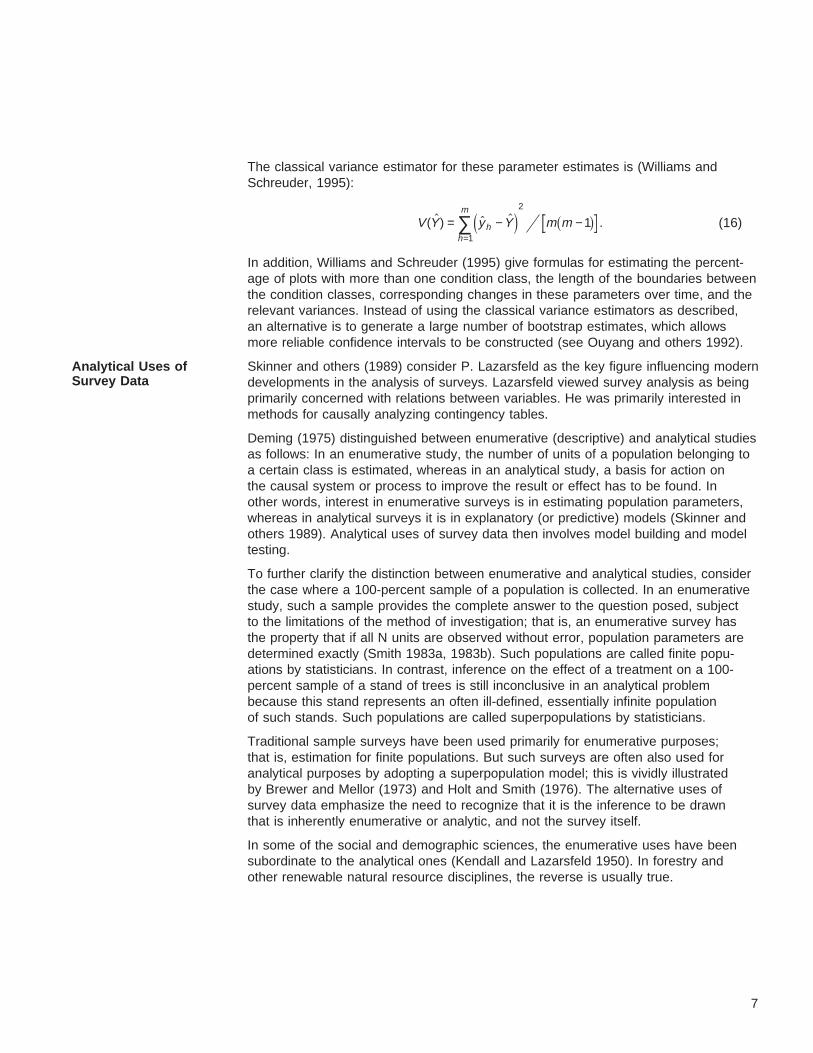
The classical variance estimator for these parameter estimates is (Williams andSchreuder, 1995):
(16)
In addition, Williams and Schreuder (1995) give formulas for estimating the percent-age of plots with more than one condition class, the length of the boundaries betweenthe condition classes, corresponding changes in these parameters over time, and therelevant variances. Instead of using the classical variance estimators as described,an alternative is to generate a large number of bootstrap estimates, which allowsmore reliable confidence intervals to be constructed (see Ouyang and others 1992).
Analytical Uses ofSurvey Data
Skinner and others (1989) consider P. Lazarsfeld as the key figure influencing moderndevelopments in the analysis of surveys. Lazarsfeld viewed survey analysis as beingprimarily concerned with relations between variables. He was primarily interested inmethods for causally analyzing contingency tables.
Deming (1975) distinguished between enumerative (descriptive) and analytical studiesas follows: In an enumerative study, the number of units of a population belonging toa certain class is estimated, whereas in an analytical study, a basis for action onthe causal system or process to improve the result or effect has to be found. Inother words, interest in enumerative surveys is in estimating population parameters,whereas in analytical surveys it is in explanatory (or predictive) models (Skinner andothers 1989). Analytical uses of survey data then involves model building and modeltesting.
To further clarify the distinction between enumerative and analytical studies, considerthe case where a 100-percent sample of a population is collected. In an enumerativestudy, such a sample provides the complete answer to the question posed, subjectto the limitations of the method of investigation; that is, an enumerative survey hasthe property that if all N units are observed without error, population parameters aredetermined exactly (Smith 1983a, 1983b). Such populations are called finite popu-ations by statisticians. In contrast, inference on the effect of a treatment on a 100-percent sample of a stand of trees is still inconclusive in an analytical problembecause this stand represents an often ill-defined, essentially infinite populationof such stands. Such populations are called superpopulations by statisticians.
Traditional sample surveys have been used primarily for enumerative purposes;that is, estimation for finite populations. But such surveys are often also used foranalytical purposes by adopting a superpopulation model; this is vividly illustratedby Brewer and Mellor (1973) and Holt and Smith (1976). The alternative uses ofsurvey data emphasize the need to recognize that it is the inference to be drawnthat is inherently enumerative or analytic, and not the survey itself.
In some of the social and demographic sciences, the enumerative uses have beensubordinate to the analytical ones (Kendall and Lazarsfeld 1950). In forestry andother renewable natural resource disciplines, the reverse is usually true.
V Y y Y m mhh
m
( $) $ $ .= − −=
∑ e j b g1
2
1
7

Analysis of data from large, complex sample surveys can be quite difficult (Landisand others 1982). Difficulties result from complications introduced by unequal prob-ability sampling, imputation for nonresponse, regression estimation and use ofseveral levels of sampling and poststratification, and conflict with the assumptionsmade in classical statistical analysis of mutually independent sample observationsdrawn by simple random sampling. In addition, survey data may contain substantialand confounded measurement errors, although classical models assume no orsimply distributed observational errors (Simmons and Bean 1969). There also isthe question of what superpopulation the sample represents, which is even morepertinent in classical statistical experimentation.
Beyond developing explanatory or predictive models, scientists and managers arealso keenly interested in cause-effect relations. In considering the conditions nec-essary to establish a cause-effect relation, and how difficult is it to achieve theseconditions, Mosteller and Tukey (1977) note that two of three criteria (consistency,responsiveness, and mechanism) must be satisfied. Consistency implies that thepresence and magnitude of the effect (y) is always associated with a minimal levelof the suspected causal agent (x). Responsiveness is established by experimentalexposures to the suspected causal agent and reproducing the symptoms. Mechanism,as it relates to the subject of this paper, is established by demonstrating a biologicalor ecological process that causes the observed effect. Only consistency can beconfirmed by observation alone. Hence, surveys are useful primarily in identifyingpotential cause-effect relations.
There are many examples, particularly in epidemiology, of falsely claiming to haveestablished cause-effect relations. Epidemiologists sometimes cannot conductexperiments on people and cannot randomly assign healthy people to exposureto potentially noxious substances. Because of these limitations, medical researchoften has not followed scientific principles. Recently, however, rigorous clinical trialmethods have enjoyed a major resurgence in medical research. Feinstein (1988)advocates the following principles for observational studies in epidemiology: stipulatea research hypothesis prior to analysis, study a well-specified cohort having a stat-istical factor in common (for example, a tree diameter-class), collect high-quality data,study possible explanations, and avoid personal biases in detecting possible relations.
Although inventories in forestry traditionally have emphasized point and changeestimation, analytical uses of inventory data are becoming more important. Anexample is the effect of treatments on a specific resource. This is particularly likelyto be of importance for NFS inventories where there is a need to examine the effectof treatments applied under operational conditions. Note that effective analytical userequires reliable point and change estimates.
8

Use of survey data either to identify potential cause-effect relations or to establishthem is controversial (Schreuder and Thomas 1992). For sample plots, there arestill many uncontrollable variables (weather, insect epidemics) and essentiallyunmeasurable variables (rainfall, pollution), so many explanations are readilyavailable for an observed effect (such as a change in the population of a birdspecies). Nevertheless, there is no alternative but to use survey data to identifypossible cause-effect relations. Schreuder and McClure (1991) suggest modifica-tions to FIA designs to improve detection of change and identify its possible causes.The broad objectives underlining the modifications to FIA proposed by Schreuderand McClure (1991) are to generate descriptive statistics, detect changes in suchstatistics, and analyze the data to identify possible cause-effect relations. Buteven with these modifications, the emphasis in FIA surveys would still be to collectdescriptive statistics efficiently, especially for timber. The fact is that it is difficultto even identify reasonable potential cause-effect relations, let alone establishcause-effect in the natural resource fields. Simplicity in survey design is morelikely to lead to success in this regard (Schreuder and others 1993).
Quality Assurance Quality assurance refers to the quality control imposed on the collection and proc-essing of data to obtain the most reliable data set and statistics possible for theamount of money spent on the survey. The most detailed quality assurance programfor natural resource inventory and monitoring activities probably is the one used byForest Health Monitoring as required by the Environmental Monitoring and Assess-ment Program (EMAP) of the EPA (U.S. EPA 1992). Forest Health Monitoringembraces the concept of total quality management (TQM), which is a process ofcontinuous improvement and innovation led by managers. Total quality managementfully integrates management philosophy, planning, and operating methodology. Thephilosophy behind TQM is aimed at achieving total employee commitment to quality.To achieve this, TQM focuses on:
• Identification of customers of the survey. All customers must be identified,and effective and continuous communication of their requirements must bemaintained.
• Standards and performance. Proactive rather than reactive measures ofperformance must be used.
• Leadership commitment. This commitment is essential and can be documentedwell by establishing a TQM “culture” during training.
• Employee recognition. A key ingredient to the success of TQM is to establishand implement criteria and mechanisms for recognizing the effort, creativity,and achievement of employees.
• Training. This is listed separately in U.S. EPA (1992), but rigorous training ofcrews who collect data certainly needs to be emphasized in TQM. EMAP makesthe point that such training should focus on the development of organizationaland interpersonal skills as well as technical proficiency.
• Development of a clearly written code of practice for data collection. Thistoo is not listed separately under TQM, but it seems to fit there. This code ofpractice is essential for training and for ready reference during data collection.
9

Specific quality assurance objectives for Forest Health Monitoring are (U.S. EPA1992):
• Compatibility of data. For purposes in Region 6, this means compatibility ofdata within and among Forests and with cooperators such as FIA and BLM.
• Meeting specified levels of uncertainty that the users are willing to accept.Such statements should be definitive and either quantitative or qualitative.
• Documentation of data collection methods. Such documentation ensuresthat information on data quality, statistical design, algorithms, protocols, andanalytical procedures are available for comment.
• Verification and validation of data. A systematic approach to verification andvalidation ensures that all data are subjected to basic standards of accuracyto verify their authenticity and reliability.
To facilitate data verification and validation, U.S. EPA (1992) recommends use ofportable data recorders, electronic data verification, and remeasurement of somefield plots as follows:
• Crews should remeasure a representative sample of their own plots so thatestimates of their “within-field” precision can be determined.
• All field crews should measure a series of reference plots so that measuresof accuracy and “between-crew” precision can be determined.
• Remeasurement, by a check crew, of a representative sample of plots com-pleted by field crews. This, too, can measure crew accuracy and between-crewprecision.
Methods Based on the specified sampling objectives, design criteria, directions from theFS Washington Office, literature, personal experience, and the concern in Region 6for a single inventory database with consistent resource estimates, the approachsummarized below was adopted.
Approach Adopted The general approach to IM adopted by Region 6 is explained in the following seriesof statements. These statements document the principles and key features of the IMsystem.
• Continue the development of Regional Geographic Information Systems (GIS)databases for historical vegetation, current vegetation, and potential naturalvegetation across all FS lands, using all levels of technology including state-of-the-art modeling and satellite imagery.
• Pursue developing techniques for continually updating GIS databases.
• Establish a 5.47-kilometer (3.4-mile) square grid across all NFS land regardlessof administrative classification or forest allocation. This grid is compatible withthat used by the Pacific Northwest Research Station FIA unit and is expectedto be adequate to meet FIA sampling error standards for each National Forest inRegion 6. This grid system was implemented in 1993 on all NFS land. Ecologicalland units (Bailey 1994, USDA Forest Service 1993) should be identified andmapped on the sample units. Establishing this grid in the field is expected tobe completed by the end of 1996.
10

• Through partnership with FIA, develop standards and procedures for measuringground sample units to include data necessary to meet information needs at alllevels of the FS. Coordinate operational inventory activities with FIA, includingdata collection, quality control, data compilation and analysis, and reporting. Thework for any activity may be accomplished by one or both administrative units orby contractors, according to the intra-Agency agreement.
• For land management planning, Forest plan implementation, and monitoringchanges in land and vegetation for all NFS lands excluding wilderness, use amore intensive grid (four times more intense) of a 2.74-kilometer (1.7-mile)square. Using this approach, Region 6 personnel have the option to repeatedlypoststratify the databases as necessary to provide critical information to forestmanagers. Information will not be constrained by strata definitions adopted in atypical prestratified inventory.
• If the standard grid (2.74-km [1.7-mi] square) for data acquisition does not meetall the vegetation or modeling needs of the forest planning effort (it is a given thatit will not), install a supplemental 1.37-kilometer (0.85-mile) grid. It is at this stagethat other data sources may be incorporated into the information base. Forexample, the occurrence of Pacific yew was a specific need dictating a particularGIS mapping overlay. Such a grid “intensification” can be tied to any use or mapas a basis for supplemental sampling.
• Sample all vegetation on all NFS land. In addition, data needed to estimatebiomass and carbon loading should be collected.
• Maintain flexibility in design to facilitate addressing future questions. This isaccommodated by establishing a self-weighting, equal probability, systematicgrid of sampling units on the ground.
• Maintain the ability to formally incorporate existing information of acceptablequality from other survey sources, such as special range, wildlife, recreation,and soil surveys.
• Provide a formal framework for designing and implementing special studies.
• Ensure that (1) the sampling units do not change over time because of sub-jectivity in the way they are defined, (2) estimates are statistically valid anddefensible, and (3) statistical estimates of reliability are provided with the mostimportant estimates.
Mapping Use of maps for estimating area —Historically, Region 6 has used several methodsto derive area estimates for a variety of purposes. These methods, regardless of howthe data were acquired, ranged from plot expansion, in sampling, to determining areafrom maps. No effort was made to estimate the error associated with any of the areaestimates or the effect of that error on a particular forest resource estimate. This hasbeen a continual concern for forest planners and should be of concern to all forestmanagers.
11

Technological changes in the management of natural resources and expansion ofissues encompassing the total landscape have necessitated that the design of inven-tories be flexible enough to be compatible with maps created from a wide range ofsources; for example, Landsat imagery and aerial photography used for ecologicalunits, predictive modeling, and even arbitrary delineations of the land base. Thisflexibility does not make it easier to provide resource estimates or make planningand decisionmaking easier or more certain.
Mapping strategy selected —Various maps of the resources are acceptable, butany map used must be evaluated, quantitatively, for accuracy. Methods for assessingaccuracy of maps are currently being developed (Czaplewski 1992, 1994) and willbe incorporated into the IM system when available.
Sampling Frame andPlot Design
To select a probabilistic sample, several sampling frames and designs are possible.All those considered preceded the Robertson (1993) letter and are included herefor completeness. We first discuss alternative sampling frames and then alternativedesigns for the ground plot installations.
Sampling frames —The three frames considered were:
• Existing vegetation polygons (similar to historical stand maps).
• Ecological polygons (also called ecological units [USDA Forest Service 1993]).
• Systematic grid of primary sampling units (PSUs). Each PSU contains a clusterof plots and line transects to subsample the PSU.
The advantages and disadvantages of each of these frames are given below.
Existing vegetation polygons (VP) —
Advantages:
• Allow easy inclusion of information from other (local) management surveys.
• Facilitate impact analysis because they comprise units that are more meaningfulto resource specialists.
• Provide estimates of variation among polygons, within given classes, and withinpolygons.
• Provide a basis for grouping similar vegetation polygons into meaningful strata toimprove efficiency.
Disadvantages:
• Likely to be unstable over time, particularly the boundaries. Clearly, vegetationchanges over time, and there is concern that the vegetative classification systemmay not be repeatable given new remote sensing information (for example, newLandsat data) and newly developed models.
• May be relatively inefficient, from a sampling perspective, because a VP shouldbe relatively uniform or homogeneous within itself. Subplots within the VP wouldnot sample much variation if the classification is done accurately.
12

Ecological polygons (EP) —
Advantage:
• Likely to provide a better base for “ecologically based” management becausethey are more consistent with the management planning process, both indeveloping and implementing the plan.
Disadvantages:
• Likely to be a lack of objectivity in defining the EPs, particularly in establishingtheir boundaries. This will lead to variability, among field crews and even withinindividuals, in defining boundaries.
• Possible major change in definitions of EPs over time. This could affectboundaries on the ground and pose problems when estimating trends.
Systematic grid of primary sampling units (PSUs) —
Advantages:
• Totally objective.
• Consistent over time.
• Likely to be relatively efficient from a sampling perspective; that is, a cluster ofsampling locations (over a reasonably large PSU) should cover considerablevariation.
• Simple in concept and implementation.
• Provide self-weighting PSUs.
• Accommodate any form of poststratification.
Disadvantages:
• Less compatible with “ecologically based” management.
• More difficult to accomplish impact analysis.
• More difficult to include information from special inventories or impact analysissurveys because these most likely focus on specific polygons or ecologicalresponse units.
• Altering sampling intensities and keeping a consistent grid limits the flexibilityof the design.
Plot designs —All five plot designs considered are cluster designs in the sensethat a larger PSU is defined, at least conceptually, and then is subsampled. Thesize and shape of the several plot designs, as well as the subsampling details,differ considerably. The PSUs for these designs are as follows:
1. One-hectare (2.47-acre) circular plot.
2. One-hectare (2.47-acre) rectangular plot.
3. A satellite system of seven subplots in a hexagonal arrangement.
13

4. A satellite system of five subsample points in a symmetric arrangement covering2.5 hectares (6.2 acres).
5. A transect (linear) arrangement of five subsample points with supplementalsampling for particular insect, disease, and tree conditions.
Each of these plot designs is described in detail below, including the proposed planfor subsampling the PSU.
Alternative (1)— Satellite system of five subplots sampling a fixed-area, circular PSUof 1 hectare (2.47 acres).
• Contains five nested, fixed-area, circular subplots with size changing given thevariable of interest; for example,
Grass and forbs—3-meter (9.8-ft) radius
Regeneration—trees <12.7-centimeters (5-in) in diameter at breast height(d.b.h.), 3-meter (9.8-ft) radius
Trees 12.7-25.4 centimeters (5-10 in) in d.b.h., 6-meter (19.7-ft) radius
Trees 25.4-101.6 centimeters (10-40 in) in d.b.h., 18-meter (59.1-ft) radius
Trees >101.6 centimeters (>40 in), entire area of 1 hectare (2.47 acres)
• The subplots are laid out in a symmetrical design.
• Some response variables, such as tree mortality, can be tallied for the entirehectare or any representative subset of the plot.
• Transects can be laid out from subplot locations; for example,
5 at about 10-meter (32.8-ft) intervals for down woody material
5 at about 10-meter (32.8-ft) intervals for shrub cover
• No substitution or movement of the plot is allowed for changing vegetationconditions in the field.
Alternative (2)— A rectangular, fixed-area PSU subsampled by rectangular subplotslocated linearly within the PSU.
• PSU has dimensions of 10 by 1000 meters or 20 by 500 meters (32.8 by3280.8 ft or 65.6 by 1640.4 ft).
• Contains fixed-area rectangular subplots with size based on the variable ofinterest; for example,
Regeneration—trees <12.7 centimeters (5 in) in d.b.h., 5 by 5 meters (16.4 by16.4 ft)
Trees 12.7-25.4 centimeters (5-10 in) in d.b.h., 10 by 10 meters (32.8 by32.8 ft)
Trees 25.4-101.6 centimeters (10-40 in) in d.b.h., 10 by 20 meters (32.8 by65.6 ft)
Trees >101.6 centimeters (40 in) in d.b.h., entire area of 1 hectare (2.47 acres)
14

• Five subplots are laid out at regular intervals to collect information on live trees:
Random starting point
Plots may be tied to center of rectangle or along one side to allow forcoincident boundaries (easier to monument)
• Mortality can be tallied for the entire hectare.
• Transects can be laid out along the direction of travel
5 at about 40-meter (131.2-ft) intervals for down woody material
5 at about 40-meter (131.2-ft) intervals for shrub cover
• No substitution or movement is allowed for changing conditions.
• Plot may have a random or systematic orientation.
• Allows for maximum variability of the response variables correlated with standbasal area within the PSU.
• PSU may end up crossing several vegetation conditions.
Alternative (3)— A satellite system of seven subplots in a hexagonal arrangement.
• The center plot controls the plot configuration and substitution rules.
• Satellite plots are a combination of fixed-area circular and variable-radius plots;for example,
Regeneration—trees <12.7 centimeters (5 in) in d.b.h., 3.3-meter (10.8-ft)radius
Trees 12.7-91.4 centimeters (5-36 in) in d.b.h., 7 BAF (metric; that is, 7 squaremeters/hectare [30.5 square feet/acre])
Trees >91.4-centimeter (36 in) in d.b.h., 18-meter (59.1-ft) radius
• Distances among subplots are predetermined and fixed so route of travel is easy.
• No fixed area is associated with the plot design.
• Mortality can be tallied on satellite plots by using same rules as for live trees.
• Substitution (point rotation) is allowed for changing conditions.
Alternative (4)— A satellite system of five subsample points, arranged symmetrically,covering about 2.5 hectares (6.2 acres).
• Design is currently operational (Pacific Northwest Research Station-FIA unit inCalifornia).
• Subsample plots are a combination of fixed-area and variable-radius plots; forexample,
Regeneration—trees <12.7 centimeters (5 in) in d.b.h., 3.3-meter (10.8-ft)radius
Trees 12.7-91.4 centimeters (5-36 in) in d.b.h., 7 BAF (metric; that is, 7 squaremeters/hectare [30.5 square feet/acre])
15

Trees 91.4 centimeters (36 in) in d.b.h., 18-meter (59.1-ft) radius
• Two line transects per subsample point are included in the plot design formeasuring residue or physical and chemical properties. Each transect is17 meters (55.8 ft) long.
• Mortality is tallied on subsample points under the same rules as for live trees.
• Lesser vegetation is tallied on a 5-meter (16.4-ft) radius circular plot at eachsubsample point.
• Root disease is mapped on a 17-meter (55.8-ft) radius circular plot at eachsubsample point.
• No substitution is allowed for changing conditions.
Alternative (5)— A transect (linear) arrangement of five subsample points withsupplemental sampling for particular insect, disease, and tree conditions.
• Subsample points are a combination of fixed-radius and variable-radius plots; forexample,
Regeneration—trees <12.7 centimeters (5 in) in d.b.h., 3.3-meter (10.8-ft)radius
Trees 12.7-101.6 centimeter (5-40 in) in d.b.h., 7 BAF (metric; that is,7 square meters/hectare [30.5 square feet/acre])
Trees >101.6 centimeter (>40 in) in d.b.h., 18-meter (59.1-ft) radius
• Area sampled is about 2 hectares (4.9 acres), although no fixed area isassociated with the plot design.
• Twenty supplemental points, spaced at regular intervals between the subsamplepoints, follow the same sampling rules as for the five subsample points, but onlyfor predetermined conditions; for example, root disease, bark beetles, dwarfmistletoe.
• Mortality is tallied on subsample points.
• Line transects can be included between points.
• No substitution of subsample points allowed for changing conditions.
Plot design selected— Beginning in summer 1993, Region 6 installed vegetationinventory plots on 5.47- and 2.74-kilometer (3.4- and 1.7-mile) grids across all NFSlands in Oregon and Washington. A version of the alternative (1) plot design wasselected. The plot design is illustrated in figure 1. The main features of this designare as follows:
• PSU size (sample unit) is 1 hectare (2.47 acres).
• Each PSU consists of five subplots each representing 1/5 hectare (1/2 acre).
• Each subplot consists of three concentric, fixed-area plots used to limitmeasurement to certain tree diameter classes.
• On each 0.02-hectare (1/20-acre) fixed-area sample at each subplot, an ecologyplot is installed based on the plant association guides developed for each Forest.
16
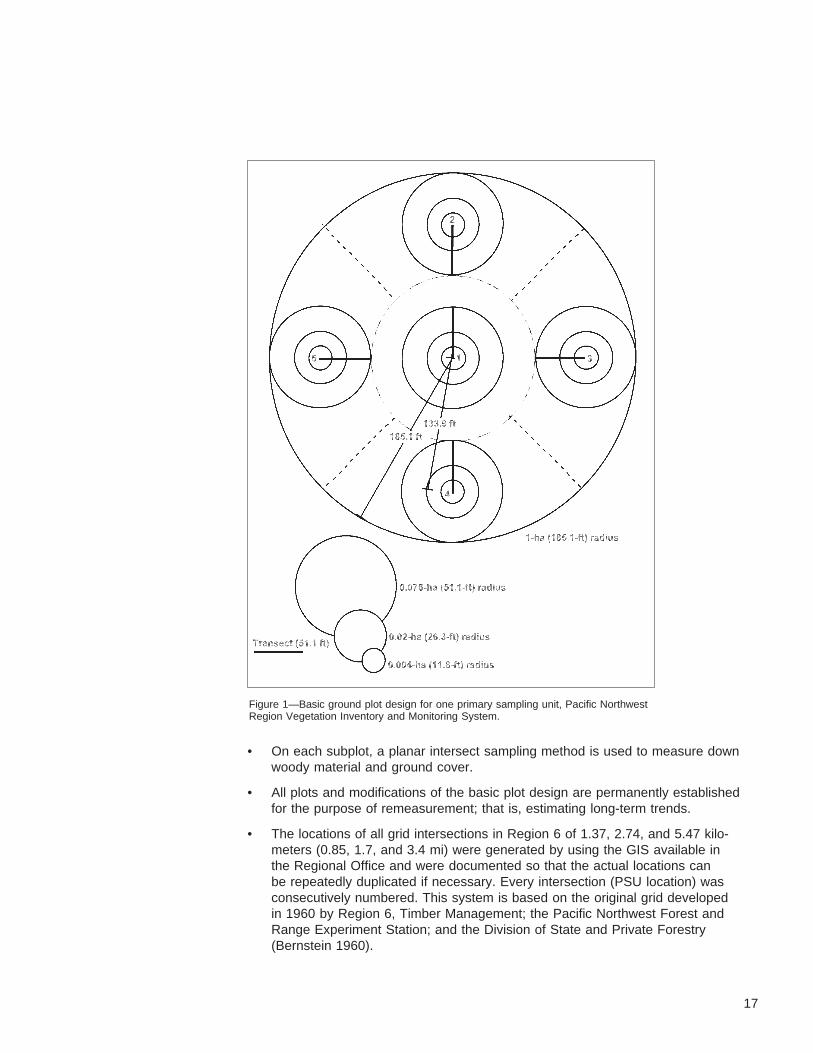
• On each subplot, a planar intersect sampling method is used to measure downwoody material and ground cover.
• All plots and modifications of the basic plot design are permanently establishedfor the purpose of remeasurement; that is, estimating long-term trends.
• The locations of all grid intersections in Region 6 of 1.37, 2.74, and 5.47 kilo-meters (0.85, 1.7, and 3.4 mi) were generated by using the GIS available inthe Regional Office and were documented so that the actual locations canbe repeatedly duplicated if necessary. Every intersection (PSU location) wasconsecutively numbered. This system is based on the original grid developedin 1960 by Region 6, Timber Management; the Pacific Northwest Forest andRange Experiment Station; and the Division of State and Private Forestry(Bernstein 1960).
Figure 1—Basic ground plot design for one primary sampling unit, Pacific NorthwestRegion Vegetation Inventory and Monitoring System.
17

The concentric plot sizes and associated diameter ranges are as follows:
— 0.004 hectare (1/100 acre) for seedlings <7.4 centimeter (3.0 in)
— 0.02 hectare (1/20 acre) for trees 7.6 to 32.8 centimeters (3.0 to 12.9 in)
— 0.08 hectare (1/5 acre) for trees 32.9 to 81.0 centimeters (13.0 to 31.9 in—east side)
— 0.08 hectare (1/5 acre) for trees 32.9 to 121.7 centimeters (13.0 to 47.9 in—west side)
— 1 hectare (2.54 acres) for trees >81.0 centimeters (32.0 in—east side) and>121.9 centimeters (48.0 in—west side) and for rare features such as occurrenceof root rot or tally of mortality
Some specific attributes of the selected alternative are:
• This plot design does not allow for rotation or changes in the layout of anysubplots, which conforms to the mandate of the Chief of the FS (Robertson1993).
• By not allowing for rotation of subplots, any major change in vegetation mustbe mapped as part of the plot information.
• The plot design is flexible enough to be modified by a project or Forest tomeet specific data requirements (for example, sampling for mortality, acquiringold-growth training sites), and it could have worked well for the Pacific yewinventory. The subplot sizes used to furnish the 1993 and 1994 data are beingexamined to determine if some modification is required. However, the 1-hectare(2.47-acre) circular plot still will be used as the PSU.
Quality Assurance The following quality assurance procedures will be followed:
• A clearly understandable manual will be provided for Region 6 data collectioncrews.
• Potential customers of the inventory results will be identified and have anopportunity to comment on this paper and on proposed and actual products.
• All FS data collection crews (direct employees) will be given 10 days of trainingin plot establishment, measurement, and inventory procedures.
• Demonstrations of plot establishment and plot inspection shall be given to allcontracted data collection crews.
• All data collection crews must measure successfully two out of three certificationplots before they are allowed to work on an inventory project.
• The work of all data collection crews shall be inspected at a rate of one plot infive during the entire project and shall be evaluated by the same set of dataacquisition standards as defined in their contract.
• All inspected plots shall become a part of the inventory database as well as partof the quality control database.
• Inspection of the work of all field inspectors shall be done through the RegionalOffice with assistance from other Forest inspectors.
18

Data Processing andEstimation
Rigorous quality control of the field data will be built into development of the finaldatabase. The estimation theory given for mapped designs in the “Review ofLiterature” will be used. The necessary computer algorithms are now beingdeveloped by the U.S. Department of Agriculture, Forest Service, TimberManagement Service Center, Fort Collins, CO.2
Analyses Procedures for analysis will be developed as data from the IM system becomeavailable. These will be keyed to the available standard statistical packages.
Acknowledgment We acknowledge the contributions of David Born, Research Forester (now retired),U.S. Department of Agriculture, Forest Service, Intermountain Research Station,324 25th Street, Ogden, UT 84401, an initial member of the committee.
References Bailey, R.G. 1994. Ecoregions of the United States. 2d ed., rev. Washington, DC:U.S. Department of Agriculture, Forest Service. 1:7,500,000; Albers equal areaprojection; colored.
Bechtold, W.A.; Ruark, G.A.; Lloyd, F.T. 1991. Changing stand structure andregional growth reductions in Georgia’s natural pine stands. Forest Science. 37:703-717.
Bernstein, D.A. 1960. Using the master sample grid in continuous forest inventory,Division of Timber Management. Portland, OR: U.S. Department of Agriculture,Forest Service, Pacific Northwest Region. Unpublished report. On file with: PacificNorthwest Region, P.O. Box 3623, Portland, OR 97208-3623.
Birdsey, R.A.; Schreuder, H.T. 1992. An overview of forest inventory and analysisestimation procedures in the eastern U.S.—with an emphasis on components ofchange. Tech. Rep. RM-214. [Fort Collins, CO]: U.S. Department of Agriculture,Forest Service, Rocky Mountain Forest and Range Experiment Station. 11 p.
Brewer, K.R.W.; Mellor, R.W. 1973. The effect of sample structure on analyticalsurveys. Australian Journal of Statistics. 15: 145-152.
Czaplewski, R.L. 1992. Accuracy assessment of remotely sensed classifications withmulti-phase sampling and the multivariate composite estimator. In: Proceedings16th international biometric conference; 7-11 December 1992; Hamilton, NewZealand. Hamilton, New Zealand: Ruakura Agricultural Centre, Statistics Section:22.
Czaplewski, R.L. 1994. Variance approximations for assessments of classificationaccuracy. Res. Pap. RM-316. Fort Collins, CO: U.S. Department of Agriculture,Forest Service, Rocky Mountain Forest and Range Experiment Station. 29 p.
Deming, W.E. 1975. On probability as a basis for action. American Statistician. 29:146-152.
Feinstein, A.R. 1988. Scientific standards in epidemiologic studies of the menace ofdaily life. Science. 242: 1257-1263.
Forest and Rangeland Renewable Resources Planning Act. Act of Aug. 17,1974. 88 Stat. 476, as amended; 16 U.S.C. 1600-1614.
2 Personal communication. 1995. Roy Mita, Forester, U.S.Department of Agiculture, Forest Service, 3825 E. Mulberry St.,Fort Collins, CO 80524.
19

Hahn, J.T.; MacLean, C.D.; Arner, S.L.; Bechtold, W.A. 1995. Procedures tohandle inventory cluster plots that straddle two or more conditions. ForestScience Monograph. 31: 12-25.
Hall, J.V.; Frayer, W.E.; Wilen, B.O. 1994. Status of Alaska wetlands. Anchorage,AK: U.S. Fish and Wildlife Service, Alaska Region. 33 p.
Holt, D.; Smith, T.M.F. 1976. The design of surveys for planning purposes.Australian Journal of Statistics. 28: 37-44.
Kendall, P.L.; Lazarsfeld, P.F. 1950. Problems of survey analysis. In: Merton, R.K.;Lazarsfeld, P.F., eds. Continuities in social research: studies in the scope andmethods of the American soldier. Chicago: Free Press.
Köhl, M. 1994. Statistical design for the second Swiss forest inventory: a conceptapplying aerial photography and terrestrial sampling. Heft 69. Mitteilungen derEidgen. Forschungs austalt für Wald, Schnee, und Landschaft. Birmensdorf,Switzerland: [Publisher unknown]. 141 p. In German.
Landis, J.R.; Lepkowski, Eklund, J.M.; Stehouwer, S.A. 1982. A statisticalmethodology for analyzing data from a complex survey: the first national healthand nutrition examination survey. Series 2, 92. [Place of publication unknown]:U.S. Department of Health and Human Services, Public Health Service, NationalCenter for Health Statistics. 52 p.
MacDonald, L.E.; Smart, A.W.; Wissmar, R.C. 1991. Monitoring guidelines toevaluate effects of forestry activities on streams in the Pacific Northwest andAlaska. Seattle, WA: U.S. Environmental Protection Agency, Region 10. 166 p.
Messer, J.J.; Linthurst, R.A.; Overton, W.S. 1991. An EPA program for monitoringecological status and trends. Environmental Monitoring Assessment. 17: 67-78.
Mosteller, F.; Tukey, J.W. 1977. Data analysis and regression. Reading, MA:Addison-Wesley Publishing Co.
National Research Council. 1994. Rangeland health—new methods to classify,inventory, and monitor rangelands. Washington, DC: National Academy Press.180 p.
Ouyang, Z.; Schreuder, H.T.; Li, J. 1992. A reevaluation of the growth declinein Georgia and Georgia-Alabama. Proceedings, 1991 Kansas State UniversityConference on applied statistics in agriculture; 1991 April 28-30; Manhattan, KS.[Place of publication unknown]: [publisher unknown]: 54-61.
Ouyang, Z.; Srivastava, J.N.; Schreuder, H.T. 1993. A general ratio estimatorand its application to regression model sampling. Annual Institute StatisticalMathematics. 45: 113-127.
Robertson, F.D. 1993. Forest inventory plot rotation. Letter dated June 24, 1993,to USDA Forest Service Regional Foresters, Station Directors, and Area Directors.On file with: Office of the Chief, U.S. Department of Agriculture, Forest Service,P.O. Box 96090, Washington, DC 20090-6090.
Ruark, G.A.; Thomas, C.E.; Bechtold, W.A.; May, D.M. 1991. Growth reductionsin naturally regenerated southern pine stands in Alabama and Georgia. SouthernJournal of Applied Forestry. 15: 73-79.
20

Schreuder, H.T.; McClure, J.P. 1991. Modifying forest survey procedures toestablish cause-effect, should it be done? 10th world forestry congress; 1991September; Paris, France. Revue Forestière Francaise. Hors Série 4, Sect. D.:67-78.
Schreuder, H.T.; Thomas, C.E. 1992. Establishing cause-effect relationships usingforest survey data. Forest Science. 37: 1497-1525.
Schreuder, H.T.; Gregoire, T.G.; Wood, G. 1993. Sampling methods for multi-resource forest inventory. New York: John Wiley. 446 p.
Scott, C.T.; Bechtold, W.A. 1995. Techniques and computations for mapping plotclusters that straddle stand boundaries. Forest Science Monograph. 31: 46-61.
Simmons, W.R.; Bean, J.A. 1969. Impact of design and estimation componentson inference. In: Johnson, N.L.; Smith, H., eds. New developments in surveysampling. New York: John Wiley: 601-628.
Skinner, C.J.; Holt, D.; Smith, T.M.F., eds. 1989. Analysis of complex surveys.New York: John Wiley. 309 p.
Smith, T.M.F. 1983a. A comment: an evaluation of model-dependent and probability-sampling inferences in sample surveys. Journal of American Statistical Association.78: 801-802.
Smith, T.M.F. 1983b. On the validity of inferences from non-random samples. Journalof Royal Statistical Society Annual. 146: 394-403.
U.S. Department of Agriculture, Forest Service. 1993. National hierarchical frame-work of ecological units. Washington, DC. 14 p. Administrative document. On filewith: USDA Forest Service, P.O. Box 96090, Washington, DC 20090-6090.
U.S. Environmental Protection Agency. 1992. Monitoring and research strategyfor forests—environmental monitoring and assessment program (EMAP).EPA/600/A-91/012. Washingon, DC.
Williams, M.S.; Schreuder, H.T. 1995. Documentation and evaluation of growthand other estimators for the fully mapped design used by FIA: a simulation study.Forest Science Monograph. 31: 26-45.
21
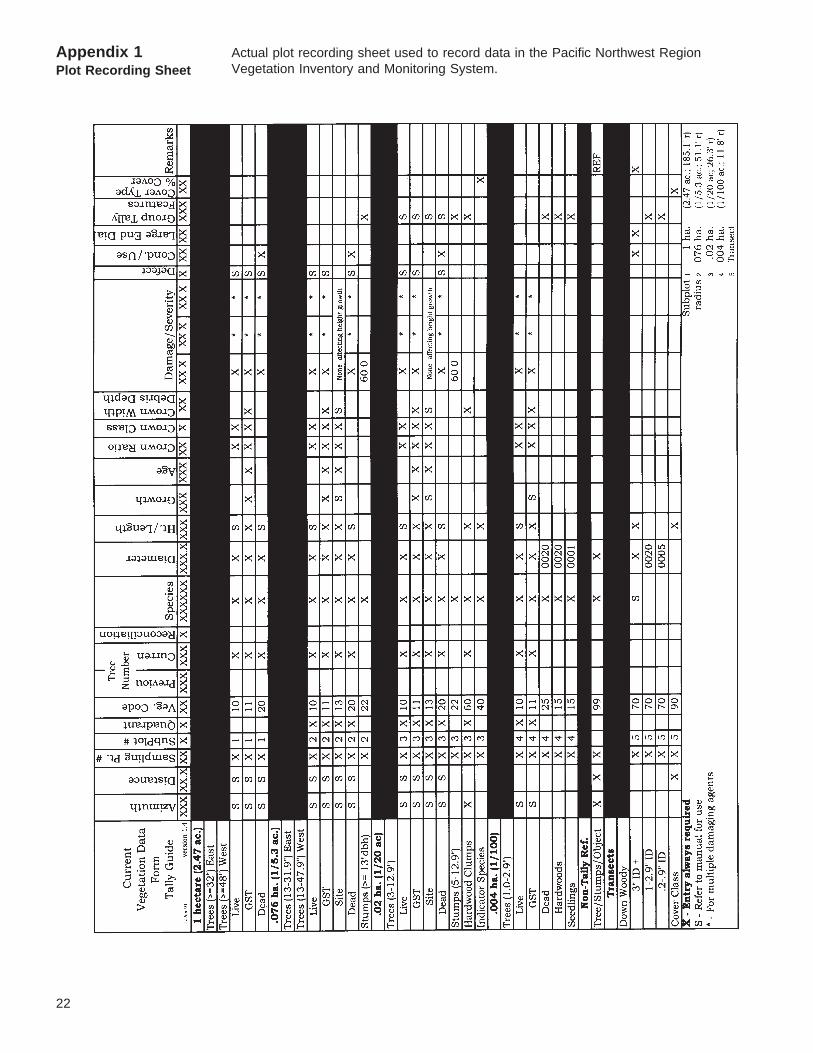
Appendix 1Plot Recording Sheet
Actual plot recording sheet used to record data in the Pacific Northwest RegionVegetation Inventory and Monitoring System.
22

Max, Timothy A.; Schreuder, Hans T.; Hazard, John W.; Oswald, Daniel D.;Teply, John; Alegria, Jim. 1996. The Pacific Northwest Region vegetationand inventory monitoring system. Res. Pap. PNW-RP-493. Portland, OR: U.S.Department of Agriculture, Forest Service, Pacific Northwest Research Station.22 p.
A grid sampling strategy was adopted for broad-scale inventory and monitoring offorest and range vegetation on National Forest System lands in the Pacific North-west Region, USDA Forest Service. This paper documents the technical detailsof the adopted design and discusses alternative sampling designs that wereconsidered. A less technical description of the selected design will be givenelsewhere. The grid consists of a regular, square spacing with 5.47 kilometers(3.4 mi) between grid points. The primary sampling unit (PSU), established ateach grid sampling point, consists of a circular, 1-hectare (2.47-acre) plot. ThePSU is subsampled with a set of different-sized fixed-area subplots, as well as linetransects, to assess all components of vegetation. The design is flexible and can beused with many types of maps. The theory of point and change estimation isdescribed, as well as estimates of variation that assess the statistical precision ofestimates.
Keywords: Sampling, plot design, fixed-area plots, line intersect sampling, monitoring,National Forest System, Pacific Northwest.
The Forest Service of the U.S. Department ofAgriculture is dedicated to the principle of multipleuse management of the Nation’s forest resources forsustained yields of wood, water, forage, wildlife, andrecreation. Through forestry research, cooperation withthe States and private forest owners, and management ofthe National Forests and National Grasslands, it strives—as directed by Congress—to provide increasingly greaterservice to a growing Nation.
The United States Department of Agriculture (USDA)prohibits discrimination in its programs on the basisof race, color, national origin, sex, religion, age, disability,political beliefs, and marital or familial status. (Not allprohibited bases apply to all programs.) Persons withdisabilities who require alternative means of communica-tion of program information (Braille, large print, audiotape,etc.) should contact the USDA Office of Communicationsat (202) 720-2791.
To file a complaint, write the Secretary of Agriculture,U.S. Department of Agriculture, Washington, DC 20250,or call (202) 720-7327 (voice), or (202) 720-1127 (TDD).USDA is an equal employment opportunity employer.
Pacific Northwest Research Station333 S.W. First AvenueP.O. Box 3890Portland, Oregon 97208-3890

U.S. Department of AgriculturePacific Northwest Research Station333 S.W. First AvenueP.O. BoxPortland, Oregon 97208-3890
Official BusinessPenalty for Private Use, $300
do NOT detach Label