Embed Size (px)
Citation preview
UNITED STATES SECURITIES AND EXCHANGE COMMISSION
Washington, D.C. 20549
FORM 10-Q
(Mark one)
For the quarterly period ended April 4, 2015
OR
For the transition period from to
Commission File Number 1-7724
(Exact name of registrant as specified in its charter)
(262) 656-5200 (Registrant’s telephone number, including area code)
Indicate by check mark whether the registrant (1) has filed all reports required to be filed by Section 13 or 15(d) of the SecuritiesExchange Act of 1934 during the preceding 12 months (or for such shorter period that the registrant was required to file such reports),and (2) has been subject to such filing requirements for the past 90 days. Yes ⌧ No �
Indicate by check mark whether the registrant has submitted electronically and posted on its corporate Web site, if any, everyInteractive Data File required to be submitted and posted pursuant to Rule 405 of Regulation S-T (§232.405 of this chapter) during the preceding 12 months (or for such shorter period that the registrant was required to submit and post such files). Yes ⌧ No �
Indicate by check mark whether the registrant is a large accelerated filer, an accelerated filer, a non-accelerated filer, or a smaller reporting company. See the definitions of “large accelerated filer,” “accelerated filer” and “smaller reporting company” in Rule 12b-2 of the Exchange Act.
Large accelerated filer ⌧ Accelerated filer � Non-accelerated filer � Smaller reporting company �
Indicate by check mark whether the registrant is a shell company (as defined in Rule 12b-2 of the Exchange Act). Yes � No ⌧
Indicate the number of shares outstanding of each of the registrant’s classes of common stock, as of the latest practicable date:
⌧ QUARTERLY REPORT PURSUANT TO SECTION 13 OR 15(d) OF THE SECURITIES EXCHANGE ACT OF 1934
� TRANSITION REPORT PURSUANT TO SECTION 13 OR 15(d) OF THE SECURITIES EXCHANGE ACT OF 1934
Delaware 39-0622040(State of incorporation) (I.R.S. Employer Identification No.)
2801 80 Street, Kenosha, Wisconsin 53143(Address of principal executive offices) (Zip code)
Class Outstanding at April 17, 2015 Common Stock, $1.00 par value 58,093,809 shares
th

TABLE OF CONTENTS
2
PagePart I: Financial Information
Item 1. Financial Statements
Condensed Consolidated Statements of Earnings (unaudited) – Three Months Ended April 4, 2015, and March 29, 2014 3
Condensed Consolidated Statements of Comprehensive Income (unaudited) – Three Months Ended April 4, 2015, and March 29, 2014 4
Condensed Consolidated Balance Sheets (unaudited) – April 4, 2015, and January 3, 2015 5-6
Condensed Consolidated Statements of Equity (unaudited) – Three Months Ended April 4, 2015, and March 29, 2014 7
Condensed Consolidated Statements of Cash Flows (unaudited) – Three Months Ended April 4, 2015, and March 29, 2014 8
Notes to Condensed Consolidated Financial Statements (unaudited) 9-29
Item 2. Management’s Discussion and Analysis of Financial Condition and Results of Operations 30-42
Item 3. Quantitative and Qualitative Disclosures About Market Risk 43-44
Item 4. Controls and Procedures 44-45
Part II: Other Information
Item 2. Unregistered Sales of Equity Securities and Use of Proceeds 45-46
Item 6. Exhibits 47
Signatures 48
Exhibit Index 49
PART I. FINANCIAL INFORMATION
Item 1: Financial Statements
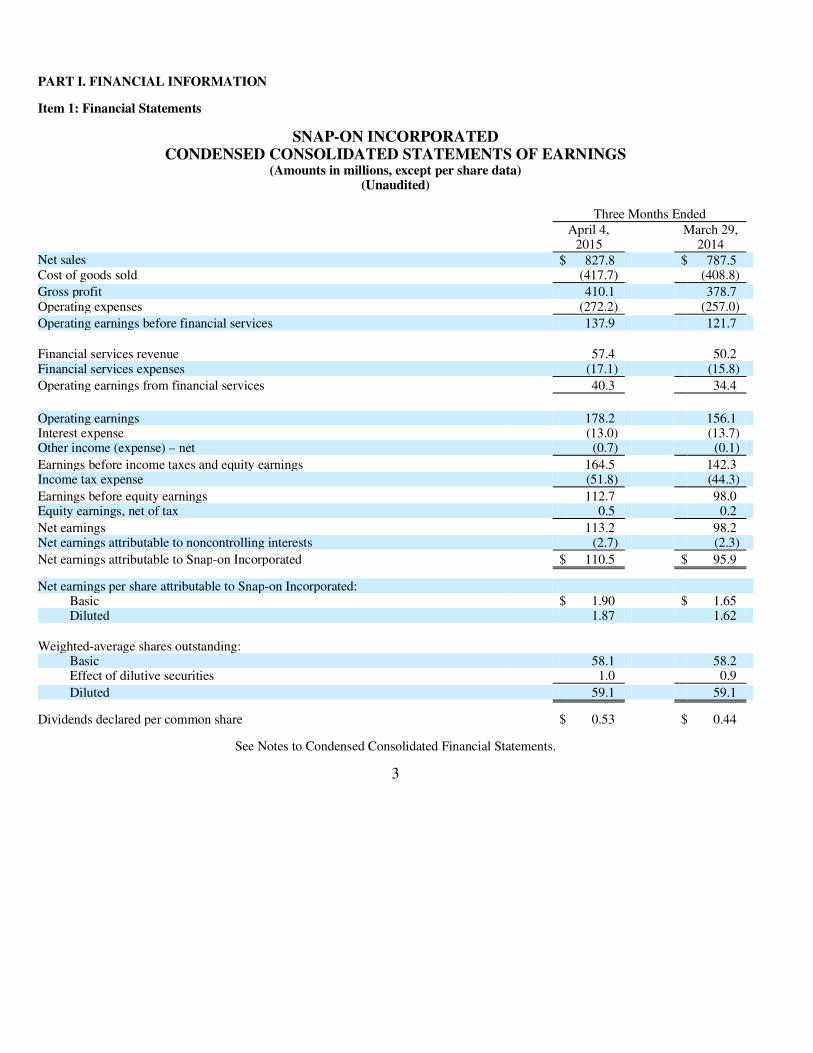
SNAP-ON INCORPORATED CONDENSED CONSOLIDATED STATEMENTS OF EARNINGS
(Amounts in millions, except per share data) (Unaudited)
See Notes to Condensed Consolidated Financial Statements.
3
Three Months Ended
April 4, 2015
March 29,2014
Net sales $ 827.8 $ 787.5 Cost of goods sold (417.7) (408.8)
Gross profit 410.1 378.7 Operating expenses (272.2) (257.0)
Operating earnings before financial services 137.9 121.7
Financial services revenue 57.4 50.2 Financial services expenses (17.1) (15.8)
Operating earnings from financial services 40.3 34.4
Operating earnings 178.2 156.1 Interest expense (13.0) (13.7) Other income (expense) – net (0.7) (0.1)
Earnings before income taxes and equity earnings 164.5 142.3 Income tax expense (51.8) (44.3)
Earnings before equity earnings 112.7 98.0 Equity earnings, net of tax 0.5 0.2
Net earnings 113.2 98.2 Net earnings attributable to noncontrolling interests (2.7) (2.3)
Net earnings attributable to Snap-on Incorporated $ 110.5 $ 95.9
Net earnings per share attributable to Snap-on Incorporated:
Basic $ 1.90 $ 1.65 Diluted 1.87 1.62
Weighted-average shares outstanding:
Basic 58.1 58.2 Effect of dilutive securities 1.0 0.9
Diluted 59.1 59.1
Dividends declared per common share $ 0.53 $ 0.44
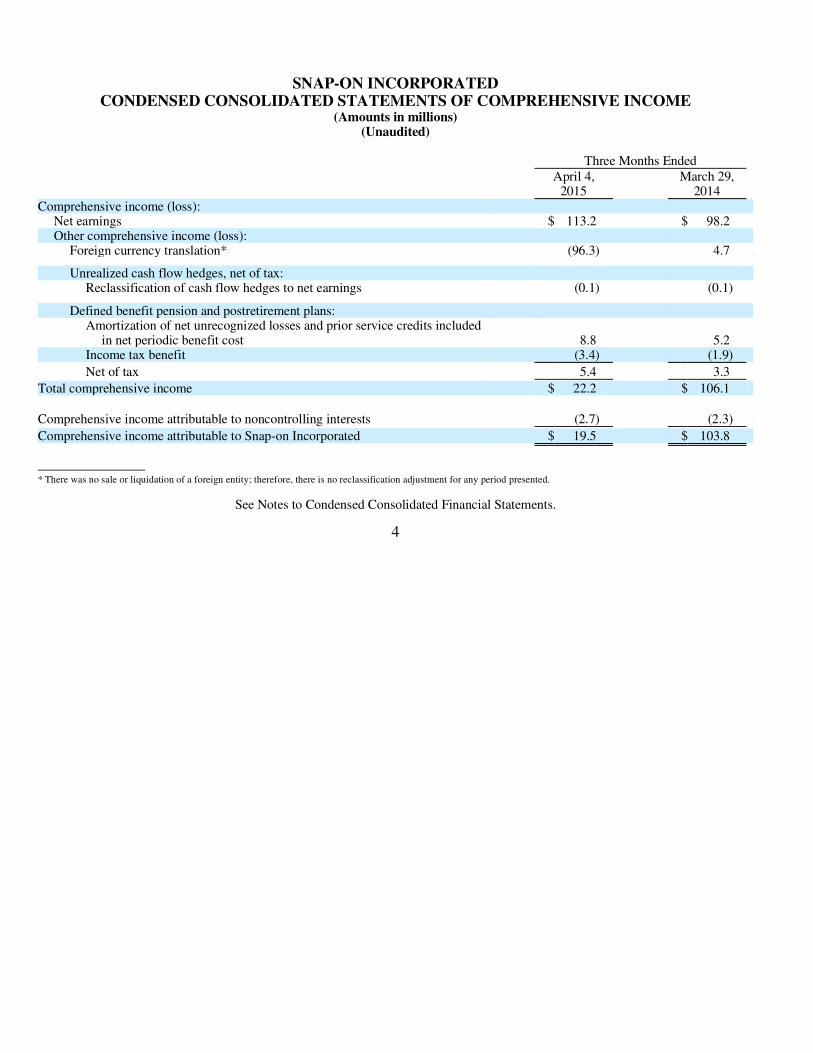
SNAP-ON INCORPORATED CONDENSED CONSOLIDATED STATEMENTS OF COMPREHENSIVE INCOME
(Amounts in millions) (Unaudited)
See Notes to Condensed Consolidated Financial Statements.
4
Three Months Ended
April 4, 2015
March 29,2014
Comprehensive income (loss):
Net earnings $ 113.2 $ 98.2 Other comprehensive income (loss):
Foreign currency translation* (96.3) 4.7
Unrealized cash flow hedges, net of tax:
Reclassification of cash flow hedges to net earnings (0.1) (0.1)
Defined benefit pension and postretirement plans:
Amortization of net unrecognized losses and prior service credits included in net periodic benefit cost 8.8 5.2
Income tax benefit (3.4) (1.9)
Net of tax 5.4 3.3
Total comprehensive income $ 22.2 $ 106.1
Comprehensive income attributable to noncontrolling interests (2.7) (2.3)
Comprehensive income attributable to Snap-on Incorporated $ 19.5 $ 103.8
* There was no sale or liquidation of a foreign entity; therefore, there is no reclassification adjustment for any period presented.
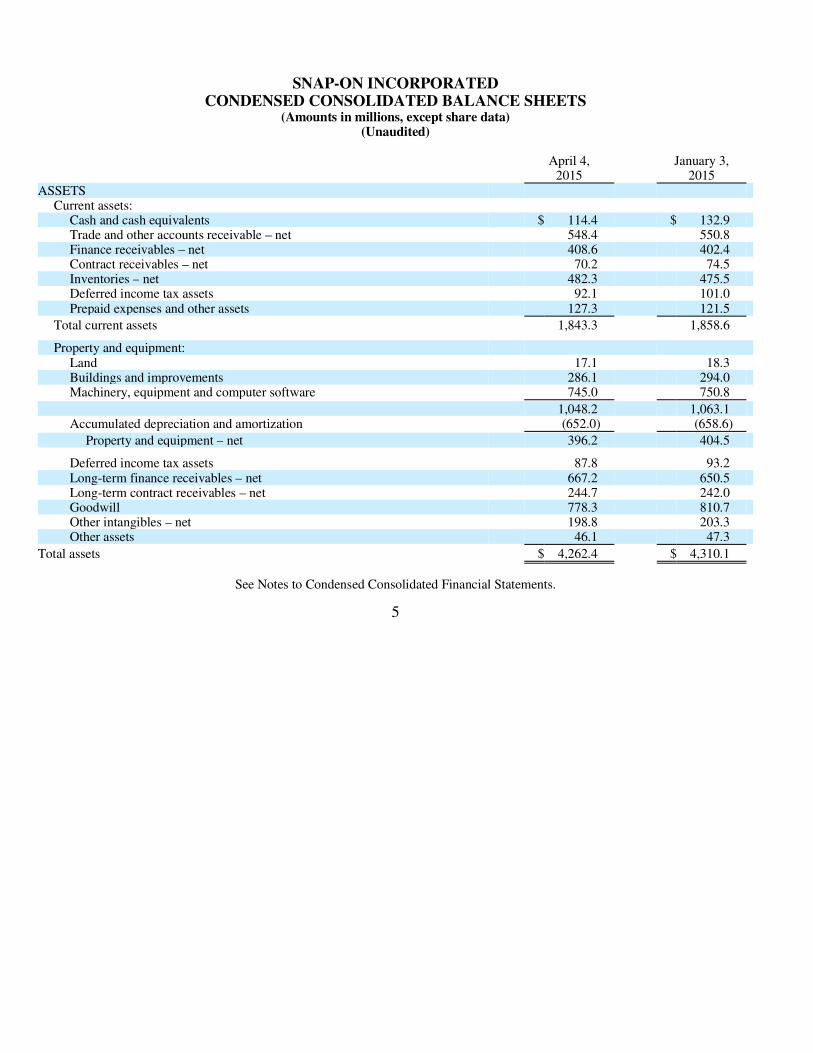
SNAP-ON INCORPORATED CONDENSED CONSOLIDATED BALANCE SHEETS
(Amounts in millions, except share data) (Unaudited)
See Notes to Condensed Consolidated Financial Statements.
5
April 4, 2015
January 3,2015
ASSETS
Current assets:
Cash and cash equivalents $ 114.4 $ 132.9 Trade and other accounts receivable – net 548.4 550.8 Finance receivables – net 408.6 402.4 Contract receivables – net 70.2 74.5 Inventories – net 482.3 475.5 Deferred income tax assets 92.1 101.0 Prepaid expenses and other assets 127.3 121.5
Total current assets 1,843.3 1,858.6
Property and equipment:
Land 17.1 18.3 Buildings and improvements 286.1 294.0 Machinery, equipment and computer software 745.0 750.8
1,048.2 1,063.1 Accumulated depreciation and amortization (652.0) (658.6)
Property and equipment – net 396.2 404.5
Deferred income tax assets 87.8 93.2 Long-term finance receivables – net 667.2 650.5 Long-term contract receivables – net 244.7 242.0 Goodwill 778.3 810.7 Other intangibles – net 198.8 203.3 Other assets 46.1 47.3
Total assets $ 4,262.4 $ 4,310.1
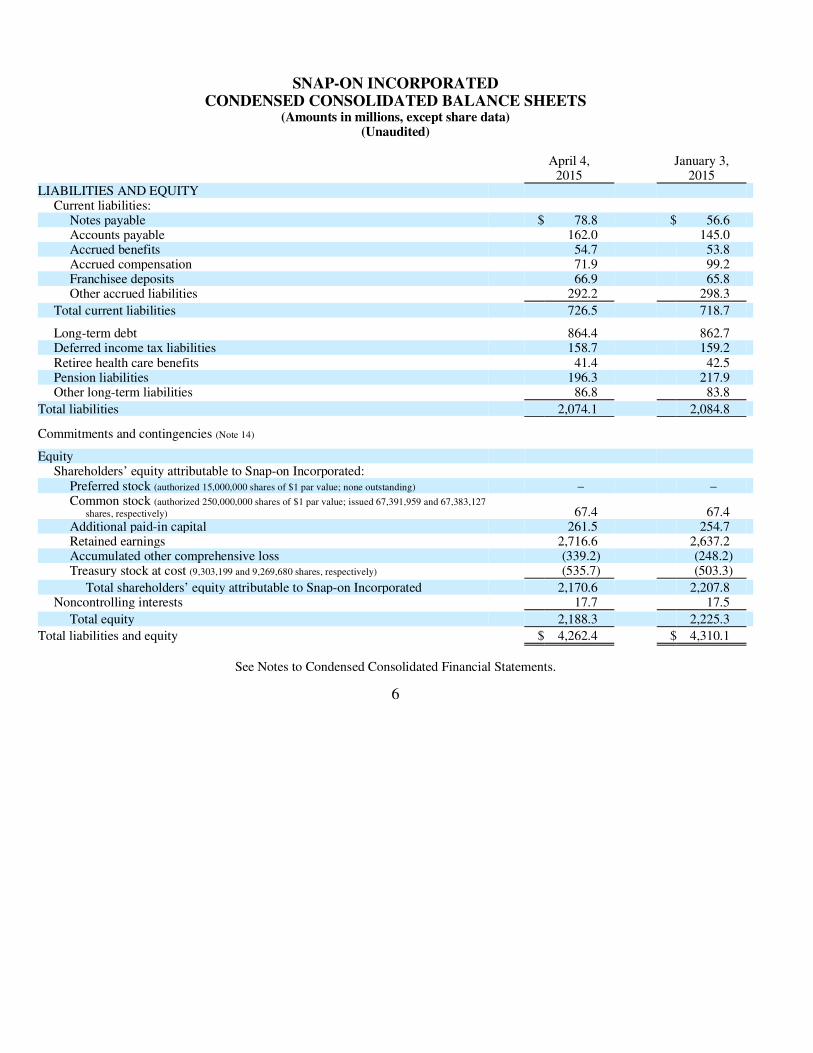
SNAP-ON INCORPORATED CONDENSED CONSOLIDATED BALANCE SHEETS
(Amounts in millions, except share data) (Unaudited)
See Notes to Condensed Consolidated Financial Statements.
6
April 4, 2015
January 3,2015
LIABILITIES AND EQUITY
Current liabilities:
Notes payable $ 78.8 $ 56.6 Accounts payable 162.0 145.0 Accrued benefits 54.7 53.8 Accrued compensation 71.9 99.2 Franchisee deposits 66.9 65.8 Other accrued liabilities 292.2 298.3
Total current liabilities 726.5 718.7
Long-term debt 864.4 862.7 Deferred income tax liabilities 158.7 159.2 Retiree health care benefits 41.4 42.5 Pension liabilities 196.3 217.9 Other long-term liabilities 86.8 83.8
Total liabilities 2,074.1 2,084.8
Commitments and contingencies (Note 14)
Equity Shareholders’ equity attributable to Snap-on Incorporated:
Preferred stock (authorized 15,000,000 shares of $1 par value; none outstanding) – – Common stock (authorized 250,000,000 shares of $1 par value; issued 67,391,959 and 67,383,127
shares, respectively) 67.4 67.4 Additional paid-in capital 261.5 254.7 Retained earnings 2,716.6 2,637.2 Accumulated other comprehensive loss (339.2) (248.2) Treasury stock at cost (9,303,199 and 9,269,680 shares, respectively) (535.7) (503.3)
Total shareholders’ equity attributable to Snap-on Incorporated 2,170.6 2,207.8 Noncontrolling interests 17.7 17.5
Total equity 2,188.3 2,225.3
Total liabilities and equity $ 4,262.4 $ 4,310.1
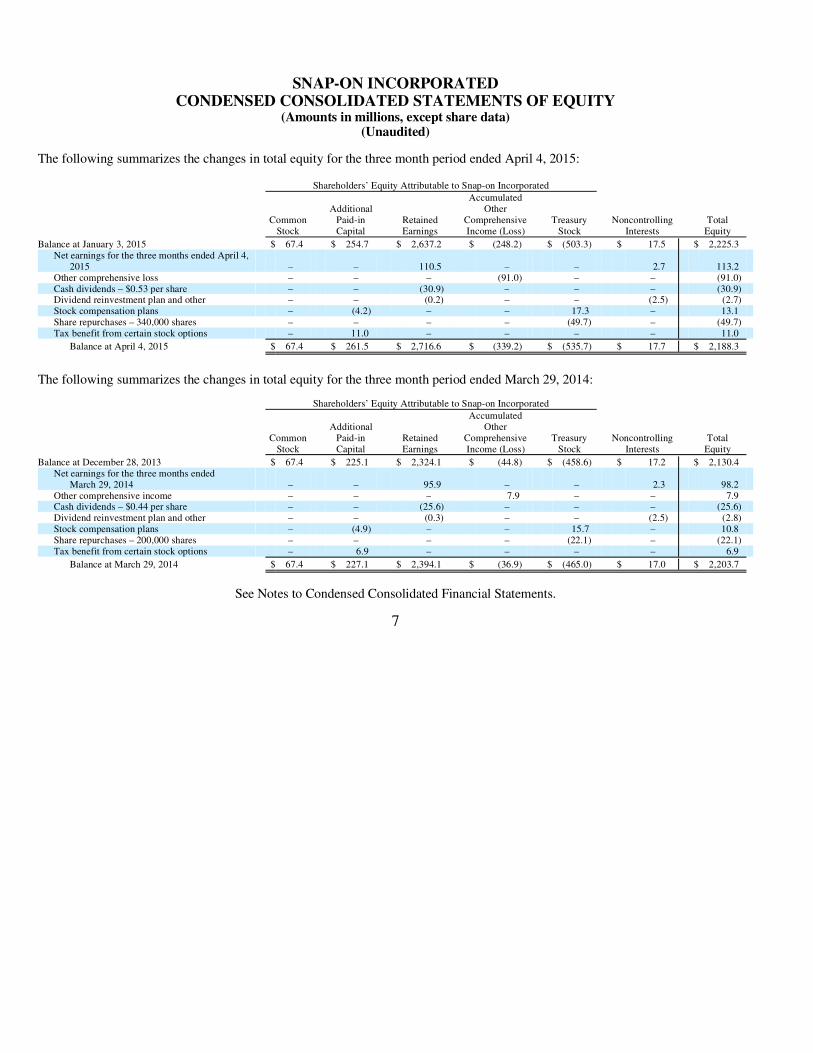
SNAP-ON INCORPORATED CONDENSED CONSOLIDATED STATEMENTS OF EQUITY
(Amounts in millions, except share data) (Unaudited)
The following summarizes the changes in total equity for the three month period ended April 4, 2015:
See Notes to Condensed Consolidated Financial Statements.
7
Shareholders’ Equity Attributable to Snap-on Incorporated
Common
Stock
AdditionalPaid-in Capital
RetainedEarnings
AccumulatedOther
ComprehensiveIncome (Loss)
Treasury Stock
NoncontrollingInterests
TotalEquity
Balance at January 3, 2015 $ 67.4 $ 254.7 $ 2,637.2 $ (248.2) $ (503.3) $ 17.5 $ 2,225.3 Net earnings for the three months ended April 4,
2015 – – 110.5 – – 2.7 113.2 Other comprehensive loss – – – (91.0) – – (91.0) Cash dividends – $0.53 per share – – (30.9) – – – (30.9) Dividend reinvestment plan and other – – (0.2) – – (2.5) (2.7) Stock compensation plans – (4.2) – – 17.3 – 13.1 Share repurchases – 340,000 shares – – – – (49.7) – (49.7) Tax benefit from certain stock options – 11.0 – – – – 11.0
Balance at April 4, 2015 $ 67.4 $ 261.5 $ 2,716.6 $ (339.2) $ (535.7) $ 17.7 $ 2,188.3
The following summarizes the changes in total equity for the three month period ended March 29, 2014:
Shareholders’ Equity Attributable to Snap-on Incorporated
Common
Stock
AdditionalPaid-in Capital
RetainedEarnings
AccumulatedOther
ComprehensiveIncome (Loss)
Treasury Stock
NoncontrollingInterests
TotalEquity
Balance at December 28, 2013 $ 67.4 $ 225.1 $ 2,324.1 $ (44.8) $ (458.6) $ 17.2 $ 2,130.4 Net earnings for the three months ended
March 29, 2014 – – 95.9 – – 2.3 98.2 Other comprehensive income – – – 7.9 – – 7.9 Cash dividends – $0.44 per share – – (25.6) – – – (25.6) Dividend reinvestment plan and other – – (0.3) – – (2.5) (2.8) Stock compensation plans – (4.9) – – 15.7 – 10.8 Share repurchases – 200,000 shares – – – – (22.1) – (22.1) Tax benefit from certain stock options – 6.9 – – – – 6.9
Balance at March 29, 2014 $ 67.4 $ 227.1 $ 2,394.1 $ (36.9) $ (465.0) $ 17.0 $ 2,203.7
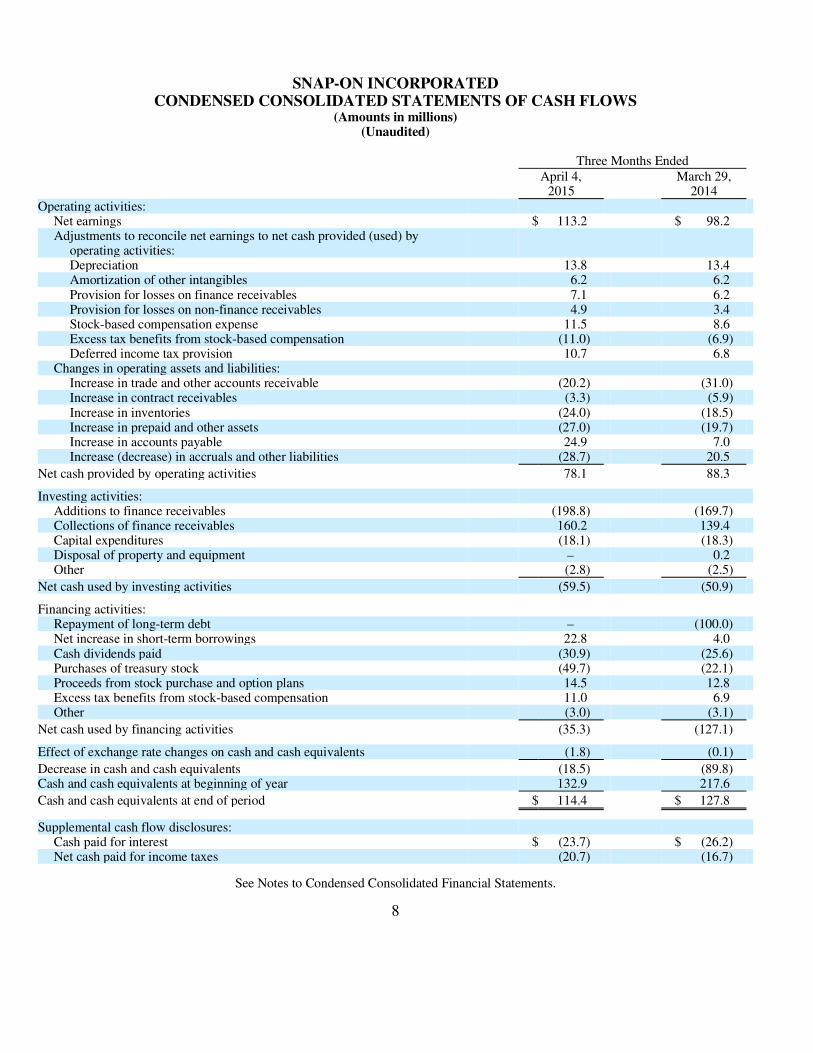
SNAP-ON INCORPORATED CONDENSED CONSOLIDATED STATEMENTS OF CASH FLOWS
(Amounts in millions) (Unaudited)
See Notes to Condensed Consolidated Financial Statements.
8
Three Months Ended
April 4, 2015
March 29,2014
Operating activities:
Net earnings $ 113.2 $ 98.2 Adjustments to reconcile net earnings to net cash provided (used) by
operating activities:
Depreciation 13.8 13.4 Amortization of other intangibles 6.2 6.2 Provision for losses on finance receivables 7.1 6.2 Provision for losses on non-finance receivables 4.9 3.4 Stock-based compensation expense 11.5 8.6 Excess tax benefits from stock-based compensation (11.0) (6.9) Deferred income tax provision 10.7 6.8
Changes in operating assets and liabilities:
Increase in trade and other accounts receivable (20.2) (31.0) Increase in contract receivables (3.3) (5.9) Increase in inventories (24.0) (18.5) Increase in prepaid and other assets (27.0) (19.7) Increase in accounts payable 24.9 7.0 Increase (decrease) in accruals and other liabilities (28.7) 20.5
Net cash provided by operating activities 78.1 88.3
Investing activities:
Additions to finance receivables (198.8) (169.7) Collections of finance receivables 160.2 139.4 Capital expenditures (18.1) (18.3) Disposal of property and equipment – 0.2 Other (2.8) (2.5)
Net cash used by investing activities (59.5) (50.9)
Financing activities:
Repayment of long-term debt – (100.0) Net increase in short-term borrowings 22.8 4.0 Cash dividends paid (30.9) (25.6) Purchases of treasury stock (49.7) (22.1) Proceeds from stock purchase and option plans 14.5 12.8 Excess tax benefits from stock-based compensation 11.0 6.9 Other (3.0) (3.1)
Net cash used by financing activities (35.3) (127.1)
Effect of exchange rate changes on cash and cash equivalents (1.8) (0.1)
Decrease in cash and cash equivalents (18.5) (89.8) Cash and cash equivalents at beginning of year 132.9 217.6
Cash and cash equivalents at end of period $ 114.4 $ 127.8
Supplemental cash flow disclosures:
Cash paid for interest $ (23.7) $ (26.2) Net cash paid for income taxes (20.7) (16.7)
SNAP-ON INCORPORATED NOTES TO CONDENSED CONSOLIDATED FINANCIAL STATEMENTS
(Unaudited)
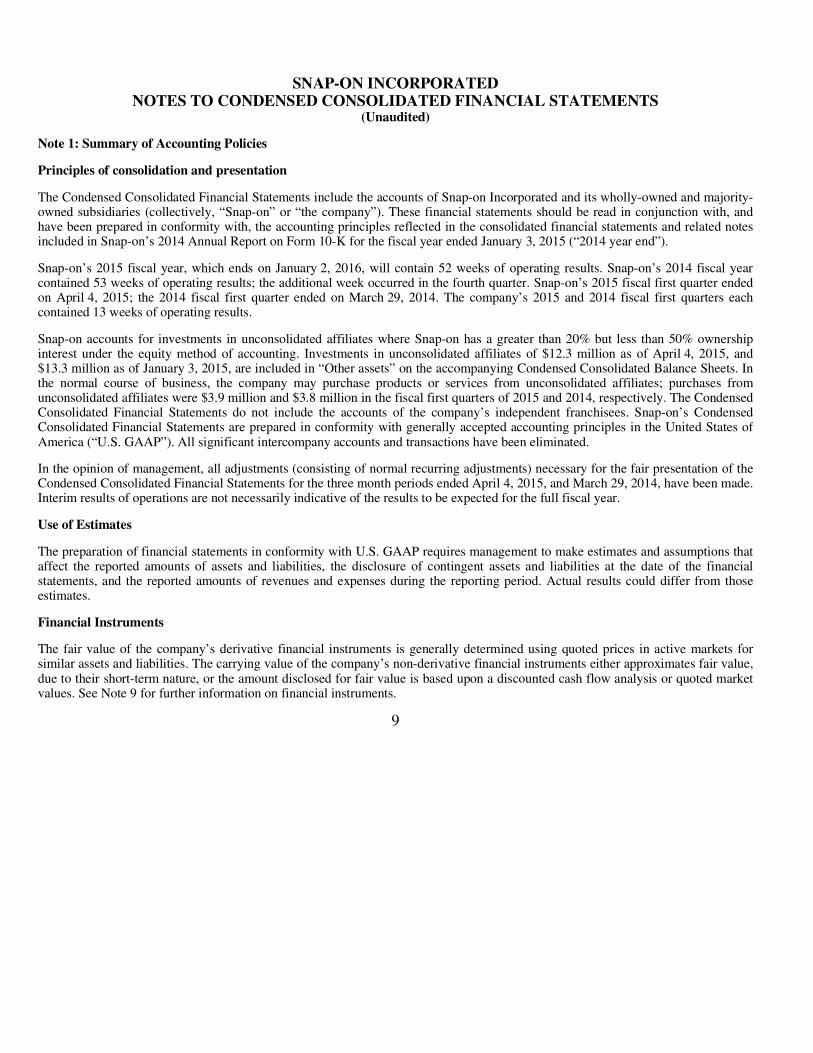
Note 1: Summary of Accounting Policies
Principles of consolidation and presentation
The Condensed Consolidated Financial Statements include the accounts of Snap-on Incorporated and its wholly-owned and majority-owned subsidiaries (collectively, “Snap-on” or “the company”). These financial statements should be read in conjunction with, andhave been prepared in conformity with, the accounting principles reflected in the consolidated financial statements and related notesincluded in Snap-on’s 2014 Annual Report on Form 10-K for the fiscal year ended January 3, 2015 (“2014 year end”).
Snap-on’s 2015 fiscal year, which ends on January 2, 2016, will contain 52 weeks of operating results. Snap-on’s 2014 fiscal year contained 53 weeks of operating results; the additional week occurred in the fourth quarter. Snap-on’s 2015 fiscal first quarter endedon April 4, 2015; the 2014 fiscal first quarter ended on March 29, 2014. The company’s 2015 and 2014 fiscal first quarters each contained 13 weeks of operating results.
Snap-on accounts for investments in unconsolidated affiliates where Snap-on has a greater than 20% but less than 50% ownership interest under the equity method of accounting. Investments in unconsolidated affiliates of $12.3 million as of April 4, 2015, and$13.3 million as of January 3, 2015, are included in “Other assets” on the accompanying Condensed Consolidated Balance Sheets. Inthe normal course of business, the company may purchase products or services from unconsolidated affiliates; purchases fromunconsolidated affiliates were $3.9 million and $3.8 million in the fiscal first quarters of 2015 and 2014, respectively. The CondensedConsolidated Financial Statements do not include the accounts of the company’s independent franchisees. Snap-on’s Condensed Consolidated Financial Statements are prepared in conformity with generally accepted accounting principles in the United States ofAmerica (“U.S. GAAP”). All significant intercompany accounts and transactions have been eliminated.
In the opinion of management, all adjustments (consisting of normal recurring adjustments) necessary for the fair presentation of theCondensed Consolidated Financial Statements for the three month periods ended April 4, 2015, and March 29, 2014, have been made.Interim results of operations are not necessarily indicative of the results to be expected for the full fiscal year.
Use of Estimates
The preparation of financial statements in conformity with U.S. GAAP requires management to make estimates and assumptions thataffect the reported amounts of assets and liabilities, the disclosure of contingent assets and liabilities at the date of the financialstatements, and the reported amounts of revenues and expenses during the reporting period. Actual results could differ from thoseestimates.
Financial Instruments
The fair value of the company’s derivative financial instruments is generally determined using quoted prices in active markets forsimilar assets and liabilities. The carrying value of the company’s non-derivative financial instruments either approximates fair value,due to their short-term nature, or the amount disclosed for fair value is based upon a discounted cash flow analysis or quoted marketvalues. See Note 9 for further information on financial instruments.
9
SNAP-ON INCORPORATED NOTES TO CONDENSED CONSOLIDATED FINANCIAL STATEMENTS (continued)
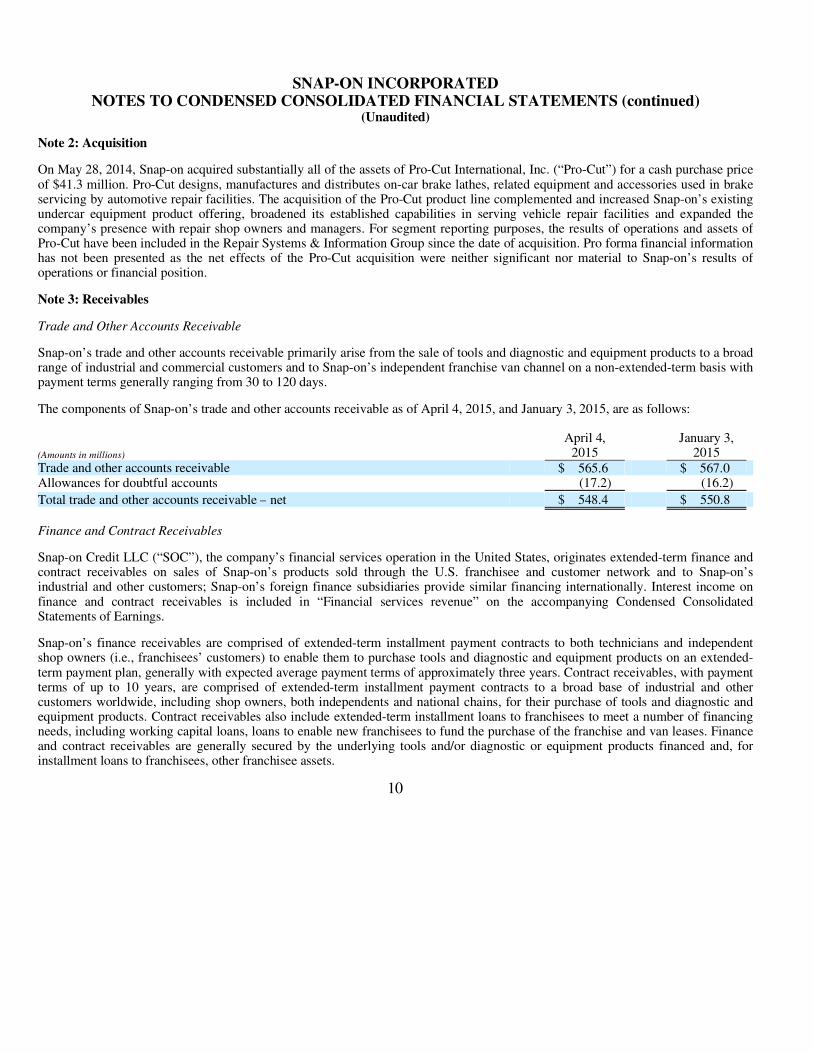
(Unaudited) Note 2: Acquisition
On May 28, 2014, Snap-on acquired substantially all of the assets of Pro-Cut International, Inc. (“Pro-Cut”) for a cash purchase price of $41.3 million. Pro-Cut designs, manufactures and distributes on-car brake lathes, related equipment and accessories used in brakeservicing by automotive repair facilities. The acquisition of the Pro-Cut product line complemented and increased Snap-on’s existing undercar equipment product offering, broadened its established capabilities in serving vehicle repair facilities and expanded thecompany’s presence with repair shop owners and managers. For segment reporting purposes, the results of operations and assets ofPro-Cut have been included in the Repair Systems & Information Group since the date of acquisition. Pro forma financial informationhas not been presented as the net effects of the Pro-Cut acquisition were neither significant nor material to Snap-on’s results of operations or financial position.
Note 3: Receivables
Trade and Other Accounts Receivable
Snap-on’s trade and other accounts receivable primarily arise from the sale of tools and diagnostic and equipment products to a broadrange of industrial and commercial customers and to Snap-on’s independent franchise van channel on a non-extended-term basis with payment terms generally ranging from 30 to 120 days.
The components of Snap-on’s trade and other accounts receivable as of April 4, 2015, and January 3, 2015, are as follows:
Finance and Contract Receivables
Snap-on Credit LLC (“SOC”), the company’s financial services operation in the United States, originates extended-term finance and contract receivables on sales of Snap-on’s products sold through the U.S. franchisee and customer network and to Snap-on’s industrial and other customers; Snap-on’s foreign finance subsidiaries provide similar financing internationally. Interest income onfinance and contract receivables is included in “Financial services revenue” on the accompanying Condensed Consolidated Statements of Earnings.
Snap-on’s finance receivables are comprised of extended-term installment payment contracts to both technicians and independentshop owners (i.e., franchisees’ customers) to enable them to purchase tools and diagnostic and equipment products on an extended-term payment plan, generally with expected average payment terms of approximately three years. Contract receivables, with paymentterms of up to 10 years, are comprised of extended-term installment payment contracts to a broad base of industrial and othercustomers worldwide, including shop owners, both independents and national chains, for their purchase of tools and diagnostic andequipment products. Contract receivables also include extended-term installment loans to franchisees to meet a number of financingneeds, including working capital loans, loans to enable new franchisees to fund the purchase of the franchise and van leases. Financeand contract receivables are generally secured by the underlying tools and/or diagnostic or equipment products financed and, forinstallment loans to franchisees, other franchisee assets.
10
(Amounts in millions)
April 4, 2015
January 3,2015
Trade and other accounts receivable $ 565.6 $ 567.0 Allowances for doubtful accounts (17.2) (16.2)
Total trade and other accounts receivable – net $ 548.4 $ 550.8
SNAP-ON INCORPORATED NOTES TO CONDENSED CONSOLIDATED FINANCIAL STATEMENTS (continued)
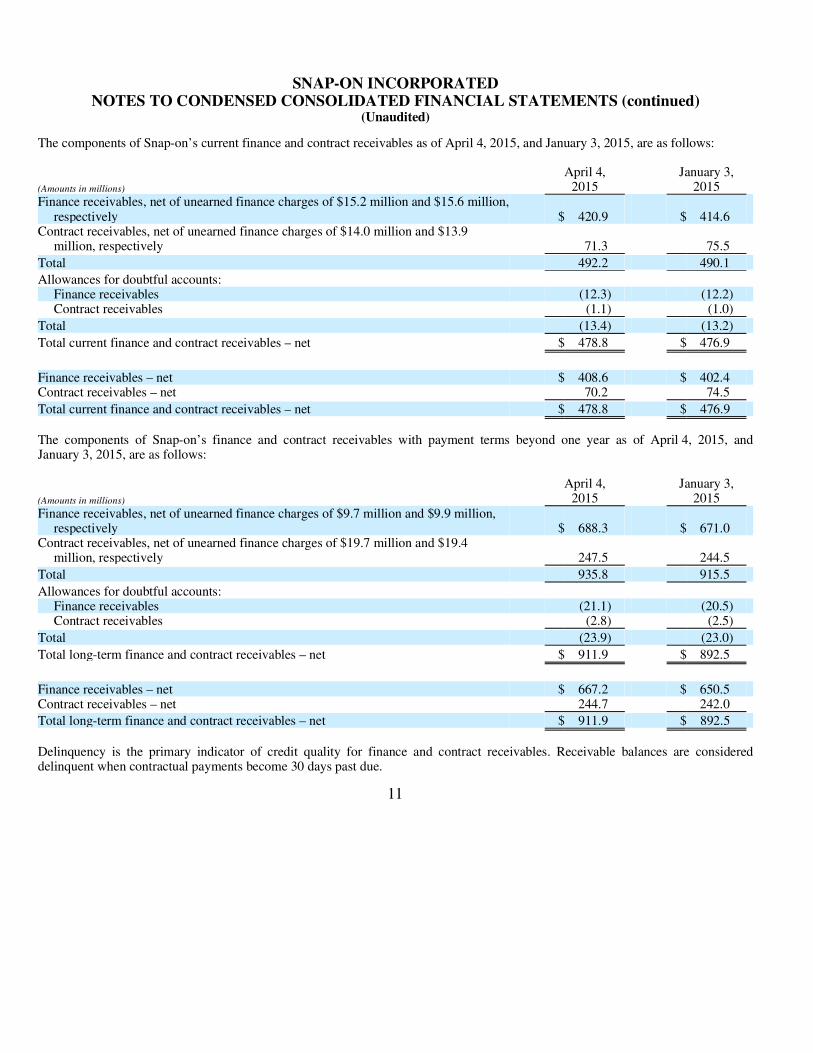
(Unaudited) The components of Snap-on’s current finance and contract receivables as of April 4, 2015, and January 3, 2015, are as follows:
The components of Snap-on’s finance and contract receivables with payment terms beyond one year as of April 4, 2015, andJanuary 3, 2015, are as follows:
Delinquency is the primary indicator of credit quality for finance and contract receivables. Receivable balances are considereddelinquent when contractual payments become 30 days past due.
11
(Amounts in millions)
April 4, 2015
January 3,2015
Finance receivables, net of unearned finance charges of $15.2 million and $15.6 million, respectively $ 420.9 $ 414.6
Contract receivables, net of unearned finance charges of $14.0 million and $13.9 million, respectively 71.3 75.5
Total 492.2 490.1
Allowances for doubtful accounts:
Finance receivables (12.3) (12.2) Contract receivables (1.1) (1.0)
Total (13.4) (13.2)
Total current finance and contract receivables – net $ 478.8 $ 476.9
Finance receivables – net $ 408.6 $ 402.4 Contract receivables – net 70.2 74.5
Total current finance and contract receivables – net $ 478.8 $ 476.9
(Amounts in millions)
April 4, 2015
January 3,2015
Finance receivables, net of unearned finance charges of $9.7 million and $9.9 million, respectively $ 688.3 $ 671.0
Contract receivables, net of unearned finance charges of $19.7 million and $19.4 million, respectively 247.5 244.5
Total 935.8 915.5
Allowances for doubtful accounts:
Finance receivables (21.1) (20.5) Contract receivables (2.8) (2.5)
Total (23.9) (23.0)
Total long-term finance and contract receivables – net $ 911.9 $ 892.5
Finance receivables – net $ 667.2 $ 650.5 Contract receivables – net 244.7 242.0
Total long-term finance and contract receivables – net $ 911.9 $ 892.5
SNAP-ON INCORPORATED NOTES TO CONDENSED CONSOLIDATED FINANCIAL STATEMENTS (continued)
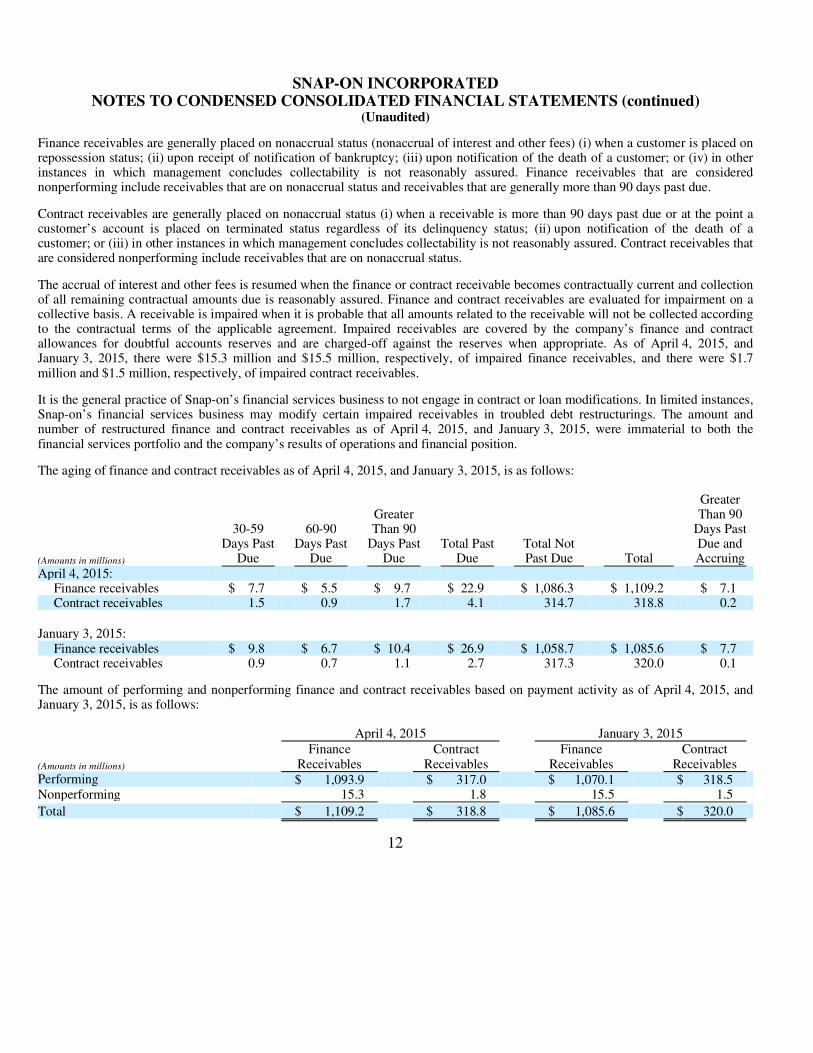
(Unaudited) Finance receivables are generally placed on nonaccrual status (nonaccrual of interest and other fees) (i) when a customer is placed onrepossession status; (ii) upon receipt of notification of bankruptcy; (iii) upon notification of the death of a customer; or (iv) in otherinstances in which management concludes collectability is not reasonably assured. Finance receivables that are considerednonperforming include receivables that are on nonaccrual status and receivables that are generally more than 90 days past due.
Contract receivables are generally placed on nonaccrual status (i) when a receivable is more than 90 days past due or at the point acustomer’s account is placed on terminated status regardless of its delinquency status; (ii) upon notification of the death of acustomer; or (iii) in other instances in which management concludes collectability is not reasonably assured. Contract receivables thatare considered nonperforming include receivables that are on nonaccrual status.
The accrual of interest and other fees is resumed when the finance or contract receivable becomes contractually current and collectionof all remaining contractual amounts due is reasonably assured. Finance and contract receivables are evaluated for impairment on acollective basis. A receivable is impaired when it is probable that all amounts related to the receivable will not be collected accordingto the contractual terms of the applicable agreement. Impaired receivables are covered by the company’s finance and contract allowances for doubtful accounts reserves and are charged-off against the reserves when appropriate. As of April 4, 2015, andJanuary 3, 2015, there were $15.3 million and $15.5 million, respectively, of impaired finance receivables, and there were $1.7million and $1.5 million, respectively, of impaired contract receivables.
It is the general practice of Snap-on’s financial services business to not engage in contract or loan modifications. In limited instances,Snap-on’s financial services business may modify certain impaired receivables in troubled debt restructurings. The amount andnumber of restructured finance and contract receivables as of April 4, 2015, and January 3, 2015, were immaterial to both thefinancial services portfolio and the company’s results of operations and financial position.
The aging of finance and contract receivables as of April 4, 2015, and January 3, 2015, is as follows:
The amount of performing and nonperforming finance and contract receivables based on payment activity as of April 4, 2015, andJanuary 3, 2015, is as follows:
12
(Amounts in millions)
30-59Days Past
Due
60-90 Days Past
Due
GreaterThan 90
Days PastDue
Total PastDue
Total Not Past Due Total
GreaterThan 90
Days PastDue andAccruing
April 4, 2015:
Finance receivables $ 7.7 $ 5.5 $ 9.7 $ 22.9 $ 1,086.3 $ 1,109.2 $ 7.1 Contract receivables 1.5 0.9 1.7 4.1 314.7 318.8 0.2
January 3, 2015:
Finance receivables $ 9.8 $ 6.7 $ 10.4 $ 26.9 $ 1,058.7 $ 1,085.6 $ 7.7 Contract receivables 0.9 0.7 1.1 2.7 317.3 320.0 0.1
April 4, 2015 January 3, 2015
(Amounts in millions)
Finance Receivables
ContractReceivables
Finance Receivables
ContractReceivables
Performing $ 1,093.9 $ 317.0 $ 1,070.1 $ 318.5 Nonperforming 15.3 1.8 15.5 1.5
Total $ 1,109.2 $ 318.8 $ 1,085.6 $ 320.0

SNAP-ON INCORPORATED NOTES TO CONDENSED CONSOLIDATED FINANCIAL STATEMENTS (continued)
(Unaudited) The amount of finance and contract receivables on nonaccrual status as of April 4, 2015, and January 3, 2015, is as follows:
The following is a rollforward of the allowances for credit losses for finance and contract receivables for the three month periodsended April 4, 2015, and March 29, 2014:
Note 4: Inventories
Inventories by major classification are as follows:
Inventories accounted for using the first-in, first-out (“FIFO”) method as of April 4, 2015, and January 3, 2015, approximated 57%and 58%, respectively, of total inventories. The company accounts for its non-U.S. inventory on the FIFO method. As of April 4, 2015, approximately 31% of the company’s U.S. inventory was accounted for using the FIFO method and 69% was accounted forusing the last-in, first-out (“LIFO”) method. There were no LIFO inventory liquidations in the three month periods ended April 4,2015, or March 29, 2014.
13
(Amounts in millions)
April 4, 2015
January 3,2015
Finance receivables $ 8.3 $ 7.9 Contract receivables 1.8 1.5
Three Months EndedApril 4, 2015
Three Months EndedMarch 29, 2014
(Amounts in millions)
FinanceReceivables
ContractReceivables
Finance Receivables
ContractReceivables
Allowances for doubtful accounts:
Beginning of year $ 32.7 $ 3.5 $ 27.8 $ 3.3 Provision for bad debt expense 7.1 0.9 6.2 0.6 Charge-offs (7.8) (0.4) (6.8) (0.4) Recoveries 1.5 – 1.3 0.1 Currency Translation (0.1) (0.1) – –
End of period $ 33.4 $ 3.9 $ 28.5 $ 3.6
(Amounts in millions)
April 4, 2015
January 3,2015
Finished goods $ 424.6 $ 415.3 Work in progress 44.9 45.3 Raw materials 85.7 87.5
Total FIFO value 555.2 548.1 Excess of current cost over LIFO cost (72.9) (72.6)
Total inventories – net $ 482.3 $ 475.5

SNAP-ON INCORPORATED NOTES TO CONDENSED CONSOLIDATED FINANCIAL STATEMENTS (continued)
(Unaudited) Note 5: Goodwill and Other Intangible Assets
The changes in the carrying amount of goodwill by segment for the three month period ended April 4, 2015, are as follows:
Additional disclosures related to other intangible assets are as follows:
Significant and unanticipated changes in circumstances, such as declines in profitability and cash flow due to significant and long-term deterioration in macroeconomic, industry and market conditions, the loss of key customers, changes in technology or markets,significant changes in key personnel or litigation, a significant and sustained decrease in share price and/or other events, includingeffects from the sale or disposal of a reporting unit, could require a provision for impairment of goodwill and/or other intangibleassets in a future period. As of April 4, 2015, the company had no accumulated impairment losses.
The weighted-average amortization periods related to other intangible assets are as follows:
Snap-on is amortizing its customer relationships on both an accelerated and straight-line basis over a 15 year weighted-average life; the remaining intangibles are amortized on a straight-line basis. The weighted-average amortization period for all amortizable intangibles on a combined basis is 11 years.
14
(Amounts in millions)
Commercial& Industrial
Group
Snap-onTools Group
Repair Systems& Information
Group Total
Balance as of January 3, 2015 $ 275.9 $ 12.5 $ 522.3 $ 810.7 Currency translation (28.0) – (4.4) (32.4)
Balance as of April 4, 2015 $ 247.9 $ 12.5 $ 517.9 $ 778.3
April 4, 2015 January 3, 2015
(Amounts in millions)
Gross CarryingValue
AccumulatedAmortization
Gross CarryingValue
AccumulatedAmortization
Amortized other intangible assets:
Customer relationships $ 146.1 $ (72.9) $ 147.1 $ (71.2) Developed technology 18.3 (18.3) 19.2 (19.2) Internally developed software 145.8 (95.3) 142.2 (92.0) Patents 28.9 (20.1) 29.3 (20.6) Trademarks 2.4 (1.5) 2.5 (1.6) Other 7.6 (1.7) 7.6 (1.6)
Total 349.1 (209.8) 347.9 (206.2) Non-amortized trademarks 59.5 – 61.6 –
Total other intangible assets $ 408.6 $ (209.8) $ 409.5 $ (206.2)
In YearsCustomer relationships 15Internally developed software 3Patents 9Trademarks 6Other 39

SNAP-ON INCORPORATED NOTES TO CONDENSED CONSOLIDATED FINANCIAL STATEMENTS (continued)
(Unaudited) The company’s customer relationships generally have contractual terms of three to five years and are typically renewed withoutsignificant cost to the company. The weighted-average 15 year life for customer relationships is based on the company’s historical renewal experience. Intangible asset renewal costs are expensed as incurred.
The aggregate amortization expense was $6.2 million in both the three month periods ended April 4, 2015, and March 29, 2014.Based on current levels of amortizable intangible assets and estimated weighted-average useful lives, estimated annual amortization expense is expected to be $24.6 million in 2015, $20.6 million in 2016, $17.3 million in 2017, $13.6 million in 2018, $12.9 million in2019, and $12.1 million in 2020.
Note 6: Exit and Disposal Activities
Snap-on did not record any costs for exit and disposal activities in the three month period ended April 4, 2015; Snap-on recorded costs for exit and disposal activities in the three month period ended March 29, 2014, as follows:
The $2.0 million of costs incurred during the three month period ended March 29, 2014, qualified for accrual treatment.
Snap-on’s exit and disposal accrual activity for the first quarter of 2015 is as follows:
The majority of the exit and disposal accrual as of April 4, 2015, is expected to be utilized in 2015.
Snap-on expects to fund the remaining cash requirements of its exit and disposal activities with available cash on hand, cash flowsfrom operations and borrowings under the company’s existing credit facilities. The estimated costs for the exit and disposal activitieswere based on management’s best business judgment under prevailing circumstances.
Note 7: Income Taxes
Snap-on’s effective income tax rate on earnings attributable to Snap-on was 32.0% and 31.6% in the first three months of 2015 and2014, respectively. The effective rate for the first three months of 2015 includes tax benefits associated with distributions from certainnon-U.S. subsidiaries, partially offset by a tax assessment in a foreign jurisdiction.
Snap-on and its subsidiaries file income tax returns in the United States and in various state, local and foreign jurisdictions. It isreasonably possible that certain unrecognized tax benefits may either be settled with taxing authorities or the statutes of limitations forsuch items may lapse within the next 12 months, causing Snap-on’s gross unrecognized tax benefits to decrease by a range of zero to$0.9 million. Over the next 12 months, Snap-on anticipates taking certain tax positions on various tax returns for which the related taxbenefit does not meet the recognition threshold. Accordingly, Snap-on’s gross unrecognized tax benefits may increase by a range ofzero to $0.3 million over the next 12 months for uncertain tax positions expected to be taken in future tax filings.
15
Three Months Ended
(Amounts in millions)
April 4, 2015
March 29,2014
Exit and disposal costs:
Cost of goods sold: Repair Systems & Information Group $ – $ 2.0
Total exit and disposal costs $ – $ 2.0
(Amounts in millions)
Balance atJanuary 3,
2015 Provision Usage
Balance atApril 4,
2015
Severance costs:
Commercial & Industrial Group $ 0.8 $ – $ (0.3) $ 0.5 Repair Systems & Information Group 5.7 – (0.4) 5.3
Total $ 6.5 $ – $ (0.7) $ 5.8

SNAP-ON INCORPORATED NOTES TO CONDENSED CONSOLIDATED FINANCIAL STATEMENTS (continued)
(Unaudited) Note 8: Short-term and Long-term Debt
Short-term and long-term debt as of April 4, 2015, and January 3, 2015, consisted of the following:
* Includes fair value adjustments related to interest rate swaps.
Notes payable of $78.8 million as of April 4, 2015, included $52.5 million of commercial paper borrowings and $26.3 million ofother notes. Notes payable of $56.6 million as of 2014 year end included $37.0 million of commercial paper borrowings and $19.6million of other notes. There were no current maturities of long-term debt as of April 4, 2015, or January 3, 2015.
Snap-on has a five-year, $700 million multi-currency revolving credit facility that terminates on September 27, 2018 (the “Credit Facility”); no amounts were outstanding under the Credit Facility as of April 4, 2015. Borrowings under the Credit Facility bearinterest at varying rates based on Snap-on’s then-current, long-term debt ratings. The Credit Facility’s financial covenant requires thatSnap-on maintain, as of each fiscal quarter end, either (i) a ratio not greater than 0.60 to 1.00 of consolidated net debt (consolidateddebt net of certain cash adjustments) to the sum of such consolidated net debt plus total equity and less accumulated othercomprehensive income or loss; or (ii) a ratio not greater than 3.50 to 1.00 of such consolidated net debt to earnings before interest,taxes, depreciation, amortization and certain other adjustments for the preceding four fiscal quarters then ended. As of April 4, 2015,the company’s actual ratios of 0.27 and 1.14, respectively, were both within the permitted ranges set forth in this financial covenant.
Snap-on’s Credit Facility and other debt agreements also contain certain usual and customary borrowing, affirmative, negative andmaintenance covenants. As of April 4, 2015, Snap-on was in compliance with all covenants of its Credit Facility and other debtagreements.
Note 9: Financial Instruments
Derivatives: All derivative instruments are reported in the Condensed Consolidated Financial Statements at fair value. Changes in thefair value of derivatives are recorded each period in earnings or on the accompanying Condensed Consolidated Balance Sheets,depending on whether the derivative is designated and effective as part of a hedged transaction. Gains or losses on derivativeinstruments recorded in Accumulated other comprehensive income (loss) (“Accumulated OCI”) must be reclassified to earnings in the period in which earnings are affected by the underlying hedged item and the ineffective portion of all hedges must be recognized inearnings in the period that such portion is determined to be ineffective.
16
(Amounts in millions)
April 4, 2015
January 3,2015
5.50% unsecured notes due 2017 $ 150.0 $ 150.0 4.25% unsecured notes due 2018 250.0 250.0 6.70% unsecured notes due 2019 200.0 200.0 6.125% unsecured notes due 2021 250.0 250.0 Other debt* 93.2 69.3
943.2 919.3
Less: notes payable (78.8) (56.6)
Total long-term debt $ 864.4 $ 862.7

SNAP-ON INCORPORATED NOTES TO CONDENSED CONSOLIDATED FINANCIAL STATEMENTS (continued)
(Unaudited) The criteria used to determine if hedge accounting treatment is appropriate are: (i) the designation of the hedge to an underlyingexposure; (ii) whether or not overall risk is being reduced; and (iii) if there is a correlation between the value of the derivativeinstrument and the underlying hedged item. On the date a derivative contract is entered into, Snap-on designates the derivative as a fair value hedge, a cash flow hedge, a hedge of a net investment in a foreign operation, or a natural hedging instrument whose changein fair value is recognized as an economic hedge against changes in the value of the hedged item. Snap-on does not use derivative instruments for speculative or trading purposes.
The company is exposed to global market risks, including the effects of changes in foreign currency exchange rates, interest rates, andthe company’s stock price, and therefore uses derivatives to manage financial exposures that occur in the normal course of business.The primary risks managed by using derivative instruments are foreign currency risk, interest rate risk and stock-based deferred compensation risk.
Foreign Currency Risk Management: Snap-on has significant international operations and is subject to certain risks inherent withforeign operations that include currency fluctuations. Foreign currency exchange risk exists to the extent that Snap-on has payment obligations or receipts denominated in currencies other than the functional currency, including intercompany loans denominated inforeign currencies. To manage these exposures, Snap-on identifies naturally offsetting positions and then purchases hedginginstruments to protect the residual net exposures. Snap-on manages most of these exposures on a consolidated basis, which allows fornetting of certain exposures to take advantage of natural offsets. Foreign currency forward contracts (“foreign currency forwards”) are used to hedge the net exposures. Gains or losses on net foreign currency hedges are intended to offset losses or gains on theunderlying net exposures in an effort to reduce the earnings volatility resulting from fluctuating foreign currency exchange rates.Snap-on’s foreign currency forwards are typically not designated as hedges. The fair value changes of these contracts are reported inearnings as foreign exchange gain or loss, which is included in “Other income (expense) – net” on the accompanying CondensedConsolidated Statements of Earnings.
At April 4, 2015, Snap-on had $134.2 million of net foreign currency forward buy contracts outstanding comprised of buy contractsincluding $74.5 million in euros, $31.8 million in Australian dollars, $13.7 million in British pounds, $13.1 million in Swedishkronor, $9.7 million in Singapore dollars, $6.6 million in South Korean won, $4.9 in Hong Kong dollars, $4.7 million in Mexicanpesos, $3.1 million in Norwegian kroner, and $3.6 million in other currencies, and sell contracts comprised of $11.8 million inCanadian dollars, $10.7 million in Japanese yen, $2.4 million in New Zealand dollars, $2.1 million in Indian rupees and $4.5 millionin other currencies. At January 3, 2015, Snap-on had $140.4 million of net foreign currency forward buy contracts outstandingcomprised of buy contracts including $81.5 million in euros, $34.8 million in Australian dollars, $22.1 million in Swedish kronor,$16.3 million in British pounds, $10.1 million in Singapore dollars, $5.7 million in South Korean won, $4.5 million in Mexican pesos,$3.6 million in Hong Kong dollars, and $0.5 million in other currencies, and sell contracts comprised of $16.8 million in Canadiandollars, $10.9 million in Japanese yen, $3.3 million in Danish kroner, and $7.7 million in other currencies.
Interest Rate Risk Management: Snap-on aims to control funding costs by managing the exposure created by the differing maturitiesand interest rate structures of Snap-on’s borrowings through the use of interest rate swap agreements.
Snap-on enters into interest rate swap agreements (“interest rate swaps”) to manage risks associated with changing interest rates related to the company’s fixed rate borrowings. Interest rate swaps are accounted for as fair value hedges. The differentials paid orreceived on interest rate swaps are recognized as adjustments to “Interest expense” on the accompanying Condensed Consolidated Statements of Earnings. The effective portion of the change in fair value of the derivative is recorded in “Long-term debt” on the accompanying Condensed Consolidated Balance Sheets, while any ineffective portion is recorded as an adjustment to “Interest expense” on the accompanying Condensed Consolidated Statements of Earnings. The notional amount of interest rate swapsoutstanding and designated as fair value hedges was $100.0 million as of both April 4, 2015, and January 3, 2015.
17
SNAP-ON INCORPORATED NOTES TO CONDENSED CONSOLIDATED FINANCIAL STATEMENTS (continued)
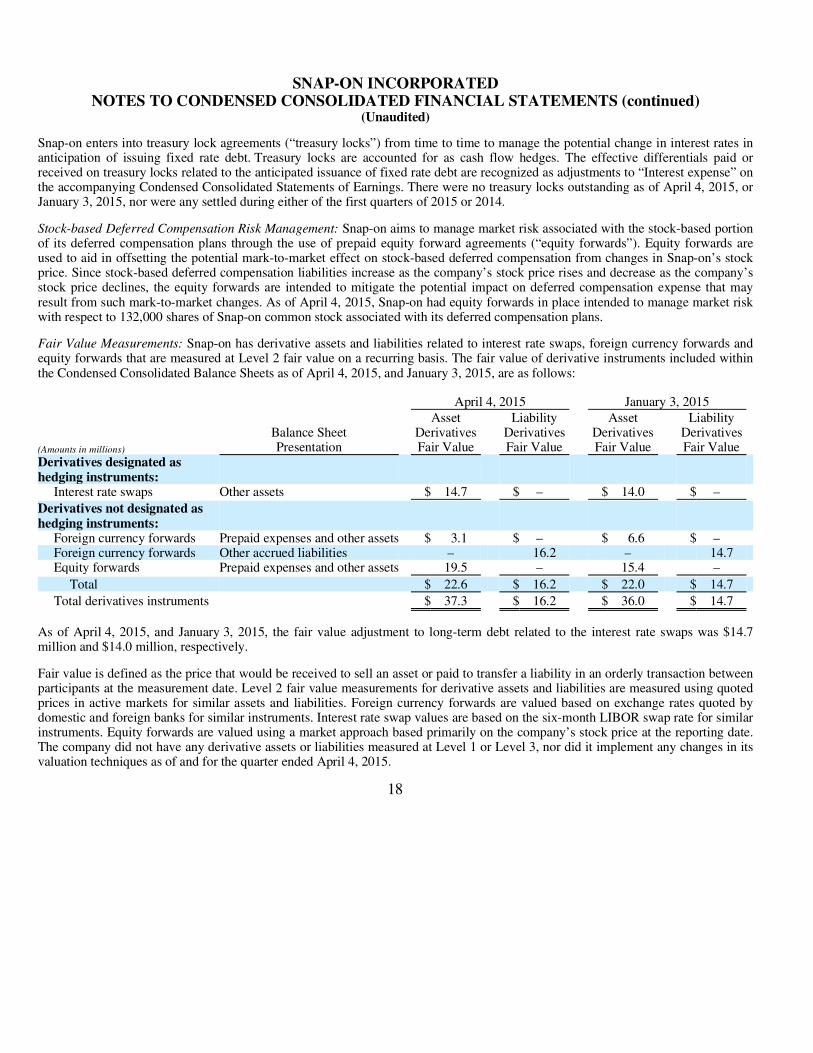
(Unaudited) Snap-on enters into treasury lock agreements (“treasury locks”) from time to time to manage the potential change in interest rates inanticipation of issuing fixed rate debt. Treasury locks are accounted for as cash flow hedges. The effective differentials paid orreceived on treasury locks related to the anticipated issuance of fixed rate debt are recognized as adjustments to “Interest expense” on the accompanying Condensed Consolidated Statements of Earnings. There were no treasury locks outstanding as of April 4, 2015, orJanuary 3, 2015, nor were any settled during either of the first quarters of 2015 or 2014.
Stock-based Deferred Compensation Risk Management: Snap-on aims to manage market risk associated with the stock-based portion of its deferred compensation plans through the use of prepaid equity forward agreements (“equity forwards”). Equity forwards are used to aid in offsetting the potential mark-to-market effect on stock-based deferred compensation from changes in Snap-on’s stock price. Since stock-based deferred compensation liabilities increase as the company’s stock price rises and decrease as the company’s stock price declines, the equity forwards are intended to mitigate the potential impact on deferred compensation expense that mayresult from such mark-to-market changes. As of April 4, 2015, Snap-on had equity forwards in place intended to manage market riskwith respect to 132,000 shares of Snap-on common stock associated with its deferred compensation plans.
Fair Value Measurements: Snap-on has derivative assets and liabilities related to interest rate swaps, foreign currency forwards andequity forwards that are measured at Level 2 fair value on a recurring basis. The fair value of derivative instruments included withinthe Condensed Consolidated Balance Sheets as of April 4, 2015, and January 3, 2015, are as follows:
As of April 4, 2015, and January 3, 2015, the fair value adjustment to long-term debt related to the interest rate swaps was $14.7 million and $14.0 million, respectively.
Fair value is defined as the price that would be received to sell an asset or paid to transfer a liability in an orderly transaction betweenparticipants at the measurement date. Level 2 fair value measurements for derivative assets and liabilities are measured using quotedprices in active markets for similar assets and liabilities. Foreign currency forwards are valued based on exchange rates quoted bydomestic and foreign banks for similar instruments. Interest rate swap values are based on the six-month LIBOR swap rate for similar instruments. Equity forwards are valued using a market approach based primarily on the company’s stock price at the reporting date. The company did not have any derivative assets or liabilities measured at Level 1 or Level 3, nor did it implement any changes in itsvaluation techniques as of and for the quarter ended April 4, 2015.
18
April 4, 2015 January 3, 2015
(Amounts in millions)
Balance Sheet Presentation
AssetDerivativesFair Value
LiabilityDerivativesFair Value
Asset Derivatives Fair Value
LiabilityDerivativesFair Value
Derivatives designated as hedging instruments:
Interest rate swaps Other assets $ 14.7 $ – $ 14.0 $ –
Derivatives not designated as hedging instruments:
Foreign currency forwards Prepaid expenses and other assets $ 3.1 $ – $ 6.6 $ – Foreign currency forwards Other accrued liabilities – 16.2 – 14.7 Equity forwards Prepaid expenses and other assets 19.5 – 15.4 –
Total $ 22.6 $ 16.2 $ 22.0 $ 14.7
Total derivatives instruments $ 37.3 $ 16.2 $ 36.0 $ 14.7

SNAP-ON INCORPORATED NOTES TO CONDENSED CONSOLIDATED FINANCIAL STATEMENTS (continued)
(Unaudited) The effect of derivative instruments designated as fair value hedges as included in the Condensed Consolidated Statements ofEarnings is as follows:
The effect of derivative instruments designated as cash flow hedges as included in Accumulated OCI on the Condensed ConsolidatedBalance Sheets and the Condensed Consolidated Statements of Earnings is as follows:
The effects of derivative instruments not designated as hedging instruments as included in the Condensed Consolidated Statements ofEarnings are as follows:
Snap-on’s foreign currency forwards are typically not designated as hedges for financial reporting purposes. The fair value changes offoreign currency forwards not designated as hedging instruments are reported in earnings as foreign exchange gain or loss in “Other income (expense) – net” on the accompanying Condensed Consolidated Statements of Earnings. The $15.0 million derivative lossrecognized in the first quarter of 2015 was partially offset by transaction gains on net exposures of $14.2 million, resulting in a netforeign exchange loss of $0.8 million. The $4.0 million derivative gain recognized in the first quarter of 2014 was offset bytransaction losses on net exposures of $4.2 million, resulting in a net foreign exchange loss of $0.2 million. The resulting net foreignexchange losses are included in “Other income (expense) – net” on the accompanying Condensed Consolidated Statements ofEarnings. See Note 15 for additional information on “Other income (expense) – net.”
19
Effective Portion of Gain Recognized inIncome
Three Months Ended
(Amounts in millions)
Statement of EarningsPresentation April 4, 2015 March 29, 2014
Derivatives designated as fair value hedges:
Interest rate swaps Interest expense $ 1.0 $ 1.0
Effective Portion of GainRecognized in
Accumulated OCI Three Months Ended Statement of
Earnings Presentation
Effective Portion of GainReclassified from Accumulated
OCI into Income Three Months Ended
(Amounts in millions)
April 4, 2015
March 29,2014
April 4, 2015
March 29,2014
Derivatives designated as cash flow hedges:
Treasury locks $ – $ – Interest expense $ 0.1 $ 0.1
Gain / (Loss) Recognized in IncomeThree Months Ended
(Amounts in millions)
Statement of EarningsPresentation
April 4, 2015
March 29,2014
Derivatives not designated as hedginginstruments:
Foreign currency forwards Other income (expense) – net $ (15.0) $ 4.0 Equity forwards Operating expenses 1.5 0.5
SNAP-ON INCORPORATED NOTES TO CONDENSED CONSOLIDATED FINANCIAL STATEMENTS (continued)
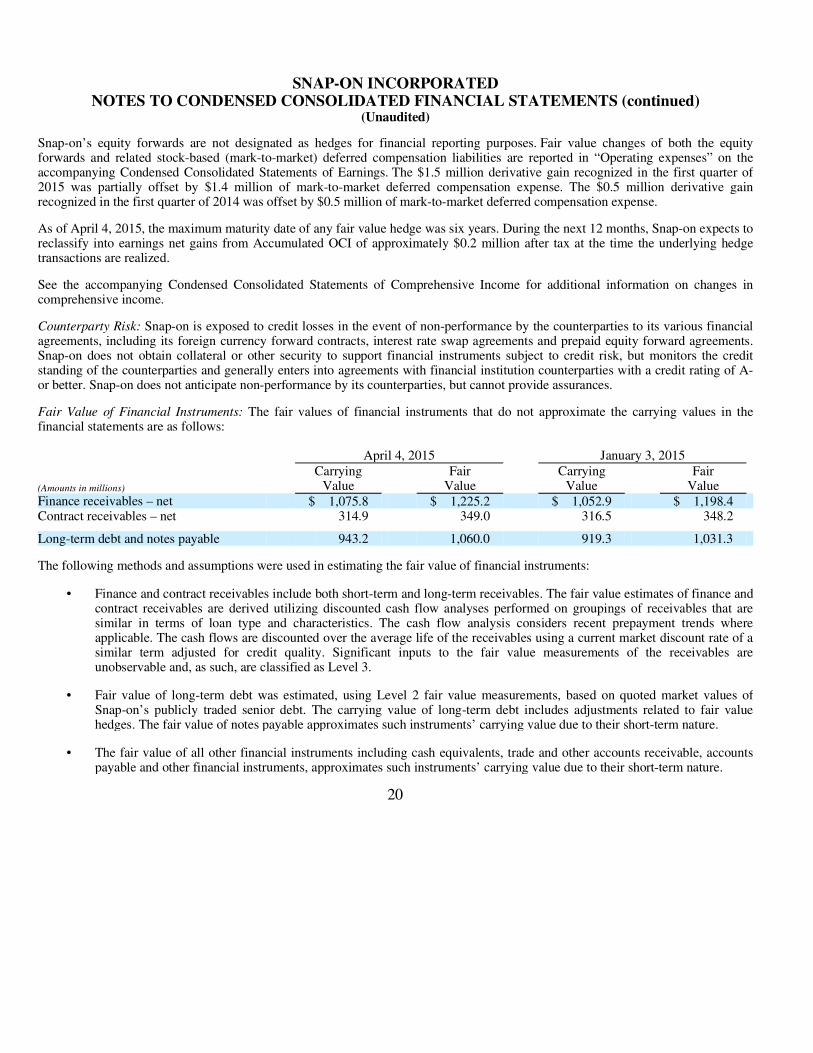
(Unaudited) Snap-on’s equity forwards are not designated as hedges for financial reporting purposes. Fair value changes of both the equityforwards and related stock-based (mark-to-market) deferred compensation liabilities are reported in “Operating expenses” on the accompanying Condensed Consolidated Statements of Earnings. The $1.5 million derivative gain recognized in the first quarter of2015 was partially offset by $1.4 million of mark-to-market deferred compensation expense. The $0.5 million derivative gainrecognized in the first quarter of 2014 was offset by $0.5 million of mark-to-market deferred compensation expense.
As of April 4, 2015, the maximum maturity date of any fair value hedge was six years. During the next 12 months, Snap-on expects to reclassify into earnings net gains from Accumulated OCI of approximately $0.2 million after tax at the time the underlying hedgetransactions are realized.
See the accompanying Condensed Consolidated Statements of Comprehensive Income for additional information on changes incomprehensive income.
Counterparty Risk: Snap-on is exposed to credit losses in the event of non-performance by the counterparties to its various financial agreements, including its foreign currency forward contracts, interest rate swap agreements and prepaid equity forward agreements.Snap-on does not obtain collateral or other security to support financial instruments subject to credit risk, but monitors the creditstanding of the counterparties and generally enters into agreements with financial institution counterparties with a credit rating of A-or better. Snap-on does not anticipate non-performance by its counterparties, but cannot provide assurances.
Fair Value of Financial Instruments: The fair values of financial instruments that do not approximate the carrying values in thefinancial statements are as follows:
The following methods and assumptions were used in estimating the fair value of financial instruments:
20
April 4, 2015 January 3, 2015
(Amounts in millions)
Carrying Value
FairValue
Carrying Value
FairValue
Finance receivables – net $ 1,075.8 $ 1,225.2 $ 1,052.9 $ 1,198.4 Contract receivables – net 314.9 349.0 316.5 348.2
Long-term debt and notes payable 943.2 1,060.0 919.3 1,031.3
• Finance and contract receivables include both short-term and long-term receivables. The fair value estimates of finance andcontract receivables are derived utilizing discounted cash flow analyses performed on groupings of receivables that aresimilar in terms of loan type and characteristics. The cash flow analysis considers recent prepayment trends whereapplicable. The cash flows are discounted over the average life of the receivables using a current market discount rate of asimilar term adjusted for credit quality. Significant inputs to the fair value measurements of the receivables areunobservable and, as such, are classified as Level 3.
• Fair value of long-term debt was estimated, using Level 2 fair value measurements, based on quoted market values of
Snap-on’s publicly traded senior debt. The carrying value of long-term debt includes adjustments related to fair value hedges. The fair value of notes payable approximates such instruments’ carrying value due to their short-term nature.
• The fair value of all other financial instruments including cash equivalents, trade and other accounts receivable, accounts
payable and other financial instruments, approximates such instruments’ carrying value due to their short-term nature.

SNAP-ON INCORPORATED NOTES TO CONDENSED CONSOLIDATED FINANCIAL STATEMENTS (continued)
(Unaudited) Note 10: Pension Plans
Snap-on’s net periodic pension cost included the following components:
Snap-on intends to make contributions of $7.1 million to its foreign pension plans and $2.0 million to its domestic pension plans in2015, as required by law. In the first three months of 2015, Snap-on made $15.3 million of cash contributions to its domestic pensionplans consisting of (i) $15.0 million of discretionary contributions; and (ii) $0.3 million of required contributions. Depending onmarket and other conditions, Snap-on may make additional discretionary cash contributions to its pension plans in 2015.
Note 11: Postretirement Health Care Plans
Snap-on’s net periodic postretirement health care cost included the following components:
Note 12: Stock-based Compensation and Other Stock Plans
The 2011 Incentive Stock and Awards Plan (the “2011 Plan”) provides for the grant of stock options, performance awards, stockappreciation rights (“SARs”) and restricted stock awards (which may be designated as “restricted stock units” or “RSUs”). No further grants are being made under the 2001 Incentive Stock and Awards Plan (the “2001 Plan”), although outstanding awards under the 2001 Plan will continue until exercised, forfeited or expired. As of April 4, 2015, the 2011 Plan had 875,755 shares available forfuture grants. The company uses treasury stock to deliver shares under both the 2001 and 2011 Plans.
Net stock-based compensation expense was $11.5 million and $8.6 million for the three month periods ended April 4, 2015, andMarch 29, 2014, respectively. Cash received from stock purchase and option plan exercises during the three month periods endedApril 4, 2015, and March 29, 2014, was $14.5 million and $12.8 million, respectively. The tax benefit realized from both the exerciseand vesting of share-based payment arrangements was $15.1 million and $12.0 million for the three month periods ended April 4,2015, and March 29, 2014, respectively.
21
Three Months Ended
(Amounts in millions)
April 4, 2015
March 29,2014
Service cost $ 5.2 $ 4.8 Interest cost 13.2 14.3 Expected return on plan assets (19.4) (18.2) Amortization of unrecognized loss 8.9 5.4 Amortization of prior service credit (0.2) (0.2)
Net periodic pension cost $ 7.7 $ 6.1
Three Months Ended
(Amounts in millions)
April 4, 2015
March 29,2014
Interest cost $ 0.5 $ 0.6 Expected return on plan assets (0.2) (0.3) Amortization of unrecognized loss 0.1 –
Net periodic postretirement health care cost $ 0.4 $ 0.3
SNAP-ON INCORPORATED NOTES TO CONDENSED CONSOLIDATED FINANCIAL STATEMENTS (continued)
(Unaudited) Stock Options
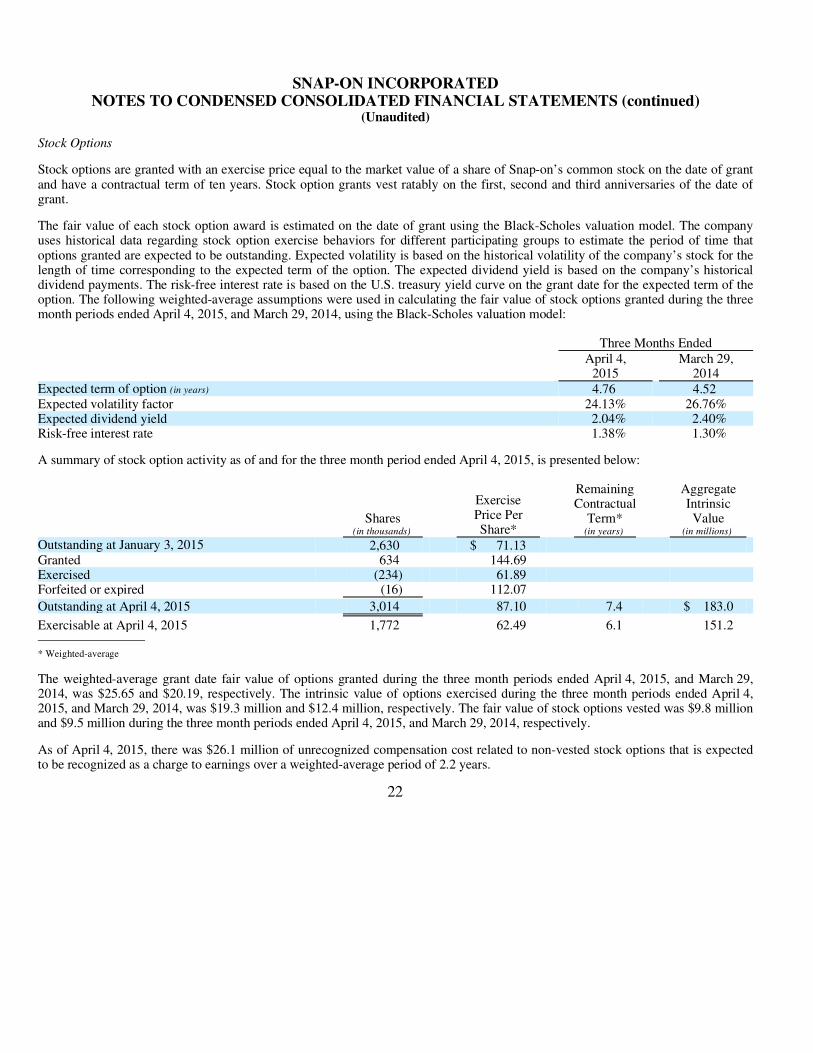
Stock options are granted with an exercise price equal to the market value of a share of Snap-on’s common stock on the date of grant and have a contractual term of ten years. Stock option grants vest ratably on the first, second and third anniversaries of the date ofgrant.
The fair value of each stock option award is estimated on the date of grant using the Black-Scholes valuation model. The company uses historical data regarding stock option exercise behaviors for different participating groups to estimate the period of time thatoptions granted are expected to be outstanding. Expected volatility is based on the historical volatility of the company’s stock for the length of time corresponding to the expected term of the option. The expected dividend yield is based on the company’s historical dividend payments. The risk-free interest rate is based on the U.S. treasury yield curve on the grant date for the expected term of theoption. The following weighted-average assumptions were used in calculating the fair value of stock options granted during the threemonth periods ended April 4, 2015, and March 29, 2014, using the Black-Scholes valuation model:
A summary of stock option activity as of and for the three month period ended April 4, 2015, is presented below:
* Weighted-average
The weighted-average grant date fair value of options granted during the three month periods ended April 4, 2015, and March 29,2014, was $25.65 and $20.19, respectively. The intrinsic value of options exercised during the three month periods ended April 4,2015, and March 29, 2014, was $19.3 million and $12.4 million, respectively. The fair value of stock options vested was $9.8 millionand $9.5 million during the three month periods ended April 4, 2015, and March 29, 2014, respectively.
As of April 4, 2015, there was $26.1 million of unrecognized compensation cost related to non-vested stock options that is expected to be recognized as a charge to earnings over a weighted-average period of 2.2 years.
22
Three Months Ended
April 4, 2015
March 29,2014
Expected term of option (in years) 4.76 4.52 Expected volatility factor 24.13% 26.76%Expected dividend yield 2.04% 2.40%Risk-free interest rate 1.38% 1.30%
Shares
(in thousands)
ExercisePrice Per Share*
Remaining Contractual
Term* (in years)
AggregateIntrinsic Value
(in millions)
Outstanding at January 3, 2015 2,630 $ 71.13
Granted 634 144.69
Exercised (234) 61.89
Forfeited or expired (16) 112.07
Outstanding at April 4, 2015 3,014 87.10 7.4 $ 183.0
Exercisable at April 4, 2015 1,772 62.49 6.1 151.2
SNAP-ON INCORPORATED NOTES TO CONDENSED CONSOLIDATED FINANCIAL STATEMENTS (continued)
(Unaudited) Performance Awards
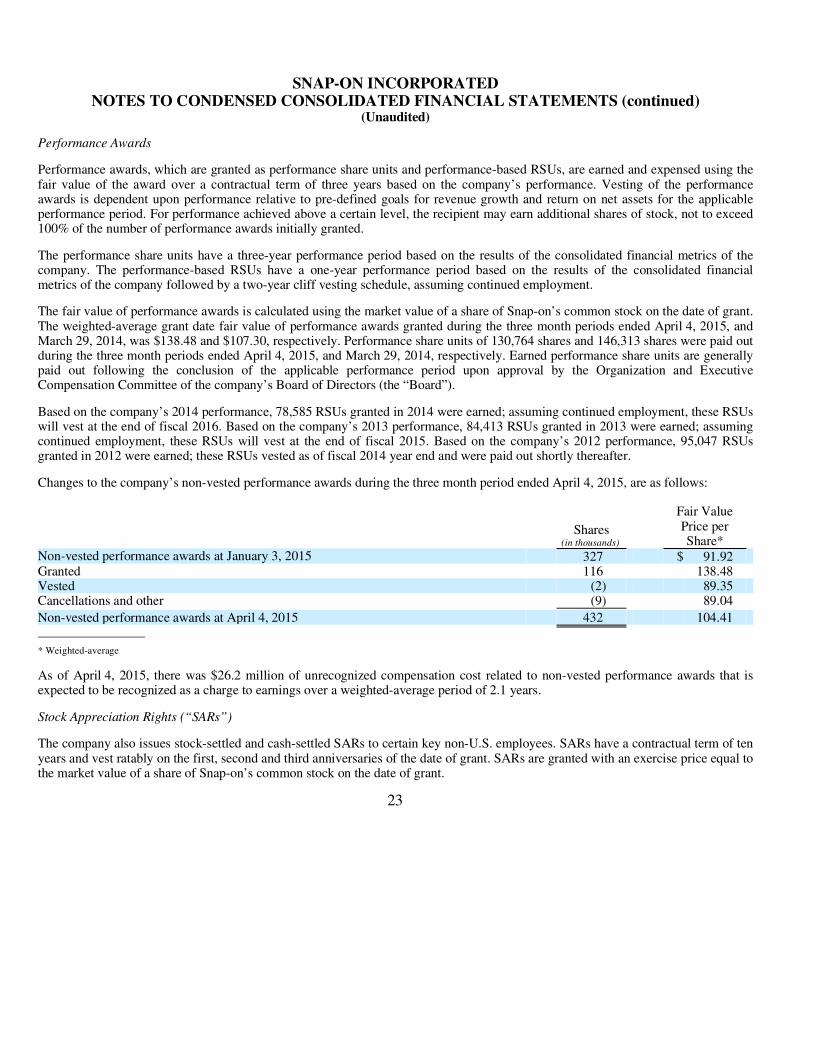
Performance awards, which are granted as performance share units and performance-based RSUs, are earned and expensed using the fair value of the award over a contractual term of three years based on the company’s performance. Vesting of the performance awards is dependent upon performance relative to pre-defined goals for revenue growth and return on net assets for the applicableperformance period. For performance achieved above a certain level, the recipient may earn additional shares of stock, not to exceed100% of the number of performance awards initially granted.
The performance share units have a three-year performance period based on the results of the consolidated financial metrics of thecompany. The performance-based RSUs have a one-year performance period based on the results of the consolidated financialmetrics of the company followed by a two-year cliff vesting schedule, assuming continued employment.
The fair value of performance awards is calculated using the market value of a share of Snap-on’s common stock on the date of grant. The weighted-average grant date fair value of performance awards granted during the three month periods ended April 4, 2015, andMarch 29, 2014, was $138.48 and $107.30, respectively. Performance share units of 130,764 shares and 146,313 shares were paid outduring the three month periods ended April 4, 2015, and March 29, 2014, respectively. Earned performance share units are generallypaid out following the conclusion of the applicable performance period upon approval by the Organization and ExecutiveCompensation Committee of the company’s Board of Directors (the “Board”).
Based on the company’s 2014 performance, 78,585 RSUs granted in 2014 were earned; assuming continued employment, these RSUswill vest at the end of fiscal 2016. Based on the company’s 2013 performance, 84,413 RSUs granted in 2013 were earned; assumingcontinued employment, these RSUs will vest at the end of fiscal 2015. Based on the company’s 2012 performance, 95,047 RSUs granted in 2012 were earned; these RSUs vested as of fiscal 2014 year end and were paid out shortly thereafter.
Changes to the company’s non-vested performance awards during the three month period ended April 4, 2015, are as follows:
* Weighted-average
As of April 4, 2015, there was $26.2 million of unrecognized compensation cost related to non-vested performance awards that is expected to be recognized as a charge to earnings over a weighted-average period of 2.1 years.
Stock Appreciation Rights (“SARs”)
The company also issues stock-settled and cash-settled SARs to certain key non-U.S. employees. SARs have a contractual term of ten years and vest ratably on the first, second and third anniversaries of the date of grant. SARs are granted with an exercise price equal tothe market value of a share of Snap-on’s common stock on the date of grant.
23
Shares
(in thousands)
Fair ValuePrice per Share*
Non-vested performance awards at January 3, 2015 327 $ 91.92 Granted 116 138.48 Vested (2) 89.35 Cancellations and other (9) 89.04
Non-vested performance awards at April 4, 2015 432 104.41
SNAP-ON INCORPORATED NOTES TO CONDENSED CONSOLIDATED FINANCIAL STATEMENTS (continued)
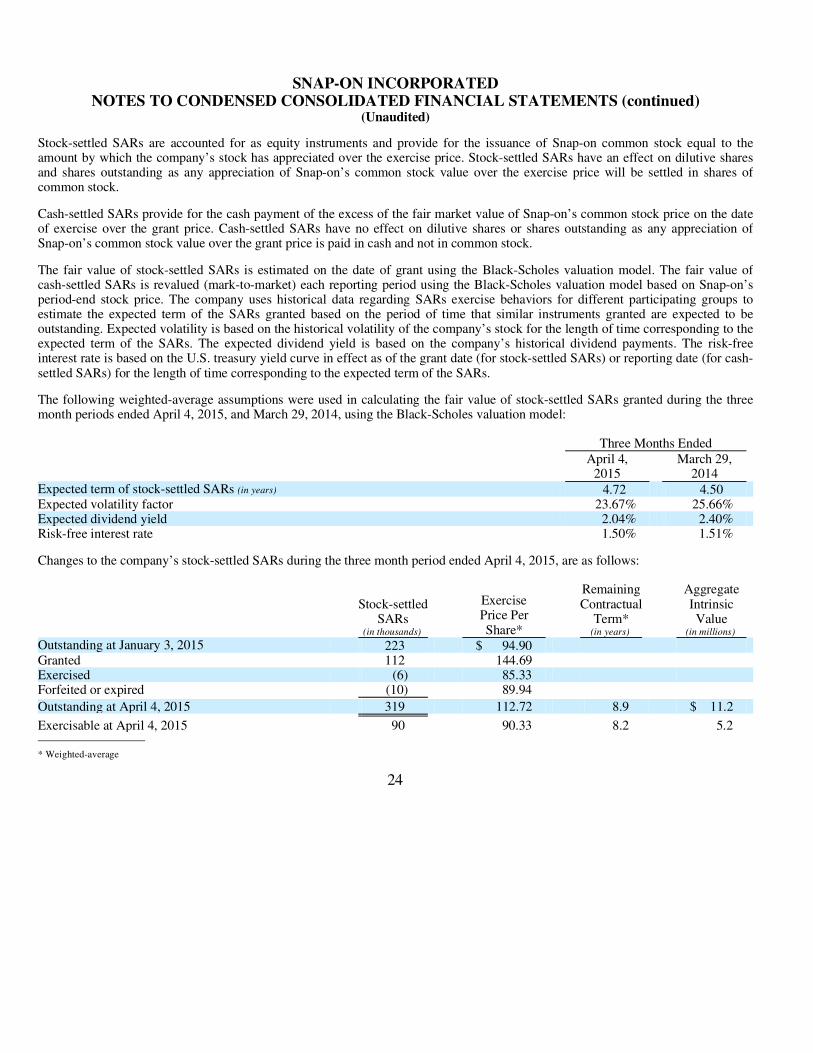
(Unaudited) Stock-settled SARs are accounted for as equity instruments and provide for the issuance of Snap-on common stock equal to theamount by which the company’s stock has appreciated over the exercise price. Stock-settled SARs have an effect on dilutive shares and shares outstanding as any appreciation of Snap-on’s common stock value over the exercise price will be settled in shares ofcommon stock.
Cash-settled SARs provide for the cash payment of the excess of the fair market value of Snap-on’s common stock price on the dateof exercise over the grant price. Cash-settled SARs have no effect on dilutive shares or shares outstanding as any appreciation ofSnap-on’s common stock value over the grant price is paid in cash and not in common stock.
The fair value of stock-settled SARs is estimated on the date of grant using the Black-Scholes valuation model. The fair value of cash-settled SARs is revalued (mark-to-market) each reporting period using the Black-Scholes valuation model based on Snap-on’s period-end stock price. The company uses historical data regarding SARs exercise behaviors for different participating groups toestimate the expected term of the SARs granted based on the period of time that similar instruments granted are expected to beoutstanding. Expected volatility is based on the historical volatility of the company’s stock for the length of time corresponding to the expected term of the SARs. The expected dividend yield is based on the company’s historical dividend payments. The risk-free interest rate is based on the U.S. treasury yield curve in effect as of the grant date (for stock-settled SARs) or reporting date (for cash-settled SARs) for the length of time corresponding to the expected term of the SARs.
The following weighted-average assumptions were used in calculating the fair value of stock-settled SARs granted during the three month periods ended April 4, 2015, and March 29, 2014, using the Black-Scholes valuation model:
Changes to the company’s stock-settled SARs during the three month period ended April 4, 2015, are as follows:
* Weighted-average
24
Three Months Ended
April 4, 2015
March 29,2014
Expected term of stock-settled SARs (in years) 4.72 4.50 Expected volatility factor 23.67% 25.66% Expected dividend yield 2.04% 2.40% Risk-free interest rate 1.50% 1.51%
Stock-settledSARs
(in thousands)
ExercisePrice Per Share*
Remaining Contractual
Term* (in years)
AggregateIntrinsic Value
(in millions)
Outstanding at January 3, 2015 223 $ 94.90
Granted 112 144.69
Exercised (6) 85.33
Forfeited or expired (10) 89.94
Outstanding at April 4, 2015 319 112.72 8.9 $ 11.2
Exercisable at April 4, 2015 90 90.33 8.2 5.2

SNAP-ON INCORPORATED NOTES TO CONDENSED CONSOLIDATED FINANCIAL STATEMENTS (continued)
(Unaudited) The weighted-average grant date fair value of stock-settled SARs granted during the three month periods ended April 4, 2015, andMarch 29, 2014, was $25.36 and $19.58, respectively. The intrinsic value of stock-settled SARs exercised during the three month periods ended April 4, 2015, and March 29, 2014, was $0.3 million and $0.1 million, respectively. The fair value of stock-settled SARs vested was $1.3 million and $0.6 million during the three month periods ended April 4, 2015, and March 29, 2014,respectively.
As of April 4, 2015, there was $4.7 million of unrecognized compensation cost related to non-vested stock-settled SARs that is expected to be recognized as a charge to earnings over a weighted-average period of 2.2 years.
The following weighted-average assumptions were used in calculating the fair value of cash-settled SARs granted during the three month periods ended April 4, 2015, and March 29, 2014, using the Black-Scholes valuation model:
The intrinsic value of cash-settled SARs exercised during the three month periods ended April 4, 2015, and March 29, 2014, was $3.4 million and $3.3 million, respectively. The fair value of cash-settled SARs vested during the three month periods ended April 4, 2015,and March 29, 2014, was $3.4 million and $3.8 million, respectively.
Changes to the company’s non-vested cash-settled SARs during the three month period ended April 4, 2015, are as follows:
* Weighted-average
As of April 4, 2015, there was $0.4 million of unrecognized compensation cost related to non-vested cash-settled SARs that is expected to be recognized as a charge to earnings over a weighted-average period of 1.8 years.
25
Three Months Ended
April 4, 2015
March 29,2014
Expected term of cash-settled SARs (in years) 4.68 4.35 Expected volatility factor 23.16% 25.19% Expected dividend yield 2.04% 2.40% Risk-free interest rate 1.26% 1.74%
Cash-settledSARs
(in thousands)
Fair ValuePrice per Share*
Non-vested cash-settled SARs at January 3, 2015 47 $ 68.35 Granted 4 25.78 Vested (42) 81.46
Non-vested cash-settled SARs at April 4, 2015 9 45.23

SNAP-ON INCORPORATED NOTES TO CONDENSED CONSOLIDATED FINANCIAL STATEMENTS (continued)
(Unaudited) Restricted Stock Awards – Non-employee Directors
The company awarded 8,940 shares and 10,398 shares of restricted stock to non-employee directors in 2015 and 2014, respectively. The fair value of the restricted stock awards is expensed over a one year vesting period based on the fair value on the date of grant.All restrictions for the restricted stock generally lapse upon the earlier of the first anniversary of the grant date, the recipient’s death or disability or in the event of a change in control, as defined in the 2011 Plan. If termination of the recipient’s service occurs prior to the first anniversary of the grant date for any reason other than death or disability, the shares of restricted stock would be forfeited,unless otherwise determined by the Board.
Employee Stock Purchase Plan
Substantially all Snap-on employees in the United States and Canada are eligible to participate in an employee stock purchase plan.The purchase price of the company’s common stock to participants is the lesser of the mean of the high and low price of the stock on the beginning date (May 15) or ending date (the following May 14) of each plan year. There were no share issuances under this planfor the three month periods ended April 4, 2015 and March 29, 2014. As of April 4, 2015, a total of 865,043 shares remain reservedfor issuance under this plan and Snap-on held approximately $5.0 million of participants’ contributions. Participants are able to withdraw from the plan at any time prior to the ending date and receive back all contributions made during the plan year.Compensation expense for plan participants was $1.0 million and $0.5 million for the three month periods ended April 4, 2015 andMarch 29, 2014, respectively.
Franchisee Stock Purchase Plan
All franchisees in the United States and Canada are eligible to participate in a franchisee stock purchase plan. The purchase price ofthe company’s common stock to participants is the lesser of the mean of the high and low price of the stock on the beginning date(May 15) or ending date (the following May 14) of each plan year. There were no share issuances under this plan for the three monthperiods ended April 4, 2015 and March 29, 2014. As of April 4, 2015, a total of 230,337 shares remain reserved for issuance underthis plan and Snap-on held approximately $4.7 million of participants’ contributions. Participants are able to withdraw from the planat any time prior to the ending date and receive back all contributions made during the plan year. Expense for plan participants was$1.2 million and $0.3 million for the three month periods ended April 4, 2015 and March 29, 2014, respectively.
Note 13: Earnings Per Share
The shares used in the computation of the company’s basic and diluted earnings per common share are as follows:
The dilutive effect of the potential exercise of outstanding options and stock-settled SARs to purchase common shares is calculated using the treasury stock method. As of April 4, 2015, and March 29, 2014, there were 741,495 shares and 756,170 shares,respectively, outstanding that were anti-dilutive. Performance-based equity awards do not affect the diluted earnings per sharecalculation until it is determined that the applicable performance metrics have been met.
26
Three Months Ended
April 4, 2015
March 29,2014
Weighted-average common shares outstanding 58,132,396 58,206,213 Effect of dilutive securities 972,913 871,042
Weighted-average common shares outstanding, assuming dilution 59,105,309 59,077,255
SNAP-ON INCORPORATED NOTES TO CONDENSED CONSOLIDATED FINANCIAL STATEMENTS (continued)
(Unaudited) Note 14: Commitments and Contingencies
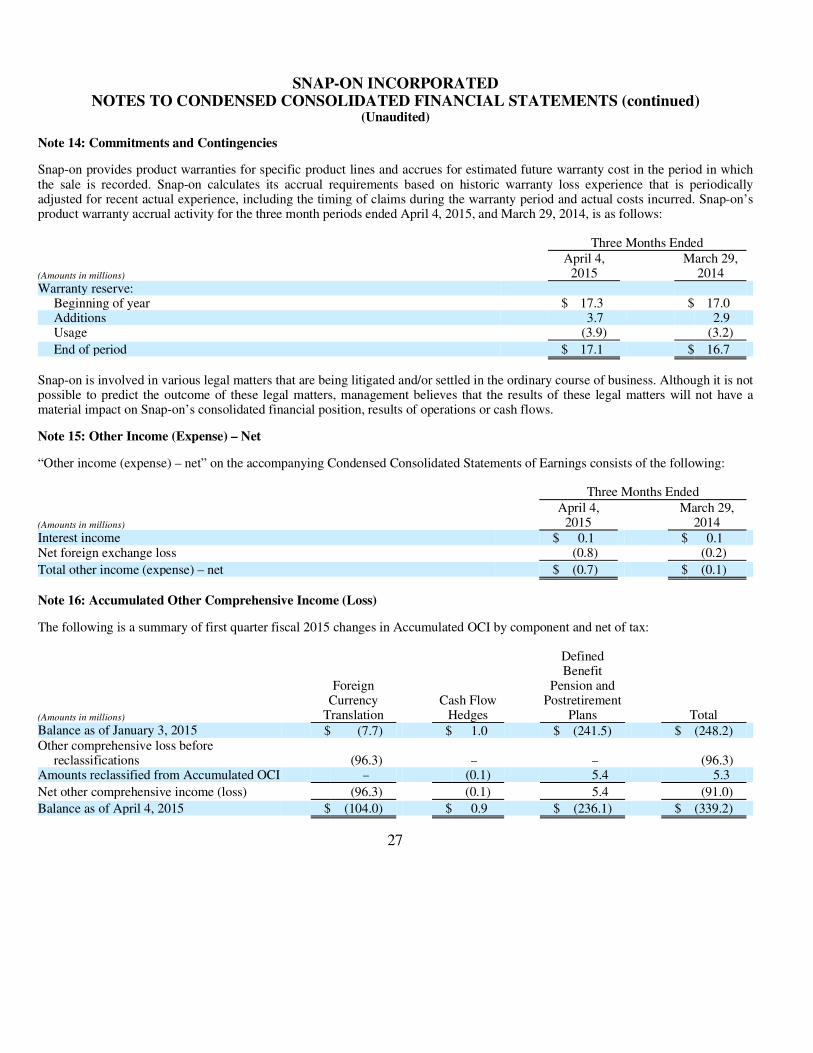
Snap-on provides product warranties for specific product lines and accrues for estimated future warranty cost in the period in whichthe sale is recorded. Snap-on calculates its accrual requirements based on historic warranty loss experience that is periodicallyadjusted for recent actual experience, including the timing of claims during the warranty period and actual costs incurred. Snap-on’s product warranty accrual activity for the three month periods ended April 4, 2015, and March 29, 2014, is as follows:
Snap-on is involved in various legal matters that are being litigated and/or settled in the ordinary course of business. Although it is notpossible to predict the outcome of these legal matters, management believes that the results of these legal matters will not have amaterial impact on Snap-on’s consolidated financial position, results of operations or cash flows.
Note 15: Other Income (Expense) – Net
“Other income (expense) – net” on the accompanying Condensed Consolidated Statements of Earnings consists of the following:
Note 16: Accumulated Other Comprehensive Income (Loss)
The following is a summary of first quarter fiscal 2015 changes in Accumulated OCI by component and net of tax:
27
Three Months Ended
(Amounts in millions)
April 4, 2015
March 29,2014
Warranty reserve:
Beginning of year $ 17.3 $ 17.0 Additions 3.7 2.9 Usage (3.9) (3.2)
End of period $ 17.1 $ 16.7
Three Months Ended
(Amounts in millions)
April 4, 2015
March 29,2014
Interest income $ 0.1 $ 0.1 Net foreign exchange loss (0.8) (0.2)
Total other income (expense) – net $ (0.7) $ (0.1)
(Amounts in millions)
ForeignCurrency
Translation
Cash FlowHedges
Defined Benefit
Pension and Postretirement
Plans Total
Balance as of January 3, 2015 $ (7.7) $ 1.0 $ (241.5) $ (248.2) Other comprehensive loss before
reclassifications (96.3) – – (96.3) Amounts reclassified from Accumulated OCI – (0.1) 5.4 5.3
Net other comprehensive income (loss) (96.3) (0.1) 5.4 (91.0)
Balance as of April 4, 2015 $ (104.0) $ 0.9 $ (236.1) $ (339.2)
SNAP-ON INCORPORATED NOTES TO CONDENSED CONSOLIDATED FINANCIAL STATEMENTS (continued)
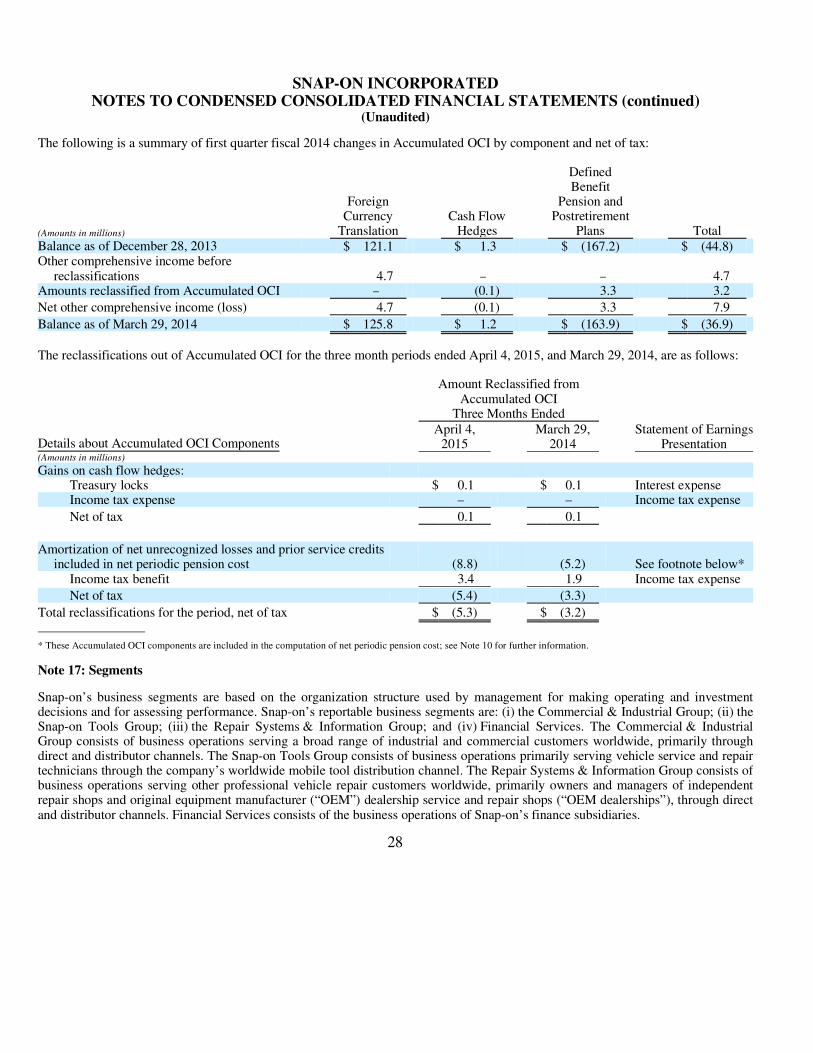
(Unaudited) The following is a summary of first quarter fiscal 2014 changes in Accumulated OCI by component and net of tax:
The reclassifications out of Accumulated OCI for the three month periods ended April 4, 2015, and March 29, 2014, are as follows:
* These Accumulated OCI components are included in the computation of net periodic pension cost; see Note 10 for further information.
Note 17: Segments
Snap-on’s business segments are based on the organization structure used by management for making operating and investmentdecisions and for assessing performance. Snap-on’s reportable business segments are: (i) the Commercial & Industrial Group; (ii) theSnap-on Tools Group; (iii) the Repair Systems & Information Group; and (iv) Financial Services. The Commercial & IndustrialGroup consists of business operations serving a broad range of industrial and commercial customers worldwide, primarily throughdirect and distributor channels. The Snap-on Tools Group consists of business operations primarily serving vehicle service and repairtechnicians through the company’s worldwide mobile tool distribution channel. The Repair Systems & Information Group consists ofbusiness operations serving other professional vehicle repair customers worldwide, primarily owners and managers of independentrepair shops and original equipment manufacturer (“OEM”) dealership service and repair shops (“OEM dealerships”), through direct and distributor channels. Financial Services consists of the business operations of Snap-on’s finance subsidiaries.
28
(Amounts in millions)
ForeignCurrency
Translation
Cash FlowHedges
Defined Benefit
Pension and Postretirement
Plans Total
Balance as of December 28, 2013 $ 121.1 $ 1.3 $ (167.2) $ (44.8) Other comprehensive income before
reclassifications 4.7 – – 4.7 Amounts reclassified from Accumulated OCI – (0.1) 3.3 3.2
Net other comprehensive income (loss) 4.7 (0.1) 3.3 7.9
Balance as of March 29, 2014 $ 125.8 $ 1.2 $ (163.9) $ (36.9)
Amount Reclassified from Accumulated OCI
Three Months Ended
Details about Accumulated OCI Components
April 4,2015
March 29, 2014
Statement of EarningsPresentation
(Amounts in millions)
Gains on cash flow hedges:
Treasury locks $ 0.1 $ 0.1 Interest expenseIncome tax expense – – Income tax expense
Net of tax 0.1 0.1
Amortization of net unrecognized losses and prior service credits included in net periodic pension cost (8.8) (5.2) See footnote below*
Income tax benefit 3.4 1.9 Income tax expense
Net of tax (5.4) (3.3)
Total reclassifications for the period, net of tax $ (5.3) $ (3.2)

SNAP-ON INCORPORATED NOTES TO CONDENSED CONSOLIDATED FINANCIAL STATEMENTS (continued)
(Unaudited) Snap-on evaluates the performance of its operating segments based on segment revenues, including both external and intersegmentnet sales, and segment operating earnings. Snap-on accounts for intersegment sales and transfers based primarily on standard costswith reasonable mark-ups established between the segments. Identifiable assets by segment are those assets used in the respectivereportable segment’s operations. Corporate assets consist of cash and cash equivalents (excluding cash held at Financial Services),deferred income taxes and certain other assets. All significant intersegment amounts are eliminated to arrive at Snap-on’s consolidated financial results. Financial data by segment was as follows:
29
Three Months Ended
(Amounts in millions)
April 4, 2015
March 29,2014
Net sales:
Commercial & Industrial Group $ 297.5 $ 290.6 Snap-on Tools Group 378.2 343.6 Repair Systems & Information Group 272.3 262.7
Segment net sales 948.0 896.9 Intersegment eliminations (120.2) (109.4)
Total net sales $ 827.8 $ 787.5 Financial Services revenue 57.4 50.2
Total revenues $ 885.2 $ 837.7
Operating earnings:
Commercial & Industrial Group $ 44.0 $ 39.1 Snap-on Tools Group 59.8 49.2 Repair Systems & Information Group 63.9 58.1 Financial Services 40.3 34.4
Segment operating earnings 208.0 180.8 Corporate (29.8) (24.7)
Operating earnings $ 178.2 $ 156.1 Interest expense (13.0) (13.7) Other income (expense) – net (0.7) (0.1)
Earnings before income taxes and equity earnings $ 164.5 $ 142.3
(Amounts in millions)
April 4, 2015
January 3,2015
Assets:
Commercial & Industrial Group $ 897.8 $ 939.7 Snap-on Tools Group 616.9 600.1 Repair Systems & Information Group 1,024.2 1,036.8 Financial Services 1,389.7 1,368.3
Total assets from reportable segments $ 3,928.6 $ 3,944.9 Corporate 377.0 401.7 Elimination of intersegment receivables (43.2) (36.5)
Total assets $ 4,262.4 $ 4,310.1

SNAP-ON INCORPORATED MANAGEMENT’S DISCUSSION AND ANALYSIS OF FINANCIAL CONDITION AND RESULTS
OF OPERATIONS
Item 2: Management’s Discussion and Analysis of Financial Condition and Results of Operations
Caution Regarding Forward-Looking Statements:
Statements in this document that are not historical facts, including statements that (i) are in the future tense; (ii) include the words“expects,” “plans,” “targets,” “estimates,” “believes,” “anticipates,” or similar words that reference Snap-on Incorporated (“Snap-on”or “the company”) or its management; (iii) are specifically identified as forward-looking; or (iv) describe Snap-on’s or management’s future outlook, plans, estimates, objectives or goals, are forward-looking statements within the meaning of the Private SecuritiesLitigation Reform Act of 1995. Snap-on cautions the reader that any forward-looking statements included in this document that are based upon assumptions and estimates were developed by management in good faith and are subject to risks, uncertainties or otherfactors that could cause (and in some cases have caused) actual results to differ materially from those described in any such statement.Accordingly, forward-looking statements should not be relied upon as a prediction of actual results or regarded as a representation bythe company or its management that the projected results will be achieved. For those forward-looking statements, Snap-on cautions the reader that numerous important factors, such as those listed below, as well as those factors discussed in its Annual Report on Form10-K for the fiscal year ended January 3, 2015, which are incorporated herein by reference, could affect the company’s actual results and could cause its actual consolidated results to differ materially from those expressed in any forward-looking statement made by, or on behalf of, Snap-on.
These risks and uncertainties include, without limitation, uncertainties related to estimates, statements, assumptions and projectionsgenerally, and the timing and progress with which Snap-on can attain value through its Snap-on Value Creation Processes, including its ability to realize efficiencies and savings from its rapid continuous improvement and other cost reduction initiatives, improveworkforce productivity, achieve improvements in the company’s manufacturing footprint and greater efficiencies in its supply chain,and enhance machine maintenance, plant productivity and manufacturing line set-up and change-over practices, any or all of which could result in production inefficiencies, higher costs and/or lost revenues. These risks also include uncertainties related to Snap-on’scapability to implement future strategies with respect to its existing businesses, its ability to refine its brand and franchise strategies,retain and attract franchisees, further enhance service and value to franchisees and thereby help improve their sales and profitability,introduce successful new products, successfully pursue, complete and integrate acquisitions, as well as its ability to withstanddisruption arising from natural disasters, planned facility closures or other labor interruptions, the effects of external negative factors,including adverse developments in world financial markets, weakness in certain areas of the global economy, and significant changesin the current competitive environment, inflation, interest rates and other monetary and market fluctuations, changes in tax rates andregulations, and the impact of energy and raw material supply and pricing, including steel and gasoline, the amount, rate and growthof Snap-on’s general and administrative expenses, including health care and postretirement costs (resulting from, among othermatters, U.S. health care legislation and its implementation), continuing and potentially increasing required contributions to pensionand postretirement plans, the impacts of non-strategic business and/or product line rationalizations, and the effects on business as a result of new legislation, regulations or government-related developments or issues, risks associated with data security andtechnological systems and protections, and other world or local events outside Snap-on’s control, including terrorist disruptions. Snap-on disclaims any responsibility to update any forward-looking statement provided in this document, except as required by law.
In addition, investors should be aware that generally accepted accounting principles in the United States of America (“U.S. GAAP”) prescribe when a company should reserve for particular risks, including litigation exposures. Accordingly, results for a givenreporting period could be significantly affected if and when a reserve is established for a major contingency. Reported results,therefore, may appear to be volatile in certain accounting periods.
30

SNAP-ON INCORPORATED MANAGEMENT’S DISCUSSION AND ANALYSIS OF FINANCIAL CONDITION AND RESULTS
OF OPERATIONS (continued)
RESULTS OF OPERATIONS
Results of operations for the three month periods ended April 4, 2015, and March 29, 2014, are as follows:
NM: Not meaningful
Percentage Disclosure: All income statement line item percentages below “Operating earnings from financial services” are calculated as a percentage of the sum of Net sales and Financial services revenue.
Net sales of $827.8 million in the first quarter of 2015 increased $40.3 million, or 5.1%, from 2014 levels, including $38.5 million ofunfavorable foreign currency translation and $4.9 million of acquisition-related sales. Organic sales (excluding foreign currency translation impacts and acquisition-related sales) in the first quarter of 2015 increased $73.9 million, or 9.9%, from 2014 levels.Snap-on has significant international operations and is subject to risks inherent with foreign operations, including foreign currencytranslation fluctuations.
Gross profit of $410.1 million in the first quarter of 2015 increased $31.4 million from $378.7 million last year. Gross margin (grossprofit as a percentage of net sales) of 49.5% in the quarter increased 140 basis points (100 basis points (“bps”) equals 1.0 percent) from 48.1% last year primarily due to benefits from higher sales, lower restructuring costs and savings from ongoing efficiency andproductivity initiatives, including benefits from prior restructuring actions (collectively, “Rapid Continuous Improvement” or “RCI initiatives”). Restructuring costs included in gross profit were zero and $2.0 million in the first quarters of 2015 and 2014,respectively.
31
Three Months Ended
(Amounts in millions) April 4, 2015 March 29, 2014 ChangeNet sales $ 827.8 100.0% $ 787.5 100.0% $ 40.3 5.1% Cost of goods sold (417.7) -50.5% (408.8) -51.9% (8.9) -2.2%
Gross profit 410.1 49.5% 378.7 48.1% 31.4 8.3% Operating expenses (272.2) -32.8% (257.0) -32.6% (15.2) -5.9%
Operating earnings before financial services 137.9 16.7% 121.7 15.5% 16.2 13.3%
Financial services revenue 57.4 100.0% 50.2 100.0% 7.2 14.3% Financial services expenses (17.1) -29.8% (15.8) -31.5% (1.3) -8.2%
Operating earnings from financial services 40.3 70.2% 34.4 68.5% 5.9 17.2%
Operating earnings 178.2 20.1% 156.1 18.6% 22.1 14.2% Interest expense (13.0) -1.4% (13.7) -1.6% 0.7 5.1% Other income (expense) – net (0.7) -0.1% (0.1) – (0.6) NM
Earnings before income taxes and equity earnings 164.5 18.6% 142.3 17.0% 22.2 15.6%
Income tax expense (51.8) -5.9% (44.3) -5.3% (7.5) -16.9%
Earnings before equity earnings 112.7 12.7% 98.0 11.7% 14.7 15.0% Equity earnings, net of tax 0.5 0.1% 0.2 – 0.3 150.0%
Net earnings 113.2 12.8% 98.2 11.7% 15.0 15.3% Net earnings attributable to noncontrolling
interests (2.7) -0.3% (2.3) -0.3% (0.4) -17.4%
Net earnings attributable to Snap-on Inc. $ 110.5 12.5% $ 95.9 11.4% $ 14.6 15.2%

SNAP-ON INCORPORATED MANAGEMENT’S DISCUSSION AND ANALYSIS OF FINANCIAL CONDITION AND RESULTS
OF OPERATIONS (continued)
Operating expenses of $272.2 million in the first quarter of 2015 increased $15.2 million from $257.0 million last year primarily dueto higher volume-related and other expenses partially offset by savings from RCI initiatives. The operating expense margin (operatingexpenses as a percentage of net sales) of 32.8% in the quarter increased 20 bps from 32.6% last year.
Operating earnings before financial services of $137.9 million in the first quarter of 2015, including $6.4 million of unfavorableforeign currency effects, increased $16.2 million, or 13.3%, as compared to $121.7 million last year. As a percentage of net sales,operating earnings before financial services of 16.7% in the quarter improved 120 bps from 15.5% last year.
Financial services operating earnings of $40.3 million on revenue of $57.4 million in the first quarter of 2015 compared to operatingearnings of $34.4 million on revenue of $50.2 million last year. The year-over-year increases in both revenue and operating earnings primarily reflect continued growth of the company’s financial services portfolio.
Operating earnings of $178.2 million in the first quarter of 2015, including $6.9 million of unfavorable foreign currency effects,increased $22.1 million, or 14.2%, from $156.1 million last year. As a percentage of revenues (net sales plus financial servicesrevenue), operating earnings of 20.1% in the quarter improved 150 bps from 18.6% last year.
Interest expense of $13.0 million in the first quarter of 2015 decreased $0.7 million from $13.7 million last year. See Note 8 to theCondensed Consolidated Financial Statements for information on Snap-on’s debt and credit facilities.
Other income (expense) – net was expense of $0.7 million and $0.1 million in the first quarters of 2015 and 2014, respectively. Otherincome (expense) – net reflects net losses and gains associated with hedging and currency exchange rate transactions, and interestincome. See Note 15 to the Condensed Consolidated Financial Statements for information on other income (expense) – net.
Snap-on’s effective income tax rate on earnings attributable to Snap-on was 32.0% in the first quarter of 2015 and 31.6% in the firstquarter of 2014. See Note 7 to the Condensed Consolidated Financial Statements for information on income taxes.
Net earnings attributable to Snap-on of $110.5 million, or $1.87 per diluted share, in the first quarter of 2015 increased $14.6 million,or $0.25 per diluted share, from 2014 levels. Net earnings attributable to Snap-on in the first quarter of 2014 were $95.9 million or $1.62 per diluted share.
On May 28, 2014, Snap-on acquired substantially all of the assets of Pro-Cut International, Inc. (“Pro-Cut”) for a cash purchase price of $41.3 million. Pro-Cut designs, manufactures and distributes on-car brake lathes, related equipment and accessories used in brakeservicing by automotive repair facilities. The acquisition of the Pro-Cut product line complemented and increased Snap-on’s existing undercar equipment product offering, broadened its established capabilities in serving vehicle repair facilities and expanded thecompany’s presence with repair shop owners and managers. For segment reporting purposes, the results of operations and assets ofPro-Cut have been included in the Repair Systems & Information Group since the date of acquisition.
Exit and Disposal Activities
Snap-on did not record any costs for exit and disposal activities in the first quarter of 2015; Snap-on recorded costs for exit and disposal activities of $2.0 million in the first quarter of 2014. See Note 6 to the Condensed Consolidated Financial Statements forinformation on Snap-on’s exit and disposal activities.
32

SNAP-ON INCORPORATED MANAGEMENT’S DISCUSSION AND ANALYSIS OF FINANCIAL CONDITION AND RESULTS
OF OPERATIONS (continued)
Segment Results
Snap-on’s business segments are based on the organization structure used by management for making operating and investmentdecisions and for assessing performance. Snap-on’s reportable business segments are: (i) the Commercial & Industrial Group; (ii) theSnap-on Tools Group; (iii) the Repair Systems & Information Group; and (iv) Financial Services. The Commercial & IndustrialGroup consists of business operations serving a broad range of industrial and commercial customers worldwide, primarily throughdirect and distributor channels. The Snap-on Tools Group consists of business operations primarily serving vehicle service and repairtechnicians through the company’s worldwide mobile tool distribution channel. The Repair Systems & Information Group consists ofbusiness operations serving other professional vehicle repair customers worldwide, primarily owners and managers of independentrepair shops and original equipment manufacturer (“OEM”) dealership service and repair shops (“OEM dealerships”), through direct and distributor channels. Financial Services consists of the business operations of Snap-on’s finance subsidiaries.
Snap-on evaluates the performance of its operating segments based on segment revenues, including both external and intersegmentnet sales, and segment operating earnings. Snap-on accounts for intersegment sales and transfers based primarily on standard costswith reasonable mark-ups established between the segments. Identifiable assets by segment are those assets used in the respectivereportable segment’s operations. Corporate assets consist of cash and cash equivalents (excluding cash held at Financial Services),deferred income taxes and certain other assets. All significant intersegment amounts are eliminated to arrive at Snap-on’s consolidated financial results.
Commercial & Industrial Group
Segment net sales of $297.5 million in the first quarter of 2015 increased $6.9 million, or 2.4%, from 2014 levels. Excluding $19.6million of unfavorable foreign currency translation, organic sales increased $26.5 million, or 9.8%, primarily reflecting similar salesstrength in both critical industries and in the segment’s European-based hand tools business.
Segment gross profit of $116.5 million in the first quarter of 2015 increased $3.8 million from 2014 levels. Gross margin of 39.2% inthe quarter improved 40 bps from 38.8% last year largely due to savings from RCI initiatives, primarily in Europe.
Segment operating expenses of $72.5 million in the first quarter of 2015 decreased $1.1 million from 2014 levels. The operatingexpense margin of 24.4% in the quarter improved 90 bps from 25.3% last year primarily due to sales volume leverage.
As a result of these factors, segment operating earnings of $44.0 million in the first quarter of 2015, including $1.3 million ofunfavorable foreign currency effects, increased $4.9 million from 2014 levels. Operating margin (segment operating earnings as apercentage of segment net sales) for the Commercial & Industrial Group of 14.8% in the first quarter of 2015 improved 130 bps from13.5% last year.
33
Three Months Ended
(Amounts in millions) April 4, 2015 March 29, 2014 Change
External net sales $ 234.0 78.7% $ 236.6 81.4% $ (2.6) -1.1% Intersegment net sales 63.5 21.3% 54.0 18.6% 9.5 17.6%
Segment net sales 297.5 100.0% 290.6 100.0% 6.9 2.4% Cost of goods sold (181.0) -60.8% (177.9) -61.2% (3.1) -1.7%
Gross profit 116.5 39.2% 112.7 38.8% 3.8 3.4% Operating expenses (72.5) -24.4% (73.6) -25.3% 1.1 1.5%
Segment operating earnings $ 44.0 14.8% $ 39.1 13.5% $ 4.9 12.5%

SNAP-ON INCORPORATED MANAGEMENT’S DISCUSSION AND ANALYSIS OF FINANCIAL CONDITION AND RESULTS
OF OPERATIONS (continued)
Snap-on Tools Group
Segment net sales of $378.2 million in the first quarter of 2015 increased $34.6 million, or 10.1%, from 2014 levels. Excluding $8.7million of unfavorable foreign currency translation, organic sales increased $43.3 million, or 12.9%, reflecting double-digit sales gains in both the company’s U.S. and international franchise operations.
Segment gross profit of $166.3 million in the first quarter of 2015 increased $18.3 million from 2014 levels. Gross margin of 44.0%in the quarter improved 90 bps from 43.1% last year primarily due to benefits from higher sales.
Segment operating expenses of $106.5 million in the first quarter of 2015 increased $7.7 million from 2014 levels primarily due tohigher volume-related expenses. The operating expense margin of 28.2% in the quarter improved 60 bps from 28.8% last yearprimarily due to sales volume leverage.
As a result of these factors, segment operating earnings of $59.8 million in the first quarter of 2015, including $3.0 million ofunfavorable foreign currency effects, increased $10.6 million from 2014 levels. Operating margin for the Snap-on Tools Group of 15.8% in the first quarter of 2015 improved 150 bps from 14.3% last year.
Repair Systems & Information Group
Segment net sales of $272.3 million in the first quarter of 2015 increased $9.6 million, or 3.7%, from 2014 levels. Excluding $11.2million of unfavorable foreign currency translation and $4.9 million of acquisition-related sales, organic sales increased $15.9 million or 6.3%. The organic sales increase primarily reflects a high single-digit gain in sales of undercar equipment, as well as mid single-digit gains in both sales to OEM dealerships and sales of diagnostic and repair information products to independent repair shopowners and managers.
Segment gross profit of $127.3 million in the first quarter of 2015 increased $9.3 million from 2014 levels. Gross margin of 46.8% inthe quarter improved 190 bps from 44.9% last year, primarily due to savings from RCI and other cost reduction initiatives and lowerrestructuring costs. Restructuring costs included in gross profit were zero and $2.0 million in the first quarters of 2015 and 2014,respectively.
34
Three Months Ended
(Amounts in millions) April 4, 2015 March 29, 2014 Change
Segment net sales $ 378.2 100.0% $ 343.6 100.0% $ 34.6 10.1% Cost of goods sold (211.9) -56.0% (195.6) -56.9% (16.3) -8.3%
Gross profit 166.3 44.0% 148.0 43.1% 18.3 12.4% Operating expenses (106.5) -28.2% (98.8) -28.8% (7.7) -7.8%
Segment operating earnings $ 59.8 15.8% $ 49.2 14.3% $ 10.6 21.5%
Three Months Ended(Amounts in millions) April 4, 2015 March 29, 2014 Change
External net sales $ 215.6 79.2% $ 207.3 78.9% $ 8.3 4.0% Intersegment net sales 56.7 20.8% 55.4 21.1% 1.3 2.3%
Segment net sales 272.3 100.0% 262.7 100.0% 9.6 3.7% Cost of goods sold (145.0) -53.2% (144.7) -55.1% (0.3) -0.2%
Gross profit 127.3 46.8% 118.0 44.9% 9.3 7.9% Operating expenses (63.4) -23.3% (59.9) -22.8% (3.5) -5.8%
Segment operating earnings $ 63.9 23.5% $ 58.1 22.1% $ 5.8 10.0%

SNAP-ON INCORPORATED MANAGEMENT’S DISCUSSION AND ANALYSIS OF FINANCIAL CONDITION AND RESULTS
OF OPERATIONS (continued)
Segment operating expenses of $63.4 million in the first quarter of 2015 increased $3.5 million from 2014 levels primarily due tohigher volume-related and other expenses, including operating expenses for Pro-Cut, partially offset by savings from RCI initiatives. The operating expense margin of 23.3% increased 50 bps from 22.8% last year primarily due to the operating expenses of Pro-Cut.
As a result of these factors, segment operating earnings of $63.9 million in the first quarter of 2015, including $2.1 million ofunfavorable foreign currency effects, increased $5.8 million from 2014 levels. Operating margin for the Repair Systems &Information Group of 23.5% in the first quarter of 2015 improved 140 bps from 22.1% last year.
Financial Services
Financial services operating earnings of $40.3 million on revenue of $57.4 million in the first quarter of 2015 compared to operatingearnings of $34.4 million on revenue of $50.2 million last year. The $7.2 million increase in financial services revenue primarilyreflects $6.3 million of higher revenue as a result of continued growth of the company’s financial services portfolio and $0.7 million of increased revenue from higher average yields on finance receivables. In the first quarters of 2015 and 2014, the average yield onfinance receivables was 17.7% and 17.5%, respectively, and the average yield on contract receivables was 9.5% in both periods.Originations of $230.7 million in the first quarter of 2015 increased $28.6 million, or 14.2%, from 2014 levels.
Financial services expenses primarily include personnel-related and other general and administrative costs, as well as provisions fordoubtful accounts. These expenses are generally more dependent on changes in the size of the financial services portfolio than theyare on the revenue of the segment. Financial services expenses of $17.1 million in the first quarter of 2015 compared to financialservices expenses of $15.8 million in 2014. As a percentage of the average financial services portfolio, financial services expenseswere 1.2% and 1.3% in the first quarters of 2015 and 2014, respectively.
See Note 3 to the Condensed Consolidated Financial Statements for further information on financial services.
Corporate
Snap-on’s first quarter 2015 general corporate expenses of $29.8 million increased $5.1 million from $24.7 million last year primarilydue to increased performance-based and stock-based compensation expenses, as well as planned higher pension expense.
Non-GAAP Supplemental Data
The supplemental data is presented for informational purposes to provide readers with insight into the information used bymanagement for assessing the operating performance of Snap-on Incorporated’s (“Snap-on”) non-financial services (“Operations”) and “Financial Services” businesses.
35
Three Months Ended
(Amounts in millions) April 4, 2015 March 29, 2014 Change
Financial services revenue $ 57.4 100.0% $ 50.2 100.0% $ 7.2 14.3% Financial services expenses (17.1) -29.8% (15.8) -31.5% (1.3) -8.2%
Segment operating earnings $ 40.3 70.2% $ 34.4 68.5% $ 5.9 17.2%
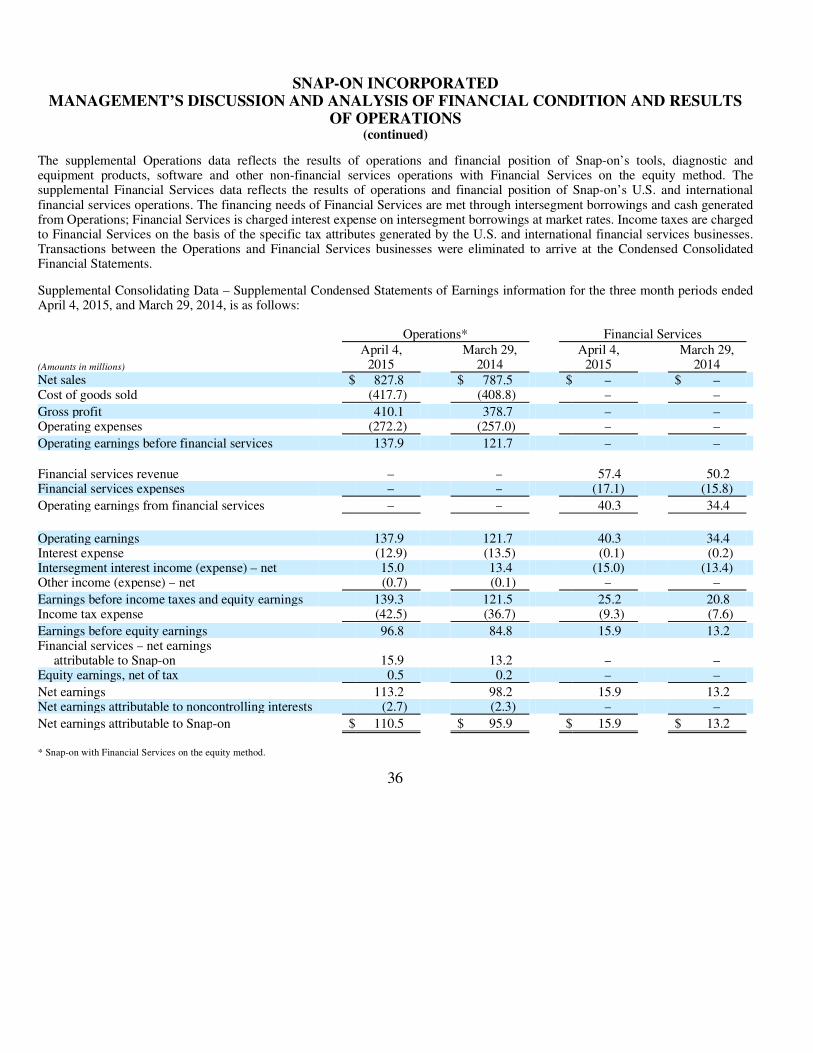
SNAP-ON INCORPORATED MANAGEMENT’S DISCUSSION AND ANALYSIS OF FINANCIAL CONDITION AND RESULTS
OF OPERATIONS (continued)
The supplemental Operations data reflects the results of operations and financial position of Snap-on’s tools, diagnostic and equipment products, software and other non-financial services operations with Financial Services on the equity method. Thesupplemental Financial Services data reflects the results of operations and financial position of Snap-on’s U.S. and international financial services operations. The financing needs of Financial Services are met through intersegment borrowings and cash generatedfrom Operations; Financial Services is charged interest expense on intersegment borrowings at market rates. Income taxes are chargedto Financial Services on the basis of the specific tax attributes generated by the U.S. and international financial services businesses.Transactions between the Operations and Financial Services businesses were eliminated to arrive at the Condensed ConsolidatedFinancial Statements.
Supplemental Consolidating Data – Supplemental Condensed Statements of Earnings information for the three month periods endedApril 4, 2015, and March 29, 2014, is as follows:
* Snap-on with Financial Services on the equity method.
36
Operations* Financial Services
(Amounts in millions)
April 4,2015
March 29,2014
April 4, 2015
March 29,2014
Net sales $ 827.8 $ 787.5 $ – $ – Cost of goods sold (417.7) (408.8) – –
Gross profit 410.1 378.7 – – Operating expenses (272.2) (257.0) – –
Operating earnings before financial services 137.9 121.7 – –
Financial services revenue – – 57.4 50.2 Financial services expenses – – (17.1) (15.8)
Operating earnings from financial services – – 40.3 34.4
Operating earnings 137.9 121.7 40.3 34.4 Interest expense (12.9) (13.5) (0.1) (0.2) Intersegment interest income (expense) – net 15.0 13.4 (15.0) (13.4) Other income (expense) – net (0.7) (0.1) – –
Earnings before income taxes and equity earnings 139.3 121.5 25.2 20.8 Income tax expense (42.5) (36.7) (9.3) (7.6)
Earnings before equity earnings 96.8 84.8 15.9 13.2 Financial services – net earnings
attributable to Snap-on 15.9 13.2 – – Equity earnings, net of tax 0.5 0.2 – –
Net earnings 113.2 98.2 15.9 13.2 Net earnings attributable to noncontrolling interests (2.7) (2.3) – –
Net earnings attributable to Snap-on $ 110.5 $ 95.9 $ 15.9 $ 13.2
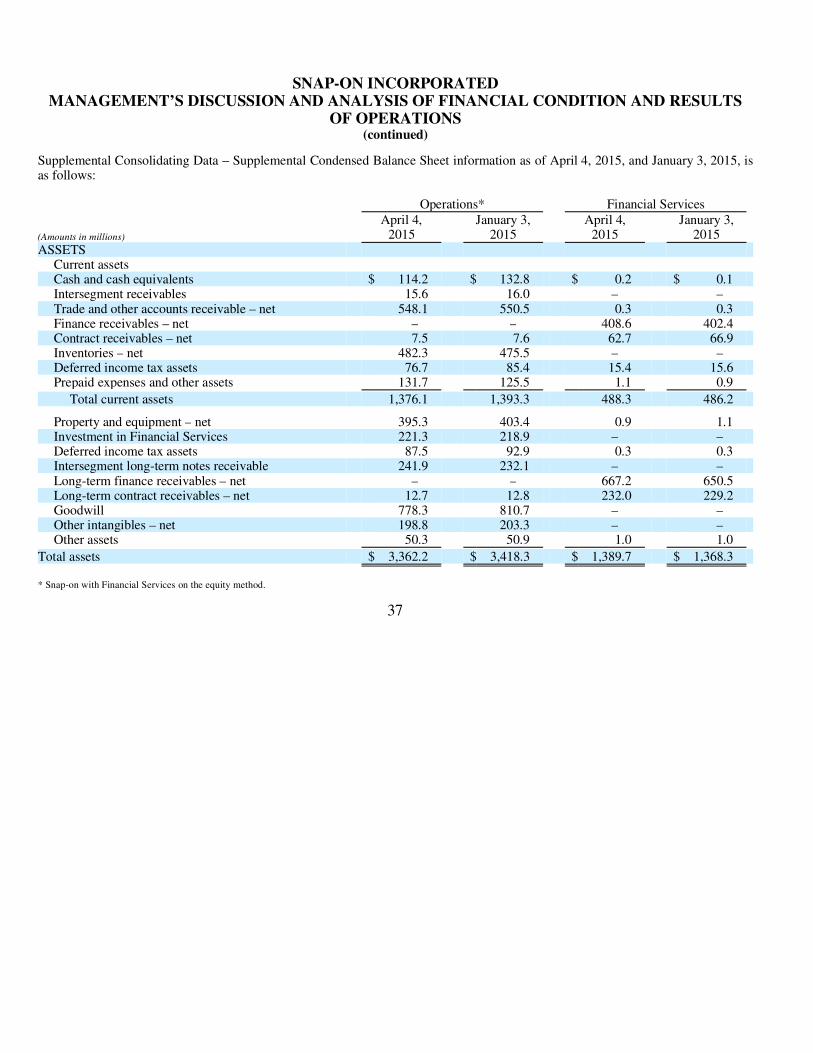
SNAP-ON INCORPORATED MANAGEMENT’S DISCUSSION AND ANALYSIS OF FINANCIAL CONDITION AND RESULTS
OF OPERATIONS (continued)
Supplemental Consolidating Data – Supplemental Condensed Balance Sheet information as of April 4, 2015, and January 3, 2015, isas follows:
* Snap-on with Financial Services on the equity method.
37
Operations* Financial Services
(Amounts in millions)
April 4,2015
January 3,2015
April 4, 2015
January 3,2015
ASSETS
Current assets
Cash and cash equivalents $ 114.2 $ 132.8 $ 0.2 $ 0.1 Intersegment receivables 15.6 16.0 – – Trade and other accounts receivable – net 548.1 550.5 0.3 0.3 Finance receivables – net – – 408.6 402.4 Contract receivables – net 7.5 7.6 62.7 66.9 Inventories – net 482.3 475.5 – – Deferred income tax assets 76.7 85.4 15.4 15.6 Prepaid expenses and other assets 131.7 125.5 1.1 0.9
Total current assets 1,376.1 1,393.3 488.3 486.2
Property and equipment – net 395.3 403.4 0.9 1.1 Investment in Financial Services 221.3 218.9 – – Deferred income tax assets 87.5 92.9 0.3 0.3 Intersegment long-term notes receivable 241.9 232.1 – – Long-term finance receivables – net – – 667.2 650.5 Long-term contract receivables – net 12.7 12.8 232.0 229.2 Goodwill 778.3 810.7 – – Other intangibles – net 198.8 203.3 – – Other assets 50.3 50.9 1.0 1.0
Total assets $ 3,362.2 $ 3,418.3 $ 1,389.7 $ 1,368.3
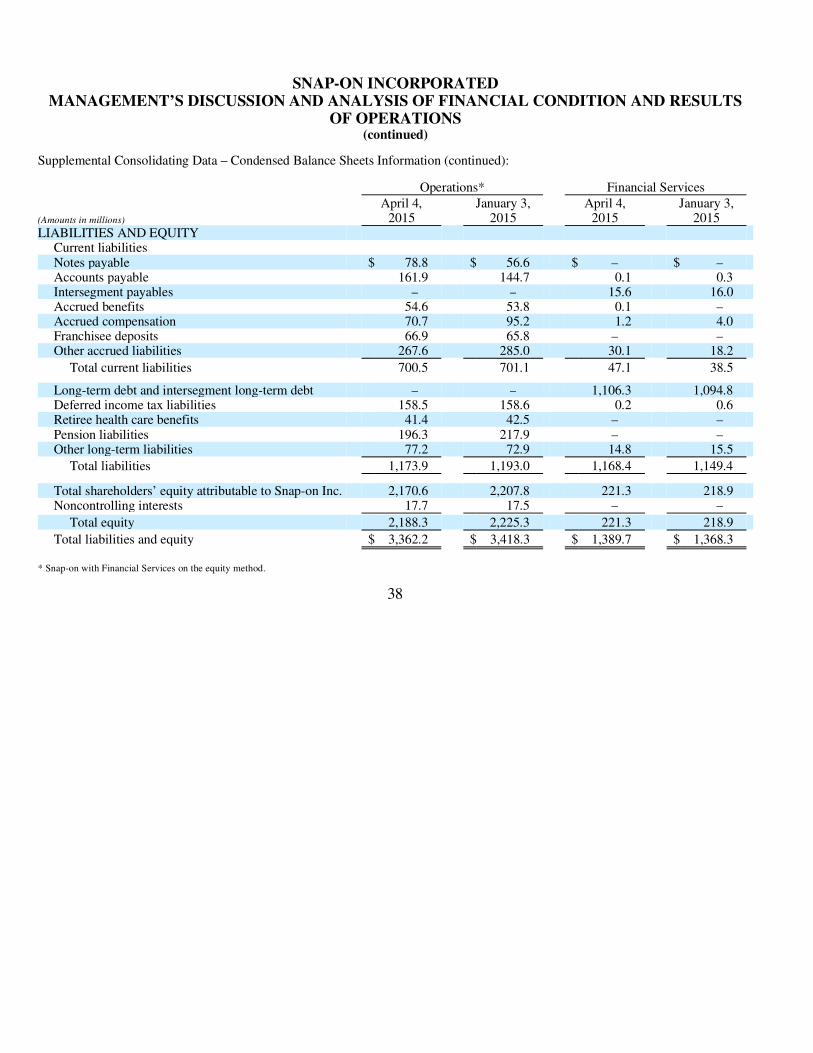
SNAP-ON INCORPORATED MANAGEMENT’S DISCUSSION AND ANALYSIS OF FINANCIAL CONDITION AND RESULTS
OF OPERATIONS (continued)
Supplemental Consolidating Data – Condensed Balance Sheets Information (continued):
* Snap-on with Financial Services on the equity method.
38
Operations* Financial Services
(Amounts in millions)
April 4,2015
January 3,2015
April 4, 2015
January 3,2015
LIABILITIES AND EQUITY Current liabilities
Notes payable $ 78.8 $ 56.6 $ – $ – Accounts payable 161.9 144.7 0.1 0.3 Intersegment payables – – 15.6 16.0 Accrued benefits 54.6 53.8 0.1 – Accrued compensation 70.7 95.2 1.2 4.0 Franchisee deposits 66.9 65.8 – – Other accrued liabilities 267.6 285.0 30.1 18.2
Total current liabilities 700.5 701.1 47.1 38.5
Long-term debt and intersegment long-term debt – – 1,106.3 1,094.8 Deferred income tax liabilities 158.5 158.6 0.2 0.6 Retiree health care benefits 41.4 42.5 – – Pension liabilities 196.3 217.9 – – Other long-term liabilities 77.2 72.9 14.8 15.5
Total liabilities 1,173.9 1,193.0 1,168.4 1,149.4
Total shareholders’ equity attributable to Snap-on Inc. 2,170.6 2,207.8 221.3 218.9 Noncontrolling interests 17.7 17.5 – –
Total equity 2,188.3 2,225.3 221.3 218.9
Total liabilities and equity $ 3,362.2 $ 3,418.3 $ 1,389.7 $ 1,368.3

SNAP-ON INCORPORATED MANAGEMENT’S DISCUSSION AND ANALYSIS OF FINANCIAL CONDITION AND RESULTS
OF OPERATIONS (continued)
Liquidity and Capital Resources
Snap-on’s growth has historically been funded by a combination of cash provided by operating activities and debt financing. Snap-on believes that its cash from operations and collections of finance receivables, coupled with its sources of borrowings and available cashon hand, are sufficient to fund its currently anticipated requirements for payments of interest and dividends, new receivablesoriginated by our financial services businesses, capital expenditures, working capital, restructuring activities, the funding of pensionplans, and funding for share repurchases and acquisitions, as they arise. Due to Snap-on’s credit rating over the years, external funds have been available at an acceptable cost. As of the close of business on April 17, 2015, Snap-on’s long-term debt and commercial paper were rated, respectively, A3 and P-2 by Moody’s Investors Service; A- and A-2 by Standard & Poor’s; and A- and F2 by Fitch Ratings. Snap-on believes that its current credit arrangements are sound and that the strength of its balance sheet affords the companythe financial flexibility to respond to both internal growth opportunities and those available through acquisitions. However, Snap-on cannot provide any assurances of the availability of future financing or the terms on which it might be available, or that its debtratings may not decrease.
The following discussion focuses on information included in the accompanying Condensed Consolidated Balance Sheets.
As of April 4, 2015, working capital (current assets less current liabilities) of $1,116.8 million decreased $23.1 million from $1,139.9million as of January 3, 2015 (fiscal 2014 year end).
The following represents the company’s working capital position as of April 4, 2015, and January 3, 2015:
Cash and cash equivalents of $114.4 million as of April 4, 2015, decreased $18.5 million from 2014 year-end levels. The $18.5 million net decrease in cash and cash equivalents includes the impacts of (i) the funding of $198.8 million of new finance receivables;(ii) the repurchase of 340,000 shares of the company’s common stock for $49.7 million; (iii) dividend payments to shareholders of$30.9 million; and (iv) the funding of $18.1 million of capital expenditures. These decreases in cash and cash equivalents werepartially offset by (i) $160.2 million of cash from collections of finance receivables; (ii) $78.1 million of cash generated fromoperations, net of $15.0 million of discretionary cash contributions to the company’s domestic pension plans; (iii) $22.8 million of cash, excluding $0.6 million of currency translation impacts, from a net increase in short-term borrowings; and (iv) $14.5 million of cash proceeds from stock purchase and option plan exercises.
39
(Amounts in millions)
April 4, 2015
January 3,2015
Cash and cash equivalents $ 114.4 $ 132.9 Trade and other accounts receivable – net 548.4 550.8 Finance receivables – net 408.6 402.4 Contract receivables – net 70.2 74.5 Inventories – net 482.3 475.5 Other current assets 219.4 222.5
Total current assets 1,843.3 1,858.6
Notes payable (78.8) (56.6) Accounts payable (162.0) (145.0) Other current liabilities (485.7) (517.1)
Total current liabilities (726.5) (718.7)
Total working capital $ 1,116.8 $ 1,139.9

SNAP-ON INCORPORATED MANAGEMENT’S DISCUSSION AND ANALYSIS OF FINANCIAL CONDITION AND RESULTS
OF OPERATIONS (continued)
Of the $114.4 million of cash and cash equivalents as of April 4, 2015, $94.8 million was held outside of the United States. Snap-on maintains non-U.S. funds in its foreign operations to (i) provide adequate working capital; (ii) satisfy various regulatory requirements;and/or (iii) take advantage of business expansion opportunities as they arise. The repatriation of cash from certain foreign subsidiariescould have adverse net tax consequences on the company should Snap-on be required to pay and record U.S. income taxes and foreign withholding taxes on such funds. Alternatively, the repatriation of cash from certain other foreign subsidiaries could result infavorable net tax consequences for the company. Snap-on periodically evaluates its cash held outside the United States and maypursue opportunities to repatriate certain foreign cash amounts to the extent that it does not incur unfavorable net tax consequences.
Trade and other accounts receivable – net of $548.4 million as of April 4, 2015, decreased $2.4 million from 2014 year-end levels; excluding $18.4 million of currency translation impacts, trade and other accounts receivable – net increased $16.0 million, largely due to higher sales. Days sales outstanding (trade and other accounts receivable – net as of the respective period end, divided by the respective trailing 12 months sales, times 360 days) was 60 days at April 4, 2015, and 61 days at 2014 year end.
The current portions of net finance and contract receivables of $478.8 million as of April 4, 2015, compared to $476.9 million at 2014year end. The long-term portions of net finance and contract receivables of $911.9 million as of April 4, 2015, compared to $892.5million at 2014 year end. The combined $21.3 million increase in net current and long-term finance and contract receivables over 2014 year-end levels is primarily due to continued growth of the company’s financial services portfolio; excluding $12.6 million of currency translation impacts, the combined increase for these receivables over 2014 year-end levels was $33.9 million.
Inventories of $482.3 million as of April 4, 2015, increased $6.8 million from 2014 year-end levels; excluding $16.9 million of currency translation impacts, inventories increased $23.7 million primarily to support continued higher customer demand and newproduct introductions. Inventory turns (trailing 12 months of cost of goods sold, divided by the average of the beginning and endinginventory balance for the trailing 12 months) were 3.6 turns and 3.7 turns as of April 4, 2015, and January 3, 2015, respectively.Inventories accounted for using the first-in, first-out (“FIFO”) method as of April 4, 2015, and January 3, 2015, approximated 57%and 58%, respectively, of total inventories. All other inventories are accounted for using the last-in, first-out (“LIFO”) method. The company’s LIFO reserve was $72.9 million and $72.6 million as of April 4, 2015, and January 3, 2015, respectively.
Notes payable of $78.8 million as of April 4, 2015 included $52.5 million of commercial paper borrowings and $26.3 million of othernotes. Notes payable of $56.6 million as of 2014 year end included $37.0 million of commercial paper borrowings and $19.6 millionof other notes. There were no current maturities of long-term debt as of both April 4, 2015, and January 3, 2015.
Accounts payable of $162.0 million as of April 4, 2015 increased $17.0 million from 2014 year-end levels; excluding $4.1 million of currency translation impacts, accounts payable increased $21.1 million primarily due to the timing of payments.
Other accrued liabilities of $292.2 million as of April 4, 2015, decreased $6.1 million from 2014 year-end levels; excluding $8.6 million of currency translation impacts, other accrued liabilities increased $2.5 million.
Long-term debt of $864.4 million as of April 4, 2015, consisted of (i) $150 million of unsecured 5.50% notes that mature in 2017;(ii) $250 million of unsecured 4.25% notes that mature in 2018; (iii) $200 million of unsecured 6.70% notes that mature in 2019;(iv) $250 million of unsecured 6.125% notes that mature in 2021; and (v) $14.4 million of other long-term debt, including fair valueadjustments related to interest rate swaps.
40
SNAP-ON INCORPORATED MANAGEMENT’S DISCUSSION AND ANALYSIS OF FINANCIAL CONDITION AND RESULTS
OF OPERATIONS (continued)
Snap-on has a five-year, $700 million multi-currency revolving credit facility that terminates on September 27, 2018 (the “Credit Facility”); no amounts were outstanding under the Credit Facility as of April 4, 2015. Borrowings under the Credit Facility bearinterest at varying rates based on Snap-on’s then-current, long-term debt ratings. The Credit Facility’s financial covenant requires thatSnap-on maintain, as of each fiscal quarter end, either (i) a ratio not greater than 0.60 to 1.00 of consolidated net debt (consolidateddebt net of certain cash adjustments) to the sum of such consolidated net debt plus total equity and less accumulated othercomprehensive income or loss; or (ii) a ratio not greater than 3.50 to 1.00 of such consolidated net debt to earnings before interest,taxes, depreciation, amortization and certain other adjustments for the preceding four fiscal quarters then ended. As of April 4, 2015,the company’s actual ratios of 0.27 and 1.14, respectively, were both within the permitted ranges set forth in this financial covenant.
Snap-on’s Credit Facility and other debt agreements also contain certain usual and customary borrowing, affirmative, negative andmaintenance covenants. As of April 4, 2015, Snap-on was in compliance with all covenants of its Credit Facility and other debtagreements.
Snap-on believes it has sufficient available cash and access to both committed and uncommitted credit facilities to cover its expectedfunding needs on both a short-term and long-term basis. Snap-on manages its aggregate short-term borrowings so as not to exceed its availability under the revolving Credit Facility. If the need were to arise, Snap-on believes that it could access short-term debt markets, predominantly through commercial paper issuances and existing lines of credit, to fund its short-term requirements and to ensure near-term liquidity. Snap-on regularly monitors the credit and financial markets and, in the future, may take advantage of whatit believes are favorable market conditions to issue long-term debt to further improve its liquidity and capital resources. Near termliquidity requirements for Snap-on include payments of interest and dividends, funding to support new receivables originated by ourfinancial services businesses, capital expenditures, working capital, restructuring activities, the funding of pension plans, and fundingfor share repurchases and acquisitions, as they arise. Snap-on intends to make contributions of $7.1 million to its foreign pensionplans and $2.0 million to its domestic pension plans in 2015, as required by law. Depending on market and other conditions, Snap-on may make additional discretionary cash contributions to its pension plans in 2015.
Snap-on’s long-term financing strategy is to maintain continuous access to the debt markets to accommodate its liquidity needs,including the potential use of commercial paper, additional fixed-term debt and/or securitizations.
The following discussion focuses on information included in the accompanying Condensed Consolidated Statements of Cash Flows.
Operating Activities
Net cash provided by operating activities was $78.1 million and $88.3 million in the first quarters of 2015 and 2014, respectively. The$10.2 million decrease in net cash provided by operating activities in 2015 primarily reflects net changes in operating assets andliabilities, including $15.0 million of discretionary cash contributions to the company’s domestic pension plans, partially offset by higher net earnings in 2015.
Investing Activities
Net cash used by investing activities of $59.5 million in the first quarter of 2015 included additions to, and collections of, financereceivables of $198.8 million and $160.2 million, respectively. Net cash used by investing activities of $50.9 million in the first quarter of 2014 included additions to, and collections of, finance receivables of $169.7 million and $139.4 million, respectively.Finance receivables are comprised of extended-term installment payment contracts to both technicians and independent shop owners(i.e., franchisees’ customers) to enable them to purchase tools and diagnostic and equipment products on an extended-term payment plan, generally with expected average payment terms of three years.
41
SNAP-ON INCORPORATED MANAGEMENT’S DISCUSSION AND ANALYSIS OF FINANCIAL CONDITION AND RESULTS
OF OPERATIONS (continued)
Capital expenditures of $18.1 million in the first quarter of 2015 compared to $18.3 million in the first quarter of last year. Capitalexpenditures in both years included continued investments related to the company’s execution of its strategic Value Creation Processes around safety, quality, customer connection, innovation and Rapid Continuous Improvement.
Net cash used by investing activities in the first quarters of 2015 and 2014 also included $2.8 million and $2.5 million, respectively,related to a prepaid equity forward transaction agreement with Citibank N.A. that is intended to reduce the impact of market riskassociated with the stock-based portion of the company’s deferred compensation plans. See Note 9 to the Condensed ConsolidatedFinancial Statements for additional information regarding prepaid equity forwards.
Financing Activities
Net cash used by financing activities of $35.3 million in the first quarter of 2015 included $22.8 million of proceeds from a netincrease in short-term borrowings. Net cash used by financing activities of $127.1 million in the first quarter of 2014 included theMarch 2014 repayment of $100.0 million of 5.85% unsecured notes at maturity.
Proceeds from stock purchase and option plan exercises totaled $14.5 million and $12.8 million in the first quarters of 2015 and 2014,respectively. Snap-on has undertaken stock repurchases from time to time to offset dilution created by shares issued for employee andfranchisee stock purchase plans, stock options and other corporate purposes. In the first quarter of 2015, Snap-on repurchased 340,000 shares of its common stock for $49.7 million under its previously announced share repurchase programs. In the first quarter of 2014,Snap-on repurchased 200,000 shares of its common stock for $22.1 million under its previously announced share repurchaseprograms. As of April 4, 2015, Snap-on had remaining availability to repurchase up to an additional $215.3 million in common stockpursuant to its Board of Directors’ (“Board”) authorizations. The purchase of Snap-on common stock is at the company’s discretion, subject to prevailing financial and market conditions. Snap-on believes that its cash generated from operations, available cash onhand, and funds available from its credit facilities, will be sufficient to fund additional share repurchases, if any, in 2015.
Snap-on has paid consecutive quarterly cash dividends, without interruption or reduction, since 1939. Cash dividends totaled $30.9million and $25.6 million in the first quarters of 2015 and 2014, respectively. On November 6, 2014, the Board increased thequarterly cash dividend by 20.5% to $0.53 per share ($2.12 per share per year). Snap-on believes that its cash generated from operations, available cash on hand and funds available from its credit facilities will be sufficient to pay dividends in 2015.
Off-Balance Sheet Arrangements
The company had no off-balance sheet arrangements as of April 4, 2015.
Critical Accounting Policies and Estimates
Snap-on’s disclosures of its critical accounting policies, which are contained in its Annual Report on Form 10-K for the fiscal year ended January 3, 2015, have not materially changed since that report was filed.
Outlook
Snap-on expects to make continued progress along its defined runways for coherent growth, including enhancing the franchisenetwork, expanding in the vehicle repair garage, extending to critical industries and building in emerging markets. In pursuit of theseinitiatives, Snap-on continues to expect that capital expenditures in 2015 will be in a range of $80 million to $90 million. Snap-on also continues to expect that its full year 2015 effective income tax rate will be at or below its 2014 full year rate.
42
Item 3: Quantitative and Qualitative Disclosures About Market Risk
Market, Credit and Economic Risks
Market risk is the potential economic loss that may result from adverse changes in the fair value of financial instruments. Snap-on is exposed to market risk from changes in foreign currency exchange rates and interest rates. Snap-on is also exposed to market riskassociated with the stock-based portion of its deferred compensation plans. Snap-on monitors its exposure to these risks and attempts to manage the underlying economic exposures through the use of financial instruments such as foreign currency forward contracts,interest rate swap agreements, treasury lock agreements and prepaid equity forward agreements (“equity forwards”). Snap-on does not use derivative instruments for speculative or trading purposes. Snap-on’s broad-based business activities help to reduce the impact that volatility in any particular area or related areas may have on its operating earnings as a whole. Snap-on’s management takes an active role in the risk management process and has developed policies and procedures that require specific administrative andbusiness functions to assist in the identification, assessment and control of various risks.
Foreign Currency Risk Management
Snap-on has significant international operations and is subject to certain risks inherent with foreign operations that include currencyfluctuations. Foreign exchange risk exists to the extent that Snap-on has payment obligations or receipts denominated in currenciesother than the functional currency, including intercompany loans denominated in foreign currencies. To manage these exposures,Snap-on identifies naturally offsetting positions and then purchases hedging instruments to protect the residual net exposures. SeeNote 9 to the Condensed Consolidated Financial Statements for information on foreign currency risk management.
Interest Rate Risk Management
Snap-on aims to control funding costs by managing the exposure created by the differing maturities and interest rate structures ofSnap-on’s borrowings through the use of interest rate swap agreements. Treasury lock agreements are used from time to time tomanage potential changes in interest rates in anticipation of the issuance or sale of certain financial instruments. See Note 9 to theCondensed Consolidated Financial Statements for information on interest rate risk management.
Snap-on utilizes a Value-at-Risk (“VAR”) model to determine the potential one-day loss in the fair value of its interest rate and foreign exchange-sensitive financial instruments from adverse changes in market factors. The VAR model estimates were madeassuming normal market conditions and a 95% confidence level. Snap-on’s computations are based on the inter-relationships among movements in various currencies and interest rates (variance/co-variance technique). These inter-relationships were determined byobserving interest rate and foreign currency market changes over the preceding quarter.
The estimated maximum potential one-day loss in fair value, calculated using the VAR model, as of April 4, 2015, was $1.5 millionon interest rate-sensitive financial instruments and $0.6 million on foreign currency-sensitive financial instruments. The VAR model is a risk management tool and does not purport to represent actual losses in fair value that will be incurred by Snap-on, nor does it consider the potential effect of favorable changes in market factors.
Stock-based Deferred Compensation Risk Management
Snap-on aims to manage market risk associated with the stock-based portion of its deferred compensation plans through the use ofequity forwards. Equity forwards are used to aid in offsetting the potential mark-to-market effect on stock-based deferred compensation from changes in Snap-on’s stock price. Since stock-based deferred compensation liabilities increase as the company’s stock price rises and decrease as the company’s stock price declines, the equity forwards are intended to mitigate the potential impacton compensation expense that may result from such mark-to-market changes. See Note 9 to the Condensed Consolidated FinancialStatements for additional information on stock-based deferred compensation risk management.
43
Credit Risk
Credit risk is the possibility of loss from a customer’s failure to make payments according to contract terms. Prior to extending credit,each customer is evaluated, taking into consideration the customer’s financial condition, collateral, debt-servicing ability, past payment experience, credit bureau information, and other financial and qualitative factors that may affect the customer’s ability to repay. Credit risk is also monitored regularly through the use of internal proprietary, custom scoring models used to evaluate eachtransaction at the time of the application for credit and by periodically updating those credit scores for ongoing monitoring purposes.Snap-on evaluates credit quality through the use of an internal proprietary measuring system that provides a framework to analyzefinance and contract receivables on the basis of risk factors of the individual obligor as well as transaction specific risk. The financeand contract receivables are typically monitored through an asset quality review process that closely monitors past due accounts andinitiates a progressive collection action process when appropriate.
Counterparty Risk
Snap-on is exposed to credit losses in the event of non-performance by the counterparties to its various financial agreements,including its foreign currency forward contracts, interest rate swap agreements and prepaid equity forward agreements. Snap-on does not obtain collateral or other security to support financial instruments subject to credit risk, but monitors the credit standing of thecounterparties and generally enters into agreements with financial institution counterparties with a credit rating of A- or better. Snap-on does not anticipate non-performance by its counterparties, but cannot provide assurances.
Economic Risk
Economic risk is the possibility of loss resulting from economic instability in certain areas of the world. Snap-on continually monitors its exposure in these markets. Inflation has not had a significant impact on the company.
As a result of the above market, credit and economic risks, net earnings and revenues in any particular period may not berepresentative of full-year results and may vary significantly from year to year.
Item 4: Controls and Procedures
Evaluation of Disclosure Controls and Procedures
Snap-on maintains a system of disclosure controls and procedures that is designed to provide reasonable assurance that materialinformation relating to the company and its consolidated subsidiaries is timely communicated to the officers who certify Snap-on’sfinancial reports and to other members of senior management and the Board, as appropriate.
In accordance with Rule 13a-15(b) of the Securities Exchange Act of 1934 (the “Exchange Act”), the company’s management evaluated, with the participation of the Chief Executive Officer and Chief Financial Officer, the effectiveness of the design andoperation of the company’s disclosure controls and procedures (as defined in Rules 13a-15(e) and 15d-15(e) under the Exchange Act)as of April 4, 2015. Based upon their evaluation of these disclosure controls and procedures, the Chief Executive Officer and ChiefFinancial Officer concluded that the disclosure controls and procedures were effective as of April 4, 2015, to ensure that informationrequired to be disclosed by the company in the reports it files or submits under the Exchange Act is recorded, processed, summarizedand reported, within the time period specified in the Securities and Exchange Commission rules and forms, and to ensure thatinformation required to be disclosed by the company in the reports it files or submits under the Exchange Act is accumulated andcommunicated to the company’s management, including its principal executive and principal financial officers, or persons performingsimilar functions, as appropriate, to allow timely decisions regarding required disclosure.
44
Changes in Internal Control
There has not been any change in the company’s internal control over financial reporting during the quarter ended April 4, 2015, thathas materially affected, or is reasonably likely to materially affect, the company’s internal control over financial reporting (as such term is defined in Exchange Act Rules 13a-15(f) and 15d-15(f)).
PART II. OTHER INFORMATION
Item 2: Unregistered Sales of Equity Securities and Use of Proceeds
The following discloses information regarding the shares of Snap-on’s common stock repurchased by the company during the firstquarter of fiscal 2015, all of which were purchased pursuant to the Board’s authorizations that the company has publicly announced. Snap-on has undertaken stock repurchases from time to time to offset dilution created by shares issued for employee and franchiseestock purchase plans, stock options and other corporate purposes, as well as to repurchase shares when the company believes marketconditions are favorable. The repurchase of Snap-on common stock is at the company’s discretion, subject to prevailing financial and market conditions.
Issuer Purchases of Equity Securities
N/A: Not applicable
45
Period
Sharespurchased
Averageprice
per share
Shares purchased as part ofpublicly announced plans or programs
Approximatevalue of sharesthat may yet bepurchased under
publicly announced plans
or programs
01/04/15 to 01/31/15 – – – $ 208.9 million 02/01/15 to 02/28/15 190,200 $ 145.99 190,200 $ 231.6 million 03/01/15 to 04/04/15 149,800 $ 146.39 149,800 $ 215.3 million
Total/Average 340,000 $ 146.17 340,000 N/A
* Subject to further adjustment pursuant to the 1996 Authorization described below, as of April 4, 2015, the approximate value of shares that may yet be purchased pursuant tothe three outstanding Board authorizations discussed below is $215.3 million.
• In 1996, the Board authorized the company to repurchase shares of the company’s common stock from time to time in the open market or in privately negotiatedtransactions (“the 1996 Authorization”). The 1996 Authorization allows the repurchase of up to the number of shares issued or delivered from treasury from timeto time under the various plans the company has in place that call for the issuance of the company’s common stock. Because the number of shares that are purchased pursuant to the 1996 Authorization will change from time to time as (i) the company issues shares under its various plans; and (ii) shares arerepurchased pursuant to this authorization, the number of shares authorized to be repurchased will vary from time to time. The 1996 Authorization will expirewhen terminated by the Board. When calculating the approximate value of shares that the company may yet purchase under the 1996 Authorization, the companyassumed a price of $132.71, $147.23 and $147.80 per share of common stock as of the end of the fiscal 2015 months ended January 31, 2015, February 28, 2015,and April 4, 2015, respectively.
• In 1998, the Board authorized the repurchase of an aggregate of $100 million of the company’s common stock (“the 1998 Authorization”). The 1998 Authorization
will expire when the aggregate repurchase price limit is met, unless terminated earlier by the Board.
• In 1999, the Board authorized the repurchase of an aggregate of $50 million of the company’s common stock (“the 1999 Authorization”). The 1999 Authorization
will expire when the aggregate repurchase price limit is met, unless terminated earlier by the Board.
*

Other Purchases or Sales of Equity Securities
Below is information regarding shares of Snap-on’s common stock that were purchased by Citibank, N.A. (“Citibank”) during the first quarter of 2015 pursuant to a prepaid equity forward transaction agreement (the “Agreement”) with Citibank that is intended toreduce the impact of market risk associated with the stock-based portion of the company’s deferred compensation plans. The company’s stock-based deferred compensation liabilities, which are impacted by changes in the company’s stock price, increase as the company’s stock price rises and decrease as the company’s stock price declines. Pursuant to the Agreement, Citibank maypurchase or sell shares of the company’s common stock (for Citibank’s account) in the market or in privately negotiated transactions.The Agreement has no stated expiration date and does not provide for Snap-on to purchase or repurchase its shares.
Citibank Purchases of Snap-on Stock
46
Period
Shares purchased
Averageprice
per share
01/04/15 to 01/31/15 – – 02/01/15 to 02/28/15 18,000 $ 145.30 03/01/15 to 04/04/15 1,200 $ 146.41
Total/Average 19,200 $ 145.37
Item 6: Exhibits
47
Exhibit 31.1 Certification of Chief Executive Officer pursuant to Section 302 of the Sarbanes-Oxley Act of 2002.
Exhibit 31.2 Certification of Principal Financial Officer pursuant to Section 302 of the Sarbanes-Oxley Act of 2002.
Exhibit 32.1
Certification of Chief Executive Officer Pursuant to 18 U.S.C. Section 1350, as Adopted Pursuant to Section906 of the Sarbanes-Oxley Act of 2002.
Exhibit 32.2
Certification of Principal Financial Officer Pursuant to 18 U.S.C. Section 1350, as Adopted Pursuant to Section906 of the Sarbanes-Oxley Act of 2002.
Exhibit 101.INS XBRL Instance Document*
Exhibit 101.SCH XBRL Taxonomy Extension Schema Document*
Exhibit 101.CAL XBRL Taxonomy Extension Calculation Linkbase Document*
Exhibit 101.DEF XBRL Taxonomy Extension Definition Linkbase Document*
Exhibit 101.LAB XBRL Taxonomy Extension Label Linkbase Document*
Exhibit 101.PRE XBRL Taxonomy Extension Presentation Linkbase Document*
* Attached as Exhibit 101 to this report are the following documents formatted in XBRL (Extensible Business Reporting Language): (i) Condensed Consolidated Statements ofEarnings for the three months ended April 4, 2015, and March 29, 2014; (ii) Condensed Consolidated Statements of Comprehensive Income for the three months ended April 4,2015, and March 29, 2014; (iii) Condensed Consolidated Balance Sheets as of April 4, 2015, and January 3, 2015; (iv) Condensed Consolidated Statements of Equity for thethree months ended April 4, 2015, and March 29, 2014; (v) Condensed Consolidated Statements of Cash Flows for the three months ended April 4, 2015, and March 29, 2014;and (vi) Notes to Condensed Consolidated Financial Statements.

SIGNATURES
Pursuant to the requirements of the Securities Exchange Act of 1934, Snap-on Incorporated has duly caused this report to be signed on its behalf by the undersigned thereunto duly authorized.
SNAP-ON INCORPORATED
48
Date: April 23, 2015 /s/ Aldo J. Pagliari Aldo J. Pagliari, Principal Financial Officer,
Senior Vice President – Finance and
Chief Financial Officer
EXHIBIT INDEX
49
Exhibit No.
31.1 Certification of Chief Executive Officer pursuant to Section 302 of the Sarbanes-Oxley Act of 2002.
31.2 Certification of Principal Financial Officer pursuant to Section 302 of the Sarbanes-Oxley Act of 2002.
32.1
Certification of Chief Executive Officer Pursuant to 18 U.S.C. Section 1350, as Adopted Pursuant to Section 906of the Sarbanes-Oxley Act of 2002.
32.2
Certification of Principal Financial Officer Pursuant to 18 U.S.C. Section 1350, as Adopted Pursuant to Section906 of the Sarbanes-Oxley Act of 2002.
101.INS XBRL Instance Document*
101.SCH XBRL Taxonomy Extension Schema Document*
101.CAL XBRL Taxonomy Extension Calculation Linkbase Document*
101.DEF XBRL Taxonomy Extension Definition Linkbase Document*
101.LAB XBRL Taxonomy Extension Label Linkbase Document*
101.PRE XBRL Taxonomy Extension Presentation Linkbase Document*
* Attached as Exhibit 101 to this report are the following documents formatted in XBRL (Extensible Business Reporting Language): (i) Condensed Consolidated Statements ofEarnings for the three months ended April 4, 2015, and March 29, 2014; (ii) Condensed Consolidated Statements of Comprehensive Income for the three months ended April 4,2015, and March 29, 2014; (iii) Condensed Consolidated Balance Sheets as of April 4, 2015, and January 3, 2015; (iv) Condensed Consolidated Statements of Equity for thethree months ended April 4, 2015, and March 29, 2014; (v) Condensed Consolidated Statements of Cash Flows for the three months ended April 4, 2015, and March 29, 2014;and (vi) Notes to Condensed Consolidated Financial Statements.
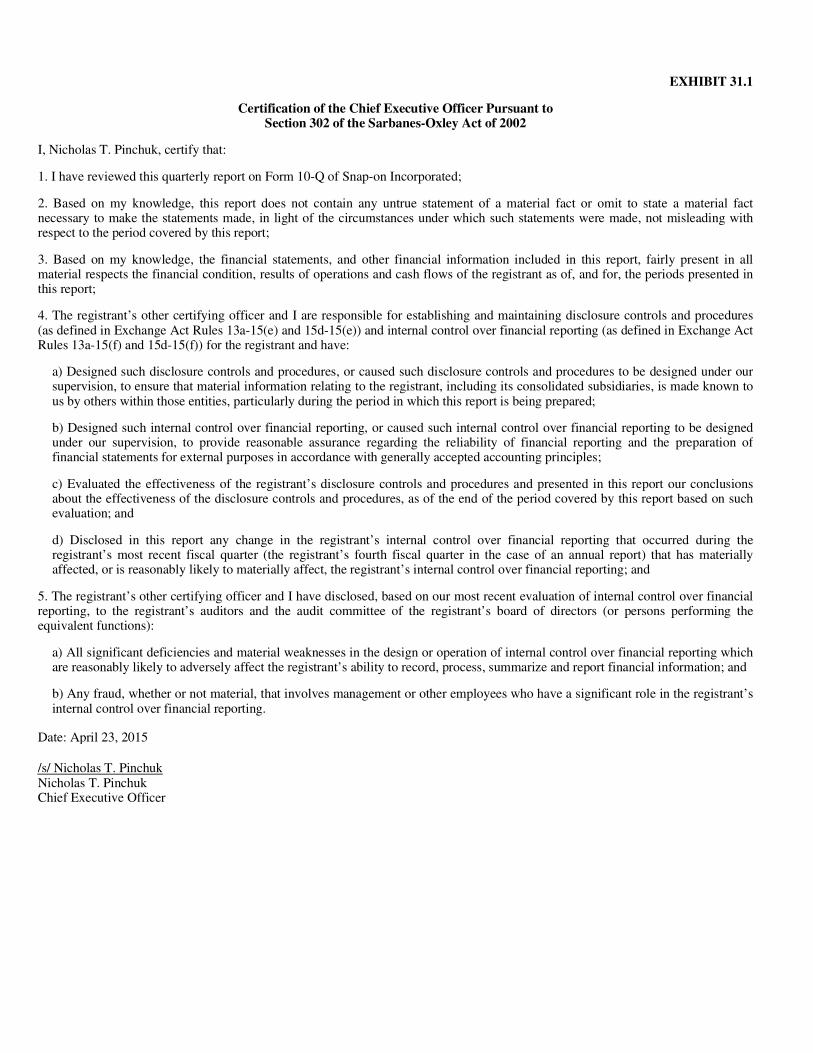
EXHIBIT 31.1
Certification of the Chief Executive Officer Pursuant to Section 302 of the Sarbanes-Oxley Act of 2002
I, Nicholas T. Pinchuk, certify that:
1. I have reviewed this quarterly report on Form 10-Q of Snap-on Incorporated;
2. Based on my knowledge, this report does not contain any untrue statement of a material fact or omit to state a material factnecessary to make the statements made, in light of the circumstances under which such statements were made, not misleading withrespect to the period covered by this report;
3. Based on my knowledge, the financial statements, and other financial information included in this report, fairly present in allmaterial respects the financial condition, results of operations and cash flows of the registrant as of, and for, the periods presented inthis report;
4. The registrant’s other certifying officer and I are responsible for establishing and maintaining disclosure controls and procedures(as defined in Exchange Act Rules 13a-15(e) and 15d-15(e)) and internal control over financial reporting (as defined in Exchange ActRules 13a-15(f) and 15d-15(f)) for the registrant and have:
a) Designed such disclosure controls and procedures, or caused such disclosure controls and procedures to be designed under oursupervision, to ensure that material information relating to the registrant, including its consolidated subsidiaries, is made known tous by others within those entities, particularly during the period in which this report is being prepared;
b) Designed such internal control over financial reporting, or caused such internal control over financial reporting to be designedunder our supervision, to provide reasonable assurance regarding the reliability of financial reporting and the preparation offinancial statements for external purposes in accordance with generally accepted accounting principles;
c) Evaluated the effectiveness of the registrant’s disclosure controls and procedures and presented in this report our conclusionsabout the effectiveness of the disclosure controls and procedures, as of the end of the period covered by this report based on suchevaluation; and
d) Disclosed in this report any change in the registrant’s internal control over financial reporting that occurred during theregistrant’s most recent fiscal quarter (the registrant’s fourth fiscal quarter in the case of an annual report) that has materiallyaffected, or is reasonably likely to materially affect, the registrant’s internal control over financial reporting; and
5. The registrant’s other certifying officer and I have disclosed, based on our most recent evaluation of internal control over financialreporting, to the registrant’s auditors and the audit committee of the registrant’s board of directors (or persons performing the equivalent functions):
a) All significant deficiencies and material weaknesses in the design or operation of internal control over financial reporting whichare reasonably likely to adversely affect the registrant’s ability to record, process, summarize and report financial information; and
b) Any fraud, whether or not material, that involves management or other employees who have a significant role in the registrant’s internal control over financial reporting.
Date: April 23, 2015
/s/ Nicholas T. PinchukNicholas T. Pinchuk Chief Executive Officer
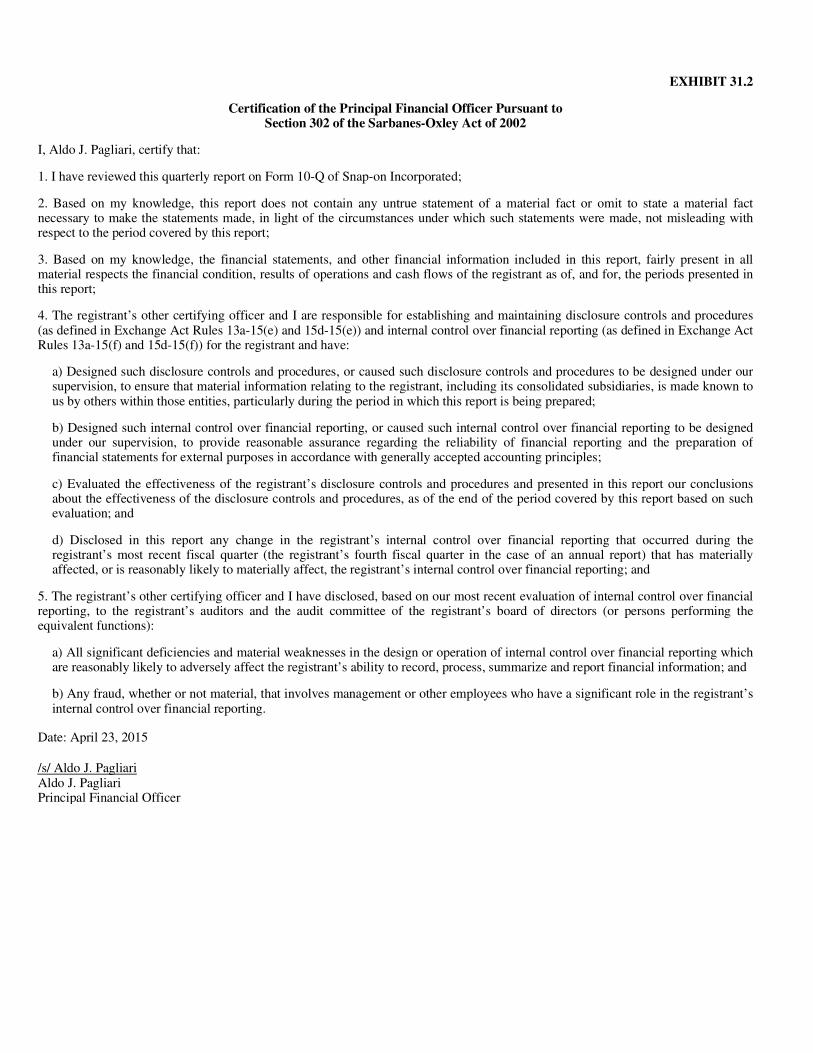
EXHIBIT 31.2
Certification of the Principal Financial Officer Pursuant to Section 302 of the Sarbanes-Oxley Act of 2002
I, Aldo J. Pagliari, certify that:
1. I have reviewed this quarterly report on Form 10-Q of Snap-on Incorporated;
2. Based on my knowledge, this report does not contain any untrue statement of a material fact or omit to state a material factnecessary to make the statements made, in light of the circumstances under which such statements were made, not misleading withrespect to the period covered by this report;
3. Based on my knowledge, the financial statements, and other financial information included in this report, fairly present in allmaterial respects the financial condition, results of operations and cash flows of the registrant as of, and for, the periods presented inthis report;
4. The registrant’s other certifying officer and I are responsible for establishing and maintaining disclosure controls and procedures(as defined in Exchange Act Rules 13a-15(e) and 15d-15(e)) and internal control over financial reporting (as defined in Exchange ActRules 13a-15(f) and 15d-15(f)) for the registrant and have:
a) Designed such disclosure controls and procedures, or caused such disclosure controls and procedures to be designed under oursupervision, to ensure that material information relating to the registrant, including its consolidated subsidiaries, is made known tous by others within those entities, particularly during the period in which this report is being prepared;
b) Designed such internal control over financial reporting, or caused such internal control over financial reporting to be designedunder our supervision, to provide reasonable assurance regarding the reliability of financial reporting and the preparation offinancial statements for external purposes in accordance with generally accepted accounting principles;
c) Evaluated the effectiveness of the registrant’s disclosure controls and procedures and presented in this report our conclusionsabout the effectiveness of the disclosure controls and procedures, as of the end of the period covered by this report based on suchevaluation; and
d) Disclosed in this report any change in the registrant’s internal control over financial reporting that occurred during theregistrant’s most recent fiscal quarter (the registrant’s fourth fiscal quarter in the case of an annual report) that has materiallyaffected, or is reasonably likely to materially affect, the registrant’s internal control over financial reporting; and
5. The registrant’s other certifying officer and I have disclosed, based on our most recent evaluation of internal control over financialreporting, to the registrant’s auditors and the audit committee of the registrant’s board of directors (or persons performing the equivalent functions):
a) All significant deficiencies and material weaknesses in the design or operation of internal control over financial reporting whichare reasonably likely to adversely affect the registrant’s ability to record, process, summarize and report financial information; and
b) Any fraud, whether or not material, that involves management or other employees who have a significant role in the registrant’s internal control over financial reporting.
Date: April 23, 2015
/s/ Aldo J. PagliariAldo J. Pagliari Principal Financial Officer

EXHIBIT 32.1
Certification of Chief Executive Officer Pursuant to 18 U.S.C. Section 1350,
As Adopted Pursuant to Section 906 of the Sarbanes-Oxley Act of 2002
In connection with the Quarterly Report of Snap-on Incorporated (the “Company”) on Form 10-Q for the period ended April 4, 2015, as filed with the Securities and Exchange Commission on the date hereof (the “Report”), Nicholas T. Pinchuk as Chief Executive Officer of the Company, hereby certifies, pursuant to 18 U.S.C. § 1350, as adopted pursuant to § 906 of the Sarbanes-Oxley Act of 2002, to the best of his knowledge, that:
(1) The Report fully complies with the requirements of section 13(a) or 15(d) of the Securities Exchange Act of 1934; and
(2) The information contained in the Report fairly presents, in all material respects, the financial condition and results of
operations of the Company.
/s/ Nicholas T. PinchukNicholas T. Pinchuk Chief Executive Officer April 23, 2015

EXHIBIT 32.2
Certification of Principal Financial Officer Pursuant to 18 U.S.C. Section 1350,
As Adopted Pursuant to Section 906 of the Sarbanes-Oxley Act of 2002
In connection with the Quarterly Report of Snap-on Incorporated (the “Company”) on Form 10-Q for the period ended April 4, 2015, as filed with the Securities and Exchange Commission on the date hereof (the “Report”), Aldo J. Pagliari as Principal Financial Officer of the Company, hereby certifies, pursuant to 18 U.S.C. § 1350, as adopted pursuant to § 906 of the Sarbanes-Oxley Act of 2002, to the best of his knowledge, that:
(1) The Report fully complies with the requirements of section 13(a) or 15(d) of the Securities Exchange Act of 1934; and
(2) The information contained in the Report fairly presents, in all material respects, the financial condition and results of
operations of the Company.
/s/ Aldo J. PagliariAldo J. Pagliari Principal Financial Officer April 23, 2015