Embed Size (px)
Citation preview
UNITED STATESSECURITIES AND EXCHANGE COMMISSION
WASHINGTON, DC 20549
FORM 10 - Q
QUARTERLY REPORT PURSUANT TO SECTION 13 or 15(d) OF THE SECURITIES EXCHANGE ACT OF 1934
FOR THE QUARTER ENDED SEPTEMBER 30, 2015
1-2360(Commission file number)
INTERNATIONAL BUSINESS MACHINES CORPORATION(Exact name of registrant as specified in its charter)
New York 13-0871985(State of incorporation) (IRS employer identification number)
Armonk, New York 10504(Address of principal executive offices) (Zip Code)
914-499-1900(Registrant’s telephone number)
Indicate by check mark whether the registrant (1) has filed all reports required to be filed by Section l3 or l5(d) of the Securities Exchange Act of 1934 during the preceding 12 months (or for such shorter period that the registrant was required to file such reports), and (2) has been subject to such filing requirements for the past 90 days. Yes No
Indicate by check mark whether the registrant has submitted electronically and posted on its corporate Web site, if any, every Interactive Data File required to be submitted and posted pursuant to Rule 405 of Regulation S-T (§232.405 of this chapter) during the preceding 12 months (or for such shorter period that the registrant was required to submit and post such files). Yes No
Indicate by check mark whether the registrant is a large accelerated filer, an accelerated filer, a non-accelerated filer or a smaller reporting company. See the definitions of “large accelerated filer,” “accelerated filer” and “smaller reporting company” in Rule 12b-2 of the Exchange Act.
Large accelerated filer Accelerated filer
Non-accelerated filer Smaller reporting company (Do not check if a smaller reporting company)
Indicate by check mark whether the registrant is a shell company (as defined in Rule 12b-2 of the Exchange Act). Yes No
The registrant had 970,110,126 shares of common stock outstanding at September 30, 2015.
2
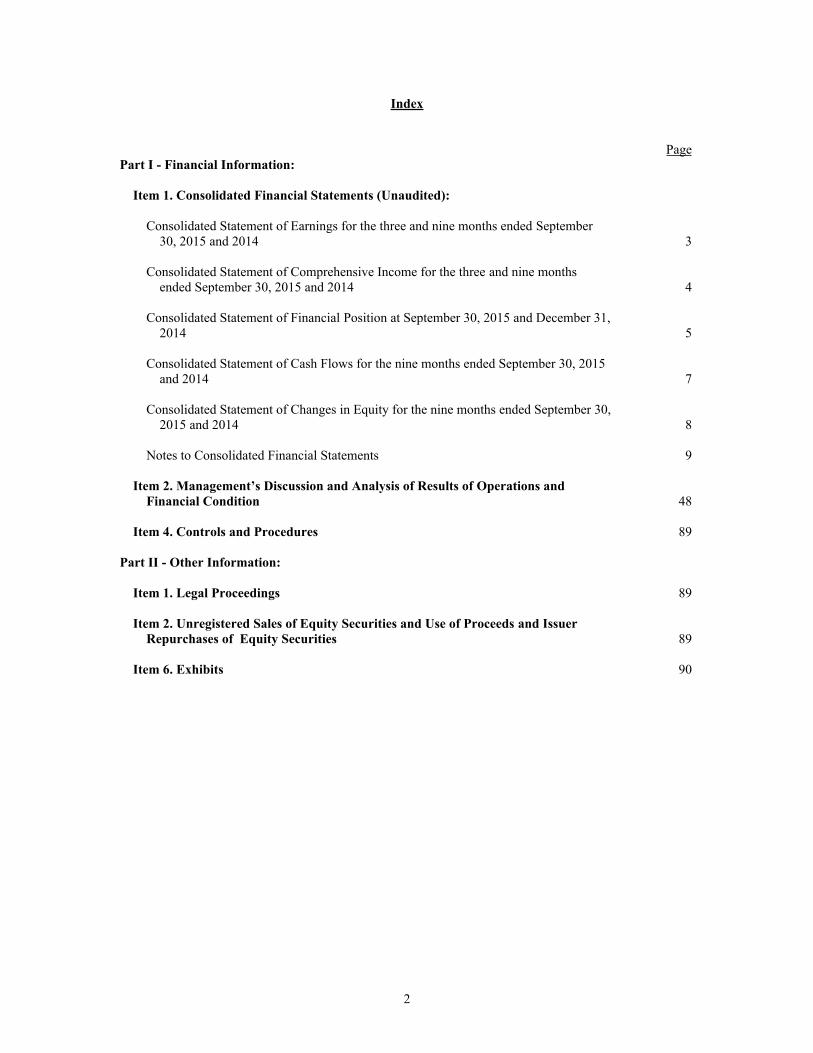
Index
PagePart I - Financial Information:
Item 1. Consolidated Financial Statements (Unaudited):
Consolidated Statement of Earnings for the three and nine months ended September 30, 2015 and 2014 3
Consolidated Statement of Comprehensive Income for the three and nine months ended September 30, 2015 and 2014 4
Consolidated Statement of Financial Position at September 30, 2015 and December 31, 2014 5
Consolidated Statement of Cash Flows for the nine months ended September 30, 2015 and 2014 7
Consolidated Statement of Changes in Equity for the nine months ended September 30, 2015 and 2014 8
Notes to Consolidated Financial Statements 9
Item 2. Management’s Discussion and Analysis of Results of Operations and Financial Condition 48
Item 4. Controls and Procedures 89
Part II - Other Information:
Item 1. Legal Proceedings 89
Item 2. Unregistered Sales of Equity Securities and Use of Proceeds and Issuer Repurchases of Equity Securities 89
Item 6. Exhibits 90
Part I - Financial Information
Item 1. Consolidated Financial Statements:
INTERNATIONAL BUSINESS MACHINES CORPORATION AND SUBSIDIARY COMPANIES
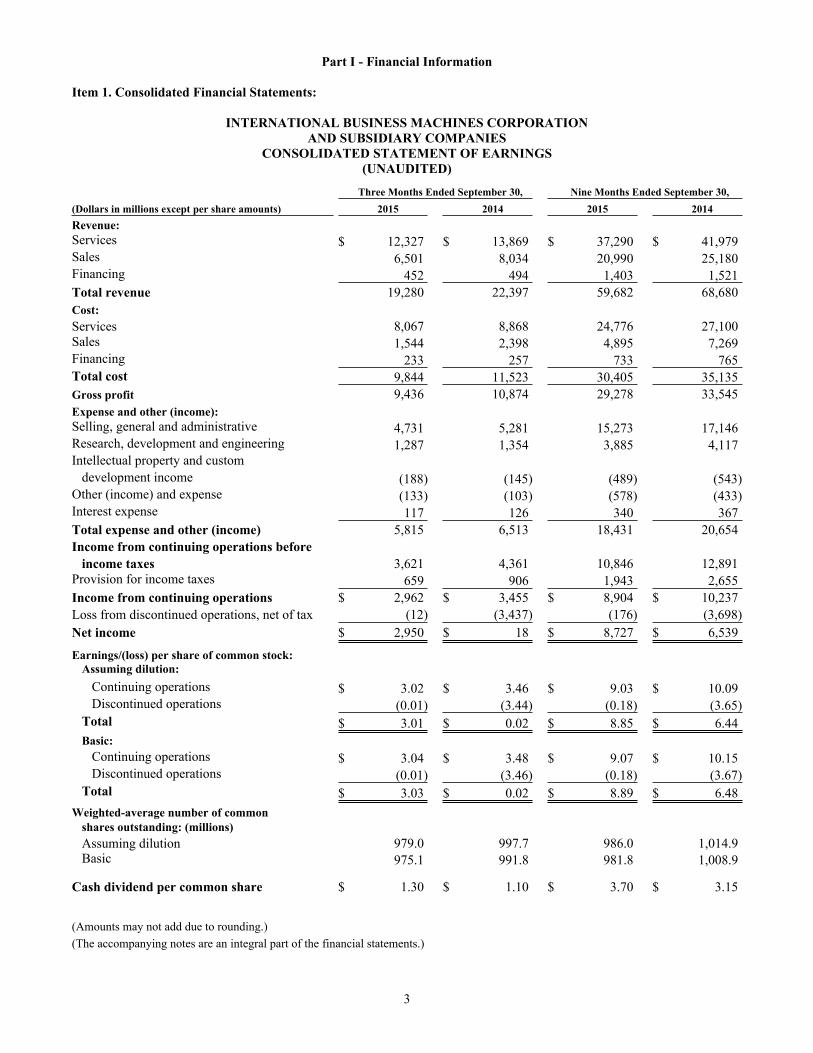
CONSOLIDATED STATEMENT OF EARNINGS (UNAUDITED)
3
Three Months Ended September 30, Nine Months Ended September 30,(Dollars in millions except per share amounts) 2015 2014 2015 2014Revenue:Services $ 12,327 $ 13,869 $ 37,290 $ 41,979Sales 6,501 8,034 20,990 25,180Financing 452 494 1,403 1,521Total revenue 19,280 22,397 59,682 68,680Cost:Services 8,067 8,868 24,776 27,100Sales 1,544 2,398 4,895 7,269Financing 233 257 733 765Total cost 9,844 11,523 30,405 35,135Gross profit 9,436 10,874 29,278 33,545Expense and other (income):Selling, general and administrative 4,731 5,281 15,273 17,146Research, development and engineering 1,287 1,354 3,885 4,117Intellectual property and custom
development income (188) (145) (489) (543)Other (income) and expense (133) (103) (578) (433)Interest expense 117 126 340 367Total expense and other (income) 5,815 6,513 18,431 20,654Income from continuing operations before
income taxes 3,621 4,361 10,846 12,891Provision for income taxes 659 906 1,943 2,655Income from continuing operations $ 2,962 $ 3,455 $ 8,904 $ 10,237Loss from discontinued operations, net of tax (12) (3,437) (176) (3,698)Net income $ 2,950 $ 18 $ 8,727 $ 6,539
Earnings/(loss) per share of common stock:Assuming dilution:
Continuing operations $ 3.02 $ 3.46 $ 9.03 $ 10.09Discontinued operations (0.01) (3.44) (0.18) (3.65)
Total $ 3.01 $ 0.02 $ 8.85 $ 6.44Basic:
Continuing operations $ 3.04 $ 3.48 $ 9.07 $ 10.15Discontinued operations (0.01) (3.46) (0.18) (3.67)
Total $ 3.03 $ 0.02 $ 8.89 $ 6.48Weighted-average number of common
shares outstanding: (millions)Assuming dilution 979.0 997.7 986.0 1,014.9Basic 975.1 991.8 981.8 1,008.9
Cash dividend per common share $ 1.30 $ 1.10 $ 3.70 $ 3.15
(Amounts may not add due to rounding.)(The accompanying notes are an integral part of the financial statements.)
INTERNATIONAL BUSINESS MACHINES CORPORATION AND SUBSIDIARY COMPANIES
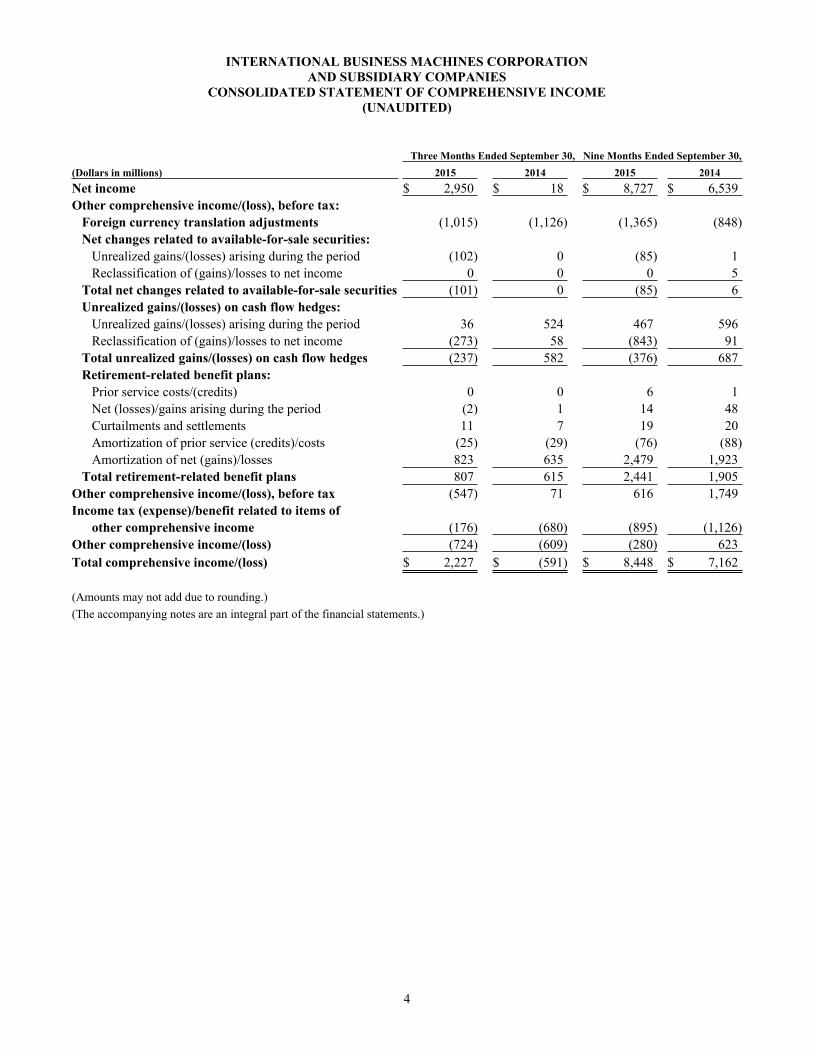
CONSOLIDATED STATEMENT OF COMPREHENSIVE INCOME (UNAUDITED)
4
Three Months Ended September 30, Nine Months Ended September 30,(Dollars in millions) 2015 2014 2015 2014Net income $ 2,950 $ 18 $ 8,727 $ 6,539Other comprehensive income/(loss), before tax:
Foreign currency translation adjustments (1,015) (1,126) (1,365) (848)Net changes related to available-for-sale securities:
Unrealized gains/(losses) arising during the period (102) 0 (85) 1Reclassification of (gains)/losses to net income 0 0 0 5
Total net changes related to available-for-sale securities (101) 0 (85) 6Unrealized gains/(losses) on cash flow hedges:
Unrealized gains/(losses) arising during the period 36 524 467 596Reclassification of (gains)/losses to net income (273) 58 (843) 91
Total unrealized gains/(losses) on cash flow hedges (237) 582 (376) 687Retirement-related benefit plans:
Prior service costs/(credits) 0 0 6 1Net (losses)/gains arising during the period (2) 1 14 48Curtailments and settlements 11 7 19 20Amortization of prior service (credits)/costs (25) (29) (76) (88)Amortization of net (gains)/losses 823 635 2,479 1,923
Total retirement-related benefit plans 807 615 2,441 1,905Other comprehensive income/(loss), before tax (547) 71 616 1,749Income tax (expense)/benefit related to items of
other comprehensive income (176) (680) (895) (1,126)Other comprehensive income/(loss) (724) (609) (280) 623Total comprehensive income/(loss) $ 2,227 $ (591) $ 8,448 $ 7,162
(Amounts may not add due to rounding.)(The accompanying notes are an integral part of the financial statements.)
INTERNATIONAL BUSINESS MACHINES CORPORATION AND SUBSIDIARY COMPANIES
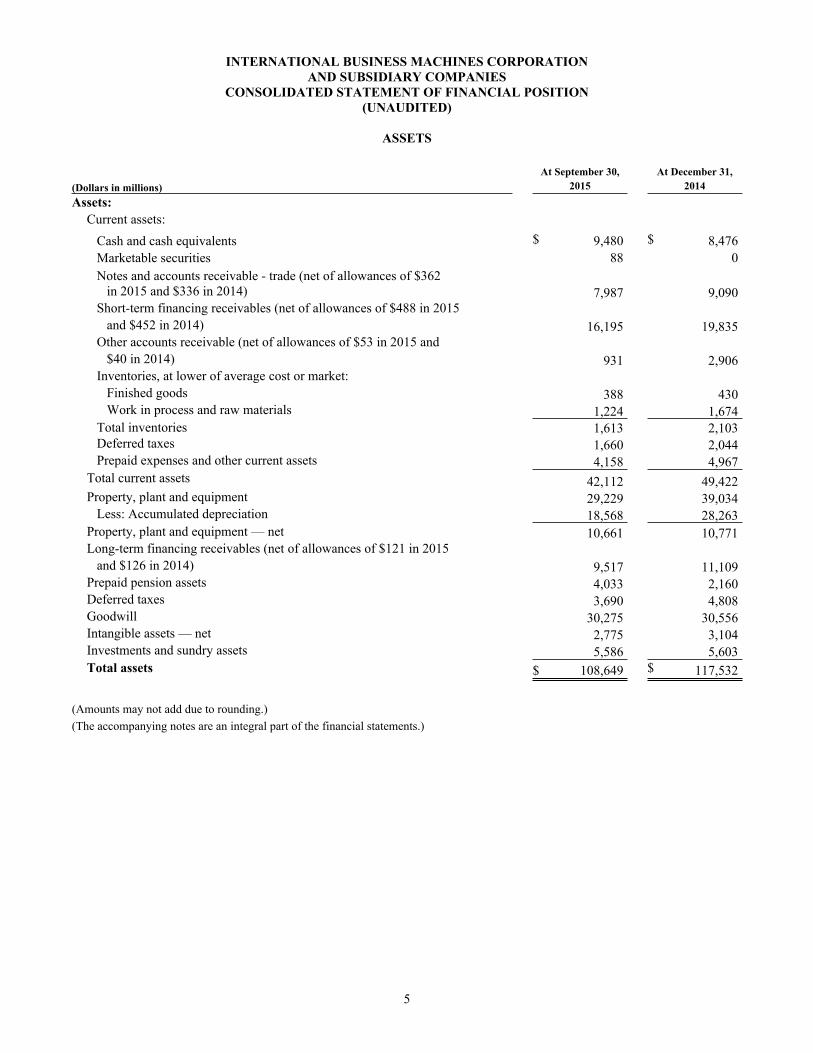
CONSOLIDATED STATEMENT OF FINANCIAL POSITION (UNAUDITED)
ASSETS
5
At September 30, At December 31,(Dollars in millions) 2015 2014Assets:
Current assets:Cash and cash equivalents $ 9,480 $ 8,476Marketable securities 88 0Notes and accounts receivable - trade (net of allowances of $362
in 2015 and $336 in 2014) 7,987 9,090Short-term financing receivables (net of allowances of $488 in 2015
and $452 in 2014) 16,195 19,835Other accounts receivable (net of allowances of $53 in 2015 and
$40 in 2014) 931 2,906Inventories, at lower of average cost or market:
Finished goods 388 430Work in process and raw materials 1,224 1,674
Total inventories 1,613 2,103Deferred taxes 1,660 2,044Prepaid expenses and other current assets 4,158 4,967
Total current assets 42,112 49,422Property, plant and equipment 29,229 39,034
Less: Accumulated depreciation 18,568 28,263Property, plant and equipment — net 10,661 10,771Long-term financing receivables (net of allowances of $121 in 2015
and $126 in 2014) 9,517 11,109Prepaid pension assets 4,033 2,160Deferred taxes 3,690 4,808Goodwill 30,275 30,556Intangible assets — net 2,775 3,104Investments and sundry assets 5,586 5,603Total assets $ 108,649 $ 117,532
(Amounts may not add due to rounding.)(The accompanying notes are an integral part of the financial statements.)
INTERNATIONAL BUSINESS MACHINES CORPORATION AND SUBSIDIARY COMPANIES
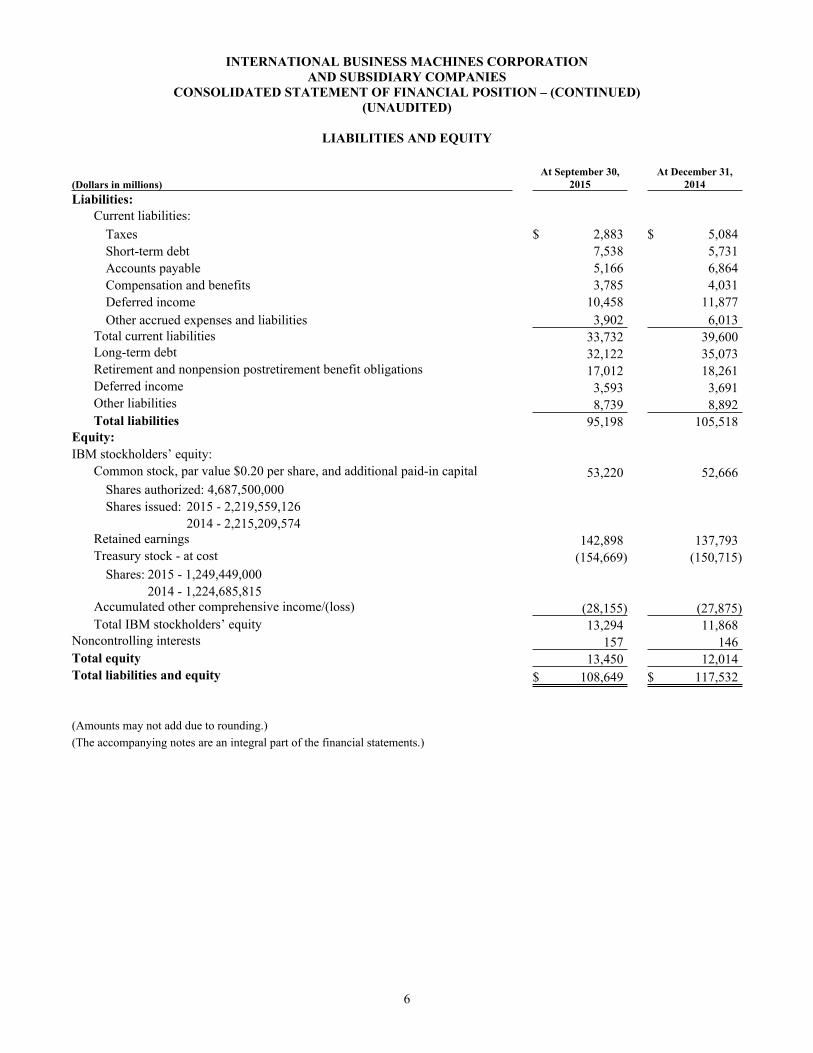
CONSOLIDATED STATEMENT OF FINANCIAL POSITION – (CONTINUED) (UNAUDITED)
LIABILITIES AND EQUITY
6
At September 30, At December 31,(Dollars in millions) 2015 2014Liabilities:
Current liabilities: Taxes $ 2,883 $ 5,084 Short-term debt 7,538 5,731 Accounts payable 5,166 6,864 Compensation and benefits 3,785 4,031 Deferred income 10,458 11,877 Other accrued expenses and liabilities 3,902 6,013
Total current liabilities 33,732 39,600Long-term debt 32,122 35,073Retirement and nonpension postretirement benefit obligations 17,012 18,261Deferred income 3,593 3,691Other liabilities 8,739 8,892Total liabilities 95,198 105,518
Equity:IBM stockholders’ equity:
Common stock, par value $0.20 per share, and additional paid-in capital 53,220 52,666Shares authorized: 4,687,500,000Shares issued: 2015 - 2,219,559,126
2014 - 2,215,209,574Retained earnings 142,898 137,793Treasury stock - at cost (154,669) (150,715)
Shares: 2015 - 1,249,449,0002014 - 1,224,685,815
Accumulated other comprehensive income/(loss) (28,155) (27,875)Total IBM stockholders’ equity 13,294 11,868
Noncontrolling interests 157 146Total equity 13,450 12,014Total liabilities and equity $ 108,649 $ 117,532
(Amounts may not add due to rounding.)(The accompanying notes are an integral part of the financial statements.)
INTERNATIONAL BUSINESS MACHINES CORPORATION AND SUBSIDIARY COMPANIES
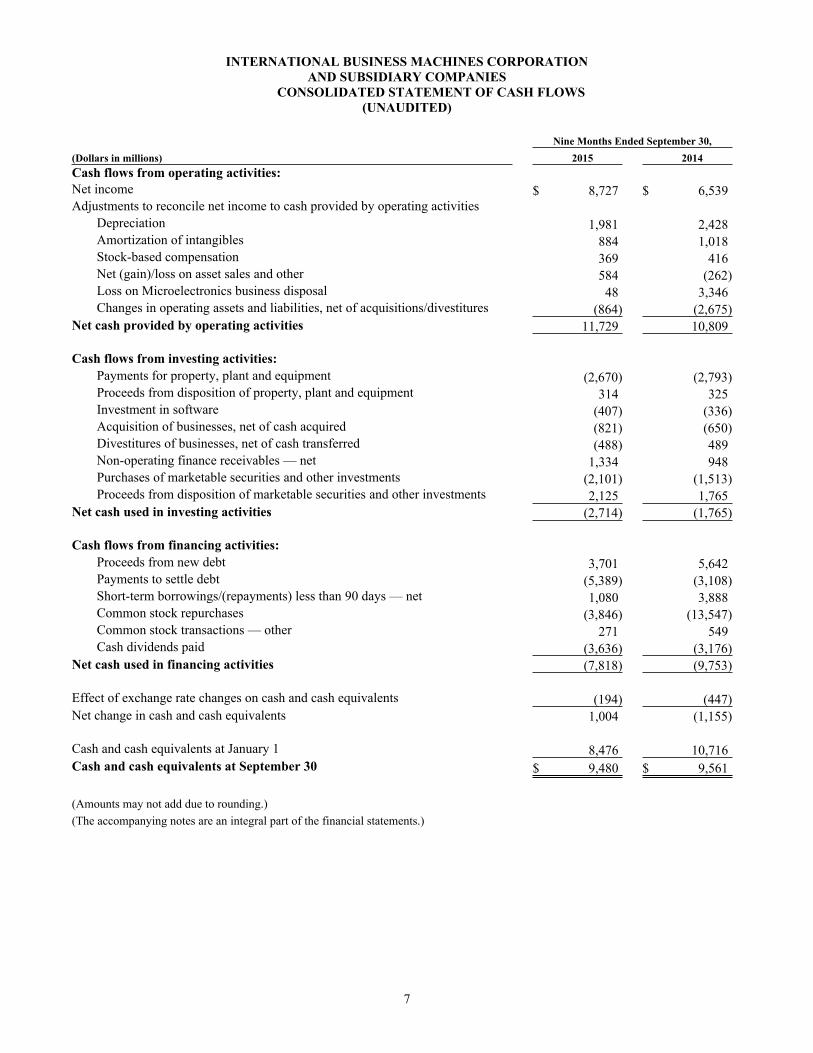
CONSOLIDATED STATEMENT OF CASH FLOWS(UNAUDITED)
7
Nine Months Ended September 30,(Dollars in millions) 2015 2014Cash flows from operating activities:Net income $ 8,727 $ 6,539Adjustments to reconcile net income to cash provided by operating activities
Depreciation 1,981 2,428Amortization of intangibles 884 1,018Stock-based compensation 369 416Net (gain)/loss on asset sales and other 584 (262)Loss on Microelectronics business disposal 48 3,346Changes in operating assets and liabilities, net of acquisitions/divestitures (864) (2,675)
Net cash provided by operating activities 11,729 10,809
Cash flows from investing activities:Payments for property, plant and equipment (2,670) (2,793)Proceeds from disposition of property, plant and equipment 314 325Investment in software (407) (336)Acquisition of businesses, net of cash acquired (821) (650)Divestitures of businesses, net of cash transferred (488) 489Non-operating finance receivables — net 1,334 948Purchases of marketable securities and other investments (2,101) (1,513)Proceeds from disposition of marketable securities and other investments 2,125 1,765
Net cash used in investing activities (2,714) (1,765)
Cash flows from financing activities:Proceeds from new debt 3,701 5,642Payments to settle debt (5,389) (3,108)Short-term borrowings/(repayments) less than 90 days — net 1,080 3,888Common stock repurchases (3,846) (13,547)Common stock transactions — other 271 549Cash dividends paid (3,636) (3,176)
Net cash used in financing activities (7,818) (9,753)
Effect of exchange rate changes on cash and cash equivalents (194) (447)Net change in cash and cash equivalents 1,004 (1,155)
Cash and cash equivalents at January 1 8,476 10,716Cash and cash equivalents at September 30 $ 9,480 $ 9,561
(Amounts may not add due to rounding.)(The accompanying notes are an integral part of the financial statements.)
INTERNATIONAL BUSINESS MACHINES CORPORATION AND SUBSIDIARY COMPANIES
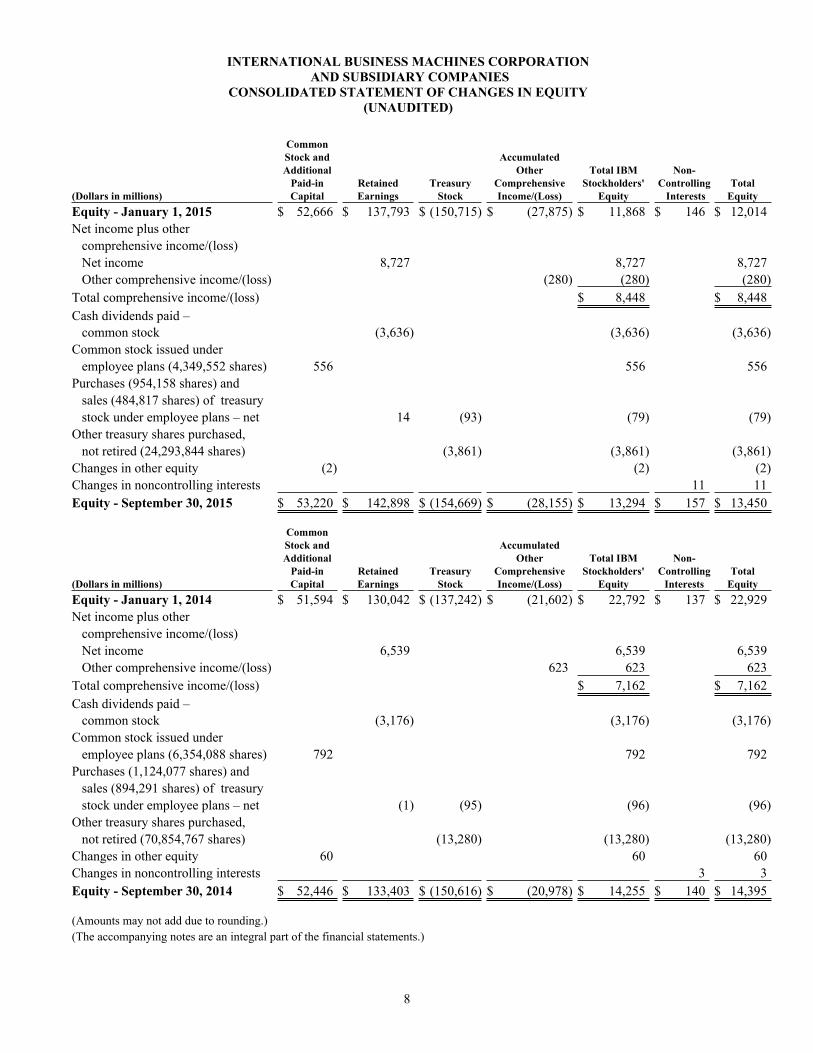
CONSOLIDATED STATEMENT OF CHANGES IN EQUITY (UNAUDITED)
8
CommonStock and AccumulatedAdditional Other Total IBM Non-
Paid-in Retained Treasury Comprehensive Stockholders' Controlling Total(Dollars in millions) Capital Earnings Stock Income/(Loss) Equity Interests EquityEquity - January 1, 2015 $ 52,666 $ 137,793 $ (150,715) $ (27,875) $ 11,868 $ 146 $ 12,014Net income plus other comprehensive income/(loss) Net income 8,727 8,727 8,727 Other comprehensive income/(loss) (280) (280) (280)Total comprehensive income/(loss) $ 8,448 $ 8,448Cash dividends paid – common stock (3,636) (3,636) (3,636)Common stock issued under employee plans (4,349,552 shares) 556 556 556Purchases (954,158 shares) and sales (484,817 shares) of treasury stock under employee plans – net 14 (93) (79) (79)Other treasury shares purchased, not retired (24,293,844 shares) (3,861) (3,861) (3,861)Changes in other equity (2) (2) (2)Changes in noncontrolling interests 11 11Equity - September 30, 2015 $ 53,220 $ 142,898 $ (154,669) $ (28,155) $ 13,294 $ 157 $ 13,450
CommonStock and AccumulatedAdditional Other Total IBM Non-
Paid-in Retained Treasury Comprehensive Stockholders' Controlling Total(Dollars in millions) Capital Earnings Stock Income/(Loss) Equity Interests EquityEquity - January 1, 2014 $ 51,594 $ 130,042 $ (137,242) $ (21,602) $ 22,792 $ 137 $ 22,929Net income plus other comprehensive income/(loss) Net income 6,539 6,539 6,539 Other comprehensive income/(loss) 623 623 623Total comprehensive income/(loss) $ 7,162 $ 7,162Cash dividends paid – common stock (3,176) (3,176) (3,176)Common stock issued under employee plans (6,354,088 shares) 792 792 792Purchases (1,124,077 shares) and sales (894,291 shares) of treasury stock under employee plans – net (1) (95) (96) (96)Other treasury shares purchased, not retired (70,854,767 shares) (13,280) (13,280) (13,280)Changes in other equity 60 60 60Changes in noncontrolling interests 3 3Equity - September 30, 2014 $ 52,446 $ 133,403 $ (150,616) $ (20,978) $ 14,255 $ 140 $ 14,395
(Amounts may not add due to rounding.)(The accompanying notes are an integral part of the financial statements.)
Notes to Consolidated Financial Statements:
9
1. Basis of Presentation: The accompanying Consolidated Financial Statements and footnotes of the International Business Machines Corporation (IBM or the company) have been prepared in accordance with accounting principles generally accepted in the United States of America (GAAP). The financial statements and footnotes are unaudited. In the opinion of the company's management, these statements include all adjustments, which are only of a normal recurring nature, necessary to present a fair statement of the company's results of operations, financial position and cash flows.
The preparation of financial statements in conformity with GAAP requires management to make estimates and assumptions that affect the amount of assets, liabilities, revenue, costs, expenses and other comprehensive income/(loss) that are reported in the Consolidated Financial Statements and accompanying disclosures. These estimates are based on management’s best knowledge of current events, historical experience, actions that the company may undertake in the future and on various other assumptions that are believed to be reasonable under the circumstances. As a result, actual results may be different from these estimates. Refer to the company's 2014 Annual Report on pages 68 to 71 for a discussion of the company's critical accounting estimates.
On October 20, 2014, the company announced a definitive agreement to divest its Microelectronics business and manufacturing operations to GLOBALFOUNDRIES. The assets and liabilities of the Microelectronics business were reported as held for sale at December 31, 2014, and the operating results of the Microelectronics business have been reported as discontinued operations. The transaction closed on July 1, 2015. Refer to Note 9, Acquisitions/Divestitures,” for additional information on the transaction. In addition, in the first quarter of 2015, the company renamed its Systems & Technology segment to Systems Hardware and its System z brand to z Systems.
Interim results are not necessarily indicative of financial results for a full year. The information included in this Form 10-Q should be read in conjunction with the company's 2014 Annual Report.
Noncontrolling interest amounts of $2.4 million and $2.4 million, net of tax, for the three months ended September 30, 2015 and 2014, respectively, and $5.9 million and $4.2 million, net of tax, for the nine months ended September 30, 2015 and 2014, respectively, are included in the Consolidated Statement of Earnings within the other (income) and expense line item.
Within the financial statements and tables presented, certain columns and rows may not add due to the use of rounded numbers for disclosure purposes. Percentages presented are calculated from the underlying whole-dollar amounts. Certain prior year amounts have been reclassified to conform to the current year presentation. This is annotated where applicable. 2. Accounting Changes: In September 2015, the Financial Accounting Standards Board (FASB) issued guidance eliminating the requirement that an acquirer in a business combination account for a measurement-period adjustment retrospectively. Instead, an acquirer will recognize a measurement-period adjustment during the period in which the amount of the adjustment is determined. In addition, the portion of the amount recorded in current-period earnings by line item that would have been recorded in previous reporting periods if the adjustment to the provisional amounts had been recognized as of the acquisition date should be presented separately on the face of the income statement or disclosed in the notes. The guidance is effective January 1, 2016 with early adoption permitted. The guidance is not expected to have a material impact in the consolidated financial results.
In July 2015, the FASB issued guidance which requires all inventories, except those using the last-in, first-out or retail methods, to be measured at the lower of cost and net realizable value. Net realizable value is the estimated selling price in the ordinary course of business, less reasonable predictable cost of completion, disposal and transportation. The guidance is effective January 1, 2017 with early adoption permitted. The guidance is not expected to have a material impact in the consolidated financial results.
In May 2015, the FASB issued guidance which removed the requirement to categorize within the fair value hierarchy all investments for which fair value is measured using the net asset value per share practical expedient. The amendments also removed the requirement to make certain disclosures for all investments that are eligible to be measured at fair value using the net asset value per share practical expedient. Rather, those disclosures are limited to investments for which the entity has elected to measure the fair value using that practical expedient. The guidance is effective January 1, 2016 with early adoption permitted. The guidance is a change in disclosure only and will not have a material impact in the consolidated financial results.
In April 2015, the FASB issued guidance which requires debt issuance costs related to a recognized debt liability to be presented in the balance sheet as a direct deduction from the carrying amount of that debt liability, consistent with debt discounts. The guidance is effective January 1, 2016 with early adoption permitted. The guidance is a change in financial
Notes to Consolidated Financial Statements – (continued)
10
statement presentation only and will not have a material impact in the consolidated financial results. At September 30, 2015, the company had approximately $74 million in debt issuance costs included in investments and sundry assets in the Consolidated Statement of Financial Position.
In April 2015, the FASB issued guidance about whether a cloud computing arrangement includes a software license. If a cloud computing arrangement includes a software license, then the customer should account for the software license element of the arrangement consistent with the acquisition of other software licenses. If a cloud computing arrangement does not include a software license, the customer should account for the arrangement as a services contract. All software licenses recognized under this guidance will be accounted for consistent with other licenses of intangible assets. The guidance is effective January 1, 2016 with early adoption permitted. The guidance is not expected to have a material impact in the consolidated financial results.
In May 2014, the FASB issued guidance on the recognition of revenue from contracts with customers. Revenue recognition will depict the transfer of promised goods or services to customers in an amount that reflects the consideration to which the entity expects to be entitled in exchange for those goods or services. The guidance also requires disclosures regarding the nature, amount, timing and uncertainty of revenue and cash flows arising from contracts with customers. The guidance permits two methods of adoption: retrospectively to each prior reporting period presented, or retrospectively with the cumulative effect of initially applying the guidance recognized at the date of initial application. The guidance was initially effective January 1, 2017 and early adoption was not permitted. In August 2015, the FASB issued guidance which provides for a one-year deferral of the effective date to January 1, 2018, with an option of applying the standard on the original effective date. The company is currently evaluating the impact of the new guidance, the effective date and the method of adoption.
In April 2014, the FASB issued guidance that changed the criteria for reporting a discontinued operation. Only disposals of a component that represents a strategic shift that has (or will have) a major effect on an entity's operations and financial results is a discontinued operation. The guidance also requires expanded disclosures about discontinued operations and disposals of a significant part of an entity that does not qualify for discontinued operations reporting. The guidance was effective January 1, 2015. The impact to the company will be dependent on any transaction that is within the scope of the new guidance.
In July 2013, the FASB issued guidance regarding the presentation of an unrecognized tax benefit when a net operating loss carryforward, a similar tax loss, or a tax credit carryforward exists. Under certain circumstances, unrecognized tax benefits should be presented in the financial statements as a reduction to a deferred tax asset for a net operating loss carryforward, a similar tax loss, or a tax credit carryforward. The guidance was effective January 1, 2014. The guidance was a change in financial statement presentation only and did not have a material impact in the consolidated financial results.
In March 2013, the FASB issued guidance on when foreign currency translation adjustments should be released to net income. When a parent entity ceases to have a controlling financial interest in a subsidiary or group of assets that is a business within a foreign entity, the parent is required to release any related cumulative translation adjustment into net income. Accordingly, the cumulative translation adjustment should be released into net income only if the sale or transfer results in the complete or substantially complete liquidation of the foreign entity in which the subsidiary or group of assets had resided. The guidance was effective January 1, 2014 and did not have a material impact in the consolidated financial results.
In February 2013, the FASB issued guidance for the recognition, measurement and disclosure of obligations resulting from joint and several liability arrangements for which the total amount of the obligation within the scope of the guidance is fixed at the reporting date. Examples include debt arrangements, other contractual obligations and settled litigation matters. The guidance requires an entity to measure such obligations as the sum of the amount that the reporting entity agreed to pay on the basis of its arrangement among its co-obligors plus additional amounts the reporting entity expects to pay on behalf of its co-obligors. The guidance was effective January 1, 2014 and did not have a material impact in the consolidated financial results.
Notes to Consolidated Financial Statements – (continued)
11
3. Financial Instruments:
Fair Value Measurements
Accounting guidance defines fair value as the price that would be received to sell an asset or paid to transfer a liability in an orderly transaction between market participants at the measurement date. Under this guidance, the company is required to classify certain assets and liabilities based on the following fair value hierarchy:
Level 1—Quoted prices (unadjusted) in active markets for identical assets or liabilities that can be accessed at the measurement date;
Level 2—Inputs other than quoted prices included within Level 1 that are observable for the asset or liability, either directly or indirectly; and
Level 3—Unobservable inputs for the asset or liability.
The guidance requires the use of observable market data if such data is available without undue cost and effort.
When available, the company uses unadjusted quoted market prices in active markets to measure the fair value and classifies such items as Level 1. If quoted market prices are not available, fair value is based upon internally developed models that use current market-based or independently sourced market parameters such as interest rates and currency rates. Items valued using internally generated models are classified according to the lowest level input or value driver that is significant to the valuation. The determination of fair value considers various factors including interest rate yield curves and time value underlying the financial instruments. For derivatives and debt securities, the company uses a discounted cash flow analysis using discount rates commensurate with the duration of the instrument.
In determining the fair value of financial instruments, the company considers certain market valuation adjustments to the “base valuations” calculated using the methodologies described below for several parameters that market participants would consider in determining fair value:
Counterparty credit risk adjustments are applied to financial instruments, taking into account the actual credit risk of a counterparty as observed in the credit default swap market to determine the true fair value of such an instrument.
Credit risk adjustments are applied to reflect the company’s own credit risk when valuing all liabilities measured at fair value. The methodology is consistent with that applied in developing counterparty credit risk adjustments, but incorporates the company’s own credit risk as observed in the credit default swap market.
As an example, the fair value of derivatives is derived utilizing a discounted cash flow model that uses observable market inputs such as known notional value amounts, yield curves, spot and forward exchange rates as well as discount rates. These inputs relate to liquid, heavily traded currencies with active markets which are available for the full term of the derivative.
Certain financial assets are measured at fair value on a nonrecurring basis. These assets include equity method investments that are recognized at fair value at the measurement date to the extent that they are deemed to be other-than-temporarily impaired. Certain assets that are measured at fair value on a recurring basis can be subject to nonrecurring fair value measurements. These assets include available-for-sale equity investments that are deemed to be other-than-temporarily impaired. In the event of an other-than-temporary impairment of a financial investment, fair value is measured using a model described above.
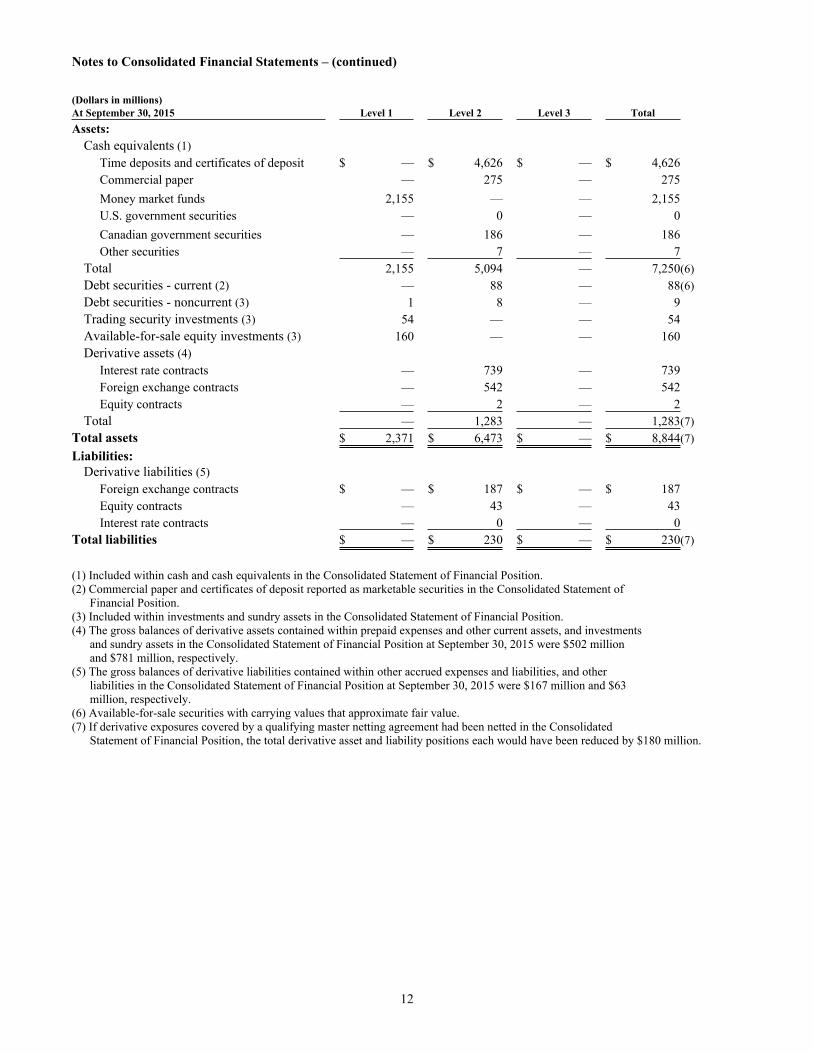
Non-financial assets such as property, plant and equipment, land, goodwill and intangible assets are also subject to nonrecurring fair value measurements if they are deemed to be impaired. The impairment models used for nonfinancial assets depend on the type of asset. In the third quarter of 2014, the company recorded an impairment on certain assets that were initially reported as held for sale at September 30, 2014. See note 9, “Acquisitions/Divestitures,” for additional information. There were no material impairments of non-financial assets for the nine months ended September 30, 2015. Accounting guidance permits the measurement of eligible financial assets, financial liabilities and firm commitments at fair value, on an instrument-by-instrument basis, that are otherwise not permitted to be accounted for at fair value under other accounting standards. This election is irrevocable. The company has not applied the fair value option to any eligible assets or liabilities. The following tables present the company’s financial assets and financial liabilities that are measured at fair value on a recurring basis at September 30, 2015 and December 31, 2014.
Notes to Consolidated Financial Statements – (continued)
12
(Dollars in millions)At September 30, 2015 Level 1 Level 2 Level 3 TotalAssets:
Cash equivalents (1)Time deposits and certificates of deposit $ — $ 4,626 $ — $ 4,626Commercial paper — 275 — 275Money market funds 2,155 — — 2,155U.S. government securities — 0 — 0Canadian government securities — 186 — 186Other securities — 7 — 7
Total 2,155 5,094 — 7,250(6)Debt securities - current (2) — 88 — 88(6)Debt securities - noncurrent (3) 1 8 — 9Trading security investments (3) 54 — — 54Available-for-sale equity investments (3) 160 — — 160Derivative assets (4)
Interest rate contracts — 739 — 739Foreign exchange contracts — 542 — 542Equity contracts — 2 — 2
Total — 1,283 — 1,283(7)Total assets $ 2,371 $ 6,473 $ — $ 8,844(7)Liabilities:
Derivative liabilities (5)Foreign exchange contracts $ — $ 187 $ — $ 187Equity contracts — 43 — 43Interest rate contracts — 0 — 0
Total liabilities $ — $ 230 $ — $ 230(7)
(1) Included within cash and cash equivalents in the Consolidated Statement of Financial Position.(2) Commercial paper and certificates of deposit reported as marketable securities in the Consolidated Statement of Financial Position. (3) Included within investments and sundry assets in the Consolidated Statement of Financial Position.(4) The gross balances of derivative assets contained within prepaid expenses and other current assets, and investments and sundry assets in the Consolidated Statement of Financial Position at September 30, 2015 were $502 million and $781 million, respectively. (5) The gross balances of derivative liabilities contained within other accrued expenses and liabilities, and other liabilities in the Consolidated Statement of Financial Position at September 30, 2015 were $167 million and $63 million, respectively.(6) Available-for-sale securities with carrying values that approximate fair value.(7) If derivative exposures covered by a qualifying master netting agreement had been netted in the Consolidated
Statement of Financial Position, the total derivative asset and liability positions each would have been reduced by $180 million.
Notes to Consolidated Financial Statements – (continued)
13
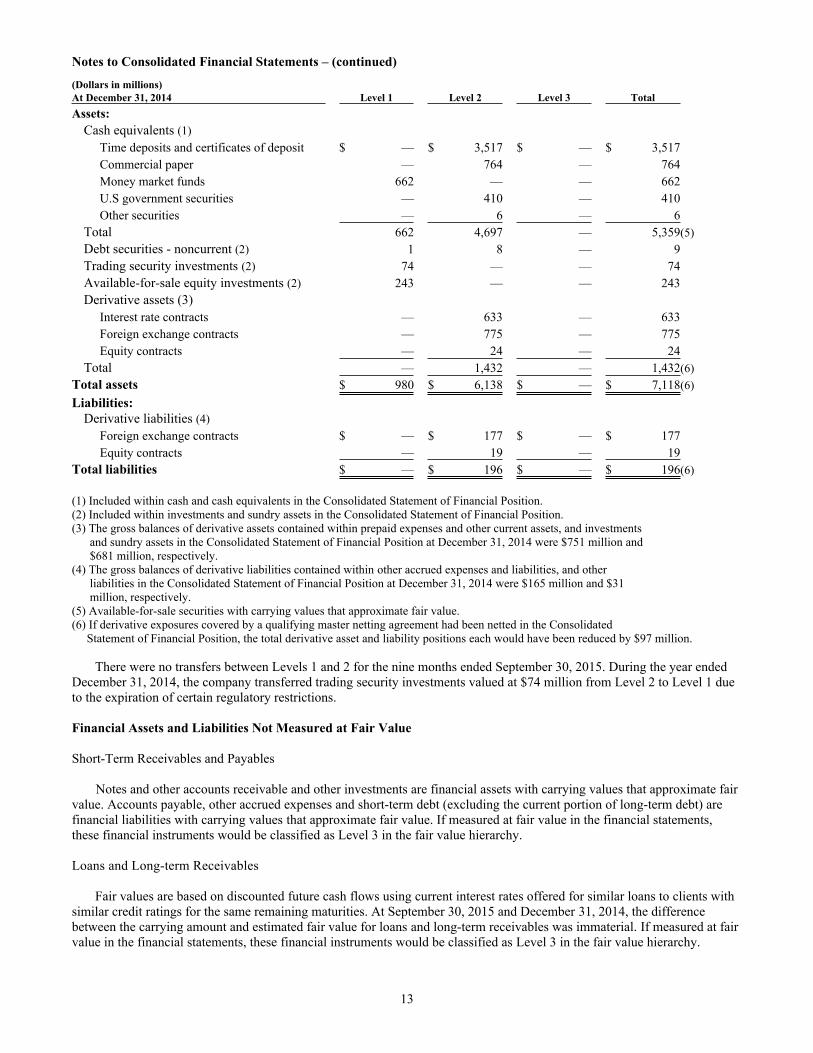
(Dollars in millions)At December 31, 2014 Level 1 Level 2 Level 3 TotalAssets:
Cash equivalents (1)Time deposits and certificates of deposit $ — $ 3,517 $ — $ 3,517Commercial paper — 764 — 764Money market funds 662 — — 662U.S government securities — 410 — 410Other securities — 6 — 6
Total 662 4,697 — 5,359(5)Debt securities - noncurrent (2) 1 8 — 9Trading security investments (2) 74 — — 74Available-for-sale equity investments (2) 243 — — 243Derivative assets (3)
Interest rate contracts — 633 — 633Foreign exchange contracts — 775 — 775Equity contracts — 24 — 24
Total — 1,432 — 1,432(6)Total assets $ 980 $ 6,138 $ — $ 7,118(6)Liabilities:
Derivative liabilities (4)Foreign exchange contracts $ — $ 177 $ — $ 177Equity contracts — 19 — 19
Total liabilities $ — $ 196 $ — $ 196(6)
(1) Included within cash and cash equivalents in the Consolidated Statement of Financial Position.(2) Included within investments and sundry assets in the Consolidated Statement of Financial Position.(3) The gross balances of derivative assets contained within prepaid expenses and other current assets, and investments and sundry assets in the Consolidated Statement of Financial Position at December 31, 2014 were $751 million and $681 million, respectively. (4) The gross balances of derivative liabilities contained within other accrued expenses and liabilities, and other liabilities in the Consolidated Statement of Financial Position at December 31, 2014 were $165 million and $31 million, respectively.(5) Available-for-sale securities with carrying values that approximate fair value.(6) If derivative exposures covered by a qualifying master netting agreement had been netted in the Consolidated
Statement of Financial Position, the total derivative asset and liability positions each would have been reduced by $97 million.
There were no transfers between Levels 1 and 2 for the nine months ended September 30, 2015. During the year ended December 31, 2014, the company transferred trading security investments valued at $74 million from Level 2 to Level 1 due to the expiration of certain regulatory restrictions.
Financial Assets and Liabilities Not Measured at Fair Value
Short-Term Receivables and Payables
Notes and other accounts receivable and other investments are financial assets with carrying values that approximate fair value. Accounts payable, other accrued expenses and short-term debt (excluding the current portion of long-term debt) are financial liabilities with carrying values that approximate fair value. If measured at fair value in the financial statements, these financial instruments would be classified as Level 3 in the fair value hierarchy.
Loans and Long-term Receivables
Fair values are based on discounted future cash flows using current interest rates offered for similar loans to clients with similar credit ratings for the same remaining maturities. At September 30, 2015 and December 31, 2014, the difference between the carrying amount and estimated fair value for loans and long-term receivables was immaterial. If measured at fair value in the financial statements, these financial instruments would be classified as Level 3 in the fair value hierarchy.
Notes to Consolidated Financial Statements – (continued)
14
Long-Term Debt
Fair value of publicly-traded long-term debt is based on quoted market prices for the identical liability when traded as an asset in an active market. For other long-term debt for which a quoted market price is not available, an expected present value technique that uses rates currently available to the company for debt with similar terms and remaining maturities is used to estimate fair value. The carrying amount of long-term debt was $32,122 million and $35,073 million, and the estimated fair value was $33,889 million and $37,524 million at September 30, 2015 and December 31, 2014, respectively. If measured at fair value in the financial statements, long-term debt (including the current portion) would be classified as Level 2 in the fair value hierarchy.
Debt and Marketable Equity Securities
The company’s cash equivalents and current debt securities are considered available-for-sale and recorded at fair value, which is not materially different from carrying value, in the Consolidated Statement of Financial Position.
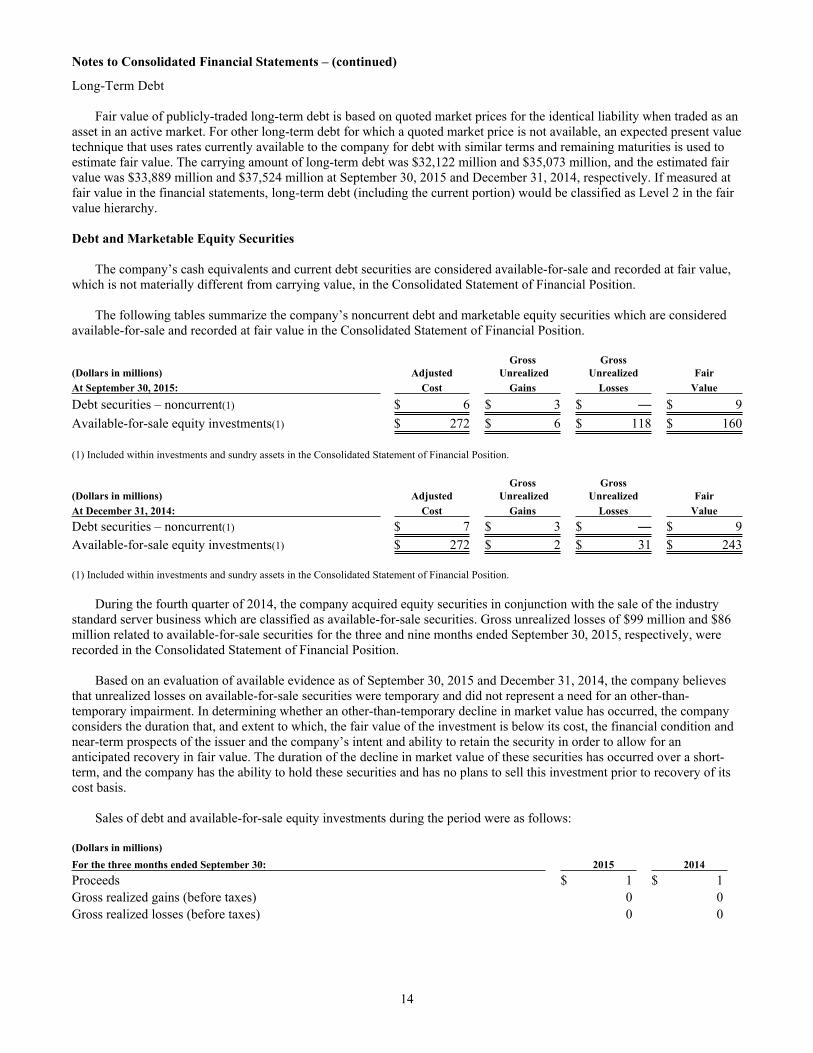
The following tables summarize the company’s noncurrent debt and marketable equity securities which are considered available-for-sale and recorded at fair value in the Consolidated Statement of Financial Position.
Gross Gross(Dollars in millions) Adjusted Unrealized Unrealized FairAt September 30, 2015: Cost Gains Losses ValueDebt securities – noncurrent(1) $ 6 $ 3 $ — $ 9Available-for-sale equity investments(1) $ 272 $ 6 $ 118 $ 160
(1) Included within investments and sundry assets in the Consolidated Statement of Financial Position.
Gross Gross(Dollars in millions) Adjusted Unrealized Unrealized FairAt December 31, 2014: Cost Gains Losses ValueDebt securities – noncurrent(1) $ 7 $ 3 $ — $ 9Available-for-sale equity investments(1) $ 272 $ 2 $ 31 $ 243
(1) Included within investments and sundry assets in the Consolidated Statement of Financial Position.
During the fourth quarter of 2014, the company acquired equity securities in conjunction with the sale of the industry standard server business which are classified as available-for-sale securities. Gross unrealized losses of $99 million and $86 million related to available-for-sale securities for the three and nine months ended September 30, 2015, respectively, were recorded in the Consolidated Statement of Financial Position.
Based on an evaluation of available evidence as of September 30, 2015 and December 31, 2014, the company believes that unrealized losses on available-for-sale securities were temporary and did not represent a need for an other-than-temporary impairment. In determining whether an other-than-temporary decline in market value has occurred, the company considers the duration that, and extent to which, the fair value of the investment is below its cost, the financial condition and near-term prospects of the issuer and the company’s intent and ability to retain the security in order to allow for an anticipated recovery in fair value. The duration of the decline in market value of these securities has occurred over a short-term, and the company has the ability to hold these securities and has no plans to sell this investment prior to recovery of its cost basis.
Sales of debt and available-for-sale equity investments during the period were as follows:
(Dollars in millions)For the three months ended September 30: 2015 2014Proceeds $ 1 $ 1Gross realized gains (before taxes) 0 0Gross realized losses (before taxes) 0 0
Notes to Consolidated Financial Statements – (continued)
15
(Dollars in millions)For the nine months ended September 30: 2015 2014Proceeds $ 7 $ 16Gross realized gains (before taxes) 1 0Gross realized losses (before taxes) 1 5
The after-tax net unrealized holding gains/(losses) on available-for-sale debt and equity securities that have been included in other comprehensive income/(loss) for the period and after-tax net (gains)/losses reclassified from accumulated other comprehensive income/(loss) to net income were as follows:
(Dollars in millions)For the three months ended September 30: 2015 2014Net unrealized gains/(losses) arising during the period $ (63) $ 0Net unrealized (gains)/losses reclassified to net income* 0 0
*There were no writedowns for the three months ended September 30, 2015 and 2014, respectively.
(Dollars in millions)For the nine months ended September 30: 2015 2014Net unrealized gains/(losses) arising during the period $ (52) $ 1Net unrealized (gains)/losses reclassified to net income* 0 3
* There were no writedowns for the nine months ended September 30, 2015 and 2014, respectively.
The contractual maturities of substantially all available-for-sale debt securities are less than one year at September 30, 2015.
Derivative Financial Instruments
The company operates in multiple functional currencies and is a significant lender and borrower in the global markets. In the normal course of business, the company is exposed to the impact of interest rate changes and foreign currency fluctuations, and to a lesser extent equity and commodity price changes and client credit risk. The company limits these risks by following established risk management policies and procedures, including the use of derivatives, and, where cost effective, financing with debt in the currencies in which assets are denominated. For interest rate exposures, derivatives are used to better align rate movements between the interest rates associated with the company’s lease and other financial assets and the interest rates associated with its financing debt. Derivatives are also used to manage the related cost of debt. For foreign currency exposures, derivatives are used to better manage the cash flow volatility arising from foreign exchange rate fluctuations. As a result of the use of derivative instruments, the company is exposed to the risk that counterparties to derivative contracts will fail to meet their contractual obligations. To mitigate the counterparty credit risk, the company has a policy of only entering into contracts with carefully selected major financial institutions based upon their overall credit profile. The company’s established policies and procedures for mitigating credit risk on principal transactions include reviewing and establishing limits for credit exposure and continually assessing the creditworthiness of counterparties. The right of set-off that exists under certain of these arrangements enables the legal entities of the company subject to the arrangement to net amounts due to and from the counterparty reducing the maximum loss from credit risk in the event of counterparty default.
The company is also a party to collateral security arrangements with most of its major derivative counterparties. These arrangements require the company to hold or post collateral (cash or U.S. Treasury securities) when the derivative fair values exceed contractually established thresholds. Posting thresholds can be fixed or can vary based on credit default swap pricing or credit ratings received from the major credit agencies. The aggregate fair value of all derivative instruments under these collateralized arrangements that were in a liability position at September 30, 2015 and December 31, 2014 was $12 million and $21 million, respectively, for which no collateral was posted at September 30, 2015 and December 31, 2014. Full collateralization of these agreements would be required in the event that the company’s credit rating falls below investment grade or if its credit default swap spread exceeds 250 basis points, as applicable, pursuant to the terms of the collateral security arrangements. The aggregate fair value of derivative instruments in asset positions as of September 30, 2015 and December 31, 2014 was $1,283 million and $1,432 million, respectively. This amount represents the maximum exposure to loss at the reporting date if the counterparties failed to perform as contracted. This exposure was reduced by $180 million and $97 million at September 30, 2015 and December 31, 2014, respectively, of liabilities included in master netting
Notes to Consolidated Financial Statements – (continued)
16
arrangements with those counterparties. Additionally, at September 30, 2015 and December 31, 2014, this exposure was reduced by $193 million and $487 million of cash collateral, and $48 million and $31 million of non-cash collateral in U.S. Treasury securities, respectively, received by the company. At September 30, 2015 and December 31, 2014, the net exposure related to derivative assets recorded in the Consolidated Statement of Financial Position was $862 million and $817 million, respectively. At September 30, 2015 and December 31, 2014, the net exposure related to derivative liabilities recorded in the Consolidated Statement of Financial Position was $50 million and $99 million, respectively.
In the Consolidated Statement of Financial Position, the company does not offset derivative assets against liabilities in master netting arrangements nor does it offset receivables or payables recognized upon payment or receipt of cash collateral against the fair values of the related derivative instruments. No amount was recognized in other receivables at September 30, 2015 or December 31, 2014 for the right to reclaim cash collateral. The amount recognized in accounts payable for the obligation to return cash collateral was $193 million and $487 million at September 30, 2015 and December 31, 2014, respectively. The company restricts the use of cash collateral received to rehypothecation, and therefore reports it in prepaid expenses and other current assets in the Consolidated Statement of Financial Position. No amount was rehypothecated at September 30, 2015 and December 31, 2014.
The company may employ derivative instruments to hedge the volatility in stockholders’ equity resulting from changes in currency exchange rates of significant foreign subsidiaries of the company with respect to the U.S. dollar. These instruments, designated as net investment hedges, expose the company to liquidity risk as the derivatives have an immediate cash flow impact upon maturity which is not offset by a cash flow from the translation of the underlying hedged equity. The company monitors this cash loss potential on an ongoing basis and may discontinue some of these hedging relationships by de-designating or terminating the derivative instrument in order to manage the liquidity risk. Although not designated as accounting hedges, the company may utilize derivatives to offset the changes in the fair value of the de-designated instruments from the date of de-designation until maturity. In its hedging programs, the company uses forward contracts, futures contracts, interest-rate swaps, cross-currency swaps, and options depending upon the underlying exposure. The company is not a party to leveraged derivative instruments. A brief description of the major hedging programs, categorized by underlying risk, follows.
Interest Rate Risk Fixed and Variable Rate Borrowings The company issues debt in the global capital markets, principally to fund its financing lease and loan portfolios. Access to cost-effective financing can result in interest rate mismatches with the underlying assets. To manage these mismatches and to reduce overall interest cost, the company uses interest-rate swaps to convert specific fixed-rate debt issuances into variable-rate debt (i.e., fair value hedges) and to convert specific variable-rate debt issuances into fixed-rate debt (i.e., cash flow hedges). At September 30, 2015 and December 31, 2014, the total notional amount of the company’s interest rate swaps was $6.4 billion and $5.8 billion, respectively. The weighted-average remaining maturity of these instruments at September 30, 2015 and December 31, 2014 was approximately 7.5 years and 8.7 years, respectively. Forecasted Debt Issuance The company is exposed to interest rate volatility on future debt issuances. To manage this risk, the company may use forward starting interest-rate swaps to lock in the rate on the interest payments related to the forecasted debt issuance. These swaps are accounted for as cash flow hedges. The company did not have any derivative instruments relating to this program outstanding at September 30, 2015 and December 31, 2014.
At September 30, 2015 and December 31, 2014, net gains of approximately $1 million (before taxes) were recorded in accumulated other comprehensive income/(loss) in connection with cash flow hedges of the company’s borrowings. Within these amounts, gains of less than $1 million are expected to be reclassified to net income within the next 12 months, providing an offsetting economic impact against the underlying transactions.
Notes to Consolidated Financial Statements – (continued)
17
Foreign Exchange Risk
Long-Term Investments in Foreign Subsidiaries (Net Investment)
A large portion of the company’s foreign currency denominated debt portfolio is designated as a hedge of net investment in foreign subsidiaries to reduce the volatility in stockholders’ equity caused by changes in foreign currency exchange rates in the functional currency of major foreign subsidiaries with respect to the U.S. dollar. The company also uses cross-currency swaps and foreign exchange forward contracts for this risk management purpose. At September 30, 2015 and December 31, 2014, the total notional amount of derivative instruments designated as net investment hedges was $5.3 billion and $2.2 billion, respectively. The weighted-average remaining maturity of these instruments at September 30, 2015 and December 31, 2014 was approximately 0.2 years for both periods.
Anticipated Royalties and Cost Transactions
The company’s operations generate significant nonfunctional currency, third-party vendor payments and intercompany payments for royalties and goods and services among the company’s non-U.S. subsidiaries and with the parent company. In anticipation of these foreign currency cash flows and in view of the volatility of the currency markets, the company selectively employs foreign exchange forward contracts to manage its currency risk. These forward contracts are accounted for as cash flow hedges. The maximum length of time over which the company has hedged its exposure to the variability in future cash flows is four years. At September 30, 2015 and December 31, 2014, the total notional amount of forward contracts designated as cash flow hedges of forecasted royalty and cost transactions was $8.7 billion and $9.3 billion, respectively. The weighted-average remaining maturity of these instruments at September 30, 2015 and December 31, 2014 was 0.6 years and 0.7 years, respectively. At September 30, 2015 and December 31, 2014, in connection with cash flow hedges of anticipated royalties and cost transactions, the company recorded net gains of $226 million and $602 million (before taxes), respectively, in accumulated other comprehensive income/(loss). Within these amounts, $207 million and $572 million of gains, respectively, are expected to be reclassified to net income within the next 12 months, providing an offsetting economic impact against the underlying anticipated transactions.
Foreign Currency Denominated Borrowings The company is exposed to exchange rate volatility on foreign currency denominated debt. To manage this risk, the company employs cross-currency swaps to convert fixed-rate foreign currency denominated debt to fixed-rate debt denominated in the functional currency of the borrowing entity. These swaps are accounted for as cash flow hedges. The maximum length of time over which the company has hedged its exposure to the variability in future cash flows is approximately seven years. At September 30, 2015 and December 31, 2014, no amounts were outstanding under this program.
At September 30, 2015 and December 31, 2014, in connection with cash flow hedges of foreign currency denominated borrowings, the company recorded net losses of $2 million (before taxes) in accumulated other comprehensive income/(loss). Within these amounts, less than $1 million of losses are expected to be reclassified to net income within the next 12 months, providing an offsetting economic impact against the underlying exposure.
Subsidiary Cash and Foreign Currency Asset/Liability Management The company uses its Global Treasury Centers to manage the cash of its subsidiaries. These centers principally use currency swaps to convert cash flows in a cost-effective manner. In addition, the company uses foreign exchange forward contracts to economically hedge, on a net basis, the foreign currency exposure of a portion of the company’s nonfunctional currency assets and liabilities. The terms of these forward and swap contracts are generally less than one year. The changes in the fair values of these contracts and of the underlying hedged exposures are generally offsetting and are recorded in other (income) and expense in the Consolidated Statement of Earnings. At September 30, 2015 and December 31, 2014, the total notional amount of derivative instruments in economic hedges of foreign currency exposure was $10.8 billion and $13.1 billion, respectively. Equity Risk Management The company is exposed to market price changes in certain broad market indices and in the company’s own stock primarily related to certain obligations to employees. Changes in the overall value of these employee compensation
Notes to Consolidated Financial Statements – (continued)
18
obligations are recorded in selling, general and administrative (SG&A) expense in the Consolidated Statement of Earnings. Although not designated as accounting hedges, the company utilizes derivatives, including equity swaps and futures, to economically hedge the exposures related to its employee compensation obligations. The derivatives are linked to the total return on certain broad market indices or the total return on the company’s common stock, and are recorded at fair value with gains or losses also reported in SG&A expense in the Consolidated Statement of Earnings. At September 30, 2015 and December 31, 2014, the total notional amount of derivative instruments in economic hedges of these compensation obligations was $1.2 billion and $1.3 billion, respectively.
Other Risks
The company may hold warrants to purchase shares of common stock in connection with various investments that are deemed derivatives because they contain net share or net cash settlement provisions. The company records the changes in the fair value of these warrants in other (income) and expense in the Consolidated Statement of Earnings. The company did not have any warrants qualifying as derivatives outstanding at September 30, 2015 and December 31, 2014. The company is exposed to a potential loss if a client fails to pay amounts due under contractual terms. The company may utilize credit default swaps to economically hedge its credit exposures. The swaps are recorded at fair value with gains and losses reported in other (income) and expense in the Consolidated Statement of Earnings. The company did not have any derivative instruments relating to this program outstanding at September 30, 2015 and December 31, 2014.
The company is exposed to market volatility on certain investment securities. The company may utilize options or forwards to economically hedge its market exposure. The derivatives are recorded at fair value with gains and losses reported in other (income) and expense in the Consolidated Statement of Earnings. At September 30, 2015 and December 31, 2014, the total notional amount of derivative instruments in economic hedges of investment securities was less than $0.1 billion for both periods.
The following tables provide a quantitative summary of the derivative and non-derivative instrument-related risk management activity as of September 30, 2015 and December 31, 2014, as well as for the three and nine months ended September 30, 2015 and 2014, respectively.
Notes to Consolidated Financial Statements – (continued)
19
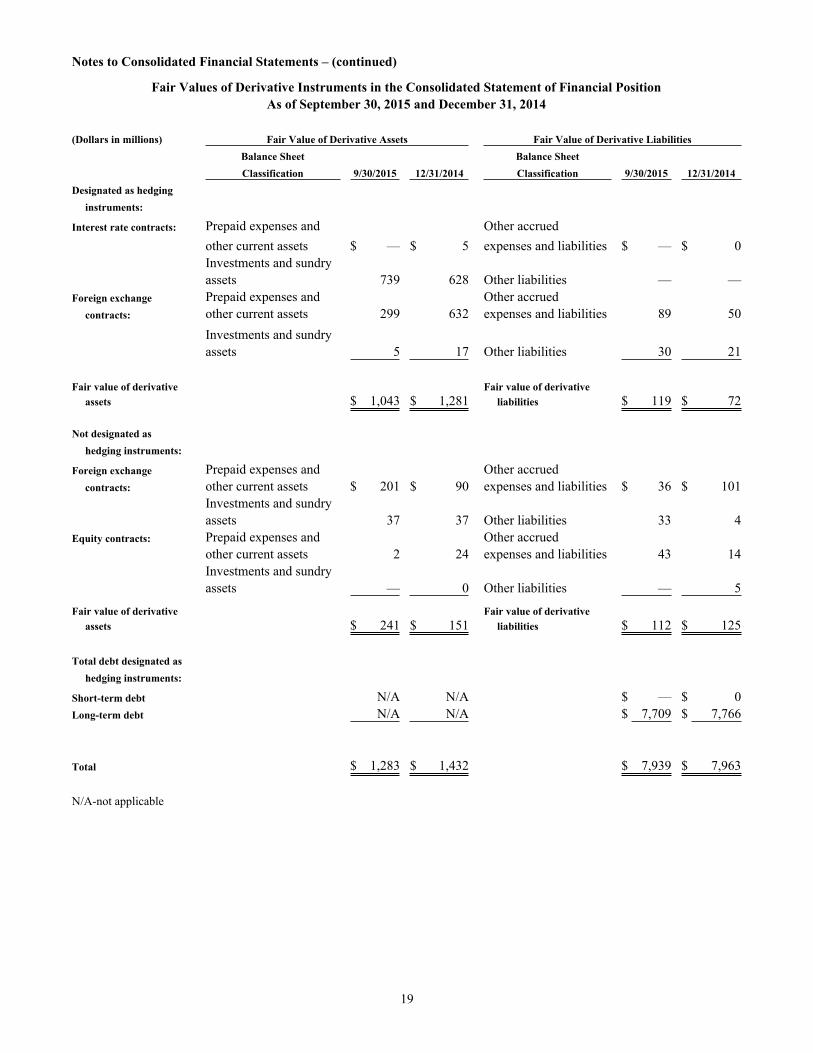
Fair Values of Derivative Instruments in the Consolidated Statement of Financial PositionAs of September 30, 2015 and December 31, 2014
(Dollars in millions) Fair Value of Derivative Assets Fair Value of Derivative LiabilitiesBalance Sheet Balance SheetClassification 9/30/2015 12/31/2014 Classification 9/30/2015 12/31/2014
Designated as hedging instruments:
Interest rate contracts: Prepaid expenses and Other accrued other current assets $ — $ 5 expenses and liabilities $ — $ 0Investments and sundry assets 739 628 Other liabilities — —
Foreign exchange Prepaid expenses and Other accrued contracts: other current assets 299 632 expenses and liabilities 89 50
Investments and sundry assets 5 17 Other liabilities 30 21
Fair value of derivative Fair value of derivative assets $ 1,043 $ 1,281 liabilities $ 119 $ 72
Not designated as hedging instruments:
Foreign exchange Prepaid expenses and Other accrued contracts: other current assets $ 201 $ 90 expenses and liabilities $ 36 $ 101
Investments and sundry assets 37 37 Other liabilities 33 4
Equity contracts: Prepaid expenses and Other accruedother current assets 2 24 expenses and liabilities 43 14Investments and sundry assets — 0 Other liabilities — 5
Fair value of derivative Fair value of derivative assets $ 241 $ 151 liabilities $ 112 $ 125
Total debt designated as hedging instruments:
Short-term debt N/A N/A $ — $ 0Long-term debt N/A N/A $ 7,709 $ 7,766
Total $ 1,283 $ 1,432 $ 7,939 $ 7,963
N/A-not applicable
Notes to Consolidated Financial Statements – (continued)
20
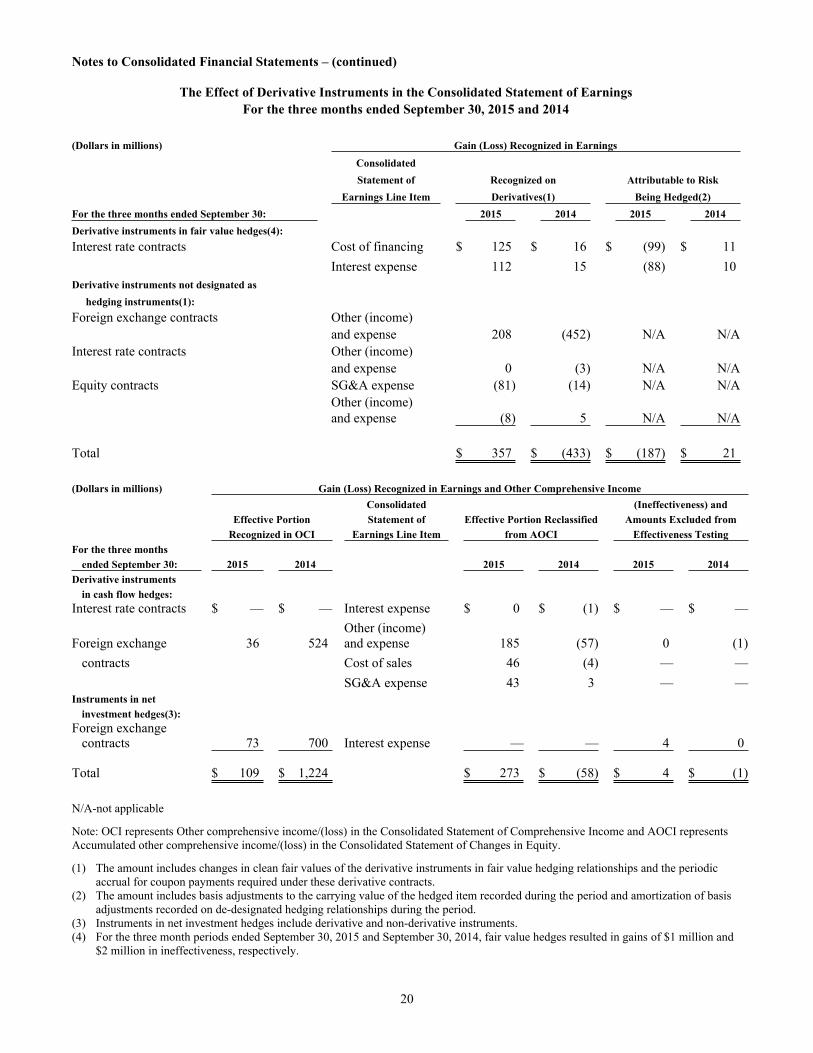
The Effect of Derivative Instruments in the Consolidated Statement of EarningsFor the three months ended September 30, 2015 and 2014
(Dollars in millions) Gain (Loss) Recognized in Earnings
ConsolidatedStatement of Recognized on Attributable to Risk
Earnings Line Item Derivatives(1) Being Hedged(2)For the three months ended September 30: 2015 2014 2015 2014Derivative instruments in fair value hedges(4):Interest rate contracts Cost of financing $ 125 $ 16 $ (99) $ 11
Interest expense 112 15 (88) 10Derivative instruments not designated as
hedging instruments(1):Foreign exchange contracts Other (income)
and expense 208 (452) N/A N/AInterest rate contracts Other (income)
and expense 0 (3) N/A N/AEquity contracts SG&A expense (81) (14) N/A N/A
Other (income)and expense (8) 5 N/A N/A
Total $ 357 $ (433) $ (187) $ 21
(Dollars in millions) Gain (Loss) Recognized in Earnings and Other Comprehensive IncomeConsolidated (Ineffectiveness) and
Effective Portion Statement of Effective Portion Reclassified Amounts Excluded fromRecognized in OCI Earnings Line Item from AOCI Effectiveness Testing
For the three months ended September 30: 2015 2014 2015 2014 2015 2014
Derivative instrumentsin cash flow hedges:
Interest rate contracts $ — $ — Interest expense $ 0 $ (1) $ — $ —Other (income)
Foreign exchange 36 524 and expense 185 (57) 0 (1)contracts Cost of sales 46 (4) — —
SG&A expense 43 3 — —Instruments in net
investment hedges(3):Foreign exchange
contracts 73 700 Interest expense — — 4 0
Total $ 109 $ 1,224 $ 273 $ (58) $ 4 $ (1)
N/A-not applicable
Note: OCI represents Other comprehensive income/(loss) in the Consolidated Statement of Comprehensive Income and AOCI represents Accumulated other comprehensive income/(loss) in the Consolidated Statement of Changes in Equity.
(1) The amount includes changes in clean fair values of the derivative instruments in fair value hedging relationships and the periodic accrual for coupon payments required under these derivative contracts.
(2) The amount includes basis adjustments to the carrying value of the hedged item recorded during the period and amortization of basis adjustments recorded on de-designated hedging relationships during the period.
(3) Instruments in net investment hedges include derivative and non-derivative instruments.(4) For the three month periods ended September 30, 2015 and September 30, 2014, fair value hedges resulted in gains of $1 million and
$2 million in ineffectiveness, respectively.
Notes to Consolidated Financial Statements – (continued)
21
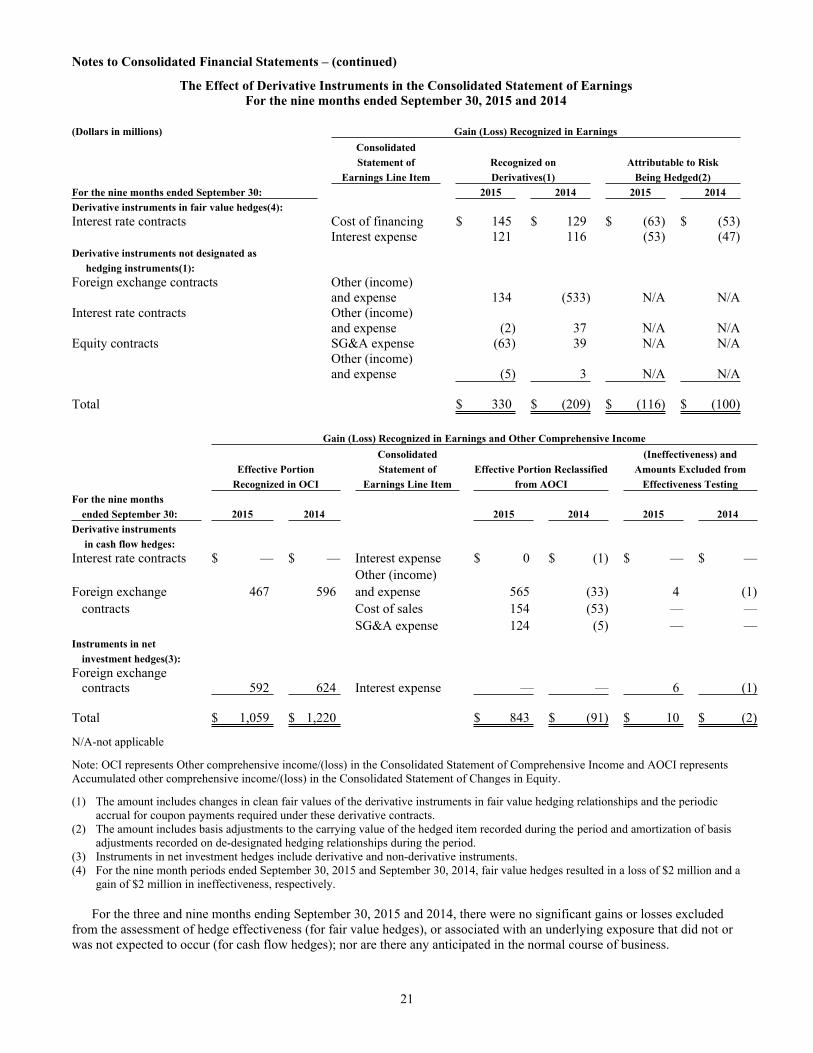
The Effect of Derivative Instruments in the Consolidated Statement of EarningsFor the nine months ended September 30, 2015 and 2014
(Dollars in millions) Gain (Loss) Recognized in EarningsConsolidatedStatement of Recognized on Attributable to Risk
Earnings Line Item Derivatives(1) Being Hedged(2)For the nine months ended September 30: 2015 2014 2015 2014Derivative instruments in fair value hedges(4):Interest rate contracts Cost of financing $ 145 $ 129 $ (63) $ (53)
Interest expense 121 116 (53) (47)Derivative instruments not designated as
hedging instruments(1):Foreign exchange contracts Other (income)
and expense 134 (533) N/A N/AInterest rate contracts Other (income)
and expense (2) 37 N/A N/AEquity contracts SG&A expense (63) 39 N/A N/A
Other (income)and expense (5) 3 N/A N/A
Total $ 330 $ (209) $ (116) $ (100)
Gain (Loss) Recognized in Earnings and Other Comprehensive IncomeConsolidated (Ineffectiveness) and
Effective Portion Statement of Effective Portion Reclassified Amounts Excluded fromRecognized in OCI Earnings Line Item from AOCI Effectiveness Testing
For the nine monthsended September 30: 2015 2014 2015 2014 2015 2014
Derivative instruments in cash flow hedges:
Interest rate contracts $ — $ — Interest expense $ 0 $ (1) $ — $ —Other (income)
Foreign exchange 467 596 and expense 565 (33) 4 (1)contracts Cost of sales 154 (53) — —
SG&A expense 124 (5) — —Instruments in net
investment hedges(3):Foreign exchange
contracts 592 624 Interest expense — — 6 (1)
Total $ 1,059 $ 1,220 $ 843 $ (91) $ 10 $ (2)
N/A-not applicable
Note: OCI represents Other comprehensive income/(loss) in the Consolidated Statement of Comprehensive Income and AOCI represents Accumulated other comprehensive income/(loss) in the Consolidated Statement of Changes in Equity.
(1) The amount includes changes in clean fair values of the derivative instruments in fair value hedging relationships and the periodic accrual for coupon payments required under these derivative contracts.
(2) The amount includes basis adjustments to the carrying value of the hedged item recorded during the period and amortization of basis adjustments recorded on de-designated hedging relationships during the period.
(3) Instruments in net investment hedges include derivative and non-derivative instruments.(4) For the nine month periods ended September 30, 2015 and September 30, 2014, fair value hedges resulted in a loss of $2 million and a
gain of $2 million in ineffectiveness, respectively.
For the three and nine months ending September 30, 2015 and 2014, there were no significant gains or losses excluded from the assessment of hedge effectiveness (for fair value hedges), or associated with an underlying exposure that did not or was not expected to occur (for cash flow hedges); nor are there any anticipated in the normal course of business.
Notes to Consolidated Financial Statements – (continued)
22
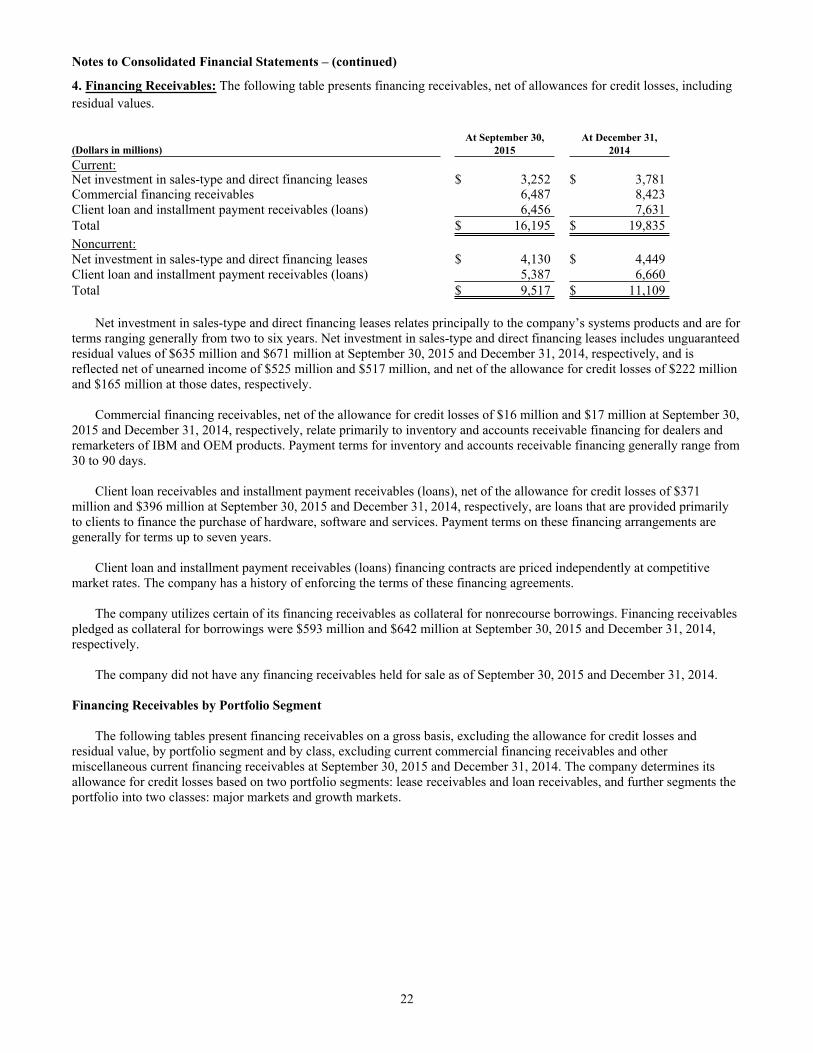
4. Financing Receivables: The following table presents financing receivables, net of allowances for credit losses, including residual values.
At September 30, At December 31,(Dollars in millions) 2015 2014Current:Net investment in sales-type and direct financing leases $ 3,252 $ 3,781Commercial financing receivables 6,487 8,423Client loan and installment payment receivables (loans) 6,456 7,631Total $ 16,195 $ 19,835Noncurrent:Net investment in sales-type and direct financing leases $ 4,130 $ 4,449Client loan and installment payment receivables (loans) 5,387 6,660Total $ 9,517 $ 11,109
Net investment in sales-type and direct financing leases relates principally to the company’s systems products and are for terms ranging generally from two to six years. Net investment in sales-type and direct financing leases includes unguaranteed residual values of $635 million and $671 million at September 30, 2015 and December 31, 2014, respectively, and is reflected net of unearned income of $525 million and $517 million, and net of the allowance for credit losses of $222 million and $165 million at those dates, respectively.
Commercial financing receivables, net of the allowance for credit losses of $16 million and $17 million at September 30, 2015 and December 31, 2014, respectively, relate primarily to inventory and accounts receivable financing for dealers and remarketers of IBM and OEM products. Payment terms for inventory and accounts receivable financing generally range from 30 to 90 days.
Client loan receivables and installment payment receivables (loans), net of the allowance for credit losses of $371 million and $396 million at September 30, 2015 and December 31, 2014, respectively, are loans that are provided primarily to clients to finance the purchase of hardware, software and services. Payment terms on these financing arrangements are generally for terms up to seven years.
Client loan and installment payment receivables (loans) financing contracts are priced independently at competitive market rates. The company has a history of enforcing the terms of these financing agreements.
The company utilizes certain of its financing receivables as collateral for nonrecourse borrowings. Financing receivables pledged as collateral for borrowings were $593 million and $642 million at September 30, 2015 and December 31, 2014, respectively.
The company did not have any financing receivables held for sale as of September 30, 2015 and December 31, 2014.
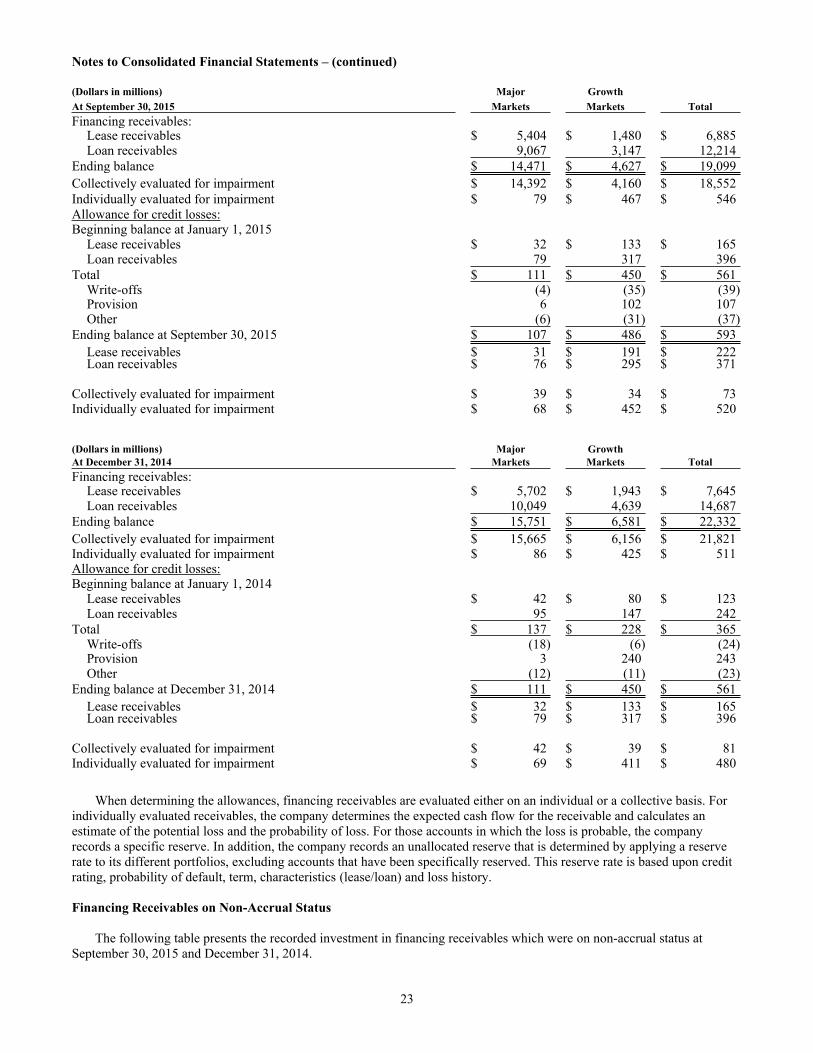
Financing Receivables by Portfolio Segment The following tables present financing receivables on a gross basis, excluding the allowance for credit losses and residual value, by portfolio segment and by class, excluding current commercial financing receivables and other miscellaneous current financing receivables at September 30, 2015 and December 31, 2014. The company determines its allowance for credit losses based on two portfolio segments: lease receivables and loan receivables, and further segments the portfolio into two classes: major markets and growth markets.
Notes to Consolidated Financial Statements – (continued)
23
(Dollars in millions) Major GrowthAt September 30, 2015 Markets Markets TotalFinancing receivables:
Lease receivables $ 5,404 $ 1,480 $ 6,885Loan receivables 9,067 3,147 12,214
Ending balance $ 14,471 $ 4,627 $ 19,099Collectively evaluated for impairment $ 14,392 $ 4,160 $ 18,552Individually evaluated for impairment $ 79 $ 467 $ 546Allowance for credit losses:Beginning balance at January 1, 2015
Lease receivables $ 32 $ 133 $ 165Loan receivables 79 317 396
Total $ 111 $ 450 $ 561Write-offs (4) (35) (39)Provision 6 102 107Other (6) (31) (37)
Ending balance at September 30, 2015 $ 107 $ 486 $ 593Lease receivables $ 31 $ 191 $ 222Loan receivables $ 76 $ 295 $ 371
Collectively evaluated for impairment $ 39 $ 34 $ 73Individually evaluated for impairment $ 68 $ 452 $ 520
(Dollars in millions) Major GrowthAt December 31, 2014 Markets Markets TotalFinancing receivables:
Lease receivables $ 5,702 $ 1,943 $ 7,645Loan receivables 10,049 4,639 14,687
Ending balance $ 15,751 $ 6,581 $ 22,332Collectively evaluated for impairment $ 15,665 $ 6,156 $ 21,821Individually evaluated for impairment $ 86 $ 425 $ 511Allowance for credit losses:Beginning balance at January 1, 2014
Lease receivables $ 42 $ 80 $ 123Loan receivables 95 147 242
Total $ 137 $ 228 $ 365Write-offs (18) (6) (24)Provision 3 240 243Other (12) (11) (23)
Ending balance at December 31, 2014 $ 111 $ 450 $ 561Lease receivables $ 32 $ 133 $ 165Loan receivables $ 79 $ 317 $ 396
Collectively evaluated for impairment $ 42 $ 39 $ 81Individually evaluated for impairment $ 69 $ 411 $ 480
When determining the allowances, financing receivables are evaluated either on an individual or a collective basis. For individually evaluated receivables, the company determines the expected cash flow for the receivable and calculates an estimate of the potential loss and the probability of loss. For those accounts in which the loss is probable, the company records a specific reserve. In addition, the company records an unallocated reserve that is determined by applying a reserve rate to its different portfolios, excluding accounts that have been specifically reserved. This reserve rate is based upon credit rating, probability of default, term, characteristics (lease/loan) and loss history.
Financing Receivables on Non-Accrual Status
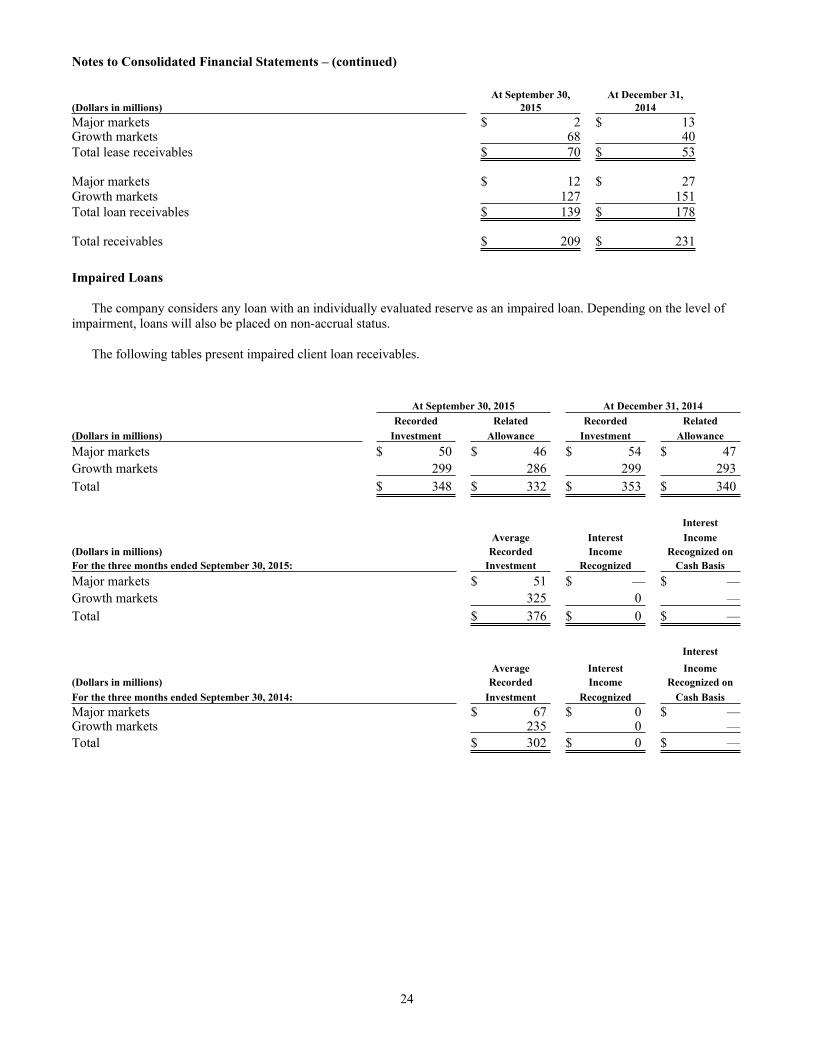
The following table presents the recorded investment in financing receivables which were on non-accrual status at September 30, 2015 and December 31, 2014.
Notes to Consolidated Financial Statements – (continued)
24
At September 30, At December 31,(Dollars in millions) 2015 2014Major markets $ 2 $ 13Growth markets 68 40Total lease receivables $ 70 $ 53
Major markets $ 12 $ 27Growth markets 127 151Total loan receivables $ 139 $ 178
Total receivables $ 209 $ 231
Impaired Loans
The company considers any loan with an individually evaluated reserve as an impaired loan. Depending on the level of impairment, loans will also be placed on non-accrual status.
The following tables present impaired client loan receivables.
At September 30, 2015 At December 31, 2014Recorded Related Recorded Related
(Dollars in millions) Investment Allowance Investment AllowanceMajor markets $ 50 $ 46 $ 54 $ 47Growth markets 299 286 299 293Total $ 348 $ 332 $ 353 $ 340
InterestAverage Interest Income
(Dollars in millions) Recorded Income Recognized onFor the three months ended September 30, 2015: Investment Recognized Cash BasisMajor markets $ 51 $ — $ —Growth markets 325 0 —Total $ 376 $ 0 $ —
InterestAverage Interest Income
(Dollars in millions) Recorded Income Recognized onFor the three months ended September 30, 2014: Investment Recognized Cash BasisMajor markets $ 67 $ 0 $ —Growth markets 235 0 —Total $ 302 $ 0 $ —
Notes to Consolidated Financial Statements – (continued)
25
InterestAverage Interest Income
(Dollars in millions) Recorded Income Recognized onFor the nine months ended September 30, 2015: Investment Recognized Cash BasisMajor markets $ 52 $ — $ —Growth markets 320 0 —Total $ 371 $ 0 $ —
InterestAverage Interest Income
(Dollars in millions) Recorded Income Recognized onFor the nine months ended September 30, 2014: Investment Recognized Cash BasisMajor markets $ 72 $ 0 $ —Growth markets 185 0 —Total $ 256 $ 0 $ —
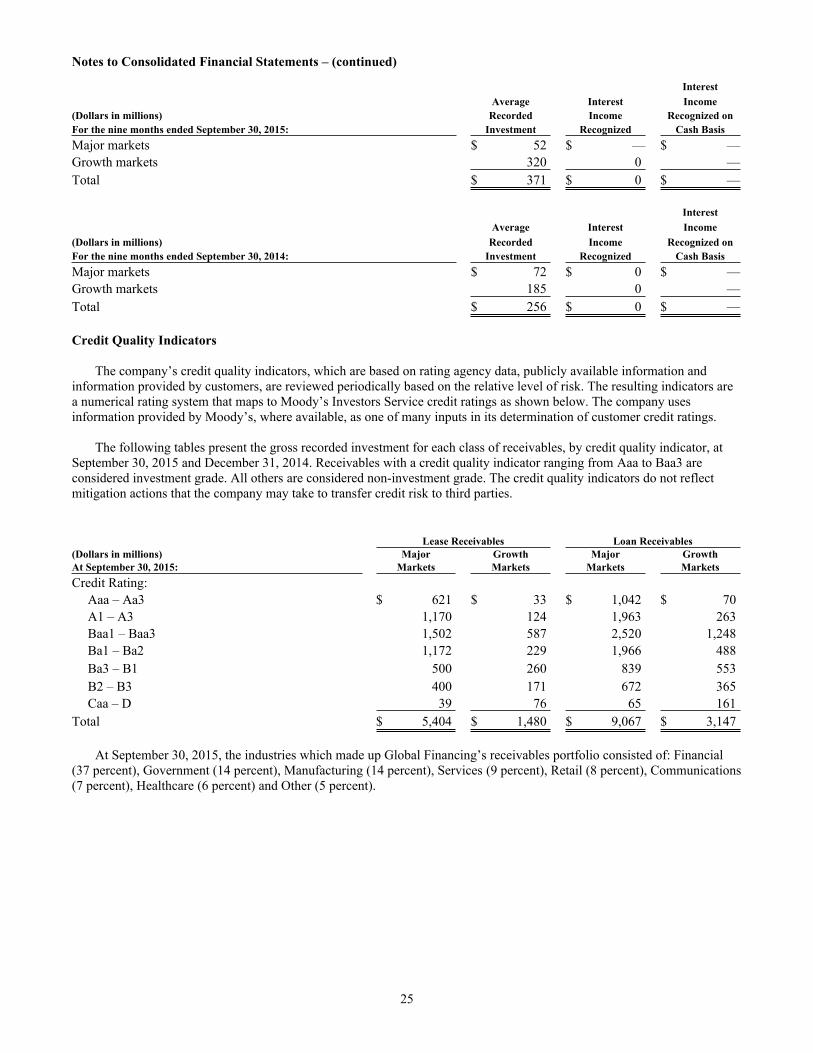
Credit Quality Indicators The company’s credit quality indicators, which are based on rating agency data, publicly available information and information provided by customers, are reviewed periodically based on the relative level of risk. The resulting indicators are a numerical rating system that maps to Moody’s Investors Service credit ratings as shown below. The company uses information provided by Moody’s, where available, as one of many inputs in its determination of customer credit ratings.
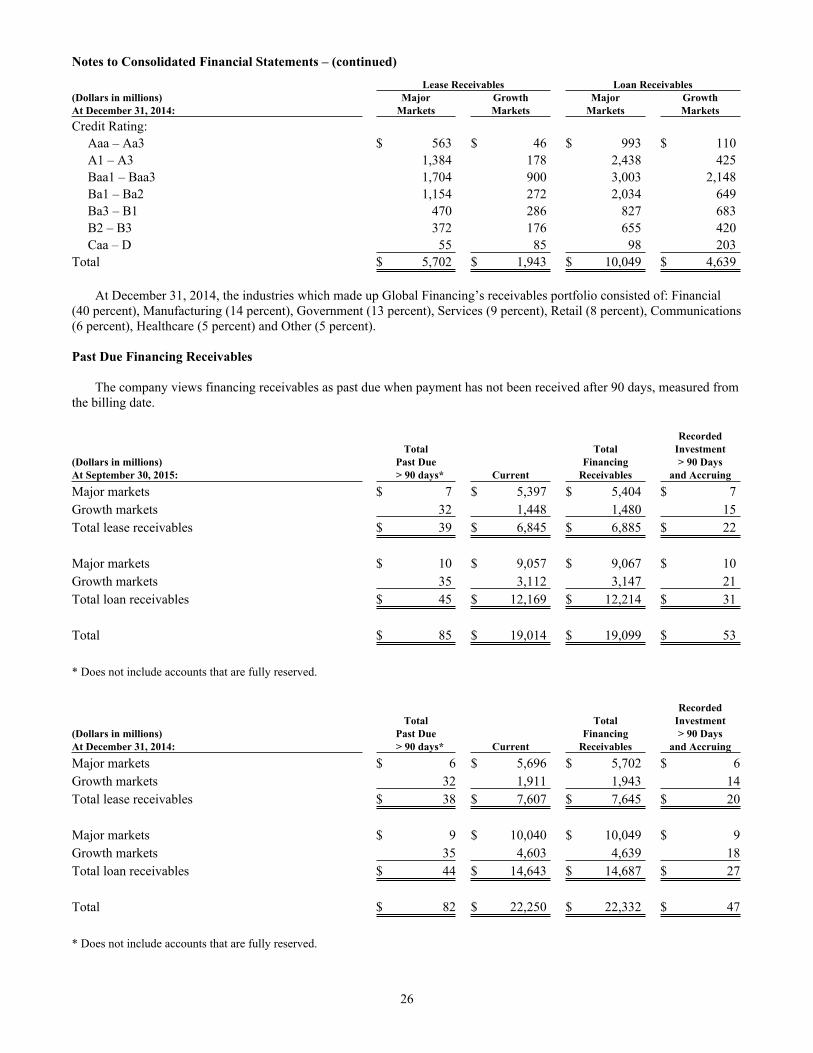
The following tables present the gross recorded investment for each class of receivables, by credit quality indicator, at September 30, 2015 and December 31, 2014. Receivables with a credit quality indicator ranging from Aaa to Baa3 are considered investment grade. All others are considered non-investment grade. The credit quality indicators do not reflect mitigation actions that the company may take to transfer credit risk to third parties.
Lease Receivables Loan Receivables(Dollars in millions) Major Growth Major GrowthAt September 30, 2015: Markets Markets Markets MarketsCredit Rating:
Aaa – Aa3 $ 621 $ 33 $ 1,042 $ 70A1 – A3 1,170 124 1,963 263Baa1 – Baa3 1,502 587 2,520 1,248Ba1 – Ba2 1,172 229 1,966 488Ba3 – B1 500 260 839 553B2 – B3 400 171 672 365Caa – D 39 76 65 161
Total $ 5,404 $ 1,480 $ 9,067 $ 3,147
At September 30, 2015, the industries which made up Global Financing’s receivables portfolio consisted of: Financial (37 percent), Government (14 percent), Manufacturing (14 percent), Services (9 percent), Retail (8 percent), Communications (7 percent), Healthcare (6 percent) and Other (5 percent).
Notes to Consolidated Financial Statements – (continued)
26
Lease Receivables Loan Receivables(Dollars in millions) Major Growth Major GrowthAt December 31, 2014: Markets Markets Markets MarketsCredit Rating:
Aaa – Aa3 $ 563 $ 46 $ 993 $ 110A1 – A3 1,384 178 2,438 425Baa1 – Baa3 1,704 900 3,003 2,148Ba1 – Ba2 1,154 272 2,034 649Ba3 – B1 470 286 827 683B2 – B3 372 176 655 420Caa – D 55 85 98 203
Total $ 5,702 $ 1,943 $ 10,049 $ 4,639
At December 31, 2014, the industries which made up Global Financing’s receivables portfolio consisted of: Financial (40 percent), Manufacturing (14 percent), Government (13 percent), Services (9 percent), Retail (8 percent), Communications (6 percent), Healthcare (5 percent) and Other (5 percent).
Past Due Financing Receivables
The company views financing receivables as past due when payment has not been received after 90 days, measured from the billing date.
RecordedTotal Total Investment
(Dollars in millions) Past Due Financing > 90 DaysAt September 30, 2015: > 90 days* Current Receivables and AccruingMajor markets $ 7 $ 5,397 $ 5,404 $ 7Growth markets 32 1,448 1,480 15Total lease receivables $ 39 $ 6,845 $ 6,885 $ 22
Major markets $ 10 $ 9,057 $ 9,067 $ 10Growth markets 35 3,112 3,147 21Total loan receivables $ 45 $ 12,169 $ 12,214 $ 31
Total $ 85 $ 19,014 $ 19,099 $ 53
* Does not include accounts that are fully reserved.
RecordedTotal Total Investment
(Dollars in millions) Past Due Financing > 90 DaysAt December 31, 2014: > 90 days* Current Receivables and AccruingMajor markets $ 6 $ 5,696 $ 5,702 $ 6Growth markets 32 1,911 1,943 14Total lease receivables $ 38 $ 7,607 $ 7,645 $ 20
Major markets $ 9 $ 10,040 $ 10,049 $ 9Growth markets 35 4,603 4,639 18Total loan receivables $ 44 $ 14,643 $ 14,687 $ 27
Total $ 82 $ 22,250 $ 22,332 $ 47
* Does not include accounts that are fully reserved.
Notes to Consolidated Financial Statements – (continued)
27
Troubled Debt Restructurings
The company did not have any troubled debt restructurings during the nine months ended September 30, 2015 and for the year ended December 31, 2014.
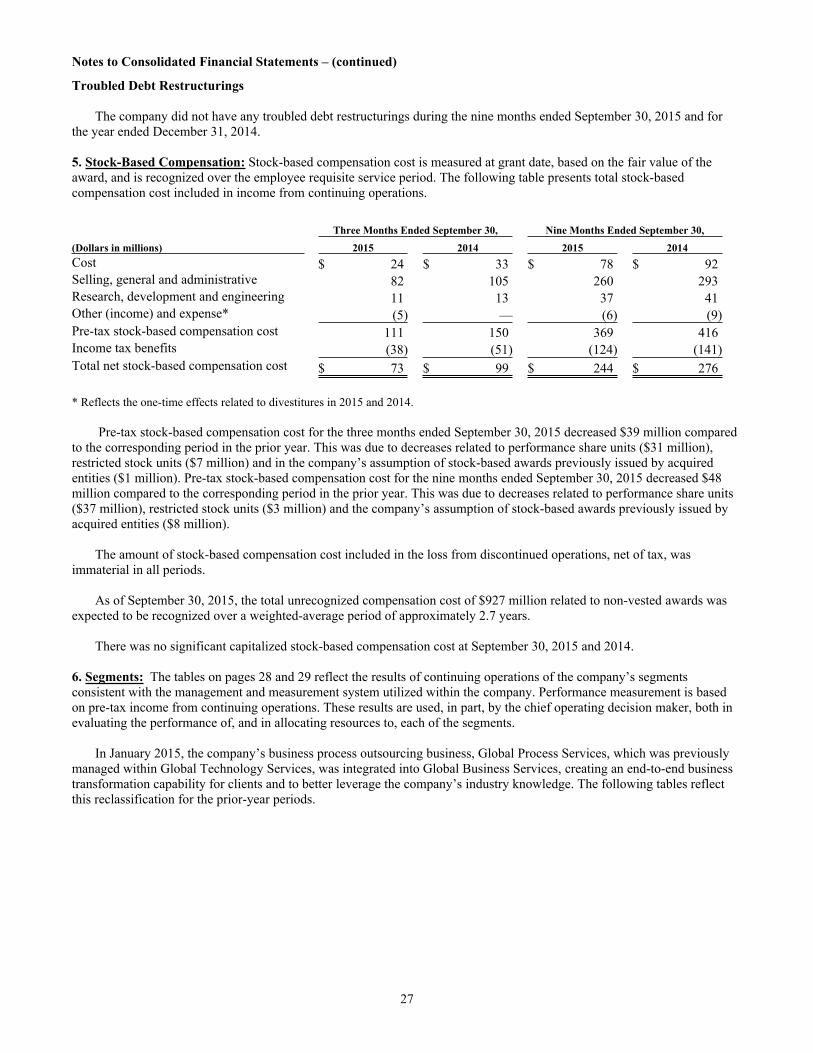
5. Stock-Based Compensation: Stock-based compensation cost is measured at grant date, based on the fair value of the award, and is recognized over the employee requisite service period. The following table presents total stock-based compensation cost included in income from continuing operations.
Three Months Ended September 30, Nine Months Ended September 30,
(Dollars in millions) 2015 2014 2015 2014Cost $ 24 $ 33 $ 78 $ 92Selling, general and administrative 82 105 260 293Research, development and engineering 11 13 37 41Other (income) and expense* (5) — (6) (9)Pre-tax stock-based compensation cost 111 150 369 416Income tax benefits (38) (51) (124) (141)Total net stock-based compensation cost $ 73 $ 99 $ 244 $ 276
* Reflects the one-time effects related to divestitures in 2015 and 2014.
Pre-tax stock-based compensation cost for the three months ended September 30, 2015 decreased $39 million compared to the corresponding period in the prior year. This was due to decreases related to performance share units ($31 million), restricted stock units ($7 million) and in the company’s assumption of stock-based awards previously issued by acquired entities ($1 million). Pre-tax stock-based compensation cost for the nine months ended September 30, 2015 decreased $48 million compared to the corresponding period in the prior year. This was due to decreases related to performance share units ($37 million), restricted stock units ($3 million) and the company’s assumption of stock-based awards previously issued by acquired entities ($8 million).
The amount of stock-based compensation cost included in the loss from discontinued operations, net of tax, was immaterial in all periods.
As of September 30, 2015, the total unrecognized compensation cost of $927 million related to non-vested awards was expected to be recognized over a weighted-average period of approximately 2.7 years.
There was no significant capitalized stock-based compensation cost at September 30, 2015 and 2014.
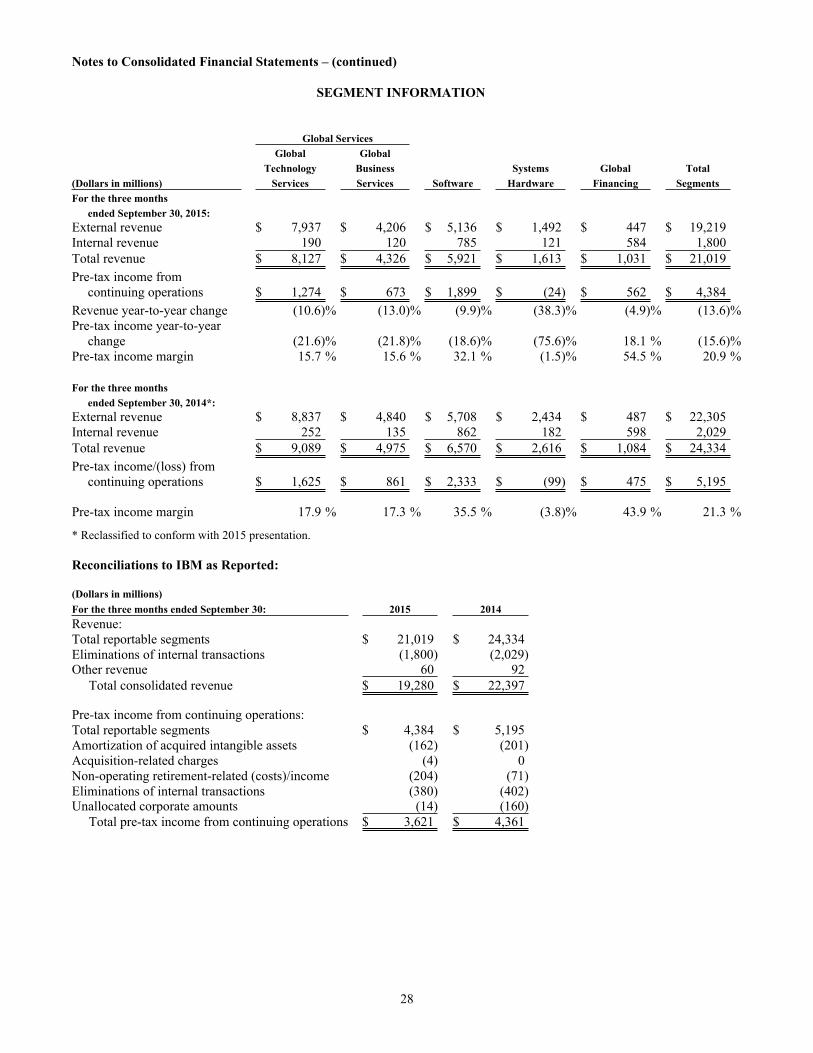
6. Segments: The tables on pages 28 and 29 reflect the results of continuing operations of the company’s segments consistent with the management and measurement system utilized within the company. Performance measurement is based on pre-tax income from continuing operations. These results are used, in part, by the chief operating decision maker, both in evaluating the performance of, and in allocating resources to, each of the segments.
In January 2015, the company’s business process outsourcing business, Global Process Services, which was previously managed within Global Technology Services, was integrated into Global Business Services, creating an end-to-end business transformation capability for clients and to better leverage the company’s industry knowledge. The following tables reflect this reclassification for the prior-year periods.
Notes to Consolidated Financial Statements – (continued)
28
SEGMENT INFORMATION
Global ServicesGlobal Global
Technology Business Systems Global Total(Dollars in millions) Services Services Software Hardware Financing SegmentsFor the three months
ended September 30, 2015:External revenue $ 7,937 $ 4,206 $ 5,136 $ 1,492 $ 447 $ 19,219Internal revenue 190 120 785 121 584 1,800Total revenue $ 8,127 $ 4,326 $ 5,921 $ 1,613 $ 1,031 $ 21,019Pre-tax income from
continuing operations $ 1,274 $ 673 $ 1,899 $ (24) $ 562 $ 4,384Revenue year-to-year change (10.6)% (13.0)% (9.9)% (38.3)% (4.9)% (13.6)%Pre-tax income year-to-year
change (21.6)% (21.8)% (18.6)% (75.6)% 18.1 % (15.6)%Pre-tax income margin 15.7 % 15.6 % 32.1 % (1.5)% 54.5 % 20.9 %
For the three monthsended September 30, 2014*:
External revenue $ 8,837 $ 4,840 $ 5,708 $ 2,434 $ 487 $ 22,305Internal revenue 252 135 862 182 598 2,029Total revenue $ 9,089 $ 4,975 $ 6,570 $ 2,616 $ 1,084 $ 24,334Pre-tax income/(loss) from
continuing operations $ 1,625 $ 861 $ 2,333 $ (99) $ 475 $ 5,195
Pre-tax income margin 17.9 % 17.3 % 35.5 % (3.8)% 43.9 % 21.3 %
* Reclassified to conform with 2015 presentation.
Reconciliations to IBM as Reported:
(Dollars in millions)For the three months ended September 30: 2015 2014Revenue:Total reportable segments $ 21,019 $ 24,334Eliminations of internal transactions (1,800) (2,029)Other revenue 60 92
Total consolidated revenue $ 19,280 $ 22,397
Pre-tax income from continuing operations:Total reportable segments $ 4,384 $ 5,195Amortization of acquired intangible assets (162) (201)Acquisition-related charges (4) 0Non-operating retirement-related (costs)/income (204) (71)Eliminations of internal transactions (380) (402)Unallocated corporate amounts (14) (160)
Total pre-tax income from continuing operations $ 3,621 $ 4,361
Notes to Consolidated Financial Statements – (continued)
29
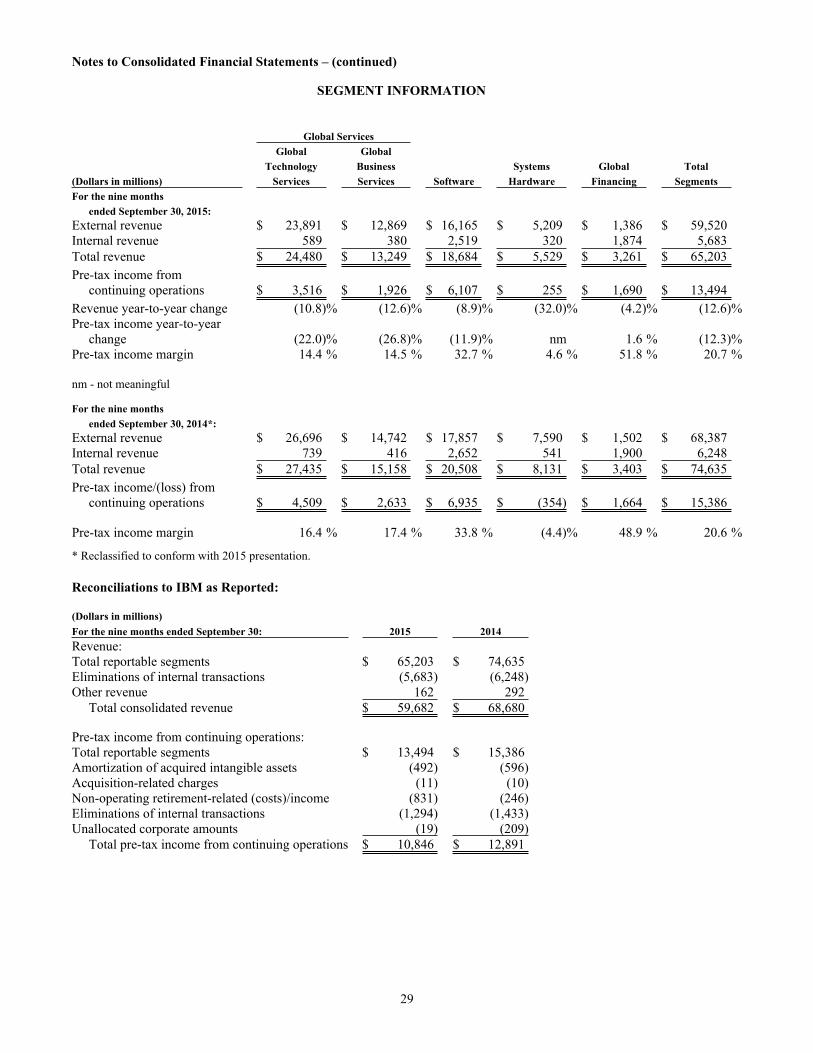
SEGMENT INFORMATION
Global ServicesGlobal Global
Technology Business Systems Global Total(Dollars in millions) Services Services Software Hardware Financing SegmentsFor the nine months
ended September 30, 2015:External revenue $ 23,891 $ 12,869 $ 16,165 $ 5,209 $ 1,386 $ 59,520Internal revenue 589 380 2,519 320 1,874 5,683Total revenue $ 24,480 $ 13,249 $ 18,684 $ 5,529 $ 3,261 $ 65,203Pre-tax income from
continuing operations $ 3,516 $ 1,926 $ 6,107 $ 255 $ 1,690 $ 13,494Revenue year-to-year change (10.8)% (12.6)% (8.9)% (32.0)% (4.2)% (12.6)%Pre-tax income year-to-year
change (22.0)% (26.8)% (11.9)% nm 1.6 % (12.3)%Pre-tax income margin 14.4 % 14.5 % 32.7 % 4.6 % 51.8 % 20.7 %
nm - not meaningful
For the nine monthsended September 30, 2014*:
External revenue $ 26,696 $ 14,742 $ 17,857 $ 7,590 $ 1,502 $ 68,387Internal revenue 739 416 2,652 541 1,900 6,248Total revenue $ 27,435 $ 15,158 $ 20,508 $ 8,131 $ 3,403 $ 74,635Pre-tax income/(loss) from
continuing operations $ 4,509 $ 2,633 $ 6,935 $ (354) $ 1,664 $ 15,386
Pre-tax income margin 16.4 % 17.4 % 33.8 % (4.4)% 48.9 % 20.6 %
* Reclassified to conform with 2015 presentation.
Reconciliations to IBM as Reported:
(Dollars in millions)For the nine months ended September 30: 2015 2014Revenue:Total reportable segments $ 65,203 $ 74,635Eliminations of internal transactions (5,683) (6,248)Other revenue 162 292
Total consolidated revenue $ 59,682 $ 68,680
Pre-tax income from continuing operations:Total reportable segments $ 13,494 $ 15,386Amortization of acquired intangible assets (492) (596)Acquisition-related charges (11) (10)Non-operating retirement-related (costs)/income (831) (246)Eliminations of internal transactions (1,294) (1,433)Unallocated corporate amounts (19) (209)
Total pre-tax income from continuing operations $ 10,846 $ 12,891
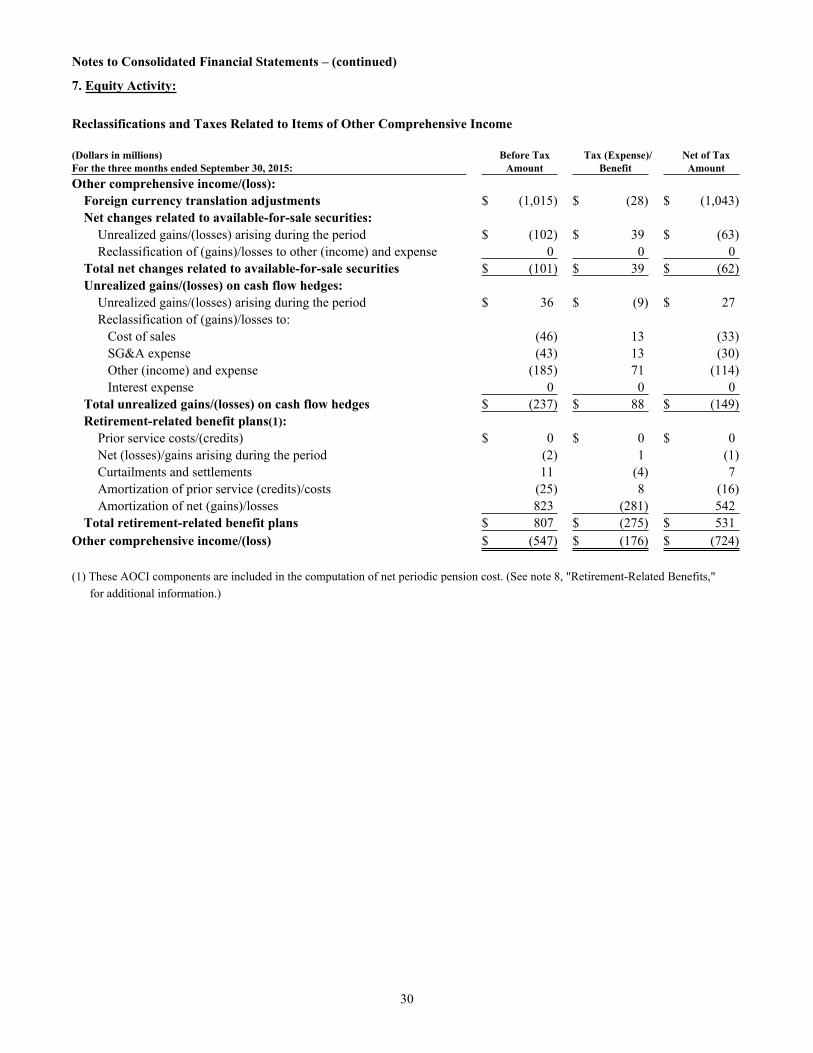
Notes to Consolidated Financial Statements – (continued)
30
7. Equity Activity:
Reclassifications and Taxes Related to Items of Other Comprehensive Income
(Dollars in millions) Before Tax Tax (Expense)/ Net of TaxFor the three months ended September 30, 2015: Amount Benefit AmountOther comprehensive income/(loss):
Foreign currency translation adjustments $ (1,015) $ (28) $ (1,043)Net changes related to available-for-sale securities:
Unrealized gains/(losses) arising during the period $ (102) $ 39 $ (63)Reclassification of (gains)/losses to other (income) and expense 0 0 0
Total net changes related to available-for-sale securities $ (101) $ 39 $ (62)Unrealized gains/(losses) on cash flow hedges:
Unrealized gains/(losses) arising during the period $ 36 $ (9) $ 27Reclassification of (gains)/losses to: Cost of sales (46) 13 (33) SG&A expense (43) 13 (30) Other (income) and expense (185) 71 (114) Interest expense 0 0 0
Total unrealized gains/(losses) on cash flow hedges $ (237) $ 88 $ (149)Retirement-related benefit plans(1):
Prior service costs/(credits) $ 0 $ 0 $ 0Net (losses)/gains arising during the period (2) 1 (1)Curtailments and settlements 11 (4) 7Amortization of prior service (credits)/costs (25) 8 (16)Amortization of net (gains)/losses 823 (281) 542
Total retirement-related benefit plans $ 807 $ (275) $ 531Other comprehensive income/(loss) $ (547) $ (176) $ (724)
(1) These AOCI components are included in the computation of net periodic pension cost. (See note 8, "Retirement-Related Benefits," for additional information.)
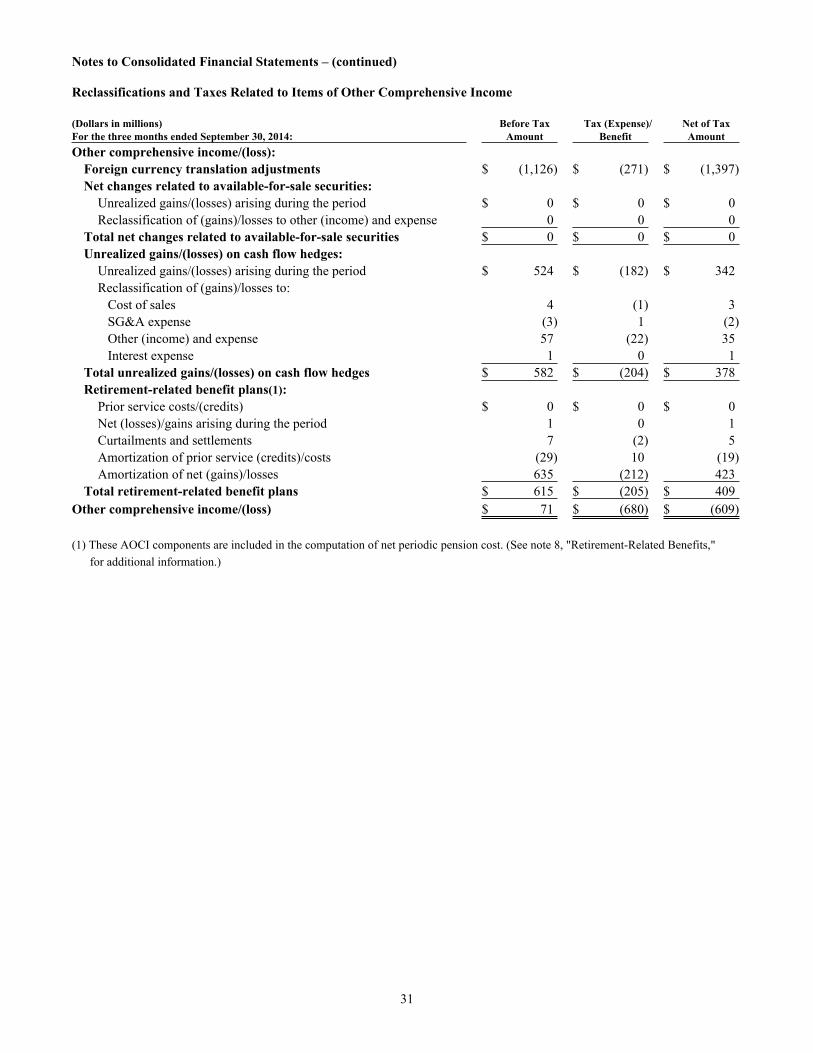
Notes to Consolidated Financial Statements – (continued)
31
Reclassifications and Taxes Related to Items of Other Comprehensive Income
(Dollars in millions) Before Tax Tax (Expense)/ Net of TaxFor the three months ended September 30, 2014: Amount Benefit AmountOther comprehensive income/(loss):
Foreign currency translation adjustments $ (1,126) $ (271) $ (1,397)Net changes related to available-for-sale securities:
Unrealized gains/(losses) arising during the period $ 0 $ 0 $ 0Reclassification of (gains)/losses to other (income) and expense 0 0 0
Total net changes related to available-for-sale securities $ 0 $ 0 $ 0Unrealized gains/(losses) on cash flow hedges:
Unrealized gains/(losses) arising during the period $ 524 $ (182) $ 342Reclassification of (gains)/losses to: Cost of sales 4 (1) 3 SG&A expense (3) 1 (2) Other (income) and expense 57 (22) 35 Interest expense 1 0 1
Total unrealized gains/(losses) on cash flow hedges $ 582 $ (204) $ 378Retirement-related benefit plans(1):
Prior service costs/(credits) $ 0 $ 0 $ 0Net (losses)/gains arising during the period 1 0 1Curtailments and settlements 7 (2) 5Amortization of prior service (credits)/costs (29) 10 (19)Amortization of net (gains)/losses 635 (212) 423
Total retirement-related benefit plans $ 615 $ (205) $ 409Other comprehensive income/(loss) $ 71 $ (680) $ (609)
(1) These AOCI components are included in the computation of net periodic pension cost. (See note 8, "Retirement-Related Benefits," for additional information.)
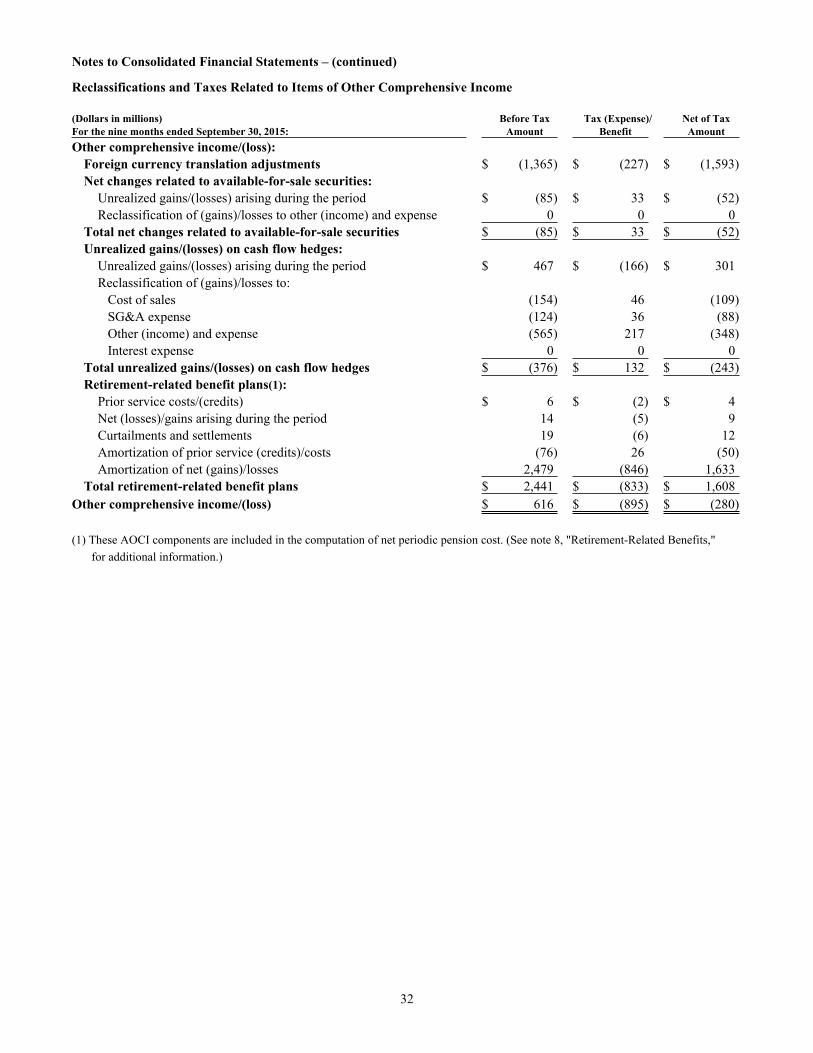
Notes to Consolidated Financial Statements – (continued)
32
Reclassifications and Taxes Related to Items of Other Comprehensive Income
(Dollars in millions) Before Tax Tax (Expense)/ Net of TaxFor the nine months ended September 30, 2015: Amount Benefit AmountOther comprehensive income/(loss):
Foreign currency translation adjustments $ (1,365) $ (227) $ (1,593)Net changes related to available-for-sale securities:
Unrealized gains/(losses) arising during the period $ (85) $ 33 $ (52)Reclassification of (gains)/losses to other (income) and expense 0 0 0
Total net changes related to available-for-sale securities $ (85) $ 33 $ (52)Unrealized gains/(losses) on cash flow hedges:
Unrealized gains/(losses) arising during the period $ 467 $ (166) $ 301Reclassification of (gains)/losses to: Cost of sales (154) 46 (109) SG&A expense (124) 36 (88) Other (income) and expense (565) 217 (348) Interest expense 0 0 0
Total unrealized gains/(losses) on cash flow hedges $ (376) $ 132 $ (243)Retirement-related benefit plans(1):
Prior service costs/(credits) $ 6 $ (2) $ 4Net (losses)/gains arising during the period 14 (5) 9Curtailments and settlements 19 (6) 12Amortization of prior service (credits)/costs (76) 26 (50)Amortization of net (gains)/losses 2,479 (846) 1,633
Total retirement-related benefit plans $ 2,441 $ (833) $ 1,608Other comprehensive income/(loss) $ 616 $ (895) $ (280)
(1) These AOCI components are included in the computation of net periodic pension cost. (See note 8, "Retirement-Related Benefits," for additional information.)
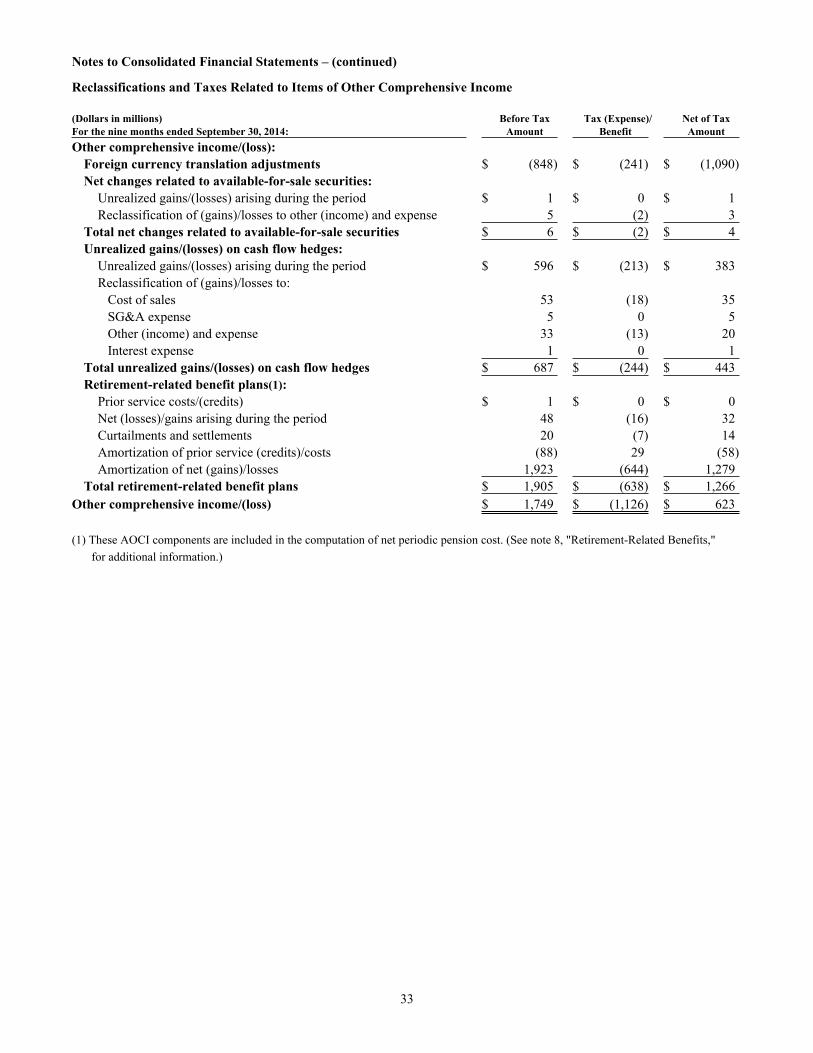
Notes to Consolidated Financial Statements – (continued)
33
Reclassifications and Taxes Related to Items of Other Comprehensive Income
(Dollars in millions) Before Tax Tax (Expense)/ Net of TaxFor the nine months ended September 30, 2014: Amount Benefit AmountOther comprehensive income/(loss):
Foreign currency translation adjustments $ (848) $ (241) $ (1,090)Net changes related to available-for-sale securities:
Unrealized gains/(losses) arising during the period $ 1 $ 0 $ 1Reclassification of (gains)/losses to other (income) and expense 5 (2) 3
Total net changes related to available-for-sale securities $ 6 $ (2) $ 4Unrealized gains/(losses) on cash flow hedges:
Unrealized gains/(losses) arising during the period $ 596 $ (213) $ 383Reclassification of (gains)/losses to: Cost of sales 53 (18) 35 SG&A expense 5 0 5 Other (income) and expense 33 (13) 20 Interest expense 1 0 1
Total unrealized gains/(losses) on cash flow hedges $ 687 $ (244) $ 443Retirement-related benefit plans(1):
Prior service costs/(credits) $ 1 $ 0 $ 0Net (losses)/gains arising during the period 48 (16) 32Curtailments and settlements 20 (7) 14Amortization of prior service (credits)/costs (88) 29 (58)Amortization of net (gains)/losses 1,923 (644) 1,279
Total retirement-related benefit plans $ 1,905 $ (638) $ 1,266Other comprehensive income/(loss) $ 1,749 $ (1,126) $ 623
(1) These AOCI components are included in the computation of net periodic pension cost. (See note 8, "Retirement-Related Benefits," for additional information.)
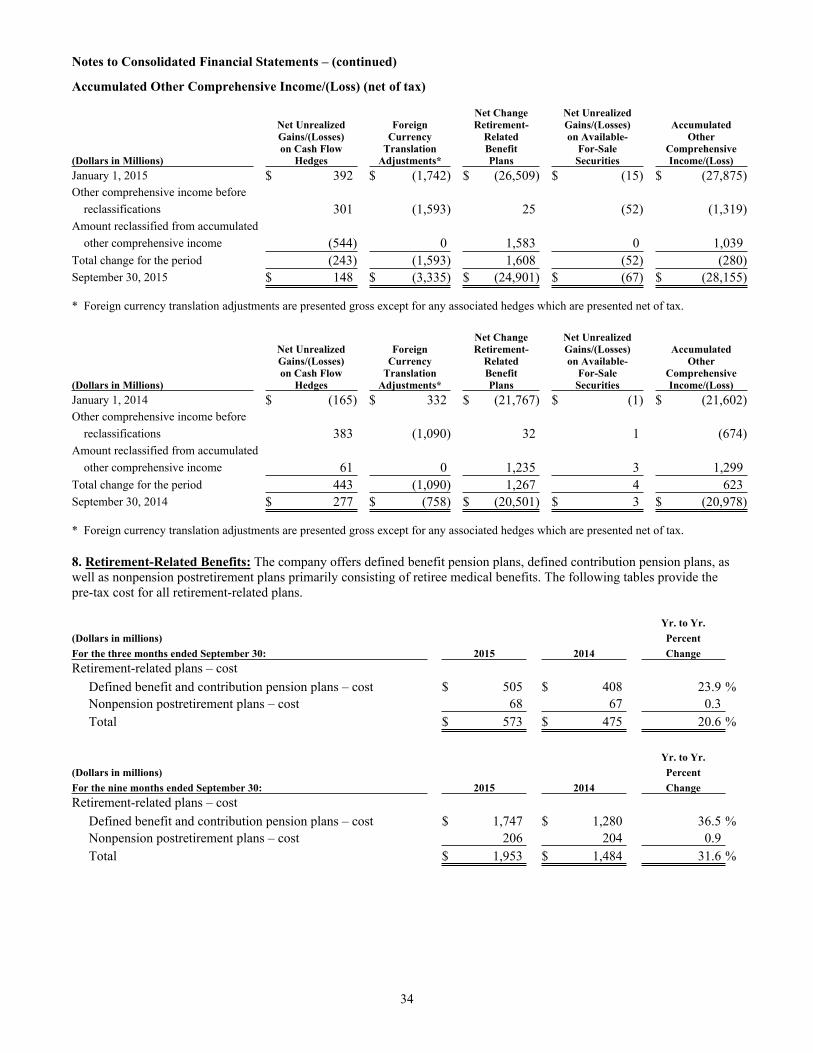
Notes to Consolidated Financial Statements – (continued)
34
Accumulated Other Comprehensive Income/(Loss) (net of tax)
Net Change Net UnrealizedNet Unrealized Foreign Retirement- Gains/(Losses) AccumulatedGains/(Losses) Currency Related on Available- Otheron Cash Flow Translation Benefit For-Sale Comprehensive
(Dollars in Millions) Hedges Adjustments* Plans Securities Income/(Loss)January 1, 2015 $ 392 $ (1,742) $ (26,509) $ (15) $ (27,875)Other comprehensive income before
reclassifications 301 (1,593) 25 (52) (1,319)Amount reclassified from accumulated
other comprehensive income (544) 0 1,583 0 1,039Total change for the period (243) (1,593) 1,608 (52) (280)September 30, 2015 $ 148 $ (3,335) $ (24,901) $ (67) $ (28,155)
* Foreign currency translation adjustments are presented gross except for any associated hedges which are presented net of tax.
Net Change Net UnrealizedNet Unrealized Foreign Retirement- Gains/(Losses) AccumulatedGains/(Losses) Currency Related on Available- Otheron Cash Flow Translation Benefit For-Sale Comprehensive
(Dollars in Millions) Hedges Adjustments* Plans Securities Income/(Loss)January 1, 2014 $ (165) $ 332 $ (21,767) $ (1) $ (21,602)Other comprehensive income before
reclassifications 383 (1,090) 32 1 (674)Amount reclassified from accumulated
other comprehensive income 61 0 1,235 3 1,299Total change for the period 443 (1,090) 1,267 4 623September 30, 2014 $ 277 $ (758) $ (20,501) $ 3 $ (20,978)
* Foreign currency translation adjustments are presented gross except for any associated hedges which are presented net of tax.
8. Retirement-Related Benefits: The company offers defined benefit pension plans, defined contribution pension plans, as well as nonpension postretirement plans primarily consisting of retiree medical benefits. The following tables provide the pre-tax cost for all retirement-related plans.
Yr. to Yr. (Dollars in millions) Percent For the three months ended September 30: 2015 2014 ChangeRetirement-related plans – cost
Defined benefit and contribution pension plans – cost $ 505 $ 408 23.9 %Nonpension postretirement plans – cost 68 67 0.3Total $ 573 $ 475 20.6 %
Yr. to Yr. (Dollars in millions) Percent For the nine months ended September 30: 2015 2014 ChangeRetirement-related plans – cost
Defined benefit and contribution pension plans – cost $ 1,747 $ 1,280 36.5 %Nonpension postretirement plans – cost 206 204 0.9Total $ 1,953 $ 1,484 31.6 %
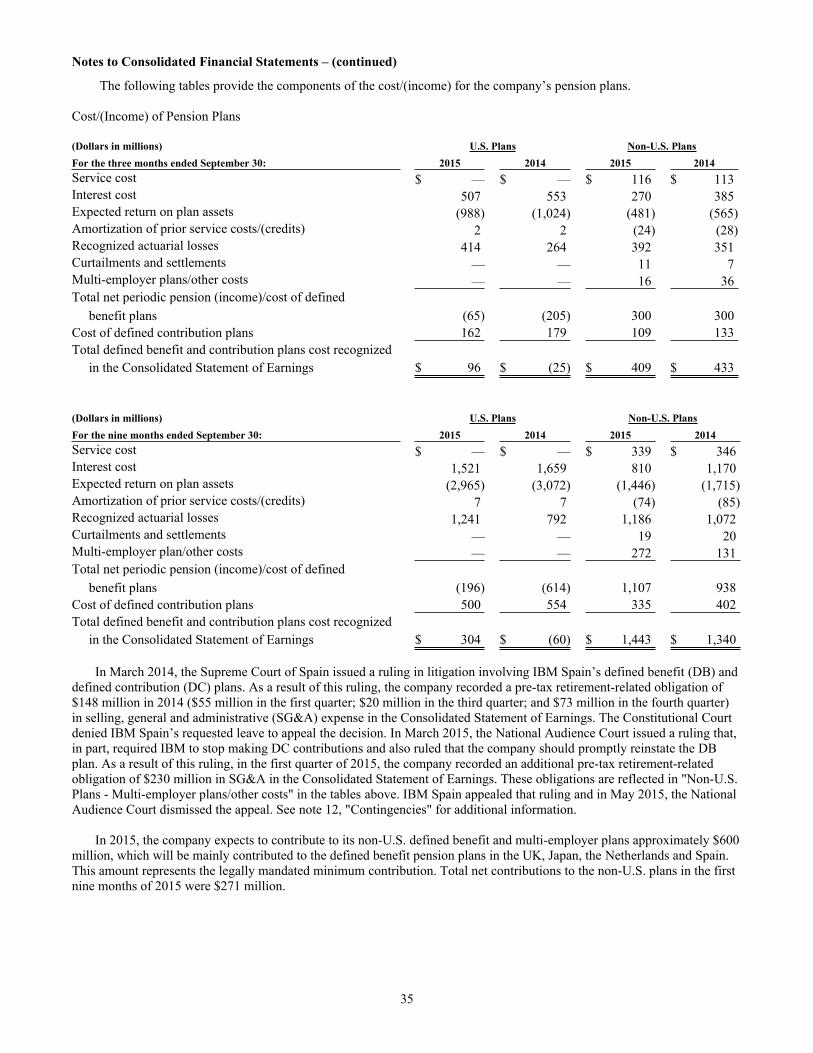
Notes to Consolidated Financial Statements – (continued)
35
The following tables provide the components of the cost/(income) for the company’s pension plans.
Cost/(Income) of Pension Plans
(Dollars in millions) U.S. Plans Non-U.S. PlansFor the three months ended September 30: 2015 2014 2015 2014Service cost $ — $ — $ 116 $ 113Interest cost 507 553 270 385Expected return on plan assets (988) (1,024) (481) (565)Amortization of prior service costs/(credits) 2 2 (24) (28)Recognized actuarial losses 414 264 392 351Curtailments and settlements — — 11 7Multi-employer plans/other costs — — 16 36Total net periodic pension (income)/cost of defined
benefit plans (65) (205) 300 300Cost of defined contribution plans 162 179 109 133Total defined benefit and contribution plans cost recognized
in the Consolidated Statement of Earnings $ 96 $ (25) $ 409 $ 433
(Dollars in millions) U.S. Plans Non-U.S. PlansFor the nine months ended September 30: 2015 2014 2015 2014Service cost $ — $ — $ 339 $ 346Interest cost 1,521 1,659 810 1,170Expected return on plan assets (2,965) (3,072) (1,446) (1,715)Amortization of prior service costs/(credits) 7 7 (74) (85)Recognized actuarial losses 1,241 792 1,186 1,072Curtailments and settlements — — 19 20Multi-employer plan/other costs — — 272 131Total net periodic pension (income)/cost of defined
benefit plans (196) (614) 1,107 938Cost of defined contribution plans 500 554 335 402Total defined benefit and contribution plans cost recognized
in the Consolidated Statement of Earnings $ 304 $ (60) $ 1,443 $ 1,340
In March 2014, the Supreme Court of Spain issued a ruling in litigation involving IBM Spain’s defined benefit (DB) and defined contribution (DC) plans. As a result of this ruling, the company recorded a pre-tax retirement-related obligation of $148 million in 2014 ($55 million in the first quarter; $20 million in the third quarter; and $73 million in the fourth quarter) in selling, general and administrative (SG&A) expense in the Consolidated Statement of Earnings. The Constitutional Court denied IBM Spain’s requested leave to appeal the decision. In March 2015, the National Audience Court issued a ruling that, in part, required IBM to stop making DC contributions and also ruled that the company should promptly reinstate the DB plan. As a result of this ruling, in the first quarter of 2015, the company recorded an additional pre-tax retirement-related obligation of $230 million in SG&A in the Consolidated Statement of Earnings. These obligations are reflected in "Non-U.S. Plans - Multi-employer plans/other costs" in the tables above. IBM Spain appealed that ruling and in May 2015, the National Audience Court dismissed the appeal. See note 12, "Contingencies" for additional information.
In 2015, the company expects to contribute to its non-U.S. defined benefit and multi-employer plans approximately $600 million, which will be mainly contributed to the defined benefit pension plans in the UK, Japan, the Netherlands and Spain. This amount represents the legally mandated minimum contribution. Total net contributions to the non-U.S. plans in the first nine months of 2015 were $271 million.
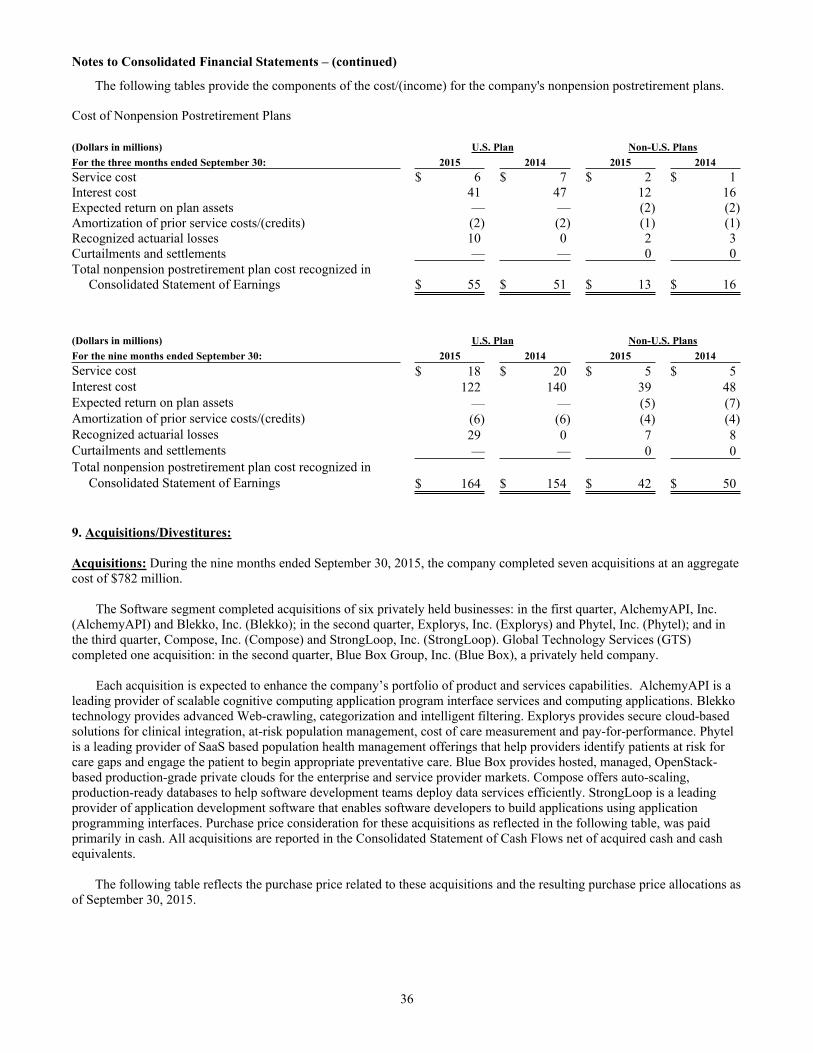
Notes to Consolidated Financial Statements – (continued)
36
The following tables provide the components of the cost/(income) for the company's nonpension postretirement plans.
Cost of Nonpension Postretirement Plans
(Dollars in millions) U.S. Plan Non-U.S. PlansFor the three months ended September 30: 2015 2014 2015 2014Service cost $ 6 $ 7 $ 2 $ 1Interest cost 41 47 12 16Expected return on plan assets — — (2) (2)Amortization of prior service costs/(credits) (2) (2) (1) (1)Recognized actuarial losses 10 0 2 3Curtailments and settlements — — 0 0Total nonpension postretirement plan cost recognized in
Consolidated Statement of Earnings $ 55 $ 51 $ 13 $ 16
(Dollars in millions) U.S. Plan Non-U.S. PlansFor the nine months ended September 30: 2015 2014 2015 2014Service cost $ 18 $ 20 $ 5 $ 5Interest cost 122 140 39 48Expected return on plan assets — — (5) (7)Amortization of prior service costs/(credits) (6) (6) (4) (4)Recognized actuarial losses 29 0 7 8Curtailments and settlements — — 0 0Total nonpension postretirement plan cost recognized in
Consolidated Statement of Earnings $ 164 $ 154 $ 42 $ 50
9. Acquisitions/Divestitures:
Acquisitions: During the nine months ended September 30, 2015, the company completed seven acquisitions at an aggregate cost of $782 million.
The Software segment completed acquisitions of six privately held businesses: in the first quarter, AlchemyAPI, Inc. (AlchemyAPI) and Blekko, Inc. (Blekko); in the second quarter, Explorys, Inc. (Explorys) and Phytel, Inc. (Phytel); and in the third quarter, Compose, Inc. (Compose) and StrongLoop, Inc. (StrongLoop). Global Technology Services (GTS) completed one acquisition: in the second quarter, Blue Box Group, Inc. (Blue Box), a privately held company.
Each acquisition is expected to enhance the company’s portfolio of product and services capabilities. AlchemyAPI is a leading provider of scalable cognitive computing application program interface services and computing applications. Blekko technology provides advanced Web-crawling, categorization and intelligent filtering. Explorys provides secure cloud-based solutions for clinical integration, at-risk population management, cost of care measurement and pay-for-performance. Phytel is a leading provider of SaaS based population health management offerings that help providers identify patients at risk for care gaps and engage the patient to begin appropriate preventative care. Blue Box provides hosted, managed, OpenStack-based production-grade private clouds for the enterprise and service provider markets. Compose offers auto-scaling, production-ready databases to help software development teams deploy data services efficiently. StrongLoop is a leading provider of application development software that enables software developers to build applications using application programming interfaces. Purchase price consideration for these acquisitions as reflected in the following table, was paid primarily in cash. All acquisitions are reported in the Consolidated Statement of Cash Flows net of acquired cash and cash equivalents.
The following table reflects the purchase price related to these acquisitions and the resulting purchase price allocations as of September 30, 2015.
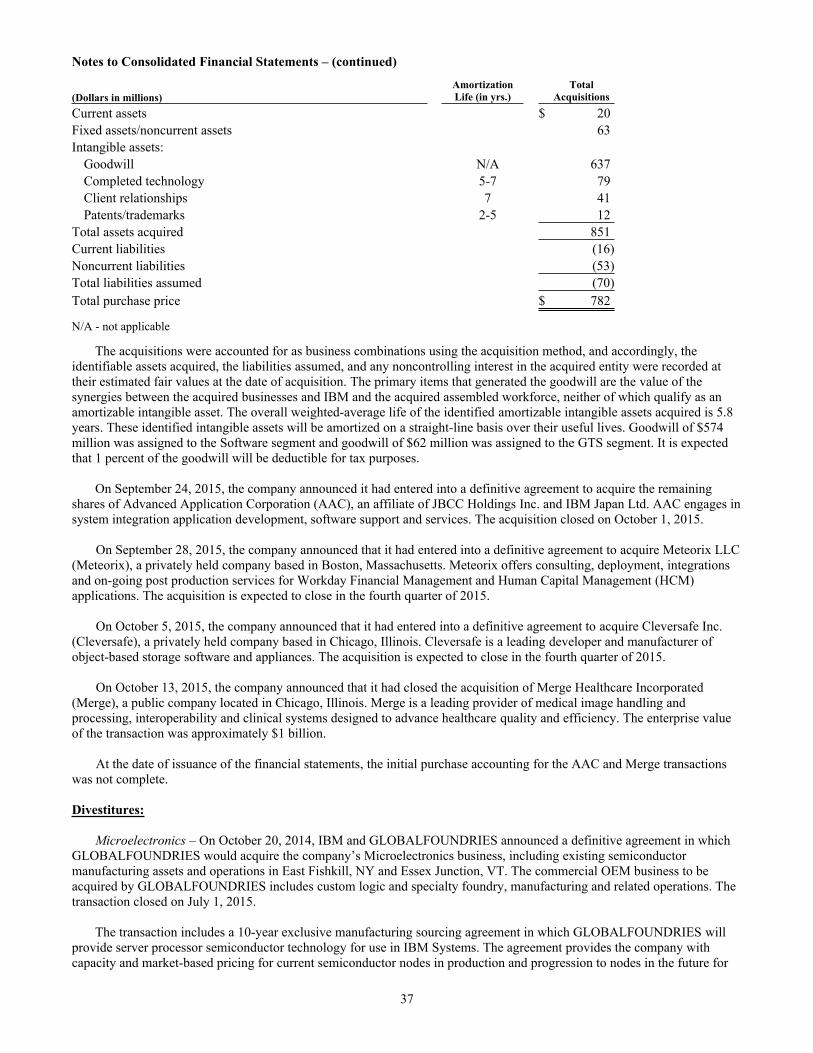
Notes to Consolidated Financial Statements – (continued)
37
Amortization Total(Dollars in millions) Life (in yrs.) AcquisitionsCurrent assets $ 20Fixed assets/noncurrent assets 63Intangible assets:
Goodwill N/A 637Completed technology 5-7 79Client relationships 7 41Patents/trademarks 2-5 12
Total assets acquired 851Current liabilities (16)Noncurrent liabilities (53)Total liabilities assumed (70)Total purchase price $ 782
N/A - not applicable
The acquisitions were accounted for as business combinations using the acquisition method, and accordingly, the identifiable assets acquired, the liabilities assumed, and any noncontrolling interest in the acquired entity were recorded at their estimated fair values at the date of acquisition. The primary items that generated the goodwill are the value of the synergies between the acquired businesses and IBM and the acquired assembled workforce, neither of which qualify as an amortizable intangible asset. The overall weighted-average life of the identified amortizable intangible assets acquired is 5.8 years. These identified intangible assets will be amortized on a straight-line basis over their useful lives. Goodwill of $574 million was assigned to the Software segment and goodwill of $62 million was assigned to the GTS segment. It is expected that 1 percent of the goodwill will be deductible for tax purposes.
On September 24, 2015, the company announced it had entered into a definitive agreement to acquire the remaining shares of Advanced Application Corporation (AAC), an affiliate of JBCC Holdings Inc. and IBM Japan Ltd. AAC engages in system integration application development, software support and services. The acquisition closed on October 1, 2015.
On September 28, 2015, the company announced that it had entered into a definitive agreement to acquire Meteorix LLC (Meteorix), a privately held company based in Boston, Massachusetts. Meteorix offers consulting, deployment, integrations and on-going post production services for Workday Financial Management and Human Capital Management (HCM) applications. The acquisition is expected to close in the fourth quarter of 2015.
On October 5, 2015, the company announced that it had entered into a definitive agreement to acquire Cleversafe Inc. (Cleversafe), a privately held company based in Chicago, Illinois. Cleversafe is a leading developer and manufacturer of object-based storage software and appliances. The acquisition is expected to close in the fourth quarter of 2015.
On October 13, 2015, the company announced that it had closed the acquisition of Merge Healthcare Incorporated (Merge), a public company located in Chicago, Illinois. Merge is a leading provider of medical image handling and processing, interoperability and clinical systems designed to advance healthcare quality and efficiency. The enterprise value of the transaction was approximately $1 billion.
At the date of issuance of the financial statements, the initial purchase accounting for the AAC and Merge transactions was not complete.
Divestitures:
Microelectronics – On October 20, 2014, IBM and GLOBALFOUNDRIES announced a definitive agreement in which GLOBALFOUNDRIES would acquire the company’s Microelectronics business, including existing semiconductor manufacturing assets and operations in East Fishkill, NY and Essex Junction, VT. The commercial OEM business to be acquired by GLOBALFOUNDRIES includes custom logic and specialty foundry, manufacturing and related operations. The transaction closed on July 1, 2015.
The transaction includes a 10-year exclusive manufacturing sourcing agreement in which GLOBALFOUNDRIES will provide server processor semiconductor technology for use in IBM Systems. The agreement provides the company with capacity and market-based pricing for current semiconductor nodes in production and progression to nodes in the future for
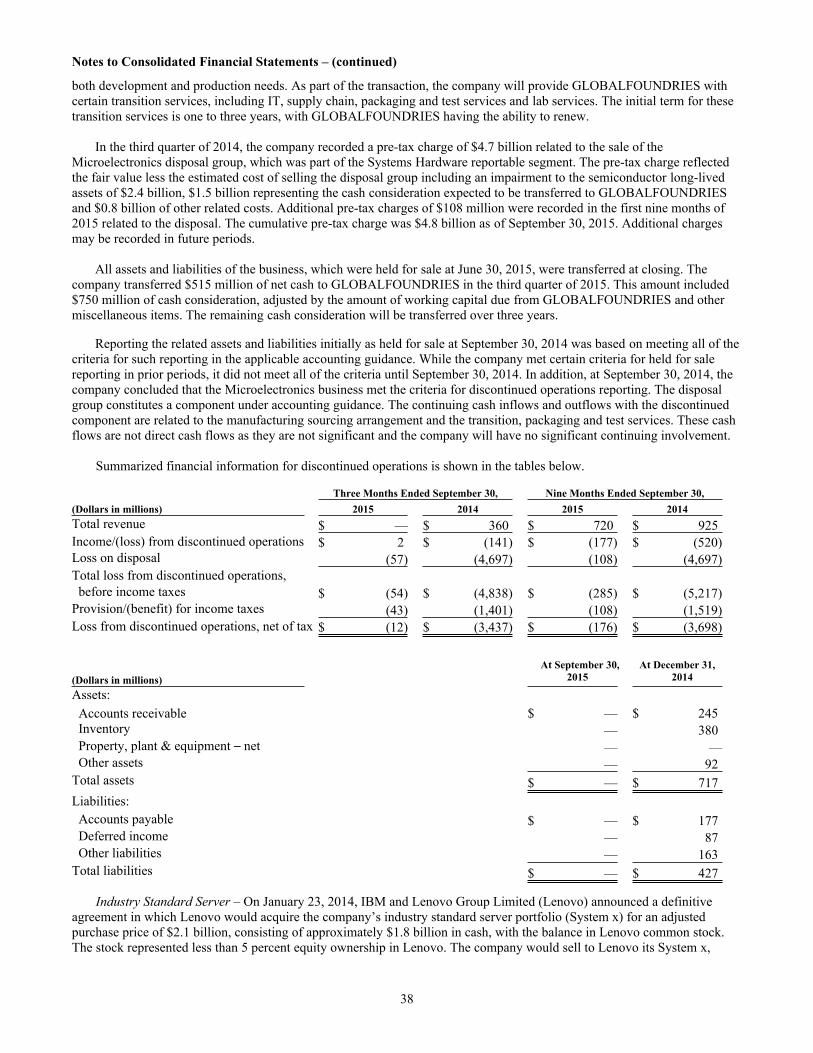
Notes to Consolidated Financial Statements – (continued)
38
both development and production needs. As part of the transaction, the company will provide GLOBALFOUNDRIES with certain transition services, including IT, supply chain, packaging and test services and lab services. The initial term for these transition services is one to three years, with GLOBALFOUNDRIES having the ability to renew.
In the third quarter of 2014, the company recorded a pre-tax charge of $4.7 billion related to the sale of the Microelectronics disposal group, which was part of the Systems Hardware reportable segment. The pre-tax charge reflected the fair value less the estimated cost of selling the disposal group including an impairment to the semiconductor long-lived assets of $2.4 billion, $1.5 billion representing the cash consideration expected to be transferred to GLOBALFOUNDRIES and $0.8 billion of other related costs. Additional pre-tax charges of $108 million were recorded in the first nine months of 2015 related to the disposal. The cumulative pre-tax charge was $4.8 billion as of September 30, 2015. Additional charges may be recorded in future periods.
All assets and liabilities of the business, which were held for sale at June 30, 2015, were transferred at closing. The company transferred $515 million of net cash to GLOBALFOUNDRIES in the third quarter of 2015. This amount included $750 million of cash consideration, adjusted by the amount of working capital due from GLOBALFOUNDRIES and other miscellaneous items. The remaining cash consideration will be transferred over three years.
Reporting the related assets and liabilities initially as held for sale at September 30, 2014 was based on meeting all of the criteria for such reporting in the applicable accounting guidance. While the company met certain criteria for held for sale reporting in prior periods, it did not meet all of the criteria until September 30, 2014. In addition, at September 30, 2014, the company concluded that the Microelectronics business met the criteria for discontinued operations reporting. The disposal group constitutes a component under accounting guidance. The continuing cash inflows and outflows with the discontinued component are related to the manufacturing sourcing arrangement and the transition, packaging and test services. These cash flows are not direct cash flows as they are not significant and the company will have no significant continuing involvement.
Summarized financial information for discontinued operations is shown in the tables below.
Three Months Ended September 30, Nine Months Ended September 30,(Dollars in millions) 2015 2014 2015 2014Total revenue $ — $ 360 $ 720 $ 925Income/(loss) from discontinued operations $ 2 $ (141) $ (177) $ (520)Loss on disposal (57) (4,697) (108) (4,697)Total loss from discontinued operations, before income taxes $ (54) $ (4,838) $ (285) $ (5,217)Provision/(benefit) for income taxes (43) (1,401) (108) (1,519)Loss from discontinued operations, net of tax $ (12) $ (3,437) $ (176) $ (3,698)
At September 30, At December 31,(Dollars in millions) 2015 2014
Assets: Accounts receivable $ — $ 245 Inventory — 380 Property, plant & equipment – net — — Other assets — 92Total assets $ — $ 717Liabilities: Accounts payable $ — $ 177 Deferred income — 87 Other liabilities — 163Total liabilities $ — $ 427
Industry Standard Server – On January 23, 2014, IBM and Lenovo Group Limited (Lenovo) announced a definitive agreement in which Lenovo would acquire the company’s industry standard server portfolio (System x) for an adjusted purchase price of $2.1 billion, consisting of approximately $1.8 billion in cash, with the balance in Lenovo common stock. The stock represented less than 5 percent equity ownership in Lenovo. The company would sell to Lenovo its System x,
Notes to Consolidated Financial Statements – (continued)
39
BladeCenter and Flex System blade servers and switches, x86-based Flex integrated systems, NeXtScale and iDataPlex servers and associated software, blade networking and maintenance operations.
IBM and Lenovo entered into a strategic relationship which included a global OEM and reseller agreement for sales of IBM’s industry-leading entry and midrange Storwize disk storage systems, tape storage systems, General Parallel File System software, SmartCloud Entry offering, and elements of IBM’s system software, including Systems Director and Platform Computing solutions. Effective with the initial closing of the transaction, Lenovo assumed related customer service and maintenance operations. IBM will continue to provide maintenance delivery on Lenovo’s behalf for an extended period of time. In addition, as part of the transaction agreement, the company will provide Lenovo with certain transition services, including IT and supply chain services. The initial term for these transition services ranges from less than one year to three years. Lenovo can renew certain services for an additional year.
The initial closing was completed on October 1, 2014. A subsequent closing occurred in most other countries in which there was a large business footprint on December 31, 2014. The remaining countries closed on March 31, 2015 resulting in a pre-tax gain of $16 million in the first quarter of 2015. In the second quarter of 2015, an additional pre-tax gain of $36 million was recorded attributed to certain adjustments resolved during the quarter. No material adjustments were recorded during the third quarter of 2015.
Overall, the company continues to expect to recognize a total pre-tax gain on the sale of approximately $1.5 billion, which does not include associated costs related to transition and performance-based costs. Net of these charges, the pre-tax gain is approximately $1.2 billion, of which $1.1 billion was recorded in the fourth quarter of 2014. The balance of the gain is expected to be recognized in 2019 upon conclusion of the maintenance agreement.
Customer Care – On September 10, 2013, IBM and SYNNEX announced a definitive agreement in which SYNNEX would acquire the company’s worldwide customer care business process outsourcing services business for $501 million, consisting of approximately $430 million in cash, net of balance sheet adjustments, and $71 million in SYNNEX common stock, which represented less than 5 percent equity ownership in SYNNEX. As part of the transaction, SYNNEX entered into a multi-year agreement with the company, and Concentrix, SYNNEX’s outsourcing business, became an IBM strategic business partner for global customer care business process outsourcing services.
The initial closing was completed on January 31, 2014, with subsequent closings occurring in 2014. For the full year of 2014, the company recorded a pre-tax gain of $202 million related to this transaction.
In the second quarter of 2015, resolution of the final balance sheet adjustments was concluded. In the third quarter of 2015, adjustments made to certain remaining provisions resulted in the recognition of an additional $2 million pre-tax gain. Through September 30, 2015, the cumulative pre-tax gain attributed to this transaction was $210 million.
Retail Store Solutions – On April 17, 2012, the company announced that it had signed a definitive agreement with Toshiba TEC for the sale of its Retail Store Solutions business. As part of the transaction, the company agreed to transfer the maintenance business to Toshiba TEC within three years of the original closing of the transaction.
The company completed the final phase of the transfer of the maintenance workforce to Toshiba in the second quarter of 2015. The parts and inventory transfer to Toshiba will commence in the fourth quarter of 2015 and is expected to be completed in 2016. An assessment of the ongoing contractual terms of the transaction resulted in the recognition of a pre-tax gain of $8 million in the third quarter of 2015.
Overall, the company has recognized a cumulative total pre-tax gain on the sale of approximately $518 million.
Others ‒ In the second quarter of 2015, the company completed the divestiture of its Travel & Transportation kiosk business to Embross North America Ltd., and the divestiture of its Telecom Expense Management product to Tangoe, Inc.
In the first quarter of 2015, the company completed the divestiture of the Algorithmics Collateral Management suite of products to SmartStream, Inc. and the divestiture of the Commerce ILOG Supply Chain Optimization Tools suite of products to Llamasoft, Inc.
The financial terms of each transaction were not material.
Notes to Consolidated Financial Statements – (continued)
40
10. Intangible Assets Including Goodwill: The following table details the company’s intangible asset balances by major asset class:
At September 30, 2015(Dollars in millions) Gross Carrying Accumulated Net CarryingIntangible asset class Amount Amortization AmountCapitalized software $ 1,329 $ (593) $ 736Client relationships 1,670 (886) 784Completed technology 2,431 (1,333) 1,098Patents/trademarks 291 (156) 134Other* 32 (9) 23Total $ 5,753 $ (2,977) $ 2,775
* Other intangibles are primarily acquired proprietary and non-proprietary business processes, methodologies and systems.
At December 31, 2014(Dollars in millions) Gross Carrying Accumulated Net CarryingIntangible asset class Amount Amortization AmountCapitalized software $ 1,375 $ (679) $ 696Client relationships 2,208 (1,271) 937Completed technology 2,831 (1,533) 1,298Patents/trademarks 374 (214) 161Other* 18 (6) 12Total $ 6,806 $ (3,702) $ 3,104
* Other intangibles are primarily acquired proprietary and non-proprietary business processes, methodologies and systems.
The net carrying amount of intangible assets decreased $328 million during the first nine months of 2015, primarily due to amortization, partially offset by intangible asset additions resulting from capitalized software and acquisitions. The aggregate intangible amortization expense was $290 million and $884 million for the third quarter and first nine months of 2015, respectively, versus $339 million and $1,018 million for the third quarter and first nine months of 2014, respectively. In addition, in the first nine months of 2015, the company retired $1,608 million of fully amortized intangible assets, impacting both the gross carrying amount and accumulated amortization by this amount.
The amortization expense for each of the five succeeding years relating to intangible assets currently recorded in the Consolidated Statement of Financial Position is estimated to be the following at September 30, 2015:
Capitalized Acquired(Dollars in millions) Software Intangibles Total2015 (for Q4) $ 122 $ 167 $ 2892016 369 625 9942017 200 518 7182018 45 358 4022019 — 231 231
The change in the goodwill balances by reportable segment, for the nine months ended September 30, 2015 and for the year ended December 31, 2014 are as follows:
ForeignCurrency
Purchase Translation(Dollars in millions) Balance Goodwill Price And Other BalanceSegment 01/01/15 Additions Adjustments Divestitures Adjustments** 9/30/15Global Business Services $ 4,555 $ — $ 0 $ (1) $ (187) $ 4,367Global Technology Services 3,530 62 0 — (86) 3,506Software 21,000 574 (1) (8) (608) 20,957Systems Hardware 1,472 — — — (27) 1,445Total $ 30,556 $ 637 $ (1) $ (9) $ (907) $ 30,275
** Primarily driven by foreign currency translation.
Notes to Consolidated Financial Statements – (continued)
41
ForeignCurrency
Purchase Translation(Dollars in millions) Balance Goodwill Price And Other BalanceSegment 01/01/14 Additions Adjustments Divestitures Adjustments** 12/31/14Global Business Services* $ 4,855 $ — $ 0 $ (52) $ (248) $ 4,555Global Technology Services* 3,608 11 21 (2) (108) 3,530Software 21,121 430 (17) (19) (516) 21,000Systems Hardware 1,601 — — (110) (19) 1,472Total $ 31,184 $ 442 $ 4 $ (183) $ (891) $ 30,556
* Reclassified to conform with 2015 presentation.** Primarily driven by foreign currency translation.
Purchase price adjustments recorded in the first nine months of 2015 and full year 2014 were related to acquisitions that were completed on or prior to December 31, 2014 or December 31, 2013, respectively, and were still subject to the measurement period that ends at the earlier of 12 months from the acquisition date or when information becomes available. There were no goodwill impairment losses recorded during the first nine months of 2015 or the full year of 2014 and the company has no accumulated impairment losses.
11. Borrowings: Short-Term Debt
At September 30, At December 31,(Dollars in millions) 2015 2014Commercial paper $ 1,600 $ 650Short-term loans 653 480Long-term debt – current maturities 5,286 4,601Total $ 7,538 $ 5,731 The weighted-average interest rate for commercial paper at September 30, 2015 and December 31, 2014 was 0.1 percent for both periods. The weighted-average interest rate for short-term loans was 5.1 percent and 4.0 percent at September 30, 2015 and December 31, 2014, respectively.
Notes to Consolidated Financial Statements – (continued)
42
Long-Term Debt
Pre-Swap Borrowing
Balance Balance
(Dollars in millions) Maturities 9/30/2015 12/31/2014U.S. dollar notes and debentures (average interest rate at September 30, 2015):1.41% 2015–2016 $ 5,274 $ 9,2543.91% 2017–2018 8,773 6,8352.24% 2019–2021 6,613 6,5551.88% 2022 1,000 1,0003.38% 2023 1,500 1,5003.63% 2024 2,000 2,0007.00% 2025 600 6006.22% 2027 469 4696.50% 2028 313 3135.88% 2032 600 6008.00% 2038 83 835.60% 2039 745 7454.00% 2042 1,107 1,1077.00% 2045 27 277.13% 2096 316 316
$ 29,420 $ 31,404Other currencies (average interest rate at September 30, 2015, in parentheses):
\
Euros (1.8%) 2015–2025 $ 5,033 $ 5,463Pound sterling (2.7%) 2017–2022 1,597 1,176Japanese yen (0.5%) 2017–2019 734 733Swiss francs (6.3%) 2020 10 162Canadian (2.2%) 2017 373 432Other (10.9%) 2015–2020 176 367
$ 37,343 $ 39,737Less: net unamortized discount 840 853Add: fair value adjustment* 904 792
$ 37,407 $ 39,675Less: current maturities 5,286 4,601Total $ 32,122 $ 35,073
* The portion of the company’s fixed-rate debt obligations that is hedged is reflected in the Consolidated Statement of Financial Position as an amount equal to the sum of the debt’s carrying value plus a fair value adjustment representing changes in the fair value of the hedged debt obligations attributable to movements in benchmark interest rates.
The company’s indenture governing its debt securities and its various credit facilities each contain significant covenants which obligate the company to promptly pay principal and interest, limit the aggregate amount of secured indebtedness and sale and leaseback transactions to 10 percent of the company’s consolidated net tangible assets, and restrict the company’s ability to merge or consolidate unless certain conditions are met. The credit facilities also include a covenant on the company’s consolidated net interest expense ratio, which cannot be less than 2.20 to 1.0, as well as a cross default provision with respect to other defaulted indebtedness of at least $500 million.
The company is in compliance with all of its significant debt covenants and provides periodic certifications to its lenders. The failure to comply with its debt covenants could constitute an event of default with respect to the debt to which such provisions apply. If certain events of default were to occur, the principal and interest on the debt to which such event of default applied would become immediately due and payable.
Pre-swap annual contractual maturities of long-term debt outstanding at September 30, 2015, are as follows:
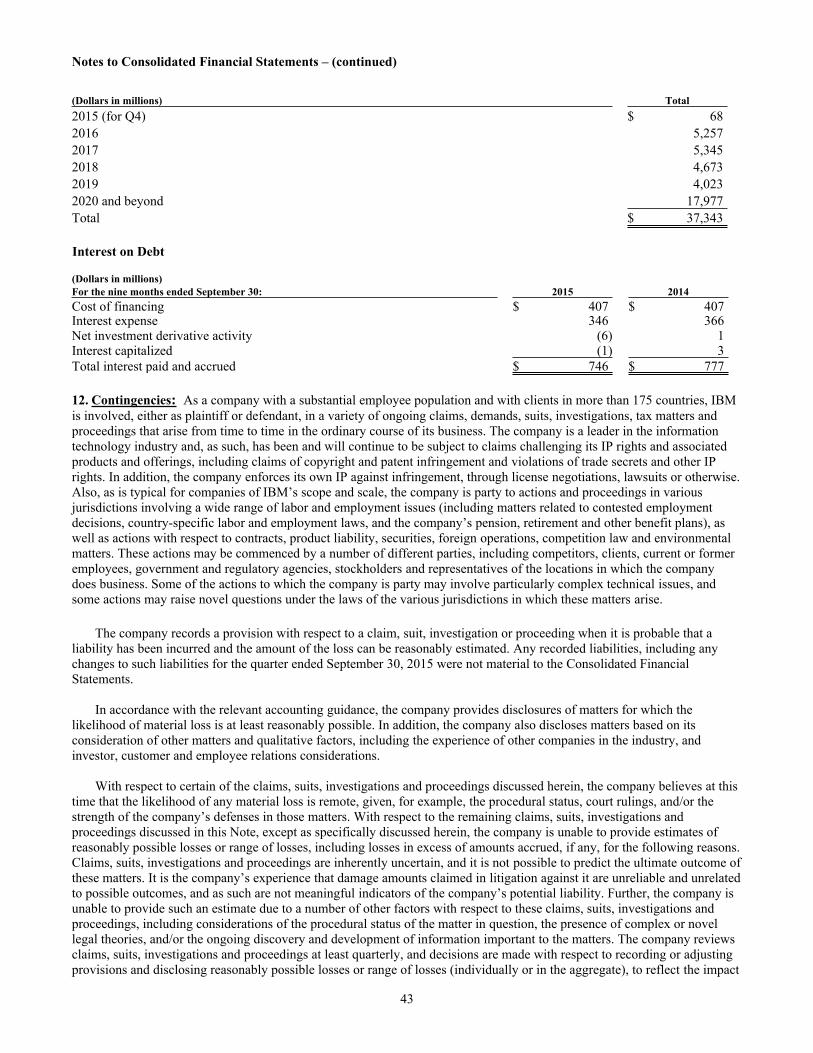
Notes to Consolidated Financial Statements – (continued)
43
(Dollars in millions) Total2015 (for Q4) $ 682016 5,2572017 5,3452018 4,6732019 4,0232020 and beyond 17,977Total $ 37,343 Interest on Debt
(Dollars in millions)For the nine months ended September 30: 2015 2014Cost of financing $ 407 $ 407Interest expense 346 366Net investment derivative activity (6) 1Interest capitalized (1) 3Total interest paid and accrued $ 746 $ 777
12. Contingencies: As a company with a substantial employee population and with clients in more than 175 countries, IBM is involved, either as plaintiff or defendant, in a variety of ongoing claims, demands, suits, investigations, tax matters and proceedings that arise from time to time in the ordinary course of its business. The company is a leader in the information technology industry and, as such, has been and will continue to be subject to claims challenging its IP rights and associated products and offerings, including claims of copyright and patent infringement and violations of trade secrets and other IP rights. In addition, the company enforces its own IP against infringement, through license negotiations, lawsuits or otherwise. Also, as is typical for companies of IBM’s scope and scale, the company is party to actions and proceedings in various jurisdictions involving a wide range of labor and employment issues (including matters related to contested employment decisions, country-specific labor and employment laws, and the company’s pension, retirement and other benefit plans), as well as actions with respect to contracts, product liability, securities, foreign operations, competition law and environmental matters. These actions may be commenced by a number of different parties, including competitors, clients, current or former employees, government and regulatory agencies, stockholders and representatives of the locations in which the company does business. Some of the actions to which the company is party may involve particularly complex technical issues, and some actions may raise novel questions under the laws of the various jurisdictions in which these matters arise. The company records a provision with respect to a claim, suit, investigation or proceeding when it is probable that a liability has been incurred and the amount of the loss can be reasonably estimated. Any recorded liabilities, including any changes to such liabilities for the quarter ended September 30, 2015 were not material to the Consolidated Financial Statements. In accordance with the relevant accounting guidance, the company provides disclosures of matters for which the likelihood of material loss is at least reasonably possible. In addition, the company also discloses matters based on its consideration of other matters and qualitative factors, including the experience of other companies in the industry, and investor, customer and employee relations considerations. With respect to certain of the claims, suits, investigations and proceedings discussed herein, the company believes at this time that the likelihood of any material loss is remote, given, for example, the procedural status, court rulings, and/or the strength of the company’s defenses in those matters. With respect to the remaining claims, suits, investigations and proceedings discussed in this Note, except as specifically discussed herein, the company is unable to provide estimates of reasonably possible losses or range of losses, including losses in excess of amounts accrued, if any, for the following reasons. Claims, suits, investigations and proceedings are inherently uncertain, and it is not possible to predict the ultimate outcome of these matters. It is the company’s experience that damage amounts claimed in litigation against it are unreliable and unrelated to possible outcomes, and as such are not meaningful indicators of the company’s potential liability. Further, the company is unable to provide such an estimate due to a number of other factors with respect to these claims, suits, investigations and proceedings, including considerations of the procedural status of the matter in question, the presence of complex or novel legal theories, and/or the ongoing discovery and development of information important to the matters. The company reviews claims, suits, investigations and proceedings at least quarterly, and decisions are made with respect to recording or adjusting provisions and disclosing reasonably possible losses or range of losses (individually or in the aggregate), to reflect the impact
Notes to Consolidated Financial Statements – (continued)
44
and status of settlement discussions, discovery, procedural and substantive rulings, reviews by counsel and other information pertinent to a particular matter. Whether any losses, damages or remedies finally determined in any claim, suit, investigation or proceeding could reasonably have a material effect on the company’s business, financial condition, results of operations or cash flows will depend on a number of variables, including: the timing and amount of such losses or damages; the structure and type of any such remedies; the significance of the impact any such losses, damages or remedies may have in the Consolidated Financial Statements; and the unique facts and circumstances of the particular matter that may give rise to additional factors. While the company will continue to defend itself vigorously, it is possible that the company’s business, financial condition, results of operations or cash flows could be affected in any particular period by the resolution of one or more of these matters. The following is a summary of the more significant legal matters involving the company. The company is a defendant in an action filed on March 6, 2003 in state court in Salt Lake City, Utah by the SCO Group (SCO v. IBM). The company removed the case to Federal Court in Utah. Plaintiff is an alleged successor in interest to some of AT&T’s UNIX IP rights, and alleges copyright infringement, unfair competition, interference with contract and breach of contract with regard to the company’s distribution of AIX and Dynix and contribution of code to Linux and the company has asserted counterclaims. On September 14, 2007, plaintiff filed for bankruptcy protection, and all proceedings in this case were stayed. The court in another suit, the SCO Group, Inc. v. Novell, Inc., held a trial in March 2010. The jury found that Novell is the owner of UNIX and UnixWare copyrights; the judge subsequently ruled that SCO is obligated to recognize Novell’s waiver of SCO’s claims against IBM and Sequent for breach of UNIX license agreements. On August 30, 2011, the Tenth Circuit Court of Appeals affirmed the district court’s ruling and denied SCO’s appeal of this matter. In June 2013, the Federal Court in Utah granted SCO’s motion to reopen the SCO v. IBM case, and proceedings have resumed in that case.
On May 13, 2010, IBM and the State of Indiana (acting on behalf of the Indiana Family and Social Services Administration) sued one another in a dispute over a 2006 contract regarding the modernization of social service program processing in Indiana. The State terminated the contract, claiming that IBM was in breach, and the State is seeking damages. IBM believes the State’s claims against it are without merit and is seeking payment of termination amounts specified in the contract. After six weeks of trial, on July 18, 2012, the Indiana Superior Court in Marion County rejected the State’s claims in their entirety and awarded IBM $52 million plus interest and costs. On February 13, 2014, the Indiana Court of Appeals reversed portions of the trial judge’s findings, found IBM in material breach, and ordered the case remanded to the trial judge to determine the State's damages, if any. The Indiana Court of Appeals also affirmed approximately $50 million of the trial court's award of damages to IBM. This matter remains pending in the Indiana courts. On April 16, 2014, Iusacell SA de C.V. (Iusacell) sued IBM, claiming that IBM made fraudulent misrepresentations that induced Iusacell to enter into an agreement with IBM Mexico. Iusacell claims damages for lost profits. Iusacell’s complaint relates to a contractual dispute in Mexico, which is the subject of a pending arbitration proceeding in Mexico initiated by IBM Mexico against Iusacell for breach of the underlying agreement. On November 14, 2014, the District Court in the Southern District of New York granted IBM's motion to stay Iusacell's action against the company pending the arbitration in Mexico between Iusacell and IBM Mexico.
IBM United Kingdom Limited (IBM UK) initiated legal proceedings in May 2010 before the High Court in London against the IBM UK Pensions Trust (the UK Trust) and two representative beneficiaries of the UK Trust membership. IBM UK is seeking a declaration that it acted lawfully both in notifying the Trustee of the UK Trust that it was closing its UK defined benefit plans to future accruals for most participants and in implementing the company’s new retirement policy. In April 2014, the High Court acknowledged that the changes made to its UK defined benefit plans were within IBM’s discretion, but ruled that IBM breached its implied duty of good faith both in implementing these changes and in the manner in which it consulted with employees. Proceedings to determine remedies were held in July 2014, and in February 2015 the High Court held that for IBM to make changes to accruals under the plan would require a new consultation of the participants, but other changes (including to early retirement policy) would not require such consultation. IBM UK has appealed both the breach and remedies judgments and a decision is not expected until at least 2016. If the appeal is unsuccessful, the Court’s rulings would require IBM to reverse the changes made to the UK defined benefit plans retroactive to their effective dates. This could result in an estimated non-operating one-time pre-tax charge of approximately $250 million, plus ongoing defined benefit related accruals. In addition, IBM UK is a defendant in approximately 290 individual actions brought since early 2010 by participants of the defined benefits plans who left IBM UK. These actions, which allege constructive dismissal and age discrimination, are pending before the Employment Tribunal in Southampton UK.
Notes to Consolidated Financial Statements – (continued)
45
On March 24, 2014, in a suit brought by local Works Councils, the Supreme Court of Spain held that IBM Spain’s Defined Contribution (DC) Plan implemented in 1993 based on the voluntary participation of its employees was null and void. The Supreme Court also held that current employees could reinstate their rights to a Defined Benefit (DB) Plan, although with an offset for DC contributions paid to date. The Court held that IBM Spain did not consult with the Works Councils in seeking to change the pension scheme, and recommended that IBM Spain and the Works Councils engage in discussions over how to carry out the offset. The Constitutional Court denied IBM Spain’s requested leave to appeal the decision. In March 2015, the National Audience Court ruled that the Works Council was not entitled to dictate the means by which IBM should carry out the offset of DC contributions, but also ruled that the Supreme Court's judgment could be executed without the need for individual lawsuits by employees, rejecting the position that the judgment was declaratory only. The National Audience Court also ruled that IBM should stop making DC contributions, and that the company should promptly reinstate the DB Plan. IBM Spain appealed that ruling and in May 2015, the National Audience Court dismissed the appeal. IBM continues to reexamine its business model as it reinstitutes an outdated pension plan that employees elected to forego 20 years ago, which benefits a limited subset of the overall population of employees in Spain. The Works Councils continue to challenge IBM’s implementation approach.
In March 2011, the company announced that it had agreed to settle a civil enforcement action with the Securities and Exchange Commission (SEC) relating to alleged violations of the Foreign Corrupt Practices Act of 1977 (FCPA). On July 25, 2013, the court approved that 2011 settlement and required that for a two-year period IBM make reports to the SEC and the court on certain matters, including those relating to compliance with the FCPA. The two-year period expired in July 2015. In early 2012, IBM notified the SEC of an investigation by the Polish Central Anti-Corruption Bureau involving allegations of illegal activity by a former IBM Poland employee in connection with sales to the Polish government. IBM is cooperating with the SEC and Polish authorities in this matter. In April 2013, IBM learned that the U.S. Department of Justice (DOJ) is also investigating allegations related to the Poland matter, as well as allegations relating to transactions in Argentina, Bangladesh and Ukraine. The DOJ is also seeking information regarding the company's global FCPA compliance program and its public sector business. The company is cooperating with the DOJ in this matter.
In March 2015, putative class action litigation was commenced in the United States District Court for the Southern District of New York related to the company's October 2014 announcement that it was divesting its global commercial semiconductor technology business. The company and three of its officers are named as defendants. Plaintiffs allege that defendants violated Sections 20(a) and 10(b) of the Securities Exchange Act of 1934 and Rule 10b-5 thereunder. In May 2015, a related putative class action was also commenced in the United States District Court for the Southern District of New York based on the same underlying facts, alleging violations of the Employee Retirement Income Security Act. The company, management’s Retirement Plans Committee, and three current or former IBM executives are named as defendants.
In August 2015, IBM learned that the SEC is conducting an investigation relating to revenue recognition with respect to the accounting treatment of certain transactions in the U.S., U.K. and Ireland. The company is cooperating with the SEC in this matter.
The company is a defendant in numerous actions filed after January 1, 2008 in the Supreme Court for the State of New York, county of Broome, on behalf of hundreds of plaintiffs. The complaints allege numerous and different causes of action, including for negligence and recklessness, private nuisance and trespass. Plaintiffs in these cases seek medical monitoring and claim damages in unspecified amounts for a variety of personal injuries and property damages allegedly arising out of the presence of groundwater contamination and vapor intrusion of groundwater contaminants into certain structures in which plaintiffs reside or resided, or conducted business, allegedly resulting from the release of chemicals into the environment by the company at its former manufacturing and development facility in Endicott. These complaints also seek punitive damages in an unspecified amount. The company has reached an agreement in principle to settle substantially all of these cases.
The company is party to, or otherwise involved in, proceedings brought by U.S. federal or state environmental agencies under the Comprehensive Environmental Response, Compensation and Liability Act (CERCLA), known as “Superfund,” or laws similar to CERCLA. Such statutes require potentially responsible parties to participate in remediation activities regardless of fault or ownership of sites. The company is also conducting environmental investigations, assessments or remediations at or in the vicinity of several current or former operating sites globally pursuant to permits, administrative orders or agreements with country, state or local environmental agencies, and is involved in lawsuits and claims concerning certain current or former operating sites. The company is also subject to ongoing tax examinations and governmental assessments in various jurisdictions. Along with many other U.S. companies doing business in Brazil, the company is involved in various challenges with Brazilian tax authorities regarding non-income tax assessments and non-income tax litigation matters. The total potential amount related to
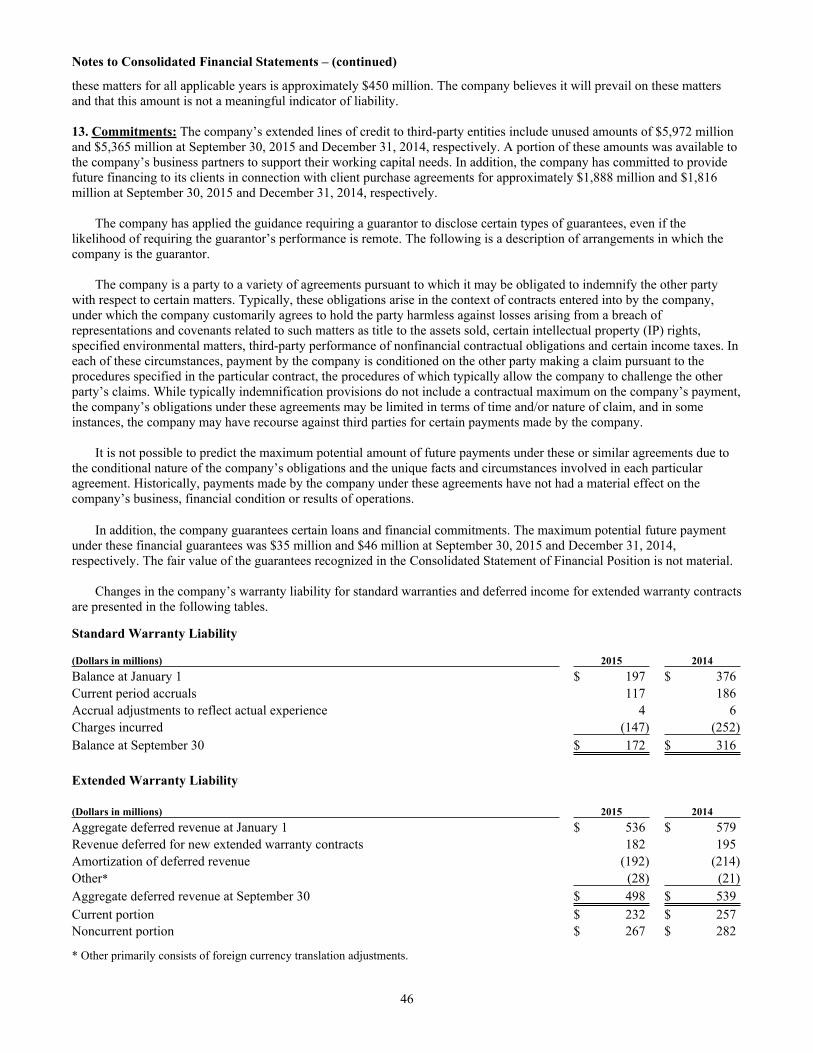
Notes to Consolidated Financial Statements – (continued)
46
these matters for all applicable years is approximately $450 million. The company believes it will prevail on these matters and that this amount is not a meaningful indicator of liability.
13. Commitments: The company’s extended lines of credit to third-party entities include unused amounts of $5,972 million and $5,365 million at September 30, 2015 and December 31, 2014, respectively. A portion of these amounts was available to the company’s business partners to support their working capital needs. In addition, the company has committed to provide future financing to its clients in connection with client purchase agreements for approximately $1,888 million and $1,816 million at September 30, 2015 and December 31, 2014, respectively.
The company has applied the guidance requiring a guarantor to disclose certain types of guarantees, even if the likelihood of requiring the guarantor’s performance is remote. The following is a description of arrangements in which the company is the guarantor.
The company is a party to a variety of agreements pursuant to which it may be obligated to indemnify the other party with respect to certain matters. Typically, these obligations arise in the context of contracts entered into by the company, under which the company customarily agrees to hold the party harmless against losses arising from a breach of representations and covenants related to such matters as title to the assets sold, certain intellectual property (IP) rights, specified environmental matters, third-party performance of nonfinancial contractual obligations and certain income taxes. In each of these circumstances, payment by the company is conditioned on the other party making a claim pursuant to the procedures specified in the particular contract, the procedures of which typically allow the company to challenge the other party’s claims. While typically indemnification provisions do not include a contractual maximum on the company’s payment, the company’s obligations under these agreements may be limited in terms of time and/or nature of claim, and in some instances, the company may have recourse against third parties for certain payments made by the company.
It is not possible to predict the maximum potential amount of future payments under these or similar agreements due to the conditional nature of the company’s obligations and the unique facts and circumstances involved in each particular agreement. Historically, payments made by the company under these agreements have not had a material effect on the company’s business, financial condition or results of operations.
In addition, the company guarantees certain loans and financial commitments. The maximum potential future payment under these financial guarantees was $35 million and $46 million at September 30, 2015 and December 31, 2014, respectively. The fair value of the guarantees recognized in the Consolidated Statement of Financial Position is not material.
Changes in the company’s warranty liability for standard warranties and deferred income for extended warranty contracts are presented in the following tables.
Standard Warranty Liability
(Dollars in millions) 2015 2014Balance at January 1 $ 197 $ 376Current period accruals 117 186Accrual adjustments to reflect actual experience 4 6Charges incurred (147) (252)Balance at September 30 $ 172 $ 316
Extended Warranty Liability
(Dollars in millions) 2015 2014Aggregate deferred revenue at January 1 $ 536 $ 579Revenue deferred for new extended warranty contracts 182 195Amortization of deferred revenue (192) (214)Other* (28) (21)Aggregate deferred revenue at September 30 $ 498 $ 539Current portion $ 232 $ 257Noncurrent portion $ 267 $ 282
* Other primarily consists of foreign currency translation adjustments.

Notes to Consolidated Financial Statements – (continued)
47
14. Subsequent Events: On October 27, 2015, the company announced that the Board of Directors approved a quarterly dividend of $1.30 per common share. The dividend is payable December 10, 2015 to shareholders of record on November 10, 2015.
On October 27, 2015, the company announced that the Board of Directors authorized $4.0 billion in additional funds for use in the company’s stock repurchase program.
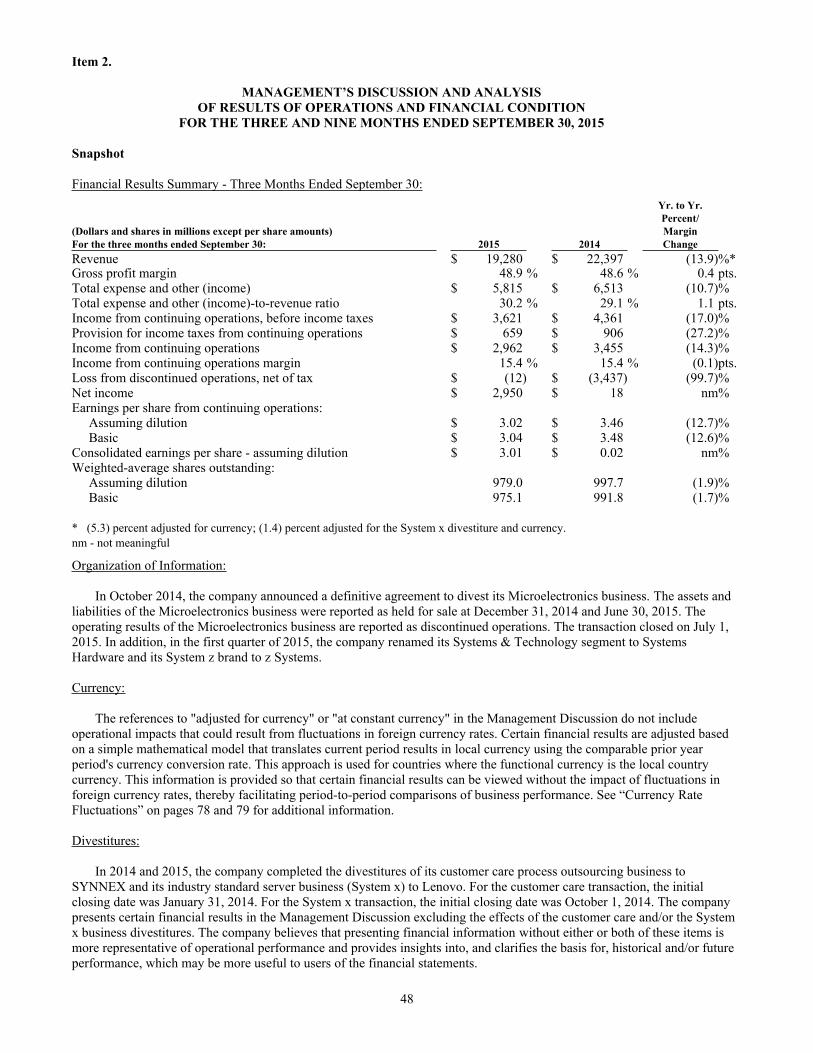
Item 2.
MANAGEMENT’S DISCUSSION AND ANALYSISOF RESULTS OF OPERATIONS AND FINANCIAL CONDITION
FOR THE THREE AND NINE MONTHS ENDED SEPTEMBER 30, 2015
Snapshot
Financial Results Summary - Three Months Ended September 30:
48
Yr. to Yr.Percent/
(Dollars and shares in millions except per share amounts) MarginFor the three months ended September 30: 2015 2014 ChangeRevenue $ 19,280 $ 22,397 (13.9)%*Gross profit margin 48.9 % 48.6 % 0.4 pts.Total expense and other (income) $ 5,815 $ 6,513 (10.7)%Total expense and other (income)-to-revenue ratio 30.2 % 29.1 % 1.1 pts.Income from continuing operations, before income taxes $ 3,621 $ 4,361 (17.0)%Provision for income taxes from continuing operations $ 659 $ 906 (27.2)%Income from continuing operations $ 2,962 $ 3,455 (14.3)%Income from continuing operations margin 15.4 % 15.4 % (0.1)pts.Loss from discontinued operations, net of tax $ (12) $ (3,437) (99.7)%Net income $ 2,950 $ 18 nm%Earnings per share from continuing operations:
Assuming dilution $ 3.02 $ 3.46 (12.7)%Basic $ 3.04 $ 3.48 (12.6)%
Consolidated earnings per share - assuming dilution $ 3.01 $ 0.02 nm%Weighted-average shares outstanding:
Assuming dilution 979.0 997.7 (1.9)%Basic 975.1 991.8 (1.7)%
* (5.3) percent adjusted for currency; (1.4) percent adjusted for the System x divestiture and currency.nm - not meaningful
Organization of Information:
In October 2014, the company announced a definitive agreement to divest its Microelectronics business. The assets and liabilities of the Microelectronics business were reported as held for sale at December 31, 2014 and June 30, 2015. The operating results of the Microelectronics business are reported as discontinued operations. The transaction closed on July 1, 2015. In addition, in the first quarter of 2015, the company renamed its Systems & Technology segment to Systems Hardware and its System z brand to z Systems.
Currency:
The references to "adjusted for currency" or "at constant currency" in the Management Discussion do not include operational impacts that could result from fluctuations in foreign currency rates. Certain financial results are adjusted based on a simple mathematical model that translates current period results in local currency using the comparable prior year period's currency conversion rate. This approach is used for countries where the functional currency is the local country currency. This information is provided so that certain financial results can be viewed without the impact of fluctuations in foreign currency rates, thereby facilitating period-to-period comparisons of business performance. See “Currency Rate Fluctuations” on pages 78 and 79 for additional information. Divestitures:
In 2014 and 2015, the company completed the divestitures of its customer care process outsourcing business to SYNNEX and its industry standard server business (System x) to Lenovo. For the customer care transaction, the initial closing date was January 31, 2014. For the System x transaction, the initial closing date was October 1, 2014. The company presents certain financial results in the Management Discussion excluding the effects of the customer care and/or the System x business divestitures. The company believes that presenting financial information without either or both of these items is more representative of operational performance and provides insights into, and clarifies the basis for, historical and/or future performance, which may be more useful to users of the financial statements.
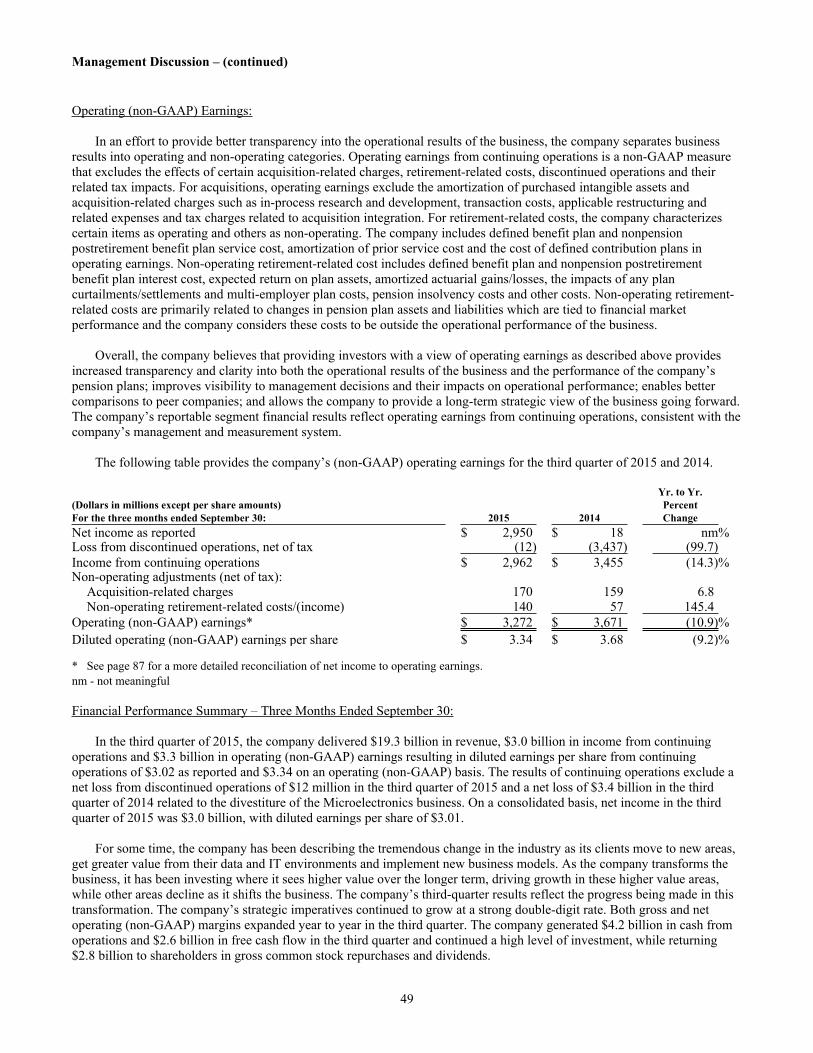
Management Discussion – (continued)
49
Operating (non-GAAP) Earnings:
In an effort to provide better transparency into the operational results of the business, the company separates business results into operating and non-operating categories. Operating earnings from continuing operations is a non-GAAP measure that excludes the effects of certain acquisition-related charges, retirement-related costs, discontinued operations and their related tax impacts. For acquisitions, operating earnings exclude the amortization of purchased intangible assets and acquisition-related charges such as in-process research and development, transaction costs, applicable restructuring and related expenses and tax charges related to acquisition integration. For retirement-related costs, the company characterizes certain items as operating and others as non-operating. The company includes defined benefit plan and nonpension postretirement benefit plan service cost, amortization of prior service cost and the cost of defined contribution plans in operating earnings. Non-operating retirement-related cost includes defined benefit plan and nonpension postretirement benefit plan interest cost, expected return on plan assets, amortized actuarial gains/losses, the impacts of any plan curtailments/settlements and multi-employer plan costs, pension insolvency costs and other costs. Non-operating retirement-related costs are primarily related to changes in pension plan assets and liabilities which are tied to financial market performance and the company considers these costs to be outside the operational performance of the business.
Overall, the company believes that providing investors with a view of operating earnings as described above provides increased transparency and clarity into both the operational results of the business and the performance of the company’s pension plans; improves visibility to management decisions and their impacts on operational performance; enables better comparisons to peer companies; and allows the company to provide a long-term strategic view of the business going forward. The company’s reportable segment financial results reflect operating earnings from continuing operations, consistent with the company’s management and measurement system.
The following table provides the company’s (non-GAAP) operating earnings for the third quarter of 2015 and 2014.
Yr. to Yr.(Dollars in millions except per share amounts) PercentFor the three months ended September 30: 2015 2014 ChangeNet income as reported $ 2,950 $ 18 nm%Loss from discontinued operations, net of tax (12) (3,437) (99.7)Income from continuing operations $ 2,962 $ 3,455 (14.3)%Non-operating adjustments (net of tax):
Acquisition-related charges 170 159 6.8Non-operating retirement-related costs/(income) 140 57 145.4
Operating (non-GAAP) earnings* $ 3,272 $ 3,671 (10.9)%Diluted operating (non-GAAP) earnings per share $ 3.34 $ 3.68 (9.2)%
* See page 87 for a more detailed reconciliation of net income to operating earnings.nm - not meaningful
Financial Performance Summary – Three Months Ended September 30:
In the third quarter of 2015, the company delivered $19.3 billion in revenue, $3.0 billion in income from continuing operations and $3.3 billion in operating (non-GAAP) earnings resulting in diluted earnings per share from continuing operations of $3.02 as reported and $3.34 on an operating (non-GAAP) basis. The results of continuing operations exclude a net loss from discontinued operations of $12 million in the third quarter of 2015 and a net loss of $3.4 billion in the third quarter of 2014 related to the divestiture of the Microelectronics business. On a consolidated basis, net income in the third quarter of 2015 was $3.0 billion, with diluted earnings per share of $3.01.
For some time, the company has been describing the tremendous change in the industry as its clients move to new areas, get greater value from their data and IT environments and implement new business models. As the company transforms the business, it has been investing where it sees higher value over the longer term, driving growth in these higher value areas, while other areas decline as it shifts the business. The company’s third-quarter results reflect the progress being made in this transformation. The company’s strategic imperatives continued to grow at a strong double-digit rate. Both gross and net operating (non-GAAP) margins expanded year to year in the third quarter. The company generated $4.2 billion in cash from operations and $2.6 billion in free cash flow in the third quarter and continued a high level of investment, while returning $2.8 billion to shareholders in gross common stock repurchases and dividends.
Management Discussion – (continued)
50
Total consolidated revenue decreased 13.9 percent as reported, but 1 percent year to year adjusted for the System x divestiture and currency in the third quarter of 2015. The year-to-year revenue performance included the impact of currency (9 points or $1.9 billion) and the divested System x business (4 points). Revenue in the quarter fell short of the company’s own expectations. The Global Business Services (GBS) transformation is taking longer as the market shifts away from some of the more traditional application areas, and the Storage disk business was weaker as more of the demand moves to the company’s flash products. In addition, while Software performance in the third quarter was consistent with performance in the first half of 2015, there was some weakness in transactions at the end of the quarter.
Revenue in the strategic imperatives‒cloud, analytics, social, mobile and security‒grew 17 percent year to year as reported and 27 percent adjusted for currency and the System x divestiture in the third quarter. Cloud revenue was up more than 35 percent as reported and over 50 percent year to year adjusted for currency and the divestiture. For the 12 months ending September 30, 2015, cloud revenue was $9.4 billion and the company exited the quarter with an annual-as-a-Service run rate of $4.5 billion compared to $3.1 billion in the third quarter of 2014. Business analytics revenue grew 4 percent as reported and 13 percent adjusted for currency. Revenue in the areas of engagement–mobile, social and security– nearly doubled year to year in the third quarter on both an as reported and adjusted for currency basis. Security revenue increased 11 percent as reported (18 percent adjusted for currency), mobile revenue quadrupled and social revenue increased 24 percent (more than 30 percent adjusted for currency). From a segment perspective, the company made additional progress in its transformation and shift to the strategic imperatives. For example, Global Technology Services (GTS) is bringing more cloud, mobile and security to infrastructure services for new clients and to assist existing clients move to the future. GTS performance in the third quarter reflects growth in revenue, adjusted for currency and the System x divestiture, and growth in the backlog at constant currency. Additionally, in the Systems Hardware business, the company has repositioned the portfolio and delivered innovation as these systems run the most contemporary workloads. Throughout 2015, the Systems Hardware business has had strong growth in z Systems and continued success in Power Systems.
The company is continuing to invest and add capabilities to accelerate the shift to higher value and to advance the transformation of the business. In the third quarter, the company committed additional capital, including:
The acquisition of Merge Healthcare to give Watson the ability to “see” millions of medical images, The acquisitions of Cleversafe, Compose, StrongLoop and Meteorix, each bolstering the company’s cloud capabilities, and The launch of the industry’s first consulting practice dedicated to cognitive business.
The company’s approach is to integrate acquired content with its own organic capabilities, and leverage partnerships and a broader ecosystem to build new high value platforms such as Watson, SoftLayer, Bluemix and OpenPOWER.
In the third quarter, Global Services revenue declined 11.2 percent as reported and 1 percent adjusted for currency (10 points) and the divestiture. GTS declined 10.2 percent as reported, but increased 1 percent adjusted for currency (11 points) and the divestiture (1 point). On an adjusted basis, GTS revenue has increased in six of the last seven quarters. GBS revenue decreased 13.1 percent as reported and 5 percent adjusted for currency. GBS has been shifting resources and investing to drive growth in the strategic imperatives, however weakness in consulting, specifically around enterprise applications, has impacted overall performance. Software revenue declined 10.0 percent (3 percent adjusted for currency) which was consistent with performance over the past year. Growth across the solution areas of security, analytics and social were more than offset by a continuing headwind from operating systems and a decline in transactional revenue. Systems Hardware revenue decreased 38.7 percent as reported and 2 percent adjusted for the divested System x business (34 points) and currency (3 points). Adjusted for currency, there was double-digit growth in z Systems, and growth in Power Systems capturing both the UNIX and Linux opportunity. Storage revenue decreased 18.6 percent (14 percent adjusted for currency) year to year in a challenging market.
From a geographic perspective, revenue in the major markets declined 11.2 percent as reported and 1 percent year to year adjusted for currency (8 points) and the divestiture (3 points). On an adjusted basis, a revenue decline in the U.S. was partially offset by growth in Japan and Germany with sequential revenue performance improvement in the UK, France and Canada. Growth markets revenue decreased 22.4 percent as reported and 3 percent adjusted for currency (11 points) and the divested business (8 points) with growth in Latin America and Middle East and Africa more than offset by declines in Asia Pacific on an adjusted basis. On that basis, this represented a 2 point sequential improvement from second-quarter 2015 year-to-year performance. Revenue in the BRIC (Brazil, Russia, India and China) countries declined 30.1 percent as reported and 7 percent adjusted for currency (12 points) and the divestiture (11 points). On an adjusted basis, revenue performance in each of the four countries improved year to year compared to the second quarter of 2015.
Management Discussion – (continued)
51
The consolidated gross profit margin of 48.9 percent increased 0.4 points versus the prior year. The operating (non-
GAAP) gross margin of 50.0 percent increased 0.8 points compared to the prior year driven by a shift to higher value, primarily through portfolio actions and the relative strength of z Systems, partially offset by investments and contract mix in the Global Services business.
Total expense and other (income) decreased 10.7 percent in the third quarter of 2015 versus the prior year. Total
operating (non-GAAP) expense and other (income) decreased 11.5 percent compared to the prior year. The year-to-year drivers were approximately:
Total OperatingConsolidated (non-GAAP)
Currency* (9) points (9) pointsSystem x divestiture (2) points (2) pointsWorkforce rebalancing 2 points 2 points
* Reflects impacts of translation and hedging programs.
The reduction in expense was driven primarily by currency and the fact that the divested System x business is no longer in the spending base. These benefits were partially offset by a higher level of workforce rebalancing charges ($0.1 billion). The reduction in operating (non-GAAP) expense was driven by the same factors. The company is continuing to shift spending within its large operational expense base; driving productivity and efficiency in some areas, while increasing investment in support of the strategic imperatives. Pre-tax income from continuing operations of $3.6 billion decreased 17.0 percent year to year. The continuing operations effective tax rate for the third quarter of 2015 was 18.2 percent, a decrease of 2.6 points versus the prior year. Income from continuing operations of $3.0 billion decreased 14.3 percent and the net income margin was 15.4 percent, essentially flat versus the third quarter of 2014. Losses from discontinued operations, net of tax, were $12 million in the third quarter of 2015 and $3.4 billion in the third quarter of 2014. Net income of $3.0 billion increased $2.9 billion year to year. Operating (non-GAAP) pre-tax income from continuing operations of $4.0 billion decreased 13.9 percent year to year. Operating (non-GAAP) income from continuing operations of $3.3 billion decreased 10.9 percent and the operating (non-GAAP) income margin from continuing operations of 17.0 percent increased 0.6 points. The operating (non-GAAP) effective tax rate from continuing operations in the third quarter of 2015 was 18.0 percent versus 20.8 percent in the third quarter of 2014. The lower tax rates year to year reflect discrete period benefits in the third quarter of 2015.
Diluted earnings per share from continuing operations of $3.02 decreased 12.7 percent year to year. In the third quarter
of 2015, the company repurchased 9.8 million shares of its common stock. Operating (non-GAAP) diluted earnings per share of $3.34 decreased 9.2 percent versus the prior year. Diluted earnings per share from discontinued operations was ($0.01) in the third quarter of 2015 compared to ($3.44) in the third quarter of 2014.
The company generated $4.2 billion in cash flow provided by operating activities, an increase of $0.3 billion when compared to the third quarter of 2014, driven primarily by lower cash tax payments, partially offset by operational performance. Net cash used in investing activities of $1.3 billion was $0.5 billion higher than the prior year, primarily due to the net payment made in the third quarter of 2015 associated with the Microelectronics divestiture. Net cash used in financing activities of $1.8 billion decreased $1.0 billion compared to the third quarter of 2014, driven primarily by higher net cash proceeds from total debt. The third quarter results are a reflection of the transformation in the company’s business as it moves to areas with longer-term high value in enterprise IT. This is a longer term strategy. The company is creating new platforms and building ecosystems, much of this is an as-a-Services model. The company continues to invest at a higher level as it shifts its spending to the strategic imperatives. In October 2015, the company disclosed that it expects to deliver GAAP earnings per diluted share from continuing operations in the range of $13.25 to $14.25, and it expects to deliver operating (non-GAAP) earnings between $14.75 and $15.75 per diluted share from continuing operations for 2015. The company also stated that it expects free cash flow in 2015 to be relatively flat year to year. See the Looking Forward section on pages 77 and 78 for additional information on the company’s expectations.
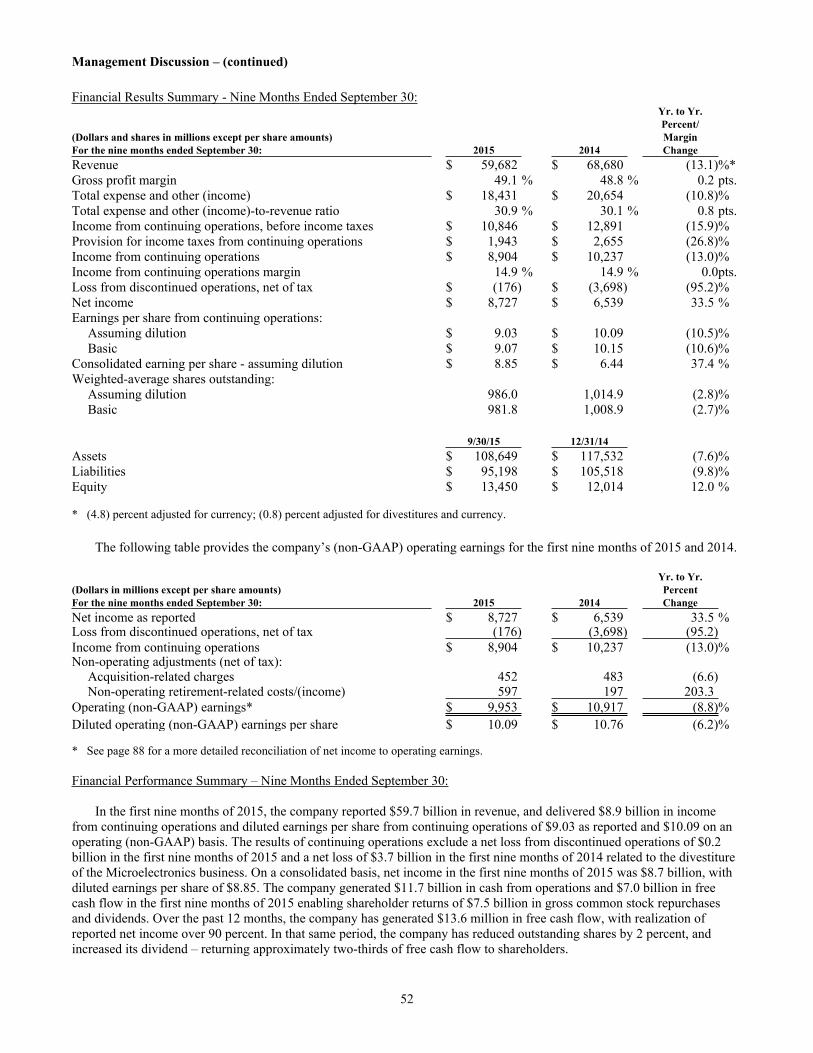
Management Discussion – (continued)
52
Financial Results Summary - Nine Months Ended September 30:Yr. to Yr.Percent/
(Dollars and shares in millions except per share amounts) MarginFor the nine months ended September 30: 2015 2014 ChangeRevenue $ 59,682 $ 68,680 (13.1)%*Gross profit margin 49.1 % 48.8 % 0.2 pts.Total expense and other (income) $ 18,431 $ 20,654 (10.8)%Total expense and other (income)-to-revenue ratio 30.9 % 30.1 % 0.8 pts.Income from continuing operations, before income taxes $ 10,846 $ 12,891 (15.9)%Provision for income taxes from continuing operations $ 1,943 $ 2,655 (26.8)%Income from continuing operations $ 8,904 $ 10,237 (13.0)%Income from continuing operations margin 14.9 % 14.9 % 0.0pts.Loss from discontinued operations, net of tax $ (176) $ (3,698) (95.2)%Net income $ 8,727 $ 6,539 33.5 %Earnings per share from continuing operations:
Assuming dilution $ 9.03 $ 10.09 (10.5)%Basic $ 9.07 $ 10.15 (10.6)%
Consolidated earning per share - assuming dilution $ 8.85 $ 6.44 37.4 %Weighted-average shares outstanding:
Assuming dilution 986.0 1,014.9 (2.8)%Basic 981.8 1,008.9 (2.7)%
9/30/15 12/31/14Assets $ 108,649 $ 117,532 (7.6)%Liabilities $ 95,198 $ 105,518 (9.8)%Equity $ 13,450 $ 12,014 12.0 %
* (4.8) percent adjusted for currency; (0.8) percent adjusted for divestitures and currency.
The following table provides the company’s (non-GAAP) operating earnings for the first nine months of 2015 and 2014.
Yr. to Yr.(Dollars in millions except per share amounts) PercentFor the nine months ended September 30: 2015 2014 ChangeNet income as reported $ 8,727 $ 6,539 33.5 %Loss from discontinued operations, net of tax (176) (3,698) (95.2)Income from continuing operations $ 8,904 $ 10,237 (13.0)%Non-operating adjustments (net of tax):
Acquisition-related charges 452 483 (6.6)Non-operating retirement-related costs/(income) 597 197 203.3
Operating (non-GAAP) earnings* $ 9,953 $ 10,917 (8.8)%Diluted operating (non-GAAP) earnings per share $ 10.09 $ 10.76 (6.2)%
* See page 88 for a more detailed reconciliation of net income to operating earnings.
Financial Performance Summary – Nine Months Ended September 30:
In the first nine months of 2015, the company reported $59.7 billion in revenue, and delivered $8.9 billion in income from continuing operations and diluted earnings per share from continuing operations of $9.03 as reported and $10.09 on an operating (non-GAAP) basis. The results of continuing operations exclude a net loss from discontinued operations of $0.2 billion in the first nine months of 2015 and a net loss of $3.7 billion in the first nine months of 2014 related to the divestiture of the Microelectronics business. On a consolidated basis, net income in the first nine months of 2015 was $8.7 billion, with diluted earnings per share of $8.85. The company generated $11.7 billion in cash from operations and $7.0 billion in free cash flow in the first nine months of 2015 enabling shareholder returns of $7.5 billion in gross common stock repurchases and dividends. Over the past 12 months, the company has generated $13.6 million in free cash flow, with realization of reported net income over 90 percent. In that same period, the company has reduced outstanding shares by 2 percent, and increased its dividend – returning approximately two-thirds of free cash flow to shareholders.
Management Discussion – (continued)
53
The company continues to transform the business as it moves to where the company sees the longer-term high value in enterprise IT. In the first nine months of 2015, the company has expanded operational (non-GAAP) margins on a relatively stable revenue base, adjusted for currency and divestitures, while going through a transformation and reinventing the business. The company has maintained high levels of investment in research and development, capital expenditures and acquisitions as it shifts spending to the strategic imperatives. The investments have provided returns as evidenced by the strong revenue growth in the strategic imperatives. At the same time, the core business is declining – in a declining market – as the company delivers productivity to its clients for reinvestment in the new areas.
Total consolidated revenue decreased 13.1 percent as reported and 1 percent year to year adjusted for divestitures and currency in the first nine months of 2015. Currency had an 8 point, or $5.7 billion impact on reported revenue in the nine month period. Additionally, revenue was impacted by 4 points in the first nine months of 2015 from divested businesses. Combined, the impact of currency and divested businesses reduced the reported revenue growth by 12 points.
In the first nine months of 2015, strategic imperatives revenue grew 20 percent year to year as reported, and more than 30 percent adjusted for currency and divestitures. Cloud revenue was up over 45 percent as reported and over 65 percent year to year adjusted for currency and divestitures. The company had strong year-to-year performance in both its private foundations and as-a-Service offerings. Business analytics revenue increased 9 percent as reported and 19 percent adjusted for currency. In the area of engagement–security, social, mobile–revenue nearly doubled compared to the first nine months of 2014 at constant currency. Security revenue increased 6 percent as reported (12 percent adjusted for currency), mobile revenue quadrupled and social revenue increased 32 percent as reported (approximately 40 percent adjusted for currency).
From a segment perspective, Global Services revenue declined 11.3 percent as reported and 1 percent adjusted for currency (10 points) and divestitures. GTS revenue declined 10.5 percent as reported, but was essentially flat adjusted for currency (10 points) and divestitures (1 point). GBS revenue decreased 12.7 percent as reported and 4 percent adjusted for currency (9 points) and divestitures. Software revenue declined 9.5 percent and 3 percent adjusted for currency. Key branded middleware decreased 6.5 percent as reported, but was essentially flat year to year at constant currency. Systems Hardware revenue decreased 31.4 percent as reported, but increased 10 percent adjusted for the divested System x business (37 points) and currency (4 points). From a geographic perspective, revenue in the major markets declined 11.0 percent as reported, but was flat year to year adjusted for currency (8 points) and divestitures (3 points) with growth in Japan, Germany and the UK on an adjusted basis. Growth markets revenue decreased 20.1 percent as reported and 3 percent adjusted for divestitures (9 points) and currency (9 points) compared to the first nine months of 2014. Performance was driven by the BRIC countries, down 29.1 percent as reported and 10 percent adjusted for divestitures (11 points) and currency (8 points).
The consolidated gross margin of 49.1 percent increased 0.2 points year to year. The operating (non-GAAP) gross margin of 50.1 percent increased 0.6 points versus the prior year primarily driven by the shift to higher value through both portfolio actions and the relative strength of z Systems, partially offset by margin declines in Global Services.
Total expense and other (income) decreased 10.8 percent in the first nine months of 2015 compared to the prior year. Total operating (non-GAAP) expense and other (income) decreased 12.5 percent compared to the first nine months of 2014. The key year-to-year drivers were:
Total OperatingConsolidated (non-GAAP)
Currency* (10) points (9) pointsSystem x divestiture (2) points (2) pointsDivestiture gains 1 point 1 pointWorkforce rebalancing (1) point (1) point
* Reflects impacts of translation and hedging programs.
The reduction in expense was driven primarily by currency impacts, a lower level of workforce rebalancing charges ($0.3 billion) and the impact of the divested System x business. These benefits were partially offset by the impact of lower divestiture gains ($0.3 billion) year to year and additional pension obligations related to litigation in Spain ($0.2 billion). The reduction in operating (non-GAAP) expense was driven by the same factors, excluding the Spain pension impact which was not reflected in operating (non-GAAP) expense. The company is continuing to shift resources and spending to strategic areas with the most opportunity. The company is on track to shift $4 billion of spending across expense, cost and capital expenditures, to the strategic imperatives.
Management Discussion – (continued)
54
Pre-tax income from continuing operations decreased 15.9 percent and the pre-tax margin was 18.2 percent, a decrease of 0.6 points versus the first nine months of 2014. The continuing operations effective tax rate for the first nine months of 2015 was 17.9 percent, a decrease of 2.7 points versus the prior year. Income from continuing operations of $8.9 billion decreased 13.0 percent and the net income margin was 14.9 percent, flat compared to the first nine months of 2014. Losses from discontinued operations, net of tax, were $0.2 billion in the first nine months of 2015 versus $3.7 billion in the first nine months of 2014. Net income of $8.7 billion increased 33.5 percent year to year. Operating (non-GAAP) pre-tax income from continuing operations decreased 11.4 percent year to year and the operating (non-GAAP) pre-tax margin from continuing operations improved 0.4 points to 20.4 percent. Operating (non-GAAP) income from continuing operations of $10.0 billion decreased 8.8 percent and the operating (non-GAAP) income margin from continuing operations of 16.7 percent increased 0.8 points. The operating (non-GAAP) effective tax rate from continuing operations in the first nine months of 2015 was 18.3 percent versus 20.6 percent in the first nine months of 2014. The tax rates in the first nine months of 2015 reflected a benefit from certain discrete items. Diluted earnings per share from continuing operations of $9.03 decreased 10.5 percent year to year. In the first nine months of 2015, the company repurchased 24.3 million shares of its common stock. Operating (non-GAAP) diluted earnings per share of $10.09 decreased 6.2 percent versus the prior year. Diluted earnings per share from discontinued operations was ($0.18) in the first nine months of 2015 compared to ($3.65) in the same period of 2014. At September 30, 2015, the company continued to have the financial flexibility to support the business over the long term. Cash and marketable securities at quarter end were $9.6 billion, an increase of $1.1 billion from December 31, 2014. Key drivers in the balance sheet were:
Total assets decreased $8.9 billion ($3.8 billion adjusted for currency) from December 31, 2014 driven by: Decreases in total receivables ($8.3 billion), deferred taxes ($1.5 billion) and prepaid expenses and sundry assets
($0.8 billion); partially offset by Increased prepaid pension assets ($1.9 billion) and increased cash ($1.0 billion).
Total liabilities decreased $10.3 billion ($7.0 billion adjusted for currency) from December 31, 2014 driven by:
Decreases in other liabilities ($2.3 billion), taxes ($2.2 billion), accounts payable ($1.7 billion), deferred income ($1.5
billion), retirement-related liabilities ($1.2 billion), and total debt ($1.1 billion).
Total equity of $13.5 billion increased $1.4 billion from December 31, 2014 as a result of:
Higher retained earnings ($5.1 billion) and higher common stock ($0.6 billion); partially offset by Increased treasury stock ($4.0 billion) and increased accumulated other comprehensive losses ($0.3 billion).
The company generated $11.7 billion in cash flow provided by operating activities, an increase of $0.9 billion compared to the first nine months of 2014, driven primarily by lower income tax payments, partially offset by operational performance. Net cash used in investing activities of $2.7 billion was $0.9 billion higher than the prior year, primarily driven by an increase in net cash used related to acquisitions and divestitures. Net cash used in financing activities of $7.8 billion decreased $1.9 billion compared to the first nine months of 2014, driven primarily by a decrease in cash used for gross common stock repurchases ($9.7 billion), partially offset by lower net debt issuances ($7.0 billion).
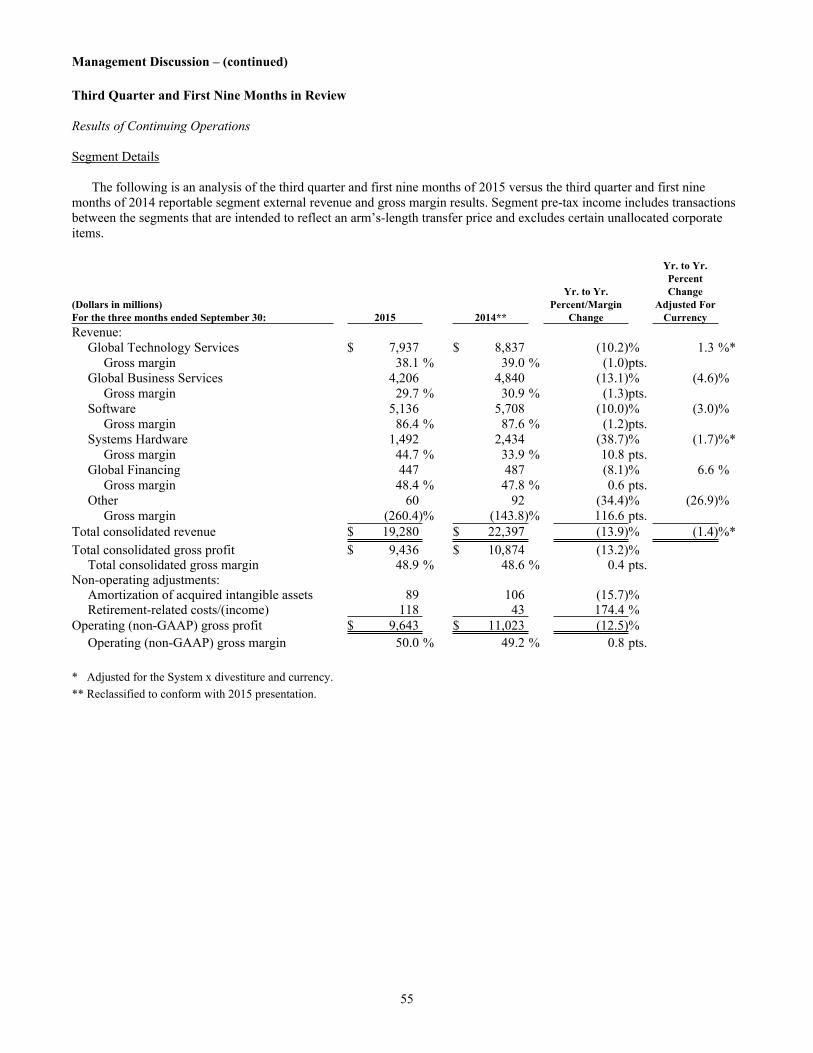
Management Discussion – (continued)
55
Third Quarter and First Nine Months in Review
Results of Continuing Operations
Segment Details The following is an analysis of the third quarter and first nine months of 2015 versus the third quarter and first nine months of 2014 reportable segment external revenue and gross margin results. Segment pre-tax income includes transactions between the segments that are intended to reflect an arm’s-length transfer price and excludes certain unallocated corporate items.
Yr. to Yr.Percent
Yr. to Yr. Change(Dollars in millions) Percent/Margin Adjusted ForFor the three months ended September 30: 2015 2014** Change CurrencyRevenue:
Global Technology Services $ 7,937 $ 8,837 (10.2)% 1.3 %*Gross margin 38.1 % 39.0 % (1.0)pts.
Global Business Services 4,206 4,840 (13.1)% (4.6)%Gross margin 29.7 % 30.9 % (1.3)pts.
Software 5,136 5,708 (10.0)% (3.0)%Gross margin 86.4 % 87.6 % (1.2)pts.
Systems Hardware 1,492 2,434 (38.7)% (1.7)%*Gross margin 44.7 % 33.9 % 10.8 pts.
Global Financing 447 487 (8.1)% 6.6 %Gross margin 48.4 % 47.8 % 0.6 pts.
Other 60 92 (34.4)% (26.9)%Gross margin (260.4)% (143.8)% 116.6 pts.
Total consolidated revenue $ 19,280 $ 22,397 (13.9)% (1.4)%*Total consolidated gross profit $ 9,436 $ 10,874 (13.2)%
Total consolidated gross margin 48.9 % 48.6 % 0.4 pts.Non-operating adjustments:
Amortization of acquired intangible assets 89 106 (15.7)%Retirement-related costs/(income) 118 43 174.4 %
Operating (non-GAAP) gross profit $ 9,643 $ 11,023 (12.5)%Operating (non-GAAP) gross margin 50.0 % 49.2 % 0.8 pts.
* Adjusted for the System x divestiture and currency. ** Reclassified to conform with 2015 presentation.
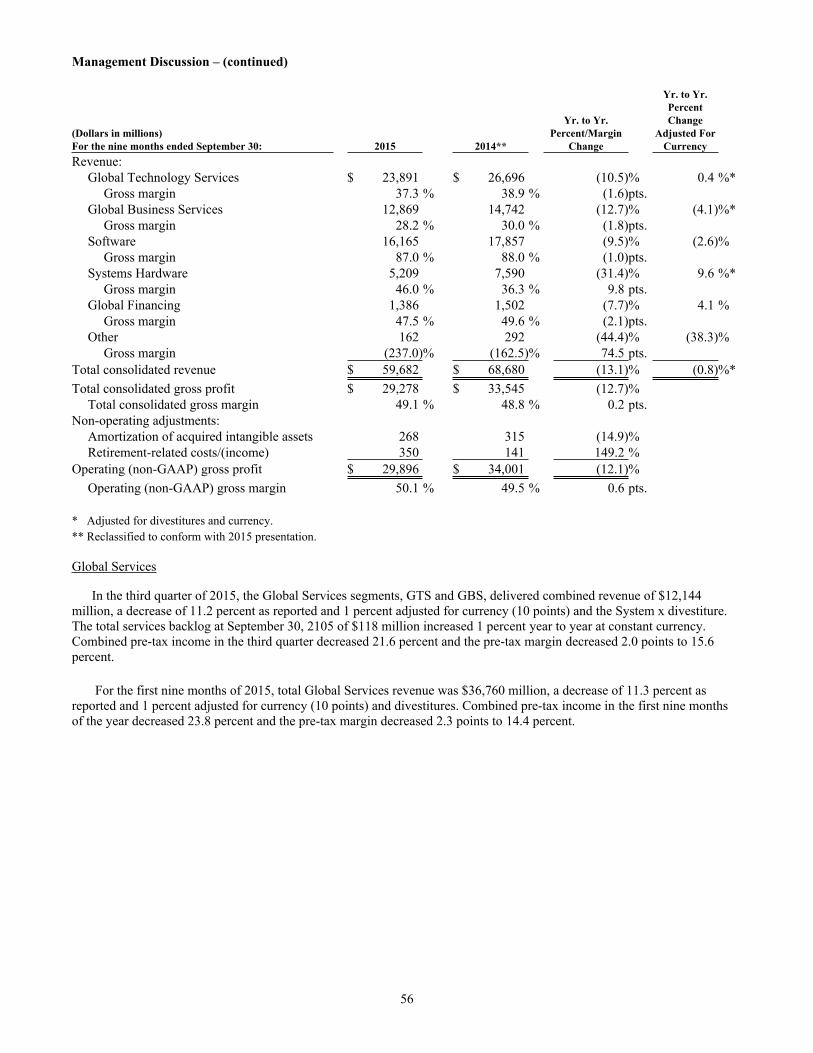
Management Discussion – (continued)
56
Yr. to Yr.Percent
Yr. to Yr. Change(Dollars in millions) Percent/Margin Adjusted ForFor the nine months ended September 30: 2015 2014** Change CurrencyRevenue:
Global Technology Services $ 23,891 $ 26,696 (10.5)% 0.4 %*Gross margin 37.3 % 38.9 % (1.6)pts.
Global Business Services 12,869 14,742 (12.7)% (4.1)%*Gross margin 28.2 % 30.0 % (1.8)pts.
Software 16,165 17,857 (9.5)% (2.6)%Gross margin 87.0 % 88.0 % (1.0)pts.
Systems Hardware 5,209 7,590 (31.4)% 9.6 %*Gross margin 46.0 % 36.3 % 9.8 pts.
Global Financing 1,386 1,502 (7.7)% 4.1 %Gross margin 47.5 % 49.6 % (2.1)pts.
Other 162 292 (44.4)% (38.3)%Gross margin (237.0)% (162.5)% 74.5 pts.
Total consolidated revenue $ 59,682 $ 68,680 (13.1)% (0.8)%*Total consolidated gross profit $ 29,278 $ 33,545 (12.7)%
Total consolidated gross margin 49.1 % 48.8 % 0.2 pts.Non-operating adjustments:
Amortization of acquired intangible assets 268 315 (14.9)%Retirement-related costs/(income) 350 141 149.2 %
Operating (non-GAAP) gross profit $ 29,896 $ 34,001 (12.1)%Operating (non-GAAP) gross margin 50.1 % 49.5 % 0.6 pts.
* Adjusted for divestitures and currency. ** Reclassified to conform with 2015 presentation.
Global Services
In the third quarter of 2015, the Global Services segments, GTS and GBS, delivered combined revenue of $12,144 million, a decrease of 11.2 percent as reported and 1 percent adjusted for currency (10 points) and the System x divestiture. The total services backlog at September 30, 2105 of $118 million increased 1 percent year to year at constant currency. Combined pre-tax income in the third quarter decreased 21.6 percent and the pre-tax margin decreased 2.0 points to 15.6 percent.
For the first nine months of 2015, total Global Services revenue was $36,760 million, a decrease of 11.3 percent as reported and 1 percent adjusted for currency (10 points) and divestitures. Combined pre-tax income in the first nine months of the year decreased 23.8 percent and the pre-tax margin decreased 2.3 points to 14.4 percent.
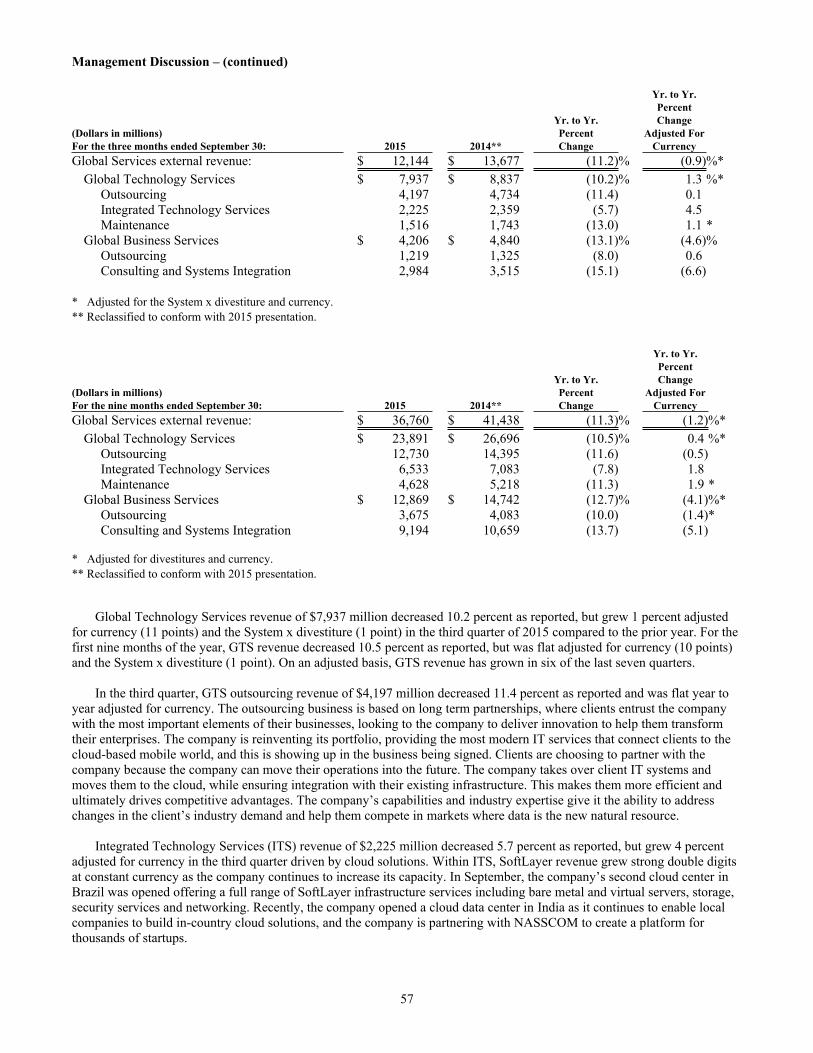
Management Discussion – (continued)
57
Yr. to Yr.Percent
Yr. to Yr. Change(Dollars in millions) Percent Adjusted ForFor the three months ended September 30: 2015 2014** Change CurrencyGlobal Services external revenue: $ 12,144 $ 13,677 (11.2)% (0.9)%*
Global Technology Services $ 7,937 $ 8,837 (10.2)% 1.3 %*Outsourcing 4,197 4,734 (11.4) 0.1Integrated Technology Services 2,225 2,359 (5.7) 4.5Maintenance 1,516 1,743 (13.0) 1.1 *
Global Business Services $ 4,206 $ 4,840 (13.1)% (4.6)%Outsourcing 1,219 1,325 (8.0) 0.6Consulting and Systems Integration 2,984 3,515 (15.1) (6.6)
* Adjusted for the System x divestiture and currency. ** Reclassified to conform with 2015 presentation.
Yr. to Yr.Percent
Yr. to Yr. Change(Dollars in millions) Percent Adjusted ForFor the nine months ended September 30: 2015 2014** Change CurrencyGlobal Services external revenue: $ 36,760 $ 41,438 (11.3)% (1.2)%*
Global Technology Services $ 23,891 $ 26,696 (10.5)% 0.4 %*Outsourcing 12,730 14,395 (11.6) (0.5)Integrated Technology Services 6,533 7,083 (7.8) 1.8Maintenance 4,628 5,218 (11.3) 1.9 *
Global Business Services $ 12,869 $ 14,742 (12.7)% (4.1)%*Outsourcing 3,675 4,083 (10.0) (1.4)*Consulting and Systems Integration 9,194 10,659 (13.7) (5.1)
* Adjusted for divestitures and currency.** Reclassified to conform with 2015 presentation.
Global Technology Services revenue of $7,937 million decreased 10.2 percent as reported, but grew 1 percent adjusted for currency (11 points) and the System x divestiture (1 point) in the third quarter of 2015 compared to the prior year. For the first nine months of the year, GTS revenue decreased 10.5 percent as reported, but was flat adjusted for currency (10 points) and the System x divestiture (1 point). On an adjusted basis, GTS revenue has grown in six of the last seven quarters.
In the third quarter, GTS outsourcing revenue of $4,197 million decreased 11.4 percent as reported and was flat year to year adjusted for currency. The outsourcing business is based on long term partnerships, where clients entrust the company with the most important elements of their businesses, looking to the company to deliver innovation to help them transform their enterprises. The company is reinventing its portfolio, providing the most modern IT services that connect clients to the cloud-based mobile world, and this is showing up in the business being signed. Clients are choosing to partner with the company because the company can move their operations into the future. The company takes over client IT systems and moves them to the cloud, while ensuring integration with their existing infrastructure. This makes them more efficient and ultimately drives competitive advantages. The company’s capabilities and industry expertise give it the ability to address changes in the client’s industry demand and help them compete in markets where data is the new natural resource.
Integrated Technology Services (ITS) revenue of $2,225 million decreased 5.7 percent as reported, but grew 4 percent adjusted for currency in the third quarter driven by cloud solutions. Within ITS, SoftLayer revenue grew strong double digits at constant currency as the company continues to increase its capacity. In September, the company’s second cloud center in Brazil was opened offering a full range of SoftLayer infrastructure services including bare metal and virtual servers, storage, security services and networking. Recently, the company opened a cloud data center in India as it continues to enable local companies to build in-country cloud solutions, and the company is partnering with NASSCOM to create a platform for thousands of startups.
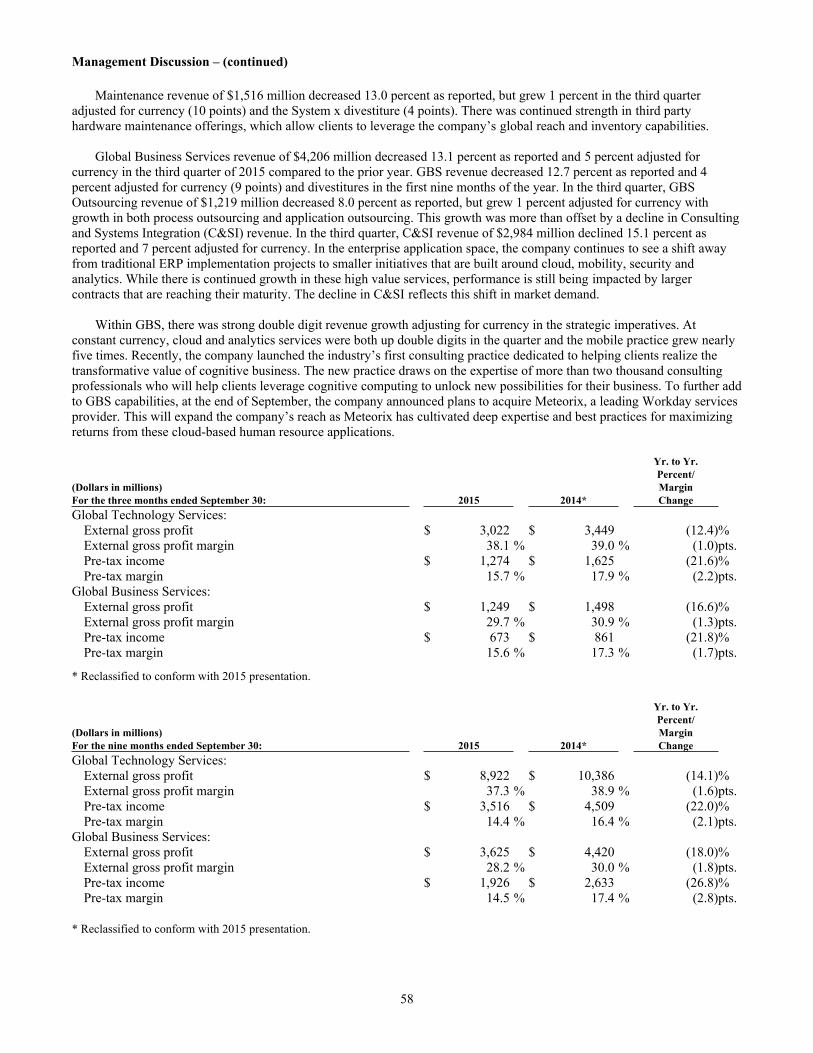
Management Discussion – (continued)
58
Maintenance revenue of $1,516 million decreased 13.0 percent as reported, but grew 1 percent in the third quarter adjusted for currency (10 points) and the System x divestiture (4 points). There was continued strength in third party hardware maintenance offerings, which allow clients to leverage the company’s global reach and inventory capabilities.
Global Business Services revenue of $4,206 million decreased 13.1 percent as reported and 5 percent adjusted for currency in the third quarter of 2015 compared to the prior year. GBS revenue decreased 12.7 percent as reported and 4 percent adjusted for currency (9 points) and divestitures in the first nine months of the year. In the third quarter, GBS Outsourcing revenue of $1,219 million decreased 8.0 percent as reported, but grew 1 percent adjusted for currency with growth in both process outsourcing and application outsourcing. This growth was more than offset by a decline in Consulting and Systems Integration (C&SI) revenue. In the third quarter, C&SI revenue of $2,984 million declined 15.1 percent as reported and 7 percent adjusted for currency. In the enterprise application space, the company continues to see a shift away from traditional ERP implementation projects to smaller initiatives that are built around cloud, mobility, security and analytics. While there is continued growth in these high value services, performance is still being impacted by larger contracts that are reaching their maturity. The decline in C&SI reflects this shift in market demand.
Within GBS, there was strong double digit revenue growth adjusting for currency in the strategic imperatives. At constant currency, cloud and analytics services were both up double digits in the quarter and the mobile practice grew nearly five times. Recently, the company launched the industry’s first consulting practice dedicated to helping clients realize the transformative value of cognitive business. The new practice draws on the expertise of more than two thousand consulting professionals who will help clients leverage cognitive computing to unlock new possibilities for their business. To further add to GBS capabilities, at the end of September, the company announced plans to acquire Meteorix, a leading Workday services provider. This will expand the company’s reach as Meteorix has cultivated deep expertise and best practices for maximizing returns from these cloud-based human resource applications.
Yr. to Yr.Percent/
(Dollars in millions) MarginFor the three months ended September 30: 2015 2014* ChangeGlobal Technology Services:
External gross profit $ 3,022 $ 3,449 (12.4)%External gross profit margin 38.1 % 39.0 % (1.0)pts.Pre-tax income $ 1,274 $ 1,625 (21.6)%Pre-tax margin 15.7 % 17.9 % (2.2)pts.
Global Business Services:External gross profit $ 1,249 $ 1,498 (16.6)%External gross profit margin 29.7 % 30.9 % (1.3)pts.Pre-tax income $ 673 $ 861 (21.8)%Pre-tax margin 15.6 % 17.3 % (1.7)pts.
* Reclassified to conform with 2015 presentation.
Yr. to Yr.Percent/
(Dollars in millions) MarginFor the nine months ended September 30: 2015 2014* ChangeGlobal Technology Services:
External gross profit $ 8,922 $ 10,386 (14.1)%External gross profit margin 37.3 % 38.9 % (1.6)pts.Pre-tax income $ 3,516 $ 4,509 (22.0)%Pre-tax margin 14.4 % 16.4 % (2.1)pts.
Global Business Services:External gross profit $ 3,625 $ 4,420 (18.0)%External gross profit margin 28.2 % 30.0 % (1.8)pts.Pre-tax income $ 1,926 $ 2,633 (26.8)%Pre-tax margin 14.5 % 17.4 % (2.8)pts.
* Reclassified to conform with 2015 presentation.
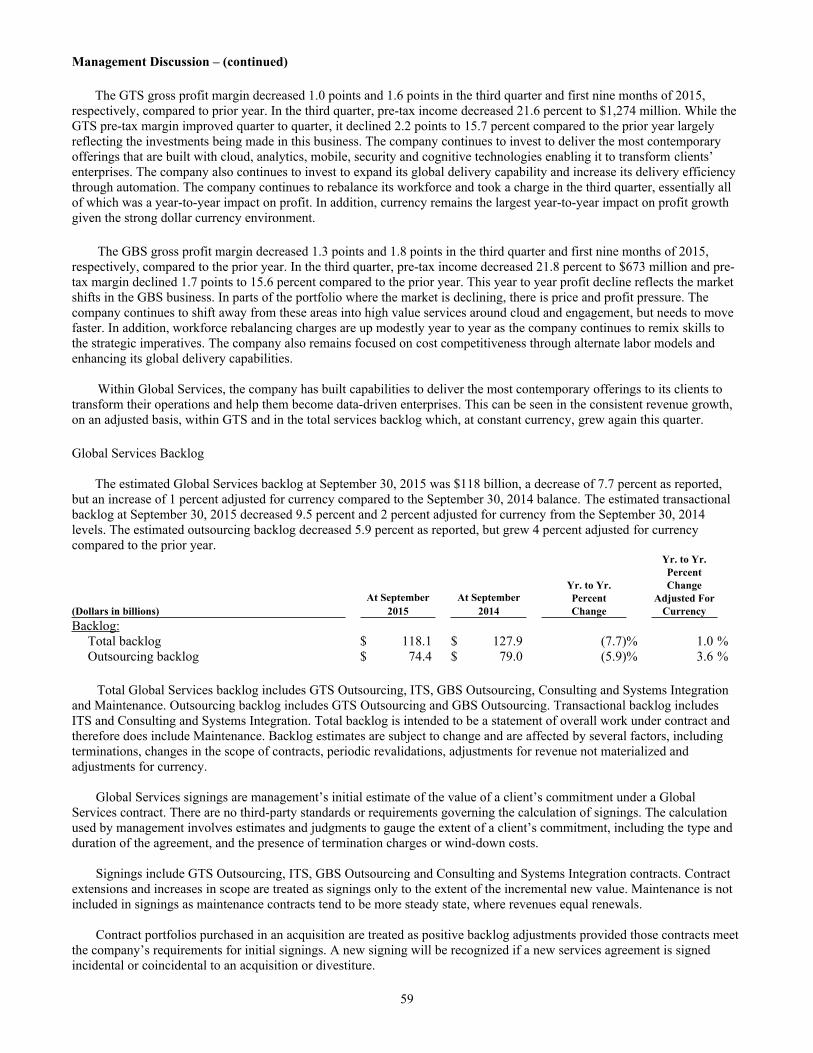
Management Discussion – (continued)
59
The GTS gross profit margin decreased 1.0 points and 1.6 points in the third quarter and first nine months of 2015, respectively, compared to prior year. In the third quarter, pre-tax income decreased 21.6 percent to $1,274 million. While the GTS pre-tax margin improved quarter to quarter, it declined 2.2 points to 15.7 percent compared to the prior year largely reflecting the investments being made in this business. The company continues to invest to deliver the most contemporary offerings that are built with cloud, analytics, mobile, security and cognitive technologies enabling it to transform clients’ enterprises. The company also continues to invest to expand its global delivery capability and increase its delivery efficiency through automation. The company continues to rebalance its workforce and took a charge in the third quarter, essentially all of which was a year-to-year impact on profit. In addition, currency remains the largest year-to-year impact on profit growth given the strong dollar currency environment.
The GBS gross profit margin decreased 1.3 points and 1.8 points in the third quarter and first nine months of 2015, respectively, compared to the prior year. In the third quarter, pre-tax income decreased 21.8 percent to $673 million and pre-tax margin declined 1.7 points to 15.6 percent compared to the prior year. This year to year profit decline reflects the market shifts in the GBS business. In parts of the portfolio where the market is declining, there is price and profit pressure. The company continues to shift away from these areas into high value services around cloud and engagement, but needs to move faster. In addition, workforce rebalancing charges are up modestly year to year as the company continues to remix skills to the strategic imperatives. The company also remains focused on cost competitiveness through alternate labor models and enhancing its global delivery capabilities.
Within Global Services, the company has built capabilities to deliver the most contemporary offerings to its clients to transform their operations and help them become data-driven enterprises. This can be seen in the consistent revenue growth, on an adjusted basis, within GTS and in the total services backlog which, at constant currency, grew again this quarter.
Global Services Backlog
The estimated Global Services backlog at September 30, 2015 was $118 billion, a decrease of 7.7 percent as reported, but an increase of 1 percent adjusted for currency compared to the September 30, 2014 balance. The estimated transactional backlog at September 30, 2015 decreased 9.5 percent and 2 percent adjusted for currency from the September 30, 2014 levels. The estimated outsourcing backlog decreased 5.9 percent as reported, but grew 4 percent adjusted for currency compared to the prior year.
Yr. to Yr.Percent
Yr. to Yr. Change At September
30,At September
30,Percent Adjusted For
(Dollars in billions) 2015 2014 Change CurrencyBacklog:
Total backlog $ 118.1 $ 127.9 (7.7)% 1.0 %Outsourcing backlog $ 74.4 $ 79.0 (5.9)% 3.6 %
Total Global Services backlog includes GTS Outsourcing, ITS, GBS Outsourcing, Consulting and Systems Integration and Maintenance. Outsourcing backlog includes GTS Outsourcing and GBS Outsourcing. Transactional backlog includes ITS and Consulting and Systems Integration. Total backlog is intended to be a statement of overall work under contract and therefore does include Maintenance. Backlog estimates are subject to change and are affected by several factors, including terminations, changes in the scope of contracts, periodic revalidations, adjustments for revenue not materialized and adjustments for currency.
Global Services signings are management’s initial estimate of the value of a client’s commitment under a Global Services contract. There are no third-party standards or requirements governing the calculation of signings. The calculation used by management involves estimates and judgments to gauge the extent of a client’s commitment, including the type and duration of the agreement, and the presence of termination charges or wind-down costs.
Signings include GTS Outsourcing, ITS, GBS Outsourcing and Consulting and Systems Integration contracts. Contract extensions and increases in scope are treated as signings only to the extent of the incremental new value. Maintenance is not included in signings as maintenance contracts tend to be more steady state, where revenues equal renewals.
Contract portfolios purchased in an acquisition are treated as positive backlog adjustments provided those contracts meet the company’s requirements for initial signings. A new signing will be recognized if a new services agreement is signed incidental or coincidental to an acquisition or divestiture.
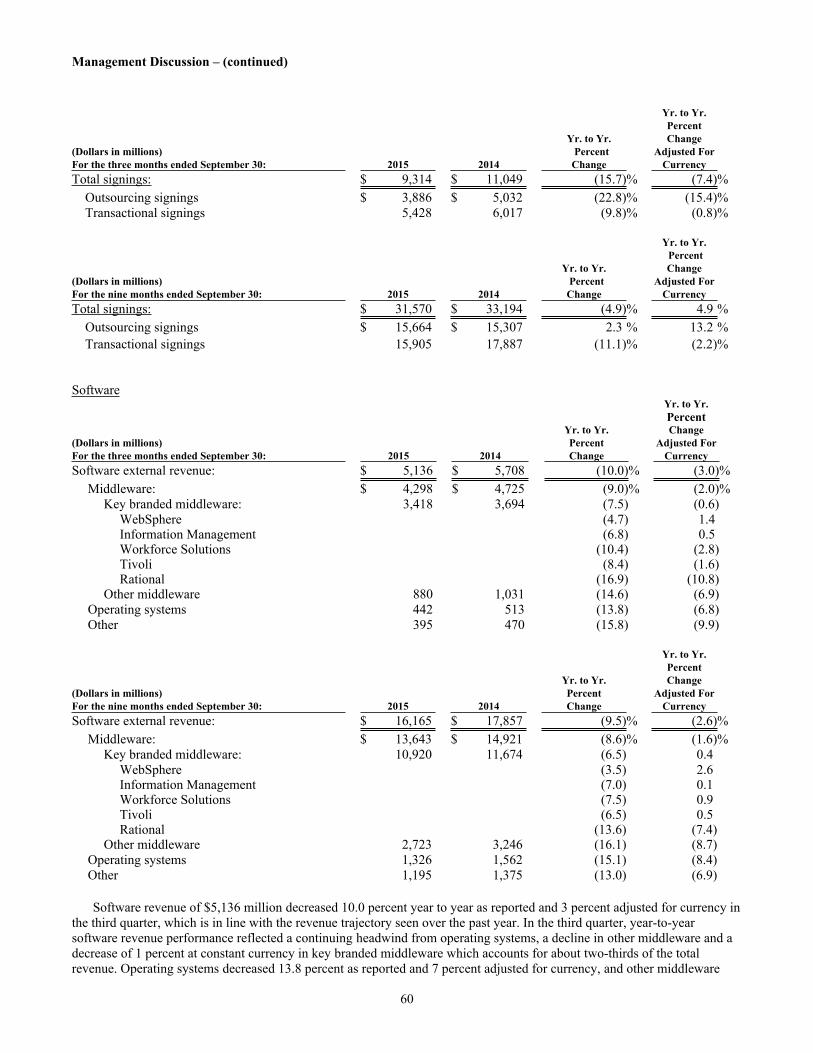
Management Discussion – (continued)
60
Yr. to Yr.Percent
Yr. to Yr. Change (Dollars in millions) Percent Adjusted ForFor the three months ended September 30: 2015 2014 Change CurrencyTotal signings: $ 9,314 $ 11,049 (15.7)% (7.4)% Outsourcing signings $ 3,886 $ 5,032 (22.8)% (15.4)% Transactional signings 5,428 6,017 (9.8)% (0.8)%
Yr. to Yr. Percent
Yr. to Yr. Change (Dollars in millions) Percent Adjusted ForFor the nine months ended September 30: 2015 2014 Change CurrencyTotal signings: $ 31,570 $ 33,194 (4.9)% 4.9 % Outsourcing signings $ 15,664 $ 15,307 2.3 % 13.2 % Transactional signings 15,905 17,887 (11.1)% (2.2)%
SoftwareYr. to Yr.Percent
Yr. to Yr. Change (Dollars in millions) Percent Adjusted For For the three months ended September 30: 2015 2014 Change CurrencySoftware external revenue: $ 5,136 $ 5,708 (10.0)% (3.0)%
Middleware: $ 4,298 $ 4,725 (9.0)% (2.0)%Key branded middleware: 3,418 3,694 (7.5) (0.6)
WebSphere (4.7) 1.4Information Management (6.8) 0.5Workforce Solutions (10.4) (2.8)Tivoli (8.4) (1.6)Rational (16.9) (10.8)
Other middleware 880 1,031 (14.6) (6.9)Operating systems 442 513 (13.8) (6.8)Other 395 470 (15.8) (9.9)
Yr. to Yr.Percent
Yr. to Yr. Change (Dollars in millions) Percent Adjusted For For the nine months ended September 30: 2015 2014 Change CurrencySoftware external revenue: $ 16,165 $ 17,857 (9.5)% (2.6)%
Middleware: $ 13,643 $ 14,921 (8.6)% (1.6)%Key branded middleware: 10,920 11,674 (6.5) 0.4
WebSphere (3.5) 2.6Information Management (7.0) 0.1Workforce Solutions (7.5) 0.9Tivoli (6.5) 0.5Rational (13.6) (7.4)
Other middleware 2,723 3,246 (16.1) (8.7)Operating systems 1,326 1,562 (15.1) (8.4)Other 1,195 1,375 (13.0) (6.9)
Software revenue of $5,136 million decreased 10.0 percent year to year as reported and 3 percent adjusted for currency in the third quarter, which is in line with the revenue trajectory seen over the past year. In the third quarter, year-to-year software revenue performance reflected a continuing headwind from operating systems, a decline in other middleware and a decrease of 1 percent at constant currency in key branded middleware which accounts for about two-thirds of the total revenue. Operating systems decreased 13.8 percent as reported and 7 percent adjusted for currency, and other middleware
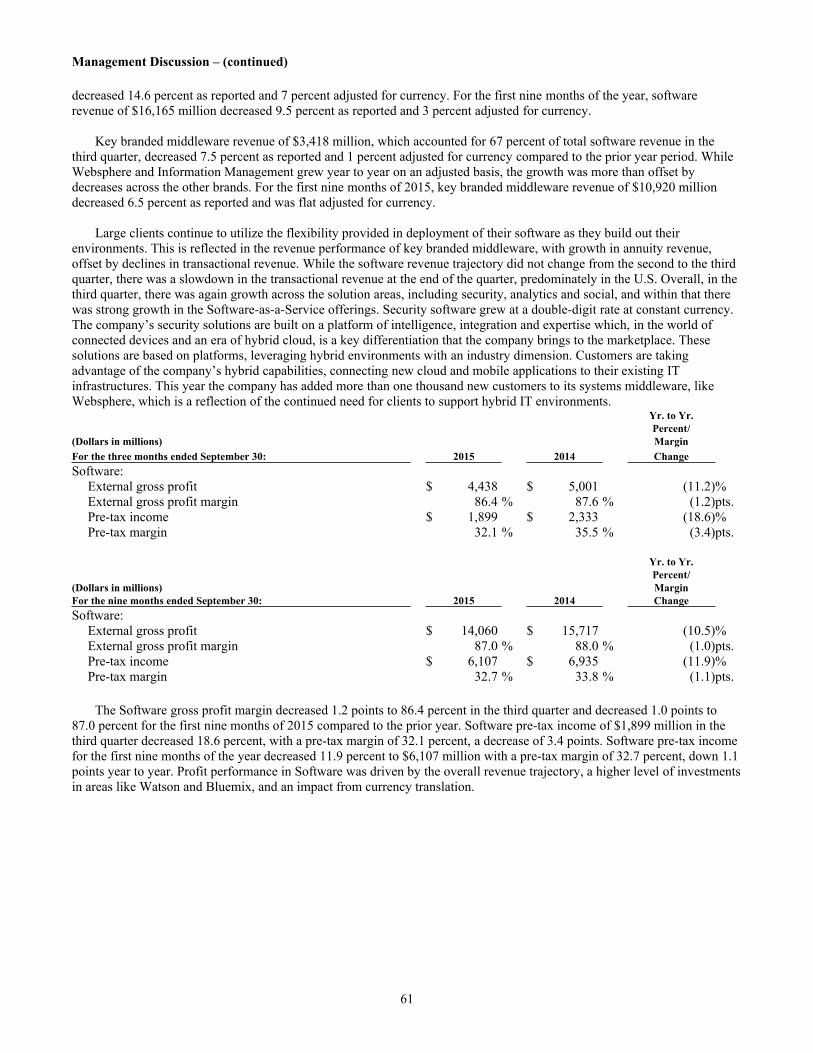
Management Discussion – (continued)
61
decreased 14.6 percent as reported and 7 percent adjusted for currency. For the first nine months of the year, software revenue of $16,165 million decreased 9.5 percent as reported and 3 percent adjusted for currency.
Key branded middleware revenue of $3,418 million, which accounted for 67 percent of total software revenue in the third quarter, decreased 7.5 percent as reported and 1 percent adjusted for currency compared to the prior year period. While Websphere and Information Management grew year to year on an adjusted basis, the growth was more than offset by decreases across the other brands. For the first nine months of 2015, key branded middleware revenue of $10,920 million decreased 6.5 percent as reported and was flat adjusted for currency.
Large clients continue to utilize the flexibility provided in deployment of their software as they build out their environments. This is reflected in the revenue performance of key branded middleware, with growth in annuity revenue, offset by declines in transactional revenue. While the software revenue trajectory did not change from the second to the third quarter, there was a slowdown in the transactional revenue at the end of the quarter, predominately in the U.S. Overall, in the third quarter, there was again growth across the solution areas, including security, analytics and social, and within that there was strong growth in the Software-as-a-Service offerings. Security software grew at a double-digit rate at constant currency. The company’s security solutions are built on a platform of intelligence, integration and expertise which, in the world of connected devices and an era of hybrid cloud, is a key differentiation that the company brings to the marketplace. These solutions are based on platforms, leveraging hybrid environments with an industry dimension. Customers are taking advantage of the company’s hybrid capabilities, connecting new cloud and mobile applications to their existing IT infrastructures. This year the company has added more than one thousand new customers to its systems middleware, like Websphere, which is a reflection of the continued need for clients to support hybrid IT environments.
Yr. to Yr.Percent/
(Dollars in millions) MarginFor the three months ended September 30: 2015 2014 ChangeSoftware:
External gross profit $ 4,438 $ 5,001 (11.2)%External gross profit margin 86.4 % 87.6 % (1.2)pts.Pre-tax income $ 1,899 $ 2,333 (18.6)%Pre-tax margin 32.1 % 35.5 % (3.4)pts.
Yr. to Yr.Percent/
(Dollars in millions) MarginFor the nine months ended September 30: 2015 2014 ChangeSoftware:
External gross profit $ 14,060 $ 15,717 (10.5)%External gross profit margin 87.0 % 88.0 % (1.0)pts.Pre-tax income $ 6,107 $ 6,935 (11.9)%Pre-tax margin 32.7 % 33.8 % (1.1)pts.
The Software gross profit margin decreased 1.2 points to 86.4 percent in the third quarter and decreased 1.0 points to 87.0 percent for the first nine months of 2015 compared to the prior year. Software pre-tax income of $1,899 million in the third quarter decreased 18.6 percent, with a pre-tax margin of 32.1 percent, a decrease of 3.4 points. Software pre-tax income for the first nine months of the year decreased 11.9 percent to $6,107 million with a pre-tax margin of 32.7 percent, down 1.1 points year to year. Profit performance in Software was driven by the overall revenue trajectory, a higher level of investments in areas like Watson and Bluemix, and an impact from currency translation.
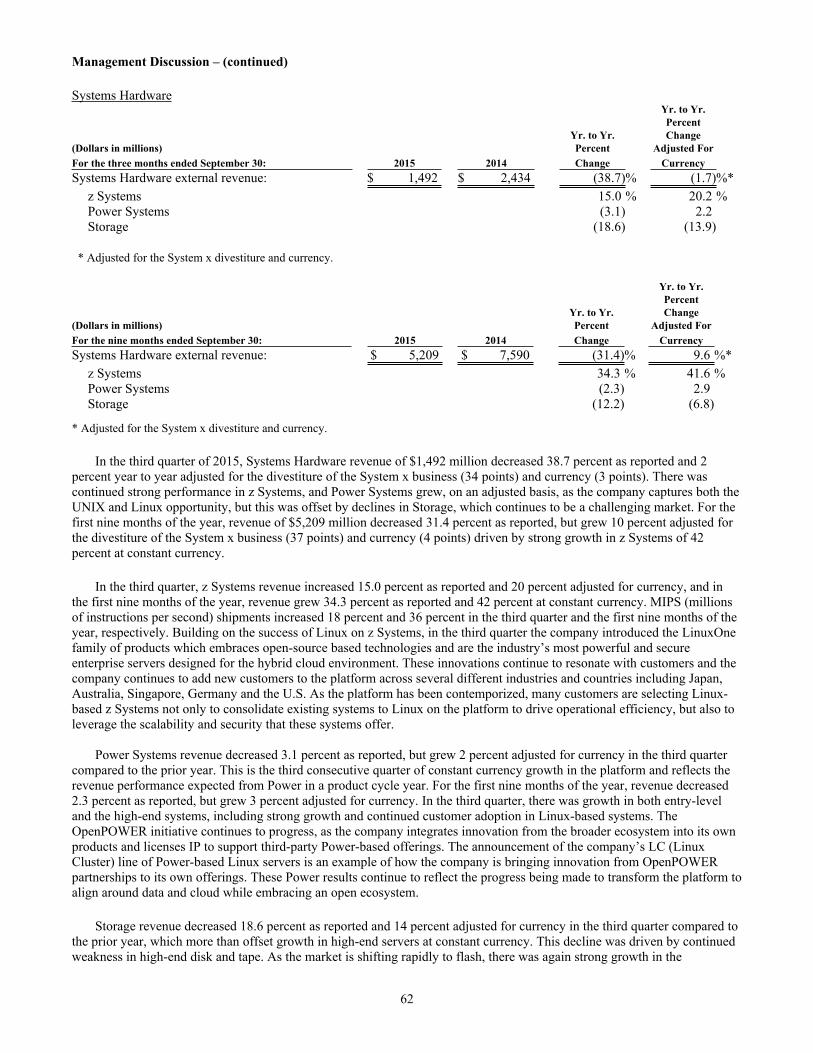
Management Discussion – (continued)
62
Systems HardwareYr. to Yr.Percent
Yr. to Yr. Change (Dollars in millions) Percent Adjusted For For the three months ended September 30: 2015 2014 Change CurrencySystems Hardware external revenue: $ 1,492 $ 2,434 (38.7)% (1.7)%*
z Systems 15.0 % 20.2 %Power Systems (3.1) 2.2Storage (18.6) (13.9)
* Adjusted for the System x divestiture and currency.
Yr. to Yr.Percent
Yr. to Yr. Change (Dollars in millions) Percent Adjusted For For the nine months ended September 30: 2015 2014 Change CurrencySystems Hardware external revenue: $ 5,209 $ 7,590 (31.4)% 9.6 %*
z Systems 34.3 % 41.6 %Power Systems (2.3) 2.9Storage (12.2) (6.8)
* Adjusted for the System x divestiture and currency.
In the third quarter of 2015, Systems Hardware revenue of $1,492 million decreased 38.7 percent as reported and 2 percent year to year adjusted for the divestiture of the System x business (34 points) and currency (3 points). There was continued strong performance in z Systems, and Power Systems grew, on an adjusted basis, as the company captures both the UNIX and Linux opportunity, but this was offset by declines in Storage, which continues to be a challenging market. For the first nine months of the year, revenue of $5,209 million decreased 31.4 percent as reported, but grew 10 percent adjusted for the divestiture of the System x business (37 points) and currency (4 points) driven by strong growth in z Systems of 42 percent at constant currency.
In the third quarter, z Systems revenue increased 15.0 percent as reported and 20 percent adjusted for currency, and in the first nine months of the year, revenue grew 34.3 percent as reported and 42 percent at constant currency. MIPS (millions of instructions per second) shipments increased 18 percent and 36 percent in the third quarter and the first nine months of the year, respectively. Building on the success of Linux on z Systems, in the third quarter the company introduced the LinuxOne family of products which embraces open-source based technologies and are the industry’s most powerful and secure enterprise servers designed for the hybrid cloud environment. These innovations continue to resonate with customers and the company continues to add new customers to the platform across several different industries and countries including Japan, Australia, Singapore, Germany and the U.S. As the platform has been contemporized, many customers are selecting Linux-based z Systems not only to consolidate existing systems to Linux on the platform to drive operational efficiency, but also to leverage the scalability and security that these systems offer.
Power Systems revenue decreased 3.1 percent as reported, but grew 2 percent adjusted for currency in the third quarter compared to the prior year. This is the third consecutive quarter of constant currency growth in the platform and reflects the revenue performance expected from Power in a product cycle year. For the first nine months of the year, revenue decreased 2.3 percent as reported, but grew 3 percent adjusted for currency. In the third quarter, there was growth in both entry-level and the high-end systems, including strong growth and continued customer adoption in Linux-based systems. The OpenPOWER initiative continues to progress, as the company integrates innovation from the broader ecosystem into its own products and licenses IP to support third-party Power-based offerings. The announcement of the company’s LC (Linux Cluster) line of Power-based Linux servers is an example of how the company is bringing innovation from OpenPOWER partnerships to its own offerings. These Power results continue to reflect the progress being made to transform the platform to align around data and cloud while embracing an open ecosystem.
Storage revenue decreased 18.6 percent as reported and 14 percent adjusted for currency in the third quarter compared to the prior year, which more than offset growth in high-end servers at constant currency. This decline was driven by continued weakness in high-end disk and tape. As the market is shifting rapidly to flash, there was again strong growth in the
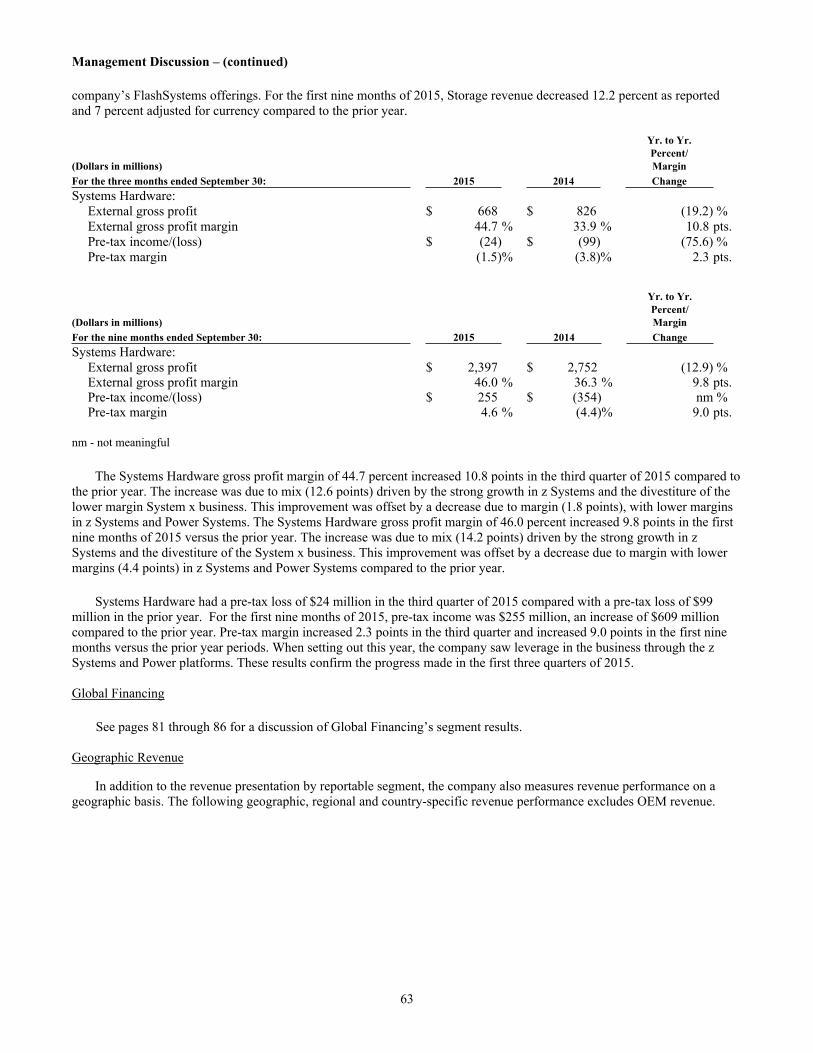
Management Discussion – (continued)
63
company’s FlashSystems offerings. For the first nine months of 2015, Storage revenue decreased 12.2 percent as reported and 7 percent adjusted for currency compared to the prior year.
Yr. to Yr.Percent/
(Dollars in millions) MarginFor the three months ended September 30: 2015 2014 ChangeSystems Hardware:
External gross profit $ 668 $ 826 (19.2) % External gross profit margin 44.7 % 33.9 % 10.8 pts.Pre-tax income/(loss) $ (24) $ (99) (75.6) % Pre-tax margin (1.5)% (3.8)% 2.3 pts.
Yr. to Yr.Percent/
(Dollars in millions) MarginFor the nine months ended September 30: 2015 2014 ChangeSystems Hardware:
External gross profit $ 2,397 $ 2,752 (12.9) %External gross profit margin 46.0 % 36.3 % 9.8 pts.Pre-tax income/(loss) $ 255 $ (354) nm %Pre-tax margin 4.6 % (4.4)% 9.0 pts.
nm - not meaningful
The Systems Hardware gross profit margin of 44.7 percent increased 10.8 points in the third quarter of 2015 compared to the prior year. The increase was due to mix (12.6 points) driven by the strong growth in z Systems and the divestiture of the lower margin System x business. This improvement was offset by a decrease due to margin (1.8 points), with lower margins in z Systems and Power Systems. The Systems Hardware gross profit margin of 46.0 percent increased 9.8 points in the first nine months of 2015 versus the prior year. The increase was due to mix (14.2 points) driven by the strong growth in z Systems and the divestiture of the System x business. This improvement was offset by a decrease due to margin with lower margins (4.4 points) in z Systems and Power Systems compared to the prior year. Systems Hardware had a pre-tax loss of $24 million in the third quarter of 2015 compared with a pre-tax loss of $99 million in the prior year. For the first nine months of 2015, pre-tax income was $255 million, an increase of $609 million compared to the prior year. Pre-tax margin increased 2.3 points in the third quarter and increased 9.0 points in the first nine months versus the prior year periods. When setting out this year, the company saw leverage in the business through the z Systems and Power platforms. These results confirm the progress made in the first three quarters of 2015.
Global Financing
See pages 81 through 86 for a discussion of Global Financing’s segment results.
Geographic Revenue
In addition to the revenue presentation by reportable segment, the company also measures revenue performance on a geographic basis. The following geographic, regional and country-specific revenue performance excludes OEM revenue.
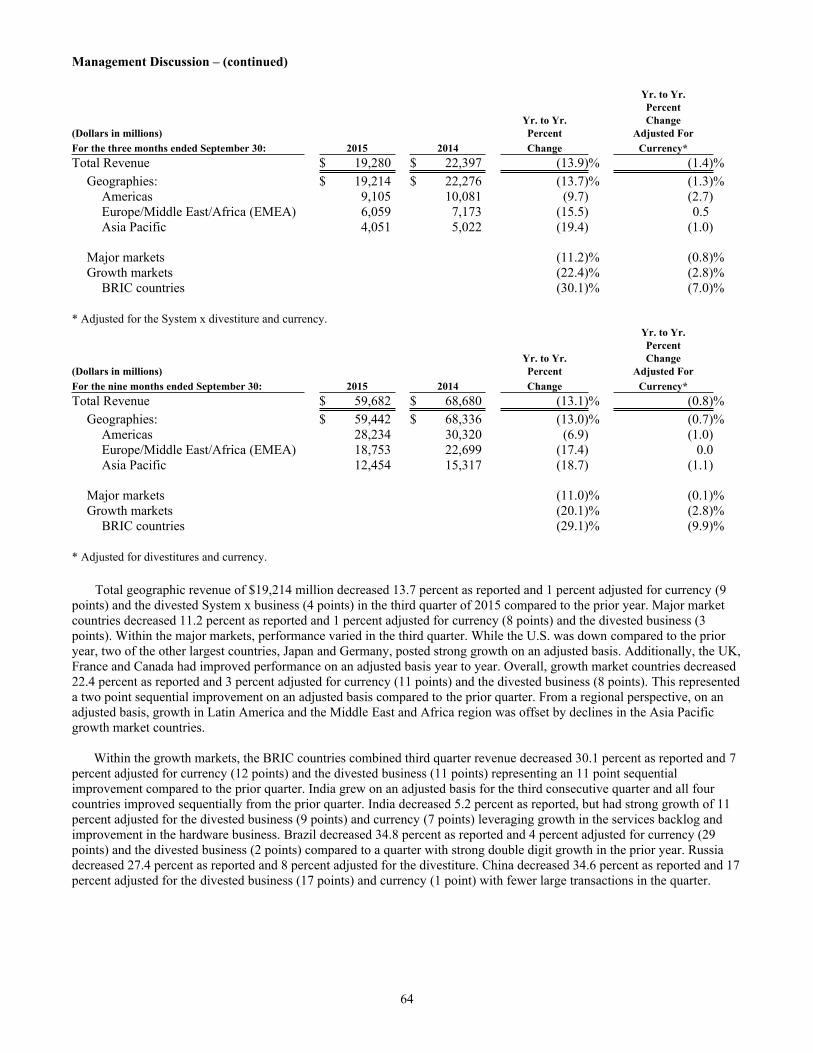
Management Discussion – (continued)
64
Yr. to Yr.Percent
Yr. to Yr. Change (Dollars in millions) Percent Adjusted For For the three months ended September 30: 2015 2014 Change Currency*Total Revenue $ 19,280 $ 22,397 (13.9)% (1.4)%
Geographies: $ 19,214 $ 22,276 (13.7)% (1.3)%Americas 9,105 10,081 (9.7) (2.7)Europe/Middle East/Africa (EMEA) 6,059 7,173 (15.5) 0.5Asia Pacific 4,051 5,022 (19.4) (1.0)
Major markets (11.2)% (0.8)%Growth markets (22.4)% (2.8)%
BRIC countries (30.1)% (7.0)%
* Adjusted for the System x divestiture and currency. Yr. to Yr.Percent
Yr. to Yr. Change (Dollars in millions) Percent Adjusted For For the nine months ended September 30: 2015 2014 Change Currency*Total Revenue $ 59,682 $ 68,680 (13.1)% (0.8)%
Geographies: $ 59,442 $ 68,336 (13.0)% (0.7)% Americas 28,234 30,320 (6.9) (1.0)Europe/Middle East/Africa (EMEA) 18,753 22,699 (17.4) 0.0Asia Pacific 12,454 15,317 (18.7) (1.1)
Major markets (11.0)% (0.1)%Growth markets (20.1)% (2.8)%
BRIC countries (29.1)% (9.9)%
* Adjusted for divestitures and currency.
Total geographic revenue of $19,214 million decreased 13.7 percent as reported and 1 percent adjusted for currency (9 points) and the divested System x business (4 points) in the third quarter of 2015 compared to the prior year. Major market countries decreased 11.2 percent as reported and 1 percent adjusted for currency (8 points) and the divested business (3 points). Within the major markets, performance varied in the third quarter. While the U.S. was down compared to the prior year, two of the other largest countries, Japan and Germany, posted strong growth on an adjusted basis. Additionally, the UK, France and Canada had improved performance on an adjusted basis year to year. Overall, growth market countries decreased 22.4 percent as reported and 3 percent adjusted for currency (11 points) and the divested business (8 points). This represented a two point sequential improvement on an adjusted basis compared to the prior quarter. From a regional perspective, on an adjusted basis, growth in Latin America and the Middle East and Africa region was offset by declines in the Asia Pacific growth market countries.
Within the growth markets, the BRIC countries combined third quarter revenue decreased 30.1 percent as reported and 7 percent adjusted for currency (12 points) and the divested business (11 points) representing an 11 point sequential improvement compared to the prior quarter. India grew on an adjusted basis for the third consecutive quarter and all four countries improved sequentially from the prior quarter. India decreased 5.2 percent as reported, but had strong growth of 11 percent adjusted for the divested business (9 points) and currency (7 points) leveraging growth in the services backlog and improvement in the hardware business. Brazil decreased 34.8 percent as reported and 4 percent adjusted for currency (29 points) and the divested business (2 points) compared to a quarter with strong double digit growth in the prior year. Russia decreased 27.4 percent as reported and 8 percent adjusted for the divestiture. China decreased 34.6 percent as reported and 17 percent adjusted for the divested business (17 points) and currency (1 point) with fewer large transactions in the quarter.
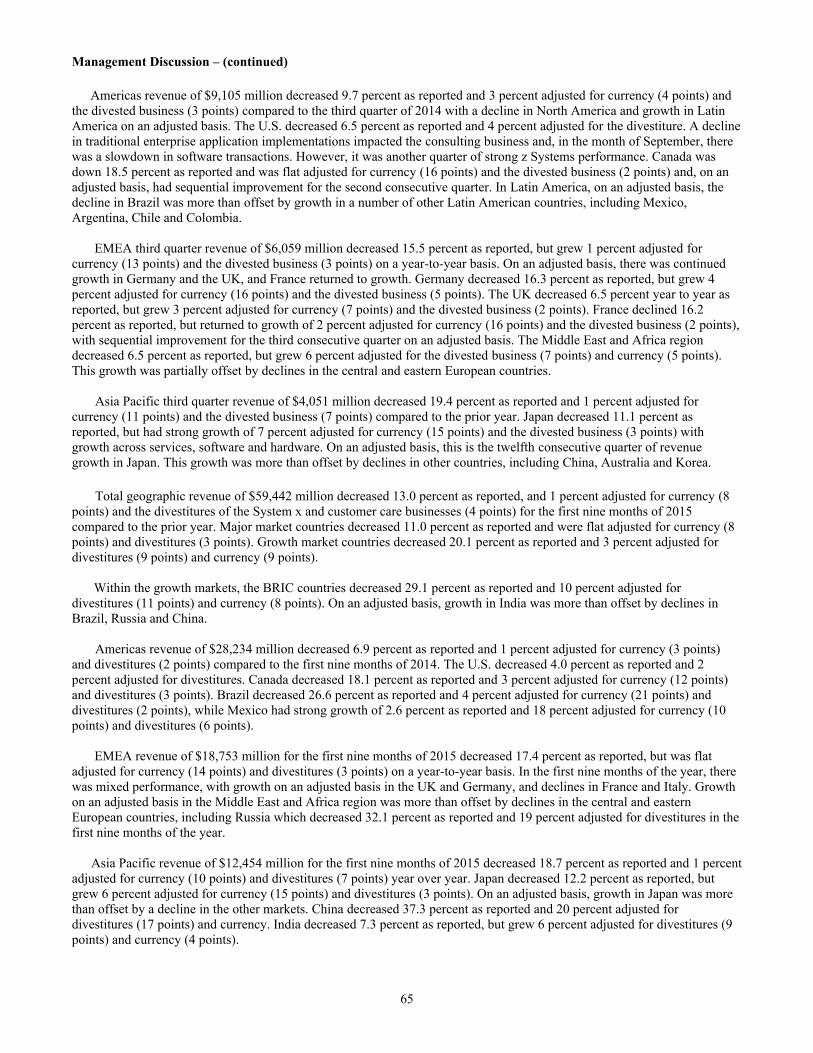
Management Discussion – (continued)
65
Americas revenue of $9,105 million decreased 9.7 percent as reported and 3 percent adjusted for currency (4 points) and the divested business (3 points) compared to the third quarter of 2014 with a decline in North America and growth in Latin America on an adjusted basis. The U.S. decreased 6.5 percent as reported and 4 percent adjusted for the divestiture. A decline in traditional enterprise application implementations impacted the consulting business and, in the month of September, there was a slowdown in software transactions. However, it was another quarter of strong z Systems performance. Canada was down 18.5 percent as reported and was flat adjusted for currency (16 points) and the divested business (2 points) and, on an adjusted basis, had sequential improvement for the second consecutive quarter. In Latin America, on an adjusted basis, the decline in Brazil was more than offset by growth in a number of other Latin American countries, including Mexico, Argentina, Chile and Colombia.
EMEA third quarter revenue of $6,059 million decreased 15.5 percent as reported, but grew 1 percent adjusted for currency (13 points) and the divested business (3 points) on a year-to-year basis. On an adjusted basis, there was continued growth in Germany and the UK, and France returned to growth. Germany decreased 16.3 percent as reported, but grew 4 percent adjusted for currency (16 points) and the divested business (5 points). The UK decreased 6.5 percent year to year as reported, but grew 3 percent adjusted for currency (7 points) and the divested business (2 points). France declined 16.2 percent as reported, but returned to growth of 2 percent adjusted for currency (16 points) and the divested business (2 points), with sequential improvement for the third consecutive quarter on an adjusted basis. The Middle East and Africa region decreased 6.5 percent as reported, but grew 6 percent adjusted for the divested business (7 points) and currency (5 points). This growth was partially offset by declines in the central and eastern European countries.
Asia Pacific third quarter revenue of $4,051 million decreased 19.4 percent as reported and 1 percent adjusted for currency (11 points) and the divested business (7 points) compared to the prior year. Japan decreased 11.1 percent as reported, but had strong growth of 7 percent adjusted for currency (15 points) and the divested business (3 points) with growth across services, software and hardware. On an adjusted basis, this is the twelfth consecutive quarter of revenue growth in Japan. This growth was more than offset by declines in other countries, including China, Australia and Korea.
Total geographic revenue of $59,442 million decreased 13.0 percent as reported, and 1 percent adjusted for currency (8 points) and the divestitures of the System x and customer care businesses (4 points) for the first nine months of 2015 compared to the prior year. Major market countries decreased 11.0 percent as reported and were flat adjusted for currency (8 points) and divestitures (3 points). Growth market countries decreased 20.1 percent as reported and 3 percent adjusted for divestitures (9 points) and currency (9 points).
Within the growth markets, the BRIC countries decreased 29.1 percent as reported and 10 percent adjusted for divestitures (11 points) and currency (8 points). On an adjusted basis, growth in India was more than offset by declines in Brazil, Russia and China.
Americas revenue of $28,234 million decreased 6.9 percent as reported and 1 percent adjusted for currency (3 points) and divestitures (2 points) compared to the first nine months of 2014. The U.S. decreased 4.0 percent as reported and 2 percent adjusted for divestitures. Canada decreased 18.1 percent as reported and 3 percent adjusted for currency (12 points) and divestitures (3 points). Brazil decreased 26.6 percent as reported and 4 percent adjusted for currency (21 points) and divestitures (2 points), while Mexico had strong growth of 2.6 percent as reported and 18 percent adjusted for currency (10 points) and divestitures (6 points).
EMEA revenue of $18,753 million for the first nine months of 2015 decreased 17.4 percent as reported, but was flat adjusted for currency (14 points) and divestitures (3 points) on a year-to-year basis. In the first nine months of the year, there was mixed performance, with growth on an adjusted basis in the UK and Germany, and declines in France and Italy. Growth on an adjusted basis in the Middle East and Africa region was more than offset by declines in the central and eastern European countries, including Russia which decreased 32.1 percent as reported and 19 percent adjusted for divestitures in the first nine months of the year.
Asia Pacific revenue of $12,454 million for the first nine months of 2015 decreased 18.7 percent as reported and 1 percent adjusted for currency (10 points) and divestitures (7 points) year over year. Japan decreased 12.2 percent as reported, but grew 6 percent adjusted for currency (15 points) and divestitures (3 points). On an adjusted basis, growth in Japan was more than offset by a decline in the other markets. China decreased 37.3 percent as reported and 20 percent adjusted for divestitures (17 points) and currency. India decreased 7.3 percent as reported, but grew 6 percent adjusted for divestitures (9 points) and currency (4 points).
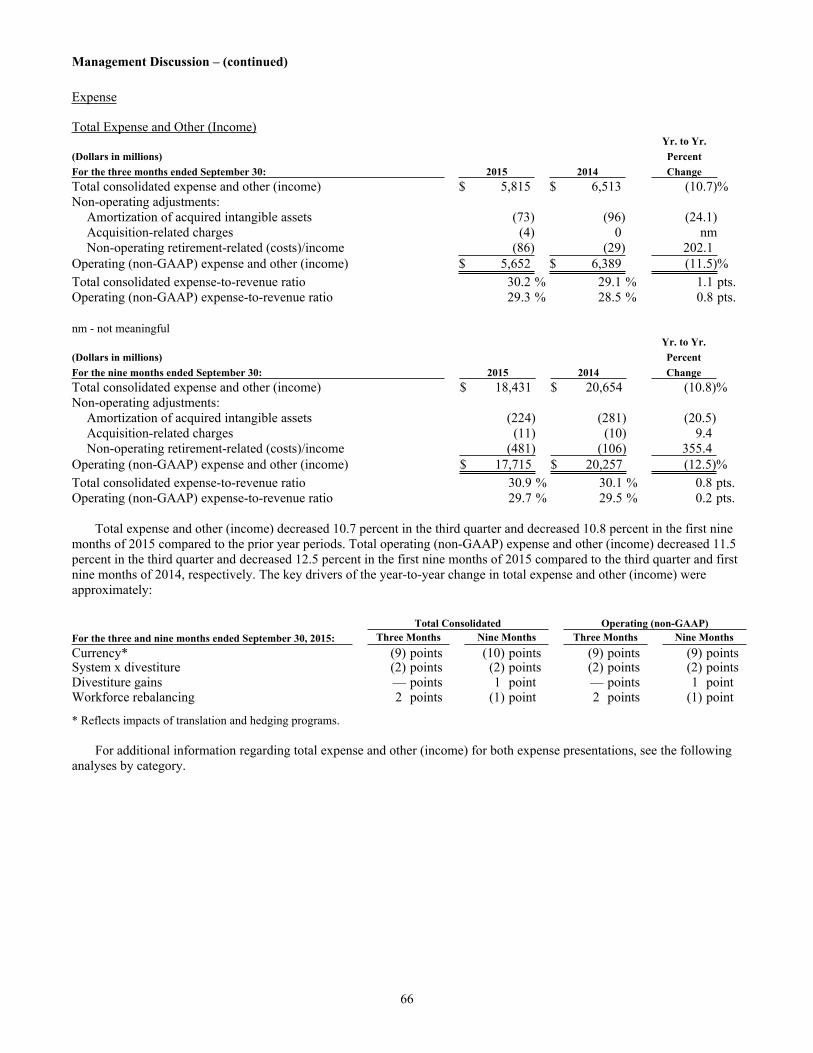
Management Discussion – (continued)
66
Expense
Total Expense and Other (Income)Yr. to Yr.
(Dollars in millions) PercentFor the three months ended September 30: 2015 2014 ChangeTotal consolidated expense and other (income) $ 5,815 $ 6,513 (10.7)%Non-operating adjustments:
Amortization of acquired intangible assets (73) (96) (24.1)Acquisition-related charges (4) 0 nmNon-operating retirement-related (costs)/income (86) (29) 202.1
Operating (non-GAAP) expense and other (income) $ 5,652 $ 6,389 (11.5)%Total consolidated expense-to-revenue ratio 30.2 % 29.1 % 1.1 pts.Operating (non-GAAP) expense-to-revenue ratio 29.3 % 28.5 % 0.8 pts.
nm - not meaningfulYr. to Yr.
(Dollars in millions) PercentFor the nine months ended September 30: 2015 2014 ChangeTotal consolidated expense and other (income) $ 18,431 $ 20,654 (10.8)%Non-operating adjustments:
Amortization of acquired intangible assets (224) (281) (20.5)Acquisition-related charges (11) (10) 9.4Non-operating retirement-related (costs)/income (481) (106) 355.4
Operating (non-GAAP) expense and other (income) $ 17,715 $ 20,257 (12.5)%Total consolidated expense-to-revenue ratio 30.9 % 30.1 % 0.8 pts.Operating (non-GAAP) expense-to-revenue ratio 29.7 % 29.5 % 0.2 pts.
Total expense and other (income) decreased 10.7 percent in the third quarter and decreased 10.8 percent in the first nine months of 2015 compared to the prior year periods. Total operating (non-GAAP) expense and other (income) decreased 11.5 percent in the third quarter and decreased 12.5 percent in the first nine months of 2015 compared to the third quarter and first nine months of 2014, respectively. The key drivers of the year-to-year change in total expense and other (income) were approximately:
Total Consolidated Operating (non-GAAP)For the three and nine months ended September 30, 2015: Three Months Nine Months Three Months Nine MonthsCurrency* (9) points (10) points (9) points (9) pointsSystem x divestiture (2) points (2) points (2) points (2) pointsDivestiture gains — points 1 point — points 1 pointWorkforce rebalancing 2 points (1) point 2 points (1) point
* Reflects impacts of translation and hedging programs.
For additional information regarding total expense and other (income) for both expense presentations, see the following analyses by category.
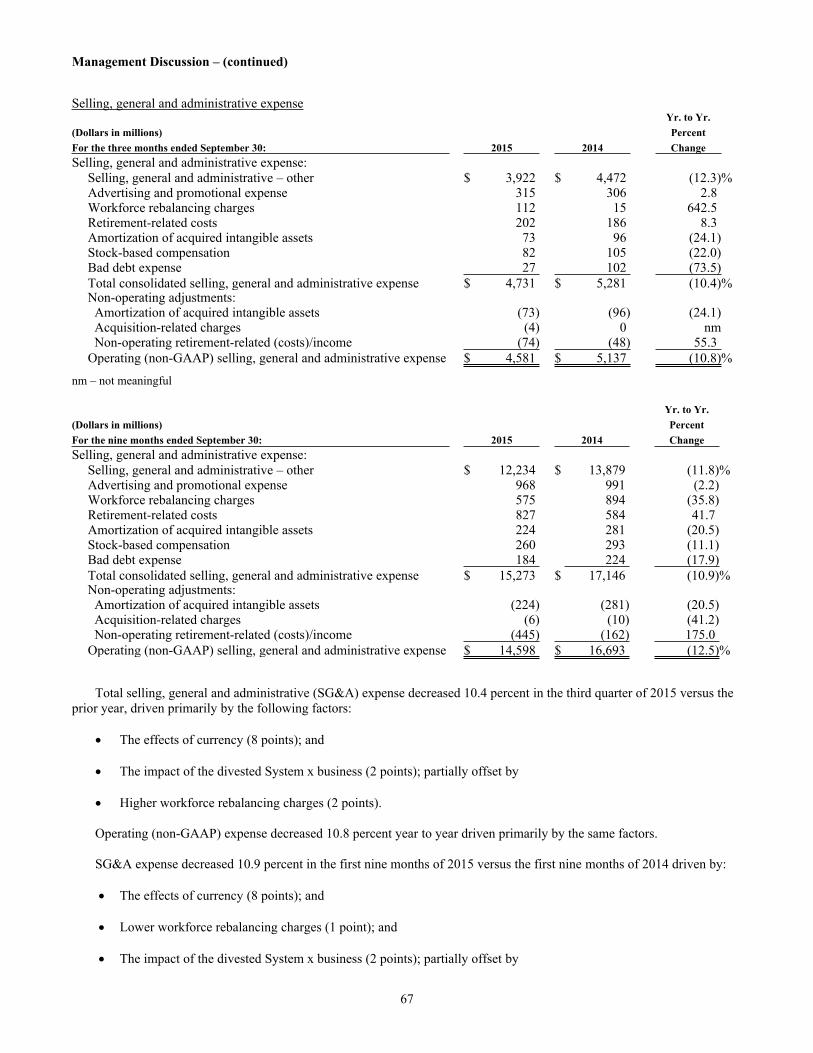
Management Discussion – (continued)
67
Selling, general and administrative expenseYr. to Yr.
(Dollars in millions) PercentFor the three months ended September 30: 2015 2014 ChangeSelling, general and administrative expense:
Selling, general and administrative – other $ 3,922 $ 4,472 (12.3)%Advertising and promotional expense 315 306 2.8Workforce rebalancing charges 112 15 642.5Retirement-related costs 202 186 8.3Amortization of acquired intangible assets 73 96 (24.1)Stock-based compensation 82 105 (22.0)Bad debt expense 27 102 (73.5)Total consolidated selling, general and administrative expense $ 4,731 $ 5,281 (10.4)%Non-operating adjustments: Amortization of acquired intangible assets (73) (96) (24.1) Acquisition-related charges (4) 0 nm Non-operating retirement-related (costs)/income (74) (48) 55.3Operating (non-GAAP) selling, general and administrative expense $ 4,581 $ 5,137 (10.8)%
nm – not meaningful
Yr. to Yr.(Dollars in millions) PercentFor the nine months ended September 30: 2015 2014 ChangeSelling, general and administrative expense:
Selling, general and administrative – other $ 12,234 $ 13,879 (11.8)%Advertising and promotional expense 968 991 (2.2)Workforce rebalancing charges 575 894 (35.8)Retirement-related costs 827 584 41.7Amortization of acquired intangible assets 224 281 (20.5)Stock-based compensation 260 293 (11.1)Bad debt expense 184 224 (17.9)Total consolidated selling, general and administrative expense $ 15,273 $ 17,146 (10.9)%Non-operating adjustments: Amortization of acquired intangible assets (224) (281) (20.5) Acquisition-related charges (6) (10) (41.2) Non-operating retirement-related (costs)/income (445) (162) 175.0Operating (non-GAAP) selling, general and administrative expense $ 14,598 $ 16,693 (12.5)%
Total selling, general and administrative (SG&A) expense decreased 10.4 percent in the third quarter of 2015 versus the prior year, driven primarily by the following factors:
The effects of currency (8 points); and
The impact of the divested System x business (2 points); partially offset by
Higher workforce rebalancing charges (2 points).
Operating (non-GAAP) expense decreased 10.8 percent year to year driven primarily by the same factors.
SG&A expense decreased 10.9 percent in the first nine months of 2015 versus the first nine months of 2014 driven by:
The effects of currency (8 points); and
Lower workforce rebalancing charges (1 point); and
The impact of the divested System x business (2 points); partially offset by
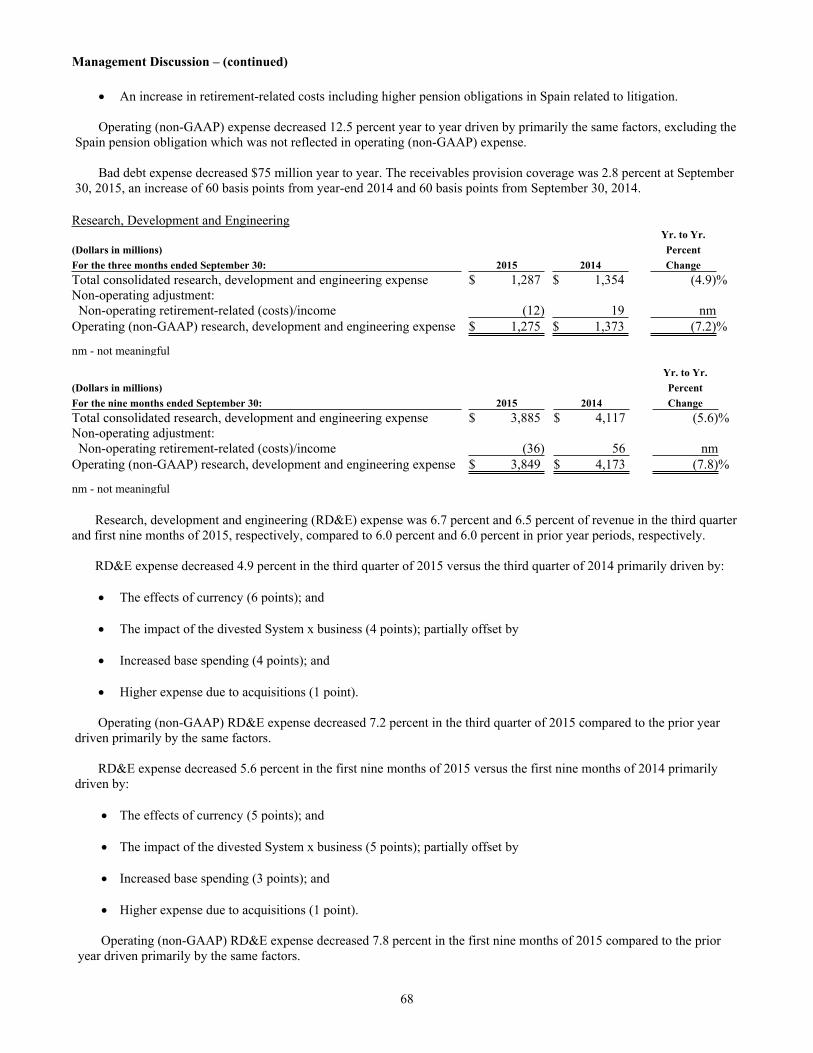
Management Discussion – (continued)
68
An increase in retirement-related costs including higher pension obligations in Spain related to litigation.
Operating (non-GAAP) expense decreased 12.5 percent year to year driven by primarily the same factors, excluding the Spain pension obligation which was not reflected in operating (non-GAAP) expense.
Bad debt expense decreased $75 million year to year. The receivables provision coverage was 2.8 percent at September 30, 2015, an increase of 60 basis points from year-end 2014 and 60 basis points from September 30, 2014.
Research, Development and EngineeringYr. to Yr.
(Dollars in millions) PercentFor the three months ended September 30: 2015 2014 ChangeTotal consolidated research, development and engineering expense $ 1,287 $ 1,354 (4.9)%Non-operating adjustment: Non-operating retirement-related (costs)/income (12) 19 nmOperating (non-GAAP) research, development and engineering expense $ 1,275 $ 1,373 (7.2)%
nm - not meaningful
Yr. to Yr.(Dollars in millions) PercentFor the nine months ended September 30: 2015 2014 ChangeTotal consolidated research, development and engineering expense $ 3,885 $ 4,117 (5.6)%Non-operating adjustment: Non-operating retirement-related (costs)/income (36) 56 nmOperating (non-GAAP) research, development and engineering expense $ 3,849 $ 4,173 (7.8)%
nm - not meaningful
Research, development and engineering (RD&E) expense was 6.7 percent and 6.5 percent of revenue in the third quarter and first nine months of 2015, respectively, compared to 6.0 percent and 6.0 percent in prior year periods, respectively.
RD&E expense decreased 4.9 percent in the third quarter of 2015 versus the third quarter of 2014 primarily driven by:
The effects of currency (6 points); and
The impact of the divested System x business (4 points); partially offset by
Increased base spending (4 points); and
Higher expense due to acquisitions (1 point).
Operating (non-GAAP) RD&E expense decreased 7.2 percent in the third quarter of 2015 compared to the prior year driven primarily by the same factors.
RD&E expense decreased 5.6 percent in the first nine months of 2015 versus the first nine months of 2014 primarily driven by:
The effects of currency (5 points); and
The impact of the divested System x business (5 points); partially offset by
Increased base spending (3 points); and
Higher expense due to acquisitions (1 point).
Operating (non-GAAP) RD&E expense decreased 7.8 percent in the first nine months of 2015 compared to the prior year driven primarily by the same factors.
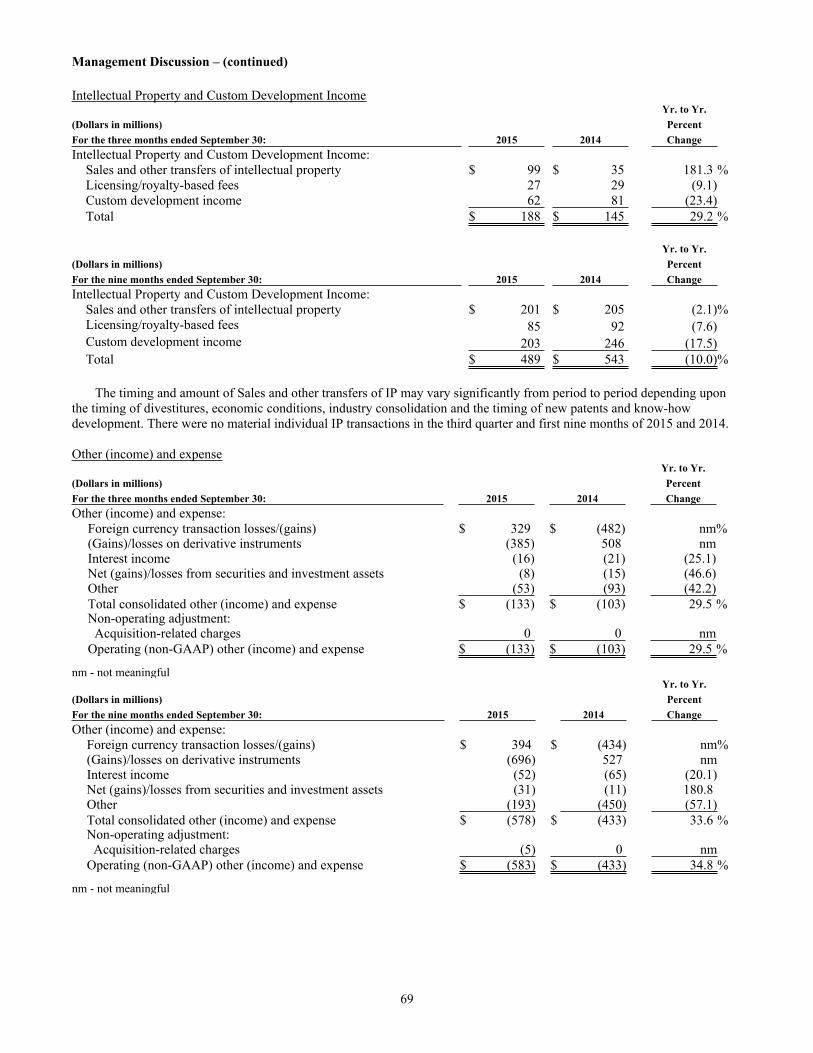
Management Discussion – (continued)
69
Intellectual Property and Custom Development IncomeYr. to Yr.
(Dollars in millions) PercentFor the three months ended September 30: 2015 2014 ChangeIntellectual Property and Custom Development Income:
Sales and other transfers of intellectual property $ 99 $ 35 181.3 %Licensing/royalty-based fees 27 29 (9.1)Custom development income 62 81 (23.4)Total $ 188 $ 145 29.2 %
Yr. to Yr.(Dollars in millions) PercentFor the nine months ended September 30: 2015 2014 ChangeIntellectual Property and Custom Development Income:
Sales and other transfers of intellectual property $ 201 $ 205 (2.1)%Licensing/royalty-based fees 85 92 (7.6)Custom development income 203 246 (17.5)Total $ 489 $ 543 (10.0)%
The timing and amount of Sales and other transfers of IP may vary significantly from period to period depending upon the timing of divestitures, economic conditions, industry consolidation and the timing of new patents and know-how development. There were no material individual IP transactions in the third quarter and first nine months of 2015 and 2014. Other (income) and expense
Yr. to Yr.(Dollars in millions) PercentFor the three months ended September 30: 2015 2014 ChangeOther (income) and expense:
Foreign currency transaction losses/(gains) $ 329 $ (482) nm%(Gains)/losses on derivative instruments (385) 508 nmInterest income (16) (21) (25.1)Net (gains)/losses from securities and investment assets (8) (15) (46.6)Other (53) (93) (42.2)Total consolidated other (income) and expense $ (133) $ (103) 29.5 %Non-operating adjustment: Acquisition-related charges 0 0 nmOperating (non-GAAP) other (income) and expense $ (133) $ (103) 29.5 %
nm - not meaningfulYr. to Yr.
(Dollars in millions) PercentFor the nine months ended September 30: 2015 2014 ChangeOther (income) and expense:
Foreign currency transaction losses/(gains) $ 394 $ (434) nm%(Gains)/losses on derivative instruments (696) 527 nmInterest income (52) (65) (20.1)Net (gains)/losses from securities and investment assets (31) (11) 180.8Other (193) (450) (57.1)Total consolidated other (income) and expense $ (578) $ (433) 33.6 %Non-operating adjustment: Acquisition-related charges (5) 0 nmOperating (non-GAAP) other (income) and expense $ (583) $ (433) 34.8 %
nm - not meaningful
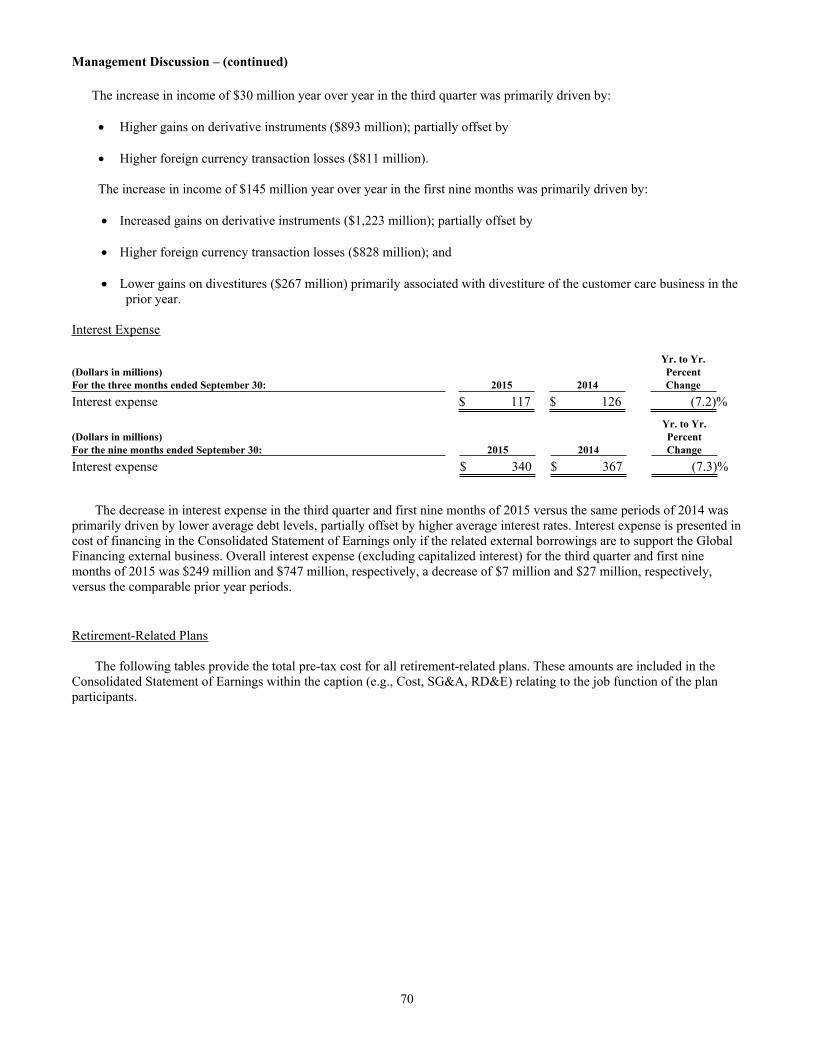
Management Discussion – (continued)
70
The increase in income of $30 million year over year in the third quarter was primarily driven by:
Higher gains on derivative instruments ($893 million); partially offset by
Higher foreign currency transaction losses ($811 million).
The increase in income of $145 million year over year in the first nine months was primarily driven by:
Increased gains on derivative instruments ($1,223 million); partially offset by
Higher foreign currency transaction losses ($828 million); and
Lower gains on divestitures ($267 million) primarily associated with divestiture of the customer care business in the prior year.
Interest Expense
Yr. to Yr.(Dollars in millions) PercentFor the three months ended September 30: 2015 2014 ChangeInterest expense $ 117 $ 126 (7.2)%
Yr. to Yr.(Dollars in millions) PercentFor the nine months ended September 30: 2015 2014 ChangeInterest expense $ 340 $ 367 (7.3)%
The decrease in interest expense in the third quarter and first nine months of 2015 versus the same periods of 2014 was primarily driven by lower average debt levels, partially offset by higher average interest rates. Interest expense is presented in cost of financing in the Consolidated Statement of Earnings only if the related external borrowings are to support the Global Financing external business. Overall interest expense (excluding capitalized interest) for the third quarter and first nine months of 2015 was $249 million and $747 million, respectively, a decrease of $7 million and $27 million, respectively, versus the comparable prior year periods.
Retirement-Related Plans
The following tables provide the total pre-tax cost for all retirement-related plans. These amounts are included in the Consolidated Statement of Earnings within the caption (e.g., Cost, SG&A, RD&E) relating to the job function of the plan participants.
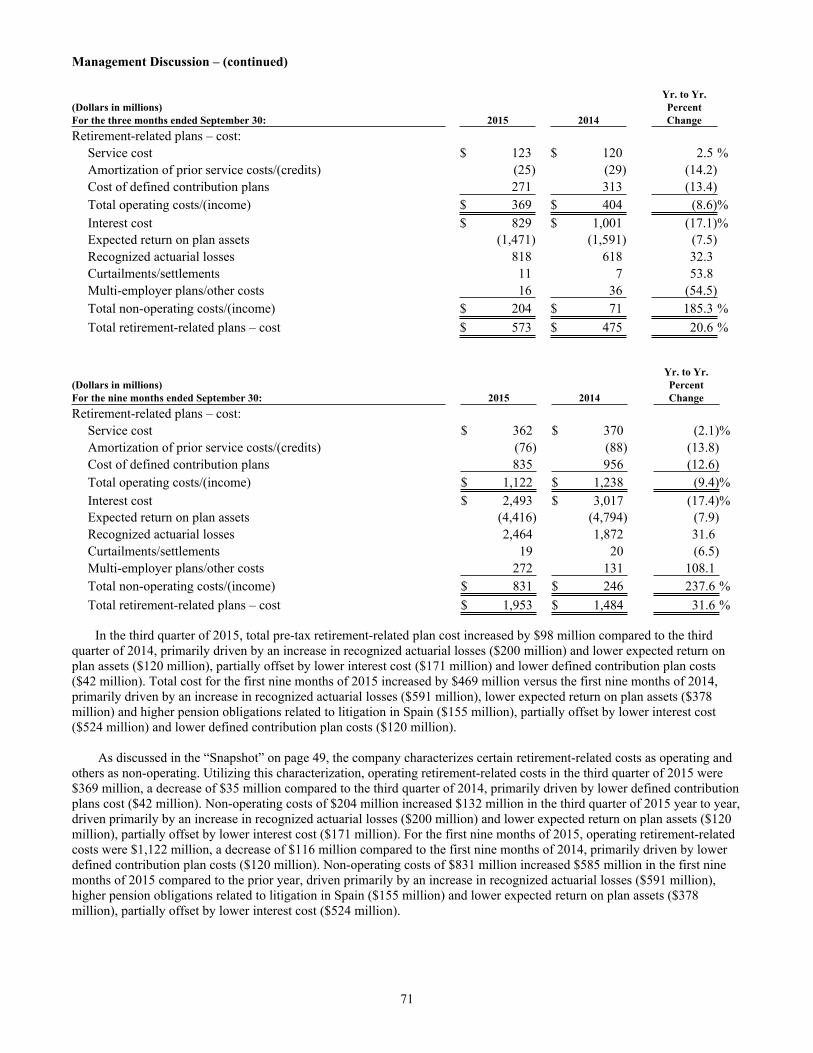
Management Discussion – (continued)
71
Yr. to Yr.(Dollars in millions) PercentFor the three months ended September 30: 2015 2014 ChangeRetirement-related plans – cost:
Service cost $ 123 $ 120 2.5 %Amortization of prior service costs/(credits) (25) (29) (14.2)Cost of defined contribution plans 271 313 (13.4)Total operating costs/(income) $ 369 $ 404 (8.6)%Interest cost $ 829 $ 1,001 (17.1)%Expected return on plan assets (1,471) (1,591) (7.5)Recognized actuarial losses 818 618 32.3Curtailments/settlements 11 7 53.8Multi-employer plans/other costs 16 36 (54.5)Total non-operating costs/(income) $ 204 $ 71 185.3 %Total retirement-related plans – cost $ 573 $ 475 20.6 %
Yr. to Yr.(Dollars in millions) PercentFor the nine months ended September 30: 2015 2014 ChangeRetirement-related plans – cost:
Service cost $ 362 $ 370 (2.1)%Amortization of prior service costs/(credits) (76) (88) (13.8)Cost of defined contribution plans 835 956 (12.6)Total operating costs/(income) $ 1,122 $ 1,238 (9.4)%Interest cost $ 2,493 $ 3,017 (17.4)%Expected return on plan assets (4,416) (4,794) (7.9)Recognized actuarial losses 2,464 1,872 31.6Curtailments/settlements 19 20 (6.5)Multi-employer plans/other costs 272 131 108.1Total non-operating costs/(income) $ 831 $ 246 237.6 %Total retirement-related plans – cost $ 1,953 $ 1,484 31.6 %
In the third quarter of 2015, total pre-tax retirement-related plan cost increased by $98 million compared to the third quarter of 2014, primarily driven by an increase in recognized actuarial losses ($200 million) and lower expected return on plan assets ($120 million), partially offset by lower interest cost ($171 million) and lower defined contribution plan costs ($42 million). Total cost for the first nine months of 2015 increased by $469 million versus the first nine months of 2014, primarily driven by an increase in recognized actuarial losses ($591 million), lower expected return on plan assets ($378 million) and higher pension obligations related to litigation in Spain ($155 million), partially offset by lower interest cost ($524 million) and lower defined contribution plan costs ($120 million).
As discussed in the “Snapshot” on page 49, the company characterizes certain retirement-related costs as operating and others as non-operating. Utilizing this characterization, operating retirement-related costs in the third quarter of 2015 were $369 million, a decrease of $35 million compared to the third quarter of 2014, primarily driven by lower defined contribution plans cost ($42 million). Non-operating costs of $204 million increased $132 million in the third quarter of 2015 year to year, driven primarily by an increase in recognized actuarial losses ($200 million) and lower expected return on plan assets ($120 million), partially offset by lower interest cost ($171 million). For the first nine months of 2015, operating retirement-related costs were $1,122 million, a decrease of $116 million compared to the first nine months of 2014, primarily driven by lower defined contribution plan costs ($120 million). Non-operating costs of $831 million increased $585 million in the first nine months of 2015 compared to the prior year, driven primarily by an increase in recognized actuarial losses ($591 million), higher pension obligations related to litigation in Spain ($155 million) and lower expected return on plan assets ($378 million), partially offset by lower interest cost ($524 million).
Management Discussion – (continued)
72
Taxes
The continuing operations effective tax rate for the third quarter of 2015 was 18.2 percent, a decrease of 2.6 points compared to the third quarter of 2014. The continuing operations effective tax rate for the first nine months of 2015 was 17.9 percent, a decrease of 2.7 points compared to the first nine months of 2014. The operating (non-GAAP) tax rate for the third quarter of 2015 was 18.0 percent, a decrease of 2.8 points versus the third quarter of 2014. The operating (non-GAAP) tax rate for the first nine months of 2015 was 18.3 percent, a decrease of 2.3 points versus the first nine months of 2014.
The decrease in the third quarter rate was primarily driven by a discrete period benefit resulting from an increase in the utilization of prior year foreign tax credits (10.4 points), net year to year discrete period benefits related to audit activity (0.9 points), as well as a more favorable geographic mix of pre-tax income (1.0 points). These benefits were partially offset by a tax charge related to certain intercompany payments made by foreign subsidiaries and the tax costs associated with the intercompany licensing of certain IP in the third quarter (9.7 points). The decrease in the third quarter operating (non-GAAP) rate was primarily driven by the same factors.
The decrease in the tax rate for the first nine months was primarily driven by the third quarter discrete period benefit resulting from the increase in the utilization of prior year foreign tax credits (3.5 points), net discrete benefits related to audit activity (1.4 points), primarily occurring in the second quarter, as well as a more favorable geographic mix of pre-tax income (1.0 points). These benefits were partially offset by the third quarter tax charge related to certain intercompany payments made by foreign subsidiaries and the tax costs associated with the intercompany licensing of certain IP (3.3 points). The decrease in the operating (non-GAAP) rate for the first nine months was primarily driven by the same factors.
With respect to major U.S. state and foreign taxing jurisdictions, the company is generally no longer subject to tax examinations for years prior to 2009. The company is no longer subject to income tax examination of its U.S. federal tax return for years prior to 2011. The open years contain matters that could be subject to differing interpretations of applicable tax laws and regulations as it relates to the amount and/or timing of income, deductions and tax credits. Although the outcome of tax audits is always uncertain, the company believes that adequate amounts of tax and interest have been provided for any adjustments that are expected to result for these years.
The amount of unrecognized tax benefits at December 31, 2014 increased by $39 million in the third quarter of 2015 and increased by $99 million in the first nine months of 2015 to $5,203 million. The total amount of unrecognized tax benefits that, if recognized, would favorably affect the effective tax rate was $4,236 million at September 30, 2015.
In April 2010, the company appealed the determination of the Japanese Tax Authorities with respect to certain foreign tax losses. The tax benefit of these losses, approximately $1,002 million adjusted for currency, has been included in unrecognized tax benefits. In April 2011, the company received notification that the appeal was denied, and in June 2011, the company filed a lawsuit challenging this decision. In May 2014, the Tokyo District Court ruled in favor of the company. The Japanese government appealed the ruling to the Tokyo High Court. On March 25, 2015, the Tokyo High Court ruled in favor of IBM and, on April 7, 2015, the Japanese government appealed the ruling to the Japan Supreme Court. No final determination has been reached on this matter.
In the fourth quarter of 2013, the company received a draft tax assessment notice, currently valued at approximately $817 million from the Indian Tax Authorities for 2009. The company believes it will prevail on these matters and that this amount is not a meaningful indicator of liability. At September 30, 2015, the company has recorded $490 million as prepaid income taxes in India. A significant portion of this balance represents cash tax deposits paid over time to protect the company’s right to appeal various income tax assessments made by the Indian Tax Authorities.
In the first quarter of 2014, the IRS commenced its audit of the company’s U.S. income tax returns for 2011 and 2012. The company anticipates that this audit will be completed by the end of 2015.
Earnings Per Share
Basic earnings per share is computed on the basis of the weighted-average number of shares of common stock outstanding during the period. Diluted earnings per share is computed on the basis of the weighted-average number of shares of common stock outstanding plus the effect of dilutive potential common shares outstanding during the period using the treasury stock method. Dilutive potential common shares include outstanding stock options and stock awards.
Management Discussion – (continued)
73
Yr. to Yr.Percent
For the three months ended September 30: 2015 2014 ChangeEarnings per share of common stock from continuing operations:
Assuming dilution $ 3.02 $ 3.46 (12.7)%Basic $ 3.04 $ 3.48 (12.6)%Diluted operating (non-GAAP) $ 3.34 $ 3.68 (9.2)%
Weighted-average shares outstanding: (in millions)Assuming dilution 979.0 997.7 (1.9)%Basic 975.1 991.8 (1.7)%
Yr. to Yr.Percent
For the nine months ended September 30: 2015 2014 ChangeEarnings per share of common stock from continuing operations:
Assuming dilution $ 9.03 $ 10.09 (10.5)%Basic $ 9.07 $ 10.15 (10.6)%Diluted operating (non-GAAP) $ 10.09 $ 10.76 (6.2)%
Weighted-average shares outstanding: (in millions)Assuming dilution 986.0 1,014.9 (2.8)%Basic 981.8 1,008.9 (2.7)%
Actual shares outstanding at September 30, 2015 were 970.1 million. The weighted-average number of common shares outstanding assuming dilution during the third quarter and first nine months of 2015 were 18.7 million and 28.9 million shares lower, respectively, than the same periods in 2014. The decrease was primarily the result of the common stock repurchase program. Results of Discontinued Operations
The loss from discontinued operations, net of tax, was $12 million and $176 million in the third quarter and first nine months, respectively, of 2015 compared to $3,437 million and $3,698 million in the third quarter and first nine months, respectively, of 2014. The loss from discontinued operations in the third quarter and first nine months of 2014 included a non-recurring pre-tax charge of $4,697 million which included an impairment to reflect the fair value less estimated costs to sell the Microelectronics business and other estimated costs related to the transaction, including cash consideration. The discontinued operations effective tax rate in the third quarter of 2015 was 78.8 percent compared to 29.0 percent in the third quarter of 2014 and was 38.0 percent in the first nine months of 2015 compared to 29.1 percent in the prior year period.
Financial Position
Dynamics
At September 30, 2015, the company continued to have the financial flexibility to support the business over the long term. Cash and marketable securities at quarter end were $9,568 million. Total debt of $39,660 million decreased $1,144 million from prior year-end levels, driven by maturities of $5,389 million, partially offset by new debt issuances of $3,705 million and commercial paper of $950 million. Within total debt, $25,969 million, or approximately 65 percent, is in support of the Global Financing business. The company continues to manage the investment portfolio to meet its capital preservation and liquidity objectives. In the first nine months of 2015, the company generated $11,729 million in cash from operations, an increase of $920 million compared to the first nine months of 2014. The company has consistently generated strong cash flow from operations and continues to have access to additional sources of liquidity through the capital markets and its $10 billion global credit facility. In October 2015, the term of the five-year global credit facility was extended by one year, and now expires on November 10, 2020.
The assets and debt associated with the Global Financing business are a significant part of the company’s financial position. The financial position amounts appearing on pages 5 and 6 are the consolidated amounts including Global Financing. The amounts appearing in the separate Global Financing section, beginning on page 81, are supplementary data presented to facilitate an understanding of the Global Financing business.
Management Discussion – (continued)
74
Working Capital
At September 30, At December 31,(Dollars in millions) 2015 2014Current assets $ 42,112 $ 49,422Current liabilities 33,732 39,600Working capital $ 8,379 $ 9,822
Current ratio 1.25:1 1.25:1
Working capital decreased $1,442 million from the year-end 2014 position. The key changes are described below:
Current assets decreased $7,310 million ($5,075 million adjusted for currency), due to:
A decline of $3,640 million ($2,548 million adjusted for currency) in financing receivables primarily due to collections of higher year-end balances; and
A decline of $1,975 million ($1,922 million adjusted for currency) in other accounts receivable primarily the result of the collection of tax refunds; and
A decline of $1,103 million ($618 million adjusted for currency) in trade accounts receivable driven by collections of higher year-end balances; and
A decline of $809 million ($557 million adjusted for currency) in prepaid expenses and other current assets due to decreases in counterparty collateral postings and derivative assets; and
A decline of $491 million ($427 million adjusted for currency) in inventories primarily driven by the Microelectronics divestiture; partially offset by
An increase of $1,004 million ($1,197 million adjusted for currency) in cash and cash equivalents.
Current liabilities decreased $5,868 million ($4,384 million adjusted for currency), as a result of:
A decrease in taxes of $2,201 million ($2,003 million adjusted for currency) primarily driven by income tax payments and a tax benefit associated with the Microelectronics divestiture; and
A decrease in other accrued expenses and liabilities of $2,111 million ($1,880 million adjusted for currency) driven by the cash consideration associated with the Microelectronics divestiture and by workforce rebalancing payments; and
A decrease in accounts payable of $1,699 million ($1,481 million adjusted for currency) reflecting declines from
typically higher year-end balances and the wind-down of the divested System x business payables; and
A decrease in deferred income of $1,419 million ($906 million adjusted for currency) driven by amortization; partially offset by
An increase in short-term debt of $1,807 million ($1,930 million adjusted for currency) primarily as a result of reclassifications of $5,441 million from long term to reflect upcoming maturities, commercial paper of $950 million and issuances of $782 million, partially offset by maturities of $5,389 million.
Cash Flow
The company’s cash flows from operating, investing and financing activities, as reflected in the Consolidated Statement of Cash Flows on page 7, are summarized in the following table. These amounts include the cash flows associated with the Global Financing business.
Management Discussion – (continued)
75
(Dollars in millions)For the nine months ended September 30: 2015 2014Net cash provided by/(used in) continuing operations: Operating activities $ 11,729 $ 10,809 Investing activities (2,714) (1,765) Financing activities (7,818) (9,753)Effect of exchange rate changes on cash and cash equivalents (194) (447)Net change in cash and cash equivalents $ 1,004 $ (1,155)
Net cash provided by operating activities increased by $920 million as compared to the first nine months of 2014 driven by the following factors:
A decrease in income taxes paid of $2,799 million; and
An improvement in accounts payable of $462 million driven by a lower opening balance; partially offset by An increase in performance based compensation payments of $456 million; and
Performance related declines within net income.
Net cash used in investing activities increased $949 million compared to the first nine months in 2014 driven by:
An increase in net cash used related to acquisitions and divestitures of $1,147 million primarily driven by the net cash consideration payment associated with the Microelectronics divestiture; and
Lower cash sourced from sales of marketable securities and other investments of $228 million; partially offset by
Higher cash from non-operating finance receivables of $386 million.
Net cash used in financing activities decreased $1,935 million as compared to the first nine months of 2014 driven by the following factors:
A decrease of $9,701 million of cash used for gross share repurchases; partially offset by
A decrease in net cash sourced from debt transactions of $7,029 million driven by a lower level of issuances in the current year; and
An increase in dividend payments of $460 million.
Noncurrent Assets and LiabilitiesAt September 30, At December 31,
(Dollars in millions) 2015 2014Noncurrent assets $ 66,537 $ 68,110Long-term debt $ 32,122 $ 35,073Noncurrent liabilities (excluding debt) $ 29,344 $ 30,844
The decrease in noncurrent assets of $1,573 million (an increase of $1,273 million adjusted for currency) was driven by:
A decrease of $1,592 million in long-term financing receivables ($734 million adjusted for currency) reflecting seasonal reductions from higher year-end balances; and
A decrease of $1,118 million in deferred taxes ($879 million adjusted for currency) driven by retirement related plan activity and a tax benefit associated with the Microelectronics divestiture; and
A decrease of $328 million in net intangible assets driven by amortization; partially offset by
Management Discussion – (continued)
76
An increase in retirement plans assets of $1,873 million ($1,948 million adjusted for currency) driven by the expected returns on plan assets.
Long-term debt decreased $2,952 million ($2,459 million adjusted for currency) from the year-end balance primarily driven by:
Reclassifications of $5,441 million to reflect upcoming maturities; partially offset by
Issuances of $2,922 million.
The decrease in noncurrent liabilities (excluding debt) of $1,500 million ($108 million adjusted for currency) was driven by:
A decrease in retirement and nonpension postretirement liabilities of $1,249 million driven by a currency impact of $875 million.
Debt
The company’s funding requirements are continually monitored and strategies are executed to manage the overall asset and liability profile. Additionally, the company maintains sufficient flexibility to access global funding sources as needed.
At September 30, At December 31,(Dollars in millions) 2015 2014Total company debt $ 39,660 $ 40,804Total Global Financing segment debt $ 25,969 $ 29,103 Debt to support external clients 22,450 25,531 Debt to support internal clients 3,519 3,572Non-Global Financing debt $ 13,691 $ 11,701
Global Financing provides financing predominantly for the company’s external client assets, as well as for assets under contract by other IBM units. These assets, primarily for Global Services, generate long-term, stable revenue streams similar to the Global Financing asset portfolio. Based on their attributes, these Global Services assets are leveraged with the balance of the Global Financing asset base. The debt analysis above is further detailed in the Global Financing section on page 85.
Non-Global Financing debt of $13,691 million was up $1,989 million from December 31, 2014, but decreased $3,361 million from the third quarter of 2014. Given the significant leverage, the company presents a debt-to-capitalization ratio which excludes Global Financing debt and equity as management believes this is more representative of the company’s core business operations. This ratio can vary from period to period as the company manages its global cash and debt positions.
“Core” debt-to-capitalization ratio (excluding Global Financing debt and equity) was 58.4 percent at September 30, 2015 compared to 59.4 percent at December 31, 2014 and 61.9 percent at September 30, 2014.
Consolidated debt-to-capitalization ratio at September 30, 2015 was 74.7 percent versus 77.3 percent at December 31, 2014 and 76.0 percent at September 30, 2014.
Equity
Total equity increased by $1,437 million from December 31, 2014 as a result of an increase in retained earnings of $5,105 million, an increase in retirement-related pension amounts of $1,608 million and an increase in common stock of $554 million, partially offset by an increase in treasury stock of $3,954 million primarily due to common stock repurchases and declines of $1,593 million related to currency translation.
Management Discussion – (continued)
77
Looking Forward
The company measures the success of its business model over the long term, not any individual quarter or year. The company’s strategies, investments and actions are all taken with an objective of optimizing long-term performance. A long-term perspective ensures that the company is well-positioned to take advantage of major shifts occurring in technology, business and the global economy. Within the IT industry, there are major shifts occurring—driven by data, cloud and changes in the ways individuals and enterprises are engaging. In February 2015, the company met with investors to discuss how it is transforming the business to where the company sees the long term value in enterprise IT. The company’s strategic direction is clear and compelling, and the company has been successful in shifting to the higher value areas. The strong revenue growth in the strategic imperatives confirms that, as does the overall profitability of the business. The company expects the industry to continue to shift. The company expects revenue from its strategic imperatives to continue to grow at a double-digit rate. These offerings are as high value as other parts of the business, which continue to manage clients’ most critical business processes. As the cloud business gets to scale, and with ongoing productivity improvements across the business, the company expects to have an opportunity to expand margin. In addition, the company expects to continue to allocate its capital efficiently and effectively to investments, and to return value to its shareholders through a combination of dividends and share repurchases. Over the longer term, in considering the opportunities it will continue to develop, the company expects to have the ability to generate low single-digit revenue growth, and with a higher value business mix, high single-digit operating (non-GAAP) earnings per share growth, with free cash flow realization in the 90’s percent range. This is a longer term growth trajectory, not an absolute end point or a multi-year objective.
In the first nine months of 2015, the company’s results reflect the progress that it is making in the transformation. The company continues to move aggressively and decisively to reshape the business to best address the long-term value in enterprise IT. The company continued to shift investments and resources, establish new partnerships and ecosystems and introduce new innovations to the marketplace, including the launch of the industry’s first consulting practice dedicated to cognitive business. Each action that the company takes contributes to its transformation and improves the business for the long term. In the first nine months, total revenue declined less than 1 percent year to year, adjusted for currency and the impact of divested businesses. Revenue from the strategic imperatives grew more than 30 percent adjusted for currency and divestitures. There was significant strength in high-end systems, as the company’s new products address the most contemporary workloads in data, cloud and mobile. This strength, together with the overall shift to higher value and the company’s portfolio actions, drove margin expansion on the fairly stable revenue base. The company has maintained a high level of investment, as it shifts its spending to the strategic imperatives. The company has realized returns on these investments, as demonstrated by the strategic imperatives revenue growth. At the same time, the core is declining, in a declining market, as the company delivers productivity to its clients so that they can invest in the new areas. The company has stated that this transformation takes time, and its progression would not be a straight line. However, execution over this sustained period is a proof point that the company is on the right path.
The company has made significant progress in driving the transformation of the business. However, the Global Business Services transformation is taking longer, which is putting some pressure on the company’s revenue and profit. In addition, the company had weaker transaction performance at the end of the third quarter, which when applied to the larger transaction base in the fourth quarter, has a more significant impact. At the same time, the company will continue to invest into the strategic imperatives where it sees tremendous opportunity – to accelerate this transformation. Taking all of this into consideration, in October 2015, the company updated its expectations for the full year 2015 for GAAP earnings per share from continuing operations to be in the range of $13.25 to $14.25, and operating (non-GAAP) earnings per share to be in the range of $14.75 to $15.75. Putting the low end of the operating (non-GAAP) earnings per share range into perspective, the $14.75 not only reflects the transaction trajectory at the end of the third quarter, but is also in line with a typical third to fourth quarter skew. The change in profit expectations has less impact on free cash flow for the year, as most of the transactions would occur late in the quarter. Therefore, the company continues to expect free cash flow to be approximately flat versus the prior year. Going forward, the company expects to continue strong growth in its strategic imperatives, and it expects to continue to invest at a high level to drive the transformation, while returning value to shareholders. Importantly, the company is continuing to manage the business for the long term.
In the present currency environment, and considering the impact from the completed divestitures, total revenue as reported is expected to decline in 2015. At October 2015 spot rates, the company expects the negative impact from currency on revenue to be approximately 5 points in the fourth quarter and approximately 7-8 points for the full year. The impact of divested businesses has no impact in the fourth quarter and is 3 points for the full year 2015. Therefore, the combined negative impact of currency at these spot rates and the divested businesses is expected to be approximately 5 points in the
Management Discussion – (continued)
78
fourth quarter and 10-11 points for the full year. Also, as with all companies with a similar global business profile, with the dollar strengthening, the company expects currency will have a significant translation impact on its profit growth. The estimated impact to operating (non-GAAP) earnings growth in the first nine months of 2015 was approximately $0.56 per share. Based on year-to-date performance and October 2015 spot rates, the company now expects currency to impact operating (non-GAAP) earnings year-to-year growth by more than $0.80 per share for the full year.
Within the company’s earnings per share expectation for 2015, with the flow through from the prior year share reduction, the first nine months repurchase amount and the remaining authorization, the company is expecting a 2-3 point benefit from share repurchases—less than the benefit in 2014. At the end of September 2015, the company had approximately $2.4 billion of repurchase authorization remaining.
The company expects, in the normal course of business, that its effective tax rate and operating (non-GAAP) tax rate will
be approximately 20 percent. The tax rate in the first nine months of 2015 reflected a benefit from certain discrete items. The rate will change year to year based on nonrecurring events, such as the settlement of income tax audits and changes in tax laws, as well as recurring factors including the geographic mix of income before taxes, the timing and amount of foreign dividend repatriation, state and local taxes and the effects of various global income tax strategies.
The company expects 2015 pre-tax retirement-related plan cost to be approximately $2.6 billion, an increase of approximately $600 million compared to 2014. This estimate reflects current pension plan assumptions at December 31, 2014. Within total retirement-related plan cost, operating retirement-related plan cost is expected to be approximately $1.5 billion, a decrease of approximately $100 million versus 2014. Non-operating retirement-related plan cost is expected to be approximately $1.1 billion, an increase of approximately $700 million compared to 2014, driven by increased recognized actuarial losses and the additional Spain pension-related obligation. Contributions for all retirement-related plans are expected to be approximately $2.6 billion in 2015, essentially flat compared to 2014.
Currency Rate Fluctuations
Changes in the relative values of non-U.S. currencies to the U.S. dollar (USD) affect the company’s financial results and financial position. At September 30, 2015, currency changes resulted in assets and liabilities denominated in local currencies being translated into fewer dollars than at year-end 2014. The company uses financial hedging instruments to limit specific currency risks related to financing transactions and other foreign currency-based transactions.
Foreign currency fluctuations often drive operational responses that mitigate the simple mechanical translation of earnings. During periods of sustained movements in currency, the marketplace and competition adjust to the changing rates. For example, when pricing offerings in the marketplace, the company may use some of the advantage from a weakening U.S. dollar to improve its position competitively, and price more aggressively to win the business, essentially passing on a portion of the currency advantage to its customers. Competition will frequently take the same action. Consequently, the company believes that some of the currency-based changes in cost impact the prices charged to clients. The company also maintains currency hedging programs for cash management purposes which mitigate, but do not eliminate, the volatility of currency impacts on the company’s financial results.
The company translates revenue, cost and expense in its non-U.S. operations at current exchange rates in the reported period. References to “adjusted for currency” or “constant currency” reflect adjustments based upon a simple constant currency mathematical translation of local currency results using the comparable prior period’s currency conversion rate. However, this constant currency methodology that the company utilizes to disclose this information does not incorporate any operational actions that management could take to mitigate fluctuating currency rates. Currency movements impacted the company’s year-to-year revenue and earnings per share growth in the first nine months of 2015. Based on the currency rate movements in the first nine months of 2015, total revenue decreased 13.1 percent as reported and decreased 4.8 percent at constant currency versus the first nine months of 2014. On an income from continuing operations before income tax basis, these translation impacts offset by the net impact of hedging activities resulted in a theoretical maximum (assuming no pricing or sourcing actions) decrease of approximately $700 million in the first nine months of 2015 on an as reported basis, and a decrease of approximately $900 million on an operating (non-GAAP) basis. The same mathematical exercise resulted in a decrease of approximately $75 million in the first nine months of 2014 on both an as reported and operating (non-GAAP) basis. The company views these amounts as a theoretical maximum impact to its as-reported financial results. Considering the operational responses mentioned above, movements of exchange rates, and the nature and timing of hedging instruments, it is difficult to predict future currency impacts on any particular period, but the company believes it could be substantially less than the theoretical maximum given the competitive pressure in the marketplace.
Management Discussion – (continued)
79
For non-U.S. subsidiaries and branches that operate in U.S. dollars or whose economic environment is highly inflationary, translation adjustments are reflected in results of operations. Generally, the company manages currency risk in these entities by linking prices and contracts to U.S. dollars.
The company continues to monitor the economic conditions in Venezuela. In March 2013, the Venezuelan government created a new foreign exchange mechanism called the “Complimentary System of Foreign Currency Acquirement” (or the “SICAD 1”). This system operates similar to an auction system and allows entities in specific sectors to bid for U.S. dollars to be used for specific import transactions. In March 2014, the company adopted the SICAD 1 rate of 10.7 Bolivar (Bs) per USD. In the first quarter of 2014, the company recorded a pre-tax loss of $31 million as a result of the devaluation in other (income) and expense in the Consolidated Statement of Earnings. In February 2015, the Venezuelan government created a new foreign exchange platform, the Marginal Currency System, or SIMADI. The company will continue to monitor transactions from these exchange systems going-forward in 2015. At the September 30, 2015 SICAD rate of 13.5 Bs/USD, the company’s net asset position in Venezuela was $33 million, reflecting a $2 million currency loss recorded in the third quarter. For the first nine months of 2015, the company has recorded $4 million in currency losses. The company’s operations in Venezuela comprised less than 1 percent of total 2014 and 2013 revenue, respectively.
Liquidity and Capital Resources
In the company’s 2014 Annual Report, on pages 65 to 68, there is a discussion of the company’s liquidity including two tables that present five years of data. The table presented on page 65 includes net cash from operating activities, cash and marketable securities and the size of the company’s global credit facilities for each of the past five years. For the nine months ended, or as of, as applicable, September 30, 2015, those amounts are $11.7 billion for net cash from operating activities, $9.6 billion of cash and marketable securities and $10 billion in global credit facilities, respectively. In October 2015, the term of the five-year global credit facility was extended by one year, and now expires on November 10, 2020.
The major rating agencies’ ratings on the company’s debt securities at September 30, 2015 appear in the table below. The agency ratings remain unchanged from December 31, 2014. Standard and Poor’s, Moody’s Investors Service and Fitch Ratings reaffirmed their credit ratings on April 21, 2015, March 30, 2015 and June 24, 2015, respectively. The company does not have “ratings trigger” provisions in its debt covenants or documentation, which would allow the holders to declare an event of default and seek to accelerate payments thereunder in the event of a change in credit rating. The company’s contractual agreements governing derivative instruments contain standard market clauses which can trigger the termination of the agreement if the company’s credit rating were to fall below investment grade. At September 30, 2015, the fair value of those instruments that were in a liability position was $230 million, before any applicable netting, and this position is subject to fluctuations in fair value period to period based on the level of the company’s outstanding instruments and market conditions. The company has no other contractual arrangements that, in the event of a change in credit rating, would result in a material adverse effect on its financial position or liquidity.
STANDARD MOODY'SAND INVESTORS FITCH
POOR'S SERVICE RATINGSSenior long-term debt AA- Aa3 A+Commercial paper A-1+ Prime-1 F1
The table appearing on page 66 of the company’s 2014 Annual Report presents the format in which management reviews cash flows for each of the past five years and is accompanied by a description of the way cash flow is managed, measured and reviewed. The company prepares its Consolidated Statement of Cash Flows in accordance with applicable accounting standards for cash flow presentation on page 7 of this Form 10-Q and highlights causes and events underlying sources and uses of cash in that format on page 75. The following is management’s view of cash flows for the first nine months of 2015 and 2014 prepared in a manner consistent with the table and description on pages 66 and 67 of the company’s 2014 Annual Report.
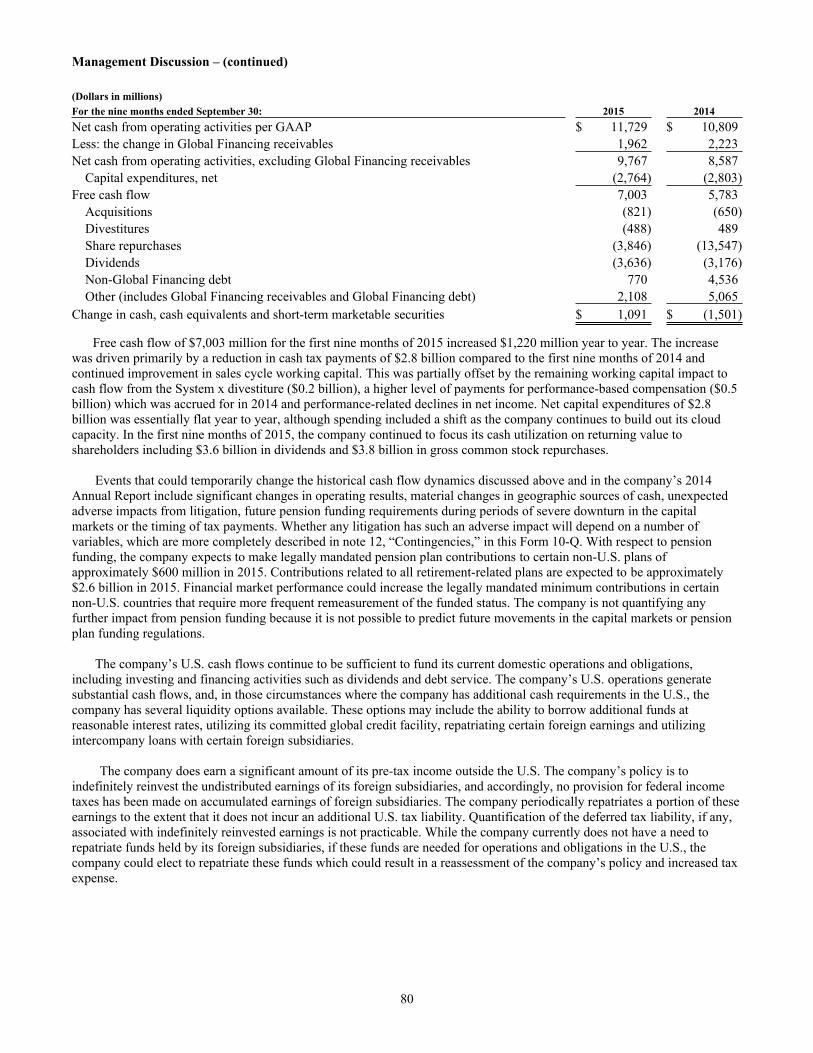
Management Discussion – (continued)
80
(Dollars in millions)For the nine months ended September 30: 2015 2014Net cash from operating activities per GAAP $ 11,729 $ 10,809Less: the change in Global Financing receivables 1,962 2,223Net cash from operating activities, excluding Global Financing receivables 9,767 8,587 Capital expenditures, net (2,764) (2,803)Free cash flow 7,003 5,783 Acquisitions (821) (650) Divestitures (488) 489 Share repurchases (3,846) (13,547) Dividends (3,636) (3,176) Non-Global Financing debt 770 4,536 Other (includes Global Financing receivables and Global Financing debt) 2,108 5,065Change in cash, cash equivalents and short-term marketable securities $ 1,091 $ (1,501)
Free cash flow of $7,003 million for the first nine months of 2015 increased $1,220 million year to year. The increase was driven primarily by a reduction in cash tax payments of $2.8 billion compared to the first nine months of 2014 and continued improvement in sales cycle working capital. This was partially offset by the remaining working capital impact to cash flow from the System x divestiture ($0.2 billion), a higher level of payments for performance-based compensation ($0.5 billion) which was accrued for in 2014 and performance-related declines in net income. Net capital expenditures of $2.8 billion was essentially flat year to year, although spending included a shift as the company continues to build out its cloud capacity. In the first nine months of 2015, the company continued to focus its cash utilization on returning value to shareholders including $3.6 billion in dividends and $3.8 billion in gross common stock repurchases.
Events that could temporarily change the historical cash flow dynamics discussed above and in the company’s 2014 Annual Report include significant changes in operating results, material changes in geographic sources of cash, unexpected adverse impacts from litigation, future pension funding requirements during periods of severe downturn in the capital markets or the timing of tax payments. Whether any litigation has such an adverse impact will depend on a number of variables, which are more completely described in note 12, “Contingencies,” in this Form 10-Q. With respect to pension funding, the company expects to make legally mandated pension plan contributions to certain non-U.S. plans of approximately $600 million in 2015. Contributions related to all retirement-related plans are expected to be approximately $2.6 billion in 2015. Financial market performance could increase the legally mandated minimum contributions in certain non-U.S. countries that require more frequent remeasurement of the funded status. The company is not quantifying any further impact from pension funding because it is not possible to predict future movements in the capital markets or pension plan funding regulations.
The company’s U.S. cash flows continue to be sufficient to fund its current domestic operations and obligations, including investing and financing activities such as dividends and debt service. The company’s U.S. operations generate substantial cash flows, and, in those circumstances where the company has additional cash requirements in the U.S., the company has several liquidity options available. These options may include the ability to borrow additional funds at reasonable interest rates, utilizing its committed global credit facility, repatriating certain foreign earnings and utilizing intercompany loans with certain foreign subsidiaries.
The company does earn a significant amount of its pre-tax income outside the U.S. The company’s policy is to indefinitely reinvest the undistributed earnings of its foreign subsidiaries, and accordingly, no provision for federal income taxes has been made on accumulated earnings of foreign subsidiaries. The company periodically repatriates a portion of these earnings to the extent that it does not incur an additional U.S. tax liability. Quantification of the deferred tax liability, if any, associated with indefinitely reinvested earnings is not practicable. While the company currently does not have a need to repatriate funds held by its foreign subsidiaries, if these funds are needed for operations and obligations in the U.S., the company could elect to repatriate these funds which could result in a reassessment of the company’s policy and increased tax expense.
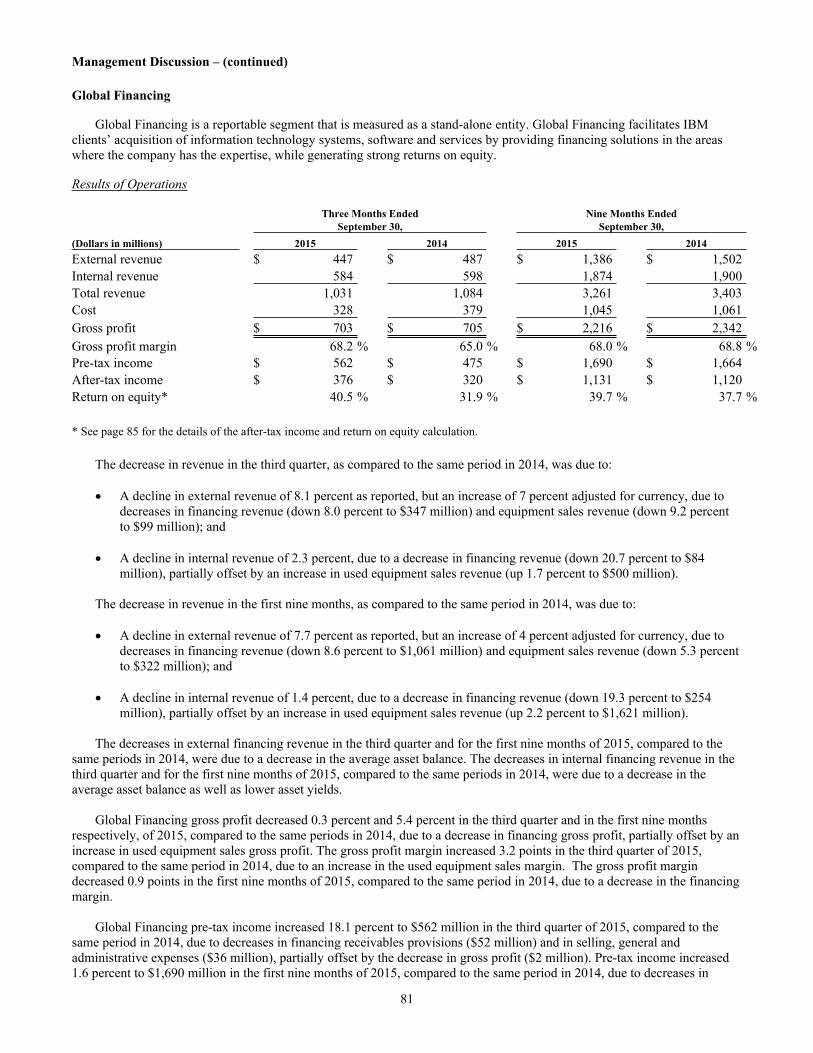
Management Discussion – (continued)
81
Global Financing
Global Financing is a reportable segment that is measured as a stand-alone entity. Global Financing facilitates IBM clients’ acquisition of information technology systems, software and services by providing financing solutions in the areas where the company has the expertise, while generating strong returns on equity.
Results of Operations
Three Months Ended Nine Months EndedSeptember 30, September 30,
(Dollars in millions) 2015 2014 2015 2014External revenue $ 447 $ 487 $ 1,386 $ 1,502Internal revenue 584 598 1,874 1,900Total revenue 1,031 1,084 3,261 3,403Cost 328 379 1,045 1,061Gross profit $ 703 $ 705 $ 2,216 $ 2,342Gross profit margin 68.2 % 65.0 % 68.0 % 68.8 %Pre-tax income $ 562 $ 475 $ 1,690 $ 1,664After-tax income $ 376 $ 320 $ 1,131 $ 1,120Return on equity* 40.5 % 31.9 % 39.7 % 37.7 %
* See page 85 for the details of the after-tax income and return on equity calculation.
The decrease in revenue in the third quarter, as compared to the same period in 2014, was due to:
A decline in external revenue of 8.1 percent as reported, but an increase of 7 percent adjusted for currency, due to decreases in financing revenue (down 8.0 percent to $347 million) and equipment sales revenue (down 9.2 percent to $99 million); and
A decline in internal revenue of 2.3 percent, due to a decrease in financing revenue (down 20.7 percent to $84 million), partially offset by an increase in used equipment sales revenue (up 1.7 percent to $500 million).
The decrease in revenue in the first nine months, as compared to the same period in 2014, was due to:
A decline in external revenue of 7.7 percent as reported, but an increase of 4 percent adjusted for currency, due to decreases in financing revenue (down 8.6 percent to $1,061 million) and equipment sales revenue (down 5.3 percent to $322 million); and
A decline in internal revenue of 1.4 percent, due to a decrease in financing revenue (down 19.3 percent to $254 million), partially offset by an increase in used equipment sales revenue (up 2.2 percent to $1,621 million).
The decreases in external financing revenue in the third quarter and for the first nine months of 2015, compared to the same periods in 2014, were due to a decrease in the average asset balance. The decreases in internal financing revenue in the third quarter and for the first nine months of 2015, compared to the same periods in 2014, were due to a decrease in the average asset balance as well as lower asset yields. Global Financing gross profit decreased 0.3 percent and 5.4 percent in the third quarter and in the first nine months respectively, of 2015, compared to the same periods in 2014, due to a decrease in financing gross profit, partially offset by an increase in used equipment sales gross profit. The gross profit margin increased 3.2 points in the third quarter of 2015, compared to the same period in 2014, due to an increase in the used equipment sales margin. The gross profit margin decreased 0.9 points in the first nine months of 2015, compared to the same period in 2014, due to a decrease in the financing margin.
Global Financing pre-tax income increased 18.1 percent to $562 million in the third quarter of 2015, compared to the same period in 2014, due to decreases in financing receivables provisions ($52 million) and in selling, general and administrative expenses ($36 million), partially offset by the decrease in gross profit ($2 million). Pre-tax income increased 1.6 percent to $1,690 million in the first nine months of 2015, compared to the same period in 2014, due to decreases in
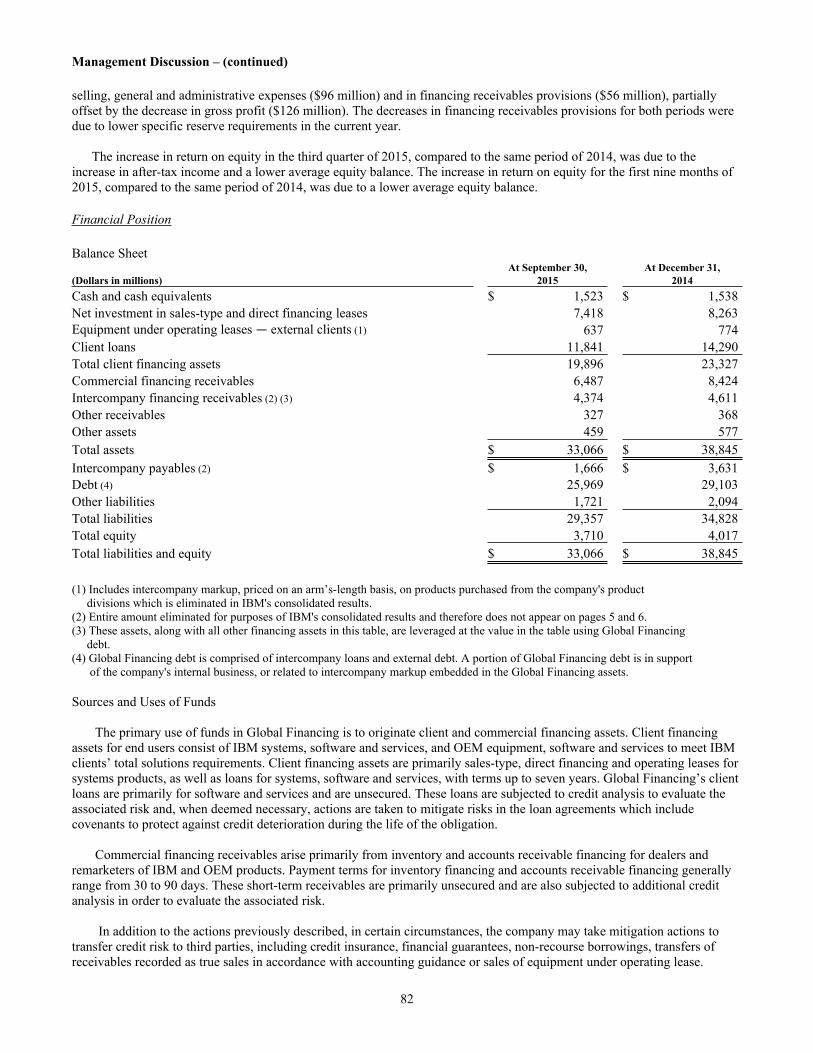
Management Discussion – (continued)
82
selling, general and administrative expenses ($96 million) and in financing receivables provisions ($56 million), partially offset by the decrease in gross profit ($126 million). The decreases in financing receivables provisions for both periods were due to lower specific reserve requirements in the current year.
The increase in return on equity in the third quarter of 2015, compared to the same period of 2014, was due to the increase in after-tax income and a lower average equity balance. The increase in return on equity for the first nine months of 2015, compared to the same period of 2014, was due to a lower average equity balance.
Financial Position
Balance SheetAt September 30, At December 31,
(Dollars in millions) 2015 2014Cash and cash equivalents $ 1,523 $ 1,538Net investment in sales-type and direct financing leases 7,418 8,263Equipment under operating leases — external clients (1) 637 774Client loans 11,841 14,290Total client financing assets 19,896 23,327Commercial financing receivables 6,487 8,424Intercompany financing receivables (2) (3) 4,374 4,611Other receivables 327 368Other assets 459 577Total assets $ 33,066 $ 38,845Intercompany payables (2) $ 1,666 $ 3,631Debt (4) 25,969 29,103Other liabilities 1,721 2,094Total liabilities 29,357 34,828Total equity 3,710 4,017Total liabilities and equity $ 33,066 $ 38,845
(1) Includes intercompany markup, priced on an arm’s-length basis, on products purchased from the company's product divisions which is eliminated in IBM's consolidated results.(2) Entire amount eliminated for purposes of IBM's consolidated results and therefore does not appear on pages 5 and 6.(3) These assets, along with all other financing assets in this table, are leveraged at the value in the table using Global Financing debt.(4) Global Financing debt is comprised of intercompany loans and external debt. A portion of Global Financing debt is in support
of the company's internal business, or related to intercompany markup embedded in the Global Financing assets.
Sources and Uses of Funds
The primary use of funds in Global Financing is to originate client and commercial financing assets. Client financing assets for end users consist of IBM systems, software and services, and OEM equipment, software and services to meet IBM clients’ total solutions requirements. Client financing assets are primarily sales-type, direct financing and operating leases for systems products, as well as loans for systems, software and services, with terms up to seven years. Global Financing’s client loans are primarily for software and services and are unsecured. These loans are subjected to credit analysis to evaluate the associated risk and, when deemed necessary, actions are taken to mitigate risks in the loan agreements which include covenants to protect against credit deterioration during the life of the obligation.
Commercial financing receivables arise primarily from inventory and accounts receivable financing for dealers and remarketers of IBM and OEM products. Payment terms for inventory financing and accounts receivable financing generally range from 30 to 90 days. These short-term receivables are primarily unsecured and are also subjected to additional credit analysis in order to evaluate the associated risk.
In addition to the actions previously described, in certain circumstances, the company may take mitigation actions to transfer credit risk to third parties, including credit insurance, financial guarantees, non-recourse borrowings, transfers of receivables recorded as true sales in accordance with accounting guidance or sales of equipment under operating lease.
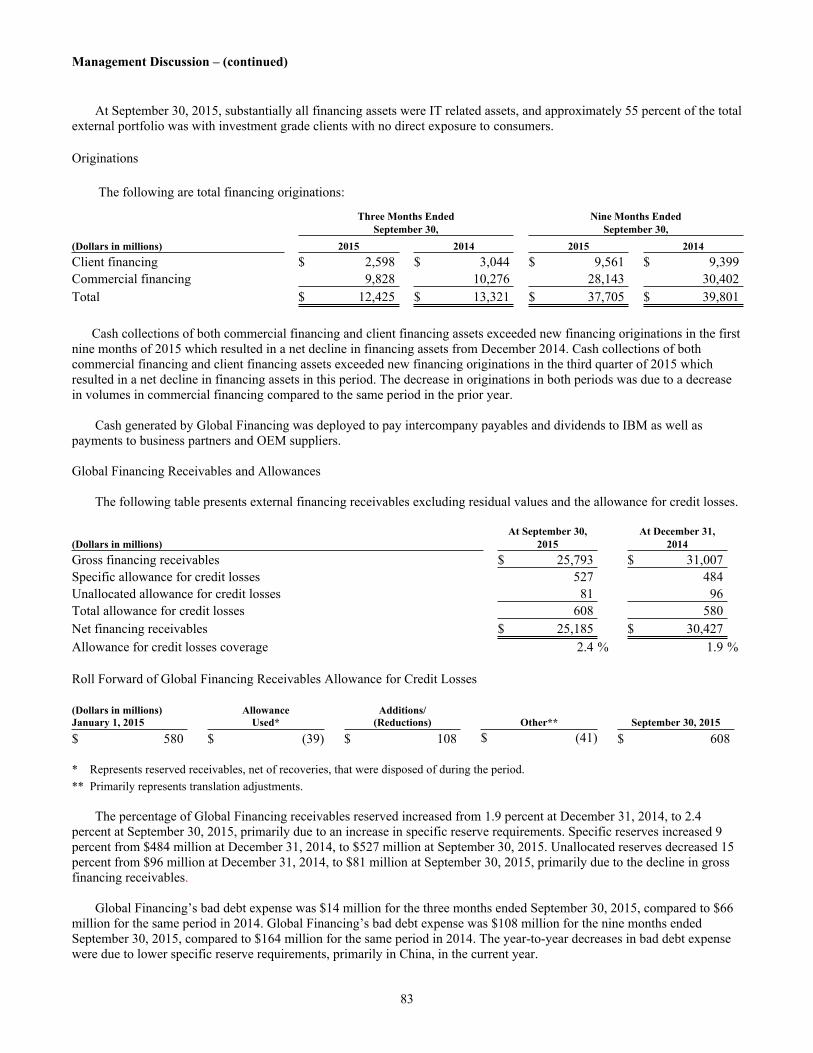
Management Discussion – (continued)
83
At September 30, 2015, substantially all financing assets were IT related assets, and approximately 55 percent of the total external portfolio was with investment grade clients with no direct exposure to consumers.
Originations
The following are total financing originations:
Three Months Ended Nine Months EndedSeptember 30, September 30,
(Dollars in millions) 2015 2014 2015 2014Client financing $ 2,598 $ 3,044 $ 9,561 $ 9,399Commercial financing 9,828 10,276 28,143 30,402Total $ 12,425 $ 13,321 $ 37,705 $ 39,801
Cash collections of both commercial financing and client financing assets exceeded new financing originations in the first nine months of 2015 which resulted in a net decline in financing assets from December 2014. Cash collections of both commercial financing and client financing assets exceeded new financing originations in the third quarter of 2015 which resulted in a net decline in financing assets in this period. The decrease in originations in both periods was due to a decrease in volumes in commercial financing compared to the same period in the prior year.
Cash generated by Global Financing was deployed to pay intercompany payables and dividends to IBM as well as payments to business partners and OEM suppliers.
Global Financing Receivables and Allowances
The following table presents external financing receivables excluding residual values and the allowance for credit losses.
At September 30, At December 31,(Dollars in millions) 2015 2014Gross financing receivables $ 25,793 $ 31,007Specific allowance for credit losses 527 484Unallocated allowance for credit losses 81 96Total allowance for credit losses 608 580Net financing receivables $ 25,185 $ 30,427Allowance for credit losses coverage 2.4 % 1.9 %
Roll Forward of Global Financing Receivables Allowance for Credit Losses
(Dollars in millions) Allowance Additions/January 1, 2015 Used* (Reductions) Other** September 30, 2015$ 580 $ (39) $ 108 $ (41) $ 608
* Represents reserved receivables, net of recoveries, that were disposed of during the period.** Primarily represents translation adjustments.
The percentage of Global Financing receivables reserved increased from 1.9 percent at December 31, 2014, to 2.4 percent at September 30, 2015, primarily due to an increase in specific reserve requirements. Specific reserves increased 9 percent from $484 million at December 31, 2014, to $527 million at September 30, 2015. Unallocated reserves decreased 15 percent from $96 million at December 31, 2014, to $81 million at September 30, 2015, primarily due to the decline in gross financing receivables.
Global Financing’s bad debt expense was $14 million for the three months ended September 30, 2015, compared to $66 million for the same period in 2014. Global Financing’s bad debt expense was $108 million for the nine months ended September 30, 2015, compared to $164 million for the same period in 2014. The year-to-year decreases in bad debt expense were due to lower specific reserve requirements, primarily in China, in the current year.
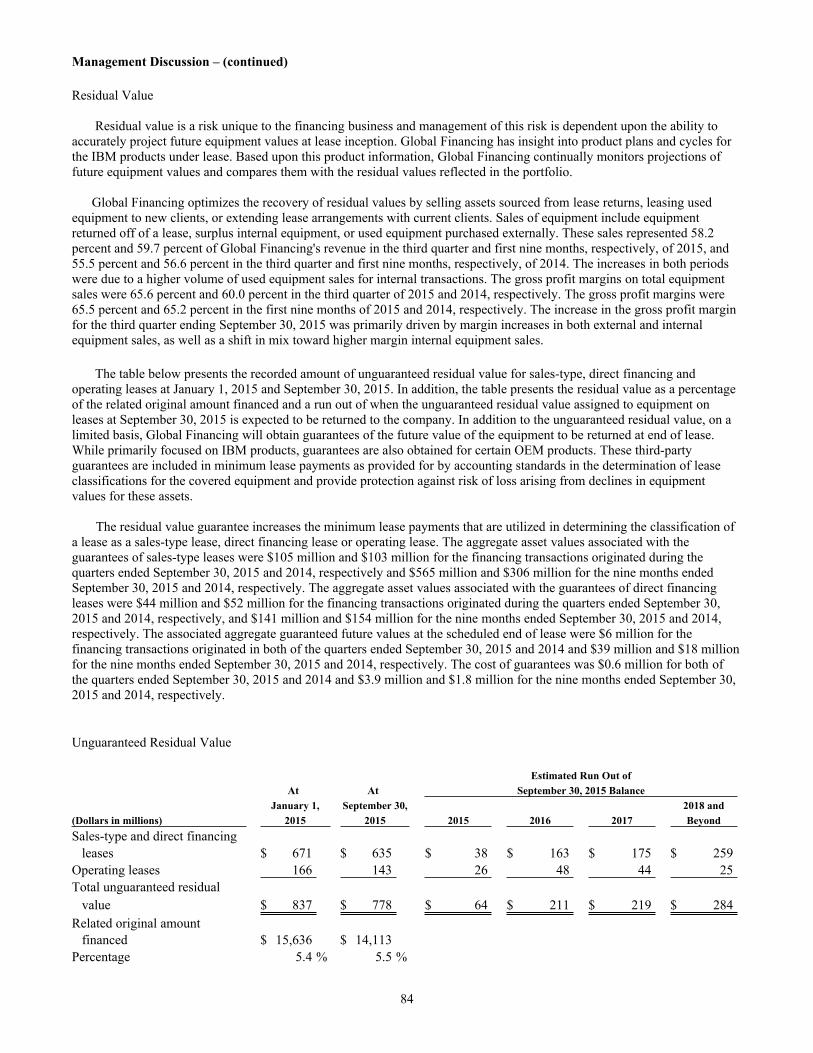
Management Discussion – (continued)
84
Residual Value
Residual value is a risk unique to the financing business and management of this risk is dependent upon the ability to accurately project future equipment values at lease inception. Global Financing has insight into product plans and cycles for the IBM products under lease. Based upon this product information, Global Financing continually monitors projections of future equipment values and compares them with the residual values reflected in the portfolio.
Global Financing optimizes the recovery of residual values by selling assets sourced from lease returns, leasing used equipment to new clients, or extending lease arrangements with current clients. Sales of equipment include equipment returned off of a lease, surplus internal equipment, or used equipment purchased externally. These sales represented 58.2 percent and 59.7 percent of Global Financing's revenue in the third quarter and first nine months, respectively, of 2015, and 55.5 percent and 56.6 percent in the third quarter and first nine months, respectively, of 2014. The increases in both periods were due to a higher volume of used equipment sales for internal transactions. The gross profit margins on total equipment sales were 65.6 percent and 60.0 percent in the third quarter of 2015 and 2014, respectively. The gross profit margins were 65.5 percent and 65.2 percent in the first nine months of 2015 and 2014, respectively. The increase in the gross profit margin for the third quarter ending September 30, 2015 was primarily driven by margin increases in both external and internal equipment sales, as well as a shift in mix toward higher margin internal equipment sales.
The table below presents the recorded amount of unguaranteed residual value for sales-type, direct financing and operating leases at January 1, 2015 and September 30, 2015. In addition, the table presents the residual value as a percentage of the related original amount financed and a run out of when the unguaranteed residual value assigned to equipment on leases at September 30, 2015 is expected to be returned to the company. In addition to the unguaranteed residual value, on a limited basis, Global Financing will obtain guarantees of the future value of the equipment to be returned at end of lease. While primarily focused on IBM products, guarantees are also obtained for certain OEM products. These third-party guarantees are included in minimum lease payments as provided for by accounting standards in the determination of lease classifications for the covered equipment and provide protection against risk of loss arising from declines in equipment values for these assets.
The residual value guarantee increases the minimum lease payments that are utilized in determining the classification of a lease as a sales-type lease, direct financing lease or operating lease. The aggregate asset values associated with the guarantees of sales-type leases were $105 million and $103 million for the financing transactions originated during the quarters ended September 30, 2015 and 2014, respectively and $565 million and $306 million for the nine months ended September 30, 2015 and 2014, respectively. The aggregate asset values associated with the guarantees of direct financing leases were $44 million and $52 million for the financing transactions originated during the quarters ended September 30, 2015 and 2014, respectively, and $141 million and $154 million for the nine months ended September 30, 2015 and 2014, respectively. The associated aggregate guaranteed future values at the scheduled end of lease were $6 million for the financing transactions originated in both of the quarters ended September 30, 2015 and 2014 and $39 million and $18 million for the nine months ended September 30, 2015 and 2014, respectively. The cost of guarantees was $0.6 million for both of the quarters ended September 30, 2015 and 2014 and $3.9 million and $1.8 million for the nine months ended September 30, 2015 and 2014, respectively.
Unguaranteed Residual Value
Estimated Run Out ofAt At September 30, 2015 Balance
January 1, September 30, 2018 and(Dollars in millions) 2015 2015 2015 2016 2017 BeyondSales-type and direct financing leases $ 671 $ 635 $ 38 $ 163 $ 175 $ 259Operating leases 166 143 26 48 44 25Total unguaranteed residual value $ 837 $ 778 $ 64 $ 211 $ 219 $ 284Related original amount financed $ 15,636 $ 14,113Percentage 5.4 % 5.5 %
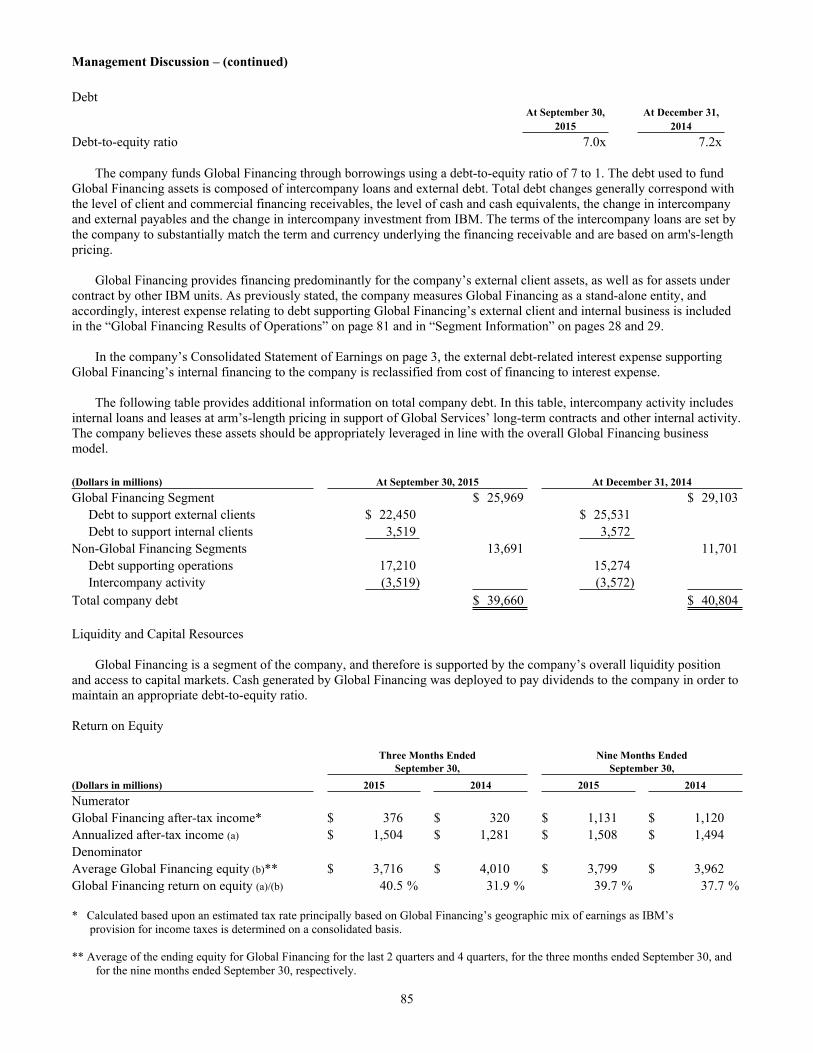
Management Discussion – (continued)
85
DebtAt September 30, At December 31,
2015 2014Debt-to-equity ratio 7.0x 7.2x
The company funds Global Financing through borrowings using a debt-to-equity ratio of 7 to 1. The debt used to fund Global Financing assets is composed of intercompany loans and external debt. Total debt changes generally correspond with the level of client and commercial financing receivables, the level of cash and cash equivalents, the change in intercompany and external payables and the change in intercompany investment from IBM. The terms of the intercompany loans are set by the company to substantially match the term and currency underlying the financing receivable and are based on arm's-length pricing.
Global Financing provides financing predominantly for the company’s external client assets, as well as for assets under contract by other IBM units. As previously stated, the company measures Global Financing as a stand-alone entity, and accordingly, interest expense relating to debt supporting Global Financing’s external client and internal business is included in the “Global Financing Results of Operations” on page 81 and in “Segment Information” on pages 28 and 29.
In the company’s Consolidated Statement of Earnings on page 3, the external debt-related interest expense supporting Global Financing’s internal financing to the company is reclassified from cost of financing to interest expense.
The following table provides additional information on total company debt. In this table, intercompany activity includes internal loans and leases at arm’s-length pricing in support of Global Services’ long-term contracts and other internal activity. The company believes these assets should be appropriately leveraged in line with the overall Global Financing business model.
(Dollars in millions) At September 30, 2015 At December 31, 2014Global Financing Segment $ 25,969 $ 29,103 Debt to support external clients $ 22,450 $ 25,531 Debt to support internal clients 3,519 3,572Non-Global Financing Segments 13,691 11,701 Debt supporting operations 17,210 15,274 Intercompany activity (3,519) (3,572)Total company debt $ 39,660 $ 40,804
Liquidity and Capital Resources
Global Financing is a segment of the company, and therefore is supported by the company’s overall liquidity position and access to capital markets. Cash generated by Global Financing was deployed to pay dividends to the company in order to maintain an appropriate debt-to-equity ratio.
Return on Equity
Three Months Ended Nine Months EndedSeptember 30, September 30,
(Dollars in millions) 2015 2014 2015 2014NumeratorGlobal Financing after-tax income* $ 376 $ 320 $ 1,131 $ 1,120Annualized after-tax income (a) $ 1,504 $ 1,281 $ 1,508 $ 1,494DenominatorAverage Global Financing equity (b)** $ 3,716 $ 4,010 $ 3,799 $ 3,962Global Financing return on equity (a)/(b) 40.5 % 31.9 % 39.7 % 37.7 %
* Calculated based upon an estimated tax rate principally based on Global Financing’s geographic mix of earnings as IBM’s provision for income taxes is determined on a consolidated basis.
** Average of the ending equity for Global Financing for the last 2 quarters and 4 quarters, for the three months ended September 30, and for the nine months ended September 30, respectively.
Management Discussion – (continued)
86
Looking Forward
Global Financing's financial position provides flexibility and funding capacity which enables the company to be well positioned in the current environment. Global Financing’s assets and new financing volumes are IBM and OEM products and services financed to the company’s clients and business partners, and substantially all financing assets are IT related assets which provide a stable base of business for future growth. Global Financing’s offerings are competitive and available to clients as a result of the company’s borrowing cost and access to the capital markets. Overall, Global Financing’s originations will be dependent upon the demand for IT products and services as well as client participation rates.
IBM continues to access both the short-term commercial paper market and the medium- and long-term debt markets. A protracted period where IBM could not access the capital markets would likely lead to a slowdown in originations.
Interest rates and the overall economy (including currency fluctuations) will have an effect on both revenue and gross profit. The company’s interest rate risk management policy, however, combined with the Global Financing pricing strategy should mitigate gross margin erosion due to changes in interest rates.
The economy could impact the credit quality of the Global Financing receivables portfolio and therefore the level of provision for credit losses. Global Financing will continue to apply rigorous credit policies in both the origination of new business and the evaluation of the existing portfolio.
As previously discussed, Global Financing has historically been able to manage residual value risk both through insight into the company’s product cycles, as well as through its remarketing business.
Global Financing has policies in place to manage each of the key risks involved in financing. These policies, combined with product and client knowledge, should allow for the prudent management of the business going forward, even during periods of uncertainty with respect to the global economy.
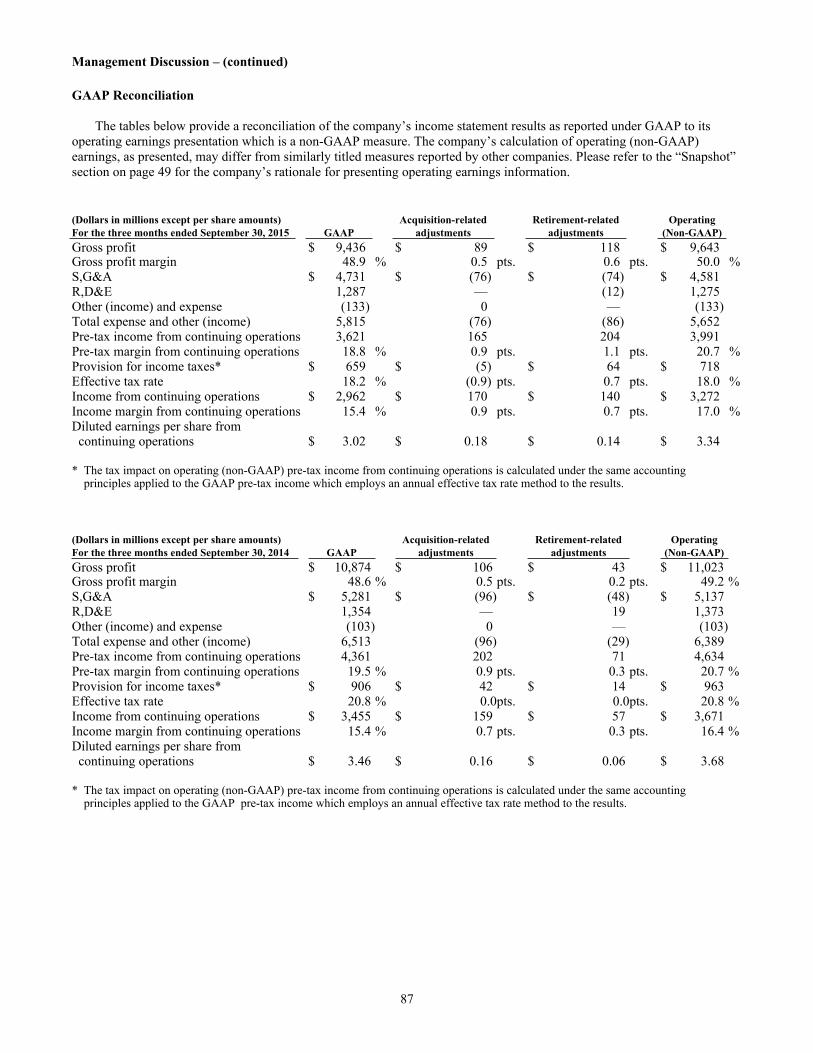
Management Discussion – (continued)
87
GAAP Reconciliation
The tables below provide a reconciliation of the company’s income statement results as reported under GAAP to its operating earnings presentation which is a non-GAAP measure. The company’s calculation of operating (non-GAAP) earnings, as presented, may differ from similarly titled measures reported by other companies. Please refer to the “Snapshot” section on page 49 for the company’s rationale for presenting operating earnings information.
(Dollars in millions except per share amounts) Acquisition-related Retirement-related OperatingFor the three months ended September 30, 2015 GAAP adjustments adjustments (Non-GAAP)Gross profit $ 9,436 $ 89 $ 118 $ 9,643Gross profit margin 48.9 % 0.5 pts. 0.6 pts. 50.0 %S,G&A $ 4,731 $ (76) $ (74) $ 4,581R,D&E 1,287 — (12) 1,275Other (income) and expense (133) 0 — (133)Total expense and other (income) 5,815 (76) (86) 5,652Pre-tax income from continuing operations 3,621 165 204 3,991Pre-tax margin from continuing operations 18.8 % 0.9 pts. 1.1 pts. 20.7 %Provision for income taxes* $ 659 $ (5) $ 64 $ 718Effective tax rate 18.2 % (0.9) pts. 0.7 pts. 18.0 %Income from continuing operations $ 2,962 $ 170 $ 140 $ 3,272Income margin from continuing operations 15.4 % 0.9 pts. 0.7 pts. 17.0 %Diluted earnings per share from continuing operations $ 3.02 $ 0.18 $ 0.14 $ 3.34
* The tax impact on operating (non-GAAP) pre-tax income from continuing operations is calculated under the same accounting principles applied to the GAAP pre-tax income which employs an annual effective tax rate method to the results.
(Dollars in millions except per share amounts) Acquisition-related Retirement-related OperatingFor the three months ended September 30, 2014 GAAP adjustments adjustments (Non-GAAP)Gross profit $ 10,874 $ 106 $ 43 $ 11,023Gross profit margin 48.6 % 0.5 pts. 0.2 pts. 49.2 %S,G&A $ 5,281 $ (96) $ (48) $ 5,137R,D&E 1,354 — 19 1,373Other (income) and expense (103) 0 — (103)Total expense and other (income) 6,513 (96) (29) 6,389Pre-tax income from continuing operations 4,361 202 71 4,634Pre-tax margin from continuing operations 19.5 % 0.9 pts. 0.3 pts. 20.7 %Provision for income taxes* $ 906 $ 42 $ 14 $ 963Effective tax rate 20.8 % 0.0 pts. 0.0 pts. 20.8 %Income from continuing operations $ 3,455 $ 159 $ 57 $ 3,671Income margin from continuing operations 15.4 % 0.7 pts. 0.3 pts. 16.4 %Diluted earnings per share from continuing operations $ 3.46 $ 0.16 $ 0.06 $ 3.68
* The tax impact on operating (non-GAAP) pre-tax income from continuing operations is calculated under the same accounting principles applied to the GAAP pre-tax income which employs an annual effective tax rate method to the results.
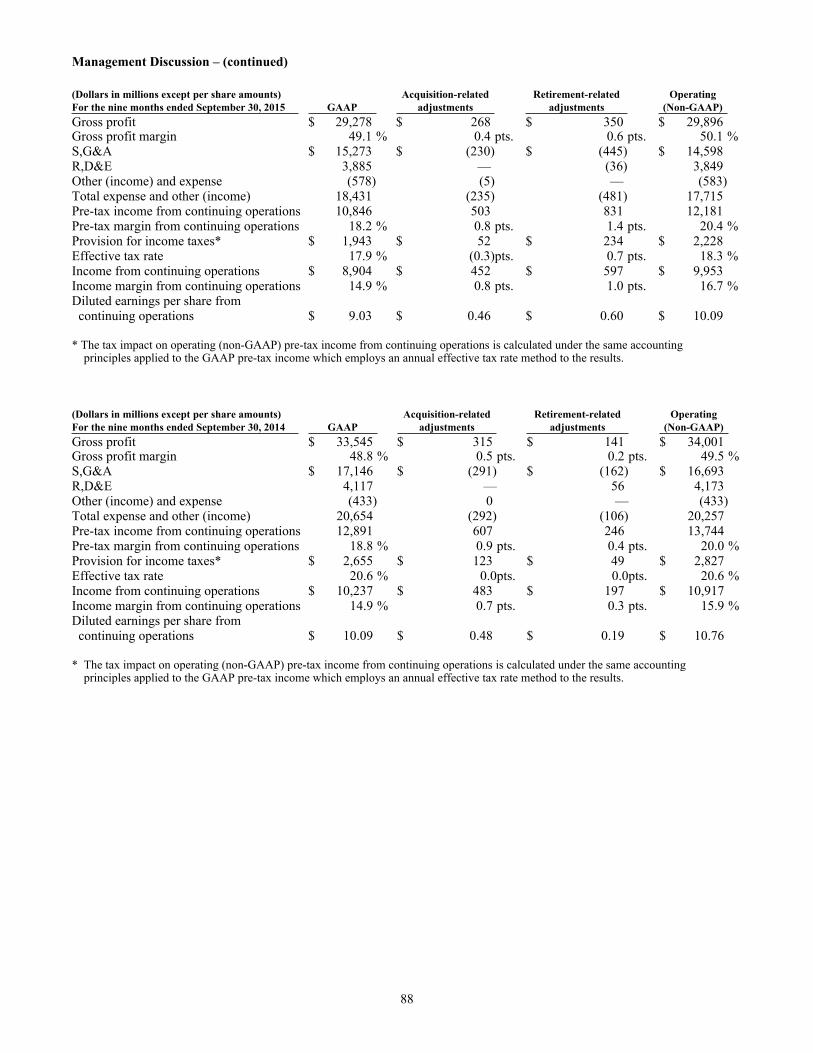
Management Discussion – (continued)
88
(Dollars in millions except per share amounts) Acquisition-related Retirement-related OperatingFor the nine months ended September 30, 2015 GAAP adjustments adjustments (Non-GAAP)Gross profit $ 29,278 $ 268 $ 350 $ 29,896Gross profit margin 49.1 % 0.4 pts. 0.6 pts. 50.1 %S,G&A $ 15,273 $ (230) $ (445) $ 14,598R,D&E 3,885 — (36) 3,849Other (income) and expense (578) (5) — (583)Total expense and other (income) 18,431 (235) (481) 17,715Pre-tax income from continuing operations 10,846 503 831 12,181Pre-tax margin from continuing operations 18.2 % 0.8 pts. 1.4 pts. 20.4 %Provision for income taxes* $ 1,943 $ 52 $ 234 $ 2,228Effective tax rate 17.9 % (0.3)pts. 0.7 pts. 18.3 %Income from continuing operations $ 8,904 $ 452 $ 597 $ 9,953Income margin from continuing operations 14.9 % 0.8 pts. 1.0 pts. 16.7 %Diluted earnings per share from continuing operations $ 9.03 $ 0.46 $ 0.60 $ 10.09
* The tax impact on operating (non-GAAP) pre-tax income from continuing operations is calculated under the same accounting principles applied to the GAAP pre-tax income which employs an annual effective tax rate method to the results.
(Dollars in millions except per share amounts) Acquisition-related Retirement-related OperatingFor the nine months ended September 30, 2014 GAAP adjustments adjustments (Non-GAAP)Gross profit $ 33,545 $ 315 $ 141 $ 34,001Gross profit margin 48.8 % 0.5 pts. 0.2 pts. 49.5 %S,G&A $ 17,146 $ (291) $ (162) $ 16,693R,D&E 4,117 — 56 4,173Other (income) and expense (433) 0 — (433)Total expense and other (income) 20,654 (292) (106) 20,257Pre-tax income from continuing operations 12,891 607 246 13,744Pre-tax margin from continuing operations 18.8 % 0.9 pts. 0.4 pts. 20.0 %Provision for income taxes* $ 2,655 $ 123 $ 49 $ 2,827Effective tax rate 20.6 % 0.0 pts. 0.0 pts. 20.6 %Income from continuing operations $ 10,237 $ 483 $ 197 $ 10,917Income margin from continuing operations 14.9 % 0.7 pts. 0.3 pts. 15.9 %Diluted earnings per share from continuing operations $ 10.09 $ 0.48 $ 0.19 $ 10.76
* The tax impact on operating (non-GAAP) pre-tax income from continuing operations is calculated under the same accounting principles applied to the GAAP pre-tax income which employs an annual effective tax rate method to the results.
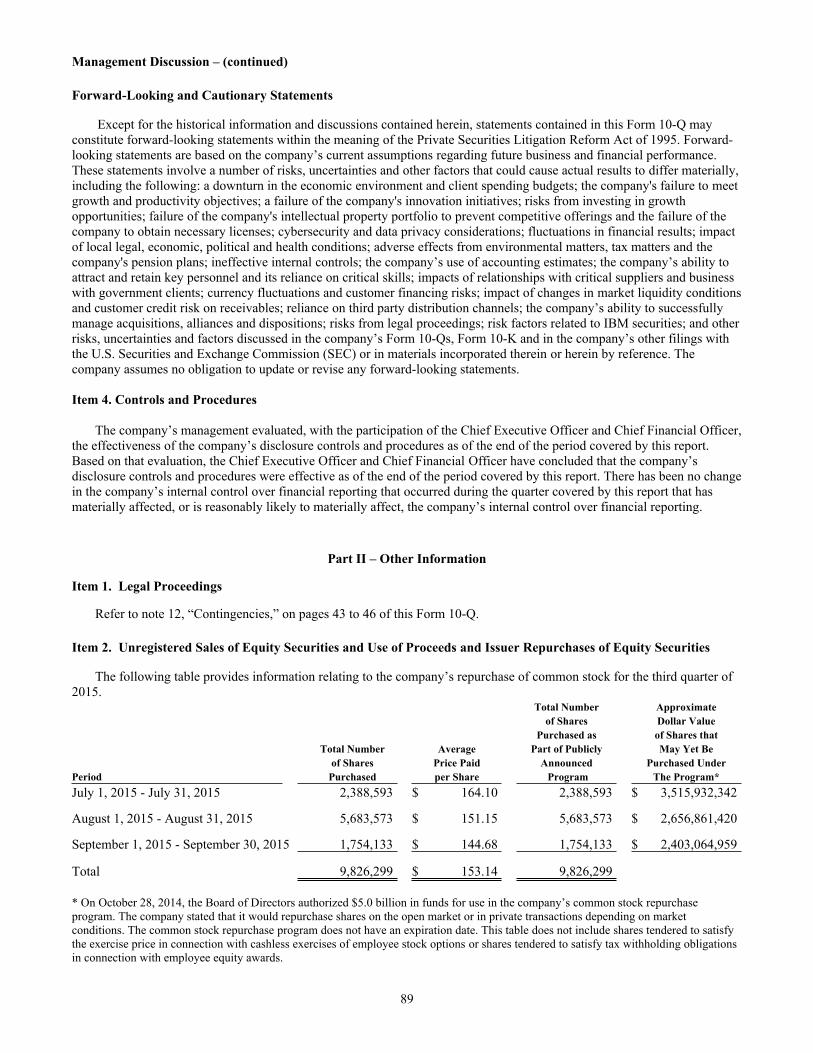
Management Discussion – (continued)
89
Forward-Looking and Cautionary Statements
Except for the historical information and discussions contained herein, statements contained in this Form 10-Q may constitute forward-looking statements within the meaning of the Private Securities Litigation Reform Act of 1995. Forward-looking statements are based on the company’s current assumptions regarding future business and financial performance. These statements involve a number of risks, uncertainties and other factors that could cause actual results to differ materially, including the following: a downturn in the economic environment and client spending budgets; the company's failure to meet growth and productivity objectives; a failure of the company's innovation initiatives; risks from investing in growth opportunities; failure of the company's intellectual property portfolio to prevent competitive offerings and the failure of the company to obtain necessary licenses; cybersecurity and data privacy considerations; fluctuations in financial results; impact of local legal, economic, political and health conditions; adverse effects from environmental matters, tax matters and the company's pension plans; ineffective internal controls; the company’s use of accounting estimates; the company’s ability to attract and retain key personnel and its reliance on critical skills; impacts of relationships with critical suppliers and business with government clients; currency fluctuations and customer financing risks; impact of changes in market liquidity conditions and customer credit risk on receivables; reliance on third party distribution channels; the company’s ability to successfully manage acquisitions, alliances and dispositions; risks from legal proceedings; risk factors related to IBM securities; and other risks, uncertainties and factors discussed in the company’s Form 10-Qs, Form 10-K and in the company’s other filings with the U.S. Securities and Exchange Commission (SEC) or in materials incorporated therein or herein by reference. The company assumes no obligation to update or revise any forward-looking statements.
Item 4. Controls and Procedures
The company’s management evaluated, with the participation of the Chief Executive Officer and Chief Financial Officer, the effectiveness of the company’s disclosure controls and procedures as of the end of the period covered by this report. Based on that evaluation, the Chief Executive Officer and Chief Financial Officer have concluded that the company’s disclosure controls and procedures were effective as of the end of the period covered by this report. There has been no change in the company’s internal control over financial reporting that occurred during the quarter covered by this report that has materially affected, or is reasonably likely to materially affect, the company’s internal control over financial reporting.
Part II – Other Information
Item 1. Legal Proceedings
Refer to note 12, “Contingencies,” on pages 43 to 46 of this Form 10-Q.
Item 2. Unregistered Sales of Equity Securities and Use of Proceeds and Issuer Repurchases of Equity Securities
The following table provides information relating to the company’s repurchase of common stock for the third quarter of 2015.
Total Number Approximateof Shares Dollar Value
Purchased as of Shares that Total Number Average Part of Publicly May Yet Be
of Shares Price Paid Announced Purchased UnderPeriod Purchased per Share Program The Program*July 1, 2015 - July 31, 2015 2,388,593 $ 164.10 2,388,593 $ 3,515,932,342
August 1, 2015 - August 31, 2015 5,683,573 $ 151.15 5,683,573 $ 2,656,861,420
September 1, 2015 - September 30, 2015 1,754,133 $ 144.68 1,754,133 $ 2,403,064,959
Total 9,826,299 $ 153.14 9,826,299
* On October 28, 2014, the Board of Directors authorized $5.0 billion in funds for use in the company’s common stock repurchase program. The company stated that it would repurchase shares on the open market or in private transactions depending on market conditions. The common stock repurchase program does not have an expiration date. This table does not include shares tendered to satisfy the exercise price in connection with cashless exercises of employee stock options or shares tendered to satisfy tax withholding obligations in connection with employee equity awards.
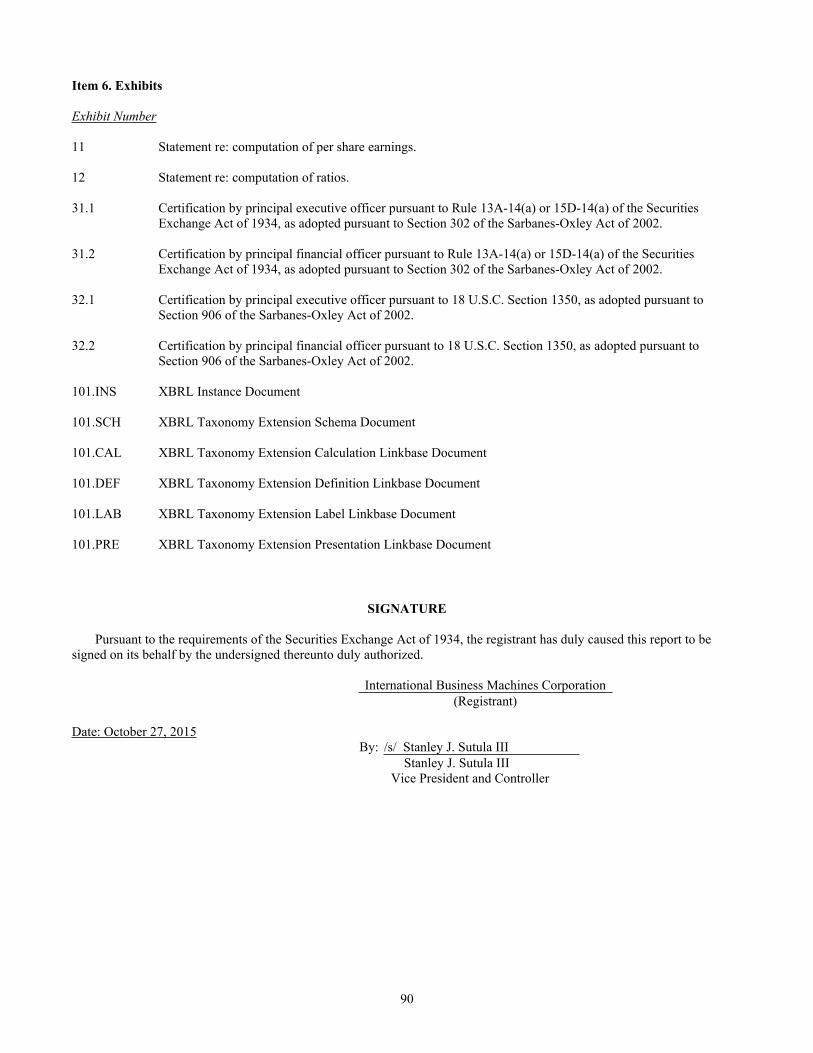
90
Item 6. Exhibits
Exhibit Number
11 Statement re: computation of per share earnings.
12 Statement re: computation of ratios.
31.1 Certification by principal executive officer pursuant to Rule 13A-14(a) or 15D-14(a) of the Securities Exchange Act of 1934, as adopted pursuant to Section 302 of the Sarbanes-Oxley Act of 2002.
31.2 Certification by principal financial officer pursuant to Rule 13A-14(a) or 15D-14(a) of the Securities Exchange Act of 1934, as adopted pursuant to Section 302 of the Sarbanes-Oxley Act of 2002.
32.1 Certification by principal executive officer pursuant to 18 U.S.C. Section 1350, as adopted pursuant to Section 906 of the Sarbanes-Oxley Act of 2002.
32.2 Certification by principal financial officer pursuant to 18 U.S.C. Section 1350, as adopted pursuant to Section 906 of the Sarbanes-Oxley Act of 2002.
101.INS XBRL Instance Document
101.SCH
101.CAL
101.DEF
101.LAB
101.PRE
XBRL Taxonomy Extension Schema Document
XBRL Taxonomy Extension Calculation Linkbase Document
XBRL Taxonomy Extension Definition Linkbase Document
XBRL Taxonomy Extension Label Linkbase Document
XBRL Taxonomy Extension Presentation Linkbase Document
SIGNATURE
Pursuant to the requirements of the Securities Exchange Act of 1934, the registrant has duly caused this report to be signed on its behalf by the undersigned thereunto duly authorized.
International Business Machines Corporation(Registrant)
Date: October 27, 2015By: /s/ Stanley J. Sutula III
Stanley J. Sutula IIIVice President and Controller
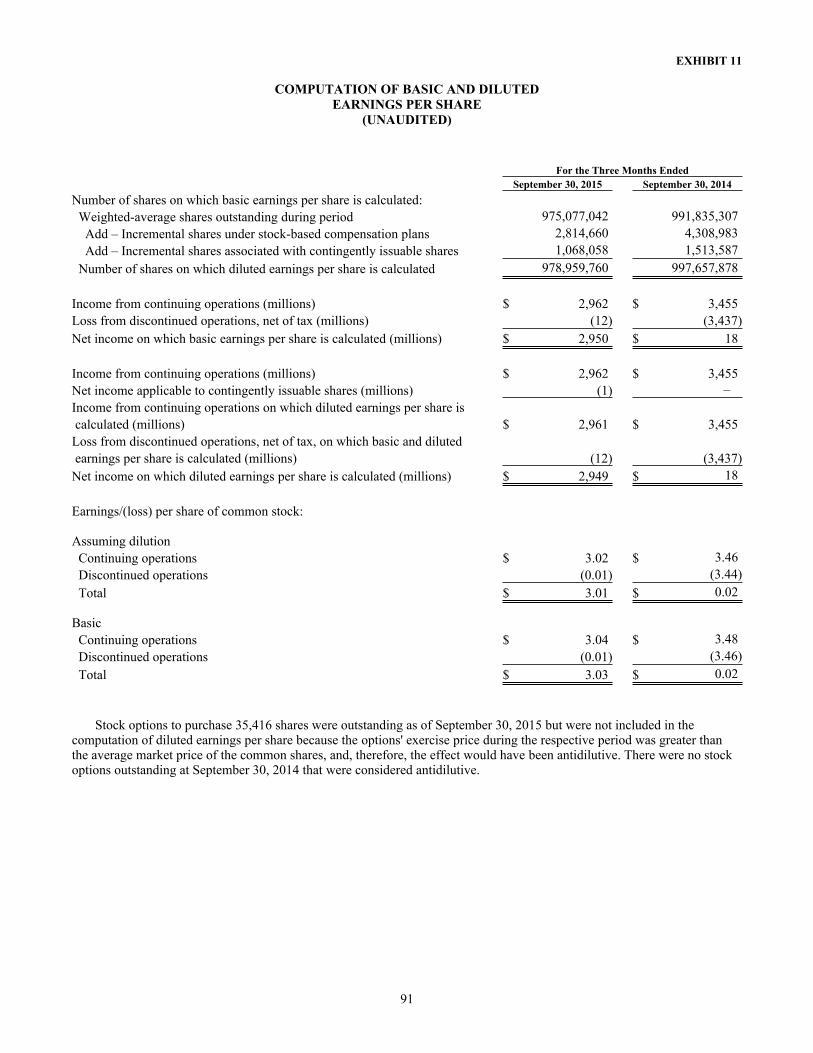
EXHIBIT 11
COMPUTATION OF BASIC AND DILUTEDEARNINGS PER SHARE
(UNAUDITED)
91
For the Three Months EndedSeptember 30, 2015 September 30, 2014
Number of shares on which basic earnings per share is calculated: Weighted-average shares outstanding during period 975,077,042 991,835,307 Add – Incremental shares under stock-based compensation plans 2,814,660 4,308,983 Add – Incremental shares associated with contingently issuable shares 1,068,058 1,513,587 Number of shares on which diluted earnings per share is calculated 978,959,760 997,657,878
Income from continuing operations (millions) $ 2,962 $ 3,455Loss from discontinued operations, net of tax (millions) (12) (3,437)Net income on which basic earnings per share is calculated (millions) $ 2,950 $ 18
Income from continuing operations (millions) $ 2,962 $ 3,455Net income applicable to contingently issuable shares (millions) (1) –Income from continuing operations on which diluted earnings per share is calculated (millions) $ 2,961 $ 3,455Loss from discontinued operations, net of tax, on which basic and diluted earnings per share is calculated (millions) (12) (3,437)Net income on which diluted earnings per share is calculated (millions) $ 2,949 $ 18
Earnings/(loss) per share of common stock:
Assuming dilution Continuing operations $ 3.02 $ 3.46 Discontinued operations (0.01) (3.44) Total $ 3.01 $ 0.02
Basic Continuing operations $ 3.04 $ 3.48 Discontinued operations (0.01) (3.46) Total $ 3.03 $ 0.02
Stock options to purchase 35,416 shares were outstanding as of September 30, 2015 but were not included in the computation of diluted earnings per share because the options' exercise price during the respective period was greater than the average market price of the common shares, and, therefore, the effect would have been antidilutive. There were no stock options outstanding at September 30, 2014 that were considered antidilutive.
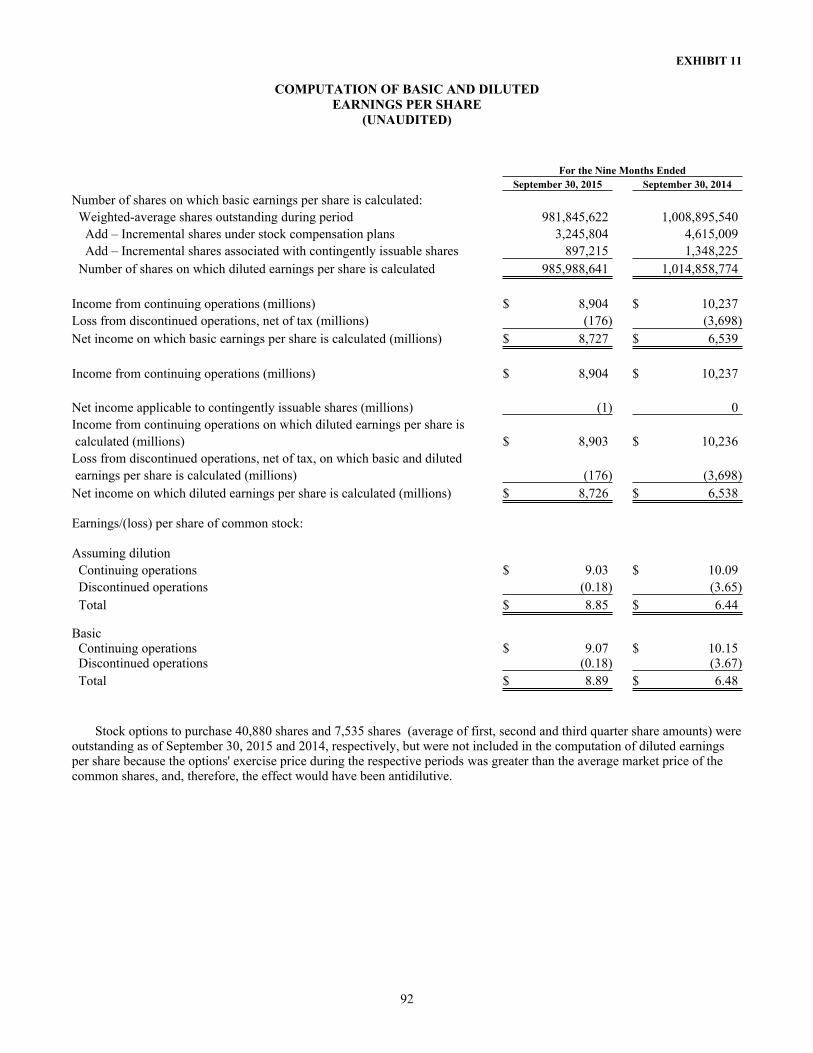
EXHIBIT 11
COMPUTATION OF BASIC AND DILUTEDEARNINGS PER SHARE
(UNAUDITED)
92
For the Nine Months EndedSeptember 30, 2015 September 30, 2014
Number of shares on which basic earnings per share is calculated: Weighted-average shares outstanding during period 981,845,622 1,008,895,540 Add – Incremental shares under stock compensation plans 3,245,804 4,615,009 Add – Incremental shares associated with contingently issuable shares 897,215 1,348,225 Number of shares on which diluted earnings per share is calculated 985,988,641 1,014,858,774
Income from continuing operations (millions) $ 8,904 $ 10,237Loss from discontinued operations, net of tax (millions) (176) (3,698)Net income on which basic earnings per share is calculated (millions) $ 8,727 $ 6,539
Income from continuing operations (millions) $ 8,904 $ 10,237
Net income applicable to contingently issuable shares (millions) (1) 0Income from continuing operations on which diluted earnings per share is calculated (millions) $ 8,903 $ 10,236Loss from discontinued operations, net of tax, on which basic and diluted earnings per share is calculated (millions) (176) (3,698)Net income on which diluted earnings per share is calculated (millions) $ 8,726 $ 6,538
Earnings/(loss) per share of common stock:
Assuming dilution Continuing operations $ 9.03 $ 10.09 Discontinued operations (0.18) (3.65) Total $ 8.85 $ 6.44
Basic Continuing operations $ 9.07 $ 10.15 Discontinued operations (0.18) (3.67) Total $ 8.89 $ 6.48
Stock options to purchase 40,880 shares and 7,535 shares (average of first, second and third quarter share amounts) were outstanding as of September 30, 2015 and 2014, respectively, but were not included in the computation of diluted earningsper share because the options' exercise price during the respective periods was greater than the average market price of thecommon shares, and, therefore, the effect would have been antidilutive.
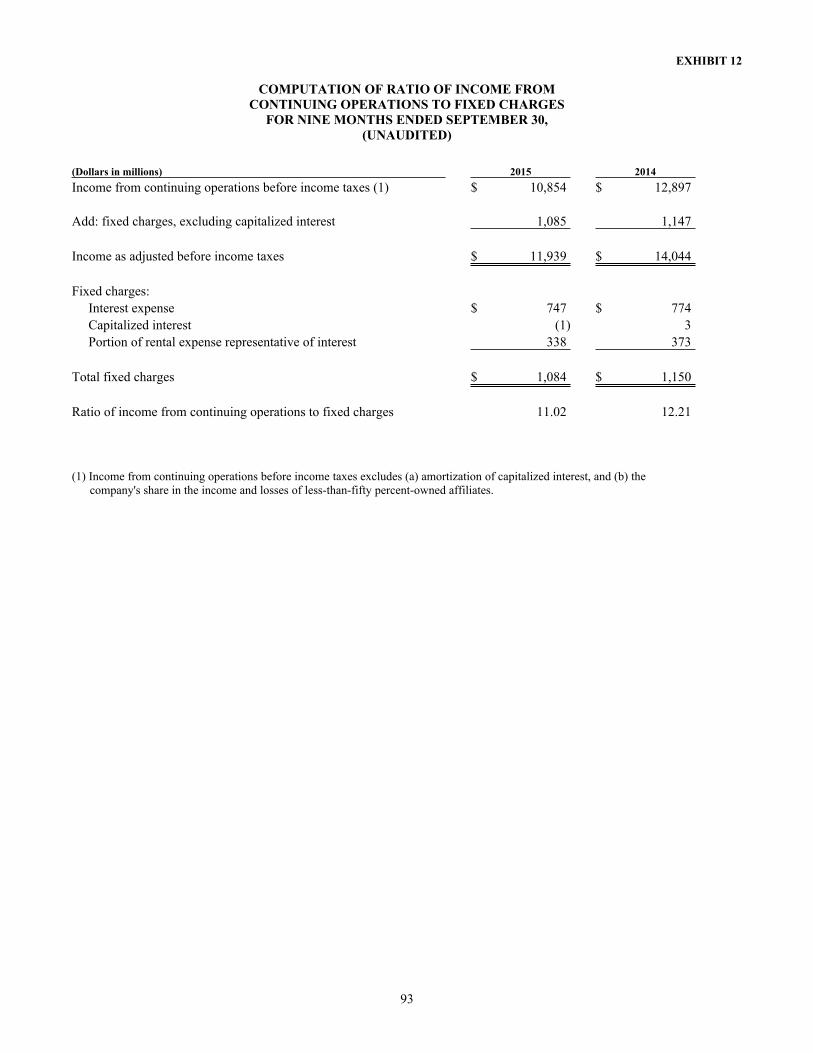
EXHIBIT 12
COMPUTATION OF RATIO OF INCOME FROMCONTINUING OPERATIONS TO FIXED CHARGES
FOR NINE MONTHS ENDED SEPTEMBER 30, (UNAUDITED)
93
(Dollars in millions) 2015 2014Income from continuing operations before income taxes (1) $ 10,854 $ 12,897
Add: fixed charges, excluding capitalized interest 1,085 1,147
Income as adjusted before income taxes $ 11,939 $ 14,044
Fixed charges: Interest expense $ 747 $ 774 Capitalized interest (1) 3 Portion of rental expense representative of interest 338 373
Total fixed charges $ 1,084 $ 1,150
Ratio of income from continuing operations to fixed charges 11.02 12.21
(1) Income from continuing operations before income taxes excludes (a) amortization of capitalized interest, and (b) the company's share in the income and losses of less-than-fifty percent-owned affiliates.
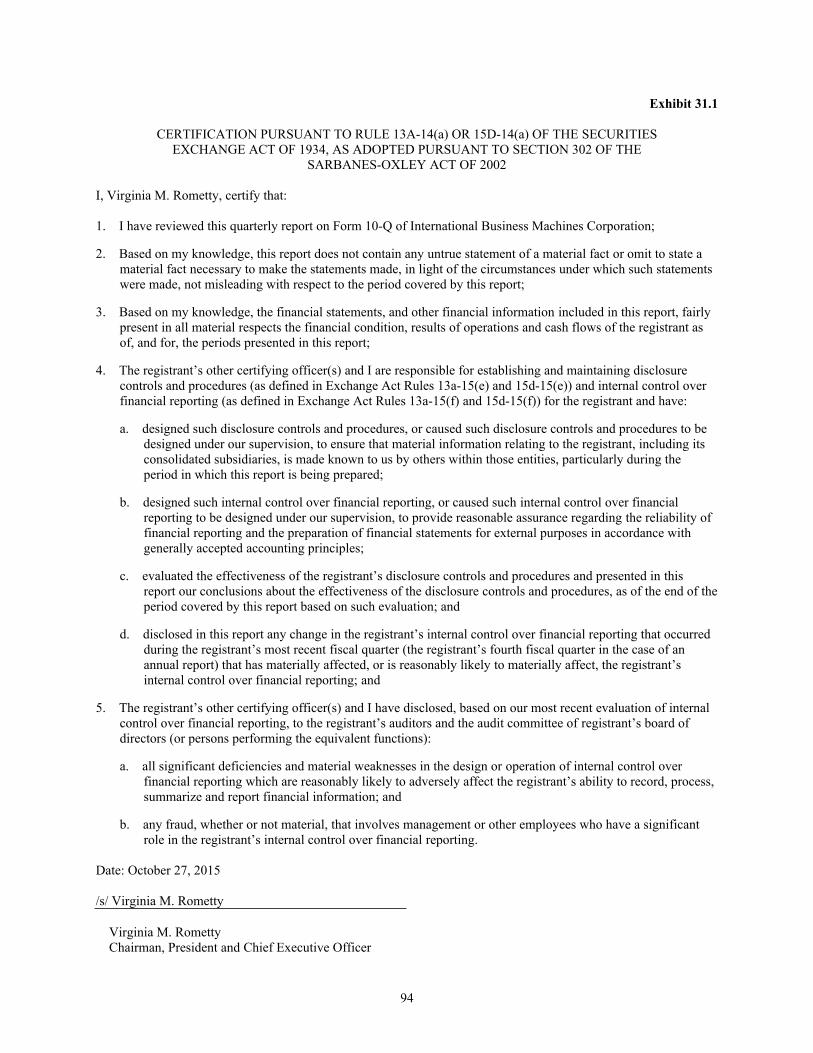
94
Exhibit 31.1
CERTIFICATION PURSUANT TO RULE 13A-14(a) OR 15D-14(a) OF THE SECURITIESEXCHANGE ACT OF 1934, AS ADOPTED PURSUANT TO SECTION 302 OF THE
SARBANES-OXLEY ACT OF 2002
I, Virginia M. Rometty, certify that:
1. I have reviewed this quarterly report on Form 10-Q of International Business Machines Corporation;
2. Based on my knowledge, this report does not contain any untrue statement of a material fact or omit to state a material fact necessary to make the statements made, in light of the circumstances under which such statements were made, not misleading with respect to the period covered by this report;
3. Based on my knowledge, the financial statements, and other financial information included in this report, fairly present in all material respects the financial condition, results of operations and cash flows of the registrant as of, and for, the periods presented in this report;
4. The registrant’s other certifying officer(s) and I are responsible for establishing and maintaining disclosure controls and procedures (as defined in Exchange Act Rules 13a-15(e) and 15d-15(e)) and internal control over financial reporting (as defined in Exchange Act Rules 13a-15(f) and 15d-15(f)) for the registrant and have:
a. designed such disclosure controls and procedures, or caused such disclosure controls and procedures to be designed under our supervision, to ensure that material information relating to the registrant, including its consolidated subsidiaries, is made known to us by others within those entities, particularly during the period in which this report is being prepared;
b. designed such internal control over financial reporting, or caused such internal control over financial reporting to be designed under our supervision, to provide reasonable assurance regarding the reliability of financial reporting and the preparation of financial statements for external purposes in accordance with generally accepted accounting principles;
c. evaluated the effectiveness of the registrant’s disclosure controls and procedures and presented in this report our conclusions about the effectiveness of the disclosure controls and procedures, as of the end of the period covered by this report based on such evaluation; and
d. disclosed in this report any change in the registrant’s internal control over financial reporting that occurred during the registrant’s most recent fiscal quarter (the registrant’s fourth fiscal quarter in the case of an annual report) that has materially affected, or is reasonably likely to materially affect, the registrant’s internal control over financial reporting; and
5. The registrant’s other certifying officer(s) and I have disclosed, based on our most recent evaluation of internal control over financial reporting, to the registrant’s auditors and the audit committee of registrant’s board of directors (or persons performing the equivalent functions):
a. all significant deficiencies and material weaknesses in the design or operation of internal control over financial reporting which are reasonably likely to adversely affect the registrant’s ability to record, process, summarize and report financial information; and
b. any fraud, whether or not material, that involves management or other employees who have a significant role in the registrant’s internal control over financial reporting.
Date: October 27, 2015
/s/ Virginia M. Rometty
Virginia M. RomettyChairman, President and Chief Executive Officer
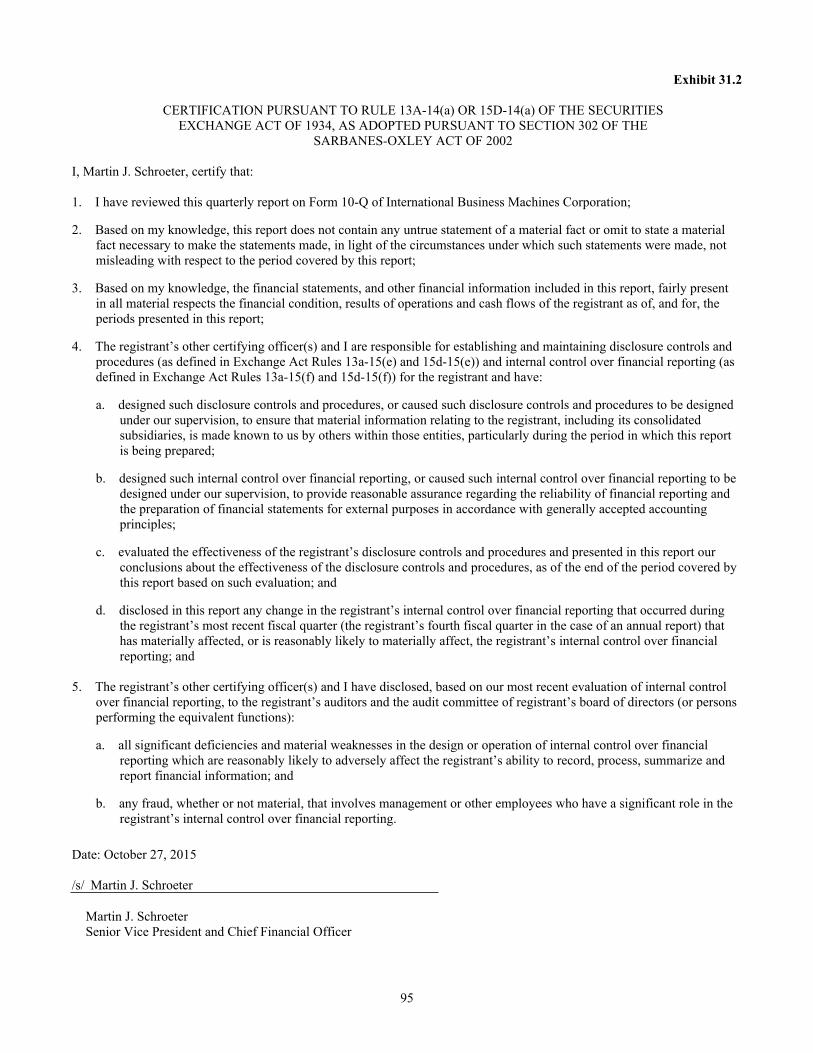
95
Exhibit 31.2
CERTIFICATION PURSUANT TO RULE 13A-14(a) OR 15D-14(a) OF THE SECURITIESEXCHANGE ACT OF 1934, AS ADOPTED PURSUANT TO SECTION 302 OF THE
SARBANES-OXLEY ACT OF 2002
I, Martin J. Schroeter, certify that:
1. I have reviewed this quarterly report on Form 10-Q of International Business Machines Corporation;
2. Based on my knowledge, this report does not contain any untrue statement of a material fact or omit to state a material fact necessary to make the statements made, in light of the circumstances under which such statements were made, not misleading with respect to the period covered by this report;
3. Based on my knowledge, the financial statements, and other financial information included in this report, fairly present in all material respects the financial condition, results of operations and cash flows of the registrant as of, and for, the periods presented in this report;
4. The registrant’s other certifying officer(s) and I are responsible for establishing and maintaining disclosure controls and procedures (as defined in Exchange Act Rules 13a-15(e) and 15d-15(e)) and internal control over financial reporting (as defined in Exchange Act Rules 13a-15(f) and 15d-15(f)) for the registrant and have:
a. designed such disclosure controls and procedures, or caused such disclosure controls and procedures to be designed under our supervision, to ensure that material information relating to the registrant, including its consolidated subsidiaries, is made known to us by others within those entities, particularly during the period in which this report is being prepared;
b. designed such internal control over financial reporting, or caused such internal control over financial reporting to be designed under our supervision, to provide reasonable assurance regarding the reliability of financial reporting and the preparation of financial statements for external purposes in accordance with generally accepted accounting principles;
c. evaluated the effectiveness of the registrant’s disclosure controls and procedures and presented in this report our conclusions about the effectiveness of the disclosure controls and procedures, as of the end of the period covered by this report based on such evaluation; and
d. disclosed in this report any change in the registrant’s internal control over financial reporting that occurred during the registrant’s most recent fiscal quarter (the registrant’s fourth fiscal quarter in the case of an annual report) that has materially affected, or is reasonably likely to materially affect, the registrant’s internal control over financial reporting; and
5. The registrant’s other certifying officer(s) and I have disclosed, based on our most recent evaluation of internal control over financial reporting, to the registrant’s auditors and the audit committee of registrant’s board of directors (or persons performing the equivalent functions):
a. all significant deficiencies and material weaknesses in the design or operation of internal control over financial reporting which are reasonably likely to adversely affect the registrant’s ability to record, process, summarize and report financial information; and
b. any fraud, whether or not material, that involves management or other employees who have a significant role in the registrant’s internal control over financial reporting.
Date: October 27, 2015
/s/ Martin J. Schroeter
Martin J. SchroeterSenior Vice President and Chief Financial Officer

96
Exhibit 32.1
INTERNATIONAL BUSINESS MACHINES CORPORATION
CERTIFICATION PURSUANT TO18 U.S.C. SECTION 1350,
AS ADOPTED PURSUANT TOSECTION 906 OF THE SARBANES-OXLEY ACT OF 2002
In connection with the Quarterly Report of International Business Machines Corporation (the “Company”) on Form 10-Q for the period ending September 30, 2015, as filed with the Securities and Exchange Commission on the date hereof (the “Report”), I, Virginia M. Rometty, Chairman, President and Chief Executive Officer of the Company, certify, pursuant to 18 U.S.C. ss. 1350, as adopted pursuant to ss. 906 of the Sarbanes-Oxley Act of 2002, that:
(1) The Report fully complies with the requirements of section 13(a) or 15(d) of the Securities Exchange Act of 1934; and
(2) The information contained in the Report fairly presents, in all material respects, the financial condition and results of operations of the Company.
/s/ Virginia M. Rometty
Virginia M. RomettyChairman, President and Chief Executive OfficerOctober 27, 2015
A signed original of this written statement required by Section 906 has been provided to IBM and will be retained by IBM and furnished to the Securities and Exchange Commission or its staff upon request.
97
Exhibit 32.2
INTERNATIONAL BUSINESS MACHINES CORPORATION
CERTIFICATION PURSUANT TO18 U.S.C. SECTION 1350,
AS ADOPTED PURSUANT TOSECTION 906 OF THE SARBANES-OXLEY ACT OF 2002
In connection with the Quarterly Report of International Business Machines Corporation (the “Company”) on Form 10-Q for the period ending September 30, 2015, as filed with the Securities and Exchange Commission on the date hereof (the “Report”), I, Martin J. Schroeter, Senior Vice President and Chief Financial Officer of the Company, certify, pursuant to 18 U.S.C. ss. 1350, as adopted pursuant to ss. 906 of the Sarbanes-Oxley Act of 2002, that:
(1) The Report fully complies with the requirements of section 13(a) or 15(d) of the Securities Exchange Act of 1934; and
(2) The information contained in the Report fairly presents, in all material respects, the financial condition and results of operations of the Company.
/s/ Martin J. Schroeter
Martin J. SchroeterSenior Vice President and Chief Financial OfficerOctober 27, 2015
A signed original of this written statement required by Section 906 has been provided to IBM and will be retained by IBM and furnished to the Securities and Exchange Commission or its staff upon request.