Embed Size (px)
Citation preview

United States Department of Agriculture
Natural Resources Conservation Service
5 Radnor Corporate Center, Suite 200 Radnor, PA 19087-4585
Subject: Geophysical Assistance -- Archaeological Date: 9 March 1999
To: David P. Doss State Conservationist USDA-NRCS, John Hanson Business Center 339 Busch's Frontage Road, Suite 302 Annapolis, Maryland 21401-5534
Purpose: To attempt to locate relics of the Chesapeake Flotilla buried along the Patuxent River using ground-penetrating radar (GPR) and electromagnetic induction (EMI) techniques.
Participants: Ron Babcock, Head Survey Technician, Calvert County S&WCD, Prince Fredrick, MD Bill Clark, District Manager, Calvert County S&WCD, Prince Fredrick, MD Jennifer David, Survey Technician, Calvert County S&WCD, Prince Fredrick, MD Jim Doolittle, Research Soil Scientist, USDA-NRCS, Radnor, PA Karen Kilfeather, Survey Technician, Calvert County S&WCD, Prince Fredrick, MD Sue Langley, State Underwater Archaeologist, Maryland Historical Trust, Crownsville, MD Ann Lynn, State Biologist, USDA-NRCS, Annapolis, MD Jennifer Snoddy, Survey Technician, Calvert County S&WCD, Prince Fredrick, MD
Activities: All field activities were completed on 16 and 17 February 1999
Equipment: The ground-penetrating radar (GPR) unit used in this study was the Subsurface Interface Radar (SIR) System-2, manufactured by Geophysical Survey Systems, Inc. 1 The SIR System-2 consists of a digital control unit (DC-2) with keypad, VGA video screen, and connector panel. A 12-volt battery powered the system. Morey (1974), Doolittle (1987), and Daniels (1996) have discussed the use and operation ofGPR. The antenna used was the model 31 10 (120 mHz) with a 705DA transceiver. A scanning time of 120 nanoseconds (ns) and a scanning rate of 32 scan/second were used in this survey.
The electromagnetic induction meter used in this study was the EM3 l, manufactured by Geonics Limited 1• This meter is
portable and requires only one person to operate. McNeill (1980) has described principles of operation. No ground contact is required with this meter. The meter provides limited vertical resolution and depth information. Lateral resolution is approximately equal to the intercoil spacing. The EM3 l meter operates at a frequency of 9 ,800 Hz and has theoretical observation depths of about 3 and 6 m in the horizontal and vertical dipole orientations, respectively (McNeill, 1980). Values of apparent conductivity are expressed in rnilliSiemens per meter (mS/m).
To help summarize the results of this study, the SURFER for Windows software program developed by Golden Software
1 Trade names have been used in this report to provide specific infonnation. Their use does not constitute endorsement by UDSA-NRCS.

Inc. was used to construct two-dimensional simulations. 2 Grids were created using kriging methods.
Background: The Chesapeake Flotilla was established at the outbreak of the War of 1812. The purpose of the Flotilla was to protect the people of tidewater Maryland and Virginia from the British fleet. The Flotilla was under the command of Commander Joshua Barney. The Flotilla consisted of 18 row galleys. Each row galley was about 60 feet long, with a maximum breath of about 16.5 feet and a maximum draft of about 6.5 feet.
After an engagement at St. Leonard's Creek, the Flotilla retreated up the Patuxent River to escape the British fleet. There, Commander Barney was directed to scuttle the flotilla and several accompanying merchant vessels rather than to risk their capture to the advancing British force. Arranged in line, more than sixteen row galleys and merchant ships were blown up and sank in the Patuxent River. The exact location(s) of these buried vessels remains unclear. The channel of the Patuxent River has changed and the flood plain has filled with sediments since the destruction of the Chesapeake Flotilla.
A preliminary GPR investigation was conducted on 23 September 1997 by NRCS. The results of this initial study were favorable and additional GPR field investigations were planned.
Field Procedures: An irregularly shaped was laid out across the study site (see Figure 1). Maximum dimensions of this grid were 1350 by 1000 feet. The grid interval was about 50 feet. The base line was X = 400 feet. Survey flags were inserted in the ground at each grid intersection and served as reference points. This procedure produced two hundred and eighty-four observation points. Pulling the 120 mHz antenna along grid lines completed radar traverses. Traverses were conducted in an east-west direction for the lower 500 feet of the grid. North of this point, traverses were conducted in a north-south direction. Areas with thick brush were not surveyed with GPR.
At each observation point, measurements were obtained with the EM3 l meter in both the horizontal and vertical dipole orientations. For each measurement, the meter was held at hip height. Areas with very thick brush were not surveyed with EMI.
Ground Penetrating Radar: Archaeologists use ground-penetrating radar to facilitate excavation strategies, decrease field time and costs, and locate buried artifacts and archaeological features. Ground-penetrating radar have been used to locate buried cultural features in many areas of the world (Batey, 1987; Berg and Bruch, 1982; Bevan, 1977, 1984a and 1984b; Bevan and Kenyon, 1975; Bevan et al. , 1984; Bruzewicz et al., 1986; Cole, 1988; Dolphin and Yetter, 1985; Doolittle, 1988; Doolittle and Miller, 1991, Gibson, 1989; Grossman, 1979; Imai et al., 1987; Kenyon, 1977; Parrington, 1979; Sakayama et al., 1988; Vaughan, 1986; Vickers and Dolphin, 1975; Vickers et al., 1976; and Weymouth and Bevan, 1983). More recently, forensic scientists have used GPR for crime scene investigations (Davenport et al., 1990; Hoving, 1986; Mellett, 1992; and Strongman, 1992).
Ground-penetrating radar has been previously used in this study. A GPR survey was conducted over the "Turtle Shell Wreck" by Pete Petrone of the National Geographic Society (Shomette, 1995). In 1979, the Turtle Shell Wreck was found protruding from the bottom of the Patuxent River beneath 6 to 8 feet of water. After its partial excavation, Shomette identified the wreck as the USS Scorpion, the flagship of the Chesapeake Flotilla. In 1980, after an intense archaeological study, the wreck was reburied and the site was returned to its original condition. The radar survey, conducted over this known and recently buried target, provided an distinct graphic signature that could be used to identify other similar features buried beneath the Patuxent River. However, no other similar features have been found since with GPR.
In the search for buried cultural features with GPR, success is never guaranteed. Even under ideal site and soil conditions, some buried cultural features will be missed with GPR. The usefulness of GPR depends on the amount of uncertainty or omission that is acceptable to archaeologists. The detection of buried cultural features is affected by the electromagnetic gradient existing between the buried cultural feature and the soil; the size, shape, and orientation of the buried cultural feature; and the presence of scattering bodies within the soil (Vickers et al., 1976). The amount of energy reflected back to an antenna by an interface is a function of the dielectric gradient existing between the buried cultural feature and the soil. The greater and more abrupt the difference in electromagnetic properties, the greater the amount of energy reflected back to
2 Trade names have been used to provide specific information. Their use does not constitute endorsement by USDA-NRCS.
the antenna, and the more intense will be the amplitude of the recorded image. Buried cultural features with dielectric properties similar to the surrounding soil matrix are poor reflectors of electromagnetic energy and are difficult to detect on radar profiles (Doolittle, 1988; Gibson, 1989; Vaughan, 1986).
Most recently buried cultural features will contrast with the surrounding soil matrix. However, with the passage of time, buried cultural features decay or weather and become less electrically contrasting with the surrounding soil matrix. The size, orientation, and depth to a buried cultural feature affect detection. Large, electrically contrasting features reflect more energy and are easier to detect than small, less contrasting features . Small, shallowly buried features will be missed, unless located directly beneath the aperture of the radar's antenna. With GPR surveys covering extensive areas and using large grid intervals, the detection of small cultural features is often considered fortuitous. Small, deeply buried cultural features are difficult to discern on radar profiles. In many soils, signal attenuation limits observation depths. In addition, the reflective power of a buried feature decreases proportional to the fourth power of the distance to the object (Bevan and Kenyon, 1975).
In highly attenuating soils, profiling depths are restricted and many subsurface features are not directly sensed with GPR. Under highly attenuating conditions, the location and identification of buried cultural features are frequently inferred from bowed, disrupted, or disturbed soil horizons.
Cultural features are difficult to distinguish in sediments having numerous rock fragments, roots, cavities, animal burrows, and modem cultural features. These scattering bodies produce undesired reflections that complicate radar imagery and can mask the reflections from buried cultural features . Frequently, in the presence of these scattering bodies, "desired" cultural features are indistinguishable from background clutter. In soils having numerous scattering bodies, GPR surveys often provide little meaningful information to supplement traditional sampling methods (Bruzewicz et al. , 1986). The identification of buried cultural features were complicated by scattering bodies in surveys conducted by Bevan (1991), Dolphin and Yetter (1985), Doolittle (1988), and Vaughan (1986). ·
Calibration: The GPR is a time scaled system. This system measures the time that it takes electromagnetic energy to travel from the antenna to an interface (i.e., soil horizon, stratigraphic layer, buried artifact) and back. To convert the travel time into a depth scale, either the velocity of pulse propagation or the depth to a reflector must be known. The relationships among depth (d), two-way, pulse travel time (t), and velocity of propagation (v) are described in the following equation (Morey, 1974):
v= 2d/t [l]
The velocity of propagation is inversely related to the dielectric permittivity ( e) of the profiled material( s) according to the equation:
e = (c/v)2 [2]
where c is the velocity of propagation in a vacuum (0.9836 ft/ns) . The velocity is expressed in feet per nanosecond. The amount and physical state of water (temperature dependent) have the greatest effect on the dielectric permittivity of a material.
Tabled values are available that approximate the velocity of propagation and the dielectric permittivity of some materials (Morey, 1974, Petroy, 1994, Daniels, 1996). No borings or measurement was made at the study site. A tabled value of 0.23 ft/ns for wet loamy soils (Petroy 1994) was used in this investigation. The maximum depth of obser:vation was estimated from equation [l] . For this survey, a scanning time of 120 ns was used. A scanning time of 120 ns provided a maximum observation depth of about 14 feet.
Interpretations: Radar profiles were of good interpretive quality and contained an abundance of subsurface information. Strong to weakly expressed plane and point reflectors were common in the upper 7 feet (60 ns). However, most of these reflectors are not considered to represent buried artifacts. Many of these features are believed to represent soil horizons, layers of sediment, burrows and cavities in the near-surface materials. Reverberated reflections occurred on radar profiles when the antenna passed too close to the metallic stems of a survey flag. Radar profiles contained very few, strong subsurface reflections that could denote contrasting buried cultural features such as iron. Undoubtedly, such objects would have been weathered through the passage of time. Weathering processes would have produced a weathering rind, which would produce a transitional zone between the unweathered iron and the surrounding sediments. This process would weaken reflections.

No buried subsurface feature similar in appearance to the image of the buried wreckage of the USS Scorpion was detected (see Shomette, 1995).
The radar records contained no significant subsurface reflector that could be definitively identified as a buried gunboat. If galley boats are buried within the survey area, they were either missed (not passed over with the antenna) or were too decayed or fragmented to be discern with GPR. A pattern of fairly strong high amplitude reflections was detected near the southwest corner of the survey area (see Figure 2). These planar reflections occur at the border of the flood plain and may represent changes in sediment. While these reflections are not believed to represent cultural features, they represent the best reflectors in an otherwise monotonously mundane set of radar data. If ground-truth soil borings are to be made within the survey area, the identity of these features should be verified.
Electromagnetic induction: Electromagnetic induction (EMI) is a noninvasive geophysical tool that has been used to locate and define archaeological features (Bevan, 1983; Dalan, 1991; and Frohlich and Lancaster, 1986). These studies have demonstrated the utility of EMI for locating, identifying, and determine the boundaries of various types of cultural features such as buried structures, tombs, filled fortification ditches, and earthen mounds. Advantages of EMI methods include speed of operation and moderate resolution of subsurface features . Results of EMI surveys are interpretable in the field. This technique can provide in a relatively short time the large number of observations needed for site characterization and assessments. Maps prepared from correctly interpreted apparent conductivity data provide a basis for assessing site conditions and for planning further investigations.
Electromagnetic induction techniques use electromagnetic energy to measure the apparent conductivity of earthen materials. Apparent conductivity is a weighted average conductivity measurement for a column of earthen materials to a theoretical observation depth. Variations in apparent conductivity are produced by changes in the electrical conductivity of earthen materials. The electrical conductivity of soils is influenced by the volumetric water content, type and concentration of ions in solution, temperature and phase of the soil water, and amount and type of clays in the soil matrix, (McNeill, 1980). The apparent conductivity of soils increases with increases in the amount of soluble salts, water, and/or clays.
In this study, EMI was used to measure spatial variations in apparent electrical conductivity. Values of apparent conductivity are seldom diagnostic in themselves, but variations in these measurements can be used to infer the locations of buried cultural features. Interpretations of the EMI data are based on the identification of spatial patterns within data sets. The location, orientation, size, and shape of patterns revealed on two-dimensional plots provide clues as to the features causing them.
As with GPR, the detection of buried cultural features is affected by the electromagnetic gradient existing between the buried cultural feature and the soil. The greater or more abrupt the difference in electrical properties between the buried cultural feature and the surrounding soil matrix, the more likely the artifact will be detected. Buried cultural features with electrical properties similar to the surrounding soil matrix are often difficult to discern.
The size, orientation, and depth to an artifact affect interpretations. Large objects are easier to detect than small objects. Small cultural features may be detectable at shallow depths. However, these features are generally undetectable where deeply buried.
Interpretations: Figure 3 contains two-dimensional plots of data collected with the EM3 l meter in the horizontal (left-hand plot) and vertical (right-hand plot) dipole orientations. In Figure 3, the left-hand plot represents the spatial distribution of apparent conductivity within the upper 2 meters of the profiled sediments. The right-hand plot represents the spatial distribution of apparent conductivity within the upper 5 meters of the profile sediments. In each plot, the isoline interval is 2 mS/m.
At most observation points, apparent conductivity increased with depth. Apparent conductivity averaged 17.4 mS/m and 24.3 mS/m in the horizontal and vertical dipole orientations, respectively. This trend is believed to reflect increasing moisture and clay content with increasing soil depth. In general, apparent conductivity increases toward the west and the border of the flood plain with the upland. This spatial pattern is presumed to reflect principally changes in soil types and properties. The southern portion of this zone contains the conspicuous planar reflections detected with GPR.
In Figure 3, broad ribbon-like patterns of apparent conductivity suggest changes in soil types and properties. Complex patterns of iso-conductivity lines suggest contrast in the underlying materials and possibly the presence of buried cultural
features. In the right-hand plot a conspicuous anomaly has been labeled "A." This anomaly is highly contrasting, close to the river, and may represent a buried cultural feature. Ground-penetrating radar records from this area failed to disclose any anomalous feature or pattern.
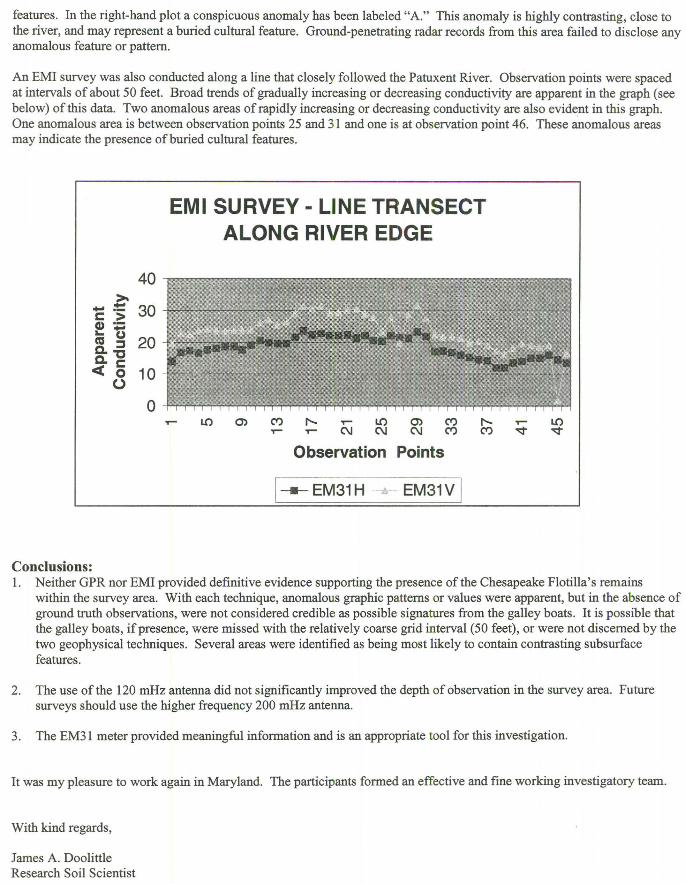
An EMI survey was also conducted along a line that closely followed the Patuxent River. Observation points were spaced at intervals of about 50 feet. Broad trends of gradually increasing or decreasing conductivity are apparent in the graph (see below) of this data. Two anomalous areas of rapidly increasing or decreasing conductivity are also evident in this graph. One anomalous area is between observation points 25 and 31 and one is at observation point 46. These anomalous areas may indicate the presence of buried cultural features.
Conclusions:
40 ~ c ·:;: 30
~~ (1S ::l 20 a. 'tJ a. c:
<C 0 10 0
0
EMI SURVEY- LINE TRANSECT ALONG RIVER EDGE
Observation Points
I--- EM31 H • EM31V I
1. Neither GPR nor EMI provided definitive evidence supporting the presence of the Chesapeake Flotilla's remains within the survey area. With each technique, anomalous graphic patterns or values were apparent, but in the absence of ground truth observations, were not considered credible as possible signatures from the galley boats. It is possible that the galley boats, if presence, were missed with the relatively coarse grid interval (50 feet), or were not discerned by the two geophysical techniques. Several areas were identified as being most likely to contain contrasting subsurface features.
2. The use of the 120 mHz antenna did not significantly improved the depth of observation in the survey area. Future surveys should use the higher frequency 200 mHz antenna.
3. The EM3 l meter provided meaningful information and is an appropriate tool for this investigation.
It was my pleasure to work again in Maryland. The participants formed an effective and fine working investigatory team.
With kind regards,
James A. Doolittle Research Soil Scientist

cc: A. J. Brown, State Soil Scientist, USDA-NRCS, John Hanson Business Center, 339 Busch's Frontage Road #301 ,
Annapolis, MD 21401-5534 B. Clark, District Manager, Calvert County Soil Conservation District, PO box 657, Prince Fredrick, MD 20678 J. Culver, Acting Director, USDA-NRCS, National Soil Survey Center, Federal Building, Room 152,100 Centennial Mall
North, Lincoln, NE 68508-3866 B. Lynn, State Biologist, USDA-NRCS, John Hanson Business Center, 339 Busch's Frontage Road #301 , Annapolis, MD
21401-5534 C. H. Smith, Director of Soils Survey Division, USDA-NRCS, Room 4250 South Building, 14th & Independence Ave.
SW, Washington, DC 20250
References
Batey, R. A. 1987. Subsurface interface radar at Sepphoris, Israel, 1985. Journal of Field Archaeology 14(1): 1-8.
Berg, F. and H. Bruch. 1982. Georadar: Archaeological interpretation of soil radar data. Second Nordic Conference on the Application of Scientific Methods in Archaeology. Elsinore, Denmark, 17-19 August 1981. In: PACT 7:285-294.
Bevan, B. W. 1977. Ground-penetrating radar at Valley Forge. Geophysical Survey Systems, Inc. Hudson, New Hampshire.
Bevan, B. W. 1983. Electromagnetics for mapping buried earth features . Journal of Field Archaeology 10:47-54.
Bevan, B. W. 1984a. Environmental effects on ground-penetrating radar. pp. 201-204. In: Abstract, 54th Annual International SEG Meeting, held at Atlanta, Georgia. Dec. 2-6, 1984.
Bevan, B. W. 1984b. Looking backward: geophysical location of historic structures. pp. 285-301. In: The Scope of Historical Archaeology, Essays in honor of John L. Cotter. Ed. D. G. Orr and D. G. Crozier. Temple Uniyersity, Philadelphia.
Bevan, B. W. 1991. The search for graves. Geophysics 56(9):1310-1319.
Bevan, B. and J. Kenyon. 1975. Ground-probing radar for historical archaeology. MASCA (Museum Applied Science Center for Archaeology) University of Pennsylvania, Philadelphia. Newsletter 11(2):2-7.
Bevan, B. W., D. G. Orr, and B. S. Blades. 1984. The discovery of the Taylor House at the Petersburg National Battlefield. Historical Archaeology 18:64-74.
Bruzewicz, A. J., C. R. Smith, D. E. Berwick, and J. E. Underwood. 1986. The use of ground-penetrating radar in cultural resource management. Technical Papers 1986 ACSM-ASPRS Annual Convention Vol. 5: 233-242.
Cole, D. P. 1988. Hi-tech archaeology: ground-penetrating radar. Biblical Archaeology Review 14(1): 38-40.
Dalan, R. A. 1991. Defining archaeological features with electromagnetic surveys at the Cahokia Mounds State Historic Site. Geophysics 56: 1280-1287.
Daniels, D. J. 1996. Surface-Penetrating Radar. The Institute of Electrical Engineers, London, United Kingdom. 300 p.
Davenport, G. C., T. J. Griffin, J. W. Lindemann, and D. Reimmer. 1990. Geoscientists and law enforcement professional work together in Colorado. Geotimes 35(7): 13-15.
Dolphin, L . and T. J. Yetter. 1985. Geophysical survey at Third Mission Site, Santa Clara University. SRI Project 8745. SRI International, Menlo Park, California. p. 56.

Doolittle, J. A. 1987. Using ground-penetrating radar to increase the quality and efficiency of soil surveyi;. pp. 11-32. In: Reybold, W. U. and G. W. Peterson (eds.) Soil Survey Techniques, Soil Science Society of America. Special Publication No. 20. p. 98
Doolittle, J. A. 1988. Ground-penetrating radar (GPR) survey at Tell Halif, Israel. pp. 180-213. In: Technical Proceedings of the Second International Symposium on Geotechnical Applications of Ground-Penetrating Radar. Gainesville, Florida. March 6-10 1988.
Doolittle, J. A. and W. F. Miller. 1991. Use of ground-penetrating radar in archaeological investigations. pp. 81-94. In: C. A. Behrens and T. L. Sever (Eds.) Application of Space-Age Technology in Anthropology; November 28, 1990, Conference Proceedings. NASA John C. Stennis Space Center p. 270. Special Publication.
Frohlich, B. and W. J. Lancaster. 1986. Electromagnetic surveying in current Middle Eastern archaeology: application and evaluation. Geophysics 51:1414-1425.
Gibson, J. L. 1989. Digging on the dock of the bay(ou): the 1988 excavation at Poverty Point. Univ. of Southwest Louisiana Center for Archaeological Studies. Report No 8 p. 227.
Grossman, J. W. 1979. Ground-penetrating radar survey at Raritan Landing: an underground map of a buried settlement. Annual Meetings of the Society for American Archaeology, Vancouver, British Columbia. April 23-26, 1979. p. 15.
Hoving, G. L. 1986. Buried body search technology. Identification News. Feb. p. 3,15.
Imai, T. , T . Sakayama, and T. Kanemori. 1987. Use of ground-probing radar and resistivity surveys for archaeological investigations. Geophysics 52(2): 137-150. ·
Kenyon, J. L. 1977. Ground-penetrating radar and its historical application to a historical archaeological site. Historical Archaeology 2:48-55 .
McNeill, J. D. 1980. Electromagnetic terrain conductivity measurement at low induction numbers. Technical Note TN-6. Geonics Limited, Mississauga, Ontario. 15 p.
Mellett, J. S. 1992. Location of human remains with ground penetrating radar. pp. 359-365. In: Hanninen, P. and S. Autio (Eds.) Fourth International Conference on Ground Penetrating Radar. June 8-13 , 1992. Rovaniemi, Finland. Geological Survey of Finland, Special Paper 16. p. 365.
Morey, R. M. 1974. Continuous subsurface profiling by impulse radar. pp. 2 12-232. In: Proceedings, ASCE Engineering Foundation Conference on Subsurface Exploration for Underground Excavations and Heavy Construction, held at Henniker, New Hampshire. Aug. 11-16, 1974.
Parrington, M. 1979. Geophysical and aerial prospecting techniques at Valley Forge National Historical Park, Pennsylvania. Journal of Field Archaeology 6(2): 193-201.
Petroy, D. E., 1994. Assessment of ground-penetrating radar applicability to specific site investigations: Simple methods for pre-survey estimation of likely dielectric constants, target resolution, and reflection strengths. SAGEEP 94. Symposium on the Application of Geophysics to Engineering and Environmental Problems. March 27 to 31, 1994. Boston, Massachusetts . 21 pp.
Sakayama, T., T. M. Osada, and K. Tamura. 1988. Some examples of archaeological investigations using ground probing radar. pp. 57-60. In: Technical Proceedings of the Second International Symposium on Geotechnical Applications of Ground-Penetrating Radar. Gainesville, Florida. March 6-10 1988.
Shomette, D. G. 1995.Tidewater Time Capsule; History Beneath the Patuxent. Tidewater Publishers, Centerville, MD. p.370.
Strongman, K. B. 1992. Forensic application of ground-penetrating radar. pp. 203-212. In: Pilon, J. A. (ed.) Ground Penetrating Radar. Geological Survey of Canada, Ottawa, Canada. Paper 90-4. p. 241 .

Vaughan, C. J. 1986. Ground-penetrating radar survey in archaeological investigations. Geophysics 51(3):595-604.
Vickers, R. S. and L. T. Dolphin. 1975. A communication on the archaeological radar experiment at Chaco Canyon, New Mexico. MASCA Newsletter 11(1): l-3 .
Vickers, R. , L. Dolphin, and D. Johnson. 1976. Archaeological investigations at Chaco Canyon using subsurface radar. pp. 81-101. In: Remote Sensing Experiments in Cultural Resource Studies, assembled by T. R. Lyons, Chaco Center, USDINPS and University of New Mexico.
Weymouth, J. W. and B. W. Bevan. 1983. Combined magnetic and ground penetrating radar survey of an archaeological site in Oklahoma. pp. 1.1-1.4. In: Digest International Geoscience and Remote Sensing Symposium (IGARDD' 83 ' ) Vol. 1.

Fi ure 1
EMI SURVEY SEARCH FOR CHESAPEAKE FLOTILLA
NEAR HILL'S BRIDGE, PATUXENT RIVER, MARYLAND
... Cl.)
tf. c:
B c: ca -en c
Location of Observation Points & GPR Traverses
t + t + t+t+t+t 135•1-P~~~~~~~~~~~~~~~~~~~~~~---+----.
130 125 120 115
110
105 100
95 90 85
80 75 70 65 60 55
50 45 40
15
• •
• • • • • • • • • • • •
• • • • • • • • • • • • • • • • • • • • • • • • • • •
• • • • • • • • • • • • • • • • • • • • • • • • • • • • • • • • • • • • • • • • • • •
• • • • • • • • • • • • • • • • • • • • • • • • • • • • • • • • •
• • • • • • • • • • • • • • • • • • • • • • • • • • • • • • • • • • • • • • • • • • • • • • • • • • • • • • • • • • • • • • • • • • • • • • • • • • • • • • • • • • • • • • • • • • • • • • • • • • • • • • • • • • • • • • •
• • • • • • • • • • • • • • • • • • • • • • • • • • • • • • • • • • • • • • • • • • • • • •
·~~~--,..---~-----~----+~+----r~.....----.~-r----.~-r---,....--.-~.---r~T""""-i+--
0 100 200 300 400 500 600 700 800 900 1000
Distance in Feet • Observation point
Direction of GPR traverse

EMI SURVEY SEARCH FOR CHESAPEAKE FLOTILLA
NEAR HILL'S BRIDGE, PATUXENT RIVER, MARYLAND
Q) Q) u.. c
Figure2
45
Location of Identified Buried Planar Reflectors
t + t + t +t+t+t
• • • • • • • • • • • • • •
• • • • •
• • • • • • • • • • • • • • • • • • • • • •
• • • • • • • • • • • • • • • • • • • • • • • • • • • • •
• • • • • • • • • • • • • •
• • • • • • • • • • • • • • • • • • • • • •
• • • • • • • • • • • • • • • • • • • • • • • . . . . . . . . . . . . . . . . . . _____. . ...,..__....._ . . . . . . . . . . . . . . -. ............. . . . . . . . . . . . . . . .......,._ . . . . . . . . . . . . . . . -.-. . . . . . . . . . . . . .
. . -- . . . . . . . . . . . . . -~ . . . . . . . . . . . . . . . _...__. . . . . . . . . . -. . ........ . . . . . . . • • • • • • • • -
r1-11----~.--....... ~..--r~+-...... ~+----r~""T"""--.~ ......... ---.r----.-~r--....... ~.--"""T"~.....---1-
o 100 200 300 400 500 600 700 800 900 1000 .
Distance in Feet
• Observation point Direction of GPR traverse Subsurface Planar Reflector

~ J! c
CD CJ c J! en c
Figure 3
0
EMI SURVEY SEARCH FOR CHESAPEAKE FLOTILLA
NEAR HILL'S BRIDGE, PATUXENT RIVER, MARYLAND
EM31 METER HORIZONTAL DIPOLE ORIENTATION
Area not Surveyed
Area not Surveyed
200 400 600 800
Distance in Feet
1000
~ CD lL
c
CD CJ c as .. .!!! c
0
EM31 METER VERTICAL DIPOLE ORIENTATION
Area not Surveyed
Area not Surveyed
200 400 600 800
Distance in Feet
mS/m
• 34
32
30
28
~ f1 ::
1000
22
20
18
16
14
12
10