Embed Size (px)
Citation preview
UNITED STATES National Residue Program for Meat,
Poultry, and Egg Products
2010 RESIDUE SAMPLE RESULTS
United States Department of Agriculture Food Safety and Inspection Service
Office of Public Health Science
June 2012
2
TABLE OF CONTENTS
ACKNOWLEDGEMENTS ....................................................................................................................... 7
EXECUTIVE SUMMARY ........................................................................................................................ 9
ACRONYMS ............................................................................................................................................. 11
INTRODUCTION ..................................................................................................................................... 13
SAMPLING PLANS OF THE U.S. NATIONAL RESIDUE PROGRAM FOR MEAT, POULTRY AND EGG PRODUCTS ........................................................................................................................... 15
Domestic Sampling Plan ....................................................................................................... 15 Import Reinspection Sampling Plan ...................................................................................... 17 Estimated Livestock, Poultry, and Egg Products .................................................................. 18
Table 1. 2010 Estimated Consumption Data by Production Class ................................... 18
SUMMARY OF DOMESTIC DATA ...................................................................................................... 20
Scheduled Sampling .................................................................................................................. 20 Sampling for Baseline Assessments ...................................................................................... 20
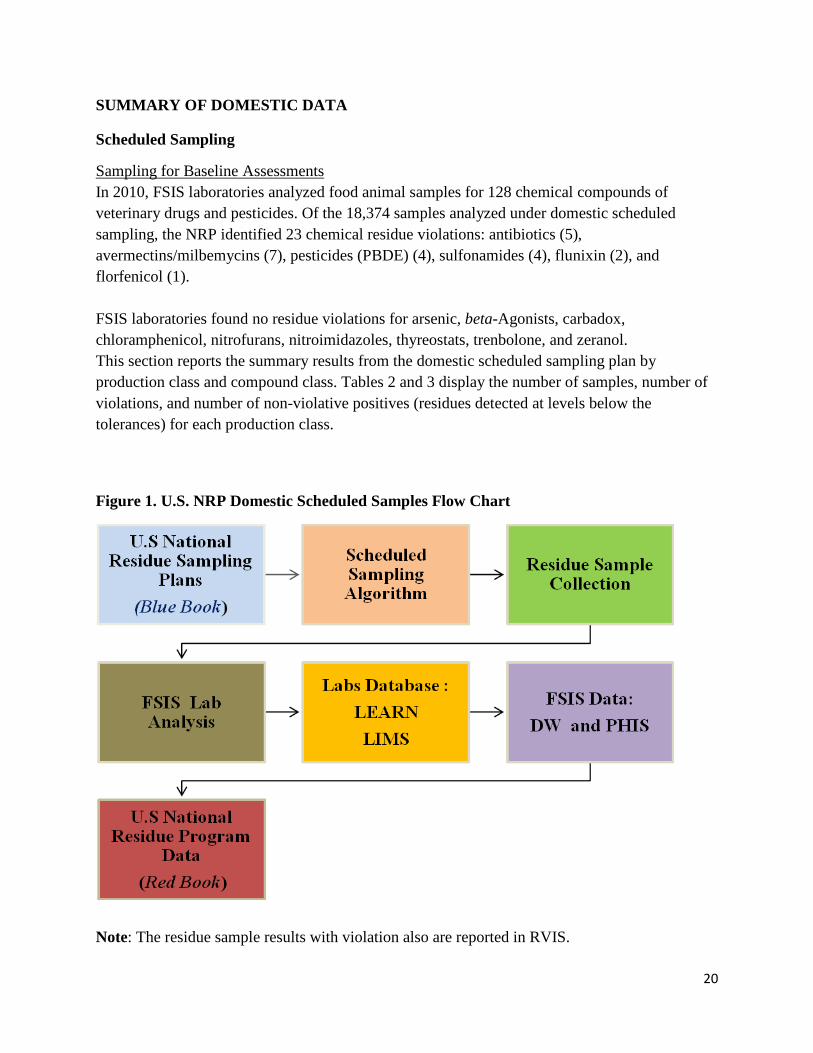
Figure 1. U.S. NRP Domestic Scheduled Samples Flow Chart........................................ 20 Production Class .................................................................................................................... 21
Table 2. Total Number of Samples by Production Class ................................................... 21 Figure 2. Total Number of Samples and Violation Rate by Production Class .................. 22 Table 3. Total Number of Samples by Compound Class................................................... 23 Figure 3. Total Number of Samples and Violation Rate by Compound Class .................. 24
Targeted Assessments............................................................................................................ 25
Inspector-Generated Sampling ................................................................................................. 25 Sampling for Suspect Animals and Populations .................................................................... 25 Show Animals........................................................................................................................ 25
Table 4. Number of Samples Tested by Production Class................................................. 26 Table 5. Number of Samples Tested by Compound Class ................................................ 27
Summary of Import Data ........................................................................................................... 28 Figure 4. 2010 Imported Meat and Poultry Products by Country ..................................... 28 Figure 5. 2010 Imported Meat and Poultry Products by Species and Type ..................... 28 Figure 6. 2010 Imported Meat and Poultry Products by Species ...................................... 28
DOMESTIC SAMPLING RESULTS ..................................................................................................... 29
Compound Class Data .............................................................................................................. 29
3
Antibiotics ............................................................................................................................. 30 Table 6a. Antibiotics Summary (7-plate bioassay) ............................................................ 30 Figure 7. Antibiotics Summary .......................................................................................... 31 Table 6b. Antibiotics Violations Report ............................................................................ 32
Arsenic ................................................................................................................................... 32 Table 7a. Arsenic Summary ............................................................................................... 32 Figure 8. Arsenic Summary ............................................................................................... 33
Avermectins (Ivermectin and Doramectin) and Milbemycins (Moxidectin) ........................ 34 Table 8a. Avermectins and Milbemycins Summary .......................................................... 34 Table 8b. Avermectins Violations Report ......................................................................... 34 Figure 9. Avermectins and Milbemycins Summary .......................................................... 35
beta-Agonists (Clenbuterol, Cimaterol, Ractopamine, Salbutamol, and Zilpaterol) ............ 36 Table 9a. beta-Agonists Summary ..................................................................................... 36
Carbadox ................................................................................................................................ 36 Chloramphenicol ................................................................................................................... 36 Chlorinated Hydrocarbons and Chlorinated Organophosphates ........................................... 37
Table 10a. Chlorinated Hydrocarbons/Organophosphates Summary ................................ 37 Table 10b. Chlorinated Hydrocarbons/Organophosphates Violations Report .................. 37 Figure 10. Chlorinated Hydrocarbons/Organophosphates Summary ................................ 38
Florfenicol ............................................................................................................................. 38 Table 11a. Florfenicol Summary ....................................................................................... 38 Table 11b. Florfenicol Violations Report .......................................................................... 39 Figure 11. Florfenicol Summary ........................................................................................ 39
Flunixin .................................................................................................................................. 39 Table 12a. Flunixin Summary ............................................................................................ 40 Table 12b. Flunixin Violations Report .............................................................................. 40 Figure 12. Flunixin Summary ............................................................................................ 40
Nitrofurans ............................................................................................................................. 41 Nitroimidazoles ..................................................................................................................... 41 Sulfonamides ......................................................................................................................... 41
Table 13a. Sulfonamides Summary ................................................................................... 41 Table 13b. Sulfonamides Violations Report ...................................................................... 42 Figure 13. Sulfonamides Summary.................................................................................... 42
Thyreostats............................................................................................................................. 43 Trenbolone ............................................................................................................................. 43 Zeranol ................................................................................................................................... 43
Table 14. Distribution of Non-Violative Positive Samples by Chemical Residue and Product Class .............................................................................................................................................. 44
Production Class Data .............................................................................................................. 45
4
Beef Cows.............................................................................................................................. 46 Table 15a. Beef Cows Summary ....................................................................................... 46 Table 15b. Beef Cows Violations Report .......................................................................... 46 Figure 14. Beef Cows Summary ........................................................................................ 47
Boars/Stags ............................................................................................................................ 47 Table 16a. Boars/Stags Summary ...................................................................................... 47 Table 16b. Boars/Stags Violations Report ......................................................................... 48 Figure 15. Boars/Stags Summary ...................................................................................... 48
Bob Veal ................................................................................................................................ 49 Table 17a. Bob Veal Summary .......................................................................................... 49 Table 17b. Bob Veal Violations Report ............................................................................. 49 Figure 16. Bob Veal Summary .......................................................................................... 50
Bulls ....................................................................................................................................... 50 Table 18a. Bulls Summary ................................................................................................. 50 Table 18b. Bulls Violations Report ................................................................................... 51 Figure 17. Bulls Summary ................................................................................................. 51
Dairy Cows ............................................................................................................................ 52 Table 19a. Dairy Cows Summary ...................................................................................... 52 Table 19b. Dairy Cows Violations Report ......................................................................... 52 Figure 18. Dairy Cows Summary ...................................................................................... 53
Ducks ..................................................................................................................................... 54 Formula-fed Veal ................................................................................................................... 54
Table 20a. Formula-fed Veal Summary............................................................................. 54 Figure 19. Formula-fed Veal Summary ............................................................................. 55
Geese ..................................................................................................................................... 55 Table 21a. Geese Summary ............................................................................................... 55
Goats ...................................................................................................................................... 56 Table 22a. Goats Summary ................................................................................................ 56 Table 22b. Goats Violations Report................................................................................... 56 Figure 20. Goats Summary ................................................................................................ 57
Heavy Calves ......................................................................................................................... 57 Table 23a. Heavy Calves Summary ................................................................................... 57 Figure 21. Heavy Calves Summary ................................................................................... 58
Heifers ................................................................................................................................... 58 Lambs .................................................................................................................................... 59
Table 24a. Lambs Summary .............................................................................................. 59 Figure 22. Lambs Summary ............................................................................................... 59
Market Hogs .......................................................................................................................... 60 Table 25a. Market Hogs Summary .................................................................................... 60 Table 25b. Market Hogs Violation Report ........................................................................ 60
5
Figure 23. Market Hogs Summary..................................................................................... 61 Mature Chickens .................................................................................................................... 62
Table 26a. Mature Chickens Summary .............................................................................. 62 Figure 24. Mature Chicken Summary ................................................................................ 62
Mature Sheep ......................................................................................................................... 63 Mature Turkeys...................................................................................................................... 63
Table 27a. Mature Turkeys Summary ............................................................................... 63 Figure 25. Mature Turkeys Summary ................................................................................ 63
Non-formula-Fed Veal .......................................................................................................... 64 Table 28a. Non-formula-Fed Veal Summary .................................................................... 64 Figure 26. Non-formula-Fed Veal Summary ..................................................................... 64
Rabbits ................................................................................................................................... 65 Table 29a. Rabbits Summary ............................................................................................. 65
Roaster Pigs ........................................................................................................................... 65 Table 30a. Roaster Pigs Summary ..................................................................................... 65 Table 30b. Roaster Pigs Violations Report ........................................................................ 65 Figure 27. Roaster Pigs Summary ..................................................................................... 66
Sows....................................................................................................................................... 67 Table 31a. Sows Summary ................................................................................................ 67 Table 31b. Sows Violation Report ..................................................................................... 67 Figure 28. Sows Summary ................................................................................................. 68
Steers ..................................................................................................................................... 69 Table 32a. Steers Summary ............................................................................................... 69 Table 32b. Steers Violation Report .................................................................................... 69 Figure 29. Steers Summary ................................................................................................ 70
Young Chickens .................................................................................................................... 70 Table 33a. Young Chickens Summary .............................................................................. 70 Figure 30. Young Chickens Summary ............................................................................... 71
Young Turkeys ...................................................................................................................... 71 Table 34a. Young Turkeys Summary ................................................................................ 71
Egg Products .......................................................................................................................... 71
Scheduled Sampling — Targeted Assessments.......................................................................... 72 Environmental Contaminants
Table 35. Number of Positive and Non-detect Dairy Cows Samples Analyzed for Cadmium and Lead, 2010 Targeted Assessments Results ................................................ 72 Table 36. Statistical Analysis of Cadmium and Lead Levels in Kidneys and Muscles from Dairy Cows, 2010 Targeted Assessments Results ............................................................. 73
Inspector-Generated Sampling ................................................................................................. 74
6
Suspect Animals .................................................................................................................... 74 Fast Antimicrobial Screen Test (FAST) ............................................................................ 74 Kidney Inhibition Swab (KIS™) Test ............................................................................... 74 Collector-Generated (COLLGEN) ................................................................................... 75
Show Animals (SHOW) ................................................................................................... 75 State or Government Agency Testing (STATE) ............................................................... 75 Table 37. Summary Results, 2010 Inspector-Generated Sampling by Project ID............. 76 Figure 31. Location of Collector-Generated Violations by U.S. States............................. 77 Table 38. Distribution of Residue Violations, Chemical Residue, and Animal Class (COLLGEN) ...................................................................................................................... 78 Figure 32. Location of FAST Violations by U.S. States ................................................... 79 Table 39. Distribution of Residue Violations, Chemical Residue, and Animal Class (FAST) ............................................................................................................................... 80 Figure 33. Location of KIS™ Test Violations by U.S. States ........................................... 81 Table 40. Distribution of Residue Violations, Chemical Residue, and Animal Class (KIS™ Test) ....................................................................................................................... 82 Table 41. Distribution of Non-Violative Positive Residue by Production Class and Project ID ....................................................................................................................................... 83 Table 42. Distribution of Non-Violative Positive Residue by Residue Compound Class and Project ID ................................................................................................................... 84 Table 43. Distribution of Non-Violative Positive Residue by Residue Compound Class and Project ID .................................................................................................................... 85 Figure 34. Distribution of Non-Violative Positive Samples by Project ID and Selected Chemical Residue .............................................................................................................. 86
Inspector-Generated Sampling ................................................................................................. 87 Suspect Populations ............................................................................................................... 87 Fast Antimicrobial Screen Test (FAST) Results for Bob Veal ............................................. 87 Kidney Inhibition Swab (KIS™) Test Results for Bob Veal ................................................ 87 Show Animals........................................................................................................................ 87
Import Reinspection Results ...................................................................................................... 88 Table 44. Normal Reinspection Results............................................................................. 88 Table 45. Increased Reinspection Results ......................................................................... 95 Table 46. Intensified Reinspection Results ........................................................................ 95
7
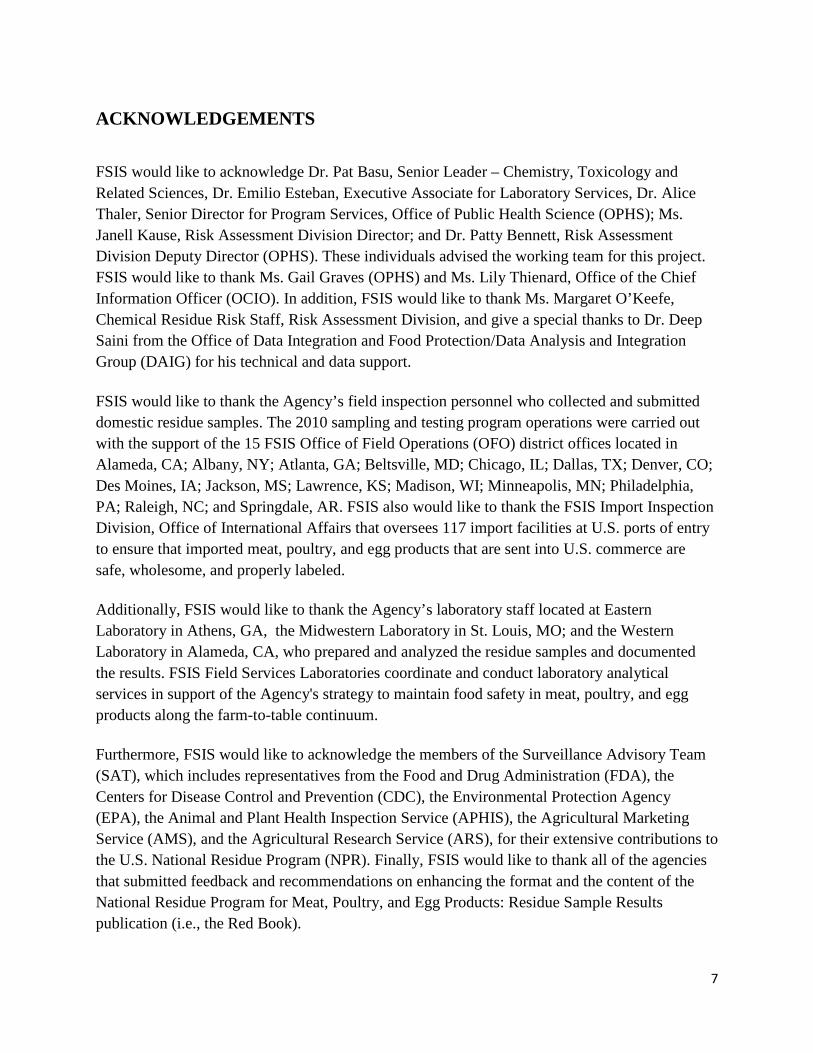
ACKNOWLEDGEMENTS
FSIS would like to acknowledge Dr. Pat Basu, Senior Leader – Chemistry, Toxicology and Related Sciences, Dr. Emilio Esteban, Executive Associate for Laboratory Services, Dr. Alice Thaler, Senior Director for Program Services, Office of Public Health Science (OPHS); Ms. Janell Kause, Risk Assessment Division Director; and Dr. Patty Bennett, Risk Assessment Division Deputy Director (OPHS). These individuals advised the working team for this project. FSIS would like to thank Ms. Gail Graves (OPHS) and Ms. Lily Thienard, Office of the Chief Information Officer (OCIO). In addition, FSIS would like to thank Ms. Margaret O’Keefe, Chemical Residue Risk Staff, Risk Assessment Division, and give a special thanks to Dr. Deep Saini from the Office of Data Integration and Food Protection/Data Analysis and Integration Group (DAIG) for his technical and data support. FSIS would like to thank the Agency’s field inspection personnel who collected and submitted domestic residue samples. The 2010 sampling and testing program operations were carried out with the support of the 15 FSIS Office of Field Operations (OFO) district offices located in Alameda, CA; Albany, NY; Atlanta, GA; Beltsville, MD; Chicago, IL; Dallas, TX; Denver, CO; Des Moines, IA; Jackson, MS; Lawrence, KS; Madison, WI; Minneapolis, MN; Philadelphia, PA; Raleigh, NC; and Springdale, AR. FSIS also would like to thank the FSIS Import Inspection Division, Office of International Affairs that oversees 117 import facilities at U.S. ports of entry to ensure that imported meat, poultry, and egg products that are sent into U.S. commerce are safe, wholesome, and properly labeled. Additionally, FSIS would like to thank the Agency’s laboratory staff located at Eastern Laboratory in Athens, GA, the Midwestern Laboratory in St. Louis, MO; and the Western Laboratory in Alameda, CA, who prepared and analyzed the residue samples and documented the results. FSIS Field Services Laboratories coordinate and conduct laboratory analytical services in support of the Agency's strategy to maintain food safety in meat, poultry, and egg products along the farm-to-table continuum. Furthermore, FSIS would like to acknowledge the members of the Surveillance Advisory Team (SAT), which includes representatives from the Food and Drug Administration (FDA), the Centers for Disease Control and Prevention (CDC), the Environmental Protection Agency (EPA), the Animal and Plant Health Inspection Service (APHIS), the Agricultural Marketing Service (AMS), and the Agricultural Research Service (ARS), for their extensive contributions to the U.S. National Residue Program (NPR). Finally, FSIS would like to thank all of the agencies that submitted feedback and recommendations on enhancing the format and the content of the National Residue Program for Meat, Poultry, and Egg Products: Residue Sample Results publication (i.e., the Red Book).
8
CONTACTS AND COMMENTS The Chemical Residue Risk Staff (CRRS), Risk Assessment Division (RAD), Office of Public Health Science, FSIS, USDA, coordinated this effort and is responsible for the publication of this material. Questions about the U.S. NRP should be directed to: USDA/FSIS/RAD/CRRS 1400 Independence Avenue, SW 355 E Street - Patriot Plaza III Washington, D.C. 20250-3700 Telephone: (202) 690-6409 Fax: (202) 690-6337 E-mail: [email protected] Web site: www.fsis.usda.gov/Science/Chemistry/index.asp PRINCIPAL AUTHORS (USDA/FSIS/OPHS/RAD/CRRS) Mr. Naser Abdelmajid Dr. Sarah Edwards Mr. Alex Domesle
9
EXECUTIVE SUMMARY
2010 United States National Residue Program Data The 2010 United States National Residue Program for meat, poultry, and egg products (U.S. NRP), an interagency chemical testing program administered by FSIS, examined food samples for the presence of 128 chemical compounds, including 78 veterinary drugs, 45 pesticides, and 5 environmental contaminants. All food samples were analyzed at one of three FSIS International Standardization Organization 17025 (ISO)-accredited laboratories: the Eastern Laboratory in Athens, GA; the Midwestern Laboratory in St. Louis, MO; and the Western Laboratory in Alameda, CA. The domestic sampling program of the U.S. NRP comprises scheduled sampling and inspector-generated sampling. The majority of violations detected by the 2010 domestic scheduled sampling plan were veterinary drugs, particularly sulfonamides and antibiotics used to prevent or treat bacterial infections. Generally, drug residue violations result from an inadequate withdrawal time for the drugs to clear the animal’s system. Detected residues are usually concentrated in kidney and liver tissue rather than in muscle tissue. Of the 211,733 samples analyzed in 2010, there were 1,632 violations: 23 from scheduled sampling and 1,609 from the inspector-generated program. FSIS field personnel collected 18,374 samples under the domestic scheduled sampling program, representing 60 compounds in 23 animal product classes. No residues were detected in 96% of the domestic scheduled samples. The domestic scheduled sampling program reported 23 residue violations: beef cows (2), boars/stags (3), bob veal (4), bull (1), dairy cows (2), goats (6), market hogs (2), roaster pig (1), sow (1), and steer (1). The 23 violations were distributed among the following compounds and compound classes: avermectins (7); sulfonamides (4); pesticides (4); antibiotics, unspecified (5); flunixin (2); florfenicol (1). Besides the 23 residue violations, the domestic scheduled sampling program identified 144 samples with non-violative positive residue levels. These are samples that tested positive for presence of residue, but at levels below the tolerance. Under the domestic scheduled sampling program, Unidentified Microbial Inhibitors (UMIs) comprised the highest percentage of non-violative positives (29% of the 144 non-violative positive samples), followed by tetracycline (17%) and ivermectin (15%). Rabbits, mature turkeys, and veal had the highest number of positive non-violative results. Under the inspector-generated program, FSIS inspection program personnel collected 211,733 samples. The in-plant inspector selects a carcass for sampling based on professional judgment and public health criteria outlined in FSIS Directives 10,800.1 and 10,220.3. FSIS labs reported 2,043 residue violations in 1,609 animals (a single animal may have multiple violations): beef
10
cows (84), bob veal (765), bulls (8), dairy cows (700), formula fed veal (3), goat (1), heavy calves (5), heifers (10), market hogs (3), non-formula fed veal (7), and steers (23). Neomycin accounted for the most residue violations across the inspector-generated program (520 or 25%), followed by flunixin (285 or 14%) and penicillin (281 or 14%). Besides the 2,043 residue violations, there were 4,215 samples reported as non-violative positives. Again, neomycin accounted for the highest percentage of non-violative positive samples (1,884 or 45%), followed by dihydrostreptomycin (487 or 12%) and tetracycline (516 or 12%). Bob veal, dairy cows, and beef cows had the highest number of positive non-violative results. The inspector-generated samples are screened in plants using either the Fast Antimicrobial Screening Test (FAST) or the Kidney Inhibition Swab (KIS™) test. Positive samples are sent to FSIS Midwestern laboratory for confirmation or initial analysis. FAST kits detected 58 (3%) of 2,043 total inspector-generated violation samples, compared to 1,926 (94%) of 2,043 violations detected by the KIS™ test kits. The remaining 3 % of violations comprise collector-generated samples and samples from show animals. Out of 4,215 non-violative positive samples analyzed under inspector-generated samples, 3,882 (92%) were detected with KIS™ tests, compared to 201 (5%) detected using the FAST screen. The remaining 3% of violations comprise collector-generated samples and samples from show animals and individual states. FSIS plans and administers an import reinspection program as part of the NRP. After the U.S. Customs Service and the USDA Animal and Plant Health Inspection Service (APHIS) requirements are met, shipments imported into the United States must be reinspected by FSIS at an approved import inspection facility. FSIS inspectors carry out reinspection in approximately 117 official import establishments. In 2010, the import sampling program analyzed 121 chemical residues from 13 compound classes of veterinary drugs and pesticides. Of the 2,843 samples analyzed, 24 violations were detected—all from the veterinary drug avermectin.
FSIS continually strives to improve methods for reporting the U.S. NRP data. These reports are publicly available online on the FSIS Web site at www.fsis.usda.gov/Science/Chemistry/index.asp. Interested parties may contact the FSIS Chemical Residue Risk Staff at (202) 690-6409 for additional copies of the annual report.
11
ACRONYMS
ADRS – Automated Disposition Reporting System
AIIS – Automated Imported Information System
AMDUCA – Animal Medicinal Drug Use Clarification Act
AMS – Agricultural Marketing Service
APHIS – Animal and Plant Health Inspection Service
ARS – Agricultural Research Service
CDC – Centers for Disease Control and Prevention
CHCs – Chlorinated hydrocarbons
COPs – Chlorinated organophosphates
COLLGEN – Collector-Generated Samples sent directly to the laboratory
CRRS – Chemical Residue Risk Staff
CVM – Center for Veterinary Medicine
DAIG – Data Analysis and Integration Group
DCA – Desfuroylceftiofur Acetamide
DCCD – Desfuroylceftiofur Cysteine Disulfide
DW – FSIS Data Warehouse
FAST – Fast Antimicrobial Screening Test
FDA – Food and Drug Administration
FSIS – Food Safety and Inspection Service
EPA – Environmental Protection Agency
HACCP – Hazard Analysis and Critical Control Points
KIS™ test – Kidney Inhibition Swab Test
LEARN – Laboratory Electronic Application for Results Notification
LIMS – Laboratory Information Management System
MARCIS – Microbiological and Residue Computer Information System
NASS – National Agricultural Statistics Service
12
ND – Non-detect
NRP – National Residue Program (Domestic & Import)
NSAID – Non-Steroidal Anti-inflammatory Drug
OCIO – Office of the Chief Information Officer
OFO – Office of Field Operations
OPHS – Office of Public Health Science
PBDE – Polybrominated diphenyl ethers
PCBs – Polychlorinated biphenyls
PHIS – Public Health Information System
PHV – Public Health Veterinarian
PPB – Parts per billion
PPM – Parts per million
RAD – Risk Assessment Division
RVIS – Residue Violation Information System
SAT – Surveillance Advisory Team
STATE – State or Government Agency Testing
SHOW – Show Animals
SULFAS – Sulfonamides compounds
TOI – Type of Inspection
13
INTRODUCTION
The 2010 United States National Residue Program (U.S. NRP) for Meat, Poultry, and Egg Products: Residue Sample Results (Red Book) provides the residue sampling results from testing for chemical compounds in food animals produced domestically or imported into the United States. The NRP requires the cooperation and collaboration of several agencies for its successful design and implementation. The Food Safety and Inspection Service (FSIS), the Environmental Protection Agency (EPA), and the Department of Health and Human Services’ Food and Drug Administration (FDA) are the primary federal agencies managing this program. The FDA, under the Federal Food, Drug, and Cosmetic Act, establishes tolerances or action levels for veterinary drugs, food additives, and environmental contaminants. The EPA, under the Federal Insecticide, Fungicide, and Rodenticide Act (as modified by the Food Quality Protection Act), establishes tolerance levels for registered pesticides. Title 21 Code of Federal Regulations (CFR) includes tolerance levels established by FDA; Title 40 CFR includes tolerance levels established by EPA.
A scheduled sampling program is developed annually by representatives from FSIS, FDA, EPA, the USDA Agricultural Research Service (ARS), the USDA Agricultural Marketing Service (AMS) and the Centers for Disease Control and Prevention (CDC). These agencies work together to create the annual sampling plan using NRP results, FDA veterinary drug inventories completed during on-farm visits and information from investigations. The agencies establish a relative ranking for the chemicals, determine the production classes of public health concern and evaluate FSIS laboratory capacity and analytical methods. FSIS publishes the finalized sampling plan in the U.S. NRP Sampling Plans for Meat, Poultry, and Egg Products, referred to as the Blue Book.
Chemical compounds tested in the program include approved and unapproved veterinary drugs, pesticides and environmental contaminants. The NRP is designed to: (1) provide a structured process for identifying and evaluating chemical compounds of concern in food animals; (2) analyze chemical compounds of concern; (3) collect and report results; (4) identify the need for regulatory follow-up when violative levels of chemical residues are found.
FSIS administers this regulatory program under the Federal Meat Inspection Act (FMIA) (21 U.S.C. 601 et seq.), the Poultry Products Inspection Act (PPIA) (21 U.S.C. 453 et seq.), and the Egg Products Inspection Act (21 U.S.C. 1031 et seq.). The program is designed to protect the health and welfare of consumers by regulating the meat, poultry, and egg products produced in federally inspected establishments and to prevent the distribution in commerce of any such products that are adulterated or misbranded.
Since 1967, FSIS has administered the NRP by collecting samples from meat, poultry, and egg products and analyzing the samples for specific chemical compounds at one of three FSIS
14
laboratories. A violation occurs when an FSIS laboratory detects a chemical compound level in excess of an established tolerance or action level. FSIS informs the producer, via certified letter, that an animal from that business has a violative chemical level. FSIS also shares the violation data with FDA, which has on-farm jurisdiction, and EPA. FDA and cooperating state agencies investigate producers linked to residue violations, and, if not corrected, can enforce legal action.
FSIS posts a weekly Residue Repeat Violator List, identifying producers with more than one violation on a rolling 12-month basis. These lists provide helpful information to processors and producers working to avoid illegal levels of residues, serve as deterrents for violators, and enable FSIS and FDA to make better use of resources. Because FSIS updates this list weekly, FDA may not have investigated each violation at the time of publication.
In the late 1990s, FSIS implemented the Hazard Analysis and Critical Control Points (HACCP) inspection system in all federally inspected establishments. The HACCP regulation (9 CFR 417) requires FSIS-inspected slaughter and processing establishments to identify all food safety hazards reasonably likely to occur before, during, and after entry into the establishment. The regulation also requires that the establishments determine preventive measures to control these hazards. FSIS takes regulatory action against establishments that do not have an adequate chemical residue control program in place.
15
SAMPLING PLANS OF THE U.S. NATIONAL RESIDUE PROGRAM FOR MEAT, POULTRY, AND EGG PRODUCTS
The NRP sampling plans focus on chemical residues in domestic meat, poultry and egg products and in import reinspection of meat and poultry products. The domestic sampling plan includes scheduled sampling and inspector-generated sampling. The import reinspection sampling plan encompasses normal sampling, increased sampling, and intensified sampling. For detailed sampling plan instructions, see FSIS Directive 10,800.1, Procedures for Residue Sampling, Testing, and Other Responsibilities for the National Residue Program.
DOMESTIC SAMPLING PLAN: Scheduled Sampling Scheduled sampling plans involve random tissue sampling from food animals that have passed ante-mortem inspection. The development of scheduled sampling plans proceeds in the following manner: 1) determine which chemical compounds are of concern to food safety; 2) use algorithms to rank the selected chemical compounds; 3) pair these chemical compounds with appropriate food animal and egg products; and 4) establish the number of samples to be collected.
The Surveillance Advisory Team (SAT), an interagency committee comprising representatives from FSIS, FDA, EPA, AMS, ARS and CDC, determines the chemical compounds and production classes (e.g., young chickens, bob veal, steers, etc.) of public health concern. FSIS calculates the number of samples needed for the scheduled sampling. The laboratories test the samples for the presence of chemical residues and report any violative levels. The resulting violation data are used to verify whether industry process controls and HACCP plans effectively control residues. The FSIS, FDA, and EPA review and make final adjustments to the plan.
Within the domestic sampling plan, there are two major types of assessments: continuous baseline and targeted sampling.
Continuous Baseline Assessments determine the prevalence of chemical residues in the nation’s food supply. Sample results are used to:
• guide FSIS decisions to condemn carcasses with violative levels of residues • guide FDA regulatory decisions when a sample contains violative levels of residues to
determine action against producers • guide industry decisions to retain product until the sample has been tested • guide industry decisions to recall a product that was not retained while the sample was
tested and found to contain violative levels of residue
16
Targeted Sampling Assessments allow us to react to the violations obtained from previous baseline assessments and intelligence information. Sample results are used to:
• reinvestigate animal populations from ongoing or previous baseline assessments if the violation rate is confirmed at 1% or greater
• investigate animal populations when the compounds in question have no established tolerances
• respond to intelligence reports from the field regarding use of veterinary drugs, pesticides and environmental contaminants
DOMESTIC SAMPLING PLAN: Inspector-Generated Sampling Inspector-generated sampling is conducted by in-plant Public Health Veterinarians (PHVs) when the PHV suspects that an animal may have violative levels of chemical residues. Currently, inspector-generated sampling targets individual suspect animals and suspect populations of animals. When an inspector-generated sample is collected, the carcass is held pending the results of laboratory testing. If a carcass is found to contain violative levels of residues, the carcass is condemned. Additionally, FSIS keeps a weekly list of establishments with repeat violations. Click here to access the weekly repeat violator list. Sampling for individual suspect animals The in-plant inspector selects a carcass for sampling based on professional judgment and public health criteria outlined in FSIS Directives 10,800.1 and 10,220.3 (i.e., animal disease signs and symptoms, producer history, or results from random scheduled sampling). Some samples are screened in the plant by the Inspector-in-Charge (IIC) and verified when necessary by a PHV. Other samples are sent directly to the laboratory for analysis. For example, if the IIC suspects the misuse of a veterinary drug in an animal, he/she can perform the relevant in-plant screening test. If the result of a screening test is positive, the sample is sent to an FSIS laboratory for confirmation.
Sampling for suspect animal populations Sampling for suspect animal populations is directed by a FSIS regulation, directive, or notice.
Actions taken on violations A violation occurs when an FSIS laboratory detects a residue that exceeds an established tolerance or action level. Once the laboratory analysis is complete, FSIS enters the residue violation into the Residue Violation Information System (RVIS), an FSIS/FDA interagency database. FDA accesses the violative sample results, and, because FDA has on-farm jurisdiction, evaluates the appropriate action to take on the violation. These actions range in severity from returning to the farm for re-education to taking legal action.
17
IMPORT REINSPECTION SAMPLING PLAN
Imported meat, poultry, and egg products are sampled through the Port-of-Entry Reinspection Program, a chemical residue-monitoring program conducted to verify the equivalence of inspection systems in exporting countries. All imported products are subject to reinspection and one or more types of inspection (TOI) is conducted on every lot of product before it enters the United States. Chemical residue sampling is included in the reinspection of imported products. The following are the three levels of chemical residue reinspection:
• Normal sampling (random sampling from a lot) • Increased sampling (above-normal sampling as the result of an Agency management
decision) • Intensified sampling (when a previous sample for a TOI failed to meet U.S. requirements)
For both normal and increased sampling, the lot is not required to be retained pending laboratory results; however, the importer may choose to retain the lot pending the laboratory results. The lot is subject to recall if it is not retained and is found to contain violative levels of residue.
For intensified sampling, the lot must be retained pending laboratory results. The data obtained from laboratory analyses are entered into the Automated Import Information System (AIIS), an FSIS database designed to generate reinspection assignments, receive and store results, and compile histories for the performance of foreign establishments certified by the inspection system in the exporting country.
18
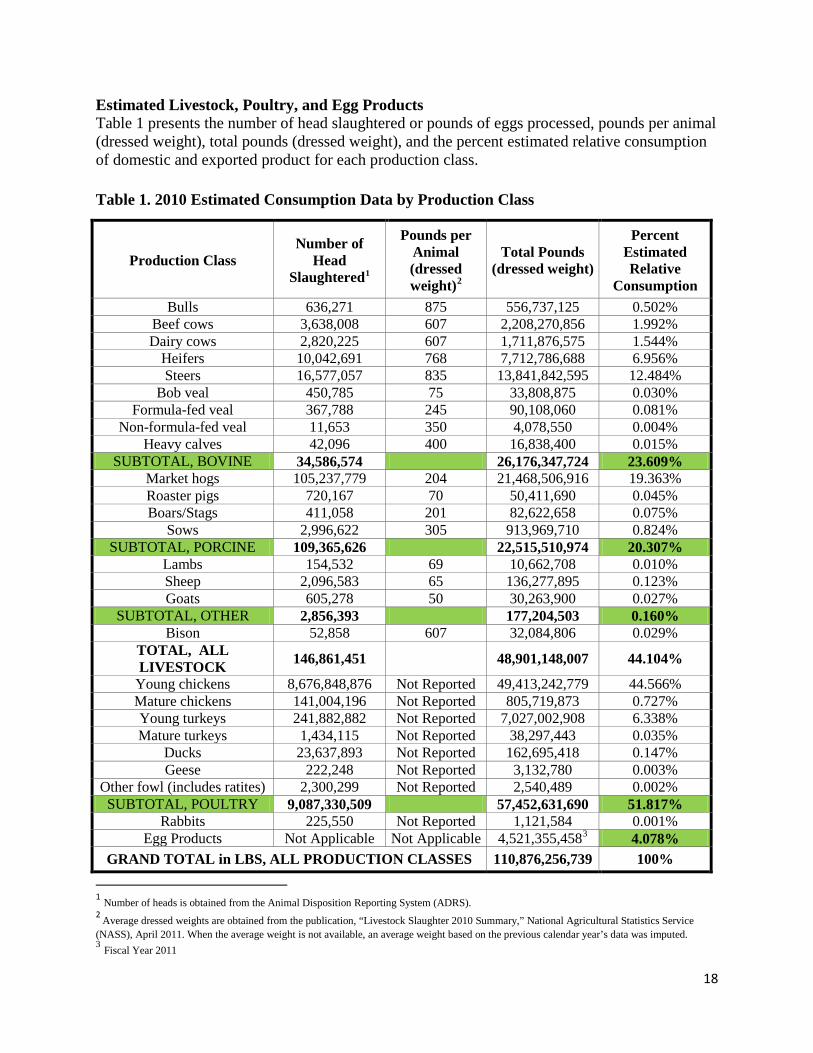
Estimated Livestock, Poultry, and Egg Products Table 1 presents the number of head slaughtered or pounds of eggs processed, pounds per animal (dressed weight), total pounds (dressed weight), and the percent estimated relative consumption of domestic and exported product for each production class. Table 1. 2010 Estimated Consumption Data by Production Class
Production Class Number of
Head Slaughtered1
Pounds per Animal (dressed weight)2
Total Pounds (dressed weight)
Percent Estimated Relative
Consumption Bulls 636,271 875 556,737,125 0.502%
Beef cows 3,638,008 607 2,208,270,856 1.992% Dairy cows 2,820,225 607 1,711,876,575 1.544%
Heifers 10,042,691 768 7,712,786,688 6.956% Steers 16,577,057 835 13,841,842,595 12.484%
Bob veal 450,785 75 33,808,875 0.030% Formula-fed veal 367,788 245 90,108,060 0.081%
Non-formula-fed veal 11,653 350 4,078,550 0.004% Heavy calves 42,096 400 16,838,400 0.015%
SUBTOTAL, BOVINE 34,586,574 26,176,347,724 23.609% Market hogs 105,237,779 204 21,468,506,916 19.363% Roaster pigs 720,167 70 50,411,690 0.045% Boars/Stags 411,058 201 82,622,658 0.075%
Sows 2,996,622 305 913,969,710 0.824% SUBTOTAL, PORCINE 109,365,626 22,515,510,974 20.307%
Lambs 154,532 69 10,662,708 0.010% Sheep 2,096,583 65 136,277,895 0.123% Goats 605,278 50 30,263,900 0.027%
SUBTOTAL, OTHER 2,856,393 177,204,503 0.160% Bison 52,858 607 32,084,806 0.029%
TOTAL, ALL LIVESTOCK 146,861,451 48,901,148,007 44.104%
Young chickens 8,676,848,876 Not Reported 49,413,242,779 44.566% Mature chickens 141,004,196 Not Reported 805,719,873 0.727% Young turkeys 241,882,882 Not Reported 7,027,002,908 6.338% Mature turkeys 1,434,115 Not Reported 38,297,443 0.035%
Ducks 23,637,893 Not Reported 162,695,418 0.147% Geese 222,248 Not Reported 3,132,780 0.003%
Other fowl (includes ratites) 2,300,299 Not Reported 2,540,489 0.002% SUBTOTAL, POULTRY 9,087,330,509 57,452,631,690 51.817%
Rabbits 225,550 Not Reported 1,121,584 0.001% Egg Products Not Applicable Not Applicable 4,521,355,4583 4.078%
GRAND TOTAL in LBS, ALL PRODUCTION CLASSES 110,876,256,739 100%
1 Number of heads is obtained from the Animal Disposition Reporting System (ADRS). 2 Average dressed weights are obtained from the publication, “Livestock Slaughter 2010 Summary,” National Agricultural Statistics Service (NASS), April 2011. When the average weight is not available, an average weight based on the previous calendar year’s data was imputed. 3 Fiscal Year 2011
19
Definitions of FSIS Production Classes
Bovine • Beef cows are mature female cattle bred for muscle development, ordinarily having given
birth to one or more calves. • Bulls are mature, uncastrated male cattle. • Calves/veal definitions are under FSIS review. • Dairy cows are mature female cattle bred for milk production, ordinarily having given birth
to one or more calves. • Heifers are young, female cattle that have not yet given birth to a calf. • Steers are male cattle castrated before sexual maturity.
Porcine • Boars are mature swine showing male sexual characteristics. • Market hogs are swine usually marketed near 6 months of age and are 200 to 300 pounds live
weight. • Roaster pigs are animals of both sexes and any age marketed with the carcass unsplit and
with the head intact. • Sows are mature female swine ordinarily having given birth to one or more litters. • Stags are male swine castrated after they have reached sexual maturity.
Poultry • Ducks are birds of both sexes and any age. • Egg products are yolks, whites, or whole eggs after breaking and are processed as dried,
frozen, or liquid. • Geese are birds of both sexes and any age. • Mature chickens are adult female birds, usually more than 10 months of age. • Mature turkeys are birds of both sexes, usually more than 15 months of age. • Other poultry include ratites (typically ostriches, emus, and rheas), guineas, squabs (young,
unfledged pigeons), adult pigeons, pheasants, grouse, partridge, quail, etc. • Young chickens include broilers/fryers birds of both sexes, usually less than 10 weeks of age. • Roasters are birds of both sexes usually less than 12 weeks of age; and capons are surgically
castrated male birds, usually less than 8 months of age. • Young turkeys include fryer/roaster birds that are of both sexes and usually less than 3-6
months of age
Other • Goats are animals of both sexes and any age. • Lambs are defined as sheep younger than 14 months and having a break joint in at least one
leg. • Other livestock include bison, deer, and elk, which are under voluntary inspection. • Rabbits are any of several lagomorph mammals of both sexes, any age, and are under
voluntary inspection. • Sheep are mature animals of both sexes.
20
SUMMARY OF DOMESTIC DATA
Scheduled Sampling
Sampling for Baseline Assessments In 2010, FSIS laboratories analyzed food animal samples for 128 chemical compounds of veterinary drugs and pesticides. Of the 18,374 samples analyzed under domestic scheduled sampling, the NRP identified 23 chemical residue violations: antibiotics (5), avermectins/milbemycins (7), pesticides (PBDE) (4), sulfonamides (4), flunixin (2), and florfenicol (1). FSIS laboratories found no residue violations for arsenic, beta-Agonists, carbadox, chloramphenicol, nitrofurans, nitroimidazoles, thyreostats, trenbolone, and zeranol. This section reports the summary results from the domestic scheduled sampling plan by production class and compound class. Tables 2 and 3 display the number of samples, number of violations, and number of non-violative positives (residues detected at levels below the tolerances) for each production class.
Figure 1. U.S. NRP Domestic Scheduled Samples Flow Chart
Note: The residue sample results with violation also are reported in RVIS.
21
Production Class
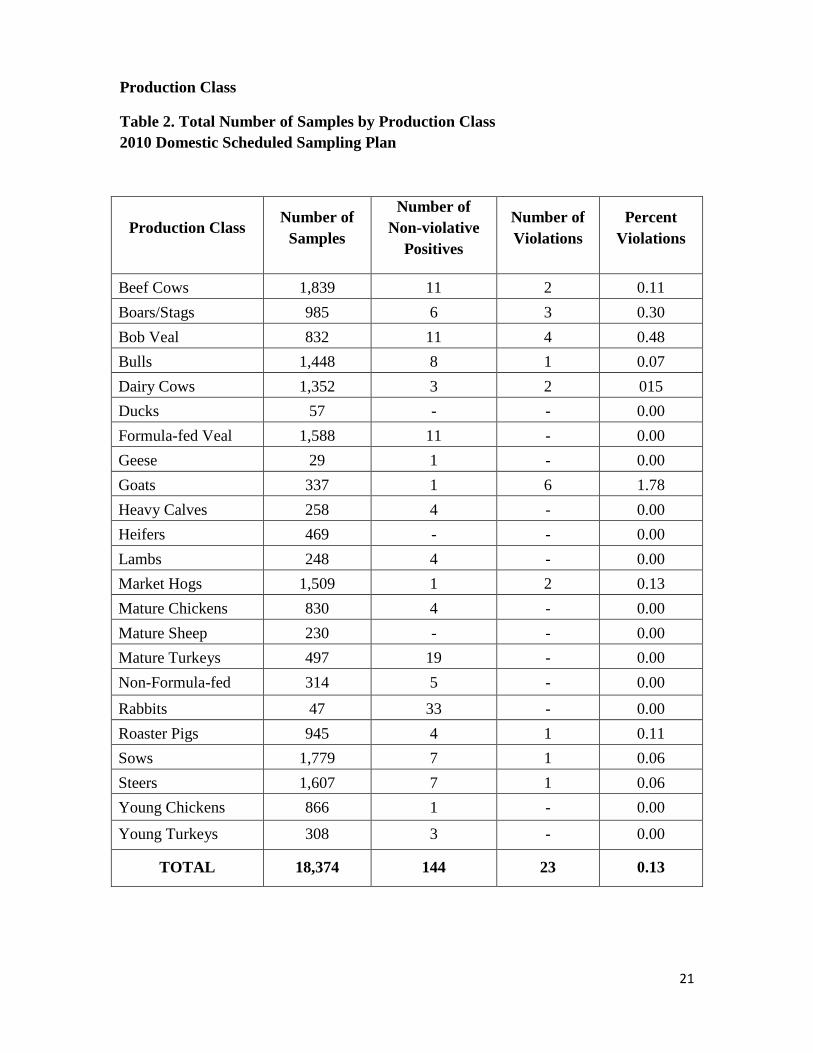
Table 2. Total Number of Samples by Production Class 2010 Domestic Scheduled Sampling Plan
Production Class Number of Samples
Number of Non-violative
Positives
Number of Violations
Percent Violations
Beef Cows 1,839 11 2 0.11 Boars/Stags 985 6 3 0.30 Bob Veal 832 11 4 0.48 Bulls 1,448 8 1 0.07 Dairy Cows 1,352 3 2 015 Ducks 57 - - 0.00 Formula-fed Veal 1,588 11 - 0.00 Geese 29 1 - 0.00 Goats 337 1 6 1.78 Heavy Calves 258 4 - 0.00 Heifers 469 - - 0.00 Lambs 248 4 - 0.00 Market Hogs 1,509 1 2 0.13 Mature Chickens 830 4 - 0.00 Mature Sheep 230 - - 0.00 Mature Turkeys 497 19 - 0.00 Non-Formula-fed
314 5 - 0.00
Rabbits 47 33 - 0.00 Roaster Pigs 945 4 1 0.11 Sows 1,779 7 1 0.06 Steers 1,607 7 1 0.06 Young Chickens 866 1 - 0.00
Young Turkeys 308 3 - 0.00
TOTAL 18,374 144 23 0.13
22
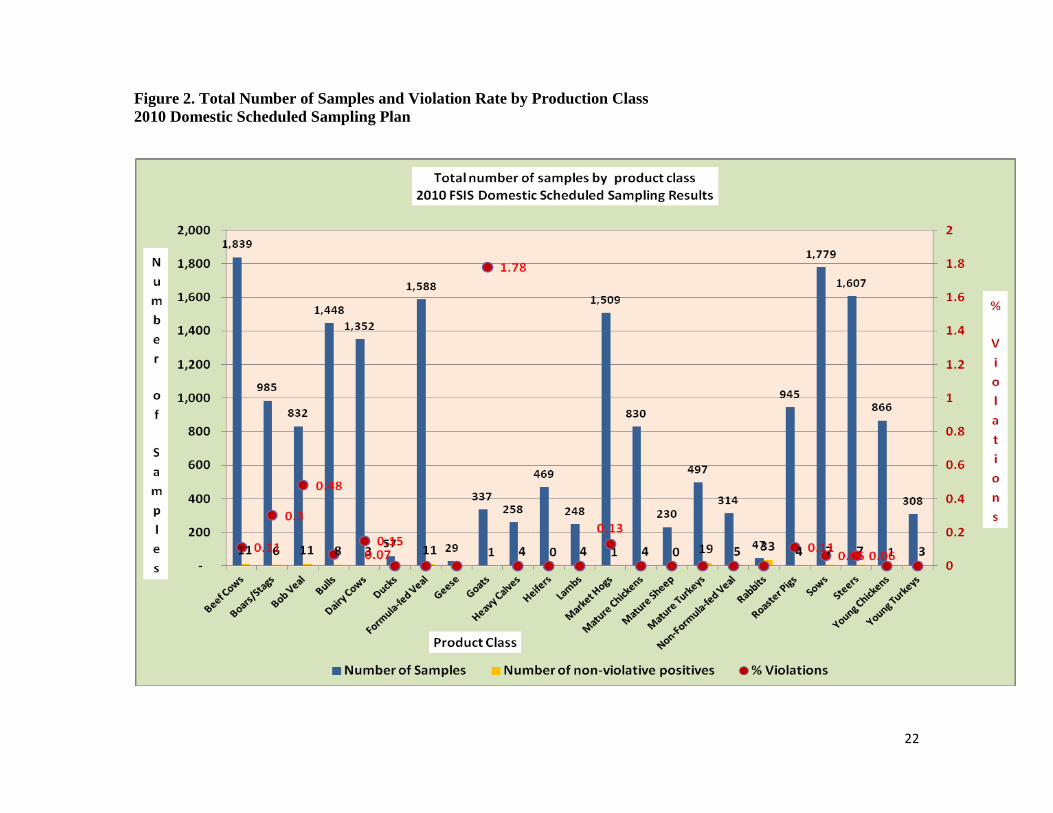
Figure 2. Total Number of Samples and Violation Rate by Production Class 2010 Domestic Scheduled Sampling Plan
23
Compound Class
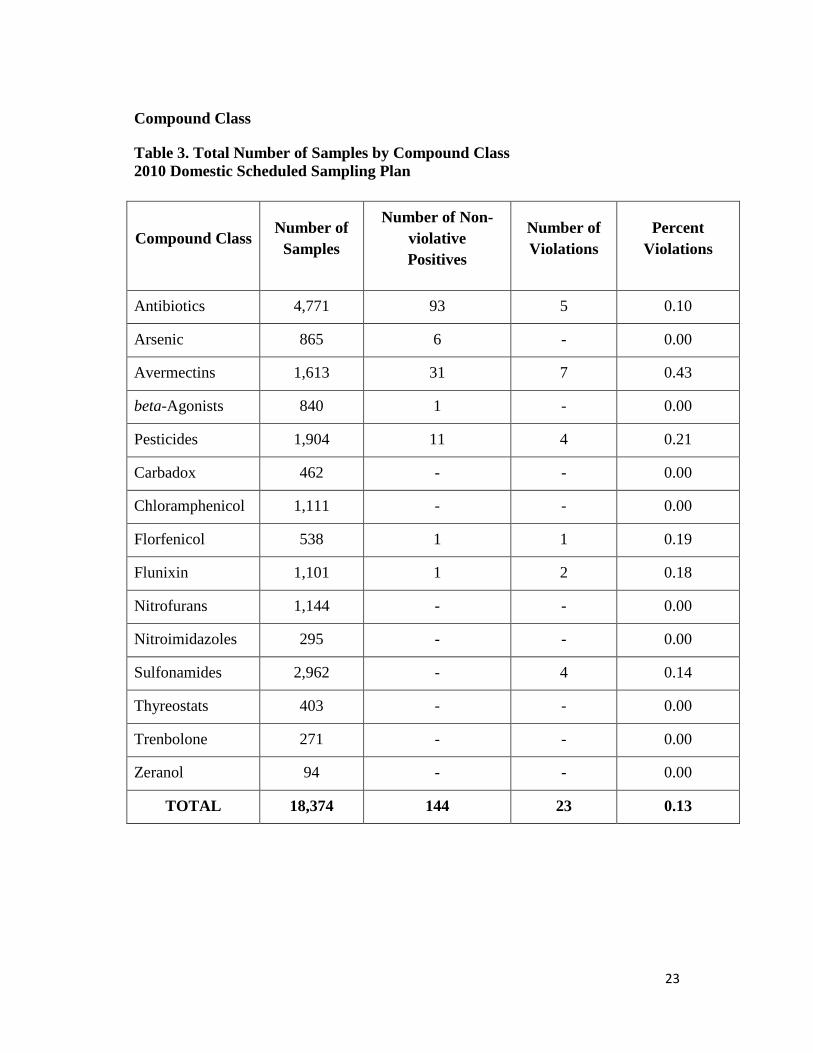
Table 3. Total Number of Samples by Compound Class 2010 Domestic Scheduled Sampling Plan
Compound Class Number of
Samples
Number of Non-violative Positives
Number of Violations
Percent Violations
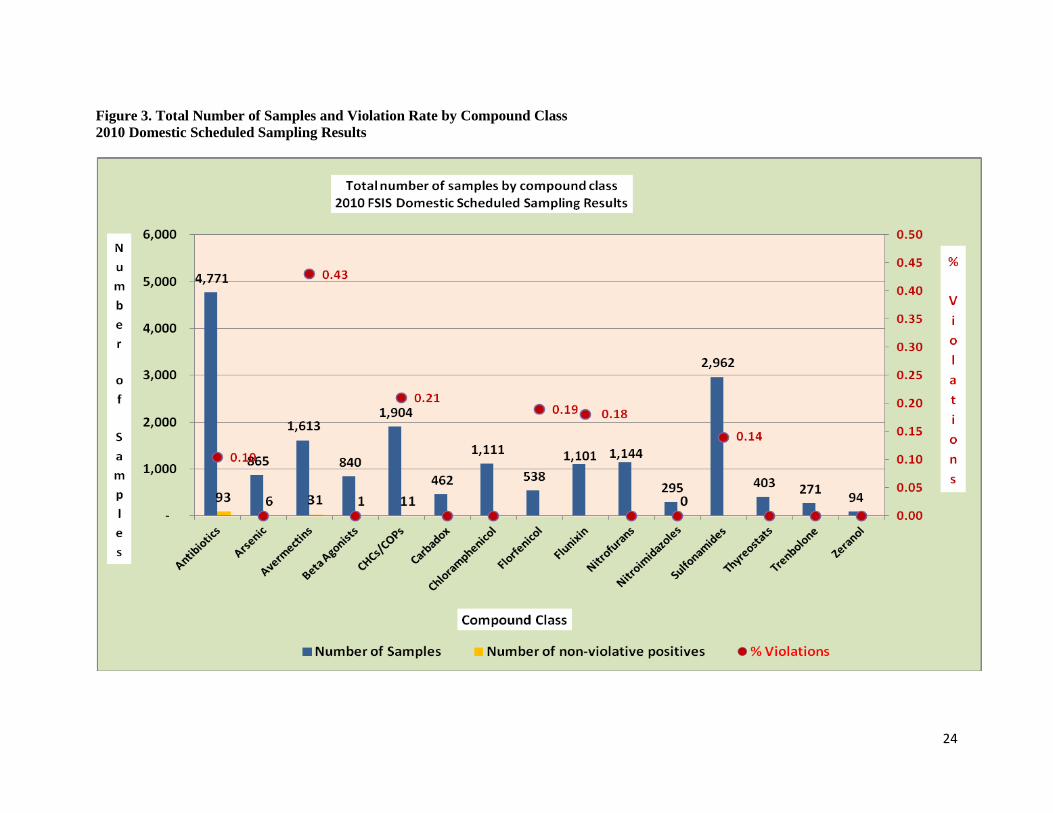
Antibiotics 4,771 93 5 0.10
Arsenic 865 6 - 0.00
Avermectins 1,613 31 7 0.43
beta-Agonists 840 1 - 0.00
Pesticides 1,904 11 4 0.21
Carbadox 462 - - 0.00
Chloramphenicol 1,111 - - 0.00
Florfenicol 538 1 1 0.19
Flunixin 1,101 1 2 0.18
Nitrofurans 1,144 - - 0.00
Nitroimidazoles 295 - - 0.00
Sulfonamides 2,962 - 4 0.14
Thyreostats 403 - - 0.00
Trenbolone 271 - - 0.00
Zeranol 94 - - 0.00
TOTAL 18,374 144 23 0.13
24
Figure 3. Total Number of Samples and Violation Rate by Compound Class 2010 Domestic Scheduled Sampling Results
25
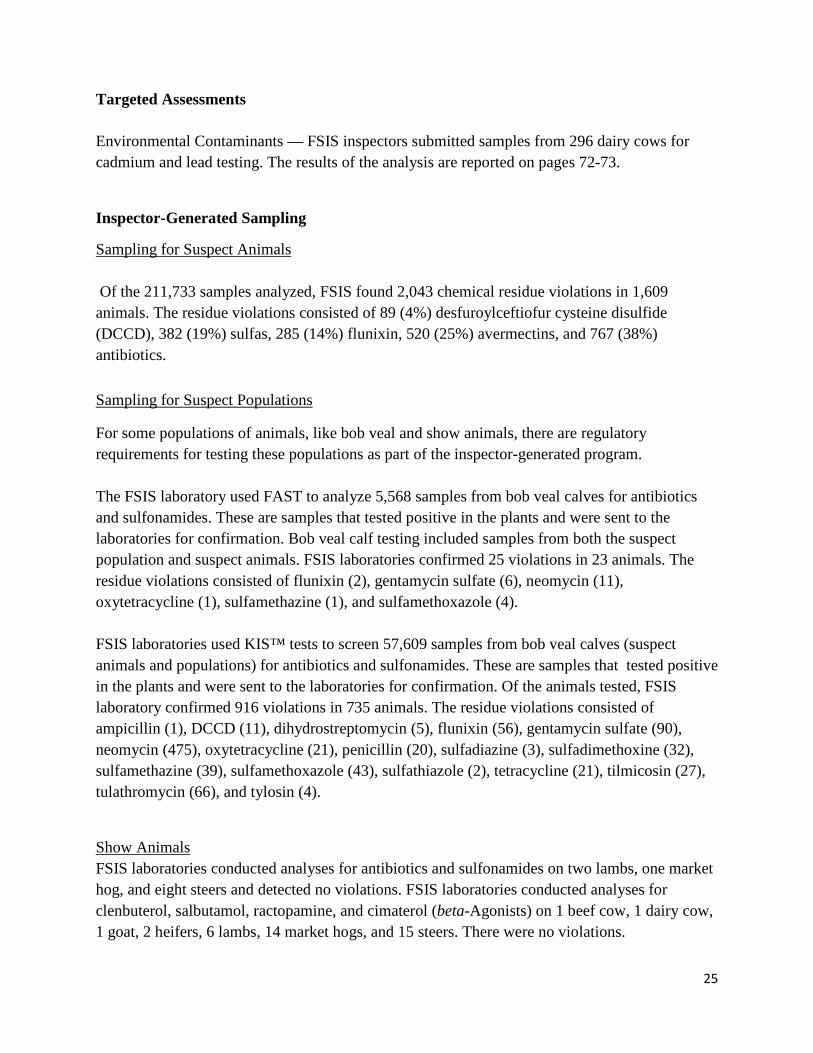
Targeted Assessments Environmental Contaminants — FSIS inspectors submitted samples from 296 dairy cows for cadmium and lead testing. The results of the analysis are reported on pages 72-73.
Inspector-Generated Sampling
Sampling for Suspect Animals Of the 211,733 samples analyzed, FSIS found 2,043 chemical residue violations in 1,609 animals. The residue violations consisted of 89 (4%) desfuroylceftiofur cysteine disulfide (DCCD), 382 (19%) sulfas, 285 (14%) flunixin, 520 (25%) avermectins, and 767 (38%) antibiotics.
Sampling for Suspect Populations
For some populations of animals, like bob veal and show animals, there are regulatory requirements for testing these populations as part of the inspector-generated program. The FSIS laboratory used FAST to analyze 5,568 samples from bob veal calves for antibiotics and sulfonamides. These are samples that tested positive in the plants and were sent to the laboratories for confirmation. Bob veal calf testing included samples from both the suspect population and suspect animals. FSIS laboratories confirmed 25 violations in 23 animals. The residue violations consisted of flunixin (2), gentamycin sulfate (6), neomycin (11), oxytetracycline (1), sulfamethazine (1), and sulfamethoxazole (4). FSIS laboratories used KIS™ tests to screen 57,609 samples from bob veal calves (suspect animals and populations) for antibiotics and sulfonamides. These are samples that tested positive in the plants and were sent to the laboratories for confirmation. Of the animals tested, FSIS laboratory confirmed 916 violations in 735 animals. The residue violations consisted of ampicillin (1), DCCD (11), dihydrostreptomycin (5), flunixin (56), gentamycin sulfate (90), neomycin (475), oxytetracycline (21), penicillin (20), sulfadiazine (3), sulfadimethoxine (32), sulfamethazine (39), sulfamethoxazole (43), sulfathiazole (2), tetracycline (21), tilmicosin (27), tulathromycin (66), and tylosin (4).
Show Animals FSIS laboratories conducted analyses for antibiotics and sulfonamides on two lambs, one market hog, and eight steers and detected no violations. FSIS laboratories conducted analyses for clenbuterol, salbutamol, ractopamine, and cimaterol (beta-Agonists) on 1 beef cow, 1 dairy cow, 1 goat, 2 heifers, 6 lambs, 14 market hogs, and 15 steers. There were no violations.
26
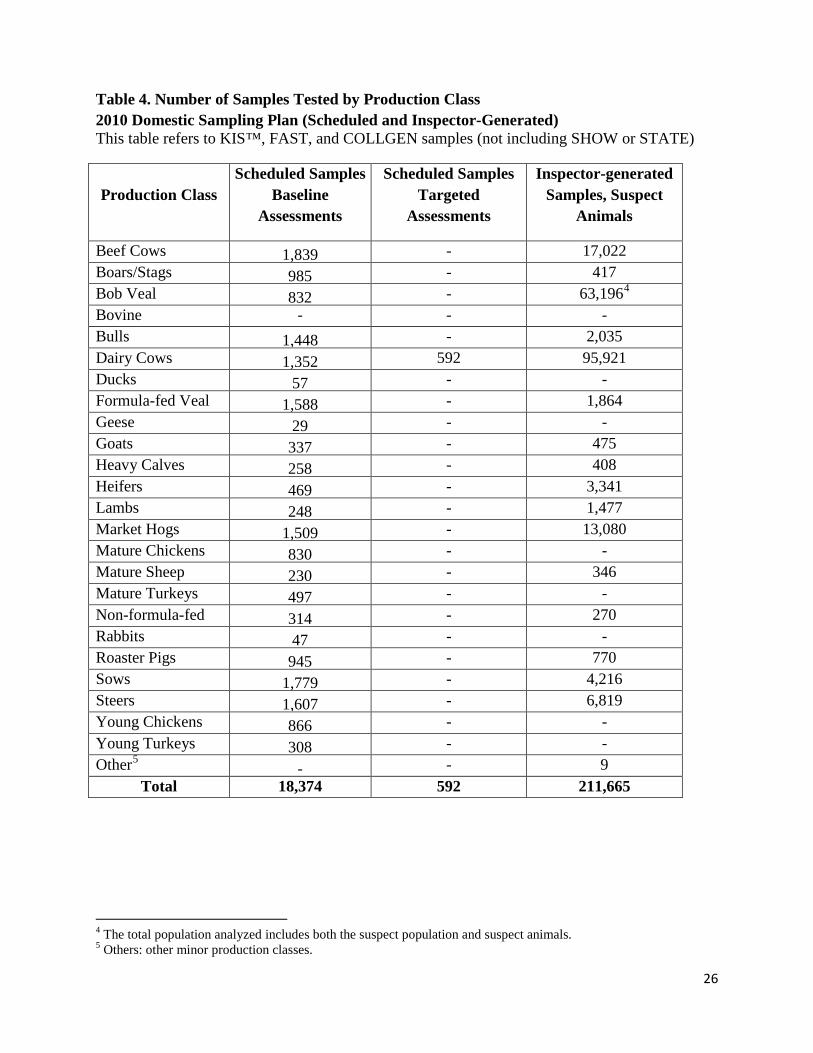
Table 4. Number of Samples Tested by Production Class 2010 Domestic Sampling Plan (Scheduled and Inspector-Generated) This table refers to KIS™, FAST, and COLLGEN samples (not including SHOW or STATE)
Production Class Scheduled Samples
Baseline Assessments
Scheduled Samples Targeted
Assessments
Inspector-generated Samples, Suspect
Animals
Beef Cows 1,839 - 17,022 Boars/Stags 985 - 417 Bob Veal 832 - 63,1964 Bovine - - - Bulls 1,448 - 2,035 Dairy Cows 1,352 592 95,921 Ducks 57 - - Formula-fed Veal 1,588 - 1,864 Geese 29 - - Goats 337 - 475 Heavy Calves 258 - 408 Heifers 469 - 3,341 Lambs 248 - 1,477 Market Hogs 1,509 - 13,080 Mature Chickens 830 - - Mature Sheep 230 - 346 Mature Turkeys 497 - - Non-formula-fed
314 - 270
Rabbits 47 - - Roaster Pigs 945 - 770 Sows 1,779 - 4,216 Steers 1,607 - 6,819 Young Chickens 866 - - Young Turkeys 308 - - Other5 - - 9
Total 18,374 592 211,665
4 The total population analyzed includes both the suspect population and suspect animals. 5 Others: other minor production classes.
27
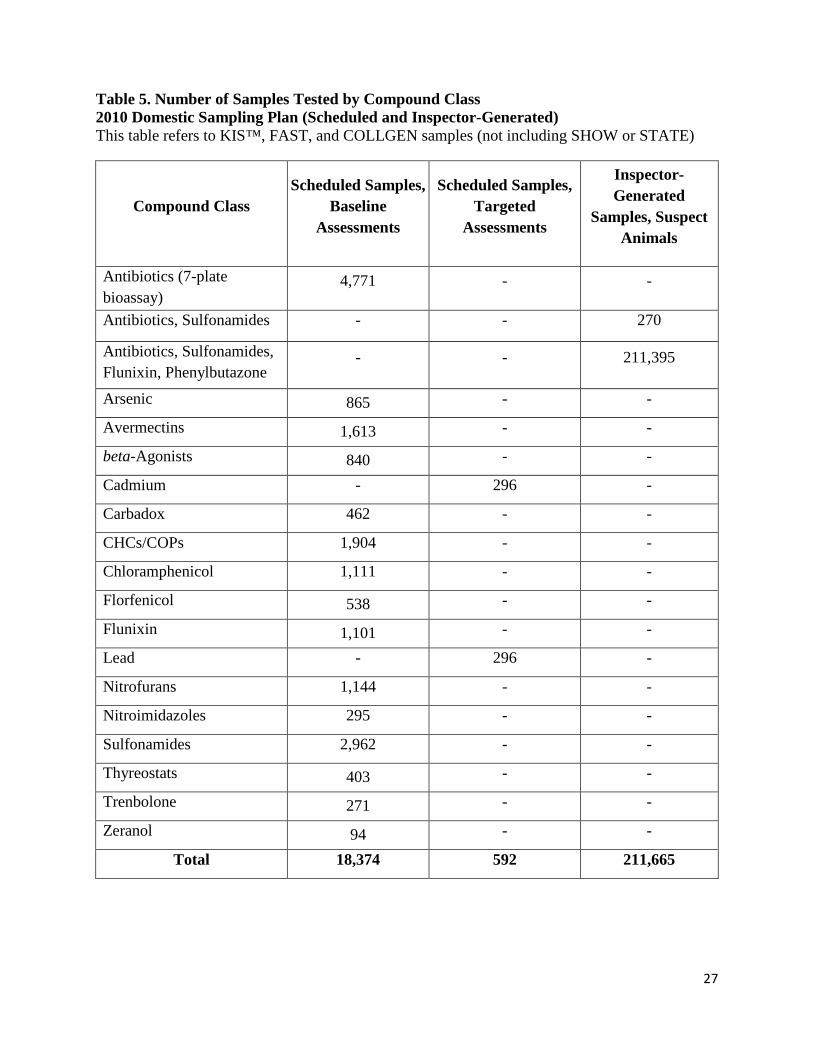
Table 5. Number of Samples Tested by Compound Class 2010 Domestic Sampling Plan (Scheduled and Inspector-Generated) This table refers to KIS™, FAST, and COLLGEN samples (not including SHOW or STATE)
Compound Class Scheduled Samples,
Baseline Assessments
Scheduled Samples, Targeted
Assessments
Inspector-Generated
Samples, Suspect Animals
Antibiotics (7-plate bioassay)
4,771 - -
Antibiotics, Sulfonamides - - 270
Antibiotics, Sulfonamides, Flunixin, Phenylbutazone
- - 211,395
Arsenic 865 - -
Avermectins 1,613 - -
beta-Agonists 840 - -
Cadmium - 296 -
Carbadox 462 - -
CHCs/COPs 1,904 - -
Chloramphenicol 1,111 - -
Florfenicol 538 - -
Flunixin 1,101 - -
Lead - 296 -
Nitrofurans 1,144 - -
Nitroimidazoles 295 - -
Sulfonamides 2,962 - -
Thyreostats 403 - -
Trenbolone 271 - -
Zeranol 94 - -
Total 18,374 592 211,665
28
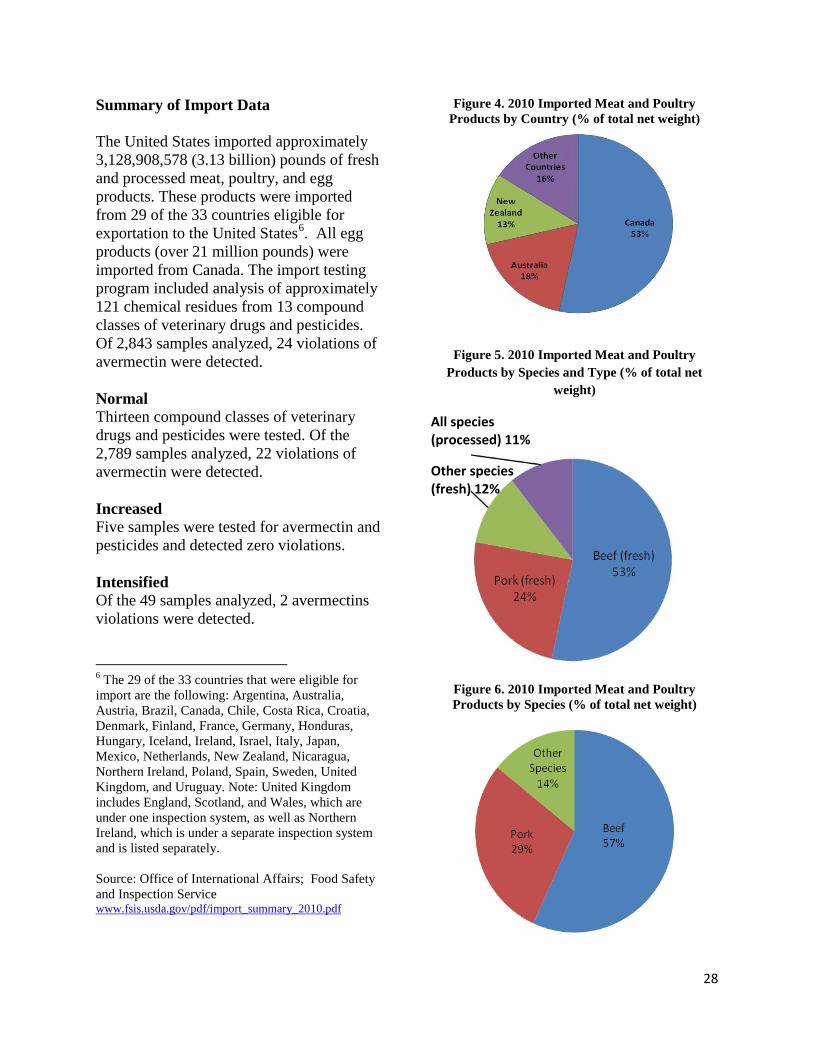
Summary of Import Data The United States imported approximately 3,128,908,578 (3.13 billion) pounds of fresh and processed meat, poultry, and egg products. These products were imported from 29 of the 33 countries eligible for exportation to the United States6. All egg products (over 21 million pounds) were imported from Canada. The import testing program included analysis of approximately 121 chemical residues from 13 compound classes of veterinary drugs and pesticides. Of 2,843 samples analyzed, 24 violations of avermectin were detected. Normal Thirteen compound classes of veterinary drugs and pesticides were tested. Of the 2,789 samples analyzed, 22 violations of avermectin were detected. Increased Five samples were tested for avermectin and pesticides and detected zero violations. Intensified Of the 49 samples analyzed, 2 avermectins violations were detected.
6 The 29 of the 33 countries that were eligible for import are the following: Argentina, Australia, Austria, Brazil, Canada, Chile, Costa Rica, Croatia, Denmark, Finland, France, Germany, Honduras, Hungary, Iceland, Ireland, Israel, Italy, Japan, Mexico, Netherlands, New Zealand, Nicaragua, Northern Ireland, Poland, Spain, Sweden, United Kingdom, and Uruguay. Note: United Kingdom includes England, Scotland, and Wales, which are under one inspection system, as well as Northern Ireland, which is under a separate inspection system and is listed separately. Source: Office of International Affairs; Food Safety and Inspection Service www.fsis.usda.gov/pdf/import_summary_2010.pdf
Figure 4. 2010 Imported Meat and Poultry Products by Country (% of total net weight)
Figure 5. 2010 Imported Meat and Poultry Products by Species and Type (% of total net
weight)
All species (processed) 11%
Other species (fresh) 12%
Figure 6. 2010 Imported Meat and Poultry Products by Species (% of total net weight)
29
DOMESTIC SAMPLING RESULTS: Compound Class Data
Tables 6–13 list summary and detailed results obtained from the FSIS Microbiological and Residue Computer Information System (MARCIS) and FSIS Data Warehouse (DW). Tables 6a–13a present domestic scheduled sampling results. The tables include the total number of animals tested (i.e., the number of composite samples in the case of poultry), the number of non-violative positives (i.e., compounds detected at a level equal to or below the established tolerance), the number of violations, and the percent of violations for each compound class. Because multiple compounds can be analyzed on the same sample, one sample (i.e., one animal or a composite from one poultry flock) could have more than one violation. A series of bar charts illustrate these data. Tables 6b–13b summarize violation results by compound class, such as production class, chemical residue, tissue type, and residue detected (ppb or ppm). These tables are contingent on violations being detected. The additional columns indicate instances when residues were detected, but were not quantitated violative (code: 8888) or non-violative (code: 9999). Table 14 lists the distribution of non-violative positive samples by chemical residue and product class. This corresponds to samples with residue present; however, this concentration is below the tolerance levels.
30
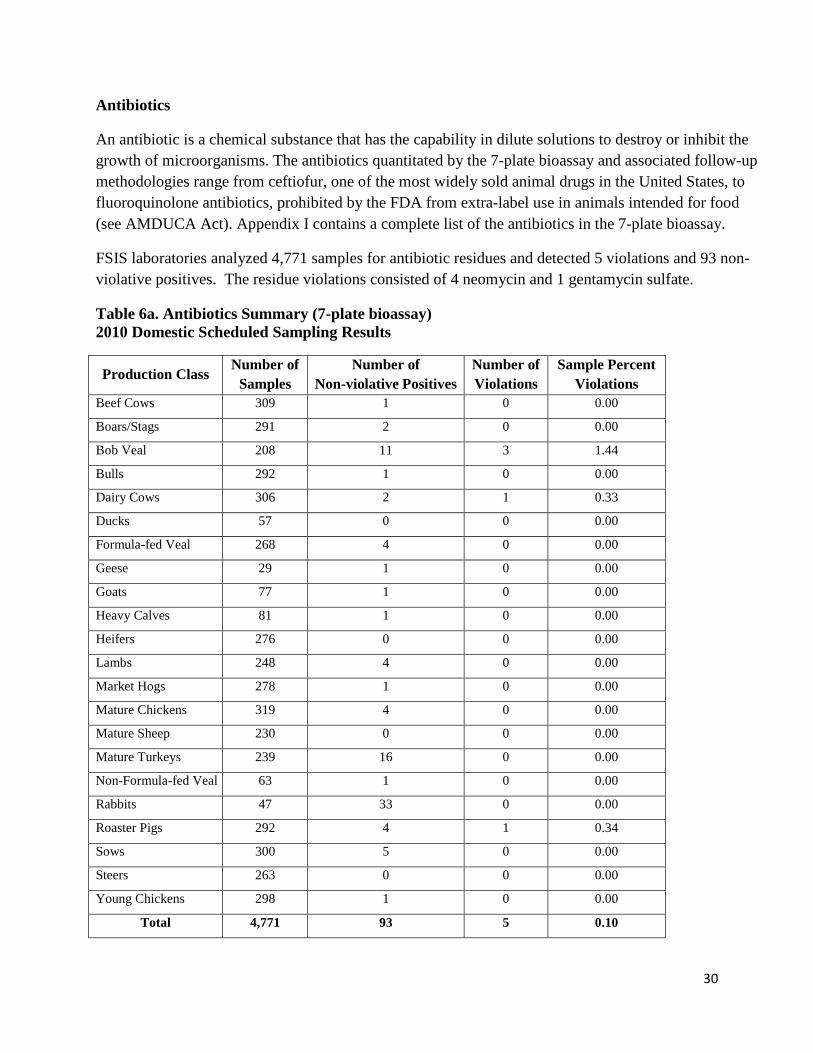
Antibiotics
An antibiotic is a chemical substance that has the capability in dilute solutions to destroy or inhibit the growth of microorganisms. The antibiotics quantitated by the 7-plate bioassay and associated follow-up methodologies range from ceftiofur, one of the most widely sold animal drugs in the United States, to fluoroquinolone antibiotics, prohibited by the FDA from extra-label use in animals intended for food (see AMDUCA Act). Appendix I contains a complete list of the antibiotics in the 7-plate bioassay.
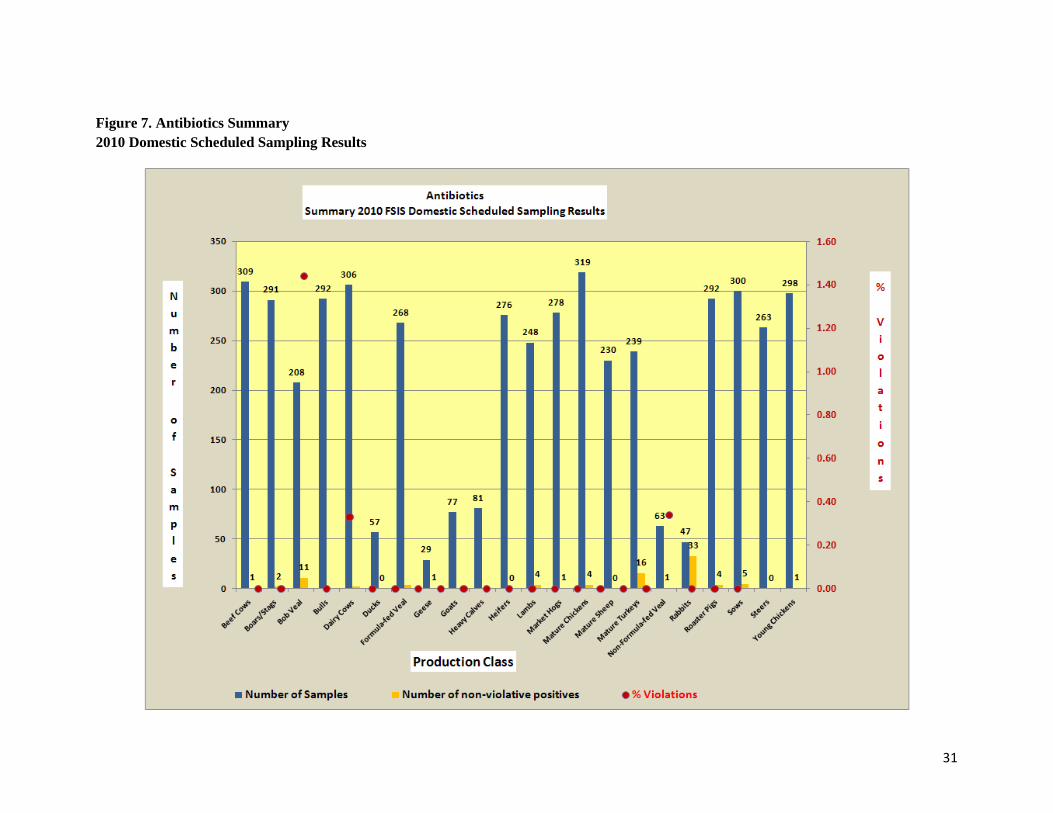
FSIS laboratories analyzed 4,771 samples for antibiotic residues and detected 5 violations and 93 non-violative positives. The residue violations consisted of 4 neomycin and 1 gentamycin sulfate.
Table 6a. Antibiotics Summary (7-plate bioassay) 2010 Domestic Scheduled Sampling Results
Production Class Number of
Samples Number of
Non-violative Positives Number of Violations
Sample Percent Violations
Beef Cows 309 1 0 0.00
Boars/Stags 291 2 0 0.00
Bob Veal 208 11 3 1.44
Bulls 292 1 0 0.00
Dairy Cows 306 2 1 0.33
Ducks 57 0 0 0.00
Formula-fed Veal 268 4 0 0.00
Geese 29 1 0 0.00
Goats 77 1 0 0.00
Heavy Calves 81 1 0 0.00
Heifers 276 0 0 0.00
Lambs 248 4 0 0.00
Market Hogs 278 1 0 0.00
Mature Chickens 319 4 0 0.00
Mature Sheep 230 0 0 0.00
Mature Turkeys 239 16 0 0.00
Non-Formula-fed Veal 63 1 0 0.00
Rabbits 47 33 0 0.00
Roaster Pigs 292 4 1 0.34
Sows 300 5 0 0.00
Steers 263 0 0 0.00
Young Chickens 298 1 0 0.00
Total 4,771 93 5 0.10
31
Figure 7. Antibiotics Summary 2010 Domestic Scheduled Sampling Results
32
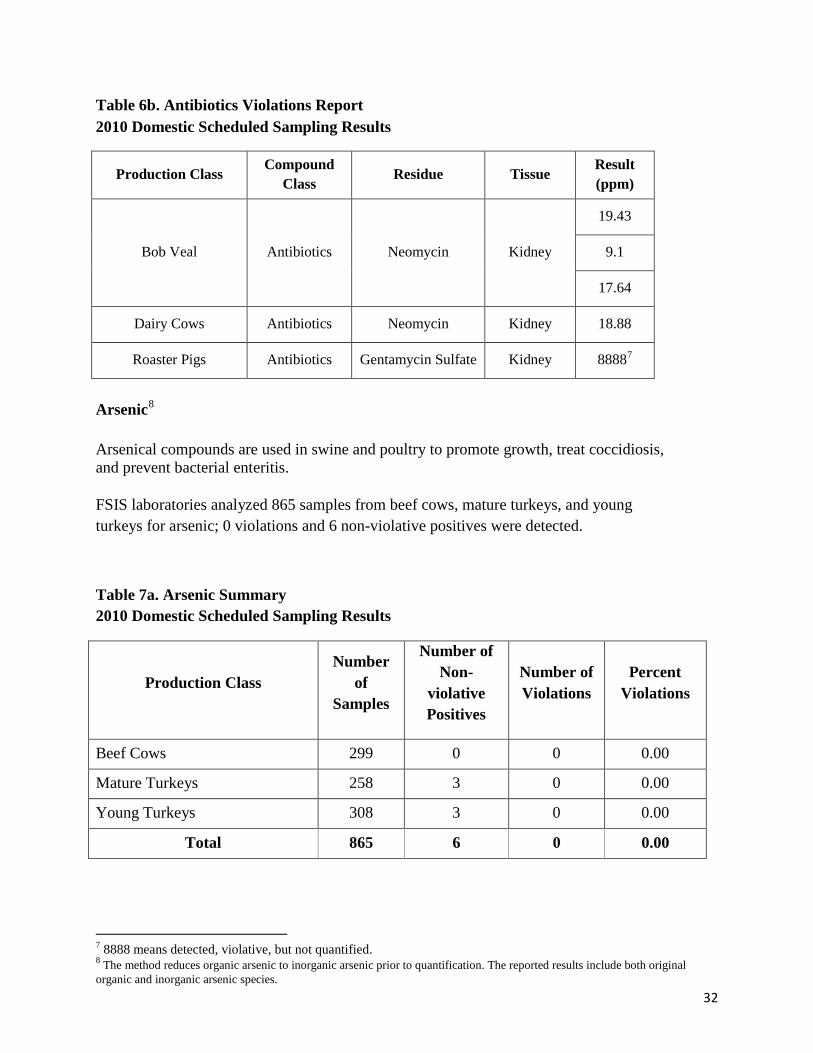
Table 6b. Antibiotics Violations Report 2010 Domestic Scheduled Sampling Results
Arsenic8
Arsenical compounds are used in swine and poultry to promote growth, treat coccidiosis, and prevent bacterial enteritis.
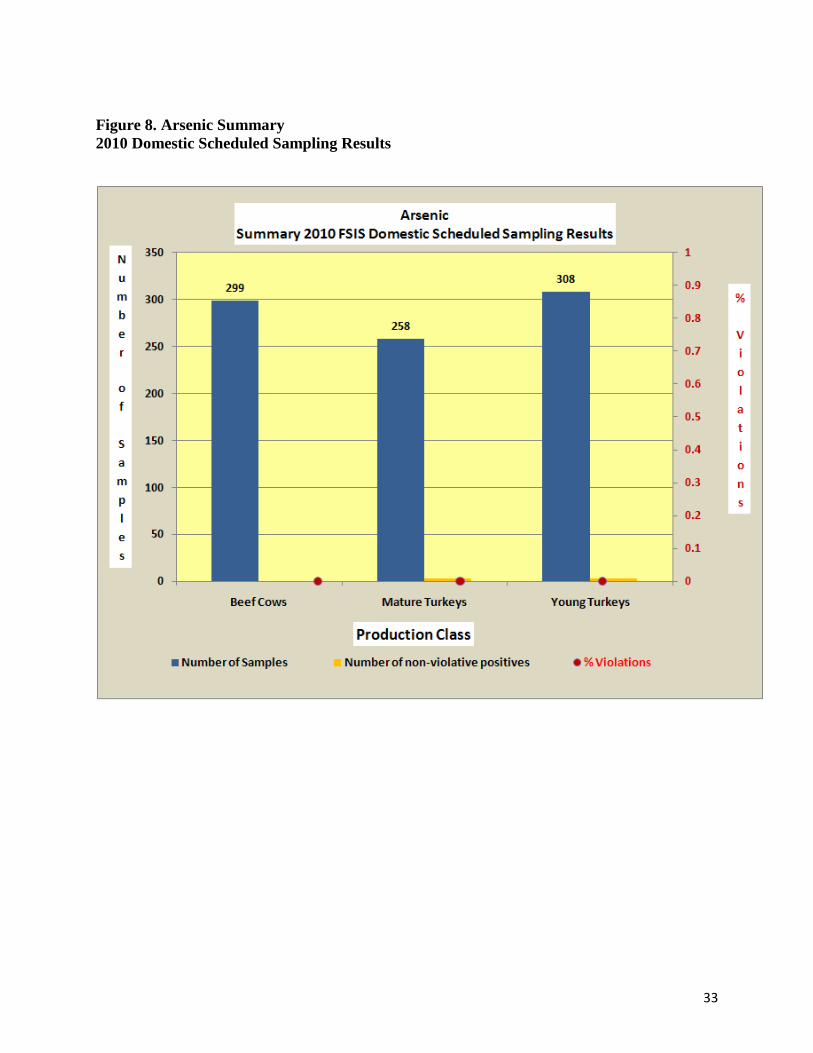
FSIS laboratories analyzed 865 samples from beef cows, mature turkeys, and young turkeys for arsenic; 0 violations and 6 non-violative positives were detected.
Table 7a. Arsenic Summary 2010 Domestic Scheduled Sampling Results
Production Class Number
of Samples
Number of Non-
violative Positives
Number of Violations
Percent Violations
Beef Cows 299 0 0 0.00
Mature Turkeys 258 3 0 0.00
Young Turkeys 308 3 0 0.00
Total 865 6 0 0.00
7 8888 means detected, violative, but not quantified. 8 The method reduces organic arsenic to inorganic arsenic prior to quantification. The reported results include both original organic and inorganic arsenic species.
Production Class Compound Class Residue Tissue Result
(ppm)
Bob Veal Antibiotics Neomycin Kidney
19.43
9.1
17.64
Dairy Cows Antibiotics Neomycin Kidney 18.88
Roaster Pigs Antibiotics Gentamycin Sulfate Kidney 88887
33
Figure 8. Arsenic Summary 2010 Domestic Scheduled Sampling Results

34
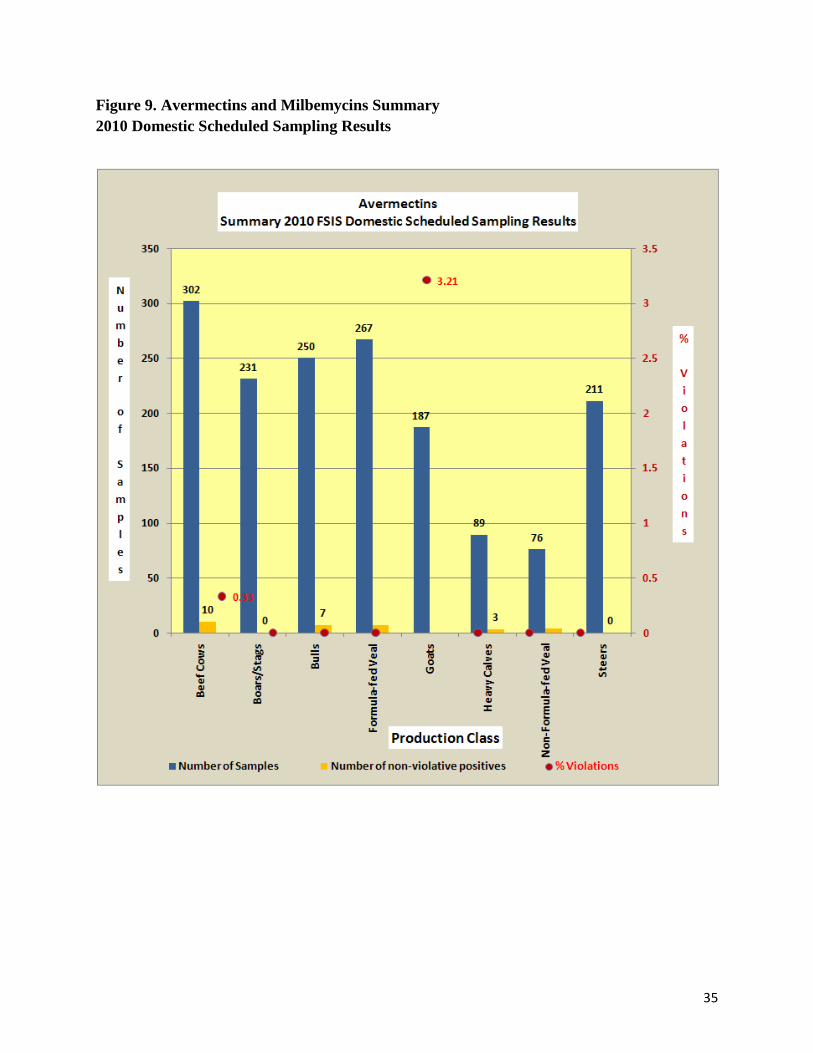
Avermectins (Ivermectin and Doramectin) and Milbemycins (Moxidectin)
Avermectins (ivermectin and doramectin) and milbemycins (moxidectin) are macrocyclic lactones used in animal husbandry practices to prevent nematode and arthropod parasites. Ivermectin is an effective parasiticide. Doramectin is a potent endectocide that combines broad-spectrum activity with a prolonged duration of activity against the major internal and external parasites of cattle. Moxidectin is an antiparasitic drug that controls a range of internal and external parasites in sheep and cattle.
FSIS laboratories analyzed 1,613 samples for avermectin and milbemycin residues: 5 moxidectin, 1 doramectin, and 1 ivermectin violations were detected.
Table 8a. Avermectins and Milbemycins Summary 2010 Domestic Scheduled Sampling Results
Production Class Number of Samples
Number of Non-violative
Positives
Number of Violations
Percent Violations
Beef Cows 302 10 1 0.33
Boars/Stags 231 0 0 0.00
Bulls 250 7 0 0.00
Formula-fed Veal 267 7 0 0.00
Goats 187 0 6 3.21
Heavy Calves 89 3 0 0.00
Non-Formula-fed Veal 76 4 0 0.00
Steers 211 0 0 0.00
Total 1,613 31 7 0.43
Table 8b. Avermectins Violations Report 2010 Domestic Scheduled Sampling Results Production Class Compound Class Residue Tissue Result (ppb)
Goats Avermectins Moxidectin Liver 45.6
55.5
38.3
111.5
213
Goats Avermectins Ivermectin Liver 117.5
Beef Cows Avermectins Doramectin Liver 158
35
Figure 9. Avermectins and Milbemycins Summary 2010 Domestic Scheduled Sampling Results
36
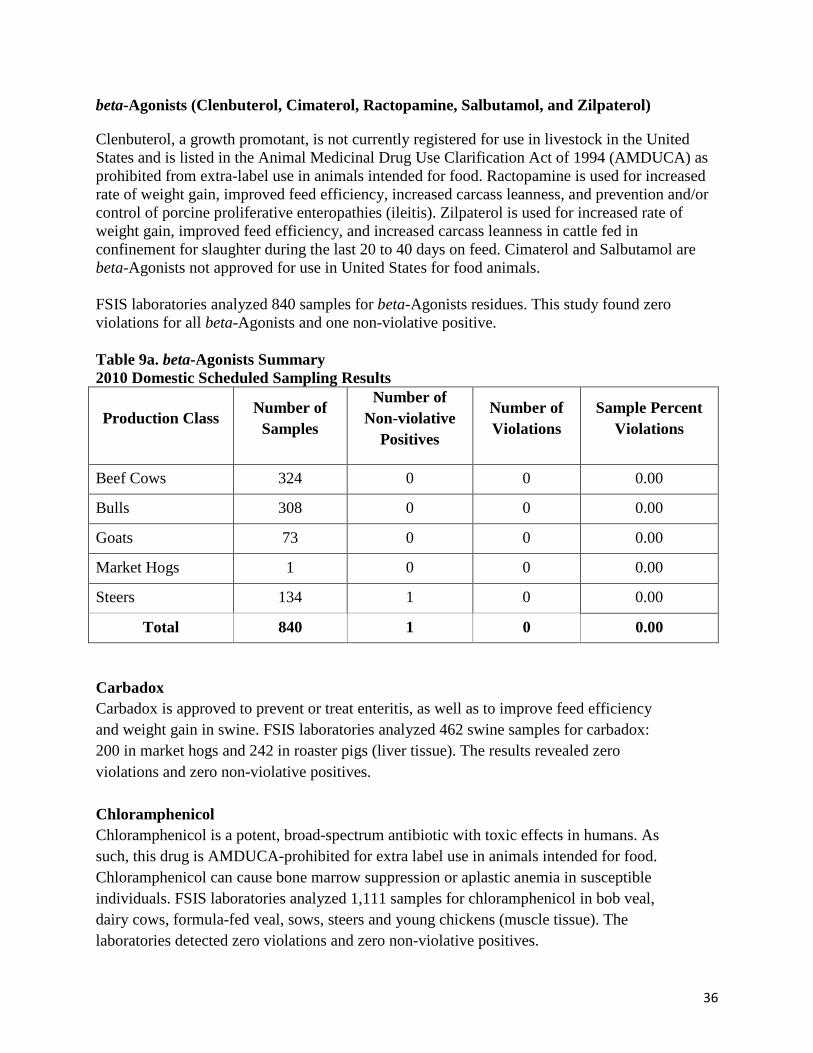
beta-Agonists (Clenbuterol, Cimaterol, Ractopamine, Salbutamol, and Zilpaterol)
Clenbuterol, a growth promotant, is not currently registered for use in livestock in the United States and is listed in the Animal Medicinal Drug Use Clarification Act of 1994 (AMDUCA) as prohibited from extra-label use in animals intended for food. Ractopamine is used for increased rate of weight gain, improved feed efficiency, increased carcass leanness, and prevention and/or control of porcine proliferative enteropathies (ileitis). Zilpaterol is used for increased rate of weight gain, improved feed efficiency, and increased carcass leanness in cattle fed in confinement for slaughter during the last 20 to 40 days on feed. Cimaterol and Salbutamol are beta-Agonists not approved for use in United States for food animals. FSIS laboratories analyzed 840 samples for beta-Agonists residues. This study found zero violations for all beta-Agonists and one non-violative positive. Table 9a. beta-Agonists Summary 2010 Domestic Scheduled Sampling Results
Production Class Number of Samples
Number of Non-violative
Positives
Number of Violations
Sample Percent Violations
Beef Cows 324 0 0 0.00
Bulls 308 0 0 0.00
Goats 73 0 0 0.00
Market Hogs 1 0 0 0.00
Steers 134 1 0 0.00
Total 840 1 0 0.00 Carbadox Carbadox is approved to prevent or treat enteritis, as well as to improve feed efficiency and weight gain in swine. FSIS laboratories analyzed 462 swine samples for carbadox: 200 in market hogs and 242 in roaster pigs (liver tissue). The results revealed zero violations and zero non-violative positives. Chloramphenicol Chloramphenicol is a potent, broad-spectrum antibiotic with toxic effects in humans. As such, this drug is AMDUCA-prohibited for extra label use in animals intended for food. Chloramphenicol can cause bone marrow suppression or aplastic anemia in susceptible individuals. FSIS laboratories analyzed 1,111 samples for chloramphenicol in bob veal, dairy cows, formula-fed veal, sows, steers and young chickens (muscle tissue). The laboratories detected zero violations and zero non-violative positives.
37
Chlorinated Hydrocarbons and Chlorinated Organophosphates
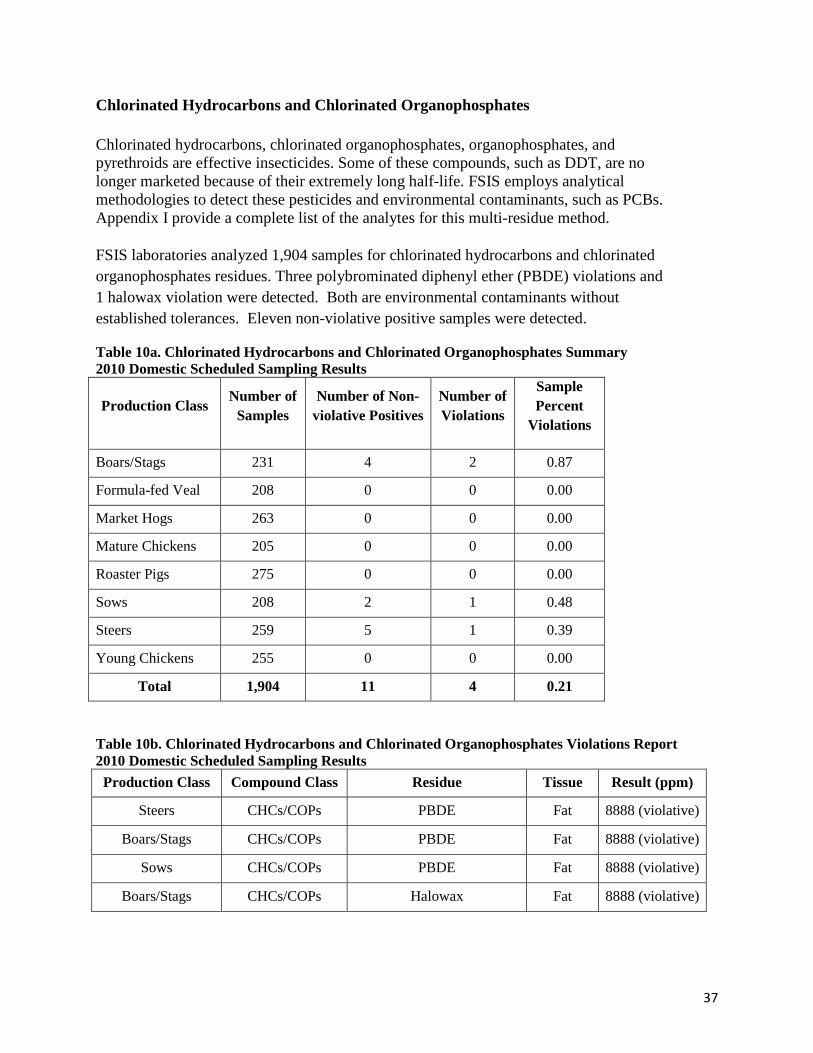
Chlorinated hydrocarbons, chlorinated organophosphates, organophosphates, and pyrethroids are effective insecticides. Some of these compounds, such as DDT, are no longer marketed because of their extremely long half-life. FSIS employs analytical methodologies to detect these pesticides and environmental contaminants, such as PCBs. Appendix I provide a complete list of the analytes for this multi-residue method.
FSIS laboratories analyzed 1,904 samples for chlorinated hydrocarbons and chlorinated organophosphates residues. Three polybrominated diphenyl ether (PBDE) violations and 1 halowax violation were detected. Both are environmental contaminants without established tolerances. Eleven non-violative positive samples were detected.
Table 10a. Chlorinated Hydrocarbons and Chlorinated Organophosphates Summary 2010 Domestic Scheduled Sampling Results
Production Class Number of Samples
Number of Non-violative Positives
Number of Violations
Sample Percent
Violations
Boars/Stags 231 4 2 0.87
Formula-fed Veal 208 0 0 0.00
Market Hogs 263 0 0 0.00
Mature Chickens 205 0 0 0.00
Roaster Pigs 275 0 0 0.00
Sows 208 2 1 0.48
Steers 259 5 1 0.39
Young Chickens 255 0 0 0.00
Total 1,904 11 4 0.21 Table 10b. Chlorinated Hydrocarbons and Chlorinated Organophosphates Violations Report 2010 Domestic Scheduled Sampling Results
Production Class Compound Class Residue Tissue Result (ppm)
Steers CHCs/COPs PBDE Fat 8888 (violative)
Boars/Stags CHCs/COPs PBDE Fat 8888 (violative)
Sows CHCs/COPs PBDE Fat 8888 (violative)
Boars/Stags CHCs/COPs Halowax Fat 8888 (violative)
38
Figure 10. Chlorinated Hydrocarbons and Chlorinated Organophosphates Summary 2010 Domestic Scheduled Sampling Results
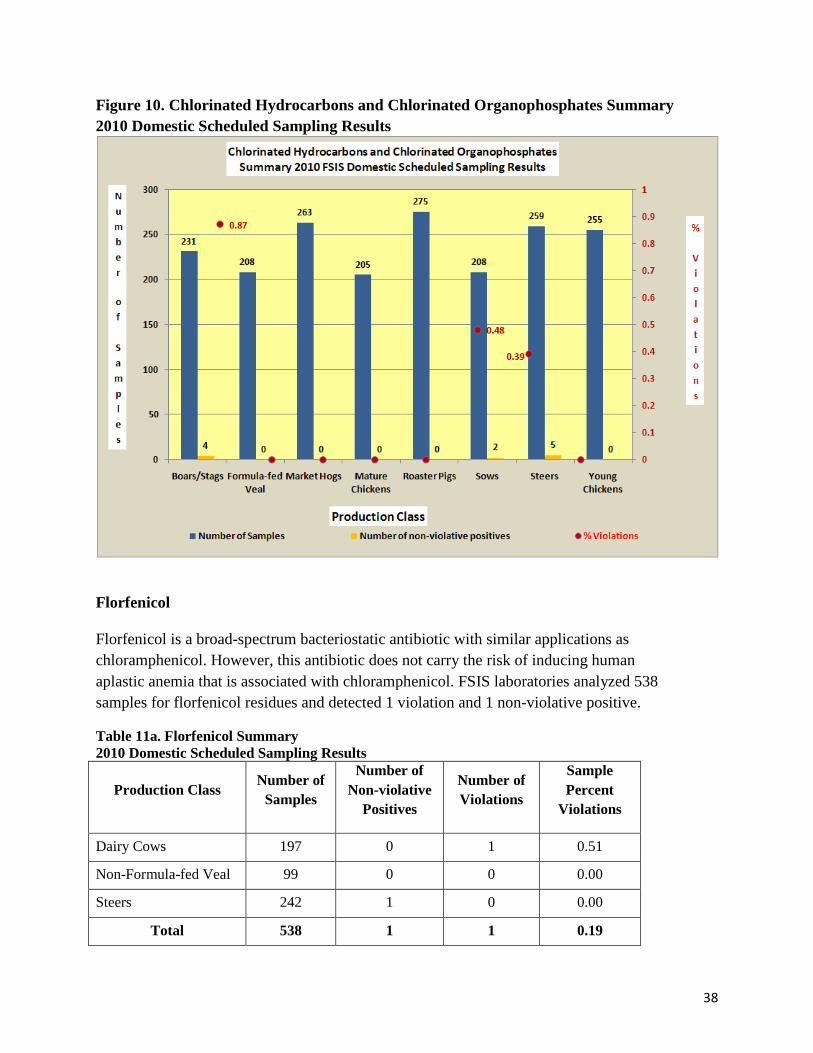
Florfenicol Florfenicol is a broad-spectrum bacteriostatic antibiotic with similar applications as chloramphenicol. However, this antibiotic does not carry the risk of inducing human aplastic anemia that is associated with chloramphenicol. FSIS laboratories analyzed 538 samples for florfenicol residues and detected 1 violation and 1 non-violative positive.
Table 11a. Florfenicol Summary 2010 Domestic Scheduled Sampling Results
Production Class Number of Samples
Number of Non-violative
Positives
Number of Violations
Sample Percent
Violations
Dairy Cows 197 0 1 0.51
Non-Formula-fed Veal 99 0 0 0.00
Steers 242 1 0 0.00
Total 538 1 1 0.19
39
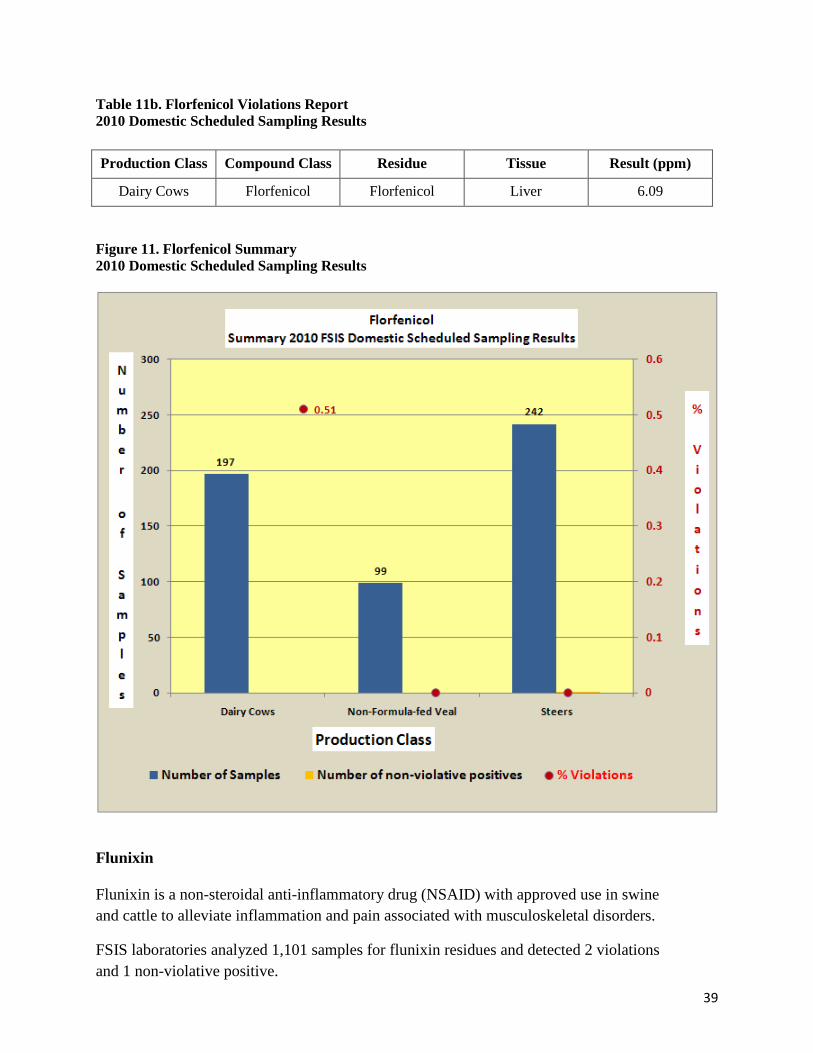
Table 11b. Florfenicol Violations Report 2010 Domestic Scheduled Sampling Results
Production Class Compound Class Residue Tissue Result (ppm)
Dairy Cows Florfenicol Florfenicol Liver 6.09
Figure 11. Florfenicol Summary 2010 Domestic Scheduled Sampling Results
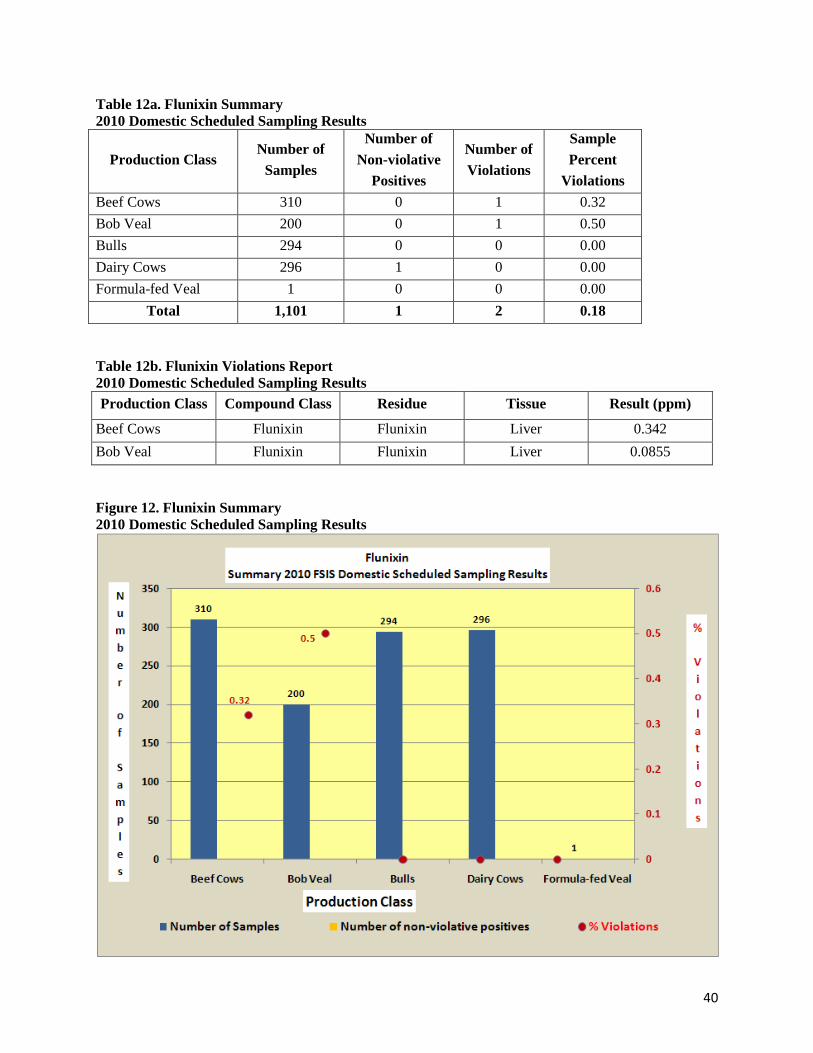
Flunixin Flunixin is a non-steroidal anti-inflammatory drug (NSAID) with approved use in swine and cattle to alleviate inflammation and pain associated with musculoskeletal disorders.
FSIS laboratories analyzed 1,101 samples for flunixin residues and detected 2 violations and 1 non-violative positive.
40
Table 12a. Flunixin Summary 2010 Domestic Scheduled Sampling Results
Production Class Number of
Samples
Number of Non-violative
Positives
Number of Violations
Sample Percent
Violations Beef Cows 310 0 1 0.32 Bob Veal 200 0 1 0.50 Bulls 294 0 0 0.00 Dairy Cows 296 1 0 0.00 Formula-fed Veal 1 0 0 0.00
Total 1,101 1 2 0.18 Table 12b. Flunixin Violations Report 2010 Domestic Scheduled Sampling Results Production Class Compound Class Residue Tissue Result (ppm)
Beef Cows Flunixin Flunixin Liver 0.342 Bob Veal Flunixin Flunixin Liver 0.0855 Figure 12. Flunixin Summary 2010 Domestic Scheduled Sampling Results
41
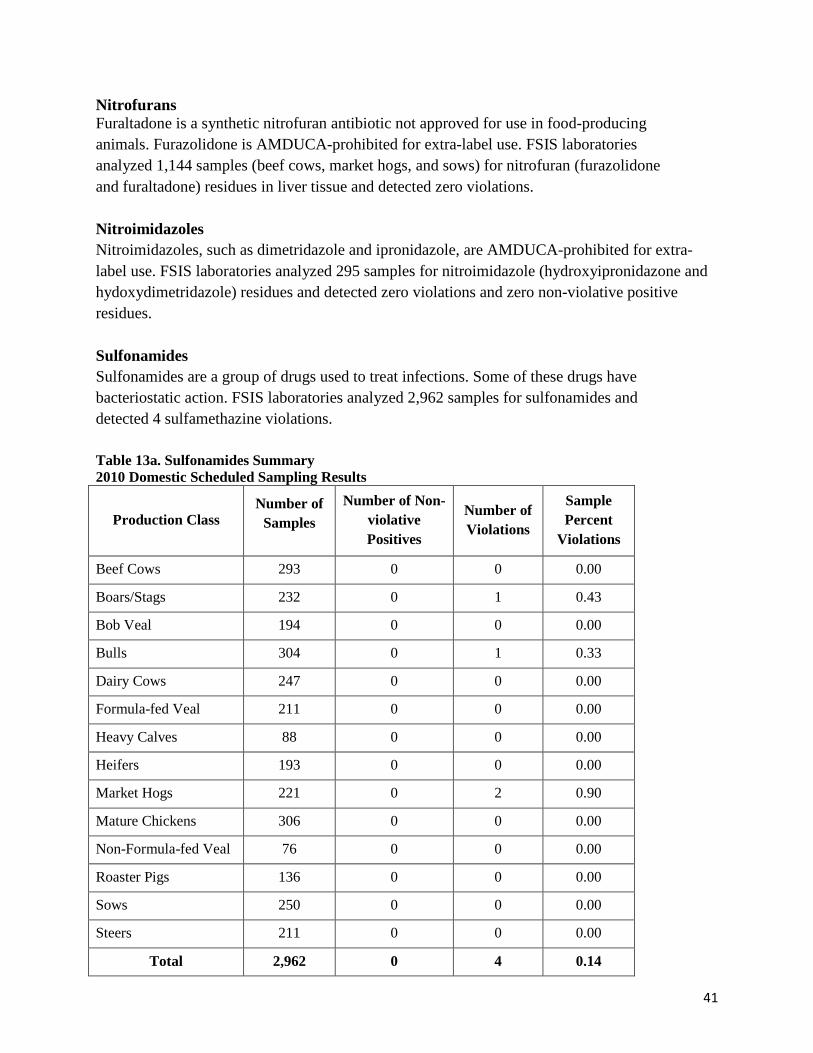
Nitrofurans Furaltadone is a synthetic nitrofuran antibiotic not approved for use in food-producing animals. Furazolidone is AMDUCA-prohibited for extra-label use. FSIS laboratories analyzed 1,144 samples (beef cows, market hogs, and sows) for nitrofuran (furazolidone and furaltadone) residues in liver tissue and detected zero violations. Nitroimidazoles Nitroimidazoles, such as dimetridazole and ipronidazole, are AMDUCA-prohibited for extra-label use. FSIS laboratories analyzed 295 samples for nitroimidazole (hydroxyipronidazone and hydoxydimetridazole) residues and detected zero violations and zero non-violative positive residues. Sulfonamides Sulfonamides are a group of drugs used to treat infections. Some of these drugs have bacteriostatic action. FSIS laboratories analyzed 2,962 samples for sulfonamides and detected 4 sulfamethazine violations. Table 13a. Sulfonamides Summary 2010 Domestic Scheduled Sampling Results
Production Class Number of
Samples Number of Non-
violative Positives
Number of Violations
Sample Percent
Violations
Beef Cows 293 0 0 0.00
Boars/Stags 232 0 1 0.43
Bob Veal 194 0 0 0.00
Bulls 304 0 1 0.33
Dairy Cows 247 0 0 0.00
Formula-fed Veal 211 0 0 0.00
Heavy Calves 88 0 0 0.00
Heifers 193 0 0 0.00
Market Hogs 221 0 2 0.90
Mature Chickens 306 0 0 0.00
Non-Formula-fed Veal 76 0 0 0.00
Roaster Pigs 136 0 0 0.00
Sows 250 0 0 0.00
Steers 211 0 0 0.00
Total 2,962 0 4 0.14
42
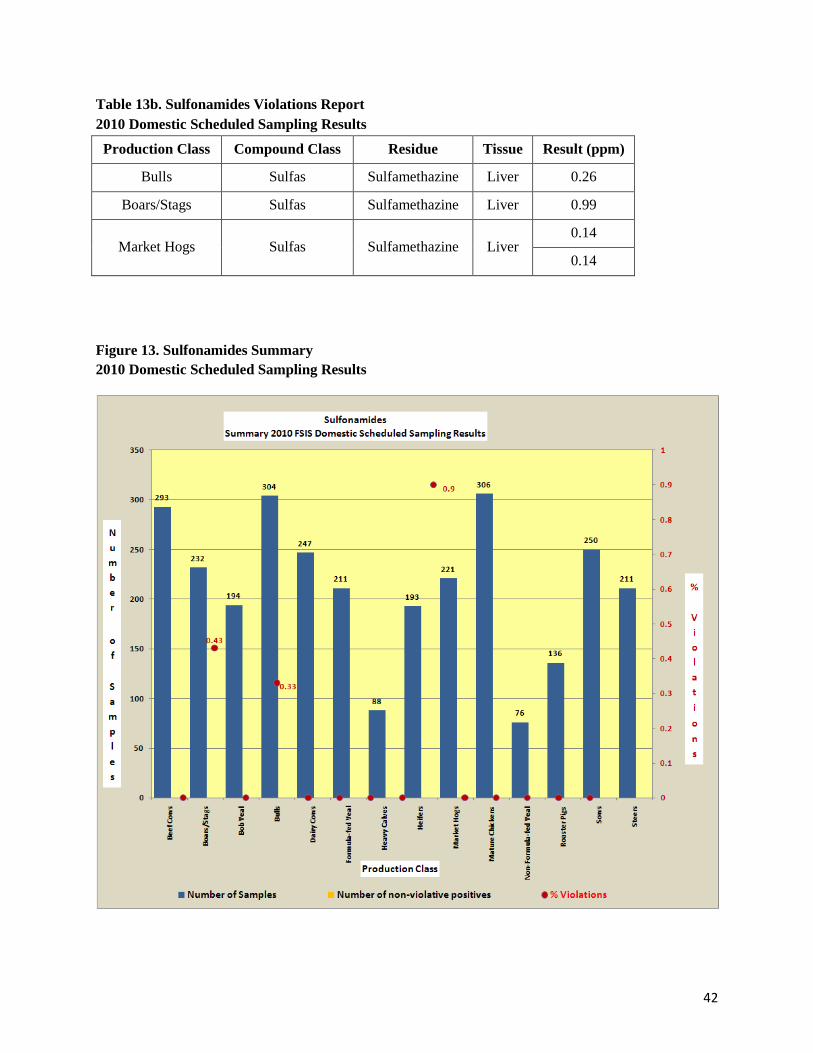
Table 13b. Sulfonamides Violations Report 2010 Domestic Scheduled Sampling Results
Production Class Compound Class Residue Tissue Result (ppm)
Bulls Sulfas Sulfamethazine Liver 0.26
Boars/Stags Sulfas Sulfamethazine Liver 0.99
Market Hogs Sulfas Sulfamethazine Liver 0.14
0.14
Figure 13. Sulfonamides Summary 2010 Domestic Scheduled Sampling Results
43
Thyreostats
Thyreostats are thyroid-inhibiting compounds that facilitate weight increase. FSIS laboratories analyzed samples from 403 sows and detected zero violations and zero non-violative positives results in muscle tissue. Trenbolone Trenbolone is a xenobiotic anabolic steroid based on the principal male hormone testosterone. This steroid has approved use in cattle, but not for use in pre-ruminant cattle.
FSIS laboratories analyzed 271 samples for trenbolone in formula-fed veal and detected zero violations and zero non-violative positives in liver tissue.
Zeranol
Zeranol is a xenobiotic, estrogenic agent used primarily in veterinary medicine as a growth stimulant. It has approved use in cattle and sheep, but not in pre-ruminant cattle.
FSIS laboratories analyzed 94 samples for zeranol residues in formula-fed veal and detected zero violations and zero non-violative positives in liver tissue.
44
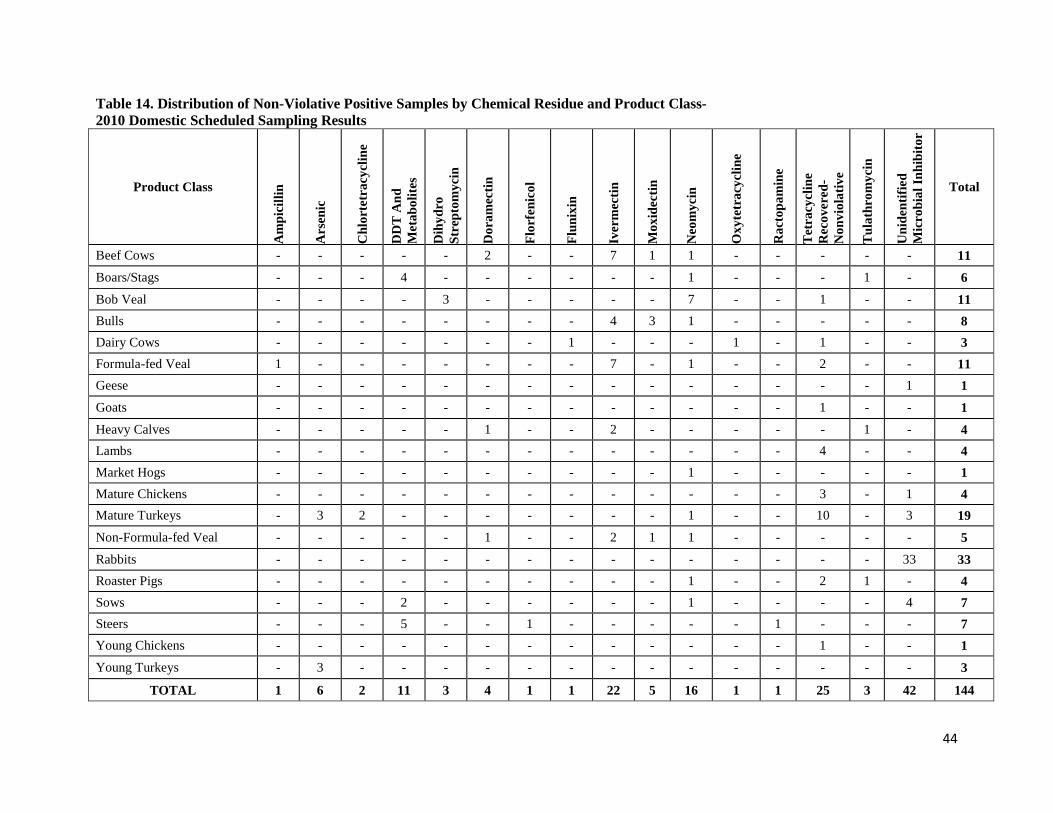
Table 14. Distribution of Non-Violative Positive Samples by Chemical Residue and Product Class- 2010 Domestic Scheduled Sampling Results
Product Class
Am
pici
llin
Ars
enic
Chl
orte
trac
yclin
e
DD
T A
nd
Met
abol
ites
Dih
ydro
St
rept
omyc
in
Dor
amec
tin
Flor
feni
col
Flun
ixin
Iver
mec
tin
Mox
idec
tin
Neo
myc
in
Oxy
tetr
acyc
line
Rac
topa
min
e
Tetr
acyc
line
Rec
over
ed-
Non
viol
ativ
e
Tula
thro
myc
in
Uni
dent
ified
M
icro
bial
Inhi
bito
r
Total
Beef Cows - - - - - 2 - - 7 1 1 - - - - - 11 Boars/Stags - - - 4 - - - - - - 1 - - - 1 - 6 Bob Veal - - - - 3 - - - - - 7 - - 1 - - 11 Bulls - - - - - - - - 4 3 1 - - - - - 8 Dairy Cows - - - - - - - 1 - - - 1 - 1 - - 3 Formula-fed Veal 1 - - - - - - - 7 - 1 - - 2 - - 11 Geese - - - - - - - - - - - - - - - 1 1 Goats - - - - - - - - - - - - - 1 - - 1 Heavy Calves - - - - - 1 - - 2 - - - - - 1 - 4 Lambs - - - - - - - - - - - - - 4 - - 4 Market Hogs - - - - - - - - - - 1 - - - - - 1 Mature Chickens - - - - - - - - - - - - - 3 - 1 4 Mature Turkeys - 3 2 - - - - - - - 1 - - 10 - 3 19 Non-Formula-fed Veal - - - - - 1 - - 2 1 1 - - - - - 5 Rabbits - - - - - - - - - - - - - - - 33 33 Roaster Pigs - - - - - - - - - - 1 - - 2 1 - 4 Sows - - - 2 - - - - - - 1 - - - - 4 7 Steers - - - 5 - - 1 - - - - - 1 - - - 7 Young Chickens - - - - - - - - - - - - - 1 - - 1 Young Turkeys - 3 - - - - - - - - - - - - - - 3
TOTAL 1 6 2 11 3 4 1 1 22 5 16 1 1 25 3 42 144
45
DOMESTIC SAMPLING RESULTS: Production Class Data
Tables 15-34 identify information obtained from the FSIS Microbiological and Residue Computer Information System (MARCIS) and FSIS DW. These tables list summary and detailed results by production class. Tables 15a–34a contain a summary of domestic scheduled sampling results and provide the number of samples analyzed, number of non-violative positives (e.g., compounds detected at a level equal to or below the established tolerance), number of violations, and percent of violations for each production class. Because multiple compounds can be analyzed on the same sample, one sample (e.g., one animal or a composite from one poultry flock) may have more than one violation. The summary data appears as a series of bar charts. Tables 15b–34b summarizes violation results by production class. These include chemical compound, tissue type, and residue detected results (ppb or ppm). For some production class categories, Tables 15b–34b may include two columns for some compound class categories. The additional columns indicate instances when residues were detected, but were not quantitated. Code 8888 is used for violative results, and code 9999 for non-violative.
46
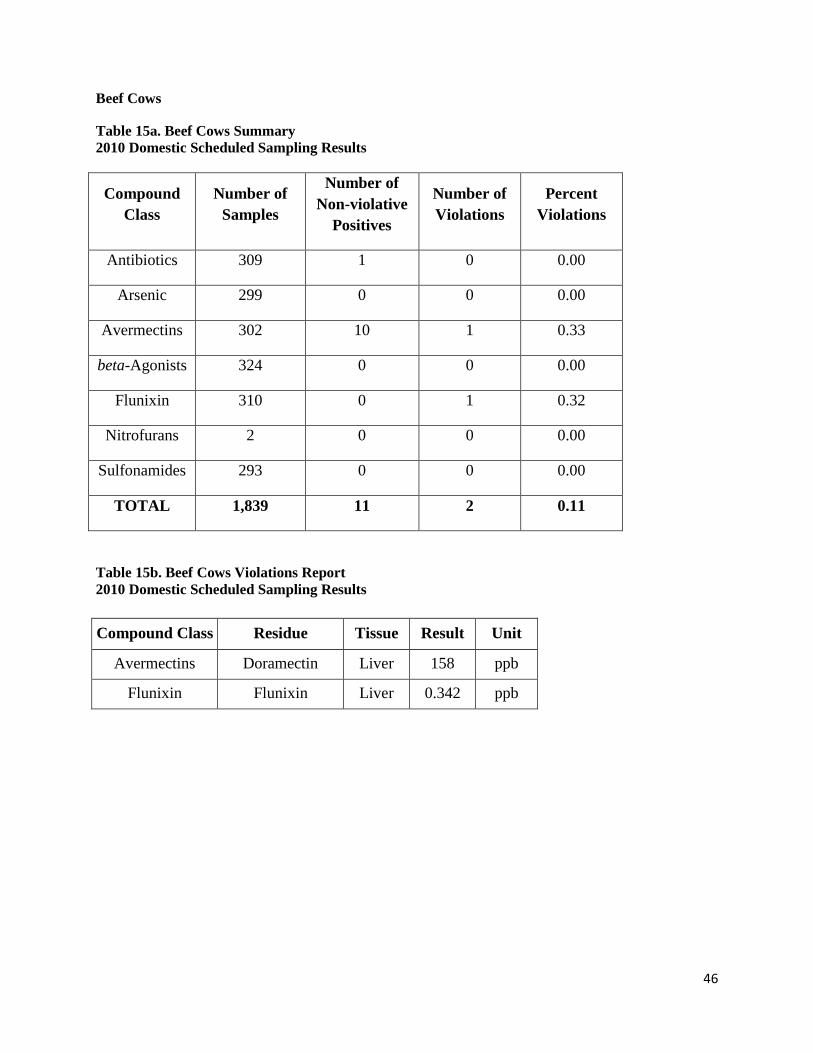
Beef Cows
Table 15a. Beef Cows Summary 2010 Domestic Scheduled Sampling Results
Compound Class
Number of Samples
Number of Non-violative
Positives
Number of Violations
Percent Violations
Antibiotics 309 1 0 0.00
Arsenic 299 0 0 0.00
Avermectins 302 10 1 0.33
beta-Agonists 324 0 0 0.00
Flunixin 310 0 1 0.32
Nitrofurans 2 0 0 0.00
Sulfonamides 293 0 0 0.00
TOTAL 1,839 11 2 0.11
Table 15b. Beef Cows Violations Report 2010 Domestic Scheduled Sampling Results
Compound Class Residue Tissue Result Unit
Avermectins Doramectin Liver 158 ppb
Flunixin Flunixin Liver 0.342 ppb
47
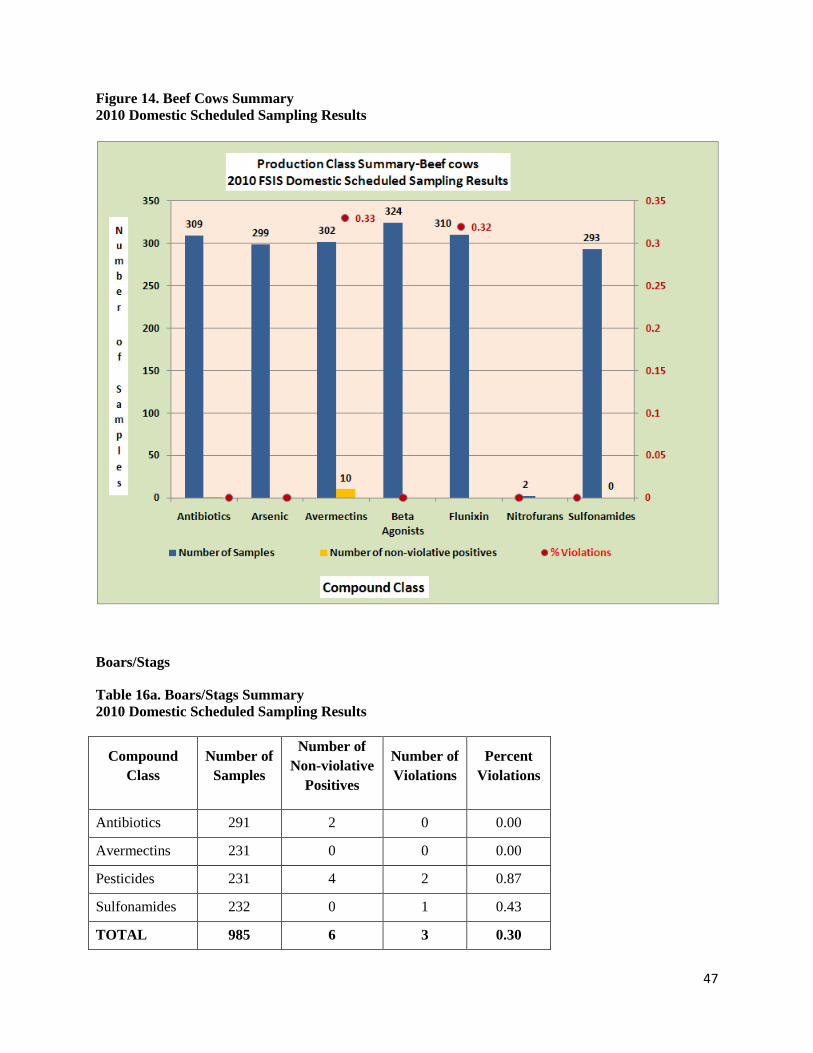
Figure 14. Beef Cows Summary 2010 Domestic Scheduled Sampling Results
Boars/Stags
Table 16a. Boars/Stags Summary 2010 Domestic Scheduled Sampling Results
Compound Class
Number of Samples
Number of Non-violative
Positives
Number of Violations
Percent Violations
Antibiotics 291 2 0 0.00
Avermectins 231 0 0 0.00
Pesticides 231 4 2 0.87
Sulfonamides 232 0 1 0.43
TOTAL 985 6 3 0.30
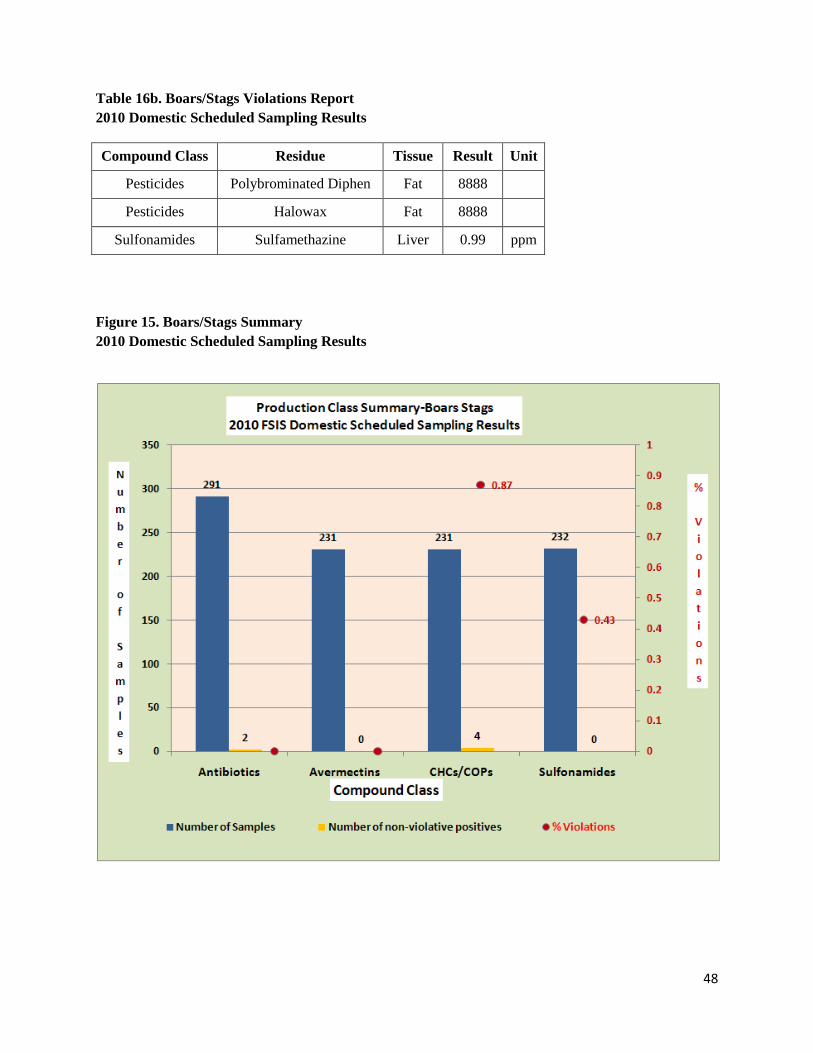
48
Table 16b. Boars/Stags Violations Report 2010 Domestic Scheduled Sampling Results Compound Class Residue Tissue Result Unit
Pesticides Polybrominated Diphen Fat 8888
Pesticides Halowax Fat 8888
Sulfonamides Sulfamethazine Liver 0.99 ppm
Figure 15. Boars/Stags Summary 2010 Domestic Scheduled Sampling Results
49
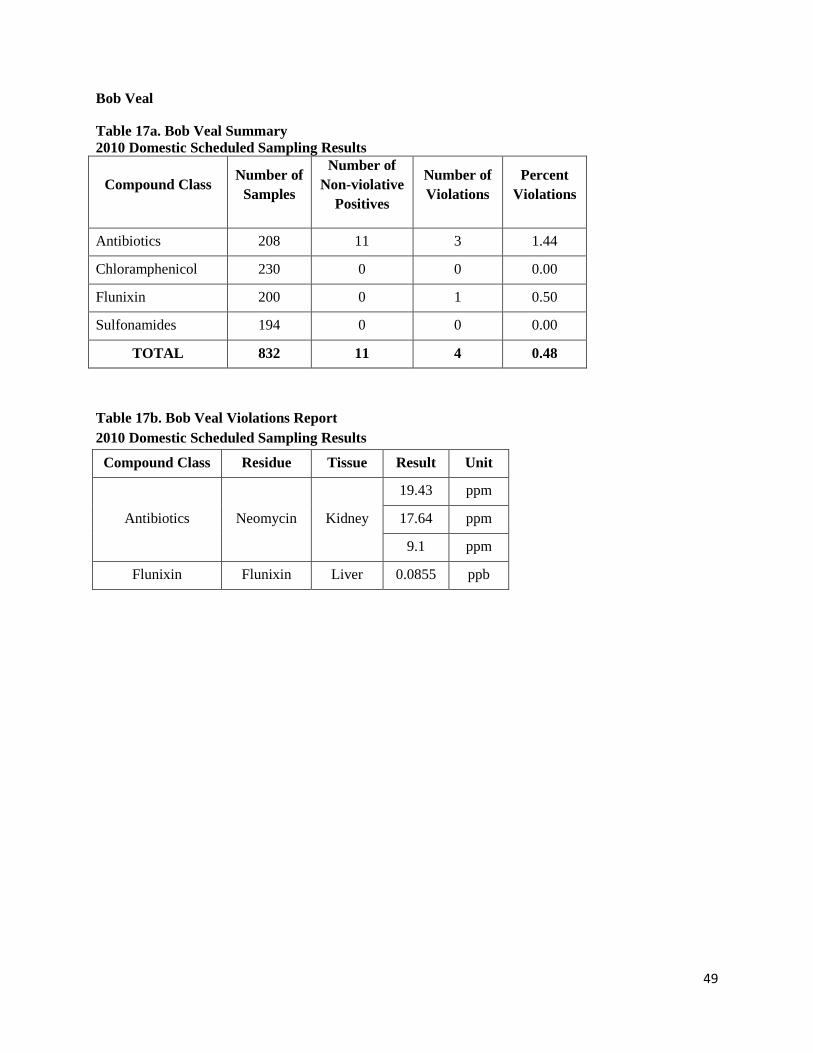
Bob Veal
Table 17a. Bob Veal Summary 2010 Domestic Scheduled Sampling Results
Compound Class Number of Samples
Number of Non-violative
Positives
Number of Violations
Percent Violations
Antibiotics 208 11 3 1.44
Chloramphenicol 230 0 0 0.00
Flunixin 200 0 1 0.50
Sulfonamides 194 0 0 0.00
TOTAL 832 11 4 0.48
Table 17b. Bob Veal Violations Report 2010 Domestic Scheduled Sampling Results
Compound Class Residue Tissue Result Unit
Antibiotics Neomycin Kidney
19.43 ppm
17.64 ppm
9.1 ppm
Flunixin Flunixin Liver 0.0855 ppb
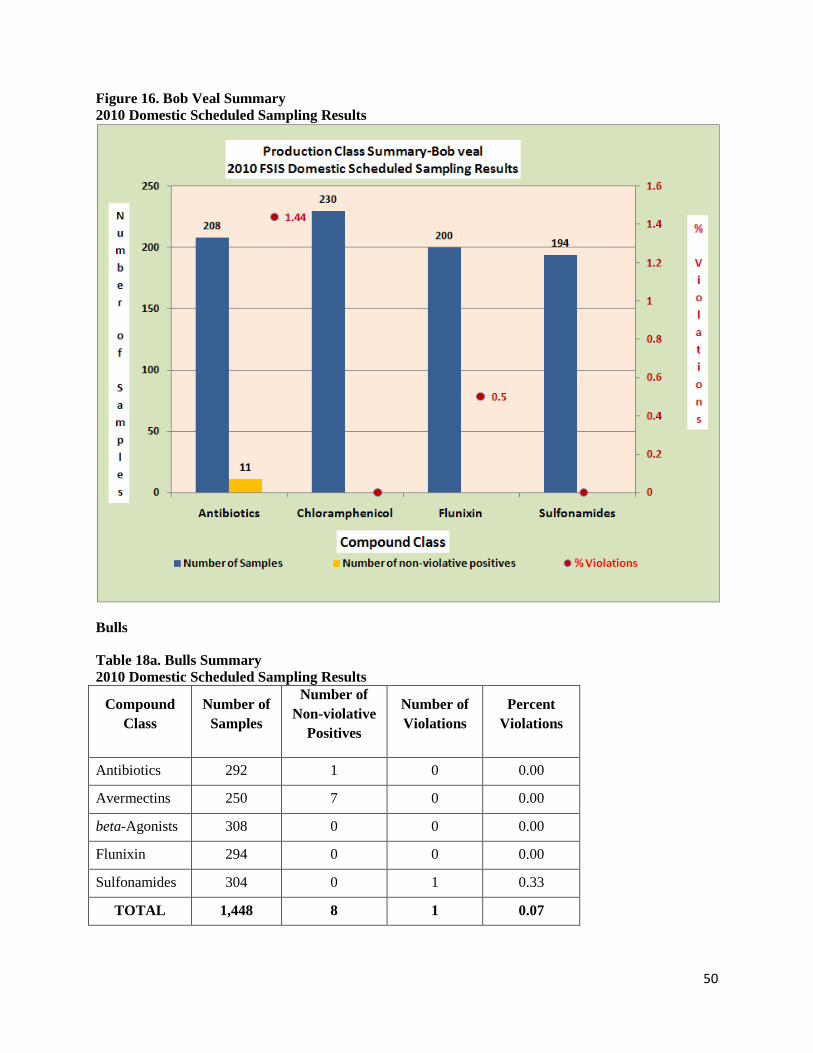
50
Figure 16. Bob Veal Summary 2010 Domestic Scheduled Sampling Results
Bulls
Table 18a. Bulls Summary 2010 Domestic Scheduled Sampling Results
Compound Class
Number of Samples
Number of Non-violative
Positives
Number of Violations
Percent Violations
Antibiotics 292 1 0 0.00
Avermectins 250 7 0 0.00
beta-Agonists 308 0 0 0.00
Flunixin 294 0 0 0.00
Sulfonamides 304 0 1 0.33
TOTAL 1,448 8 1 0.07
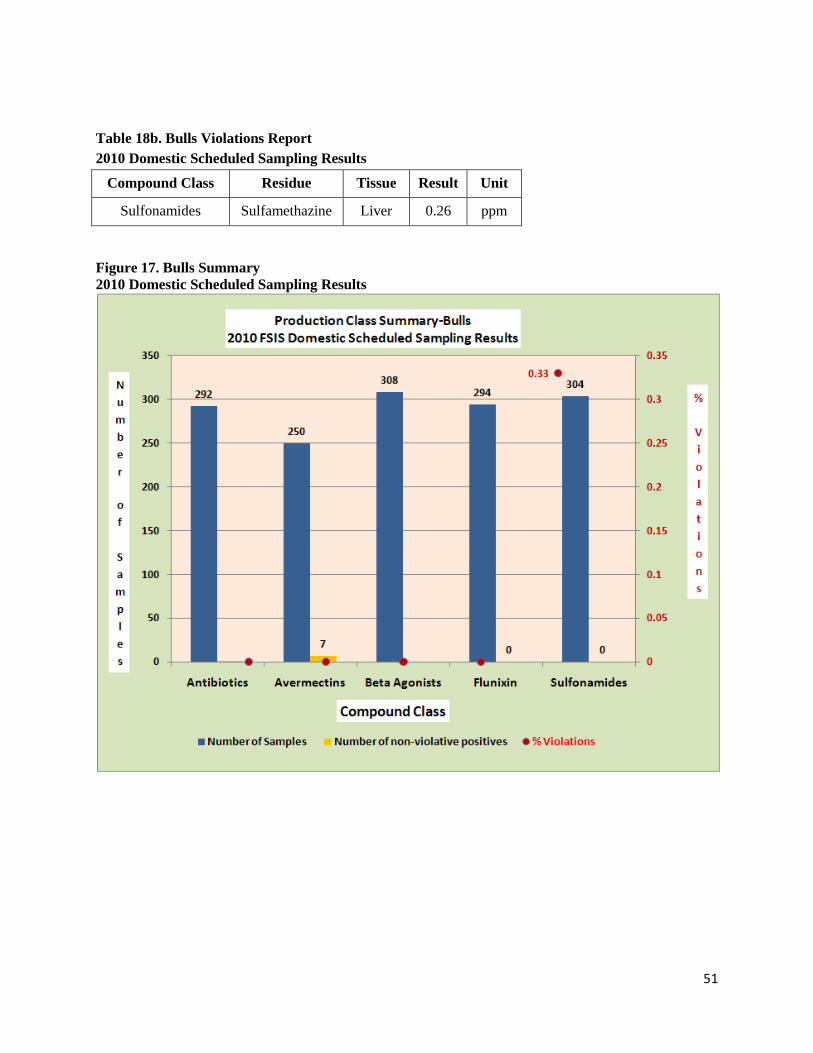
51
Table 18b. Bulls Violations Report 2010 Domestic Scheduled Sampling Results
Compound Class Residue Tissue Result Unit
Sulfonamides Sulfamethazine Liver 0.26 ppm
Figure 17. Bulls Summary 2010 Domestic Scheduled Sampling Results
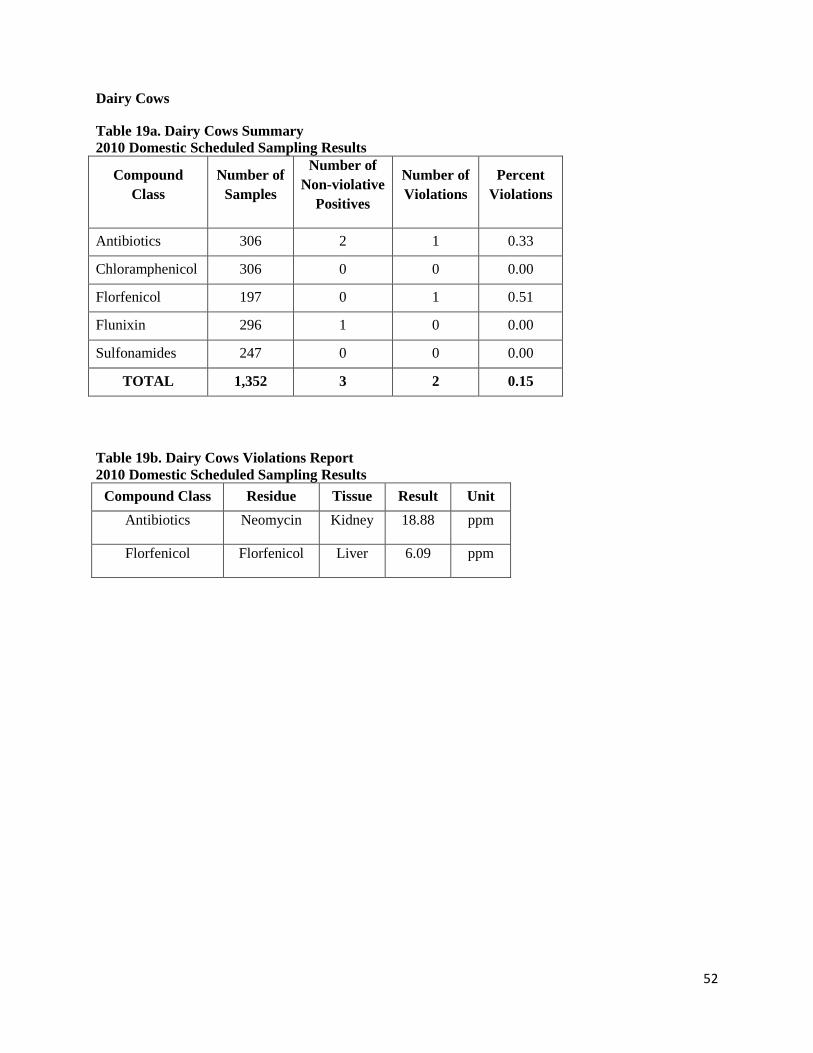
52
Dairy Cows
Table 19a. Dairy Cows Summary 2010 Domestic Scheduled Sampling Results
Compound Class
Number of Samples
Number of Non-violative
Positives
Number of Violations
Percent Violations
Antibiotics 306 2 1 0.33
Chloramphenicol 306 0 0 0.00
Florfenicol 197 0 1 0.51
Flunixin 296 1 0 0.00
Sulfonamides 247 0 0 0.00
TOTAL 1,352 3 2 0.15
Table 19b. Dairy Cows Violations Report 2010 Domestic Scheduled Sampling Results
Compound Class Residue Tissue Result Unit Antibiotics Neomycin Kidney 18.88 ppm
Florfenicol Florfenicol Liver 6.09 ppm
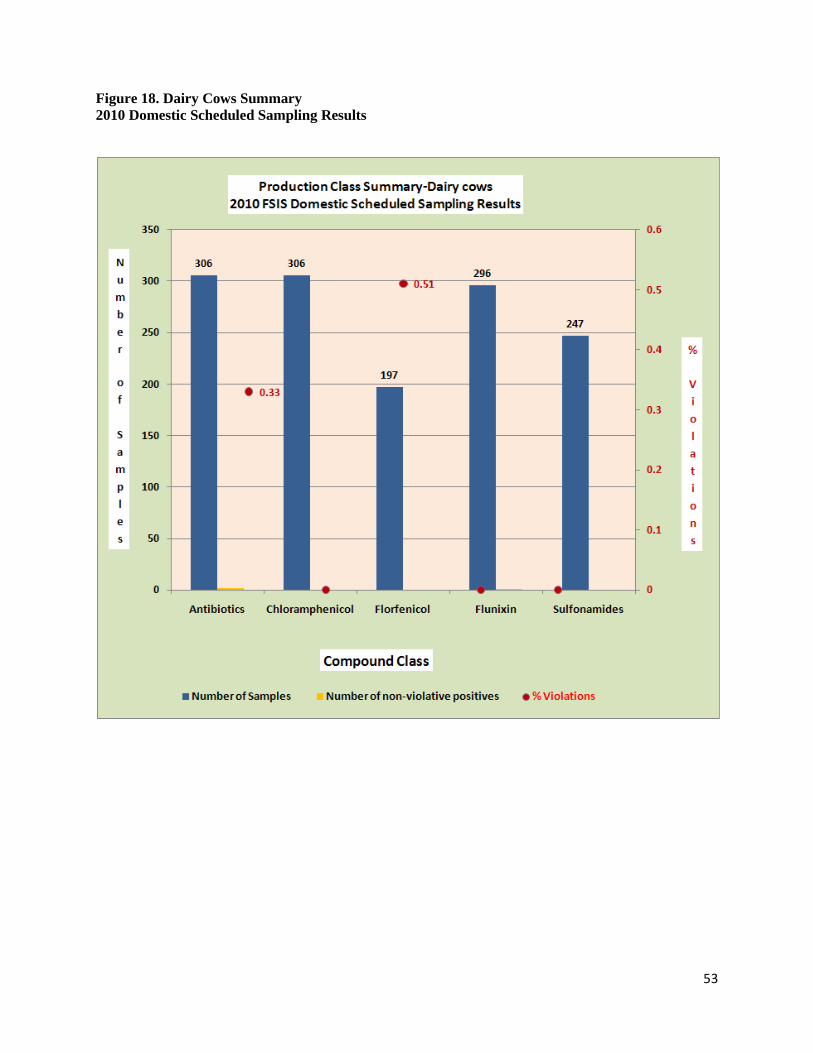
53
Figure 18. Dairy Cows Summary 2010 Domestic Scheduled Sampling Results
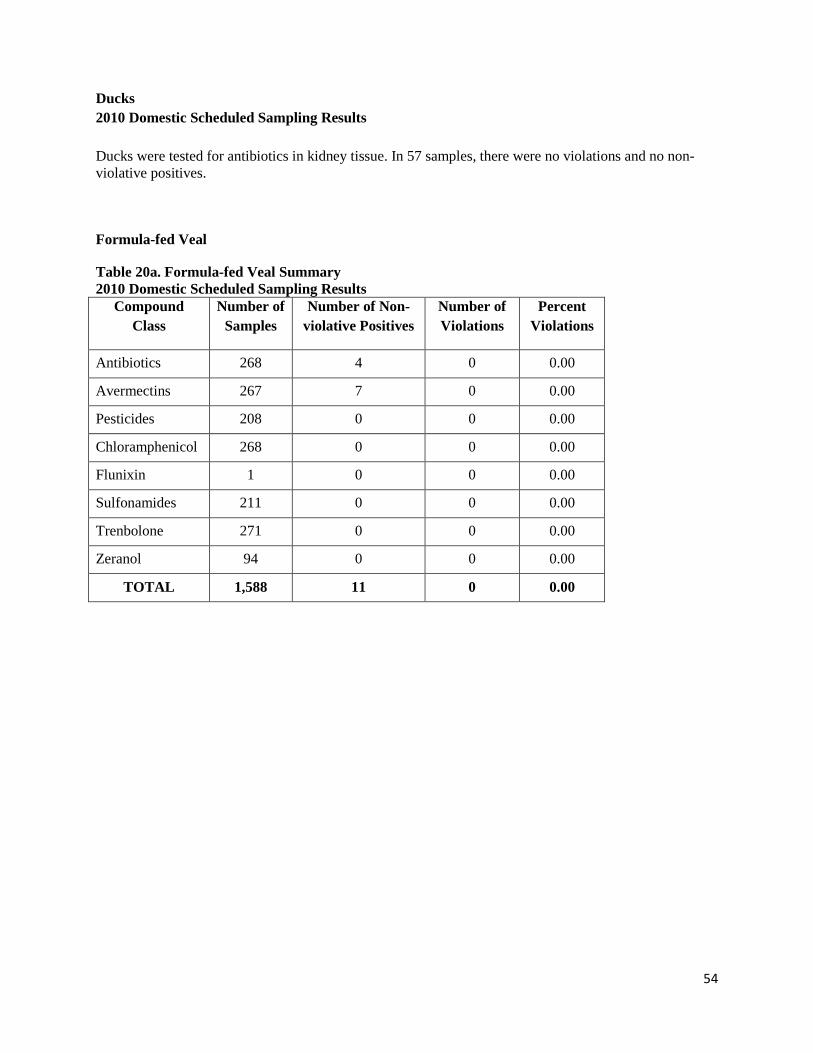
54
Ducks 2010 Domestic Scheduled Sampling Results Ducks were tested for antibiotics in kidney tissue. In 57 samples, there were no violations and no non-violative positives.
Formula-fed Veal
Table 20a. Formula-fed Veal Summary 2010 Domestic Scheduled Sampling Results
Compound Class
Number of Samples
Number of Non-violative Positives
Number of Violations
Percent Violations
Antibiotics 268 4 0 0.00
Avermectins 267 7 0 0.00
Pesticides 208 0 0 0.00
Chloramphenicol 268 0 0 0.00
Flunixin 1 0 0 0.00
Sulfonamides 211 0 0 0.00
Trenbolone 271 0 0 0.00
Zeranol 94 0 0 0.00
TOTAL 1,588 11 0 0.00
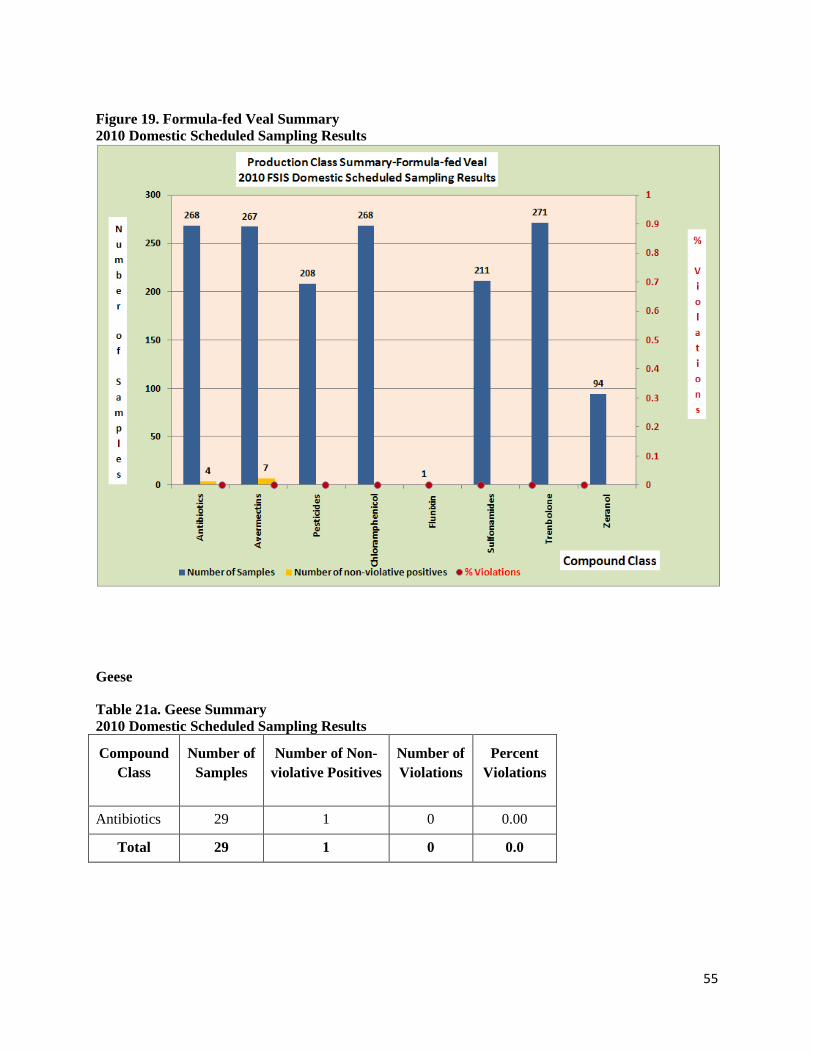
55
Figure 19. Formula-fed Veal Summary 2010 Domestic Scheduled Sampling Results
Geese
Table 21a. Geese Summary 2010 Domestic Scheduled Sampling Results
Compound Class
Number of Samples
Number of Non-violative Positives
Number of Violations
Percent Violations
Antibiotics 29 1 0 0.00
Total 29 1 0 0.0
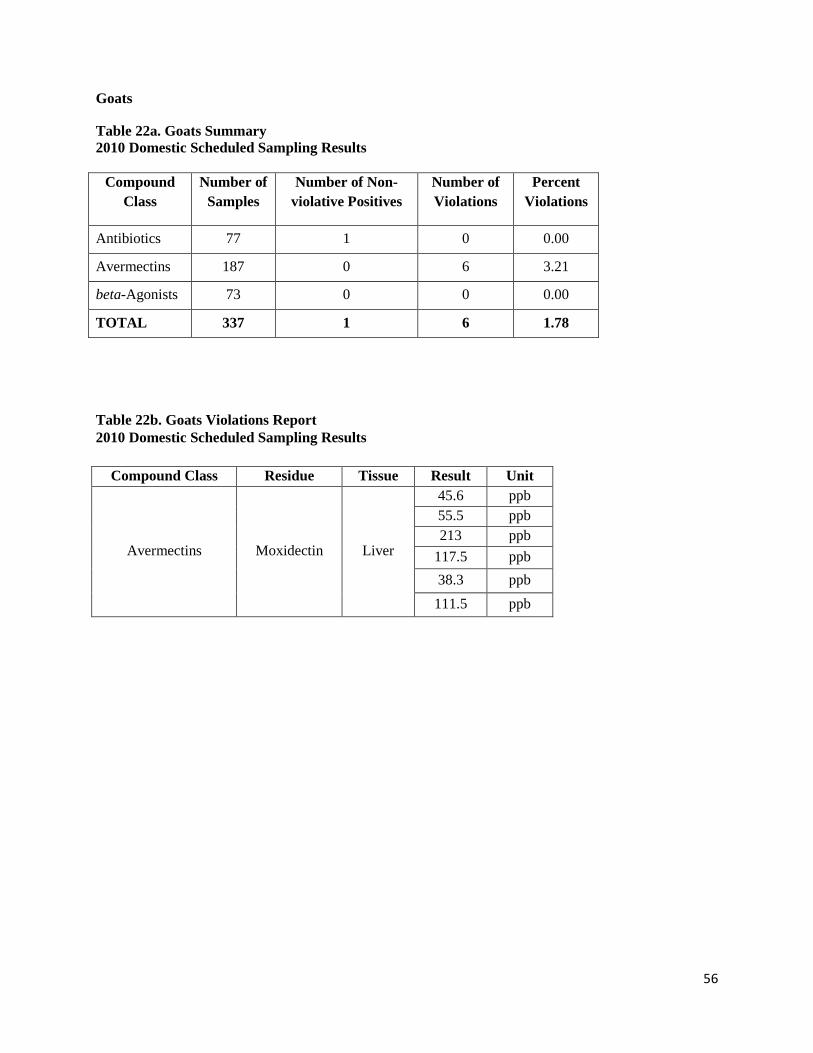
56
Goats
Table 22a. Goats Summary 2010 Domestic Scheduled Sampling Results
Compound Class
Number of Samples
Number of Non-violative Positives
Number of Violations
Percent Violations
Antibiotics 77 1 0 0.00
Avermectins 187 0 6 3.21
beta-Agonists 73 0 0 0.00
TOTAL 337 1 6 1.78
Table 22b. Goats Violations Report 2010 Domestic Scheduled Sampling Results
Compound Class Residue Tissue Result Unit
Avermectins Moxidectin Liver
45.6 ppb 55.5 ppb 213 ppb
117.5 ppb 38.3 ppb
111.5 ppb
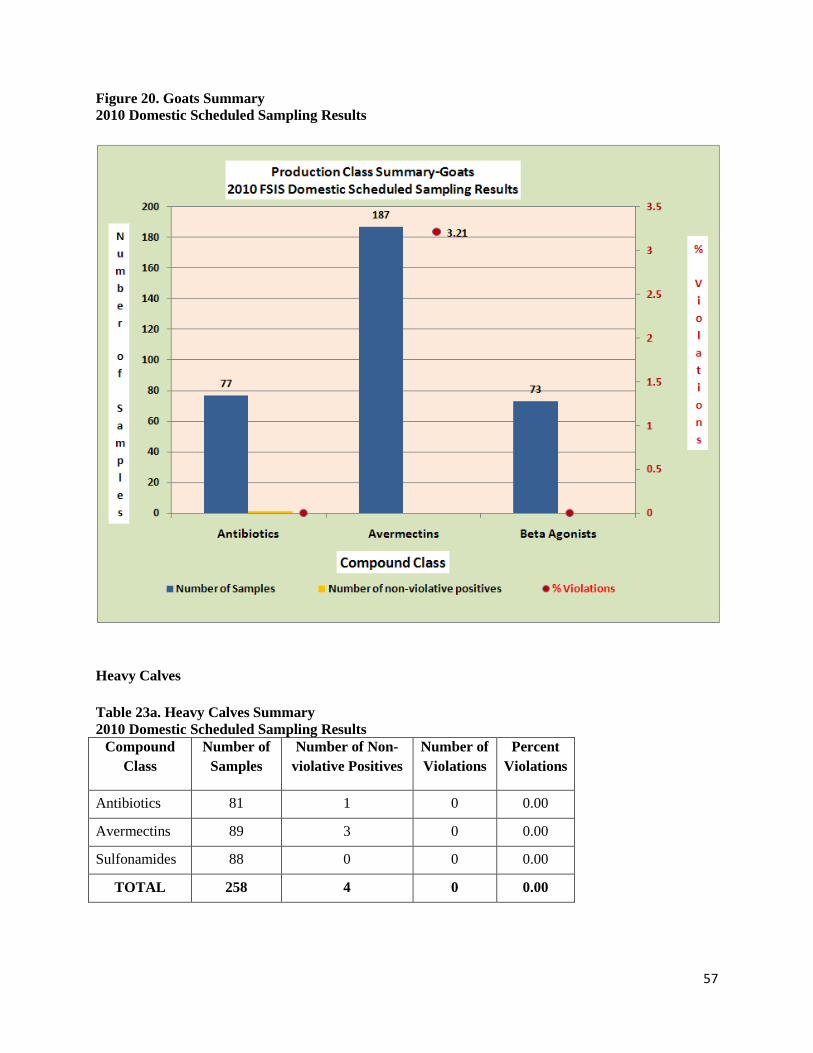
57
Figure 20. Goats Summary 2010 Domestic Scheduled Sampling Results
Heavy Calves Table 23a. Heavy Calves Summary 2010 Domestic Scheduled Sampling Results
Compound Class
Number of Samples
Number of Non-violative Positives
Number of Violations
Percent Violations
Antibiotics 81 1 0 0.00
Avermectins 89 3 0 0.00
Sulfonamides 88 0 0 0.00
TOTAL 258 4 0 0.00
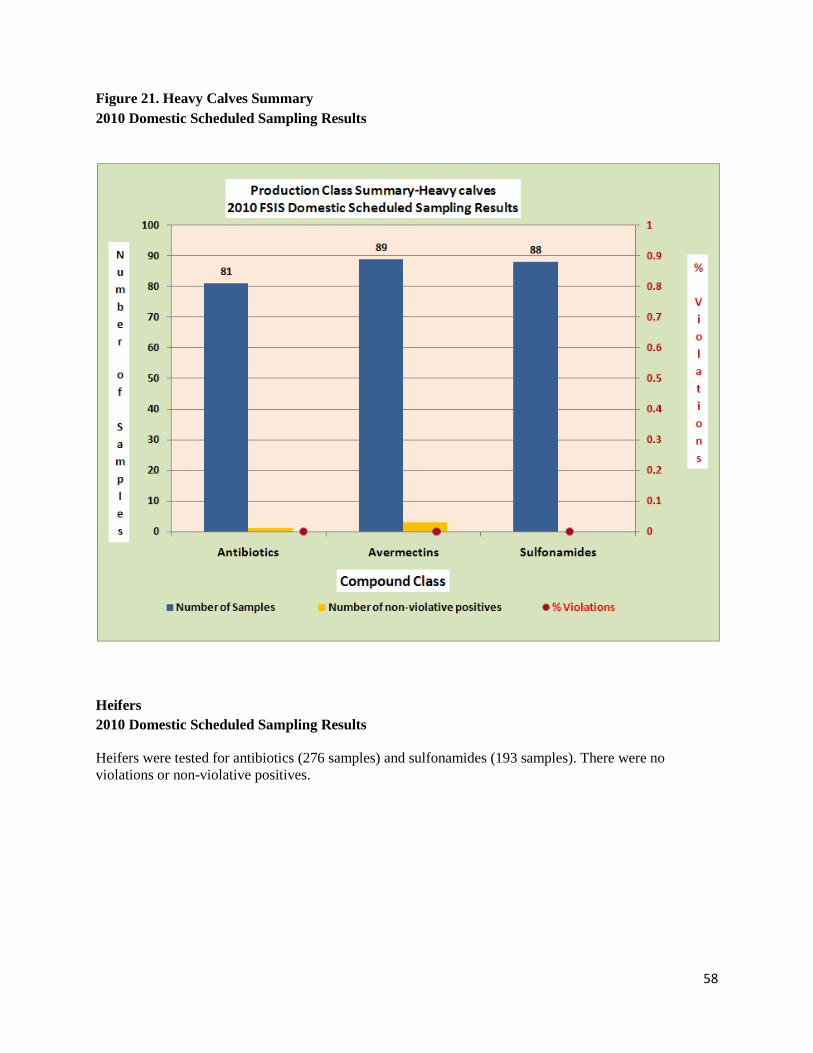
58
Figure 21. Heavy Calves Summary 2010 Domestic Scheduled Sampling Results
Heifers 2010 Domestic Scheduled Sampling Results Heifers were tested for antibiotics (276 samples) and sulfonamides (193 samples). There were no violations or non-violative positives.
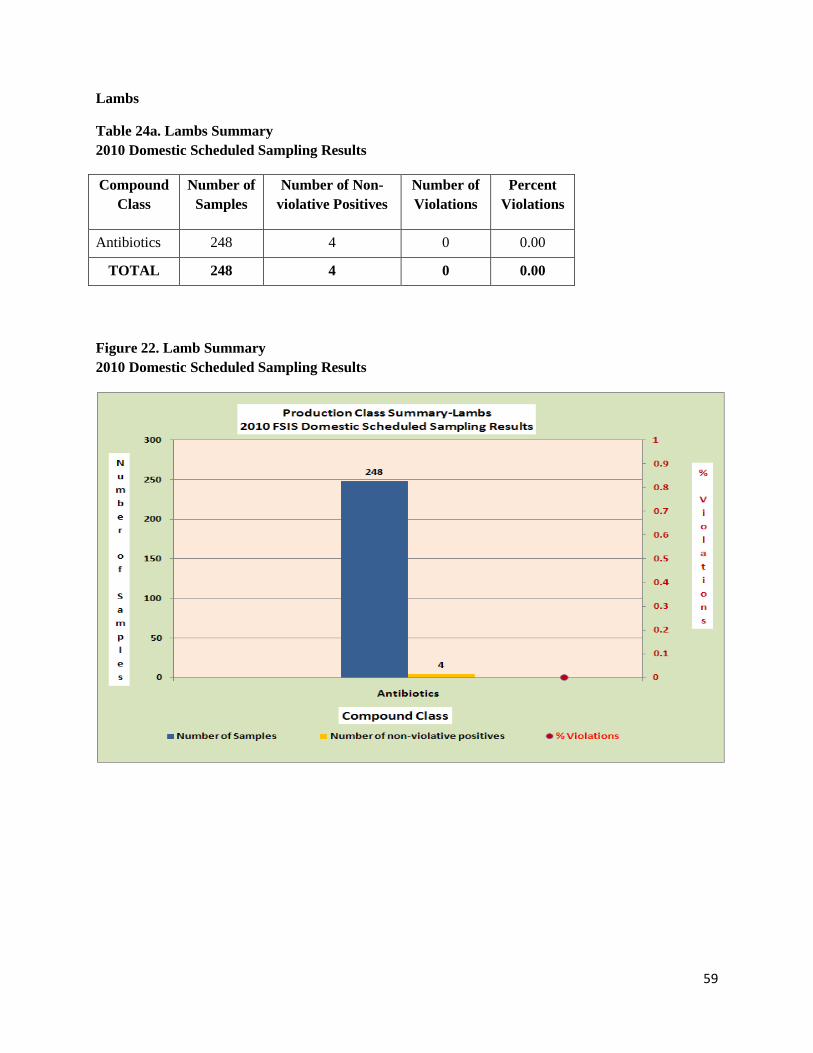
59
Lambs
Table 24a. Lambs Summary 2010 Domestic Scheduled Sampling Results
Compound Class
Number of Samples
Number of Non-violative Positives
Number of Violations
Percent Violations
Antibiotics 248 4 0 0.00
TOTAL 248 4 0 0.00
Figure 22. Lamb Summary 2010 Domestic Scheduled Sampling Results
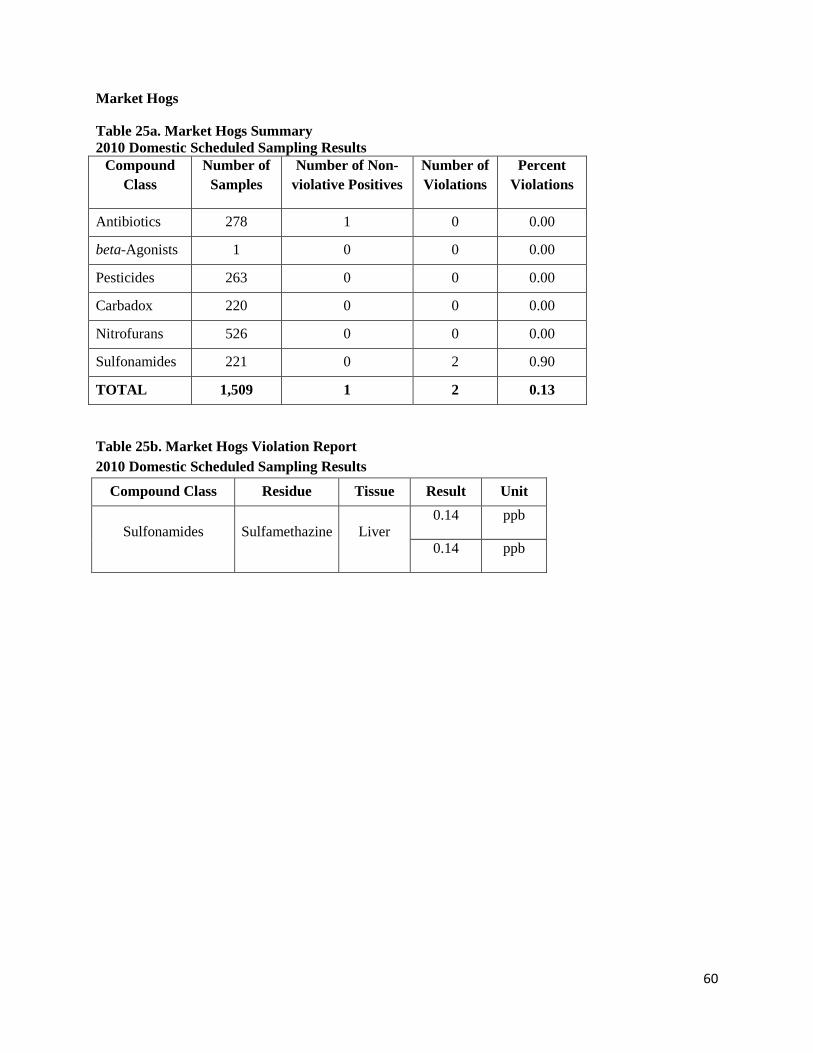
60
Market Hogs
Table 25a. Market Hogs Summary 2010 Domestic Scheduled Sampling Results
Compound Class
Number of Samples
Number of Non-violative Positives
Number of Violations
Percent Violations
Antibiotics 278 1 0 0.00
beta-Agonists 1 0 0 0.00
Pesticides 263 0 0 0.00
Carbadox 220 0 0 0.00
Nitrofurans 526 0 0 0.00
Sulfonamides 221 0 2 0.90
TOTAL 1,509 1 2 0.13
Table 25b. Market Hogs Violation Report 2010 Domestic Scheduled Sampling Results
Compound Class Residue Tissue Result Unit
Sulfonamides Sulfamethazine Liver 0.14 ppb
0.14 ppb
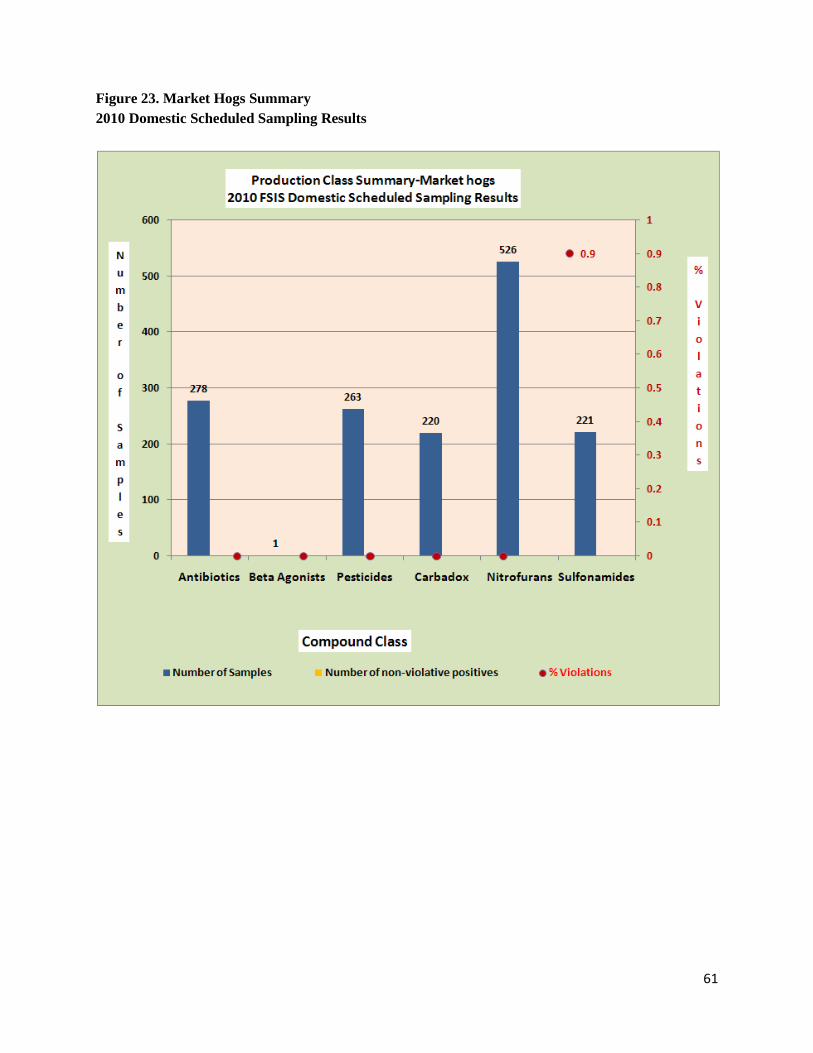
61
Figure 23. Market Hogs Summary 2010 Domestic Scheduled Sampling Results

62
Mature Chickens
Table 26a. Mature Chickens Summary 2010 Domestic Scheduled Sampling Results
Compound Class
Number of Samples
Number of Non-violative Positives
Number of Violations
Percent Violations
Antibiotics 319 4 0 0.00
Pesticides 205 0 0 0.00
Sulfonamides 306 0 0 0.00
TOTAL 830 4 0 0.00
Figure 24. Mature Chicken Summary 2010 Domestic Scheduled Sampling Results
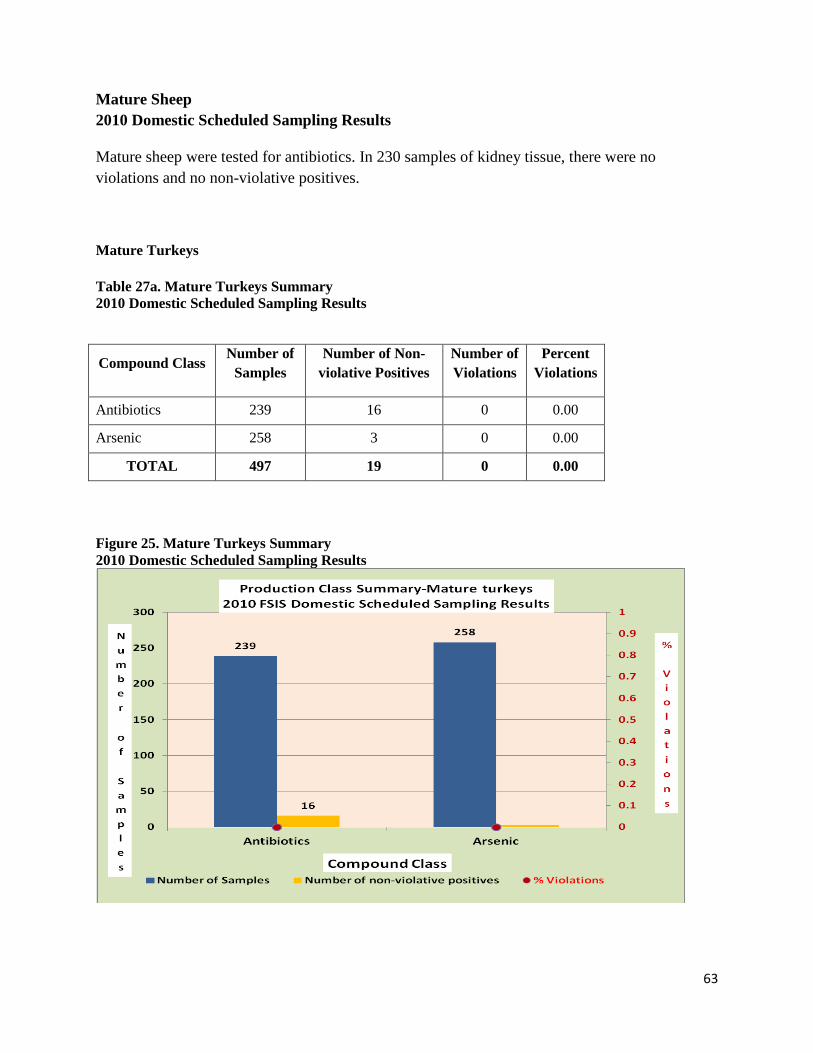
63
Mature Sheep 2010 Domestic Scheduled Sampling Results Mature sheep were tested for antibiotics. In 230 samples of kidney tissue, there were no violations and no non-violative positives.
Mature Turkeys Table 27a. Mature Turkeys Summary 2010 Domestic Scheduled Sampling Results
Compound Class Number of Samples
Number of Non-violative Positives
Number of Violations
Percent Violations
Antibiotics 239 16 0 0.00
Arsenic 258 3 0 0.00
TOTAL 497 19 0 0.00
Figure 25. Mature Turkeys Summary 2010 Domestic Scheduled Sampling Results
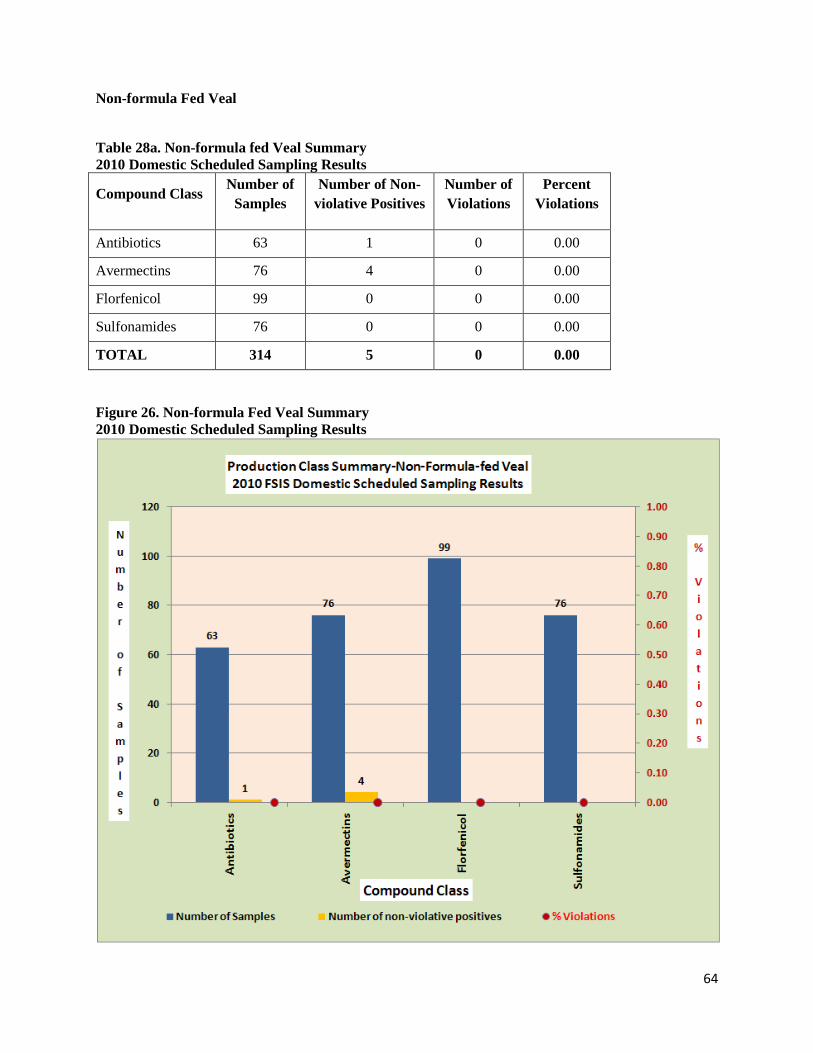
64
Non-formula Fed Veal
Table 28a. Non-formula fed Veal Summary 2010 Domestic Scheduled Sampling Results
Compound Class Number of Samples
Number of Non-violative Positives
Number of Violations
Percent Violations
Antibiotics 63 1 0 0.00
Avermectins 76 4 0 0.00
Florfenicol 99 0 0 0.00
Sulfonamides 76 0 0 0.00
TOTAL 314 5 0 0.00 Figure 26. Non-formula Fed Veal Summary 2010 Domestic Scheduled Sampling Results
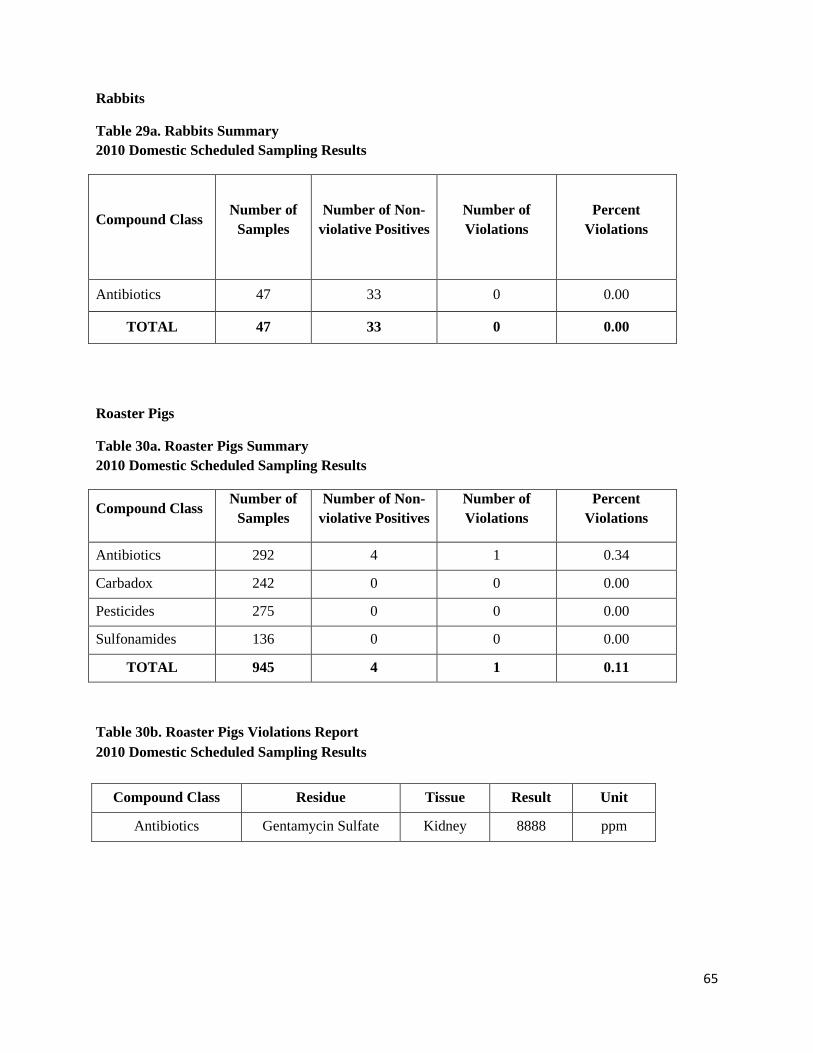
65
Rabbits
Table 29a. Rabbits Summary 2010 Domestic Scheduled Sampling Results
Compound Class Number of Samples
Number of Non-violative Positives
Number of Violations
Percent Violations
Antibiotics 47 33 0 0.00
TOTAL 47 33 0 0.00
Roaster Pigs
Table 30a. Roaster Pigs Summary 2010 Domestic Scheduled Sampling Results
Compound Class Number of
Samples Number of Non-
violative Positives Number of Violations
Percent Violations
Antibiotics 292 4 1 0.34
Carbadox 242 0 0 0.00
Pesticides 275 0 0 0.00
Sulfonamides 136 0 0 0.00
TOTAL 945 4 1 0.11
Table 30b. Roaster Pigs Violations Report 2010 Domestic Scheduled Sampling Results
Compound Class Residue Tissue Result Unit
Antibiotics Gentamycin Sulfate Kidney 8888 ppm
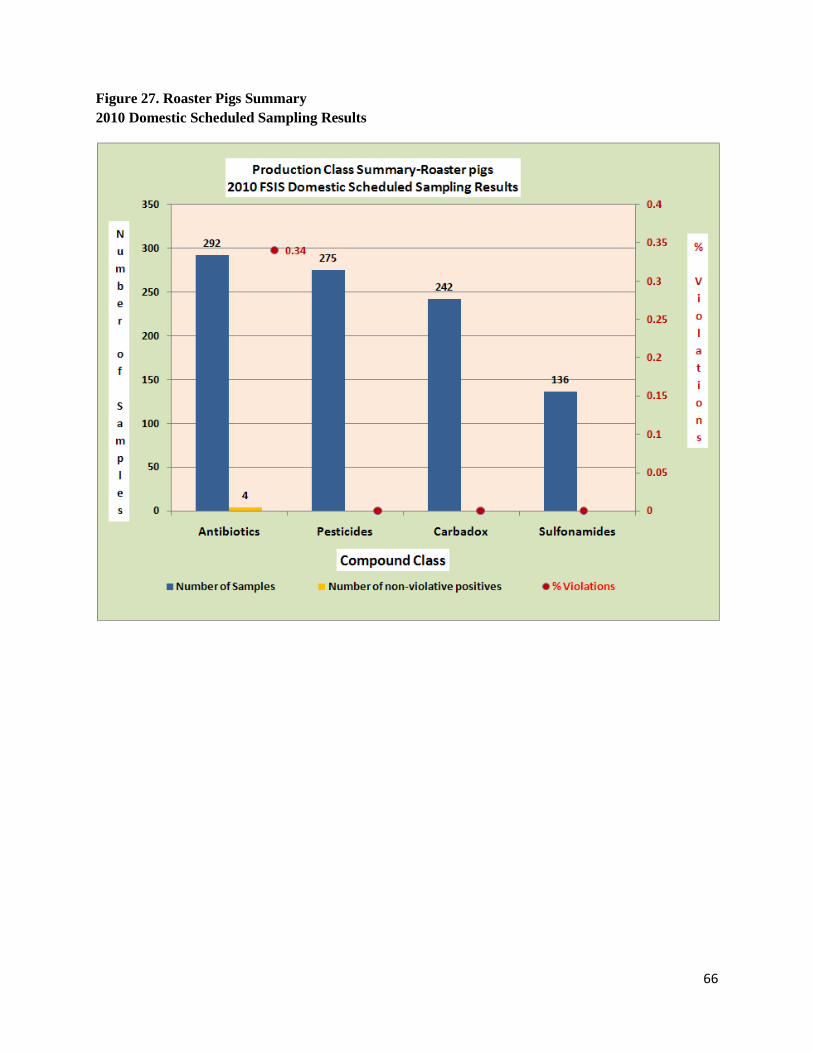
66
Figure 27. Roaster Pigs Summary 2010 Domestic Scheduled Sampling Results
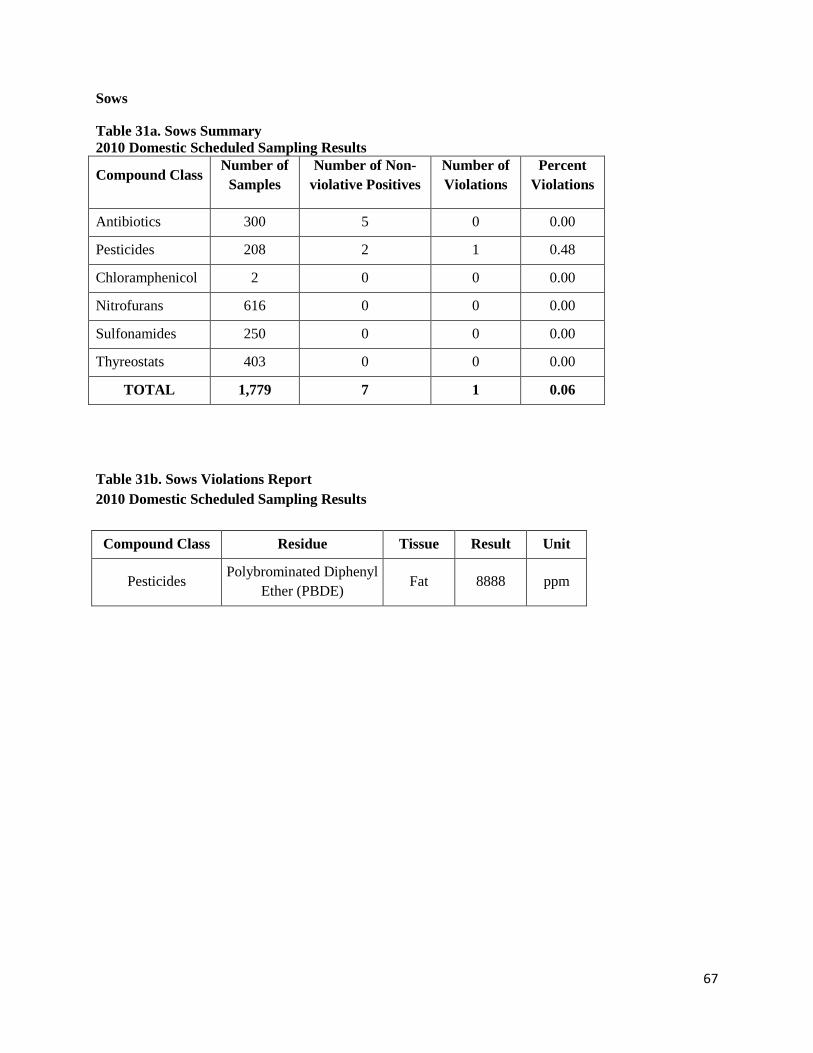
67
Sows
Table 31a. Sows Summary 2010 Domestic Scheduled Sampling Results
Compound Class Number of Samples
Number of Non-violative Positives
Number of Violations
Percent Violations
Antibiotics 300 5 0 0.00
Pesticides 208 2 1 0.48
Chloramphenicol 2 0 0 0.00
Nitrofurans 616 0 0 0.00
Sulfonamides 250 0 0 0.00
Thyreostats 403 0 0 0.00
TOTAL 1,779 7 1 0.06
Table 31b. Sows Violations Report 2010 Domestic Scheduled Sampling Results
Compound Class Residue Tissue Result Unit
Pesticides Polybrominated Diphenyl Ether (PBDE)
Fat 8888 ppm
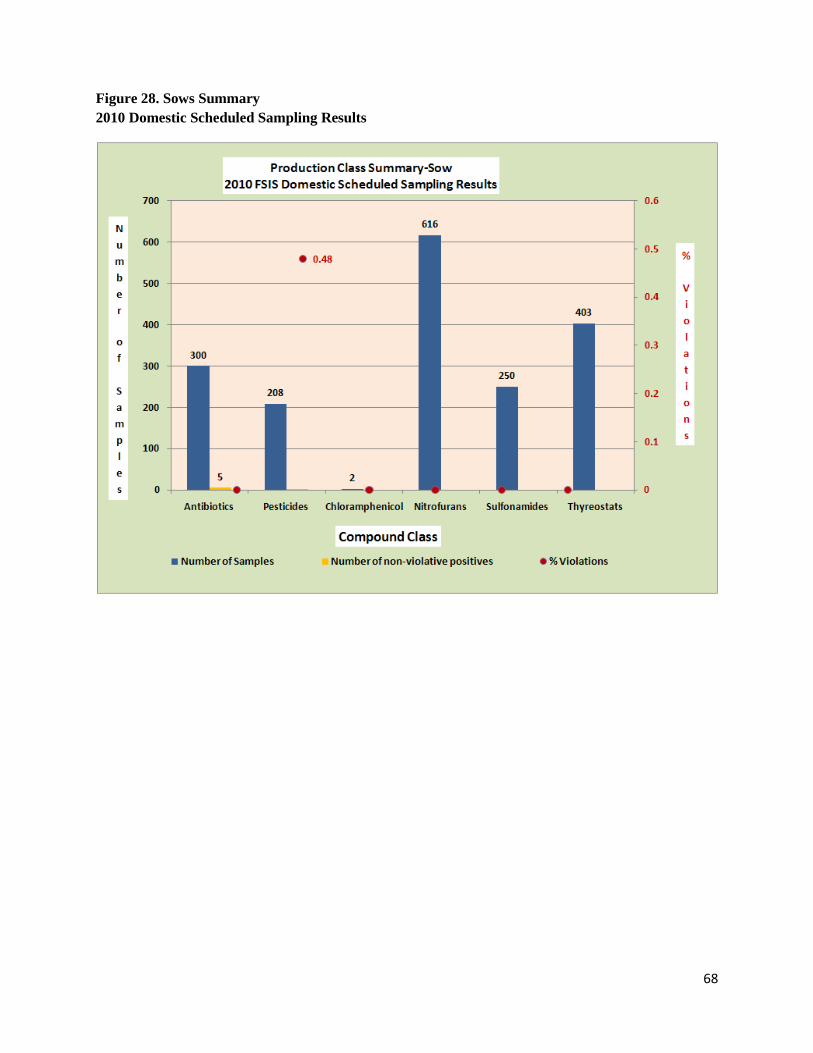
68
Figure 28. Sows Summary 2010 Domestic Scheduled Sampling Results
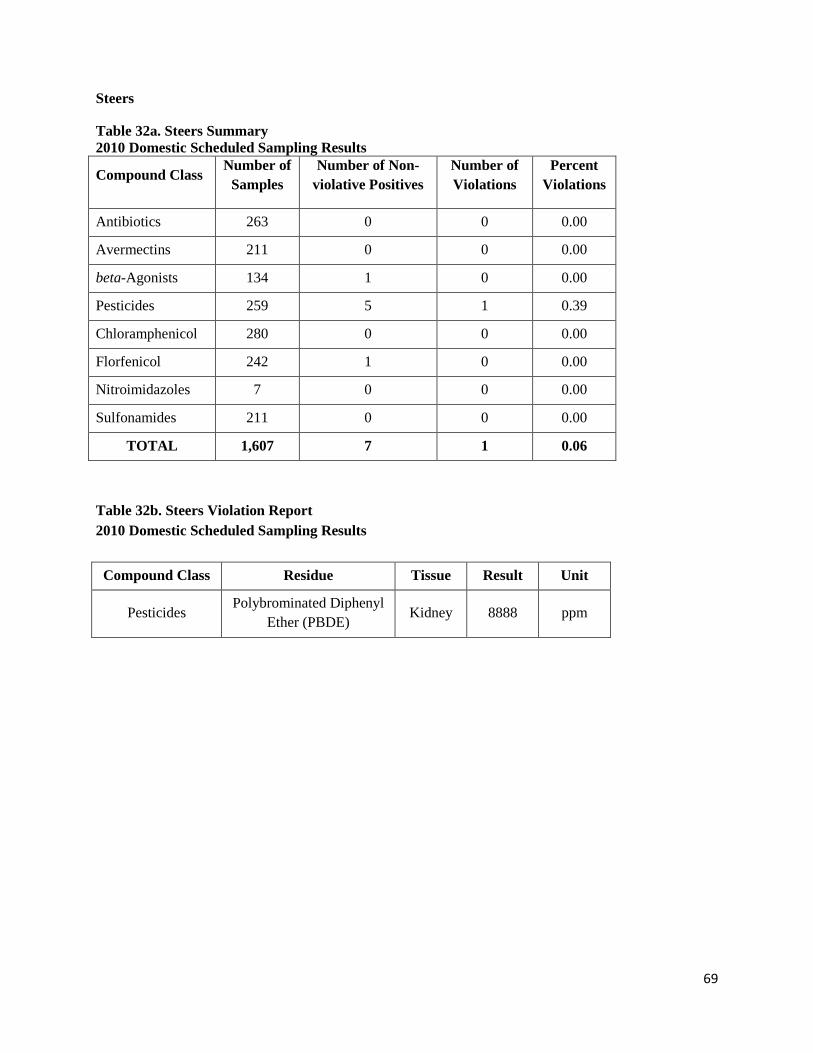
69
Steers
Table 32a. Steers Summary 2010 Domestic Scheduled Sampling Results
Compound Class Number of Samples
Number of Non-violative Positives
Number of Violations
Percent Violations
Antibiotics 263 0 0 0.00
Avermectins 211 0 0 0.00
beta-Agonists 134 1 0 0.00
Pesticides 259 5 1 0.39
Chloramphenicol 280 0 0 0.00
Florfenicol 242 1 0 0.00
Nitroimidazoles 7 0 0 0.00
Sulfonamides 211 0 0 0.00
TOTAL 1,607 7 1 0.06 Table 32b. Steers Violation Report 2010 Domestic Scheduled Sampling Results
Compound Class Residue Tissue Result Unit
Pesticides Polybrominated Diphenyl
Ether (PBDE) Kidney 8888 ppm
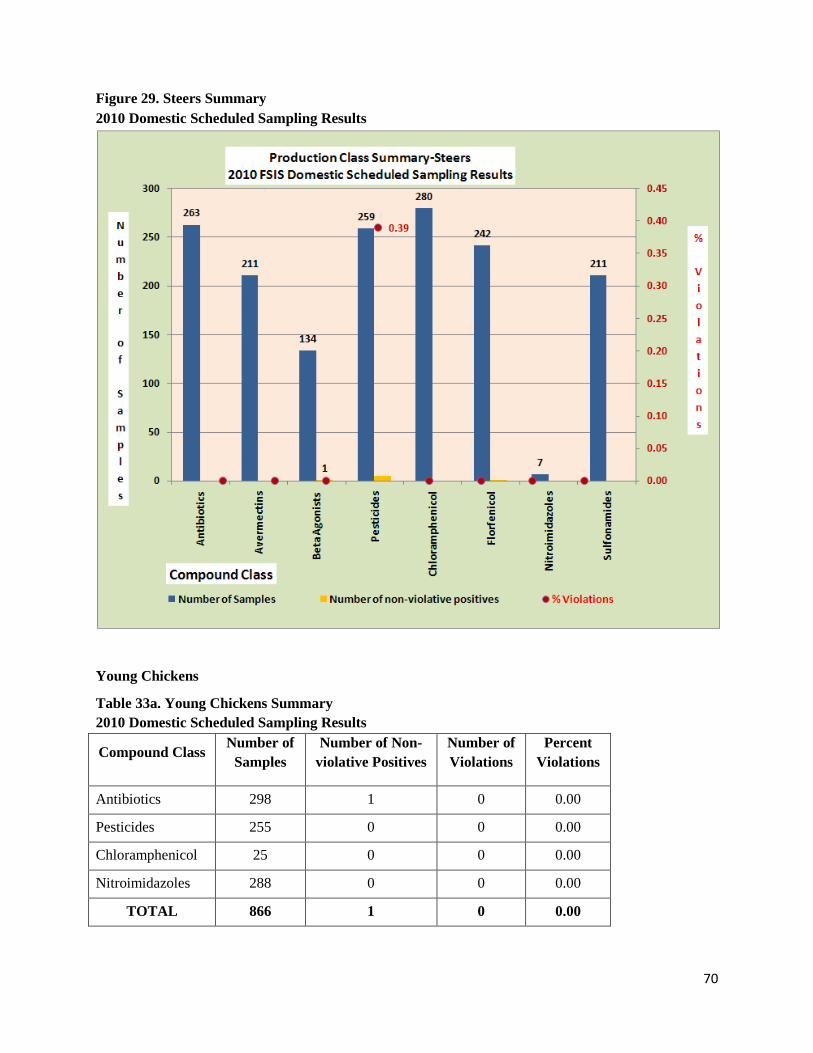
70
Figure 29. Steers Summary 2010 Domestic Scheduled Sampling Results
Young Chickens
Table 33a. Young Chickens Summary 2010 Domestic Scheduled Sampling Results
Compound Class Number of Samples
Number of Non-violative Positives
Number of Violations
Percent Violations
Antibiotics 298 1 0 0.00
Pesticides 255 0 0 0.00
Chloramphenicol 25 0 0 0.00
Nitroimidazoles 288 0 0 0.00
TOTAL 866 1 0 0.00
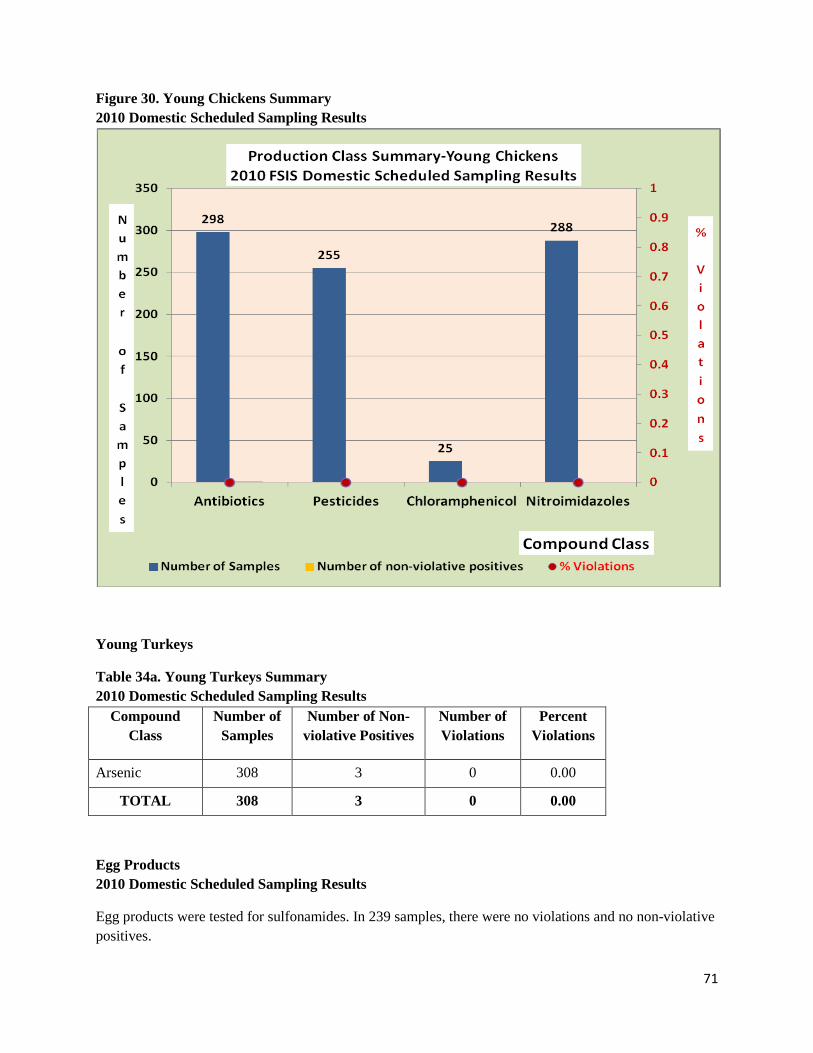
71
Figure 30. Young Chickens Summary 2010 Domestic Scheduled Sampling Results
Young Turkeys
Table 34a. Young Turkeys Summary 2010 Domestic Scheduled Sampling Results
Compound Class
Number of Samples
Number of Non-violative Positives
Number of Violations
Percent Violations
Arsenic 308 3 0 0.00
TOTAL 308 3 0 0.00
Egg Products 2010 Domestic Scheduled Sampling Results
Egg products were tested for sulfonamides. In 239 samples, there were no violations and no non-violative positives.
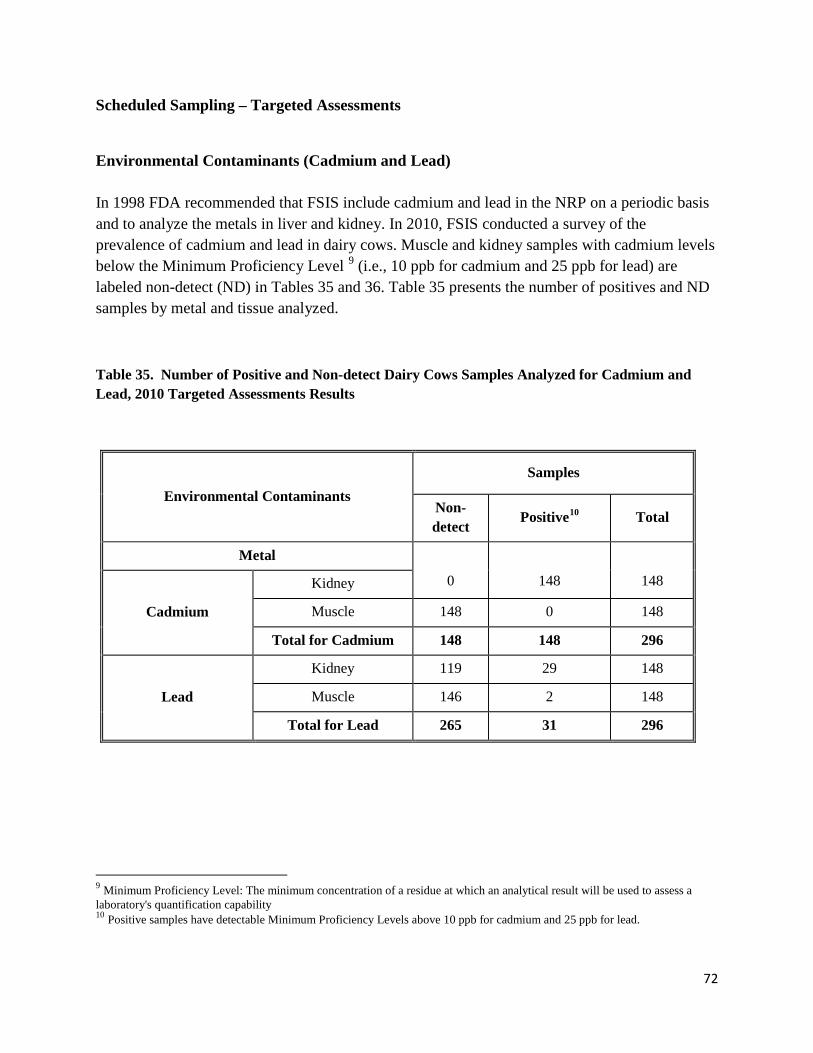
72
Scheduled Sampling – Targeted Assessments
Environmental Contaminants (Cadmium and Lead) In 1998 FDA recommended that FSIS include cadmium and lead in the NRP on a periodic basis and to analyze the metals in liver and kidney. In 2010, FSIS conducted a survey of the prevalence of cadmium and lead in dairy cows. Muscle and kidney samples with cadmium levels below the Minimum Proficiency Level 9 (i.e., 10 ppb for cadmium and 25 ppb for lead) are labeled non-detect (ND) in Tables 35 and 36. Table 35 presents the number of positives and ND samples by metal and tissue analyzed.
Table 35. Number of Positive and Non-detect Dairy Cows Samples Analyzed for Cadmium and Lead, 2010 Targeted Assessments Results
9 Minimum Proficiency Level: The minimum concentration of a residue at which an analytical result will be used to assess a laboratory's quantification capability 10 Positive samples have detectable Minimum Proficiency Levels above 10 ppb for cadmium and 25 ppb for lead.
Environmental Contaminants Samples
Non-detect Positive10 Total
Metal 0
148
148
Cadmium
Kidney
Muscle 148 0 148
Total for Cadmium 148 148 296
Lead
Kidney 119 29 148
Muscle 146 2 148
Total for Lead 265 31 296
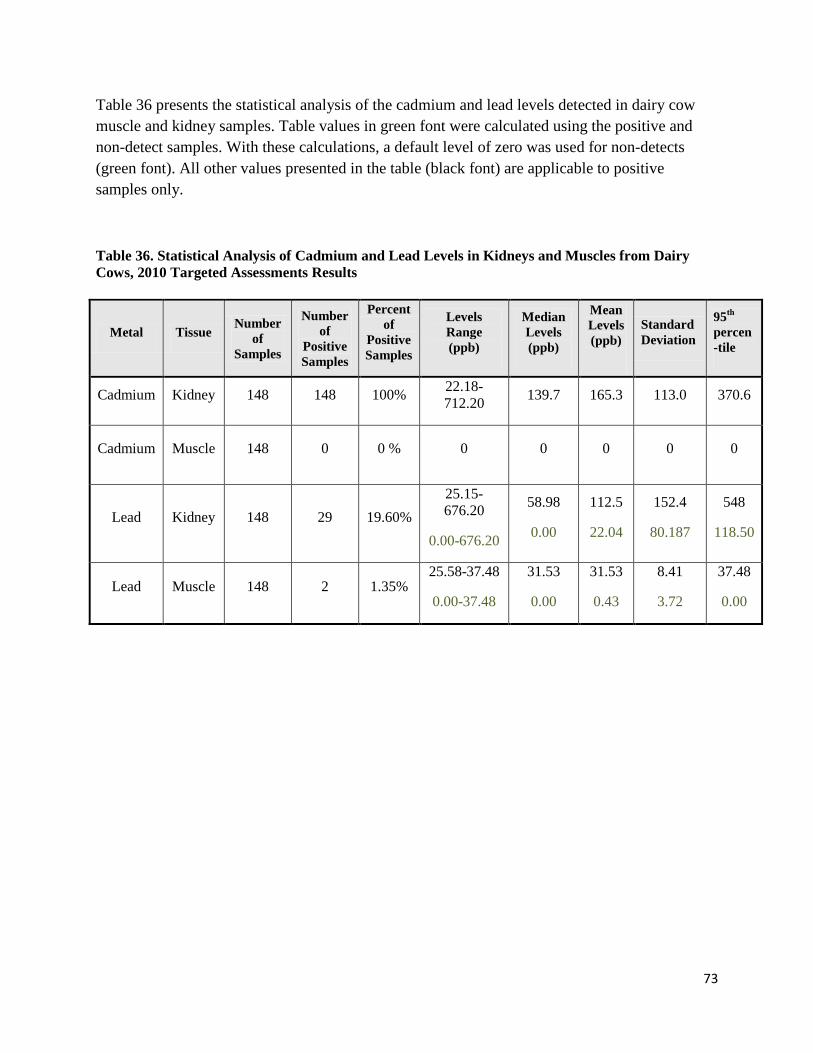
73
Table 36 presents the statistical analysis of the cadmium and lead levels detected in dairy cow muscle and kidney samples. Table values in green font were calculated using the positive and non-detect samples. With these calculations, a default level of zero was used for non-detects (green font). All other values presented in the table (black font) are applicable to positive samples only.
Table 36. Statistical Analysis of Cadmium and Lead Levels in Kidneys and Muscles from Dairy Cows, 2010 Targeted Assessments Results
Metal Tissue Number
of Samples
Number of
Positive Samples
Percent of
Positive Samples
Levels Range (ppb)
Median Levels (ppb)
Mean Levels (ppb)
Standard Deviation
95th percen-tile
Cadmium Kidney 148 148 100% 22.18-712.20 139.7 165.3 113.0 370.6
Cadmium Muscle 148 0 0 % 0 0 0 0 0
Lead Kidney 148 29 19.60% 25.15- 676.20
0.00-676.20
58.98
0.00
112.5
22.04
152.4
80.187
548
118.50
Lead Muscle 148 2 1.35% 25.58-37.48
0.00-37.48
31.53
0.00
31.53
0.43
8.41
3.72
37.48
0.00
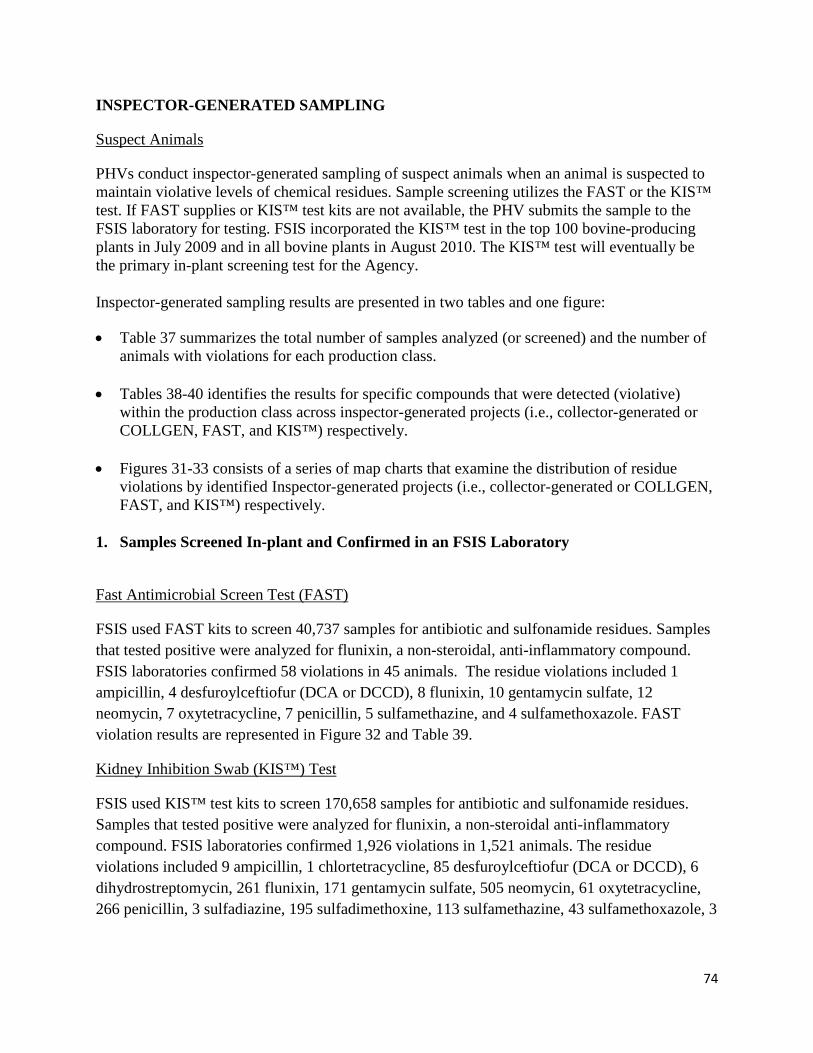
74
INSPECTOR-GENERATED SAMPLING
Suspect Animals
PHVs conduct inspector-generated sampling of suspect animals when an animal is suspected to maintain violative levels of chemical residues. Sample screening utilizes the FAST or the KIS™ test. If FAST supplies or KIS™ test kits are not available, the PHV submits the sample to the FSIS laboratory for testing. FSIS incorporated the KIS™ test in the top 100 bovine-producing plants in July 2009 and in all bovine plants in August 2010. The KIS™ test will eventually be the primary in-plant screening test for the Agency. Inspector-generated sampling results are presented in two tables and one figure:
• Table 37 summarizes the total number of samples analyzed (or screened) and the number of animals with violations for each production class.
• Tables 38-40 identifies the results for specific compounds that were detected (violative) within the production class across inspector-generated projects (i.e., collector-generated or COLLGEN, FAST, and KIS™) respectively.
• Figures 31-33 consists of a series of map charts that examine the distribution of residue violations by identified Inspector-generated projects (i.e., collector-generated or COLLGEN, FAST, and KIS™) respectively.
1. Samples Screened In-plant and Confirmed in an FSIS Laboratory
Fast Antimicrobial Screen Test (FAST)
FSIS used FAST kits to screen 40,737 samples for antibiotic and sulfonamide residues. Samples that tested positive were analyzed for flunixin, a non-steroidal, anti-inflammatory compound. FSIS laboratories confirmed 58 violations in 45 animals. The residue violations included 1 ampicillin, 4 desfuroylceftiofur (DCA or DCCD), 8 flunixin, 10 gentamycin sulfate, 12 neomycin, 7 oxytetracycline, 7 penicillin, 5 sulfamethazine, and 4 sulfamethoxazole. FAST violation results are represented in Figure 32 and Table 39.
Kidney Inhibition Swab (KIS™) Test
FSIS used KIS™ test kits to screen 170,658 samples for antibiotic and sulfonamide residues. Samples that tested positive were analyzed for flunixin, a non-steroidal anti-inflammatory compound. FSIS laboratories confirmed 1,926 violations in 1,521 animals. The residue violations included 9 ampicillin, 1 chlortetracycline, 85 desfuroylceftiofur (DCA or DCCD), 6 dihydrostreptomycin, 261 flunixin, 171 gentamycin sulfate, 505 neomycin, 61 oxytetracycline, 266 penicillin, 3 sulfadiazine, 195 sulfadimethoxine, 113 sulfamethazine, 43 sulfamethoxazole, 3
75
sulfathiazole, 42 tetracycline, 88 tilmicosin, 68 tulathromycin, and 6 tylosin. KIS™ test violations results are represented in Figure 33 and Table 40.
2. Samples Confirmed in an FSIS Laboratory
Collector-Generated (COLLGEN)
FSIS analyzed samples collected from 270 animals for antibiotic and sulfonamide residues. FSIS laboratories confirmed 55 violations in 40 animals. The residues included 3 ampicillin, 1 dihydrostreptomycin, 15 flunixin, 3 gentamycin sulfate, 2 moxidectin, 3 neomycin, 3 oxytetracycline, 6 penicillin, 2 sulfadiazine, 6 sulfadimethoxine, 8 sulfamethazine, 2 tetracycline, and 1 tilmicosin. Collector-generated (COLLGEN) violations results are represented in Figure 31 and Table 38.
Show Animals (SHOW)
Analyses were conducted for antibiotic and sulfonamide residue in 51 animals including 1 beef cow, 1 dairy cow, 1 goat, 2 heifers, 8 lambs, 15 market hogs, and 22 steers. No violations were detected.
State or Government Agency Testing (STATE)
Analyses were conducted for antibiotic and sulfonamide residue in 17 animals. Four violations in three animals were found. The residue included one flunixin, one oxytetracycline, and two penicillin.
Additional inspector-generated sampling results for non-violative positive residue samples are detailed in Tables 41-43. Furthermore, figure 34 consists of a series of pie charts that examine the distribution of residue violations by chemical residue and identified inspector-generated projects (i.e., COLLGEN, FAST, and KIS™) respectively.
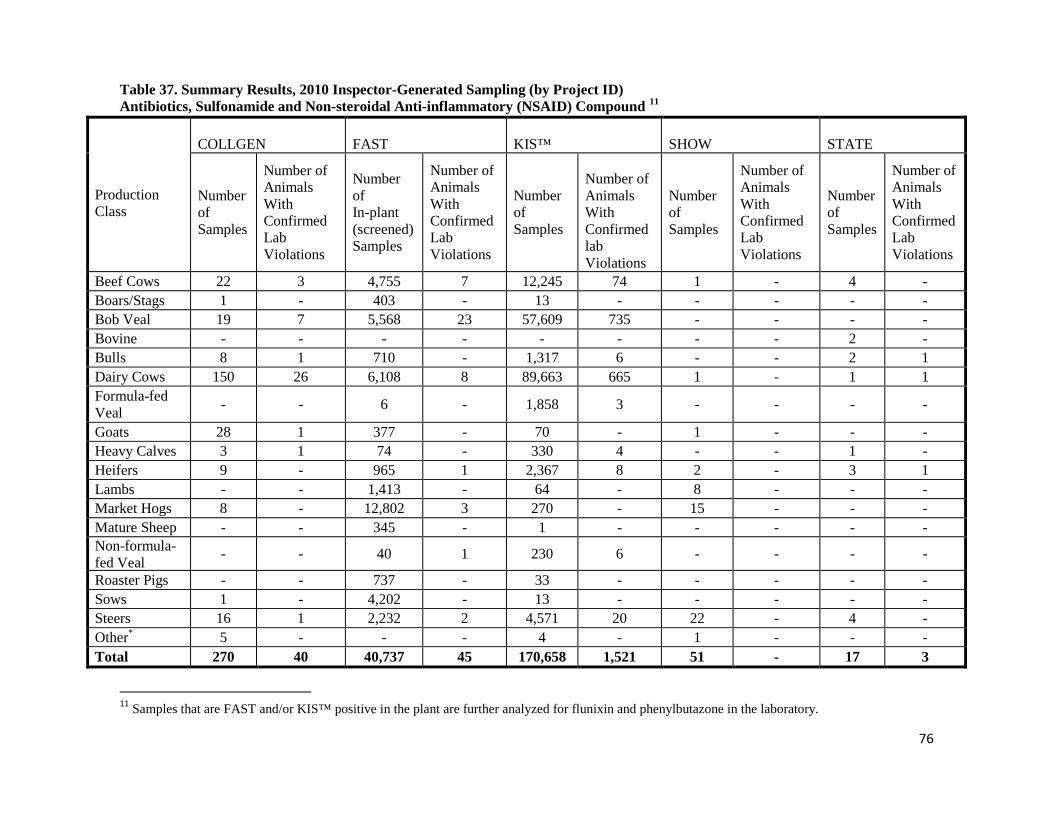
76
Table 37. Summary Results, 2010 Inspector-Generated Sampling (by Project ID) Antibiotics, Sulfonamide and Non-steroidal Anti-inflammatory (NSAID) Compound 11
11 Samples that are FAST and/or KIS™ positive in the plant are further analyzed for flunixin and phenylbutazone in the laboratory.
Production Class
COLLGEN
FAST
KIS™
SHOW
STATE
Number of Samples
Number of Animals With Confirmed Lab Violations
Number of In-plant (screened) Samples
Number of Animals With Confirmed Lab Violations
Number of Samples
Number of Animals With Confirmed lab Violations
Number of Samples
Number of Animals With Confirmed Lab Violations
Number of Samples
Number of Animals With Confirmed Lab Violations
Beef Cows 22 3 4,755 7 12,245 74 1 - 4 - Boars/Stags 1 - 403 - 13 - - - - - Bob Veal 19 7 5,568 23 57,609 735 - - - - Bovine - - - - - - - - 2 - Bulls 8 1 710 - 1,317 6 - - 2 1 Dairy Cows 150 26 6,108 8 89,663 665 1 - 1 1 Formula-fed Veal - - 6 - 1,858 3 - - - -
Goats 28 1 377 - 70 - 1 - - - Heavy Calves 3 1 74 - 330 4 - - 1 - Heifers 9 - 965 1 2,367 8 2 - 3 1 Lambs - - 1,413 - 64 - 8 - - - Market Hogs 8 - 12,802 3 270 - 15 - - - Mature Sheep - - 345 - 1 - - - - - Non-formula-fed Veal - - 40 1 230 6 - - - -
Roaster Pigs - - 737 - 33 - - - - - Sows 1 - 4,202 - 13 - - - - - Steers 16 1 2,232 2 4,571 20 22 - 4 - Other* 5 - - - 4 - 1 - - - Total 270 40 40,737 45 170,658 1,521 51 - 17 3
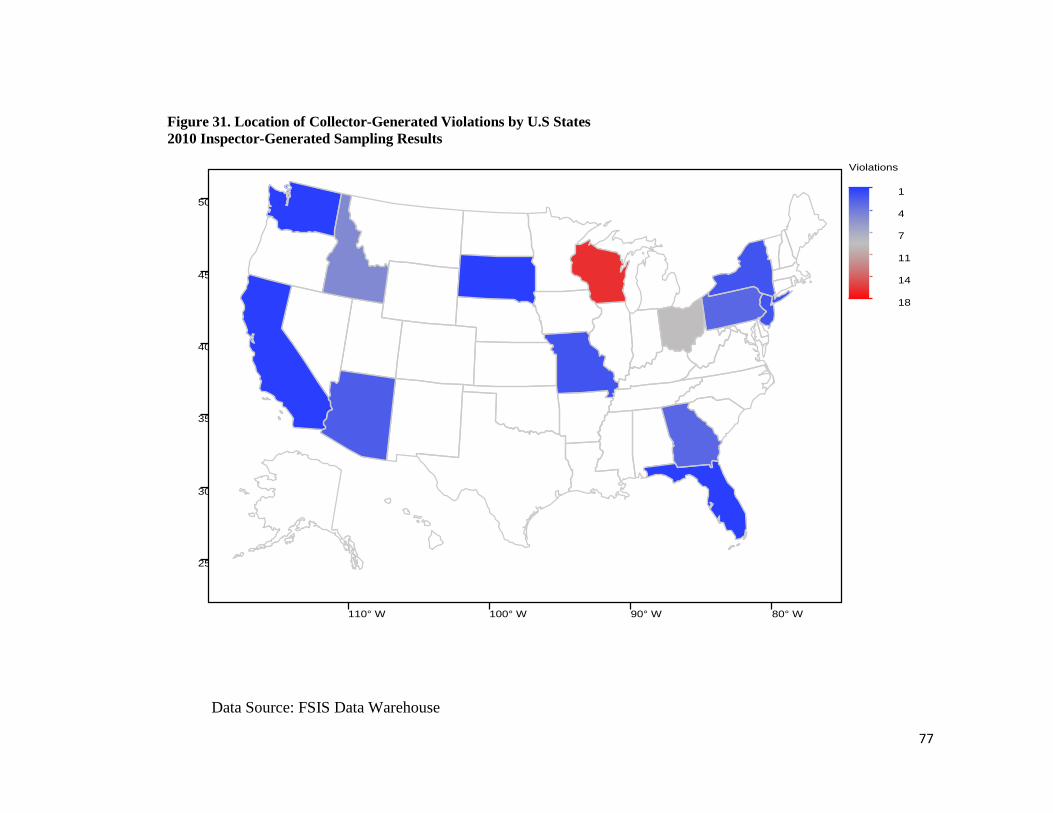
77
Figure 31. Location of Collector-Generated Violations by U.S States 2010 Inspector-Generated Sampling Results
25
30
35
40
45
50
110° W 100° W 90° W 80° W
Violations
1
4
7
11
14
18
Data Source: FSIS Data Warehouse
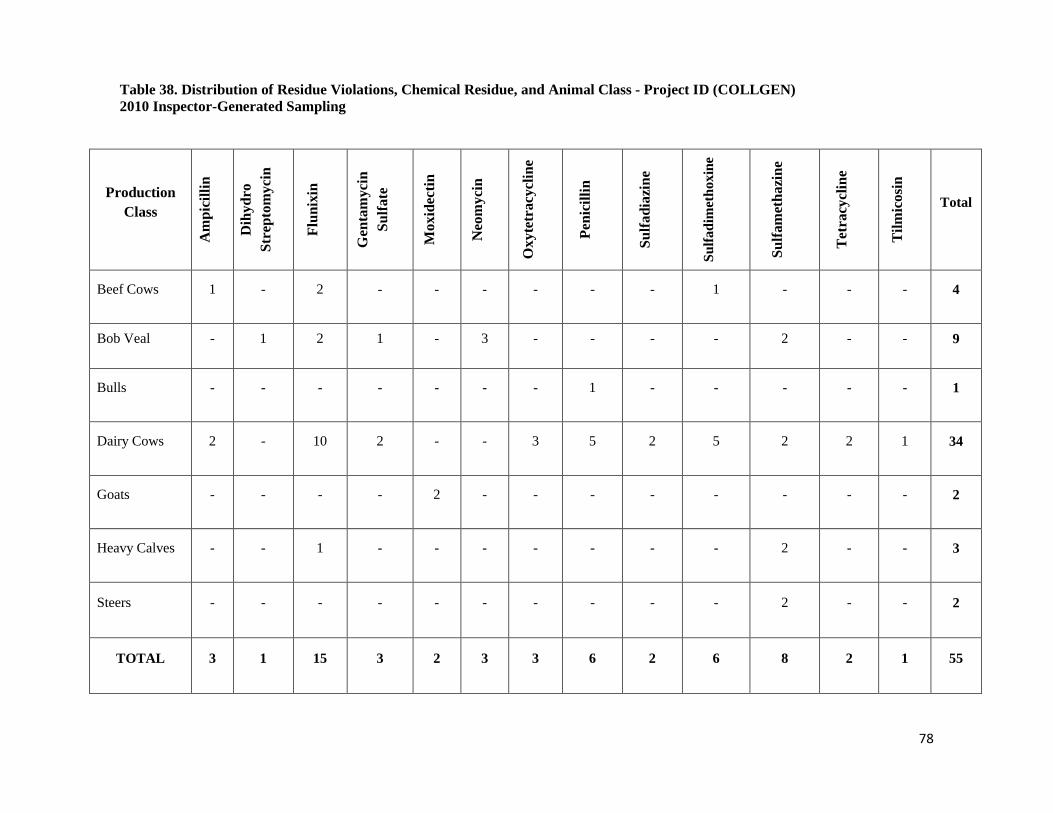
78
Table 38. Distribution of Residue Violations, Chemical Residue, and Animal Class - Project ID (COLLGEN) 2010 Inspector-Generated Sampling
Production Class
Am
pici
llin
Dih
ydro
St
rept
omyc
in
Flun
ixin
Gen
tam
ycin
Su
lfate
Mox
idec
tin
Neo
myc
in
Oxy
tetr
acyc
line
Peni
cilli
n
Sulfa
diaz
ine
Sulfa
dim
etho
xine
Sulfa
met
hazi
ne
Tetr
acyc
line
Tilm
icos
in
Total
Beef Cows 1 - 2 - - - - - - 1 - - - 4
Bob Veal - 1 2 1 - 3 - - - - 2 - - 9
Bulls - - - - - - - 1 - - - - - 1
Dairy Cows 2 - 10 2 - - 3 5 2 5 2 2 1 34
Goats - - - - 2 - - - - - - - - 2
Heavy Calves - - 1 - - - - - - - 2 - - 3
Steers - - - - - - - - - - 2 - - 2
TOTAL 3 1 15 3 2 3 3 6 2 6 8 2 1 55

79
Figure 32. Location of FAST Violations by U.S. States 2010 Inspector-Generated Sampling Results
25
30
35
40
45
50
110° W 100° W 90° W 80° W
Violations
1
5
8
12
16
20
Data Source: FSIS Data Warehouse
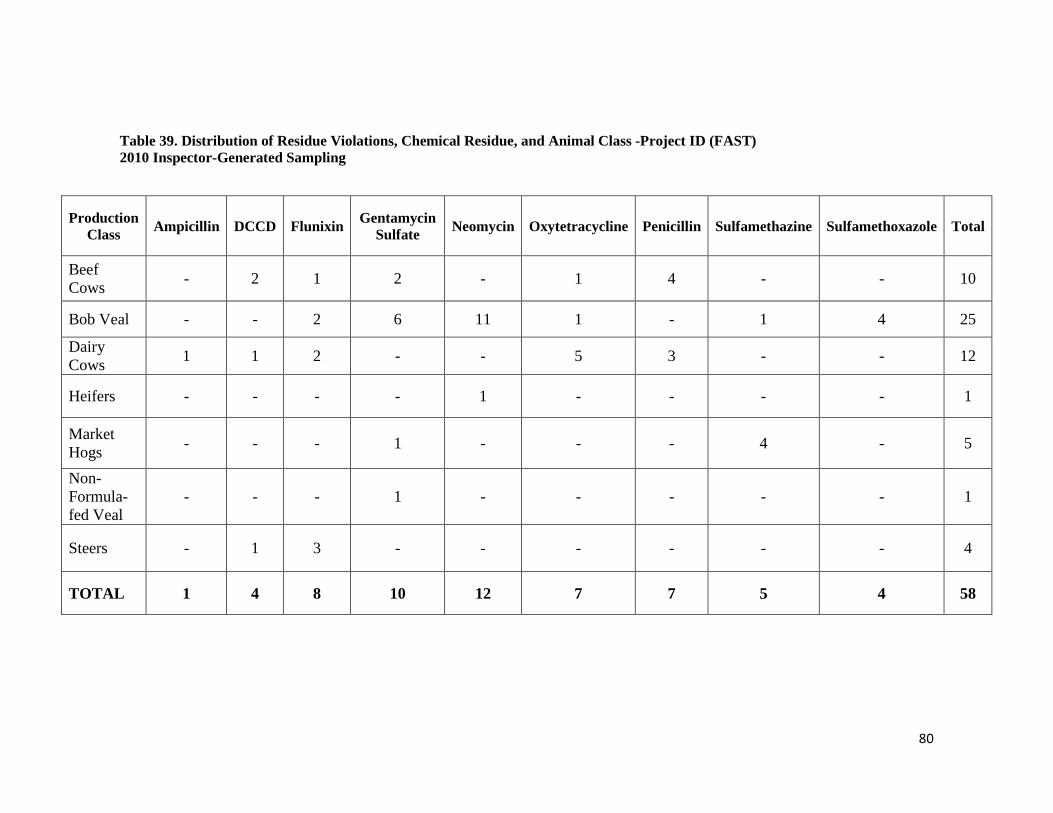
80
Table 39. Distribution of Residue Violations, Chemical Residue, and Animal Class -Project ID (FAST) 2010 Inspector-Generated Sampling
Production Class Ampicillin DCCD Flunixin Gentamycin
Sulfate Neomycin Oxytetracycline Penicillin Sulfamethazine Sulfamethoxazole Total
Beef Cows - 2 1 2 - 1 4 - - 10
Bob Veal - - 2 6 11 1 - 1 4 25
Dairy Cows 1 1 2 - - 5 3 - - 12
Heifers - - - - 1 - - - - 1
Market Hogs - - - 1 - - - 4 - 5
Non-Formula-fed Veal
- - - 1 - - - - - 1
Steers - 1 3 - - - - - - 4
TOTAL 1 4 8 10 12 7 7 5 4 58
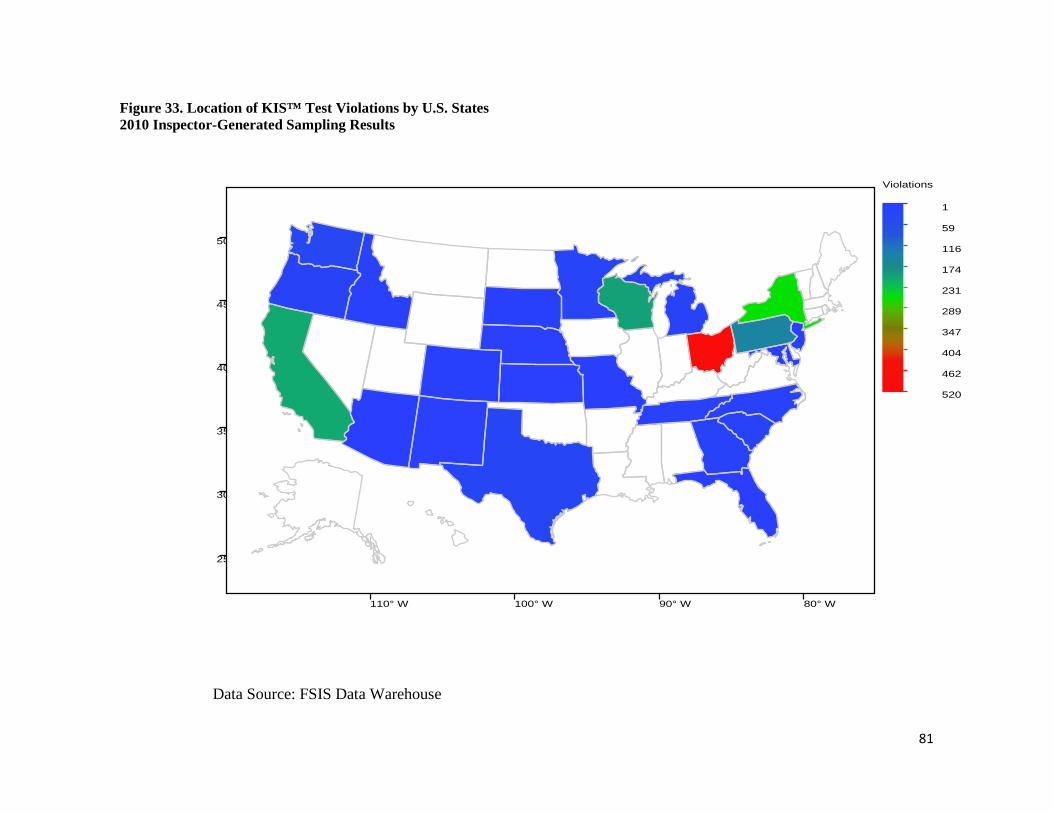
81
Figure 33. Location of KIS™ Test Violations by U.S. States 2010 Inspector-Generated Sampling Results
25
30
35
40
45
50
110° W 100° W 90° W 80° W
Violations
1
59
116
174
231
289
347
404
462
520
Data Source: FSIS Data Warehouse
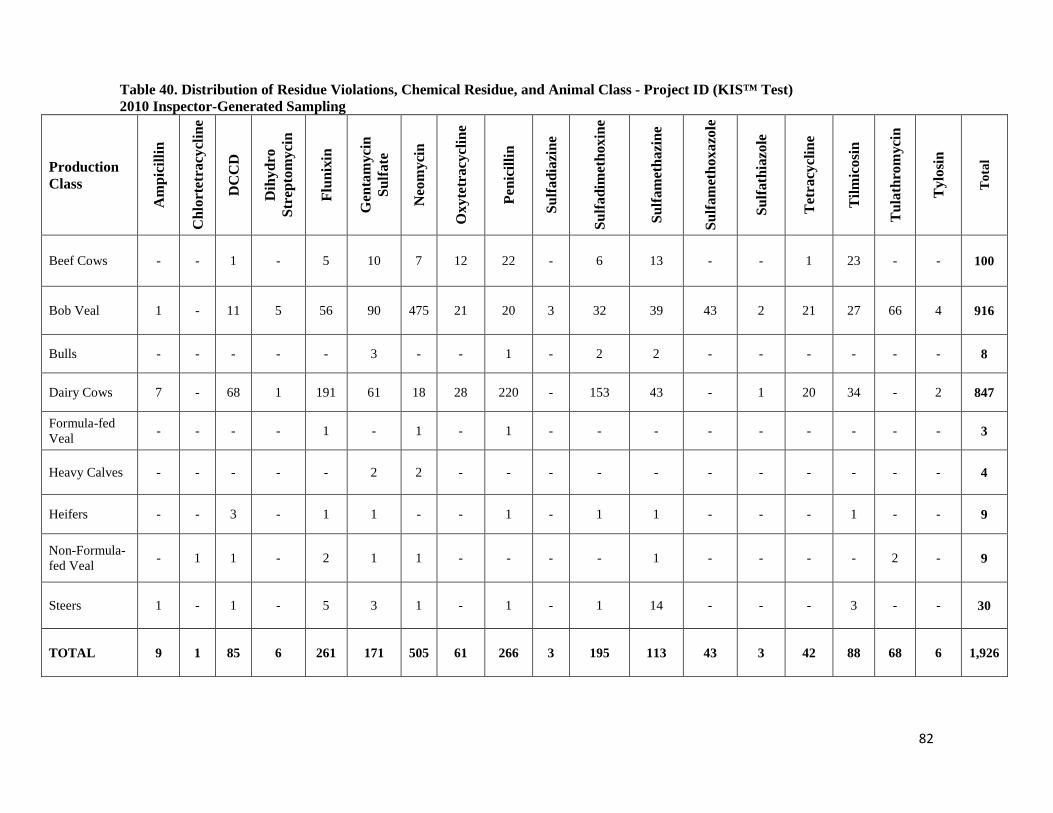
82
Table 40. Distribution of Residue Violations, Chemical Residue, and Animal Class - Project ID (KIS™ Test) 2010 Inspector-Generated Sampling
Production Class
Am
pici
llin
Chl
orte
trac
yclin
e
DC
CD
Dih
ydro
St
rept
omyc
in
Flun
ixin
Gen
tam
ycin
Su
lfate
Neo
myc
in
Oxy
tetr
acyc
line
Peni
cilli
n
Sulfa
diaz
ine
Sulfa
dim
etho
xine
Sulfa
met
hazi
ne
Sulfa
met
hoxa
zole
Sulfa
thia
zole
Tetr
acyc
line
Tilm
icos
in
Tula
thro
myc
in
Tylo
sin
Tota
l
Beef Cows - - 1 - 5 10 7 12 22 - 6 13 - - 1 23 - - 100
Bob Veal 1 - 11 5 56 90 475 21 20 3 32 39 43 2 21 27 66 4 916
Bulls - - - - - 3 - - 1 - 2 2 - - - - - - 8
Dairy Cows 7 - 68 1 191 61 18 28 220 - 153 43 - 1 20 34 - 2 847
Formula-fed Veal - - - - 1 - 1 - 1 - - - - - - - - - 3
Heavy Calves - - - - - 2 2 - - - - - - - - - - - 4
Heifers - - 3 - 1 1 - - 1 - 1 1 - - - 1 - - 9
Non-Formula-fed Veal - 1 1 - 2 1 1 - - - - 1 - - - - 2 - 9
Steers 1 - 1 - 5 3 1 - 1 - 1 14 - - - 3 - - 30
TOTAL 9 1 85 6 261 171 505 61 266 3 195 113 43 3 42 88 68 6 1,926
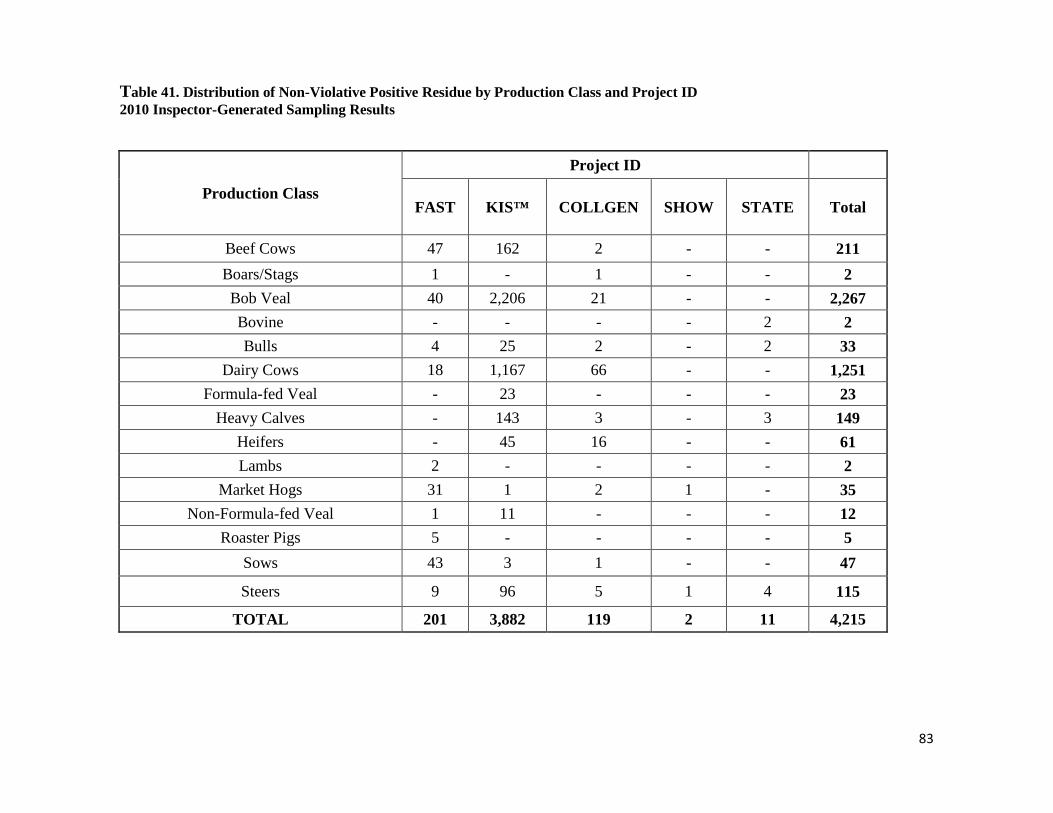
83
Table 41. Distribution of Non-Violative Positive Residue by Production Class and Project ID 2010 Inspector-Generated Sampling Results
Production Class
Project ID
FAST KIS™ COLLGEN SHOW STATE
Total
Beef Cows 47 162 2 - - 211 Boars/Stags 1 - 1 - - 2 Bob Veal 40 2,206 21 - - 2,267 Bovine - - - - 2 2 Bulls 4 25 2 - 2 33
Dairy Cows 18 1,167 66 - - 1,251 Formula-fed Veal - 23 - - - 23
Heavy Calves - 143 3 - 3 149 Heifers - 45 16 - - 61 Lambs 2 - - - - 2
Market Hogs 31 1 2 1 - 35 Non-Formula-fed Veal 1 11 - - - 12
Roaster Pigs 5 - - - - 5 Sows 43 3 1 - - 47
Steers 9 96 5 1 4 115
TOTAL 201 3,882 119 2 11 4,215
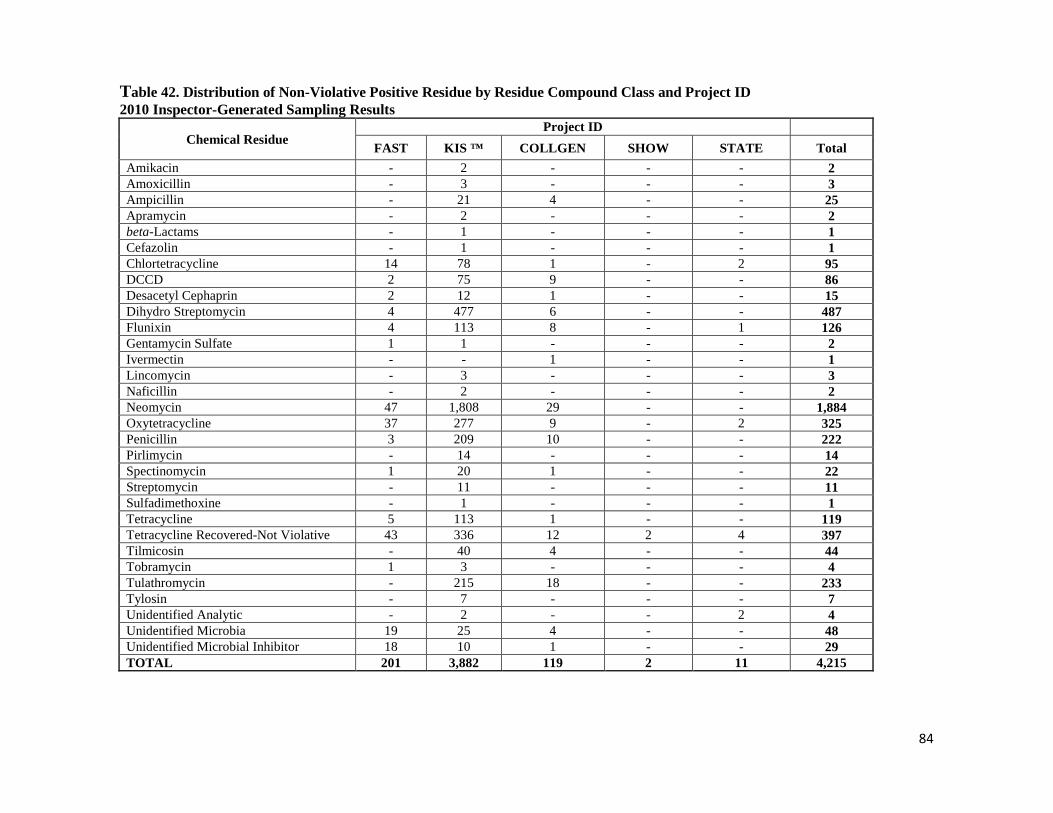
84
Table 42. Distribution of Non-Violative Positive Residue by Residue Compound Class and Project ID 2010 Inspector-Generated Sampling Results
Chemical Residue Project ID
FAST KIS ™ COLLGEN SHOW STATE Total Amikacin - 2 - - - 2 Amoxicillin - 3 - - - 3 Ampicillin - 21 4 - - 25 Apramycin - 2 - - - 2 beta-Lactams - 1 - - - 1 Cefazolin - 1 - - - 1 Chlortetracycline 14 78 1 - 2 95 DCCD 2 75 9 - - 86 Desacetyl Cephaprin 2 12 1 - - 15 Dihydro Streptomycin 4 477 6 - - 487 Flunixin 4 113 8 - 1 126 Gentamycin Sulfate 1 1 - - - 2 Ivermectin - - 1 - - 1 Lincomycin - 3 - - - 3 Naficillin - 2 - - - 2 Neomycin 47 1,808 29 - - 1,884 Oxytetracycline 37 277 9 - 2 325 Penicillin 3 209 10 - - 222 Pirlimycin - 14 - - - 14 Spectinomycin 1 20 1 - - 22 Streptomycin - 11 - - - 11 Sulfadimethoxine - 1 - - - 1 Tetracycline 5 113 1 - - 119 Tetracycline Recovered-Not Violative 43 336 12 2 4 397 Tilmicosin - 40 4 - - 44 Tobramycin 1 3 - - - 4 Tulathromycin - 215 18 - - 233 Tylosin - 7 - - - 7 Unidentified Analytic - 2 - - 2 4 Unidentified Microbia 19 25 4 - - 48 Unidentified Microbial Inhibitor 18 10 1 - - 29 TOTAL 201 3,882 119 2 11 4,215
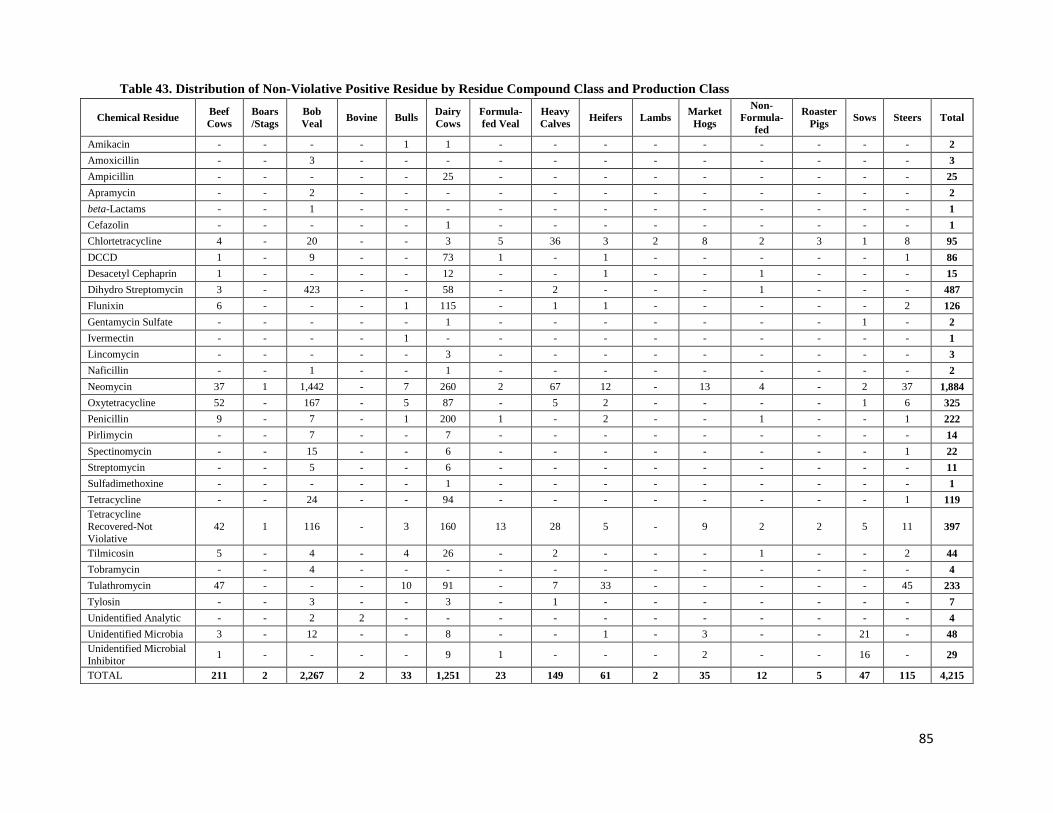
85
Table 43. Distribution of Non-Violative Positive Residue by Residue Compound Class and Production Class
Chemical Residue Beef Cows
Boars/Stags
Bob Veal Bovine Bulls Dairy
Cows Formula-fed Veal
Heavy Calves Heifers Lambs Market
Hogs
Non-Formula-
fed
Roaster Pigs Sows Steers Total
Amikacin - - - - 1 1 - - - - - - - - - 2 Amoxicillin - - 3 - - - - - - - - - - - - 3 Ampicillin - - - - - 25 - - - - - - - - - 25 Apramycin - - 2 - - - - - - - - - - - - 2 beta-Lactams - - 1 - - - - - - - - - - - - 1 Cefazolin - - - - - 1 - - - - - - - - - 1 Chlortetracycline 4 - 20 - - 3 5 36 3 2 8 2 3 1 8 95 DCCD 1 - 9 - - 73 1 - 1 - - - - - 1 86 Desacetyl Cephaprin 1 - - - - 12 - - 1 - - 1 - - - 15 Dihydro Streptomycin 3 - 423 - - 58 - 2 - - - 1 - - - 487 Flunixin 6 - - - 1 115 - 1 1 - - - - - 2 126 Gentamycin Sulfate - - - - - 1 - - - - - - - 1 - 2 Ivermectin - - - - 1 - - - - - - - - - - 1 Lincomycin - - - - - 3 - - - - - - - - - 3 Naficillin - - 1 - - 1 - - - - - - - - - 2 Neomycin 37 1 1,442 - 7 260 2 67 12 - 13 4 - 2 37 1,884 Oxytetracycline 52 - 167 - 5 87 - 5 2 - - - - 1 6 325 Penicillin 9 - 7 - 1 200 1 - 2 - - 1 - - 1 222 Pirlimycin - - 7 - - 7 - - - - - - - - - 14 Spectinomycin - - 15 - - 6 - - - - - - - - 1 22 Streptomycin - - 5 - - 6 - - - - - - - - - 11 Sulfadimethoxine - - - - - 1 - - - - - - - - - 1 Tetracycline - - 24 - - 94 - - - - - - - - 1 119 Tetracycline Recovered-Not Violative
42 1 116 - 3 160 13 28 5 - 9 2 2 5 11 397
Tilmicosin 5 - 4 - 4 26 - 2 - - - 1 - - 2 44 Tobramycin - - 4 - - - - - - - - - - - - 4 Tulathromycin 47 - - - 10 91 - 7 33 - - - - - 45 233 Tylosin - - 3 - - 3 - 1 - - - - - - - 7 Unidentified Analytic - - 2 2 - - - - - - - - - - - 4 Unidentified Microbia 3 - 12 - - 8 - - 1 - 3 - - 21 - 48 Unidentified Microbial Inhibitor 1 - - - - 9 1 - - - 2 - - 16 - 29
TOTAL 211 2 2,267 2 33 1,251 23 149 61 2 35 12 5 47 115 4,215
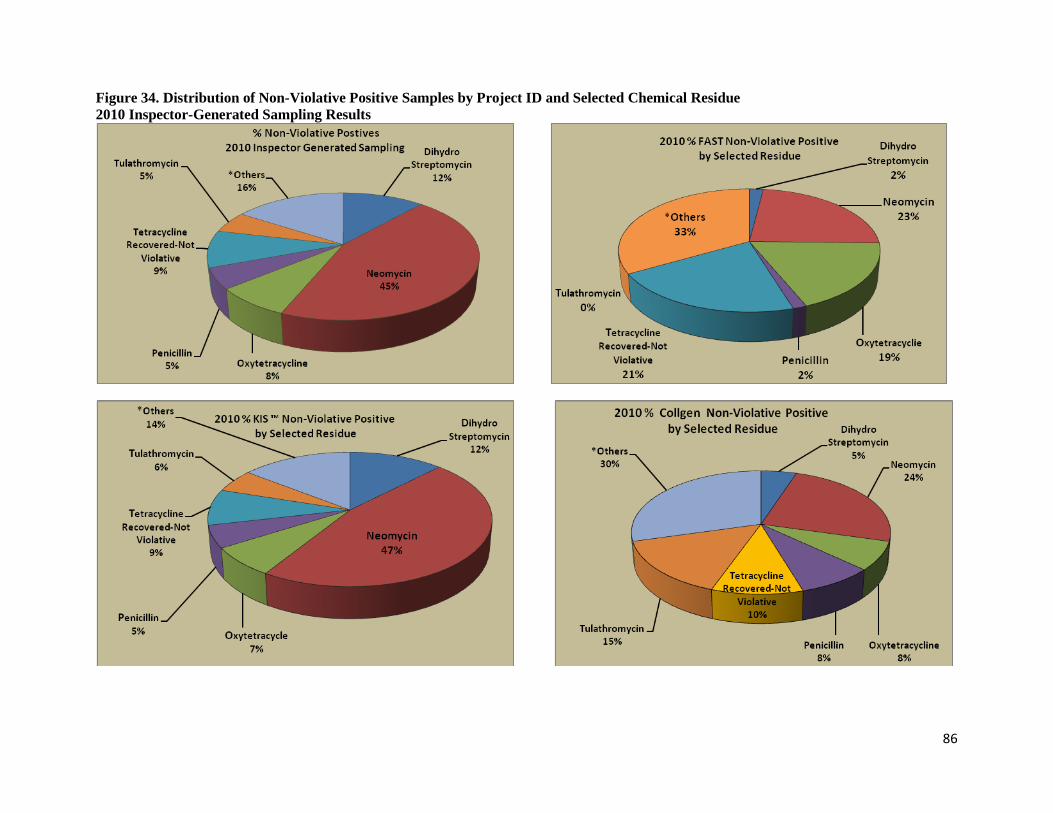
86
Figure 34. Distribution of Non-Violative Positive Samples by Project ID and Selected Chemical Residue 2010 Inspector-Generated Sampling Results
87
INSPECTOR-GENERATED SAMPLING
Suspect Populations
FSIS tested suspect populations in bob veal for antibiotics, sulfonamides, and beta-Agonists.
FAST results for Bob Veal
FSIS field personnel used the FAST test to screen 5,568 samples from bob veal calves for antibiotics and sulfonamides. Of the animals tested, FSIS laboratories confirmed 25 violations in 23 animals. The residue violations consisted of 2 flunixin, 6 gentamycin sulfate, 11 neomycin, 1 oxytetracycline, 1 sulfadiazine, and 4 sulfamethoxazole.
KIS™ test results for Bob Veal
FSIS field personnel used KIS™ tests to screen 57,609 samples from bob veal calves for antibiotics and sulfonamides. Of the animals tested, FSIS laboratories confirmed 916 violations in 735 animals. The residue violations consisted of 1 ampicillin, 11 desfuroylceftiofur (DCA or DCCD), 5 dihydrostreptomycin, 56 flunixin, 90 gentamycin sulfate, 475 neomycin, 21 oxytetracycline, 20 penicillin, 3 sulfadiazine, 32 sulfadimethoxine, 39 sulfamethazine, 43 sulfamethoxazole, 2 sulfathiazole, 21 tetracycline, 27 tilmicosin, 66 tulathromycin, and 4 tylosin.
Show Animals
FSIS laboratories conducted analyses for antibiotics and sulfonamides on two lambs, one market hog, and eight steers. No violations were found.
FSIS laboratories conducted analyses for clenbuterol, salbutamol, ractopamine, and cimaterol (beta-Agonists) on 1 beef cow, 1 dairy cow, 1 goat, 2 heifers, 6 lambs, 14 market hogs, and 15 steers. No violations were found.
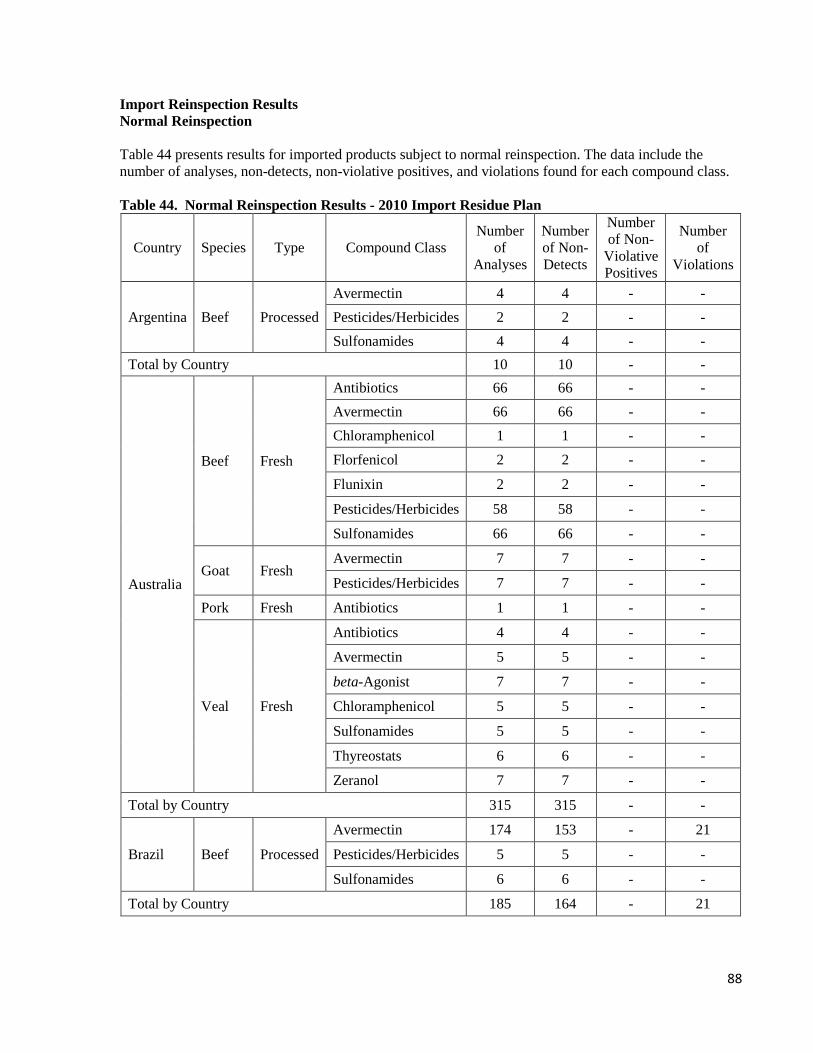
88
Import Reinspection Results Normal Reinspection Table 44 presents results for imported products subject to normal reinspection. The data include the number of analyses, non-detects, non-violative positives, and violations found for each compound class. Table 44. Normal Reinspection Results - 2010 Import Residue Plan
Country Species Type Compound Class Number
of Analyses
Number of Non-Detects
Number of Non-
Violative Positives
Number of
Violations
Argentina Beef Processed Avermectin 4 4 - - Pesticides/Herbicides 2 2 - - Sulfonamides 4 4 - -
Total by Country 10 10 - -
Australia
Beef Fresh
Antibiotics 66 66 - - Avermectin 66 66 - - Chloramphenicol 1 1 - - Florfenicol 2 2 - -
Flunixin 2 2 - -
Pesticides/Herbicides 58 58 - -
Sulfonamides 66 66 - -
Goat Fresh Avermectin 7 7 - -
Pesticides/Herbicides 7 7 - -
Pork Fresh Antibiotics 1 1 - -
Veal Fresh
Antibiotics 4 4 - -
Avermectin 5 5 - -
beta-Agonist 7 7 - -
Chloramphenicol 5 5 - -
Sulfonamides 5 5 - -
Thyreostats 6 6 - -
Zeranol 7 7 - -
Total by Country 315 315 - -
Brazil Beef Processed
Avermectin 174 153 - 21
Pesticides/Herbicides 5 5 - -
Sulfonamides 6 6 - -
Total by Country 185 164 - 21
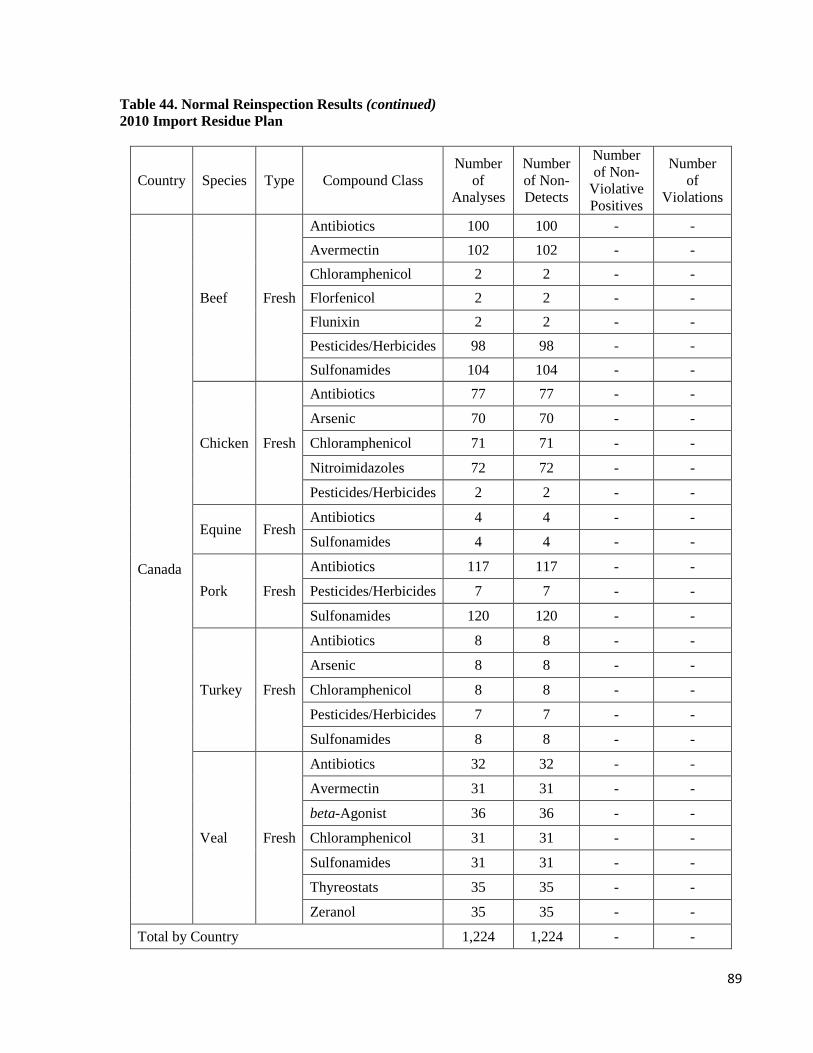
89
Table 44. Normal Reinspection Results (continued) 2010 Import Residue Plan
Country Species Type Compound Class Number
of Analyses
Number of Non-Detects
Number of Non-
Violative Positives
Number of
Violations
Canada
Beef Fresh
Antibiotics 100 100 - - Avermectin 102 102 - - Chloramphenicol 2 2 - - Florfenicol 2 2 - - Flunixin 2 2 - - Pesticides/Herbicides 98 98 - - Sulfonamides 104 104 - -
Chicken Fresh
Antibiotics 77 77 - -
Arsenic 70 70 - -
Chloramphenicol 71 71 - -
Nitroimidazoles 72 72 - -
Pesticides/Herbicides 2 2 - -
Equine Fresh Antibiotics 4 4 - -
Sulfonamides 4 4 - -
Pork Fresh
Antibiotics 117 117 - -
Pesticides/Herbicides 7 7 - -
Sulfonamides 120 120 - -
Turkey Fresh
Antibiotics 8 8 - -
Arsenic 8 8 - -
Chloramphenicol 8 8 - -
Pesticides/Herbicides 7 7 - -
Sulfonamides 8 8 - -
Veal Fresh
Antibiotics 32 32 - -
Avermectin 31 31 - -
beta-Agonist 36 36 - -
Chloramphenicol 31 31 - -
Sulfonamides 31 31 - -
Thyreostats 35 35 - -
Zeranol 35 35 - -
Total by Country 1,224 1,224 - -
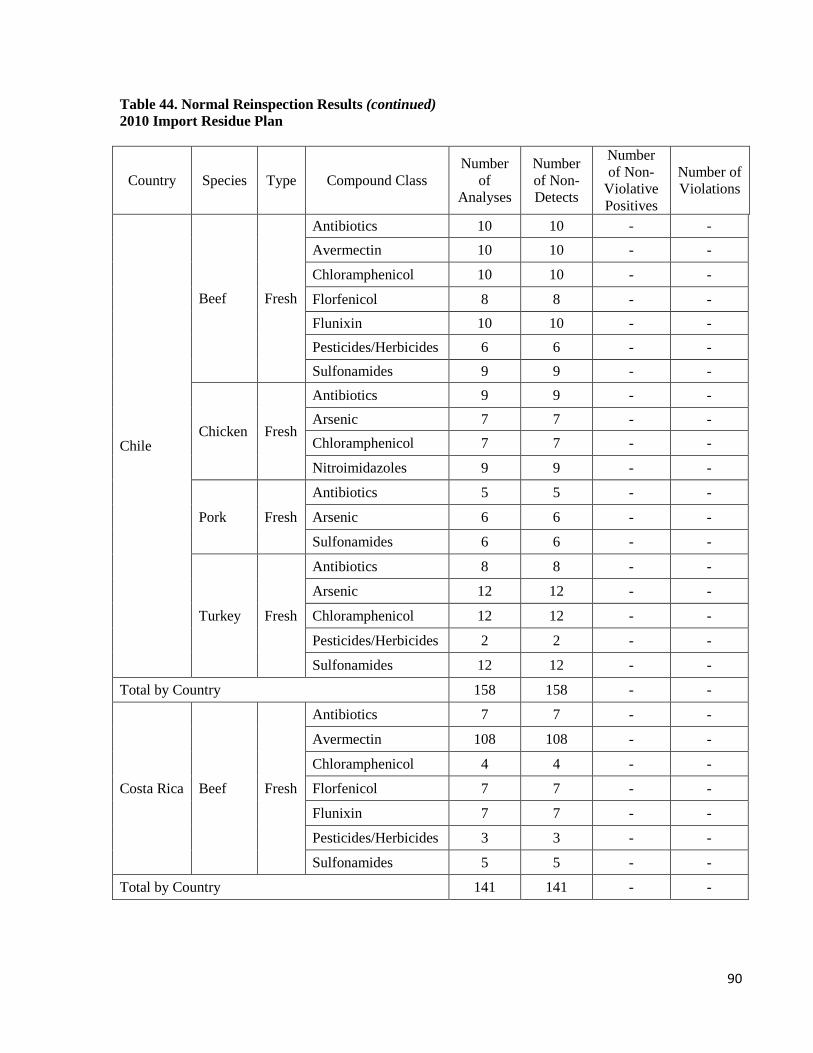
90
Table 44. Normal Reinspection Results (continued) 2010 Import Residue Plan
Country Species Type Compound Class Number
of Analyses
Number of Non-Detects
Number of Non-
Violative Positives
Number of Violations
Chile
Beef Fresh
Antibiotics 10 10 - - Avermectin 10 10 - -
Chloramphenicol 10 10 - -
Florfenicol 8 8 - - Flunixin 10 10 - - Pesticides/Herbicides 6 6 - - Sulfonamides 9 9 - -
Chicken Fresh
Antibiotics 9 9 - - Arsenic 7 7 - - Chloramphenicol 7 7 - -
Nitroimidazoles 9 9 - -
Pork Fresh
Antibiotics 5 5 - -
Arsenic 6 6 - -
Sulfonamides 6 6 - -
Turkey Fresh
Antibiotics 8 8 - -
Arsenic 12 12 - -
Chloramphenicol 12 12 - -
Pesticides/Herbicides 2 2 - -
Sulfonamides 12 12 - -
Total by Country 158 158 - -
Costa Rica Beef Fresh
Antibiotics 7 7 - -
Avermectin 108 108 - -
Chloramphenicol 4 4 - -
Florfenicol 7 7 - -
Flunixin 7 7 - -
Pesticides/Herbicides 3 3 - -
Sulfonamides 5 5 - -
Total by Country 141 141 - -
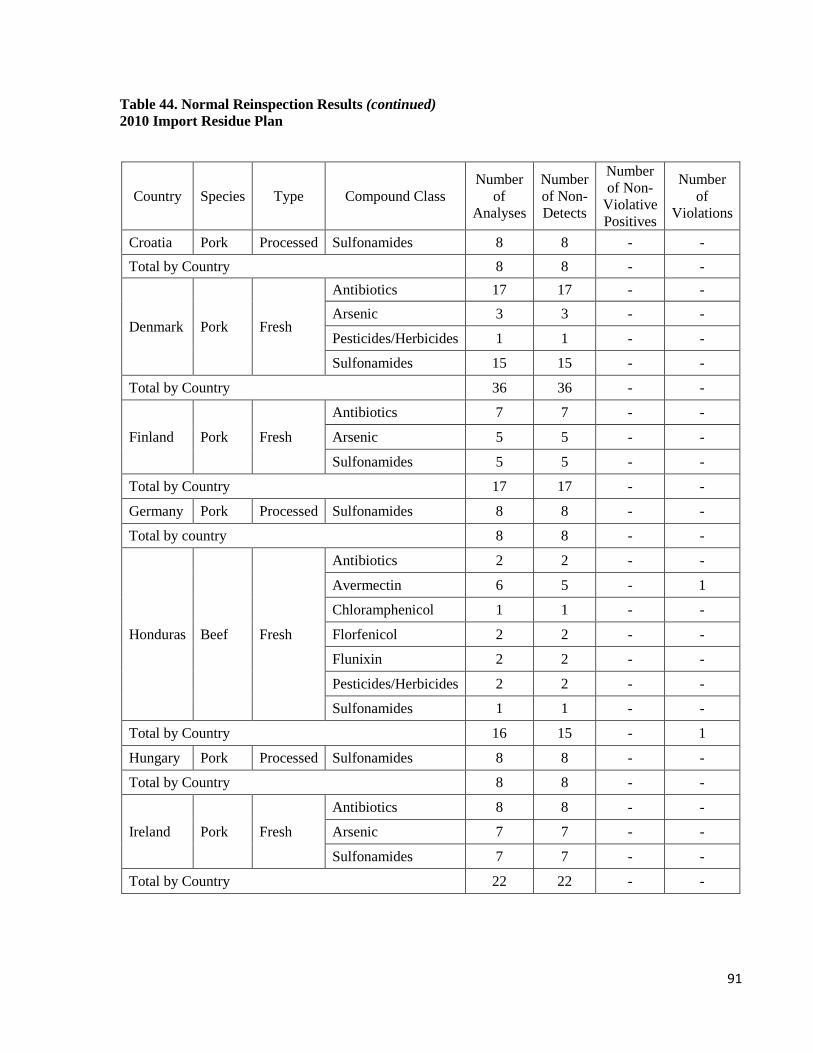
91
Table 44. Normal Reinspection Results (continued) 2010 Import Residue Plan
Country Species Type Compound Class Number
of Analyses
Number of Non-Detects
Number of Non-
Violative Positives
Number of
Violations
Croatia Pork Processed Sulfonamides 8 8 - - Total by Country 8 8 - -
Denmark Pork Fresh
Antibiotics 17 17 - - Arsenic 3 3 - -
Pesticides/Herbicides 1 1 - -
Sulfonamides 15 15 - -
Total by Country 36 36 - -
Finland Pork Fresh
Antibiotics 7 7 - -
Arsenic 5 5 - -
Sulfonamides 5 5 - -
Total by Country 17 17 - -
Germany Pork Processed Sulfonamides 8 8 - -
Total by country 8 8 - -
Honduras Beef Fresh
Antibiotics 2 2 - -
Avermectin 6 5 - 1
Chloramphenicol 1 1 - -
Florfenicol 2 2 - -
Flunixin 2 2 - -
Pesticides/Herbicides 2 2 - -
Sulfonamides 1 1 - -
Total by Country 16 15 - 1
Hungary Pork Processed Sulfonamides 8 8 - -
Total by Country 8 8 - -
Ireland Pork Fresh
Antibiotics 8 8 - -
Arsenic 7 7 - -
Sulfonamides 7 7 - -
Total by Country 22 22 - -
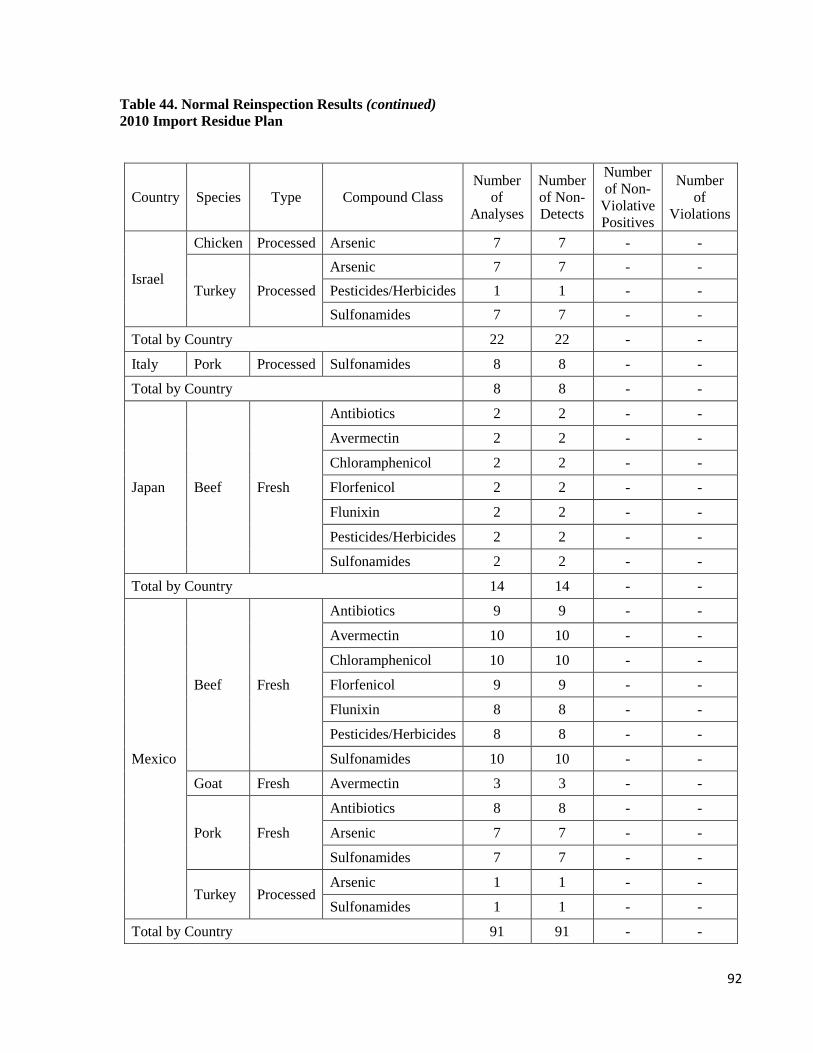
92
Table 44. Normal Reinspection Results (continued) 2010 Import Residue Plan
Country Species Type Compound Class Number
of Analyses
Number of Non-Detects
Number of Non-
Violative Positives
Number of
Violations
Israel
Chicken Processed Arsenic 7 7 - -
Turkey Processed Arsenic 7 7 - - Pesticides/Herbicides 1 1 - - Sulfonamides 7 7 - -
Total by Country 22 22 - -
Italy Pork Processed Sulfonamides 8 8 - -
Total by Country 8 8 - -
Japan Beef Fresh
Antibiotics 2 2 - -
Avermectin 2 2 - -
Chloramphenicol 2 2 - -
Florfenicol 2 2 - -
Flunixin 2 2 - -
Pesticides/Herbicides 2 2 - -
Sulfonamides 2 2 - -
Total by Country 14 14 - -
Mexico
Beef Fresh
Antibiotics 9 9 - -
Avermectin 10 10 - -
Chloramphenicol 10 10 - -
Florfenicol 9 9 - -
Flunixin 8 8 - -
Pesticides/Herbicides 8 8 - -
Sulfonamides 10 10 - -
Goat Fresh Avermectin 3 3 - -
Pork Fresh
Antibiotics 8 8 - -
Arsenic 7 7 - -
Sulfonamides 7 7 - -
Turkey Processed Arsenic 1 1 - -
Sulfonamides 1 1 - -
Total by Country 91 91 - -
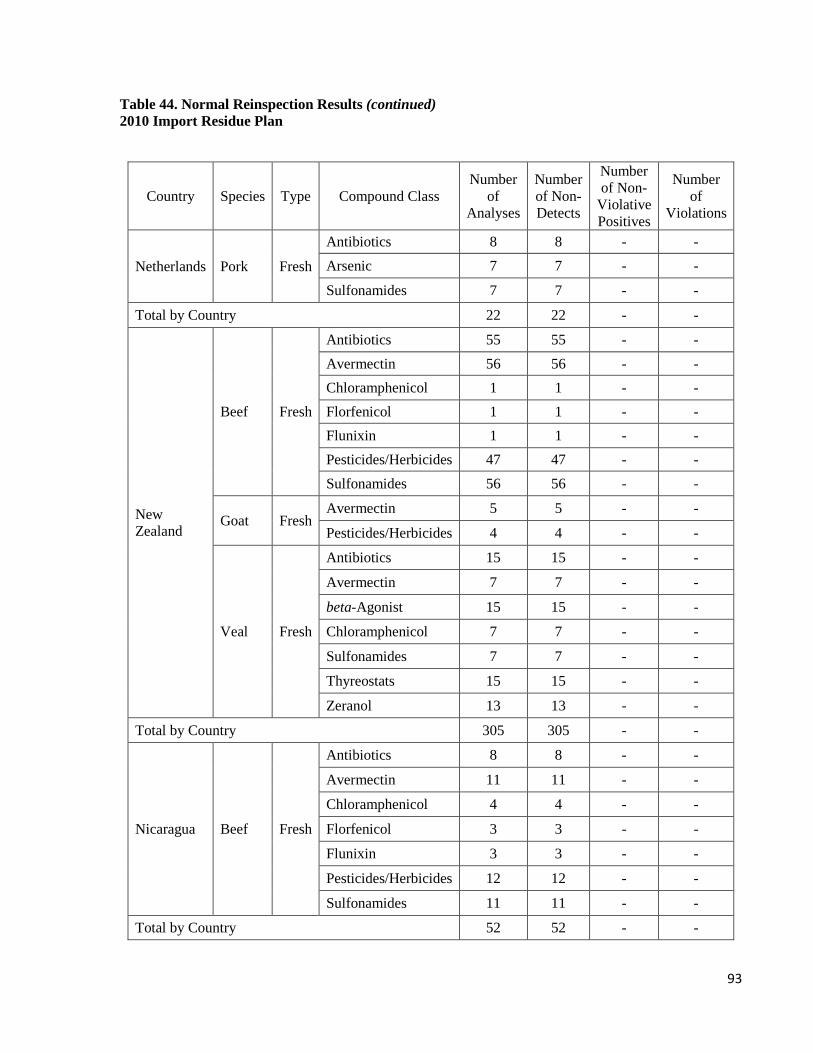
93
Table 44. Normal Reinspection Results (continued) 2010 Import Residue Plan
Country Species Type Compound Class Number
of Analyses
Number of Non-Detects
Number of Non-
Violative Positives
Number of
Violations
Netherlands Pork Fresh
Antibiotics 8 8 - - Arsenic 7 7 - -
Sulfonamides 7 7 - -
Total by Country 22 22 - -
New Zealand
Beef Fresh
Antibiotics 55 55 - - Avermectin 56 56 - - Chloramphenicol 1 1 - - Florfenicol 1 1 - - Flunixin 1 1 - - Pesticides/Herbicides 47 47 - - Sulfonamides 56 56 - -
Goat Fresh Avermectin 5 5 - -
Pesticides/Herbicides 4 4 - -
Veal Fresh
Antibiotics 15 15 - -
Avermectin 7 7 - -
beta-Agonist 15 15 - -
Chloramphenicol 7 7 - -
Sulfonamides 7 7 - -
Thyreostats 15 15 - -
Zeranol 13 13 - -
Total by Country 305 305 - -
Nicaragua Beef Fresh
Antibiotics 8 8 - -
Avermectin 11 11 - -
Chloramphenicol 4 4 - -
Florfenicol 3 3 - -
Flunixin 3 3 - -
Pesticides/Herbicides 12 12 - -
Sulfonamides 11 11 - -
Total by Country 52 52 - -
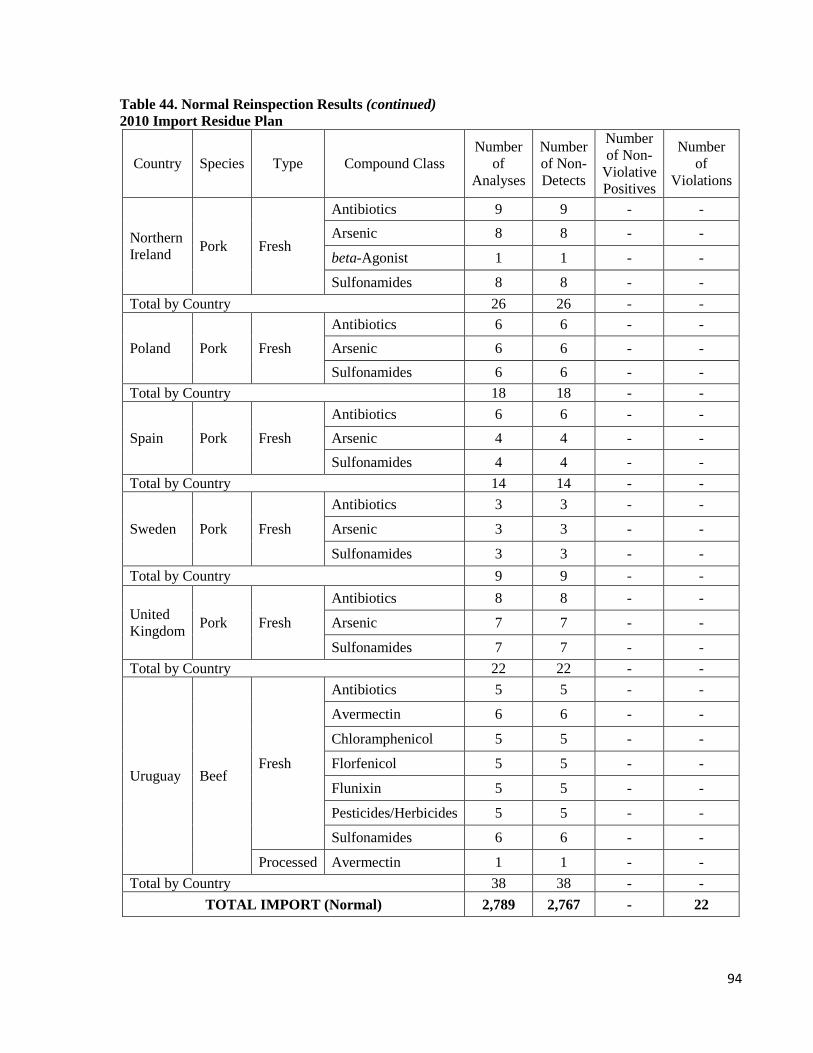
94
Table 44. Normal Reinspection Results (continued) 2010 Import Residue Plan
Country Species Type Compound Class Number
of Analyses
Number of Non-Detects
Number of Non-
Violative Positives
Number of
Violations
Northern Ireland Pork Fresh
Antibiotics 9 9 - - Arsenic 8 8 - -
beta-Agonist 1 1 - -
Sulfonamides 8 8 - - Total by Country 26 26 - -
Poland Pork Fresh Antibiotics 6 6 - - Arsenic 6 6 - - Sulfonamides 6 6 - -
Total by Country 18 18 - -
Spain Pork Fresh Antibiotics 6 6 - - Arsenic 4 4 - - Sulfonamides 4 4 - -
Total by Country 14 14 - -
Sweden Pork Fresh
Antibiotics 3 3 - -
Arsenic 3 3 - -
Sulfonamides 3 3 - - Total by Country 9 9 - -
United Kingdom Pork Fresh
Antibiotics 8 8 - -
Arsenic 7 7 - -
Sulfonamides 7 7 - - Total by Country 22 22 - -
Uruguay Beef Fresh
Antibiotics 5 5 - -
Avermectin 6 6 - -
Chloramphenicol 5 5 - -
Florfenicol 5 5 - -
Flunixin 5 5 - -
Pesticides/Herbicides 5 5 - -
Sulfonamides 6 6 - -
Processed Avermectin 1 1 - - Total by Country 38 38 - -
TOTAL IMPORT (Normal) 2,789 2,767 - 22
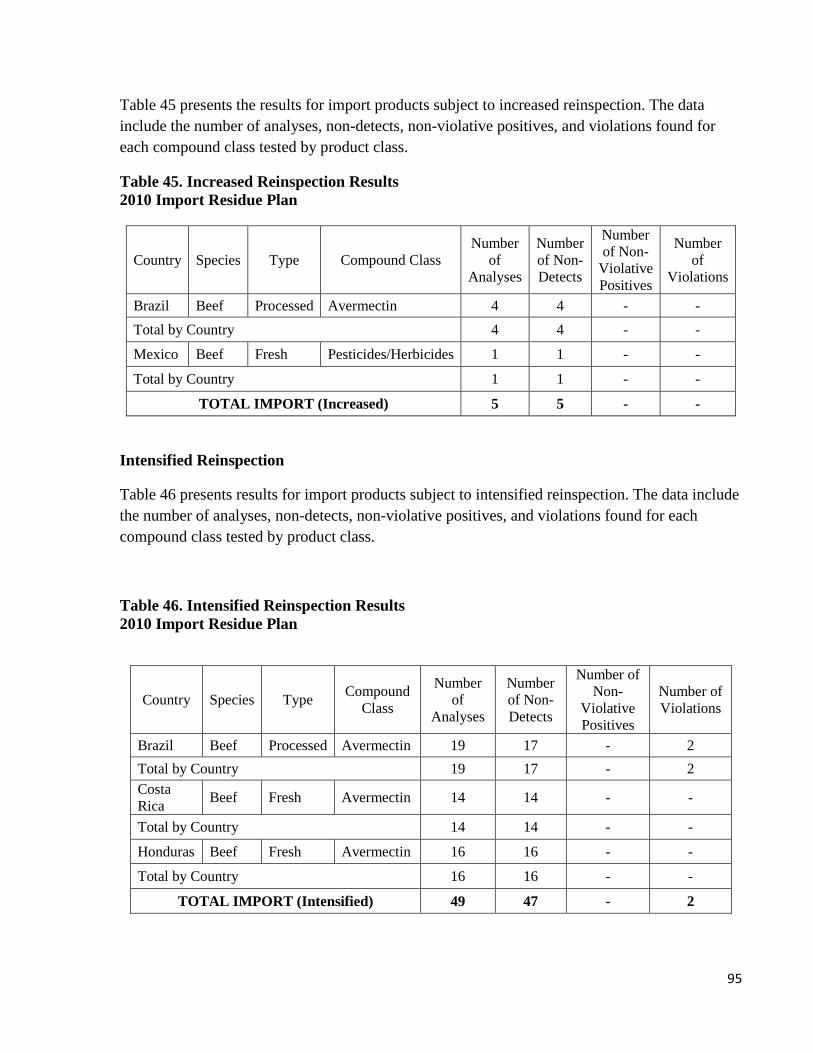
95
Table 45 presents the results for import products subject to increased reinspection. The data include the number of analyses, non-detects, non-violative positives, and violations found for each compound class tested by product class.
Table 45. Increased Reinspection Results 2010 Import Residue Plan
Country Species Type Compound Class Number
of Analyses
Number of Non-Detects
Number of Non-
Violative Positives
Number of
Violations
Brazil Beef Processed Avermectin 4 4 - - Total by Country 4 4 - -
Mexico Beef Fresh Pesticides/Herbicides 1 1 - -
Total by Country 1 1 - -
TOTAL IMPORT (Increased) 5 5 - -
Intensified Reinspection
Table 46 presents results for import products subject to intensified reinspection. The data include the number of analyses, non-detects, non-violative positives, and violations found for each compound class tested by product class.
Table 46. Intensified Reinspection Results 2010 Import Residue Plan
Country Species Type Compound Class
Number of
Analyses
Number of Non-Detects
Number of Non-
Violative Positives
Number of Violations
Brazil Beef Processed Avermectin 19 17 - 2 Total by Country 19 17 - 2 Costa Rica Beef Fresh Avermectin 14 14 - -
Total by Country 14 14 - -
Honduras Beef Fresh Avermectin 16 16 - -
Total by Country 16 16 - -
TOTAL IMPORT (Intensified) 49 47 - 2
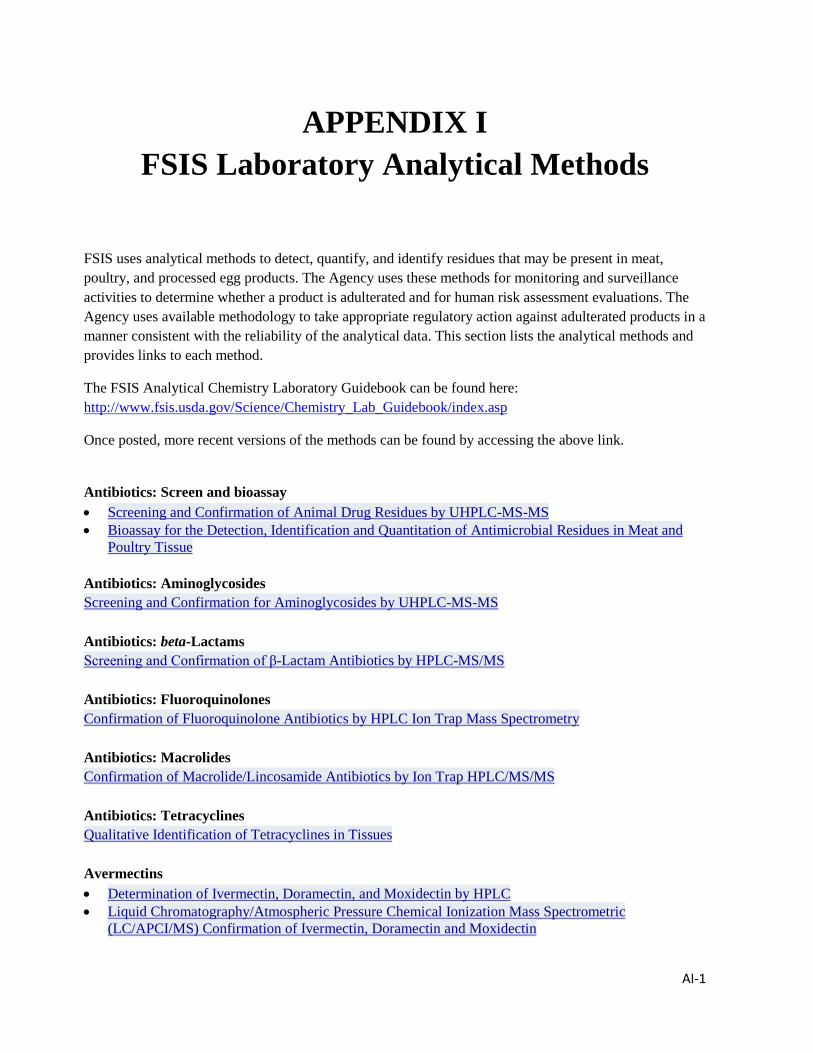
AI-1
APPENDIX I
FSIS Laboratory Analytical Methods
FSIS uses analytical methods to detect, quantify, and identify residues that may be present in meat, poultry, and processed egg products. The Agency uses these methods for monitoring and surveillance activities to determine whether a product is adulterated and for human risk assessment evaluations. The Agency uses available methodology to take appropriate regulatory action against adulterated products in a manner consistent with the reliability of the analytical data. This section lists the analytical methods and provides links to each method.
The FSIS Analytical Chemistry Laboratory Guidebook can be found here: http://www.fsis.usda.gov/Science/Chemistry_Lab_Guidebook/index.asp
Once posted, more recent versions of the methods can be found by accessing the above link.
Antibiotics: Screen and bioassay • Screening and Confirmation of Animal Drug Residues by UHPLC-MS-MS • Bioassay for the Detection, Identification and Quantitation of Antimicrobial Residues in Meat and
Poultry Tissue Antibiotics: Aminoglycosides Screening and Confirmation for Aminoglycosides by UHPLC-MS-MS Antibiotics: beta-Lactams Screening and Confirmation of β-Lactam Antibiotics by HPLC-MS/MS Antibiotics: Fluoroquinolones Confirmation of Fluoroquinolone Antibiotics by HPLC Ion Trap Mass Spectrometry Antibiotics: Macrolides Confirmation of Macrolide/Lincosamide Antibiotics by Ion Trap HPLC/MS/MS Antibiotics: Tetracyclines Qualitative Identification of Tetracyclines in Tissues Avermectins • Determination of Ivermectin, Doramectin, and Moxidectin by HPLC • Liquid Chromatography/Atmospheric Pressure Chemical Ionization Mass Spectrometric
(LC/APCI/MS) Confirmation of Ivermectin, Doramectin and Moxidectin
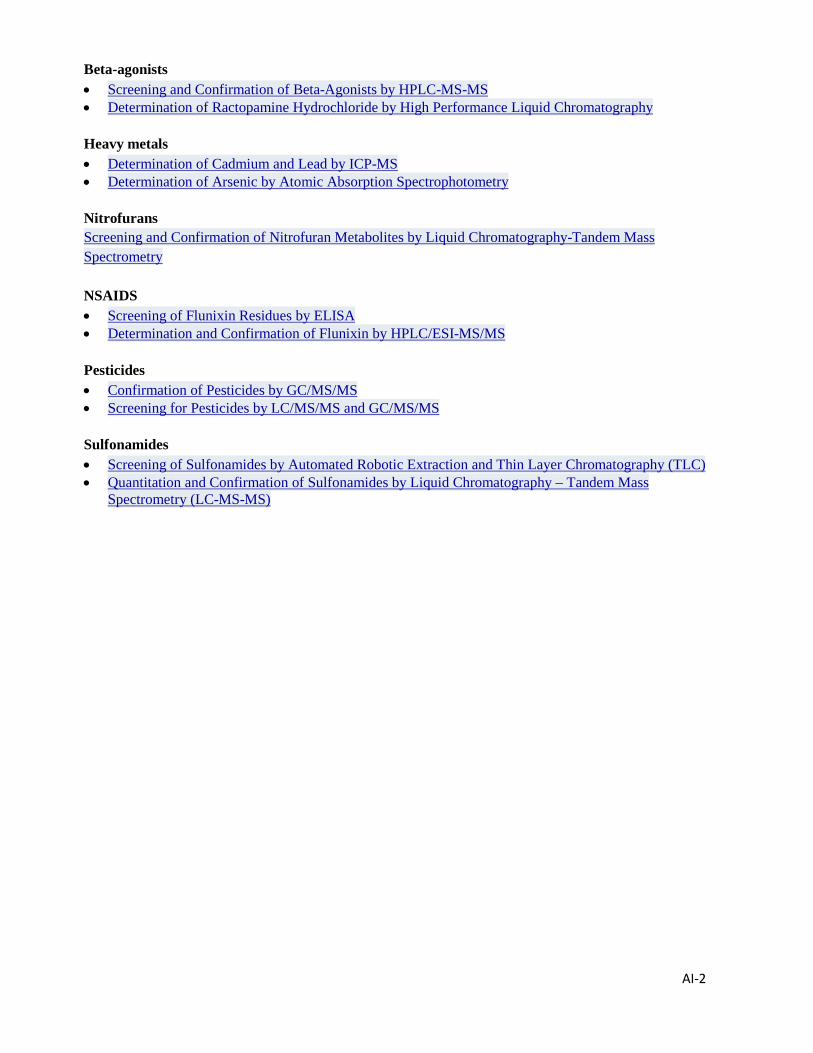
AI-2
Beta-agonists • Screening and Confirmation of Beta-Agonists by HPLC-MS-MS • Determination of Ractopamine Hydrochloride by High Performance Liquid Chromatography Heavy metals • Determination of Cadmium and Lead by ICP-MS • Determination of Arsenic by Atomic Absorption Spectrophotometry Nitrofurans Screening and Confirmation of Nitrofuran Metabolites by Liquid Chromatography-Tandem Mass Spectrometry NSAIDS • Screening of Flunixin Residues by ELISA • Determination and Confirmation of Flunixin by HPLC/ESI-MS/MS Pesticides • Confirmation of Pesticides by GC/MS/MS • Screening for Pesticides by LC/MS/MS and GC/MS/MS Sulfonamides • Screening of Sulfonamides by Automated Robotic Extraction and Thin Layer Chromatography (TLC) • Quantitation and Confirmation of Sulfonamides by Liquid Chromatography – Tandem Mass
Spectrometry (LC-MS-MS)
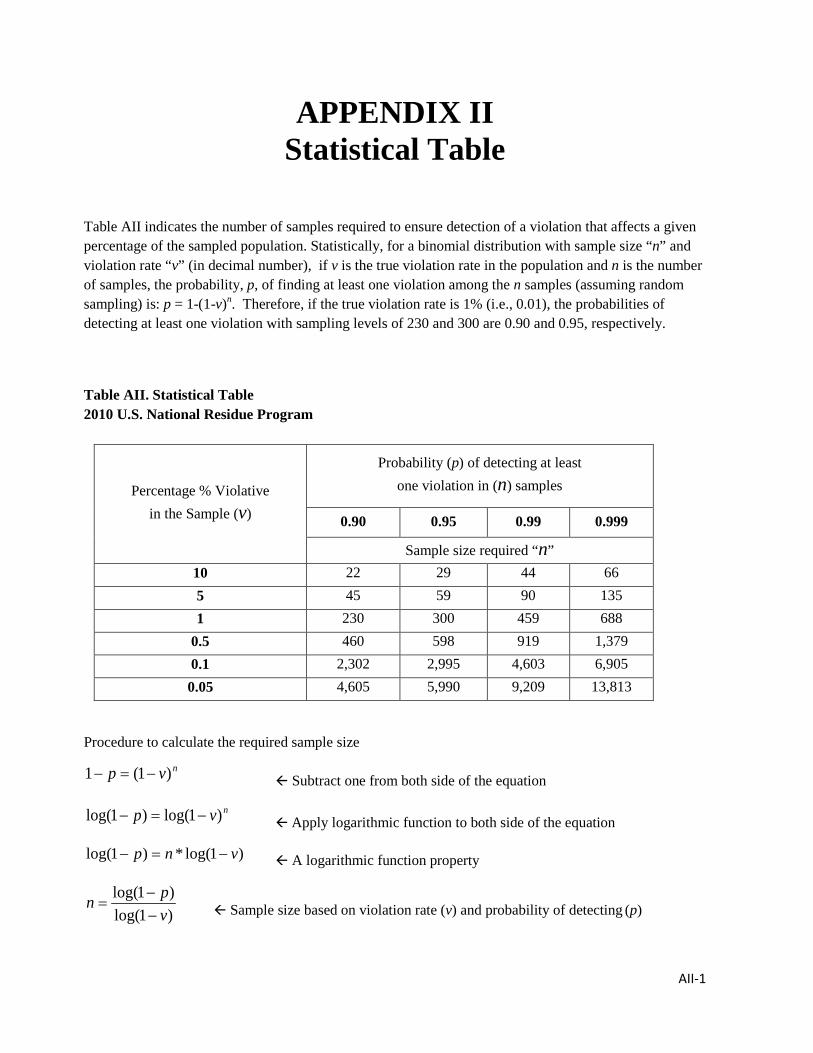
AII-1
APPENDIX II Statistical Table
Table AII indicates the number of samples required to ensure detection of a violation that affects a given percentage of the sampled population. Statistically, for a binomial distribution with sample size “n” and violation rate “v” (in decimal number), if v is the true violation rate in the population and n is the number of samples, the probability, p, of finding at least one violation among the n samples (assuming random sampling) is: p = 1-(1-v)n. Therefore, if the true violation rate is 1% (i.e., 0.01), the probabilities of detecting at least one violation with sampling levels of 230 and 300 are 0.90 and 0.95, respectively.
Table AII. Statistical Table 2010 U.S. National Residue Program
Percentage % Violative in the Sample (v)
Probability (p) of detecting at least one violation in (n) samples
0.90 0.95 0.99 0.999
Sample size required “n” 10 22 29 44 66 5 45 59 90 135 1 230 300 459 688
0.5 460 598 919 1,379 0.1 2,302 2,995 4,603 6,905 0.05 4,605 5,990 9,209 13,813
Procedure to calculate the required sample size
nvp )1(1 −=− Subtract one from both side of the equation
nvp )1log()1log( −=− Apply logarithmic function to both side of the equation
)1log(*)1log( vnp −=− A logarithmic function property
)1log()1log(
vpn
−−
= Sample size based on violation rate (v) and probability of detecting (p)
AIII-1
APPENDIX III Summary of U.S. NRP
Scheduled Sampling Data From 2007 to 2009
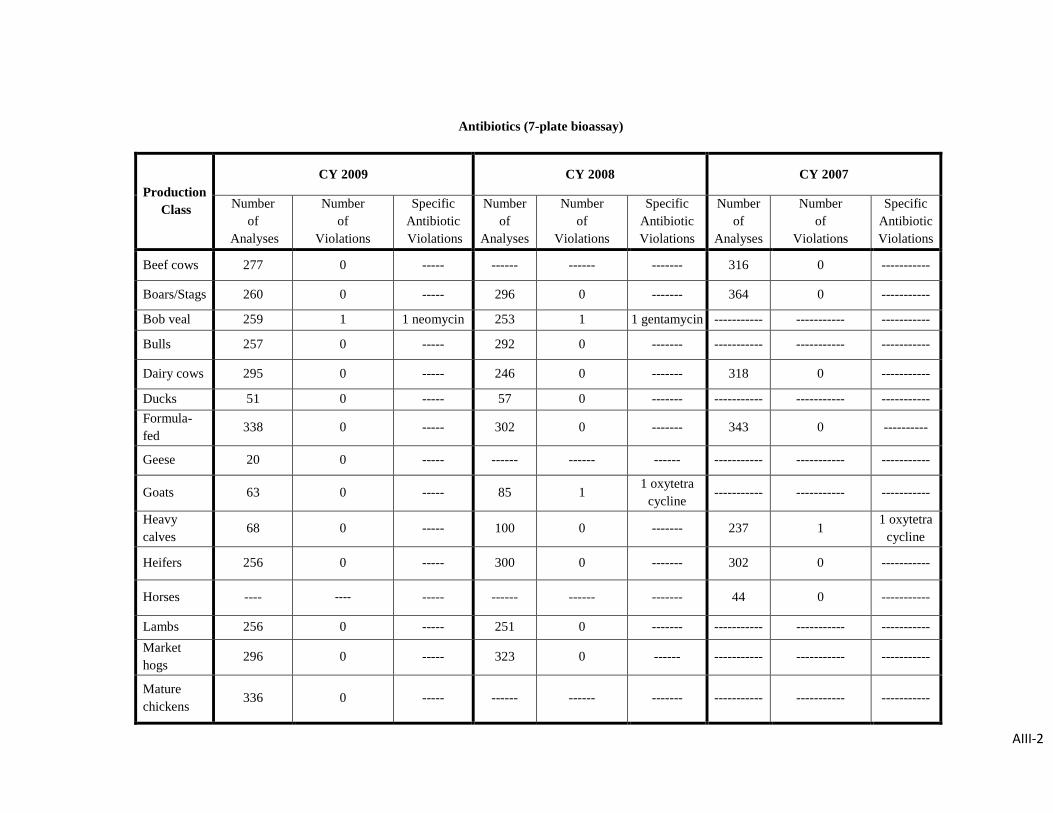
AIII-2
Antibiotics (7-plate bioassay)
Production Class
CY 2009 CY 2008 CY 2007
Number of
Analyses
Number of
Violations
Specific Antibiotic Violations
Number of
Analyses
Number of
Violations
Specific Antibiotic Violations
Number of
Analyses
Number of
Violations
Specific Antibiotic Violations
Beef cows 277 0 ----- ------ ------ ------- 316 0 -----------
Boars/Stags 260 0 ----- 296 0 ------- 364 0 -----------
Bob veal 259 1 1 neomycin 253 1 1 gentamycin ----------- ----------- -----------
Bulls 257 0 ----- 292 0 ------- ----------- ----------- -----------
Dairy cows 295 0 ----- 246 0 ------- 318 0 -----------
Ducks 51 0 ----- 57 0 ------- ----------- ----------- ----------- Formula-fed
338 0 ----- 302 0 ------- 343 0 ----------
Geese 20 0 ----- ------ ------ ------ ----------- ----------- -----------
Goats 63 0 ----- 85 1 1 oxytetra
cycline ----------- ----------- -----------
Heavy calves
68 0 ----- 100 0 ------- 237 1 1 oxytetra
cycline
Heifers 256 0 ----- 300 0 ------- 302 0 -----------
Horses ---- ---- ----- ------ ------ ------- 44 0 -----------
Lambs 256 0 ----- 251 0 ------- ----------- ----------- ----------- Market hogs
296 0 ----- 323 0 ------ ----------- ----------- -----------
Mature chickens
336 0 ----- ------ ------ ------- ----------- ----------- -----------
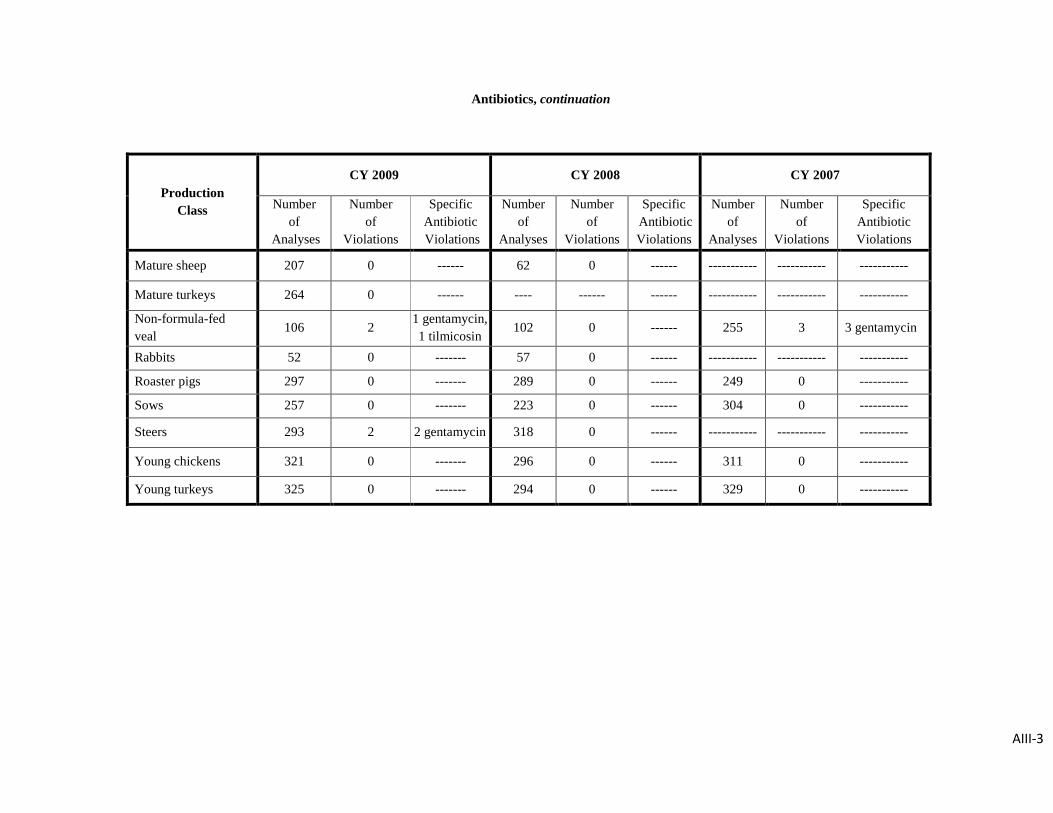
AIII-3
Antibiotics, continuation
Production Class
CY 2009 CY 2008 CY 2007
Number of
Analyses
Number of
Violations
Specific Antibiotic Violations
Number of
Analyses
Number of
Violations
Specific Antibiotic Violations
Number of
Analyses
Number of
Violations
Specific Antibiotic Violations
Mature sheep 207 0 ------ 62 0 ------ ----------- ----------- -----------
Mature turkeys 264 0 ------ ---- ------ ------ ----------- ----------- -----------
Non-formula-fed veal
106 2 1 gentamycin, 1 tilmicosin
102 0 ------ 255 3 3 gentamycin
Rabbits 52 0 ------- 57 0 ------ ----------- ----------- -----------
Roaster pigs 297 0 ------- 289 0 ------ 249 0 -----------
Sows 257 0 ------- 223 0 ------ 304 0 -----------
Steers 293 2 2 gentamycin 318 0 ------ ----------- ----------- -----------
Young chickens 321 0 ------- 296 0 ------ 311 0 -----------
Young turkeys 325 0 ------- 294 0 ------ 329 0 -----------
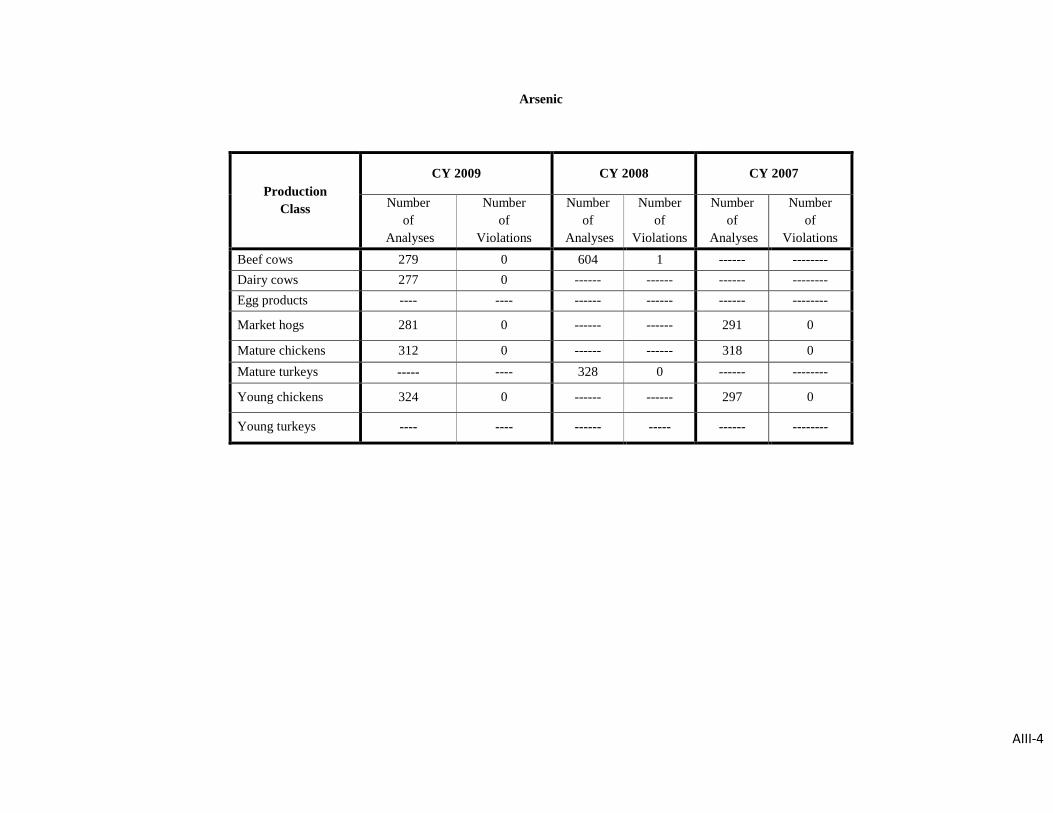
AIII-4
Arsenic
Production Class
CY 2009 CY 2008 CY 2007
Number of
Analyses
Number of
Violations
Number of
Analyses
Number of
Violations
Number of
Analyses
Number of
Violations Beef cows 279 0 604 1 ------ -------- Dairy cows 277 0 ------ ------ ------ -------- Egg products ---- ---- ------ ------ ------ --------
Market hogs 281 0 ------ ------ 291 0
Mature chickens 312 0 ------ ------ 318 0 Mature turkeys ----- ---- 328 0 ------ --------
Young chickens 324 0 ------ ------ 297 0
Young turkeys ---- ---- ------ ----- ------ --------
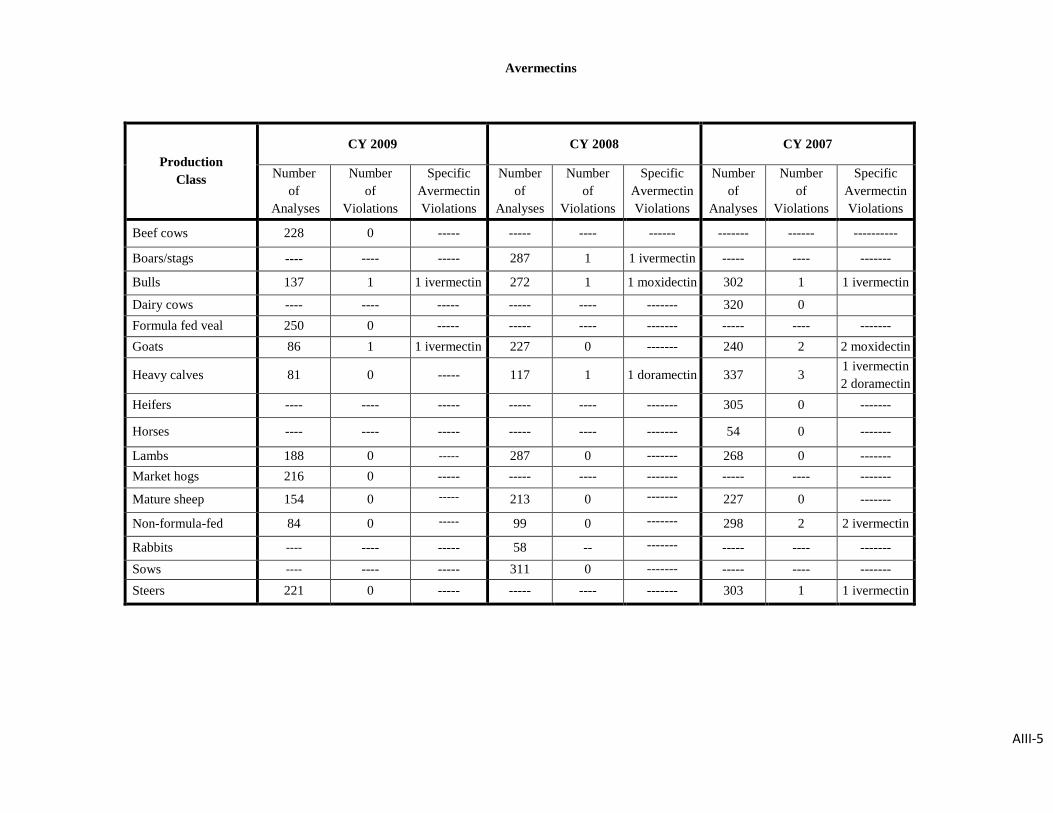
AIII-5
Avermectins
Production Class
CY 2009 CY 2008 CY 2007
Number of
Analyses
Number of
Violations
Specific Avermectin Violations
Number of
Analyses
Number of
Violations
Specific Avermectin Violations
Number of
Analyses
Number of
Violations
Specific Avermectin Violations
Beef cows 228 0 ----- ----- ---- ------ ------- ------ ----------
Boars/stags ---- ---- ----- 287 1 1 ivermectin ----- ---- -------
Bulls 137 1 1 ivermectin 272 1 1 moxidectin 302 1 1 ivermectin
Dairy cows ---- ---- ----- ----- ---- ------- 320 0 Formula fed veal 250 0 ----- ----- ---- ------- ----- ---- ------- Goats 86 1 1 ivermectin 227 0 ------- 240 2 2 moxidectin
Heavy calves 81 0 ----- 117 1 1 doramectin 337 3 1 ivermectin 2 doramectin
Heifers ---- ---- ----- ----- ---- ------- 305 0 -------
Horses ---- ---- ----- ----- ---- ------- 54 0 -------
Lambs 188 0 ----- 287 0 ------- 268 0 ------- Market hogs 216 0 ----- ----- ---- ------- ----- ---- -------
Mature sheep 154 0 ----- 213 0 ------- 227 0 -------
Non-formula-fed 84 0 ----- 99 0 ------- 298 2 2 ivermectin
Rabbits ---- ---- ----- 58 -- ------- ----- ---- ------- Sows ---- ---- ----- 311 0 ------- ----- ---- ------- Steers 221 0 ----- ----- ---- ------- 303 1 1 ivermectin
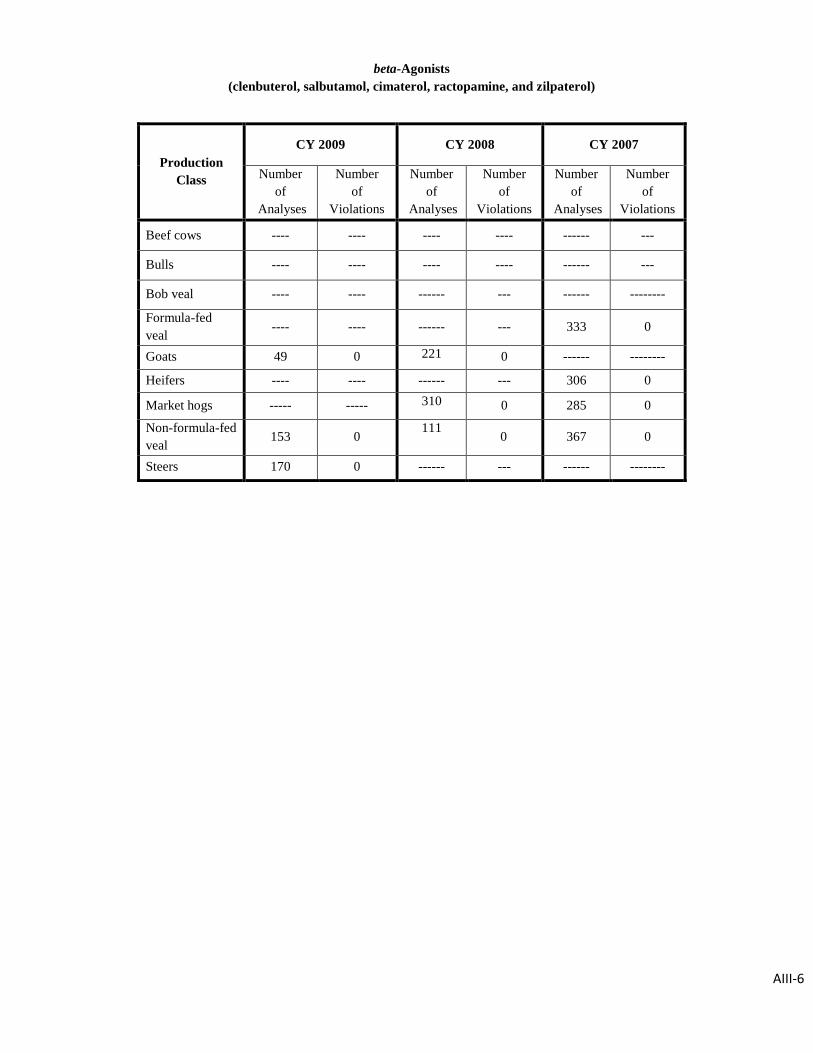
AIII-6
beta-Agonists (clenbuterol, salbutamol, cimaterol, ractopamine, and zilpaterol)
Production Class
CY 2009 CY 2008 CY 2007
Number of
Analyses
Number of
Violations
Number of
Analyses
Number of
Violations
Number of
Analyses
Number of
Violations
Beef cows ---- ---- ---- ---- ------ ---
Bulls ---- ---- ---- ---- ------ ---
Bob veal ---- ---- ------ --- ------ --------
Formula-fed veal
---- ---- ------ --- 333 0
Goats 49 0 221 0 ------ --------
Heifers ---- ---- ------ --- 306 0
Market hogs ----- ----- 310 0 285 0
Non-formula-fed veal
153 0 111
0 367 0
Steers 170 0 ------ --- ------ --------
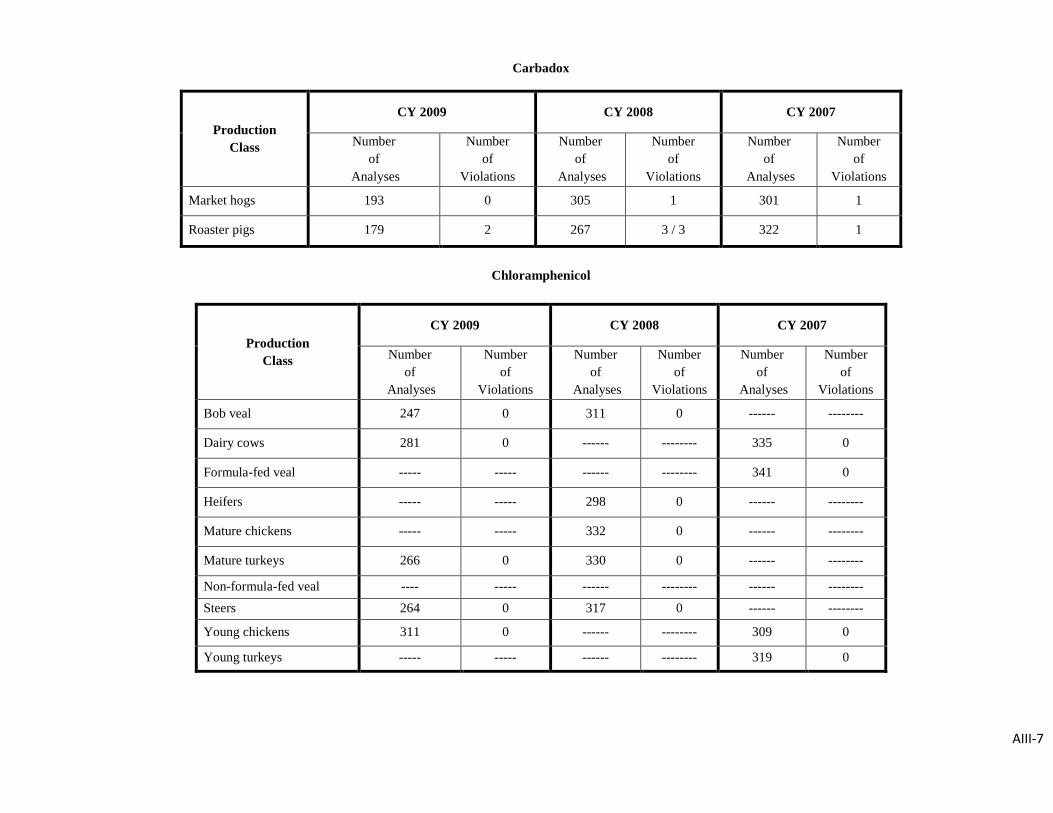
AIII-7
Carbadox
Chloramphenicol
Production Class
CY 2009 CY 2008 CY 2007
Number of
Analyses
Number of
Violations
Number of
Analyses
Number of
Violations
Number of
Analyses
Number of
Violations
Market hogs 193 0 305 1 301 1
Roaster pigs 179 2 267 3 / 3 322 1
Production Class
CY 2009 CY 2008 CY 2007
Number of
Analyses
Number of
Violations
Number of
Analyses
Number of
Violations
Number of
Analyses
Number of
Violations
Bob veal 247 0 311 0 ------ --------
Dairy cows 281 0 ------ -------- 335 0
Formula-fed veal ----- ----- ------ -------- 341 0
Heifers ----- ----- 298 0 ------ --------
Mature chickens ----- ----- 332 0 ------ --------
Mature turkeys 266 0 330 0 ------ --------
Non-formula-fed veal ---- ----- ------ -------- ------ -------- Steers 264 0 317 0 ------ --------
Young chickens 311 0 ------ -------- 309 0
Young turkeys ----- ----- ------ -------- 319 0
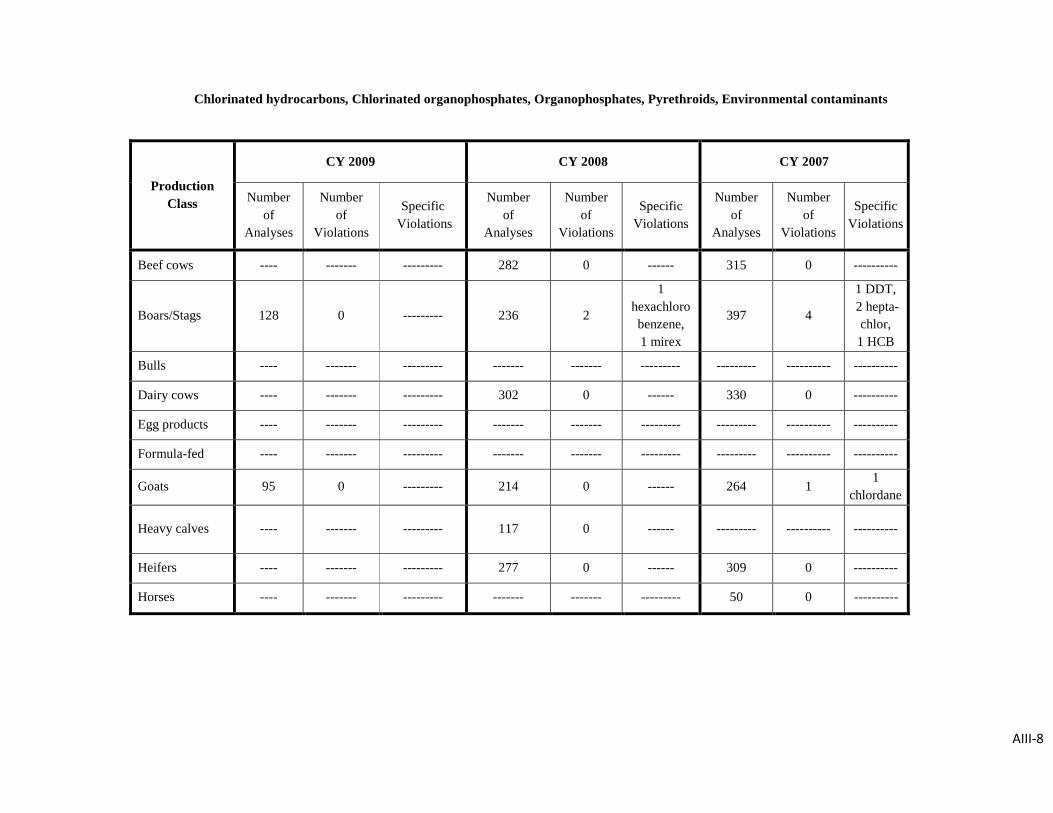
AIII-8
Chlorinated hydrocarbons, Chlorinated organophosphates, Organophosphates, Pyrethroids, Environmental contaminants
Production Class
CY 2009 CY 2008 CY 2007
Number of
Analyses
Number of
Violations
Specific Violations
Number of
Analyses
Number of
Violations
Specific Violations
Number of
Analyses
Number of
Violations
Specific Violations
Beef cows ---- ------- --------- 282 0 ------ 315 0 ----------
Boars/Stags 128 0 --------- 236 2
1 hexachloro benzene, 1 mirex
397 4
1 DDT, 2 hepta-
chlor, 1 HCB
Bulls ---- ------- --------- ------- ------- --------- --------- ---------- ----------
Dairy cows ---- ------- --------- 302 0 ------ 330 0 ----------
Egg products ---- ------- --------- ------- ------- --------- --------- ---------- ----------
Formula-fed ---- ------- --------- ------- ------- --------- --------- ---------- ----------
Goats 95 0 --------- 214 0 ------ 264 1 1
chlordane
Heavy calves ---- ------- --------- 117 0 ------ --------- ---------- ----------
Heifers ---- ------- --------- 277 0 ------ 309 0 ----------
Horses ---- ------- --------- ------- ------- --------- 50 0 ----------
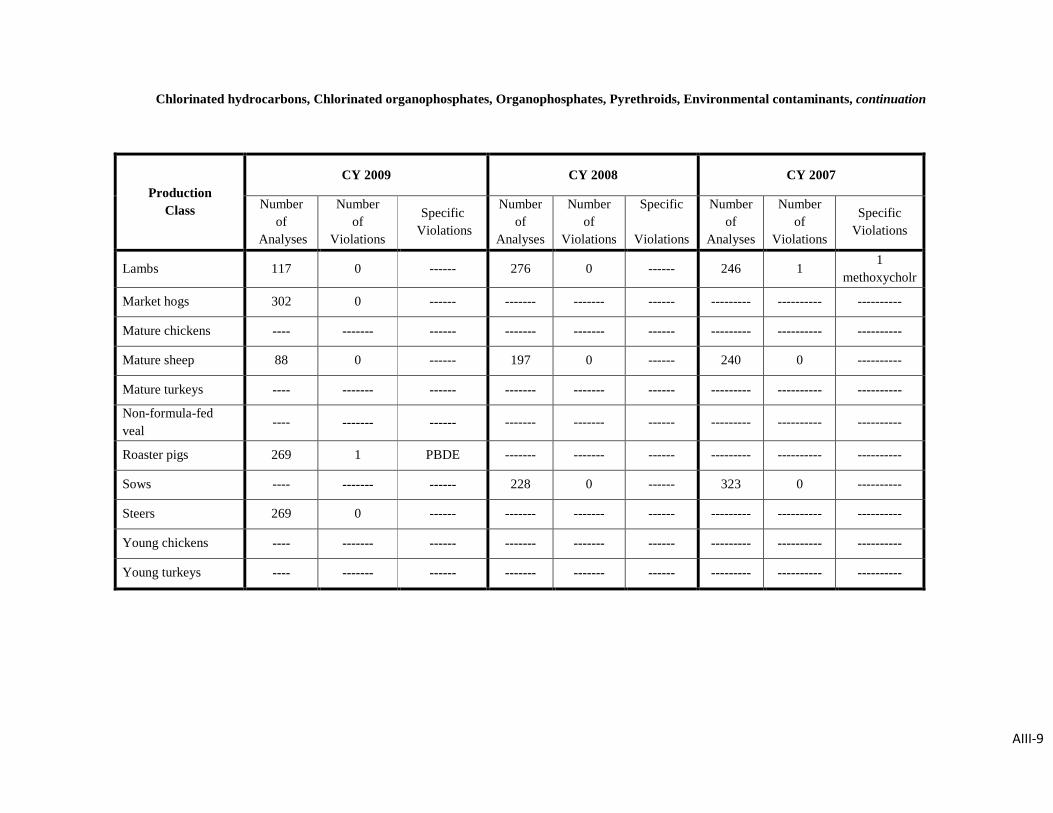
AIII-9
Chlorinated hydrocarbons, Chlorinated organophosphates, Organophosphates, Pyrethroids, Environmental contaminants, continuation
Production Class
CY 2009 CY 2008 CY 2007
Number of
Analyses
Number of
Violations
Specific Violations
Number of
Analyses
Number of
Violations
Specific
Violations
Number of
Analyses
Number of
Violations
Specific Violations
Lambs 117 0 ------ 276 0 ------ 246 1 1
methoxycholr
Market hogs 302 0 ------ ------- ------- ------ --------- ---------- ----------
Mature chickens ---- ------- ------ ------- ------- ------ --------- ---------- ----------
Mature sheep 88 0 ------ 197 0 ------ 240 0 ----------
Mature turkeys ---- ------- ------ ------- ------- ------ --------- ---------- ----------
Non-formula-fed veal
---- ------- ------ ------- ------- ------ --------- ---------- ----------
Roaster pigs 269 1 PBDE ------- ------- ------ --------- ---------- ----------
Sows ---- ------- ------ 228 0 ------ 323 0 ----------
Steers 269 0 ------ ------- ------- ------ --------- ---------- ----------
Young chickens ---- ------- ------ ------- ------- ------ --------- ---------- ----------
Young turkeys ---- ------- ------ ------- ------- ------ --------- ---------- ----------
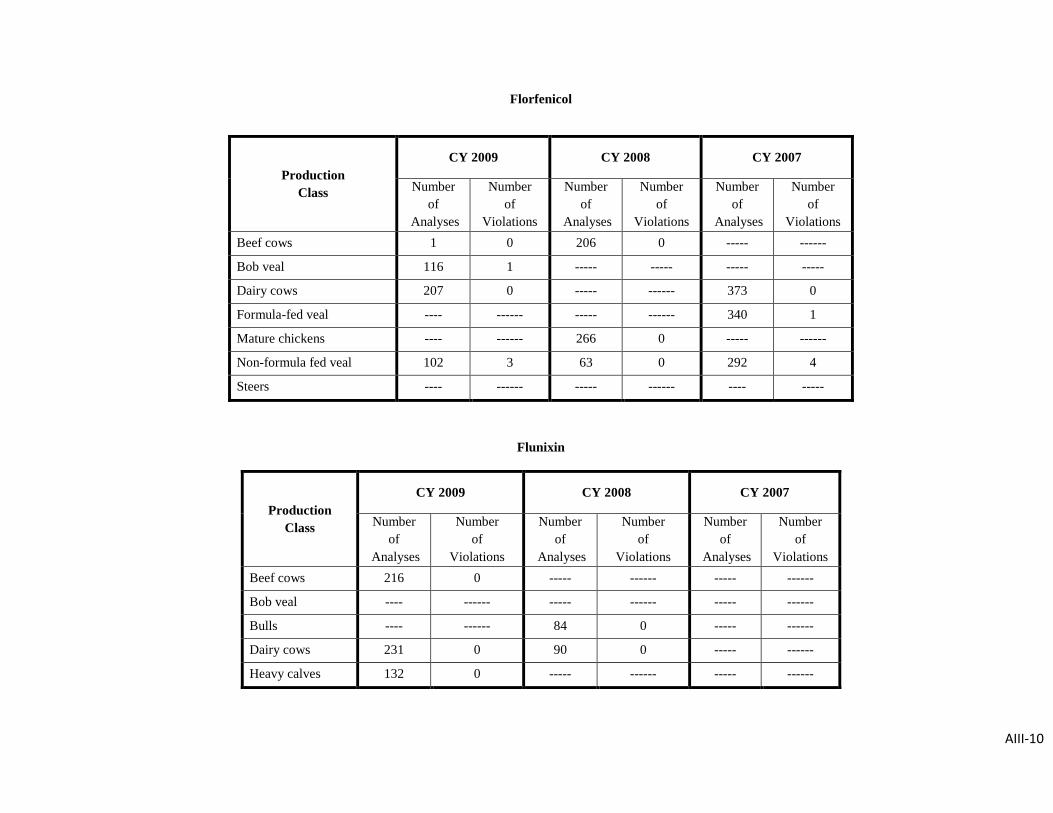
AIII-10
Florfenicol
Flunixin
Production Class
CY 2009 CY 2008 CY 2007
Number of
Analyses
Number of
Violations
Number of
Analyses
Number of
Violations
Number of
Analyses
Number of
Violations Beef cows 1 0 206 0 ----- ------
Bob veal 116 1 ----- ----- ----- -----
Dairy cows 207 0 ----- ------ 373 0
Formula-fed veal ---- ------ ----- ------ 340 1
Mature chickens ---- ------ 266 0 ----- ------
Non-formula fed veal 102 3 63 0 292 4
Steers ---- ------ ----- ------ ---- -----
Production Class
CY 2009 CY 2008 CY 2007
Number of
Analyses
Number of
Violations
Number of
Analyses
Number of
Violations
Number of
Analyses
Number of
Violations Beef cows 216 0 ----- ------ ----- ------
Bob veal ---- ------ ----- ------ ----- ------
Bulls ---- ------ 84 0 ----- ------
Dairy cows 231 0 90 0 ----- ------
Heavy calves 132 0 ----- ------ ----- ------
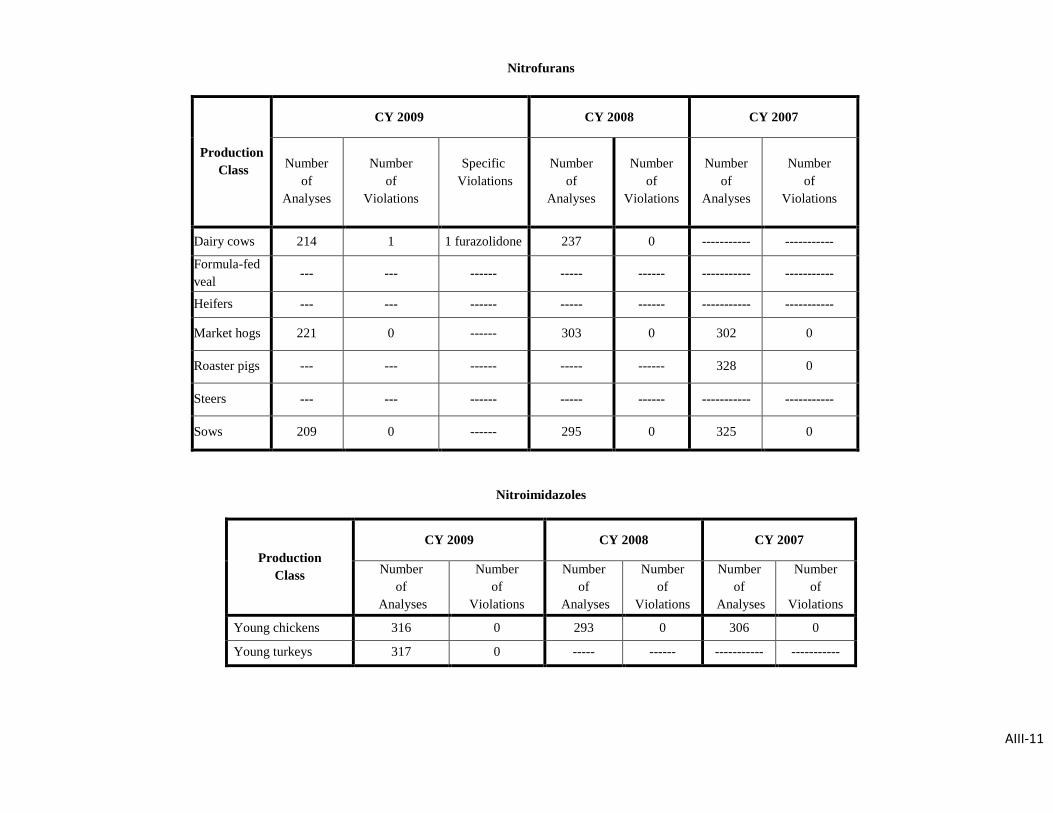
AIII-11
Nitrofurans
Production Class
CY 2009 CY 2008 CY 2007
Number
of Analyses
Number
of Violations
Specific
Violations
Number
of Analyses
Number
of Violations
Number of
Analyses
Number of
Violations
Dairy cows 214 1 1 furazolidone 237 0 ----------- -----------
Formula-fed veal --- --- ------ ----- ------ ----------- -----------
Heifers --- --- ------ ----- ------ ----------- -----------
Market hogs 221 0 ------ 303 0 302 0
Roaster pigs --- --- ------ ----- ------ 328 0
Steers --- --- ------ ----- ------ ----------- -----------
Sows 209 0 ------ 295 0 325 0
Nitroimidazoles
Production Class
CY 2009 CY 2008 CY 2007
Number of
Analyses
Number of
Violations
Number of
Analyses
Number of
Violations
Number of
Analyses
Number of
Violations
Young chickens 316 0 293 0 306 0
Young turkeys 317 0 ----- ------ ----------- -----------
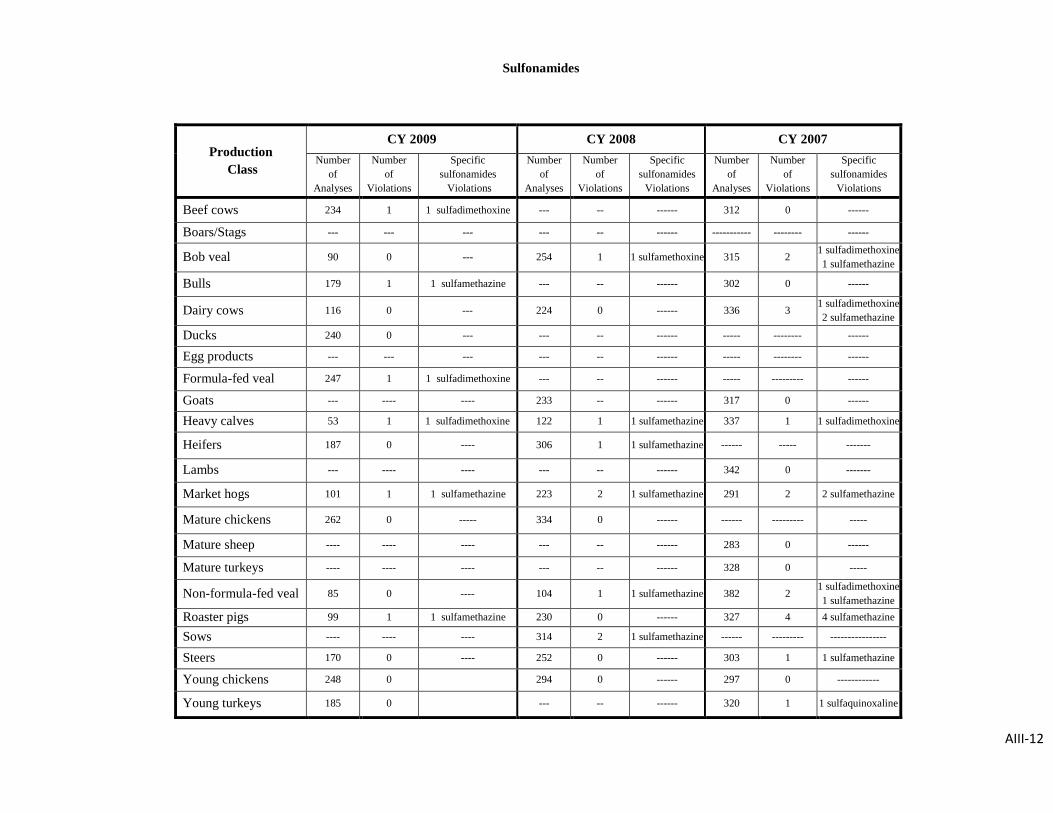
AIII-12
Sulfonamides
Production Class
CY 2009 CY 2008 CY 2007 Number
of Analyses
Number of
Violations
Specific sulfonamides Violations
Number of
Analyses
Number of
Violations
Specific sulfonamides
Violations
Number of
Analyses
Number of
Violations
Specific sulfonamides
Violations
Beef cows 234 1 1 sulfadimethoxine --- -- ------ 312 0 ------
Boars/Stags --- --- --- --- -- ------ ----------- -------- ------
Bob veal 90 0 --- 254 1 1 sulfamethoxine 315 2 1 sulfadimethoxine 1 sulfamethazine
Bulls 179 1 1 sulfamethazine --- -- ------ 302 0 ------
Dairy cows 116 0 --- 224 0 ------ 336 3 1 sulfadimethoxine 2 sulfamethazine
Ducks 240 0 --- --- -- ------ ----- -------- ------
Egg products --- --- --- --- -- ------ ----- -------- ------
Formula-fed veal 247 1 1 sulfadimethoxine --- -- ------ ----- --------- ------
Goats --- ---- ---- 233 -- ------ 317 0 ------
Heavy calves 53 1 1 sulfadimethoxine 122 1 1 sulfamethazine 337 1 1 sulfadimethoxine
Heifers 187 0 ---- 306 1 1 sulfamethazine ------ ----- -------
Lambs --- ---- ---- --- -- ------ 342 0 -------
Market hogs 101 1 1 sulfamethazine 223 2 1 sulfamethazine 291 2 2 sulfamethazine
Mature chickens 262 0 ----- 334 0 ------ ------ --------- -----
Mature sheep ---- ---- ---- --- -- ------ 283 0 ------
Mature turkeys ---- ---- ---- --- -- ------ 328 0 -----
Non-formula-fed veal 85 0 ---- 104 1 1 sulfamethazine 382 2 1 sulfadimethoxine 1 sulfamethazine
Roaster pigs 99 1 1 sulfamethazine 230 0 ------ 327 4 4 sulfamethazine
Sows ---- ---- ---- 314 2 1 sulfamethazine ------ --------- ----------------
Steers 170 0 ---- 252 0 ------ 303 1 1 sulfamethazine
Young chickens 248 0 294 0 ------ 297 0 ------------
Young turkeys 185 0 --- -- ------ 320 1 1 sulfaquinoxaline
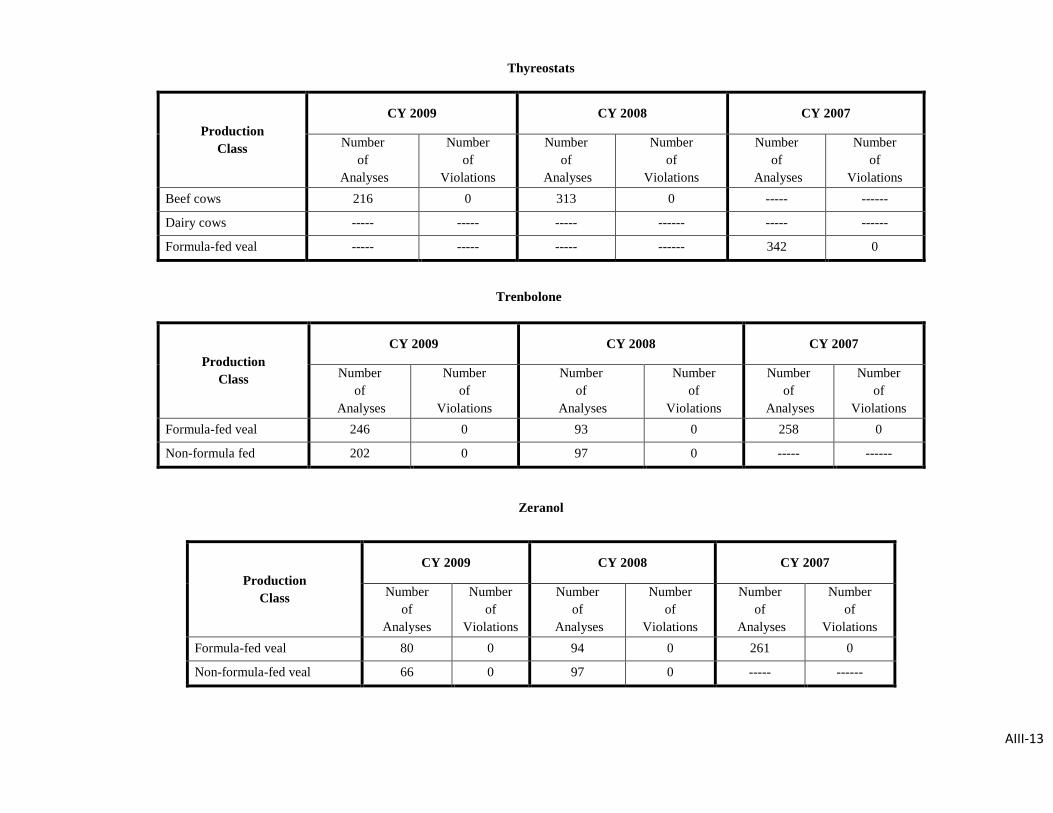
AIII-13
Thyreostats
Trenbolone
Zeranol
Production Class
CY 2009 CY 2008 CY 2007
Number of
Analyses
Number of
Violations
Number of
Analyses
Number of
Violations
Number of
Analyses
Number of
Violations Beef cows 216 0 313 0 ----- ------
Dairy cows ----- ----- ----- ------ ----- ------
Formula-fed veal ----- ----- ----- ------ 342 0
Production Class
CY 2009 CY 2008 CY 2007
Number of
Analyses
Number of
Violations
Number of
Analyses
Number of
Violations
Number of
Analyses
Number of
Violations Formula-fed veal 246 0 93 0 258 0
Non-formula fed 202 0 97 0 ----- ------
Production Class
CY 2009 CY 2008 CY 2007
Number of
Analyses
Number of
Violations
Number of
Analyses
Number of
Violations
Number of
Analyses
Number of
Violations Formula-fed veal 80 0 94 0 261 0
Non-formula-fed veal 66 0 97 0 ----- ------