Embed Size (px)
Citation preview

United States Merchant Marine Academy
“Economies of Scale in Container Ship Costs”
Midshipman William Murray
The views expressed in this article are the author’s own and not those of the U.S. Merchant Marine Academy, the Maritime Administration, the Department of Transportation or the United States government.

Introduction
Today the largest container ships are capable of carrying over 19000 twenty foot
equivalent units (TEU), and orders have already been placed for ships with capacities of over
21000 TEU. Yet this increase size is not a recent trend. Data from various United Nations
Conference on Trade and Development (UNCTAD) Reviews of Maritime Transport and Barry
Rogliano Salles Alphaliner Reports, shown in the graph below, demonstrates the increase in
average vessel size in terms of carrying capacity over the last 25 years. In 1995, the average
container ship had a maximum capacity of 1498 TEU. By 2005, this had increased to 2171 TEU,
and by 2015 it was 3649 TEU.
On the extreme end of this increase in ship size is the development of mega container
ships. These ships, capable of carrying 10000 TEU or more, have become a facet of the container
shipping industry. While there are undeniably more ships on the low capacity end of the
spectrum than on the high capacity end, mega ships are being built a staggering rate. In 2014
0
500
1000
1500
2000
2500
3000
3500
4000
1985 1990 1995 2000 2005 2010 2015 2020
Aver
age
Ship
Size
(TEU
)
Year
Average Size of Container Ships (TEU)

there were 196 vessels over 10000 TEU, with 66 of those being larger than 13300 TEU. In 2015,
there were 265 ships over 10000 TEU, with 96 larger than 13300 TEU1.
Ship Size 2014 2015 Annual Increase Greater than 10000 TEU 196 265 35% Greater than 13300 TEU 66 96 45%
This represents a 35% increase in the number of vessels over 10000 TEU, and a 45% increase in
those greater than 13300 TEU. Ultra large container ships are undoubtedly in vogue.
It is not difficult to determine why ship owners are building more ships; it is in response
to the demand for containerized freight. To meet this demand, more capacity must be available.
This can only be accomplished by either building more ships or by increasing the size of those
already built. While some owners have undertaken jumboizations in order to increase existing
vessels’ capacities, the majority prefer to build new ships. In efforts to capture as large a market
share as possible, these ships are built to carry as many containers as possible. Competing
carriers have few ways to differentiate themselves. While on time performance and customer
service are important, there is a distinct lowest cost advantage. That carrier which can offer the
lowest freight rates is better positioned than its competitors. Ship owners believe that these mega
ships offer a cost advantage, although it is worth noting that the costs associated with these
vessels are vast. Owners must weigh the costs of these larger ships against the potential
economic benefits they offer.
The costs associated with commercial shipping are immense. To better understand them,
it is useful to first identify categories that the various costs can be broken down into. Martin
Stopford identifies five major cost categories in shipping: operating costs, periodic maintenance 1 Data from IHS Fairplay’s World Shipping Encyclopaedia

costs, voyage costs, capital costs, and cargo handling costs. Operating costs may be defined as
those expenses associated with daily vessel operations, comprising around 25% of total costs2.
Periodic maintenance costs are those larger expenditures incurred during dry dockings and
special surveys. Voyage costs include fuel expenses and port fees, while cargo costs are those
incurred for cargo operations. Lastly, capital costs are incurred in the course of vessel
acquisition. In its Report on Megaships, the ITF identifies three cost categories; capital, voyage,
and operating. The definition of these categories aligns with Stopford’s, while periodic
maintenance costs are condensed into the operating cost category and cargo handling costs are
excluded.
I have based my analysis upon these same three categories, as they comprise the bulk of
the costs ship owners face. As mentioned above, ship owners look to distinguish themselves
from their competitors in any way possible. The best way to do this is in offering the lowest
freight rates, an objective which can only be accomplished by minimizing costs. But how do
larger ships equate to lower costs for shipping companies? In general, the push to build ships
larger is predicated upon the presence of economies of scale in these categories. That is, there is
a marginal decrease in cost as ship size increases. This means that, per TEU, larger ships are
actually cheaper than smaller ones. This analysis looks to see to what extent economies of scale
exist in the above mentioned cost categories, and determine how they have changed over the past
decade.
Capital Costs
2 Specifically, Stopford defines them as “the ongoing expenses connected with the day-to-day running of the vessel (excluding fuel), together with an allowance for day-to-day repairs and maintenance” Stopford, Martin. Maritime Economics. p160. London. 1997.

In order to determine whether or not an economy of scale is present, it is necessary to
take a close look at each category in turn. This involves extensive data acquisition and analysis.
The first step was thus to gather a database of all container vessels as listed in the IHS World
Shipping Encyclopedia; this consisted of just over 5000 ships3. This was then filtered to exclude
vessels which did not have data on construction costs and those whose construction costs were
reported in values in currencies other than USD (in an effort to minimize the impact of
fluctuating exchange rates). Vessels built before 2006 were also excluded, in an attempt to
eliminate the need to account for inflation. Note that this is one shortcoming of the data; the
construction costs used in the following calculations are as-reported, and are not inflation
adjusted.
This resulted in a database of 1078 ships. These ships were then further subdivided based
upon their size and year of construction. To ensure adequate sample size, the sample was then
compared to the total number of vessels built that year. This revealed that the sample was fairly
large, consisting of approximately 35% of the 3099 vessels in the fleet. Larger vessels were more
heavily represented due to the availability of data: the relative percentages for the period 2006-
2015 are shown in the following table.
Size (TEU) Percentage of Fleet
Represented in Sample 3 These vessels are broadly divided into the following categories: 0-999 TEU, 1000-1499 TEU, 1500-1999 TEU, 2000-2999 TEU, 3000-3999 TEU, 4000 – 5099 TEU, 5100 – 7499 TEU, 7500 – 9999 TEU, 10000 – 13299 TEU, and 13300+ TEU. The categories align with those used by Alphaliner in various fleet forecasts. Each category consists of vessels with generally homogenous characteristics.

13300+ 68% 10000-13299 59%
7500-9999 40% 5100-7499 41% 4000-5099 38% 3000-3999 46% 2000-2999 28% 1500-1999 20% 1000-1499 26%
0-999 5%
Modern container ships are some of the largest machines ever built by mankind, and they
carry a price tag that reflects this fact. Indeed, in 2015 the average construction cost of a
container ship was $64 million USD. As shown by the chart below, construction prices have
varied considerably over the past decade.
Nearly every size category of vessel saw a peak in price in 2011, followed by a steady decline.
This variability may be explained by fluctuations in demand, as shipyards adjust prices to ensure
maximum profitability. The impact of exchange rates must also be considered due to the
30
40
50
60
70
80
90
100
2004 2006 2008 2010 2012 2014 2016Cons
truc
tion
Cost
in M
illio
ns o
f USD
Year of Construction
Average Vessel Price Over Time
international nature of the industry4. The impacts of the 2008 economic crisis are clear, as prices
dropped off as the industry entered a glut. One thing is certain; the average price of a new-build
varies greatly depending upon economic conditions.
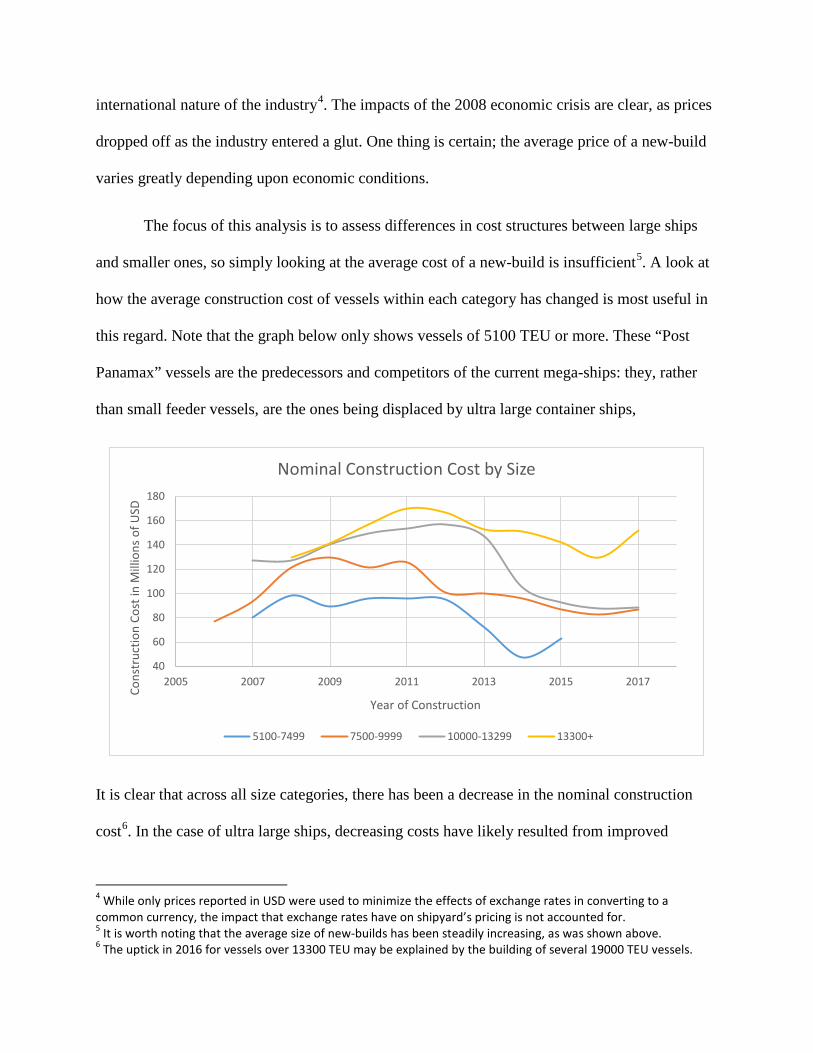
The focus of this analysis is to assess differences in cost structures between large ships
and smaller ones, so simply looking at the average cost of a new-build is insufficient5. A look at
how the average construction cost of vessels within each category has changed is most useful in
this regard. Note that the graph below only shows vessels of 5100 TEU or more. These “Post
Panamax” vessels are the predecessors and competitors of the current mega-ships: they, rather
than small feeder vessels, are the ones being displaced by ultra large container ships,
It is clear that across all size categories, there has been a decrease in the nominal construction
cost6. In the case of ultra large ships, decreasing costs have likely resulted from improved
4 While only prices reported in USD were used to minimize the effects of exchange rates in converting to a common currency, the impact that exchange rates have on shipyard’s pricing is not accounted for. 5 It is worth noting that the average size of new-builds has been steadily increasing, as was shown above. 6 The uptick in 2016 for vessels over 13300 TEU may be explained by the building of several 19000 TEU vessels.
40
60
80
100
120
140
160
180
2005 2007 2009 2011 2013 2015 2017
Cons
truc
tion
Cost
in M
illio
ns o
f USD
Year of Construction
Nominal Construction Cost by Size
5100-7499 7500-9999 10000-13299 13300+

construction techniques. The first 15000 TEU ships were built by Maersk in 2006: prior to this,
no shipyard had experience building such a large container vessel. Over the course of the next
few years, however, several competing companies have placed orders with a variety of builders,
driving down costs. In addition to the general trend of decreasing costs, it is clear that larger
vessels generally carry larger price tags.
This change in nominal cost over time is interesting, but it is not the focus of this
analysis. We are more concerned with the differences between larger ships and the rest of the
fleet than with the fleet in its entirety. Nominal construction costs are not very helpful in this
regard, as there is no real measure of size associated with them. Rather, the cost per TEU must
be assessed to allow an “apples to apples” comparison. This value, calculated by dividing the
construction cost by the carrying capacity of the vessel, gives the cost of each cell onboard the
vessel7.
7 Cost per TEU was calculated by simply dividing the construction cost by the TEU capacity; this does not consider the utilization of the vessel’s capacity.
0
50
100
150
200
250
0 5000 10000 15000 20000
Cons
truc
tion
Cost
(in
mill
ions
of U
SD)
Capacity (TEU)
Nominal Cost of Construction
A cursory glance at the nominal cost of ships shows that, unsurprisingly, there is a
positive correlation between capacity and construction cost. It is not surprising that larger ships
cost more than smaller ones. After all, there is more steel, and more labor required to assemble it.
The question lies in how much more they cost. A more thorough look at the graph of the nominal
cost of construction shows that while it increases, it does so at a decreasing rate. This is evidence
of an economy scale; as additional TEU are added, there is an ever decreasing rise in cost.8
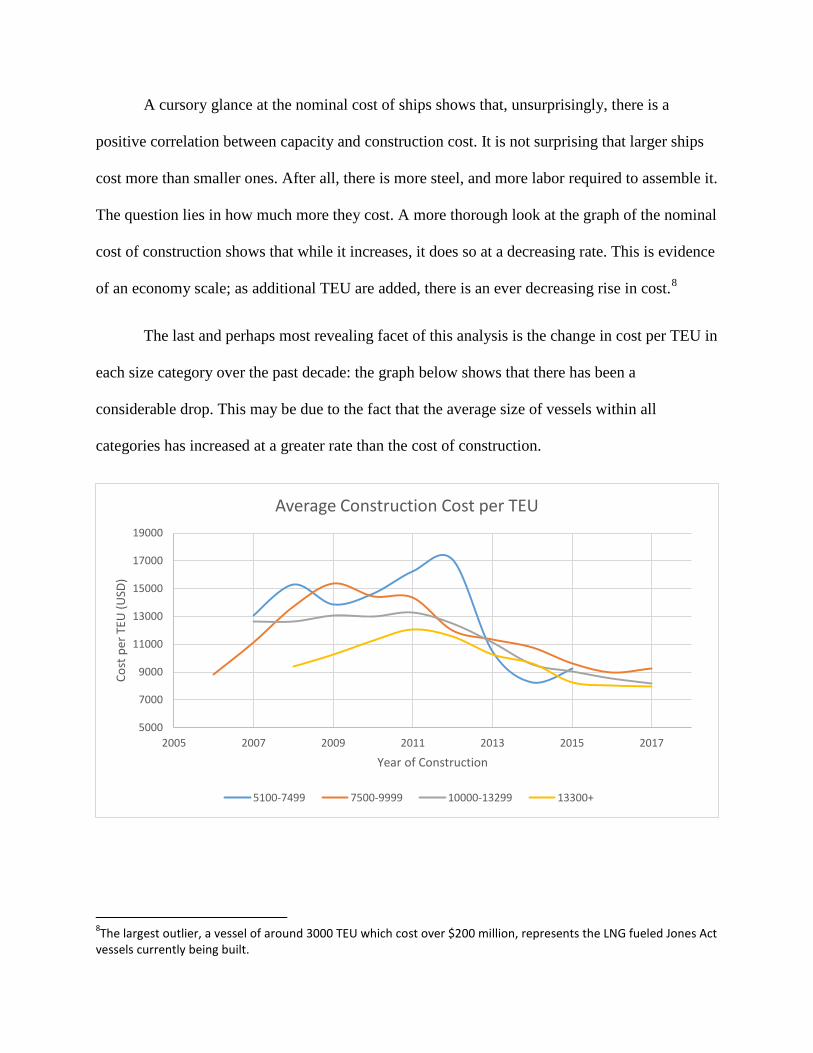
The last and perhaps most revealing facet of this analysis is the change in cost per TEU in
each size category over the past decade: the graph below shows that there has been a
considerable drop. This may be due to the fact that the average size of vessels within all
categories has increased at a greater rate than the cost of construction.
8The largest outlier, a vessel of around 3000 TEU which cost over $200 million, represents the LNG fueled Jones Act vessels currently being built.
5000
7000
9000
11000
13000
15000
17000
19000
2005 2007 2009 2011 2013 2015 2017
Cost
per
TEU
(USD
)
Year of Construction
Average Construction Cost per TEU
5100-7499 7500-9999 10000-13299 13300+

It is worth noting that the disparity between size groups seems to be shrinking, particularly
among smaller vessels. In the years to come there may be less advantage to larger ships;
however, it is unlikely that their cost per TEU will increase above those of smaller vessels.
A detailed look at the cost per TEU further affirms the presence of an economy of scale:
as vessel capacity increases, the cost per TEU clearly decreases.
Smaller ships cost more to build per TEU; a ship of 6000 TEU costs, on average $13,912 per
TEU while a ship over 13300 TEU has a per TEU cost of just $9,299.
Size Cost/TEU 0-999 $ 23,065.11 1000-1499 $ 20,606.62 1500-1999 $ 19,215.59 2000-2999 $ 16,436.43 3000-3999 $ 16,255.45 4000-5099 $ 14,672.54 5100-7499 $ 13,912.16 7500-9999 $ 11,491.36 10000-13299 $ 11,234.63 13300+ $ 9,298.82
$-
$5,000.00
$10,000.00
$15,000.00
$20,000.00
$25,000.00
$30,000.00
$35,000.00
$40,000.00
$45,000.00
0 5000 10000 15000 20000 25000
Cost
per
TEU
in
USD
Capacity (TEU)
Construction Cost per TEU

Clearly an economy of scale exists. It is predicated upon efficiency of ship design, as ships with
larger capacities are built with the same physical dimensions of some of their smaller
counterparts, along with the effectiveness of modern shipbuilding techniques. Changes in
operational practices have also helped, as a trend towards slow steaming means vessels are being
built with lower horsepower engines. It is also clear that the marginal decrease in cost shrinks as
ship size increases. It is conceivable then, that at some point this decrease in marginal cost may
become negligible.
In summary, there is a clear economy of scale in capital costs. While larger vessels are
more expensive, their increased capacity greatly drives down the per TEU cost. Furthermore,
there has been a steady decrease in the construction cost per TEU of all vessels. Costs across
different size categories do seem to be converging, meaning that the gradual capacity creep is
outpacing a rise in price. However, mega ships continue to offer considerable advantage of
smaller vessels, a trend which seems unlikely to reverse in the near future.
Voyage Costs and Fuel Consumption
Data for fuel consumption is not particularly easy to come by, as it is generally
proprietary information. Sources are thus fairly scanty, limiting the ability to effectively verify
the data. Fortunately, Clarkson’s commercial shipping database, Shipping Intelligence Network,
contains a wide array of vessel characteristics. For many vessels, this includes their design speed
and fuel consumption. Being concerned primarily with the economics of ultra large ships, the
focus here is primarily on vessels with a capacity over 5000 TEU. To create a representative
picture of this segment of the fleet, I randomly selected 395 ships constructed since the year
2000 ranging in capacity from 5100 to 18270 TEU. However, there is a large degree of
variability of fuel consumption within these categories, especially in the 5100 – 7499 TEU

group. There are also some questions as to the validity of the data, as several inconsistencies
arose. Nevertheless, the following analysis gives a rough estimate of the impacts that increasing
capacity have on fuel consumption.
Fuel consumption is typically reported in the number of metric tons of fuel burned per
day. Before beginning an analysis of fuel consumption within the container fleet, we must take a
brief look at a few of the technical aspects of marine propulsion. The first, and perhaps most
important, distinction to make is in the type of prime mover in use. The development of the
steam turbine and the shift to Heavy Fuel Oil (rather than coal) fed boilers in the first half of the
twentieth century allowed for vessels that were faster than ever before. However, steam turbines
are markedly inefficient. As oil prices began to rise in the 1970s and 1980s, steam turbines fell
out of favor. Reciprocating diesel engines took an ever larger market share as they offered
significantly better fuel economy, albeit at the cost of speed. These marine diesels are classed as
slow, medium, or high speed depending upon their normal operational RPM. In the sample taken
of 395 ships, all use slow speed diesel engines as their prime movers. This removes one
significant variable, the type of engine, from the equation.
In addition to engine type, we must also consider possible variability introduced by the
use of different types of fuel. Modern ships burn either distillate (such as marine gas oil) or
residual (heavy) fuel oils. Today, nearly every ship uses Heavy Fuel Oil (HFO) when at sea,
although some may switch to lighter fuels when transiting emissions controlled areas (ECAs). As
the lion’s share of time is spent at sea, there is no need to consider the efficiency of different
fuels in our examination of fuel consumption.
While engine and fuel type are mostly homogenous across the container fleet, we must
also consider the impact of the service speed of the vessels. Vessels are designed with an

optimized hull speed, known as the design speed. Obviously, this varies across vessels of
different sizes and between vessels built at different times. To account for this variation, the fuel
consumption must be adjusted to a common speed. I have selected a speed of 23 knots for this
purpose: this speed was chosen as it represents the lower quartile, or twenty fifth percentile, of
the ships sampled. The majority of vessels sampled thus had their actual consumption scaled
down. 9 However, as our interest lies in comparing vessels of varying sizes and ages rather than
in the specific characteristics of each, a homogenous prediction is sufficient. To calculate the
actual fuel consumption at the selected speed, the “cube rule” equation was used. That is,
𝐹 = 𝐹∗ �𝑆𝑆∗�3
Where:
F = Actual Consumption (Metric Tons per Day)
S = Actual Speed (23 knots)
𝐹∗ = Design Fuel Consumption
S∗ = Design Speed
Note that the exponent is dependent upon the type of engine concerned. For diesel engines, it is
approximately 3: thus the “cube rule”. For steam turbines it is lower, around two. This means
that there is more variability in fuel consumption of diesel engines; in other words, there are
greater tradeoffs for higher speeds with diesel engines in terms of fuel consumption. However,
this is in terms of marginal consumption. While a steam turbine may have a proportionally lower
9 It is worth noting that in reality, fuel consumption may be different from these predictions as vessels age and hulls become fouled.

fuel consumption to reach a certain speed, in absolute terms it is considerably higher. This is due
to aforementioned inherent inefficiency in steam turbines. As diesel ships make up the vast
majority of the container ship fleet, however, this consideration does not weigh into this analysis.
For the vessels sampled, design speeds ranged from 21 to 26.5 knots (with a mean of 24 knots)
as shown in the scatter plot below.
It is apparent that there is a much higher degree of variability in speed among smaller vessels.
There are a few explanations for this. The first is the fact the sampled ships between 5000 and
1000 TEU were built over a longer time span than their larger counterparts. In fact, the sample
includes smaller ships built every year between 2000 and 2015. In contrast, the first ship over
10000 TEU included in the sample was built in 2006. While the data does include larger ships
built every year between 2006 and 2015, those first six years saw some of the highest design
speeds. Thus these larger vessels were built in a period where slow steaming was becoming ever
more prevalent, while those ships built in the early 2000s may have been built with speed as a
priority. Regardless of the reason, the trend is clear; there has been a general decrease in design
speed across vessels of all sizes. The chart below shows the average design speed for each size
category over the past 15 years.
20
21
22
23
24
25
26
27
0 5000 10000 15000 20000
Desig
n Sp
eed
(kno
ts)
Ship Size (TEU)
Design Speed vs Ship Size

The hull speed of a vessel is generally limited by its length on the waterline, with longer
ships being capable of higher speeds. However, this correlation assumes that the vessel is fitted
with an engine of sufficient power to propel it up to such speeds. Horsepower, then, is typically
the deciding factor in a vessel’s speed. While hull smoothness and design efficiency also play a
role, the ship owner typically regulates the vessel’s maximum speed by choosing the horsepower
of the engine. Since we have observed a considerable decrease in design speed, it follows that
there would be a similar decrease in horsepower. Indeed, this was the case; average horsepower
dropped from around 88,000 in 2006 to just over 60,000 in 2014.
21
22
23
24
25
26
1998 2000 2002 2004 2006 2008 2010 2012 2014 2016
Desig
n Sp
eed
(kno
ts)
Year of Construction
Change in Design Speed Over Time
5100-7499 7500-9999 10000-13299 13300+ Total

While a considerable portion of this drop may be attributed to the preference for lower design
speeds, design improvements have also been factors.
The relationship between fuel consumption and engine horsepower is remarkably linear;
it is not surprising that bigger engines burn more fuel. The graph below, showing horsepower vs
design fuel consumption, illuminates this.
20000
30000
40000
50000
60000
70000
80000
90000
100000
110000
1999 2001 2003 2005 2007 2009 2011 2013 2015
Average Horsepower
5100-7499 7500-9999 10000-13299 13300+ Total
0
50
100
150
200
250
300
350
400
450
0 20000 40000 60000 80000 100000 120000
Fuel
Con
sum
ptio
n at
Des
ign
Spee
d (m
etric
tons
pe
r day
)
Horsepower
Horsepower vs Fuel Consumption

Just as it follows that lower design speeds have precipitated lower engine horsepower, we can
expect that lower horsepower engines have thus predicated a drop in fuel consumption. In
looking at a graph of the average consumption at design speed, a slight drop is apparent.
Interestingly, the drop is more pronounced among smaller vessels, particularly those in the 5100-
7499 TEU rang. Vessels in the 13300+ TEU category saw a large drop in 2009 as the first single
screw megaships were introduced. Fuel consumption leveled off around 250 tons per day until
2013, when Maersk launched the Triple-E class. These vessels were the largest container ships in
the world at their time of construction, with a fuel consumption of almost 400 tons per day.
Interestingly, NOL also had a number of ships with capacities of around 14000 TEU built in
2013 and 2014 with similarly high fuel consumption10. In looking at adjusted fuel consumption,
this drop is nonexistent (except for among the smaller ships).
10 I was unable to find any indication as to why these vessels’ fuel consumption is so high. One possible explanation is the engine in use, the MAN B&W 11S90MC. The only other vessels with this engine in the sample were two CMA CGM ships which were reported to consume 375 tons per day. The engine has a horsepower rating of approximately 88,000 HP, which is slightly above average for ships of this size. This engine is then fairly inefficient, although there could also be an error in the reported consumption rate.
050
100150200250300350400450
1998 2000 2002 2004 2006 2008 2010 2012 2014 2016
Fuel
Con
sum
ptio
n (m
etric
tons
per
day
)
Year of Construction
Average Nominal Fuel Consumption
13300+ 10000-13299 7500-9999 5100-7499 Average
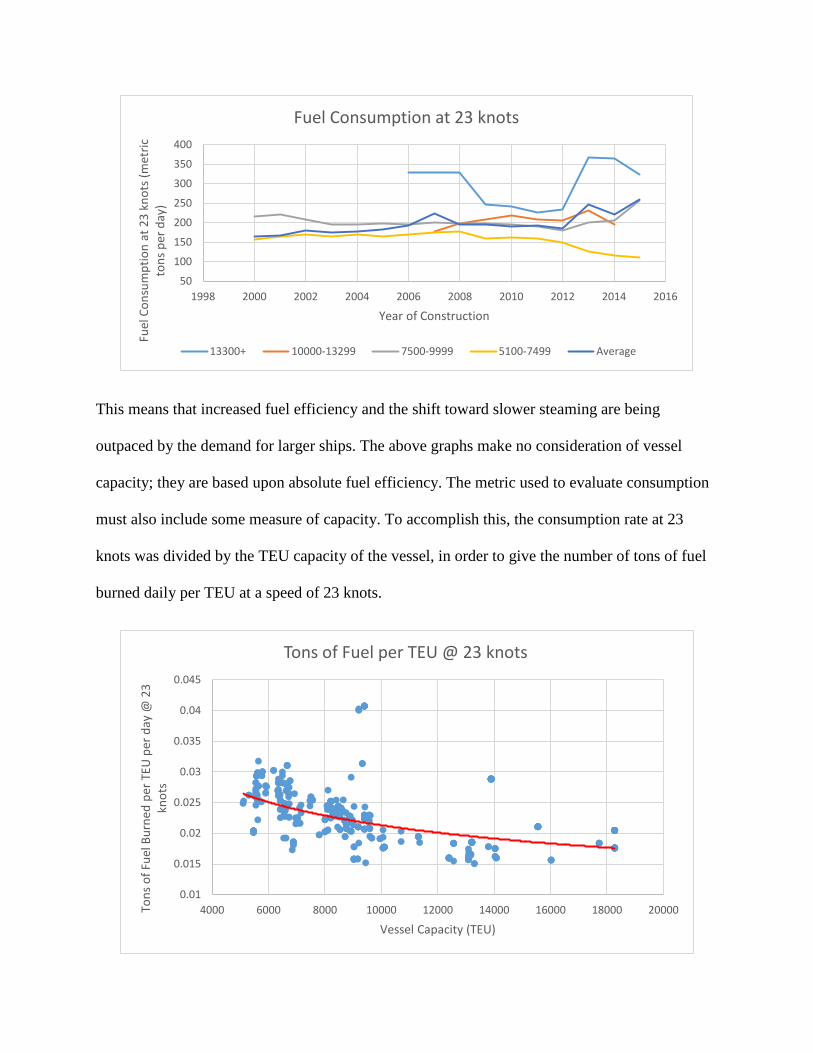
This means that increased fuel efficiency and the shift toward slower steaming are being
outpaced by the demand for larger ships. The above graphs make no consideration of vessel
capacity; they are based upon absolute fuel efficiency. The metric used to evaluate consumption
must also include some measure of capacity. To accomplish this, the consumption rate at 23
knots was divided by the TEU capacity of the vessel, in order to give the number of tons of fuel
burned daily per TEU at a speed of 23 knots.
50
100
150
200
250
300
350
400
1998 2000 2002 2004 2006 2008 2010 2012 2014 2016
Fuel
Con
sum
ptio
n at
23
knot
s (m
etric
to
ns p
er d
ay)
Year of Construction
Fuel Consumption at 23 knots
13300+ 10000-13299 7500-9999 5100-7499 Average
0.01
0.015
0.02
0.025
0.03
0.035
0.04
0.045
4000 6000 8000 10000 12000 14000 16000 18000 20000Tons
of F
uel B
urne
d pe
r TEU
per
day
@ 2
3 kn
ots
Vessel Capacity (TEU)
Tons of Fuel per TEU @ 23 knots

It is now apparent that, on average, larger ships are slightly more efficient than smaller ones.
This means that larger ships fuel costs per TEU are lower than those on smaller vessels. In other
words, an economy of scale exists in fuel costs as well.11
As with capital costs, we wish to see how the cost advantage has change over the past
decade. To do so, we must again look at the change in cost per TEU in each size category over
time.
The most pronounced trend in the graph above is not surprising: smaller ships burn more fuel per
TEU than larger ones. As mentioned above, this verifies the presence of an economy of scale.
Interestingly, there seems to be a point of diminishing returns. There is a large gap between the
11 Vessel utilization is not taken into account here. A smaller vessel which has 90% utilization might actually have lower per TEU fuel costs than a larger one which has 60% utilization.
0.015
0.017
0.019
0.021
0.023
0.025
0.027
0.029
2000 2001 2002 2003 2004 2005 2006 2007 2008 2009 2010 2011 2012 2013 2014 2015
Fuel
Con
sum
ptio
n (m
etric
tons
) Per
TEU
@ 2
3 kn
ots
Year of Construction
Marginal Adjusted Fuel Consumption
13300+ 10000-13299 7500-9999 5100-7499 Average

average consumption of the two smaller size groups, while consumption rates of the two larger
groups are very similar. This suggests that the benefit per TEU shrinks as vessel capacity
increases, just as is the case with construction costs.
A second trend worth discussing is the variability in consumption beginning in 2012. The
reason for the increase in the 13300+ TEU category was explained above, but it is interesting to
note that the three largest size groups all saw increases in fuel consumption in the past three
years. It is difficult to pinpoint an explanation of this uptick. Perhaps owners desired vessels with
higher horsepower and operating speeds due to fluctuations in fuel prices, as these vessels were
generally above average in these areas. It is also entirely possible that some reported
consumption rates are unreliable12.
Operating Costs
The last category to be examined is operating costs. This consists chiefly of expenses
attributable to crewing, insurance, stores and lubes, and repairs and maintenance. As with fuel
consumption, exact numbers for these costs are difficult to come by. While I was able to find
some data in reports from Drewry Research, it was necessary to make several extrapolations.
Drewry reported operating costs for vessels in seven size categories; 500-750, 1000-2000, 2000-
3000, 3000-4000, 5000-6000, 8000-9000, and 10000-12000 TEU. It is apparent that these size
groups are considerably different than those that have been used above. Indeed, they are not even
contiguous. I thus interpolated to estimate the costs for those vessels less than 12000 TEU which
did not fall into any of the above categories. Similarly, I extrapolated to calculate the costs of
12 I found a great deal of variability in consumption rates. For example, several of the ships with the highest per TEU consumption rate were owned by CMA CGM. These vessels, with a capacity of 9400 TEU, had a reported fuel consumption of 335 tons per day. In contrast, several 9400 TEU MSC vessels fitted with the same engine were reported to have a daily consumption of 189 tons. Clearly this represents a significant disparity.

vessels over 12000 TEU. It is also worth noting that the data is from 2012, so those values for
2013, 2014, and 2015 are all estimations.13
Based upon the data, I found that repairs and maintenance, followed by crewing,
represented the largest portion of operating costs.
Over the fifteen year period for which data was available, the stores and lubes category saw the
largest increase in cost, followed by the repairs and maintenance category. This increase may be
partially explained by the increasing size of ships. Larger ships require more stores and more
maintenance; there is more rust to be chipped and more steel to be painted. It is also not
surprising that there has not been a large increase in the cost of crewing. Larger ships are making
use of the same size crew, as automation and technological innovation spread throughout the
industry. It is rather interesting, however, that insurance rates have not increased too
dramatically. It might be expected that the mega ships carry with them considerable insurance
13 I used Drewry’s estimations to provide data through 2015.
0
2000
4000
6000
8000
10000
12000
2001 2002 2003 2004 2005 2006 2007 2008 2009 2010 2011 2012 2013 2014 2015
Ope
ratin
g Co
st (U
SD p
er d
ay)
Year
Distribution of Operating Costs
Manning Insurance Stores and Lubes Repairs and Maintenance Other

premiums. After all, the ships themselves are worth upwards of a hundred million dollars. The
best explanation for the marginal increase in rates may be the excellent safety record of the fleet;
large container ships are very rarely lost or damaged.
As with the other cost categories, our interest lies in whether or not an economy of scale
exists. To evaluate whether or not this is the case, we must once again turn to the data. The graph
below shows the operating costs per TEU for the years 2001, 2008, and 2015. It is not surprising
that operating costs have increased over the past 15 years, as these values are not inflation
adjusted. What is notable, however, is the impact that vessel size has on cost.
It is apparent that larger ships have considerably lower per TEU costs than smaller ones; again,
the economy of scale persists. The benefit is considerable. In 2015, a 5000 TEU vessel had a
daily per TEU operating cost of $2.19, a 10000 TEU ship a cost of $1.45, and a 15000 TEU ship
of $1.14: larger vessels undoubtedly have a cost advantage in operating costs. As with other cost
$-
$1.00
$2.00
$3.00
$4.00
$5.00
$6.00
$7.00
$8.00
$9.00
$10.00
0 2000 4000 6000 8000 10000 12000 14000 16000 18000 20000
Daily
Ope
ratin
g Co
st p
er T
EU
Vessel Capacity (TEU)
Daily Operating Cost per TEU
2001 2008 2015

categories, however, there is a marginal decrease in the benefit of larger vessels (here
represented by the “flattening” of the cost curve).
This advantage has not faltered over the past decade and a half. The graph below shows
the average cost for vessels of 5000, 10000, and 15000 TEU.
Again we see the same trends. Smaller vessels have higher average costs, with the marginal
benefit decreasing as size increases (represented by the smaller gap between the 10000 and
15000 TEU series than between the 5000 and 10000 TEU series). We can also readily see the
impacts of the 2008 financial crisis, which resulted in a temporary decrease in costs.
Nevertheless, operating costs per TEU have consistently been on the rise. As mentioned above,
this is likely the result of inflation (indeed, the annual increase in cost has hovered just above
3.5%, while the inflation rate has been around 2.7%). As this rise has been even across vessels of
all sizes, it should not impact ship owners’ preference for larger ships.
Conclusion
$0.50 $0.70 $0.90 $1.10 $1.30 $1.50 $1.70 $1.90 $2.10 $2.30
2000 2002 2004 2006 2008 2010 2012 2014 2016
Daily
Ope
ratin
g Co
st p
er T
EU (U
SD)
Year
Daily Operating Cost
5000 TEU 10000 TEU 15000 TEU

It is quite clear than an economy of scale exists in all three major cost categories. We
have seen that, unequivocally, marginal costs decrease as vessel size increases. There are thus
considerable benefits to ship owners’ in building ultra large containerships, so it is not surprising
that more and more of these vessels are being built. These benefits have persisted throughout the
decade, although it does seem that there is a decreasing marginal return as size increases. This
suggests that ultimately a tipping point will be reached where the additional TEU capacity is not
worth the cost. However, this point has yet to be reached, and vessel size continues to creep
upwards.
Lower costs to the ship owner in and of themselves are not definite confirmation that
bigger ships are better. This analysis falls short in a number of ways: I have not considered the
externalities that mega ships carry with them. Constraints on terminals and port facilities are very
real, as operators struggle to handle the large cargo volumes associated with these vessels. We
have also not considered the physical limitations on these mega ships, which may be constrained
by their size to certain routes. Indeed, there also concern that too many large vessels may lead to
overcapacity in the market. This has been fed by owners competing against one another to gain
as large a market share as possible. While today large alliances between companies have become
the norm, there is still considerable concern that demand is not keeping pace with the supply. It
is entirely conceivable that megaships, while giving the owner a cost advantage, hurt the industry
by driving down freight rates. Thus while there are benefits to ship owners in building larger
vessels, deeper analysis is needed to determine whether or not they are best for the industry at
large.

Sources and References
BRS Alphaliner Fleet Monthly Forecasts. 2011, 2012, 2013, 2014, 2015.
Clarkson’s World Shipping Intelligence Network. 2015
Cullinane, Kevin, and Mahim Khanna. "Economies of Scale in Large Container Ships." Journal of Transport Economics and Policy 33 (1998): 185-208.
Drewry Maritime Research Report on Operating Costs. 2012 IHS Fairplay World Shipping Encyclopedia. 2015.
International Transport Forum Report The Impact of Mega-Ships. Organization of Economic Cooperation and Development. 2015
Rodrigue, Jean Paul. "The Geography of Transport Systems." The Largest Available Containership 1970-2013. Hofstra University, Web.
Stopford, Martin. Maritime Economics. London: Routledge, 2009. Print