Embed Size (px)
Citation preview


UNITED STATES ENVIRONMENTAL, PROTECTION AGENCY WASHINGTON D.C., 20460
ENVIRONMENTAL FATE AND EFFECTS DIVISION OFFICE OF PESTICIDE PROGRAMS
Chemical: Methidathion PC Codes: 100301 Barcode: D287592
Date: September 24,2008
Subject: Guideline studies on the effect of Methidathion on the early life stage of fathead minnows.
From: James Goodyear Ecological Effects Biologist Environmental Review Branch 3 Environmental Fate and Effects Division 7507P
To: Tom Meyers, RB2 Risk Manager Reviewer
stration Division 7508P
Through:
Environmental Fate and Effects Division 7507P'
The registrants of SupracideB (Methidathion) have submitted a study on its 35-day chronic toxicity of to the early life stage of Fathead Minnows (Pimephales promelas) under flow-through conditions. The study was originally submitted in 1984, when it was classified as "Invalid," because no data or statistical analysis was included. The new submission included these parts. - It was reclassified ACCEPTABLE.
Fertilized eggs (140 eggsllevel, 4 repsllevel, 35 eggslrep; <48 hrs old) of fathead minnow were exposed time-weighted concentrations were <0.24-<0.42 (CLOQ; negative and solvent controls), 0.68, 1.6, 3.2,6.3 and 12 yg ai/L. The test system was maintained at 24 to 27 OC and a pH of 7.9-8.3. The 35-day ECS0 and NOAEC values, based on survival, total length and wet weight, were >12 and 6.3 yg ai/L, respectively. The sub-lethal effects included reduced juvenile survival and inhibitions of total length and dry weight. The most sensitive end points were percent survival, total length and wet weight.
The hardness and alkalinity were five times the level that EPA allowed when the study was originally submitted, but these levels are now allowed, because they meet the OECD protocol.
This toxicity study is scientifically sound and satisfies the requirements of $72-4a for an early life toxicity study with Pimephales promelas. It is classified as Acceptable.
TEXT SEARCHABLE DOCUMENT October 2008
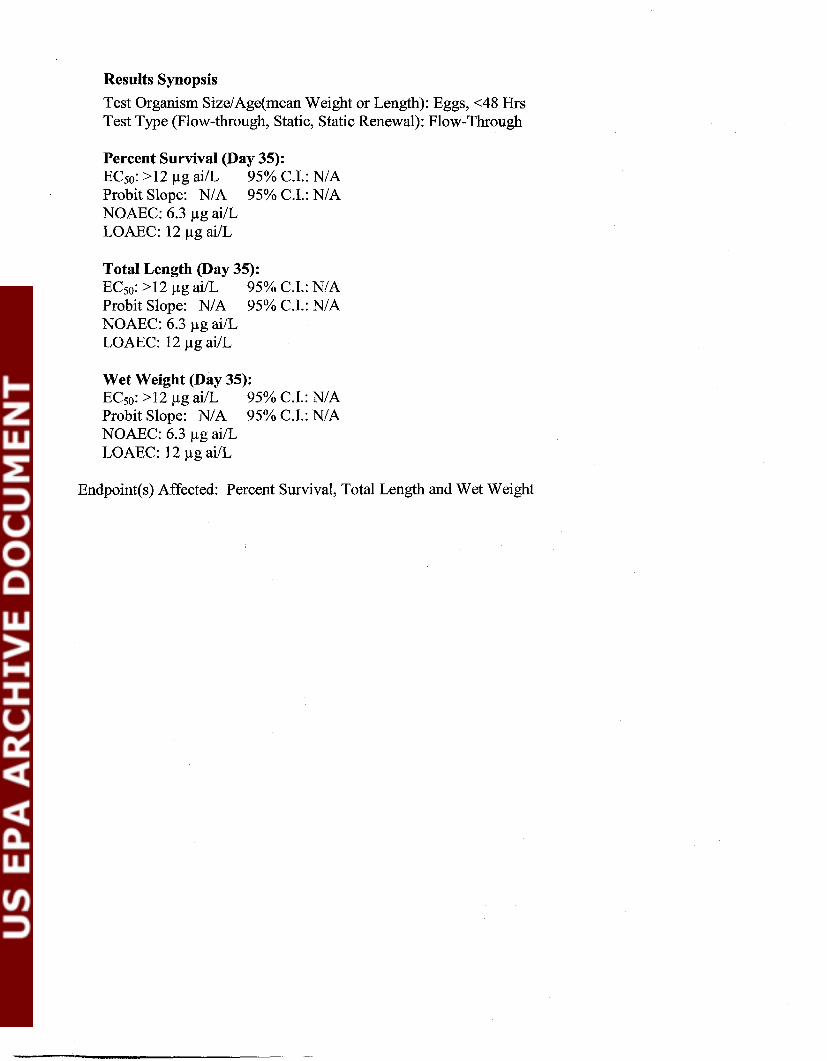
Results Synopsis Test Organism Size/Age(mean Weight or Length): Eggs, <48 Hrs Test Type (Flow-through, Static, Static Renewal): Flow-Through
Percent Survival (Day 35): ECS0: >12 pg ai/L 95% C.I.: N/A Probit Slope: N/A 95% C.I.: N/A NOAEC: 6.3 pg ai/L LOAEC: 12 pg ai/L
Total Length (Day 35): EC5O: >12 pg ailL 95% C.I.: N/A Probit Slope: N/A 95% C.I.: N/A NOAEC: 6.3 pg ai/L LOAEC: 12 pg ai/L
Wet Weight (Day 35): EC50: >12 pg ai/L 95% C.I.: N/A Probit Slope: N/A 95% C.I.: N/A NOAEC: 6.3 pg ai/L LOAEC: 12 pg ai/L
Endpoint(s) Affected: Percent Survival, Total Length and Wet Weight

Toxicity of Methidathion to Fish Early Life Stage
Data Requirement: PMRA Data Code (...I OECD Data Point {. . . .) EPA Barcode D287592 EPA MRID 001573-53 & 458227-01 EPA Guideline 72-4a
For control of certain insects of artichokes; certain citrus, h i t s and nuts; olives; safflowers; sunflowers; cotton; nursery stock;
Test Material: Supracidem 2E Purity (%): 97.2% Common name: Methidathion Reg. No. 10 163-236 Chemical name: IUPAC: Methidathion: 0, @-dimethyl phosphorodithioate, Z-ester with 4- 4-
(mercaptotnethy1)-2-methoxy-22- l,3,4-thiadiazol in-5-one CAS name CAS No. 950-37-8 Synonyms-
"Supracide 2E contains 2 lbs, ai per gallon;" "1 pt. Supracide 2E = 114 lb ai."
Primary Reviewer: John Marton Signature: Staff Scientist, Cambridge Environmental Inc. Date: 11/26/06
Secondary Reviewer: Teri S. Myers Senior Scientist, Cambridge Environmental Inc.
Signature: Date: 12/01/06 'S
Primary Reviewer: James Goodyear, Ph.D. Signature:
Biologist, EPAlOPPlEFEDlERB3 Date: 2008 Sep 23
Reference/Submission No.: ....................... Company Code [For PMRA] Active Code [For PMRA]
Use Site Category [For PMRA] EPA PC Code 100301
Date Evaluation Completed: 2008 Sep 23
CITATION:: McAllister, W.; L. Franklin, V. Knox, 1984. Early LiSe Stage Toxicity of Supracidem to fathead minnows (Pimephalesprornelas) in a flow-through system. Final Report #3 1330. Unpublished study prepared by Analytical Bio-Chemistry Laboratories, Inc. 30 pp. MRID 001573-53
MRID 458227-01: Winkler, V. (2002) Methidathion: Raw data for fathead minnow Early Life Stage study: Lab Project Number: VW 070902: 031330: 7809. Unpublished study prqared by Gowan Company. 337 pp.
DISCLAIMER: This document provides guidance for EPA and PMRA reviewers on how to complete a data evaluation record after reviewing a scientific study concerning the toxicity of a pesticide to fish, early life cycle. It is not intended to prescribe conditions to any external party for conductilng this study nor to establish absolute criteria regarding the assessment of whether the study is scientifically sound and whether the study satisfies any applicable data requirements. Reviewers are expected to review and to determine for each study, on a case-by-case basis, whether it is scientifically sound and provides sufficient information to satisfy applicable data requirements. Studies , that fail to meet any of the conditions may be accepted, if appropriate; similarly, studies that meet all of the conditions may be rejected, if appropriate. In sum, the reviewer is to take into account the totality of factors related to the test methodology and results in determining the acceptability of the study.

D287592 Toxicity of Methidathion to Fish, Early Life Stage MRID 001573-53 & 458227-01
EXECUTIVE SUMMARY: The 35-day chronic toxicity of SupracideB (Methidathion) to the early life stage of Fathead
Minnows (Pimephalespromelas) was studied under flow-through conditions. The study was originally submitted in 1984, when it was classified as "Invalid," because no data or statistical analysis was included. The new submission included these parts.
Fertilized eggs (140 eggsllevel, 4 repsllevel, 35 eggslrep; <48 hrs old) of fathead minnow were exposed to 0 (negative and solvent controls), 0.93, 1.9,3.8,7.5 and 15 pg ai/L nominal concentrations. Time-weighted, mean-measured concentrations were <0.24-<0.42 (<LOQ; negative and solvent controls), 0.68, 1.6,3.2,6.3 and 12 pg ai1L. The test system was maintained at 24 to 27 "C and a pH of 7.9-8.3. The 35-day EC50 and NOAEC values, based on survival, total length and wet weight, were >12 and 6.3 pg ailL, respectively. The sub-lethal effects included reduced juvenile survival and inhibitions of total length and dry weight. The most sensitive end-points were percent survival, total length, and wet weight.
The hardness and alkalinity were five times the level that EPA allowed when the study was originally submitted, but these levels are now allowed, because they meet the OECD protocol.
This toxicity study is scientifically sound and satisfies the requirements of 872-4a for an early life toxicity study with Pimephales promelas. It is classified as Acceptable.
Results Synopsis
Test Organism Size/Age(mean Weight or Length): Eggs, <48 Hrs Test Type (Flow-through, Static, Static Renewal): Flow-Through
Percent Survival (Day 35): ECS0: >12 pg ai1L 95% C.I.: NIA Probit Slope: N/A 95% C.I.: NIA NOAEC: 6.3 pg ai/L LOAEC: 12 pg ai1L
Total Length (Day 35): ECS0: >12 pg ai/L 95% C.I.: NIA Probit Slope: N/A 95% C.I.: Ni'A NOAEC: 6.3 pg ai/L LOAEC: 12 pg ai/L
Wet Weight (Day 35): ECSO: >12 pg ai/L 95% C.I.: NIA Probit Slope: NIA 95% C.I.: NIA NOAEC: 6.3 p g ai/L LOAEC: 12 pg ai/L
Endpoint(s) Affected: Percent Survival, Total Length and Wet Weight
Page 2 of 23

D287592 Toxicity of Methidatluon to Fish, Early Life Stage MRID 001573-53 & 458227-01
I. MATERIALS AND METHODS:
GUIDELINE FOLLOWED: This study was conducted following guidelines outlined in ASTM Standard Practice for Conducting Toxicity Tests on the Early Life Stages of Fishes, E- 47.01; and U.S. EPA Proposed Recommended Bioassay Procedure for Egg and Dry Stages of Freshwater Fish (1 972), unpublished manuscript, Environmental Research Laboratory, Duluth, MN. The following deviations from OPPTS 850.1400 were noted:
1. The physiochemical properties of the test material were not reported. 2. The test chambers were constructed with polyethylene, instead of a recommended
glass or stainless steel material; while polyethylene could interact with the test material, measured concentrations throughout the study were consistent.
3. The age of the test organisms at test initiation (<48 Hrs) may have been higher than recommended in the guidance (2-24 Hrs).
4. The method of collection of fertilized eggs was not specified. 5. The amount of solvent used in the preparation of the stock solutions was not reported. 6. The reported hardness (225-275 mg/L as CaC03) and pH (7.9-8.3) of the dilution
water were higher than recommended by EPA (40-48 mg/L as CaC03 and 7.2-7.6, respectively), but satisfy the OECD protocol.
These deviations do not affect the acceptability of the study.
COMPLIANCE: Signed and data Quality Assurance and GLP statements were provided. This study was conducted in compliance with the criteria promulgated by the Good Laboratory Practice regulations for Non-clinical Laboratory Studies (21 CFR, Part 58).
A. MATERIALS:
1. Test Material SupracideB (Methidathion)
Description: White Crystalline Solid
Lot No./Batch No. : FL830958 Methidathion (Lot No.) Purity: 97.2%
Stability of compound under test conditions: Analytical verification of the test material in the dilution water was conducted on Days 0, 1, and then every 7 days thereafter. The time-weighted concentrations yielded recoveries of 73-85% of nominal.
Storage conditions of test chemicals: The test material was stored in the dark at 4OC.
Page 3 of 23

D287592 Toxicity of Methidathion to Fish, Early Life Stage MRID 001573-53 & 458227-01
Physicochemical properties of Methidathion.
Parameter Values 1 comments
I Water solubility at 20EC I Not Reported I I Vapor pressure
UV absorption
(OECD recommends water solubility, stability in water and light, p ~ a , Pow, and vapor pressure of test compound)
Not Reported
Not Reported
P K ~
Kow
2. Test organism:
Not Reported
Not Reported
Species: Fathead Minnow (Pimephales promelas) Age /embryonic stage at test initiation: <48 Hrs
EPA recornmendsJish embryos 2 to 24 hours old.
Method of collection of the fertilized eggs: Not Reported
Source: In-house Cultures
B. STUDY DESIGN:
1. Experimental Conditions
a. Range-finding study: A 13-day flow-through toxicity test was conducted to determine the acute toxicity to fathead minnows. Nominal concentrations were 0.012, 0.025,0.05, 0.1, and 0.2 mg ai/L. The 13-Day LCs0 and NOAEC values were 0.15 and 0.012 mg ai/L, respectively.
b. Definitive study
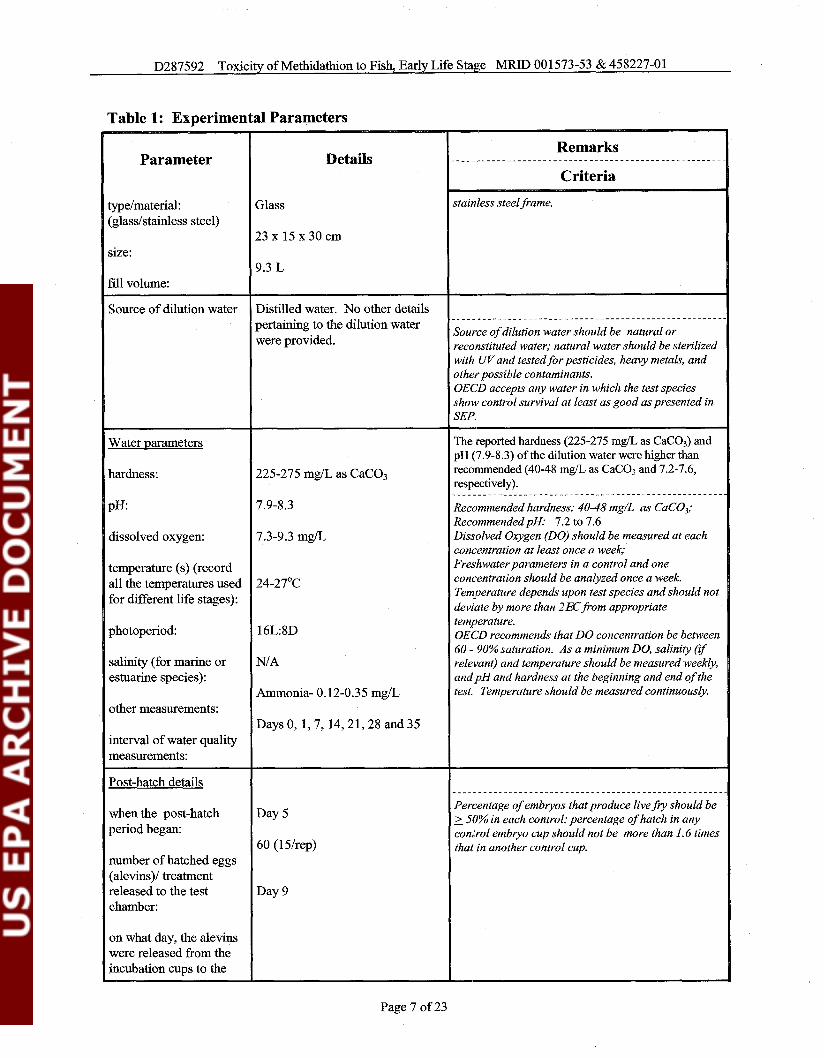
Table 1: Experimental Parameters
Conditions (same as test Fed at least twice daily with a
Page 4 of 23
D287592 Toxicity of Methidathion to Fish, Early Life Stage MRID 001573-53 & 458227-01
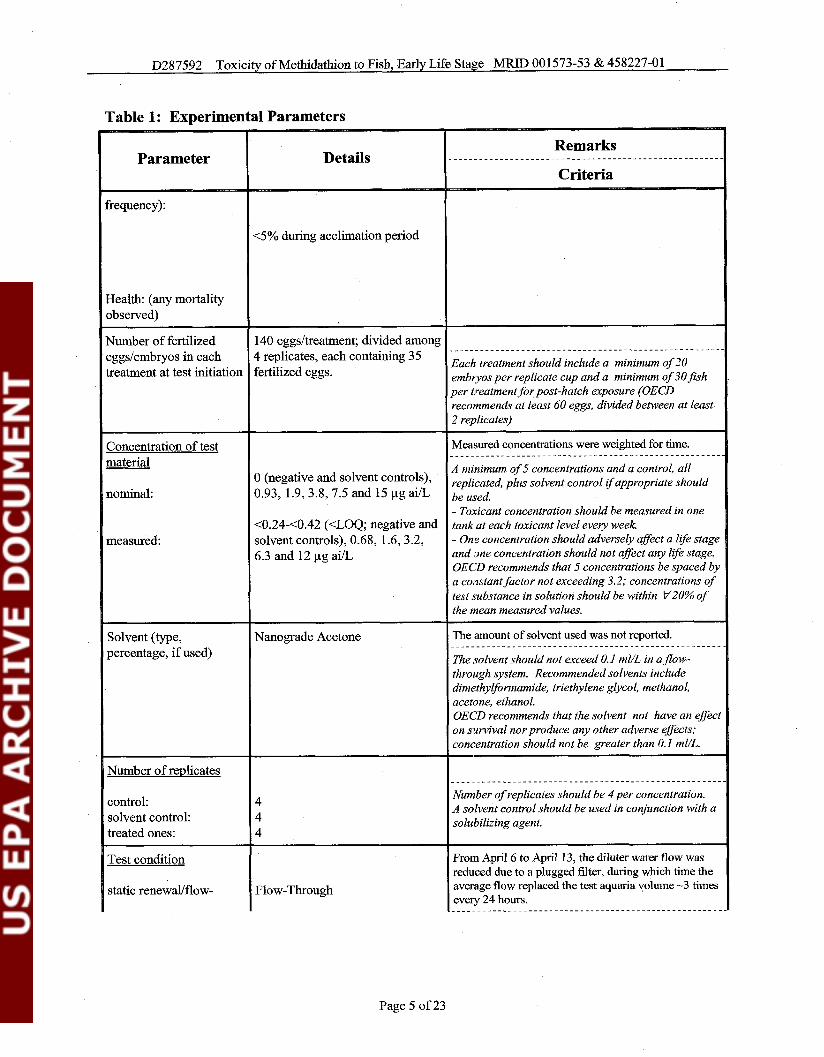
Table 1 : Experimental Parameters
Parameter Details
frequency):
Health. (any mortality observed) I Number of fertilized 140 eggsltreatment; divided among eggslembryos in each 4 replicates, each containing 35 treatment at test initiation fertilized eggs.
Concentration of test material
0 (negative and solvent controls), nominal: 0.93, 1.9,3.8,7.5 and 15 yg ai/L
measured: <0.24-<0.42 (<LOQ; negative and solvent controls), 0.68, 1.6,3.2, 6.3 and 12 yg a i n
Solvent (type, Nanograde Acetone percentage, if used)
Number of rmlicates
control: solvent control: treated ones:
Test condition
static renewallflow- Flow-Through
Remarks .-------..------------------------------------.------
Criteria
Each treatment should include a minimum of 20 embryos per replicate cup and a minimum of 30Jish per t,reatment forpost-hatch exposure (OECD recommends at least 60 eggs, divided between at least 2 replicates)
Measured concentrations were weighted for time. ------------.------.--------------.---------------..-
A minimum of 5 concentrations and a control, all replicated, plus solvent control i f appropriate should be used. - Toxicant concentration should be measured in one tank at each toxicant level every week. - One concentration should adversely affect a life stage and one concentration should not affect any life stage. OECD recommends that 5 concentrations be spaced by a constant factor not exceeding 3.2; concentrations of test substance in solution should be within V20% of the mean measured values.
The amount of solvent used was not reported. ..-------.-----.-------.-----------------------------
The solvent should not exceed 0.1 ml/L in aflow- through system. Recommended solvents include dimethylformamide, triethylene glycol, methanol, acetone, ethanol. OECD recommends that the solvent not have an efSect on survival nor produce any other adverse effects; concentration should not be greater than 0.1 ml/L.
----..------.-------.-.-----.-------..---------------
Number of replicates should be 4per concentration. A solvent control should be used in conjunction with a solubilizing agent.
From April 6 to April 13, the diluter water flow was reduced due to a plugged filter, during which time the average flow replaced the test aquaria volume -3 times every 24 hours.
Page 5 of 23

D287592 Toxicity of Methidathion to Fish, Early Life Stage MRID 001573-53 & 458227-01
Table 1: Experimental Parameters
Parameter Details
through: Intermittent proportional diluter
type of dilution system system described by Mount and for flow through method: Brungs
flow rate: -7 volume replacements every 24 hours
NIA renewal rate for static renewal:
. . . . . . . . . . . . . . . . . . . .
Criteria
Intermittent flow proportional diluters or continuous $ow serial diluters should be used. EPA recommends that flow rate to larval cups shouldprovide 90% replacement in 8 to 12 hours (OECD recommends 5 test chamber volurnes/24 hours). For static-renewal, OECD recommends 2 renewal procedures; either transfer eggs and larvae to new, clean vessels or retain organisms in vessels and change at least 213 test water. A minimum of 5 toxicant concentrations with a dilution factor not greater than 0.5 and controls shoula ba used. Toxicant Mixing: I) Mixing chamber is preferred; 2) Aeration should not be used for mixing; 3) The test solution shouM be completely mixed before introduction into the test system; 4) Flow splitting accuracy should be within 10%.
Aeration, if any
Duration of the test
I Water was aerated prior to I . . . . . . . . . . . . . . . . . . . . introduction into the aquaria
- -
35 Days
Dilution water should be aerated to ensure DO concentration at or near 100% saturation. Test tanks and embryo cups should not be aerated.
-...---------.-----..------..------- -.------.--------
Recommended test duration is 32 days for EPA. OECD recommendations for test duration are species specific and range from 28-60 days.
Embrvo CUDS. if used 1 Recommended embryo cups are 120 ml glass jars with
type/material boxes with 40 mesh bottoms replaced with 40 mesh stainless steel or nylon (glass/stainless steel): stainless steel screen fused to the
I sides
10' cm2 size:
Completely submersed in test fill volume: vessels.
Test vessel The water depth in the test vessels was 24 cm.
Recommended test vessel is all glass or glass with
Page 6 of 23
D287592 Toxicity of Methidathion to Fish, Early Life Stage MRID 001573-53 & 458227-01
Table 1: Experimental Parameters
Parameter I Details
typelmaterial: Glass (glasslstainless steel)
23 x 15x30cm size:
9.3 L fill volume:
Source of dilution water Distilled water. No other details
Water parameters
hardness: 1 225-275 mg/L as CaCOl
pH: 1 7.9-8.3 dissolved oxygen: I 7.3-9.3 mglL
temperature (s) (record all the temperatures used 24-27°C for different life stages):
photoperiod: 1 16L:8D
salinity (for marine or estuarine species):
other measurements:
interval of water quality measurements:
Post-hatch details
when the post-hatch period began:
number of hatched eggs (alevins)/ treatment released to the test chamber:
on what day, the alevins were released from the incubation cups to the
NIA
Ammonia- 0.12-0.35 mg/L
Days 0, 1,7,14,21,28 and 35
Day 5
60 (151rep)
Day 9
Remarks ----------.-----.-----------------.-----.------.-----
Criteria
stainless steel frame.
Source o f dilution water should be natural or reconstituted water; natural water should be sterilized with W a n d tested for pesticides, heavy metals, and other possible contaminants. OECD accepts any water in which the test species show control survival at least as good aspresented in SEP.
The reported hardness (225-275 mg/L as CaC03) and pH (7.9-8.3) of the dilution water were higher than recommended (40-48 mg/L as CaC03 and 7.2-7.6, respectively). --------.---------------------------------...------.-
Recommended hardness: 40-48 mg/L as CaC03; RecommendedpH: 7.2 to 7.6 Dissolved Oxygen (DO) should be measured at each concentration at least once a week; Freshwater parameters in a control and one concentration should be analyzed once a week. Temperature depends upon test species and should not deviate by more than 2EC from appropriate temperature. OECD recommends that DO concentration be between 60 - 90% saturation. As a minimum DO, salinity (iy relevant) and temperature should be measured weekly, and pH and hardness at the beginning and end of the test. Temperature should be measured continuously.
Percentage of embryos that produce live fry should be > 50% in each control; percentage of hatch in any - conkrol embryo cup should not be more than 1.6 times that in another control cup.
Page 7 of 23

D287592 Toxicity of Methidathion to Fish, Early Life Stage MRlD 001573-53 & 458227-01
Table 1: Experimental Parameters
A mixed diet of live newly hatched brine shrimp nauplii and ground commercial fish food (Rangen's@)
were 73-85% of nominal and individual measured values ranged
Days 0,1,7,14,21,28 and 35
Page 8 of 23

D287592 Toxicity of Methidathion to Fish, Early Life Stage MRID 001573-53 & 458227-01
2. Observations:
Table 2: Observations
Parameters
bservation intervalddates for:
11. RESULTS AND DISCUSSION:
A. MORTALITY:
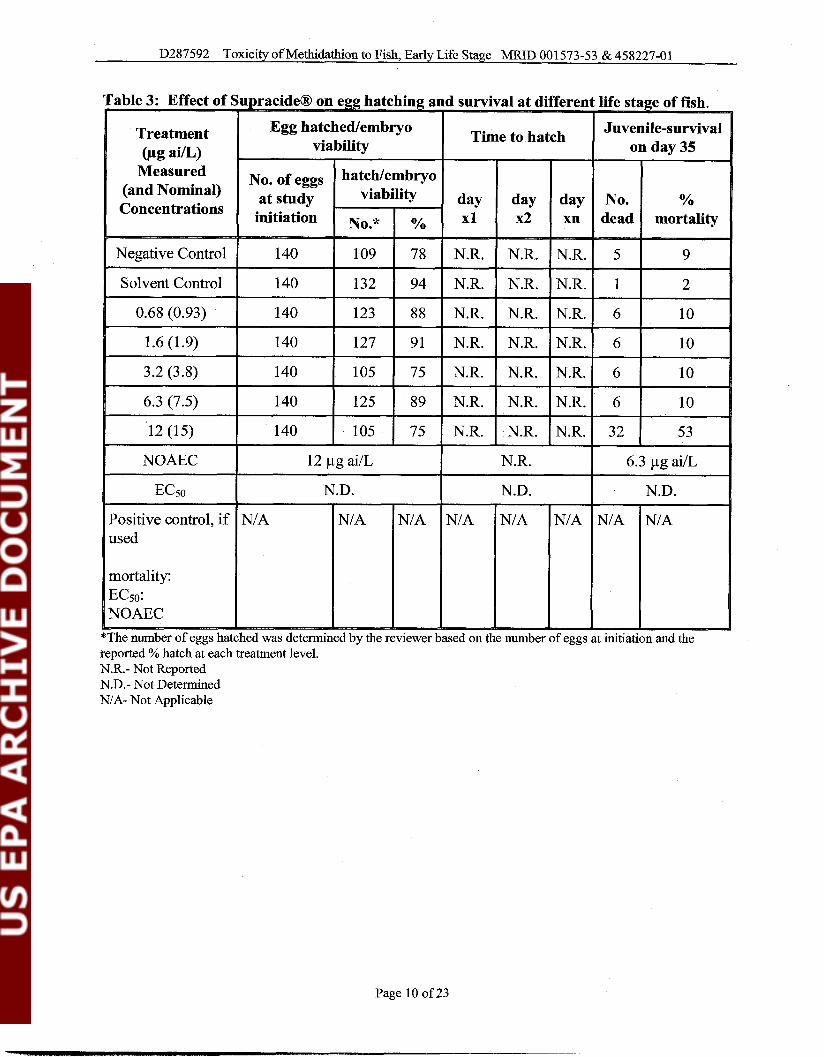
Percent egg hatch [(no. of fry + no. of eggs on day 0) x 1001 was 78 and 94% in the negative and solvent controls, respectively, and 88,91,75,89 and 75% in the measured 0.68, 1.6, 3.2, 6.3 and 12 yg ai/L treatment groups, respectively. No significant differences were detected at any treatment levels relative to the controls.
Fry survival [(no. of fry on day 35 -+ no. of fYy introduced) x 1001 was 91 and 98% in the negative and solvent controls, respectively, and 90,90,90,90,90 and 47% in the measured 0.68, 1.6, 3.2, 6.3 and 12 yg ai/L treatment groups, respectively. The percent survival at the highest treatment level, measured 12 yg ai/L, was significantly reduced relative to the pooled controls. The resulting NOAEC and LOAEC values were 6.3 and 12 pg ai/L.
Page 9 of 23
D287592 Toxicity of Methidathion to Fish, Early Life Stage MRID 001573-53 & 458227-01
Page 10 of 23

D287592 Toxicity of Methidathion to Fish, Early Life Stage MRID 001573-53 & 458227-01
N.D.- Not Determined; NIA- Not Applicable; *- Significantly different (a=0.05) from the control using one-way ANOVA and Fisher's protected Least Significant Difference.
B. SUB-LETHAL TOXICITY AND OTHER CHRONIC EFFECTS: Clinical signs of toxicity during the definitive toxicity test were not provided in the raw
data. Time to hatch and time to swim-up were not evaluated; however, the growth period began on Day 5 with greater than 95% hatch.
Total length and wet weight were the most sensitive endpoints. There were statistically significant reductions detected for both endpoints at the highest measured treatment level (12 pg ai/L) relative to the pooled control. Total length averaged 16 mm in both controls, and 15, 16, 16, 15 and 12 mm in the measured 0.68, 1.6,3.2,6.3 and 12 pg ai/L treatment groups, respectively. Wet weight averaged 76 and 74 mg in the negative and solvent controls, and 73,76,74, 70 and 38 mg in the measured 0.68, 1.6, 3.2,6.3, and 12 pg a iL treatment groups, respectively. The NOAEC and LOAEC for both endpoints were 6.3 and 12 pg ai/L, respectively.
Page 11 of 23
D287592 Toxicity of Methidathion to Fish, Early Life Stage MRID 001573-53 & 458227-01
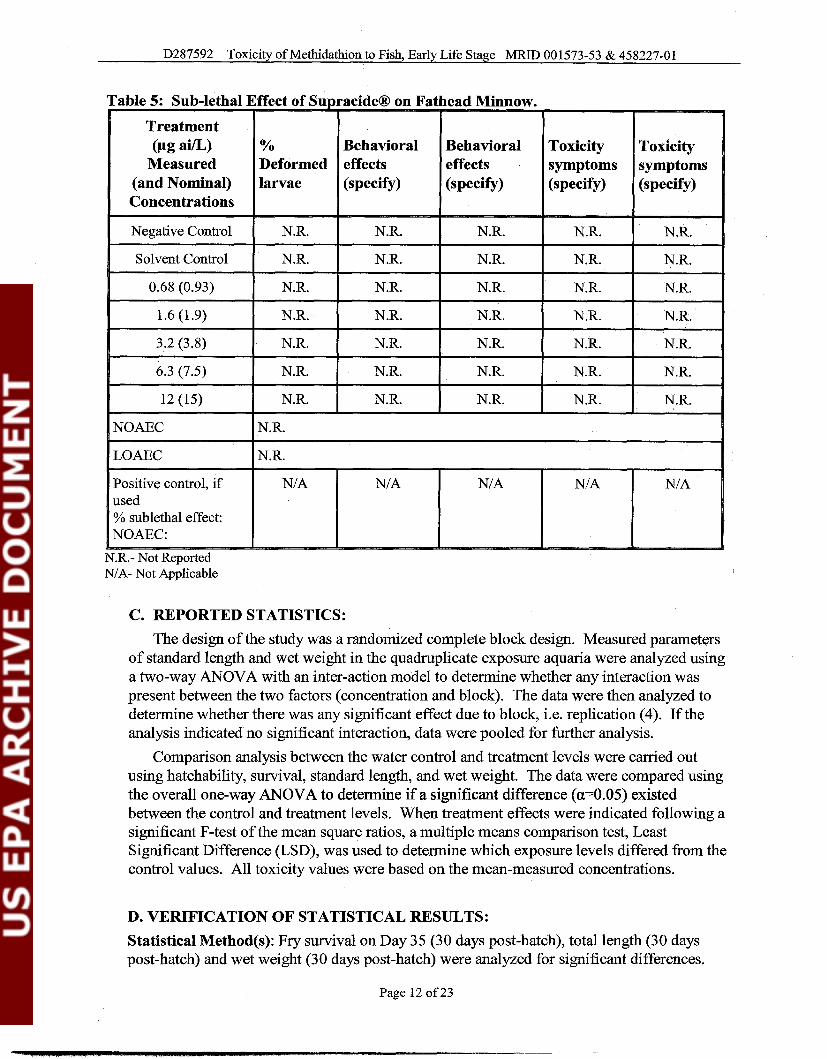
Table 5: Sub-lethal Effect of SupracideB on Fathead Minnow. I I I I
Treatment Behavioral effects (specify)
Negative Control N.R. N.R. N.R.
Solvent Control N.R. N.R. N.R.
1 0.68 (0.93) 1 N.R. I N.R. I N.R.
I 1.6 (1.9) I N.R. ( N.R. I N.R.
3.2 (3.8) N.R. N.R. N.R.
6.3 (7.5) N.R. N.R. N.R.
12 (15) N.R. N.R. N.R.
1 NOAEC I N.R.
Positive control, if I NIA I N'A I N/ A
% sublethal effect: NOAEC: I
Toxicity Toxicity symptoms symptoms (specify) (specify)
N.R. N.R.
N.R. N.R.
N.R. I N.R. I N.R. N.R. I
N.R.- Not Reported NIA- Not Applicable
C. REPORTED STATISTICS:
The design of the study was a randomized complete block design. Measured parameters of standard length and wet weight in the quadruplicate exposure aquaria were analyzed using a two-way ANOVA with an inter-action model to determine whether any interaction was present between the two factors (concentration and block). The data were then analyzed to determine whether there was any significant effect due to block, i.e. replication (4). If the analysis indicated no significant interaction, data were pooled for further analysis.
Comparison analysis between the water control and treatment levels were carried out using hatchability, survival, standard length, and wet weight. The data were compared using the overall one-way ANOVA to determine if a significant difference (a=0.05) existed between the control and treatment levels. When treatment effects were indicated following a significant F-test of the mean square ratios, a multiple means comparison test, Least Significant Difference (LSD), was used to determine which exposure levels differed from the control values. All toxicity values were based on the mean-measured concentrations.
D. VERIFICATION OF STATISTICAL RESULTS:
Statistical Method(s): Fry survival on Day 35 (30 days post-hatch), total length (30 days post-hatch) and wet weight (30 days post-hatch) were analyzed for significant differences.
Page 12 of 23
D287592 Toxicity of Methidathion to Fish, Early Life Stage MRID 00 1573-53 & 458227-01
For fi-y, survival and wet-weight, the negative and solvent controls were analyzed using a Student's t-test and no significant differences were detected. No variability existed between the controls for total length.
Data from all three endpoints were analyzed for normality using Chi-square and Shapiro Wilks tests and for homogeneity of variance using Hartley and Bartlett's tests. Fry survival and wet weight met the assumptions of ANOVA and were therefore analyzed using the Bonferroni t-test and Williams test. Total length did not meet the assumptions of ANOVA and was analyzed using the non-parametric Kruskal-Wallis test. The raw data for replicate C of the highest treatment level (measured 12 pg ai/L) was excluded from all analyses, because it was not clear to the reviewer how many fish were observed and measured. All toxicity values were determined using the time-weighted averages. Raw data were not provided for mean percent hatch; therefore, the reviewer was unable to analyze this endpoint.
Percent Survival (Day 35): EC50: >12 pg ai/L (95% C.I.: NIA) Probit Slope: NIA 95% C.I.: N/A NOAEC: 6.3 pg ai/L LOAEC: 12 pg ai/L
Total Length (Day 35): EC5O: >12 pg ailL 95% C.I.: N/A Probit Slope: NIA 95% C.I.: NIA NOAEC: 6.3 pg ai/L LOAEC: 12 pg a=
Wet Weight (Day 35): EC5O: >12 pg ai/L 95% C.I.: NIA Probit Slope: N/A 95% C.I.: NIA NOAEC: 6.3 pg ai/L LOAEC: 12 pg ai/L
E. STUDY DEFICIENCIES: There were no study deficiencies.
F. REVIEWER'S COMMENTS:
The reviewer's results were obtained using the time-weighted measured concentrations while those of the study authors were based on the mean-measured concentrations. Therefore, the reviewer's results are reported in the Executive Summary and Conclusions sections of this DER.
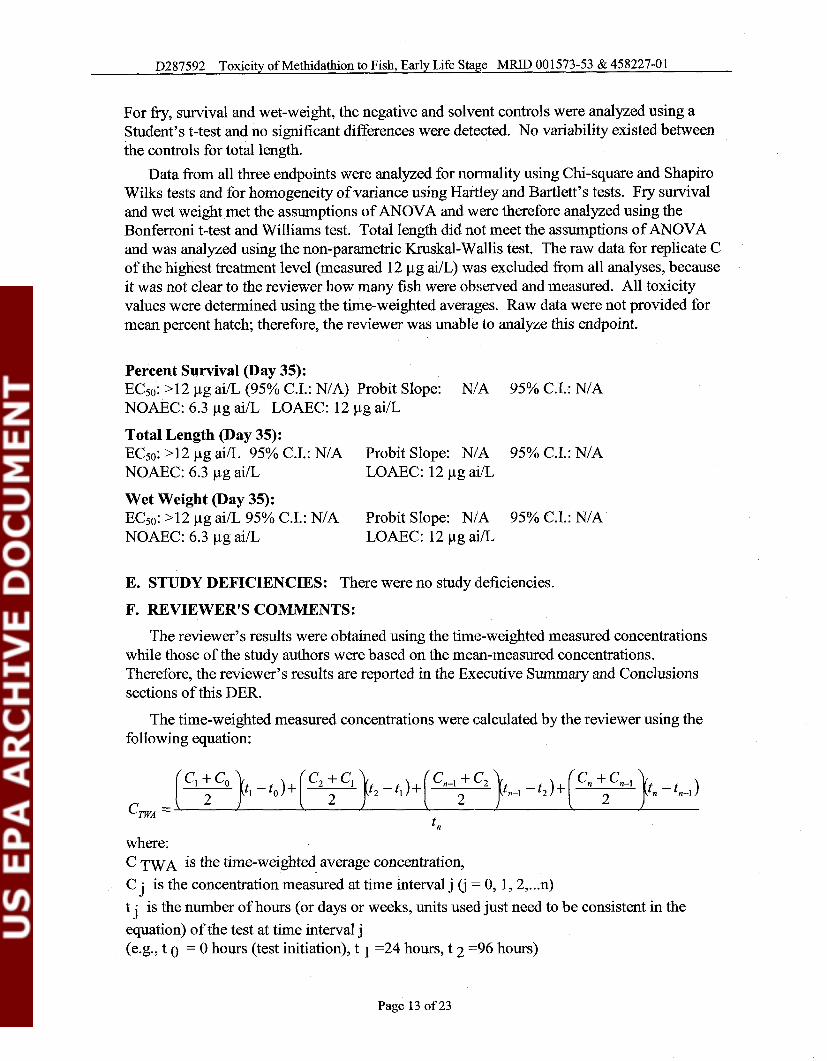
The time-weighted measured concentrations were calculated by the reviewer using the following equation:
where: C TWA is the time-weighted average concentration, C j is the concentration measured at time interval j fi = 0, 1,2, ... n) t j is the number of hours (or days or weeks, units used just need to be consistent in the equation) of the test at time interval j (e.g., t 0 = 0 hours (test initiation), t 1 =24 hours, t 2 -96 hours)
Page 13 of 23

D287592 Toxicity of Methidathion to Fish, Early Life Stage MRID 001573-53 & 458227-01
The study authors reported that replicate D of the solvent control was not included in the statistical analyses due to non-toxicant related mortality.
The results fiom a period screening analysis of the dilution water indicated the presence of the following elements: lead (0.01 7 ppm), mercury (0.0008 ppm) and zinc (0.00 1 ppm).
A method validation study for the analysis of the test material in the dilution water was conducted using spikes of 0.10, 1.00, 10.0, 100, and 1000 pg ai/L. The overall mean recovery (&S.D.) was 93.7% (rt10.3).
The in-life portion of the definitive toxicity test was conducted fkom March 21 to April 25, 1984.
G. CONCLUSIONS: The study is scientifically sound and fulfils the guideline requirements. It is classified as ACCEPTABLE. Fry survival (Day 35), total length (Day 35) and wet-weight (Day 35) were equally sensitive to the test material with NOAEC, LOAEC, and ECso values of 6.3, 12 and >12 pg ai/L, respectively.
Page 14 of 23
D287592 Toxicity of Methidathion to Fish, Early Life Stage MRID 001573-53 & 458227-01
U.S. Congress. 1979. Toxic Substances Control Act. Public Law 94-469. Federal Register, March 16,1979. Part N. pp. 16291.
U.S. Environmental Protection Agency. 1978. Registration of Pesticides in the United States, proposed guidelines. Federal Register, July 10, 1978: 29692-29741.
Mount, D.I. and C.E. Stephan. 1967. A method for establishing acceptable toxicant limits for fish-malatnion and the butoxy-ethanol ester of 2,4-D. Transactions of the American Fisheries Society. 96: 185- 193.
American Society for Testing and Materials. 1981. Standard Practice for Conducting Toxicity Tests on the Early Life Stages of Fishes. Draft No. 1, February 198 1, ASTM Committee E- 47.01. 51pp.
U.S. Environmental Protection Agency. 1972. Proposed Recommended Bioassay Procedure for Egg and Fry Stages of Freshwater Fish. Unpublished manuscript, Environmental Research Laboratory, Duluth, Minnesota, January, 1972. 7pp.
Eddy, Samuel. 1969. The Freshwater Fishes. 2nd ed. W.C. Brown Company, Dubuque, Iowa. 2 ~ P P .
Mount, D.I. and W.A. Brungs. 1967. A Simplified Dosing Apparatus for Fish Toxicological Studies. Water Res. 1 : 21 -29.
Neter, J. and W. Wasserman. 1974. Applied Linear Statistics. Richard D. Irwin, Inc. 507-508.
National Academy of Sciences- National Academy of Engineering. 1972. Water Quality Criteria,
Organization for Economic Cooperation and Development. 198 1. OECD Guidelines for Testing of Chemicals, Principles of Good Laboratory Practice Annex 2, C(81) 30 (Final):7-28.A Report of the Committee on Water Quality Criteria. Washington, D.C. 1972. 5 9pp.
U.S. Food and Drug Administration. 1978. Nonclinical Laboratory Studies, Good Laboratory Practice Regulations (21 CFR, Part 58). Federal Register, Vol. 43, No. 247: 59986-60025.
U.S. Environmental Protection Agency. 1983. Pesticide Programs; Good Laboratory Practice Standards; Final Rule (40 CFR, Part 160). Federal Register, Vol. 48, No. 230: 53946-53969.
U.S. Environmental Protection Agency. 1983. Toxic Substances Control; Good Laboratory Practice Standards; Final Rule (40 CFR, Part 792). Federal Register, Vo. 48; No. 230:53922- 53944.
Page 15 of 23

D287592 Toxicity of Methidathion to Fish, Early Life Stage MRID 001573-53 & 458227-01
APPENDIX I. OUTPUT OF REVIEWER'S STATISTICAL VERIFICATION: Fry survival ( % ) , 30 days post-hatch; ug ai/L File: 2701fs Transform: NO TRANSFORM
t-test of Solvent and Blank Controls Ho:GRPl MEAN = GRP2 MEAN ............................................................................... GRPl (SOLVENT CRTL) MEAN = 91.5000 CALCULATED t VALUE = -1.4916 GRP2 (BLANK CRTL) MEAN = 98.250 0 DEGREES OF FREEDOM = 6 DIFFERENCE IN MITANS - - -6.7500
............................................................................... TABLE t VALUE (0.05 (2), 6) = 2.447 NO significant difference at alpha=0.05 TABLE t VALUE (0.01 (2), 6) = 3.707 NO significant difference at alpha=0.01
Fry survival ( % ) , 30 days post-hatch; ug ai/L File: 270lfs Transform: NO TRANSFORMATION
Chi-square test for normality: actual and expected frequencies ..............................................................................
INTERVAL <-I. 5 -1.5 to <-0.5 -0.5 to 0.5 20.5 to 1.5 >1.5
EXPECTED 1.541 5.566 OBSERVED 0 7
.............................................................................. Calculated Chi-square goodness of fit test statistic = 7.8671 Table Chi-Square value (alpha = 0.01) = 13.277
Data PASS normality test. Continue analysis.
Fry survival ( % ) , 30 days post-hatch; ug ai/L File: 2701fs Transform: NO TRANSFORMATION
Shapiro Wilks test for normality ..............................................................................
Critical W (P = 0.05) (n = 23) = 0.914 Critical W (P = 0.01) (n = 23) = 0.881 ..............................................................................
Data PASS normality test at P=0.01 level. Continue analysis.
Fry survival ( % ) , 30 days post-hatch; ug ai/L File: 2701fs Transform: NO TRANSFORMATION
Hartley test for homogeneity of variance
Calculated H statistic (max Var/min Var) = 20.92 Closest, conservative, Table H statistic = 184.0 (alpha = 0.01)
Used for Table H ==> R (#groups) = 6, df (#reps-1) = 3 Actual values ==> R (#groups) = 6, df (#avgreps-1) = 2.83
(average df used)
Data PASS homogeneity test. Continue analysis.
Page 16 of 23

D287592 Toxicity of Methidathion to Fish, Early Life Stage MRID 001573-53 & 458227-01
NOTE: This test requires equal replicate sizes. If they are unequal but do not differ greatly, the Hartley test may. still be used as an approximate test (average df are used).
Fry survival ( % ) , 30 days post-hatch; ug ai/L File: 2701fs Transform: NO TRANSFORMATION
Bartletts test for homogeneity of variance
Calculated B statistic = 7.59 Table Chi-square value = 15.09 (alpha = 0.01) Table Chi-squarevalue = 11.07 (alpha = 0.05)
Average df used in calculation ==> df (avg n - 1) = 2.83 Used for Chi-square table value ==> df (#groups-1) = 5
Data PASS homogeneity test at 0.01 level. Continue analysis
NOTE: If groups have unequal replicate sizes the average replicate size is used to calculate the B statistic (see above).
Fry survival ( % ) , 30 days post-hatch; ug ai/L File: 2701fs Transform: NO TRANSFORMATION
ANOVA TABLE ..............................................................................
SOURCE DF SS MS F .............................................................................. Between 5 4815.192 963.038 8.459
Within (Error) 17 1935.417 113.848 .............................................................................. Total 2 2 6750.609 ..............................................................................
Critical F value = 2.81 (0.05,5,17) Since F > Critical F REJECT Ho:A11 groups equal
Fry survival ( % ) , 30 days post-hatch; ug ai/L File: 2701fs Transform: NO TRANSFORMATION
BONFERRONI T-TEST - TABLE 1 OF 2 Ho:ControliTreatment
TRANSFORMED MEAN CALCULATED IN GROUP IDENTIFICATION MEAN ORIGINAL UNITS T STAT SIG ----- .................... ----------- ------------------ ------ --- 1 neg control 91.500 91.500 2 0.68 88.250 88.250 0.431 3 1.6 87.500 87.500 0.530 4 3.2 90.000 90.000 0.199 5 6.3 90.000 90.000 0.199 6 12 46.667 46.667 5.501 *
Bonferroni T table value = 2.57 (1 Tailed Value, P=0.05, df=17,5)
Fry survival ( % ) , 30 days post-hatch; ug ai/L File: 2701fs Transform: NO TRANSFORMATION
BONFERRONI T-TEST - TABLE 2 OF 2 Ho:Control<Treatment ............................................................................
Page 17 of 23

D287592 Toxicity of Methidathion to Fish, Early Life Stage MRID 001573-53 & 458227-01
GROUP IDENTIFICATION ----- ....................
1 neg control 2 0 . 6 8 3 1 . 6 4 3 . 2 5 6 . 3 6 1 2
...........................
NUM OF REPS - - - - - - -
4 4 4 4 4 3
. - - - - - - - - -
Minimum Sig Diff (IN ORIG. UNITS) ----------------
1 9 . 3 6 8 1 9 . 3 6 8 1 9 . 3 6 8 1 9 . 3 6 8 20 .919
% of CONTROL - - - - - - -
21.2 2 1 . 2 21 .2 2 1 . 2 2 2 . 9
. - - - - - - - -
DIFFERENCE FROM CONTROL ------------
3.250 4 .000 1 .500 1 . 5 0 0
44 .833 ---------------
Fry survival ( % ) , 30 days post-hatch; ug ai/L File: 2 7 0 1 f s Transform: NO TRANSFORMATION
WILLIAMS TEST (Isotonic regression model) TABLE 1 OF 2 ............................................................................ GROUP ORIGINAL TRANSFORMED ISOTONIZED
IDENTIFICATION N MEAN MEAN MEAN
neg control 4 91 .500 91 .500 91 .500 0 . 6 8 4 88 .250 88 .250 88 .938
1 . 6 4 87 .500 87 .500 88 .938 3 . 2 4 90 .000 90 .000 88 .938 6 . 3 4 90 .000 90 .000 88 .938
1 2 3 46 .667 46 .667 46 .667
Fry survival ( % ) , 30 days post-hatch; ug ai/L File: 2 7 0 1 f s Transform: NO TRANSFORMATION
WILLIAMS TEST (Isotonic regression model) TABLE 2 OF 2
IDENTIFICATION .................... -
neg control 0 . 6 8
1 . 6 3 . 2 6 . 3
1 2
ISOTONIZED MEAN
. - - - - - - - - - - 91 .500 88 .938 88 .938 8 8 . 9 3 8 88 .938 46 .667
CALC . SIG WILLIAMS P= - 0 5
s = 1 0 . 6 7 0 Note: df used for table values are approximate when
TABLE WILLIAMS
-----------
DEGREES OF FREEDOM
-------------
Total length (rmn), 30 days post hatch; ug ai/L File: 2 7 0 1 t l Transform: NO TRANSFORMATION
Chi-square test for normality: actual and expected frequencies ..............................................................................
INTERVAL 1 - 1 . 5 -1 .5 to <-0 .5 - 0 . 5 to 0 . 5 > 0 . 5 to 1 . 5 > 1 . 5
EXPECTED 1 . 5 4 1 5 . 5 6 6 OBSERVED 0 9
.............................................................................. Calculated Chi-square goodness of fit test statistic = 5 .3048 Table Chi-Square value (alpha = 0 . 0 1 ) = 13 .277
Data PASS normality test. Continue analysis.
Page 18 of 23
D287592 Toxicity of Methidathion to Fish, Early Life Stage MRID 001573-53 & 458227-01
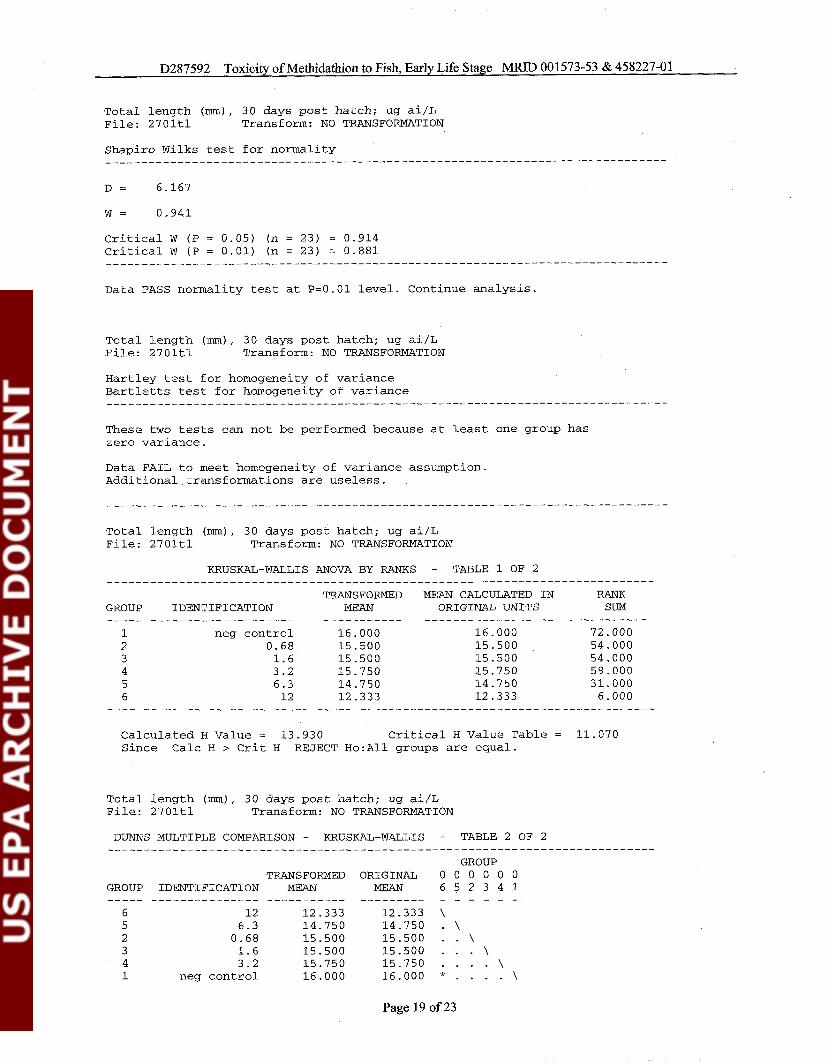
Total length (mm), 30 days post hatch; ug a i / ~ File: 2701tl Transform: NO TRANSFORMATION
Shapiro Wilks test for normality ..............................................................................
Critical W (P = 0.05) (n = 23) = 0.914 Critical W (P = 0.01) (n = 23) = 0.881 ..............................................................................
Data PASS normality test at P=0.01 level. Continue analysis.
Total length (nun), 30 days post hatch; ug ai/L File: 2701tl Transform: NO TRANSFORMATION
Hartley test for homogeneity of variance Bartletts test for homogeneity of variance ..............................................................................
These two tests can not be performed because at least one group has zero variance.
Data FAIL to meet homogeneity of variance assumption. Additional transformations are useless.
Total length (nun), 30 days post hatch; ug ai/L File: 2701tl Transform: NO TRANSFORMATION
KRUSKAL-WALLIS ANOVA BY RANKS - TABLE 1 OF 2
TRANSFORMED MEAN CALCULATED IN RANK GROUP IDENTIFICATION MEAN ORIGINAL UNITS SUM ----- .................... ----------- ------------------ ----------- 1 neg control 16.000 16.000 72.000 2 0.68 15.500 15.500 54.000 3 1.6 15.500 ZL5.500 54.000 4 3.2 15.750 15.750 59.000 5 6.3 14.750 14.750 31.000 6 12 12.333 12.333 6.000
Calculated H Value = 13.930 Critical H Value Table = 11.070 Since Calc H > Crit H REJECT Ho:A11 groups are equal.
Total length (mm), 30 days post hatch; ug ai/L File: 2701tl Transform: NO TRANSFORMATION
DUNNS MULTIPLE COMPARISON - KRUSKAL-WALLIS - TABLE 2 OF 2 ............................................................................
GROUP TRANSFORMED ORIGINAL 0 0 0 0 0 0
GROUP IDENTIFICATION MEAN MEAN 6 5 2 3 4 1 ----- --------------- ----------- --------- - - - - - - 6 12 12.333 12.333 \ 5 6.3 14.750 14.750 . \ 2 0.68 15.500 15.500 . . \ 3 1.6 15.500 15.500 . . . \ 4 3.2 15.750 15.750 . . . . \ 1 neg control 16.000 16.000 * . . . . \
Page 19 of 23
D287592 Toxicity of Methidathion to Fish, Early Life Stage MND 001573-53 & 458227-01
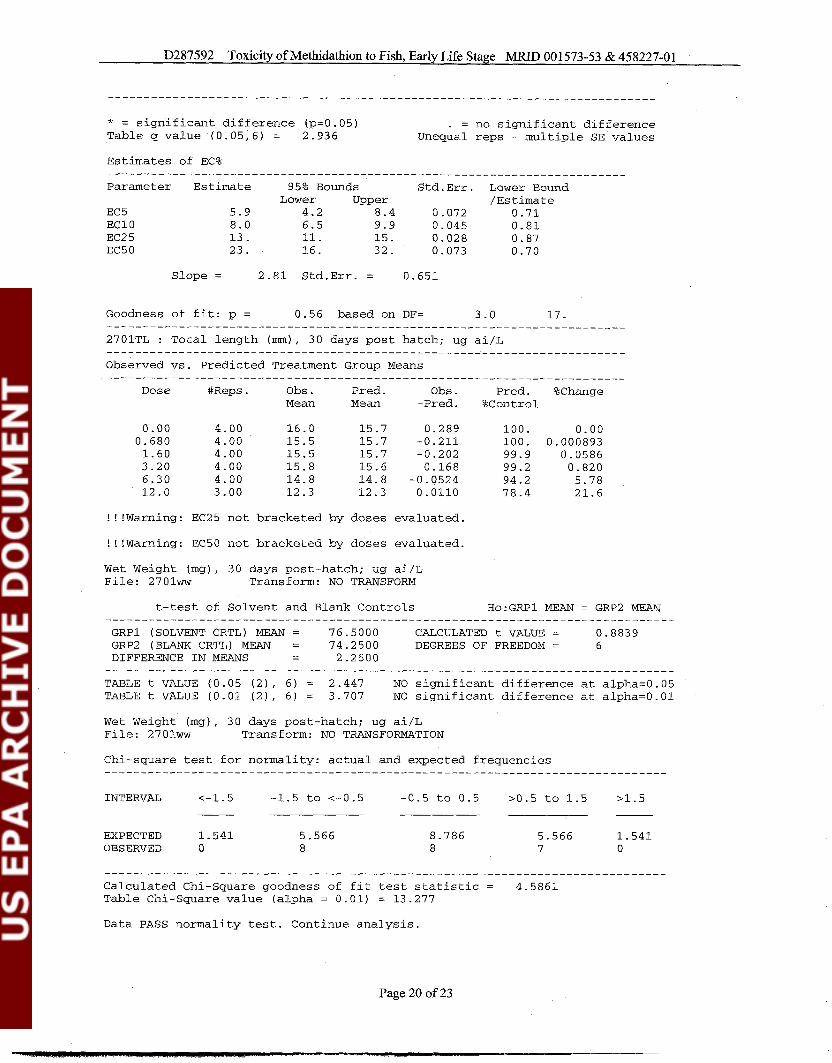
* = significant difference (p=0.05) . = no significant difference Table q value (0.05,6) = 2.936 Unequal reps - multiple SE values
Estimates of EC% ........................................................................ Parameter Estimate 9 5 % Bounds Std.Err. Lower Bound
Lower Upper /Estimate EC 5 5.9 4.2 8.4 0.072 0.71 EClO 8.0 6.5 9.9 0.045 0.81 EC2 5 13. 11. 15. 0.028 0.87 EC50 23. 16. 32. 0.073 0.70
Slope = 2.81 Std.Err.= 0.651
Goodness of fit: p = 0.56 based on DF= 3.0 17. ........................................................................ 2701TL : Total length (mrn) , 30 days post hatch; ug ai/L ........................................................................ Observed vs. Predicted Treatment Group Means ........................................................................
Dose #Reps. Obs . Pred . Obs . Pred . %Change Mean Mean -Pred. %Control
!!!Warning: EC25 not bracketed by doses evaluated.
! ! !Warning: EC50 not bracketed by doses evaluated.
Wet Weight (mg), 30 days post-hatch; ug ai/L File: 2 7 0 1 ~ Transform: NO TRANSFORM
t-test of Solvent and Blank Controls Ho:GRPl MEAN = GRP2 MEAN ............................................................................... GRPl (SOLVENT CRTL) MEAN = 76.5000 CALCULATED t VALUE = 0.8839 GRP2 (BLANKCRTL) MEAN = 74.2500 DEGREES OF FREEDOM = 6 DIFFERENCE IN MEANS - - 2.2500
............................................................................... TABLEtVALUE (0.05 (2), 6) = 2.447 NO significantdifferenceatalpha=0.05 TABLEtVALUE (0.01 (2), 6) = 3.707 NO significantdifferenceatalpha=O.Ol
Wet Weight (mg), 30 days post-hatch; ug ai/L File: 2701ww Transform: NO TRANSFORMATION
Chi-square test for normality: actual and expected frequencies ..............................................................................
INTERVAL 1-1.5 -1.5 to <-0.5 -0.5 to 0.5 >0.5 to 1.5 >1.5
EXPECTED 1.541 5.566 OBSERVED 0 8
.............................................................................. Calculated Chi-square goodness of fit test statistic = 4.5861 Table Chi-Square value (alpha = 0.01) = 13.277
Data PASS normality test. Continue analysis.
Page 20 of 23
D287592 Toxicity of Methidathion to Fish, Early Life Stage MRID 001573-53 & 458227-01
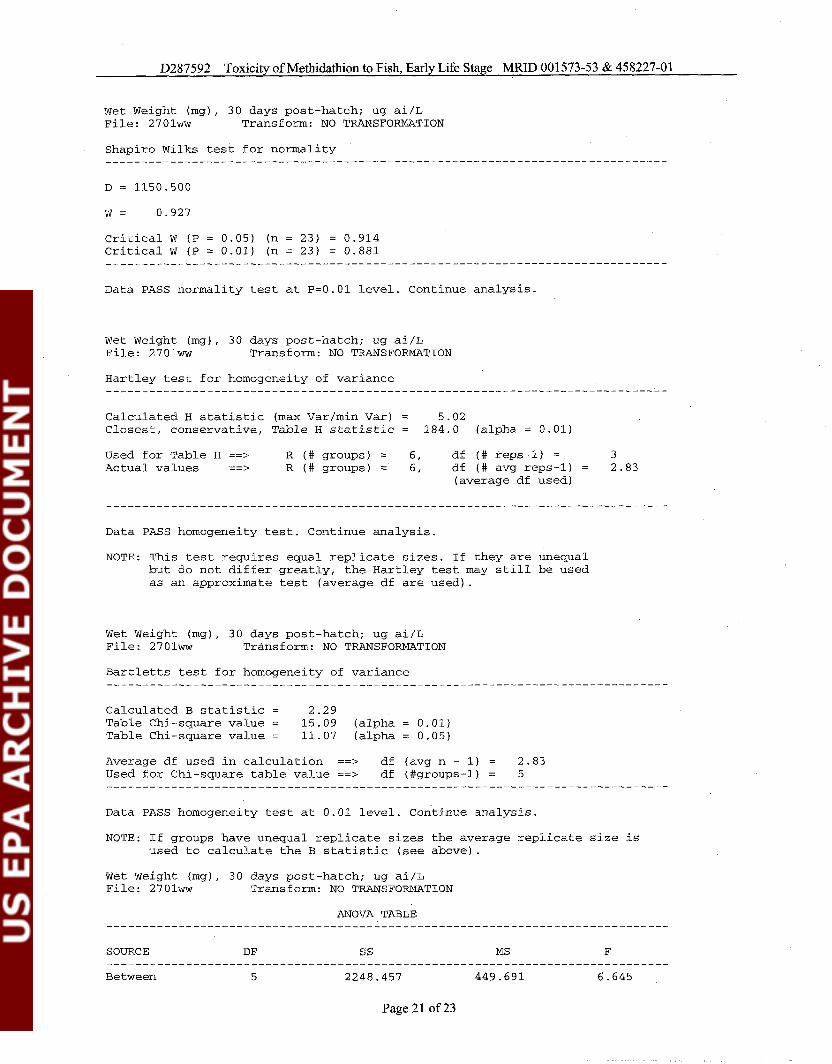
Wet Weight (mg), 30 days post-hatch; ug ai/L File: 2 7 0 1 ~ Transform: NO TRANSFORMATION
Shapiro Wilks test for normality
Critical W (P = 0.05) (n = 23) = 0.914 Critical W (P = 0.01) (n = 23) = 0.881 ..............................................................................
Data PASS normality test at P=0.01 level. Continue analysis.
Wet Weight (mg), 30 days post-hatch; ug ai/L File: 2701ww Transform: NO TRANSFORMATION
Hartley test for homogeneity of variance ..............................................................................
Calculated H statistic (max Var/min Var) = 5.02 Closest, conservative, Table H statistic = 184.0 (alpha = 0.01)
Used for Table H ==> R (#groups) = 6, df (#reps-1) = 3 Actual values ==> R (#groups) = 6, df (#avgreps-1) = 2.83
(average df used)
Data PASS homogeneity test. Continue analysis.
NOTE: This test requires equal replicate sizes. If they are unequal but do not differ greatly, the Hartley test may still be used as an approximate test (average df are used).
Wet Weight (mg), 30 days post-hatch; ug ai/L File: 2 7 0 1 ~ Transform: NO TRANSFORMATION
Bartletts test for homogeneity of variance ..............................................................................
Calculated B statistic = 2.29 Table Chi-square value = 15.09 (alpha = 0.01) Table Chi-square value = 11.07 (alpha = 0.05)
Average df used in calculation ==> df (avg n - 1) = 2.83 Used for Chi-square table value ==> df (#groups-1) = 5
Data PASS homogeneity test at 0.01 level. Continue analysis
NOTE: If groups have unequal replicate sizes the average replicate size is used to calculate the B statistic (see above).
Wet Weight (mg), 30 days post-hatch; ug ai/L File: 2701ww Transform: NO TRANSFORMATION
ANOVA TABLE ..............................................................................
SOURCE DF S S MS F .............................................................................. Between 5 2248.457 449.691 6.645
Page 21 of 23
D287592 Toxicity of Methidathion to Fish, Early Life Stage MRID 001573-53 & 458227-01
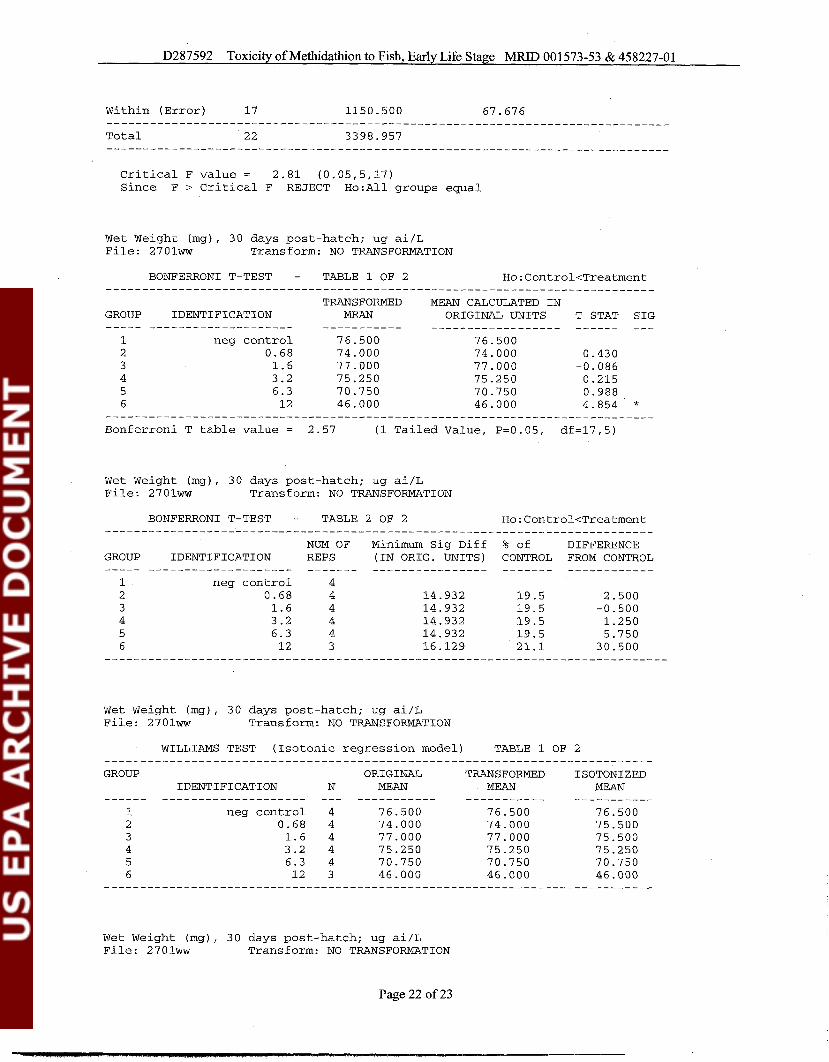
Within (Error) 17 1150.500 67.676 .............................................................................. Total 22 3398.957 ..............................................................................
Critical F value = 2.81 (0.05,5,17) Since F > Critical F REJECT Ho:A11 groups equal
Wet Weight (mg), 30 days post-hatch; ug ai/L File: 2 7 0 1 ~ Transform: NO TRANSFORMATION
BONFERRONI T-TEST - TABLE 1 OF 2 Ho:Control<Treatment ............................................................................
TRANSFORMED MEAN CALCULATED IN GROUP IDENTIFICATION MEAN ORIGIN& UNITS T STAT SIG ----- .................... ----------- ------------------ ------ --- 1 neg control 76.500 76.500 2 0.68 74.000 74.000 0.430 3 1.6 77.000 77.000 -0.086 4 3.2 75.250 75.250 0.215 5 6.3 70.750 70.750 0.988 6 12 46.000 46.000 4.854 *
............................................................................ Bonferroni T table value = 2.57 (1 Tailed Value, P=0.05, df=17,5)
Wet Weight (mg), 30 days post-hatch; ug ai/L File: 2701ww Transform: NO TRANSFORMATION
BONFERRONI T-TEST - TABLE 2 OF 2 Ho:Control<Treatment ............................................................................
NUM OF Minimum Sig Diff % of DIFFERENCE GROUP IDENTIFICATION REPS (IN ORIG. UNITS) CONTROL FROM CONTROL ----- .................... ------- ---------------- ------- ------------ 1 neg control 4 2 0.68 4 14.932 19.5 2.500 3 1.6 4 14.932 19.5 -0.500 4 3.2 4 14.932 19.5 1.250 5 6.3 4 14.932 19.5 5.750 6 12 3 16.129 21.1 30.500
.............................................................................
Wet Weight (mg), 30 days post-hatch; ug ai/L File: 2701ww Transform: NO TRANSFORMATION
WILLIAMS TEST (Isotonic regression model) TABLE 1 OF 2
GROUP ORIGINAL TRANSFORMED I SOTONI ZED IDENTIFICATION N MEAN MEAN MEAN
------ .................... --- ----------- ----------- 1 neg control 4 76.500 76.500 2 0.68 4 74.000 74.000 3 1.6 4 77.000 77.000 4 3.2 4 75 -250 75.250 5 6.3 4 70.750 70.750 6 12 3 46.000 46.000
.................................................................
Wet Weight (mg), 30 days post-hatch; ug ai/L File: 2 7 0 1 ~ Transform: NO TRANSFORMATION
Page 22 of 23
D287592 Toxicity of Methidathion to Fish, Early Life Stage MRID 001573-53 & 458227-01
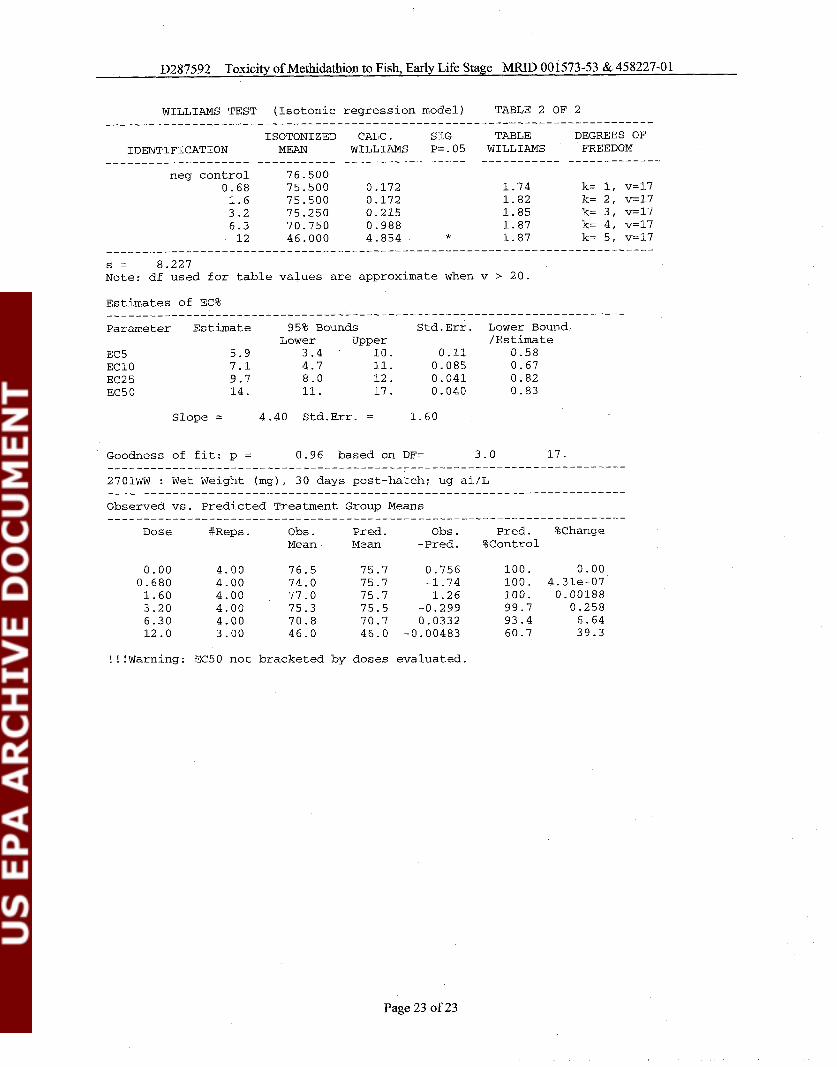
WILLIAMS TEST (Isotonic regression model) TABLE 2 OF 2 _____________--___----------------------------------------------------------
ISOTONIZED CALC. SIG TABLE DEGREES OF IDENTIFICATION MEAN WILLIAMS P= .05 WILLIAMS FREEDOM
_ - _ - _ - _ _ _ _ _ _ _ - _ _ _ _ _ _ __-___----_ ____-__-- -_ - _ _ _ _ _---------_ _--_--------- neg control 76.500
0.68 75.500 0.172 1.74 k= 1, v=17 1.6 75.500 0.172 1.82 k= 2, v=17 3.2 75.250 0.215 1.85 k= 3, v=17 6.3 70.750 0.988 1.87 k= 4, v=17 12 46.000 4.854 * 1.87 k= 5, v=17
________-_-________--------------------------------------------------------- s = 8.227 Note: df used for table values are approximate when v > 20.
Estimates of EC% __-_______-_____-__----------------------------------------------------- Parameter Estimate 95% Bounds Std.Err. Lower Bound
Lower upper /Estimate EC 5 5.9 3.4 10. 0.11 0.58 EClO 7.1 4.7 11. 0.085 0.67 EC2 5 9.7 8.0 12. 0.041 0.82 EC50 14. 11. 17. 0.040 0.83
Slope = 4.40 Std.Err. = 1.60
' Goodness of fit: p = 0.96 based on DF= 3.0 17. ........................................................................ 2701WW : Wet Weight (mg), 30 days post-hatch; ug ai/L ........................................................................ Observed vs. Predicted Treatment Group Means ........................................................................
Dose #Reps. Obs . Pred . Obs . Pred . %Change Mean Mean -Pred. %Control
!!!Warning: EC50 not bracketed by doses evaluated.
Page 23 of 23