Embed Size (px)
Citation preview


1
UNITED STATES ENVIRONMENTAL PROTECTION AGENCY WASHINGTON, D.C. 20460
OFFICE OF CHEMICAL SAFETY AND
POLLUTION PREVENTION
Preliminary Pollinator Assessment to Support the Registration Review of Imidacloprid
January 4th, 2016
PC Code: 129099. IUPAC Name: N-{1-[(6-Chloro-3-pyridyl)methyl]-4,5-dihydroimidazol-2-yl}nitramide
Prepared by: US EPA - Justin Housenger, M.S., Biologist Keith G. Sappington, M.S, Senior Science Advisor Mohammed A. Ruhman, Ph.D., Senior Agronomist California Department of Pesticide Regulation: Richard Bireley, Sr. Environmental Scientist (Specialist) John Troiano, Ph.D., Research Scientist III Denise Alder, Sr. Environmental Scientist (Specialist) Approved by Mah T. Shamim, Ph.D. Branch Chief
United States Environmental Protection Agency Office of Pesticide Programs
Environmental Fate and Effects Division Environmental Risk Branch V
1200 Pennsylvania Ave. Mail Code 7507P
Washington, D.C. 20460

2
Contents Contributors, Reviewers, and Acknowledgements ..................................................................................... 12
1. Executive Summary ............................................................................................................................. 13
1.1. Background and Scope ................................................................................................................ 13
1.2. Use Characterization ................................................................................................................... 13
1.3. Environmental Fate and Transport ............................................................................................. 13
1.4. Exposure Assessment .................................................................................................................. 14
1.5. Effects Assessment...................................................................................................................... 14
1.6. Pollen Route of Exposure ............................................................................................................ 16
1.7. Non-Apis Bee Characterization ................................................................................................... 16
1.8. Additional Lines of Evidence ....................................................................................................... 17
1.9. Risk Conclusions .......................................................................................................................... 17
2. Problem Formulation .......................................................................................................................... 24
2.1. Registration Review Background ................................................................................................ 24
2.2. Nature and Scope of Assessment ............................................................................................... 24
2.3. Pesticide Type, Class, and Mode of Action ................................................................................. 25
2.4. Overview of Imidacloprid Uses ................................................................................................... 26
2.5. Overview of Physicochemical, Fate, and Transport Properties .................................................. 26
2.6. Stressors of Toxicological Concern ............................................................................................. 26
2.7. Protection Goals and Assessment Endpoints ............................................................................. 27
2.8. Conceptual Models and Risk Hypotheses ................................................................................... 28
2.8.1. Foliar Spray................................................................................................................................ 28
2.8.2. Soil Application ......................................................................................................................... 30
2.8.3. Seed Treatment ......................................................................................................................... 31
2.9. Analysis Plan................................................................................................................................ 32
2.9.1. Risk Assessment Methodology ................................................................................................. 32
2.10. Measures of Exposure ............................................................................................................. 37
2.11. Measures of Effects ................................................................................................................. 37
3. Use Characterization ........................................................................................................................... 39
3.1. Agricultural Uses ......................................................................................................................... 39
3.1.1. Foliar Applications ..................................................................................................................... 40
3.1.2. Soil Applications ........................................................................................................................ 42
3.1.3. Seed Treatments ....................................................................................................................... 43

3
3.1.4. Multiple Application Types (e.g. combinations of seed, soil, and/or foliar) ............................. 45
4. Exposure Assessment .......................................................................................................................... 46
4.1. Physical/chemical and fate and transport properties ................................................................ 47
4.1.1. Physical/Chemical properties ................................................................................................... 48
4.1.2. Environmental Fate and Transport Properties ......................................................................... 48
4.2. Imidacloprid Plant Up-take ......................................................................................................... 55
4.2.1. Imidacloprid applied to soil including seed treatment ............................................................. 55
4.2.2. Imidacloprid applied to foliage and fruits ................................................................................. 56
4.2.3. Imidacloprid: soil versus foliage applied ................................................................................... 57
4.3. Plant Metabolism of Imidacloprid .............................................................................................. 58
4.3.1. Imidacloprid metabolism in various plants ......................................................................... 59
4.3.2. Imidacloprid metabolism profile in plants .......................................................................... 60
4.3.3. Imidacloprid metabolism profile in plants .......................................................................... 62
4.4. Potential for Exposure to Bees ................................................................................................... 63
4.5. Screening-level Exposure Estimation .......................................................................................... 68
4.6. Experimental Residue Studies ..................................................................................................... 71
4.6.1. Rationale for Residue-based EEC Selection for Refined Tier I ............................................ 71
4.6.2. Rationale for Comparing Residue Data With Tier II Endpoints ........................................... 73
4.6.3. Foliar Application Residue Studies – Registrant Submitted ................................................ 73
4.6.4. Soil Application Residue Studies – Registrant Submitted ................................................... 77
4.6.5. Soil Application Residue Studies – Open Literature ............................................................ 83
4.6.6. Seed Treatment Application Residue Studies – Registrant Submitted ............................... 86
4.6.7. Seed Treatment Application Residue Studies – Open Literature ....................................... 91
4.6.8. Combined Application Method Residue Studies ................................................................ 93
4.7. Carry-over of Imidacloprid Residues in Soil ................................................................................ 97
4.8. Observational Residue Monitoring Studies ................................................................................ 98
4.8.1. Agricultural crop studies ..................................................................................................... 99
4.8.2. Hive monitoring studies ...................................................................................................... 99
5. Effects Assessment............................................................................................................................ 101
5.1. Tier I .......................................................................................................................................... 101
5.1.1. Adult Acute Contact Toxicity ............................................................................................. 103
5.1.2. Adult Acute Oral Exposure ................................................................................................ 110
5.1.3. Adult Chronic Oral Toxicity (Apis and non-Apis) ............................................................... 115
4
5.1.4. Larval Acute Oral Toxicity.................................................................................................. 117
5.1.5. Larval Chronic Oral Toxicity............................................................................................... 118
5.1.6. Acute and Chronic Toxicity of the Degradation Products of Imidacloprid ....................... 120
5.2. Tier II ......................................................................................................................................... 123
5.2.1. Registrant-Submitted ........................................................................................................ 123
5.2.2. Open Literature Studies .................................................................................................... 127
5.3. Tier III ........................................................................................................................................ 154
5.3.1. Registrant Submitted ........................................................................................................ 154
5.3.2. Open Literature ................................................................................................................. 154
5.4. Reported Pollinator Incident Information ................................................................................ 160
6. Risk Characterization ........................................................................................................................ 168
6.1. Risk Estimation .......................................................................................................................... 168
6.1.1. Tier I - Screening-level RQs (On-field Contact – Foliar Uses Only) .................................... 174
6.1.2. Tier I - Screening-level RQs (On-field oral) ........................................................................ 175
6.1.3. Screening Level RQs (Off-Field) ......................................................................................... 177
6.1.4. Refined RQs (On-field Oral) ............................................................................................... 183
6.1.5. Refined RQs (Off-field Oral) .............................................................................................. 204
6.1.6. Uncertainties at the Tier I Level ........................................................................................ 205
6.2. Risk Description ......................................................................................................................... 206
6.2.1. Characterization of Tier I Risks and Tier II Analysis ........................................................... 207
6.2.2. Tier III analysis ................................................................................................................... 271
6.2.3. Examination of the pollen route of exposure ................................................................... 272
6.2.4. Risk Characterization of Non-Apis Bees ............................................................................ 277
6.2.5. Additional Lines of Evidence ............................................................................................. 283
6.2.6. Higher Tier and other General Uncertainties.................................................................... 284
7. Conclusions ....................................................................................................................................... 287
8. References ........................................................................................................................................ 293
Table of Tables
Table 1-1. Summary of the toxicity endpoints to be used in risk estimation for individual bees. ............ 15 Table 1-2. Summary of risk findings for honey bees (Apis mellifera) for the registered use patterns of imidacloprid ................................................................................................................................................ 20 Table 2-1. Protection goals and examples of associated assessment and measurement (population and individual) endpoints for bees. ................................................................................................................... 28

5
Table 3-1. Summary of labeled use information for foliar applications of imidacloprid ........................... 40 Table 3-2. Summary of labeled use information for soil applications of imidacloprid ............................... 42 Table 3-3. Summary of labeled use information for seed treatment applications of imidacloprid ........... 44 Table 4-1. Chemical profile of imidacloprid ................................................................................................ 48 Table 4-2. Fate and transport properties for imidacloprid ......................................................................... 48 Table 4-3. Imidacloprid root up-take/distribution and resultant concentrations in cotton, potatoes, corn and eggplant (%= up-take in % of the applied radioactivity and numbers in brackets are resultant concentrations in mg/kg) ............................................................................................................................ 55 Table 4-4. Imidacloprid up-take/distribution and resultant concentrations in various parts of the potato plants and only in the fruits of apples and tomatoes (%= up-take in % of the applied radioactivity and numbers in brackets are resultant concentrations in mg/kg). ................................................................... 57 Table 4-5. Observed estimated concentrations of the stressor in parts per million= ppm) (parent imidacloprid + IMI-olefin and IMI-5-OH compounds) in varied crops, plant parts and application procedures based on radioactivity data ..................................................................................................... 62 Table 4-6. Attractiveness of crops for the registered foliar uses of imidacloprid to bees (as indicated by USDA, 2014). Note, the potential for off-field exposure is indicated from all foliar uses. ........................ 64 Table 4-7. Attractiveness of crops for the registered soil uses of imidacloprid to bees (as indicated by USDA, 2014) ................................................................................................................................................ 65 Table 4-8. Attractiveness of crops for the registered seed treatment uses of imidacloprid to bees (as indicated by USDA, 2014) ........................................................................................................................... 66 Table 4-9. Summary of contact and dietary exposure estimates for foliar applications, soil treatment, seed treatments, and tree trunk injections of pesticides for Tier I risk assessments. ............................... 69 Table 4-10. Summary of estimated food consumption rates of bees. ...................................................... 70 Table 4-11. Summary of available registrant submitted foliar application residue studies ...................... 75 Table 4-12. Summary of available registrant submitted soil application residue studies ......................... 79 Table 4-13. Summary of the soil application residue studies evaluated from the open literature .......... 84 Table 4-14. Summary of the registrant submitted seed treatment application residue studies .............. 87 Table 4-15. Summary of residue data from imidacloprid-treated seed studies evaluated from the open literature. .................................................................................................................................................... 92 Table 4-16. Summary of the registrant-submitted combined application method residue studies (soil application + foliar spray) ........................................................................................................................... 95 Table 4-17. Summary of the registrant submitted combined application method residue studies (seed treatment + foliar spray) ............................................................................................................................. 96 Table 4-18. Distribution of samples from corn fields according to their concentration of imidacloprid (Bonmatin, 2005) ........................................................................................................................................ 99 Table 4-19. Distribution of residues from corn and sunflower pollen according to their concentration of imidacloprid (Bonmatin, 2007) ................................................................................................................... 99 Table 5-1. Summary of endpoints to be used in screening-level and refined Tier I risk estimation ..... 103 Table 5-2. Summary of registrant submitted adult acute contact toxicity studies (all studies tested Apis mellifera) ................................................................................................................................................... 104 Table 5-3. Summary of adult acute contact toxicity studies to Apis bees evaluated from the open literature ................................................................................................................................................... 105 Table 5-4. Summary of registrant submitted adult acute contact toxicity studies for non-Apis bees (Note: both studies concern Bombus terrestris) ....................................................................................... 106

6
Table 5-5. Summary of adult acute contact toxicity studies to non-Apis bees evaluated from the open literature ................................................................................................................................................... 107 Table 5-6. Summary of registrant submitted adult acute oral toxicity studies (Note: All studies tested Apis mellifera). .......................................................................................................................................... 110 Table 5-7. Summary of adult acute oral toxicity studies for Apis bees evaluated from the open literature .................................................................................................................................................................. 111 Table 5-8. Summary of registrant-submitted and evaluated open literature studies assessing the chronic oral toxicity of imidacloprid to Apis and non-Apis adults. ........................................................................ 115 Table 5-9. Summary of results from Abbott et al., 2008 examining the effects of imidacloprid TGAI on larval development of blue orchard bees (Osmia lignaria) .1 (Note: Study classified as qualitative) ....... 119 Table 5-10. Summary of acute oral toxicity studies testing the degradates of imidacloprid in the open literature ................................................................................................................................................... 120 Table 5-11. Summary of chronic adult oral toxicity studies with urea metabolite and 6-CNA (all studies conducted with Apis mellifera) ................................................................................................................. 122 Table 5-12. Summary of semi-field (feeding) studies available from the open literature (Apis)1 ........... 130 Table 5-13. Summary of semi-field (Tunnel) studies available from the open literature (Bombus) ....... 141 Table 5-14. Summary of semi-field (feeding) studies available from the open literature (Bombus) ...... 143 Table 5-15. Summary of Tier III (full field) studies available from the open literature for Apis bees ..... 156 Table 5-16. Summary of Tier III (full field) studies available from the open literature for Bombus bees. .................................................................................................................................................................. 159 Table 5-17. Summary of reported pollinator incident reports that are either associated with confirmatory residue analysis or registrant submitted ............................................................................ 163 Table 6-1. Attractiveness of crops to bees for the registered foliar uses of imidacloprid....................... 170 Table 6-2. Attractiveness of crops to bees for the registered soil uses of imidacloprid. ........................ 171 Table 6-3. Attractiveness of crops to bees for the registered seed treatment uses of imidacloprid. ..... 172 Table 6-4. Summary of Tier I screening-level RQs for contact exposure resulting from foliar uses of imidacloprid (screening-level contact on-field) ........................................................................................ 174 Table 6-5. Summary of Tier I screening-level RQs for oral exposure resulting from foliar uses of imidacloprid (based on model-generated exposure values on-field).4 .................................................... 176 Table 6-6. Summary of Tier I screening-level RQs for oral exposure resulting from soil uses of imidacloprid (based on model-generated exposure values on-field).4 .................................................... 176 Table 6-7. Summary of labeled use information for seed treatment applications of imidacloprid (screening-level oral on-field) 4 ................................................................................................................. 177 Table 6-8. Imidacloprid Use Patterns for Crops with or without Specific Application Restrictions ........ 178 Table 6-9. Distance from the edge of the field associated with LOC exceedance, for citrus and pome fruits, calculated using AgDRIFT v.1.1.1, the Tier I Orchard/Airblast module, and app rate of 0.25 lbs. a.i./A. ......................................................................................................................................................... 179 Table 6-10. Citrus and Pome Fruits: Tier II aerial applications, boom height 10 ft, wind speed 15 mph (label required), non-volatile rate 0.25 lbs./A, spray volume 5 gal/A ...................................................... 180 Table 6-11. Citrus and Pome Fruits: Tier II aerial applications, boom height 10 ft, wind speed 10 mph (label required), non-volatile rate 0.25 lbs./A, spray volume 5 gal/A ...................................................... 180 Table 6-12. Globe artichoke (only ground apps allowed): Tier I ground applications, high boom height (50 inches), application rate 0.126 lbs. a.i./A, 90th percentile results ..................................................... 181

7
Table 6-13. Globe artichoke (only ground apps allowed): Tier I ground applications, low boom height (20 inches), application rate 0.126 lbs. a.i./A, 90th percentile results ..................................................... 181 Table 6-14. Stone fruit, Tree nuts: Tier II aerial applications, boom height 10 ft, wind speed 15 mph (label required), non-volatile rate 0.10 lbs./A, spray volume 25 gal/A (label required for these crops) . 181 Table 6-15. Stone fruit, Tree nuts: Tier II aerial applications, boom height 10 ft, wind speed 10 mph, non-volatile rate 0.10 lbs./A, spray volume 25 gal/A (label required for these crops). ........................... 182 Table 6-16. Tuberous & Corm Vegetables and Certain Other Crops: Tier II aerial applications, boom height 10 ft, wind speed 15 mph (label required), non-volatile rate 0.04 lbs./A, spray volume 5 gal/A . 182 Table 6-17. Tuberous & Corm Vegetables and Certain Other Crops: Tier II aerial applications, boom height 10 ft, wind speed 10 mph, non-volatile rate 0.04 lbs./A, spray volume 5 gal/A ........................... 183 Table 6-18. Summary of the refined acute and chronic estimated environmental concentrations (EECs) for foliar applications on citrus fruits (oranges) based on measured residue data.................................. 184 Table 6-19. Summary of Tier I oral RQs for honey bees using refined exposure estimates with total imidacloprid residues in pollen and nectar from foliar-applications to oranges.1,4 ................................. 185 Table 6-20. Summary of the refined acute and chronic estimated environmental concentrations (EECs) for foliar applications on cherries based on measured residue data ....................................................... 186 Table 6-21. Summary of Tier I oral RQs for honey bees using refined exposure estimates with total imidacloprid residues in pollen and nectar from foliar-applications to cherries1,4 .................................. 186 Table 6-22. Summary of the refined acute and chronic estimated environmental concentrations (EECs) for foliar applications on cotton based on measured residue data.......................................................... 187 Table 6-23. Summary of Tier I oral RQs for honey bees using refined exposure estimates with total imidacloprid residues in nectar from foliar-applied cotton1,4 .................................................................. 188 Table 6-24. Summary of the refined acute and chronic estimated environmental concentrations (EECs) for soil applications on tomatoes based on measured residue data. ....................................................... 189 Table 6-25. Summary of Tier I oral RQs for honey bees using refined exposure estimates with total imidacloprid residues in pollen from soil-applications to tomatoes1,4 ..................................................... 189 Table 6-26. Summary of the refined acute and chronic estimated environmental concentrations (EECs) for soil applications on melons based on measured residue data. .......................................................... 190 Table 6-27. Summary of Tier I oral RQs for honey bees using refined exposure estimates with total imidacloprid residues in pollen and nectar from soil-applications to melons.1,4 ..................................... 191 Table 6-28. Summary of the refined acute and chronic estimated environmental concentrations (EECs) for soil applications to citrus based on measured residue data. .............................................................. 192 Table 6-29. Summary of Tier I oral RQs for honey bees using refined exposure estimates with total imidacloprid residues in nectar from soil applications to citrus1,4............................................................ 193 Table 6-30. Summary of the refined acute and chronic EECs in pollen and nectar following soil applications to blueberries based on measured residue data. ................................................................ 194 Table 6-31. Summary of Tier I oral RQs for honey bees using refined exposure estimates with measured total imidacloprid residues in pollen and nectar following soil applications to blueberries1,4 ................ 194 Table 6-32. Summary of the refined acute and chronic EECs for soil applications to strawberries based on measured residue data. ....................................................................................................................... 195 Table 6-33. Summary of Tier I oral RQs for honey bees using refined exposure estimates with measured imidacloprid residues in pollen from soil applications to strawberries1,4 ................................................ 196 Table 6-34. Summary of the refined acute and chronic EECs for soil applications on cotton based on measured residue data. ............................................................................................................................ 197

8
Table 6-35. Summary of Tier I oral RQs for honey bees using refined exposure estimates with measured total imidacloprid residues in pollen and nectar from soil-applications to cotton.1,4 .............................. 197 Table 6-36. Summary of the refined acute and chronic EECs for seed treatment applications on corn based on measured residue data.............................................................................................................. 198 Table 6-37. Summary of Tier I oral RQs for honey bees using refined exposure estimates with total imidacloprid residues in pollen and nectar from seed-treated corn1,4 ..................................................... 199 Table 6-38. Summary of the refined acute and chronic EECs for combined (soil + foliar) applications to tomato based on measured residue data ................................................................................................. 200 Table 6-39. Summary of Tier I oral RQs for honey bees using refined exposure estimates with measured imidacloprid residues in pollen from combined soil + foliar-applications to tomatoes.1,4 ....................... 201 Table 6-40. Summary of the refined acute and chronic EECs for combined (soil + foliar) applications to cotton based on measured residue data. ................................................................................................. 202 Table 6-41. Summary of Tier I oral RQs for honey bees using refined exposure estimates with total imidacloprid residues in pollen and nectar from soil + foliar-applied cotton1,4 ....................................... 202 Table 6-42. Summary of the refined acute and chronic EECs for combined (seed + foliar) applications on cotton based on residue data ................................................................................................................... 203 Table 6-43. Summary of Tier I oral RQs for honey bees using refined exposure estimates with measured imidacloprid residues in pollen and nectar from combined seed + foliar applications to cotton.1,4 ....... 203 Table 6-44. SLUA data for imidacloprid and citrus fruits (2004-2013) ................................................... 210 Table 6-45. SLUA data for imidacloprid and stone fruits (2004-2013) ................................................... 214 Table 6-46. SLUA data for imidacloprid and oilseed crops (2004-2013)1 ............................................... 219 Table 6-47. SLUA data imidacloprid and use patterns registered for additional foliar and soil use patterns (2004-2013) with no available residue data............................................................................... 224 Table 6-48. Summary of risk findings for the foliar applied use patterns of imidacloprid with available residue data. ............................................................................................................................................. 225 Table 6-49. SLUA data for imidacloprid and fruiting vegetables (2004-2013) ......................................... 226 Table 6-50. SLUA data for imidacloprid and cucurbit vegetables (2004-2013) .................................... 230 Table 6-51. SLUA data imidacloprid and berries/small fruit (2004-2013) .............................................. 239 Table 6-52. SLUA data for imidacloprid on soil only registered use patterns (2004-2013). (Note: Data are available for soil treated cucurbit vegetables and therefore is not presented below since its SLUA data is shown in the soil treated melon discussion.............................................................................................. 250 Table 6-53. Summary of risk findings for the soil applied use patterns of imidacloprid with available residue data. ............................................................................................................................................. 251 Table 6-54. SLUA data imidacloprid and cereal grains (2004-2013)1 ....................................................... 252 Table 6-55. SLUA data imidacloprid and other non-cereal grain seed treatment uses (2004-2013)1 ..... 257 Table 6-56. Summary of risk findings for the seed treatment use patterns of imidacloprid. ................. 258 Table 6-57. Summary of risk findings for the combined method use patterns of imidacloprid. ............. 270 Table 6-58. Comparison of oral exposure to pollen and nectar for adult Apis and Non-Apis bees1 ...... 279 Table 6-59. Comparison of oral exposure to pollen and nectar for larval Apis and Non-Apis bees1 ....... 279 Table 6-60. Comparison of imidacloprid acute contact toxicity to Apis and non-Apis bees ................. 280 Table 6-61. Comparison of imidacloprid acute oral toxicity to Apis and non-Apis bees ......................... 280 Table 7-1. Summary of risk findings for honey bees (Apis mellifera) for the registered use patterns of imidacloprid .............................................................................................................................................. 289

9
Table of Figures
Figure 2-1. Conceptual model for risk assessment of foliar spray applications of imidacloprid to honey bees. Red depicts systemic pathways. Dashed lines represent routes of exposure that are not considered major. ....................................................................................................................................... 30 Figure 2-2. Conceptual model for risk assessment of soil applications of imidacloprid to honey bees. Red depicts systemic pathways. Dashed lines represent routes of exposure that are not considered major. 31 Figure 2-3. Conceptual model for risk assessment of planting of imidacloprid-treated seeds to honey bees. Red depicts systemic pathways. Dashed lines represent routes of exposure that are not considered major. ....................................................................................................................................... 32 Figure 2-4. Tiered approach for assessing risk to honey bees from foliar spray applications .................... 35 Figure 2-5. Tiered approach for assessing risk to honey bees from soil/seed applications ....................... 36 Figure 4-1. Imidacloprid application and processes involved in bee exposure .......................................... 46 Figure 4-2. Imidacloprid expected accumulation in 10 years of repeated application at a rate of 0.5 lb. a.i/A (This rate is equal to 0.245 ppm distributed on the top 6” of the soil); Noting that the graph was constructed based on yearly application coupled with daily degradation based on the aerobic soil degradation rate constant. ......................................................................................................................... 50 Figure 4-3. Expected degradation profile for imidacloprid in compartments of the terrestrial ecosystems. Imidacloprid parent, and the IMI-olefin and IMI-5-OH degradates are considered residues of toxicological concern. ............................................................................................................................. 53 Figure 4-4. Comparison of up-take data obtained for imidacloprid applied to soil and that applied to foliage in potatoes ...................................................................................................................................... 58 Figure 4-5. Suggested Imidacloprid degradation profile in plants (based on submitted plant metabolism data). ........................................................................................................................................................... 61 Figure 5-1. Scatterplot of adult acute contact toxicity of Apis and non-Apis bees from registrant-submitted and open literature sources conducted with technical grade active ingredient (TGAI) and formulated typical end product (TEP) imidacloprid. Red circle denotes endpoint used for Tier I risk estimation purposes. ................................................................................................................................ 109 Figure 5-2. Scatterplot of adult acute oral toxicity of Apis and non-Apis bees from registrant-submitted and open literature sources conducted with technical grade active ingredient (TGAI) and formulated typical end product (TEP) imidacloprid. Red circle denotes endpoint used for Tier I risk estimation purposes. ................................................................................................................................................... 114 Figure 5-3. Queen Production Data from Whitehorn et al (2012) in Controls (A), Low (B) and High Exposure Treatments (C). Legend numbers indicate the concentration in pollen and nectar, respectively. .................................................................................................................................................................. 152 Figure 6-1. Summarization of the potential scenarios warranting a Tier I on and/or off-field risk assessment. ............................................................................................................................................... 169 Figure 6-2. Summary of acute and chronic RQ values using totality of pollen and nectar residue data from foliar-applied citrus residue study (MRID 49521301). ..................................................................... 211 Figure 6-3. Imidacloprid nectar residues in nectar from foliar-applied citrus study (MRID 49521301, trials NT005 and NT006 only) as compared to effect levels in registrant submitted colony feeding study (MRID 49510001). ..................................................................................................................................... 212 Figure 6-4. Imidacloprid average residues in pollen from foliar-applied citrus study (MRID 49521301, trials NT005 and NT006 only). .................................................................................................................. 213
10
Figure 6-5. Summary of acute and chronic RQ values using totality of pollen and nectar residue data from foliar-applied cherry residue study (MRID 49535601). .................................................................... 215 Figure 6-6. Imidacloprid residues in nectar from foliar-applied cherry study (MRID 49535601) as compared to effect levels in registrant submitted colony feeding study (MRID 49510001). .................. 216 Figure 6-7. Imidacloprid average residues in pollen from foliar-applied cherry study (MRID 49535601). .................................................................................................................................................................. 217 Figure 6-8. Summary of acute and chronic RQ values using totality of residue data from foliar-applied cotton residue study (MRID 49103301). ................................................................................................... 220 Figure 6-9. Imidacloprid residues in foliar-applied cotton residue study (MRID 49103301) as compared to effect levels in registrant submitted colony feeding study (MRID 49510001). .................................... 221 Figure 6-10. Summary of acute and chronic RQ values using totality of bee-collected pollen residue data from soil-applied tomato residue study (MRID 49665201). ..................................................................... 227 Figure 6-11. Imidacloprid average residues in pollen from soil-applied tomato study (MRID 49665201). .................................................................................................................................................................. 228 Figure 6-12. Summary of acute and chronic RQ values using totality of pollen residue data from soil melon residue study (MRID 49090501). ................................................................................................... 231 Figure 6-13. Imidacloprid residues in nectar in soil-applied melon residue study (MRID 49090501) as compared to effect levels in registrant submitted colony feeding study (MRID 49510001). .................. 232 Figure 6-14. Imidacloprid average residues in pollen from soil-applied melon study (MRID 49090501). .................................................................................................................................................................. 233 Figure 6-15. Summary of acute and chronic RQ values using totality of nectar residue data from the soil-applied citrus residue study (MRID 49090505). ....................................................................................... 236 Figure 6-16. Imidacloprid residues in nectar in soil-applied citrus residue study (MRID 49090505) as compared to effect levels in registrant submitted colony feeding study (MRID 49510001). .................. 237 Figure 6-17. Summary of acute and chronic RQ values using totality of the bee collected-pollen and hive nectar residue data from soil-applied blueberry residue study (MRID 49535602). ................................. 240 Figure 6-18. Average total residues in nectar from soil-applied blueberry study (MRID 49535602) as compared to effect levels in registrant submitted colony feeding study (MRID 49510001). .................. 241 Figure 6-19. Imidacloprid average residues in pollen from soil-applied blueberry study (MRID 49535602). ................................................................................................................................................ 242 Figure 6-20. Summary of acute and chronic RQ values using totality of pollen residue data from soil –applied strawberry residue study (MRID 49090502). (Note: Sampling interval not provided)................ 244 Figure 6-21. Imidacloprid average residues in pollen from soil-applied strawberry study (MRID 49090502). ................................................................................................................................................ 245 Figure 6-22 Summary of acute and chronic RQ values using totality of pollen and nectar residue data from soil-applied cotton residue study (MRID 49665202). ...................................................................... 247 Figure 6-23. Imidacloprid residues in nectar in the soil-applied cotton study (MRID 49665202) as compared to effect levels in registrant submitted colony feeding study (MRID 49510001). .................. 248 Figure 6-24. Imidacloprid average residues in pollen in the soil-applied cotton study (MRID 49665202). .................................................................................................................................................................. 249 Figure 6-25. Summary of acute and chronic RQ values using totality of pollen residue data from seed treatment corn residue study (MRID 49511701). ..................................................................................... 253 Figure 6-26. Imidacloprid residues in pollen in the seed treated corn study (MRID 49511701). ............ 254

11
Figure 6-27. Summary of acute and chronic RQ values using totality of pollen residue data from the combined soil + foliar treatment tomato residue study (MRID 49665201). ............................................ 259 Figure. 6-28. Imidacloprid residues in pollen in the soil + foliar applied tomato study (MRID 49665202). .................................................................................................................................................................. 260 Figure 6-29. Summary of acute and chronic RQ values using totality of pollen and extra-floral nectar data from the combined soil + foliar-applied cotton residue study (MRID 49665202). .......................... 262 Figure 6-30. Imidacloprid residues in nectar from the soil + foliar cotton study (MRID 49665202) as compared to effect levels in registrant submitted colony feeding study (MRID 49510001). .................. 263 Figure 6-31. Imidacloprid average residues in pollen from the soil + foliar cotton study (MRID 49665202). ................................................................................................................................................ 264 Figure 6-32. Summary of acute and chronic RQ values using totality of pollen and floral nectar data from the combined seed treatment + foliar-applied cotton residue study (MRID 49511702). ........................ 266 Figure 6-33. Imidacloprid floral nectar residues in seed + foliar cotton study (MRID 49511702) as compared to effect levels in registrant submitted colony feeding study (MRID 49510001). .................. 267 Figure 6-34. Imidacloprid averages residues in pollen from the seed + foliar cotton study (MRID 49665202). ................................................................................................................................................ 268 Figure 6-35. Box and Whisker Plots of Total Imidacloprid Measured in Hive-Collected Uncapped Nectar (A) and Bee Bread (B) from the Sucrose Colony Feeding Study (MRID 49510001) .................................. 276 Figure 6-36. Comparison of effect levels from qualitative Tier II feeding studies on B. terrestris obtained from the open literature (numbers in parentheses refer to the magnitude of effects and/or additional exposure to pollen) ................................................................................................................................... 283

12
Contributors, Reviewers, and Acknowledgements USEPA Contributors: Office of Pesticide Programs: Christina Wendel, Biologist Christine Hartless, Wildlife Biologist José Meléndez, Chemist Office of Research and Development/National Health and Environmental Effects Research Laboratory/ Atlantic Ecology Division: Glen Thursby, Chief, Watershed Diagnostics Branch Reviewers: Thomas Steeger, Ph.D., Senior Science Advisor Michael Wagman, Biologist California Department of Pesticide Regulation: Contributors: Alexander Kolosovich, Environmental Scientist, Ecotoxicology Brigitte Tafarella, Environmental Scientist, Ecotoxicology Russell Darling, Environmental Scientist, Reevaluation

13
1. Executive Summary 1.1. Background and Scope Imidacloprid, along with the other nitroguanidine-substituted neonicotinoid insecticides, clothianidin, thiamethoxam, dinotefuran, are currently undergoing Registration Review by the USEPA. With imidacloprid, the EPA published a final registration review Work Plan in 2009 and issued a Generic Data Call-in in 2010 to obtain data required for assessing risks to bees and other taxa. This 2015 Preliminary Ecological Risk Assessment evaluates the risk of the registered agricultural uses of imidacloprid to bees alone. Consistent with the EPA 2014 Guidance for Assessing Pesticide Risks to Bees (USEPA et al. 2014), risks are quantified for the honey bee, Apis mellifera, and to the extent that data are available, characterized qualitatively for other bee taxa relative to the honey bee to the extent that data are available. Following the receipt of public comments on this Preliminary Pollinator Risk Assessment, the EPA plans to issue a revised Preliminary Ecological Risk Assessment at the end of 2016 that will: (i) consider any comments or information submitted in response to this bee-only preliminary risk assessment; (ii) incorporate additional data EPA anticipates to receive that is relevant to bees; and, (iii) assess the potential risks of all registered uses of imidacloprid to all taxa. 1.2. Use Characterization Imidacloprid is registered for a variety of agricultural crops, including (but not limited to): root and tuber vegetables, bulb vegetables, leafy, brassica, cucurbit, and fruiting vegetables, beans and other legumes, citrus fruit, pome fruit, stone fruit, berries, tree nuts, cereal grains, herbs, oilseed crops (e.g. canola, cotton) and other use patterns not associated with a crop group such as peanuts and tobacco. It has been registered for use in the United States since 1994. Maximum application rates vary by crop and method, but typically do not exceed 0.5 lbs. a.i./A (single application or per year). Imidacloprid may be applied to crops via a variety of methods including aerial and ground foliar sprays, soil drench, chemigation, soil injection, in furrow sprays, and seed treatment, including multiple application methods within the same growing season so long as the 0.5 lbs a.i/A rate is not exceeded. There are a wide variety of non-agricultural uses, some examples of which include tree trunk injection, forestry, pet spot-on treatments, turf, and applications to ornamentals; non-agricultural uses will be assessed in the Preliminary Risk Assessment scheduled for 2016. Additionally, there are a number of use patterns that specifically prohibit applications during the pre-bloom or blooming period or whenever bees are foraging. 1.3. Environmental Fate and Transport Imidacloprid is a systemic insecticide that is associated with a high water solubility and low volatility. These properties, combined with low propensity to partition to organic carbon suggest that imidacloprid will be highly mobile in the terrestrial environment (i.e., subject to leaching in soils and runoff). The dominant transformation processes for imidacloprid are photolysis (very fast in the presence of water) and aerobic soil degradation. However, aerobic soil metabolism for imidacloprid is very slow (half-lives range from 200 days to more than one year) and therefore, imidacloprid is expected to persist in the soil system. Based on their occurrence as the primary degradates identified in plant metabolism studies and

14
comparable toxicological properties with respect to bees relative to parent imidacloprid, the primary stressors of concern include parent imidacloprid and its metabolites IMI-olefin (IMI-olefin) and IMI-5-OH (5-OH-IMI). As a systemic chemical, in plants, imidacloprid is absorbed via the roots, stems and foliage and is considered xylem mobile, with dominant uptake routes following the transpiration stream (i.e., no downward transport from leaves to roots). Additionally, numerous field studies have demonstrated that imidacloprid applied via foliar, soil or seed treatment methods can result in residues in pollen and nectar of blooming plants. 1.4. Exposure Assessment Exposure of bees through direct contact by foliar spray of imidacloprid (i.e., interception of spray droplets either on or off the treated field) and oral ingestion (e.g., consumption of contaminated pollen and nectar) represent the primary routes of exposure considered in this assessment. Bees may also be exposed to imidacloprid through other routes, such as contaminated surface water, plant guttation fluids, honey dew, soil (for ground-nesting bees), and leaves; however, there is high uncertainty regarding the importance of some of these exposure routes, and the Agency lacks information to understand the relative importance of these other routes of exposure and/or to quantify risks from these other routes. With respect to potential exposure via drift of abraded seed coat dust, the Agency is working with different stakeholders to identify best management practices and to promote technology-based solutions that reduce this potential route of exposure. Finally, the “carryover” of imidacloprid residues in soil (i.e. the potential for year-to-year accumulation in soil leading to higher residues in pollen and nectar) was considered as a potential route of exposure in this assessment. This potential for carryover was evaluated using multiple lines of evidence. While model results and some empirical data from multi-year applications in soil suggest possible year-to-year accumulation in soils, available residue data in pollen and nectar are not indicative of imidacloprid carryover in treated crops. Furthermore, imidacloprid residues in succeeding crops (e.g. white clover following seed treatment applications to corn) are low when detected, such that risks to honey bees is not expected. In accordance with the 2014 Guidance for Assessing Pesticide Risks to Bees (USEPA et. al. 2014), the exposure assessment considered Tier I (model-generated/screening-level) exposures of bees via contact and oral routes. Prior to this step, a determination was made on the potential for exposure based on indications of crop attractiveness to bees and cultural practices (e.g. whether the crop is harvested before bloom) referenced in the United States Department of Agriculture document, Attractiveness of Agricultural Crops to Pollinating Bees for the Collection of Nectar and/or Pollen (2014). For foliar sprays, off-field exposures via spray drift were also considered. These modeled/screening-level, exposure estimates were then refined using available information on measured imidacloprid residues in pollen and nectar of representative crops to assess risks to individual bees. This same residue information was also used to characterize risks at the colony level. 1.5. Effects Assessment As with other neonicotinoid insecticides, imidacloprid acts on the insect nicotinic acetylcholine receptors (nAChRs) of the central nervous system via competitive modulation. At the individual organism level, a
15
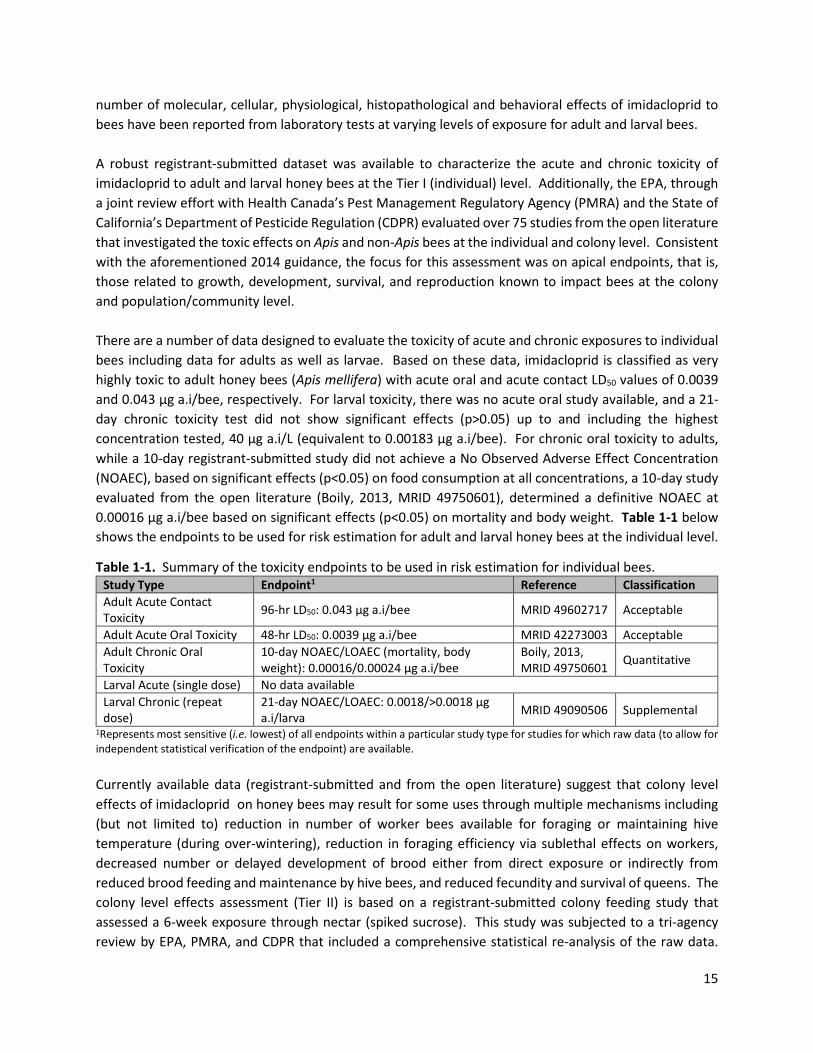
number of molecular, cellular, physiological, histopathological and behavioral effects of imidacloprid to bees have been reported from laboratory tests at varying levels of exposure for adult and larval bees. A robust registrant-submitted dataset was available to characterize the acute and chronic toxicity of imidacloprid to adult and larval honey bees at the Tier I (individual) level. Additionally, the EPA, through a joint review effort with Health Canada’s Pest Management Regulatory Agency (PMRA) and the State of California’s Department of Pesticide Regulation (CDPR) evaluated over 75 studies from the open literature that investigated the toxic effects on Apis and non-Apis bees at the individual and colony level. Consistent with the aforementioned 2014 guidance, the focus for this assessment was on apical endpoints, that is, those related to growth, development, survival, and reproduction known to impact bees at the colony and population/community level. There are a number of data designed to evaluate the toxicity of acute and chronic exposures to individual bees including data for adults as well as larvae. Based on these data, imidacloprid is classified as very highly toxic to adult honey bees (Apis mellifera) with acute oral and acute contact LD50 values of 0.0039 and 0.043 µg a.i/bee, respectively. For larval toxicity, there was no acute oral study available, and a 21-day chronic toxicity test did not show significant effects (p>0.05) up to and including the highest concentration tested, 40 µg a.i/L (equivalent to 0.00183 µg a.i/bee). For chronic oral toxicity to adults, while a 10-day registrant-submitted study did not achieve a No Observed Adverse Effect Concentration (NOAEC), based on significant effects (p<0.05) on food consumption at all concentrations, a 10-day study evaluated from the open literature (Boily, 2013, MRID 49750601), determined a definitive NOAEC at 0.00016 µg a.i/bee based on significant effects (p<0.05) on mortality and body weight. Table 1-1 below shows the endpoints to be used for risk estimation for adult and larval honey bees at the individual level.
Table 1-1. Summary of the toxicity endpoints to be used in risk estimation for individual bees. Study Type Endpoint1 Reference Classification Adult Acute Contact Toxicity 96-hr LD50: 0.043 µg a.i/bee MRID 49602717 Acceptable
Adult Acute Oral Toxicity 48-hr LD50: 0.0039 µg a.i/bee MRID 42273003 Acceptable Adult Chronic Oral Toxicity
10-day NOAEC/LOAEC (mortality, body weight): 0.00016/0.00024 µg a.i/bee
Boily, 2013, MRID 49750601 Quantitative
Larval Acute (single dose) No data available Larval Chronic (repeat dose)
21-day NOAEC/LOAEC: 0.0018/>0.0018 µg a.i/larva MRID 49090506 Supplemental
1Represents most sensitive (i.e. lowest) of all endpoints within a particular study type for studies for which raw data (to allow for independent statistical verification of the endpoint) are available. Currently available data (registrant-submitted and from the open literature) suggest that colony level effects of imidacloprid on honey bees may result for some uses through multiple mechanisms including (but not limited to) reduction in number of worker bees available for foraging or maintaining hive temperature (during over-wintering), reduction in foraging efficiency via sublethal effects on workers, decreased number or delayed development of brood either from direct exposure or indirectly from reduced brood feeding and maintenance by hive bees, and reduced fecundity and survival of queens. The colony level effects assessment (Tier II) is based on a registrant-submitted colony feeding study that assessed a 6-week exposure through nectar (spiked sucrose). This study was subjected to a tri-agency review by EPA, PMRA, and CDPR that included a comprehensive statistical re-analysis of the raw data.

16
Although there were other evaluated colony studies conducted with colonies of Apis mellifera, only this study was considered acceptable for quantitative use in this risk assessment. Based on a tri-agency analysis of the statistical and biological considerations of the data, a NOAEC and LOAEC of 25 and 50 µg a.i./L in nectar were determined based on reductions of the number of adult workers, numbers of pupae, pollen stores and honey stores which persisted across much of the study duration. The level of imidacloprid in nectar at or below which no effects would be expected to the colony is determined to be 25 µg a.i./L. 1.6. Pollen Route of Exposure
Honey bees are exposed to both pollen and nectar, which serve as the protein and carbohydrate sources in the diet, respectively. The risk assessment for individual bees assumes an equal contribution of these two food sources in the diet and equal potency at the individual level. No information was identified that enabled these assumptions to be directly evaluated at the individual organism level. At the colony level, the risk assessment is based on comparisons of imidacloprid residues measured in nectar in various crops to the sucrose-based dietary endpoints from the registrant-submitted colony feeding study. Comparison of imidacloprid residues in pollen to the sucrose-based dietary endpoints from the colony feeding study was not considered appropriate due to the differential utilization of pollen by the colony relative to nectar, and the subsequent differences in exposure of bees to dietary imidacloprid via pollen and nectar. Although this represents a limitation in the risk assessment, several lines of evidence suggest this uncertainty is not likely to substantially alter the risk conclusions for several reasons. First, while colonies were not fed spiked pollen in the colony feeding study, bees were nonetheless exposed to imidacloprid in pollen in the form of bee bread (a combination of stored pollen and honey) at concentrations that approximated 20% of those measured in uncapped nectar. Therefore, from an in-hive exposure perspective, the effects observed from the sucrose colony feeding study actually reflect a combination of exposure to contaminated nectar and pollen in the form of bee bread. Second, nectar is the dominant food source for adult foragers and hive bees whereas pollen is not consumed directly by adult bees and is processed into bee bread for feeding to developing larval bees. Third, the assessment for individual bees indicates that larval bees are at least one order of magnitude less sensitive than adult honey bees on a chronic basis. Finally, although not definitive, the available suite of higher-tier studies resulting from the pollen route of exposure suggest that colony-level effects on honey bees via contaminated pollen occur at higher residue levels than those in nectar. Taken together, these lines of evidence suggest that the lack of pollen consideration in the assessment of colony effects is not likely to substantially alter the risk conclusions except when exposure via pollen is extraordinarily high relative to nectar. The latter is noted for certain crop groups where pollen is expected to be the dominant route of exposure (e.g., corn), and additional consideration is given to available data in the open literature on colony-level effects associated with spiked pollen. 1.7. Non-Apis Bee Characterization The risk profile of imidacloprid to non-Apis bees (e.g., bumble bees, solitary bees) may differ relative to honey bees due to differences in their exposure and sensitivity to imidacloprid. Therefore, uncertainty exists in extrapolating the risk findings of this assessment to non-Apis bees. The relative importance of

17
this uncertainty was evaluated by first considering the relative differences in exposure (e.g., oral consumption rates) and sensitivity (e.g., acute toxicity) individual level. Although data were very limited for non-Apis bees, results suggest oral exposure and effects of imidacloprid on the honey bee are reasonably representative (protective) of available data on adult non-Apis bees (primarily bumble bees). It is also noted that there are limited data on the toxicity of imidacloprid to non-Apis bees. At the colony level, however, a review of studies published in the open literature suggests that bumble bees may be adversely affected at the colony level at concentrations in sucrose considerably lower than those observed for the honey bee. These effects are primarily associated with reproduction (i.e. worker and queen production) in sucrose and/or pollen feeding studies. These studies were considered for qualitative use in thee risk assessment, primarily from a lack of analytical verification of the test substance and lack of raw data, and therefore additional data with Bombus would benefit the risk characterization for non-Apis bees. 1.8. Additional Lines of Evidence The agency evaluated available wildlife incidents for bees and for most incidents, there was not a strong, established association between individual bee or colony losses to imidacloprid as indicated by confirmatory residue analysis. In the cases where a link between imidacloprid exposure and individual or colony losses was made, these reports generally concerned residential uses or other uses pesticide control operators (PCOs). Additionally, there were studies available from the open literature that surveyed imidacloprid residues in agricultural fields as well as various hive matrices. Results from the agricultural monitoring studies, where pollen samples originated from corn and sunflower fields seed treated with imidacloprid, indicated that while imidacloprid was detected frequently (ranging from 36 – 58% of the total samples), the mean values of quantifiable residues ranged from 0.6 – 3.0 ppb, which is just above the limit of quantitation for these studies. The hive monitoring studies included surveys across the United States and Europe where imidacloprid residues were investigated in pollen, nectar, bee, and wax samples. These studies indicated that while imidacloprid was detected in various matrices, the frequency of detection was generally below 10% and where the frequency exceeded 10%, the mean values were generally marginally above the limit of quantitation (varies depending on the study). Although there was one study in which the mean residue of imidacloprid in pollen samples reached as high as 39 ppb, this mean originated from 10 detections out of 350 analyzed samples (2.9%). The studies suggest that despite widespread use of imidacloprid on crops through multiple application methods, the magnitude and frequency of detection in hive matrices is relatively low. 1.9. Risk Conclusions The agency conducted a screening level assessment (Tier I) for the various uses of imidacloprid utilizing the toxicity endpoints in Table 1-1 above and either conservative (modeled) exposures or, as a more refined assessment, actual residue values from pollen and/or nectar (where data were available) to determine if there are risks to individual bees. If these analysis indicated that the level of concern is not exceeded, the agency concluded that there is not a risk and that there is not a concern at the colony level. In these instances, no further analysis was necessary. However, if the analysis demonstrated a risk to individual bees, the agency did, when data were available, conduct a risk assessment to determine

18
whether there were risks posed to the colony. As mentioned above and further described in Section 2 (Problem Formulation), the risk assessment approach to honey bees proceeds in a stepwise, tiered process evaluating risks to individual bees first and, if needed, risks to the colony. After the initial step in determining the potential for exposure of bees to agricultural uses of imidacloprid, risk quotients (or levels of concern) are estimated to evaluate the risk to individual bees using modeled/screening-level exposure estimates and the acute and chronic laboratory toxicity endpoints (i.e. adult acute contact LD50, adult acute oral LD50, adult chronic oral NOAEL, and larval chronic oral LOAEL). For all crops and application methods where on-field exposure, is expected, values exceeded risk levels of concern. Even in cases where on-field exposure was not expected, an off-field spray drift assessment was conducted and indicated that there could be risk for all foliar uses (depending on what crop is adjacent to the field, whether the crop is in bloom, whether the crop is pollinator attractive, etc). Additionally, a refined analysis was conducted using available measured residue data to supplant the modeled/screening-level estimates of exposure that were mentioned above. These refined values were compared to the hazard endpoints tabulated above. For all use patterns where residue data were available, LOCs were exceeded based on refined estimates of exposure. Table 1-2 summarizes the agency’s preliminary risk findings on a crop group-based approach. The table presents the findings for groups of crops that have similar use patterns and application methods and are further split out into three categories of risk findings. When residue data are available, the crop is identified parenthetically within the table along with the respective crop group. Crop groups/use patterns where either on-field exposure is not anticipated due to attractiveness or the crop is harvested before bloom, or the tiered process indicates a low potential for on-field risk, are listed in the green group in Table 1-2. These include all application methods of root/tuberous, bulb, leafy greens, and brassica vegetables, globe artichoke, and tobacco (harvested before bloom) as well as soil applications to blueberries (berries and small fruits) and seed treatment applications to corn (cereal grains). Additional members of the cereal grain group (which is registered for seed treatment uses only) including wheat, barley, oats, rye, and millet are either not attractive to honey bees or primarily wind pollinated. Finally, members of the fruiting vegetable group (of which soil and soil + foliar residues data for tomato are available) are largely unattractive to honey bees with the exception of okra. Therefore, a low potential for on-field risk is determined for all members of this group, except okra, for all application methods based on a lack of exposure. The yellow/gold group represents crop groups/use patterns for which the assessment for individual bees indicates that the LOCs have been exceeded; however, uncertainty exists in the assessment of risk to the colony. These include uses where either no data are available (with indications of the potential to bridge to other neonicotinoid chemicals where data are expected for that same use pattern and application method) or where there is uncertainty in the nectar and pollen residue data originating from uncertainties in the available studies. For several crop groups including legumes, tree nuts, and certain application methods of stone fruits, berries/small fruits, and oilseed, residue data are unavailable but there is the potential to bridge from data for other neonicotinoid chemicals with forthcoming data for certain application methods. In other cases, data are not available and there are no data expected for the other neonicotinoid chemicals such as certain application methods for legumes, tree nuts, berries/small fruits,

19
nectar producing cereal grain members, and herbs and spices. In the case of cucurbit vegetables (soil applications to melons data available), citrus fruits (soil applications to oranges and grapefruits data available), and berries/small fruits (soil applications to strawberries data available), there are limitations with the residue studies that create uncertainty in the risk determinations with these use patterns/application methods. This uncertainty is generally associated with these studies having an unknown timing of application relative to bloom (strawberry), no nectar data available (strawberry), no pollen data available (citrus fruits), and no available residue data from coarse soils, which are shown through several studies to yield residues in nectar and pollen up to an order of magnitude higher as compared to medium and fine soil types. Furthermore, the soil-applied citrus study was conducted with a post-bloom application while the label does not restrict pre-bloom or during bloom applications and therefore the residues from this study are likely underestimated. For soil applications to cucurbits and citrus fruits, there is a potential to bridge with forthcoming data for other neonicotinoid chemicals. In the case of cucurbit vegetables, a full field study (Tier III) on pumpkins is expected in 2016 to further refine the risk picture. Additionally, although foliar applications to stone fruits resulted in pollen residues exceeding a threshold that is indicated in the open literature to cause colony level effects, the bloom duration of stone fruits is markedly shorter than the exposure duration employed in from those studies that determined these effects and therefore there is uncertainty with this determination. Finally, while data are unavailable for pome fruits, residue data for imidacloprid are expected in 2016. Lastly, the red grouping within the table indicates use patterns with associated application methods that present a risk to individual bees as well as a risk in nectar or both nectar or pollen. These include foliar applications (with a 10-day pre-bloom interval) to citrus fruits and foliar, soil, soil + foliar, and seed treatment + foliar applications. (with no bloom restrictions) to cotton. A full field study with cotton is expected in 2016 to further refine this risk determination.

20
Table 1-2. Summary of risk findings for honey bees (Apis mellifera) for the registered use patterns of imidacloprid
Crop Group (Available
Residue Data)
Appl. Method
Individual Bee (Tier I) Risk? Colony (Tier II) Risk? Risk Conclusions
(Basis and Other Considerations ) On Field
(Screening Level)
Off Field (Screening
Level)
On Field (Refined) Nectar Pollen3
Crop Groups/Use Patterns that Present Low On-Field Risk
Root/Tuber Vegetables4
Foliar N Y
No further analysis conducted
Low On-Field Risk (all uses, lack of exposure)1; Off-Field Risk (Tier I, foliar uses only) Soil N
Seed N Bulb Vegetables
Soil N Low On-Field Risk (all uses, lack of exposure)1; Off-Field Risk (Tier I, foliar uses only) Seed N
Leafy Greens Vegetables
Foliar N Y Low On-Field Risk (all uses, lack of exposure)1; Off-Field Risk (Tier I, foliar uses only) Soil N
Brassica Vegetables
Foliar N Y Low On-Field Risk (all uses, lack of exposure)1; Off-Field Risk (Tier I, foliar uses only) Soil N
Seed N
Fruiting Vegetables (Tomatoes)
Foliar Y Y
Y No data2 N
Low On-Field Risk (Tier II, pollen; nectar not produced, lack of exposure) Off-Field Risk (Tier I, foliar uses only) (Determinations apply to all members except okra due to unattractiveness of group to honey bees, Bombus used for pollination services in greenhouse)
Soil Y
Berries/Small Fruits (Blueberry)
Soil Y Y N N Low On and Off-Field Risk (Tier II, nectar and pollen)
Cereal Grains (Corn) Seed Y Y No data2 N
Low On and Off-Field Risk (pollen; nectar not produced) (Other members such as wheat, barley, oats, millet and rye are either not attractive to bees)
Tobacco, globe artichoke
Foliar N Y No further analysis conducted Low On-Field Risk (all uses, lack of exposure)1;
Off-Field Risk (Tier I, foliar uses only) Soil N
Crop Groups/Use Patterns with Uncertainty in Colony (Tier II) Assessment
Legumes
Foliar Y Y No data No data No data On Field Risk (Tier I, all uses); Tier II Risk unknown Off Field Risk (Tier I, foliar uses only) (Honey bee attractive; no bloom restrictions; seed treatment of soybean = highest usage of all registered crops (400,000 lbs a.i/year).
Soil Y
No data No data No data
Seed Y No data
(Potential bridging)
No data
(Potential bridging)
No data
(Potential bridging)

21
Crop Group (Available
Residue Data)
Appl. Method
Individual Bee (Tier I) Risk? Colony (Tier II) Risk? Risk Conclusions
(Basis and Other Considerations ) On Field
(Screening Level)
Off Field (Screening
Level)
On Field (Refined) Nectar Pollen3
Cucurbit Vegetables (Melons)
Soil Y
Y Uncertain (Potential bridging)
Uncertain (Potential bridging)
On-Field Risk (Tier I); Tier II Risk uncertain (Long [6 weeks +] bloom duration; uncertainty of lower than maximum annual rate used and one sampling interval, no residues in coarse soils, unknown as to whether application closer to bloom would yield higher residues; Tier III full field study [pumpkins] expected for 2016 assessment)
Citrus Fruits (Oranges/ grapefruits)
Soil Y Y Uncertain (Potential bridging)
No data (Potential bridging)
On-Field Risk (Tier I); Tier II Risk uncertain (6 week + bloom duration; uncertainty of no residues in coarse soils and residues do not reflect worst case scenario as current labels permit pre and during bloom applications where these applications were made post-bloom)
Pome Fruits Foliar Y Y Y No data No data On-Field Risk (Tier I); Off-Field Risk (Tier I, foliar uses
only) (Residue data expected in 2016) Soil Y Y No data No data
Stone Fruits (Cherries) Foliar Y Y Y N Possible
Low On-Field Risk (Tier II, Nectar;), Tier II Risk possible (Pollen); Off-Field Risk (Tier I) (Stone fruits associated with short bloom duration [2-3 weeks] relative to exposure duration in open literature pollen feeding study [12 weeks] which likely mitigates the potential for colony level from pollen route of exposure)
Stone Fruits Soil Y Y No data
(potential bridging)
No data (potential bridging)
On-Field Risk (Tier I); Tier II Risk unknown
Berries/small fruits Foliar Y Y Y
No data (potential bridging)
No data (potential bridging)
On-Field Risk (Tier I); Tier II Risk unknown Off-Field Risk (Tier I)
Berries and small fruits (Strawberries)
Soil Y Y No data Possible
On-Field Risk (Tier I); Tier II Risk possible (pollen) (Long [6 weeks +] bloom duration; uncertainty of one sampling interval, no residues in coarse soils, unknown timing of application relative to bloom

22
Crop Group (Available
Residue Data)
Appl. Method
Individual Bee (Tier I) Risk? Colony (Tier II) Risk? Risk Conclusions
(Basis and Other Considerations ) On Field
(Screening Level)
Off Field (Screening
Level)
On Field (Refined) Nectar Pollen3
Tree nuts Foliar Y Y Y
No data (potential bridging)
No data (potential bridging)
On-Field Risk (Tier I, all uses); Tier II Risk unknown (Variable bee attractiveness within group); Off-Field Risk (Tier I, foliar uses only)
Soil Y
Y No data No data
Cereal grains Seed Y Y No data No data On-Field Risk (Tier I); Tier II Risk unknown (Nectar producers within the group (i.e. sorghum, buckwheat).
Herbs/Spices Foliar Y Y Y No data No data On-Field Risk (Tier I); Tier II Risk unknown
Off-field Risk (Tier I, foliar uses only) (Variable attractiveness within group)
Soil Y
Y No data No data Seed Y Y No data No data
Oilseed5 Seed Y Y No data
(potential bridging)
No data (potential bridging)
On-field Risk (Tier I), Tier II Risk unknown
Crop Groups/Use Patterns with Colony (Tier II) Risk Indicated
Citrus Fruits (Oranges) Foliar Y Y Y Y Possible
On-field Risk (Tier I), Tier II Risk (nectar), Tier II Risk possible (pollen) Off-field Risk (Tier I) (10-d pre-bloom restriction for foliar uses; 6 week + bloom duration; used for honey production)
Oilseed5
(Cotton)
Foliar Y Y Y Y Possible On-field Risk (Tier I), Tier II Risk (nectar), Tier II Risk possible (pollen), Off-field Risk (Tier I, foliar uses only) (Tier III full field study [cotton] expected for 2016 assessment.
Soil Y Y Y Possible
Hash marks represent no off-field exposure expected for soil and seed treatment uses. 1 Crop is harvested before bloom (except for small acreage for seed production; nectar and pollen residue data were not required as minimal on-field exposure is expected. 2Nectar is not produced by representative crop where residue data are available 3Possible Tier II Risk for pollen indicated when residues in pollen from a residue study exceed 100 ppb, which is indicated in the literature to be a level where colony overwintering survival is potentially impacted. 4Two members of this group, potatoes and sweet potato, are noted to be harvested after bloom, although potatoes are not honey bee attractive and in the case of sweet potato, require pollination only for breeding, which is a small percentage of the total acreage. 5Cotton is registered for all application methods. All other members of the oilseed group including canola and sunflower are registered only for seed treatment use
23
1.10. Major Assumptions and Uncertainties
There are several assumptions and uncertainties associated with both the effects and exposure assessments for imidacloprid. While these assumptions and uncertainties are described in further detail throughout this assessment, a list of the major assumptions and uncertainties is provided below:
• Pollen and nectar are assumed to be the dominant routes of exposure for bees. Potential exposure via abraded seed coat dust is being addressed through separate ongoing development of best management practices.
• Model-predicted, screening-level EECs serve as a conservative estimate for predicting exposure to individual adult and larval honey bees resulting from foliar, soil, and seed treatment applications and therefore may over-estimate exposure.
• It is assumed that pollen and nectar are equally potent routes of exposure when assessing the risk to individual bees.
• Extrapolation of individual bee risk findings to risks at the colony-level is uncertain due to the complexities of exposure and effects at the colony level.
• Off-field estimates of risk are based on screening-level exposure estimates which cannot be refined with available residue data and are assumed to be to pollinator friendly crops at the time of bloom. Therefore, potential off-field risks may be overestimated.
• Available data from crop residue studies may not fully capture variation in temporal and spatial factors (e.g., weather patterns, soil type) that affect imidacloprid residues in pollen and nectar for the tested crop.
• Except for citrus where multiple crops are represented by residue information, most crop groups are represented by residue studies for one or two crops. It is therefore assumed that residue information for the tested crop(s) are representative of other crops in the same crop group.
• Interpretation of Tier 2 risks based on the 6-week, sucrose colony feeding study assumes that bees forage on the treated crop nearly 100% of the time to represent the nectar needs of the colony. In the field, bees may forage for significantly shorter periods of time particularly for crops such as cherries and blueberries that have a 2-3 weeks blooming duration. Bees may also forage on alternative (untreated) plants. Conversely, bees associated with migratory colonies used for pollination services may feed on treated crops for similar or possibly longer periods of time over the course of a growing season.
• Available full field data (Tier III) for sunflower, canola, and corn are considered inadequate to evaluate risk for use patterns where further refinement of risks to the colony are indicated. However, full field studies for pumpkin and cotton are expected in 2016.

24
2. Problem Formulation Problem formulation serves as the first step of a risk assessment and it provides the foundation for the entire ecological risk assessment. In addition to identifying the risk assessment scope and objectives, the problem formulation includes three major components: (1) assessment and measurement endpoints that reflect management goals and the ecosystem they represent, (2) conceptual models that describe key relationships between a stressor (i.e., pesticide) and assessment endpoint or between several stressors and assessment endpoints, and (3) an analysis plan that summarizes the key sources of data and methods to be used in the risk assessment (USEPA 1998).
2.1. Registration Review Background As articulated by the Agency’s Registration Review Schedule, the nitroguanidine-substituted neonicotinoid insecticides (imidacloprid, clothianidin, thiamethoxam, dinotefuran) are currently undergoing Registration Review. With imidacloprid, the first installment of the Registration Review process was the publication of the Problem Formulation and Preliminary Work Plan documents in 2008, (USEPA 2008a; 2008b). With respect to assessing ecological risk, these documents summarized the available data on ecological effects and environmental fate of imidacloprid, identified key data gaps, and set forth a schedule for obtaining these data and completing the ecological risk assessment. Following its receipt and response to public comment comments, the Agency published a Final Work Plan in 2009 (USEPA 2009), which was subsequently amended in 2010 to request additional data related to assessing risks to bees (USEPA 2010a). Also in 2010, a Generic Data Call-In (GDCI) was issued (USEPA 2010b) that required registrants to submit certain types of environmental fate and effects data in preparation for the forthcoming Preliminary Ecological Risk Assessment document.
2.2. Nature and Scope of Assessment Unlike most of the Agency’s Preliminary Ecological Risk Assessment for pesticides which focus on multiple taxa of aquatic and terrestrial non-target organisms, this preliminary assessment focuses solely on the risk of registered imidacloprid uses to bees. The decision to focus on imidacloprid’s potential risk to bees (honey bees [Apis mellifera] and non-Apis bees) reflects that Agency’s desire to evaluate potential risks and appropriate mitigation measures earlier in the Registration Review process relative to other taxa. It also reflects the large volume of information related to environmental exposure and effects of imidacloprid to bees which has been generated over the past decade. Following receipt of public comments on this Preliminary Pollinator Assessment, the Agency plans to issue a revised Preliminary Risk Assessment (PRA) at the end of 2016. The revised 2016 assessment which will include all taxa traditionally considered in Agency pesticide ecological risk assessments (e.g., fish, aquatic invertebrates, mammals, birds, amphibians, reptiles, plants) and update the bee risk assessment with additional information that may have become available. Several other aspects related to the scope of this assessment are important to note. First, this assessment includes a quantitative estimate of risk (i.e., derivation of risk quotients) for the honey bees. Other types,

25
i.e. non-Apis bees, are also considered in this assessment, e.g., bumble bees (Bombus spp.) and solitary bees), but risks are evaluated qualitatively (i.e., without derivation of risk quotients) due to limitations in available data and suitably vetted risk assessment methods for these species. This approach is consistent with the Agency’s Guidance for Assessing Pesticide Risks to Bees (USEPA/PMRA/CDPR, 2014) which recognizes that methods and data for assessing pesticide effects (and exposure) to bumble bees and solitary bees are still evolving and lack standardized regulatory guidelines. Second, this assessment is limited to registered agricultural uses of imidacloprid and therefore, does not include evaluation of risks associated with non-agricultural uses (e.g., residential, forestry uses). The revised assessment to be published at the end of 2016 will include all registered uses of imidacloprid (agricultural and non-agricultural) as there is additional information expected to be incorporated for the non-agricultural uses including ornamentals. Finally, the effects data considered in this assessment are centered on the Agency’s protection goals and their associated assessment endpoints previously identified for bees (USEPA et. al. 2014). As described further in Section 2.5, the assessment and measurement endpoints used to support these protection goals are those that closely relate to survival, growth and reproduction of individual (solitary) bees and overall colony strength and survival (for eusocial bees). A large body of literature has been generated on effects of imidacloprid on bees at lower levels of biological organization (e.g., molecular, organ-level effects) in addition to endpoints relating to behavioral aspects of individual bees. While such data serve as additional lines of evidence in risk assessment and understanding the mechanisms of toxicological effects, they were formally evaluated in this assessment only when they were quantitatively linked to Agency assessment endpoints described in Section 2.5.
2.3. Pesticide Type, Class, and Mode of Action Imidacloprid (IUPAC name: N-[1-[(6-chloropyridin-3-yl)methyl]-4,5-dihydroimidazol-2-yl]nitramide) is a systemic, neonicotinoid insecticide which acts on the insect nicotinic acetylcholine receptors (nAChRs) of the central nervous system via competitive modulation (IRAC 2015). Imidacloprid in the N-nitroguanidine group of neonicotinoids (IRAC subclass 4A) along with clothianidin, thiamethoxam and dinotefuran.1 Its mode of action on target insects involves out-competing the neurotransmitter, acetylcholine for available binding sites on the nAChRs (Zhang et al. 2008). At low concentrations, neonicotinoids cause excessive nervous stimulation and at high concentrations, insect paralysis and death will occur (Tomizawa and Casida 2005). Imidacloprid is a xylem-mobile systemic compound that is readily taken up by the roots of the plant and translocated throughout the plant via the transpiration stream2.
1 http://www.irac-online.org/ 2 Sur, R. and Stork, A. (2003). Uptake, translocation, and metabolism of imidacloprid in plants. Bulletin of Insectology. 56 (1), 35 – 40.

26
2.4. Overview of Imidacloprid Uses Imidacloprid is a registered on a wide variety of agricultural crops, including (but not limited to): root and tuber vegetables, bulb vegetables, leafy, brassica, cucurbit, and fruiting vegetables, cereal grains, citrus fruit, pome fruit, stone fruit, berries, tree nuts, beans and other legumes, herbs, oilseed crops (e.g. canola, cotton) and other use patterns not associated with a crop group such as peanuts and tobacco. It has been registered for use in the United States since 1994. Maximum application rates vary by crop and method, but typically do not exceed 0.5 pounds of active ingredient per acre (lbs a.i/A; single application or per year). Imidacloprid may be applied to crops via a variety of methods including aerial and ground foliar sprays, soil drench, chemigation, soil injection, in-furrow sprays, and seed treatment. There are a wide variety of non-agricultural uses, some examples of which include tree trunk injection, forestry, pet spot-on treatments, turf, and applications to ornamentals. Additionally, there are a number of use patterns that specifically prohibit applications during the pre-bloom or blooming period or whenever bees are foraging. However, as described in Section 2.2, the focus of this preliminary risk assessment for bees is on agricultural uses only. A detailed summary of registered agricultural uses of imidacloprid is provided in Section 3.
2.5. Overview of Physicochemical, Fate, and Transport Properties As described in Section 4.1, imidacloprid is a highly water soluble chemical with low vapor pressure and Henry’s Law Constants. These properties suggest that the chemical will be readily soluble for movement with water and that it is unlikely to volatilize to a meaningful degree. Furthermore, the organic carbon: water partitioning coefficient (KOC) for imidacloprid is low. The dominant transformation process for imidacloprid are photolysis (very fast in the presence of water) and aerobic soil degradation. However, aerobic soil transformation for imidacloprid is very slow (half- life values range from 200 days to more than a year) and therefore, it is expected to persist in the soil system. Photodegradation may occur on soil surfaces via soil application and on wet foliage in case of foliar application, although photolysis on dry soil appears to be slow. Several metabolites of imidacloprid may be formed in the terrestrial soil/plant system and are of toxicological concern with respect to bees. These include IMI-olefin (IMI-olefin) and IMI-5-OH (5-OH-IMI). In plants, imidacloprid may be taken up via the roots or across plant stems and leaves. Imidacloprid is considered xylem mobile, with dominant uptake routes following the transpiration stream3. Details of imidacloprid fate and transformation pathways are provided in Section 4.1.
2.6. Stressors of Toxicological Concern As discussed in Section 4.1, imidacloprid is considered persistent in the terrestrial environment with the exception of conditions that favor aqueous photolysis. Metabolites identified from aerobic soil metabolism studies include IMI-olefin, nitrosamine, guanidine, and 5-keto urea isomers. Based on plant metabolism studies submitted to the Agency, metabolites of imidacloprid detected in various plants
3 Ibid

27
include guanidine, IMI-5-OH, IMI-olefin, IMI-4,5-OH, 6-chloronicotinic acid (6-CNA), 6-chloro-picolylalcohol (6-CPA), nitrosamine and urea. Data on the relative toxicity these metabolites are discussed in Section 5. These data indicate that two metabolites (IMI-olefin and 5-OH-IMI) are of similar toxicity as parent imidacloprid to the honey bee, while other metabolites are much less toxic (e.g. 6-CNA and urea). Therefore, based on relative toxicity of various imidacloprid metabolites to bees and their occurrence in pollen and nectar, the primary stressors of toxicological concern for this assessment are:
• Imidacloprid (parent) • IMI-olefin, and • IMI-5-OH.
2.7. Protection Goals and Assessment Endpoints The Agency has recently defined protection goals for assessing pesticide risks to bees which include: 1) maintenance of pollination services, 2) hive product production (e.g., honey, wax, propolis), and 3) bee biodiversity (Table 2-1; USEPA/PMRA/CDPR 2014). These goals do not apply uniformly across Apis and non-Apis bees; however, they are considered relevant for both social and solitary bees, and honey bees are generally used a surrogate for non-Apis bees. Protection goals dictate assessment endpoints for which specific measurement endpoints are identified. As EPA regulates pesticides under the Federal Insecticide, Fungicide, and Rodenticide Act, which directs EPA to weigh ecological risks associated with a pesticide product against the benefits of that product, protection goals serve to clarify the potential risks against which benefits can be balanced. The management goals, assessment endpoints and measurement endpoints depicted in Table 2-1 reflect the Agency’s use of honey bees as a surrogate for other bee pollinators. Although this approach has limitations, it is assumed that data on individual organisms as well as colony-level data can provide relevant information on the potential effects of a pesticide on both solitary bees as well as social bees. In addition, protection of honey bees would contribute to pollinator diversity indirectly by preserving the pollination and propagation of the many plants species pollinated by honey bees, which also serve as food sources for other pollinating insects. In evaluating potential risks specific to honey bees, the protection goals of preserving pollination services and production of hive products (e.g., honey, wax) are readily assessed through the assessment of population size and the stability (e.g., presence of a queen, uniform brood pattern) of the colony and through direct and indirect measures of the quantity and quality of hive products4. As such, the sensitivity of individual larval or adult honey bees based on laboratory-based acute and chronic toxicity studies serve as reasonable measurement endpoints for screening-level assessments of potential adverse effects on colony strength, survival and capacity of the colony to produce any products. While these measurement and assessment endpoints are tested using managed
4 USEPA. 2012. White Paper in Support of the Proposed Risk Assessment Process for Bees. Submitted to the FIFRA Scientific Advisory Panel for Review and Comment September 11 – 14, 2012. Office of Chemical Safety and Pollution Prevention Office of Pesticide Programs Environmental Fate and Effects Division, Environmental Protection Agency, Washington DC; Environmental Assessment Directorate, Pest Management Regulatory Agency, Health Canada, Ottawa, CN; California Department of Pesticide Regulation http://www.regulations.gov/#!documentDetail;D=EPA-HQ-OPP-2012-0543-0004

28
honey bee colonies, they apply to feral honey bee colonies and, in the absence of data specific to other bees, these measurement endpoints provide useful information for assessing the survival and development of solitary bees and potential effects on bee species richness and biodiversity. To the extent that data are available for other species such as the bumble bee (e.g., Bombus terrestris), blue orchard bee (Osmia lignaria), and the alfalfa leafcutting bee (Megachile rotundata), the effects of imidacloprid on these species are also considered in this risk assessment.
Table 2-1. Protection goals and examples of associated assessment and measurement (population and individual) endpoints for bees.
Protection Goal Assessment Endpoints Example Measurement Endpoints
Population level and higher
Individual Level
Contribution to Bee Biodiversity
Species richness1 and abundance
Individual bee survival (solitary bees) and colony strength and survival (social bees) Species richness and abundance1
Individual worker and larval survival assays; larval emergence; queen fecundity/reproduction
Provision of Pollination Services
Population size2 and stability of native bees and commercially managed bees
Colony strength and survival; colony development
Individual worker and larval survival assays; queen fecundity; brood success; worker bee longevity
Production of Hive Products
Quantity and quality of hive products
Quantity and quality of hive products; including pesticide residue levels on honey/wax
Individual worker and larval survival assays; queen fecundity/reproduction; larval emergence
1 Use of honey bees as a surrogate for other insect pollinators has limitations; however, it is assumed that as with all surrogates, data on individual organisms as well as colony-level data would provide some relevant information on the potential effects of a pesticide on both solitary bees as well as “eusocial” taxa. In addition, protection of honey bees would contribute to pollinator diversity indirectly by preserving the pollination and propagation of the many plants species pollinated by honey bees, which also serve as food sources for other pollinating insects. 2 For managed honey bees, population size can include numbers of colonies.
2.8. Conceptual Models and Risk Hypotheses The risk hypothesis and conceptual model are used to depict the hypothesis in terms of the source of the stress, route of exposure, receptor, and changes in the receptor attribute(s) of concern (USEPA, 1998). With imidacloprid, the conceptual models are depicted separately for each method of application to agricultural crops (i.e. foliar spray, soil application and seed treatment).
2.8.1. Foliar Spray There are many factors that determine the exposure of bees to a pesticide, including methods and timing of application, application rate, attractiveness of the crop to bees, and agronomic practices such as harvesting crops prior to bloom. In general, however, foliar application of systemic pesticides such as

29
imidacloprid are expected to result in exposure of bees via two dominant routes: 1) direct contact with the bee via interception of pesticide spray droplets and newly-sprayed vegetation, and 2) oral ingestion through contaminated pollen and nectar (Figure 2-1). With foliar sprays, these routes of exposure may occur on the treated field or adjacent to the treated field in the case of spray drift. With honey bees, nectar and pollen foragers are expected to receive high exposure via their frequent interaction with blooming crops. Dominant exposure routes of in-hive bees (e.g., nurse, queen, drone bees) include ingestion and processing of pollen and nectar and exposure through production. Stored honey is expected to be an important exposure route for over wintering bees. Processed bee bread, brood food, and royal jelly are major routes of exposure for developing larvae and the queen, although limited evidence suggests pesticide levels in royal jelly are orders of magnitude below those found in pollen and nectar (USEPA 2012). Exposure through the vapor phase is not expected to be a significant route of exposure for imidacloprid, regardless of application method. Exposure of honey bees through contact with contaminated soil is also not expected to be a major route of exposure, although this may be important for ground-nesting bees on or near the treated site. Other routes of exposure are also possible, including consumption of plant guttation fluids, water from dew droplet formation on leaves, puddles, and other surface water. Although relatively high concentrations of neonicotinoid insecticides have been reported in plant guttation fluid (e.g. Girolami et al. 2009), recent reviews of honey bee exposure routes indicate high uncertainty in the importance of guttation fluid ingestion relative to other oral ingestion sources of pesticides (e.g., nectar and pollen). This uncertainty is partly due to the availability of guttation fluid at times of the year when crops are generally unattractive to pollinators and there are other sources of water (Godfray et al. 2014; USEPA 2012). Furthermore, there is presently a lack of robust information on water intake rates by bees from surface water and multiple factors that affect these rates. Therefore, this pathway is not currently considered for quantitative estimation of risk to bees. Changes in the assessment endpoints (e.g., size and stability of bee colonies, production of hive products, pollinator species richness and abundance) as a result of the aforementioned pesticide exposure routes may occur through various means, including reduction in number of worker bees available for foraging or maintaining hive temperature (over wintering), reduction in foraging efficiency via sublethal effects on workers, decreased number or delayed development of brood either from direct exposure to pesticide or indirectly from reduced brood feeding and maintenance by hive bees, and reduced fecundity and survival of queens. Changes in these assessment endpoints are directly related to impacts on protection goals of maintaining pollination services, production of hive products and contribution to pollinator biodiversity.

30
Figure 2-1. Conceptual model for risk assessment of foliar spray applications of imidacloprid to honey bees. Red depicts systemic pathways. Dashed lines represent routes of exposure that are not considered major.
2.8.2. Soil Application Exposure of honey bees to imidacloprid via soil applications (e.g., drench, injection, in-furrow sprays and chemigation) are expected to follow the same routes of exposure as shown previously with foliar sprays, except that contact exposure (on-field and off-field) is not expected to be significant since applications are typically made close to soil surfaces where the likelihood of drift is reduced (Figure 2-2). Furthermore, the nature of these applications is not expected to result in substantial spray drift to adjacent sites relative to foliar sprays. Depending on the timing of rainfall events, there is some potential for exposure via imidacloprid runoff and subsequent translocation into plants adjacent to the treated field. Also, given its persistence in soil, there is potential for soil applications of imidacloprid to be taken up by rotational plants (e.g., cover crops) that are planted after crop harvest. Some of these rotational crops may be attractive to bees as sources of pollen and/or nectar (e.g., clover).

31
Figure 2-2. Conceptual model for risk assessment of soil applications of imidacloprid to honey bees. Red depicts systemic pathways. Dashed lines represent routes of exposure that are not considered major.
2.8.3. Seed Treatment Potential exposure routes of honey bees to imidacloprid used as seed treatments include pollen, nectar, exudates (e.g., guttation fluid), and honey dew resulting from translocation from the seed to growing plant tissues (Figure 2-3). Another route of exposure includes contact with abraded seed coat dust during planting. The latter pathway has been associated with incidents of honey bee mortality (Pistorius et al. 2009, Forster et al. 2009) and is the focus of considerable research (e.g., Tapparro et al. 2012, Krupke et al. 2012). The extent to which honey bees are exposed via contact with abraded seed coat dust is determined by many factors including the physico-chemical properties of the seed coating, seed planting equipment, use of fluency agents (e.g., talc), environmental conditions (wind speed, humidity), and hive location in relation to sowing. Off-site drift of contaminated seed coat dust also may contribute to residues on plants, soil, and surface water to which bees may be exposed through direct contact and ingestion of surface water, pollen, and nectar. This is further described in Section 2.10 (Measures of Exposure). One important attribute of the seed treatment exposure pathway is that exposure to pesticides may occur over a wide time scale (e.g., at seed sowing, during plant growth and flowering, and potentially at plant harvest from exposure to contaminated plant dust).
Imidacloprid: Soil Application

32
Figure 2-3. Conceptual model for risk assessment of planting of imidacloprid-treated seeds to honey bees. Red depicts systemic pathways. Dashed lines represent routes of exposure that are not considered major.
2.9. Analysis Plan The analysis plan provides a rationale for selecting and omitting risk hypotheses in the actual analysis. As with any risk assessment process, the analysis plan also articulates data gaps, the methods used to evaluate existing and anticipated data, and the assumptions that will be made where data may be missing. The analysis plan also identifies the specific measures of exposure (e.g., estimated environmental concentrations; EECs) and effect (e.g., median lethal dose for 50% of the organisms tested; LD50) which will be used to develop risk estimates.
2.9.1. Risk Assessment Methodology For assessing the risks of registered agricultural uses of imidacloprid to bees, this assessment follows the Agency’s guidance entitled: “Guidance for Assessing Pesticide Risks to Bees” (USEPA et al. 2014). The risk assessment consists of an iterative, tiered process that considers multiple lines of evidence related to
Imidacloprid: Planting of Treated Seeds

33
exposure and effects of pesticides to bees. The overall risk assessment framework for foliar spray applications and soil/seed applications are shown in Figure 2-4 and Figure 2-5, respectively. Assessing the Potential for Exposure. The first step of this process is to determine whether exposure to adult and larval bees is of concern. This determination is made based on information about the application methods, application timing, attractiveness of crops to bees, and agronomic practices for the treated crops. This process also considers the potential for bees to be exposed both by foraging on the treated field (i.e., on-field exposure) and from foraging at sites adjacent to the treated field (i.e., off-field exposure). With foliar spray applications of pesticides such as imidacloprid, it is presumed that off-field exposure would occur due to spray drift to adjacent areas regardless of the attractiveness or agronomic practices pertaining to the treated crop. Tier I Assessment (Screening-level). The next step in this process is to conduct a Tier I risk assessment based on estimated exposure via contact and oral routes and effects on individual bees tested in the laboratory. The (EECs) are first calculated at a screening-level using conservative (high end) assumptions of potential exposure. For foliar sprays, these screening-level EECs are calculated for both “on-field” and “off-field” exposures. The screening-level EECs are then compared to acute and chronic toxicity endpoints for adult and larval bees (oral exposure) and acute toxicity endpoints for adult bees (for contact exposure) for the purposes of calculating risk quotients (i.e. the ratio of the EEC to toxicity endpoints). Tier I Assessment (Refined). If the screening-level tier I RQ values exceed the acute or chronic risk level of concern (LOC), then refinements to the Tier I screening-level RQs are considered. These refinements include additional information on the potential exposure of bees to the pesticide, such as field studies that quantify the pesticide residue in pollen and nectar of treated crops, i.e. using measured rather than estimated exposure levels. The Tier I RQ values are then recalculated using the refined EECs and again compared to the acute (0.4) and chronic (1.0) LOCs. If the acute or chronic risk LOCs are again exceeded using the refined Tier I, then mitigation options may be considered and/or a higher tier assessment may be conducted. Tier II Assessment. The Tier II assessment is based on effect studies that characterize pesticide effects at the whole-colony level and therefore, reduce uncertainty associated with extrapolating effects on individual bees under laboratory conditions (Tier I toxicity studies) to effects on the colony. It is important to recognize that Tier II effect studies are conducted under semi-field conditions where the high-end exposure at the colony level is generally expected. Often, Tier II semi-field studies are conducted in which whole colonies are exposed to the pesticide of concern, either in enclosed mesh tunnels or via the diet, such as through feeding spiked sucrose. In Tier II studies other stressors may be present and potential compensatory mechanisms of the colony may occur. Unlike Tier I, characterization of risk in Tier II does not involve the calculation of RQ values per se. Rather, risks at the colony level are usually characterized in relation to pesticide application rate and/or measured residue levels in their diet. Interpretation of such whole-colony effects studies is often much more complex than Tier I studies, and relies on comprehensive considerations of the extent to which adverse effects are likely to occur at the colony level. Based on the risks identified at lower-tier assessments, their associated uncertainties, and other

34
lines of evidence, the risk assessor considers the impact of any risk mitigation options identified for the pesticide of concern. Tier III Assessment. The need for more refined information conducted at the Tier III level is determined depending on the nature of the estimated risks, the associated uncertainties, and available risk mitigation options. Tier III studies are full-field studies that are designed to mimic actual pesticide applications and exposure of bees encountered in the environment. Tier III full field studies are usually highly complex and require a high level of effort to design and conduct so as to address specific sources of uncertainties and potential risks identified in lower risk assessment tiers. Similar to risk characterization at Tier II, risk characterization at Tier III considers multiple lines of evidence available from lower Tiers and other information sources (e.g., open literature) that meet the respective Agency’s standard for inclusion in risk assessments. Risk assessment conclusions are made based on the weight of evidence, available risk mitigation options, and uncertainties in the available data and methods.

35
Figure 2-4. Tiered approach for assessing risk to honey bees from foliar spray applications

36
Figure 2-5. Tiered approach for assessing risk to honey bees from soil/seed applications

37
2.10. Measures of Exposure The primary routes of exposure being assessed quantitatively in this assessment are the contact and oral routes. These are considered the dominant exposure routes for imidacloprid. Measures of contact exposure include the estimated contact dose on a per bee basis (e.g., µg a.i./bee). Contact exposure is also incorporated into Tier II semi-field (tunnel) studies; however, it is not quantified on a per bee basis. Oral exposure is also determined on a mass a.i. per bee basis and considers ingestion of contaminated pollen and nectar. Detailed methods for estimating contact and oral exposure to honey bees are described later in Section 4. Bees may also be exposed to pesticides via other routes of exposure such as through plant guttation fluid, surface water, soil (for ground nesting bees) and drift of abraded seed coat dust. As noted previously, the extent to which bees are exposed via plant guttation fluids and surface water is considered uncertain. Furthermore, the Agency currently lacks reliable methods for evaluating these exposure routes in a quantitative manner (i.e., derivation of Tier I EECs). Therefore, consistent with the Agency’s 2014 risk assessment guidance, this risk assessment will focus on quantitative estimates of exposure via contact and ingestion of, pollen and nectar only. Although exposure and effects to bees via abraded seed coat dust has been documented, obtaining quantitative estimates of this route of exposure is also considered highly uncertain. Rather than assess the risks of abraded seed coat dust, the Agency is focusing its resources on mitigating risks from this exposure pathway through best management practices and working with the regulated community in the development of alternative technologies to reduce dust-off during planting (e.g., alternative fluency agents, equipment modifications, etc.)5 An additional potential route of exposure that is assessed to some extent but certain available data is the carryover of imidacloprid residues in soil from one planting season to another. As will be discussed, environmental fate data suggest a high persistence in the soil and to the extent that residue studies allow, it will explored the magnitude of residues in pollen and nectar following planting in a field where imidacloprid applications were made in previous years.
2.11. Measures of Effects The primary species of focus in this risk assessment is the honey bee and reflects the dominant role this species maintains in providing managed pollination services for agricultural crops throughout the U.S. It also reflects the availability of standardized methods for estimating exposure and effects on A. mellifera. As such, this assessment will consider a variety of measures of effects for quantifying risk to honey bees which differ according to the level of biological organization being assessed. At the Tier I (organism) level, measures of effects include:
• The acute contact LD50 to adult worker bees, • The acute oral LD50 to adult worker bees • The chronic (10-d) oral NOAEL6 for adult worker bees, and
5 http://www2.epa.gov/pollinator-protection/2013-summit-reducing-exposure-dust-treated-seed 6 No Observed Adverse Effect Level

38
• The chronic (21-d) NOAEL for larval bees.
The acute contact and oral endpoints are derived from standardized laboratory toxicity tests conducted according to EPA Office of Chemical Safety and Pollution Prevention (OCSPP) and the Organization for Economic Cooperation and Development (OECD) guidelines and consider lethality as its primary test endpoint, although sublethal effects are commonly noted. Currently, standardized test guidelines do not exist for the 10-d adult chronic oral test or the chronic larval test, but draft guidance have been developed by the OECD7. This test measures lethality and food consumption of adult bees during a 10-d oral exposure. For larval honey bees, measures of effect at the Tier I level include the acute oral LD50, conducted by OECD Test Guideline 237 and the chronic oral NOAEL following draft OECD guidance or other testing protocols currently in development. Acute effects on honey bee larvae are based on lethality while chronic effects include larval bee mortality and the percent emergence of adult bees following pupation. While, the acute LD50 for larval bees is also commonly included as a measure of effect, the acute data for honey bee larvae were not available for imidacloprid. At the Tier II and Tier III levels, measures of effect at the colony level typically include:
• forager bee mortality, • fecundity (e.g., eggs production), • brood development and survival, • hive weigh, strength and survival, • foraging activity, and • the quantity and quality of food provisions.
These effects may be expressed in terms of a particular pesticide application rate (e.g., lbs. a.i./A) or the concentration of the active ingredient in the diet (e.g., µg a.i./L in sucrose). As discussed in USEPA et al. 2014), other sublethal endpoints such as proboscis extension reflex (PER), histopathological effects, and behavior anomalies are not considered as regulatory endpoints by themselves. However, to the extent that these effects contribute to impairment of the aforementioned colony level effects, they are indirectly incorporated into Tier II and Tier III measure of effect and the ensuing risk assessment. Although the focus of this risk assessment is on the honey bee, the Agency recognizes that numerous other species of bees occur in North America and that these non-Apis bees have ecological and in some cases, commercial importance. For example, several species of non-Apis bees are commercially managed for their pollination services, including bumble bees (Bombus spp.), leaf cutting bees (Megachile rotundata), alkali bees (Nomia melanderi), and blue orchard bees (Osmia lignaria), and the Japanese horn-faced bee (Osmia cornifrons). Importantly, a growing body of information indicates native bees play an important role in crop and native plant pollination, besides their overall ecological importance via maintaining biological diversity. Although standard methods are currently not available to quantitatively assess exposure and effects to non-Apis bees, this assessment will include data on the effects of imidacloprid to non-Apis bees and qualitatively assess risks to non-Apis bees.
7 Available at: http://www.oecd.org/chemicalsafety/testing/Draft_GD_honeybee_larval_tox_repeated_exposure_25_February_2014.pdf

39
3. Use Characterization As noted in the problem formulation, Imidacloprid is registered for the control of sucking insects on a large variety of agricultural and non-agricultural sites, including vegetable crops, tree nuts, tree fruits, stone fruits, cotton, tobacco, grapes, citrus, turf, and ornamentals. Target pests include aphids, thrips, whiteflies, termites, turf insects, soil insects and some beetles. Imidacloprid formulations are available as wettable powder, granular, seed dressing (flowable slurry concentrate), and soluble concentrate. Overall agricultural use of imidacloprid includes a large component as a seed treatment where approximately 520,000 pounds are used, and main seed-treatment uses include soybean, followed by cotton, then corn and potato. Use of imidacloprid appears to have increased, where approximately 5 million acres received an imidacloprid treatment in 1998, and approximately 30 million acres received an imidacloprid treatment in 2012. Part of this usage increase (as a foliar or soil treatment) has occurred on a number of specialty crops such as on apples, carrots, cauliflower, cherries; other usage increase, as a seed treatment, has occurred on crops such as soybean and wheat.
3.1. Agricultural Uses Table 3-1 shows the maximum application rates and maximum number of applications for the different crops for imidacloprid with foliar applications, as well as other labeled use information. Each of the tables provides additional comments where there are caveats to the federal labels. Table 3-2 shows use information for the different crops for imidacloprid with soil applications, and Table 3-3 shows use information for different crops for seed-treatment applications. It is noted that several crops have restrictions on applications made during the pre-bloom and bloom period. These include use patterns that have either a pre-bloom interval associated with them or prohibit applications made pre-bloom, during bloom or when bees are foraging (i.e. only post-bloom applications are permitted). Those use patterns and associated application methods that require a 10-day pre-bloom interval include:
• Foliar applications to strawberries • Foliar applications to citrus fruits
Those use patterns and associated application methods that prohibit applications made during the pre-bloom or during bloom period, or when bees are foraging include:
• Soil applications to strawberries (annual and perennial varieties) • Soil and foliar applications to bushberries (e.g. blueberry) • Soil and foliar applications to caneberry (e.g. blackberry and raspberry) • Soil (containerized) applications to citrus fruits • Soil and foliar applications to coffee • Soil applications to cranberry

40
• Soil and foliar applications to pome fruits • Soil and foliar applications to stone fruits • Soil and foliar applications to tropical fruits • Soil and foliar applications to tree nuts
3.1.1. Foliar Applications
Table 3-1. Summary of labeled use information for foliar applications of imidacloprid
Crop Group (Use Pattern)
Max. Single Appl. Rate (lbs a.i/A)
Max # of Appl.
Appl. Interval
Annual total (lbs a.i/A)
Appl. Method Appl. Timing Comment
1 (Potato) 0.05 4 7 0.2 Ground/Aerial From emergence to 7 days prior to harvest
--
1(Tuberous and corm vegetables
0.04
3 (1 only on radish)
5 0.13 (per season) Ground/Aerial
After planting up to 7 days prior to harvest.
--
4A (Leafy greens vegetables)
0.046 5 NA 0.23 (per season) Ground/Aerial
After planting up to 7 days prior to harvest.
--
5 (Brassica (Cole) Leafy vegetables)
0.046 5 5 0.23 (per season) Ground/Aerial
After planting up to 7 days prior to harvest.
--
6 (Legume vegetables (except soybean)
0.04 3 7 0.13 (per season) Ground/Aerial
After planting up to 7 days prior to harvest.
--
6 (Soybeans) 0.05 3 7 0.14 Ground/Aerial At bloom to 21 days prior to harvest
--
8 (Fruiting vegetables) 0.08 3 5 0.24 (per
season) Ground/Aerial After planting up to 0 days prior to harvest.
--
10 (Citrus Fruits) 0.25 2 10 0.5 Ground/Aerial
Anytime up to 0 days prior to harvest.
--
11 (Pome fruits) 0.25 2 10 0.5 Ground/Aerial
Anytime up to 7 days prior to harvest.
0.25 lbs./A is only for pear, other crops have max. of 0.1 lbs./A
12 (Stone fruits) 0.10 5 7 or 10 0.5 Ground/Aerial
Anytime up to 0-7 days prior to harvest.
Yearly maximum 0.3 lbs./A for Apricot, Nectarine, Peach; 0.5 lbs./A for Cherry, Plum, Plumcot, Prune.

41
Crop Group (Use Pattern)
Max. Single Appl. Rate (lbs a.i/A)
Max # of Appl.
Appl. Interval
Annual total (lbs a.i/A)
Appl. Method Appl. Timing Comment
13A (Caneberry) 0.1 3 7 0.3 Ground/Aerial
After bloom up to 3 days prior to harvest.
13B (Bushberry) 0.1 5 7 0.5 Ground/Aerial
After bloom up to 3 days prior to harvest.
--
13 (Grape) 0.1 1 14 0.1 Ground/Aerial Anytime up to 30 days prior to harvest.
--
13 (Strawberry) 0.047 3 5 0.14 (per
season) Ground/Aerial After planting up to 7 days prior to harvest.
--
14 (Tree nuts) 0.10 3 6 0.36 Ground/Aerial Anytime up to 7 days prior to harvest.
--
19A (Herbs) 0.04 3 5 0.13 (per season) Ground/Aerial
After planting up to 7 days prior to harvest.
--
20 (Cotton) 0.06 5 7 0.31 Ground/Aerial
40 days after planting up to 14 days prior to harvest
--
No group (Banana and plantain)
0.1 5 14 0.5 Ground/Aerial Anytime up to 0 days prior to harvest.
--
No group (Coffee) 0.1 5 7 0.5 Ground/Aerial
Anytime up to 7 days prior to harvest.
--
No group (Globe artichoke)
0.126 4 14 0.5 Ground/Aerial After planting up to 7 days prior to harvest.
--
No group (Hops) 0.10 3 21 0.3 Ground/Aerial
Anytime up to 28 days prior to harvest.
--
No group (Peanut) 0.04 3 5 0.13 Ground/Aerial
From emergence to 14 days prior to harvest
--
No group (Pomegranate) 0.10 3 7 0.3 Ground/Aerial
Anytime up to 7 days prior to harvest.
--
No group (Tobacco) 0.05 5 7 0.28 Ground/Aerial
From emergence to 14 days prior to harvest
--
No group (Tropical fruit) 0.10 5 10 0.5 Ground/Aerial
Anytime up to 7 days prior to harvest.
--
NA = not applicable; lbs a.i./A = pounds of active ingredient/acre

42
3.1.2. Soil Applications
Table 3-2. Summary of labeled use information for soil applications of imidacloprid
Crop Group (Use Pattern)
Max. Single Appl. Rate (lbs a.i/A)
Max # of Appl.
Appl. Interval
Annual total (lbs a.i/A)
Appl. Method Appl. Timing Comment
1 (Sugar beet) 0.18 1 NA 0.18 In-furrow Prior to or at planting --
1B (Root vegetables) 0.38 1 NA
0.38 (per season)
In-furrow / band / chemigation
At or after planting up to 21 days prior to harvest.
--
1 (Potato) 0.31 1 NA 0.31 in-furrow / band / subsurface side-dress
At Planting --
1 (Tuberous and corm vegetables)
0.38 1 NA 0.38 (per season)
In-furrow / shank / side-dress
At or after planting up to 3 days prior to harvest.
--
3 (Bulb Vegetables) 0.5 1 NA 0.5 (per
season)
In-furrow / band / chemigation / drench
Prior to, at, or after planting up to 21 days prior to harvest.
Generally applied at planting for greatest benefit
4A (Leafy greens vegetables)
0.38 1 NA 0.38 (per season)
In-furrow / band / chemigation / drench
At or after planting up to 21 days prior to harvest.
--
4B (Leafy petiole vegetables)
0.38 1 NA 0.38 (per season)
In-furrow / band/ chemigation / drench
At or after planting up to 45 days prior to harvest.
--
5 (Brassica (Cole) leafy vegetables)
0.38 1 NA 0.38 (per season)
In-furrow / band / chemigation /drench
At or after planting up to 21 days prior to harvest.
--
6 (Legume vegetables (except soybean)
0.38 1 NA 0.38 (per season)
In-furrow / band/ chemigation / drench
At or after planting up to 21 days prior to harvest.
--
8 (Fruiting vegetables) 0.5 1 NA 0.5 (per
season)
In-furrow/band/ chemigation / drench
At or immediately following planting
- 0.5 lbs./a for pepper and okra, 0.38 lbs./a for other crops
9 (Cucurbit vegetables) 0.38 1 NA 0.38
In-furrow /band /chemigation /drench
At Planting --
10 (Citrus fruits) 0.5 1 NA 0.5 Chemigation /
band/drench Anytime up to 0 days prior to harvest. --
11 (Pome fruits) 0.38 1 NA 0.38 Chemigation Anytime up to 21
days prior to harvest. --
12 (Stone fruits) 0.38 1 NA 0.38 Chemigation Anytime up to 21
days prior to harvest. --
13A (Caneberry) 0.5 1 NA 0.5 Chemigation
/drench After bloom up to 7 days prior to harvest. --
13B (Bushberry) 0.5 1 NA 0.5 Chemigation /
band After bloom up to 7 days prior to harvest. --
13 (Grape) 0.5 1 NA 0.5 Chemigation / side-dress/drench
Anytime up to 30 days prior to harvest. --

43
Crop Group (Use Pattern)
Max. Single Appl. Rate (lbs a.i/A)
Max # of Appl.
Appl. Interval
Annual total (lbs a.i/A)
Appl. Method Appl. Timing Comment
13 (Cranberry) 0.5 1 NA 0.5 Chemigation / direct app.
Anytime up to 30 days prior to harvest. --
13 (Strawberry (annual and perennial)
0.5 1 NA 0.5 (per season)
Chemigation / band
Prior to, at, or after planting up to 14 days prior to harvest.
--
13-07G (Strawberry (perennial and post-harvest)
0.38 1 NA 0.38 Chemigation / band
During renovation up to 14 days prior to harvest.
--
14 (Tree nuts) 0.50 1 NA 0.5 Chemigation / side-dress/drench
Anytime up to 7 days prior to harvest. --
19A (Herbs) 0.38 1 NA 0.38 (per season)
in-furrow / shank / drench /chemigation
At or after planting up to 14 days prior to harvest.
--
20 (Cotton) 0.33 1 NA 0.33 In-furrow / band /chemigation At Planting
Labels allow both at planting AND foliar applications
No group (Banana and plantain)
0.5 1 NA 0.5 Chemigation Anytime up to 0 days prior to harvest. --
No group (Coffee) 0.5 1 NA 0.5
Chemigation / side-dress/drench
Anytime up to 7 days prior to harvest.
- Basal treatment available on 264-827, 264-758)
No group (Globe artichoke)
0.5 1 NA 0.5 In-furrow /chemigation
Prior to, at, or after planting up to 7 days prior to harvest.
--
No group (Hops) 0.3 1 NA 0.3
Chemigation / side-dress/drench
Anytime up to 60 days prior to harvest. --
No group (Peanut) 0.38 1 NA 0.38 In-furrow /
chemigation At Planting --
No group (Pomegranate) 0.50 1 NA 0.5 Chemigation Anytime up to 0 days
prior to harvest. --
No group (Tobacco) 0.04 NA 0.5
In-furrow / tray drench /chemigation
Prior to or At Planting
Single app rate is based on lbs. a.i/1000 plants. Optimum plant population = 6200 to 7200 plants per acre.
No group (Tropical fruit) 0.50 1 NA 0.5 Chemigation
Anytime during the year up to 6 days prior to harvest.
--
NA = not applicable; lbs a.i./A = pounds of active ingredient/acre
3.1.3. Seed Treatments

44
The maximum single application rate in (lbs a.i/A) was estimated based on the amount of product applied to seeds coupled with the number of seeds planted per acre. The number of seeds per acre were either provided or calculated from parameters listed in Acres Planted per Day and Seeding Rates of Crops Grown in the United States. (US EPA, March 24, 2011).
Table 3-3. Summary of labeled use information for seed treatment applications of imidacloprid
Crop Group (Use pattern) Max. Single Appl. Rate (lbs a.i/A)
Comment1
1A (Sugar beet) 0.293 Calculated from labeled application rate of 0.2 lbs a.i/2.2 lbs seed. Application rate = ((1/2.2) * 0.2 * 3.24)). 3.24 is the number of pound of seed per acre
1A, 1B (Carrot) 0.036 Calculated from labeled application rate of 0.003 lbs a.i/lbs seed and lbs of seed/acre (11.95). Pounds of seed/acre calculated from number of seeds per acre and number of seeds per pound.
1C (Potato) 0.50
Calculated from labeled application rate of 0.001 lbs a.i/lbs seed. As the rate that was calculated from number of seeds per acre and number of seeds per pound exceeded the maximum single application rate (in lbs a.i/A) of all imidacloprid uses, the rate was capped at 0.5 lbs a.i/A.
03-07A, 03-07B (onions/leeks/scallions) 0.15
Calculated from labeled application rate of 0.002 oz./1000 seed and lbs seed per acre. Rate = ((0.002 / 16) * 1,229,929 seeds / 1000))
5A (Broccoli) 0.18 Calculated from labeled application rate of 0.014 oz./1000 seed and lbs seed per acre. Rate = ((0.014 / 16) * 210,845 seeds / 1000))
6A (Soybean) 0.210 Calculated from labeled application rate of 0.0013 lbs a.i/lbs seed and lbs of seed/acre (167). Pounds of seed/acre calculated from number of seeds per acre and number of seeds per pound.
6 (Beans and peas) 0.50
Not permitted in California. Calculated from labeled application rate of 0.001 lbs a.i/lbs seed. As the rate that was calculated from number of seeds per acre and number of seeds per pound exceeded the maximum single application rate (in lbs a.i/A) of all imidacloprid uses, the rate was capped at 0.5 lbs a.i/A
15 (Barley) 0.130
Calculated from labeled application rate of 0.00094 lbs a.i/lbs seed and lbs of seed/acre (138). Pounds of seed/acre calculated from number of seeds per acre and number of seeds per pound.
15 (Buckwheat) 0.017
Calculated from labeled application rate of 0.00023 lbs a.i/lbs seed and lbs of seed/acre (72). Pounds of seed/acre calculated from number of seeds per acre and number of seeds per pound.
15 (Corn, field) 0.118
Calculated from labeled application rate of 0.004 lbs a.i/lbs seed and lbs of seed/acre (29.57). Pounds of seed/acre calculated from number of seeds per acre and number of seeds per pound.
15 (Corn, pop) 0.056
Calculated from labeled application rate of 0.003 lbs a.i/lbs seed and lbs of seed/acre (22.04). Pounds of seed/acre calculated from number of seeds per acre and number of seeds per pound.
15 (Corn, sweet) 0.189
Calculated from labeled application rate of 0.006 lbs a.i/lbs seed and lbs of seed/acre (31.52). Pounds of seed/acre calculated from number of seeds per acre and number of seeds per pound.
15 (Millet) 0.12 Calculated from labeled application rate of 0.004 lbs a.i/lbs seed and lbs of seed/acre (30).
15 (Oats) 0.081 Calculated from labeled application rate of 0.0009 lbs a.i/lbs seed and lbs of seed/acre (90).
15 (Rye) 0.436 Calculated from labeled application rate of 0.004 lbs a.i/lbs seed and lbs of seed/acre (109).

45
Crop Group (Use pattern) Max. Single Appl. Rate (lbs a.i/A)
Comment1
15 (Sorghum) 0.092 Calculated from labeled application rate of 0.004 lbs a.i/lbs seed and lbs of seed/acre (23).
15 (Wheat) 0.176
Calculated from labeled application rate of 0.0009 lbs a.i/lbs seed and lbs of seed/acre (188). Pounds of seed/acre calculated from number of seeds per acre and number of seeds per pound.
15 (Triticale) 0.10 Calculated from labeled application rate of 0.0009 lbs a.i/lbs seed and lbs of seed/acre (109).
19B (Mustard) 0.070 Calculated from labeled application rate of 0.01 lbs a.i/lbs seed and lbs of seed/acre (7).
20 (Canola/Rape) 0.082 Calculated from labeled application rate of 0.01 lbs a.i/lbs seed and lbs of seed/acre (8.23). Pounds of seed/acre calculated from number of seeds per acre and number of seeds per pound.
20 (Cotton) 0.095 Calculated from labeled application rate of 0.005 lbs a.i/lbs seed and lbs of seed/acre (18.89). Pounds of seed/acre calculated from number of seeds per acre and number of seeds per pound.
20 (Sunflower) 0.02 Calculated from labeled application rate of 0.005 lbs a.i/lbs seed and lbs of seed/acre (4). Pounds of seed/acre calculated from number of seeds per acre and number of seeds per pound.
20 (Safflower) 0.175 Calculated from labeled application rate of 0.005 lbs a.i/lbs seed and lbs of seed/acre (35). Pounds of seed/acre calculated from number of seeds per acre and number of seeds per pound.
No group (Peanuts) 0.141 Calculated from labeled application rate of 0.00062 lbs a.i/lbs seed and lbs of seed/acre (228). Pounds of seed/acre calculated from number of seeds per acre and number of seeds per pound.
1Number of seeds per acre either provided or calculated from parameters listed in “Acres Planted per Day and Seeding Rates of Crops Grown in the United States.” (US EPA, March 24, 2011).
3.1.4. Multiple Application Types (e.g. combinations of seed, soil, and/or foliar) As indicated above, the maximum annual application rate for several use patterns of imidacloprid is 0.5 lbs a.i/A. Several use patterns stipulate that a variety of application methods (i.e. foliar, soil, and seed treatment) can be used so as long as the applied rate does not exceed 0.5 lbs a.i/year. As will be discussed, there are residue studies available for combined application methods of soil + foliar treatments and seed + foliar treatments.

46
4. Exposure Assessment
Imidacloprid is a systemic insecticide that is associated with multiple use patterns. Exposure of bees to imidacloprid is determined by many factors that are expected to affect the concentration of the chemical in plant parts visited by bees. Two main procedures are used for applying this pesticide: soil and foliar applications. (1) Direct Soil application including in-furrow, drench, chemigation (through drip irrigation), band, shank
injection and planting treated seeds: These types of applications deliver most of the pesticide mass into the soil system with the potential for relatively low amount of drift such as seed drilling dust; and
(2) Foliar application by ground and air equipment. These types of applications deliver the pesticide on to the plant foliage (target) with a percentage being deposited or drifting to the soil upon application (also, later from plant wash-off).
Figure 4-1 depicts important processes governing exposure of bees to imidacloprid through the plant. In this figure, it is assumed that imidacloprid alone is systemic as it is uncertain if any of imidacloprid metabolites are systemic.
Figure 4-1. Imidacloprid application and processes involved in bee exposure
Soil System
Imidacloprid Pool for Plant
Foliage Uptake Foliar Applied
Drifted
Run-Off
Imidacloprid Pool for Plant Root Uptake
Flowers
Carried-over/Accumulated

47
As shown in Figure 4-1, determining the extent of bee exposure to imidacloprid through the plant requires knowledge of the source and movement of the compound from the point of application into the point of plant entry (roots and/or foliage). To help in the analysis, two virtual imidacloprid pools are assumed: a pool for plant root up-take and a pool for plant foliage up-take. In case of the “root up-take pool”, sources of imidacloprid are from direct soil application including seed treatment, indirect spray following foliar application, in addition to that reaching the soil later by plant wash-off. Other sources could be imidacloprid carried-over from applications to previous rotational crop(s) (accumulated in the soil and/or added from treated plant material left in the field after harvest). In case of the “foliage up-take pool”, the source of imidacloprid is from direct foliar application noting that part of the foliage-applied chemical is expected to reach the soil during application and later through wash-off. The dynamic nature of these two virtual pools is expected because chemical species present in these pools and their concentrations will vary with time following application. Therefore, it is important to understand factors that govern the characteristics of these imidacloprid virtual pools including important factors such as: mode of application (e.g., soil, foliar), procedure (e.g., ground, aerial), rate, and timing in relation to the crop growth stage; and, imidacloprid physical/chemical and fate and transport properties (solubility, mobility and persistence in the soil system in case of the “root up-take pool” or persistence within the plant foliage in case of the “foliage up-take pool”). Furthermore, it is equally important to understand factors related to crop including: root and foliage up-take properties, imidacloprid physical distribution, and metabolism within various plant parts. Ahead of this discussion, it is noted that this exposure section includes several studies that characterize the residues of imidacloprid and its metabolites in plant parts other than those frequented by pollinating insects, such as honey bees. While these studies do not allow for the assessment of residues in the pollen and nectar for a given crop, they will be used to provide further characterization of exposure in terms of availability of resides in plant parts (e.g. stems, leaves, fruits) available for consumption by other taxa such as birds and mammals in the subsequent assessment for imidacloprid expected by the end of 2016.
4.1. Physical/chemical and fate and transport properties Table 4-1 contains a summary of the chemical profile of imidacloprid. These data indicate that imidacloprid is highly soluble with low vapor pressure and Henry’s Law Constant. These properties suggest that the chemical will be readily soluble for movement with water and that it is unlikely to volatilize to a meaningful degree. Furthermore, the Kow for imidacloprid is low, and this property along with the high solubility are known attributes of systemic pesticides although the systemic nature of the pesticide should be based on residue and fate analyses to reduce uncertainties (Bonmatin et al, 2015).

48
4.1.1. Physical/Chemical properties Table 4-1 contains a summary of the chemical profile of imidacloprid. Table 4-1. Chemical profile of imidacloprid
Property Value
Chemical Structure: Name
1-(6-chloro-3-pyridin-3-ylmethyl)-N-nitroimidazolidin-2-ylidenamine
Molecular Formula C9H10ClN5O2 Molecular Weight (CAS No.) 255.7 g/mole (13826-41-3) Water Solubility @ 20 oC 580 mg/L (ppm) Octanol: Water Coefficient Kow 3.7 @ 21 oC Vapor pressure (Henry’s Law Constant) 1.5 x 10⁻⁹ torr (9.9 x 10⁻¹³ atm m3 mol-1 @ 20 oC
Data in Table 4-1 indicate that imidacloprid is highly soluble with low vapor pressure and Henry’s Law Constants. These properties suggest that the chemical will be readily soluble for movement with water and that it is unlikely to volatilize to a meaningful degree. Furthermore, the octanol: water coefficient (Kow) for imidacloprid is low, and this property along with the high solubility are known attributes of systemic pesticides.
4.1.2. Environmental Fate and Transport Properties The environmental fate and transport characteristics of imidacloprid are summarized in Table 4-2. These data suggest that the compound is relatively stable to multiple routes of degradation other than photolysis in water and is therefore likely to be persistent in soils. Given the persistence in soil and the mobility of imidacloprid, the compound has the potential to leach into ground water and to run-off into surface waters for extended periods of time depending on soil and climatic conditions. Table 4-2. Fate and transport properties for imidacloprid
Imidacloprid
N+ O
N
NH CH2
Cl N
O-
N
Property Values MRID Reference
Hydrolysis t ½ Stable @ pH 5, 7 and hydrolyzed slowly (Extrapolated t ½= 355 d) in sterile alkaline solutions @ pH 9 420553-37
Environmentally Relevant Direct Aqueous Photolysis t ½ (Two hours study)
0.2 days Major Metabolites: Guanidine or desnitro compound (NTN-38014): Max 17% and urea compound (NTN-33519): Max 10% @ End of study= EOS Additionally, three major un-knowns reached Maximums of 8-13% @ EOS. Minor Metabolites: Several un-knowns with a total Max of 13% @ EOS Important Notes: (1) UV spectra of the chemical has a maximum absorption at 269 nm, therefore
degradation by sunlight is expected
422563-76

49
(2) Under natural sunlight, in a dilute aqueous solution in the greenhouse: 60% of the chemical degraded within 4 hours supporting the results of the study
Environmentally Relevant Soil Photolysis t ½ (15-d study)
171 days in a sandy loam soil from Kansas (pH= 5.2; O.C= 1.4% and CEC= 22 meq/100 g) Major Metabolites: None Minor Metabolites: 5-hydroxy compound (WAK-4103): Max 6%; Nitosimine compound (WAK-3839): Max 1% and a mixture of urea compound (NTN-33519) and Olefin compound (NTN-35884): Max 3%; and 6-Cloronictonic acid: Max 2%; All Maximums @ EOS. Additionally, two unidentified reached Maximums of >>5% @ EOS Un-extracted Residues (UER): Max 11% @ EOS
422563-77
Aerobic soil t ½ @ 20 ± 2 oC (End of study “EOS”= 366 day; Pyridinyl-14C-methylene imidacloprid)
>>Year (Parent reached only 71% @ EOS) in a sandy loam soil from Kansas (pH= 4.8; O.C= 1.4% and CEC= 16 meq/100 g). Note: Levels of metabolites were insufficient to permit their identification (Needed 20x to 100x the rate) Major Metabolites: None Minor Metabolites: Olefin compound (NTN-35884), WAK-4230-1, Nitosimine compound (WAK-3839), Guanidine or desnitro compounds (NTN-33014) and the two isomers of 5-keto-urea compounds. Additionally, one unidentified reached Maximums of nearly 1% @ EOS Un-extracted Residues (UER): Max 10-15% @ 30 d-EOS after additional reflux extraction yielding parent Mineralization to CO2: Max 7.4% @ EOS
420735-01
Aerobic soil t ½ @ 20 ± 2 oC (End of study “EOS”= 100 day; Pyridinyl-14C-methylene imidacloprid)
289 d (Extrapolated value because parent reached 71% @ EOS) in BBA 2.2, a loamy sand soil from Germany (pH= 5.5; O.C= 2.2% and CEC= 10 meq/100 g). Note: Levels of metabolites were insufficient to permit their identification (Needed 20x to 100x the rate) Major Metabolites: None Minor Metabolites: Same as in the soil, above Mineralization to CO2: Max 10% @ EOS Un-extracted Residues (UER): Max 13-16% @ 30 d- EOS after additional reflux extraction yielding parent Un-extracted Residues (UER): Max 13-16% @ 30 d- EOS after additional reflux extraction yielding parent
452393-01
Aerobic soil t ½ @ 22 ± 2 oC (End of study “EOS”= 100 day; Pyridinyl-14C-methylene imidacloprid)
210 d (Extrapolated value because parent reached 75% @ EOS) in Hoefchen, a loamy soil from Germany (pH= 5.3; O.C= 1.2% and CEC= 11 meq/100 g). Major Metabolites: None Minor Metabolites: Several metabolites occurred at very low levels: total= 7% (not identified nor quantified) Mineralization to CO2: Max 6.4% @ EOS Un-extracted Residues (UER): Max 11-13% @ 35 d- EOS after additional reflux extraction yielding parent
452393-02
Aerobic soil t ½ @ 22 ± 2 oC (End of study “EOS”= 366 day; Pyridinyl-14C-methylene imidacloprid)
>Year (Parent reached 73% @ 125 days to EOS) in Monheim 1, a sandy loam soil from Germany. Major Metabolites: None Minor Metabolites: None were tracked, if any Mineralization to CO2: Max 5% @ EOS Un-extracted Residues (UER): Max 12-22% @ 100- EOS after additional reflux extraction yielding parent
452393-03
Terrestrial Field Dissipation
All studies were unacceptable
GA: 422563-79 MN: 422563-80 CA: 422563-81
Koc ( (L Kg -1) Parent 425208-01

50
Persistence Available environmental fate data suggest that the main route of imidacloprid, transformation in terrestrial ecosystems, is abiotic aqueous photolysis with very low metabolism in the aerobic soil. Aerobic soil transformation of imidacloprid is expected to be slow with degradation half-lives ranging from 305 to >2,000 days and 90th percentile t½ of 1,669 days (n=4). Based on this route of degradation alone, imidacloprid is expected to be highly persistent in the soil system. This persistence in soils may lead to accumulation over time with repeated applications. For example, if it is assumed that imidacloprid dissipates in the soil by aerobic soil metabolism alone with the shortest half-life of 305 days or the 90th percentile half-life of 1,669 days, an accumulation of about five times the yearly rate is possible, with the long half-life, within 10 years of repeated yearly applications (Figure 4-2). In reality, the magnitude of accumulation is expected to be highly affected by other important routs of dissipation including: leaching, run-off and plant up-take which is expected to reduce this accumulation.
Figure 4-2. Imidacloprid expected accumulation in 10 years of repeated application at a rate of 0.5 lb. a.i/A (This rate is equal to 0.245 ppm distributed on the top 6” of the soil); Noting that the graph was constructed based on yearly application coupled with daily degradation based on the aerobic soil
Average= 318 (n=5) with a range from 277 to 411 L Kg -1 in soils differing in texture (sand, loamy sand, silt loam “replicated” and loam), cation exchange capacity (4-16 meq/100 g), organic carbon content (0.4-2.6%) and pH (4.5-6.5); Found no relation with O.C, Clay or pH Guanidine Compound (a metabolite) Average= 742 (n=4) with a range from 327 to 942 in the same soils used for the parent, above
and 425208-02

51
degradation rate constant. Photo-degradation may occur on soil surfaces in the case of direct/indirect soil application and on foliage in the case of foliar application. Photolysis on soil data suggest that dissipation of imidacloprid through this process is expected to be slow (t½ = 171 days). In contrast, aqueous photolysis is expected to be a significant process for imidacloprid transformation on wet foliage. The significance of this process is dependent on the presence of light and moisture (rain and/or irrigation) on foliage and factors that determine how much of the chemical is taken up by the plant (application rate, formulation, tank mixes, timing, application procedure and plant foliage density/characteristics) and for how long (affected by plant wash-off by rain and/or irrigation). Although many factors are required for dissipation of the chemical by aqueous photolysis, laboratory data suggest that abiotic photolysis may play an important role in imidacloprid dissipation (t½ = 0.2 days). Unfortunately, this parameter was not measured in the field although measurement of imidacloprid decline and formation of the urea metabolite on foliage may be used as an indication of the importance photolysis. These factors will be examined later in this assessment. For persistence of imidacloprid in the field, available terrestrial field dissipation studies are all classified as invalid for several reasons including application rates not confirmed, and metabolites were not tracked. However, it could be stated that the chemical showed relative stability in the field. Additionally, available rotational crop studies confirmed occurrence of soil carry-over from application to one crop to the following crop based on data obtained for magnitude of residues in rotational crops (MRIDs: 432459-01 and 440637-01). In these studies, detectable residues of imidacloprid were found in variable quantities in rotational crops planted after 1, 4, 8 and 11 months rotational intervals following a single granular application of 0.29-0.32 lb. a.i/A. Measured average residues of imidacloprid plus its metabolites (parent plus metabolites containing the 6-chloropyridinyl moiety) were observed in California: wheat forage/straw (0.12-0.19 (ppm), turnip tops (0.58 ppm), and spinach leaves (0.32 ppm) all planted-back after 8 months. It is noted however, that residues were much lower in other parts of the plant such as roots and grain (e.g., grains: <0.05 ppm) and that the magnitude of residues varies within a given crop depending on the planting location (i.e., CA vs. KS or MS). It is noted that the list of degradates containing the 6-chloropyridinyl moiety includes the two degradates of concern (IMI-olefin and IMI-5-OH) plus guanidine, 4-5-hydroxy, nitrosimine and urea compounds. With the exception of the soil applied blueberry residue study (MRID 495356-02), field soil residues data were not obtained for studies conducted to measure pollen, nectar and/or leaves residues in several other crops. In the blueberry study, imidacloprid residues (imidacloprid, IMI-olefin, and IMI-5-OH) were measured in three locations (Site 1: Loam soil in NY, Site 2: Silt loam soil in IL and Site 3: Sand soil in MI). In each site, nine samples, from the top 6” of the soil, were analyzed (after the first application of 0.50 lbs a.i/A) at two separate sampling intervals (245 and 361 days after the 1st application at site 1 and 275 and 357 days after the 1st application at site 2). At 366, 360 and 366 days after the 1st application a 2nd application of 0.50 lbs. a.i/A was applied to sites 1, 2 and 3, respectively. After this 2nd application, the same scheme of sampling/ analyses were performed after 588, 611 and 608 days following the 1st application at sites 1, 2 and 3, respectively (Appendix H). Parent was the major constituent of the tracked residues (on the average 72% of the applied after nearly a year following the 1st application at sites 1 and

52
2). The IMI-olefin metabolite constitutes 2 to 5% of the applied after same period at site 1 and 2. Within the year after the first application, each of the three sites received a second application of 0.5 lbs a.i./A. Residue analyses was not performed just before and just after this 2nd application but rather within a year after the application (nearly two years after the 1st application). Again, residue data indicate that parent was the major constituent of the tracked residues (on the average 50, 69 and 48% of total applied “% of the 1st plus the 2nd applications” after nearly two years following the 1st application at sites 1, 2, and 3, respectively). The IMI-olefin metabolite constitutes 2, 5 and 2% of the applied after same period at sites 1, 2 and 3, respectively. The IMI-5-OH metabolite was not detected at sites 1 and 2 within the first year from the first application but was sporadically detected, after two years in the three sites, at very low level (<0.4% of the total two applications). A wide range of concentrations were observed and some were even higher than what is expected from the amount applied (further details in Appendix H). This may be a reflection of the small width of the band application (18” on each side) in relation to the larger area of sampling (100 x 200 ft and 200 x 400 ft). However, the large number of samples may reflect the real concentration present resulting from application followed by dissipation (degradation and movement). Mobility Based on laboratory batch equilibrium studies, parent imidacloprid is expected to be moderately mobile (Koc = 318 L Kg -1, n=5; FAO Classification). Persistence/mobility data suggest that imidacloprid has the potential to leach into groundwater and to move into surface waters through run-off for long periods of time. The mobility of imidacloprid was confirmed in the field by two prospective ground water (PGW) studies. One of the studies was conducted in Montcalm County, Michigan (0.34 lbs. a.i/A to potatoes; MRID 458582-01) and the other in Monterey County, California (0.45 lb. a.i/A to broccoli; 458787-01). In both studies, the registrant monitored for imidacloprid parent, imidacloprid guanidine, imidacloprid olefin, and imidacloprid urea in the vadose zone (area between ground surface and where groundwater is at atmospheric pressure) and in shallow ground water. In both studies, the predominant compound detected in soil, soil-pore water throughout the vadose zone, and in ground-water (when detectable) was parent imidacloprid. Of the three degradates analyzed for (guanidine, olefin, and urea compounds) only the urea compound leached at concentrations that were frequently detectable in the shallow ground water. It was noted that detections in ground water (i.e., breakthrough) started after 500 days from application and continued five years after application. Residues of imidacloprid in ground water were most frequently observed under use conditions which promoted greater ground-water recharge and/or when imidacloprid was used in multiple growing seasons at the same site. Degradation Profile Based on various laboratory fate studies (Table 4-2), abiotic direct photolysis appears to be the major degradation pathway for imidacloprid. In contrast, the chemical is expected to resist biotic metabolism in the aerobic soil. Based on this data, Figure 4-3 is suggested to represent the degradation pathways for imidacloprid in terrestrial ecosystems.

53
Maximum: 17%
Maximum: 10%
Maximum: 6%
Maximum: 2%
(Maximums for Metabolite, above: <1-2%) +UNE (Un-Extracted Residues) (10-16%) + CO2 (6-10%)
Figure 4-3. Expected degradation profile for imidacloprid in compartments of the terrestrial ecosystems. Imidacloprid parent, and the IMI-olefin and IMI-5-OH degradates are considered residues of toxicological concern.
Imidacloprid
N+ O
N
NH CH2
Cl N
O-
N
Guanidine NH
NH CH2
Cl N
N
Olefin
NO2 N
NH CH2
Cl N
N
Nitrosimine
NO N
NH CH2
Cl N
N
Guanidine NH
NH CH2
Cl N
N
Urea
O
NH CH2
Cl N
N
5 hydroxy
OH
NO2 N
NH CH2
N
6-chloronicotinic acid
COOH Cl
N
5-Keto – Urea Isomers
O
NH CH2
Cl N
N
O
O
NH CH2
Cl N
N
O
WAK-4230-1 N
NH CH2
Cl NH
N NO2
Aqueous Photolysis:
Rapid (t ½= 0.2 days)
Soil Photolysis:
Slow (t ½ = 171 days)
Aerobic Soil System: Slow Metabolism (t ½ = 200 days - > Year)

54
Data in Figure 4-3 show the following: • Direct aqueous photolysis: photolysis is expected to be rapid (t½ = 0.2 days) producing the following
metabolites: guanidine/desnitro compound (NTN-38014) at a maximum of 17% and imidacloprid urea (NTN-33519) at a maximum of 10%. Both maxima occurring at the end of the study suggesting their stability to further photo-degradation. Many other metabolites were not identified with only three of them at levels ranging from 8-13% of the applied residues. Availability of water and sunlight is necessary for this process to occur and therefore is expected to be important in clear shallow surface water exposed to sunlight and could be important on wet foliage exposed to sunlight; and
• Biotic aerobic soil metabolism: this process is expected to be very slow producing metabolites at very low concentrations. Although it is very slow, aerobic soil degradation is the only degradation pathway that is expected to affect applied parent reaching the soil directly upon soil or seed application or indirectly from foliar applications and later from wash-off. Limited, biotic degradation in aerobic soil systems is expected to produce the following minor metabolites: olefin (NTN-35884), WAK-4230-1, nitrosimine (WAK-3839), guanidine/desnitro (NTN-38014) and the two isomers of 5-keto-urea compounds.
The degradation profile of imidacloprid suggests the following: Imidacloprid parent is expected to be the major species present in the soil system of the terrestrial
eco-systems because it resists aerobic soil bio-degradation and abiotic photolysis on soil. Therefore, parent is expected to be the dominant species in both imidacloprid pools (root and foliage), noting that metabolites are also expected to be present but at low concentrations. In addition to parent, the only other two metabolite that are reported to be of toxicological concern for bees are the olefin and 5-hydroxy imidacloprid; and
Although, aqueous photolysis is expected to be a significant process for imidacloprid transformation
on wet foliage during daylight (t½ = 0.2 days). However, the importance of this parameter was not demonstrated in the examined field trials herein.
In terrestrial ecosystems, there are two dissipation processes that appear to be of varying importance in imidacloprid exposure: degradation and movement. Degradation in the soil system is expected to have minimal effects on parent imidacloprid and available field data do not show that photolysis is important in degradation of imidacloprid reaching foliage. In contrast to degradation, imidacloprid exposure is expected to be highly affected by its movement including leaching down the soil profile, movement into the plant (plant up-take) and with surface water run-off. Imidacloprid mobility is necessary for its movements towards the root system from the point of application for root up-take but it may also reduce its availability for the same root up-take, by leaching downwards, as it reduces the available pool of imidacloprid from which the roots could up-take the pesticide. In this respect, it should be noted that dense/deep plant root systems may overcome effects of imidacloprid leaching. This factor depends on the plant type and the stage of growth in relation to application timing of the pesticide. Although the compound is expected to leach and no longer be available for root uptake for crops with shallow/thin root

55
systems, it would still be available for those plants with deep/dense root systems. Similarly, reduction of the available pool of imidacloprid for root-uptake is expected as a result of its movement away from the application site in run-off waters. This dissipation pathway is highly dependent on many factors such as soil type/slope and rainfall intensity/timing in relation to the time of pesticide application. 4.2. Imidacloprid Plant Up-take Several studies were evaluated in order to understand root and foliage up-take. These studies were not specifically designed for this purpose but rather for determining the nature of imidacloprid residues in varied raw agricultural commodities (apples, corn, tomatoes, potatoes and eggplants). In this section, plant up-take will be examined for imidacloprid applied to soil (including seed treatment) as well as applied to foliage. 4.2.1. Imidacloprid applied to soil including seed treatment
In four studies, radio-labeled compound (14C-imidacloprid) was soil applied to cotton, potatoes, corn and eggplant (MRIDs: 425561-05/06/10 and 11, respectively). Only a summary of the results obtained from these studies is included herein and more details are included in Appendix H. Results from these four studies are summarized in Table 4-3. In this Table 4-3, observed up-take in percent of applied and resultant concentrations are included. It is noted, that data for foliage were combined from stems and leaves but most of the radioactivity assigned for foliage in Table 4-3 is present in leaves rather than stems. Table 4-3. Imidacloprid root up-take/distribution and resultant concentrations in cotton, potatoes, corn and eggplant (%= up-take in % of the applied radioactivity and numbers in brackets are resultant concentrations in mg/kg)
Cotton
Timing 1 211 days Type 2 Foliage Seeds
Data 4.7% (0.11) 0.2% (0.007)
Potatoes
Timing 1 129 days
Type 2 Foliage Tubers
Plant 2.2% (5.76) 0.3% (0.091)
Soil 98.4% (0-20 cm: 0.98-0.47; 20-50 cm: 0.007-0.002)
Corn
Timing 1 33 days 61 days 134 days
Type 2 Foliage Foliage Foliage Husks Cobs Grain
Plant 4.2% (5.84) 10.2% (1.52) 19.7% (3.08) 0.12% (0.21) 0.15% (0.12) 0.14% (0.04)
Eggplant Timing 1 14 days 35 days 69 days Type 2 Foliage Foliage F/FC/IMMF Foliage F/FC/IMMF Calyx Fruits

56
Plant 2.7% (5.89) 2.7% (3.63) 0.03% (0.73) 1.6% (1.47) 0.04% (0.74) 0.01% (0.17) 0.03% (0.04)
Soil 79% (1.67) 74% (1.43) 78% (1.60) 1 Timing: Timing in days from imidacloprid application which coincides with planting time noting that it was transplanting time for eggplant plantlets which were transplanted at the eight leaves stage 2 Type: Type of sample noting that Foliage= Stems and leaves/vines; F/FC/IMMF= Flowers, flower clusters and immature fruits
Data in Table 4-3 suggest that the total root uptake for soil-applied imidacloprid, appeared to take place upon application reaching equilibrium in the early growth stage of the plant. Uptake was generally very low (ranged from 2-5% of the applied in cotton, potatoes and eggplant). In corn, much higher uptake was observed with quantities increasing towards maturity (from 4 to 20% of the applied). In all cases, radioactivity that was up taken through the roots concentrated in foliage (leaves and stems) with minor amounts reaching the productive parts of the plant at maturity (ranged from 0.1 to 0.5% of the applied). As a result of the skewed distribution of radioactivity within the plant, concentrations in the foliage ranged from 0.1 to 5.89 ppm compared to 0.007 to 0.2 ppm in the reproductive parts of the plant. Radioactivity left in the soil was measured in only two studies in eggplant at 14, 35 and 69 days showing that radioactivity left in the soil were almost constant (74 to 79% of the applied). The same was observed in the soil planted with potatoes in which 98.4% of the applied radioactivity left in the soil. Loss of radioactivity may be related to leaching, in addition to expected analytical errors. Transformation of imidacloprid was observed in the soil planted in eggplant as observed parent concentrations were between 62 and 82% with not more than 2% of the metabolites 5-hydroxy and nitrosimine compounds and 6-CNA. Data, not shown in Table 4-3, suggest that the presence of high concentrations of imidacloprid in the soil lead to high root up-take. This was demonstrated in cotton by applying an additional soil drench of imidacloprid to some of the cotton plants (60 X of the seed treatment amount applied in the main experiment). Application of 60 X the rate to cotton resulted in 379 to 1908 fold increase in concentrations related to root up-take.
4.2.2. Imidacloprid applied to foliage and fruits
In three studies, 14C-imidacloprid was applied as formulated liquid spray to the foliage of potato plants and to the fruits of apple and tomato plants planted in the greenhouse (MRIDs: 425561-07/08 and 09, respectively). These studies represent application of the chemical directly to foliage and depending on the growth stage of the plant, it may also be directly applied to flowers and fruits. In this case, plant up-take is determined by the amount of chemical inside the fruits in the case of application to fruits (tomato and apple experiments). However, uptake can be only confirmed in the case of foliage (the potato experiment) by the occurrence of plant metabolism inside leaves and stems (when metabolism on the surface can be discounted) and by translocation to other plant parts that are not directly sprayed by the chemical (such as tubers when no chemical is present in the soil). Only a summary of the results obtained from these studies is included herein and more details are included in Appendix H. Data obtained from the three studies for radioactivity distribution and resultant concentrations are summarized in Table 4-4.

57
Table 4-4. Imidacloprid up-take/distribution and resultant concentrations in various parts of the potato plants and only in the fruits of apples and tomatoes (%= up-take in % of the applied radioactivity and numbers in brackets are resultant concentrations in mg/kg).
Potatoes
Timing 1 7/90 days 28/111 days 64/147 days
Type 2 Vines Tubers Vines Tubers Vines Tubers
Plant 40.1% (2.51) 0.02% (0.01) 48.5% (1.97) 0.02% (0.01) 49.0% (1.35) 0.20% (0.01)
Soil 50.75% (0-15 cm: 0.006-0.004; 15-55 cm: 0.001-<0.001); Samples for 64/147 days only and the depth of
sampling, in cm, is indicated
Tomatoes
Timing 1 4 days 7 days 14-21 days
Type 2 Fruit Surfaces Fruit Pulp Fruit surfaces Fruit Pulp Fruit surfaces Fruit Pulp
Fruits 88% (0.89) 12% (0.12) 77% (0.64) 23% (0.19) 76-60% (0.65-0.39)
24-40% (0.2-0.25)
Apples
Timing 1 Zero Day (Just After) the Last of 3 Applications 14 Days After the Last of 3 Application
Type 2 Fruit Surfaces Fruit Peel Fruit Pulp Fruit Surfaces Fruit Peel Fruit Pulp
Fruits 74.2% (1.31) 15.9% (0.28) 9.9% (0.17) 64.9% (0.94) 21.1% (0.31) 14.0% (0.2) 1 Timing: Timing in days from imidacloprid application; For potato 7/90 days mean that (vines)/tubers were sampled 7 days after application on plants at age of 90 days) 2 Type: Column: Type of sample noting that Potato Vines= Stems and leaves
Data in Table 4-4 indicate that only half of the chemical reached/stayed on/in the foliage of the potato plants (40-49% of the applied radioactivity), the other half reached the soil and only 0.2% reached tubers presumably by direct up-take from the contaminated soil or by translocation from the foliage. In the case of tomato and apples fruits, most of the applied radioactivity stayed on the surface of the fruits (60 to 88%) with relatively substantial amounts entering the fruits (12 to 40% in tomatoes and 26-35% in apples). Additionally, increasing residence time on the fruit surfaces appears to increase radioactivity that enters the fruits (an increase from 26 to 35% in apple peel+ pulp after a resident time of 21 days and from 12 to 40% in tomato pulp after a resident time of 14 days. The results suggest the likelihood of an increase in residues in fruits sprayed at younger age compared to those sprayed at older age. Data suggest that important translocation may occurred from the surfaces fruits to the fruits inside. In contrast, no apparent transport of radioactivity occurs from plant leaves into fruits in both apples and tomatoes in a separate imidacloprid translocation experiments (refer to Appendix H).
4.2.3. Imidacloprid: soil versus foliage applied As expected, the chemical residues present on/in foliage from foliar applied imidacloprid was much higher than that resulting from soil application (A total of 49.2% on mature plants, 64 days after application compared to a total of 2.5% on mature plants, 129 days after application ). In the first case, imidacloprid reaches foliage directly and the soil indirectly while in the second case, only a comparatively small fraction

58
of the chemical reaches foliage by root up-take. In this respect, it is noted that the level of chemical ending up in the foliage, from foliar application, depends on many factors that were not investigated here such as photolysis on wet foliage, use of stickers and levels of wash-off (weather dependent). Soil (at planting) and foliar applications were investigated in parallel in potatoes. Data obtained from previously stated experiments are summarized in Figure 4-4. It is important to note that in the soil applied part of the graph: radioactivity in the soil is from application and that radioactivity in foliage is from root up-take and radioactivity in the tubers is from soil/root up-take; however, in the foliar applied part of the graph radioactivity in BOTH soil and foliage are from direct/indirect application and ONLY the amount in tubers is from soil/foliage up-take. These data indicate that a large percentage (49%) of imidacloprid was present on foliage due to direct application while a relatively low percentage (2.2%) reached the foliage from the soil by root up-take. However, the amount of radioactivity moving from the foliage into the tubers was almost the same (0.3% in the case of soil application and 0.2% in case of foliar application). Although radioactivity reaching tubers was the same, it is noted that measured concentrations in tubers from soil-applied imidacloprid is relatively higher than that present in the tubers from foliar applied imidacloprid (0.09 mg/kg compared to 0.01 mg/kg). A possible explanation to the observed may be related to higher yield of tubers in the foliar applied experiment compared to that in the soil applied experiment.
Figure 4-4. Comparison of up-take data obtained for imidacloprid applied to soil and that applied to foliage in potatoes 4.3. Plant Metabolism of Imidacloprid In the experiments discussed in the preceding section, radioactivity that was applied and/entered into the plant, as parent, was examined to obtain data on imidacloprid plant metabolism during the period from
0%
20%
40%
60%
80%
100%
Soil Applied Foliar Applied
Soil
Soil
Tubers:0.3% (0.09 mg/kg)
Tubers0.2% (0.01 mg/kg)
Foliage
Foliage
% o
f App
lied
Radi
oact
ivity

59
initial exposure (application time) to fruit maturity. Only a summary of the results obtained from these studies is included herein and more details are included in Appendix H.
4.3.1. Imidacloprid metabolism in various plants In contrast to the persistence of imidacloprid in the soil system, plant metabolism appears to play an important role in its degradation within various plant parts. Biotransformation occurs as a result of changes in in moieties associated with the imidazole ring with the backbone structure of the chemical staying intact in addition to cleavage of the chemical structure between the imidazole and chloropyridinyl rings. The following is a summary of the data obtained for metabolism of imidacloprid in various plants: (1) In cotton (seed treated), almost all parent (99 to 97%) was transformed into mainly guanidine and
glucoside in the leaves and 6-CNA in seeds with relatively high percentages of un-identified compounds (extracted and un-extracted);
(2) In potatoes (soil applied), high percentage of parent persisted in both leaves and tubers (25 and 48%). Transformation in potatoes produced the major metabolites 5-hydroxy, guanidine and 6-CNA and the minor metabolites nitrosimine, IMI-olefin and 6-CPA with relatively high percentages of un-identified compounds (extracted and un-extracted) in the leaves compared to the tubers;
(3) In corn (seed treated), relatively high percentages (65 to 47%) of imidacloprid parent appear to persist
in the whole plant throughout the plant growth stages up to maturity as it then decreases to 22%. High concentrations were observed in corn husks and cobs (43 to 47%) with lower concentrations in grains (24%). Imidacloprid appears to be transformed primarily into IMI-5-OH and guanidine with minor amounts of IMI-olefin, 4, 5-hydroxy, nitrosimine, 6-CNA, 6-CPA and open ring guanidine. Higher percentage of un-identified compounds (extracted and un-extracted) appear to form as the corn plant matures;
(4) In transplanted eggplant (soil applied), Imidacloprid parent appears to decrease (i.e., degrade) in
foliage as the plant matures (decrease from 33 to 9% of the total residues) with relatively higher percentage of parent persisting in the fruits (22% of the residues). In all cases, parent degradation resulted in formation of imidacloprid transformation products and substantial amounts of un-identified compounds (extracted and un-extracted). Transformation products found in foliage included the major metabolite guanidine with minor amounts of IMI-olefin, IMI-5-OH, nitrosimine, glucoside and 6-CNA but glucoside and 6-CNA were the major metabolites in fruits;
(5) In potatoes (foliar applied), parent imidacloprid dominated the percentage of radioactive residues in the vines at Day 90 but declined (i.e., degraded) as the plant matured. Metabolite residues in young and immature vines consisted primarily of the metabolites guanidine, 4,5-hydroxy and IMI-5-OH and minor amounts nitrosamine, IMI-olefin and glucoside. Residues in the tubers were primarily 6-CNA with a large percentage of un-identified compounds (extracted and un-extracted).
(6) In potatoes, comparison between two cases: Case 1 in which the chemical entered potato plant through the leaves from foliar application (root up-take from soil may not be discounted as

60
imidacloprid was present in the soil during foliar application), and Case 2 in which the chemical entered the leaves from soil through root up-take following a soil application suggested the following:
(a) Plant transformation of imidacloprid in the leaves, following foliar application in Case 1 (38% of the
applied persisted and 62% metabolized), is less pronounced than in Case 2 in which imidacloprid was applied as a soil treatment (25% of the applied persisted and 75% metabolized). This might be resulting from the longer resident time of imidacloprid in the plant in Case 2 compared to Case 1 (129 days compared to 64 days) giving more time for metabolism to occur; and
(b) Chemical residues reaching the tubers in Case 1 (0.2% of the applied) contain 11% as parent and those reaching the tubers in Case 2 (0.3% of the applied) contain 48% as parent. Residues in both cases are at least partly translocated from other parts of the plant, therefore, no conclusions can be drawn on possible imidacloprid transformation in the tubers. The high amounts of parent in tubers in Case 2 compared to Case 1 (48% compared to 11%) appear to suggest the tubers are affected by direct up-take of parent from the soil. It is noted however, that imidacloprid parent was available, in the soil, for tuber up-take in both cases.
(7) In apple and tomato Fruits, parent imidacloprid was applied to the surfaces of immature fruits. Data
indicated the following: (a) Parent dominates residues in both outside and inside apple and tomato fruits with no major
transformation products present in either outside or inside the fruits; (b) Minor metabolites were observed on the surface of the apple fruits including: Guanidine, 4-5-
Hydroxy, Urea and Nitrosimine. The same minor metabolites were present on the surface of tomatoes with 5-Hydroxy replacing 4-5-hydroxy. Authors suggested minimal abiotic transformation (assume minimum photolysis possibly due to lack of moisture (plant in greenhouse irrigated through the soil);
(c) Minor metabolites were observed inside the apple fruits including Guanidine, 4-5 & 5-Hydroxy, Olefin and Glucoside Minor metabolites identified inside tomatoes included: Guanidine, 5-Hydroxy, Nitrosimine, Olefin and Glucoside.
Finally, it is generally noted that the importance of plant metabolism in the fate of imidacloprid appears to differ from one species of plant to another. Additionally, un-identified compounds (extracted and un-extracted) appear to form as the plant matures due to association of residues with natural plant compounds resulting in compounds that are difficult to identify.
4.3.2. Imidacloprid metabolism profile in plants Based on data presented earlier, parent imidacloprid appears to be metabolized in the plant through two main processes:

61
(1) Changes occurring in moieties associated with the imidazole ring with the backbone structure of the chemical staying intact. This includes reduction and loss of the nitro group as well as hydration of the imidazole ring and subsequent loss of H2O; and
(2) Breakage of the backbone of the chemical structure between the imidazole and chloropyridinyl rings resulting in the formation of the metabolite 6-CPA followed by either association with glucose forming glucoside or oxidation into 6-CNA.
Figure 4-5 contains a summary of the plant metabolism profile of imidacloprid based on submitted data. It is noted that not all of the plant metabolism radioactive residues were extracted/identified (due to possible incorporation into the natural plant constituents) or were extracted but not identified. The first fraction of the residues is termed herein as un-extracted residue (UER) while the second is termed as unidentified residue (UN-ID).
Figure 4-5. Suggested Imidacloprid degradation profile in plants (based on submitted plant metabolism data).
+
Un-Extracted Residues (UER)
+ Un-Identified Residues
(UN-ID)
Urea
O
NH CH2
Cl N
N
Guanidine NH
NH CH2
Cl N
N
Imidacloprid
N+
O
N
NH CH2
Cl N
O-
N
6-CPA: 6-chloropicoly1 alcohol
OH CH2
Cl
N
Glucoside
O-Glucose CH2
Cl
N
6-CNA: 6-chloronicotinic acid
OH COOH Cl
N
4,5 hydroxy
OH OH
NO2 N
NH CH2
Cl N
N
5 hydroxy
OH
NO2 N
NH CH2
Cl N
N
Olefin
NO2 N
NH CH2
Cl N
N
Nitrosimine
NO N
NH CH2
Cl N
N
Imidacloprid
N+ O
N
NH CH2
Cl N
O-
N
Ring opened guanidine
C CH2
Cl NH
N
NH2
NH

62
4.3.3. Imidacloprid metabolism profile in plants
As a result of plant metabolism, the quantity of parent entering the plant through root or foliage/fruit up-take is expected to decrease with time. However, plant metabolism produces two metabolites that are considered of concern: IMI-5-OH and IMI-olefin and olefin. Table 4-5 contains a summary of the estimated stressor concentrations in various plants and plant parts. Table 4-5. Observed estimated concentrations of the stressor in parts per million= ppm) (parent imidacloprid + IMI-olefin and IMI-5-OH compounds) in varied crops, plant parts and application procedures based on radioactivity data
Soil Applied
Cotton
Timing 1 211 days Type 2 Foliage Seeds
Data 0.004 <0.001
Potatoes
Timing 1 129 days
Type 2 Foliage Tubers
Plant 2.016 0.054
Corn
Timing 1 33
days 61 days 134 days
Type 2 Foliage Foliage Foliage Husks Cobs Grain
Plant 4.497 0.851 0.893 0.118 0.074 0.019
Eggplant
Timing 1 14
days 35 days 69 days Type 2 Foliage Foliage F/FC/IMMF Foliage F/FC/IMMF Calyx Fruits
Plant 2.533 0.436 0.088 0.206 0.163 0.037 0.009
Foliar Applied
Potatoes
Timing 1 7/90 days 28/111 days 64/147 days Type 2 Vines Tubers Vines Tubers Vines Tubers
Plant 2.033 0.000 1.162 0.000 0.635 0.001
Tomatoes
Timing 1 4 days 7 days 14-21 days Type 2 Surface Pulp Surface Pulp Surface Pulp
Fruits 0.748 0.012 0.461 0.036
0.0455- 0.0700 0.068- 0.1040
Apples Timing 1 Zero Day (Just After) the Last of 3
Applications 14 Days After the Last of 3 Application Type 2 Surface Peel Pulp Surface Peel Pulp
Fruits 0.865 0.031 0.019 0.526 0.040 0.026
1 Timing: Timing in days from imidacloprid application; 2 Type: Column: Type of sample noting that Potato Vines= Stems and leaves ; Foliage= Stems and leaves/vines; F/FC/IMMF= Flowers, flower clusters and immature fruits
63
4.4. Potential for Exposure to Bees As described in the Problem Formulation (Section 2), the first step in the tiered pollinator risk assessment process is assessing the potential for exposure to adult and larval honey bees for a given use pattern. Tables 4-6 to 4-8 below summarize potential exposure pathways for each of the registered use patterns for imidacloprid, organized by application method. The determination for potential on-field exposure is based on whether the crop is attractive to bees and the agricultural practices, such as whether the crop is harvested prior to or after the bloom period. The potential for on-field exposure is presumed for crops harvested after bloom and which are attractive to visiting honey bees, while off-field exposure is pertinent only for foliar uses, whether the crop is attractive to bees or not, as a result of spray drift.

64
Table 4-6. Attractiveness of crops for the registered foliar uses of imidacloprid to bees (as indicated by USDA, 2014). Note, the potential for off-field exposure is indicated from all foliar uses.
Crop Group Number (Crop Group Name)
Honey Bee Attractive? (Y/N)
Bumble Bee Attractive? (Y/N)
Solitary Bee Attractive? (Y/N)
Notes Potential for On-Field Exposure? (Y/N)
1 (Root and Tuber Vegetables)1
Y (Pollen and Nectar)
Y Y Bees important for seed production, typically harvested prior to bloom. Potatoes noted to be harvested after bloom
Y
4A (Leafy Green Vegetables) Y (Pollen and Nectar)
Y Y Bees important for seed production, crop harvested prior to bloom when not used for seed production.
N
5 (Brassica Leafy Vegetables) Y (Pollen and Nectar)
Y Y Harvested prior to bloom N
6 (Legume Vegetables) Y (Pollen and Nectar)
Y Y Not harvested prior to bloom Y
8 (Fruiting Vegetables) Y (pollen and nectar)4
Y Y May be grown in glasshouses, with bumble bees for pollination
Y
10 (Citrus Fruit) Y (Pollen and Nectar)
Y Y -- Y
11 (Pome Fruit) Y (Pollen and Nectar)
Y Y Not harvested prior to bloom Y
12 (Stone Fruit) Y (Pollen and Nectar)
Y Y Not harvested prior to bloom Y
13 (Berry and Small Fruit)2 Y (Pollen and Nectar)
Y Y Not harvested prior to bloom Y
14 (Tree Nuts) Y (Pollen and Nectar)
Y Y Not harvested prior to bloom Y
9 (Herbs) Y (Pollen and Nectar)
Y Y Not harvested prior to bloom Y
20 (Oilseed)3 Y (Pollen and Nectar)
Y Y Y
Non-crop group uses (Globe artichoke, banana and plantain, peanut, pomegranate, tobacco, coffee, hops, tropical fruit)
Y (Pollen and Nectar)
Y Y Globe artichoke harvested before bloom, tobacco deflowered as part of the harvest process
N (globe artichoke, tobacco) Y for all others
1Refer to members of subgroups 1C (potato) and 1D (yams, ginger, others) only

65
2Includes 13A, 13B, 13-07D, 13-07F, 13-07G 3Cotton is sole member of this group with registered foliar uses 4Okra nectar and pollen indicated to be attractive to honey bees (USDA, 2014)
Table 4-7. Attractiveness of crops for the registered soil uses of imidacloprid to bees (as indicated by USDA, 2014)
Crop Group Number (Crop Group Name)
Honey Bee Attractive? (Y/N)
Bumble Bee Attractive? (Y/N)
Solitary Bee Attractive? (Y/N)
Notes
Potential for On-Field Exposure? (Y/N)
Potential for Off-Field Exposure? (Y/N)
1 (Root and Tuber Vegetables) Y (Pollen and Nectar)
Y Y Bees important for seed production, typically harvested prior to bloom. Potatoes noted to be harvested after bloom
Y N
3 (Bulb Vegetables) Y (Pollen and Nectar)
Y Y Typically harvest prior to bloom. N N
4 (Leafy Vegetables) Y (Pollen and Nectar)
Y Y Crop harvested prior to bloom when not used for seed production.
N N
5 (Brassica Leafy Vegetables) Y (Pollen and Nectar)
Y Y Harvested prior to bloom N N
6 (Legume Vegetables) Y (Pollen and Nectar)
Y Y Not harvested prior to bloom Y N
8 (Fruiting Vegetables) Y (Pollen and nectar)
Y Y May be grown in glasshouses, with bumble bees for pollination
Y N
9 (Cucurbit Vegetables) Y (Pollen and Nectar)
Y Y -- Y N
10 (Citrus Fruit) Y (Pollen and Nectar)
Y Y -- Y N
11 (Pome Fruit) Y (Pollen and Nectar)
Y Y Not harvested prior to bloom Y N
12 (Stone Fruit) Y (Pollen and Nectar)
Y Y Not harvested prior to bloom Y N
13 (Berry and Small Fruit)1 Y (Pollen and Nectar)
Y Y Not harvested prior to bloom Y N
14 (Tree Nuts) Y (Pollen and Nectar)
Y Y Not harvested prior to bloom Y N
19 (Herbs) Y (Pollen and Nectar)
Y Y Not harvested prior to bloom Y N

66
Crop Group Number (Crop Group Name)
Honey Bee Attractive? (Y/N)
Bumble Bee Attractive? (Y/N)
Solitary Bee Attractive? (Y/N)
Notes
Potential for On-Field Exposure? (Y/N)
Potential for Off-Field Exposure? (Y/N)
20 (Oilseed)2 Y (Pollen and Nectar)
Y Y -- Y N
Non-crop group uses (Globe artichoke, banana/plantain, peanut, pomegranate, tobacco, coffee, hops, tropical fruit)
Y (Pollen and Nectar)
Y Y -- Y N
1Includes 13A, 13B, 13-07D, 13-07F, 13-07G, 13-07H 2Cotton is sole member of this group with registered soil uses. 3Okra nectar and pollen indicated to be attractive to honey bees (USDA, 2014)
Table 4-8. Attractiveness of crops for the registered seed treatment uses of imidacloprid to bees (as indicated by USDA, 2014)
Crop Group Number (Crop Group Name)
Honey Bee Attractive? (Y/N)
Bumble Bee Attractive? (Y/N)
Solitary Bee Attractive? (Y/N)
Notes
Potential for On-Field Exposure? (Y/N)
Potential for Off-Field Exposure? (Y/N)
1 (Root and Tuber Vegetables)1 Y (Pollen and Nectar)
Y Y Bees important for seed production, typically harvested prior to bloom. Potatoes noted to be harvested after bloom
Y N
3 (Bulb Vegetables)2 Y (Pollen and Nectar)
Y Y Typically harvest prior to bloom. N N
5 (Brassica Leafy Vegetables)3 Y (Pollen and Nectar)
Y Y Requires pollination only when grown for seed; small % of acreage; harvested prior to bloom
N N
6 (Legume Vegetables)4 Y (Pollen and Nectar)
Y Y Not harvested prior to bloom N N
15 (Cereal grains)5* Y (Pollen and Nectar)
Y Y Not harvested prior to bloom Y N
19 (Herbs)6 Y (Pollen and Nectar)
Y Y Not harvested prior to bloom Y N
20 (Oilseed)7 Y (Pollen and Nectar)
Y Y -- Y N

67
Crop Group Number (Crop Group Name)
Honey Bee Attractive? (Y/N)
Bumble Bee Attractive? (Y/N)
Solitary Bee Attractive? (Y/N)
Notes
Potential for On-Field Exposure? (Y/N)
Potential for Off-Field Exposure? (Y/N)
Non-crop group uses (peanut) Y (Pollen and Nectar)
Y Y -- Y N
1Labels specify sugarbeet (1A), carrot (1B), and potato (1C) 2Labels specify onions/leeks and scallions (03-07A, 03-07B) 3Labels specify broccoli (5A) 4Labels specify soybean (6A) and beans/peas (6) 5Labels specify buckwheat, triticale, wheat, barley, oats, millet, sorghum, rye, and corn (pop, sweet, field) 6Labels specify borage (19A) and mustard (19B) 7Labels specify flax, sunflower, safflower, cotton, canola, and crambe

68
4.5. Screening-level Exposure Estimation
As described above in Section 2, the pollinator risk assessment process is a tiered approach that begins with model-generated (based on consumption rates of pollen and nectar and application rate) or default estimates of exposure and laboratory toxicity data at the individual level (Tier I). These estimates are also based on the bee’s life stage (i.e. adult vs larvae) and the method of application (i.e. foliar, soil, or seed treatment applications). In Tier I, pesticide exposures are estimated based on honey bee castes with known high-end consumption rates. For larvae, food consumption rates are based on 5-day old larvae, which consume the most food compared to other days of this life stage. For adults, the screening method relies upon nectar foraging bees, which consume the greatest amount of nectar of all castes while nurse bees consume the greatest amount of pollen. It is assumed that this value will be comparable to the consumption rates of adult drones (males) and will be protective for adult queens as well. Although the queen consumes more food than adult workers or drones, the queen consumes “processed” food (i.e., royal jelly produced by the hypopharyngeal glands of nurse bees) that is assumed, based on currently available data, to contain orders of magnitude less pesticide than that consumed by adult workers. Nectar is the major food source for foraging honey bees as well as nurse bees (young, in-hive females). Therefore, pesticide residues in nectar likely account for most of the exposures to bees, and may represent most of the potential risk concerns for adult bees. However, if residues in pollen are of concern, exposures to nurse bees, which consume more pollen than any other adult honey bees, should be considered. This is the case especially when pesticide concentrations in pollen are much greater than in nectar, or for crops that mainly provide pollen to bees and would be assessed on a case-by-case basis. In fact, the screening level Tier I risk estimation model for honey bees (Bee-Rex; v.1.0) allows calculation of exposure and resulting risk quotients (RQs) for all types of bee castes. As described in the 2012 White Paper (USEPA et al. 2012) presented to the FIFRA Scientific Advisory Panel and the final Guidance Document for Assessing Risk to Bees (USEPA et al. 2014), for dietary exposure from foliar applications, it is assumed that pesticide residues on tall grass (from the Kenaga nomogram of T-REX which is incorporated into Bee-REX) are a suitable surrogate for residues in pollen and nectar of flowers that are directly sprayed. The Bee-REX model is a screening level tool that is intended for use in a Tier I risk assessment to assess exposures of bees to pesticides and to calculate risk quotients. This model is individual-based, and is not intended to assess exposures and effects at the colony-level (i.e., for honey bees). The Tier I exposure method is intended to account for the major routes of pesticide exposure that are relevant to bees (i.e., through diet and contact). Exposure routes for bees differ based on application type. In the model, bees foraging in a field treated with a pesticide through foliar spray could potentially be exposed to the pesticide through direct spray as well through consuming contaminated food. For honey bees foraging in fields treated with a pesticide through direct application to soil (e.g., drip irrigation), through seed treatments, or through tree injection, direct spray onto bees is not expected. For these application methods, pesticide exposure through consumption of residues in nectar and pollen are expected to be the dominant routes.

69
Table 4-9 below (extracted from Guidance for Assessing Pesticide Risks to Bees, USEPA et al. 2014) summaries the exposure estimates for contact and dietary exposures for adult and larvae resulting from foliar, soil, seed treatment and tree injection application of pesticides. Table 4-9. Summary of contact and dietary exposure estimates for foliar applications, soil treatment, seed treatments, and tree trunk injections of pesticides for Tier I risk assessments.
The consumption of nectar and pollen vary depending on the bee’s life stage and caste within the hive. The consumption rates tabulated below inform the exposure estimates and resultant RQs in the default Tier I and refined Tier I analyses that are presented in Section 6. Table 4-10 below is extracted from Guidance for Assessing Pesticide Risks to Bees, USEPA et al. 2014, and additional detail of the derivation of these consumption rates can be found in the White Paper (USEPA et al. 2012).

70
Table 4-10. Summary of estimated food consumption rates of bees.

71
4.6. Experimental Residue Studies In cases where the screening-level Tier I RQs exceed the level of concern (LOC, discussed below), estimates of exposure may be refined using measured pesticide concentrations in pollen and nectar of treated crops, and further calculated for other castes of bees using their food consumption rates (see Table 4-10). As discussed above in Section 4.2, the most conservative (highest) exposure estimates for contact and/or diet exposure routes are selected for the Tier I screening-level assessment. These exposure estimates are based on adult and larval bees with the highest food consumption rates among bees. The Bee-REX tool also calculates dietary exposure values and associated RQs for larvae of different ages, adult workers with different tasks (and associated energy requirements) and the queen. This is accomplished using the food consumption rates provided in Table 4-10. Those food consumption rates are based on work described in the White Paper8 and updated to reflect comments from the Scientific Advisory Panel (SAP). Exposure values for other groups of bees within a hive along with their RQs can be used to characterize risks of dietary exposures of different bees within the hive. Empirical data can be used to refine conservative exposure estimates and reduce uncertainties associated with the Tier I exposure assessment by providing direct measurements of pesticide concentrations resulting from actual use settings. Studies investigating pesticide concentrations in pollen and nectar should be designed to provide residue data for crops and application methods of concern. The available residue studies for imidacloprid for foliar, soil, and seed treatment applications from both registrant and open literature sources are summarized below. For detailed summaries of the methods and findings of each study, please see Appendix E. 4.6.1. Rationale for Residue-based EEC Selection for Refined Tier I The Agency has a long standing practice of deriving estimated environmental concentrations (EECs) using model-derived exposure data (USEPA 2000). For example, acute EECs for aquatic organisms are based on the maximum peak (daily) concentration with an estimated return interval of 1-in-10 years while chronic EECs are based on the 21-d average (invertebrates) or 60-d average (fish) concentration with the same return interval. Generally speaking, these EECs are considered “high-end” estimates of exposure within the context of the available model output. Terrestrial EECs produced by the T-REX model similarly reflect high-end estimates of exposure to birds and mammals. The general rationale behind the Agency’s selection of EECs from its exposure models relates to the desire to achieve an EEC that is sufficiently protective given the temporal and spatial variability in exposure concentrations that can be expected to occur across the United States. Unlike EEC selection from its standard exposure models, the Agency does not yet have a standard process for selecting EECs in pollen and nectar obtained from field residue studies. This partly reflects the wide diversity of residue study designs from which residue data are obtained and the relatively recent adoption of a quantitative risk assessment process for bees. Nonetheless, the conceptual approached used by the
8 USEPA, PMRA, CDPR (2012) White paper in support of the proposed risk assessment process for bees. United States Environmental Protection Agency, Office of Pesticide Programs, Washington DC. Pest Management Regulatory Agency, Health Canada, Ottawa. California Department of Pesticide Regulation, Sacramento, CA.

72
Agency for selecting model-based EECs appropriate to other taxa (e.g., fish, birds) is used here to guide the selection of pollen and nectar EECs obtained from field residue studies. In selecting the acute and chronic EECs from field residue data in pollen and nectar, the following factors were considered:
1. Field residue data typically have relatively coarse resolution with respect to capturing the temporal variability in pollen and nectar residues that would be expected to occur for a given crop in the U.S. This reflects the technical and resource constraints associated with the conduct of these studies. Specifically, pollen and nectar residue trials sample residues at discrete times following pesticide application, usually 5 or fewer sampling intervals. Often, these sampling intervals may span one or more weeks such that the pattern of residues in between the sampling events is not known. Furthermore, data are usually available for 1 or 2 growing seasons, which likely underestimates the temporal variation associated with pesticide residues in pollen and nectar over multiple growing seasons.
2. From a spatial variability perspective, field residue data for pollen and nectar generally reflect a limited number of sites in the U.S. (commonly 3 or less). Where a substantially greater number of sites have been included in pollen and nectar residue studies (e.g., 10), these tend to be located in one specific region or State for practical reasons. Therefore, available field residue data sets currently available to the Agency likely underestimate the extent of spatial variation that exists in in pollen and nectar residues in the U.S.
3. From a toxicological perspective, the averaging period associated with a given EEC should reflect the time period necessary to elicit adverse effects in the toxicity studies to which it is being compared. In the case of honey bee toxicity studies, acute toxicity endpoints obtained from Tier I studies reflect a single oral or contact dose to the bee. Therefore, the EEC averaging period appropriate for comparing to acute toxicity endpoints should be relatively short (e.g., 1 day). Chronic toxicity endpoints derived from Tier I toxicity studies reflect exposure durations of 10 days (adult) and 21-days (larvae). However, the actual dosing in chronic larval tests last only for 3-4 consecutive days, after which larvae undergo pupation and emergence. Based on these considerations, it seems appropriate for the chronic EEC to reflect several days at most, given that toxicological effects may be manifest from exposure periods that are shorter than the duration of a chronic test.
4. Most of the residue studies available to the Agency with imidacloprid contained multiple sample replicates for a given sampling period. Therefore, some variation due to sampling and pesticide application methods was captured in these cases.
Tier I Acute EEC. Given the limitations of residue trial data to account for temporal and spatial variability, the Agency defines the field residue acute EEC as the overall maximum residue value measured for each matrix (pollen, nectar). If replicate data are reported (i.e., multiple samples on a given sampling day), then the acute EEC would be the maximum of the replicates. These field residue acute EECs are then used to calculate the acute RQ for adult and larval bees (caste and life stage/task specific).

73
Tier I Chronic EEC. Given the short exposure windows of chronic adult and larval toxicity tests and relatively coarse temporal resolution associated with the field residue data, the Agency defines the field residue chronic EECs as high average residue value determined from a given sampling event (usually a daily average). Additional characterization of RQ values derived from the aforementioned EECs will be conducted using the entire pollen and nectar data set obtained for each representative crop where the totality of the data will be compared to the Tier I endpoints to yield a set of resultant RQs. This will be expressed as a percentage of the RQs which exceed the respective LOC. 4.6.2. Rationale for Comparing Residue Data With Tier II Endpoints According to the 2014 Guidance for Assessing Pesticide Risks to Bees, RQ values are not determined in evaluating risks at higher tiers. Rather, risks are evaluated qualitatively and consider multiple lines of evidence. In the case of the Tier 2 colony feeding study, consideration is given not only to the magnitude of the residue in nectar relative to the NOAEC and LOAEC, but also the duration and frequency that residues exceed these Tier 2 endpoints. Additionally, information regarding the duration that the crop remains in bloom is also factored into the Tier 2 risk characterization to characterize the potential for long-term exposure of bees to contaminated pollen and nectar. The quality and quantity of available residue data are also carefully considered at the Tier 2 level. For example, available information suggests that soil applications of imidacloprid in coarse soils results in substantially greater residues in pollen and nectar compared to fine/heavy soils. Thus, if no data are available for coarse soils for a particular soil application, this information will be considered when evaluating the uncertainty associated with the Tier 2 risk characterization.
4.6.3. Foliar Application Residue Studies – Registrant Submitted There are three registrant submitted studies available to characterize the total residues of parent imidacloprid and the metabolites IMI-olefin and IMI-5-OH in pollen and nectar. There were no studies that were available from the open literature that examined residues on crops following foliar applications of imidacloprid. Table 4-11 below summarizes the key elements of the available registrant submitted foliar application residue studies. Further details of each residue study are provided in Appendix E. Available studies on oranges, cherries, and cotton were conducted at rates that represent 20% (cotton) – 100% (orange and cherry) of the maximum permitted annual rate for these crops (and respective crop groups, noting that no foliar applications are permitted for other members of the oilseed group, of which cotton is a member). In the case of the foliar cotton study, an additional 4 foliar applications of 0.06 lbs a.i/A are permitted during the indeterminate bloom period, but the available study only assessed on application. Cotton represents one of the few use patterns of imidacloprid where there are no restrictions for foliar applications associated with the bloom period given the protracted period of time over which cotton blooms. In the study on oranges conducted in Florida in 2012-2013 (MRID 49521301), imidacloprid as the formulated product Admire® Pro SC (42.9% a.i) was applied twice at 0.25 lbs a.i/A with a reported 8 – 10

74
day reapplication interval and the last application prior to the 10-day pre bloom interval, in accordance with labeled parameters and represents the highest single and annual rate on oranges and other citrus fruits. Maximum residues across all individual replicates (i.e. acute EEC) and the maximum average concentration among all individual sampling events (i.e. chronic EEC) were noted to be an order of magnitude higher in pollen as compared to nectar (acute and chronic EEC of 4,100 and 3,000 ppb, respectively in pollen compared to 430 and 324 ppb, respectively in nectar). In the cherry study (conducted in New York and Oregon in 2013 - 2014), 5 applications of Admire Pro® (42.9% a.i) at 0.1 lbs a.i/A were made post-bloom after harvest in the first year of the study and pre-harvest in the second year of the study (MRID 49535601). This scenario is in accordance with labeled parameters and represents the highest single and annual rate of foliar application on cherries and other stone fruits. Acute and chronic EECs in pollen were noted to be two orders of magnitude higher than in nectar (1000 and 545 ppb, respectively in pollen as compared to 10 and 5.6 ppb, respectively in nectar). It is noted that the label permits foliar applications to stone fruits only after the bloom period. As indicated previously, the available foliar-applied cotton study represents approximately 20% of the permitted maximum annual application rate. For this study (conducted in California from 2008 – 2010, MRID 49103301) one application of imidacloprid (as Provado® 1.6 F, 17.4% a.i) of 0.06 lbs a.i/A was made during the bloom period. It was noted that previous applications of Admire® Pro (42.9% a.i) were made as soil application in 2008 and 2009 to other crops with rates ranging from 0.18 – 0.38 lbs a.i/A in the same fields as the cotton. Due to the lower annual application rate and lack of pollen data, the acute and chronic EEC of 66 and 56 ppb, respectively, are considered underestimates of the potential risk associated with foliar applications on cotton.

75
Table 4-11. Summary of available registrant submitted foliar application residue studies
Crop Group (Crop)
No. Sites/ Location/ Duration
Formulation, Appl. Rate, Interval, Timing Matrix1
Residue-based Acute EEC2 (ppb)
Residue-based Chronic EEC3 (ppb)
DAA4 (days) Study Notes Classification (Reference)
Citrus Fruits – 10 (Orange)
3 sites (FL) 2 years (2012, 2013)
Gaucho® 600 FL Admire® Pro SC 2 x 0.25 lbs. a.i/A @ 8-10d interval (0.5 lbs. a.i/A total) Ground applied ~10d pre-bloom
Pollen Nectar
4,100 430
3,300 324
7, 4 4
• Experimental trials (sandy soils);
• Data are from trials NT005 and NT006 only;
• Nectar residues declined with time; pollen usually remained constant or declined (one trial/year);
• Year-to-year residue carryover uncertain
• LOQ and LOD for total imidacloprid residues were 1 and 0.7 ppb in nectar, respectively, and 1 and 0.5 ppb in pollen, respectively
Acceptable (NT005 & NT006 only) (Murphy et al. 2014, MRID 49521301)
Stone Fruit – 12 (Cherry)
4 sites, (NY, OR) 2 years (2013-2014)
Gaucho 600® FL Admire® Pro SC (airblast) post bloom 5 x 0.1 lbs. a.i/A @ 8-11d interval (0.5 lbs. a.i/A total) Year 1: Post harvest (fall) Year 2: Pre-harvest (summer)
Pollen Nectar
1000 10
545 5.6
208 208, 212
• Experimental trials • Sandy loam soils • NY sites 10X higher pollen
residues vs. OR, • Post-harvest (fall) appl. >
residues vs. Pre-harvest (summer) appl.
• Year to year residue carry over is uncertain
• LOQ and LOD for total imidacloprid residues were 1 and 0.7 ppb in nectar, respectively, and 1 and 0.5 ppb in pollen, respectively
Acceptable (Miller et al. 2014, MRID 49535601)

76
Crop Group (Crop)
No. Sites/ Location/ Duration
Formulation, Appl. Rate, Interval, Timing Matrix1
Residue-based Acute EEC2 (ppb)
Residue-based Chronic EEC3 (ppb)
DAA4 (days) Study Notes Classification (Reference)
Oilseed – 20 (Cotton)5
5 sites (CA) 2-3 years (2008-2010)
2010: Provado® 1.6F 1 x 0.06 lbs. a.i/A during bloom (aerial) 2008-2009: Admire® Pro: 0.18-0.38 lbs. a.i/A (chemigation to other crops)
Nectar 66 56 6
• Commercial fields; • Heavy (clay) soils; • Field portion of study was
non-GLP • Only 1 sampling event post
application (nectar only) • Less than max seasonal rate
tested • LOQ reported to be 1 ppb in
nectar
Supplemental (Beedle and Harbin 2011, MRID 49103301)
NR: Not reported; LOQ: limit of quantitation; LOD: limit of detection; DAA: Days after application 1 Refers to hand collected pollen and nectar 2 Acute EEC chosen as the maximum reported concentration among all individual replicates following application, refers to parent + IMI-olefin and IMI-5-OH 3 Chronic EEC chosen as the maximum average concentration among all individual sampling events following application, refers to parent + IMI-olefin and IMI-5-OH 4 DAA = Days after the last application of the pesticide 5Cotton represent sole member of oilseed group with registered foliar uses.

77
4.6.4. Soil Application Residue Studies – Registrant Submitted There are seven registrant-submitted studies available to characterize the total residues of parent imidacloprid and the IMI-olefin and IMI-5-OH metabolites in pollen and nectar. Table 4-12 below summarizes the key elements of the available registrant-submitted soil application studies. Detailed methods and findings of each study are provided in Appendix E. Studies on tomatoes, melons, citrus fruits, blueberries, strawberries, and cotton are available that represent 47% (tomatoes) – 100% (tomatoes, citrus, melons, blueberries, strawberries, and cotton) of the maximum permitted annual rate for these crops (and associated groups). There are two studies available for tomato with one study (California, 2009 – 2010; MRID 49090503) testing 47 – 66% of the maximum annual rate permitted for tomatoes and other fruiting vegetables while a more recent study (California, 2013 – 2014; MRID 49090503) assessed the highest annual rate of 0.38 lbs a.i/A. Both studies tested the formulated product Admire® Pro (42.9% a.i) and applications ranged from at being made at transplant to 25 days after transplant, depending on the trial. Both studies employed a drip irrigation method of soil application. It is noted that tomato does not produce nectar, and therefore only pollen data is available. In the case of the more recent study testing the higher application rate, the residues in pollen collected by bumble bees was assessed. The higher acute and chronic EECs resulted, as expected from the more recent study and were 242 and 198 µg a.i/L (parts per billion; ppb), respectively. In the available melon study (California, 2008 – 2011; MRID 49090501), cantaloupe and unidentified varieties of melons were treated with Admire® Pro (42.9% a.i), Alias® (40.6% a.i), and an unidentified formulation of imidacloprid at application rates ranging from 0.23 – 0.38 lbs a.i/A, representing 60 – 100% of the maximum annual rate permitted for melons and other cucurbit vegetables. Applications were made via soil drip or seed line drench at transplant depending on the trial. Bee-collected (trapped) pollen and hive (comb) nectar were sampled as opposed to hand-collected nectar and pollen directly from the melon flowers. Acute and chronic EECs in trapped pollen were 32 and 19 ppb, respectively, and 8 and 4.9 ppb in hive nectar, respectively. In a soil-applied citrus study (California, 2009 – 2011; MRIDs 49090504 and 49090505), orange, tangerine, and grapefruit orchards were treated in multiple trials at applications rates ranging from 0.25 – 0.50 lbs a.i/A which represent 50 – 100% of the maximum labeled annual rate of soil application to citrus fruits. The trials were conducted either in tunnels or open fields, all with Admire® Pro (42.9% a.i). Only one field trial assessed the residues in pollen, which was the sole trial in the study that assessed the lower 0.25 lbs a.i/A. Maximum residues in nectar from individual replicates (i.e. acute EECs) were similar (29.1 – 35.5 ppb) across the three trials that tested the highest maximum annual rate of 0.5 lbs a.i/A. In the trial that tested the half rate of 0.25 lbs a.i/A, maximum residues were approximately 50% reduced, at 18.3 ppb. The magnitude of residues in pollen from this study are uncertain given the trials with the higher application rate did not sample residues in pollen. For the blueberry study (New York, Illinois, Michigan, 2012 – 2013; MRID 49535602), one Admire® Pro 600 SC (42.9% a.i) at 0.5 lbs a.i/A (representing the highest permitted soil-applied rate for blueberries and

78
other bushberries) was made 3 days post-harvest. Honey bee hive nectar and bee-collected (Apis and Bombus) pollen were assessed with acute and chronic EECs of 16 and 8.8 ppb, respectively in hive nectar and 42 and 16.5 ppb, respectively in bee-collected pollen (i.e honey bee and bumble bees that were within a flight cage during the course of the nectar and pollen collection period.). The highest concentrations were noted to have been determined in coarser soils. In the strawberry study (California, 2010 – 2011; MRID 49090502), although the highest application rate of 0.5 lbs a.i/A to strawberries was made (Admire® Pro [42.9% a.i] or Alias® 4F [40.6% a.i]), its timing in relation to bloom as well as the interval between application and sampling of residues is unknown. Labels prohibit soil applications to strawberries prior to bud opening, during bloom, or when bees are foraging. Additionally, this study did not investigate the residue levels in nectar, which is considered to be attractive to honey bees (USDA 2014). The acute and chronic EECs in pollen were 320 and 280 ppb, respectively, and due to the absence of residue data for nectar, the exposure to residues in pollen alone is considered to be an underestimation of the potential exposure to imidacloprid for foraging honey bees. Finally, in the cotton study (California, 2013 – 2014, MRID 49665202), a single soil application of Admire® Pro SC (42.9% a.i) application was made at planting at the maximum single and annual application rate for cotton at 0.33 lbs a.i/A. This study was one part of another component that tested the combined residues of this soil application and three foliar applications (to be discussed later in the combined method applications section). Residues in pollen, nectar, and extra-floral nectar were assessed, with the maximum nectar residue samples being roughly 3 - 3.5 fold higher than those in pollen or the extra-floral nectar (acute EEC of 127, 43.4 and 35.9 ppb in floral nectar, pollen and extra-floral nectar, respectively).

79
Table 4-12. Summary of available registrant submitted soil application residue studies
Crop Group (Crop)
No. Sites/ Location/ Duration
Formulation, Appl. Rate, Interval, Timing Matrix1
Residue-based Acute EEC2 (ppb)
Residue-based Chronic EEC3 (ppb)
DAA4 (days) Study Notes
Classification (Reference)
Fruiting Vegetable – 8 (Tomato)
9 Sites Kings & Kern Co, CA 2 years (2009-2010)
Admire® Pro 3 sites: 1 x 0.18 lbs. a.i/A per year, 2-25d post transplant (drip chemigation) 6 sites: 2 x 0.13 lbs. a.i/A per year; at/near transplant & during bloom (drip chemigation)
Pollen (including anthers)
54 46 100
• Commercial fields; heavy and medium soils
• Residues from 2 composites from a single sampling time in 2010
• Tested rates reflect 47-66% of maximum single application rate
• Field sampling not GLP
Supplemental (Freeseman and Harbin, 2011; MRID 49090503)
Fruiting Vegetables – 8 (Tomato)
9 sites CA 2 years (2013-2014)
Admire® Pro Systemic Protectant SC 0.38 lbs. a.i/A @ 7d post- transplant (soil drip/ drench)
Pollen (b) 242 198 36-38
• Experimental fields; fine, medium, and coarse soils
• Year 2 ongoing for 5 sites • 1-2 replicates from bumble
bee-collected pollen • Most residue data reflect
coarse soils • Limited data indicates no
year-to-year carry over (leaves)
• LOQ and LOD for total imidacloprid residues were 1 and 0.7 ppb in nectar, respectively, and 1 and 0.5 ppb in pollen, respectively
Acceptable (Gould and Jerkins, 2015, MRID 49665201)

80
Crop Group (Crop)
No. Sites/ Location/ Duration
Formulation, Appl. Rate, Interval, Timing Matrix1
Residue-based Acute EEC2 (ppb)
Residue-based Chronic EEC3 (ppb)
DAA4 (days) Study Notes
Classification (Reference)
Cucurbit Vegetable - 9 (Cantaloupe & unknown melons)
10 sites CA 2-4 years (2008-2011)
Admire® Pro, Alias®, and unknown formulation 0.23-0.38 lbs. a.i/A per yr. soil drip or seed line drench at transplant (2011)
Pollen (t) Nectar (h)
32 8
19 4.9
Approx. 90-120
• Commercial fields; heavy & Medium soils
• LOQ in nectar and pollen were 1 and 10 ppb, respectively
Supplemental (Beedle 2012 MRID 49090501)
Citrus – 10 (Orange)
3 Tunnels Exeter, CA 1 year
Admire® Pro 1 x 0.5 lbs. a.i/A; post bloom via soil drench (Sept 3, 2009),
Nectar Nectar (b) Nectar (h)
34.6 37.1 95.2
21.2 17.5 72.8
~230 (4/22/10)
• 3 trees/tunnel; 1 hive/tunnel • Loam soil, weekly irrigation • Higher conc. in hive nectar
may be partly due to water loss
Supplemental (Byrne et al. 2011, MRID 49090504; Fischer and Bowers, 2012, MRID 49090505)
Citrus – 10 (Orange, Tangerine)
Multiple Open fields, CA (1-2 mi radius around hives) 1 year (2009-2010)
Various formulations (unspecified); 1 x 0.25 lbs. a.i/A @ post bloom (Fall 2009) Presumed soil drench
Nectar Nectar (b) Nectar (h) Pollen (t)
18.3 16.0 15.5 10.2
9.4 7.6 11.6 9.4
~230 (April 2010)
• Commercial citrus fields • Loamy soil • Small # of pollen samples
could be collected • Half of maximum single
application rate
Supplemental (Byrne et al. 2011, MRID 49090504; Fischer and Bowers 2012, MRID 49090505)

81
Crop Group (Crop)
No. Sites/ Location/ Duration
Formulation, Appl. Rate, Interval, Timing Matrix1
Residue-based Acute EEC2 (ppb)
Residue-based Chronic EEC3 (ppb)
DAA4 (days) Study Notes
Classification (Reference)
Citrus – 10 (Orange)
2 sites Open fields Lindcove Research and Extension Center (LREC) and Bakersfield, CA
Admire® Pro 1 x 0.5 lbs. a.i/A @ post-bloom via soil drench (Sept 3 & 8, 2009)
Nectar 29.1 19.3 Spring 2010
• 3.9 ac commercial field and LREC site (size unspecified) 2X (1 lbs. a.i/A) also tested.
• Loamy soil • Residues scaled with
application rate
Supplemental (Byrne et al. 2011, MRID 49090504; Fischer and Bowers 2012, MRID 49090505)
Citrus – 10 (Grapefruit)
Multiple fields: Helmet, Temecula, LREC, CA
Admire® Pro 1 x 0.5 lbs. a.i/A per yr. Helmet & LREC = post-bloom appl. (2 years; Fall ‘08/09) Temecula = summer ’08 & spring ’09) Presumed soil drench
Nectar 35.5 23.8 Spring 2010
• Study designed to evaluate carry over (1 x 1X rate shown here)
• Helmet = commercial orchard, sandy loam soil, weekly irrigation
• Temecula = 6 commercial fields (soil type not specified)
• LREC = 5 citrus blocks, loamy soil
• Residues generally reflect most recent appl.
Supplemental (Byrne et al. 2011, MRID 49090504; Fischer and Bowers 2012, MRID 49090505)
Berries – 13 (Blueberry)
3 sites NY, IL, MI 2 years (2012, 2013)
Gaucho® 600 FL Admire® Pro 600 SC 1 x 0.5 lbs. a.i/A 3-d post-harvest (Fall) Banded soil appl.
Pollen (b) Nectar (h)
42 16
16.5 8.8
240 233
• Experimental fields, irrigated • Sandy, silt loam, loam soils;
Highest conc. in sandy soils • Residues steady/ increase
during sampling • No obvious year-to-year
carryover • LOQ and LOD for total
imidacloprid residues were 1
Acceptable (Gould et al. 2014; MRID 49535602)

82
Crop Group (Crop)
No. Sites/ Location/ Duration
Formulation, Appl. Rate, Interval, Timing Matrix1
Residue-based Acute EEC2 (ppb)
Residue-based Chronic EEC3 (ppb)
DAA4 (days) Study Notes
Classification (Reference)
and 0.7 ppb in nectar, respectively, and 1 and 0.5 ppb in pollen, respectively
Berries – 13 (Strawberry)
7 sites, CA 2 years (2010, 2011)
Alias® 4F,Admire® Pro, or unknown formulation 1 x 0.5 lbs. a.i/A in 2010 & 2011 Presumed soil appl. Bloom timing unknown
Pollen 320 280 Not known
• Commercial fields, light (sand) and medium (loam) soils;
• Field portion non-GLP; application method and timing unknown
• Residues from sandy soils higher than loam (<LOD)
• LOD and LOQ in pollen were 2.6 and 10 ppb, respectively
Supplemental Gould et al 2012 MRID 49090502
Oilseed – 20 (Cotton)5
9 sites CA 2 years (2013-2014)
Admire® Pro SC 0.33 lbs. a.i/A per yr. @ plant In furrow spray
Pollen Nectar Exfl. Nectar
43.4 127 35.9
41.1 83.1 35.9
78 78 78
• 2 fine, 1 medium and 6 coarse soils
• 3 trials = 1 yr. only; 6 trials = 2 yr.
• No indication of carryover • LOQ and LOD for total
imidacloprid residues were 1 and 0.7 ppb in nectar, respectively, and 1 and 0.5 ppb in pollen, respectively
Acceptable (Fischer and Jerkins, 2015; MRID 49665202).
NR: Not reported; LOQ: limit of quantitation; LOD: limit of detection; DAA: Days after application 1Refers to hand collected pollen and nectar unless otherwise specified: “h” (hive collected), “b” (bee collected), or “t” (trapped pollen), 2 Acute EEC chosen as the maximum reported concentration among all individual replicates following application, refers to parent + IMI-olefin and IMI-5-OH 3 Chronic EEC chosen as the maximum average concentration among all individual sampling events following application, refers to parent + IMI-olefin and IMI-5-OH 4 DAA = Days after the last application of the pesticide 5Cotton represents sole member of oilseed group with registered soil uses.

83
4.6.5. Soil Application Residue Studies – Open Literature Additionally, there were 3 studies available from the open literature that investigated the residues of imidacloprid in pollen and nectar following soil applications (i.e., 2 studies on cucurbit vegetables and 1 study on the carryover of imidacloprid residues from soil applications to potatoes). These studies generally reported the range of residues determined as well as an average. Table 4-13 below summarizes the key elements from each of the studies. Summaries of each study including methods and results are provided in Appendix B. In a study that assessed the residues of imidacloprid in clover (Rogers and Kemp, 2003 MRID 49719626), soil applications to potatoes were made in one year, followed by underseeded grain in the following year (treated with imidacloprid), and finally clover in the following year (not treated with imidacloprid). Applications to potatoes and underseeded grain were 0.18 lbs a.i/A for each of potatoes and underseed grain. Residues in clover pollen and nectar were determined to be below the LOQ (2 ppb) although were noted to be as high as 32 ppb in soil (underseeded grain fields). In one study assessing residues in pollen and nectar from squash (Stoner and Eitzer, 2012; MRID 49719616), applications of Admire® Pro (42.9% a.i) were made at 0.32 lbs a.i/A (slightly lower than the maximum single application rate of 0.38 lbs a.i/A) in two consecutive years, with one year having application at one day pre-plant and the other year at 5-days post-transplant in a green house. The pollen and nectar residues from both trials were pooled which resulted in residues as high as 28 ppb in pollen and 14 ppb in nectar. As these data were pooled, it could not be ascertained the potential differences in year-to-year results as well as the potential effect of differing applications regimens on the magnitude of residues. In another residue study with pumpkins (Dively and Kamel, 2012; MRID 49719612), various treatment regimens of imidacloprid were tested with applications rates ranging from 0.027 to 0.38 lbs a.i/A (representing 7 – 100% of the maximum annual application rate for soil application to cucurbit vegetables). The lowest residues (6.7 ppb in pollen and 0.5 ppb in nectar) resulted from the bedding drench method at 0.027 lbs a.i/A while the highest (101 ppb in pollen and 13.7 ppb in nectar) were associated with a split application of 0.19 lbs a.i/A as a transplant water treatment followed by 0.19 lbs a.i/A as a drip irrigation treatment. In a subsequent trial the following year, the maximum residues in pollen and nectar (associated with the split application method described above) were 44 and 16 ppb, respectively.

84
Table 4-13. Summary of the soil application residue studies evaluated from the open literature
Crop Group (Crop)
No. Sites/ Location/ Duration
Formulation, Appl. Rate, Interval, Timing Matrix1
Max Value (ppb)2
Average Value (ppb)3
DAA (days) Study Notes
Classification (Reference)
Root & Tuber Vegetables – 1 (Potato), Cereal Grains – 15 (unspecified), Non-grass animal feed – 19 (Clover)
23 sites (18 in Prince Edward Island; 5 in New Brunswick) 3 years (1999-2001)
Admire® Pro 240F 0.18 lbs a.i/A, 1999 (Year 3 – clover), 2000 (Year 2 – under seeded grain), 2001 (Year 1 – potato) (All applications made in Spring)
Pollen (b) – clover only) Nectar (b) – clover only)
<LOQ <LOQ
NR NR
NR NR
• Study examined carryover of residues primarily in soil over the course of three years and different crops.
• Pollen and nectar measurements only in clover.
• LOD: NR; LOQ: 2 ppb
Qualitative (Rogers and Kemp, 2003 MRID 49719626)
Cucurbit Vegetable – 9 (Squash)
2 sites, Connecticut, 2 trial years (2009/2010)
Admire® Pro, 0.32 lbs a.i/A @ 1 d pre-plant (soil spray) Admire® Pro, 0.32 lbs a.i/A @ 5 d post-transplant in greenhouse (drip irrigation)
Pollen Nectar
28 14
14 10
Variable Variable
• Residue values pooled across appl. methods (effect of appl. method unknown)
• Pollen and nectar samples obtained at varying times depending on the treatment regimen and trial year,
• LOD: 0.5 – 2 ppb depending on the matrix (no further information provided), LOQ: NR
Qualitative (Stoner and Eitzer, 2012 MRID 49719616)
Cucurbit Vegetable – 9 (Pumpkin)
1 site, NC, 2 trial years (2009, 2010)
Admire® Pro, 0.027 lbs a.i/A bedding drench (2009) Admire® Pro, 0.25 lbs a.i/A, transplant water treatment (2009) Admire® Pro, 0.38 lbs a.i/A, transplant water treatment, (2009)
Pollen Nectar Pollen Nectar Pollen Nectar Pollen
6.7 0.5 40.1 7.3 86.6 11.9 101
4.9 0.4 36.7 5.7 60.9 7.4 80.2
NR NR 42-45 42-45 42-45 42-45 42-45
• Soil characteristics not provided
• The metabolites IMI-olefin, IMI-5-OH, desnitro-imidacloprid, urea metabolite, and 6-CNA were 14-31% of the values of parent (based on means) in pollen and 25 – 57% in nectar (breakdown of metabolite not provided)
Qualitative (Dively and Kamel, 2012 MRID 49719612)

85
Crop Group (Crop)
No. Sites/ Location/ Duration
Formulation, Appl. Rate, Interval, Timing Matrix1
Max Value (ppb)2
Average Value (ppb)3
DAA (days) Study Notes
Classification (Reference)
Admire Pro, 0.19 lbs a.i/A x 2), transplant water / drip irrigation (2009)
Nectar 13.7 11.2 42-45 • LOD and LOQ of 0.2 and 0.66, respectively
Admire® Pro, 0.027 lbs a.i/A, bedding drench (2010) Admire® Pro, 0.25 lbs a.i/A, transplant water treatment, (2010) Admire® Pro, 0.19 lbs a.i/A x 2, transplant water / drip irrigation (2010)
Pollen Nectar Pollen Nectar Pollen Nectar
<LOD <LOD 23.9 6.7 44.0 16.0
<LOD <LOD 18.2 6.1 31.8 9.1
NR NR 42-45 42-45 42-45 42-45
• Soil characteristics not provided
• Weather/more frequent irrigation in 2010 may contribute to lower residues in 2010 vs. 2009.
• The metabolites IMI-olefin, IMI-5-OH, desnitro-imidacloprid, urea metabolite, and 6-CNA were not detected in nectar and pollen
• LOD and LOQ of 0.2 and 0.66, respectively
NR: Not reported; LOQ: limit of quantitation; LOD: limit of detection 1Unless delineated as “h” (hive collected), “b” (bee collected), or “t” (trapped pollen), nectar and pollen refer to hand collected pollen and nectar 2If study provided a low to high range of residues, the high end value is reported here 3Value reflect the reported mean value of all residues within the provided scenario. Studies generally did not provide information on the numbers of sampling intervals from which the average was derived and therefore it is assumed to be one sampling period unless otherwise noted.
86
4.6.6. Seed Treatment Application Residue Studies – Registrant Submitted A registrant-submitted study is available to characterize the total residues of parent imidacloprid and the metabolites IMI-olefin and IMI-5-OH in pollen in seed-treated corn followed by a subsequent planting of clover as a rotational crop to examine the uptake of imidacloprid from soil. Additionally, there are several other registrant-submitted studies that were either a semi-field tunnel or full-field study design that had a residue component in addition to characterizing the effects of imidacloprid on honey bee colonies. While these studies will not be individually discussed, it is noted here that they generally reported no residues in pollen and nectar (hand collected from plant, bee-collected, and hive sources) above the LOD or LOQ, which depending on the study, ranged from 1.5 to 10 ppb (inclusive of LOD and LOQ). Due to several deficiencies associated with each study (which are summarized in Appendix A), these studies are designated as supplemental from an exposure (i.e. residue information) standpoint and invalid with respect to effects. Table 4-14 below summarizes the key elements of the available registrant-submitted seed-treatment residue information. In the available seed-treatment corn study (conducted in Kansas and Nebraska, 2012-2013; MRID 49511701), imidacloprid (as Gaucho® 600 ST) was applied at a rate of 1.34 mg a.i/seed (equivalent to 0.12 lbs a.i/A) which is the highest labeled equivalent application rate for seed-treated corn). Residues were only available in pollen as corn does not produce nectar. Acute and chronic EECs for pollen were 39.7 and 22.3 ppb, respectively. Notably, while the average and maximum residues values were similar in two of the three trials (i.e. sites), residues were generally higher in the third trial. The percent sand in soils from the third trial (36%) is about 2X (16%) and 30% greater (28%) from that of the other two trials, respectively suggesting that the higher imidacloprid residues in pollen for this trial may be the result of its greater fraction of sand in soil. Additionally, this study planted clover as a rotational crop to investigate the residues in pollen and nectar following seed treatment applications to corn the previous year. The majority of samples were below the LOD; however, in samples with detectable levels, the maximum measured residues in pollen and nectar were 3.8 and 1.3 ppb, respectively. A more detailed description of the methods and results of this study can be found in Appendix E.

87
Table 4-14. Summary of the registrant submitted seed treatment application residue studies
Crop Group Crop)
No. Sites/ Location/ Duration
Formulation, Appl. Rate, Interval, Timing Matrix1
Residue-based Acute EEC2 (ppb)
Residue-based Chronic EEC3 (ppb)
DAA (days) Study Notes Classification
(Reference)
Cereal Grain –15 (Corn/Maize)
3 sites, KS, NE 2 years (2012, 2013)
Gaucho 600 ST 1.34 mg a.i./seed (0.12 lbs. a.i/A)
Pollen 39.7 22.3 84
• Experimental fields • Loam, silty loam, silty
clay soils • Residues increase
during sampling time • LOD and LOQ in pollen
were 0.5 and 1 ppb, respectively
Acceptable (Miller et al. 2014, MRID 49511701)
Rotational Crop (Clover)
3 sites KS, NE (2013)
White clover planted on fields with prior year planting of seed-treated corn @ 1.34 mg a.i./seed
Pollen Nectar
3.8 1.3
2.3 1.1
461, 456 401
• Vast majority of residues were < LOD
• Residues at 1 ppb reflect assumptions of ½ the LOD for non-detects.
Cereal Grain - 15 (Corn/Maize)
1 site, (tunnel) Germany 1 year
Gaucho 70 WS, 1 mg a.i/seed, seeds sown on 5/10/2000
Pollen <LOQ NR 70-77
• Semi-field tunnel study
• Pollen from seed treated corn fed to bees for 38 day exposure
• No soil information • LOD: NR, LOQ: 5 ppb
Supplemental (exposure only) (Maus et al. 2000, MRID 47699416)
Cereal Grain - 15 (Corn/Maize)
1 site, (tunnel) Germany 1 year
Imidacloprid FS 600, 1 mg a.i/seed, seeds sown 11/23/2000 (in Brazil)
Pollen <LOQ NR 63
• Semi-field tunnel study Pollen from seed treated corn fed to bees for 45 day exposure
• Soil characterized as: 3.1% coarse sand, 7.3% fine sand, 37.6% clay, 51.9% silt)
Supplemental (exposure only) (Maus et al. 2002, MRID 47699414)

88
Crop Group Crop)
No. Sites/ Location/ Duration
Formulation, Appl. Rate, Interval, Timing Matrix1
Residue-based Acute EEC2 (ppb)
Residue-based Chronic EEC3 (ppb)
DAA (days) Study Notes Classification
(Reference)
• LOD: NR, LOQ: 5 ppb
Oilseed – 20 (Sunflower)
1 site, Germany 1 year (1998)
Gaucho 70 WS, 0.7 mg a.i./seed (0.05 lbs a.i./A) seeds sown on 5/8/1998
Nectar (b) <LOQ NR 14 (exposure duration)
• Full field study, • % foraging on treated
crop not quantified • Control field had
sandy, gravelly soil (no data on treatment field soil)
• LOD: NR, High LOQ: (10 ppb)
Supplemental (exposure only) (Schmidt et al. 1998 – MRID 49766206)
Oilseed – 20 (Rapeseed/ canola)
4 sites, (tunnels) Germany 1 year (1999)
Poncho FS 500 (formulated with beta-cyfluthrin) 0.03 lbs a.i./A seeds sown 5/12/1999
Nectar (h) Nectar Pollen (b) Pollen
<LOD <LOD <LOD <LOD
NR NR NR NR
10 54 - 59 10 54 - 59
• Semi field tunnel study • Silty clay soil type • Sites had various prior
regimens of imidacloprid use
• LOD: 1.5 ppb, LOQ: 5 ppb
Supplemental (exposure only) (Schmuck, Schöning, Schramel 1999, MRID 47699417)
Oilseed – 20 (Sunflower)
4 sites, (tunnels) Germany 1 year (1999)
Gaucho WS 70 0.05 lbs a.i/A seeds sown 5/12/1999
Pollen Pollen (h) Nectar (h)
<LOD <LOD <LOD
NR NR NR
NR 10 NR
Cereal Grain - 15 (Corn/Maize)
4 sites (tunnels) Germany 1 year (1999)
Gaucho WS 70 0.08 lbs a.i/A seeds sown 5/12/1999
Pollen <LOD NR NR
Oilseed – 20 (Rapeseed/ canola)
4 sites (tunnels) Germany 1 year (1999)
Poncho FS 500 (formulated with beta-cyfluthrin 0.06 lbs a.i./A
Nectar Pollen (b)
<LOD <LOD
NR NR
NR 10
• Semi field tunnel study loamy silt soil type
Supplemental (exposure only)

89
Crop Group Crop)
No. Sites/ Location/ Duration
Formulation, Appl. Rate, Interval, Timing Matrix1
Residue-based Acute EEC2 (ppb)
Residue-based Chronic EEC3 (ppb)
DAA (days) Study Notes Classification
(Reference)
seeds sown 05/11/1999 Pollen Pollen (h)
<LOD <LOD
NR NR
59 – 69 10
• Sites had various prior regimens of imidacloprid use
• LOD: 1.5 ppb, LOQ: 5 ppb
(Schmuck, Schöning, Schramel 1999, MRID 47699422, 47699425, 47699423)
Oilseed – 20 (Sunflower)
4 sites (tunnels) Germany 1 year (1999)
Gaucho® WS 70 0.04 lbs a.i./A Seeds sown 5/10/1999
Pollen (h) Nectar (h) Pollen
<LOD <LOD <LOD
NR NR NR
4 2-8 NR
Cereal Grain - 15 (Corn/Maize)
4 sites (tunnels) Germany 1 year (1999)
Gaucho® WS 70 0.08 lbs a.i/A Seeds sown 05/09/1999
Pollen <LOD NR NR
Oilseed – 20 (Rapeseed/ canola)
1 site (tunnel) Sweden (1999)
Poncho® FS 500 (formulated with beta cyfluthrin) 0.05 lbs a.i/A (Planting date not specified, exposure period July 2-6)
Nectar (b) Nectar
<LOQ <LOQ
NR NR
4 NR
• Semi-field tunnel study
• LOD: NR, High LOQ: (10 ppb)
Supplemental (exposure only) (Schmuck, Schöning, 1999, MRID 47699418)
Oilseed – 20 (Rapeseed/ canola)
2 sites, Ontario, Canada, and Minnesota, USA (2000)
Gaucho® + Vitavax (carboxin and thiram), 6-7 lbs product/A (Ontario), planting time not reported Gaucho + Vitavax (carboxin and thiram), 4.5 lbs product/A (Ontario), planting time not reported
Nectar (b) Pollen (b) Nectar (b) Pollen (b)
<LOQ <LOQ 0.81 7.6
NR NR NR NR
8 8 8 8
• Full field study, Ontario Loam soil (Ontario), no soil information for MN component
• Vitavax (carboxin and thiram) + Lindane was used as negative control
• % foraging on crop not quantified
• LOD: 0.3 ppb, LOQ: 1 ppb
Supplemental (exposure only) (Scott-Dupree et al, 2001 – MRID 45422435)

90
Crop Group Crop)
No. Sites/ Location/ Duration
Formulation, Appl. Rate, Interval, Timing Matrix1
Residue-based Acute EEC2 (ppb)
Residue-based Chronic EEC3 (ppb)
DAA (days) Study Notes Classification
(Reference)
Oilseed – 20 (Rapeseed/ canola)
1 site, Germany (1999)
Imidacloprid + beta cyfluthrin FS 0.03 lbs a.i./A Seeds sown 08/23/1999
Nectar <LOD NR NR
• Full field study • Soil type not reported • % foraging on crop not
quantified • LOD: 1.5 ppb, LOQ: 5
ppb
Supplemental (exposure only) (Schuld, 2002 MRID 49073605)
Oilseed – 20 (Rapeseed /canola)
1 site France (1998)
Poncho® (formulation with beta-cyfluthrin) 0.05 lbs a.i./A Seeds sown 03/19/1998
Nectar (b) Nectar
<LOQ <LOQ
NR NR
NR NR
• Semi field tunnel study
• LOD: NR; LOQ: (10 ppb)
Supplemental (exposure only) (Schmuck, Schöning, 1999 MRID 47699419)
NR: Not reported; LOQ: limit of quantitation; LOD: limit of detection 1Unless delineated as “h” (hive collected), “b” (bee collected), or “t” (trapped pollen), nectar and pollen refer to hand collected pollen and nectar 2 Acute EEC chosen as the maximum reported concentration among all individual replicates following application, refers to parent + IMI-olefin and IMI-5-OH (applies only to Miller et al. 2014, MRID 49511701). 3 Chronic EEC chosen as the maximum average concentration among all individual sampling events following application refers to parent + IMI-olefin and IMI-5-OH (Miller et al. 2014, MRID 49511701)

91
4.6.7. Seed Treatment Application Residue Studies – Open Literature Additionally, there were 4 studies available from the open literature that investigated the residues of imidacloprid in pollen and nectar following seed treatment applications either as a targeted residue study or as part of a semi-field or full-field study design. As these studies originated from the open literature, only the maximum and average residue values were available and not the entire dataset to verify the findings. Table 4-15 below summarizes the key elements from each of the studies. Summaries of each study including methods and results are provided in Appendix B. In a study by Donnarumma et al. (2011, MRID 49719614 ), seed-treated corn (Gaucho® 350 FS at 1.0 mg/seed, insufficient information to provide rate in terms of lbs a.i/A) were planted and samples were collected at 30, 45, 60, 80, and 130 days after initial sowing. Analysis of pollen residues 130 days after sowing indicated residues below the LOQ of 1. The study also indicated that residues in the soil declined steadily as the trial progressed, i.e., 652 ppb at 30 days after sowing to 11 ppb 130 days after sowing. In a study by Laurent and Rathahao (2003; MRID 48077902), the uptake and distribution of seed treated-imidacloprid in sunflowers was examined under controlled conditions in the laboratory and uncontrolled conditions using an outdoor lysimeter. Sunflower seeds were dressed with Gaucho® 70 WS (1 mg a.i/seed). The dressed seeds were also radiolabeled with 14C (radiochemical purity of >97%). Pollen residues were collected when approximately ⅔ of the florets on the treatment plots were blossoming and indicted a mean residue level of 13 ppb and a maximum of 36 ppb. It was also determined from the radiolabeling analysis that between 3 – 10% of the total applied radioactivity was taken up by the plant depending on whether the plant was grown under controlled laboratory conditions or within an outdoor lysimeter. Schmuck et al. (2001), conducted an uptake and metabolism study of imidacloprid-treated sunflower seeds in a greenhouse as well a residue component of imidacloprid-treated sunflower seeds in a honey bee field study. For the greenhouse component, sunflower seeds were dressed with labeled [methylene-14C]imidacloprid formulated as the commercial 700g/ kg WS (Gaucho® WS 70) at a rate of 0.7 mg a.i/seed. The field residue component was conducted with a rate of 1 mg a.i/seed. Parent imidacloprid, IMI-olefin and IMI-5-OH were assessed. The LOD and LOQ were reported to be 1.5 and 5 ppb, respectively. Pollen and nectar residues in both study components were reported to be below the LOD with sampling interval of 62 – 66 days after application. In Stadler 2003 (MRID 47796301), while the primary focus was to evaluate the effects of imidacloprid on honey bee colonies exposed to imidacloprid-treated sunflower seed, the residues in bee-collected nectar and pollen as well as hive wax were quantified with an LOD of 1.5 ppb in all matrices. The honey bee colonies were exposed to seed-treated sunflower for 10 days, monitored through an overwintering period, and after which nectar and pollen samples were taken. Parent imidacloprid, IMI-olefin and IMI-5-OH were below the LOD in all matrices assessed. The interval between samples being collected and analyzed was approximately 216 days.

92
Table 4-15. Summary of residue data from imidacloprid-treated seed studies evaluated from the open literature.
Crop Group (Crop) No. Sites/ Location/ Duration
Formulation, Appl. Rate, Interval, Timing Matrix
Max Value (ppb)2
Average Value (ppb)3
DAA (days) Study Notes Classification
(Reference)
Cereal Grain - 15 (Corn/Maize)
1 site Italy (Year of study not reported)
Gaucho® 350 FS 1 mg/seed Sowing time not reported
Pollen <LOQ NR 130
• Soil composition was 54.3% clay, 43.4% silt, and 2.3% sand
• LOD: NR, LOQ: 1 ppb
Qualitative (Donnarumma, 2011 MRID 49719614)
Oilseed – 20 (Sunflower)
1 site, Argentina (2000 – 2001)
Gaucho® 60 FS 0.26 mg a.i/seed, Seeds sown 12/7/1999
Honey (b) Pollen (b) Wax
<LOD <LOD <LOD
NR NR NR
13 days 13 days 13 days
• Full field study • No soil characterization
Pollen analysis showed 20-30% of pollen collected was from sunflower
• LOD: 1.5 ppb, LOQ: 5 ppb
Qualitative (Stadler, 2000 (also part of open lit effort as Stadler 2003, MRID 47796301)
Oilseed – 20 (Sunflower)
1 site, France (Year of study not reported)
Gaucho® 70 WS 1 mg a.i/seed Grown in controlled conditions for 4-5 days until emergence then transferred to outdoor lysimeter
Pollen 36 13 NR
• Reported that uptake of radiolabeled imidacloprid into plant from treated seeds ranged from 3-10%
• LOD: NR, LOQ: 0.5 ppb
Qualitative (Laurent and Rathahao, 2003 MRID 48077902)
Oilseed – 20 (Sunflower)
1 site, Germany
Gaucho® WS 70 0.7 mg a.i/seed (greenhouse component) Gaucho® WS 70 1 mg a.i/seed
Pollen Nectar Pollen Nectar
<LOD <LOD <LOD <LOD
NR NR NR NR
62-66 days
• Greenhouse component: LOD: 1 ppb; LOQ: NR
• Full field study component: LOD: 1.5 ppb; LOQ: 5 ppb
• Full field component seeds also treated with carbendazim, metalaxyl and copper oxyquniolate
Qualitative (Schmuck 2001, MRID 47812303)
1Unless delineated as “h” (hive collected), “b” (bee collected), or “t” (trapped pollen), nectar and pollen refer to hand collected pollen and nectar 2If study provided a low to high range of residues, the high end value is reported here 3Value reflect the reported mean value of all residues within the provided scenario. Studies generally did not provide information on the numbers of sampling intervals from which the average was derived and therefore it is assumed to be one sampling period unless otherwise noted.

93
4.6.8. Combined Application Method Residue Studies There are three registrant-submitted studies available to characterize the total residues of parent imidacloprid, IMI-olefin, and IMI-5-OH in pollen and nectar following applications made via two different methods (i.e. a combination of two of applications via seed treatment, soil, or foliar methods). It is noted that labels stipulate maximum annual rate of 0.5 lbs a.i/A for several use patterns and allow for a combination of methods to get to that maximum rate. Two studies in tomato and cotton examine a soil application followed by multiple foliar applications while one study in cotton involves a seed treatment application followed by foliar spray applications. None of the residue studies evaluated from the open literature combined application method design. Table 4-16 and Table 4-17 below summarize the key elements of the soil + foliar and seed treatment + foliar residue studies. A more detailed description of each study is provided in Appendix E. In a study assessing residues from the combined soil + foliar applications to tomatoes (conducted in California, 2013 – 2014; MRID 49665201; same study as that discussed in the soil-applied section), 2 foliar applications of 0.06 lbs a.i/A each were made at bloom following the a soil application of 0.38 lbs a.i/A for a total rate that approximates the highest annual application rate for imidacloprid on fruiting vegetables. Tomatoes do not produce nectar and therefore only pollen data (bumble bee-collected) are available9. The acute and chronic EECs were 1521 and 1268 ppb, respectively, and are approximately 6-fold higher than acute and chronic EECs for the soil-applied component alone. For the combined soil + foliar study on cotton (conducted in California, 2013 -2014; MRID 49665202; same study as that discussed in the soil-applied section), 3 foliar applications of 0.06 lbs a.i/A each were applied during bloom after a 0.33 lbs. a.i/A soil application for a total rate that approximates the highest annual application rate for imidacloprid on cotton. As with the soil-applied alone study component, residues were assessed in pollen, floral nectar and extra-floral nectar. While in the soil-alone component found floral nectar residues above those of extra-floral, when the foliar component was added, the extra-floral nectar residues were an order of magnitude higher than floral nectar (i.e., acute and chronic EECs were 2775 and 1952 ppb, respectively in extra-floral nectar as compared to 171 and 152 ppb, respectively in floral nectar). Acute and chronic EECs in pollen were similar at 328 and 324 ppb, respectively. Finally, in the seed treatment + foliar study on cotton (conducted in Missouri, 2012 – 2013; MRID 49511702), 5 applications of 0.06 lbs a.i/A (Admire® Pro – 42.9% a.i) followed a seed treatment with Gaucho® 600 Flowable equivalent to an application rate of 0.05 lbs a.i/A. This scenario represents the highest annual application rate of foliar applications made to cotton (0.31 lbs a.i/A). Residues in pollen, floral nectar, and extra-floral nectar were assessed. Similar to the soil-applied alone component of that study, residues in floral nectar were higher than that of extra-floral nectar (acute and chronic EEC of 40 and 29 ppb, respectively for floral nectar as compared to 30 and 16.2 ppb, respectively for extra-floral nectar). These residues were also approximately 3.5-fold lower than those determined in the soil-applied alone study component of the soil + foliar study discussed above, despite 5 foliar applications at bloom. Acute and chronic residues in pollen were 57 and 25 ppb, respectively. Additionally, this study
9 Greenleaf, S. and Kreman, C. (2006). Wild bee species increase tomato production and respond differently to surrounding land use in Northern California. Biological Conservation, 133. 81-87.

94
investigated residues in white clover as a rotational crop planted following foliar applications the previous year. Total residues were near or below the level of detection (0.7 ppb) in the majority of samples analyzed (detection frequency = 38% for clover nectar and 53% for clover pollen). The maximum concentrations of total IMI measured in clover nectar in trials NT014 and NT015 are 1.6 and 2.7 ppb, respectively. The maximum concentrations of total IMI measured in clover pollen in trials NT014 and NT015 are 8 and 8.6 ppb, respectively.
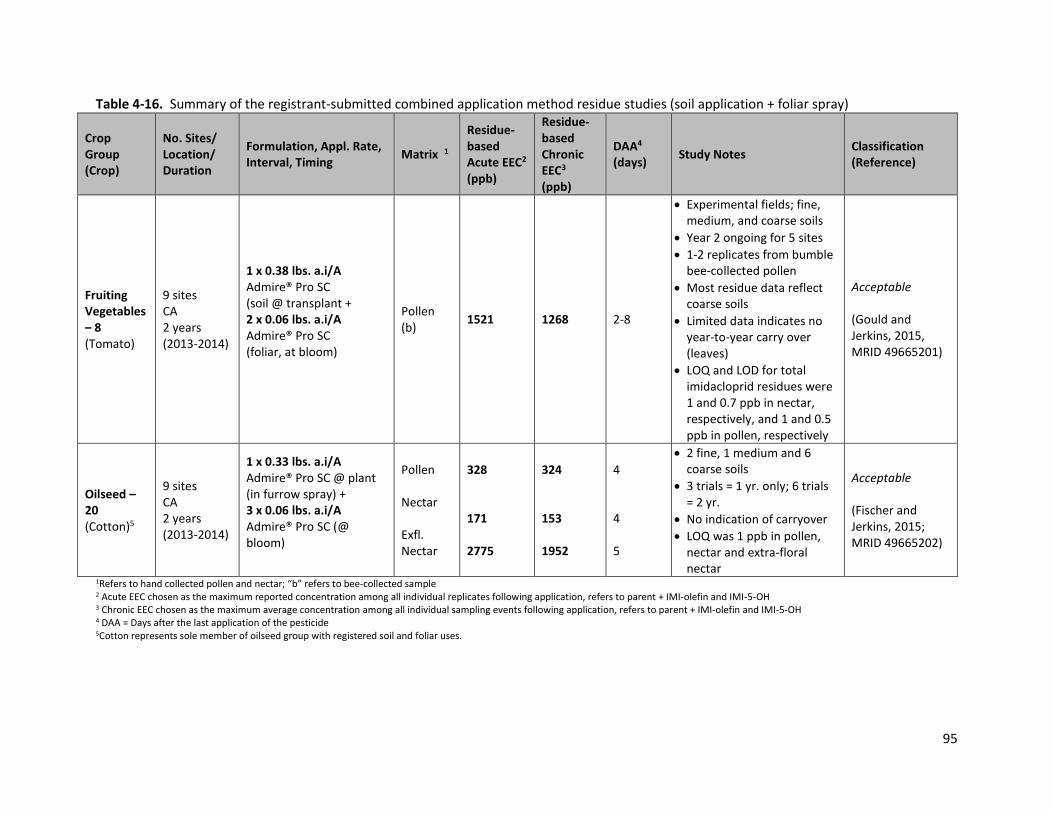
95
Table 4-16. Summary of the registrant-submitted combined application method residue studies (soil application + foliar spray)
Crop Group (Crop)
No. Sites/ Location/ Duration
Formulation, Appl. Rate, Interval, Timing Matrix 1
Residue-based Acute EEC2 (ppb)
Residue-based Chronic EEC3 (ppb)
DAA4 (days) Study Notes Classification
(Reference)
Fruiting Vegetables – 8 (Tomato)
9 sites CA 2 years (2013-2014)
1 x 0.38 lbs. a.i/A Admire® Pro SC (soil @ transplant + 2 x 0.06 lbs. a.i/A Admire® Pro SC (foliar, at bloom)
Pollen (b) 1521 1268 2-8
• Experimental fields; fine, medium, and coarse soils
• Year 2 ongoing for 5 sites • 1-2 replicates from bumble
bee-collected pollen • Most residue data reflect
coarse soils • Limited data indicates no
year-to-year carry over (leaves)
• LOQ and LOD for total imidacloprid residues were 1 and 0.7 ppb in nectar, respectively, and 1 and 0.5 ppb in pollen, respectively
Acceptable (Gould and Jerkins, 2015, MRID 49665201)
Oilseed – 20 (Cotton)5
9 sites CA 2 years (2013-2014)
1 x 0.33 lbs. a.i/A Admire® Pro SC @ plant (in furrow spray) + 3 x 0.06 lbs. a.i/A Admire® Pro SC (@ bloom)
Pollen Nectar Exfl. Nectar
328 171 2775
324 153 1952
4 4 5
• 2 fine, 1 medium and 6 coarse soils
• 3 trials = 1 yr. only; 6 trials = 2 yr.
• No indication of carryover • LOQ was 1 ppb in pollen,
nectar and extra-floral nectar
Acceptable (Fischer and Jerkins, 2015; MRID 49665202)
1Refers to hand collected pollen and nectar; “b” refers to bee-collected sample 2 Acute EEC chosen as the maximum reported concentration among all individual replicates following application, refers to parent + IMI-olefin and IMI-5-OH 3 Chronic EEC chosen as the maximum average concentration among all individual sampling events following application, refers to parent + IMI-olefin and IMI-5-OH 4 DAA = Days after the last application of the pesticide 5Cotton represents sole member of oilseed group with registered soil and foliar uses.
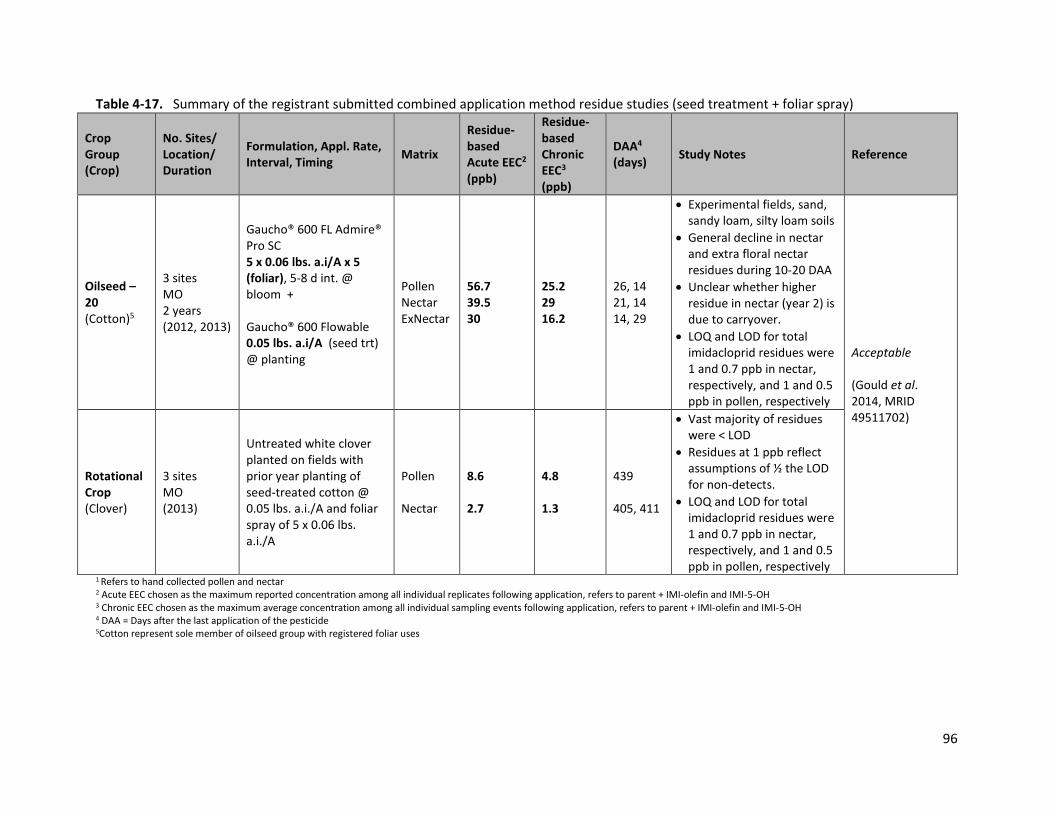
96
Table 4-17. Summary of the registrant submitted combined application method residue studies (seed treatment + foliar spray)
Crop Group (Crop)
No. Sites/ Location/ Duration
Formulation, Appl. Rate, Interval, Timing Matrix
Residue-based Acute EEC2 (ppb)
Residue-based Chronic EEC3 (ppb)
DAA4 (days) Study Notes Reference
Oilseed – 20 (Cotton)5
3 sites MO 2 years (2012, 2013)
Gaucho® 600 FL Admire® Pro SC 5 x 0.06 lbs. a.i/A x 5 (foliar), 5-8 d int. @ bloom + Gaucho® 600 Flowable 0.05 lbs. a.i/A (seed trt) @ planting
Pollen Nectar ExNectar
56.7 39.5 30
25.2 29 16.2
26, 14 21, 14 14, 29
• Experimental fields, sand, sandy loam, silty loam soils
• General decline in nectar and extra floral nectar residues during 10-20 DAA
• Unclear whether higher residue in nectar (year 2) is due to carryover.
• LOQ and LOD for total imidacloprid residues were 1 and 0.7 ppb in nectar, respectively, and 1 and 0.5 ppb in pollen, respectively
Acceptable (Gould et al. 2014, MRID 49511702)
Rotational Crop (Clover)
3 sites MO (2013)
Untreated white clover planted on fields with prior year planting of seed-treated cotton @ 0.05 lbs. a.i./A and foliar spray of 5 x 0.06 lbs. a.i./A
Pollen Nectar
8.6 2.7
4.8 1.3
439 405, 411
• Vast majority of residues were < LOD
• Residues at 1 ppb reflect assumptions of ½ the LOD for non-detects.
• LOQ and LOD for total imidacloprid residues were 1 and 0.7 ppb in nectar, respectively, and 1 and 0.5 ppb in pollen, respectively
1 Refers to hand collected pollen and nectar 2 Acute EEC chosen as the maximum reported concentration among all individual replicates following application, refers to parent + IMI-olefin and IMI-5-OH 3 Chronic EEC chosen as the maximum average concentration among all individual sampling events following application, refers to parent + IMI-olefin and IMI-5-OH 4 DAA = Days after the last application of the pesticide 5Cotton represent sole member of oilseed group with registered foliar uses

97
4.7. Carry-over of Imidacloprid Residues in Soil
The carryover of imidacloprid residues in soil (i.e. year-to-year accumulation in pollen and nectar) was considered as a potential exposure route. As discussed in Section 4.1, imidacloprid is persistent in the soil, with half-ranging from 305 days to several years in studies that were terminated after one year and up to 71% of the applied imidacloprid was still present in the soil. Several lines of evidence were considered in evaluating the potential impact of this exposure route including modeling results, rotational crop studies, and field trials in pollen and nectar, with a subset of these latter studies exploring the residues of pollen ad nectar in a rotational crop (white cover) in fields that were previously treated with imidacloprid. The modeling of potential residues present after carryover accumulation in soil indicated an accumulation of about 5 times the annual rate is potential within 10 years of repeated annual applications. This simulation does not take into account important routes of dissipation including leaching, run-off, and plant up-take of imidacloprid residues which are expected to reduce to the potential magnitude of this accumulation. Available rotational crop studies confirmed occurrence of soil carry-over from application to one crop to the following crop based on data obtained for magnitude of residues in rotational crops. In these studies, detectable residues of imidacloprid were found in variable quantities in rotational crops planted after 1, 4, 8 and 11 months rotational intervals following a single granular application of 0.29-0.32 lb. a.i/A. While residues reached as higher as 0.58 ppm in the edible portions of various crops, residues in pollen and nectar were not available from these studies. Furthermore, these studies considered the total residues of imidacloprid as parent plus 7 other degradation products including those that are not identified as being of toxicological concern (IMI-olefin and IMI-5-OH). Additionally, the available field trials in pollen and nectar were evaluated. In several studies that were conducted in one growing season, where only one sampling interval was included (as was the case with the foliar-applied cotton study, soil-applied melon study, and soil-applied strawberry study) the potential for carryover could not be assessed due to limited data from one year only. Additionally, the foliar applied studies with citrus fruits (oranges) had uncertainties associated with it that confound the ability to ascertain a carryover effect. These include inadvertent applications of imidacloprid to the trial field and differing nectar and pollen sampling measurements across trials. In other cases (soil + foliar applied tomato and soil + foliar applied cotton) there was insufficient information present to determine whether a carryover effect was present. Finally, 3 studies (soil-applied blueberry, seed treatment corn, and seed + foliar-applied cotton) included sufficient information to assess whether a carryover effect was present across the multiple trial years within a study. For 2 of these studies (seed treatment corn seed + foliar-applied cotton) a rotational crop (white clover) was planted in the season directly following the trial years to investigate the residues in pollen and nectar resulting from plant uptake of imidacloprid residues from the soil in the previous season. These studies are further discussed below. In the soil applied blueberry study conducted across two trial years, there was no indication of carryover as nectar residues decreased from year 1 to year 2 (7.25 ppb vs 1.8 ppb) while residues in pollen remained

98
essentially the same (13.7 vs 14.0 ppb) from year 1 to year 2. In the seed treatment corn study, there did not appear to be a consistent increase or decrease in pollen residues in year 2 values relative to year 1. This finding is despite the fact that residues in soil measured prior to planting in year 2 (9-80 ppb) are elevated compared to those measured prior to planting in year 1 (2-4 ppb) which suggests a year-to-year carryover in soil. Finally, the seed + foliar treatment cotton study indicated that year 2 mean residues in floral and extra floral nectar increase by 1.2X to 2.7X over year 1 mean residues. With cotton pollen, yearly averages of mean residues increase by 1.5X to 2.9X from year 1 to year 2. Interestingly, the two trials with the highest coarseness in soils show the greatest relative increase in yearly average residues from year 1 to year 2 in nectar and pollen (1.7X to 2.9X) compared to the trial where the soil type was described as mostly silt (1.2-1.5X). It is not certain whether this differential increase is related to differences in soil composition, but all three trials had similar amounts of IMI in soil prior to the 2nd year planting (24-42 ppb). In the rotational crop (clover) component of the seed treatment corn study, the mean residues in pollen and nectar planted following planting and harvesting corn the previous year were near or below the combined limits of detection (1.24 ppb for pollen; 1.33 ppb for nectar) in the majority of samples analyzed (detection frequency = 28% for clover pollen and 0% for clover nectar). The maximum concentrations of imidacloprid residues in clover pollen in three trials is 3.8 ppb. Similarly, in the rotational component of the seed + foliar treatment cotton study, mean residues of imidacloprid were near or below the level of detection (0.7 ppb) in the majority of samples analyzed (detection frequency = 38% for clover nectar and 53% for clover pollen). The maximum concentrations of imidacloprid in nectar were 1.6 and 2.7 ppb, respectively. The maximum concentrations of imidacloprid residues in pollen were 8 and 8.6 ppb, respectively. Based on the available data for which sufficient information is present to indicate an effect, there is limited indication of a carryover effect from year-to-year accumulation of imidacloprid resides in soil that translates to increased residues in pollen and nectar, even in the case where a year-to-year build up in soil residues was present (as with the seed treatment corn study). Additionally, the two studies that investigated the residues in pollen and nectar in a rotational crop (white clover) did result in a widespread occurrence of residues that were substantially above the limit of quantitation for these studies.
4.8. Observational Residue Monitoring Studies In addition to the registrant submitted and open literature field residue trials discussed previously which characterized the residues in pollen and nectar following a specific application regimen and sampling schedule, there are several monitoring studies available from the open literature to characterize the residues of imidacloprid. Rather than a targeted study as those described above, these studies surveyed residues of pollen and nectar in crops on agricultural fields with known imidacloprid use as well as samples from various matrices (nectar, pollen, wax) from honey bee hives.

99
4.8.1. Agricultural crop studies The studies by Bonmatin 2005 (MRID 47523411) and 2007, investigated the residues in various plant parts from fields known to have been planted with imidacloprid-treated seed. As a result, it is not possible to tie a particular application rate or sampling interval relative to the application timing to the residues of imidacloprid that were determined. The work in 2005 investigated the residues in corn pollen and trapped pollen originating from corn fields while the study in 2007 assessed corn and sunflower pollen. The findings of the 2005 and 2007 studies are summarized below. Full study summaries with a discussion of the methods are provided in Appendix C. Despite the aforementioned uncertainty of an unknown application rate or sampling interval, Tables 4-18 and 4-19 below indicate low mean residues of imidacloprid in sampled corn and sunflower pollen with values either below the LOQ or a maximum of 3-fold above it.
Table 4-18. Distribution of samples from corn fields according to their concentration of imidacloprid (Bonmatin, 2005)
Sampled Matrix
Number of samples
Number of samples
below LOD1
Number of samples between
LOD and LOQ1,2
Number (Percent) of
samples above LOQ2,3
Mean concentration
(ppb ±SD)3
Corn pollen
47 6 18 23 (49%) 2.1 ± 2.7
Trapped pollen
11 5 2 4 (36%) 0.6 ± 1.0 1 LOD = 0.3 ppb 2 LOQ = 1 ppb 3Refers to samples above the LOQ
Table 4-19. Distribution of residues from corn and sunflower pollen according to their concentration of imidacloprid (Bonmatin, 2007)
Sampled Matrix Number of samples Percentage of samples
exceeding LOQ1 Mean concentration
(ppb)2
Corn pollen 47 2 2.0 Sunflower pollen 24 58 3.0
1LOQ: 1 ppb 23Refers to samples above the LOQ
4.8.2. Hive monitoring studies In addition to the crop monitoring studies discussed above, several studies are available from the open literature that survey residues in in-hive pollen, wax, nectar , and dead bee samples, for various chemicals, including imidacloprid. These studies were not part of the suite of studies that received a review for their utility in terms of quantitative or qualitative use for this assessment for the exposure and effects assessments. Rather, these studies serve to characterize the potential extent to which bees are exposed to imidacloprid in the field. What follows is a summary of these studies while more detailed summaries are provided in Appendix C.

100
The available studies that survey various matrices for pesticide contamination, including hive pollen (bee bread), trapped pollen (pollen collected from bees as they enter the colony), honey, beeswax, and honey bee samples provide a broad picture of the overall in-hive residues that result from use of imidacloprid and other chemicals. While the studies differed in the location of sampled hives, as well as the condition of the colony from which the samples originated (with only Mullin 2010 and Kasiotis 2014 indicating that healthy and known diseased colonies were sampled), all studies had similar sampling procedures for a given matrix and appropriately low LOQ values reported for the analytical methods used (LOQs varied from study to study, see Appendix C for further information). In the several of available studies, regardless of whether they were conducted in the United States or Europe, imidacloprid was generally detected in 10% or less of pollen, honey, wax, or honey bee samples. For those studies (Mullin 2010, Wiest 2011, Kasiotis 2014, Johnston 2014), the highest imidacloprid concentration was detected in trapped pollen at 149 ppb. For the remaining studies (Chauzat 2006, Chauzat 2009, Stoner and Eitzer 2013, and Lu 2015), imidacloprid was detected in at least one matrix with a frequency of 10% or more While there were high frequencies (nearing or above 50%) of detections of imidacloprid in pollen and honey samples in the Chauzat studies, as well as Lu 2015, the mean concentrations were generally at or slightly above the reported LOQ. The Chauzat studies in particular claim that although certain pesticide residues were frequently detected across various hive matrices, that there did not appear to be relationships between the abundance of brood and adults and the presence of a particular residue. Stoner and Eitzer 2013 found 12% frequency of detections in pollen. An additional point to be made from these studies is that, for all studies except Lu 2015 (which screened only for neonicotinoid pesticides), multiple pesticides were found in the same samples, with some samples containing up to 12 pesticides (Johnston, 2014). In the majority of these cases, the Varroa mite (Varroa destructor) treatment miticides fluvalinate, coumaphos, and amitraz (DMA and DMPF degradates) were detected, in some cases in up to 98% of the assessed samples, depending on the matrix (Mullin, 2010). Additionally, fungicides, particularly those of the sterol biosynthesis inhibitor class that include the triazole fungicides were detected with high frequency. There are reports in the literature that these chemicals may exhibit a greater than additive (e.g., synergistic) effect on toxicity when bees are exposed simultaneously with neonicotinoid chemicals like imidacloprid. While the extent of this relationship is beyond the scope of this assessment, it highlights the complex nature of interactions of different stressors that exist in the hive.

101
5. Effects Assessment
5.1. Tier I At the Tier I (screening) level, effects to individual bee are considered. This is achieved through a suite of laboratory studies that assess different life stages (i.e. adults and larvae) and different durations of exposure, i.e., acute (single dose) and chronic (repeat dose). The adult acute contact, adult acute oral, and larval acute oral toxicity studies have formal protocols published from at least one regulatory entity and these protocols are generally adhered to with registrant-submitted data. While test methods originating from the open literature can be more varied, the adult acute contact and adult acute oral tests evaluated from the open literature for imidacloprid were also generally conducted in accordance with one or more published guidelines. The most sensitive endpoints from the Tier I studies (from which findings can be statistically verified) inform the Tier I default and Tier I refined RQs, using screening level estimates and residue data in pollen and nectar (where available), respectively. Sources of Data Registrant-Submitted Studies For registrant-submitted studies, the distinction between acute/chronic adult and acute/chronic larval is made as these guidelines are either already released or in development and are in line the with the 2014 Guidance for Assessing the Risk of Pesticides to Bees (USEPA et al. 2014). For the acute contact toxicity, registrant-submitted studies adhered to either the Office of Chemical Safety and Pollution Prevention (OCSPP) guideline 850.302010, the Organization for Economic Cooperation and Development (OECD) Test Guideline 21411, or the European and Mediterranean Plant Protection Organization (EPPO) guideline 17012 for adult honey bees. For acute oral toxicity to adult honey bees, studies generally adhered to OECD TG 21313 and EPPO 170. Acute oral toxicity studies with honey bee larvae were conducted in accordance with OECD TG 23714. Finally, the chronic oral larval toxicity tests and chronic adult (10-day) oral toxicity test protocols are currently in development but the available studies were conducted in accordance with methodology determined to be sufficient for quantitative risk assessment purposes. As guidelines are well established for most Tier I data requirements (particularly the acute contact and acute oral toxicity tests for adult honey bees), the methodology for each submitted study is not discussed extensively but rather only when major guideline deviations are noted. As distinguished from the open literature studies, registrant-submitted studies that are designed to satisfy a guideline requirement are 10 USEPA. 2012a. “Honey Bee Acute Contact Toxicity” Ecological Effects Test Guidelines OCSPP 850.3020. EPA 712-C-019 Web: http://www.regulations.gov/#!documentDetail;D=EPA-HQ-OPPT-2009-0154-0016 11 OECD.1998b. OECD Guidelines for the Testing of Chemicals. Test Number 214, Acute Contact Toxicity Test. http://www.oecd-ilibrary.org/environment/test-no-214-honey bees-acute-contact-toxicity-test_9789264070189-en;jsessionid=43gvto47wnue9.delta 12 EPPO. 2010. Efficacy Evaluation of Plant Protection Products: Side-effects on Honey bees. PP 1/170 (4). OEPP/EPPO Bulletin 40: 313–319 13OECD. 1998a. OECD Guidelines for the Testing of Chemicals. Honey bees, Acute Oral Toxicity Test. 213. http://lysander.sourceoecd.org/vl=5988235/cl=12/nw=1/rpsv/cgi-bin/fulltextew.pl?prpsv=/ij/oecdjournals/1607310x/v1n2/s14/p1.idx 14 OECD. 2013. OECD Guidelines for Testing Chemicals. Honey bee (Apis mellifera) larval toxicity test, single exposure. http://www.oecd-ilibrary.org/environment/test-no-237-honey-bee-apis-mellifera-larval-toxicity-test-single-exposure_9789264203723-en

102
classified as acceptable (suitable for quantitative use in risk estimation), supplemental (some deviations noted that render the study useful for either quantitative or qualitative use), or invalid (not suitable for use in risk assessment due to guideline deviations that affect the scientific soundness of a study). Typically, open literature studies are designated as for quantitative, qualitative, or invalid for risk assessment purposes. Open Literature Studies Through a joint collaborative effort by the EPA, Canada’s Pest Management Regulatory Agency (PMRA), and the state of California Department of Pesticide Regulation (CDPR), over 30 studies in the open literature were evaluated to further characterize the toxic effects of imidacloprid at the Tier I (individual) level. These effects include effects on mortality, food consumption, brood production, and behavioral responses on several subspecies of Apis, as well as non-Apis bees including bumble bees (Bombus spp.) and several solitary bee species including blue orchard bees (Osmia lignaria) and alfalfa leafcutting bees (Megachile rotundata). While the Guidance for Assessing Pesticide Risks to Bees (USEPA, 2014) stipulates that data from non-Apis species can be considered in the risk assessment, it does not provide a process to estimate risk as it does for honey bees (Apis). This is due in part to the fact that there are different exposure estimates that would be needed for non-Apis species that at the present time have not been sufficiently explored by the Agency. For example, bumble bee workers and drones are larger than their honey bee counterparts, in addition to having higher food consumption rates that would necessitate different contact and oral exposure estimates, respectively. For the sake of discussion of the Tier I data, due to the exposure and test durations varying so greatly as compared to the more standardized registrant-submitted studies (which generally follow established regulatory guidance), those studies with a 5-day or less exposure/test duration will be considered acute while those 6 days or longer will be considered chronic. To obviate the need to state it for every open literature study discussed, it is noted here that generally all open literature studies (with the exceptions noted in the individual discussions) did not provide raw data in order to conduct an independent verification of the statistical results. This limitation was one of the primary reasons that open literature studies were considered to be qualitative in their utility; those that were evaluated and considered invalid for utility in this risk assessment are tabulated in Appendix 1. The studies from the open literature not only serve to broaden the database of species for which effects of imidacloprid can be characterized, but also expand on the suite of effects that are investigated in the registrant-submitted studies, which is generally limited to observations of mortality and clinical signs of toxicity (sublethal effects). Additionally, studies from the open literature serve to examine any differential toxicity that may be present in Apis vs. non-Apis bees, particularly as it relates to effects on individual bees at the Tier I level. What follows is a summary of the available registrant-submitted and open literature studies to characterize the acute and chronic effects to Apis and non-Apis adult bees and larvae. The studies are organized by species (e.g. Apis vs. non-Apis), duration (acute or chronic), route of exposure (contact or oral) and source (registrant-submitted and open literature). Unless otherwise stated, in the section

103
dealing with Apis studies, all studies concern A. mellifera. It is also noted here that a limitation to all Tier I data is the uncertainty as to the extent to which the lethal and sublethal effects described in these studies translate to an adverse effect(s) at the colony level. Table 5-1 below summaries the most sensitive endpoints from each of the Tier I study types with further discussion of all studies providing Tier I endpoints provided below. Endpoints in this table originate from registrant-submitted studies conducted with A. mellifera with the exception of a chronic (10-day) oral toxicity test reported by Boily et al. (2013; MRID 49750601) where raw data were made available by the study author to statistically verify the results.
Table 5-1. Summary of endpoints to be used in screening-level and refined Tier I risk estimation Study Type Endpoint1 Reference Classification Adult Acute Contact Toxicity 96-hr LD50: 0.043 µg a.i/bee MRID 49602717 Acceptable
Adult Acute Oral Toxicity 48-hr LD50: 0.0039 µg a.i/bee MRID 42273003 Acceptable
Adult Chronic Oral Toxicity
10-day NOAEC/LOAEC (food consumption): <0.004/0.004 µg a.i/bee (<10/10 µg a.i/L) MRID 49511703 Supplemental
10-day NOAEC/LOAEC (mortality, body weight): 0.00016 µg a.i/bee
Boily et al., 2013; MRID 49750601
Quantitative
Larval Acute (single dose) No data available Larval Chronic (repeat dose)
21-day NOAEC/LOAEC: 0.0018/>0.0018 µg a.i/larva MRID 49090506 Supplemental
Toxicity of Residues on Foliage2 (OSCP 850.30303)
2-hr residues of 0.025 lbs a.i/A: 20% mortality 2-hr residues of 0.05 lbs a.i/A: 19% mortality 2-hr residues of 0.1 lbs a.i/A: 28% mortality
MRID 42480503 Supplemental
Bolded value to be used in risk estimation if more than one endpoint present for a study type. 1Represents most sensitive (i.e. lowest) of all endpoints within a particular study type for studies for which raw data (to allow for independent statistical verification of the endpoint) are available. 2Although cited in 40 CFR Part 158 as an EPA testing requirement, the results of this study are not used for risk estimation. 3 USEPA. 2012b. “Honey Bee Toxicity of Residues on Foliage.” Ecological Effects Test Guidelines OCSPP 850.3030. EPA 712-C-018. Web. http://www.regulations.gov/#!documentDetail;D=EPA-HQ-OPPT-2009-0154-0017
5.1.1. Adult Acute Contact Toxicity Apis – Registrant-Submitted Studies There are five available contact studies to characterize the acute toxicity of imidacloprid to adult honey bees with technical grade active ingredient (TGAI, purities range from 98.6 - 99.8%) and one study conducted with a formulated typical end use product (TEP, 200 g/L, 20% a.i, assuming density of 1 g/L). As indicated above, these studies were conducted in accordance with one or more recognized protocols for testing the acute contact toxicity to honey bees. The observation period (i.e. study duration) ranged from 48 – 96 hours and the resultant LD50 values ranged from 0.043 – 0.104 µg a.i./bee. Clinical signs of toxicity were noted in the majority of studies. Table 5-2 below summarizes the available registrant submitted acute contact toxicity studies to adult honey bees. Summaries for each study are provided in Appendix D. It is noted here, as above in Table 5-1, that the most sensitive adult acute contact toxicity endpoint is 0.043 µg a.i/bee (MRID 49602717).

104
Table 5-2. Summary of registrant submitted adult acute contact toxicity studies (all studies tested Apis mellifera)
Test Substance (% a.i)
Study Duration
Endpoint (95% CI) (expressed in terms of µg a.i/bee)
Comments
Classification (Reference, MRID)
TGAI (99.8) 48-hr LD50: 0.078 (0.068 – 0.090)
No observations (if any) of clinical signs of toxicity were noted to be present in the study report
Acceptable (42273003)
TGAI (98.6) 72-hr LD50: 0.104 (0.080 – 0.131)
- Clinical signs of toxicity include paralysis, spasms, or frozen behavior, and were observed at all treatment groups.
Acceptable (49766209)
TGAI (98.6) 72-hr LD50: 0.048 (0.041 – 0.057)
- Clinical signs of toxicity included bees observed to have been incapacitated and uncoordinated (stumbling) at all treatment groups
Acceptable (49602715)
TGAI (98.6) 96-hr LD50: 0.043 (0.026 – 0.055)
- Lying on back/difficulty standing and coordination issues reported at all treatment groups
Acceptable (49602717)
TGAI (98.6) 96-hr LD50: 0.069 (0.056 – 0.085)
- Clinical signs of toxicity include lethargy, lack of coordination, and immobility (not specified which treatment groups)
Acceptable (49602714)
TEP (Imidacloprid 200 SL) (200 g/L, 20% purity assuming density is 1 g/L)
96-hr
LD50: 0.045 (0.034 – 0.060) 0.0246 µg product/bee
- Clinical signs of toxicity noted were uncoordinated movement in the 4 highest treatment groups
Acceptable (49602707)
NA: not available; TGAI: technical grade active ingredient; TEP: typical end use product Bolded value represents endpoint to be used risk estimation Apis – Open Literature Studies There were six studies evaluated from the open literature that investigated the acute contact toxicity to honey bee adults. These studies generally followed at least one of the protocols available for the acute contact toxicity testing to honey bees. The observation period (i.e. study duration) ranged from 24 – 72 hours and tests assessed multiple subspecies of A. mellifera. The acute contact LD50 values ranged from 0.018 – 0.24 µg a.i/bee. As noted previously, these studies were classified as qualitative primarily due to their absence of raw data provided to statistically verify the results. In contrast to the suite of registrant-studies, clinical signs of toxicity were generally not reported in the open literature studies. Summaries of each study including methods and other limitations and uncertainties are provided in Appendix D.

105
Table 5-3. Summary of adult acute contact toxicity studies to Apis bees evaluated from the open literature
Test Species
Test Substance (% a.i)
Study Duration
Endpoint (95% CI) (expressed in terms of µg a.i/bee)
Comments
Classification (Reference, MRID)
Apis mellifera TGAI (>99) 24-hr LD50: 0.018 (0.009 – 0.032)
- Also tested piperonyl butoxide, triflumizole, and propiconzole with imidacloprid to assess potential synergistic effects (no significant differences in all combined LD50 values relative to imidacloprid alone.
Qualitative (Iwasa 2004, 47523404)
Apis mellifera carnica
TGAI (>98)
48-hr
LD50: 0.081 (0.055 – 0.119)
- No mention of whether dose response was present
Qualitative (Schmuck 2001, 47812303)
LD50: 0.23 (NA) TEP (70) LD50: 0.24 (0.17 – 0.35) TEP (200 g/L, 20% purity assuming density of 1 g/L)
LD50: 0.060 (0.039 – 0.093)
Apis mellifera carnica
TGAI (>98) 48-hr
LD50: 0.061 (0.026 – 0.090) - No mention of whether dose response was present
Qualitative (Schmuck 2003, 47796304)
LD50: 0.050 (0.009 – 0.071)
LD50 0.075 (0.062 – 0.091)
Apis mellifera mellifera TGAI
(98) 48-hr
LD50: 0.024 (0.022 – 0.027) - Mortality rates increase at low doses, decrease at intermediate doses, and increase again at higher doses.
Qualitative (Suchail 2000, 47800513)
Apis mellifera caucasia
LD50 0.013 (0.010 – 0.016)
Apis mellifera
TGAI (99.9) 48-hr LD50: 0.067 (0.044 – 0.102)
- Also tested myclobutanil, propiconazole, flusilazole, and tebuconazole.
Qualitative (Thompson 2014a, 49750606)
Apis mellifera
TEP (Provado® 1.6F) (17.4)
48-hr
LD50: 0.03 µg a.i/bee (0.017 – 0.05) 0.15 µg product/bee; 0.05 – 0.32)
- Range of actual doses tested was not provided. - There was no mention of whether dose response was present.
Qualitative (Biddinger 2013, (49719605)
NA: not available; TGAI: technical grade active ingredient; TEP: typical end use product

106
Non-Apis – Registrant-Submitted studies There are two available registrant-submitted contact studies to characterize the acute toxicity of imidacloprid to adult bumble bees; one study each with TGAI (98.6% purity) and one study with formulated product (30.4%). These studies are limited in their utility as the study with TGAI could not determine a LD50 due to excessive mortality in the majority of concentrations tested by 24 hours after treatment and the formulated product study not indicating a clear dose response in the results. Summaries of each study are provided in Appendix D.
Table 5-4. Summary of registrant submitted adult acute contact toxicity studies for non-Apis bees (Note: both studies concern Bombus terrestris)
Test Substance (% a.i)
Study Duration (Type)
Endpoint (95% CI) (expressed in terms of µg a.i/bee)
Comments
Classification (Reference, MRID)
TGAI (98.6) 72-hr Could not be determined
- Test concentrations were evidently too high as all but lowest treatment group had at least 90% mortality after 24 hours. - Definitive LD50 could not be determined. There was 90 – 100% mortality in the 4, 8, 31, 65, and 101 µg a.i/bee and 47% mortality at the lowest dose (0.1 µg a.i/bee).
Supplemental (49766208)
TEP (Imidacloprid FS 350) (30.4)
96-hr LD50: 85.3 (N/A)
- There was no clear indication of a dose response provided (percent mortality was 0, 20, 33, 27, 53, and 47% in the control, 1.23, 3.70, 11.1, 33.3, and 100 µg a.i/bee) - There was 46.7% mortality in the highest treatment group (100 µg a.i/bee)
Supplemental (MRID 49532101)
NA: not available; TGAI: technical grade active ingredient; TEP: typical end use product
Non-Apis – Open Literature Studies There were 5 studies evaluated from the open literature that characterize the acute contact toxicity to non-Apis bees including bumble bees (B. impatiens), Japanese orchard bees (Osmia cornifrons), blue orchard bees, alfalfa leaf cutting bees, and a species of stingless bee (i.e., Melipona quadrifasciata). The key elements of these studies are summarized below with full summaries provided in Appendix D. Some studies did not estimate endpoints in terms of dose (i.e., µg a.i/bee) and did not provide sufficient information for estimating dose per bee.

107
Table 5-5. Summary of adult acute contact toxicity studies to non-Apis bees evaluated from the open literature
Test Species Test Substance (% a.i)
Study Duration
Endpoint (95% CI) (expressed in terms of µg a.i/bee unless otherwise noted)
Comments
Classification (Reference, MRID)
Bumble bee (Bombus impatiens)
TGAI (>95) 72-hr
No endpoint calculated; there was 72, 96, and 100% mortality for the 0.05, 0.5, and 5 lbs a.i/A treatment groups, respectively.
- Contact administration to bees was via a Potter Spray Tower - Notably high test concentrations, particularly the highest dose
Qualitative (Gradish 2009, 48194902)
Bumble bee (Bombus terrestris)
TGAI (purity not reported)
72-hr LD50: 0.02 (NA)
- Doses that bees were exposed to not provided - The purity of imidacloprid was not reported - There was no information on the performance of the control although it was stated that trials in which over one control individual had died were not considered. - There was no indication on whether a dose-response was present
Qualitative (Marletto 2003, 47796306)
Japanese orchard bee (Osmia cornifrons)
TEP (17.4) 48-hr LD50 0.66 (0.30 – 2.19)
- The study also exposed Japanese orchard bees to imidacloprid with fenbuconazole (mixture was 2-fold less toxic relative to imidacloprid alone. - The doses that the bees were exposed to were not provided
Qualitative (Biddinger 2013, 49719605)
Bumble bee (Bombus impatiens- (females only)
TGAI (>95) 48-hr
LD50: 32.2 µg/kg test solution (NA)
- The test groups were presented in terms of percent active ingredient in solution as opposed to actual treatment concentrations. These concentrations were converted to µg/kg by assuming the density of the test solution was 1 g/mL
Qualitative (Scott-Dupree 2009, 48191904)
Alfalfa leafcutting bee (Megachile rotundata)
LD50: 1.7 µg/kg test solution (NA)
Blue orchard bee (Osmia lignaria)
LD50: 0.7 µg/kg solution (NA)

108
Test Species Test Substance (% a.i)
Study Duration
Endpoint (95% CI) (expressed in terms of µg a.i/bee unless otherwise noted)
Comments
Classification (Reference, MRID)
Melipona quadrifasciata (stingless bee)
700 g a.i/L (70% purity assuming a density of 1 g/L)
24-hr LD50: 0.023 (NA)
- No mention of control mortality but data in treatment groups were corrected for control mortality - Relatively short (24-hour) observation period -this species of stingless bee does not have a range that extends into North America and its appropriateness as a surrogate for other species of stingless bees is unknown
Qualitative (Tomé, 2015 49719633)
NA: not available; TGAI: technical grade active ingredient; TEP: typical end use product
There were additional studies evaluated from the open literature that assessed the effects of acute contact exposure to adult honey bees that were determined to be unsuitable for discussion in this assessment due to various uncertainties and limitations. These studies, along with their respective associated uncertainties and limitations, are provided in Appendix 1. Summary of Adult Acute Contact Exposure Route to Apis and non-Apis Bees From the suite of Tier I registrant-submitted studies, the most sensitive Apis adult acute contact toxicity endpoint (which could be verified by provided raw data) was a 72-hour LD50 value of 0.048 µg a.i/bee (MRID 49602715). In total, there were ten studies (from both registrant-submitted and open literature sources) that tested the acute contact toxicity of imidacloprid to adult honey bees, inclusive studies listing A. mellifera as the test species as well as studies testing two subspecies (A. mellifera caucasia and A. mellifera carnica). There was not a clear trend, based on the available studies, of the impact of the study observation period (e.g., 48, 72, 96 hours), on the determined LD50. Additionally, there was not a clear pattern in the data to ascertain whether one subspecies of A. mellifera is differentially more or less sensitive than another. For these reasons, data concerning different subspecies of A. mellifera and varying study durations are grouped together in Figure 5-1 below, separated by whether the data were registrant-submitted or were evaluated from the open literature. Additionally, registrant-submitted and open literature studies that tested formulated imidacloprid do not indicate (albeit with a notably limited dataset) an increased or decreased sensitivity as compared to technical grade imidacloprid. Three open literature studies testing formulated imidacloprid on non-Apis species (B. terrestris, O. cornifrons, and M. quadrifasciata), show a range of values spanning over an order of magnitude. It is noted that for two non-Apis studies (Gradish, 2009, MRID 48194902 and Scott-Dupree, 2009, MRID 48191904) endpoints were not expressed in µg a.i/bee; therefore, these values are not represented in Figure 5-1 below.

109
Figure 5-1. Scatterplot of adult acute contact toxicity of Apis and non-Apis bees from registrant-submitted and open literature sources conducted with technical grade active ingredient (TGAI) and formulated typical end product (TEP) imidacloprid. Red circle denotes endpoint used for Tier I risk estimation purposes.
As depicted in the scatterplot above, the acute contact LD50 values span over an order of magnitude (inclusive of all studies). The most sensitive (i.e. lowest) acute contact toxicity LD50 value originating from a registrant-submitted study (allowing for an independent verification of the statistical analysis based on the raw data) is 0.043 µg a.i/bee. The duration of Apis studies conducted with TGAI (registrant submitted and open literature sources) range from 24 hours to 96 hours and the LD50 values range from 0.013 – 0.104 µg a.i/bee, with a median LD50 of 0.061 µg a.i/bee and a mean LD50 of 0.068 µg a.i/bee. The duration of Apis studies conducted with TEP (registrant submitted and open literature) range from 48 – 96 hours and the LD50 values range from 0.030 – 0.243 µg a.i/bee, with a median LD50 of 0.052 and a mean LD50 of 0.094 µg a.i/bee. It is noted that these ranges do not include endpoints that were non-definitive., nor does Figure 5-1 depict endpoints that were non-definitive.

110
5.1.2. Adult Acute Oral Exposure Apis – Registrant-Submitted Studies There are nine available acute studies to characterize the oral toxicity of imidacloprid to adult honey bees with TGAI (purities range from 98.6 - 99.8%) and one study conducted with a formulated TEP (200 g/L, 20% a.i., assuming density of 1 g/L). These studies were generally in line with OECD TG 213 and LD50 values ranged from 0.0039 µg a.i/bee – 0.151 µg a.i/bee. Clinical signs of toxicity were noted in most tests that included observation of bees being incapacitated and/or uncoordinated activity/movements and were similar to those reported for the acute contact toxicity tests. Summaries of each study are provided in Appendix D. From the suite of registrant-submitted Tier I adult acute contact toxicity studies (from which raw data were provided), the most sensitive Apis acute oral toxicity endpoint was 0.0039 µg a.i/bee (MRID 42273003 study).
Table 5-6. Summary of registrant submitted adult acute oral toxicity studies (Note: All studies tested Apis mellifera).
Test Substance (% a.i)
Study Duration
Endpoint (95% CI) (expressed in terms of µg a.i/bee)
Comments
Classification (Reference, MRID)
TGAI (99.8) 48-hr LD50: 0.0039 (0.0027 – 0.0054) --
Acceptable (42273003)
TGAI (98.0) 48-hr LD50: >0.036 (NA)
- Clinical signs of toxicity included coordination problems, lethargy, and agitation were observed in the four highest treatment concentrations
Acceptable (49766202)
TGAI (98.6) 48-hr LD50: >0.020 (NA) - Clinical signs of toxicity included paralysis and spasm observed in bees at the four highest treatment groups
Acceptable (49766205)
TGAI (98.6) 48-hr LD50: >0.045 (NA)
- Clinical signs of toxicity include bees observed being incapacitated or loss of coordination in the 3 highest treatment groups
Acceptable (49602716)
TGAI (98.6) 48-hr LD50: >0.070 (NA)
- Clinical signs of toxicity included lethargy, loss of coordination , and immobility in the two highest treatment groups
Acceptable (49602714)
TGAI (98.6) 96-hr LD50: >0.035 (NA)
- incapacitated/loss of coordination reported at the highest test concentration - Percent food uptake decreased in a dose dependent manner as concentration increased.
Acceptable (49602717)
TGAI (99.4) 96-hr LD50: 0.151 (0.078 – 1.86)
- Clinical signs of toxicity included loss of coordination, lethargy, agitation, and incapacitation were observed in all but the lowest treatment groups
Supplemental (49766203)

111
Test Substance (% a.i)
Study Duration
Endpoint (95% CI) (expressed in terms of µg a.i/bee)
Comments
Classification (Reference, MRID)
TGAI (99.4) 96-hr LD50: 0.041 (13.5 - 3980173)
- Clinical signs of toxicity included lethargy, loss of coordination problems, agitation, and inactivity were observed in the five highest treatment groups.
Supplemental (49766204)
TEP (200 g/L, 20% purity assuming product density of 1 g/L)
96-hr
LD50: 0.053 (0.038 – 0.074) 0.290 µg product/bee
- Clinical signs of toxicity that were noted were uncoordinated movement in the 2 highest treatment groups
Acceptable (49602707)
NA: not available; TGAI: technical grade active ingredient; TEP: typical end use product Bolded value represents endpoint to be used risk estimation Apis - Open Literature Studies Discussed below are those studies from the open literature that investigated the toxic effects to honey bees following oral exposure. All studies discussed below are a single oral exposure to 5 or more concentrations follow by a 48-96 hour observations period that generally follow OECD TG 213 with the exception of the study reported by Ramirez-Romero et al., 2005 (MRID 47796305), which exposed bees to only a single concentration. As a result, this study did not estimate an endpoint (i.e. an LC50 and does not appear in Table 5-7 summarizing the adult acute oral exposure studies from the open literature (study summary provided in Appendix D. It is noted that for some studies, multiple trials were conducted, yielding several estimates of toxicity within the same study (e.g. Schmuck 2001 [MRID 47812303] and Schmuck 2003 [MRID 47796304]).
Table 5-7. Summary of adult acute oral toxicity studies for Apis bees evaluated from the open literature
Test Species
Test Substance (% a.i)
Duration Endpoint (95% CI) (expressed in terms of µg a.i/bee)
Comments
Classification (Reference, MRID)
Apis mellifera carnica
TGAI (>98)
48-hr
LD50: 0.0037 (0.0027 – 0.0053)
- There was no mention of whether a dose response was present.
Qualitative (Schmuck 2001, 47812303)
LD50: >0.021 (NA) LD50 0.041 (NA)
TEP (as WG 70) (70)
LD50: 0.012 (0.007 – 0.018)
TEP (as SC 200) (200 g/L)
LD50: 0.021 (0.015 – 0.030)
Apis mellifera carnica
TGAI (>98) 48-hr
LD50: 0.041 (NA) - There was no mention of whether a dose response was present.
Qualitative (Schmuck 2003, 47796304)
LD50: >0.020 (NA) LD50 >0.081 (NA) LD50 >0.081 (NA) LD50 >0.081 (NA)

112
Test Species
Test Substance (% a.i)
Duration Endpoint (95% CI) (expressed in terms of µg a.i/bee)
Comments
Classification (Reference, MRID)
LD50: >0.081 (NA) LD50: >0.081 (NA)
Apis mellifera mellifera TGAI
(98) 48-hr
LD50: 0.0048 (0.0045 – 0.0051) - Analytical confirmation
of imidacloprid in the treatment concentrations was not conducted
Qualitative (Suchail 2000 47800513)
Apis mellifera caucasia
LD50 0.0065 (0.0047 – 0.0083)
Apis mellifera
TGAI (97) 96-hr LD50: 0.037 (NA)
- Analytical confirmation of imidacloprid in the treatment concentrations was not conducted - No mention of whether a dose response was present
Qualitative (Suchail 2001, 47523402)
Apis mellifera
TGAI (99.9) 48-hr LD50: 0.536 (0.339 – 1.18)
- Also tested myclobutanil, propiconazole, flusilazole, and tebuconazole in separate combinations with imidacloprid (no endpoint significantly lower than imidacloprid alone - No mention of any presence of control mortality
Qualitative (Thompson 2014a, 49750606)
Apis mellifera
TEP (Confidor – 17.8%)
72-hr
LD50: 0.194 (NA) - Study states that 42% of the data presented is from another source making this study both a primary source and review (secondary source) article (no way of discriminating the primary and secondary source data from the available information in the study - The actual number of exposed bees per treatment group is not specified. - There was no mention of whether a dose response was present.
Qualitative (Laurino 2013, 49719620)
Apis mellifera ligustica
LD50: 0.030 (NA) LD50: 0.065 (NA) LD50: 0.025 (NA)
LD50: 0.035 (NA)
NA: not available; TGAI: technical grade active ingredient; TEP: typical end use product

113
Non-Apis – Registrant Submitted Studies In an acute oral study, 30 bumble bees (Bombus terrestris) per group were exposed to nominal concentrations of TGAI (98.6%) imidacloprid at 0.110, 0.330, 0.530, 0.720, and 0.960 µg a.i/bee (including a negative control). Clinical signs of toxicity included paralysis, and spasms at all treatment concentrations. It was reported that most of the bumble bees that ingested 0.330 µg a.i/bee or more died within 24 hours. The 72-hour LD50 was determined to be 0.170 µg a.i/bee; the study is classified as acceptable. Non-Apis – Open Literature Studies In Marletto, 2013 (MRID 47796306, discussed above regarding adult acute contact toxicity results), 5 bumble bee (B. terrestris) workers were placed in each cage, although it is not known how many replicates per treatment group were used. Additionally, the actual test concentrations to which the bees were exposed was not reported. The 72-hour oral LD50 was determined to be 0.02 µg a.i/bee (95% confidence intervals not available). Limitations in addition to those listed above include the purity of imidacloprid not being provided, no information on the performance of the control available, and no analytical verification of the test substance in the provided sucrose. In a study by Thompson et al. 2014b (MRID 49719632), TGAI (>99% purity) was administered to bumble bees (B. terrestris) in a 30% sucrose solution at nominal imidacloprid concentrations of 0 (control), 1.0, 10, and 100 µg a.i/L. After 3 days of exposure, mortality was 15, 5, 15, and 15% for the control, 1.0, 10, and 100 µg a.i/L groups, respectively. Additionally, it was reported that a significantly (statistical results not provided) lower spiked sucrose was consumed in the 10 and 100 µg a.i//L groups. Limitations in this study include that the discussion of certain results are not present. For example, mortality data were excluded if 100% mortality was reached before the end of the experimental period. Without raw data to confirm any of the statistical findings, the results of this study are uncertain. Also, despite concentrations spanning two orders of magnitude, mortality did not show evidence of a dose response. Summary of Adult Acute Oral Exposure Route to Apis and non-Apis Bees In total, there were 15 studies (from both registrant-submitted and open literature sources) that tested the acute oral toxicity of imidacloprid to adult honey bees, inclusive of studies indicating A. mellifera as the test species as well as studies testing two subspecies (A. mellifera caucasia and A. mellifera carnica). Similar to the dataset for the acute contact toxicity to adult bees, the available studies do not show a clear trend in differential sensitivity of one subspecies of A. mellifera as compared to others, nor do the data allow for making inferences of changes in toxicity associated with duration of the post-exposure observation period. Of the 15 acute oral studies for adult honey bees that tested TGAI (inclusive of both registrant-submitted and open literature sources), less than half (47%) yielded endpoints that were definitive LD50 values. The non-definitive endpoints were not plotted in Figure 5-2 depicting registrant and evaluated open literature Apis and non-Apis studies conducted with TGAI and formulated TEP of imidacloprid.

114
Figure 5-2. Scatterplot of adult acute oral toxicity of Apis and non-Apis bees from registrant-submitted and open literature sources conducted with technical grade active ingredient (TGAI) and formulated typical end product (TEP) imidacloprid. Red circle denotes endpoint used for Tier I risk estimation purposes.
As depicted above, the acute oral LD50 values span over two orders of magnitude, ranging from 0.0039 – 0.536 µg a.i/bee (inclusive of registrant-submitted and open literature studies testing TGAI imidacloprid, observations periods of 48 – 96 hours). From the suite of Tier I registrant-submitted studies, the most sensitive Apis adult acute oral toxicity endpoint conducted was a 48-hour LD50 value of 0.0039 µg a.i/bee (MRID 42273013). The mean and median for TGAI studies (registrant-submitted and open literature) are 0.087 and 0.039 µg a.i/bee, respectively, and for formulated TEP imidacloprid studies are 0.054 and 0.033 µg a.i/bee, respectively. It is noted that these measures of central tendency do not include endpoints that were non-definitive.

115
5.1.3. Adult Chronic Oral Toxicity (Apis and non-Apis) There are 5 studies available from combined registrant-submitted and open literature sources that examine the chronic toxicity of imidacloprid through dietary exposure for honey bee and bumble bee adults (results combined into one summary table and discussion due to low number of studies relative to the acute data). These effects are summarized in the Table 5-8 below. Where available, the no observed adverse effect concentration (NOAEC) and the lowest observed adverse effect concentration (LOAEC) are provided; otherwise, a description of the report’s effects is tabulated. An endpoint more sensitive than the registrant-submitted study was available from the open literature (Boily 2013 – MRID 49750601) and for which raw data were obtained from the primary author to verify the statistical findings. Therefore, this study is suitable for quantitative risk assessment purposes. Summaries of each study, including methods and full findings, are provided in Appendix D. Apis – Registrant-Submitted Studies
Table 5-8. Summary of registrant-submitted and evaluated open literature studies assessing the chronic oral toxicity of imidacloprid to Apis and non-Apis adults.
Test Species
Test Substance (% purity)
Exposure Period
Exposure concentrations Reported Effects Comments
Classification (Reference / MRID)
Apis mellifera
TGAI (99.4%) 10 days
0 (control), 10, 20, 50, and 100 µg a.i/L
NOAEC/LOAEC (mortality): 100/>100 µg a.i/bee NOAEC/LOAEC (food consumption: <10/10 µg a.i/L (equivalent to <0.0039 µg a.i/bee)
- Concentrations in terms of mean intake over study course (excluding control) were 0.0039, 0.0063, 0.016, and 0.028 µg a.i/bee) - No definitive NOAEC established based on food consumption
Supplemental (49511703)

116
Test Species
Test Substance (% purity)
Exposure Period
Exposure concentrations Reported Effects Comments
Classification (Reference / MRID)
Apis mellifera
Admire 240 (24.0% a.i assuming a product density of 1 g/L)
10 days
0 (control), 0.08, 0.16, 0.24, and 0.30 ng a.i/bee
NOAEC/LOAEC (mortality and body weight): 0.16/0.24 ng a.i/bee (0.00016/0.00024 µg a.i/bee)
- Test conducted with formulated product (Admire 240F) but concentrations provided in terms of active ingredient - Clinical signs of toxicity included tumbling and trembling at all doses
Quantitative (Boily 2013, 49750601)
Apis mellifera
Imidacloprid (purity not clear from citation but stated to be obtained from Cluzeau (Analytical Chemistry Materials Provider, France)
10 days 0 (control), 0.70, 7.0, 70 ppb
Mortality: 5.6, 10.4, 16.3, and 17.4%, respectively
- Mortality for all treatment groups was significantly increased from control (p<0.05) - No significant effects reported for food consumption (p>0.05)
Qualitative (Alaux 2010, 48077922)
Apis mellifera
Analytical standard (exact purity not provided)1
6 days
0 (control), 0.08, 0.2, 0.51, 1.3, 3.2, 8.0, 20, 50, and 125 µg a.i/L
No reported effects up to and including the highest concentration
- Mortality, locomotory activity, and food consumption were assessed - Results not reported as percent difference from control
Qualitative (Cresswell 2012, 497196610) Bombus
terrestris
Analytical standard (exact purity not provided)1
38% reduction in food consumption when ingesting 4.9 ng a.i/bee (0.0049 µg a.i/bee) (percent effects reported only for certain concentrations)
Apis mellifera
Analytical standard (exact purity not provided)1
3 day exposure (followed by 5 days of
0 (control) and 125 µg a.i/L (0.0022 µg a.i/bee/day)
No reported effects in 3-day and 8-day exposures
- Food consumption and locomotory activity were measured
Qualitative (Cresswell 2013, 49719611)

117
Test Species
Test Substance (% purity)
Exposure Period
Exposure concentrations Reported Effects Comments
Classification (Reference / MRID)
Bombus terrestris
Analytical standard (exact purity not provided)1
untreated sucrose), or 8 day continuous exposure (treated sucrose)
Significant reductions from control (p<0.05) in food consumption and locomotion
- Bumble bees on 3 days exposure showed recovery of these effects
1As confirmed by study author, email communication 03/16/15 Bolded value represents endpoint to be used risk estimation
5.1.4. Larval Acute Oral Toxicity Apis - Registrant Submitted Studies There are no registrant-submitted studies or studies that were surveyed as part of the open literature effort that concern the acute oral exposure to honey bee larvae. Non-Apis – Open Literature Studies In a study conducted by Tomé et al. (2012), the larvae of the stingless bee Melipona quadrifasciata anthidiodes were exposed to varying concentrations of imidacloprid TEP (reported as 700 g a.i/L, 70% purity assuming product density of 1 g/L), for up to 5 days, depending on when adults emerged. Observations were made for mortality, body mass, and developmental time. Colonies were collected in the field and maintained in an experimental apiary within a laboratory at Federal University, Vicosa, Brazil. Brood chambers containing eggs were removed from the hives and transferred to artificial cells containing larval diet (also obtained from the field) that was either untreated or spiked with 18 varying concentrations of imidacloprid ranging from 0.0056 to 56 µg a.i/bee. Upon emergence, the adult workers were marked with different colors to facilitate age monitoring and were fed with untreated honey and pollen syrup (not further described in the article). For each treatment concentration, there were five replicates of 24 larvae each. There was 97% control survival and survival was above 50% only at the lowest treatment concentration (0.0056 µg a.i/bee). There was a negative correlation between imidacloprid dose and median survival time (TL50). According to the study authors, body mass and development time, by contrast, were not significantly affected; however, statistical results were not provided. The authors noted that stingless bee larvae ingested the entire dose, irrespective of the treatment concentration. While a definitive endpoint was unclear from the study, none of the larvae reached pupation at treatment concentrations higher than 0.28 µg a.i/bee. Limitations from the study include no analytical verification of the concentrations of imidacloprid in the treatment groups and the fact that no explicitly stated endpoint was available from the study. Additionally, it is noted that the bees were wild collected as well as their diet and it is an uncertainty of the prior exposure to pesticides. Finally, it is noted that the geographic distribution of this species of stingless bee does not extend into North America, and it is unclear to what extent this species is representative of other species of stingless bees.
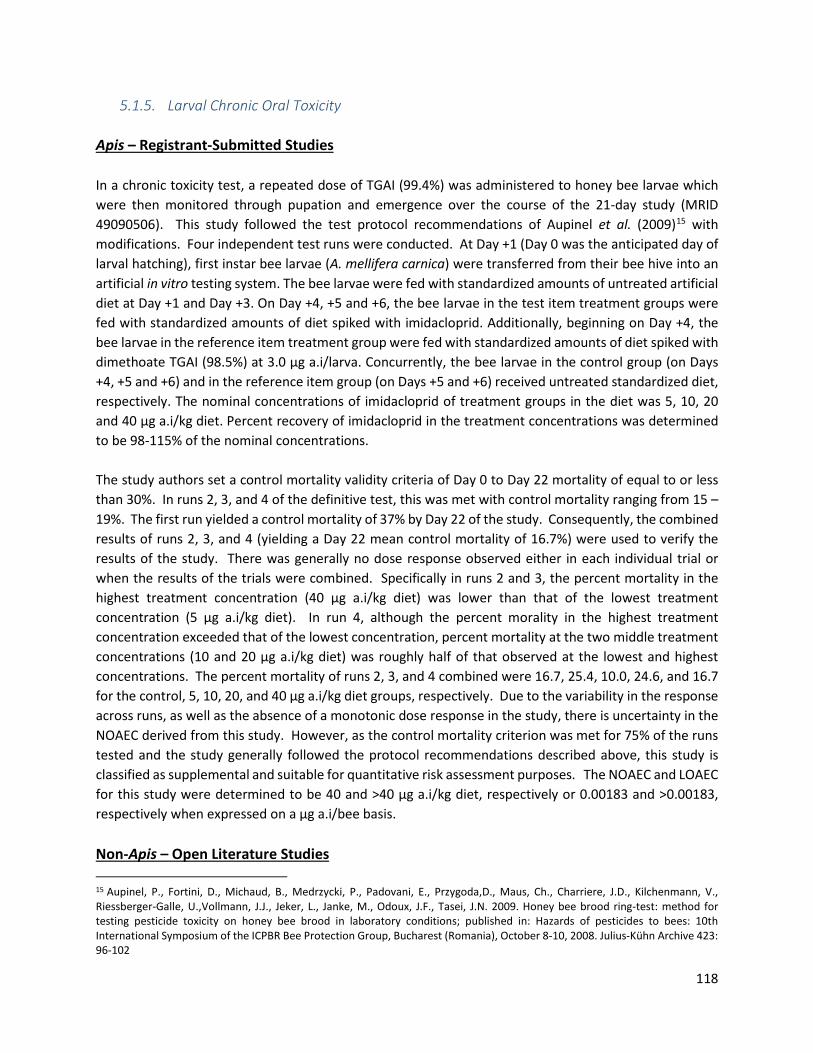
118
5.1.5. Larval Chronic Oral Toxicity Apis – Registrant-Submitted Studies In a chronic toxicity test, a repeated dose of TGAI (99.4%) was administered to honey bee larvae which were then monitored through pupation and emergence over the course of the 21-day study (MRID 49090506). This study followed the test protocol recommendations of Aupinel et al. (2009)15 with modifications. Four independent test runs were conducted. At Day +1 (Day 0 was the anticipated day of larval hatching), first instar bee larvae (A. mellifera carnica) were transferred from their bee hive into an artificial in vitro testing system. The bee larvae were fed with standardized amounts of untreated artificial diet at Day +1 and Day +3. On Day +4, +5 and +6, the bee larvae in the test item treatment groups were fed with standardized amounts of diet spiked with imidacloprid. Additionally, beginning on Day +4, the bee larvae in the reference item treatment group were fed with standardized amounts of diet spiked with dimethoate TGAI (98.5%) at 3.0 µg a.i/larva. Concurrently, the bee larvae in the control group (on Days +4, +5 and +6) and in the reference item group (on Days +5 and +6) received untreated standardized diet, respectively. The nominal concentrations of imidacloprid of treatment groups in the diet was 5, 10, 20 and 40 μg a.i/kg diet. Percent recovery of imidacloprid in the treatment concentrations was determined to be 98-115% of the nominal concentrations. The study authors set a control mortality validity criteria of Day 0 to Day 22 mortality of equal to or less than 30%. In runs 2, 3, and 4 of the definitive test, this was met with control mortality ranging from 15 – 19%. The first run yielded a control mortality of 37% by Day 22 of the study. Consequently, the combined results of runs 2, 3, and 4 (yielding a Day 22 mean control mortality of 16.7%) were used to verify the results of the study. There was generally no dose response observed either in each individual trial or when the results of the trials were combined. Specifically in runs 2 and 3, the percent mortality in the highest treatment concentration (40 µg a.i/kg diet) was lower than that of the lowest treatment concentration (5 µg a.i/kg diet). In run 4, although the percent morality in the highest treatment concentration exceeded that of the lowest concentration, percent mortality at the two middle treatment concentrations (10 and 20 µg a.i/kg diet) was roughly half of that observed at the lowest and highest concentrations. The percent mortality of runs 2, 3, and 4 combined were 16.7, 25.4, 10.0, 24.6, and 16.7 for the control, 5, 10, 20, and 40 µg a.i/kg diet groups, respectively. Due to the variability in the response across runs, as well as the absence of a monotonic dose response in the study, there is uncertainty in the NOAEC derived from this study. However, as the control mortality criterion was met for 75% of the runs tested and the study generally followed the protocol recommendations described above, this study is classified as supplemental and suitable for quantitative risk assessment purposes. The NOAEC and LOAEC for this study were determined to be 40 and >40 µg a.i/kg diet, respectively or 0.00183 and >0.00183, respectively when expressed on a µg a.i/bee basis. Non-Apis – Open Literature Studies 15 Aupinel, P., Fortini, D., Michaud, B., Medrzycki, P., Padovani, E., Przygoda,D., Maus, Ch., Charriere, J.D., Kilchenmann, V., Riessberger-Galle, U.,Vollmann, J.J., Jeker, L., Janke, M., Odoux, J.F., Tasei, J.N. 2009. Honey bee brood ring-test: method for testing pesticide toxicity on honey bee brood in laboratory conditions; published in: Hazards of pesticides to bees: 10th International Symposium of the ICPBR Bee Protection Group, Bucharest (Romania), October 8-10, 2008. Julius-Kühn Archive 423: 96-102

119
In a study by Abbott et al. (2008, MRID 47812301), the eggs of blue orchard bees (Osmia lignaria) were exposed to varying concentrations of TGAI (97.5% purity) into microwell plates and until adulthood, representing a duration of approximately 30-40 days. The bees were obtained as over-wintering adults in cocoons and kept in storage until the start of the experiment. Parameters that were assessed included the timing and completion of larval development, the number of days between the egg stage and the beginning of each larval stage, and the start of cocoon formation and its completion, including darkening. Time was also recorded from the date of first observation (egg stage) to the date each larva finished spinning a thin white cocoon around itself, and to the date the darkened cocoon was completed. Confirmation of the concentrations of the final pollen provisions were performed by Bayer CropScience and yielded levels for the low, medium, and high treatments of 2.7, 35, and 276 ppb, respectively for imidacloprid. Further details on the method and limitations of this study are provided in Appendix D.
Table 5-9. Summary of results from Abbott et al., 2008 examining the effects of imidacloprid TGAI on larval development of blue orchard bees (Osmia lignaria) .1 (Note: Study classified as qualitative)
Response variable 3 ppb 30 ppb 300 ppb Lab Component – Own Pollen
Time to reach last larval stage (days) NS NS NS Time to spin a cocoon (days) NS NS NS
Time to finish darkening a cocoon (days) NS NS Males: NS Females: ↓
Time to emerge from cocoons (days) NS NS NS
Weight of bees after emergence from cocoon (grams) Males: ↑ Females: NS
Males: ↑ Females: NS
Males: ↑ Females: NS
Lab Component – New Pollen Time to reach last larval stage (days) NS NS NS Time to spin a cocoon (days) NS NS NS Time to finish darkening a cocoon (days) NS NS NS
Time to emerge from cocoons (days) NS NS Males: NS Females: ↓
Weight of bees after emergence from cocoon (grams) NS NS NS Field Component
Time to reach last larval stage (days) NS Males: NS Females: ↑
Males: ↑ Females: NS
Time to spin a cocoon (days) NS Males: ↑ Females: NS NS
Time to finish darkening a cocoon (days) NS Males: ↑ Females: ↑
Males: ↑ Females: NS
Time to emerge from cocoons (days) NS NS NS Weight of bees after emergence from cocoon (grams) NS NS NS
1 Means not presented. Arrow up or down denotes significant (p<0.05) increase or decrease from control, respectively; NS = not significant (p>0.05)

120
5.1.6. Acute and Chronic Toxicity of the Degradation Products of Imidacloprid As discussed in Section 4, imidacloprid can degrade into various products both within the plant as well as in the soil. Specifically, imidacloprid is metabolized within the plant to 4,5 IMI-OH, which then degrades to 5-OH-IMI, and subsequently to IMI-olefin. In the aerobic soil metabolism pathway, the olefin-IMI metabolite is formed at a minor (i.e. less than 10% of the applied residues) rate. While there are no registrant-submitted studies to characterize the toxicity of these metabolites, there are studies available from the open literature that investigated the acute and chronic oral toxicity of these metabolites to adult honey bees. As described in Section 4, parent imidacloprid undergoes metabolism to several degradates that include IMI-olefin, IMI-5-OH, 4,5-OH-IMI, desnitro-IMI, 6-CNA, and a urea metabolite. Table 5-10 below summarizes the studies assessing the acute oral toxicity of the various degradation products of imidacloprid. There are registrant-submitted and open literature studies available to characterize the acute and chronic toxicity of the various degradation products of imidacloprid. The registrant-submitted studies primarily concern the chronic oral toxicity to honey bee adults of the urea metabolite and 6-CNA metabolites. Additionally, there are two studies from the open literature that assess the acute oral toxicity to honey bee adults to several degradates including IMI-olefin, IMI-5-OH, 4,5-OH-IMI, desnitro-IMI, 6-CNA, and the urea metabolite.
Table 5-10. Summary of acute oral toxicity studies testing the degradates of imidacloprid in the open literature
Species Test Substance (% a.i)
Duration Endpoint1 Comments
Classification (Reference, MRID )
Apis mellifera
IMI-olefin (>98)
72-hr
LD50: >0.036 µg a.i/bee (NA) - No mention of whether dose
response was present - Unclear from methods section whether analytical confirmation of the test substance in the treatment groups was conducted - Failure to capture sufficient dose response to enable calculation of LD50 values
Qualitative (Schmuck 2003, 47800520)
IMI-5-OH (>98)
LD50: 0.159 µg a.i/bee (NA)
4,5-OH imidacloprid (>98)
LD50: >0.049 µg a.i/bee (NA)
6-CNA (>98) LD50: >121 µg a.i/bee (NA)
Urea metabolite (>98)
LD50: >99.5 µg a.i/bee (NA)
Apis mellifera
IMI-olefin (>97)
96-hr
LD50: 0.023 µg a.i/bee (NA) - Analytical confirmation of
imidacloprid in the treatment groups was not conducted - No mention of whether a dose response was present
Qualitative (Suchail 2001, 47523402)
IMI-5-OH (>97)
LD50: 0.222 µg a.i/bee (NA)
4,5-OH imidacloprid (>97)
LD50 >1 µg a.i/bee (NA)

121
Species Test Substance (% a.i)
Duration Endpoint1 Comments
Classification (Reference, MRID )
Desnitro-imidacloprid (>97)
LD50 >1 µg a.i/bee (NA)
6-CNA (>97) LD50 >1 µg a.i/bee (NA)
Urea metabolite (>97)
LD50 >1 µg a.i/bee (NA)
1Numbers in parentheses for acute endpoints refer to 95% confidence intervals, listed as NA if not available
The available suite of chronic oral studies assessing the toxicity of the urea metabolite and 6-CNA, indicate that that these two degradates do not elicit a lethal effect significantly increased from that of controls up to and including a dietary concentration of 10 µg a.i/L. The test designs of all studies were generally the same although one key difference was the level of control mortality across studies, which ranged from 0 – 44% for the chronic urea metabolite studies and from 0 – 54% for the 6-CNA studies. While there is, at present, no formal guideline for a chronic adult 10-day oral toxicity test with honey bees, a control mortality level of above 20% suggests that husbandry conditions or general procedures in conducting the test may not have been optimal and therefore the ability to discern a true treatment-related effect may be compromised. As a result, the studies with greater than 20% mortality are not tabulated below. As the study designs were so similar, the major elements of each study are summarized in Table 5-11 below as opposed to a summary discussion of each study. All studies were conducted with A. mellifera, were 10 days in duration (i.e., 10 days of exposure), and tested either the urea metabolite or 6-CNA at concentrations of 0.1, 1.0, and 10 µg a.i/L in the diet (sucrose solution). Additionally, there was generally no evidence of analytical verification of the concentrations of the urea metabolite and 6-CNA in the treatment solutions. Finally, there were generally no observations of clinical signs of toxicity recorded for these studies (i.e. studies did not report whether such effects were examined). The results for the urea metabolite studies indicate that concentrations up to and including 10 µg a.i/L do not have an increased mortality effect to adult honey bees as compared to the control group. Two studies (MRIDs 49602711 and 49602713) also included food consumption as a response variable, but this endpoint was not subjected to statistical analysis by the study authors. Similarly, the results of the studies conducted with 6-CNA generally indicate (when not confounded by excessive control mortality; these studies not tabulated below) that concentrations up to and including 10 µg a.i/L do not result in an increased level of mortality when compared to controls after a 10-day exposure. As with the urea metabolite studies, for certain tests (MRIDs 49602710 49602720), food consumption was included as a response variable, although not statistically analyzed in the original study reports. Interestingly, for MRID 49602711 (urea metabolite study), the bees that were reported to be older (i.e. 22-45 days) had a 3-fold higher level of control mortality than the same study that included a component

122
that tested 12-17 day old bees (results not tabulated below for this component). Additionally, while the age of the bees was not reported, MRIDs 49602713 and 49602710 tested bees characterized as “house” bees and “field” bees that showed markedly different rates of control mortality despite both cohorts being subjected to the same methodology within each test (results not tabulated below for this component). It is an uncertainty whether the age of the test bees had an effect on the results of these studies.
Table 5-11. Summary of chronic adult oral toxicity studies with urea metabolite and 6-CNA (all studies conducted with Apis mellifera)
Experimental Design Results (presented for the control, 0.1, 1.0, and 10 µg a.i/L in ascending order)
Comments Classification (MRID)
Urea metabolite (99.4% purity for all studies)
3 reps/trt, 10 bees/rep
Mortality: 10, 37, 3, and 63% Food Consumption (per 10 bees): Mean food uptake was 4.87, 4.64, 3.93, and 3.57 g
- Bees were 12-17 days old - Statistical analysis of data not conducted by study authors
Acceptable (496027111)
5 reps/trt, 10 bees/rep
Mortality: 4, 10, 8, and 12% Food Consumption (per 10 bees): 7.30, 7.27, 7.27, and 7.54 g
- Test bees characterized as “house” bees, with no age reported - No significant differences in mortality, food consumption not statistically analyzed by study authors
Acceptable (496027132)
Mortality: 0, 8, 6, and 0%
- Statistical analysis of the data not conducted by the study authors - Age of bees up to 5 days old (post-emergence).
Acceptable (496027211)
6-CNA (99.6% purity for all studies except MRID 49602720 where purity not reported)
Mortality: 4, 10, 4 and 6% Food Consumption (per 10 bees): 7.29, 7.24, 7.34, and 7.19 g
- Test bees characterized as “house” bees, with no age reported - No significant differences in mortality, food consumption not statistically analyzed by study authors
Acceptable (496027102)
3 reps/trt, 10 bees/rep
Mortality: 7, 10, 7, and 7% Food consumption (per 10 bees): 5.94, 5.87, 5.50, and 5.8
- Test bees were 12-17 days old - Statistical analysis of data not conducted by study authors
Acceptable (496027201)
5 reps/trt, unspecified number of bees/rep
Mortality: 0, 2, 4, and 0% - Age of test reported to be up to 5 days old
Acceptable (496027223)
1Results are the same as those provided in Schmuck 2004 (“Germany II” testing facility) 2Results are the same as those provided in Schmuck 2004 (“Germany III” testing facility) 3Results are the same as those provided in Schmuck 2004 (“Germany I” testing facility)

123
5.2. Tier II As discussed in the Pollinator Risk Assessment Guidance (USEPA et al. 2014), Tier II encompasses studies that characterize effects at the colony level. The need for these studies depends on whether Tier I LOCs are exceeded, the availability of data, and the nature of uncertainties that warrant further testing. Tier II studies can include those characterized as “semi-field” studies where small colonies are enclosed in tunnels, along with pesticide-treated crops. Additionally, these studies may be a feeding study design in which whole colonies are provided pesticide-treated sucrose or pollen and the colonies are not confined to enclosures (i.e., the bees are free-foraging). Typically, semi-field studies are conducted under conditions that represent the worst-case exposure scenario of proposed uses to the entire colony or designed to address specific uncertainties with respect to the effects of the colony. Tier II study designs may be amenable to additional treatment levels and replication, this facilitating quantification of an application rate-response (semi-field tunnel study) or dose-response (feeding study) relationship at the colony level and determination of a NOAEC. For imidacloprid, both registrant-submitted and open literature Tier II-type studies are available. The registrant-submitted Tier II study (MRID 49510001) employed a feeding design in which 84 hives were provided either untreated sucrose solution within the hives or sucrose spiked with one of 5 concentrations of imidacloprid. Additionally, there are a number of Tier II-type studies (inclusive of tunnel and feeding study designs) that were evaluated by EPA, Health Canada’s Pest Management Regulatory Agency (PMRA), and the California Department of Pesticide Regulation (CDPR) (referred to as “tri-Agency”) open literature review effort. While the registrant-submitted study exposed honey bee colonies to varying concentrations of imidacloprid spiked in sucrose solutions, the suite of open literature studies concern both Apis and non-Apis species (B. terrestris and B. impatiens) exposed to imidacloprid through diet (i.e., both spiked sucrose and spiked pollen).
5.2.1. Registrant-Submitted Colony Feeding Study The registrant-submitted colony feeding study was conducted with honey bees to assess the potential for long-term effects, including colony overwintering survival, resulting from exposure to imidacloprid. The study was conducted in 12 test areas (Apiaries A – L) reported to be of low agricultural cultivation in North Carolina from June 21, 2013 to March 24, 2014. Eighty-four hives were divided according to hive strength (number of brood frames) with the strongest 7 hives assigned to Apiary A and the weakest 7 hives assigned to Apiary L (i.e., the study design was stratified to account for differences in colony strength). Within each apiary, the 7 hives were randomly assigned to treatment groups. At each apiary, five test hives were artificially fed with 50% sugar solution spiked with imidacloprid at 12.5, 25, 50, 100 or 200 µg a.i/L for six weeks continuously in the field, with two hives at each apiary serving as controls. The 8th colony at each apiary served as a monitoring hive to characterize the alternative sources of forage (pollen/nectar) of the test colonies as well as to monitor for the potential contamination with other pesticides. Assuming the density of a 50% sugar solution is 1.23 g/ml, the reviewer calculated that the test concentrations at 12.5,

124
25, 50, 100, and 200 µg/L are equivalent to 10.2, 20.3, 40.7, 81.3, and 162.7 ppb (µg/kg), respectively. Eight Colony Condition Assessments (CCAs) were conducted during the study. Three CCAs (CCA1 - 3) were conducted prior to feeding (i.e., pre-exposure phase) to determine hive strength (number of adult and developing bees) and initial hive conditions. A CCA was conducted during exposure with another one conducted one week after termination of exposure (CCA4 and CCA5, respectively) which characterize hive condition during exposure (i.e., exposure phase). Two more CCAs were conducted at 5 and 10 weeks after exposure (CCA6 and CCA7, respectively) to assess the chronic effect following exposure to imidacloprid and to characterize pre-overwintering hive conditions (post-exposure phase). A final CCA was conducted after overwintering in March 2014 (CCA8) to assess potential exposure impact on survival and chronic colony-level effects. Multiple parameters, such as hive weight, number of individuals at different life stages in the hive, hive honey and pollen stores, and hive overwintering survival, were measured during the course of the study. A joint review effort of this study was conducted by the United States Environmental Protection Agency (EPA), Canada’s Pest Management Regulatory Agency (PMRA), and the State of California Department of Pesticide Regulation (CDPR). As part of that effort, a separate statistical analysis was conducted by each regulatory entity as an independent verification of the results from the analysis provided by the registrant. These analyses were distinct in approach but generally yielded similar statistical results. It is noted here that when weighing the statistical results as well as biological concerns, particularly as they relate to honey bee biology at the colony level, EPA, PMRA, and CDPR arrived at the same overall conclusion and are therefore harmonized in terms of the determination of an overall NOAEC and LOAEC yielded by this study. For further details on the methodology and a more detailed discussion of the results of this study, please refer to Appendix G. Conclusions While there were uncertainties that were generally related to inherent aspects of any semi-field or full field study design (such as dilution of the test chemical through alternative sources of forage, detection of other chemicals in the monitoring hives), this study still provides information on a number of colony condition parameters about the long-term effects (including overwintering) from dietary exposure to imidacloprid at the colony level. As indicated in the results section above, the PMRA, EPA, and CDPR analyses determined significant effects (at both the 0.05 and 0.1 alpha levels) in the 50, 100, and 200 µg/L groups across multiple CCAs for the majority of response variables. Specifically, for the 100 and 200 µg/L treatment groups, significant effects (p<0.05) were determined for every response variable and persisted across at least 2 CCAs, along with very high overwintering mortality. While the 50 µg/L group had overwintering mortality similar to the controls, colony condition effects were different from controls with an early onset of effects which tended to persist, and notably poorer colony condition in surviving hives after overwintering in comparison to controls. Conversely, there was not a strong indication from the PMRA, EPA, and CDPR analyses of an impact at the colony level at the 12.5 and 25 µg/L treatment groups. This is evidenced not only by a general lack of

125
statistical findings (p>0.1) at these treatment levels but in cases where significant effects were determined, they either did not show strong dose-responsiveness, did not persist across multiple CCAs, or were considered potential transient effects (e.g., at CCA6) which did not persist after overwintering. This latter point was the case for the total life stage and pupal cell findings in which the PMRA analysis determined significant effects at all treatment levels at CCA6 (EPA also determined a significant reduction in pupal cells at the lowest treatment group of 12.5 µg/L at CCA6). As well at CCA6, PMRA determined significant effects on the proportion of eggs and larvae at 25 µg/L treatment (but not at the 50 µg/L). For these two lowest treatment groups (12.5 and 25 µg/L), the colony condition of surviving hives at CCA8 following overwintering was similar to controls, indicating the effects observed at CCA6 were likely transient and the colony was able to compensate for these effects. When examining the effects on food stores (pollen and nectar), the PMRA, EPA, and CDPR analyses did not determine any consistent and significant reductions in pollen and nectar stores at the 12.5 and 25 µg/L treatment groups. This is distinguished from the 50 µg/L group where effects on nectar in particular were apparent when compared alongside the response of the control in terms of the level of nectar buildup before hive preparation for overwintering at CCA7. This finding was also confirmed statistically in all three agency analyses with significant reductions in honey stores at CCAs 6, 7, and 8 (CCA8 data excluded from the EPA analysis for the 100 and 200 µg/L groups). Significant (p<0.05) reductions in pollen stores were also confirmed at CCAs 4 and 5 at the 50 µg/L treatment during the exposure phase. Specifically, when considering the adult and honey and pollen stores response variables, the differences from control were apparent both visually and statistically, particularly in the three highest treatment groups. For the proportion of adults, the onset of a decline in numbers occurred one CCA earlier in these groups than in the control, 12.5 and 25 µg/L treatment groups. For honey stores, the buildup that occurred starting at CCA5 in the 50 µg/L treatment group, reached only half the level reached in the control, 12.5, and 25 µg/L treatment groups by CCA7. Pollen stores were also reduced at CCA4 and CCA5 compared to controls for the three highest treatment groups, as well as at CCA6 and CCA7 at the highest treatment group. These effects were statistically significant (p<0.05) and indicate that the 50 µg/L treatment group was associated with trends and proportions of abundance for life stages and food stores not observed in the control, 12.5, and 25 µg/L treatment groups. Therefore, when weighing biological significance and the natural seasonal changes of honey bees colonies, as well as supporting conclusions from the statistical approaches used in PMRA, EPA, and CDPR, the NOAEC and LOAEC for this study is determined to be 25 and 50 µg/L, respectively. Strengths and limitations It is important to recognize the inherent strengths and limitations of this study as results are considered in this risk assessment. In the context of available field studies involving honey bees and imidacloprid, this study contains a number of strengths including:
• Use of a high degree of replication (n=12) to achieve a reasonable level of statistical power;

126
• Demonstration of a generalized concentration-response relationship with respect to the concentration of imidacloprid in sucrose solution and the magnitude and duration of adverse effects;
• Quantification of exposure to parent (imidacloprid) and toxicologically-relevant metabolites in diet and in hive matrices (uncapped nectar, pollen, honey, bee bread);
• Use of a 6-week exposure duration to represent a “high end” exposure scenario; • Inclusion of multiple colony-level endpoints reflecting hive strength, brood development and food
stores; • Detailed quality assurance/quality control (QA/QC) regarding quantification of chemical residues
in various matrices; and, • Availability of raw data for conducting/verifying statistical analysis.
A number of limitations are also noted with this study, including:
• Exposure of bees through nectar (sucrose) alone, whereas bees in the field are likely exposed through both pollen and nectar routes. While exclusion of the pollen route is expected to reduce overall exposure, the impact of this exclusion on the study results is uncertain and will likely depend on the life stage/caste of bee.
• Imidacloprid was found in both hive nectar and hive pollen (beebread), at concentrations lower than the feeding solutions. Dilution compared to the treatment feeding solution is expected since bees could also forage on outside nectar and pollen sources. As well, hive pollen contains only some hive nectar, thus would not be expected to have a concentration equivalent to nectar alone, and it is mixed with pollen which comes from outside [untreated] sources. Therefore exposure through both hive pollen and nectar occurred via exposure to the sucrose feeding solution, but how this compares to exposure through contaminated pollen directly is not known. It is also noted that nectar is considered the dominant exposure route for forager bees; other hive bees and larvae consume both nectar and pollen.
• The quantity of nectar provided to hives (2 L per week per hive) likely did not fulfill the complete carbohydrate needs of the colony, as indicated by colony bioenergetics and the lack of remaining sucrose solution upon their renewal. This suggests that bees could be exposed to a greater dose of imidacloprid in nectar had a greater volume of spiked sucrose been provided. Although the dosing regimen may have underestimated exposure through sucrose relative to 100% contaminated diet, it is noted that bees had to supplement their spiked sucrose by foraging on their own for other sources of nectar.
• Overwintering success of controls was impacted (36% hive mortality). This may have reduced the ability to detect adverse effects related to hive loss following overwintering. Although comparable to overwintering losses of commercial beekeepers (32% based on a 5-yr average16),
16 White House. 2015. National Strategy to Promote the Health of Honey Bees and Other Pollinators. Pollinator Health Task Force. May 19, 2015. https://www.whitehouse.gov/sites/default/files/microsites/ostp/Pollinator%20Health%20Strategy%202015.pdf

127
it is possible that elements of the study design may have contributed to this loss (e.g., lack of supers to allow for colony growth, delayed supplemental feeding during fall).
• Hive contamination with pesticides from food sources other than the artificial feeding was detected during the exposure period and post-exposure periods through collection of pollen from pollen traps. Although the study was deliberately conducted in an area where minimal potential for pesticide contamination from other sources was expected, the bees still appeared to be foraging on contaminated pollen and possibly nectar. During both exposure and post-exposure periods, multiple pesticides such as spiromesifen (maximum at 961 ppb) and piperonyl butoxide (maximum at 591 ppb) that may cause concern for bees were detected in most monitoring hives,. Trace amounts of other bee-toxic pesticides, such as chlorpyifos (LOD = 1.0 ppb) and malathion (LOD = 4.0 ppb) were also detected. The test chemical imidacloprid was found at 12.1 ppb in pollen from one (apiary L) of the total of six sites analyzed.
• Residues of imidacloprid in uncapped nectar and bee bread within the hives at CCAs 4, 5, and 8 represent a single sample per hive on a single frame rather than a composite sample from multiple portions of the comb within a hive. This means that residue results may reflect “hit or miss” scenario with respect to detecting residues in nectar laid down from spiked sucrose diets (fed) vs. outside sources.
• The exposure, based on residues measured in the hive (hive nectar and hive pollen) indicated that, overall, higher measured hive residues correlated with higher nominal residues in feeding solutions. However, individual hive residue values varied, and there was some overlap in measured values, particularly among the three lowest doses. Given the limited spatial and temporal sampling methodology (as mentioned above), there is uncertainty in whether these residues represent actual in hive residues across all portions of the frame. Specifically, one sample of one area of the comb on one side of the frame to represent the nectar or pollen residues of an entire hive may not reflect the true nature of the residues across all portions of a given hive.
In addition to the colony feeding study, there are several registrant-submitted Tier II studies employing a tunnel design that were previously mentioned in Section 4 regarding their residue information. These studies generally involved exposure to honey bee colonies foraging on seed-treated corn, canola, or sunflower within a netted enclosure (i.e. tunnel). These studies, while serving as a line of evidence in terms of the residue information provided, have several deficiencies that limit their utility from an effects standpoint. The limitations associated with each study can be found in Appendix 1.
5.2.2. Open Literature Studies This section summarizes the available Tier II (i.e., tunnel and feeding study design) studies that were evaluated from the open literature as part of the aforementioned joint review between EPA, PMRA, and CDPR. At the Tier II (and Tier III) levels, effects on the colony as a whole are assessed as distinguished from Tier I studies that characterize the effects of imidacloprid at the individual bee level. Where

128
sufficient information is available, a table summarizing the results is provided within the discussion of each study. Additionally, the limitations of each study are provided within each summary. It is noted here that all studies are determined to be of qualitative utility for characterization purposes in this assessment. As with the Tier I data, this is primarily due to the fact that raw data were not available to allow for an independent verification of the statistical results but, as will be discussed, other uncertainties contribute to this classification of utility. Apis Summary of Tier II Apis Studies from the Open Literature While many of the evaluated studies from the open literature do not have a robust experimental design (i.e., lack of replication of colonies or plots within treatment groups), lack of an overwintering component to provide insight on the long-term effects of imidacloprid at the colony level, and only one treatment concentration, these studies provide several additional endpoints not captured in the registrant-submitted colony feeding study. For example, foraging observations dealing with behavior and success are examined in the majority (90%) of the higher-tier Apis studies. Additionally, several higher-tier studies were evaluated that investigate the colony-level effects of imidacloprid on bumble bees and, as will be discussed, the concentrations in pollen and nectar at which effects are observed vary from that of Apis colonies. There were a total of 3 Tier II studies (all feeding design; 1 with spiked sucrose, 2 with spiked pollen) evaluated from the open literature to characterize the colony-level effects of imidacloprid to honey bees. These studies employed study design elements that were akin to the registrant-submitted colony feeding study discussed above such as replication of hives among treatment groups, monitoring for pests and pathogens, multiple colony condition assessments to monitor the hives during and after exposure, and an overwintering component to assess the long-term effects of colony health as a result chronic exposure to imidacloprid. There were an additional 4 studies (Bortolotti 2003, Eiri and Nieh 20120, Schneider 2012, and Tan 2014), that exposed honey bees to a single oral dose, but examined endpoints that could potentially lead to colony-level impacts. These studies, while not traditional colony-level feeding study designs provide information on foraging behavior and success endpoints not provided in other studies that were evaluated in the open literature. Besides being differentiated by the other colony feeding studies in their exposure duration, they are also distinct in that they do not include other measures of colony health such as information on mortality, proportions of various life stages, and overwintering survival. As noted in the Problem Formulation, while these studies do not provide information on regulatory endpoints by themselves, they provide additional information when characterizing the potential impact on the hive by measures of foraging success and behavior. Table 5-12 below summarizes key elements and findings from the Apis high-tier studies that were evaluated from the open literature. While the studies were varied in their exposure duration, concentrations tested, and endpoints assessed, the following is a discussion of each subset of endpoints that aims to put into context the results of these studies with those of the registrant-submitted Tier II colony feeding study described above. Summaries of each of these studies including the methods and full results are provided in Appendix D.

129
There are several points worth noting with regards to this discussion:
1. While the registrant-submitted colony feeding study had raw data provided to allow for an independent verification of the statistical results, the higher tier studies from the open literature did not have this information available. For some studies, the responses of certain endpoints were estimated from the graphs provided in the original article and are therefore not without some uncertainty in their precision. For other studies, the means of the responses were not provided, but rather only the direction of the effect as compared to the control and whether or not the results were statistically significant.
2. The studies evaluated from the open literature do not demonstrate exposure to the extent provided in the registrant-submitted colony feeding study. Specifically, this refers to a general lack of information regarding analytical confirmation of imidacloprid in treatment solutions, as well as a general lack of in-hive residue data for stored pollen, honey, and honey bee samples.
3. While the registrant submitted study assessed numerous colony condition parameters, it did not include any response variables regarding foraging behavior or success. By contrast, a number of the Tier II studies from the open literature include some measure of foraging behavior or success as a response variable.
4. Only 3 of the 7 available Tier II studies included an overwintering component. This design element is critical in evaluating the long term success of a colony following exposure to imidacloprid since, as was suggested by the results of the registrant-submitted colony feeding study, the honey bee colony can be a resilient entity that is capable of recovery of certain effects when exposure ceases.

130
Table 5-12. Summary of semi-field (feeding) studies available from the open literature (Apis)1
Test Substance – Purity (Test species)
Exposure Matrix (Exposure Level)
Exposure Dur. (Observ. Dur)
Design Elements
Endpoints Assessed -- (Statistical analysis conducted – Yes/No)
Effects2 (all comparisons made relative to the study’s control)
Limitations2
Classification Citation (MRID Number)
Confidor - not reported (Apis mellifera)
Sucrose (0, 100, 500, and 1000 ppb)
Not reported – although assumed to be single dose given that observations were made at given intervals after exposure study duration was 24 hours (24 hours)
- Single colony isolated from other colonies and bees trained to forage on feeder for observations
Percentage of bees returning to hive after treatment, percentage of bees returning to feeding sites -- (No)
Return to hive: ↓25% (100 ppb, 0-2 hours post-exposure), ↓31% (100 ppb, 4-5 hours post exposure), ↓5.1% (100 ppb, 24 hours post exposure) Return to feeder: ↓90% (100 ppb, 0-2 hours and 4-5 post exposure)
- Purity of test substance not reported - Bees in 500 and 1000 ppb appeared to avoid feeders and were not observed for the duration of the test; - One hive per group precluded statistical analysis; - Unknown impact of these effects to other colony health parameters; - Unknown amount of time that the bees spent at the feeders.
Qualitative Bortolotti, 20034
47800505
IMI - not reported (Apis cerana)
Sucrose (0, 10, 20, and 40 ppb)
Single dose (not reported)
- 90 bees per group in feeder component - 21 bees per group in nectar collection component - 20 bees per group for predator avoidance component
Proportion of bees returning to feeder, average volume of nectar collected, predator avoidance -- (Yes)
Proportion of bees returned to feeder: ↓23% (40 ppb)†; average volume of nectar collected: ↓46% (20 ppb)†, ↓63% (40 ppb)†;
- Majority of the sugar solution was stated by the study authors as having been regurgitated suggesting an unknown dose level the bees were exposed to. - The purity of imidacloprid was not stated - Test species (Apis cerana) is not distributed in North America.
Qualitative Tan, 20144
49719631

131
Test Substance – Purity (Test species)
Exposure Matrix (Exposure Level)
Exposure Dur. (Observ. Dur)
Design Elements
Endpoints Assessed -- (Statistical analysis conducted – Yes/No)
Effects2 (all comparisons made relative to the study’s control)
Limitations2
Classification Citation (MRID Number)
IMI - technical3
(Apis mellifera)
Sucrose (0, 0.15, 1.5, 3.0, and 6 ng a.i/bee)
Single dose (48 hours)
- Subset of bees from a colony were fitted with RFID tags to monitor foraging behavior after single oral dose - 12 bees per dose group - 2 identical trials conducted consecutively
Number of feeder trips, length of foraging trip, time to feeder, time at feeder, time to hive, interval between foraging trips, time of stay inside the hive immediately following treatment -- (Yes)
Number of feeder visits: ↓47% (1.5 ng)†, ↓98% (3 ng)†
- 12 bees per group and two total trials results in limited sample size from which results are based. - High variability for certain endpoints that is likely the result of limited sample size and replication. - Unknown impact of these effects to other colony health parameters particularly since these effects were noted to have been observed immediately after treatment were not present 24 and 48 hours after dose administration.
Qualitative Schneider, 20124
49719629
Length of foraging trip: ↑50% (1.5 ng)†, ↑130% (3 ng)†
Time to feeder: ↑65% (1.5 ng)†, ↑241% (3 ng)†
Time at feeder: ↑25% (1.5 ng)†, ↑46% (3 ng)†
Time to hive: ↑20% (1.5 ng)†, ↑210% (3 ng)†
Interval between trips: ↑33% (1.5 ng)†, ↑993% (3 ng)†
Time inside hive (1st stay): ↑972% (3 ng)†
Time inside hive (2nd stay): ↑33% (1.5 ng)†, ↑1077 (3 ng)†

132
Test Substance – Purity (Test species)
Exposure Matrix (Exposure Level)
Exposure Dur. (Observ. Dur)
Design Elements
Endpoints Assessed -- (Statistical analysis conducted – Yes/No)
Effects2 (all comparisons made relative to the study’s control)
Limitations2
Classification Citation (MRID Number)
IMI – technical (Apis mellifera ligustica)
Sucrose (0, 24, and 241 ppb for sucrose response; 0 and 24 ppb for dancing behavior)
Single dose (1 hour for SRT, 24 hours for dancing behavior)
- 314 nectar foragers and 209 pollen foragers used for SRT component - 65 bees used for dancing behavior component
- SRT (lowest sucrose concentration that bees would elicit complete PER) -Dancing behavior (number of dance circuits) -- (Yes)
Nectar forager SRT: ↑78% (24 ppb)†, ↑81% (241 ppb)† Pollen forager SRT: ↑206% (241 ppb)†
- It was unclear whether the entire dose was consumed; - Mean % sucrose response threshold (minimum percent sucrose to elicit a proboscis extension response) noted to be highly variable with %CV values of 143% and 224% for control nectar and pollen foragers, respectively. - Although the authors state that the objective of the dancing behavior component was to examine the effects of imidacloprid metabolites, residues are not identified and/or measured. - Unknown impact of these effects to other colony health parameters.
Qualitative Eiri and Nieh4, 2012

133
Test Substance – Purity (Test species)
Exposure Matrix (Exposure Level)
Exposure Dur. (Observ. Dur)
Design Elements
Endpoints Assessed -- (Statistical analysis conducted – Yes/No)
Effects2 (all comparisons made relative to the study’s control)
Limitations2
Classification Citation (MRID Number)
IMI - not reported (Apis mellifera mellifera)
Sucrose (0-unfed, 0-fed), 0.5, and 5 ppb)
34 days (7 months, including overwinter)
- Unfed control group relied exclusively on forage - 8 colonies/trt - 7 colony condition assessments
Mortality, egg laying, activity index(bees per min entering hive), capped brood area, hive weight, adult population, disease and parasite incidence -- (Yes)
Number of frames of capped brood area : ↑14% (0.5 ppb)†; ↓34% (5 ppb)†
- Purity of imidacloprid not reported - Results refer to after overwintering period and comparisons made to fed (sucrose) control (not clear from study whether different from unfed control)
Qualitative Faucon, 2005 47523406

134
AdmirePro – not reported (not reported)
Pollen (0, 5, and 20 ppb)
12 weeks (5 months from exposure start to last CCA (mid-October, colonies were then over-wintered)
- 10 replicate colonies per group - October 15 was last CCA - Limited space in nucleus hives and supplemental feeding was not provided
Egg-laying activity, larvae development, food consumption, amount of pollen collected, total foragers returning to hive, percentage of foragers with pollen pellets, nectar station visits -- (Yes)
Nectar station visits: ↓35.7% (5 ppb)†, ↑13.1% (20 ppb)
- Unknown confounding effect of queen replacement and food/brood removal frame removal - For the foraging trials, numbers of marked bees are provided but this represents a small (approximately 2-4% of the total numbers exposed) - Unknown confounding effect of queen replacement and food/brood removal frame removal; - For the foraging trials, numbers of marked bees are provided but this represents a small (approximately 2-4% of the total numbers exposed); - No way to confirm the lack of potential for exposure to other sources of imidacloprid or neonicotinoids in the surrounding area or where the imidacloprid in the control colonies came from. The study area was noted to have been surrounded by corn that may have been seed treated with neonicotinoids.
Qualitative Dively, 2009 (47775502)

135
Test Substance – Purity (Test species)
Exposure Matrix (Exposure Level)
Exposure Dur. (Observ. Dur)
Design Elements
Endpoints Assessed -- (Statistical analysis conducted – Yes/No)
Effects2 (all comparisons made relative to the study’s control)
Limitations2
Classification Citation (MRID Number)
Admire Pro – 42.8% (not reported)
Pollen (0, 5, 20, and 100 ppb
12 weeks (10 months from exposure start to last CCA (mid-March)
- 10 replicate colonies per group, each blocked in groups of 2 across 5 apiary locations - Pollen traps installed at each entrance to direct bees to feed on spiked pollen patties -Residue analysis conducted confirmed presence in pollen patties (5.5, 19.8, and 97.5 µg/kg for the 5, 20, and 100 µg/kg groups, respectively)
Queen event (manual replacement or natural supersedure), disease presence and incidence (Varroa and Nosema), mean colony size, mean amount of pollen collected, percentage of total frame covered for bees, capped brood cells, capped honey, beebread, drawn out cells (defined by study as empty, cleaned out cells), overwintering survival -- (Yes)
2009 Trial: Overwintering survival: ↓25% (100 µg/kg)† Percentage of total frame coverage by capped honey: ↑65% (100 µg/kg) 2010 Trial: Percentage of total frame coverage by capped honey: ↑125% (100 µg/kg)
- In the 2009 trial, mean Varroa mite levels were 7.1, 8.8, 6.6, and 13.3 mites per 100 bees in the control, 5, 20, and 100 ppb treatment groups, respectively but there was no mention of treatment. It is noted however that overwintering success in this trial was 100% in the control group. - In the 2010 trial, queen events were collapsed for the control and 5 ppb levels in one metric and for the 20 and 100 ppb groups in another. It is unclear if more queen events occurred in the control or 5 ppb group. - Control overwintering survival in the 2010 trial was 57% which renders results from this trial uncertain in discriminating treatment related effects - Survival data were pooled in the 2009 and 2010 trial despite 100% control survival in 2009 and 57% in 2010.
Qualitative Dively, 2015
IMI: imidacloprid; PER: Proboscis extension response; RFID: radiofrequency identification; CCA: colony condition assessment, SRT: sucrose response threshold
136
†Indicates effect was statistically significant (p<0.05). 1Most studies not associated with NOAEC/LOAEC values. Reported is the most sensitive statistically derived or otherwise observed difference relative to the control. 2Only subset of limitations are listed here. Others associated with this study can be found with the study summaries in Appendix D. 3Although not explicitly stated in the article, personal communication with the author (email dated 01/29/15) indicates that imidacloprid was of technical grade. 4 These studies, while assessing endpoints that could potentially impact colonies, are not of a feeding design in the traditional sense in that bees are exposed to a single dose

137
Mortality (inclusive of worker/forager and colony overwintering): There were 3 studies which included either worker or colony mortality (or survival) as a response variable. With these studies, exposure to imidacloprid through spiked nectar, pollen, or following seed treatment applications generally did not appear to have an overall impact on worker or overall colony survival when compared to the control with the exception of colonies provided imidacloprid in spiked pollen at 100 µg/kg (Dively 2015). The registrant-submitted colony feeding study (technical imidacloprid, 6 week exposure, 12.5, 25, 50, 100, and 200 µg a.i/L groups, overwintering component) showed an erratic dose response (18, 9, 36, 91, and 82% overwintering mortality for the treatment groups, respectively) for overwintering mortality and when compared to 36% overwintering mortality in the control group, inferences made about treatment-related overwintering mortality at the lower groups (12.5, 25, and 50) are uncertain. In Faucon, 2005, (sucrose feeding study design, 0.5, and 5 ppb treatment groups, 34-day exposure, overwintering component), the study authors did not subject the mortality data to statistical analysis as it was stated that daily mean mortality was low with means of 3.1, 4.4, 4.3, and 3.3 for the unfed control group, untreated sucrose control, 0.5 and 5 ppb imidacloprid groups, respectively. These data corresponded to a period that included the entire 34-day exposure phase as well as the 16-day interval just after exposure ended. For overwintering success, colonies were scored by the number of frames with brood combined with frames of adults. The colonies were scored the March after exposure began (previous July) and there was no significant differences (p>0.05) in the treated groups from that of both control groups. Dively, 2015 (formulated imidacloprid, pollen feeding study design, 5, 20, and 100 ppb treatment groups, 12-week exposure period, overwintering component) included two years of feeding study trials (2009 and 2010) with separate colonies and exposures taking place each year. In the 2009 trial, there was a significant (p<0.05) reduction at the 100 µg /kg [spiked pollen] group (mortality in 2/8 colonies as compared to 0/10 colonies in the control (two colonies in the 100 µg/kg group were terminated in early September by the study authors after the colonies underwent natural supersedure (queen replacement) and the researcher determined that the colonies were no longer healthy enough to survive overwintering). In the 2010 trial, there were no treatment-related effects on colony overwintering but it is noted the control group for this trial had 57% survival. Effects on presence of various life stages: The same 3 studies discussed above for mortality also assessed the impact of imidacloprid exposure to the presence of various life stages within the hive. Additionally, Dively, 2009 (pollen exposure, 5 and 20 ppb treatment groups, 12-week exposure phase, no overwintering component) examined the presence of various life stages within the hive. While not every study examined the same life stages and route of exposure, there was generally no impact on the presence of different life stages up to and including the highest treatment concentrations assessed (20 µg a.i/L in sucrose, 100 µg/kg in pollen). By contrast, the registrant-submitted colony feeding study determined significant reductions in the numbers (as percentage of frame coverage within the hive) of adults, eggs, and capped brood (pupae) at the three highest treatment groups (50, 100 and 200 µg a.i/L). These effects were usually observed following

138
exposure and sustained through the duration of the study including after overwintering (100 and 200 µg a.i/L groups) but other effects were determined during exposure, showed recovery to the level of the control group following exposure, but were again reduced after the overwintering period (50 µg a.i/L group). Faucon, 2005 did not determine significant effects (p>0.05) to percent frame coverage of adults and eggs up to and including the highest treatment group (5 ppb in sucrose). The capped brood (pupae) coverage response changed depending on the interval considered. When considering the exposure duration interval as well as exposure phase plus 3 weeks post-exposure phase, there were no significant effects determined (p>0.05). However, after the overwintering period, there were significant effects on the number of frames with capped brood area (p<0.05) although these effects were not dose-responsive (14% increase at 0.5 ppb group, 34% decrease in the 5 ppb group). While the route of exposure was distinct from Schmuck, 2001 and Faucon, 2005, there were no significant effects (p>0.05) determined in both Dively, 2009 and Dively, 2015 on percent frame coverage of adults, eggs, and capped brood (pupae). While there was a dose-responsive increase of 27, 35, and 51% (for the 5, 20, and 100 µg/kg treatment groups, respectively, the different treatments were not statistically significant, p>0.05) in the coverage of capped brood cells in the 2010 trial of Dively, 2015 for observations made at a mid-August CCA. In the subsequent early October CCA, these observations did not indicate a treatment-related effect (↑8%, ↓15%, no change, for the 5, 20, and 100 ppb groups, respectively). Foraging behavior/foraging success observations: As noted previously, the majority of the available Tier II open literature studies with Apis include some measure of foraging behavior (numbers of foraging trips, time spent on trips, durations of trips) and success (amount of pollen and nectar collected). While some studies include foraging measurements with other colony health parameters in an attempt to link these effects to short- or long-term colony success, other studies assess foraging endpoints only. With the latter case, there is uncertainty in the impact of these effects on the success of the colony. As mentioned previously, the registrant-submitted colony feeding study did not include foraging endpoints. It was previously mentioned that a subset of the studies examining foraging endpoints involved a single oral exposure for individual bees as opposed to a sustained exposure to colonies with spiked sucrose or spiked pollen provisions. While Bortolotti, 2003 does not specify the duration of exposure, as the study was 24 hours in duration with endpoints made in pre-defined intervals after exposure, it was assumed to be a single oral dose. In Bortolotti, 2003 (formulated imidacloprid, 100, 500, and 1000 ppb treatment groups, duration of exposure not reported), there were decreases ranging from 25-31% of bees returning to the hive from directly after exposure to 5 hours post exposure in the 100 ppb group. After 24 hours, this effect was reduced to 5.1%, suggesting a recovery of orientation after imidacloprid exposure ceases. Reductions to the number of bees returning to a sucrose feeder were observed to be 90% as compared to the control group at both the 0-2 and 4-5 hours after exposure intervals (no statistical analysis conducted on the results). There was no 24-hour post-exposure observation for this endpoint. Bees in the 500 and 1000

139
ppb groups were not seen returning to the hive or feeder and therefore no further data were collected. It is noted that 500 and 1000 ppb are markedly high concentrations that for a study investigating sublethal effects on foraging behavior and success. Tan, 2014 (spiked sucrose, 10, 20, and 40 ppb treatment groups, single oral exposure) similarly investigated the numbers of bees retuning to a feeder provided in the field. There was a 23% reduction (p<0.05) in the number of bees returning to the feeder at the 40 ppb group. Additionally, the mean amount of nectar collected was significantly decreased (p<0.05) from the level of the control in the 20 and 40 ppb treatment groups (↓46% and ↓63%, respectively). Schneider, 2012 (technical imidacloprid, 0.15, 1.5, 3, and 6 ng a.i/bee, RFID tagging) determined significant reductions (p<0.05) in number of feeder visits (↓47 - 98%), and significant increases (p<0.05) in length of foraging trips (↑50 – 130%), time to feeder (↑65 – 241%), time at feeder (↑25 – 46%), time to hive (↑20 – 210%), and interval between trips (↑33 – 993%). It is noted that these effects were observed immediately after treatment and were not observed 24 and 48 hours after treatment which corroborate to some extent the results of Bortolotti, 2003. Finally, in Eiri and Nieh, 2012, individual honey bees that were exposed to a single oral dose of either 24 or 241 ppb in sucrose and subsequently assessed in a sucrose response threshold, which is defined as the lowest concentration of sucrose which will elicit a proboscis extension response (PER) in honey bees. The results indicated that there was a dose-responsive increase in the sucrose response threshold with increasing dose, indicating higher concentrations were needed to elicit a PER. No other response variables were assessed in this study. Several studies also examined the amount of nectar and pollen collected. In the Dively studies (2009 and 2015) that had a pollen feeding study design, a variety of foraging endpoints were assessed. In Dively 2009, while there were no significant effects (p>0.05) on the amount of pollen collected and percentage of foragers with pollen pellets, there was a significant (p<0.05) reduction from control in the number of nectar station visits at the 5 ppb group, although this response was a non-significant increase of 13.1% at the 20 ppb group. In Dively 2015, there were no effects on the amount of pollen collected (increases from control ranged from 14 – 32% but were not significant and not dose-responsive). Summary: This discussion illustrates that for the available set of higher-tier studies from the open literature, effects on colony health parameters such as overwintering survival, worker/forager mortality, and presence of various life stages (as percentage of frame coverage within the hive), were not determined at levels in spiked sucrose up to and including 40 ppb, and in levels of pollen up to and including 20 ppb. The latter statement is based only on two available pollen exposure studies (Dively, 2009 and Dively 2015), but there was a significant reduction in overwintering survival at the 100 ppb group in one of the two trial years. For foraging measurements in which a single oral dose was administered to individual bees (Bortolotti 2003, Eiri and Nieh 2012, Schneider 2012, and Tan 2014), significant effects on orientation (bees returning to feeder, time to and at feeder, length of foraging trips) were observed at concentrations in sucrose as low as 1.5 ng a.i/bee. These effects were noted immediately following oral exposure and were not observed 24 hours after exposure. For the colony-level feeding studies, there were no effects up to an including 5 ppb in sucrose and 20 ppb in pollen. For effects on pollen and nectar collection, there were

140
no effects in spiked sucrose feeding studies up to and including 20 ppb and up to and including 100 ppb in spiked pollen. This summary is based on the results of a small number of studies and therefore there is uncertainty as to whether levels of imidacloprid in nectar and pollen above or below the concentrations described above could potentially impact the overall health of a colony following continuous exposure. There are no data at this time to link impaired foraging behavior of individual bees as a result of acute exposure to relatively low doses of imidacloprid to impaired colony condition. Bombus Summary of Tier II Bombus Studies from the Open Literature There were a total of 2 Tier II studies (tunnel design, one of which also had a full-field Tier III component) and 8 feeding design studies to characterize the colony-level effects on bumble bees (i.e. various species of Bombus). Two of the Tier II feeding design studies originate from the same dataset (i.e. Gill 2012 and Gill and Raine 2014), with Gill and Raine 2014 re-analyzing a subset of the 2012 data (foraging measurements). As with the higher-tier Apis open literature studies, exposure duration, concentrations tested, and endpoints assessed varied across the 10 studies. There are a few points worth noting:
1. While workers and the queen bee undergo overwintering in honey bee colonies, and subsequently build up again the following spring, only the Bombus queen overwinters. Therefore, there was no overwintering component included in any of the open literature Bombus studies as distinguished from Apis.
2. Colonies of Bombus are much smaller than those of Apis and typically range from several dozen to several hundred bees at most. In contrast, Apis colonies consist of thousands of bees and can reach sizes up to several tens of thousands. It is therefore expected to some extent that Apis colonies are able to compensate for greater losses of their adult population before colony failure as compared to Bombus.
3. Some Bombus studies are conducted with microcolonies. Microcolonies are queen-less units of a few worker bumble bees where one individual eventually becomes dominant and starts laying unfertilized eggs that will eventually become drones (males).
Table 5-13 below summarizes key elements and findings from the Bombus higher tier studies that were evaluated from the open literature.

141
Table 5-13. Summary of semi-field (Tunnel) studies available from the open literature (Bombus) Test Substance Purity (Test species)
Crop (App. Rate)
Exp. Dur. (Observ. Dura)
Design Elements
Endpoints Assessed (Statistics analysis conducted? – Yes/No)
Effects2 (all comparisons made relative to the study’s control)
Limitations3
Classification Citation (MRID Number)
Gaucho – not reported (Bombus terrestris)
Sunflower (0.7 mg a.i/seed)
4 days (4 days)
- One tunnel per treatment group - 75 total workers observed for foraging measurements
Number of workers visiting blooming heads, number of workers with ‘short’ foraging trips, number of bees with ‘long’ foraging trips1
--
(Yes)
Numbers of visits: ↑36%, Workers with ‘long’ foraging trips: ↑60%
- Insufficient demonstration of exposure as study authors cite unpublished data from nectar samples of sunflowers in greenhouse used for this study. - Small sample sizes that were subject to statistical analysis for foraging data. - Minimal information on the husbandry the bees used.
Qualitative Tasei 2001 (47800503)
Merit 0.5 G – not reported (Bombus impatiens)
Turf with 25-50% flowering white clover (0.4 lbs a.i/A)
28 days (28 days)
- 5 plots (3m x 5m per group - 1.5 cm of irrigation following exposure - 1 colony per plot
Colony weight, worker weight, queen weight, number of workers, number of brood chambers, number of honey pots, time to initial defense response, duration of defense response, number of bees responding -- (Yes)
Number of workers: ↓26%, Time to initial defense response: ↓76%, Number of brood chambers: ↑75%
- Method used for defense response has not been formally standardized to determine its sensitivity - It was noted that variability for some endpoints was high, especially in the data for the 0.5 G experiment, which could explain the statistical methods failing to detected high (over 70% reductions and increases from the level of control). - 28 exposure period in a flight cage is longer than the 10-14 days recommended by OECD semi field tests for honey bees. It is unknown how adaptable bumble bees are to this length of confinement.
Qualitative Gels, 2002 47796308 Merit 75
WP – not reported (Bombus impatiens)
Turf with 25-50% flowering white clover (0.3 lbs a.i/A)
- 5 plots (3m x 5m per group (control, spray w/ irrigation, spray w/ no irrigation) - 1 colony per plot
Colony weight (↓54%)†, worker weight (↓56%)†, number of workers (↓60%)†, number of brood chambers (↓87%)†, number of honey pit (↓72%)†, time to initial defense response (↓67%)†, duration of defense response (↓73%)†, number of bees responding (↓77%)†
†Indicates effect was statistically significant (p<0.05).

142
1’Short’ trips defined by study author to be 1-50 seconds and ‘long’ trips defined to be >50 seconds 2Not all studies were associated with NOAEC/LOAEC values. Reported is the most sensitive statistically derived or otherwise observed difference relative to the control. 3Limitations considered to be major listed here. Others associated with this study can be found with the study summaries in Appendix D.

143
Table 5-14. Summary of semi-field (feeding) studies available from the open literature (Bombus) Test Substance – Purity (Test species)
Exposure Matrix (Exposure Level)
Exposure Dur. (Observ. Dur)
Design Elements
Endpoints Assessed -- (Statistical analysis conducted – Yes/No)
Effects2 (all comparisons made relative to the study’s control)
Limitations3
Classification Citation (MRID Number)
Confidor – 20% (Bombus terrestris)
Sucrose – component 1 and 2 (0, 10, 20, 200, 20000, and 200000 ppb; component 3 (0, 2, 10, and 20 ppb)
Component 1 and 2: – 11 weeks; Component 3: – 2 weeks (11 weeks and 2 weeks, respectively)
Components 1 and 2: - microcolony (4 colonies with 5 workers each housed in cages for 11 week exposure Component 3: - queen right colonies (25 bees per colony, 1 per group) in 2 week greenhouse exposure
Component 1: mortality, reproduction (total amount of brood produced) Components 2 and 3: mortality, reproduction, and foraging behavior -- (Yes)
Component 1: Mortality: 100% in 200, 2000, 20000, and 20000 ppb†; Reproduction: no reproduction at these doses† Component 2: Mortality: 50% in 20 ppb, 100% in 200, 2000, 20000, and 200000 ppb† Reproduction: ↓62% (10 ppb)†, ↓75% (20 ppb)†, ↓83% (200 ppb)† Component 3: Mortality: 62% (10 ppb)†, 92% (20 ppb)† Reproduction: no reproduction at 10 and 20 ppb groups
- There was no analytical confirmation of imidacloprid in the treatment solutions - Control performance was not reported in component 1 and component 2 of the study
Qualitative Mommaerts, 2010 48151502
IMI – technical grade (Bombus terrestris)
Sucrose (0 and 10 µg a.i/L)
4 weeks (4 weeks)
- 10 colonies per group of control, IMI, λ-cyhalothrin (spray treatment), and mix of two - Colonies housed in laboratory but allowed to freely
Mean worker mortality, % workers getting lost, % worker loss + mortality, % sucrose consumption, pollen foraging size, number of workers/colony, number of foragers/colony, brood production, queen loss, nest structure mass, colony failure, number
%workers getting lost (↑50%)†, %worker loss+mortality (↑37%), number of workers/colony (↓27%)†, number of foragers/colony (↑150%)†, brood production/colony (↓22%)†, pollen load score/foraging worker
- Vulnerability of small size colonies may differ from that of larger colonies; - The protozoan Crithidia bombi was found in 55% of the colonies although there was no treatment-
Qualitative Gill, 2012 49719618

144
Test Substance – Purity (Test species)
Exposure Matrix (Exposure Level)
Exposure Dur. (Observ. Dur)
Design Elements
Endpoints Assessed -- (Statistical analysis conducted – Yes/No)
Effects2 (all comparisons made relative to the study’s control)
Limitations3
Classification Citation (MRID Number)
forage outside through connecting tube - Foraging observations recorded with RFID tags
of foraging bouts/colony, pollen load score/foraging worker, pollen load score/successful foraging bout, % foraging bouts/forager that returned with pollen, duration of pollen bouts -- (Yes)
(↓31%)†, %foraging bouts/forager that returned with pollen (↓28%)†, duration of pollen bouts (↑18%)†
related effect in the incidence of the disease among the bumble bees. - No analytical confirmation of treatment concentrations
IMI – technical grade (Bombus terrestris)
Sucrose (0, 0.08, 0.20, 0.51, 1.28, 3.20, 8.0, 20.0, 50.0, and 125.0 µg a.i/L
13 days (14 days)
- Micro-colonies (4-5 workers, no queen) established to examine effects on ovary development and reproduction - Varying number of replicates for each concentration
Fecundity (number of eggs and larvae produced), food consumption, and oocyte development -- (Yes)
Fecundity: ↓42% at 1 µg a.i/L.
- Unknown relevance of reproductive effects on workers for effects to colony health given that worker production of males is generally much less of the colony male output and workers cannot produce new workers or new queens - No analytical confirmation of treatment concentrations
Qualitative Laycock, 2012 49719622

145
Test Substance – Purity (Test species)
Exposure Matrix (Exposure Level)
Exposure Dur. (Observ. Dur)
Design Elements
Endpoints Assessed -- (Statistical analysis conducted – Yes/No)
Effects2 (all comparisons made relative to the study’s control)
Limitations3
Classification Citation (MRID Number)
IMI – technical grade (Bombus terrestris)
Sucrose (of 0, 0.06, 0.16, 0.40, 1.0, 2.5, 6.3, 16, 39, and 98 ppb
14 days or 28 days (14 days or 28 days)
- 3 queenright colonies (1 queen, 4 workers) per group for 14-days on dose followed by 14-days of off dose (unspiked syrup) - Study consisted of the results of the two trials pooled - Continuous exposure of 1 group (5 colonies) to 98 ppb for 28 days (7 colonies for control)
Brood production, time to first oviposition, pollen consumption, sucrose consumption -- (Yes)
Brood production: 14-day on-dose EC50: 1.44 ppb, 28-day (on/off dose) EC50: >98 ppb Pollen consumption: 14-day on-dose EC50: 4.4 ppb, 28-day (on/off dose) EC50: 44 ppb
- Long-term impacts of decreased brood production on other colony health parameters like queen loss and worker mortality were not investigated
Qualitative Laycock and Cresswell, 2013 49719621

146
Test Substance – Purity (Test species)
Exposure Matrix (Exposure Level)
Exposure Dur. (Observ. Dur)
Design Elements
Endpoints Assessed -- (Statistical analysis conducted – Yes/No)
Effects2 (all comparisons made relative to the study’s control)
Limitations3
Classification Citation (MRID Number)
IMI – technical grade (Bombus terrestris)
Sucrose (0 and 10 µg a.i/L)
6 weeks (6 weeks)
- 8 queen-right colonies in each group - Colonies were kept in cages within the laboratory for the entire duration of the study - Data informed the Sublethal Stress Model development (developed by the study authors)
Mortality, brood production -- (No)
Mortality (day 0-42) (↓2.56%), birth rate (day 0-42) (↓71.3%)
- Control mortality differed substantially between the 8 colonies, ranging from 9-38%, and above 25% in 5 of 8 colonies. As this study was conducted in the laboratory, this is suggestive of general husbandry issues; - Although there appeared to be sufficient replication among the treatment groups, the results were not subjected to statistical analysis by the study authors. - No analytical confirmation of treatment concentrations
Qualitative Bryden, 2013 49719607

147
Test Substance – Purity (Test species)
Exposure Matrix (Exposure Level)
Exposure Dur. (Observ. Dur)
Design Elements
Endpoints Assessed -- (Statistical analysis conducted – Yes/No)
Effects2 (all comparisons made relative to the study’s control)
Limitations3
Classification Citation (MRID Number)
IMI – technical grade (Bombus terrestris)
Sucrose (0 and 10 µg a.i/L)
4 weeks (4 weeks)
- Same methodology used in Gill 2012 - Temporal analysis of the foraging data of Gill 2012 assessing week-by-week results.
Number of foragers, foraging bouts, foraging bout duration, pollen load size from all foraging bouts, pollen load size from successful foraging bouts, successful pollen foraging bout duration -- (Yes)
Number of foragers (↑ for all intervals/sampling times)†, foraging bouts (↓ - week 2 only)†, pollen load size from all foraging bouts (↓ - week 4 only)†, successful pollen foraging bout duration (↑ - week 4 only)†
Same limitations as those identified in Gill 2012
Qualitative Gill and Raine, 2014

148
Test Substance – Purity (Test species)
Exposure Matrix (Exposure Level)
Exposure Dur. (Observ. Dur)
Design Elements
Endpoints Assessed -- (Statistical analysis conducted – Yes/No)
Effects2 (all comparisons made relative to the study’s control)
Limitations3
Classification Citation (MRID Number)
IMI – technical grade (Bombus terrestris)
Sucrose (0, 0.7, and 1.4 ppb – ‘low group’); Pollen (0, 6, and 12 ppb – ‘high group’)
14 days – lab (6 weeks in field)
- 25 colonies per group (mean 15 bees per colony) - Colonies provided spiked sucrose and spiked pollen simultaneously in lab for 2 weeks - Moved to field (with mixed farmland) for 6 week observation period
Colony weight, mean numbers of life stages (workers, males, pupae, and empty pupal cells), mean number of queens produced -- (Yes)
Colony weight: ↓8% (‘low group’)†, ↓12% (‘high group’)†, Number of queens produced: ↓85% (‘low group’)†, ↓90% (‘high group’)†
- No analytical verification of imidacloprid in nectar and pollen - It would have been informative to have a measure of food consumption or whether the pollen and nectar stores had to be replenished at any time during the 14-day exposure -Although the authors suggest that imidacloprid may have reduced foraging efficiency in the treated colonies, this study did not include any response variables to evaluate foraging efficiency
Qualitative Whitehorn, 2012 49719634

149
Test Substance – Purity (Test species)
Exposure Matrix (Exposure Level)
Exposure Dur. (Observ. Dur)
Design Elements
Endpoints Assessed -- (Statistical analysis conducted – Yes/No)
Effects2 (all comparisons made relative to the study’s control)
Limitations3
Classification Citation (MRID Number)
IMI – not reported (Bombus terrestris)
Sucrose: (0, 0.7 ppb); Pollen: ( 0 and 6 ppb)
14 days – lab (4 weeks in field)
- 3 colonies per group (65 bees per colony) - Colonies observed after exposure in area described as urban garden area with nearest farmed area 0.5 miles away
Colony survival, weight of nectar collected/foraging bout, nectar foraging efficiency, weight of pollen collected, pollen foraging efficiency -- (Yes)
Weight of pollen collected: ↓28%†, pollen foraging efficiency: ↓31%†
- Purity of imidacloprid not reported - Analytical verification of imidacloprid in spiked pollen and nectar was not conducted
Qualitative Feltham, 2014 49719617
IMI = imidacloprid; RFID = radiofrequency identification; †Indicates effect was statistically significant (p<0.05). 2Not all studies were associated with NOAEC/LOAEC values. This column will report the most sensitive statistically derived or otherwise observed difference from that of the control. 3Limitations considered to be major listed here. Others associated with this study can be found in the study summaries in Appendix D.
150
There were 4 feeding design studies that assessed worker bumble bee mortality. Mommaerts, 2010 (formulated imidacloprid, spiked sucrose) tested both microcolonies (5 bees) and queen-right colonies (25 bees) for 11 week and 2-week exposure durations, respectively. In one microcolony trial, there was 100% mortality in the 200, 2000, 20000, and 200000 ppb treatment groups while mortality was not significantly reduced (maximum reduction of 15% from control) at the 10 and 20 ppb groups. In a second trial with the same treatment groups but an additional experimental chamber to evaluate foraging, there was again 100% mortality in the top 4 groups with 50% mortality in the 20 ppb. For queen-right colonies (2, 10, and 20 ppb treatment groups), mortality was significantly increased over the control at the 10 and 20 ppb groups (↑62 – 92%, respectively). It is not clear why the queen-right colonies were determined to be more sensitive to lower concentrations and for shorter durations as compared to the queenless microcolonies. In Gill, 2012 (technical imidacloprid, spiked sucrose, 10 µg a.i/L, 4 week exposure), there was no significant (p>0.05) impact on worker mortality determined. Bryden, 2013 (technical imidacloprid, spiked sucrose, 10 µg a.i/L, 6-week exposure period) observed a 2.6% reduction in survival (no statistical analysis conducted) from the control. In Feltham, 2014 (spiked sucrose – 0.7 ppb, and spiked pollen – 6 ppb, 14-day exposure), 92% of exposed colonies in the treatment group (both food provisions available simultaneously) survived until the end of the 4-week post-exposure observation period in the field. Effects on numbers of various life stages: There was one semi-field tunnel design study and 2 semi-field feeding design studies that investigated effects on various life stages of bumble bees. In Gels, 2002 (formulated imidacloprid, 28-day exposure period in flight cage) bumble bee colonies were placed in flight cages following either granular or spray application to turf. For the granular application (0.4 lbs a.i/A of Merit® 0.5 G), there were no significant effects (p>0.05) determined although the number of workers decreased by 26% and the number of brood chambers increased by 75% relative to the control. There was high variability in the responses for this component of the study with statistical methods used failing to identify percent differences of 70% and above. In the spray application component (0.3 lbs a.i/A Merit® 75 WP), there were significant (p<0.05) decreases in the numbers of workers (↓60%) as well as the number of brood chambers (↓72%). Interestingly, these differences were identified when spray application were not followed by irrigation; however, when irrigation was administered, there were no significant differences from the control group. In Gill, 2012, there was a significant reduction (p<0.05) in the number of workers per colony (↓27%) following a week exposure to 10 µg a.i/L. Finally, Whitehorn, 2012 (technical imidacloprid, spiked sucrose – 0.7 and 1.4 and spiked pollen – 6 and 12 ppb co-exposure, 14-day exposure period) did not identify significant effects (p>0.05) on the numbers of workers, males, and pupae. Effects on reproduction (brood and queen production) There were 6 feeding design studies (4 spiked sucrose studies, 2 with co-exposure of spiked sucrose and spiked pollen) and one full-field study that assessed endpoints related to reproduction. In Mommearts, 2010 in addition to no reproduction at the concentrations which elicited 100% mortality in the microcolony trials, there was no reproduction in the 10 and 20 ppb groups for the queen-right colony trial. Reproduction was not significantly impacted (p>0.05) at 2 ppb. Gill, 2010 found a significant (p<0.05) 22% reduction in brood production as compared to the control group. Laycock, 2012 (technical imidacloprid,

151
spiked sucrose, concentrations ranging from 0.08 – 125 µg a.i/L, 13-day exposure period) tested microcolonies (4-5 workers each) and determined a 42% reduction in fecundity at a concentration of 1 µg a.i/L. Whitehorn. 2012 exposed queen-right colonies (25 per treatment) for 14 days in the laboratory followed by a 6 week observation period in the field. The number of queens produced was significantly reduced by 85 and 90%, for the “low” (6 ppb/0.7 ppb pollen/sucrose) and “high” (12ppb/1.2 ppb pollen/sucrose) fed groups, respectively. As shown in Figure 5-3, it is evident that queen production is highly variable in the control B. terrestris colonies, with the bulk of new queens coming from 5 colonies. These same 5 control colonies were also the largest in terms of overall weight (data not shown), which supports the hypothesis that queen production is dependent on colony size of B. terrestris. It is also noteworthy that 48% of the control colonies did not produce queens whereas 88% and 68% of the low and high exposure groups, respectively. It is not known whether the failure of 48% of the control hives to produce new queens reflects “normal” development and queen production in natural B. terrestris colonies in the field. Nevertheless, it is evident that colonies failed to produce large number of queens in the low and high exposed treatments, relative to controls.

152
Figure 5-3. Queen Production Data from Whitehorn et al (2012) in Controls (A), Low (B) and High Exposure Treatments (C). Legend numbers indicate the concentration in pollen and nectar, respectively. In Bryden, 2013, there was a 71% reduction in brood production the sole treatment group of 10 µg a.i/L (statistical analysis not conducted). In Laycock and Cresswell, 2013 (technical imidacloprid, spiked sucrose, concentrations ranging from 0.06 – 98 µg a.i/L), queen-right colonies (1 queen, 4 workers) were exposed to imidacloprid spiked sucrose for 14 days followed by 14 days of observation while colonies were fed untreated sucrose. When assessing the exposure only interval, the EC50 for brood production was 1.44 µg a.i/L, a similar finding of Laycock 2012. When assessing the entire 28-day duration (including the 14-day ‘off dose’ period) the EC50 was determined to be >98 ppb, suggesting a recovery in brood production after exposure to imidacloprid ceases. Finally, in Tasei, 2001, there were 17 and 24 queens per colony in the control and treatment fields, respectively, and the difference was not statistically significant (p>0.05). Foraging behavior/foraging success observations: There was one semi-field tunnel design study and 3 semi-field feeding design studies evaluated for Bombus that assessed endpoints related to foraging behavior and success. In Tasei, 2001 (0.7 mg a.i/sunflower seed), while the effects were not statistically significant (p>0.05) there increases in the number of workers visiting blooming heads of seed treated sunflowers (↑36%), and the number of ‘long’ foraging trips (characterized by the study authors as being longer than 50 seconds). In Gill, 2012 (sucrose exposure to 10 µg a.i/L), the study authors used radio frequency identification (RFID) tags to obtain various measures of foraging behavior and success. There were significant increases (p<0.05) in the numbers of foragers per colony (↑150%) and the duration of pollen foraging trips (↑18%), as well as significant decreases (p<0.05) in pollen load score (amount of pollen collected relative to the size of the worker) (↓31%), and the number of foraging trips that returned with pollen (↓28%). The results of this study were collected over a 4-week exposure duration. In follow up work by Gill and Raine, 2014, the foraging data were analyzed more temporally (i.e. week-by-week) as opposed to collapsing the entire 4-week study duration. While means of the response variables were not provided, there were significant (p<0.05) increases in the number of foragers (all intervals assessed), and the duration of pollen foraging trips (week

153
4 only) at the sole treatment concentration of 10 µg a.i/L. Additionally, there were significant decreases (p<0.05) in the number of foraging trips (week 2 only), and the pollen load size from all foraging trips (week 4 only). Finally, in Feltham, 2014, colonies were evaluated for the weight of nectar and pollen collected as well as efficiency (weight collected per hour). While there were no significant effects on nectar variables, the weight and foraging efficiency for pollen were significantly decreased (p<0.05), ↓28% and 31%, respectively at the sole treatment group of 0.7 ppb in nectar and 6 ppb in pollen. Summary: The suite of evaluated higher-tier studies with the Bombus suggest that impacts to reproductive endpoints and measures of foraging behavior and success occur at lower concentrations in sucrose and pollen than those that elicit effects on mortality (as supported by Gill, 2012, Mommaerts, 2010, Laycock, 2012, Laycock and Cresswell, 2013, Whitehorn, 2012, and Bryden, 2013). In these studies, effects to reproduction (inclusive of worker and queen production) occurred at sucrose levels as low as 0.7 ppb and pollen levels as low as 1.4 ppb. Interestingly, queen-right colonies of bees exposed for 2 weeks appeared more sensitive to effects on mortality (62 and 92% reductions at concentrations of 10 and 20 ppb) compared with 11-week exposure periods with queenless microcolonies (0 and 15% mortality in 10 and 20 ppb; 0 and 50% mortality in 10 and 20 ppb for two trials, respectively). However, the effects on fecundity when microcolonies and queen-right colonies exposed to similar concentrations of imidacloprid appear to be similar as suggested by work by Laycock (2012 and 2013) with microcolonies showing a 42% reduction in fecundity at 1 ppb while queen-right colonies showed a 50% decrease in brood production at 1.44 ppb. The impact at 1.44 µg a.i/L identified by Laycock and Cresswell (2013) was determined after a 14-day exposure period. These colonies were subsequently observed a further 14 days feeding on untreated syrup and when the entire 28-day study duration interval is considered, there were no significant effects on brood production up to and including the highest dose (98 ppb). This suggestion of a recuperation from significant effects when imidacloprid exposure ceases is also suggested in other work by Cresswell on individual bumble bees. As discussed previously, bumble bees exposed to 125 µg a.i/L for 3 days were observed to consume less food and exhibit less locomotor activity (p<0.05). When switched to untreated sucrose, bumble bee workers were significantly more active after 3 days, and feeding rates were at levels similar to control after 8 days. While these results suggest that colonies and individuals can recover from short-term exposures to imidacloprid, it is noted that even in crops with short blooming periods that are highly synchronous (e.g. canola), the fate of colony could still potentially be impacted as foragers would be expected to bring nectar back to the hive, process it, and store it for potentially long periods of time. The results of these studies also indicate that imidacloprid exposure ranging from 2 – 6 weeks, could potentially lead to a greater recruitment of foragers that is hypothesized to be due to a more frequent and less efficient foraging trips in collecting pollen. These effects were determined in one study (Gill and Raine 2014) to occur immediately following exposure (increased numbers of foragers) or appear after several weeks of exposure (decreased pollen load size, increased pollen foraging trip duration). It is noted here that pollen is a vital food source for the colony (both for Bombus and Apis species), not only promoting the development of the queen’s ovaries, but also serving as the primary food for the Bombus

154
larvae. While the studies indicating increased foraging numbers, and decreased foraging efficiency also indicated that these colonies did not fail (at 4 weeks exposure, 10 µg a.i/L), the impact to colonies under conditions different from those tested in these studies is uncertain.
5.3. Tier III Tier III represents the highest level of refinement for pollinator studies since they are intended to characterize the potential effects of a pesticide on bee colonies under actual use conditions. These studies are organized by source (i.e registrant submitted vs open literature) and are discussed below.
5.3.1. Registrant Submitted There are currently two full field studies that are being conducted by Bayer Crop Science to characterize the colony level effects of application of imidacloprid on cotton in California and pumpkin in South Dakota. The results of these studies will be incorporated into the preliminary risk assessment expected to be complete by the end of 2016.
5.3.2. Open Literature There are two Apis and one Bombus full field studies that were evaluated in the open literature which are summarized below with further details on the methods provided in Appendix D.
Apis In Pohorecka, 2013 (formulated imidacloprid, seed-treated corn full-field design, 21-day exposure period, overwintering observation in one trial year). The number of dead honey bees in the 2011 trial was not significantly different from control (p>0.05) throughout the exposure period and up until the last colony visit in mid-October (141 dead bees/colony in treatment group compared to 132 dead bees/colony in control). In 2012, while the observation period for mortality was a month and a half shorter (last assessment made in late August) there was no treatment-related effect on mortality (p>0.05, 22 dead bees/colony in treatment group compared to 30 dead bees/colony in the control). All colonies (control and treatment) were stated to have overwintered successfully for the 2011 trial (no further information given, similar information not provided for the 2012 trial). The analysis of the pollen collected by bees indicated only 3% was from the treated crop. Stadler, 2003 (formulated imidacloprid, seed-treated sunflower full-field design, 10-day exposure period, overwintering component) reported that there were no significant (p>0.05) effects on mortality. It is noted however that this determination appeared to only be from the exposure phase of the study and there was no indication of mortality results for the rest of the 216-day observation period, including after the overwintering period. In both the Pohorecka and Stadler studies, there were significant (p<0.05) increases in the percent frame coverage of brood area for the treatment groups compared to controls in multiple CCAs. In Pohorecka, these increases (relative to controls) were 44% and 87% in the mid-September and early October CCAs, respectively, although it was noted in the study report that these numbers were typical for the time of season. It is noted that despite these increases, the study authors stated that all control and treatment
155
group colonies overwintered successfully. Similarly, while Stadler identified significant increases in brood area coverage, in was not clear from the study article the actual magnitude of these effects as means were not presented and indications of statistical significance were not uniform in their use within the article.

156
Table 5-15. Summary of Tier III (full field) studies available from the open literature for Apis bees Test Substance – Purity (Test species)
Crop (App. Rate)
Exposure Dur. (Observ. Dur)
Design Elements
Endpoints Assessed -- (Statistical analysis conducted? – Yes/No)
Effects2 (all comparisons made relative to the study’s control)
Limitations3
Qualitative Citation (MRID Number)
Gaucho® 600 FS - 60%1
(Apis mellifera)
Corn (83.3 mL/50k seeds)
21 days (approx. 3 months)
- One control plot (unknown size), one treatment plot (89 acres) - Colonies assessed every 3-4 weeks during observation period)
Mortality, number of combs covered by bees, brood area -- (Yes)
Brood area: ↑44% (mid-September CCA)†, ↑87% (early October CCA)†
- Pollen analysis indicated 3% or less of pollen collected originating from treated crop; - Two fungicides (metalaxyl and fludioxonil) were seed treated along with imidacloprid. Metalaxyl is known to be systemic in plants and would be expected to be available in pollen and nectar but no information is available for residues in pollen from this study.
Qualitative Pohorecka, 2013 (49719625)
Courase® 350 FS - 35%1
(Apis mellifera)
Corn (150 mL/50k seeds)
- One control plot (unknown size), one treatment plot (74 acres) - Colonies assessed every 3-4 weeks during observation period)
Brood area: ↑16% in 1 colony assessments

157
Test Substance – Purity (Test species)
Crop (App. Rate)
Exposure Dur. (Observ. Dur)
Design Elements
Endpoints Assessed -- (Statistical analysis conducted? – Yes/No)
Effects2 (all comparisons made relative to the study’s control)
Limitations3
Qualitative Citation (MRID Number)
Gaucho® 600FS - 60%1
(Apis mellifera)
Sunflower (0.24 mg/seed)
10 days (216 days, including overwinter)
- One control plot, one treatment plot (each 60 acres) - Hives acclimated for 35 days then moved to fields for 10 days
Hive weight, percent cells occupied with honey and nectar, percent cells occupied with pollen, percent cells occupied with worker brood, percent empty cells, foraging activity, mortality -- (Yes)
↑ in hive weight†, ↑ in percentage of cells occupied with pollen†, worker brood†, and empty cells†
- Means for each response variable not reported, only direction of effect and indication of statistical significance are reported; - Although foraging activity and mortality were assessed, the summary table differs from the text in reporting of effects in the study article. - Lack of pollen, nectar, and soil residue analysis to confirm exposure.
Qualitative Stadler, 2003 47796301
†Indicates effect was statistically significant (p<0.05). 1Purity not reported but assumed to be percentage indicated assuming a product density of 1 g/L 2Not all studies were associated with NOAEC/LOAEC values. This column will report the most sensitive statistically derived or otherwise observed difference from that of the control. 3Limitations considered to be major listed here. Others associated with this study can be found in with the study summaries in Appendix D.

158
Bombus In a study by Tasei 2001 (which had a semi-field component that was previously discussed) a full-field design component was initiated with two sunflower fields (located in France), one each serving as a control and the other with seed-treated sunflower (Gaucho® - purity not provided - 0.7 mg a.i/seed). Colonies of bumble bees (10 per field in the control and treatment plots) were exposed to untreated and seed-treated sunflower, respectively, for a 9-day exposure period. After this exposure period, the colonies were brought into the laboratory, where they were fed with untreated syrup and pollen paste. After 26 days, the study authors recorded the number of marked (with colored spot on thorax to delineate exposure) to estimate their homing rate during the field period and the growth rate of each colony. At the conclusion of the colony life cycle, emerged queens were captured, recorded, and housed in cages along with male bees for mating purposes. When considering the exposure phase duration (Day 0 to Day 9), the mean loss of marked workers per colony was 33.5% in the treated group as compared to 23.1% in the control group, a difference that was not significant (p>0.05). The mean population increase, which was assessed 26 days after the introduction of the hives into the fields, was 86.5 and 78.1 workers/colony in control and treated fields, respectively. This difference was not significant (p>0.05). New queens were produced by 8 colonies out of 10 in each field. There were 17 and 24 queens/colony in hives of the control and treated fields, respectively, a difference that was not significant (p>0.05). While this study investigated individual and colony-level effects with bumble bees resulting from exposure to seed-treated sunflower, there are uncertainties as to what extent the bumble bees were exposed. Despite the finding that nectar foragers and pollen foragers had 98 and 25% of their respective loads originating from sunflowers, there were no confirmatory measurements in either the semi-field or field components to indicate that imidacloprid was present in the nectar or pollen collected from the bumble bees. Further details on this as well as additional information on the methods and results are provided in Appendix D.

159
Table 5-16. Summary of Tier III (full field) studies available from the open literature for Bombus bees. Test Substance – Purity (Test species)
Crop (App. Rate)
Exposure Dur. (Observ. Dur)
Design Elements
Endpoints Assessed -- (Statistical analysis conducted? – Yes/No)
Effects1 (all comparisons made relative to the study’s control)
Limitations2
Qualitative Citation (MRID Number)
Gaucho® – not reported (Bombus terrestris)
Sunflower (0.7 mg a.i/seed)
9 days ( days)
- One control field (44 acres) and one treated field (40 acres); - 10 colonies introduced in each field when sunflowers began blooming, removed after 9 days; - Control and treated field were 12 miles away.
Mean loss of marked workers/colony, colony population (Day 0-26), mean number of new queens. (Yes)
Colony population (Day 0-26) (↓8.65%); mean number of new queens (↑41.2%)
- There were no pollen, nectar, bee, or other samples taken to demonstrate exposure to imidacloprid. Only soil samples were taken in which imidacloprid was not detected (LOD = 5 ppb), and study authors cite previous work in same field to state that bees were exposed. - Minimal information on the husbandry of the bees and overall health at study initiation.
Qualitative Tasei, 2001 (47800503)
†Indicates effect was statistically significant (p<0.05). 2Not all studies were associated with NOAEC/LOAEC values. This column will report the most sensitive statistically derived or otherwise observed difference from that of the control. 3Limitations considered to be major listed here. Others associated with this study can be found in with the study summaries in Appendix D.

160
5.4. Reported Pollinator Incident Information The Office of Pesticide Programs (OPP) maintains a database called the Incident Database System (IDS) in which wildlife incidents reported to the Agency from a variety of sources are maintained. Additionally, the Environmental Fate and Effects Division (EFED) within OPP maintains an incident database called the Environmental Information Incident System (EIIS). There is some overlap with the information housed in these databases, but generally a more detailed narrative of an incident is contained in an EIIS report such as magnitude of the number of organisms impacted, location, date, product used, use pattern, whether the use was a registered use, and any confirmatory residue analysis if available. The sources of information for incidents include, registrant reports submitted under the Federal Insecticides, Fungicides, and Rodenticides Act (FIFRA) §6(a)(2) reporting requirement, as well as reports from local, state, national and international level government reports on bee kill incidents, news articles, and correspondence made to EFED by phone or via email (through [email protected]) generally reported by homeowners and beekeepers. It is noted that not all reported incidents are associated with narrative or analytical information that definitively links imidacloprid exposure to the bee kill event. Analytical information can include residue analysis of dead bees observed at a site or within hive residues of pollen and nectar that confirm imidacloprid was present. Even in those cases, many incident reports are associated with findings of other pesticides, of which the interactions with imidacloprid in contributing to potentially enhanced toxicity to bees are not fully understood. In other instances, imidacloprid was only suspected to be the cause of bee kill events based on observational accounts between beekeepers in a given area. This, as indicated by the summaries below, is not always supported by a confirmatory residue analysis or apiary inspector examination of colony health. Typically, the reported wildlife incidents serve as a line of evidence in determining the potential effects of imidacloprid, as the reports are useful in understanding how its use may impact pollinators under the actual use conditions. As evidenced in the incident summaries below, much of the incident information made through phone and email correspondence to EFED does not usually include a thorough investigation of the incident or provide any confirmatory residue data to link a chemical with a particular incident. Rather, much of these reports are anecdotal in nature. For two incidents (I023737-005 and I24127), the reports concerned broad studies/investigations that detailed bee losses in Italy and Austria, respectively. Full details and methods are described in Appendix F. The Italian report details colony losses thought to be due to dust dispersion from the sowing of imidacloprid-treated seed. The Austrian report is similar in nature but generally indicated less frequency of detection (3-11% in samples, depending on the matrix) as compared to 25.7% of dead bees showing imidacloprid residues in the Italian report. In a report from Health Canada’s PMRA entitled “Update on Neonicotinoid Pesticides and Bee Health (2014)”, incident reports were compiled in collaboration with the Regions and Programs Bureau of Health Canada that included information on residue analysis of samples and planting practices surrounding the affected apiaries. These reports were from 2012 – 2014. The PMRA concluded that neonicotinoids (imidacloprid, thiamethoxam, and clothianidin) present in dust generated during planting of treated corn and soybean seeds contributed to the reported bee mortalities in 2012 and 2013, that were described

161
either as dead bee (i.e forager loss) or colony losses. Analytical results and evaluation of the 2014 data are still pending. The report stated that 70% of dead bees collected during the corn and soybean planting period in 2012 and 2013 had neonicotinoid residues present; whereas, the majority of the live bees sampled did not have such residues present. Additionally, it was reported that the 2012 incidents primarily identified high numbers of dead bees and symptoms of pesticide poisoning, while the 2013 reports involved lower number of dead bees but increased incidence of colony-level effects such as lack of foragers, and loss of honey production especially in the later months of the beekeeping season. The latter was also reported in 2014. It is noted that the report states that unclear how widespread the colony losses are as in 2014, three beekeepers accounted for over 72% of the reported incidents. In 2012, a total of 278 bee yards from all participating provinces (Ontario, Québec, Alberta, Saskatchewan, Manitoba, and Nova Scotia) reported bee loss incidents that represented 53 beekeepers. A follow-up investigation revealed that 86% of these incidents were associated with corn and soybean planting. The number of reported incidents increased in 2013 and 2014 to 420 and 343, respectively, but the causality assessment of these incidents is still pending. Of these incidents, the majority (>85%) originated in Ontario where corn in particular is intensively cultivated. The analysis also found that the majority of the incidents were reported at the time of seed-treated corn and soybean planting, suggesting exposure to abraded treated-seed coatings (dust off) during planting. Interestingly, the corn growing areas of Québec and Manitoba are not associated with a similar frequency of incident reports, and the Western Canadian provinces where the majority of canola seed is treated with neonicotinoids are also not associated with reported incident information. This report does not provide the breakdown of the number of incidents associated with a particular chemical, and therefore it is unknown what percentage of the reported incidents are the results of seed treated imidacloprid. Also, PMRA responded to these incidents by requiring in 2014 a dust-reducing seed flow lubricant when planting neonicotinoid treated seeds using pneumatic planting equipment. Additionally, PMRA updated the best management practices (BMPs) for the responsible use of treated seed as well as enhanced warnings of pesticide labels and seed package labels for directions on how to protect bees were published. Summary of Reported Pollinator Incidents Approximately one half (17/36) of the incidents summarized in Table 5-17 below either included a follow-up investigation that confirmed through residue analysis the presence of imidacloprid in at least one matrix (dead bees, floral pollen, nectar) or were submitted by the registrant under FIFRA 6(a)(2). Only 6 of these incidents originated from an agricultural use while others were mainly from residential and commercial use on ornamentals. In some of these instances, other chemicals (including other neonicotinoid chemicals) were also detected. For others, the incident was determined to originate from a misuse of the imidacloprid. Several other incident reports were more anecdotal in the narrative they provided without a confirmatory residue analysis such as news reports and beekeeper organization newsletters (there incidents are tabulated along with those below in Appendix F. Of the incidents that provided a residue analysis, imidacloprid concentrations of dead bee samples were quantified as high as 2456 ppb. It is important to

162
note incident information serve as one line of evidence and that the absence of reports does not indicate an absence of pollinator losses due to pesticides.

163
Table 5-17. Summary of reported pollinator incident reports that are either associated with confirmatory residue analysis or registrant submitted Incident Record Date Use Pattern Product Location Legality App.
Method Comments
I020700-001 06-2008 Ornamental Merit 2F DE Registered use Soil injection
Submitted under FIFRA 6(a)(2). Linden trees (Tilia cordata) on a commercial golf course were treated for Japanese beetle control using Merit 2F soil injection treatment. It was stated in the report that some months after treatment, the trees bloomed, and dead bumble bees (Bombus) and carpenter bees (Xylocopa) were found at the base of the tree. It was estimated that 2000-4000 individuals were affected (11 trees treated). A follow up residue analysis (August 2008) conducted by Bayer confirmed imidacloprid presence in the leaves of parent imidacloprid (ranging from 2.6 – 11.7 ppm), IMI-5-OH (1.6 – 2.2 ppm), and IMI-olefin (0.59 – 1.8 ppm). Residues of these products in dead bee samples were 0.146, 0.016, 0.138 ppm, respectively (composite samples).
I021017-001 03-2009 Ornamental Xytect 75 WSP PA Undetermined NR
Submitted under FIFRA 6(a)(2). Product applied to control aphids in 6 linden trees that were reported to 8-10 inches. The application took place March 30, 2009. During blooming, it was discovered that an unspecified number of bees were killed and that the bee deaths ceased when blooming ended. It was unspecified of what species of bee was affected.
I022340-001 04-2010 NR NR IN Undetermined NR
Summary report from bee kill incidents at the Purdue University Department of Entomology. There were reports of hives with dead bees out in front with observations of seed treated corn being planted in the fields adjacent to the university lab. A residue analysis determined that sampled pollen from affected hives (composite sample) had imidacloprid at levels of 2.8 ppb. All other sampled matrices (live and dead bees) did not return any detectable residues (LOD and LOQ not reported). Clothianidin was detected in pollen at 21 ppb.
I023702-001 2006 Canola, rapeseed Gaucho ND Undetermined 2006
Part of an April 2009 report from the Nebraska Beekeepers Association. Seven beekeepers in North Dakota and Minnesota initiated legal action against Bayer Crop Science when they suspected Gaucho (used as a seed treatment on neighboring canola fields) were responsible for their bee losses. Laboratory analysis of the wax comb and honey found imidacloprid in all samples with residues ranging from 22 – 671 ppb. Carbofuran,

164
Incident Record Date Use Pattern Product Location Legality App.
Method Comments
dichlotvos, and coumaphos were also screened for (no results provided).
I023702-005 2007 Citrus Admire FL Undetermined NR
Part of an April 2009 report from the Nebraska Beekeepers Association. A beekeeper maintaining 7500 hives for honey production and crop pollination provided 18 hives to a research project organized by Penn State that would monitor the hives to investigate causes for mortality. The beekeeper stated that while he provided 18 hives for the study, he only received 4 back with only 1 hives in a state sufficient to produce honey. The first samples taken were from when the bees were pollinating Florida citrus where imidacloprid residues ranging from 14-17 ppb were detected in the pollen. Follow up with the grove manager revealed that Admire Pro had been used as a ground application as the trees began to bloom.
I025512-001 08-2013 Soybean Leverage 360 MO Undetermined Ground
Submitted by Bayer Crop Science under FIFRA 6(a)(2). A soybean farm was being sprayed by Leverage 360 (imidacloprid and beta-cyfluthrin) which was adjacent to neighbor who had 11 honey bee hives. The neighbor had reported that he had “piles of dead honey bees,” back on his property. There was no further confirmatory residue information provided in the report.
I025610-001 05-2013 Parking lot Quali-Pro OR Misuse Soil drench
Submitted under FIFRA § 6(a)(2) by Makhteshim Agan of North America (MANA) involving soil drench of linden trees at a golf club in Portland, Oregon that resulted in an unspecified number of dead bumble bees. Oregon Department of Agriculture investigated and conducted residue analysis and determined presence of imidacloprid but there were no residues presented in the report. It was reported that while this use represented one that was permitted by the label, the pest control operator (PCO) did not have the necessary licenses to make this application.
I025610-002 2013 Urban Quali-Pro OR Misuse Soil drench
Submitted under FIFRA § 6(a)(2) by Makhteshim Agan of North America (MANA) involving soil drench of linden trees at 200 Market Street in Portland, Oregon that resulted in an unspecified number of dead bumble bees. Oregon Department of Agriculture investigated and conducted residue analysis and determined presence of imidacloprid but there were no residues presented in the report. It was reported that while this use represented one that was permitted by the label, the pest control operator (PCO) did not have the necessary licenses to make this application.

165
Incident Record Date Use Pattern Product Location Legality App.
Method Comments
I025980-001 12-2013 Citrus Orchard
Admire Pro FL Undetermined Surface
Submitted by Bayer Crop Science as part of FIFRA §6(a)(2). Admire® Pro application was made on orange tree orchard in which bees had been placed. The hive yards ranged from 1550 – 5500 feet away from the treated grove. The application method was described as “surface” application. A follow-up investigation conducted by Bayer found that the apiaries had small hive beetle in some hives, no varroa present, small amount of early stage European foulbrood, adequate honey stores, and all stages of brood present in the queen yard (1550 yards from grove). In the apiary 5500 yards from grove, there were fewer dead bees than in the yard used for queen breeding and evidence of hive robbing and heavily infested with all stages of small hive beetle larvae. Residue analysis of dead bees from the various yards returned total residues of imidacloprid (parent + IMI-olefin+ IMI-5-OH) yielded results of 2.5 – 2456 ppb. Live bee residue analysis had total residues ranging from 1.1 – 5.1 ppb.
I026301-001 08-2013 Residential Merit 2F CA Undetermined Tree injection
Submitted as part of FIFRA 6(a)(2) by Bayer Crop Science. A pest control operator (PCO) applied Merit® 2F (imidacloprid) as tree injection to Arbutus and Laurel trees on residential property. The observation of dead bees (number not specified) occurred shortly after the trees were treated. No other confirmatory residue analysis provided in the report.
I026563-001 06-2014 Residential NR OR Misuse NR
Sidewalks were reported to be littered with dead and dying bumble bees in Eugene, Oregon. The bees were collected the following day by the Oregon Department of Agriculture for testing. Imidacloprid and acephate were detected at 0.05 and 0.30 µg a.i/bee, respectively. An investigation prompted a suspension of the pest control operator company who sprayed linden trees while in bloom, which is a violation of the label restrictions.
I026593-001 06-2014 Residential Ima-Jeet OR Registered Use
Tree injection
Beaverton, OR incident involving bumble bees and honey bees being discovered underneath linden trees in a neighborhood. The trees were treated to control aphids. An investigation led to the discovery that the same pesticides (imidacloprid, dinotefuran) were used here as in a related incident involving linden trees in a parking lot (I025610-001). Follow on investigation took bee, flower, and leaf samples where analysis determined residue levels of 0.050 µg a.i/bee, 0.49 ppm, and 2.2 ppm, respectively.
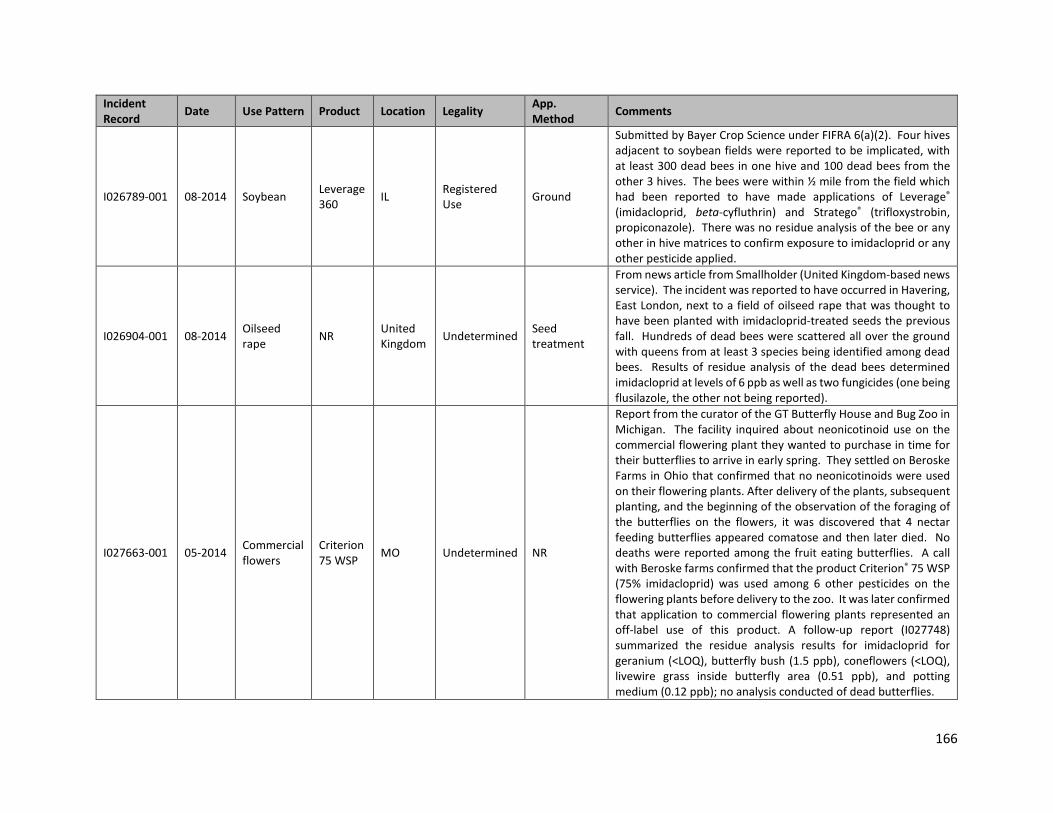
166
Incident Record Date Use Pattern Product Location Legality App.
Method Comments
I026789-001 08-2014 Soybean Leverage 360 IL Registered
Use Ground
Submitted by Bayer Crop Science under FIFRA 6(a)(2). Four hives adjacent to soybean fields were reported to be implicated, with at least 300 dead bees in one hive and 100 dead bees from the other 3 hives. The bees were within ½ mile from the field which had been reported to have made applications of Leverage® (imidacloprid, beta-cyfluthrin) and Stratego® (trifloxystrobin, propiconazole). There was no residue analysis of the bee or any other in hive matrices to confirm exposure to imidacloprid or any other pesticide applied.
I026904-001 08-2014 Oilseed rape NR United
Kingdom Undetermined Seed treatment
From news article from Smallholder (United Kingdom-based news service). The incident was reported to have occurred in Havering, East London, next to a field of oilseed rape that was thought to have been planted with imidacloprid-treated seeds the previous fall. Hundreds of dead bees were scattered all over the ground with queens from at least 3 species being identified among dead bees. Results of residue analysis of the dead bees determined imidacloprid at levels of 6 ppb as well as two fungicides (one being flusilazole, the other not being reported).
I027663-001 05-2014 Commercial flowers
Criterion 75 WSP MO Undetermined NR
Report from the curator of the GT Butterfly House and Bug Zoo in Michigan. The facility inquired about neonicotinoid use on the commercial flowering plant they wanted to purchase in time for their butterflies to arrive in early spring. They settled on Beroske Farms in Ohio that confirmed that no neonicotinoids were used on their flowering plants. After delivery of the plants, subsequent planting, and the beginning of the observation of the foraging of the butterflies on the flowers, it was discovered that 4 nectar feeding butterflies appeared comatose and then later died. No deaths were reported among the fruit eating butterflies. A call with Beroske farms confirmed that the product Criterion® 75 WSP (75% imidacloprid) was used among 6 other pesticides on the flowering plants before delivery to the zoo. It was later confirmed that application to commercial flowering plants represented an off-label use of this product. A follow-up report (I027748) summarized the residue analysis results for imidacloprid for geranium (<LOQ), butterfly bush (1.5 ppb), coneflowers (<LOQ), livewire grass inside butterfly area (0.51 ppb), and potting medium (0.12 ppb); no analysis conducted of dead butterflies.
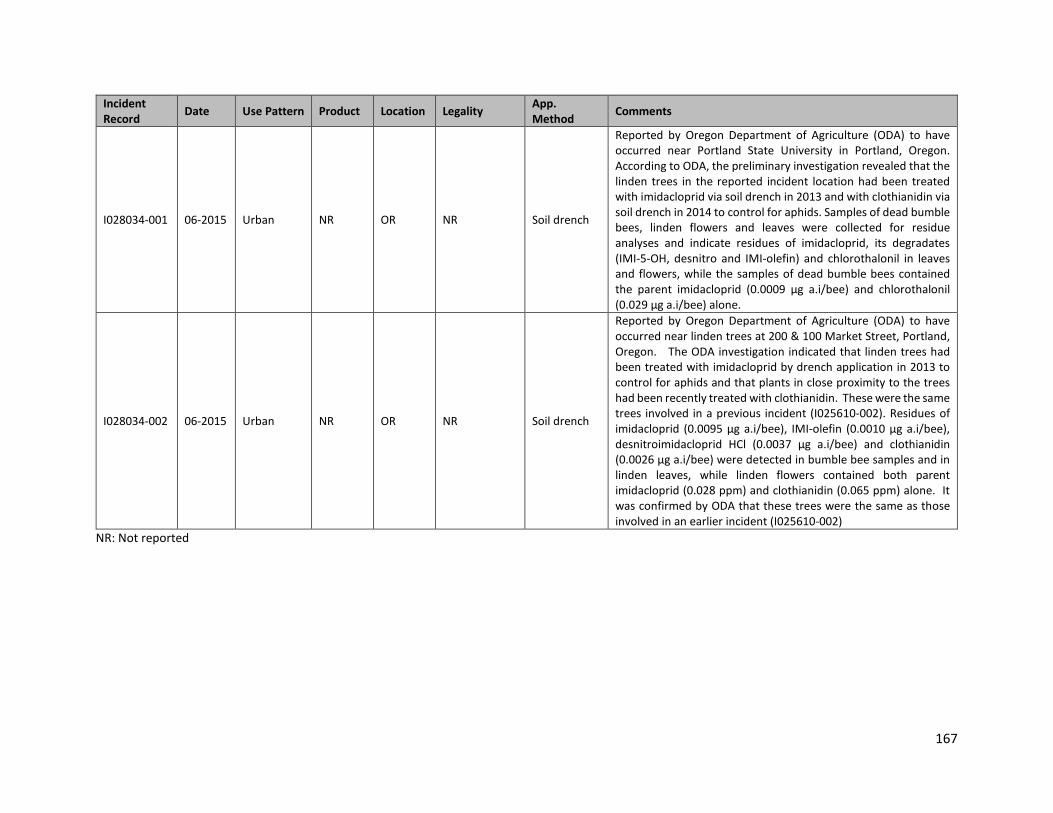
167
Incident Record Date Use Pattern Product Location Legality App.
Method Comments
I028034-001 06-2015 Urban NR OR NR Soil drench
Reported by Oregon Department of Agriculture (ODA) to have occurred near Portland State University in Portland, Oregon. According to ODA, the preliminary investigation revealed that the linden trees in the reported incident location had been treated with imidacloprid via soil drench in 2013 and with clothianidin via soil drench in 2014 to control for aphids. Samples of dead bumble bees, linden flowers and leaves were collected for residue analyses and indicate residues of imidacloprid, its degradates (IMI-5-OH, desnitro and IMI-olefin) and chlorothalonil in leaves and flowers, while the samples of dead bumble bees contained the parent imidacloprid (0.0009 µg a.i/bee) and chlorothalonil (0.029 µg a.i/bee) alone.
I028034-002 06-2015 Urban NR OR NR Soil drench
Reported by Oregon Department of Agriculture (ODA) to have occurred near linden trees at 200 & 100 Market Street, Portland, Oregon. The ODA investigation indicated that linden trees had been treated with imidacloprid by drench application in 2013 to control for aphids and that plants in close proximity to the trees had been recently treated with clothianidin. These were the same trees involved in a previous incident (I025610-002). Residues of imidacloprid (0.0095 µg a.i/bee), IMI-olefin (0.0010 µg a.i/bee), desnitroimidacloprid HCl (0.0037 µg a.i/bee) and clothianidin (0.0026 µg a.i/bee) were detected in bumble bee samples and in linden leaves, while linden flowers contained both parent imidacloprid (0.028 ppm) and clothianidin (0.065 ppm) alone. It was confirmed by ODA that these trees were the same as those involved in an earlier incident (I025610-002)
NR: Not reported
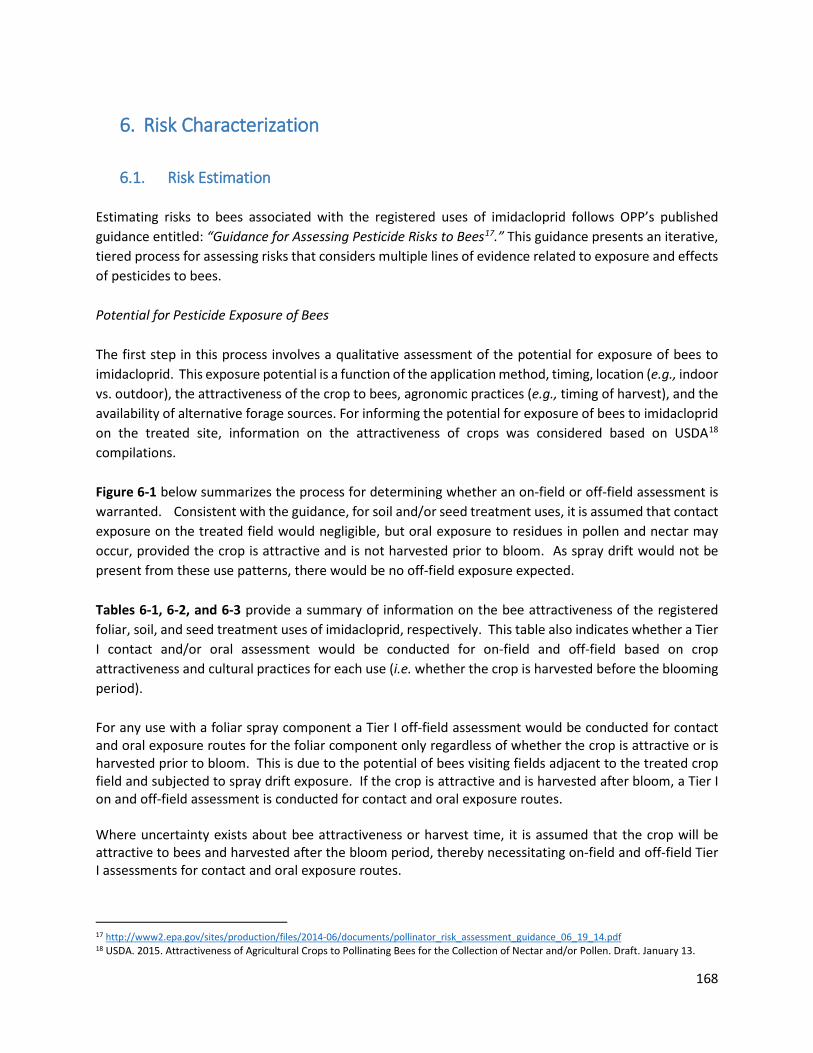
168
6. Risk Characterization
6.1. Risk Estimation Estimating risks to bees associated with the registered uses of imidacloprid follows OPP’s published guidance entitled: “Guidance for Assessing Pesticide Risks to Bees17.” This guidance presents an iterative, tiered process for assessing risks that considers multiple lines of evidence related to exposure and effects of pesticides to bees. Potential for Pesticide Exposure of Bees The first step in this process involves a qualitative assessment of the potential for exposure of bees to imidacloprid. This exposure potential is a function of the application method, timing, location (e.g., indoor vs. outdoor), the attractiveness of the crop to bees, agronomic practices (e.g., timing of harvest), and the availability of alternative forage sources. For informing the potential for exposure of bees to imidacloprid on the treated site, information on the attractiveness of crops was considered based on USDA18 compilations. Figure 6-1 below summarizes the process for determining whether an on-field or off-field assessment is warranted. Consistent with the guidance, for soil and/or seed treatment uses, it is assumed that contact exposure on the treated field would negligible, but oral exposure to residues in pollen and nectar may occur, provided the crop is attractive and is not harvested prior to bloom. As spray drift would not be present from these use patterns, there would be no off-field exposure expected. Tables 6-1, 6-2, and 6-3 provide a summary of information on the bee attractiveness of the registered foliar, soil, and seed treatment uses of imidacloprid, respectively. This table also indicates whether a Tier I contact and/or oral assessment would be conducted for on-field and off-field based on crop attractiveness and cultural practices for each use (i.e. whether the crop is harvested before the blooming period). For any use with a foliar spray component a Tier I off-field assessment would be conducted for contact and oral exposure routes for the foliar component only regardless of whether the crop is attractive or is harvested prior to bloom. This is due to the potential of bees visiting fields adjacent to the treated crop field and subjected to spray drift exposure. If the crop is attractive and is harvested after bloom, a Tier I on and off-field assessment is conducted for contact and oral exposure routes. Where uncertainty exists about bee attractiveness or harvest time, it is assumed that the crop will be attractive to bees and harvested after the bloom period, thereby necessitating on-field and off-field Tier I assessments for contact and oral exposure routes.
17 http://www2.epa.gov/sites/production/files/2014-06/documents/pollinator_risk_assessment_guidance_06_19_14.pdf 18 USDA. 2015. Attractiveness of Agricultural Crops to Pollinating Bees for the Collection of Nectar and/or Pollen. Draft. January 13.

169
Figure 6-1. Summarization of the potential scenarios warranting a Tier I on and/or off-field risk assessment. For the tables below, the attractiveness and harvesting information presented represents the most conservative scenario that would warrant a Tier I on-field and off-field assessment. For example, if a certain member of a crop group indicates no attractiveness to bees, yet another crop within the group is considered attractive, a Tier I on-field and off-field assessment would be conducted.

170
Table 6-1. Attractiveness of crops to bees for the registered foliar uses of imidacloprid.
Crop Group Number (Crop Group Name)
Honey Bee Attractive?
Bumble Bee Attractive?
Solitary Bee Attractive?
Notes Tier I On-Field Contact/Oral Assessment?
Tier I Off-Field Contact/Oral Assessment?
1 (Root and Tuber Vegetables)1
Y (Pollen and Nectar)
Y Y Bees important for seed production, typically harvested prior to bloom. Potatoes noted to be harvested after bloom
Y Y
4A (Leafy Green Vegetables) Y (Pollen and Nectar)
Y Y Bees important for seed production, crop harvested prior to bloom when not used for seed production.
N Y
5 (Brassica Leafy Vegetables) Y (Pollen and Nectar)
Y Y Harvested prior to bloom N Y
6 (Legume Vegetables) Y (Pollen and Nectar)
Y Y Not harvested prior to bloom Y Y
8 (Fruiting Vegetables) Y (pollen and nectar)4
Y Y May be grown in glasshouses, with bumble bees for pollination
Y Y
10 (Citrus Fruit)* Y (Pollen and Nectar)
Y Y -- Y Y
11 (Pome Fruit) Y (Pollen and Nectar)
Y Y Not harvested prior to bloom Y Y
12 (Stone Fruit)* Y (Pollen and Nectar)
Y Y Not harvested prior to bloom Y Y
13 (Berry and Small Fruit)2 Y (Pollen and Nectar)
Y Y Not harvested prior to bloom Y Y
14 (Tree Nuts) Y (Pollen and Nectar)
Y Y Not harvested prior to bloom Y Y
9 (Herbs) Y (Pollen and Nectar)
Y Y Not harvested prior to bloom Y Y
20 (Oilseed)3,* Y (Pollen and Nectar)
Y Y -- Y Y
Non-crop group uses (Globe artichoke, banana and plantain, peanut, pomegranate, tobacco, coffee, hops, tropical fruit)
Y (Pollen and Nectar)
Y Y Globe artichoke harvested before bloom, tobacco deflowered as part of the harvest process
N (globe artichoke, tobacco) Y for all others
Y
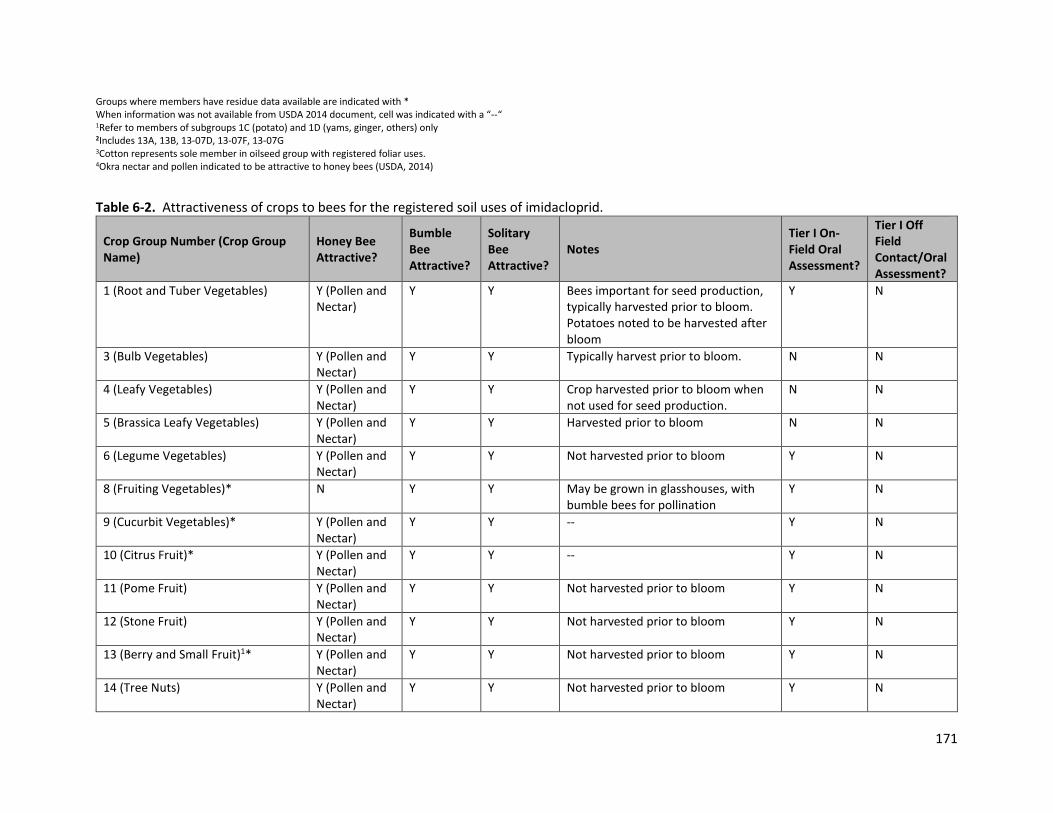
171
Groups where members have residue data available are indicated with * When information was not available from USDA 2014 document, cell was indicated with a “--“
1Refer to members of subgroups 1C (potato) and 1D (yams, ginger, others) only 2Includes 13A, 13B, 13-07D, 13-07F, 13-07G 3Cotton represents sole member in oilseed group with registered foliar uses. 4Okra nectar and pollen indicated to be attractive to honey bees (USDA, 2014)
Table 6-2. Attractiveness of crops to bees for the registered soil uses of imidacloprid.
Crop Group Number (Crop Group Name)
Honey Bee Attractive?
Bumble Bee Attractive?
Solitary Bee Attractive?
Notes Tier I On-Field Oral Assessment?
Tier I Off Field Contact/Oral Assessment?
1 (Root and Tuber Vegetables) Y (Pollen and Nectar)
Y Y Bees important for seed production, typically harvested prior to bloom. Potatoes noted to be harvested after bloom
Y N
3 (Bulb Vegetables) Y (Pollen and Nectar)
Y Y Typically harvest prior to bloom. N N
4 (Leafy Vegetables) Y (Pollen and Nectar)
Y Y Crop harvested prior to bloom when not used for seed production.
N N
5 (Brassica Leafy Vegetables) Y (Pollen and Nectar)
Y Y Harvested prior to bloom N N
6 (Legume Vegetables) Y (Pollen and Nectar)
Y Y Not harvested prior to bloom Y N
8 (Fruiting Vegetables)* N Y Y May be grown in glasshouses, with bumble bees for pollination
Y N
9 (Cucurbit Vegetables)* Y (Pollen and Nectar)
Y Y -- Y N
10 (Citrus Fruit)* Y (Pollen and Nectar)
Y Y -- Y N
11 (Pome Fruit) Y (Pollen and Nectar)
Y Y Not harvested prior to bloom Y N
12 (Stone Fruit) Y (Pollen and Nectar)
Y Y Not harvested prior to bloom Y N
13 (Berry and Small Fruit)1* Y (Pollen and Nectar)
Y Y Not harvested prior to bloom Y N
14 (Tree Nuts) Y (Pollen and Nectar)
Y Y Not harvested prior to bloom Y N

172
Crop Group Number (Crop Group Name)
Honey Bee Attractive?
Bumble Bee Attractive?
Solitary Bee Attractive?
Notes Tier I On-Field Oral Assessment?
Tier I Off Field Contact/Oral Assessment?
19 (Herbs) Y (Pollen and Nectar)
Y Y Not harvested prior to bloom Y N
20 (Oilseed)2* Y (Pollen and Nectar)
Y Y -- Y N
Non-crop group uses (Globe artichoke, banana/plantain, peanut, pomegranate, tobacco, coffee, hops, tropical fruit)
Y (Pollen and Nectar)
Y Y -- Y N
Groups where members have residue data available are indicated with * When information was not available from USDA 2014 document, cell was indicated with a “--“
1Includes 13A, 13B, 13-07D, 13-07F, 13-07G, 13-07H 23Cotton represents sole member in oilseed group with registered soil uses.
Table 6-3. Attractiveness of crops to bees for the registered seed treatment uses of imidacloprid.
Crop Group Number (Crop Group Name)
Honey Bee Attractive?
Bumble Bee Attractive?
Solitary Bee Attractive? Notes
Tier I On-Field Oral Assessment?
Tier I Off Field Contact/Oral Assessment?
1 (Root and Tuber Vegetables)1 Y (Pollen and Nectar)
Y Y Bees important for seed production, typically harvested prior to bloom. Potatoes noted to be harvested after bloom
Y N
3 (Bulb Vegetables)2 Y (Pollen and Nectar)
Y Y Typically harvest prior to bloom. N N
5 (Brassica Leafy Vegetables)3 Y (Pollen and Nectar)
Y Y Requires pollination only when grown for seed; small % of acreage; harvested prior to bloom
N N
6 (Legume Vegetables)4 Y (Pollen and Nectar)
Y Y Not harvested prior to bloom N N
15 (Cereal grains)5* Y (Pollen and Nectar)
Y Y Not harvested prior to bloom Y N
19 (Herbs)6 Y (Pollen and Nectar)
Y Y Not harvested prior to bloom Y N

173
Crop Group Number (Crop Group Name)
Honey Bee Attractive?
Bumble Bee Attractive?
Solitary Bee Attractive? Notes
Tier I On-Field Oral Assessment?
Tier I Off Field Contact/Oral Assessment?
20 (Oilseed)7 Y (Pollen and Nectar)
Y Y -- Y N
Non-crop group uses (peanut) Y (Pollen and Nectar)
Y Y -- Y N
Groups where members have residue data available are indicated with * When information was not available from USDA 2014 document, cell was indicated with a “--“
1Labels specify sugarbeet (1A), carrot (1B), and potato (1C) 2Labels specify onions/leeks and scallions (03-07A, 03-07B) 3Labels specify broccoli (5A) 4Labels specify soybean (6A) and beans/peas (6) 5Labels specify buckwheat, triticale, wheat, barley, oats, millet, sorghum, rye, and corn (pop, sweet, field) 6Labels specify borage (19A) and mustard (19B) 7Labels specify flax, sunflower, safflower, cotton, canola, and crambe

174
6.1.1. Tier I - Screening-level RQs (On-field Contact – Foliar Uses Only) As described in Section 4, the Tier I method is intended to generate “reasonably conservative” estimates of honey bee contact and oral exposure to pesticides for determining the need for additional refinement of exposure estimates (e.g. measured residues in pollen and nectar). As such, exposure estimates are determined using high-end values predicted from the Bee-Rex model (v.1.0). What follows is a summarization of RQs for each route of exposure (contact vs oral) separated by application type (foliar, soil, and seed treatment) and whether the on-field or off-field risks (foliar applications only) are estimated. For crop uses where an exposure potential of bees is identified the next step in the risk assessment process is to conduct a Tier I risk assessment. By design, the Tier I assessment relies on conservative (high end) estimates of exposure via contact and oral routes. For contact exposure, only the adult (forager) life stage is considered since this is the relevant life stage of honey bees for contact exposure. Effects are defined by laboratory exposures to groups of individual bees. As described in Section 4, the endpoint selected for acute contact toxicity for adult honey bees is a 96-hour LD50 of 0.043 µg a.i/bee. Table 6-4 summarizes the screening-level acute contact RQ values for adult honey bees that are assumed to be foraging on treated crop during pesticide application. As such, Table 6-4 includes only those crops that are considered bee attractive or for which no data are available on bee attractiveness (as a conservative assumption). As the Tier I screening-level for acute contact exposure utilizes the maximum single application rate and a standard contact dose rate of 2.7 µg a.i/bee per 1 lbs. a.i/A, registered use patterns with the same maximum single application rate are grouped together in Table 6-4. For all foliar uses assessed, acute contact RQ values range from 2.5 (legumes, peanut, herbs) to 15.7 (citrus and pome fruits) and exceed the Agency’s acute risk LOC of 0.4. The estimate of contact exposure is considered conservative (although not impossible) since it is determined using a high end estimate of forager bees exposure to spray droplets.
Table 6-4. Summary of Tier I screening-level RQs for contact exposure resulting from foliar uses of imidacloprid (screening-level contact on-field)
Use pattern
Max. Single Appl. Rate (lbs a.i/A)
Dose (μg a.i./bee per 1 lbs. a.i./A)1
Imidacloprid Contact Dose (µg a.i/bee)
Acute Contact RQ1,2
Tuberous and corm vegetables, Legume vegetables (except soybean), Peanut, Herbs
0.04 2.7 0.108 2.5
Strawberry 0.047 2.7 0.127 3.0 Potato, Soybean 0.05 2.7 0.135 3.1 Cotton 0.06 2.7 0.162 3.8 Fruiting vegetables 0.08 2.7 0.216 5.0 Stone fruit, Caneberry, Bushberry, Grape, Tree nuts, Banana and plantain, Pomegranate, Tropical fruit, Coffee, Hops
0.10 2.7 0.27 6.3
Citrus, Pome fruit 0.25 2.7 0.675 15.7

175
1 Based on a 96-h acute contact LD50 of 0.043 ug a.i/bee for imidacloprid (MRID 49602717) 2 Bolded value exceeds the acute risk LOC of 0.4.
6.1.2. Tier I - Screening-level RQs (On-field oral) Oral Exposure (Foliar, Soil, and Seed Treatment Uses) For oral (dietary) exposure, the Tier I assessment initially considers just the caste of bees with the greatest oral exposure (foraging adults). If risks are identified, then other factors are considered for refining the default Tier I risk estimates. These factors include other castes of bees and available information on residues in pollen and nectar which are deemed applicable to the crops of interest. Oral exposure through the consumption of imidacloprid-contaminated pollen is considered for on-field and off-field scenarios resulting from foliar applications. For soil and seed-treatment applications, where no spray drift is expected, oral exposure is assessed for the on-field scenario only. For foliar applications, the Bee-REX model uses a standard dose of 32 µg a.i/bee per 1 lbs. a.i/A for adults and 13.6 µg a.i/bee for larvae that are based off of consumption rates for these life stages. This dose is multiplied by the application rate to yield an oral dose, one each for adults and larvae. For imidacloprid, this dose is compared against the most sensitive acute oral LD50 value of 0.0039 µg a.i/bee for adult acute exposure and 0.00016 µg a.i/bee for adult chronic exposure. For larvae, there are no acute oral toxicity studies for imidacloprid and therefore these cells are shaded in Table 6-15 below. For chronic toxicity, the NOAEC was determined to be 0.0018 µg a.i/larva. For soil applications, the oral exposure estimate for adults and larvae are determined using Briggs model estimates (based off application rate, the log KOW, and organic carbon partition coefficient KOC of imidacloprid) multiplied by the consumption rates of 0.292 g/day for adults and 0.124 g/day for larvae. The exposure estimates are compared against the same endpoints as described above. Finally, for seed treatment applications, the exposure estimate is assumed to be 1 µg a.i/g for all uses regardless of the application rate. This is multiplied by the consumption rates of 0.292 g/day for adults and 0.124 g/day for larvae (as with soil applications) to yield the oral dose that is compared to the Tier I toxicity endpoints described previously. Foliar applications Table 6-5 below summarizes the on-field acute and chronic oral RQs resulting from the foliar applications of imidacloprid. The acute and chronic RQs for adult bees exceed the LOCs of 0.4 and 1, respectively, for all use patterns assessed (adult acute RQs ranged from 329 – 2059, and adult chronic RQs ranged from 8031 – 50195). As noted previously, there are no acute oral toxicity studies to honey bee larvae available for imidacloprid; therefore, these cells are shaded in Table 6-5 below. For chronic larval toxicity, RQ values exceed the LOC of 1 for all use patterns assessed, with RQs ranging from 321 – 2008.

176
Table 6-5. Summary of Tier I screening-level RQs for oral exposure resulting from foliar uses of imidacloprid (based on model-generated exposure values on-field).4
Use pattern
Max. Single Appl. Rate (lbs a.i/A)
Bee Life Stage
Dose (μg a.i./bee per 1 lbs. a.i./A)1
Imidacloprid Oral Dose (µg a.i/bee)
Acute RQ2
Chronic RQ3
Tuberous and corm vegetables, Legume vegetables (except soybean), Peanut, Herbs
0.04 Adult 32 1.2850 329 8031
Larval 13.6 0.5878 321
Strawberry 0.047 Adult 32 1.5099 387 9437 Larval 13.6 0.6907 377
Potato, Soybean 0.05 Adult 32 1.6062 412 10039 Larval 13.6 0.7348 402
Cotton 0.06 Adult 32 1.9275 494 12047 Larval 13.6 0.8818 482
Fruiting vegetables 0.08 Adult 32 2.5700 659 16062 Larval 13.6 1.1757 642
Stone fruit, Caneberry, Bushberry, Grape, Tree nuts, Banana and plantain, Pomegranate, Tropical fruit, Coffee, Hops
0.10
Adult 32 3.2125 824 20078
Larval 13.6 1.4696 803
Larval 13.6 1.8517 1012
Citrus , Pome fruit 0.25 Adult 32 8.0311 2059 50195 Larval 13.6 3.674 2008
1 Source: USEPA et al. 2014. Guidance for Assessing Pesticide Risks to Bees. 2 Based on a 48-h acute oral LD50 of 0.0039 ug a.i/bee for imidacloprid (MRID 42273003) 3Based on adult 10-day chronic NOAEC of 0.00016 µg a.i/bee (Boily 2013, MRID 49750601) and larval 21-day chronic NOAEC of 0.0018 µg a.i/larva (MRID 49090506). 4Bolded value exceeds the acute risk LOC of 0.4 or chronic LOC of 1.
Soil applications Table 6-6 below summarizes the on-field acute and chronic oral RQs resulting from the soil applications of imidacloprid. The acute and chronic RQs for adult bees exceeded the LOCs of 0.4 and 1, respectively, for all use patterns assessed (adult acute RQs ranged from 0.47 – 5.8, and adult chronic RQs ranged from 11 – 142). For chronic larval toxicity, the LOC of 1 was exceeded for all use patterns assessed except tobacco (0.04 lbs a.i/A), with RQs ranging from 0.45 – 5.7.
Table 6-6. Summary of Tier I screening-level RQs for oral exposure resulting from soil uses of imidacloprid (based on model-generated exposure values on-field).4
Use pattern Max. Single Appl. Rate (lbs a.i/A)
Bee Life Stage
Imidacloprid Oral Dose (µg a.i/bee)1
Acute RQ2
Chronic RQ3
Tobacco 0.04 Adult 0.0018 0.47 11 Larval 0.0008 0.45
Sugar beet 0.18 Adult 0.0082 2.1 52 Larval 0.0037 2.0
Hops 0.3 Adult 0.0136 3.5 85 Larval 0.0062 3.4

177
1Briggs EEC (derived from Bee-REX) * consumption rate for life stages (0.292g/day for adults; 0.124 g/day for brood) 2 Based on a 48-h acute oral LD50 of 0.0039 ug a.i/bee for imidacloprid (MRID 42273003) 3Based on adult 10-day chronic NOAEC of 0.00016 µg a.i/bee (Boily 2013, MRID 49750601) and larval 21-day chronic NOAEC of 0.0018 µg a.i/larva (MRID 49090506). 4Bolded value exceeds the acute risk LOC of 0.4 or chronic LOC of 1. Seed treatment applications
As indicated previously, the Bee-REX model assumes all seed treatment applications to have an EEC in pollen and nectar of 1 mg a.i/kg regardless of the application rate. This is multiplied by the consumption rate factors for adults and brood (0.292 and 0.124 g/day, respectively) and then compared to the Tier I toxicity endpoints previously discussed. All RQs (adult acute oral, adult chronic oral, larval chronic oral) exceed the acute and chronic LOCs of 0.4 and 1, respectively.
Table 6-7. Summary of labeled use information for seed treatment applications of imidacloprid (screening-level oral on-field) 4
Use pattern Bee Life Stage EEC in pollen and nectar
Imidacloprid Oral Dose (µg a.i/bee)1 Acute RQ2 Chronic
RQ3
All registered seed treatment use patterns
Adult 1 mg a.i/kg (screening-level value for all seed treatment uses)
0.2920 74.9 1825
Larval 0.1336 73
1 Source: USEPA et al. 2014. Guidance for Assessing Pesticide Risks to Bees. 2 Based on a 48-h acute oral LD50 of 0.0039 ug a.i/bee for imidacloprid (MRID 42273003) 3Based on adult 10-day chronic NOAEC of 0.00016 µg a.i/bee (Boily 2013, MRID 49750601) and larval 21-day chronic NOAEC of 0.0018 µg a.i/larva (MRID 49090506). 4Bolded value exceeds the acute risk LOC of 0.4 or chronic LOC of 1.
6.1.3. Screening Level RQs (Off-Field) As described in Section 3, imidacloprid products may be applied to crops via foliar spray applications. Consistent with the Agency’s risk assessment process for bees and other taxa, exposure beyond the treated field is expected to occur as a result of spray drift. This so-called “off-field” exposure is assessed
Potato 0.31 Adult 0.0141 3.6 88 Larval 0.0064 3.5
Cotton 0.33 Adult 0.0150 3.8 94 Larval 0.0069 3.8
Root vegetables, Tuberous and corm vegetables, Legume vegetables (except soybean), Cucurbit vegetables, Pome fruit, Stone fruit, Peanut, Strawberry (perennial and post-harvest), Herbs
0.38
Adult 0.0173 4.4 108
Larval 0.0079 4.31
Fruiting vegetables, Citrus, Caneberry, Bushberry, Cranberry, Grape, Tree nuts, Banana and plantain, Pomegranate, Strawberry (annual and perennial), Tropical fruit, Coffee
0.50
Adult 0.0227 5.8 142
Larval 0.0104 5.7

178
here for honey bees that are assumed to be foraging adjacent to treated fields. The AgDRIFT model (v. 2.1.119) is used here to estimate the fraction of the foliarly-applied application rate at various distances beyond the treated field. The AgDRIFT model accounts for multiple factors that affect the distance and amount of spray drift (and consequently the associated risk) of a single spray application. These include factors such as wind speed, spray nozzle type, release height, application volume and label restrictions pertaining to spray drift mitigation. Table 6-8 below summarizes various aspects of label restrictions applicable to foliar spray applications of imidacloprid using the Admire® Pro label as an example (EPA Reg No. 264-827). Table 6-8. Imidacloprid Use Patterns for Crops with or without Specific Application Restrictions
Use pattern Max. Single Appl. Rate (lbs a.i./A)
Restrictions
Tuberous and corm vegetables, Legume vegetables (except soybean), Peanut, Herbs 0.04 No restrictions
Leafy green vegetables, Brassica (Cole) Leafy vegetables 0.046 No restrictions
Strawberry 0.047 No restrictions Potato, Soybean, Tobacco 0.05 No restrictions Cotton 0.06 No restrictions Fruiting vegetables 0.08 No restrictions Caneberry, Banana and plantain, Pomegranate, Tropical fruit, Coffee, Hops 0.10 No restrictions; For tree crops, a minimum of 5
gal/A is recommended.
Bushberry 0.10 For ground applications use 20 gal/A and for aerial applications use 50 gal/A.
Grape 0.10 Only ground applications are allowed.
Stone fruit, Tree nuts 0.10 For ground applications use 25 gal/A and for aerial applications use 50 gal/A.
Globe artichoke 0.126 No restrictions
Citrus, Pome fruit 0.25 For tree crops, a minimum of 5 gal/A is recommended.
As shown in Table 6-8, certain crops have limits related to the spray volume. It is expected that higher spray volumes will result in lower drift. There are no restrictions related to boom height, droplet size or wind speed; however, all these factors are also expected to affect drift levels. Spray drift is expected to increase with higher boom heights, smaller droplets, and higher wind speeds. Based on the information provided in Table 6-8, nine AgDRIFT scenarios were modeled that span the range of foliar spray application rates and conditions that favor higher and lower drift estimates in order to bracket the potential for off-field risks. In addition, the Tier I acute and chronic toxicity endpoints for the honey bee summarized in Table 5.1 were used to determine the distance required to achieve the applicable acute LOC (0.4) and chronic LOC (1.0). These distances can be interpreted as the distance from the edge of the treated field beyond which the acute and chronic LOC values would not be exceeded. In modeling using AgDRIFT, default conditions were used, except for the variations mentioned in the following paragraphs and/or in the tables and footnotes.
19 Available at http://www.epa.gov/pesticide-science-and-assessing-pesticide-risks/models-pesticide-risk-assessment#atmospheric (accessed 11/8/15).

179
Citrus and Pome Fruit (Airblast Application) Citrus and pome fruits have the highest single application rate among all crops for foliar sprays. The only label restriction identified is a minimum of 5 gal/A for tree crops. Ground applications are usually through airblast methods for citrus and pome fruits. Spray drift was modeled using AgDRIFT (Tier I Orchard/Airblast mode of AgDRIFT) with two options: sparse (default) and orchard (Table 6-9). RQ values for contact indicate the acute risk LOC for honey bees is exceeded out to 46 and 66 ft from treated field edge for the sparse and orchard scenarios, respectively. Using screening-level oral exposure estimates, dietary-based RQ values exceed the acute or chronic risk LOC values from 455 to >1000 ft (the limit of model estimation). Table 6-9. Distance from the edge of the field associated with LOC exceedance, for citrus and pome fruits, calculated using AgDRIFT v.1.1.1, the Tier I Orchard/Airblast module, and app rate of 0.25 lbs. a.i./A.
Application
selection
Distance from the field and point estimate of application rate (lbs./A)
App rate lbs./A at ea. LOC and distance associated to app rate
10 ft 25 ft 50 ft 100 ft 150 ft Acute
Contact (0.00637)
Adult Acute Oral (4.86x10⁻⁵ )
Adult Chronic
Oral (4.98x10⁻⁶ )
Larval Chronic
(1.32x10⁻⁴ )
Sparse (young,
dormant)1 0.0571 0.0252 0.0093 0.0026 0.0011 62 581 >1000 455
Orchard2 0.027 0.0126 0.0052 0.0018 0.001 66 >1000 >1000 963
Aerial Application Aerial applications to citrus and pome fruit were modeled using AgDRIFT in Tier II Aerial mode with wind speeds of 10 mph and 15 mph (default) and a range of droplet sizes (fine to medium, medium, medium to coarse), respectively. In the absence of additional label restrictions, the default droplet size utilized in risk assessments is fine to medium. Results indicate that contact RQ values exceed the acute risk LOC from 184 to 318 ft beyond the treated field assuming a wind speed of 15 mph (Table 6-10) and from 141 to 269 ft beyond the treated field assuming a wind speed of 10 mph (Table 6-11). With aerial application, which results in greater amounts of spray drift compared to airblast, acute and chronic Tier I dietary-based RQ values exceed their respective LOCs for more than 1000 ft from the edge of the treated field.

180
Table 6-10. Citrus and Pome Fruits: Tier II aerial applications, boom height 10 ft, wind speed 15 mph (label required), non-volatile rate 0.25 lbs./A, spray volume 5 gal/A
Droplets
Dv0.5 (µm)
Distance from the field and point estimate of application rate
App rate lbs./A at ea. LOC and distance associated to app rate
10 ft 25 ft 50 ft 100 ft 150 ft Acute
Contact (0.00637)
Adult Acute Oral
(4.86x10⁻⁵ )
Adult Chronic
Oral (4.98x10⁻⁶ )
Larval Chronic
(1.32x10⁻⁴ )
F to M 255 0.1408 0.0832 0.0519 0.0305 0.0189 318 >1000 >1000 >1000
M 294 0.1207 0.0705 0.0435 0.0249 0.0148 269 >1000 >1000 >1000
M to C 341 0.1014 0.0575 0.0244 0.0187 0.0107 213 >1000 >1000 >1000
C 385 0.0872 0.049 0.0291 0.0152 0.0088 184 >1000 >1000 >1000 In the Tier II mode, there are additional droplet size options: fine (F) to medium (M; default), medium, and medium to course (C; among others). Table 6-11. Citrus and Pome Fruits: Tier II aerial applications, boom height 10 ft, wind speed 10 mph (label required), non-volatile rate 0.25 lbs./A, spray volume 5 gal/A
Droplets
Dv0.5 (µm)
Distance from the field and point estimate of application rate
App rate lbs./A at ea. LOC and distance associated to app rate
10 ft 25 ft 50 ft 100 ft 150 ft Acute
Contact (0.00637)
Adult Acute Oral (4.86x10⁻⁵ )
Adult Chronic
Oral (4.98x10⁻⁶ )
Larval Chronic
(1.32x10⁻⁴ )
F to M 255 0.0783 0.0506 0.0389 0.021 0.0128 269 >1000 >1000 >1000
M 294 0.0682 0.0429 0.0319 0.0165 0.01 223 >1000 >1000 >1000
M to C 341 0.0573 0.0347 0.025 0.012 0.0071 167 >1000 >1000 >1000
C 385 0.0496 0.0303 0.0205 0.0098 0.0058 141 >1000 >1000 >1000 In the Tier II mode, there are additional droplet size options: fine (F) to medium (M; default), medium, and medium to course (C; among others). Globe Artichoke Globe artichoke represents the second highest foliar spray application rate at 0.126 lbs a.i./A. Only ground applications are allowed according to the label. Two options were modeled using AgDRIFT in the Tier I mode: a high boom height (50 inches; default) and a low boom height (20 inches); and two droplet sizes: very fine to fine and fine to medium/coarse. Results indicate that the contact-based RQ values exceed the acute risk LOC from 10 to 52 ft beyond the treated field assuming a high boom height (Table 6-12) and from 7 to 20 ft beyond the treated field assuming a low boom height (Table 6-13). With the exception of medium/coarse very fine to fine, and fine to medium/coarse droplet size using a low boom height for larval chronic oral risk, the acute and chronic Tier I dietary-based RQ values exceed their respective LOCs for more than 1000 ft from the treated field.

181
Table 6-12. Globe artichoke (only ground apps allowed): Tier I ground applications, high boom height (50 inches), application rate 0.126 lbs. a.i./A, 90th percentile results
Droplets
Dv0.5 (µm)
Distance from the field and point estimate of application rate (lbs./A)
App rate lbs./A at ea. LOC and distance associated to app rate
10 ft 25 ft 50 ft 100 ft 150 ft Acute
Contact (0.00637)
Adult Acute Oral (4.86x10⁻⁵ )
Adult Chronic
Oral (4.98x10⁻⁶ )
Larval Chronic
(1.32x10⁻⁴ )
VF to F 175 0.0327 0.0131 0.0063 0.0031 0.0021 52 >1000 >1000 >1000
F to M/C 341 0.0058 0.0026 0.0015 0.0009 0.0006 10 >1000 >1000 771 For ground applications, there are two droplet size options: very fine (VF) to fine (F), and medium (M)/course (C). Table 6-13. Globe artichoke (only ground apps allowed): Tier I ground applications, low boom height (20 inches), application rate 0.126 lbs. a.i./A, 90th percentile results
Droplets
Dv0.5 (µm)
Distance from the field and point estimate of application rate (lbs./A)
App rate lbs./A at ea. LOC and distance associated to app rate
10 ft 25 ft 50 ft 100 ft 150 ft Acute
Contact (0.00637)
Adult Acute Oral (4.86x10⁻⁵ )
Adult Chronic
Oral (4.98x10⁻⁶ )
Larval Chronic
(1.32x10⁻⁴ )
VF to F 175 0.0116 0.0044 0.0022 0.0012 0.0008 20 >1000 >1000 932
F to M/C 341 0.0035 0.0016 0.0009 0.0006 0.0004 7 >1000 >1000 587 For ground applications, there are two droplet size options: very fine (VF) to fine (F), and medium (M)/course (C).
Stone Fruit and Tree Nuts Stone fruit and tree nuts are examples of crops with label restrictions regarding application volumes for ground and aerial applications. Since the spray volume is not an option in AgDRIFT modeling for ground applications, only aerial applications were modeled assuming wind speeds of 15 mph and 10 mph. Results indicate that the contact-based RQ values exceed the acute risk LOC from 115 to 161 ft beyond the treated field assuming a wind speed of 15 mph (Table 6-14) and from 66 to 115 ft beyond the treated field assuming a wind speed of 10 mph (Table 6-15). All of the Tier I dietary-based RQ values exceed the acute and chronic risk LOCs more than 1000 ft from the treated field. Table 6-14. Stone fruit, Tree nuts: Tier II aerial applications, boom height 10 ft, wind speed 15 mph (label required), non-volatile rate 0.10 lbs./A, spray volume 25 gal/A (label required for these crops)
Droplets
Dv0.5 (µm)
Distance from the field and point estimate of application rate
App rate lbs./A at ea. LOC and distance associated to app rate
10 ft 25 ft 50 ft 100 ft 150 ft Acute
Contact (0.00637)
Adult Acute Oral (4.86x10⁻⁵ )
Adult Chronic
Oral (4.98x10⁻⁶ )
Larval Chronic
(1.32x10⁻⁴ )
F to M 255 0.0553 0.0324 0.02 0.0116 0.007 161 >1000 >1000 >1000
M 294 0.0476 0.0276 0.0168 0.0095 0.0055 138 >1000 >1000 >1000
M to C 341 0.0401 0.0226 0.0136 0.0072 0.004 115 >1000 >1000 >1000
C 385 0.0344 0.0192 0.0113 0.0058 0.0033 92 >1000 >1000 974
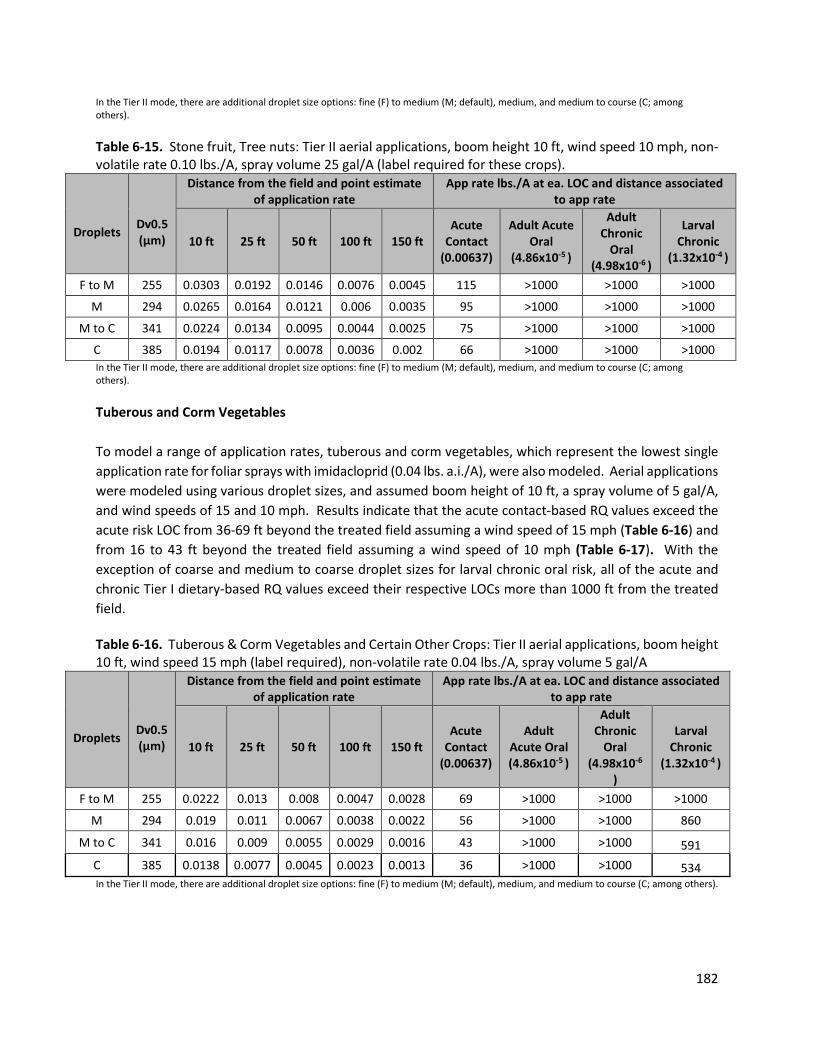
182
In the Tier II mode, there are additional droplet size options: fine (F) to medium (M; default), medium, and medium to course (C; among others). Table 6-15. Stone fruit, Tree nuts: Tier II aerial applications, boom height 10 ft, wind speed 10 mph, non-volatile rate 0.10 lbs./A, spray volume 25 gal/A (label required for these crops).
Droplets
Dv0.5 (µm)
Distance from the field and point estimate of application rate
App rate lbs./A at ea. LOC and distance associated to app rate
10 ft 25 ft 50 ft 100 ft 150 ft Acute
Contact (0.00637)
Adult Acute Oral
(4.86x10⁻⁵ )
Adult Chronic
Oral (4.98x10⁻⁶ )
Larval Chronic
(1.32x10⁻⁴ )
F to M 255 0.0303 0.0192 0.0146 0.0076 0.0045 115 >1000 >1000 >1000
M 294 0.0265 0.0164 0.0121 0.006 0.0035 95 >1000 >1000 >1000
M to C 341 0.0224 0.0134 0.0095 0.0044 0.0025 75 >1000 >1000 >1000
C 385 0.0194 0.0117 0.0078 0.0036 0.002 66 >1000 >1000 >1000 In the Tier II mode, there are additional droplet size options: fine (F) to medium (M; default), medium, and medium to course (C; among others). Tuberous and Corm Vegetables To model a range of application rates, tuberous and corm vegetables, which represent the lowest single application rate for foliar sprays with imidacloprid (0.04 lbs. a.i./A), were also modeled. Aerial applications were modeled using various droplet sizes, and assumed boom height of 10 ft, a spray volume of 5 gal/A, and wind speeds of 15 and 10 mph. Results indicate that the acute contact-based RQ values exceed the acute risk LOC from 36-69 ft beyond the treated field assuming a wind speed of 15 mph (Table 6-16) and from 16 to 43 ft beyond the treated field assuming a wind speed of 10 mph (Table 6-17). With the exception of coarse and medium to coarse droplet sizes for larval chronic oral risk, all of the acute and chronic Tier I dietary-based RQ values exceed their respective LOCs more than 1000 ft from the treated field. Table 6-16. Tuberous & Corm Vegetables and Certain Other Crops: Tier II aerial applications, boom height 10 ft, wind speed 15 mph (label required), non-volatile rate 0.04 lbs./A, spray volume 5 gal/A
Droplets
Dv0.5 (µm)
Distance from the field and point estimate of application rate
App rate lbs./A at ea. LOC and distance associated to app rate
10 ft 25 ft 50 ft 100 ft 150 ft Acute
Contact (0.00637)
Adult Acute Oral (4.86x10⁻⁵ )
Adult Chronic
Oral (4.98x10⁻⁶
)
Larval Chronic
(1.32x10⁻⁴ )
F to M 255 0.0222 0.013 0.008 0.0047 0.0028 69 >1000 >1000 >1000
M 294 0.019 0.011 0.0067 0.0038 0.0022 56 >1000 >1000 860
M to C 341 0.016 0.009 0.0055 0.0029 0.0016 43 >1000 >1000 591 C 385 0.0138 0.0077 0.0045 0.0023 0.0013 36 >1000 >1000 534 In the Tier II mode, there are additional droplet size options: fine (F) to medium (M; default), medium, and medium to course (C; among others).

183
Table 6-17. Tuberous & Corm Vegetables and Certain Other Crops: Tier II aerial applications, boom height 10 ft, wind speed 10 mph, non-volatile rate 0.04 lbs./A, spray volume 5 gal/A
Droplets
Dv0.5 (µm)
Distance from the field and point estimate of application rate
App rate lbs./A at ea. LOC and distance associated to app rate
10 ft 25 ft 50 ft 100 ft 150 ft Acute
Contact (0.00637)
Adult Acute Oral (4.86x10⁻⁵ )
Adult Chronic Oral
(4.98x10⁻⁶ )
Larval Chronic
(1.32x10⁻⁴ )
F to M 255 0.0122 0.008 0.006 0.0031 0.0018 43 >1000 >1000 >1000
M 294 0.0107 0.007 0.005 0.0024 0.0014 30 >1000 >1000 >1000
M to C 341 0.009 0.005 0.004 0.0018 0.001 20 >1000 >1000 673 C 385 0.0078 0.005 0.003 0.0015 0.0008 16 >1000 >1000 551 In the Tier II mode, there are additional droplet size options: fine (F) to medium (M; default), medium, and medium to course (C; among others).
6.1.4. Refined RQs (On-field Oral)
As distinguished from the default Tier I assessment, in cases where residue information in pollen and nectar are available, these data can be used to refine the estimates of oral exposure as well as further characterize the level of risk for other castes of bees using their food consumption rates. These refined exposure estimates in pollen and nectar are then compared to the Tier I (i.e. individual level) toxicity endpoints in a manner similar to that for the model-generated or default Tier I exposure estimates. Rather than reporting the highest exposure estimates for contact and/or dietary exposure routes (as with the default Tier assessment), the Bee-REX model also calculates dietary exposure values and associated RQs for larvae of different ages, adult workers with different tasks (and associated energy requirements) and the queen using the various aforementioned consumption rates. What follows is a summarization of RQs for each use pattern where there are residue data available in pollen and/or nectar. The discussion is organized by the application method employed for a given study. For adult acute oral RQs, the acute EECs (maximum reported concentration among all individual replicates following application) will be compared against the most sensitive acute oral LD50 (0.0039 µg a.i/bee) and for the chronic adult oral and chronic larval oral RQs, the chronic EECs (maximum average concentration among all individual sampling events following application) will be compared against the larval chronic oral (0.0018 µg a.i/bee) and adult chronic oral (0.00016 µg a.i/bee) NOAEC values, respectively. As discussed previously, the refined Tier I assessment focuses only on the oral route of exposure and not contact. Finally, although Bee-REX includes consumption rates for royal jelly, residue information for this matrix is not available from any residue study for imidacloprid. As royal jelly constitutes the exclusive diet of the larval and the adult queen, refined Tier I oral RQs are not provided for the queen (larval and adult). To obviate the need to state it for every analysis described below, the refined oral RQs generally reduced adult acute oral, adult chronic oral, and larval chronic oral RQs by 1-2 orders of magnitude (depending on the caste and life stage), as compared to the screening-level oral Tier I assessment discussed above which relies on model-generated and default exposure values. Nurse bees (6-17 day old workers), nectar foragers, and adult drones were the castes generally associated with highest adult acute oral RQs and adult chronic oral RQs while drones had the highest larval chronic oral RQ.

184
Finally, all available residue studies assessed parent imidacloprid, IMI-olefin, and IMI-5-OH and therefore these combined residues will be referred to as the total residues of imidacloprid. Foliar Applications There are three studies available to characterize the total residues of imidacloprid in pollen and/or nectar resulting from foliar applications (citrus, cherry, cotton). Please refer to Appendix E) for a more detailed discussion of the methods and findings of these studies. Below is a summary of the RQs using the refined estimates of exposure provided by each study. Crop Group 10 – Citrus Fruits (Orange) In the available foliar-applied citrus study conducted in Florida (MRID 49521301), imidacloprid (as Gaucho® 600 FL Admire® Pro SC) was applied twice at 0.25 lbs a.i/A (maximum permitted single application rate for foliar-applied citrus fruits) at a reported 8-10 day interval. Applications were made according to the label in that there was no application at or within 10 days of bloom. Residues in pollen and nectar were assessed in 3 sites across 2 years (although it is noted that the data reflect the residues from two sites only as one site was determined to be directly adjacent to another and therefore considered as the same site). Pollen and nectar samples were taken 7- and 4-days after the last application, respectively. The default exposure estimates within Bee-REX were supplanted with the following values summarized below.
Table 6-18. Summary of the refined acute and chronic estimated environmental concentrations (EECs) for foliar applications on citrus fruits (oranges) based on measured residue data
Matrix1 Acute EEC (ppb)2 Chronic EEC (ppb)3
Pollen 4,100 3,300 Nectar 430 324
1 Refers to hand collected pollen and nectar 2 Acute EEC chosen as the maximum reported concentration among all individual replicates following application 3 Chronic EEC chosen as the maximum average concentration among all individual sampling events following application
Table 6-19 below summaries the refined Tier I oral RQs for various castes of honey bees using the residue data in pollen and nectar from the foliar-applied citrus study. Refined adult acute oral RQs exceeded the LOC of 0.4 for every caste (RQs ranged from 4.8 – 32). Similarly, larval chronic oral RQs and adult chronic oral RQs exceeded the LOC of 1 for every caste (RQs ranged from 14 – 30 and 89 – 592, respectively). Nectar residues were observed to generally decline over time where reliable dissipation half-life (DT50) values could be calculated for the three trial years that ranged from 8.9 – 14.1 days. Although not tabulated below, if acute and chronic nectar concentrations were reduced by 50%, adult acute and chronic oral RQs would still all remain well above the LOC of 1.

185
Table 6-19. Summary of Tier I oral RQs for honey bees using refined exposure estimates with total imidacloprid residues in pollen and nectar from foliar-applications to oranges.1,4
Life stage
Caste or task in hive
Average age (in days)
Consumption Rates5 Acute dose (µg a.i./bee)6
Acute RQ2
Chronic dose (µg a.i./bee)6
Chronic RQ3 Nectar
(mg/day) Pollen (mg/day)
Larval Worker
4 60 1.8
0.025 14 5 120 3.6 0.051 28
Drone 6+ 130 3.6 0.054 30
Adult
Worker (cell cleaning and capping)
0-10 60 6.65 0.053 14 0.041 259
Worker (brood and queen tending, nurse bees)
6 to 17 140 9.6 0.100 26 0.077 482
Worker (comb building, cleaning and food handling)
11 to 18 60 1.7 0.033 8.4 0.025 157
Worker (foraging for pollen)
>18 43.5 0.041 0.019 4.8 0.014 89
Worker (foraging for nectar)
>18 292 0.041 0.126 32 0.095 592
Worker (maintenance of hive in winter)
0-90 29 2 0.021 5.3 0.016 100
Drone >10 235 0.0002 0.101 26 0.076 476 1For life stages or castes that rely exclusively on royal jelly (i.e. larval and adult queen, 1-3 day old worker bees), these rows were removed from the table as residues of imidacloprid in royal jelly are not available. 2 Based on a 48-h acute oral LD50 of 0.0039 ug a.i/bee for imidacloprid (MRID 42273003) 3Based on adult 10-day chronic NOAEC of 0.00016 µg a.i/bee (Boily 2013, MRID 49750601) and larval 21-day chronic NOAEC of 0.0018 µg a.i/larva (MRID 49090506). 4Bolded value exceeds the acute risk LOC of 0.4 or chronic risk LOC of 1. 5From Guidance for Assessing Pesticide Risks to Bees (US EPA et al, 2014) 6Based on concentrations reported in Table 6-18.
Crop Group 12 – Stone Fruits (Cherry) In the available foliar-applied cherry study conducted in New York and Oregon across 2 years (MRID 49535601), imidacloprid (as Gaucho® 600 FL Admire® Pro SC) was applied 5 times at 0.1 lbs a.i/A (maximum permitted single application rate for foliar applications on cherries) at a reported 8-11 day interval per year. For the first year of the trial (2013), applications were made in the fall post-harvest. In the second year of the trial (2014), applications were made pre-harvest during the summer. Residues in pollen and nectar (sampled 208 days after the last application) were assessed at 4 sites across 2 years with the sites in New York being observed to have pollen residues approximately 10X higher as compared to the Oregon sites. Table 6-20 below summarizes the residue values that replaced the screening-level

186
model-generated and default exposure estimates within Bee-REX for the refined oral assessment for foliar-applied stone fruits (cherries).
Table 6-20. Summary of the refined acute and chronic estimated environmental concentrations (EECs) for foliar applications on cherries based on measured residue data
Matrix1 Acute EEC (ppb)2 Chronic EEC (ppb)3
Pollen 1,000 545 Nectar 10 5.6
1 Refers to hand collected pollen and nectar 2 Acute EEC chosen as the maximum reported concentration among all individual replicates following application 3 Chronic EEC chosen as the maximum average concentration among all individual sampling events following application Table 6-21 below summaries the refined Tier I oral RQs for various castes of honey bees using the measured residue data in pollen and nectar from the foliar-applied cherry study. Refinements to Tier I screening-level oral RQs resulted in one caste (pollen foragers) being below the adult acute oral LOC of 0.4. All other castes and life stages exceed the acute risk LOC (RQs ranged from 0.59 – 2.82). Similarly, one caste of larval life stages was below the LOC of 1 for larval chronic oral risk (RQ = 0.72). All other risk estimates for larval castes exceed the chronic risk LOC (RQs ranged from 1.4 – 1.5) as well as all adult castes exceed the chronic risk LOC for adult (RQs ranged from 1.7 – 38). The highest adult acute and chronic oral RQs were associated with the nurse bees which are noted from the table below to have the highest pollen consumption rate of all adult castes within the hive. Acute and chronic EECs for pollen were approximately 100-fold higher than corresponding values for nectar.
Table 6-21. Summary of Tier I oral RQs for honey bees using refined exposure estimates with total imidacloprid residues in pollen and nectar from foliar-applications to cherries1,4
Life stage
Caste or task in hive
Average age (in days)
Consumption Rates5 Acute dose (µg a.i./bee)6
Acute RQ2
Chronic dose (µg a.i./bee)6
Chronic RQ3 Nectar
(mg/day) Pollen (mg/day)
Larval Worker
4 60 1.8
0.0013 0.72 5 120 3.6 0.0026 1.4
Drone 6+ 130 3.6 0.0027 1.5
Adult
Worker (cell cleaning and capping)
0-10 60 6.65 0.0073 1.9 0.0040 25
Worker (brood and queen tending, nurse bees)
6 to 17 140 9.6 0.0110 2.8 0.0060 38
Worker (comb building, cleaning and food handling)
11 to 18 60 1.7 0.0023 0.59 0.0013 7.9
Worker (foraging for pollen)
>18 43.5 0.041 0.0005 0.12 0.0003 1.7
Worker (foraging for nectar)
>18 292 0.041 0.0030 0.76 0.0017 10

187
Life stage
Caste or task in hive
Average age (in days)
Consumption Rates5 Acute dose (µg a.i./bee)6
Acute RQ2
Chronic dose (µg a.i./bee)6
Chronic RQ3 Nectar
(mg/day) Pollen (mg/day)
Worker (maintenance of hive in winter)
0-90 29 2 0.0023 0.59 0.0013 7.8
Drone >10 235 0.0002 0.0024 0.60 0.0013 8.2 1For life stages or castes that rely exclusively on royal jelly (i.e. larval and adult queen, 1-3 day old worker bees), these rows were removed from the table as residues of imidacloprid in royal jelly are not available. 2 Based on a 48-h acute oral LD50 of 0.0039 ug a.i/bee for imidacloprid (MRID 42273003) 3Based on adult 10-day chronic NOAEC of 0.00016 µg a.i/bee (Boily 2013, MRID 49750601) and larval 21-day chronic NOAEC of 0.0018 µg a.i/larva (MRID 49090506). 4Bolded value exceeds the acute risk LOC of 0.4 or chronic risk LOC of 1. 5From Guidance for Assessing Pesticide Risks to Bees (US EPA et al., 2014) 6Based on concentrations reported in Table 6-20.
Crop Group 20 – Oilseed (Cotton) In the available foliar-applied cotton study conducted in California across 2-3 years (MRID 49103301), imidacloprid (as Provado® 1.6F) was applied once at 0.06 lbs a.i/A (represents maximum single application rate but 5-fold less than maximum annual rate) during the bloom period as an aerial application in 2010. Given the persistence of imidacloprid in plant tissues, the resulting residues in nectar may be underestimated. From 2008-2009, it was reported that imidacloprid (as Admire® Pro) was applied via chemigation to other crops on the same fields. It is noted that residues represent only 1 sampling event made post application (6-days after application), and are available for nectar only. The screening-level exposure estimates within Bee-REX were replaced with the following values summarized below. As indicated previously, cotton is the sole member in the oilseed group with registered foliar uses. Table 6-22. Summary of the refined acute and chronic estimated environmental concentrations (EECs) for foliar applications on cotton based on measured residue data
Matrix1 Acute EEC (ppb)2 Chronic EEC (ppb)3
Nectar 66 56 1 Refers to hand collected nectar 2 Acute EEC chosen as the maximum reported concentration among all individual replicates following application 3 Chronic EEC chosen as the maximum average concentration among all individual sampling events following application Although refinements to exposure estimates based on measured residues in nectar reduced adult acute oral, adult chronic oral, and larval chronic oral RQs, all of the acute and chronic RQs are still exceed the acute and chronic risk LOCs of 0.4 and 1, respectively (adult acute RQs range from 0.49 – 4.94; adult chronic oral RQs range from 10 - 102; larval chronic oral RQs range from 1.8 – 4.07). Despite all acute and chronic RQs for adults and larvae being above their respective LOCs, the refined RQs would be expected to be even higher if additional foliar applications were made at the maximum rates/reapplication intervals as permitted on the label.

188
Table 6-23. Summary of Tier I oral RQs for honey bees using refined exposure estimates with total imidacloprid residues in nectar from foliar-applied cotton1,4
Life stage
Caste or task in hive
Average age (in days)
Consumption Rates5 Acute dose (µg a.i./bee)6
Acute RQ2
Chronic dose (µg a.i./bee)6
Chronic RQ3 Nectar
(mg/day) Pollen (mg/day)
Larval Worker
4 60 1.8
0.0034 1.8 5 120 3.6 0.0067 3.7
Drone 6+ 130 3.6 0.0073 4.0
Adult
Worker (cell cleaning and capping)
0-10 60 6.65 0.0040 1.0 0.0034 21
Worker (brood and queen tending, nurse bees)
6 to 17 140 9.6 0.0092 2.4 0.0078 49
Worker (comb building, cleaning and food handling)
11 to 18 60 1.7 0.0040 1.0 0.0034 21
Worker (foraging for pollen)
>18 43.5 0.041 0.0029 0.74 0.0024 15
Worker (foraging for nectar)
>18 292 0.041 0.0193 4.9 0.0164 102
Worker (maintenance of hive in winter)
0-90 29 2 0.0019 0.49 0.0016 10
Drone >10 235 0.0002 0.0155 4.0 0.0132 82 1For life stages or castes that rely exclusively on royal jelly (i.e. larval and adult queen, 1-3 day old worker bees), these rows were removed from the table as residues of imidacloprid in royal jelly are not available. 2 Based on a 48-h acute oral LD50 of 0.0039 ug a.i/bee for imidacloprid (MRID 42273003) 3Based on adult 10-day chronic NOAEC of 0.00016 µg a.i/bee (Boily 2013, MIRD 49750601) and larval 21-day chronic NOAEC of 0.0018 µg a.i/larva (MRID 49090506). 4Bolded value exceeds the acute risk LOC of 0.4 or chronic risk LOC of 1. 5From Guidance for Assessing Pesticide Risks to Bees (US EPA et al., 2014) 6Based on concentrations reported in Table 6-22.
Soil Applications There are seven studies available to characterize the total residues of imidacloprid in pollen and/or nectar resulting from soil applications that include tomato (2 studies), melons, citrus, blueberries, strawberries, and cotton. Please refer to Appendix E) for a more detailed discussion of the methods and findings of these studies. Below is a summary of the RQs using the refined estimates of exposure provided by the residues data from each of the available studies.

189
Crop Group 8 – Fruiting Vegetables (Tomato) For tomato, 2 studies are available, both conducted in California. In one study (MRID 49090503), imidacloprid (as Admire® Pro) was applied via drip chemigation once at 0.18 lbs a.i/A on 3 sites and two applications of 0.13 lbs a.i/A via drip chemigation on 6 sites (study conducted from 2009-2010). These two scenarios represent 66 and 47% of the maximum permitted seasonal rate on fruiting vegetables including tomato, respectively. The fields in this study were characterized as having medium and fine (heavy) soil types. As tomatoes do not produce nectar, only pollen data are available. In another study (MRID 49665201), one application of imidacloprid (as Admire® Pro Systemic Protectant SC) was made at 0.38 lbs a.i/A (maximum permitted single application rate on tomatoes) via soil drip/drench. As with the study discussed above, there were no nectar residues sampled in this study. Total residues of imidacloprid were analyzed from bumble bee-collected pollen where bees were enclosed in tents during the pollen collection period. This study was conducted across 2 years (2013 – 2014) with Year 2 still ongoing for 5 sites that were characterized as having fine, medium, and coarse soils. Table 6-24 below summarizes the pollen residue information from the two available residues studies for soil-applied tomato. It is noted that for the first study (MRID 49090503), pollen sampling was 100 days after application while it occurred 36 – 38 days after sampling for the second study (MRID 49665201).
Table 6-24. Summary of the refined acute and chronic estimated environmental concentrations (EECs) for soil applications on tomatoes based on measured residue data.
Matrix Acute EEC (ppb)1 Chronic EEC (ppb)2 Reference Pollen (including anthers) 543 463 MRID 49090503
Pollen (bee collected) 242 198 MRID 49665201 Values in bold represent those that will replace model-generated exposure values within Bee-REX. 1 Acute EEC chosen as the maximum reported concentration among all individual replicates following application. 2 Chronic EEC chosen as the maximum average concentration among all individual sampling events following application. 3Residues are 2 composites from a single sampling time of 66 – 47% of the maximum seasonal rate permitted.
Refined oral RQs indicate that adult acute oral RQs are generally below the acute risk LOC of 0.4 or marginally above for cell cleaning and nurse bee castes (RQs range from <0.01 – 0.60). Larval chronic oral RQs were all below the chronic risk LOC of 1 (RQs range from 0.19 – 0.39). Adult chronic oral RQs range from <0.01 – 12 where the castes above the LOC were generally those with an appreciable percentage of their diet as pollen as with the acute oral RQs (workers less than 10 days old, nurse bees).
Table 6-25. Summary of Tier I oral RQs for honey bees using refined exposure estimates with total imidacloprid residues in pollen from soil-applications to tomatoes1,4
Life stage
Caste or task in hive
Average age (in days)
Consumption Rates5 Acute dose (µg a.i./bee)6
Acute RQ2
Chronic dose (µg a.i./bee)6
Chronic RQ3 Nectar
(mg/day) Pollen (mg/day)
Larval Worker
4 60 1.8
3.56E-04 0.19 5 120 3.6 7.13E-04 0.39
Drone 6+ 130 3.6 7.13E-04 0.39

190
Life stage
Caste or task in hive
Average age (in days)
Consumption Rates5 Acute dose (µg a.i./bee)6
Acute RQ2
Chronic dose (µg a.i./bee)6
Chronic RQ3 Nectar
(mg/day) Pollen (mg/day)
Adult
Worker (cell cleaning and capping)
0-10 60 6.65 1.61E-03 0.41 1.32E-03 8.2
Worker (brood and queen tending, nurse bees)
6 to 17 140 9.6 2.32E-03 0.60 1.90E-03 12
Worker (comb building, cleaning and food handling)
11 to 18 60 1.7 4.11E-04 0.11 3.37E-04 2.1
Worker (foraging for pollen)
>18 43.5 0.041 9.92E-06 <0.01 8.12E-06 0.05
Worker (foraging for nectar)
>18 292 0.041 9.92E-06 <0.01 8.12E-06 0.05
Worker (maintenance of hive in winter)
0-90 29 2 4.84E-04 0.12 3.96E-04 2.5
Drone >10 235 0.0002 4.84E-08 <0.01 3.96E-08 <0.1 1For life stages or castes that rely exclusively on royal jelly (i.e. larval and adult queen, 1-3 day old worker bees), these rows were removed from the table as residues of imidacloprid in royal jelly are not available. 2 Based on a 48-h acute oral LD50 of 0.0039 ug a.i/bee for imidacloprid (MRID 42273003) 3Based on adult 10-day chronic NOAEC of 0.00016 µg a.i/bee (Boily 2013, MRID 49750601) and larval 21-day chronic NOAEC of 0.0018 µg a.i/larva (MRID 49090506). 4Bolded value exceeds the acute risk LOC of 0.4 or chronic risk LOC of 1. 5From Guidance for Assessing Pesticide Risks to Bees (US EPA et al., 2014) 6Based on concentrations reported in Table 6-24.
Crop Group 9 – Cucurbit Vegetables (Melon) For the available soil-applied melon study (reported as cantaloupes and unknown species), imidacloprid (as Admire® Pro, Alias®, and an unknown formulation) was applied at applications rates ranging from 0.23 – 0.38 lbs a.i/A via soil drip or a seed line drench at the time of transplant, representing 61 – 100% of the maximum rate for soil application to Crop Group 8). The study was conducted in California across 10 sites from 2008 – 2011 on commercial fields characterized as having medium to fine (heavy) soils. Sampling of trapped pollen and hive-collected nectar occurred approximately 90 – 120 days after application. The bees Table 6-26 below summarizes the residue values in pollen and nectar to supplant the default estimates for soil applied melon.
Table 6-26. Summary of the refined acute and chronic estimated environmental concentrations (EECs) for soil applications on melons based on measured residue data.
Matrix Acute EEC (ppb)1 Chronic EEC (ppb)2
Pollen (trapped) 32 19 Nectar (hive collected)3 8 4.9

191
1 Acute EEC chosen as the maximum reported concentration among all individual replicates following application 2 Chronic EEC chosen as the maximum average concentration among all individual sampling events following application 3It was noted that the majority of the nectar samples were taken 9-11 days after the bees had been placed into tents. Refined oral RQs for imidacloprid-treated melon via soil applications indicate that adult acute oral RQs are generally below the acute risk LOC of 0.4 (RQs range from <0.01 – 0.60) with nectar foraging worker bees and drones representing the two castes marginally above the acute risk LOC. None of the larval chronic oral RQs exceed the chronic risk LOC of 1. Chronic oral RQs for all castes of adults exceed the chronic risk LOC (RQs range from 1.1 – 8.9), with the same castes as mentioned above associated with the highest RQs.
Table 6-27. Summary of Tier I oral RQs for honey bees using refined exposure estimates with total imidacloprid residues in pollen and nectar from soil-applications to melons.1,4
Life stage
Caste or task in hive
Average age (in days)
Consumption Rates5 Acute dose (µg a.i./bee)6
Acute RQ2 Chronic dose (µg a.i./bee)6
Chronic RQ3 Nectar
(mg/day) Pollen (mg/day)
Larval Worker
4 60 1.8
3.28E-04 0.18 5 120 3.6 6.56E-04 0.36
Drone 6+ 130 3.6 7.05E-04 0.39
Adult
Worker (cell cleaning and capping)
0-10 60 6.65 6.93E-04 0.18 4.20E-04 2.6
Worker (brood and queen tending, nurse bees)
6 to 17 140 9.6 1.43E-03 0.37 8.68E-04 5.4
Worker (comb building, cleaning and food handling)
11 to 18 60 1.7 5.34E-04 0.14 3.26E-04 2.0
Worker (foraging for pollen)
>18 43.5 0.041 3.49E-04 0.09 2.14E-04 1.3
Worker (foraging for nectar)
>18 292 0.041 2.34E-03 0.60 1.43E-03 8.9
Worker (maintenance of hive in winter)
0-90 29 2 2.96E-04 0.08 1.80E-04 1.1
Drone >10 235 0.0002 1.88E-03 0.48 1.15E-03 7.2 1For life stages or castes that rely exclusively on royal jelly (i.e. larval and adult queen, 1-3 day old worker bees), these rows were removed from the table as residues of imidacloprid in royal jelly are not available. 2 Based on a 48-h acute oral LD50 of 0.0039 ug a.i/bee for imidacloprid (MRID 42273003) 3Based on adult 10-day chronic NOAEC of 0.00016 µg a.i/bee (Boily 2013, MRID 49750601) and larval 21-day chronic NOAEC of 0.0018 µg a.i/larva (MRID 49090506). 4Bolded value exceeds the acute risk LOC of 0.4 or chronic risk LOC of 1. 5From Guidance for Assessing Pesticide Risks to Bees (US EPA et al., 2014) 6Based on concentrations reported in Table 6-26.

192
Crop Group 10 – Citrus Fruits (Orange/Grapefruit) For citrus, two studies (MRIDs 49090504 and 49090505) conducted multiple trials with citrus in California both in tunnels and in open fields of oranges, tangerines, and grapefruits. All trials involved one application of imidacloprid (as Admire® Pro) at 0.5 lbs a.i/A (maximum single application rate permitted for soil-applied citrus) as a post-bloom soil drench except one trial which used an unspecified formulation as 0.25 lbs a.i/A. The soils types were characterized as loam for some sites, sandy loam for others, and was not provided for two sites. Across all trials within the study, maximum individual residues across all replicates (acute EEC) in nectar (hand-collected) ranged from 18.3 – 35.5 and the maximum average concentration among all individual sampling events (chronic EEC) ranged from 9.4 – 23.8 ppb. Two trials also reported residues for bee-collected nectar which were generally similar in levels as those reported for hand-collected nectar. These same two trials also reported residues for hive nectar which for one trial was just below hand-collected nectar residues and for the other study was roughly 3-fold higher than that of hand-collected nectar, indicating an uncertain relationship between the two methods of sampling from these two trials. The sampling interval was the same for both trials (230 days after application); the study with higher hive nectar values was conducted in a flight tunnel, while the other trial was conducted in an open field, suggesting that the open field bees could have had access alternative sources of forage to dilute the level of imidacloprid in the hive nectar stores as compared to the tunnel-confined bees. Finally, only one trial provided pollen data and is the sole trial within the study which did not test the maximum single application rate. Therefore, the trial with the highest acute EEC value in nectar (hand-collected) and its corresponding chronic value will be used for refined Tier I assessment purposes.
Table 6-28. Summary of the refined acute and chronic estimated environmental concentrations (EECs) for soil applications to citrus based on measured residue data.
Matrix1 Acute EEC (ppb)2 Chronic EEC (ppb)2 Component (inclusive of both MRID 49090504 and 49090505)
Nectar 34.6 21.2 Oranges, 1 x 0.5 lbs. a.i/A; post bloom, tunnel Nectar (bee collected) 37.1 17.5
Nectar (hive collected) 95.2 72.8 Nectar 18.3 9.4
Oranges/tangerines, 1 x 0.25 lbs. a.i/A, post bloom, open field
Nectar (bee collected) 16.0 7.6 Nectar (hive collected) 15.5 11.6 Pollen (trapped) 10.2 9.4
Nectar 29.1 19.3 Oranges, 1 x 0.5 lbs. a.i/A, post-bloom, open field
Nectar 35.5 23.8 Grapefruit, 1 x 0.5 lbs. a.i/A, post bloom, open field
Values in bold represent those that will replace model-generated exposure values within Bee-REX. 1Unless otherwise indicated, nectar is hand-collected. 2 Acute EEC chosen as the maximum reported concentration among all individual replicates following application. 3 Chronic EEC chosen as the maximum average concentration among all individual sampling events following application. Table 6-29 below summarizes the refined Tier I oral RQs for the various castes of larval and adult bees using nectar residue data from soil-applied citrus. Adult acute oral RQs were above the LOC of 0.4 with the exception of worker bees maintaining the hive overwintering, likely due to a decreased nectar

193
consumption rate relative to all other adult castes (RQs ranged from 0.26 – 2.1). The adult castes with the highest nectar consumption rates (nectar foragers, drones) were associated with the highest acute oral RQs. Similarly, these castes also had the highest adult chronic oral RQs (43 and 35, respectively) as well as all other adult castes having RQs above the LOC of 1 (RQs ranged from 4.3 – 43). Larval chronic oral RQs were above the LOC for two castes (RQs ranged from 0.78 – 1.7). While the acute and chronic RQs using refined data from soil-applied citrus are noted to be generally one order of magnitude lower than those discussed above using residue data from foliar-applied citrus, it is noted that the pollen residue data is not available from the soil applied citrus study that yielded the highest nectar residues and was therefore used for the refined Tier I analysis presented below. Pollen residues in the foliar-applied citrus study were noted to be as high as 4,100 ppb but it is an uncertainty as to the magnitude of these residues resulting from soil application. Additionally, it is noted that residue data from the soil applied citrus studies originate from post-bloom applications of imidacloprid whereas for the foliar residue study, applications were made at 10 days pre-bloom.
Table 6-29. Summary of Tier I oral RQs for honey bees using refined exposure estimates with total imidacloprid residues in nectar from soil applications to citrus1,4
Life stage
Caste or task in hive
Average age (in days)
Consumption Rates5 Acute dose (µg a.i./bee)6
Acute RQ2 Chronic dose (µg a.i./bee)6
Chronic RQ3 Nectar
(mg/day) Pollen (mg/day)
Larval Worker
4 60 1.8
0.0014 0.78 5 120 3.6 0.0029 1.6
Drone 6+ 130 3.6 0.0031 1.7
Adult
Worker (cell cleaning and capping)
0-10 60 6.65 0.0021 0.55 0.0014 8.9
Worker (brood and queen tending, nurse bees)
6 to 17 140 9.6 0.0050 1.3 0.0033 21
Worker (comb building, cleaning and food handling)
11 to 18 60 1.7 0.0021 0.55 0.0014 8.9
Worker (foraging for pollen)
>18 43.5 0.041 0.0015 0.40 0.0010 6.5
Worker (foraging for nectar)
>18 292 0.041 0.0104 2.7 0.0069 43
Worker (maintenance of hive in winter)
0-90 29 2 0.0010 0.26 0.0007 4.3
Drone >10 235 0.0002 0.0083 2.1 0.0056 35 1For life stages or castes that rely exclusively on royal jelly (i.e. larval and adult queen, 1-3 day old worker bees), these rows were removed from the table as residues of imidacloprid in royal jelly are not available. 2 Based on a 48-h acute oral LD50 of 0.0039 ug a.i/bee for imidacloprid (MRID 42273003) 3Based on adult 10-day chronic NOAEC of 0.00016 µg a.i/bee (Boily 2013, MRID 49750601) and larval 21-day chronic NOAEC of 0.0018 µg a.i/larva (MRID 49090506).

194
4Bolded value exceeds the acute risk LOC of 0.4 or chronic risk LOC of 1. 5From Guidance for Assessing Pesticide Risks to Bees (US EPA et al., 2014) 6Based on concentrations reported in Table 6-28.
Crop Group 13 – Berries and Small Fruits (Blueberry) In a study conducted across New York, Michigan, and Illinois from 2012 – 2013 (MRID 49535602), imidacloprid as Admire® Pro 600 SC, as applied once at 0.5 lbs a.i/A (maximum single application rate permitted on blueberries) 3 days post-harvest as a banded soil application. Bee-collected pollen and hive nectar were sampled 240 and 233 days later, respectively. During the collection period, the bees were housed in tents to ensure the collected residues were not diluted by other sources of forage. It was reported that the experimental fields varied with respect to soil composition, being characterized as either sandy or silt loam, with the highest residues being reported in the sandy soils. Residues were also reported to have either remained relatively consistent or increased during the course of the trial though there was no clear indication of year-to-year carryover. Table 6-30 below summarizes the acute and chronic EECs for measured pollen and nectar residues after soil-applications to blueberries.
Table 6-30. Summary of the refined acute and chronic EECs in pollen and nectar following soil applications to blueberries based on measured residue data.
Matrix Acute EEC (ppb)1 Chronic EEC (ppb)2
Pollen (bee-collected) 42 16.5 Nectar (hive-collected) 16 8.8
1 Acute EEC chosen as the maximum reported concentration among all individual replicates following application 2 Chronic EEC chosen as the maximum average concentration among all individual sampling events following application Table 6-31 below summarizes the refined Tier I oral RQs for the various castes of larval and adult bees using measured nectar residue data following soil applications to blueberries. Adult acute oral RQs are either below or marginally above the acute risk LOC of 0.4 (RQs range 0.14 – 1.2) with the highest RQs associated with nurse bee, nectar forager, and drone castes. Chronic adult oral RQs are above the chronic risk LOC of 1 for all castes (RQs range from 2.4 – 16); however, larval chronic oral RQs are below the chronic risk LOC for all castes (RQs range from 0.30 – 0.66).
Table 6-31. Summary of Tier I oral RQs for honey bees using refined exposure estimates with measured total imidacloprid residues in pollen and nectar following soil applications to blueberries1,4
Life stage
Caste or task in hive
Average age (in days)
Consumption Rates5 Acute dose (µg a.i./bee)6
Acute RQ2
Chronic dose (µg a.i./bee)6
Chronic RQ3 Nectar
(mg/day) Pollen (mg/day)
Larval Worker
4 60 1.8
5.58E-04 0.30 5 120 3.6 1.12E-03 0.61
Drone 6+ 130 3.6 1.20E-03 0.66
Adult
Worker (cell cleaning and capping)
0-10 60 6.65 1.24E-03 0.32 6.38E-04 4.0
Worker (brood and queen tending, nurse bees)
6 to 17 140 9.6 2.64E-03 0.68 1.39E-03 8.7

195
Life stage
Caste or task in hive
Average age (in days)
Consumption Rates5 Acute dose (µg a.i./bee)6
Acute RQ2
Chronic dose (µg a.i./bee)6
Chronic RQ3 Nectar
(mg/day) Pollen (mg/day)
Worker (comb building, cleaning and food handling)
11 to 18 60 1.7 1.03E-03 0.26 5.56E-04 3.5
Worker (foraging for pollen)
>18 43.5 0.041 6.98E-04 0.18 3.83E-04 2.4
Worker (foraging for nectar)
>18 292 0.041 4.67E-03 1.2 2.57E-03 16
Worker (maintenance of hive in winter)
0-90 29 2 5.48E-04 0.14 2.88E-04 1.8
Drone >10 235 0.0002 3.76E-03 0.96 2.07E-03 13 1For life stages or castes that rely exclusively on royal jelly (i.e. larval and adult queen, 1-3 day old worker bees), these rows were removed from the table as residues of imidacloprid in royal jelly are not available. 2 Based on a 48-h acute oral LD50 of 0.0039 ug a.i/bee for imidacloprid (MRID 42273003) 3Based on adult 10-day chronic NOAEC of 0.00016 µg a.i/bee (Boily 2013, MRID 49750601) and larval 21-day chronic NOAEC of 0.0018 µg a.i/larva (MRID 49090506). 4Bolded value exceeds the acute risk LOC of 0.4 or chronic risk LOC of 1. 5From Guidance for Assessing Pesticide Risks to Bees (US EPA et al., 2014) 6Based on concentrations reported in Table 6-30.
Crop Group 13 – Berries and Small Fruits (Strawberry) In a study conducted in California from 2010-2011 (MRID 49090502), imidacloprid (as Alias® 4F, Admire® Pro, and an unknown formulation) was applied once at 0.5 lbs a.i/A (maximum permitted single application rate for soil-applied strawberries). Only pollen samples were available but it was not reported the interval between application and sampling (field portion of this study was not conducted under GLP). The soils of the treatment plots were characterized as coarse (sandy) and medium (loamy) soils with measured residues in pollen generally reported as being higher for sandy soils. Table 6-32 below summarizes the acute and chronic EECs for pollen and nectar residues from soil applications to strawberries.
Table 6-32. Summary of the refined acute and chronic EECs for soil applications to strawberries based on measured residue data.
Matrix1 Acute EEC (ppb)2 Chronic EEC (ppb)3
Pollen 320 280 1Refers to hand collected pollen 2Acute EEC chosen as the maximum reported concentration among all individual replicates following application 3Chronic EEC chosen as the maximum average concentration among all individual sampling events following application Table 6-33 below summarizes the refined Tier I oral RQs for the various castes of larval and adult bees using measured pollen residue data from soil applications to strawberries. Adult acute oral RQs are either below or marginally above the acute risk LOC of 0.4 with cleaning bees and nurse bees having the highest RQs of all adult castes assessed (RQs range from <0.01 – 0.79). These castes are associated with the

196
highest pollen consumption rates, which is the sole matrix from which residue data are available. Similarly, adult chronic oral RQs exceeded the chronic risk LOC of 1 for these castes as well as comb building worker and overwintering maintenance worker castes (RQs range from <0.1 – 17). Nectar and pollen foraging bees were the only two castes below the chronic risk LOC, and also have pollen consumption rates of less than 0.1 mg/day. Larval chronic oral RQs are below the chronic risk LOC of 1 for all castes assessed (RQs range from 0.28 – 0.55). Honey bees are attracted to both pollen and nectar of strawberries and there is uncertainty regarding RQs had nectar residue data been available to further refine exposure estimates.
Table 6-33. Summary of Tier I oral RQs for honey bees using refined exposure estimates with measured imidacloprid residues in pollen from soil applications to strawberries1,4
Life stage
Caste or task in hive
Average age (in days)
Consumption Rates5 Acute dose (µg a.i./bee)6
Acute RQ2
Chronic dose (µg a.i./bee)6
Chronic RQ3 Nectar
(mg/day) Pollen (mg/day)
Larval Worker
4 60 1.8
5.04E-04 0.28 5 120 3.6 1.01E-03 0.55
Drone 6+ 130 3.6 1.01E-03 0.55
Adult
Worker (cell cleaning and capping)
0-10 60 6.65 2.13E-03 0.55 1.86E-03 12
Worker (brood and queen tending, nurse bees)
6 to 17 140 9.6 3.07E-03 0.79 2.69E-03 17
Worker (comb building, cleaning and food handling)
11 to 18 60 1.7 5.44E-04 0.14 4.76E-04 3.0
Worker (foraging for pollen)
>18 43.5 0.041 1.31E-05 <0.01 1.15E-05 0.1
Worker (foraging for nectar)
>18 292 0.041 1.31E-05 <0.01 1.15E-05 0.1
Worker (maintenance of hive in winter)
0-90 29 2 6.40E-04 0.16 5.60E-04 3.5
Drone >10 235 0.0002 6.40E-08 <0.01 5.60E-08 <0.01 1For life stages or castes that rely exclusively on royal jelly (i.e. larval and adult queen, 1-3 day old worker bees), these rows were removed from the table as residues of imidacloprid in royal jelly are not available. 2 Based on a 48-h acute oral LD50 of 0.0039 ug a.i/bee for imidacloprid (MRID 42273003) 3Based on adult 10-day chronic NOAEC of 0.00016 µg a.i/bee (Boily 2013, MRID 49750601) and larval 21-day chronic NOAEC of 0.0018 µg a.i/larva (MRID 49090506). 4Bolded value exceeds the acute risk LOC of 0.4 or chronic risk LOC of 1. 5From Guidance for Assessing Pesticide Risks to Bees (US EPA et al., 2014) 6Based on concentrations reported in Table 6-30.

197
Crop Group 20 – Oilseed (Cotton) In a study conducted in California from 2013-2014 (MRID 49665202), imidacloprid (as Admire® Pro SC) was applied once at 0.33 lbs a.i/A (maximum permitted single application rate for soil-applied cotton) as an in-furrow spray at planting. Pollen, nectar, and extra-floral nectar samples were obtained 78 days after application. The study was conducted across 9 sites where 2 soil plots were characterized as fine (heavy), 1 as medium, and 6 as coarse (light) texture. Table 6-34 below summarizes the acute and chronic EECs for measured pollen and nectar residues from soil applications to cotton. As indicated below, floral nectar samples were higher in this study and therefore will be used as the nectar values for modeling purposes. As indicated previously, cotton represents the sole member of the oilseed group with registered soil uses.
Table 6-34. Summary of the refined acute and chronic EECs for soil applications on cotton based on measured residue data.
Matrix1 Acute EEC (ppb)2 Chronic EEC (ppb)3
Pollen 43.4 41.1 Nectar 127 83.1 Extra-floral nectar 35.9 35.9
Values in bold represent those that will replace screening-level exposure values within Bee-REX 1Refers to hand collected pollen and nectar 2Acute EEC chosen as the maximum reported concentration among all individual replicates following application 3Chronic EEC chosen as the maximum average concentration among all individual sampling events following application Table 6-35 below summarizes the refined Tier I oral RQs for the various castes of larval and adult bees using measured nectar residue data from soil applications to cotton. All castes of adult bee exceed the acute risk LOC of 0.4 from oral exposure (RQs range from 0.97 – 9.51) with the highest RQs are associated with the nurse bees, nectar foragers, and drones. This is also the case for the adult chronic oral RQs for these castes as well as all other adult castes assessed (RQs range from 16 – 152). Larval chronic oral RQs are also above the chronic risk LOC of 1 for all castes assessed (RQs range from 2.8 -6.0). The acute and chronic RQs are all higher but within a factor of 2 as compared to the RQs for the refined foliar-applied cotton analysis. This is likely due to the addition of pollen data for the soil-applied study (foliar study was nectar only), as well as a higher application rate.
Table 6-35. Summary of Tier I oral RQs for honey bees using refined exposure estimates with measured total imidacloprid residues in pollen and nectar from soil-applications to cotton.1,4
Life stage
Caste or task in hive
Average age (in days)
Consumption Rates5 Acute dose (µg a.i./bee)6
Acute RQ2 Chronic dose (µg a.i./bee)6
Chronic RQ3 Nectar
(mg/day) Pollen (mg/day)
Larval Worker
4 60 1.8
0.0051 2.8 5 120 3.6 0.0101 5.5
Drone 6+ 130 3.6 0.0110 6.0
Adult
Worker (cell cleaning and capping)
0-10 60 6.65 0.0079 2.0 0.0053 33
Worker (brood and queen tending, nurse bees)
6 to 17 140 9.6 0.0182 4.7 0.0120 75

198
Life stage
Caste or task in hive
Average age (in days)
Consumption Rates5 Acute dose (µg a.i./bee)6
Acute RQ2 Chronic dose (µg a.i./bee)6
Chronic RQ3 Nectar
(mg/day) Pollen (mg/day)
Worker (comb building, cleaning and food handling)
11 to 18 60 1.7 0.0077 2.0 0.0051 32
Worker (foraging for pollen)
>18 43.5 0.041 0.0055 1.4 0.0036 23
Worker (foraging for nectar)
>18 292 0.041 0.0371 9.5 0.0243 152
Worker (maintenance of hive in winter)
0-90 29 2 0.0038 0.97 0.0025 16
Drone >10 235 0.0002 0.0298 7.7 0.0195 122 1For life stages or castes that rely exclusively on royal jelly (i.e. larval and adult queen, 1-3 day old worker bees), these rows were removed from the table as residues of imidacloprid in royal jelly are not available. 2 Based on a 48-h acute oral LD50 of 0.0039 ug a.i/bee for imidacloprid (MRID 42273003) 3Based on adult 10-day chronic NOAEC of 0.00016 µg a.i/bee (Boily 2013, MRID 49750601) and larval 21-day chronic NOAEC of 0.0018 µg a.i/larva (MRID 49090506). 4Bolded value exceeds the acute risk LOC of 0.4 or chronic risk LOC of 1. 5From Guidance for Assessing Pesticide Risks to Bees (US EPA et al., 2014) 6Based on concentrations reported in Table 6-34.
Seed Treatment Applications There is one study available to characterize the total residues of imidacloprid in pollen resulting from seed treatment application to corn. Please refer to Appendix E for a more detailed discussion of the methods and findings of these studies. Below is a summary of the RQs using the refined estimates of exposure. Crop Group 15 – Cereal Grains (Corn) In a study conducted across 3 sites in Kansas and Nebraska from 2012-2013 (MRID 49511701), imidacloprid (as Gaucho® 600 ST) was applied at a rate of 1.34 mg a.i/seed (0.12 lbs a.i/A) which is equivalent to the maximum labeled rate for field corn as a seed treatment. Pollen samples were taken 84 days after application. As the corn plant does not produce nectar, only pollen residue data are available from this study. The study was conducted on fields that were characterized as loam, silty loam, and clay soils. Residues appeared to increase during the sampling time. Table 6-36 below summarizes the acute and chronic EECs for pollen residues in seed-treated corn used to supplant default values in Bee-REX for refined Tier I assessment purposes.
Table 6-36. Summary of the refined acute and chronic EECs for seed treatment applications on corn based on measured residue data.
Matrix1 Acute EEC (ppb)2 Chronic EEC (ppb)3
Pollen 39.7 22.3 1Refers to hand collected pollen 2Acute EEC chosen as the maximum reported concentration among all individual replicates following application

199
3Chronic EEC chosen as the maximum average concentration among all individual sampling events following application Table 6-37 below summarizes the refined Tier I oral RQs for the various castes of larval and adult bees using nectar residue data from seed-treated corn. The RQ values for all castes of adult bee are below the acute risk LOC of 0.4 for oral exposure (RQs range from <0.01 – 0.1). The highest RQ is associated with the nurse bee caste given their high pollen consumption rate relative to other adult castes. Similarly, there are no larval chronic oral RQs that exceed the chronic risk LOC of 1 (RQs range from 0.02 – 0.04). For adult chronic oral risk, all castes are below LOC except for the nurse bee caste, which is marginally above the LOC (RQs range from <0.01 – 1.34).
Table 6-37. Summary of Tier I oral RQs for honey bees using refined exposure estimates with total imidacloprid residues in pollen and nectar from seed-treated corn1,4
Life stage
Caste or task in hive
Average age (in days)
Consumption Rates5 Acute dose (µg a.i./bee)6
Acute RQ2 Chronic dose (µg a.i./bee)6
Chronic RQ3 Nectar
(mg/day) Pollen (mg/day)
Larval Worker
4 60 1.8
4.01E-05 0.02 5 120 3.6 8.03E-05 0.04
Drone 6+ 130 3.6 8.03E-05 0.04
Adult
Worker (cell cleaning and capping)
0-10 60 6.65 2.64E-04 0.07 1.48E-04 0.93
Worker (brood and queen tending, nurse bees)
6 to 17 140 9.6 3.81E-04 0.10 2.14E-04 1.34
Worker (comb building, cleaning and food handling)
11 to 18 60 1.7 6.75E-05 0.02 3.79E-05 0.24
Worker (foraging for pollen)
>18 43.5 0.041 1.63E-06 <0.01 9.14E-07 0.01
Worker (foraging for nectar)
>18 292 0.041 1.63E-06 <0.01 9.14E-07 0.01
Worker (maintenance of hive in winter)
0-90 29 2 7.94E-05 0.02 4.46E-05 0.28
Drone >10 235 0.0002 7.94E-09 <0.01 4.46E-09 <0.01 1For life stages or castes that rely exclusively on royal jelly (i.e., larval and adult queen, 1-3 day old worker bees), these rows were removed from the table as residues of imidacloprid in royal jelly are not available. 2 Based on a 48-h acute oral LD50 of 0.0039 µg a.i/bee for imidacloprid (MRID 42273003) 3Based on adult 10-day chronic NOAEC of 0.00016 µg a.i/bee (Boily 2013, MRID 49750601) and larval 21-day chronic NOAEC of 0.0018 µg a.i/larva (MRID 49090506). 4Bolded value exceeds the acute risk LOC of 0.4 or chronic risk LOC of 1. 5From Guidance for Assessing Pesticide Risks to Bees (US EPA et al., 2014). 6Based on concentrations reported in Table 6-36.

200
Combined Method Applications There are three studies available to characterize the total residues of imidacloprid in pollen and/or nectar resulting from multiple methods of application. This flexibility in multiple types of applications within the same growing season is permitted for most use patterns of imidacloprid so long as the annual application rate does not exceed 0.50 lbs a.i/A. Two studies examine the total residues in tomato and cotton resulting from a soil application followed by two and three foliar applications, respectively (MRIDs 49665201 and 49665201, respectively). Both of these studies are also discussed in the soil section (same respective MRID numbers) where the residues were quantified before foliar applications were made. A third study examines the residues in pollen and nectar of seed-treated cotton followed by 5 foliar applications. Appendix E provides a more detailed discussion of the methods and findings of these studies. Below is a summary of the RQs using the refined estimates of exposure provided by each study. Crop Group 8 – Fruiting Vegetables (Tomato – Soil + Foliar) In a study conducted across 9 sites in California in 2013-2014 (MRID 49665201), imidacloprid (as Admire® Pro SC) was applied at a rate of 0.38 lbs a.i/A at transplant (as described in the soil application above) which was followed by two foliar applications of Admire® Pro SC at 0.06 lbs a.i/A with a reported 4-5 day interval at bloom. Bumble bee-collected pollen were sampled 2-8 days after application (nectar samples not collected as the tomato crop does not produce it). The study was conducted on fields that were characterized as having fine, medium, or coarse textures. Table 6-38 below summarizes the acute and chronic EECs for pollen residues from soil + foliar-applications to tomato. Pollen residue data alone are available as the tomato plant does not produce nectar. As compared to the soil treatment alone component of the same study, it is noted that the acute and chronic EECs are over 6-fold higher when the foliar component is added.
Table 6-38. Summary of the refined acute and chronic EECs for combined (soil + foliar) applications to tomato based on measured residue data
Matrix Acute EEC (ppb)1 Chronic EEC (ppb)2
Pollen (bee collected) 1521 1268 1Acute EEC chosen as the maximum reported concentration among all individual replicates following application. 2Chronic EEC chosen as the maximum average concentration among all individual sampling events following application. Table 6-39 below summarizes the refined Tier I oral RQs for the various castes of larval and adult bees using pollen residue data from combined soil + foliar applications to tomatoes. Oral RQs for adult castes with an appreciable percentage of their diet as pollen exceed the acute and chronic risk LOC of 0.4 and 1, respectively. These castes include cleaning, nurse, and comb building, and hive maintenance workers (acute RQs range from 0.02 – 3.7, chronic RQs range from <0.01 - 76). Larval chronic oral RQs exceed the chronic risk LOC for all castes assessed (RQs range from 1.2 – 2.5). Pollen foraging workers did not exceed the acute or chronic risk LOCs given their low pollen consumption rate. The added foliar component increased the RQs over 6 fold relative to the respective RQs of the soil component-applied alone component.

201
Table 6-39. Summary of Tier I oral RQs for honey bees using refined exposure estimates with measured imidacloprid residues in pollen from combined soil + foliar-applications to tomatoes.1,4
Life stage
Caste or task in hive
Average age (in days)
Consumption Rates5 Acute dose (µg a.i./bee)6
Acute RQ2 Chronic dose (µg a.i./bee)6
Chronic RQ3 Nectar
(mg/day) Pollen (mg/day)
Larval Worker
4 60 1.8
2.28E-03 1.2 5 120 3.6 4.56E-03 2.5
Drone 6+ 130 3.6 4.56E-03 2.5
Adult
Worker (cell cleaning and capping)
0-10 60 6.65 1.01E-02 2.6 8.43E-03 53
Worker (brood and queen tending, nurse bees)
6 to 17 140 9.6 1.46E-02 3.7 1.22E-02 76
Worker (comb building, cleaning and food handling)
11 to 18 60 1.7 2.59E-03 0.66 2.16E-03 14
Worker (foraging for pollen)
>18 43.5 0.041 6.24E-05 0.02 5.20E-05 0.3
Worker (foraging for nectar)
>18 292 0.041 6.24E-05 0.02 5.20E-05 0.3
Worker (maintenance of hive in winter)
0-90 29 2 3.04E-03 0.78 2.54E-03 16
Drone >10 235 0.0002 3.04E-07 0.00 2.54E-07 <0.01 1For life stages or castes that rely exclusively on royal jelly (i.e., larval and adult queen, 1-3 day old worker bees), these rows were removed from the table as residues of imidacloprid in royal jelly are not available. 2 Based on a 48-h acute oral LD50 of 0.0039 µg a.i/bee for imidacloprid (MRID 42273003). 3Based on adult 10-day chronic NOAEC of 0.00016 µg a.i/bee (Boily 2013, MRID 49750601) and larval 21-day chronic NOAEC of 0.0018 µg a.i/larva (MRID 49090506). 4Bolded value exceeds the acute risk LOC of 0.4 or chronic risk LOC of 1. 5From Guidance for Assessing Pesticide Risks to Bees (US EPA et al., 2014). 6Based on concentrations reported in Table 6-38.
Crop Group 20 – Oilseed (Cotton – Soil + Foliar) In a study conducted across 9 sites in California in 2013-2014 (MRID 49665202), imidacloprid (as Admire® Pro SC) was applied at a rate of 0.33 lbs a.i/A as an in-furrow spray (as described in the soil application above) which was followed by three foliar applications of Admire® Pro SC at 0.06 lbs a.i/A with a reported 6-7 day interval at bloom. Pollen, floral nectar, and extra-floral nectar samples were taken 4, 4, and, 5 days after the last application, respectively. Soil types of the experimental fields were characterized as fine, medium, and coarse texture. Table 6-40 below summarizes the acute and chronic EECs for pollen residues in the combined soil + foliar applications to cotton used in Bee-REX for refined Tier I assessment purposes. As the extra-floral nectar residues were higher than those of floral nectar (as distinguished

202
from the soil-applied alone component of this study described above), these values will be used for refinement of Tier I EECs for the nectar component.
Table 6-40. Summary of the refined acute and chronic EECs for combined (soil + foliar) applications to cotton based on measured residue data.
Matrix1 Acute EEC (ppb)2 Chronic EEC (ppb)3
Pollen 328 324 Nectar 171 153 Extra-floral nectar 2775 1952
Bolded values refer to those to be used for refinement of EECs. 1Refers to hand-collected pollen and nectar. 2Acute EEC chosen as the maximum reported concentration among all individual replicates following application. 3Chronic EEC chosen as the maximum average concentration among all individual sampling events following application.
Table 6-41 below summarizes the refined Tier I oral RQs for the various castes of larval and adult bees using nectar residue data from the combined soil + foliar-applications to cotton. Adult acute and chronic oral and larval chronic oral RQs exceed their respective LOCs for every caste assessed. Adult acute oral RQs range from 21 – 208 while adult chronic oral RQs range from 358 – 3562. Similarly, larval chronic oral RQs ranged from 64 – 139. The added foliar component increased the RQs over 6 fold the level of the respective RQs after the soil treatment alone. These RQs are 20- to 25-fold higher (depending on the life stage) as compared to their respective RQs from the soil-only component of this study discussed previously.
Table 6-41. Summary of Tier I oral RQs for honey bees using refined exposure estimates with total imidacloprid residues in pollen and nectar from soil + foliar-applied cotton1,4
Life stage
Caste or task in hive
Average age (in days)
Consumption Rates5 Acute dose (µg a.i./bee)6
Acute RQ2 Chronic dose (µg a.i./bee)6
Chronic RQ3 Nectar
(mg/day) Pollen (mg/day)
Larval Worker
4 60 1.8
0.1177 64 5 120 3.6 0.2354 129
Drone 6+ 130 3.6 0.2549 139
Adult
Worker (cell cleaning and capping)
0-10 60 6.65 0.1687 43 0.1193 745
Worker (brood and queen tending, nurse bees)
6 to 17 140 9.6 0.3916 100 0.2764 1727
Worker (comb building, cleaning and food handling)
11 to 18 60 1.7 0.1671 43 0.1177 735
Worker (foraging for pollen)
>18 43.5 0.041 0.1207 31 0.0849 531
Worker (foraging for nectar)
>18 292 0.041 0.8103 208 0.5700 3562

203
Life stage
Caste or task in hive
Average age (in days)
Consumption Rates5 Acute dose (µg a.i./bee)6
Acute RQ2 Chronic dose (µg a.i./bee)6
Chronic RQ3 Nectar
(mg/day) Pollen (mg/day)
Worker (maintenance of hive in winter)
0-90 29 2 0.0811 21 0.0573 358
Drone >10 235 0.0002 0.6521 167 0.4587 2867 1For life stages or castes that rely exclusively on royal jelly (i.e., larval and adult queen, 1-3 day old worker bees), these rows were removed from the table as residues of imidacloprid in royal jelly are not available. 2 Based on a 48-h acute oral LD50 of 0.0039 µg a.i/bee for imidacloprid (MRID 42273003) 3Based on adult 10-day chronic NOAEC of 0.00016 µg a.i/bee (Boily 2013, MRID 49750601) and larval 21-day chronic NOAEC of 0.0018 µg a.i/larva (MRID 49090506). 4Bolded value exceeds the acute risk LOC of 0.4 or chronic risk LOC of 1. 5From Guidance for Assessing Pesticide Risks to Bees (US EPA et al., 2014). 6Based on concentrations reported in Table 6-40.
Crop Group 20 – Oilseed (Cotton – Seed + Foliar) In a study conducted across 3 sites in Missouri in 2013-2014 (MRID 49511702), imidacloprid (as Gaucho® 600 Flowable) was applied at a rate of 0.05 lbs a.i/A as a seed treatment at planting followed by 5 foliar spray application of 0.06 lbs a.i/A each at 5-8 day intervals. The experimental fields were characterized as sandy, sandy loam, and silty loam soil types. Pollen, floral nectar, and extra-floral nectar samples were taken nectar samples were taken 26, 21, and 14 days after the last pesticide application. Table 6-42 below summarizes the acute and chronic EECs for pollen residues in seed + foliar-treated cotton to refine model-generated values in Bee-REX for Tier I assessment purposes. As the floral nectar residues were higher than those of extra-floral nectar for this study, these values will be used for refinement of Tier I default EECs for the nectar component.
Table 6-42. Summary of the refined acute and chronic EECs for combined (seed + foliar) applications on cotton based on residue data
Matrix1 Acute EEC (ppb)2 Chronic EEC (ppb)3
Pollen 56.7 25.2 Nectar 39.5 29 Extra-floral nectar 30 16.2
Bolded values refer to those to be used for refinement of EECs. 1Refers to hand-collected pollen and nectar. 2Acute EEC chosen as the maximum reported concentration among all individual replicates following application. 3Chronic EEC chosen as the maximum average concentration among all individual sampling events following application.
Table 6-43 below summarizes the refined Tier I oral RQs for the various castes of larval and adult bees using nectar residue data from seed + foliar-treated cotton. Adult acute and chronic oral and larval chronic oral RQs exceed their respective LOCs for every caste assessed except acute oral RQ values for adult workers maintaining the hive in winter. Adult acute oral RQs range from 0.3 – 3.0 while adult chronic oral RQs range from 5.6 – 53. Additionally, larval chronic oral RQs range from 1.0 – 2.1.
Table 6-43. Summary of Tier I oral RQs for honey bees using refined exposure estimates with measured imidacloprid residues in pollen and nectar from combined seed + foliar applications to cotton.1,4

204
Life stage
Caste or task in hive
Average age (in days)
Consumption Rates5 Acute dose (µg a.i./bee)6
Acute RQ2 Chronic dose (µg a.i./bee)6
Chronic RQ3 Nectar
(mg/day) Pollen (mg/day)
Larval Worker
4 60 1.8
0.0018 1.0 5 120 3.6 0.0036 2.0
Drone 6+ 130 3.6 0.0039 2.1
Adult
Worker (cell cleaning and capping)
0-10 60 6.65 0.0027 0.7 0.0019 12
Worker (brood and queen tending, nurse bees)
6 to 17 140 9.6 0.0061 1.6 0.0043 27
Worker (comb building, cleaning and food handling)
11 to 18 60 1.7 0.0025 0.6 0.0018 11
Worker (foraging for pollen)
>18 43.5 0.041 0.0017 0.4 0.0013 7.9
Worker (foraging for nectar)
>18 292 0.041 0.0115 3.0 0.0085 53
Worker (maintenance of hive in winter)
0-90 29 2 0.0013 0.3 0.0009 5.6
Drone >10 235 0.0002 0.0093 2.4 0.0068 43 1For life stages or castes that rely exclusively on royal jelly (i.e. larval and adult queen, 1-3 day old worker bees), these rows were removed from the table as residues of imidacloprid in royal jelly are not available. 2 Based on a 48-h acute oral LD50 of 0.0039 µg a.i/bee for imidacloprid (MRID 42273003) 3Based on adult 10-day chronic NOAEC of 0.00016 µg a.i/bee (Boily 2013, MIRD 49750601) and larval 21-day chronic NOAEC of 0.0018 µg a.i/larva (MRID 49090506). 4Bolded value exceeds the acute risk LOC of 0.4 or chronic risk LOC of 1. 5From Guidance for Assessing Pesticide Risks to Bees (US EPA et al., 2014) 6Based on concentrations reported in Table 6-42.
6.1.5. Refined RQs (Off-field Oral) In theory, the estimates of spray drift provided by AGDRIFT could be used in conjunction with measured concentrations of imidacloprid in pollen and nectar from available residue studies as a way to refine the AGDRIFT estimates of spray drift. This approach assumes strict proportionality between measured residues in pollen and nectar and application rate. It also assumes that the conditions associated with the foliar application in the residue studies and that used in the AGDRIFT modeling are comparable. Residue data for imidacloprid in pollen and nectar resulting from foliar applications are available for citrus, stone fruit (cherry) and cotton. The citrus residue study (MRID 49521301) involved ground applications of 2 x 0.25 lbs. a.i./A at approximately 10 days prior to bloom and residue measurements beginning 4-7 days following the last application. Residue data are available for both pollen and nectar. The stone fruit

205
residue study (MRID 49535601) consisted of post-harvest airblast applications of 5 x 0.1 lbs. a.i./A with residues in pollen and nectar measured at 208 days post application. The cotton foliar residue study (MRID 49103301) consisted of a single aerial application of 0.06 lbs. a.i./A made during bloom with residues measured approximately 6 days following application, however, residues in nectar were measured. Unfortunately, none of these studies are considered appropriate for refining AGDRIFT estimates of spray drift at off-field locations due to their design and timing of residue measurements. Specifically, the citrus study involved 2 sequential applications (with an 8-10 day interval) and a targeted a 10-day pre-bloom interval. The AGDRIFT model provides drift estimates based on a single application rate which is not comparable to the citrus residue study. Furthermore, actual off-field drift would not reflect a 10-day pre-bloom interval on application days. Therefore, the citrus residue measurements may underestimate the day 0 residues expected on flowering plants adjacent to the treated site on the day of application. The stone fruit study also involves multiple application rates and a sampling interval of over 200 days, which again is not representative of residues expected off-field due to drift occurring on the day of application. Finally, the cotton study only measured residues in nectar. Therefore, comparable pollen data are not available to calculate refined Tier I RQ values that reflect drift to adjacent flowering plants. As a result of these limitations, refinement of the AGDRIFT-predicted off-field drift RQ value using residue data was not conducted.
6.1.6. Uncertainties at the Tier I Level There are several sources if uncertainty at the screening-level and refined Tier I level associated primarily with the screening-level exposure estimates and use of residue data, respectively. What follows are the uncertainties associated with each point: Screening-level Exposure Estimate Uncertainties:
• The extent to which the amount of food consumed by bees for the Tier I exposure estimate represent pesticide concentration in food sources.
• The extent that residues on leaves and even soil may be available for bee uptake
• For soil applications, there are three notable limitations to the modified Briggs’ model approach that include:
o This methodology is based on one species of plant (barley) o The dataset used to derive elements of the model is based on a limited number of
chemicals that represent only two classes of pesticides that do not include the neonicotinoid insecticides
o The model is based upon data on pesticide concentrations in vegetative plant matrix (i.e., shoots) as a surrogate for nectar and pollen

206
• For seed treatment applications, the screening-level assumption of exposure within Bee-REX is 1 mg/kg (1 ppm). This is based in the Internal Commission for Plant-Bee Relationships’ 1 mg a.i/kg to represent an upper bound concentration in pollen and nectar. This assumption of exposure is independent of application rate (i.e mass of chemical applied to the seed0 but is considered to be protective of the varying rates currently being used for seed treatments.
• Bee-REX assumes exposures through consumption of nectar and pollen are conservative representations of potential exposures through consumption of honey and bee bread, respectively. This approach is likely to be conservative because it assumes that pesticides do not degrade while honey and bee bread are stored in the hive. For bees that consume honey, it is assumed that the estimated pesticide exposures can be related back to the original concentration in nectar by accounting for the amount of sugar consumed by bees. It is also assumed that pollen and nectar consumption rates and resulting exposures are protective of exposures of bees to pesticides through consumption of royal jelly and brood food.
• The screening-level exposure assumption in Bee-REX assumes pesticide concentrations in pollen and nectar are equivalent (i.e. effectively one EEC for bee food). As was shown in the suite of available residue studies, pollen and nectar residue values can vary markedly depending on the use pattern and application method. For example, maximum residues in pollen in the foliar applied cherry study were 100 fold higher than maximum residues in nectar. Conversely, extra-floral nectar residues were over 8-fold higher than pollen residues in the soil + foliar-applied cotton study.
Use of Residue Data:
• The use of chemical-specific pollen and nectar residue data reduces the uncertainties associated with the methods discussed above; however, these data also require certain considerations to ensure they are used in the most appropriate manner use in estimating potential risk.
6.2. Risk Description The risk description section further characterizes the findings of Risk Estimation as well as integrates additional lines of evidence and uncertainties regarding the potential risks to bees beyond the Tier I RQ values. Additionally, the risk description characterizes the effects and findings of the higher tier (i.e. Tier II semi-field and Tier III full field) colony-level studies. These effects will be put into context with the findings of the available residue studies described previously in Section 5 and in the Section 6.1. This risk description includes the following elements for characterizing the risk of imidacloprid’s agricultural uses to bees:
1. Additional characterization of Tier I risks and evaluating risks at Tier II level 2. Evaluating risks at the Tier III level 3. Examination of colony-level risks from the pollen route of exposure 4. Consideration of risks to non-Apis bees

207
5. Assessing risks associated with additional lines of evidence 6. Articulating major uncertainties at each risk assessment tier
6.2.1. Characterization of Tier I Risks and Tier II Analysis Approach for Characterizing Tier 1 Risks The additional characterization of the refined Tier I risk estimation is organized by application method (e.g., foliar, soil, seed treatment) and crop group, using representative crop residue data when available. At the Tier I level, additional characterization includes consideration of the magnitude, duration and frequency at which the acute and chronic risk LOC values are exceeded. This refined Tier 1 risk characterization considers the totality of available residue data for pollen and nectar rather than just the acute or chronic EECs described in Risk Estimation (Section 6.1). In this way, the refined Tier I risk characterization is able to distinguish RQ values generated in Risk Estimation that reflect short-term, infrequent ‘spikes’ of imidacloprid pollen and nectar residues from those that reflect long-term, frequent occurrences. This analysis utilizes the raw data from a given residue study and calculates the maximum RQs among bee castes/tasks for each pair of total imidacloprid residues (i.e. parent imidacloprid, IMI-olefin, and IMI-5-OH) in pollen and nectar sampled on the same day. Then, the highest RQ was selected among the various age/task-specific RQs calculated by BeeREX v. 1.0. For larval bees, this was always the 5-day old worker larvae20 and for adults it was either nectar foragers or nurse bees. Approach for Characterizing Tier II Risks At the Tier II level, a NOAEC and LOAEC of 25 and 50 ppb of total imidacloprid in sucrose was determined from the registrant-submitted colony feeding study (MRID 49501001). At this time, the registrant-submitted colony feeding study is considered the most comprehensive and robust Tier II study available from which to characterize the colony-level effects of imidacloprid to honey bees. Specifically, this study:
• Contains a high degree of replication and adequate statistical power, • Demonstrates a robust dose-response relationship between sucrose residues and colony-level
apical endpoints, • Examined a 6-week exposure period that is commensurate with relatively long-term exposures
expected for some crop use scenarios, • Provides raw data that enabled an independent statistical evaluation of the responses, • Was conducted according to Good Laboratory Practice specifications, and • Included an evaluation of over-wintering colony survival.
20 According to BeeREX v. 1.0, drone larvae are not typically included in risk estimation due to their limited role in the hive population, although their estimated exposure is slightly greater than worker larvae (130 mg nectar/larvae/day for drone larvae vs. 120 mg nectar/larvae/day for worker larvae).

208
The NOAEC and LOAEC of 25 and 50 ppb, respectively, are based on reductions in several colony-level apical endpoints including numbers of adults, number of pupae, pollen stores, and honey stores that persisted across multiple assessments of the colonies throughout the course of the study.
As the registrant colony feeding study exposed honey bee colonies via spiked sucrose, only residue data for nectar from the Tier II residue studies can be compared to the Tier II NOAEC and LOAEC with a sufficient level of certainty. This limitation relates to the differential utilization of pollen by the colony relative to nectar and the subsequent differences in exposure of bees to dietary imidacloprid via pollen and nectar. Furthermore, there is evidence to suggest that colony-level effects on honey bees via contaminated pollen occur at higher residue levels than those in nectar. Potential colony-level risks associated with the pollen route of exposure are discussed in a later section within this risk description. Where nectar data are available, the average residue values from all sampling events were plotted alongside the NOAEC and LOAEC of the colony feeding study in order to determine the magnitude, frequency and duration by which the NOAEC and LOAEC values were exceeded. Notably, comparing residues measured in nectar to the Tier II NOAEC and LOAEC inherently assumes comparable dosimetry of imidacloprid between bees foraging on nectar from the treated crop and bees consuming spiked sucrose from the colony feeding study (i.e., a 6-week continuous exposure). In some situations, such as when an abundance of uncontaminated alternate forage is available, the assumption that bees in the field would be exposed to imidacloprid residues in crop nectar continuously for 6 weeks will be conservative (i.e., overestimate exposure). In other situations, possibly with managed hives used to pollinate multiple crops over the entire growing season, this assumption may underestimate exposure. It is therefore important to consider not only the magnitude by which the NOAEC or LOAEC values are exceeded, but also the frequency and duration of the exceedance. As indicated in Section 5, there are two studies in the open literature that assess the long term effects to honey bee colonies resulting from the pollen route of exposure (Dively 2009 and Dively 2015). These studies were similar in design to that of the registrant-submitted Tier II colony feeding study in that they replicated hives across treatment groups, monitored for disease and parasites, and included an overwintering component. Additionally, these studies examined similar response variables as with the Tier II colony feeding study in nectar including percentage of comb area covered by various life stages and food stores (pollen and nectar). The studies tested up to 100 ppb in pollen (Dively 2015) and employed a 12 week exposure duration. The findings were restricted to a significant (p<0.05) reduction in overwintering survival at the 100 ppb treatment group in one trial within the Dively 2015 paper. These studies, as indicated in Section 5, are associated with a number of limitations and uncertainties that limit their utility for assessing the impact of the spiked pollen route of exposure to honey bee colonies. Specifically, the Dively 2015 study (which included two trials conducted in back-to-back years with only the number of replicate colonies per treatment group differing) was noted to have high levels of Varroa mite infestation in all treatment groups as well as the control. In one trial, these levels were 2-4X the level which the certain resources indicate as sufficient for treatment.21 Additionally, despite the two trials being conducted in a similar manner in consecutive years, the control overwintering survival between the
21 http://honeybeehealthcoalition.org/wp-content/uploads/2015/08/HBHC%20Guide_Varroa_Interactive_23Sep.pdf

209
two years was markedly different (100% vs. 57%, respectively). Furthermore, raw data was not available to independently verify the results. The duration of exposure was exceptionally long (12 weeks) which is likely not realized in many real world exposure scenarios. Finally, there is a wide dose spacing (i.e. 4-5X) between the 3 treatment group (5, 20, and 100 ppb). This wide dose spacing introduces uncertainty in the purported overwintering NOAEC of 20 ppb and the LOAEC of 100 ppb. Therefore, this study is considered to have limited utility for characterizing colony-level risks to honey bees at the Tier II level. Where data for imidacloprid residues in pollen are available, exceedances of the purported 100 ppb overwintering LOAEC are noted for informational purposes, but are not considered of similar weight as exceedances of the nectar NOAEC and LOAEC described earlier. Consideration of Crop Usage and Label Information Another important aspect that is considered in the Tier 2 risk evaluation is information on the usage of imidacloprid for the crop of interest (e.g., poundage of active ingredient applied per acre per year as well as the average percent of crop acreage that is treated). For example, lettuce was identified as having an average percent crop treated of 35% for imidacloprid, which means that out of all the lettuce grown in the United States, on average 35% is treated with imidacloprid each year. This information is available from the memo entitled “Usage Report in Support of Registration Review Draft Risk Assessment Purposes for Imidacloprid (US EPA, 2015),” that includes the Screening Level Usage Analysis (SLUA) that includes usage data from 2004 – 2013. The sources for the SLUA include the USDA’s National Agricultural Statistics Service (NASS, reporting data from 2004 – 2013), private pesticide market research (reporting data from 2004 – 2013), and the CDPR Pesticide Use Reporting (PUR) data (reporting from 2004 – 2012). To obviate the need to state it for every crop in the analysis that follows, the following are important points/caveats to the SLUA data:
• Pesticide usage data are considered for a single active ingredient. That is to say that imidacloprid co-formulated with one or more pesticides are not included in the SLUA data.
• The average annual pounds of pesticide applied for each crop originates from the states that were surveyed and not the entirety of the United States. It is also noted that usage information for a given crop is available from states that produce 80% or more of that crop in most cases.
• Lack of reported usage for a given crop does not necessarily indicate zero usage. • Usage data on a particular site may be noted in data sources, but not quantified. In these cases,
the site would not be reported in the SLUA. • Although some uses for seed treatment applications are delineated, the SLUA does not distinguish
between foliar and soil applications if a given crop is registered for both application methods. Finally, label information pertaining to the use of imidacloprid on the crop associated with each residue study is also considered in the risk characterization. As the residue studies were generally stated to have been conducted with Admire® Pro (EPA Reg. No. 264-827), language from this label is considered for determining the extent to which the resulting residues in pollen and nectar reflect current labeled use and reasonably “worse case,” exposure conditions.

210
What follows is a discussion of the risks associated with each crop group where residue data are available organized by application method.
Foliar Applications Crop Group 10 – Citrus Fruits (Orange) The citrus crop group includes, among other members, oranges, grapefruit, lemons, limes, mandarins, tangelo, tangerines, and various hybrids thereof. Specific to the uses of imidacloprid on citrus, oranges appear to be the dominant crop with an estimated usage of estimated 60,000 lbs/year (Table 6-44). This is followed by grapefruit, tangerines and lemons with much lower usage. As noted previously, members of the citrus crop group are considered highly attractive to honey bees as a source of pollen and nectar (e.g., oranges, grapefruit, lemons, mandarins, clementines, tangerines; USDA 2014). According to the USDA (2014), oranges, clementine, mandarin and tangerine utilize managed pollination services, although this appears dependent on the cultivar. Further, citrus is widely recognized as a source of nectar for commercial honey production. Members of the citrus fruits crop group ae associated with a bloom duration that is at least 6 weeks in length where nectar and pollen would be potentially be available to visiting honey bees.
Table 6-44. SLUA data for imidacloprid and citrus fruits (2004-2013) Crop Lbs. Applied/yr. % Acreage Treated (average) % Acreage Treated (maximum) Grapefruit 8,000 30 60 Lemons 3,000 10 25 Oranges 60,000 25 40 Tangelos <500 15 20 Tangerines 6,000 25 40
Refined Tier I Oral Risks and magnitude, duration, and frequency of LOC exceedance analysis As described in Section 6.1, refined Tier I oral RQ values for honey bees resulting from the foliar use on oranges, range from 4.8 – 32 (adult acute), 14 – 30 (larval chronic) and 89 – 592 (adult chronic) depending on their caste and function within the hive. These RQ values reflect “high end” estimates of pollen and nectar residues obtained from foliar applications at the maximum label rate (2 x 0.25 lbs. a.i/A) for citrus with the last application made 10-days prior to bloom (MRID 49521301). Figure 6-2 below shows the adult acute oral, adult chronic oral and larval chronic oral RQs in relation to the LOCs with the totality of the nectar and pollen data available and how it translates into the magnitude, duration and frequency of Tier I LOC exceedances. For this study, only data from trials NT005 and NT006 were included since trial NT004 was contaminated by inadvertent applications of imidacloprid.

211
Figure 6-2. Summary of acute and chronic RQ values using totality of pollen and nectar residue data from foliar-applied citrus residue study (MRID 49521301). A total of 14 oral RQ values were calculated for each life stage/duration. As indicated by Figure 6-2, 100% of the refined Tier I acute and chronic RQ values exceed their LOC values (0.4 and 1.0, respectively) up to 38 days following the last foliar application. As indicated previously, this reflects the majority of the blooming period of citrus although there is the potential for regional variation. The magnitude of these RQ values range from 1.5 to 32 (adult, acute), 27-592 (adult, chronic), and 1.3-28 (larval chronic). Due to the dissipation of residues over time (primarily in citrus nectar), RQ values also decline with time by approximately an order of magnitude. Tier II Risks An acceptable Tier II long-term feeding study is available for imidacloprid which quantified effects at the colony level following a 6-week exposure to imidacloprid via spiked sucrose solution. This study generated a NOAEC of 25 ppb and a LOAEC of 50 ppb (see Section 5.2). To evaluate the risk of foliar application of imidacloprid to citrus at the colony level for honey bees, reported residues of total imidacloprid residues in nectar were compared to the aforementioned NOAEC and LOAEC values (Figure 6-3).

212
Figure 6-3. Imidacloprid nectar residues in nectar from foliar-applied citrus study (MRID 49521301, trials NT005 and NT006 only) as compared to effect levels in registrant submitted colony feeding study (MRID 49510001). There were 13 of 14 (93%) of daily average residue values that exceeded the NOAEC during the sampling intervals of the study. Mean residues of total imidacloprid in orange nectar exceed the LOAEC (50 ppb) for approximately 15 days after the last foliar application. The mean residues exceed the NOAEC for at least 25 days and appear to drop below the NOAEC by 38 days after application (DAA). As a number of the citrus fruits crop group, including oranges are noted to have a blooming period that extends for 6 weeks or more, the colony feeding study exposure duration of 6 weeks is particularly relevant when characterizing the Tier II risk of honey bee colonies to foliar-treated citrus fruits. Figure 6-4 below shows the average residues in pollen from the foliar-applied citrus fruit study. All residues are noted to be above the 100 ppb threshold which, as noted previously was indicated to be a level where honey bee colonies exposed to spiked pollen patties for 12 weeks experienced significantly reduced (p<0.05) survival after the overwintering period relative to the control.

213
Figure 6-4. Imidacloprid average residues in pollen from foliar-applied citrus study (MRID 49521301, trials NT005 and NT006 only). Additional Considerations Due to an oversight by the study author, the plots in trial NT004 were sprayed with PROVADO® (1.6 lb imidacloprid a.i/gal, corresponding to 0.1 lb a.i/acre application), in both 2010 and 2011, which was not known at the time of the experiment. Additionally, PREY®, another insecticide containing imidacloprid, was used as a maintenance pesticide on both the treated and control plots of this trial in September 2012 and September 2013 (single application of 0.15 lbs/A each year). Because of the additional imidacloprid added to the plots prior to the study, the residue values are presumably higher in the NT004 than what would be expected from the study applications alone and therefore these data were not included in the above analysis. Additionally, all three sites for this study were in relatively close proximity to one another. In fact, two sites (NT005 and NT006, which represent the data used in the analysis above) were immediately adjacent. Soil types reflect sandy compositions (96-98%) and low organic carbon content (0.35-1.9%). Weather conditions (temperature and precipitation) were similar across the three trials. As a result of the close proximity of trial sites, this study provides very limited information on how differences in environmental conditions across different areas of the US may affect accumulation of total imidacloprid residues in pollen and nectar.

214
Additionally, the extent to which prior year applications of imidacloprid contributed to year-to-year carryover in nectar and pollen concentrations could not be reliably assessed due to several study limitations including the aforementioned inadvertent pesticide applications in trial NT004 and the different sampling times (and plant growth stages) employed during the two trial years (NT005 and NT006). Since the application method was foliar spray, concentrations in soil may not be reliable indicators of pesticide year-to-year carryover. Current label language for foliar imidacloprid applications on citrus specify a 0.25 lbs a.i/A maximum single application rate (0.5 lbs a.i/A per year) as well as prohibiting applications made 10 days prior to bloom, during bloom, or when bees are foraging. This study was conducted with a 10-day pre bloom interval and 2 applications of 0.25 lbs a.i/A, and was therefore conducted in accordance with the label. Conclusions Average residues in nectar resulting from the foliar application (with the labelled restriction of a 10-day pre-bloom interval) to citrus fruits (oranges) indicate a colony level risk based on residues being above the Tier II NOAEC in nectar for an extended period of time. Similarly, average residues in pollen were also above 100 ppb which has been associated with colony level effects following a 12-week exposure via pollen (Dively 2015, Qualitative). Crop Group 12 – Stone Fruits (Cherry) The stone fruit crop group includes, among other members, apricots, cherries, nectarines, peaches, plums and various hybrids. Specific to the uses of imidacloprid, cherries appear to be the dominant crop with an estimated usage of estimated 4,000 lbs/year (Table 6-45), with peaches and plums to a lesser extent. As noted previously, members of the stone fruit crop group are considered highly attractive to honey bees as a source of pollen and nectar (e.g., cherries, nectarines, peaches, plums/prunes; USDA 2014). According to the USDA (2014), all of the aforementioned members require bee pollination and utilize managed pollination services. Stone fruits, including cherries are noted to bloom for around 2-3 weeks.
Table 6-45. SLUA data for imidacloprid and stone fruits (2004-2013) Crop Lbs. Applied/yr. % Acreage Treated (average) % Acreage Treated (maximum)
Cherries 4,000 25 50 Peaches 1,000 5 15
Plums/Prunes <500 <2.5 10 Refined Tier I Oral Risks and magnitude, duration, and frequency of LOC exceedance analysis As described in Section 6.1, the refined Tier I oral RQ values for honey bees resulting from the foliar use on cherries, range from 0.59 – 2.82 (adult acute), 1.4 – 1.5 (larval chronic) and 1.7 - 38 (adult chronic) depending on their caste and function within the hive. These RQ values reflect “high-end” estimates of pollen and nectar residues obtained from foliar applications at the maximum label rate (5 X 0.1 lbs a.i/A) for cherries (MRID 49535601). All applications were post-bloom with applications in the first year being
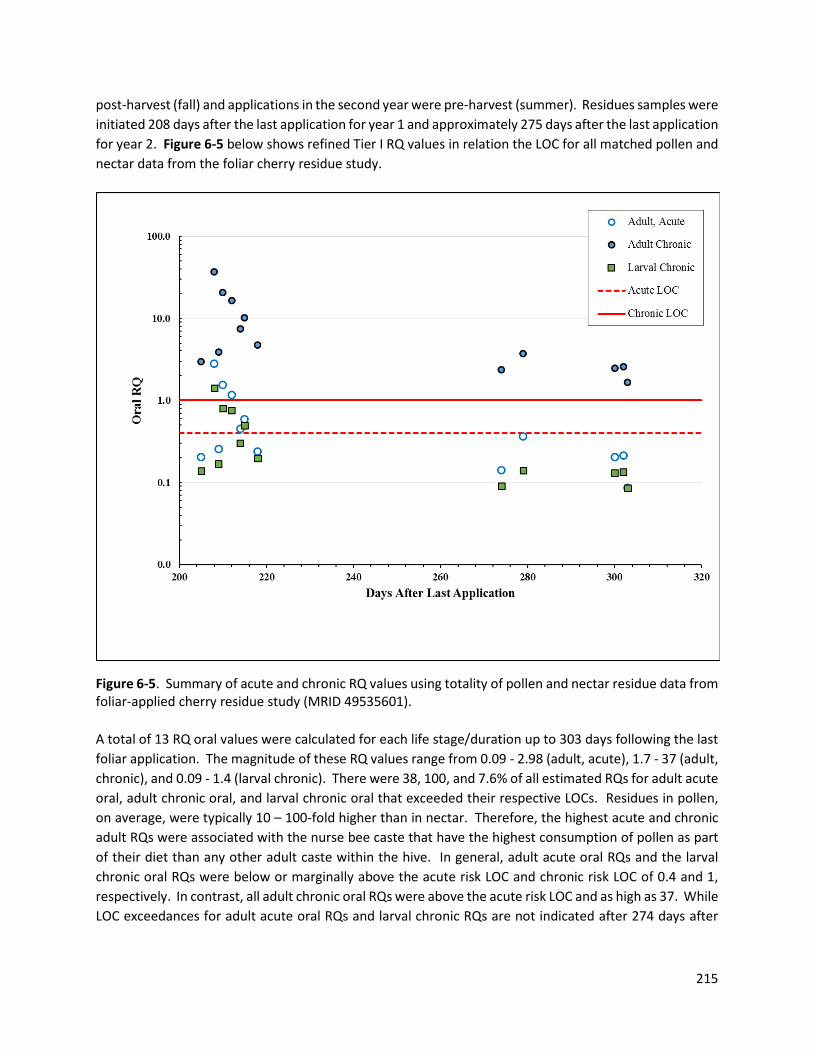
215
post-harvest (fall) and applications in the second year were pre-harvest (summer). Residues samples were initiated 208 days after the last application for year 1 and approximately 275 days after the last application for year 2. Figure 6-5 below shows refined Tier I RQ values in relation the LOC for all matched pollen and nectar data from the foliar cherry residue study.
Figure 6-5. Summary of acute and chronic RQ values using totality of pollen and nectar residue data from foliar-applied cherry residue study (MRID 49535601). A total of 13 RQ oral values were calculated for each life stage/duration up to 303 days following the last foliar application. The magnitude of these RQ values range from 0.09 - 2.98 (adult, acute), 1.7 - 37 (adult, chronic), and 0.09 - 1.4 (larval chronic). There were 38, 100, and 7.6% of all estimated RQs for adult acute oral, adult chronic oral, and larval chronic oral that exceeded their respective LOCs. Residues in pollen, on average, were typically 10 – 100-fold higher than in nectar. Therefore, the highest acute and chronic adult RQs were associated with the nurse bee caste that have the highest consumption of pollen as part of their diet than any other adult caste within the hive. In general, adult acute oral RQs and the larval chronic oral RQs were below or marginally above the acute risk LOC and chronic risk LOC of 0.4 and 1, respectively. In contrast, all adult chronic oral RQs were above the acute risk LOC and as high as 37. While LOC exceedances for adult acute oral RQs and larval chronic RQs are not indicated after 274 days after

216
the last application, chronic adult oral RQs still exceed the chronic risk LOC up to and including the residue samples measured at 303 days after the last application. Tier II Risks To evaluate the risk of foliar application of imidacloprid to cherries at the colony level for honey bees, reported residues of total imidacloprid concentrations in nectar were compared to the aforementioned NOAEC and LOAEC values from the available registrant submitted colony feeding study (Figure 6-5). The daily average residues were plotted by the year they were sampled.
Figure 6-6. Imidacloprid residues in nectar from foliar-applied cherry study (MRID 49535601) as compared to effect levels in registrant submitted colony feeding study (MRID 49510001). Based on this comparison, there were no average total residues (0%) of imidacloprid in cherry nectar that exceeded the Tier II NOAEC (25 ppb) at sampling intervals up to and including 303 days after the last foliar application. Although residues in nectar appeared to be relatively consistent over time, the highest daily average value determined was 5.6 ppb, approximately 5-fold lower than the NOAEC. As noted previously, cherries typically bloom for 2-3 weeks, which is roughly half the duration of the exposure period of the Tier II colony feeding study.

217
Figure 6-7 below shows the daily average residues in pollen from the foliar-applied cherry study. A subset of these residues are noted to be above 100 ppb which has been associated with colony level effects following a 12-week exposure via pollen (Dively 2015, Qualitative). It is noted that cherries and other stone fruits have a bloom duration of 2-3 weeks, which is 4-6 fold less than the exposure period from the feeding study conducted with spiked pollen.
Figure 6-7. Imidacloprid average residues in pollen from foliar-applied cherry study (MRID 49535601).
Additional Considerations Within each residue trial, the data indicate that applications during late summer/early fall resulted in greater residues measured in nectar during year 1 (2013) compared to applications made in late spring / early summer and subsequent measurement in year 2 (2014). The lower residue values measured during year 2 may reflect the greater amount of time available for dissipation of imidacloprid residues between application and residue measurement (275-300 days) compared to that from year 1 (about 205-215 days). Lower residues in year 2 may also reflect temporal differences in imidacloprid translocation to nectar when applied in late summer/early fall vs. spring/early summer. It should be noted that except for one value from trial NT016, residues of total imidacloprid in nectar from year 2 (2014) largely reflect levels below the limit of analytical detection or quantification where ½ the LOD or LOQ (0.7 ppb and 1.0 ppb in nectar and pollen, respectively) was assumed.

218
The two trials within the NY and OR locations were each within close proximity, such that they shared the same weather data. Soil types reflect sandy loam compositions (53-67% sand) and moderate to low organic carbon content (0.9-3.4%). Although within NY and OR the sites were in close proximity, this study encompasses some regional differences in cherry cultivation which may affect accumulation of total imidacloprid residues in pollen and nectar. The available data suggest that year-to-year accumulation of total imidacloprid is not evident (as indicated by a decline in pollen and nectar residues from year-to-year); however, the impact of differences in pesticide application timing between year 1 to year 2 on the resulting residues in pollen and nectar is not clear. In other words, the lower residues measured in year 2 may reflect a longer time between application and sampling. It is also noted that the mean residues in pollen in the NY sites were an order of magnitude higher (average residues of 153 and 422 ppb) as compared to the OR sites (13 and 21 ppb). This observation is less pronounced for nectar (average of 4.8 and 3.9 ppb in NY compared to 3.4 and 1.6 ppb). Current label language mandates that imidacloprid not be applied pre-bloom, during bloom, or when bees are foraging. This study with 5 foliar applications of 0.1 lbs a.i/A (the maximum single application rate for foliar treatment to stone fruits) made post-bloom, was conducted in accordance with current label language. Conclusions Average residues in nectar resulting from the foliar application (post bloom) to stone fruits (cherries) do not exceed the Tier II NOAEC (25 ppb) in nectar when residues were sampled the following season (200 – 300 days after the last application, depending on the trial year). Average residues in pollen were roughly 100 fold higher than those in nectar and did exceed 100 ppb for several days in two of the four trials. Although colony level effects have been associated with imidacloprid exposure following 12 weeks to 100 ppb in pollen, these residues exceeded 100 ppb for a short period and the entire bloom duration of cherry (2-3 weeks) is much shorter than the 12-week exposure from the spiked pollen feeding study. Therefore, despite the fact that nectar is considered the dominant route of exposure for forager honey bees, there is uncertainty whether residues in cherry pollen pose a significant colony level risk to honey bees since it is not known whether a shorter exposure period would have led to similar effects observed in the open literature studies. Crop Group 20 – Oilseed (Cotton) The oilseed crop group includes, among other members, cotton, flax, sunflower, and rapeseed (canola). Specific to the uses of imidacloprid, cotton is the only crop represented, with 50,000 lbs a.i/A for each of foliar/soil uses and seed treatment uses and is the only member of the oilseed group with registered foliar and soil uses. Cotton is noted to have nectar that is attractive to bees while the pollen is not considered to be attractive to honey bees. Additionally, cotton is associated with a blooming duration of at least 6 weeks.

219
Table 6-46. SLUA data for imidacloprid and oilseed crops (2004-2013)1
Crop Lbs. Applied/yr.
% Acreage Treated (average)
% Acreage Treated (maximum)
Cotton 50,000 5 10 Cotton (Seed Treatment)1 50,000 10 20
1The surveying period for seed treatment uses does not always cover the entire period of the SLUA There are three residue studies available to characterize the residues of imidacloprid in pollen, nectar, and extra-floral nectar in cotton assessing various application methods. For foliar applications, a study assessing one aerial application of imidacloprid at the maximum single application rate, 0.06 lbs a.i./A (at bloom) yielded floral nectar data only across 1 sampling event. This represented a treatment regimen that was less than the maximum annual rate of 0.31 lbs a.i./A (MRID 49103301). Additionally, studies are available that assess the combined soil + foliar method (inclusive of a soil only component) and seed + foliar regimen that will be discussed in the combined application method section. Refined Tier I Oral Risks and magnitude, duration, and frequency of LOC exceedance analysis As described in Section 6.1, the refined Tier I oral RQ values for honey bees resulting from the foliar use on cotton, range from 0.49 – 4.94 (adult acute), 1.8 – 4.1 (larval chronic) and 10 - 102 (adult chronic) depending on their caste and function within the hive. These RQ values reflect “high-end” estimates of pollen and nectar residues obtained from a foliar application at the maximum single rate (1 X 0.06 lbs a.i/A) for cotton (MRID 49103301). An aerial application was made during bloom and it was noted that in the two years prior to the study, applications of imidacloprid (ranging from 0.18 – 0.38 lbs a.i/A) had been made to other crops via chemigation. Additionally, only nectar was sampled (only one sampling event available) at 6 days post-application (noted to be a fraction of the 6 week or longer bloom duration of cotton). Figure 6-8 below shows refined Tier I RQ values in relation the LOC for all nectar data available from the foliar cotton residue study.

220
Figure 6-8. Summary of acute and chronic RQ values using totality of residue data from foliar-applied cotton residue study (MRID 49103301). A total of 5 RQs were estimated from the totality of nectar data for each life stage and duration. All (100%) of the estimated RQs for all life stages were above their respective LOCs at the single sampling period assessed (6 days post-application). These results are considered an underestimation of the potential risk given that only one application was made while the maximum annual rate for foliar application on cotton would have allowed for 4 more applications. Additionally, since there was only one sampling period, it is not possible to determine how RQs may have changed over time as a result of the potential changes in residue levels. Finally, although the pollen produced by the cotton plant is not considered attractive to honey bees, the overall RQs would be higher with the added pollen component of the diet to several castes within the hive such as worker bee larvae and nurse bees. Tier II Risks To evaluate the risk of a single foliar application of imidacloprid to cotton at the colony level for honey bees, daily average residues of total imidacloprid concentrations in nectar were compared to the aforementioned NOAEC and LOAEC values from the available registrant-submitted colony feeding study (Figure 6-9). As indicated previously, these residues values present only a single sampling period 6 days after application.

221
While the refined Tier I analysis indicated all RQs exceeded the LOC at the honey bee individual level, 2 of the 5 (40%) of the available nectar data indicate an average total residue level below the NOAEC of 25 ppb. One sample was marginally above the LOAEC of 50 ppb (56 ppb) while another sample was between the NOAEC and the LOAEC. It is reiterated that the number of samples available from this study is small and originated from one sampling interval (6 days post-application). Additionally, it is expected that had five applications been made (as permitted on the label), all residues would likely exceed the NOAEC and possibly the LOAEC. As noted previously, the cotton bloom period can extend for at least 6 weeks, consistent with the exposure duration for the sucrose colony feeding study. As noted previously, there were no pollen residue data available from this study.
Figure 6-9. Imidacloprid residues in foliar-applied cotton residue study (MRID 49103301) as compared to effect levels in registrant submitted colony feeding study (MRID 49510001). Additional Considerations In the cotton foliar application residue study, four of the five sites had chemigation applications in 2008 and 2009 (Sites NT001, NT002, NT003, NT005). One of the five sites had two chemigation applications in 2009 but no application in 2008 (Site NT004). The formulated products used were Provado® 1.6F (for aerial applications) to cotton and Admire® Pro (for prior chemigation uses). All five sites were in one

222
county in California and therefore the spatial variability was limited and similar climatic conditions would be expected. Although prior applications of Admire® Pro had been made to 4 of the 5 treatment sites, there was no quantification of the residues in soil prior to aerial application of imidacloprid to determine the potential carryover that could affect the resultant residues following foliar application. All residue values are noted to originate from fine (heavy) soil types. As indicated previously and will be suggested by several soil-applied residue studies discussed below, imidacloprid concentrations in pollen and nectar are often higher with increasing soil coarseness (i.e., increasing sand composition). There is uncertainty with respect to the potential increased magnitude of residues in nectar if a portion or all samples originated from coarser textured soils, but this uncertainty may be minor given that this application was as an air blast where soil exposure would be more limited. As indicated previously, this study assessed one foliar application at the maximum single use rate of 0.06 lbs a.i/A but did not assess the effect of subsequent applications (an additional 4 would be permitted on the label) on the residues in pollen and nectar. Therefore, despite this study not assessing a worst case scenario, it is noted that potential colony-level effects are indicated. It is also worth noting that according to SLUA data, which do not make the distinction between foliar- and soil-applied application methods, that imidacloprid is used to treat an average of 5% of the cotton acreage per year and a maximum of 10% of the cotton acreage per year. Conclusions Average residues in nectar collected 6 days after resulting a single at bloom foliar application to cotton indicate a colony level risk based on residues being above the Tier II NOAEC in nectar. The residues from this study would be expected to be even higher if the study had made an additional 4 foliar applications as is permitted on current labels. There was no residue information in pollen available from this study. Additional Foliar Application Use Patterns Imidacloprid is associated with several other use patterns that are registered for foliar treatment applications including members from crop groups 1 (root and tuberous vegetables), 4 (leafy vegetables), 5 (brassica vegetables), 6 (legumes), 8 (fruiting vegetables), 11 (pome fruits), 13 (berries and small fruits), 14 (tree nuts), 19 (herbs and spices), and several other use patterns not associated with a crop group including banana, plantain, globe artichoke, coffee, hops, peanut, pomegranate, and tobacco. Specific to the data provided by the SLUA, Table 6-47 below summarizes the use patterns registered for foliar applications of imidacloprid. It is noted that the table below presents crops that are registered with both foliar and soil applied uses, although the SLUA does not distinguish between these application methods in the usage data. The use patterns are organized by crop group with usage data information on crop attractiveness and whether the crop is harvested before bloom. Although residue data are not available for at least one member of the majority of crop groups, a large portion of these use patterns involve harvesting prior to bloom or are not honey bee attractive, thus minimizing exposure risk to foraging honey bees.

223
Generally speaking, members of Crop Groups 1, 4, and 5 (root and tuberous, leafy, and brassica vegetables, respectively) are harvested before bloom while also producing pollen and nectar that are noted to be attractive to honey bees. Therefore, with the exception of when used for seed production, the exposure to honey bees is expected to be minimal as the crop would be harvested prior to when bees would likely be foraging. Members of the legume group (Crop Group 6) are also noted to produce pollen and nectar that are attractive to bees and some legumes (e.g., cow peas and snap beans) and generally indicated by USDA 2014 to not be harvested prior to bloom. Soybean represents a total of 430,000 pounds of imidacloprid applied a year when considering both foliar/soil uses and seed treatment uses. There is uncertainty as to the levels of the total imidacloprid residues in pollen and nectar resulting from applications on soybean, which the largest usage of imidacloprid in terms of applied active ingredient per year. Although no data are currently available for pome fruits, a combination soil + foliar application study with apples is expected in 2016 and will be incorporated into the subsequent preliminary risk assessment for imidacloprid. While there are no foliar application studies available for members of the fruiting vegetables and berries/small fruits groups (Groups 8 and 13, respectively), data are available for soil applications and in the case of tomato, soil + foliar applications. Grapes represent a large use pattern (60,000 pounds per year), and while no data are available to characterize the residues of this crop, grapes do not produce nectar and are wind pollinated. Members of the tree nut group (Crop Group 14), of which several members are also wind pollinated, are noted to produce pollen and nectar (except in the case of hazelnuts and walnuts) that are attractive to bees. There is uncertainty as to the potential exposure of honey bees during bloom as well as the residues in pollen and nectar to members of this group which account for almost 30,000 pounds of imidacloprid applied per year according to the SLUA data. Finally, there are several uses of imidacloprid that are not associated with a crop group. In two of these cases, artichokes and tobacco, the crops are harvested before bloom so exposure to bees is expected to be minimal. Pomegranate is not represented in the USDA document and therefore its attractiveness is uncertain. This discussion serves to demonstrate that while foliar application residue studies are only available for oranges, cherries, and cotton, several other use patterns are expected to have minimal exposure to bees either by being unattractive or harvested prior to bloom, that there are several use patterns including potatoes, legumes (soybean), and tree nuts that have uncertainty associated with them with respect to serving as sources of forage as well as the residue levels resulting from foliar applications. Table 6-47 shows the SLUA data for additional foliar use patterns with no available residue data. As the SLUA does not distinguish between foliar and soil use patterns, the uses below apply to foliar/soil-applied uses. It is noted that foliar data are available for oranges, tomatoes, cherries, and cotton and therefore these crops are not presented below as their SLUA data are presented above and elsewhere in the risk description section).

224
Table 6-47. SLUA data imidacloprid and use patterns registered for additional foliar and soil use patterns (2004-2013) with no available residue data.
Crop Group Name (Number) Use pattern Lbs.
Applied/yr.
% Acreage Treated (average)
% Acreage Treated (max)
Honey Bee Attractive? (Pollen or nectar) (Y/N)
Harvested Before Bloom? (Y/N)
Root & Tubers (1) Potatoes 70,000 35 50 N -- Carrots 4,000 15 45 Y Y
Leafy Vegetables (4)
Chicory* <500 10 20 Y Y Lettuce 40,000 65 85 Y Y Spinach 2,000 25 40 N Y Celery 1,000 10 20 Y Y
Brassica (Cole) (5)
Brussels Sprouts* <500 50 85 Y Y
Broccoli 10,000 65 90 Y Y Cauliflower 5,000 60 90 Y Y Cabbage 4,000 30 45 Y Y
Legumes (6)
Dry Beans/Peas <500 <1 <2.5 Y --
Peas, green <500 <2.5 <2.5 Y -- Soybeans 30,000 <2.5 <2.5 Y -- Beans, Green 3,000 5 10 Y --
Pome Fruit (11) Apples 10,000 30 45 Y N Pome Fruit (11) Pears 1,000 5 15 Y --
Berry& Small Fruit (13)
Caneberries (blackberry and raspberry)
<500 15 25 Y --
Berry& Small Fruit (13) Grapes 60,000 30 50 Y (pollen) N
Berry& Small Fruit (13) Strawberries 2,000 5 15 Y --
Berry& Small Fruit (13) Blueberries 1,000 10 20 Y N
Tree Nuts (14) Hazelnuts <500 5 20 Y (pollen) -- Tree Nuts (14) Pecans 20,000 15 20 N -- Tree Nuts (14) Pistachios 3,000 5 15 N -- Tree Nuts (14) Walnuts 3,000 10 20 Y (pollen) -- Tree Nuts (14) Almonds 1,000 <2.5 <2.5 Y N No Group Artichokes <500 15 60 Y Y No Group Pluots* <500 20 65 -- -- No Group Sugarcane <500 <2.5 <2.5 N -- No Group Tobacco 10,000 25 40 Y (pollen) Y
No Group Pomegranates* 4,000 45 65 -- --
*Based on CDPR PUR data only (80% or more of total acreage is in California)

225
Summary of Crop Group/Use Patterns for which Foliar Residues Data are Available Table 6-48 below summarizes the available residues studies for the foliar-applied method as well as a providing a range of the refined Tier I RQs, the percentage of nectar residues above the Tier II NOAEC threshold in nectar (25 ppb) and where available, the duration those residues exceed the NOAEC.
Table 6-48. Summary of risk findings for the foliar applied use patterns of imidacloprid with available residue data.
Crop Group
(Crop)
Application Scenario1
Worst Case
Scenario? (Y/N)
Refined Tier I RQ Ranges3 (%age of Refined Tier I RQs above LOC
using all residue data)4 Tier II5
Adult Acute Oral
Adult Chronic
Oral
Larval Chronic
Oral
%age of nectar residues above
NOAEC
Duration above NOAEC
Citrus fruits
(Oranges)
2 X 0.25 lbs a.i/A, 10-day
pre bloom Y 4.8 - 32
(100%) 89 - 592 (100%)
14 - 30 (100%) 93% 25 days after
last application
Stone Fruits
(Cherry)
5 X 0.1 lbs a.i/A, post
harvest Y 2.8
(38%) 38
(100%) 1.5
(7.6%) 0% N/A
Oilseed (Cotton)
1 X 0.06 lbs a.i/A, at bloom
N 4.9 (100%)
102 (100%)
4 (100%) 40%
6 days (one sampling
interval only) Bolded value represent RQ in exceedance of acute or chronic LOC (0.4 and 1.0, respectively). 1Application rate, number of applications, timing 2Based on whether rate represents maximum annual rate for a given use pattern 3Based on highest reported residue concentration of all individual replicates (acute) or highest average concentration among all individual sampling events (chronic). 4Based on all pollen and/or nectar data from all sampling intervals 5Compared to colony feeding study NOAEC of 25 ppb.
Soil Applications Crop Group 8 – Fruiting Vegetables (Tomato) The fruiting vegetables crop group includes, among other members, eggplant, pepper (bell peppers, chili peppers, and sweet peppers), and tomatoes and various hybrids thereof. Specific to the uses of imidacloprid, tomato appears to be the dominant crop with an estimated usage of estimated 30,000 lbs/year (Table 6-49). This is followed by peppers with roughly a third of the total usage as reported for tomato. According to USDA (2014), members of the fruiting vegetable crop group are largely unattractive to honey bees with the exception of okra and chilies, which are noted to have pollen and nectar that is attractive (approximately 2400 total acres of okra). The entirety of this group, however, is important for bumble bees. Bumble bees extract the pollen granules from the tomato anthers by a technique known as “buzz pollination,” in which the bumble bee worker grasps the anthers and rapidly move their wings to dislodge and shake out pollen. It is noted here that the tomato plant does not produce nectar. Eggplant, peppers, and tomatoes all are noted to require bee pollination but only tomato is listed to use managed pollinator resources, specifically bumble bees when grown indoors (e.g., glasshouses).

226
As discussed previously, there are two studies that examine the residues of pollen in soil treated tomato. In one study (MRID 49090503), lower application rates were investigated while in a subsequent study (MRID 49665201), the maximum single rate of 0.38 lbs a.i/A to soil-treated fruiting vegetables was assessed. Additionally, the field sampling component of the first study was not conducted under GLP. Finally, the latter study reported higher residue levels in pollen, as expected from the higher application rate, and therefore the residues of this study were used for refining the Tier I risk estimation as well as for evaluating the frequency and duration of LOC exceedances using each sampled pollen measurement.
Table 6-49. SLUA data for imidacloprid and fruiting vegetables (2004-2013) Crop Lbs. Applied/yr. % Acreage Treated (average) % Acreage Treated (maximum) Tomatoes 30,000 30 60 Peppers 9,000 35 50
Refined Tier I oral risks and magnitude, duration, and frequency of LOC exceedance analysis As described in Section 6.1, the refined Tier I oral RQ values for honey bees resulting from the soil application on tomatoes range from <0.01 – 0.60 (adult acute), <0.01 - 12 (adult chronic), 0.19 – 0.39 (larval chronic). These RQ values reflect “high-end” estimates of bumble bee-collected pollen residues obtained from soil applications at the maximum label rate (1 X 0.38 lbs a.i/A) for tomatoes (MRID 49665201). The highest RQs for adults were determined for nurse bees that have a significant portion of their diet as pollen. Figure 6-10 below shows refined Tier I RQ values in relation the LOC for all available pollen data.

227
Figure 6-10. Summary of acute and chronic RQ values using totality of bee-collected pollen residue data from soil-applied tomato residue study (MRID 49665201). A total of 22 RQs were estimated from pollen residue data for each life stage/duration. Figure 6-10 above shows adult acute RQs generally below the acute risk LOC line of 0.4 with the exception of a few residue samples that yielded RQs marginally above. Adult chronic oral RQs in contrast are generally above the chronic risk LOC of 1 with the exception of roughly 20% of the estimated values. There were 2/22 (9%), 17/22 (77%), and 0/22 (0%) of estimated adult acute oral, adult chronic oral, and larval chronic oral RQs that exceeded their respective LOCs, respectively, using the totality of the residue data. As indicated previously, since there were no nectar data available, comparisons cannot be made to the colony feeding study effects level. Pollen residue levels were relatively consistent (acute EEC: 242 ppb, chronic EEC: 198 ppb) during the course of the study which is also indicated by the pattern of the estimated RQs, specifically with adult chronic RQs estimated to be above the chronic risk LOC from 32 days to 76 days after application.

228
Tier II Risk As no nectar data are available (the tomato plant does not produce nectar), comparisons of residues to the NOAEC and LOAEC of the colony feeding study cannot be made. Figure 6-11 shows the average residues in pollen from the soil-applied tomato study. While there is some exceptions, the higher residues are generally associated with the coarse soils and lowest with the finer soils. A subset of the residues (originating from coarse, medium, and fine soil types) are to be above 100 ppb which is associated with colony level effects following a 12-week exposure via pollen (Dively 2015, Qualitative).
Figure 6-11. Imidacloprid average residues in pollen from soil-applied tomato study (MRID 49665201). Additional Considerations At each sampling interval, bumble bee colonies were placed in bee tunnels (100 to 210 feet long and 20 to 40 feet wide, and enclosed four to eight rows of tomato plants) at each site. The bees were allowed to forage from the tomato flowers for several days after which the bees were collected and pollen was removed from pollen baskets (full description of methods provided in Appendix E).

229
There were 9 field sites used for this study all of which were located in California; sites located on the central coast and in the Central Valley with 5 fields characterized as coarse soil type, 1 with medium, and 3 as fine. The maximum distance between the sites was approximately 180 miles. Average residue values were variable within and across all sites and soil types and precluded the ability to state whether a given magnitude of residue values was associated with a particular soil type. For some sites, there were two sampling events within one trial that generally indicated that pollen residues were declining between the roughly two week period that residues were sampled although two sites (one coarse soil site and one fine soil site) had residues that increased between the sampling periods. As noted previously, tomatoes do not produce nectar, but their pollen is considered attractive, particularly to bumble bees. As discussed previously, the pollen route of exposure will be discussed later in the risk description. There are several soil application methods that are allowed on the label and the submitted study tests the highest single maximum application rate (0.38 lbs a.i/A) as a 7-day post-transplant soil drench which represents a permitted labeled scenario. Conclusions Daily average residues in pollen (no nectar produced by tomato) resulting from a soil application (post-transplant) to tomatoes exceeded 100 ppb which has been associated with colony level effects following a 12-week exposure to spiked pollen (Dively 2015, Qualitative).Although tomatoes are considered indeterminate bloomers, the findings of a potential colony level risk from the pollen route of exposure has limited relevance to honey bees since the fruiting vegetable group, including tomatoes, are not classified as honey bee attractive with the exception of okra, which produces both nectar and pollen and chilies which produce pollen that is attractive to honey bees. Therefore, from an Apis perspective, there is limited on-field exposure anticipated for tomato and the rest of the fruiting vegetable group except okra. However, member of this group, including tomato, are frequented by bumble bees, where managed pollination services are utilized for some members including tomatoes and sweet peppers within greenhouses. Crop Group 9 – Cucurbit Vegetables (Melon) The cucurbit vegetables crop group includes, among other members, cucumbers, muskmelon (inclusive of cantaloupe, honeydew and others) pumpkin, squash, and watermelons. Specific to the uses of imidacloprid, cantaloupes and watermelons are the dominant crops with an estimated usage of estimated 9,000 lbs/year each and an average of 40% of all cantaloupe nationwide treated with imidacloprid (Table 6-50). This is followed by cucumbers, honeydew, pumpkin, and squash with total poundage of roughly one third of that for cantaloupe and watermelon. According to USDA (2014) all members represented in the SLUA produce pollen and nectar noted to be honey bee attractive as well as requiring bee pollination using managed pollination services. Cucurbit vegetable crops are also associated with blooming duration of at least 6 weeks.

230
Table 6-50. SLUA data for imidacloprid and cucurbit vegetables (2004-2013) Crop Lbs. Applied/yr. % Acreage Treated (average) % Acreage Treated (maximum) Cantaloupes 9,000 40 60 Cucumbers 3,000 10 20 Honeydews 2,000 30 50 Pumpkins 2,000 10 20
Squash 2,000 15 30 Watermelons 9,000 25 45
Refined Tier I oral risks and magnitude, duration, and frequency of LOC exceedance analysis As described in Section 6.1, the refined Tier I oral RQ values for honey bees resulting from soil applications to melons, range from <0.01 – 0.60 (adult acute), 1.1 – 8.9 (adult chronic), 0.18 – 0.39 (larval chronic). These RQ values reflect “high-end” estimates of pollen and nectar residues obtained from a single soil application that ranged from 0.23 – 0.38 lbs a.i/A (representing 61 – 100% of the maximum single application rate) for melons at transplant (MRID 49090501). The highest RQs for adults were for nectar foragers. Figure 6-12 below shows refined Tier I RQ values in relation the LOC for all the totality of matched pollen and nectar data. A total of 10 RQs were estimated from all available pollen and nectar data for each life stage and duration (all from the same sampling interval of 100 days after application). Six of 10 (60%) of adult acute oral RQ values are below the acute risk LOC of 0.4. All (100%) of the adult chronic oral RQs are above the chronic risk LOC of 1 while 100% of the larval chronic oral RQs were below the chronic risk LOC.

231
Figure 6-12. Summary of acute and chronic RQ values using totality of pollen residue data from soil melon residue study (MRID 49090501).
Tier II Risks To evaluate the risk of soil application of imidacloprid to melons at the colony level for honey bees, daily average residues of total imidacloprid concentrations in nectar were compared to the aforementioned NOAEC and LOAEC values from the available registrant-submitted colony feeding study (Figure 6-10). As indicated previously, these residues values present only a single sampling period 100 days after application. The residue samples originate from soils characterized as medium and heavy (Figure 6-10). While the refined Tier I analysis indicated several adult acute oral RQs and all adult chronic oral RQs exceeded their respective LOCs at the honey bee individual level, all (100%) of the average residue values of available nectar data are below the colony feeding study NOAEC value of 25 ppb. As noted previously, cucurbit vegetable crops are associated with at least 6-week blooming periods, which matches the exposure duration of the colony feeding study. Although the highest average nectar residue value determined for this study would have to be approximately 5-fold higher to reach the NOAEC and approximately 10-fold higher to reach the LOAEC, the magnitude of these residues in coarser soils is

232
uncertain. Based on the residue studies of soil applications to other crops (e.g. blueberry), residues in pollen and nectar associated with coarser soils may exceed those in medium or fine soils by up to an order of magnitude.
Figure 6-13. Imidacloprid residues in nectar in soil-applied melon residue study (MRID 49090501) as compared to effect levels in registrant submitted colony feeding study (MRID 49510001).
Figure 6-14 below shows the daily average residues in pollen from the foliar-applied melon study. A subset of these residues are noted to be above 100 ppb which is associated with colony level effects following a 12- week exposure via pollen (Dively 2015, Qualitative). As noted above with nectar residues, it is an uncertainty the magnitude of residues in pollen had soil applications been made to melon in coarser soils.

233
Figure 6-14. Imidacloprid average residues in pollen from soil-applied melon study (MRID 49090501). Additional Considerations All ten sites employed for soil-applied melon study were located in one county in Southern California and were noted to have similar climatic conditions. As mentioned previously, application rates for the ten sites ranged from 0.23 – 0.38 lbs a.i/A on medium and heavy soils. The study report contained information gaps for 5 trials in the association of application rates with specific sites and soils. For the 5 trials with soil and application rate information, the data indicate a similar magnitude of residues in nectar and pollen from medium and fine soils. For the other 5 trials this information is not provided and is therefore an uncertainty. Therefore, the geographic/climatic representation of this study is limited. The extent to which prior year applications of imidacloprid contributed to year-to-year carryover was not assessed in this study. Finally, it is unclear the timing of the application relative to the bloom period and whether the scenario employed in this study represents one where the maximum residues in pollen and nectar would be realized. Additionally, there are two studies available from the open literature that investigate the residues of imidacloprid in pollen and nectar from soil-applications to cucurbit vegetables. In a study by Stoner and Eitzer (2012, MRID 49719616), imidacloprid (as Admire® Pro) was applied as a soil spray pre-planting at

234
0.32 lbs a.i/A 1 day before squash was planted. In a subsequent trial, the same application rate was used at a 5 day post-transplant via drip irrigation in a greenhouse. The residue values in pollen and nectar were pooled together from the various trials and no interval between application and sampling was available. Maximum and average values for pollen were 28 and 14 ppb, respectively, and were 14 and 10 ppb, respectively, for nectar. It is noted that the application rate is slightly below the maximum labeled single application rate 0.38 lbs a.i/A In a study by Dively and Kamel (2012, MRID 49719612), several trials were conducted with various treatment regimen to soil treated pumpkins. Applications rates of Admire® Pro included bedding drench applications (0.027 lbs a.i/A, transplant water treatment (0.25 lbs a.i/A and 0.38 lbs a.i/A), and split application of 0.19 lbs a.i/A first as transplant water, then as drip irrigation (See Appendix B for further details). Average pollen residue levels ranged 4.9– 80.2 ppb across all application methods and rates. Average nectar values ranged from 0.4 – 11.2 ppb, with the maximum nectar residue value was 13.7 ppb). All treatment regimens utilized are permitted on the label for soil-applied cucurbit vegetables. While average pollen residues were noted to be as high as 80 ppb in this study, this level is still under the threshold of where overwintering survival effects were noted from the available 12-week spiked pollen colony feeding study (Dively 2015, Qualitative). Soil type information was not available from this study. Finally, the registrant-submitted study discussed above (MRID 49090501) assessed a range of imidacloprid application rates representing 61 – 100% of the maximum application rate cited on the label. Applications across all sites were either made by soil drip or seed-line drench at transplant which are methods consistent with labeled applications. Conclusions While the average residues in nectar and pollen were both below the levels associated with colony level effects (25 ppb in nectar, 100 ppb in pollen), the residue data are associated with several uncertainties. These include a subset of the residues originating from less than the maximum application rate, unknown timing of application relative to bloom, and no residue information on coarse soils, which are indicated to potentially lead to residues in pollen and nectar up to an order of magnitude higher than those in medium and fine soils. The latter lack of residue data from coarse soils is significant because other residue studies suggest residues may be an order of magnitude greater medium and fine soils relative to those in coarse soils. Therefore, the on-field colony level risk to honey bees resulting from soil applications to cucurbits is considered uncertain. A full field Tier III study for pumpkins is expected in 2016 to further refine this determination as well as the potential to bridge to forthcoming soil-applied cucurbit vegetable studies for other neonicotinoid pesticides. Crop Group 10 – Citrus Fruits (Orange/Grapefruit) The usage and attractiveness of the citrus crop group was previously discussed in the foliar application uses section of risk description. The soil applied citrus study investigated the total residues of imidacloprid in pollen and nectar of multiple members of the group including orange, tangerine, and grapefruit. All trials utilized a post-bloom soil drench at the maximum single application rate for soil applications on

235
citrus (0.5 lbs a.i/A) with the exception of trials on oranges and tangerines which tested 0.25 lbs a.i./A. Because these trials tested only half the maximum labelled application rate for soil treatment to citrus, they were not included in the refined Tier I and Tier II analysis presented below. Additionally, pollen was not sampled in the remaining trials, which, as an important component of the diet for several castes of individuals such as nurse bees. Therefore, the refined Tier I RQs are considered an underestimation of the potential level of risk. Refined Tier I oral risks and magnitude, duration, and frequency of LOC exceedance analysis As described in Section 6.1, the refined Tier I oral RQ values for honey bees resulting from the soil application on citrus, range from 0.26 – 2.1 (adult acute), 4.3 -43 (adult chronic), 0.78 – 1.7 (larval chronic). The highest RQs for adults were nectar foragers. Figure 6-15 below shows refined Tier I RQ values in relation the LOC for all the totality of and nectar data (excluding the trial conducted with 0.25 lbs a.i/A). The 3 trials (3 tunnel sites and 6 field sites) assessed the residues in oranges and grapefruit at a maximum single application on citrus fruits at 0.5 lbs a.i/A. These trials are separated by lines inserted on the figure below with one trial comprised of three tunnel sites (3 mean residue samples), one trial with 2 fields (2 mean residue samples), and a third trial with 4 fields (4 mean residue samples). It is noted that in the tunnel trials, there were 3 trees (3 samples per tree) within each tunnel with one average sample from those three trees to yield an average from that tunnel. The soil type for this trial was characterized as loam (medium). In the second trial (field sites in LREC and Bakersfield), there were ten trees per field (3 samples per tree) with average samples from each field obtained. The soil type in this trial was also characterized as loamy (medium). In the third field trial, there were 10 trees in the Hemet site (1 sample per tree), 5 trees at the LREC site (2 samples per tree), 1 orange tree at the Temecula site (2 samples), and 6 grapefruit trees in Temecula site (2 samples per tree). The Hemet and Temecula sites were characterized as a sandy loam and the LREC site as loamy. It is also noted that while applications in this study were made post-bloom, that certain labels do not restrict pre-bloom and during bloom soil applications to citrus fruits, and therefore the residues in nectar from this study are likely underestimated. A total of 9 RQs were estimated for honey bee life stage and duration based on the three included trials from the available nectar. There were 8 of 9 (89%) of adult acute oral RQs above the acute risk LOC of 0.4 across all sites except one sample from the Temecula site with grapefruit. All (100%) of adult chronic oral RQs exceeded the chronic risk LOC for all sites. Finally, 4 of 9 (44%) of larval chronic oral RQs exceeded the chronic risk LOC across all trials.

236
Figure 6-15. Summary of acute and chronic RQ values using totality of nectar residue data from the soil-applied citrus residue study (MRID 49090505). Tier II Risks To evaluate the risk of soil application of imidacloprid to citrus at the colony level for honey bees, reported residues of total imidacloprid concentrations in nectar were compared to the aforementioned NOAEC and LOAEC values from the available registrant-submitted colony feeding study (Figure 6-16). There were no average residue values (0%) in nectar across all trials that exceeded the NOAEC level of 25 ppb; however, there is wide variability for several sites likely the result of small numbers of samples informing the average residue values for most sites. Despite this variability, the average residue values were relatively similar for sites with the same application rate of 0.5 lbs a.i/A across all trials (noting some lower values in the LREC and Temecula sites) that represent tunnel and field locations on two different members of the citrus fruits group. Although the data are not shown below, the field trial conducted with the lower rate of 0.25 lbs a.i/A had a maximum nectar residue value of 18.3 ppb that is roughly 50% of the maximum nectar residue values noted in tunnel, LREC/Bakersfield field site, and the Hemet/LREC/Temecula field sites which were 34.6, 29.1, and 35.5 ppb, respectively. As mentioned previously it was not known for all trials the sampling interval and how far after the application nectar samples were obtained.

237
As previously indicated, no pollen residue data were available from the trials that assessed the highest application rates for the soil-applied citrus study. The Hemet site was characterized as having a sandy loam, while for the Tunnel, LREC, and Bakersfield sites, the soils were characterized as loamy (no soil type information provided for the Temecula site) and from Figure 6-16 below, no inference can be made about soil type having an effect on the magnitude of residues in nectar, with the exception of one sample from the Temecula site.
Figure 6-16. Imidacloprid residues in nectar in soil-applied citrus residue study (MRID 49090505) as compared to effect levels in registrant submitted colony feeding study (MRID 49510001). Additional Considerations In the citrus soil residue study, nectar was either sampled directly from the flower or from stores collected within the hive, depending on the trial. Nectar samples were obtained from two locations (citrus blocks in the Temecula region and at LREC) where the 1X soil application rate of imidacloprid had been made in two successive years (2008, 2009) prior to sampling in April 2010. Residue levels at these 11 sites averaged 8 ppb and ranged from 1 to 18 ppb.

238
The six locations for the citrus trials were in relatively close proximity. Soil types reflect sandy loam, loam or clay compositions (20-40% clay) and low organic carbon content (0.35-1.9%). Weather conditions (temperature and precipitation) were similar across the three trials. As a result of the close proximity of trial sites, this study provides very limited information on how differences in environmental conditions across different areas of the U.S. may affect accumulation of total imidacloprid in pollen and nectar. The authors speculated that imidacloprid residues at the Hemet site appear to be a function of the rate applied at the most recent application only, with no evidence of carryover from previous years. However, following the third year of application at the Hemet site, residues were higher at the two sites receiving no treatment in 2010 than at the site treated all three years with 1X. This indicates some degree of carryover from previous application years, at least for sites treated with the 2X rate during one of the two years prior to the no treatment year. This was the only site where samples were collected following a year without treatment. Conclusions While the average residues in citrus nectar are just below the threshold indicated to present colony level risk in nectar (25 ppb) the residue data are associated with some uncertainties. The primary uncertainty relates to the lack of residue information originating from coarse soils which are indicated to potentially lead to residues in pollen and nectar up to an order of magnitude higher than those in medium and fine soils. Additionally, while the available citrus study employed a post-bloom application, current labels for soil applications to citrus fruits do not restrict applications being made pre-bloom or during the bloom period. The magnitude of residues in nectar and pollen may have been higher had applications been made closer to the bloom period. Therefore, the on-field colony level risk to honey bees resulting from soil applications to citrus fruits is considered uncertain. The potential to bridge to forthcoming soil-applied cucurbit vegetable studies for other neonicotinoid pesticides will be evaluated for the final risk assessment. Crop Group 13 – Berries/Small fruits (Blueberry and Strawberry) The berries crop group includes, among other members, blackberry, blueberry, and raspberry. This crop group also includes group 13-07 (small fruit and berries group), which itself encompasses 8 subgroups that contain other crops such as strawberry, cranberry, and grape. Specific to the uses of imidacloprid, grapes are the dominant crop with an estimated usage of estimated 60,000 lbs/year (Table 6-51). This is followed by strawberries and blueberries to a far lesser extent. According to USDA (2014), blueberries, blackberries, and raspberries require bee pollination blueberries uses managed sources of pollination. Although, bee pollination of strawberry is not considered essential, it may be used to compliment wind pollination. Similarly, grapes are wind pollinated and therefore do not require honey bee pollination. Additionally, grape do not produce nectar, although their pollen is noted to be attractive according to USDA (2014).

239
Table 6-51. SLUA data imidacloprid and berries/small fruit (2004-2013)
Crop Lbs. Applied/yr.
% Acreage Treated (average)
% Acreage Treated (maximum)
Caneberries (includes blackberry and raspberry) <500 15 25
Grapes 60,000 30 50 Strawberries 2,000 5 15 Blueberries 1,000 10 20
Residue studies are available for soil-treated blueberry and strawberry and will be discussed separately below. Blueberry Refined Tier I oral risks and magnitude, duration, and frequency of LOC exceedance analysis As described in Section 6.1, the refined Tier I oral RQ values for honey bees resulting from soil application to blueberries, range from 0.14 – 1.2 (adult acute), 2.4 - 16 (adult chronic), 0.30 – 0.66 (larval chronic). These RQ values reflect “high-end” estimates of bee-collected pollen and hive nectar residues obtained from a soil application at the maximum label rate (1 X 0.50 lbs a.i/A) post-bloom for blueberries (MRID 49665201). The highest RQs for adults were for nurse bees that have a significant portion of pollen as their diet. Figure 6-17 below shows refined Tier I RQ values in relation to the LOC for all matched pollen and nectar data.

240
Figure 6-17. Summary of acute and chronic RQ values using totality of the bee collected-pollen and hive nectar residue data from soil-applied blueberry residue study (MRID 49535602). A total of 17 matched data for pollen and nectar residues were available to estimate acute and chronic RQs for honey bee adults and larvae. There were 2 /17 (12%) of the adult acute oral RQs that exceeded acute risk LOC of 0.4 while 0/17 (0%) of the larval chronic oral RQs exceeded the chronic risk LOC of 1. This is distinguished from adult chronic oral RQ values where all (100%) RQs exceeded the chronic risk LOC. The highest acute and chronic RQs for adults were associated with nectar foragers. Tier II Risks To evaluate the risk of soil application of imidacloprid to blueberries at the colony level for honey bees, reported residues of total imidacloprid concentrations in nectar were compared to the aforementioned NOAEC and LOAEC values from the available registrant-submitted colony feeding study (Figure 6-14). As there was no obvious carry over from year-to-year evident in the data, the average nectar residue values were plotted by soil type. While the data are limited, the figure below shows overall higher residue values for sandy soils as compared to loam and silty loam soil types, with sandy soils having mean residues almost 10-fold higher than silty loam soils. None of the daily average residues values in nectar (0%) exceeded the NOAEC value of the colony feeding study of 25 ppb.

241
Figure 6-18. Average total residues in nectar from soil-applied blueberry study (MRID 49535602) as compared to effect levels in registrant submitted colony feeding study (MRID 49510001). Figure 6-19 below shows the average residues in pollen from the foliar-applied melon study. All residues were noted to be below 100 ppb which is associated with decreased overwintering survival following a 12-week exposure to imidacloprid spiked pollen (Dively 2015, Qualitative).

242
Figure 6-19. Imidacloprid average residues in pollen from soil-applied blueberry study (MRID 49535602). Additional Considerations In the blueberry residue study, within each trial and year, the duration of sampling times were relatively short, ranging from approximately 3 days to 20 days which apparently reflects the blooming period for the blueberry varieties tested. With hive-collected nectar, there appears to be a slight increase in mean residues of total imidacloprid residues over the sampling time. With pollen, the temporal trend in mean residues appears to be variable or stable over the sampling period, depending on the trial. Furthermore, the overall range in reported residues of total imidacloprid residues in pollen is substantially greater than that observed with nectar. This may reflect differences in collection methods between the two matrices (hive-collected for nectar, bee-collected for pollen). The geographic coverage among the three trials was relatively broad (northwestern NY, northern IL, and southwestern MI) although they were in the northern portion of the US. A range of soil types are represented (loam, silty loam and sand) with sandy soils generally associated with the highest average residue as indicated by Figures 6-18 and 6-19 above.

243
A qualitative evaluation of the potential for year-to-year accumulation of total imidacloprid residues in nectar and pollen could only be conducted for 1 of the 3 trials (NT003); since a majority of the mean residue data for trial NT001 and NT002 were below levels of detection or quantification. The data indicate the mean (based on those residues >LOQ) of total imidacloprid residues in nectar from Trial NT003 decreased in year 2 relative to year 1 (7.25 ppb vs 1.8 ppb) while those in pollen remained essentially the same (13.7 vs 14.0 ppb). Thus, there is little evidence of year-to-year carryover of residues in bee-relevant matrices, despite evidence of increases in soil concentrations from the end of the first to the second growing season from two of the trials (soil: 151 to 233 ppb in NT001; 151 to 339 ppb in trial NT002). Finally, ccurrent label language for soil applications to blueberry specify that application may be made post-bloom up to 7 days prior to harvest, or post-harvest until October 1st. Additionally, applications are not permitted pre-bloom, during bloom, or when bees are foraging. Therefore, the residue study was conducted in accordance with label restrictions. Conclusions Average residues in nectar were below threshold that is associated with colony level risk (25 ppb in nectar). Furthermore, residues in pollen were below levels associated with reduced overwintering success following a 12-week exposure (Dively 2015, Qualitative). The available blueberry study was conducted according to current labels, and while the data suggest average residues in coarser soils are higher than those in medium and fine soils, all residues were below colony level risk thresholds in their respective matrices. Therefore, post-bloom soil applications to blueberries are determined to present a low on-field risk to honey bees at the colony level. Strawberry Refined Tier I oral risks and magnitude, duration, and frequency of LOC exceedance analysis As described in Section 6.1, refined Tier I oral RQ values for honey bees range from <0.01 – 0.79 (adult acute), <0.1 - 17 (adult chronic), 0.28 – 0.55 (larval chronic). These RQ values reflect “high-end” estimates of pollen residues obtained from a single soil application at the maximum label rate (1 X 0.50 lbs a.i/A) for strawberries (MRID 49090502). The highest acute and chronic RQs for adults were determined for nurse bees that have the highest portion of pollen as their diet among adult. Figure 6-20 below shows refined Tier I RQ values in relation to the LOC for all available pollen residue data. It is noted that no nectar data are available from this study despite the fact that strawberries produce nectar that is attractive to honey bees. Consequently, the RQ values may underestimate risk for the refined Tier I analysis as no nectar component is included in the exposure estimates as well as precludes a Tier II analysis to characterize the risks of soil applications to strawberries at the colony level.

244
Figure 6-20. Summary of acute and chronic RQ values using totality of pollen residue data from soil –applied strawberry residue study (MRID 49090502). (Note: Sampling interval not provided). A total of 7 RQs were estimated using the totality of pollen residue data for each life stage and duration. It is noted that the sampling interval was not available from this study and therefore it is unknown how long after application the sampling was conducted, although the samples were stated to have been collected during bloom. Additionally, the timing of the application in relation the bloom period is not known for this study and therefore there is no x-axis label to indicate the days after application. There were 2 of 7 (29%) and 3 of 7 (43%) of adult acute oral and adult chronic oral RQs, respectively, that exceeded their respective LOCs. No larval chronic oral RQs (0%) exceeded the chronic LOC. Again, the results of this refined Tier I analysis are uncertain given that nectar data would be expected to raise EECs and the RQs, and that no sampling interval (other than “during bloom”) was available to ascertain the potential behavior of residues over time. Tier II Risks As stated previously, as no nectar data are available (despite the strawberry crop producing nectar that is attractive to honey bees), comparisons of residues to the NOAEC and LOAEC of the colony feeding study were not made.

245
The available pollen residue data shown below in Figure 6-21 indicate that a subset of the average values are above 100 ppb which is associated with reduced overwintering survival following a 12 week exposure to spiked pollen (Dively 2015, Qualitative). Additionally, Figure 6-21 indicates that the residues associated with lighter (sandy) soils have higher average residues as compared to medium (loamy) soil, where average residues were approximately an order of magnitude lower. Strawberries are associated with a long (i.e. several month) blooming period.
Figure 6-21. Imidacloprid average residues in pollen from soil-applied strawberry study (MRID 49090502). Additional Considerations As indicated previously, there was one sampling event for this study, of an unknown interval in relation to time of application, and therefore it is not possible to assess residues over time. All seven sites employed for this study were located in a single location in California with the same weather conditions (temperature and precipitation) across all sites. As a result of the close proximity of the trial sites, this study provides no information on how differences in environmental conditions across different production areas of strawberry of the US may affect accumulation of total imidacloprid residues in bee-relevant matrices. As all samples were taken at one sampling interval during one year, the potential carryover of imidacloprid cannot be assessed.
0
1
10
100
1000
Con
cent
ratio
n in
Pol
len
(ppb
)
Sand
Loam

246
It is also noted that this study tested 3 coarse (i.e. sandy) soils and 4 medium (i.e. loam) textured soils. The 3 sets of highest RQs are from trials conducted on sandy soils. Average residues in pollen ranged from 87 – 279 ppb in the sandy soil sites and 4.8 – 8.6 ppb in the loamy sites, indicting residues in pollen in the sandy sites were one to two orders of magnitude higher than those in loamy sites. It is also noted that the LOD and LOQ in pollen for this study were 2.6 and 10 ppb, respectively, meaning that all average residues values from the loamy sites were between the LOD and LOQ, rendering these values less certain in their estimates. This study was conducted at the maximum single application rate for soil-applied imidacloprid to strawberries (0.50 lbs a.i/A). Labels allow for applications to strawberry at this rate (0.50 lbs a.i/A) when applied to annual and perennial varieties where pest pressure may occur later in crop development. Alternatively, a maximum single rate of 0.38 lbs a.i/A is permitted for perennial varieties as a post-harvest application. Either one method or the other is permitted. As the available study tested the higher rate, it is assumed that the application was made post-bloom as the label states to not apply immediately prior to bud opening, during bloom, or when bees are foraging. Conclusions The daily average residues in nectar were not available from this study, although honey bees are attracted to honey bee nectar. Daily average residues in pollen that originated from coarse soils were above 100 ppb which is associated with reduced overwintering success following a 12 week exposure to spiked pollen (Dively 2015, Qualitative). Additionally, it is an uncertainty of the timing of this application relative to the bloom period. Therefore, soil application to strawberries present an uncertain colony level for honey bees. While no further soil application studies are expected for strawberries for other neonicotinoid chemicals, there is the potential to bridge to data for foliar applications to strawberries that is forthcoming for other chemicals. Crop Group 20 – Oilseed (Cotton) The usage and attractiveness of cotton was previously discussed in the foliar application uses section of risk description. The soil-applied cotton study is one component of a combined soil + foliar application study to be later described in the combined application method section (MRID 49665202). The soil component of the study made an “at plant” application at the maximum single rate for soil-applied imidacloprid on cotton at 0.33 lbs a.i/A. Residues from pollen, nectar and extra-floral nectar were sampled but as the floral nectar residues were approximately 3-fold higher than extra-floral data, these values were used for the analysis below. Refined Tier I oral risks and magnitude, duration, and frequency of LOC exceedance analysis
As described in Section 6.1, the refined Tier I oral RQ values for honey bees resulting from a soil application to cotton, range from 0.97 – 9.5 (adult acute), 16 - 152 (adult chronic), 2.8 – 6.0 (larval chronic). These RQ values reflect “high-end” estimates of pollen and nectar residues obtained from a soil application at the maximum label rate (1 X 0.33 lbs a.i/A) for cotton at planting (MRID 49665202).

247
Figure 6-22 Summary of acute and chronic RQ values using totality of pollen and nectar residue data from soil-applied cotton residue study (MRID 49665202). A total of 15 RQs were estimated from matched pollen and floral nectar data for each life stage and duration. Figure 6-22 above indicates that 10 of 15 (67%) of the adult acute oral RQs values exceed the acute risk LOC of 0.4. All (100%) of the estimated adult chronic oral RQs and 7/15 (47%) of the larval chronic oral RQs exceed the chronic risk LOC of 1, respectively. Tier II Risks To evaluate the risk of soil application of imidacloprid to cotton at the colony level for honey bees, daily average residues of total imidacloprid concentrations in nectar were compared to the aforementioned NOAEC and LOAEC values from the available registrant-submitted colony feeding study (Figure 6-23). As data were available for one year, the average nectar residue values were plotted by soil type. While the data are limited, the figure below shows overall higher residue values for sandy soils (loamy sand) as compared to loam, sandy loam, and clay soil types.

248
There were 5 of 15 (33%) average residue samples (all soils combined) that exceeded the NOAEC of 25 ppb and 3 of 15 (20%) samples that exceeded the LOAEC of 50. Ten of fifteen (67%) of the average residue samples were below the NOAEC of 25 ppb (range 1.65 – 19.35 ppb). It is noted that the NOAEC and LOAEC exceedances are associated with sandy loam and loamy sand soil types, which are the coarsest of those included in this study.
Figure 6-23. Imidacloprid residues in nectar in the soil-applied cotton study (MRID 49665202) as compared to effect levels in registrant submitted colony feeding study (MRID 49510001). The available pollen residue data shown below in Figure 6-24 indicate that all residues were below 100 ppb, which is associated with reduced overwintering success following a 12-week exposure in pollen (Dively 2015, Qualitative).

249
Figure 6-24. Imidacloprid average residues in pollen in the soil-applied cotton study (MRID 49665202). Additional Considerations The soil-applied cotton study also assessed 3 “at bloom” foliar application at the maximum single application rate of 0.06 lbs a.i/A. The combined magnitude of the soil residues with the foliar component will be discussed in the combined application method section. As the soil component was associated with one sampling event, the behavior of the residues in nectar over time could not be determined. Samples were collected four to five days before the first foliar application. There were nine sites employed for this study that were all located in California’s Central Valley. It was not reported whether the treatment fields had prior applications of imidacloprid. Current label language for soil applications to cotton specify that application may at planting at a maximum single application rate of 0.33 lbs a.i/A with no specific restrictions to honey bees or other pollinators. There are no other registered use patterns of the oilseed crop group for soil applications. Conclusions Average residues in nectar and pollen resulting from a single soil application indicate a colony level risk based on residues in nectar being above the Tier II NOAEC in nectar (25 ppb) and residues in pollen were

250
below 100 ppb which is associated with reduced overwintering survival following a 12-week exposure (Dively 2015, Qualitative). As indicated with the conclusions for cotton associated with foliar applications discussed above, a full field Tier III study is expected in 2016 to potentially further refine this determination. Additional Soil Application Use Patterns In addition to the use patterns presented above in the foliar use pattern section (which are also registered as soil applications), there are several other use patterns registered for imidacloprid for soil only. These uses include other members of root and tuber vegetables (crop group 1) as well as crop groups 3 and 9 (bulb and cucurbit vegetables, respectively). Specific to the data provided by the SLUA, Table 6-52 below summarizes these uses in a manner similar to that presented above for the foliar (and soil) uses. The root vegetables carrot and sugar beet (the latter registered only in California according to the Admire® Pro label) produce pollen and nectar that are attractive to honey bees but are also harvested before bloom unless used for seed production. This is also the case for members of the bulb vegetables group and therefore honey bee exposure to these crops is expected to be minimal. The cucurbit vegetable group (crop group 9) produces pollen and nectar that are considered to be attractive to honey bees, and accounts for approximately 25,000 pounds per year of imidacloprid usage according to the SLUA. Residue data are available for melons for this group as presented above although it is an uncertainty as to what extent the residues in this crop are representative for other members of the group. It is noted that the use patterns associated with uncertainty including potatoes, legumes (soybean), and tree nuts that were noted in the foliar use section in terms of magnitude of residues in pollen and nectar are noted here as well with respect to soil applications.
Table 6-52. SLUA data for imidacloprid on soil only registered use patterns (2004-2013). (Note: Data are available for soil treated cucurbit vegetables and therefore is not presented below since its SLUA data is shown in the soil treated melon discussion
Crop Group Name (Number) Use pattern
Lbs. Applied/yr.
% Acreage Treated (average)
% Acreage Treated (max)
Honey Bee Attractive? (Pollen or nectar) (Y/N)
Harvested Before Bloom? (Y/N)
Root & Tubers (1) Carrots 4,000 15 45 Y Y Sugar Beets* 2,000 <2.5 5 Y (nectar) Y
Bulb Vegetables (3) Garlic <500 5 5 Y Y
Bulb Vegetables (3) Onions 1,000 <2.5 5 Y Y
*For use in California only according to Admire® Pro label (EPA Reg. No. 264-827)

251
Summary of Crop Group/Use Patterns for which Soil Residue Data are Available Table 6-53 below summarizes the available residues studies for the soil-applied method as well as a providing a range of the refined Tier I RQs, the percentage of nectar residues above the Tier II NOAEC threshold in nectar (25 ppb) and where available, the duration those residues exceed the NOAEC.
Table 6-53. Summary of risk findings for the soil applied use patterns of imidacloprid with available residue data.
Crop Group
(Crop)
Application Scenario1
Worst Case
Scenario? (Y/N)
Refined Tier I RQ Ranges3 (percentage of Refined Tier I RQs above LOC using all
residue data)4 Tier II5
Adult Acute Oral
Adult Chronic
Oral
Larval Chronic Oral
%age of nectar residues above NOAEC
Duration above NOAEC8
Fruiting Vegetable (Tomato)
1 x 0.38 lbs a.i/A, 7-days
post -transplant
Y6
<0.01 - 0.60 (9.0%)
<0.01 - 12 (77%)
0.19 - 0.39 (0%)
- No analysis conducted, tomato does not produce nectar - Crop group generally not attractive to honey bees
Cucurbit Vegetables (Melons)
1 x 0.23 – 0.38 lbs a.i/A, at
transplant
N7 <0.01 - 0.60 (60%)
1.1 - 8.9 (100%)
018 - 0.39 (0%) 0% N/A
Citrus (Orange /
Grapefruit)
1 x 0.50 lbs a.i/A, post
bloom Y 0.26 – 2.1
(89%) 4.3 - 43 (100%)
0.78 - 1.7 (44%) 0% N/A
Berries (Blueberry)
1 x 0.5 lbs a.i/A, 3 days post-harvest
Y 0.14 - 1.2 (12%)
2.4 - 16 (100%)
0.3 - 0.66 (0%) 0% N/A
Berries (Strawberry)
1 x 0.5 lbs a.i/A, app. timing unknown relative to bloom
Unknown <0.01 - 0.79 (29%)
<0.01 - 17 (43%)
0.28 - 0.55 (0%)
- No analysis conducted, nectar data not available
Oilseed (Cotton)
1 x 0.33 lbs a.i/A, at planting
Y 0.97 - 9.5 (67%)
16 - 152 (100%)
2.8 – 6.0 (47%) 67% 17 days
Bolded value represent RQ in exceedance of acute or chronic LOC (0.4 and 1.0, respectively); N/A: Not applicable 1Application rate, number of applications, timing 2Based on whether rate represents maximum annual rate for a given use pattern 3Based on highest reported residue concentration of all individual replicates (acute) or highest average concentration among all individual sampling events (chronic). 4Based on all pollen and/or nectar data from all sampling intervals 5Compared to colony feeding study NOAEC of 25 ppb 6Maximum soil-applied rate allowed on all fruiting vegetables except okra and pepper, which is 0.50 lbs a.i/A 7Multiple sites for this study using range of application rates depending on site. It is unclear the application rate for some of the sites to which to tie back residues to. Maximum annual rate for cucurbit vegetables is 0.38 lbs a.i/A 8Refers to at least one average residue value

252
Seed Treatment Applications Crop Group 15 – Cereal Grains (Corn) The cereal grains crop group includes, among other members, barley, corn, oats, rice, rye, and wheat. Specific to the uses of imidacloprid, wheat is the dominant crop with an estimated usage of estimated 100,000 lbs/year (Table 6-54). This is followed by corn and sorghum with approximately 30% and 10%, respectively of the total poundage applied to wheat. It is noted that seed treatment is the only registered application method to cereal grains. Usage statistics were unavailable from the SLUA for any other cereal grain crop. According to USDA (2014), the cereal grain group is generally unattractive to bees or does not produce nectar as is the case with corn and wheat, which produce only pollen. An exception to this is sorghum, which produces pollen and nectar that is considered to be attractive to honey bees. Although not reported in the SLUA, buckwheat is considered highly attractive for honey bees and may be used for honey production. Additionally, members of this group generally do not require bee pollination or use managed pollination services.
Table 6-54. SLUA data imidacloprid and cereal grains (2004-2013)1
Crop Lbs. Applied/yr. % Acreage Treated (average)
% Acreage Treated (maximum)
Corn (Seed Treatment)1 30,000 <2.5 <2.5 Sorghum (seed treatment)1 10,000 15 20
Wheat (seed treatment)1 100,000 15 20 1The surveying period for seed treatment uses does not always cover the entire period of the SLUA Refined Tier I oral risks and magnitude, duration, and frequency of LOC exceedance analysis As described in Section 6.1, the refined Tier I oral RQ values for honey bees resulting from a seed treatment application on corn range from <0.01 – 0.1 (adult acute), <0.01 – 1.34 (adult chronic), 0.02 – 0.04 (larval chronic). These RQ values reflect “high-end” estimates of pollen and nectar residues obtained from a seed treatment application at the maximum label rate (1.34 mg a.i/seed) for corn at planting (MRID 49511701). As the corn plant does not produce nectar, Figure 6-25 below shows the totality of all pollen data used to estimate refined Tier I RQs for each life stage and duration.

253
Figure 6-25. Summary of acute and chronic RQ values using totality of pollen residue data from seed treatment corn residue study (MRID 49511701).
A total of 36 RQs values were estimated for each life stage and duration. Only one chronic adult (3% of the total RQs) exceeded the chronic LOC of 1. All other adult acute oral RQs and larval chronic oral RQs were below their respective LOCs. Comparisons were not made to the sucrose-based colony feeding study effect levels. For corn, comparisons cannot be made to the colony feeding study effect levels. However, with the exception of one adult chronic oral RQ value estimated from the maximum sampled residue (40 ppb), the results of the refined Tier I indicate pollen residues are below Tier I acute and chronic LOCs for honey bees when applied as seed treatment to corn. Tier II Risks As stated previously, as no nectar data are available (corn does not produce nectar), comparisons of residues to the NOAEC and LOAEC of the colony feeding study were not made. The daily average pollen residue data shown in Figure 6-26 below indicate that all residues are below 100 ppb which is associated with reduced overwintering success following a 12-week exposure to spiked pollen (Dively 2015, Qualitative).

254
Figure 6-26. Imidacloprid residues in pollen in the seed treated corn study (MRID 49511701). Additional Considerations Among all trials in the corn residue study, the maximum duration of the sampling period during bloom is approximately 8 days. Temporal trends in daily average total imidacloprid residues in pollen were variable or declining with time in 2012 while interestingly in 2013, concentrations increased with time in each of the three trials. The maximum daily average concentration of total imidacloprid (22.3 ppb) from DAA 84 in trial NT012 is much greater than the previous sampling event for that trial (4.0 ppb) and is also greater than daily means from all other trials. Inspection of the raw data indicates this high value is not a result of a single outlier among the 5 replicates. The reason for the increasing concentrations of total imidacloprid during the second year of sampling is not clear but may reflect greater desiccation of pollen over time. This explanation, however, does not explain why such trends were not consistently observed during year 1 (2012). With corn tassels, the daily average of total IMI residues generally followed a similar trend as pollen, which is expected since tassels are the pollen bearing portion of the corn plant. This also suggests that the increase in concentration over time consistently observed in year 2 (and in year 1 of trial NT012) is not limited to the pollen matrix alone, but rather reflects the pattern in the entire corn tassel. The three corn residue trials were located in the midwestern U.S. with a maximum distance of approximately 270 miles (further details provided in Appendix E). Examination of the monthly precipitation records suggests a similar magnitude and pattern over time. Thus from a climate perspective, these trials reflect similar climatic conditions. A range of soil types is represented in the trials (silty clay, silt loam, loam) although none were predominately composed of sand. The total imidacloprid

255
residues in corn pollen and tassels are comparable from years 1 and 2 of one site and suggest no obvious year-to-year carry over in total imidacloprid residues in corn pollen and tassels. It is clear that imidacloprid residues in soil measured prior to planting in year 2 (9-80 ppb) are elevated compared to those measured prior to planting in year 1 (2-4 ppb). Within each trial/plot, concentrations of imidacloprid increased in soil by 2-13X prior to planting in year 1 vs. year 2. Comparison of soil concentrations measured at the end of each growing season in one site also suggest year-to-year carry over in soil, with year 2 imidacloprid concentrations increasing by 4X to 5X relative to year 1. It is important to recognize that these trends reflect parent imidacloprid only and do not include possible contribution of toxic degradates (IMI-olefin, 5-OH IMI). Additionally, while the residues in soil are indicated to be increasing from year 1 to year 2, this does not manifest in higher residues in pollen in year 2 relative to year 1. Additionally, a second series of trials was conducted to measure the same residues in/on bee-relevant white clover pollen and nectar samples and in blossoms, leaves, and soil from white clover plants grown at locations where seed-treated corn plants were grown the previous year (full description of methods provided in Appendix E). Samples of white clover leaves, blossoms, nectar (hive-collected), and pollen (hive collected) were collected during four sampling periods in study year 2. The concentrations of total IMI measured in white clover nectar and pollen planted following planting and harvesting of seed-treated corn the previous year were near or below the combined limits of detection for total imidacloprid (1.24 ppb for pollen and 1.33 ppb for nectar. In the majority of samples analyzed (detection frequency = 28% for clover pollen and 0% for clover nectar). The maximum concentrations of total IMI measured in clover pollen in three trials was 3.8 ppb. In addition to the seed-treated corn study discussed above, there are several registrant and open literature studies available that assessed the residues in pollen of seed-treated corn. In the case of the registrant-submitted studies (MRIDs 47699416, 47699414, 47699422, 47699423, and 47699425), all were semi-field tunnel studies that allowed the bees to forage on seed treated corn or provided pollen that originated from seed-treated corn to bees within a tunnel. While these studies are not of utility from an effects standpoint due to major deficiencies that are presented in Appendix A, the residue component of these studies are considered fit for qualitative use. All studies found that pollen residues were below the LOQ of 5 ppb. It is noted that 55% of the 36 pollen samples taken during the seed-treated corn study discussed above were at or below 5 ppb. The sampling interval for these studies ranged from 63 to 77 days after application and was not reported for some studies. Additionally, a study evaluated as part of the open literature effort assessed pollen residues of seed-treated corn 130 days after planting and residues were below the LOQ of 1 ppb (Donnarumma, 2011, MRID 497196140). As the available seed-treated corn study (MRID 49511701) tested the maximum labeled rate of 1.34 mg a.i/seed and there are no other restrictions on the label related to bees, this study was conducted in accordance with the label. There is uncertainty as to what the residue levels in pollen would be for other seed-treated crops, as members of the cereal grain group have varying application rates when expressed in terms of mg a.i/seed. Additionally, while this crop group is largely unattractive to bees or does not require bee pollination, sorghum is noted to be an exception, as well as being a use pattern identified in the SLUA as having 10,000 pounds of a.i/year associated with it. Buckwheat is also an exception, but currently not identified in the SLUA.

256
It is also noted here that this analysis does not take into consideration the potential risk of abraded seed coating from corn or other seed treatment applications of imidacloprid. This exposure pathway is one that is recognized in the Guidance for Assessing Pesticide Risks to Bees (US EPA 2014). At this time, the Agency has not addressed this potential route in a quantitative manner. Rather it has worked with different sectors of the seed treatment industry to identify means to reduce potential exposure through management practices. Efforts have been made to identify best management practices (e.g., Seed Treatment Stewardship Guide by the American Seed Trade Association), technology (e.g., new seed lubricants used during planting operations with pneumatic planter), and design (e.g., new design standards for certain pneumatic planting equipment). The agency will continue to evaluate new information on the effectiveness of these best management practices in addition to data that quantify off-field drift of imidacloprid via abraded seed coat dust. Pending review of this information, the agency will consider additional characterization of the dust-off exposure in its complete Preliminary Risk Assessment at the end of 2016. Conclusions The available data on seed treated corn indicates that daily average residues in pollen were below 100 ppb which is associated with decreased overwintering survival following a 12-week exposure to spiked pollen (Dively 2015, Qualitative). As indicated previously, data are not available for nectar as corn does not produce it. Therefore, seed treatment applications to corn are determined to present a low on-field colony level risk to honey bees. While other members of the cereal grain group are not attractive to honey bees including wheat, oats, rye, and barley, there are two members, sorghum and buckwheat that produce nectar that is attractive to honey bees. No residue data are currently available for these two members and registrant-submitted data are not expected for the other neonicotinoids being assessed in 2016. It is noted, however, that based on the residue studies of seed-treated crops in other crop groups (Tables 4-14 and 4-15), levels of imidacloprid in nectar are low (<10 ppb) relative to other application methods. Should nectar residue data continue to be unavailable for nectar producing cereal grains (sorghum, buckwheat) the agency will consider bridging information from seed-treated crops in other crop groups in its 2016 assessment. Additional Seed Treatment Use Patterns Imidacloprid is registered for seed treatment for other members of crop groups 1 (root and tuberous vegetables), crop group 3 (bulb vegetables), crop group 5 (brassica vegetables), crop group 6 (legumes), crop group 19 (herbs and spices), crop group 20 (oilseed) and peanuts (no crop group). Screening level use information provided by the SLUA (which is noted to not include all potential uses of seed treated application for imidacloprid, Table 6-55 below) indicates that soybean dominates the seed treatment application usage, with 400,000 lbs applied annually. This represents the largest use of imidacloprid (in terms of poundage applied) from all use patterns delineated in the SLUA. This is followed to a lesser extent by the aforementioned seed treated cotton (50,000 lbs) and potatoes at 30,000 lbs per year. Soybeans represent an uncertainty in the risk profile because it is a major use pattern is attractive to bees via pollen and nectar, yet pollen and nectar data are unavailable from both registrant and open
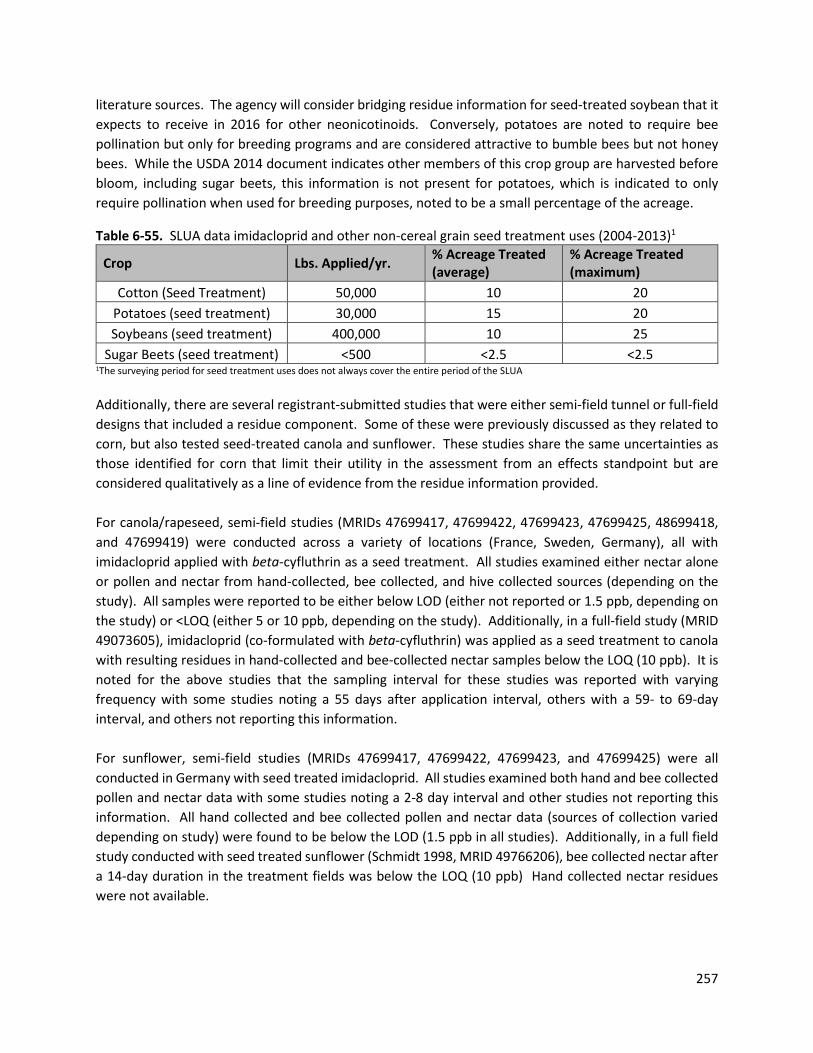
257
literature sources. The agency will consider bridging residue information for seed-treated soybean that it expects to receive in 2016 for other neonicotinoids. Conversely, potatoes are noted to require bee pollination but only for breeding programs and are considered attractive to bumble bees but not honey bees. While the USDA 2014 document indicates other members of this crop group are harvested before bloom, including sugar beets, this information is not present for potatoes, which is indicated to only require pollination when used for breeding purposes, noted to be a small percentage of the acreage.
Table 6-55. SLUA data imidacloprid and other non-cereal grain seed treatment uses (2004-2013)1
Crop Lbs. Applied/yr. % Acreage Treated (average)
% Acreage Treated (maximum)
Cotton (Seed Treatment) 50,000 10 20 Potatoes (seed treatment) 30,000 15 20 Soybeans (seed treatment) 400,000 10 25
Sugar Beets (seed treatment) <500 <2.5 <2.5 1The surveying period for seed treatment uses does not always cover the entire period of the SLUA Additionally, there are several registrant-submitted studies that were either semi-field tunnel or full-field designs that included a residue component. Some of these were previously discussed as they related to corn, but also tested seed-treated canola and sunflower. These studies share the same uncertainties as those identified for corn that limit their utility in the assessment from an effects standpoint but are considered qualitatively as a line of evidence from the residue information provided. For canola/rapeseed, semi-field studies (MRIDs 47699417, 47699422, 47699423, 47699425, 48699418, and 47699419) were conducted across a variety of locations (France, Sweden, Germany), all with imidacloprid applied with beta-cyfluthrin as a seed treatment. All studies examined either nectar alone or pollen and nectar from hand-collected, bee collected, and hive collected sources (depending on the study). All samples were reported to be either below LOD (either not reported or 1.5 ppb, depending on the study) or <LOQ (either 5 or 10 ppb, depending on the study). Additionally, in a full-field study (MRID 49073605), imidacloprid (co-formulated with beta-cyfluthrin) was applied as a seed treatment to canola with resulting residues in hand-collected and bee-collected nectar samples below the LOQ (10 ppb). It is noted for the above studies that the sampling interval for these studies was reported with varying frequency with some studies noting a 55 days after application interval, others with a 59- to 69-day interval, and others not reporting this information. For sunflower, semi-field studies (MRIDs 47699417, 47699422, 47699423, and 47699425) were all conducted in Germany with seed treated imidacloprid. All studies examined both hand and bee collected pollen and nectar data with some studies noting a 2-8 day interval and other studies not reporting this information. All hand collected and bee collected pollen and nectar data (sources of collection varied depending on study) were found to be below the LOD (1.5 ppb in all studies). Additionally, in a full field study conducted with seed treated sunflower (Schmidt 1998, MRID 49766206), bee collected nectar after a 14-day duration in the treatment fields was below the LOQ (10 ppb) Hand collected nectar residues were not available.

258
Summary of Crop Group/Use Patterns for which Seed Treatment Residue Data are Available Table 6-56 below summarizes the available residues studies for the soil-applied method as well as a providing a range of the refined Tier I RQs, the percentage of nectar residues above the Tier II NOAEC threshold in nectar (25 ppb) and where available, the duration those residues exceed the NOAEC.
Table 6-56. Summary of risk findings for the seed treatment use patterns of imidacloprid.
Crop Group
(Crop)
Application Scenario1
Worst Case
Scenario? (Y/N)
Refined Tier I RQ Ranges3 (%age of Refined Tier I RQs above LOC using all
residue data)4 Tier II5
Adult Acute Oral
Adult Chronic Oral
Larval Chronic
Oral
%age of nectar residues above NOAEC
Duration above NOAEC
Cereal Grains (Corn)
1.34 mg a.i/seed (0.12 lbs a.i/A)
Y <0.01 - 0.1 (0%)
<0.01 - 1.34 (3%)
0.02 - 0.04 (0%)
- No analysis conducted, corn does not produce nectar
Bolded value represent RQ in exceedance of acute or chronic LOC (0.4 and 1.0, respectively). 1Application rate, number of applications, timing 2Based on whether rate represents maximum annual rate for a given use pattern 3Based on highest reported residue concentration of all individual replicates (acute) or highest average concentration among all individual sampling events (chronic). 4Based on all pollen and/or nectar data from all sampling intervals 5Compared to colony feeding study NOAEC of 25 ppb.
Combined application methods Soil + Foliar Crop Group 8 – Fruiting Vegetable (Tomato) The usage and attractiveness of tomatoes and other members of the fruiting vegetables group were previously discussed in the soil application uses section of risk description. The tomato residue study was previously discussed also had a foliar component, in which 2 applications of 0.06 lbs a.i/A were made at bloom after the soil application of 0.38 lbs a.i/A (MRID 49665201 – further details provided in the soil application method section). This application rate is slightly lower than the maximum single application rate for foliar use on fruiting vegetables (0.08 lbs a.i/A), but when considered with the previous soil application of 0.38 lbs a.i/A, the total pesticide applied is equivalent to maximum annual rate of 0.5 lbs a.i/A. As indicated previously, the tomato plant does not produce nectar and therefore only the pollen data are used for the refined Tier I analysis examining the totality of all residue information from this study. The general pattern of average residues rising nearly tenfold at the sampling event following the first foliar application was observed at all sites

259
Refined Tier I oral risks and magnitude, duration, and frequency of LOC exceedance analysis As described in Section 6.1, the refined Tier I oral RQ values for honey bees resulting from the combined soil + foliar application to tomato, range from 0.02 – 3.7 (adult acute), <0.01 - 76 (adult chronic), 1.2 – 2.5 (larval chronic). These RQ values reflect “high-end” estimates of pollen residues obtained from a soil application at the maximum label rate (1 X 0.38 lbs a.i/A), followed by 2 foliar applications of 0.06 lbs a.i/A to achieve the maximum annual rate of 0.50 lbs a.i/A for tomato (MRID 49665201).
Figure 6-27. Summary of acute and chronic RQ values using totality of pollen residue data from the combined soil + foliar treatment tomato residue study (MRID 49665201). A total of 23 RQs were estimated from all available pollen residue data for each life stage and exposure duration. Figure 6-27 depicts two groups of residue values that were sampled from the same fields with the same trial where the first sampling was generally done from days 5-8 after the last application (10 samples) while the second sampling was done from days 17-20 (13 samples) after the last foliar application (across both trial years of the study). The RQs reflect a general decline in pollen residues up to an order of magnitude during each sampling interval. However at the first sampling interval, there were acute and chronic risk LOC exceedances for adult and larval bees. These RQs generally fell below the respective LOC by the time of the second sampling period. That is to say that for the first sampling

260
interval (5-8 days after the last foliar application), 10/10 (100%) of the acute oral RQs exceeded the acute risk LOC. By the time of the final sampling interval (17 – 20 days after the last application), only 1/13 (7.7%) RQ values exceeded the acute risk LOC. Similarly, for larval chronic oral RQs, 2/10 (20%) RQs exceeded the chronic risk LOC at the time of the first sampling interval and these were both below LOC by the time of the second interval. For adult chronic oral RQs, 100% of the RQs exceeded the chronic risk LOC of 1 (inclusive of all sampling intervals), indicating the residues in pollen were persistent enough to exceed chronic risk LOC up to 20 days after the last foliar application. As indicated by the discussion of the soil-applied component, the majority of adult acute oral RQ values are below the acute risk LOC and all of the larval chronic oral RQs were below the chronic risk LOC. However, the majority of adult chronic oral RQs exceeded the chronic risk LOC. Addition of the foliar spray component yields higher residue values compared to soil application alone which then results in a greater number of RQs exceedances across all bee life stages and durations of exposure. Tier II Risks As stated previously, sine no nectar data are available for tomato (tomato does not produce nectar), comparisons of residues to the NOAEC and LOAEC of the colony feeding study were not made. However, it is noted that residues exceed 100 ppb, which is associated with reduced overwintering survival following a 12-week exposure to spiked pollen (Dively 2015, Qualitative).
Figure. 6-28. Imidacloprid residues in pollen in the soil + foliar applied tomato study (MRID 49665202).

261
Additional Considerations The general pattern of average residues rising nearly tenfold at the sampling event following the first foliar application was observed at all sites. A sharp decline in concentration between the first and second foliar applications was also observed except for the San Luis Obispo site where there was only a slight decrease present by the time of final sampling event. Residue data following the first foliar application indicate that residues in pollen increased at all sites irrespective of soil type. The label permits multiple application methods to be applied to certain crops, including tomatoes, so long as the maximum annual application rate does not exceed 0.5 lbs a.i/A. Therefore, with an initial soil application of 0.38 lbs a.i/A followed by 2 foliar applications of 0.06 lbs a.i/A, this study represents a scenario that is permitted by the label and assesses the highest annual application on tomatoes. Conclusions Average residues in tomato pollen resulting from the combined soil + foliar application (post-transplant and at bloom, respectively) were above 100 ppb indicated by the open literature to cause colony level effects through the pollen route of exposure (Dively 2015, Qualitative). As indicated previously in the discussion of soil applications to tomatoes, the fruiting vegetables crop group is largely unattractive to honey bees. With the exception of okra, which is attractive to honey bees, the on-field colony level risk to honey bees resulting from soil + foliar applications to tomatoes is determined to be low. Crop Group 20 – Oilseed (Cotton) The usage and attractiveness of cotton to bees was previously discussed in the foliar application uses section of risk description. Refined Tier I oral risks and magnitude, duration, and frequency of LOC exceedance analysis As described in Section 6.1, the refined Tier I oral RQ values for honey bees resulting from soil + foliar applications on cotton, range from 21-208 (adult acute), 358 - 3562 (adult chronic), 64 - 139 (larval chronic). These RQ values reflect “high-end” estimates of pollen and extra-floral nectar residues obtained from a soil application at the maximum label rate (1 X 0.33 lbs a.i/A) for cotton at planting followed by 3 foliar applications of 0.06 lbs a.i/A (MRID 49665202). As noted previously, these RQs are 20- to 25-fold higher (depending on the life stage) as compared to their respective RQs from the soil-alone component of this study. Figure 6-29 shows RQs estimated using the totality of matched pollen and extra-floral nectar samples at the same sampling event.

262
Figure 6-29. Summary of acute and chronic RQ values using totality of pollen and extra-floral nectar data from the combined soil + foliar-applied cotton residue study (MRID 49665202). A total of 30 RQs were estimated using all available pollen and extra-floral nectar data for each honey bee life stage and duration. Two sampling events occurred after the last application at 4-5 days after last application and 13-14 days after last foliar application, with 15 data points associated with each interval. At the sampling event 4-5 days after the last foliar application, all (100%) of adult acute oral, adult chronic oral, and larval chronic oral RQs exceed their respective LOCs. By the time of 14 – 15 days after the last foliar application, all (100%) of adult acute oral and adult chronic oral RQs still exceed their respective LOCs while 13/15 (87%) of larval chronic oral RQs exceed the LOC of 1. During the time of the two sampling intervals, the residues in extra-floral nectar generally decreased by an order of magnitude, with residues in pollen generally decreasing as well, although not to the extent observed in extra-floral nectar. Tier II Risks To evaluate the risk of soil application of imidacloprid to cotton at the honey bee colony-level, reported daily average residues of total imidacloprid concentrations in extra-floral nectar were compared to the aforementioned NOAEC and LOAEC values from the available registrant-submitted colony feeding study (Figure 6-22). As there were only data available for one year, the daily average extra-floral nectar residue values were plotted by soil type. The 30 average residue samples were split between the 4-5 day after

263
last application and 14-days after last application sampling events. All (100%) of the average extra-floral nectar values exceeded the NOAEC (25 ppb) and LOAEC (50 ppb) of the colony feeding study. Approximately 10 days later, there were 8/15 (53%) that exceeded the NOAEC. It is not known the extent the average extra-floral nectar residue concentrations would decrease had a subsequent sampling event occurred. It is also reiterated the blooming duration of cotton is at least 6 weeks in duration, which matches the exposure duration of the colony feeding study. Additionally, extra-floral nectar sources are available even after the last petal fall, which lengthens the overall potential duration of exposure by foraging bees.
Figure 6-30. Imidacloprid residues in nectar from the soil + foliar cotton study (MRID 49665202) as compared to effect levels in registrant submitted colony feeding study (MRID 49510001). Figure 6-31 below shows the average residues in pollen from the soil + foliar applied cotton study. As with the average nectar data above, there is no clear trend in the magnitude of residues associated with a given soil type which is 5X the result of foliar applications. Figure 6-31 indicates that a subset of the daily average residues exceed 100 ppb which is associated with reduced overwintering success following a 12-week exposure via spiked pollen (Dively 2015, Qualitative)

264
Figure 6-31. Imidacloprid average residues in pollen from the soil + foliar cotton study (MRID 49665202). Additional Considerations The 9 sites employed for this study were in relatively close proximity to each other in California’s Central Valley and were shown to have similar climatic condition. This limits the ability to evaluate how regional differences in climate may affect residues in cotton pollen and nectar. Temporal trends in total imidacloprid residues measured in extra-floral nectar following 3 at-bloom foliar spray applications at 0.06 lbs a.i/A reflect a 1-2 orders of magnitude increase in concentrations relative to residues measured 75 – 95 days following soil application of 0.33 lbs a.i/A. This clearly demonstrates the strong impact of at bloom foliar spray applications on pollen and nectar residues, and suggests that application timing and method are major factors governing potential exposure of honey bees to imidacloprid. This study assessed a scenario with a single “at-plant” soil application of 0.33 lbs a.i/A followed by 3 foliar applications of 0.06 lbs a.i/A to yield a maximum annual rate of 0.51 lbs a.i/A, which is approximately the maximum rate specified on the label (0.50 lbs a.i/A)

265
Conclusions As documented with foliar and soil applications alone discussed previously, average residues in nectar and pollen resulting from the combined soil + foliar application to cotton study indicate a colony level risk to honey bees based on residues being well above the Tier II NOAEC in nectar (25 ppb) and furthermore above 100 ppb in pollen which is associated with reduced overwintering survival following a 12 week exposure (Dively 2015, Qualitative). It is further noted that a full field Tier III study is expected in 2016 to potentially further refine this risk determination. Seed Treatment + Foliar Crop Group 20 – Oilseed (Cotton) The usage and attractiveness of cotton was previously discussed in the foliar application uses section of risk description. This study assessed the residues in pollen, nectar, and extra-floral nectar of cotton following a 0.05 lbs a.i/A seed treatment application and 5 foliar applications of 0.06 lbs a.i/A at bloom (5 – 8 day intervals). Unlike the soil + foliar treatment described previously, the average floral nectar residues from this study were higher than those in extra-floral nectar; therefore, floral nectar data were used in further refinements to the Tier I analysis and Tier II analysis. Refined Tier I oral risks and magnitude, duration, and frequency of LOC exceedance analysis As described in Section 6.1, the refined Tier I oral RQ values for honey bees resulting from seed treatment + foliar applications on cotton, range from 0.3 – 3.0 (adult acute), 5.6 - 53 (adult chronic), and 1.0 – 2.1 (larval chronic). These RQ values reflect “high-end” estimates of pollen and floral nectar residues from the treatment regimen parameters described above (MRID 495117020). Figure 6-32 shows RQs estimated using the totality of matched pollen and nectar samples at the same sampling event. A total of 43 RQ values (inclusive of 2 years of sampling) were estimated from the available pollen and nectar residue data for each bee life stage and exposure duration. These residues spanned 14 – 50 days after the last foliar application. A total of 29 of 43 (67%), 5 of 43 (12%), and 43 of 43 (100%) of the RQ values exceeded the LOCs for adult acute oral, larval chronic oral and adult chronic oral which exceeded their respectively. Residues in pollen and nectar generally declined across the 4-5 sampling events per site. Despite this general trend, samples collected as far as 41 days (almost 6 weeks) after the last foliar application yielded Tier I RQ values that exceeded the adult acute oral and adult chronic oral LOCs. Samples collected 50 days after treatment produced RQ values that exceed the chronic adult oral LOC of 1.

266
Figure 6-32. Summary of acute and chronic RQ values using totality of pollen and floral nectar data from the combined seed treatment + foliar-applied cotton residue study (MRID 49511702).
Tier II Risks To evaluate the risk of seed treatment + foliar application of imidacloprid to cotton at the colony level for honey bees, reported daily average residues of total imidacloprid concentrations in nectar were compared to the aforementioned NOAEC and LOAEC values from the available registrant-submitted colony feeding study (Figure 6-32). As there were two years of sampling data, the daily average residues are depicted of each year in the figure below. There were 3 of 43 (7%) of the daily average extra-floral nectar residue values exceeded the NOAEC (25 ppb) of the colony feeding study. The remainder (93%) of residues were below the NOAEC. Exceedances were associated with the first two sampling periods (approximately 14 and 21 days after the last foliar application, respectively). Average floral nectar residues continued to decline after that point. The exceedances were also associated with data from 2013, and an examination of the data below from 2013 compared to 2012 suggest a carryover effect from year to year. This increase could also relate to differing climatic conditions in 2013 relative to 2012. As indicated previously and from the sampling duration for this study, cotton is associated with a bloom period of at least 6 weeks (matching the exposure duration of the colony feeding study) and while there is uncertainty with respect to the magnitude of residues beyond the last sampling date 50 days after the last application, the available data suggest a decline in
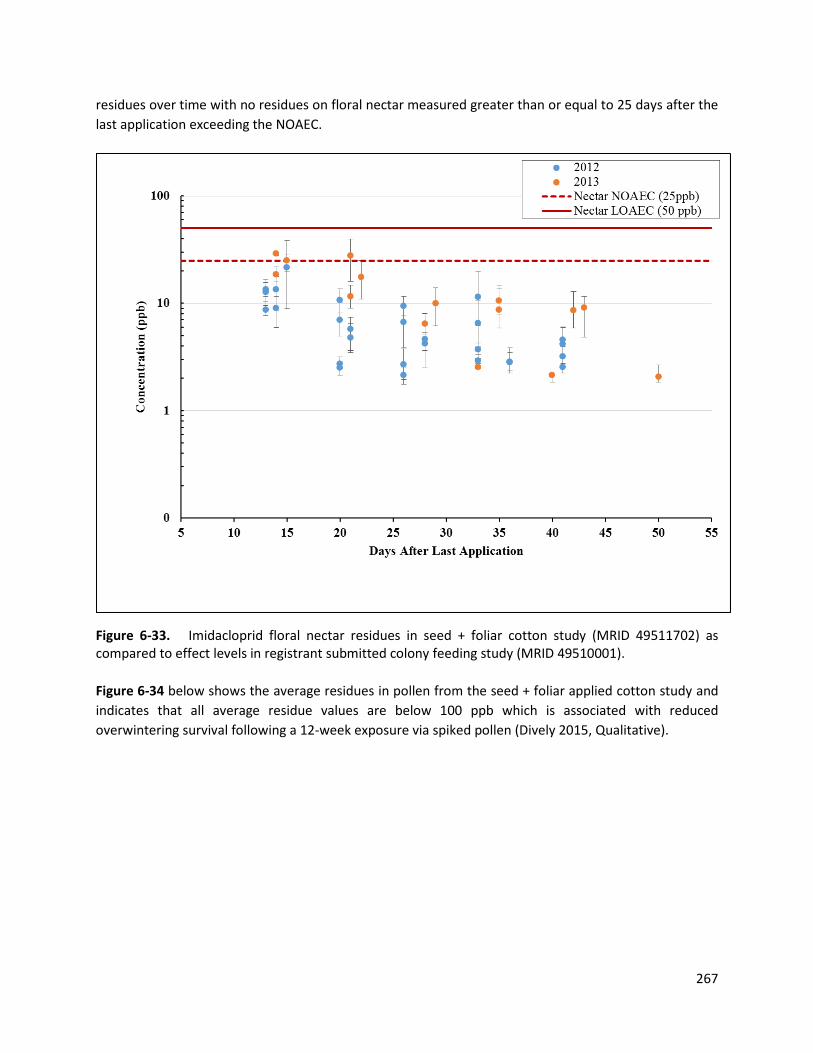
267
residues over time with no residues on floral nectar measured greater than or equal to 25 days after the last application exceeding the NOAEC.
Figure 6-33. Imidacloprid floral nectar residues in seed + foliar cotton study (MRID 49511702) as compared to effect levels in registrant submitted colony feeding study (MRID 49510001). Figure 6-34 below shows the average residues in pollen from the seed + foliar applied cotton study and indicates that all average residue values are below 100 ppb which is associated with reduced overwintering survival following a 12-week exposure via spiked pollen (Dively 2015, Qualitative).

268
Figure 6-34. Imidacloprid averages residues in pollen from the seed + foliar cotton study (MRID 49665202).
Additional Considerations Following seed + foliar spray applications, DT50 for residues of total IMI in cotton floral nectar vary from 19-68 days while those for extra-floral nectar vary from 27 – 52 days (except for one trial where residues remained stable over the 40-day sampling period). With floral and extra-floral nectar, 14/16 (88%) of the DT50 values of total IMI are between 19 and 51 days. With pollen, most of the trials contained insufficient data for reliable determination of DT50 values (<4 sampling points with detectable residues of total IMI). Three DT50 values for total IMI in pollen varied from 14 to 58 days.
The three trials were located in the midwestern U.S. within the same general vicinity. Examination of the monthly precipitation records suggests a similar magnitude and temporal pattern over time. Thus from a climate perspective, these trials are relatively similar. A range of soil types are represented (sandy loam, silt loam, sand). Based on yearly mean values of total IMI in floral and extra-floral nectar, year 2 means increase by 1.2X to 2.7X over year 1 means. With cotton pollen, yearly averages of total IMI increase by 1.5X to 2.9X from year 1 to year 2. The majority of increase in year 2 residues of total IMI occurred sooner after application

269
(13-20 days) across the trials. The two trials with the greatest percent sand in soils (NT013 and NT015) show the greatest relative increase in yearly average total IMI from year 1 to year 2 in nectar and pollen (1.7X to 2.9X) compared to NT014 which contained mostly silt (1.2-1.5X). It is uncertain whether this differential increase is related to differences in soil composition, but all three trials had similar amounts of IMI (24-42 ppb) in soil prior to the 2nd year planting. Residues of total IMI in soil measured prior to planting in year 2 (24-45 ppb) are elevated compared to those (0.3-12 ppb) measured prior to planting in year 1. This could explain some of the higher residues of total IMI in pollen and nectar observed in year 2. Unfortunately, soil samples at the end of the 1st growing season were not taken; therefore, it is not known whether post-application residues in soil increase from year to year or remain similar from year to year. Other factors (weather) may also contribute to these observed differences. Additionally, white clover was planted as a rotational crop to investigate the residues in pollen and nectar in the same cotton fields that were harvested the prior year (for more details on the methods, please refer to Appendix E). The concentrations of total IMI measured in white clover nectar and pollen planted following foliar application to seed-treated cotton harvested the previous year (trials NT014 and NT015) were near or below the level of detection (0.7 ppb) in the majority of samples analyzed (detection frequency = 38% for clover nectar and 53% for clover pollen). The maximum concentrations of total IMI measured in clover nectar in trials NT014 and NT015 are 1.6 and 2.7 ppb, respectively. The maximum concentrations of total IMI measured in clover pollen in trials NT014 and NT015 are 8 and 8.6 ppb, respectively. It is noted the difference in the magnitude of residues between the soil alone, soil + foliar study, and seed + foliar study. Specifically, the soil-applied floral nectar residues are roughly within a factor of 2 of the soil + foliar applied study while roughly 3 fold the level of the seed + foliar study. This is distinguished from the extra-floral nectar, which was roughly 1/3 the value of floral nectar residues in the soil-alone study yet over 15-fold higher than floral nectar residues in the soil + foliar study. Conclusions As with foliar alone, soil alone, and combined soil + foliar applications discussed above (no pollen data from the foliar application alone study), average residues in nectar and pollen resulting from the combined seed treatment + foliar application to cotton indicate a colony level risk to honey bees based on residues being above the Tier II NOAEC in nectar (25 ppb). There were no average residues in pollen above 100 ppb, which is associated with reduced overwintering survival following a 12-week exposure via spiked pollen. As indicated previously, a full field Tier III study is expected in 2016 to potentially further refine this determination.

270
Summary of Crop Group/Use Patterns for which Combined Method Residue Data are Available Table 6-57 below summarizes the available residues studies for the soil-applied method as well as a providing a range of the refined Tier I RQs, the percentage of nectar residues above the Tier II NOAEC threshold in nectar (25 ppb) and where available, the duration those residues exceed the NOAEC.
Table 6-57. Summary of risk findings for the combined method use patterns of imidacloprid.
Crop Group
(Crop)
Application Scenario1
Worst Case
Scenario?
(Y/N)
Refined Tier I RQ Ranges3 (percentage of Refined Tier I RQs above LOC using
all residue data)4 Tier II5
Adult Acute Oral
Adult Chronic Oral
Larval Chronic
Oral
Percentage of nectar residues
above NOAEC
Duration above NOAEC6
Fruiting Vegetables (Tomato)7
1 x 0.38 lbs a.i/A, at
plant + 3 x 0.06 lbs a.i/A, at bloom
Y 0.02 - 3.7
(100; 7.7%)
<0.01 - 76 (100%; 100%)
1.2 - 2.5 (20%; 0%)
- No analysis conducted, tomato does not produce
nectar - Crop group generally not attractive to honey bees
Oilseed (Cotton)8
1 x 0.33 lbs a.i/A, at
plant + 3 x 0.06 lbs a.i/A at bloom
Y 21 - 208 (100%, 100%)
358 - 3562 (100%, 100%)
64 - 139 (100%, 87%)
1st interval: 100%
2nd interval: 53%
10 days
Oilseed (Cotton)
0.05 lbs a.i/A at
planting + 5 x 0.06 lbs a.i/A at bloom
Y 0.3 - 3.0 (29%)
5.6 - 53 (100%)
1.0 - 2.1 (12%) 7% 10 days
Bolded value represent RQ in exceedance of acute or chronic LOC (0.4 and 1.0, respectively). 1Application rate, number of applications, timing 2Based on whether rate represents maximum annual rate for a given use pattern 3Based on highest reported residue concentration of all individual replicates (acute) or highest average concentration among all individual sampling events (chronic). 4Based on all pollen and/or nectar data from all sampling intervals, for tomato and cotton studies, 1st interval and 2 interval separated parenthetically by semicolon) 5Compared to colony feeding study NOAEC of 25 ppb. 6Refers to at least one average residue value. 7Two sampling events occurred after last foliar application, one at 5 – 8 days after last application, the other at 17 – 20 days after last application 8Two sampling events occurred after last foliar application, one at 4 – 5 days after last application, the other at 12 - 14 days after last application

271
6.2.2. Tier III analysis
As indicated in the White Paper (USEPA et al. 2012), full-field studies represent the highest level of refinement for pollinator studies since they are intended to reflect the potential effects of a pesticide on bee colonies under actual chemical use conditions. Tier III studies may be considered to address specific uncertainties, i.e., risk hypotheses, which have been identified through lower-tier studies and/or through the open literature under reasonable worst case exposure scenarios in the field. Tier III full field studies are generally specific for a given crop and application method. Importantly, interpretation of the results from Tier III studies requires careful evaluation of exposure to bees to the treated crop in the context of exposures that may be reasonably expected to occur across the landscape. There are currently no registrant-submitted Tier III full-field studies available for imidacloprid that are considered acceptable for use in risk assessment (i.e. quantitative or qualitative). As discussed in Section 5, there are currently two full-field studies that are being conducted by Bayer CropScience to characterize the colony-level effects of application of imidacloprid on cotton in California and pumpkin in South Dakota. The results of these studies will be incorporated in the preliminary risk assessment expected to by the end of 2016. Additionally, there are two full-field studies that were evaluated in the open literature that investigate the colony-level effects to honey bees exposed to seed-treated corn and sunflower. In Pohorecka 2013 (MRID 49769625, Qualitative), Gaucho® 600 FS; 83.3 mL/50,000 seeds and Courase® 350 FS; 150 mL/50,000 seeds in the 2011 and 2012 trials, respectively) were applied to corn as a seed treatment in a full-field design with a 21-day exposure period. The number of dead bees per colony was not significantly different from the control fields in both the 2011 and 2012 trials. Additionally, there was a significant increase (p<0.05) in percent frame coverage in two colony condition assessments ahead of the overwintering period. Despite these increases, the study authors noted that all colonies (control and treatment) overwintered successfully in 2011 but similar information was not provided for the 2012 trial. It is noted that the analysis of the bee-collected and trapped pollen from corn did not exceed 3%, indicating minimal exposure to imidacloprid seed-treated corn. Stadler 2003 (Qualitative) investigated the colony-level effects of honey bees foraging on seed-treated sunflower (0.24 mg a.i/seed) in full-field design imidacloprid for a 10-day exposure period. Similar to Pohorecka 2013, there were no effects on mortality but an increase in the brood area coverage. It is noted however, the magnitude of this effect is uncertain as means were not presented in the article and indications of statistical significance were unclear. It is noted that the available Tier III studies from the open literature represent two uses that are only approved for seed treatment. In the case of seed-treated corn, the refined Tier I analysis using all available data from the seed-treated corn residue study indicated all RQs estimated with exception of one adult chronic oral RQ were below their respective LOCs. A Tier II analysis was not conducted as the corn plant does not produce nectar to compare to the NOAEC and LOAEC of the colony-feeding study.

272
For sunflower, there are two registrant-submitted full-field studies that were previously indicated to be qualitative from an exposure standpoint but not suitable for risk assessment purposes with regards to effects due to major deficiencies in these studies. In Schmidt et al. (MRID 49766206), honey bee colonies were exposed for 14 days to seed-treated sunflower applied at 0.7 mg a.i/seed. The bee-collected nectar after the 14-day exposure period was determined to be below the LOQ, which was notably less sensitive at 10 ppb as compared to other studies. In the full-field component of Schmuck 2001, seed-treated sunflower sampled 62 – 66 days after exposure yielded pollen and nectar residues below LOD (1.5 ppb). It is noted that the seeds were also treated with carbendazim, metalaxyl and copper oxyquinolate. Finally, in a study evaluated in the open literature (Laurent and Rathahao, 2003; MRID 48077902; full details of methods provided in Appendix B), pollen residues from radiolabeled seed-treated sunflower (1 mg a.i/seed) averaged 13 ppb with maximum residues in pollen of 36 ppb. It was also noted from the analysis of radioactive residues that a maximum of 10% of the residues from the treated seed were taken up by the various plant parts.
6.2.3. Examination of the pollen route of exposure Pollen is the chief protein source of honey bees and is therefore an important component of the diet along with nectar that provides carbohydrates. Although the pollen route of exposure is considered as part of the Tier I risk assessment, it is not explicitly considered in the Tier II assessment since the only acceptable (quantitative) data involved feeding hives spiked sucrose22. In this section, information regarding the relative importance of the pollen route of exposure to honey bees is described in effort to evaluate the importance of not having quantitative data on colony-level effects resulting directly from the pollen route of exposure. It is noted here that honey bees do not directly consume raw pollen grains. Rather, nectar that is brought back to the hive is processed and mixed with raw pollen to create beebread, which serves as the hive’s protein source. (US EPA et al. 2014) Consideration of Honey Bee Pollen vs. Nectar Consumption As described in the 2014 Guidance for Assessing Pesticide Risks to Bee (USEPA et al. 2014) document, pollen consumption rates by honey bees depend on their age and their task. Across all ages and tasks, average pollen consumption is estimated to represent 10% or less of the total consumption, with the vast majority consisting of nectar (honey). After hatching, worker larvae consume royal jelly until approximately 4 days of age after which they start with a diet of processed nectar and pollen (bee bread) (US EPA et al.; 2014). At day 4 and 5, worker larvae are estimated to consume an average of 1.8 and 3.6 mg pollen/day, respectively, while consuming much greater amounts of nectar (60 and 120 mg/day, respectively). Thus, pollen consumption by larval bees approximates < 3% of their total daily food consumption. After emergence, the honey bee worker is engaged with in-hive activities including cell cleaning and capping of developing pupae for roughly its first week as an adult and is estimated to consume on average
22 Although colonies were fed spiked sucrose solution only, larval and adult honey bees consume bee bread which is a mixture of processed nectar and pollen.

273
6.7 mg/day of pollen and 60 mg/day of nectar. Pollen consumption increases when the worker transitions to brood and queen tending, (i.e. nurse bees), with an estimated average consumption rate of 9.6 mg/day of pollen. However, nectar consumption also increases to approximately 140 mg/day. When the worker is recruited for nectar or pollen foraging, the pollen consumption rate falls sharply and for the purposes of Tier I risk assessment, is estimated to be less than 0.1 mg/day as compared to 292 mg/day of nectar for nectar foragers. Indeed, even with nurse bees, who have the highest pollen consumption rate of any adult caste within the hive, the nectar consumption rate is at least 10-fold higher than the pollen consumption rate. Consideration of Differential Life Stage Sensitivity As summarized above, pollen larval and adult hive bees are the primary consumers of pollen (in the form of bee bread). Based on toxicity data described in Table 5-1, larval bees are much less sensitive to imidacloprid on a chronic exposure basis compared to adult bees (no acute oral toxicity data are available for larvae). Specifically, the chronic oral NOAEC for adult bees is 0.00016 µg a.i/bee while that for larvae is approximately 10X greater (0.0018 µg a.i./bee). In the larval toxicity study, no statistically significant effects were seen at the highest treatment level and therefore the NOAEC could actually be greater than 0.0018 µg a.i./bee. Given that larval bees consume a maximum of 3% of their total diet as pollen, these data suggest that at the organism level, larval bees are expected to be much less sensitive to a given concentration of imidacloprid in pollen compared to adult bees. Consideration of Higher Tier Studies Involving Pollen As indicated previously, a Tier II analysis was not conducted for use patterns for which nectar residue data were unavailable since the available colony feeding study assessed exposure via spiked sucrose. Although no higher-tier studies involving the pollen route of exposure were identified for quantitative use in this risk assessment, four higher-tier studies (2 registrant studies and 2 open literature studies) are available that are considered appropriate for qualitative use. Registrant-Submitted Studies. Prior to the initiation of the available colony feeding study, two pilot feeding studies were conducted by the registrant in Montana and North Carolina to support protocol development and inform the treatment regimens that would later be employed by the current colony feeding study. These studies are discussed earlier in Section 5.2.1 and are relevant here because they included both a sucrose and pollen route of exposure. Only interim reports are available for these studies and raw data were not available to confirm statistical results. In the North Carolina pilot study (Lawrence 2013; MRID 48962002 small honey bee colonies were fed separate treatments of spiked sucrose (50 and 200 ppb) and spiked pollen patties (50 and 200 ppb) along with an untreated control for 6 weeks. Based on interim report for the North Carolina Study, colonies fed 200 ppb imidacloprid in sucrose experienced significant reductions (p<0.05) food consumption, pollen stores, colony strength, and the total number of brood while only pollen and nectar stores were significantly reduced (p<0.05) at the 50 ppb sucrose group. Unfortunately, the results of the pollen route of exposure are considered invalid because control hives appeared to be unable to forage adequately for

274
nectar (the study was conducted during a nectar dearth). This likely resulted in reduced nectar storage, pollen storage and hive strength (adults and brood) over time in the controls and confounded the ability to detect treatment effects from pollen exposure. In the Montana study (Bromenshenk et al., 2012; MRID 48962001) technical imidacloprid was spiked at varying nominal concentrations in artificial pollen patties and sucrose at concentrations of 50 ppb pollen + 50 ppb sucrose (50/50), 50 ppb pollen + 200 ppb sucrose (50/200), 200 ppb pollen + 50 ppb sucrose (200/50) and 200 ppb pollen + 200 ppb sucrose (200/200) for 6 weeks. Results reported in the interim report (without statistical analysis) suggest a combination of 50/50 ppb spiked pollen and sugar (lowest combination) reduced the hive strength, pollen stores, pollen consumption, and hive weight relative to controls. This combination of 50/50 ppb spiked pollen and sugar appeared to result in a greater number of detectable effects compared to 50 ppb spiked sugar alone from the North Carolina pilot study, which only found significant reductions in pollen and nectar storage during exposure. At the same concentration, spiked sucrose appeared to result in greater effects compared to spiked pollen. Since these results originated from an interim report, lacked raw data and a formal statistical analysis, the findings do not enable a conclusive evaluation of the relative importance of imidacloprid exposure through pollen vs. nectar regarding honey bee colony health.
Open Literature Studies. Two additional studies that were evaluated in the open literature that assessed the pollen route of exposure of honey bees colonies to imidacloprid. In the study by Dively (2009; MRID 47775502) which was previously described in Section 5 and in Appendix D, honey bee colonies were exposed to imidacloprid at concentrations of 5 and 20 ppb spiked into pollen cakes provided in the hive, in addition to a control group. Multiple measures of colony health were assessed over the course of the nearly 12-week exposure period (15 May, 2008 – 06 August 2008). As discussed previously, the hives in this study became congested with increased queen failure that was not considered treatment related. Results from the 12 week exposure to spiked pollen up to and including 20 ppb did not result in any significant effect relative to the control group with one exception. At 5 ppb, the number of marked foragers visiting nectar stations that was reduced at the 5 ppb group, but increased at the 20 ppb group relative to control and thus was not deemed treatment related. In further work by Dively (2015), a similar study design was employed for that of the 2009 study (full methods and discussion provided in Appendix D) with the addition of a 100 ppb treatment group and addition of supers to avoid the crowding reported in the previous study. Replicate trials of the studies were conducted consecutively in 2009 and 2010 with the 2009 trial having 10 replicate colonies per group and the 2010 trial having 7 replicate colonies per group. Out of several colony health parameters assessed over the 12-week exposure period including mean colony size, mean amount of pollen collected, and percentage of total frame covered for bees, capped brood cells, capped honey, and beebread, only overwintering survival in the 100 ppb group (75%) was significantly reduced relative to the control (100%). In the 2010 trial, the study authors suggested that the mild winter in the test area may have led to bees consuming their stores too quickly which may explain the low overwintering survival of control colonies (57%). Overwintering survival was 50% in each of the 5, 20, and 100 ppb treatments which was not significantly different from controls. No other treatment-related effects were indicated compared to

275
controls. It is worthy to note that while the Dively (2015) study observed that overwintering survival was reduced from 100% in controls to 75% after 12 weeks exposure to 100 ppb in spiked pollen, this same concentration fed to colonies in sucrose caused catastrophic effects during the course of the 6 week colony feeding study such that colonies were removed from the trial due to their weakened condition to avoid possible cross contamination via hive robbing. Nearly all of these hives exposed to 100 ppb in sucrose were lost following overwintering. Summary Discussion and Implications for this Risk Assessment The aforementioned lines of evidence suggest the following:
• Across all honey bee life stages and tasks, consumption of pollen (in the form of bee bread) is far less than that of nectar, ranging up to 10% of the total diet.
• Larval bees, which rely on pollen as a protein source during their rapid development, are at least 10X less sensitive compared to adult bees on a chronic exposure basis.
• Combined 6-week exposure to imidacloprid spiked pollen and sucrose (50 ppb each) results in a greater number of adverse effects (based on mean responses) compared spiked sucrose alone (50 ppb) when considering interim results from two separate studies.
• One study indicates that a 12-week exposure to 100 ppb in pollen resulted in a significant (25%) reduction in overwintering survival, but a repeat of this study the following year by the same author was inconclusive regarding effects on overwintering survival at 20 and 100 ppb.
• At the colony level, exposure to 100 ppb imidacloprid in spiked sucrose results in more rapid and severe effects compared to the same concentration in spiked pollen.
Implications for this Risk Assessment The Tier I risk assessment considers both the pollen and nectar exposure routes to honey bees and assumes equal potency at the organism level for these two food sources. No information was identified that enabled this assumption to be evaluated at the organism level. At the colony level, the Tier II risk assessment is based on colonies feed imidacloprid-spiked sucrose only. While colonies were not fed spiked pollen, bees were nonetheless exposed to imidacloprid in pollen in the form of bee bread (i.e., a mixture of pollen and honey). As shown in Figure 6-35, mean concentrations of total imidacloprid in bee bread were approximately 20% of those measured in uncapped nectar (MRID 49510001. Therefore, from an in-hive exposure perspective, the effects observed from the Tier II sucrose colony feeding study actually reflect a combination of exposure to contaminated nectar and pollen in the form of bee bread. Had spiked pollen also been provided, the exposure of bees to imidacloprid would undoubtedly have been greater; however it is not clear as to extent to which colony-level effects would have increased relative to spiked sucrose alone. The aforementioned studies do not provide consistent evidence of the degree to which sucrose only exposures might have underestimated colony-level effects. Furthermore, since imidacloprid is known to affect honey bee pollen collection in this (and other) studies, providing a pollen source might have masked some of the effects resulting from reduced pollen collection.

276
Figure 6-35. Box and Whisker Plots of Total Imidacloprid Measured in Hive-Collected Uncapped Nectar (A) and Bee Bread (B) from the Sucrose Colony Feeding Study (MRID 49510001) The biggest impact for this assessment relating to the pollen route of exposure is the inability to assess risks at the colony level for crops where no nectar is produced. This is the case with tomatoes, where RQ values exceeded the LOC at the refined Tier I level for both soil and soil + foliar application methods, and for corn, where the refined Tier I analysis indicated only a marginal level of risk for adult chronic oral component (maximum RQ of 1.34). In the case of tomato, honey bees are not considered attracted to the pollen and nectar of members of the fruiting vegetable group, of which tomato is a member. It was previously noted, that this crop group is of importance to non-Apis bees, particularly bumble bees, where managed pollination services are used for tomatoes. In the case of corn, given the marginal exceedance of the adult chronic risk LOC, and the that only 3% of the refined Tier I RQs exceeded this threshold, while there were no adult acute oral or larval chronic oral LOC exceedances, the potential impact of the lack of Tier II analysis is determined to be low for the seed-treated corn use pattern. Finally, as distinguished

277
from corn and tomato, the lack of nectar data in the strawberry is considered a limitation as strawberries are noted to produce nectar that is attractive to honey bees. In this case, not only were the refined Tier I RQs likely underestimated by the absence of a nectar component, but a Tier II analysis could not be conducted. Therefore the lack of nectar data in this case presents a higher level of uncertainty as compared to the corn and tomato cases. The second biggest potential impact is for use patterns where the pollen residues are markedly higher than nectar residues. This was the case for the cherry study in which residues in pollen were noted to be 100-fold higher as compared to nectar residues. In this case, while risk was identified all life stages/ exposure durations in the refined Tier I analysis, there were no daily average residues in nectar above the Tier II NOAEC. To the extent that the Tier II sucrose colony-level study underestimates effects resulting from combined nectar/pollen route of exposure, there is potential to underestimate risk for imidacloprid in these cases.
6.2.4. Risk Characterization of Non-Apis Bees Consistent with the Agency’s 2014 risk assessment guidance for bees, the preliminary risk assessment of registered agricultural uses of imidacloprid focuses on the honey bee, A. mellifera. This Apis-centric focus reflects two important considerations: 1) honey bees are widely recognized as the most important managed pollinator in most regions of the world from both a commercial and ecological perspective;23 and 2) standardized test methods for evaluating exposure and effects of chemicals in a regulatory context are much more developed with the honey bee compared to non-Apis bees (USEPA et al. 2014; USEPA 201224), although recent progress has been made on test method development for bumble bees25. Nonetheless, within North America alone, there are an estimated 4,000 species of bees (Michener 2007) and this number rises to more than 20,000 worldwide (Fischer and Moriarty 2014). Several species of non-Apis bees are commercially managed for their pollination services, including bumble bees (Bombus spp.), leaf cutting bees (Megachile rotundata), alkali bees (Nomia melanderi), and blue orchard bees (Osmia lignaria), and the Japanese horn-faced bee (O. cornifrons). Importantly, a growing body of information indicates native bees (in addition to other insect pollinators such as flies, moths, butterflies, beetles, wasps, and ants) play an important role in crop and native plant pollination, besides their overall ecological importance via maintaining biological diversity. Although the current risk assessment process for bees does not include a formal process that is specific to non-Apis bees, available data related to the
23 According to Tautz, J. (2008), approximately 80% of the world’s flowing plants are pollinated by insects and 85% of these by honey bees. In all, the list of flowering plants pollinated by honey bees includes 170,000 species. 24 USEPA. 2012. White Paper in Support of the Proposed Risk Assessment Process for Bees. Submitted to the FIFRA Scientific Advisory Panel for Review and Comment September 11 – 14, 2012. Office of Chemical Safety and Pollution Prevention Office of Pesticide Programs Environmental Fate and Effects Division, Environmental Protection Agency, Washington DC; Environmental Assessment Directorate, Pest Management Regulatory Agency, Health Canada, Ottawa, CN; California Department of Pesticide Regulation http://www.regulations.gov/#!documentDetail;D=EPA-HQ-OPP-2012-0543-0004 25 Compilation of results of the ICPPR non-Apis working group with a special focus on the bumble bee acute oral and contact toxicity ring test 2014 ICPPR Non-Apis Working Group. Available at: http://pub.jki.bund.de/index.php/JKA/article/view/5352

278
potential exposure of non-Apis bees to imidacloprid and subsequent effects are summarized here in relation to the previously described risk assessment for the honey bee. Exposure Considerations Several aspects of the biology and ecology of non-Apis bees lead to important differences in the route and extent to which they may be exposed to pesticides compared to honey bees. These aspects have been reviewed previously (EFSA 2012, Fisher and Moriarty 2014) and are summarized here briefly. Specifically, many non-Apis bees are smaller in size and thus, would receive a higher dose on a contact exposure basis (i.e., greater surface area to volume ratio) via intercepting droplets of sprayed pesticide. Most non-Apis bees are solitary nesting species26 and therefore, loss of a single nesting adult would have a much greater consequence on reproduction (at least for that nest) compared to the loss of a single adult foraging honey bee. Furthermore, the foraging range of non-Apis bees tends to be much smaller than that of honey bees. As a consequence, non-Apis bees that occupy areas adjacent to treated fields may be exposed to pesticides at a higher proportion of their foraging area compared to honey bees, which can forage over long distances (~7 km) in which they are more likely to encounter untreated forage areas. For ground nesting bees, exposure via direct contact with soil may be a major route of exposure unlike that for the honey bee. Soil and leaf material are known to be used extensively by some non-Apis bees for nest construction, which may lead to different types of exposures (e.g., prolonged contact exposure with contaminated residues on treated foliage). To investigate the extent to which exposure estimates for honey bees may serve as a surrogate for non-Apis bees, comparisons were made in the daily consumptions rates of pollen and nectar available from the literature as compiled by EFSA (2012). Although there are a number of uncertainties associated with these consumption estimates, the data in Tables 6-58 and 6-59 suggest that proposed food consumption rate for adult honey bee workers (292 mg/bee/day) is similar to that for adult bumble bee (210-402 mg/bee/day) and is greater than that of adult female European mason bee and alfalfa leaf cutting bees (45-193 and 110-165 mg/bee/day, respectively). Food consumption rates estimated for 5-day old honey bee larvae (120 mg/bee/day) are greater than rates for larvae of the other non-Apis bees (7.8-83 mg/bee/day). These data suggest that the Tier I exposure assessment conducted for oral ingestion of imidacloprid by adult honey bees would be representative (and generally protective) for adults these particular non-Apis bees. However, it is noted that unlike honey bee larvae which are fed processed pollen and nectar in the form of bee bread, larvae of bumble bees and other non-Apis bees consume pollen and nectar directly which may lead to differential exposure relative to Apis larvae.
26 Colonies of the social non-Apis bees (e.g., bumble bees and stingless bees) tend to be smaller than honey bees.

279
Table 6-58. Comparison of oral exposure to pollen and nectar for adult Apis and Non-Apis bees1
Species Nectar consumption rate (mg/bee/day)*
Pollen consumption rate (mg/bee/day)
Total food consumption rate (mg/bee/day)
Honey bee worker (A. mellifera) 292 0.04 292
Bumble bee (Bombus spp.) 183-372 27-30 210-402
European mason bee (Osmia cornuta) 45-193 N/A 45-193
Alfalfa leaf-cutting bee (Megachile rotundata) 110-165 N/A 110-165
1From EFSA (2012); N/A = not applicable
Table 6-59. Comparison of oral exposure to pollen and nectar for larval Apis and Non-Apis bees1
Species Male/ female
Nectar consumption rate (mg/bee/day) *
Pollen consumption rate (mg/bee/day) *
Total food consumption rate (mg/bee/day)
Honey bee (A. mellifera) Female 117 2.7 120
Bumble bee (Bombus spp.) unknown 60 22-23 82-83
European mason bee (Osmia cornuta)
Female 1.8 16.3 18 Male 1.1 9.5 11
Alfalfa leaf-cutting bee (Megachile rotundata)
Female 6.2 3.1 9.3 Male 5.2 2.6 7.8
1 From EFSA (2012); * = from stored provisions As discussed previously, non-Apis bees are expected to be exposed to pesticides via soil and plant material used for nest construction. For the European mason bee, contact exposure to mud by adult females has been estimated at 200 – 400 mg/bee/day. Similarly, contact exposure of alfalfa leaf cutting bees has been estimated at 173 mg/bee/day. Due to the limitations in available data, the current risk assessment process for honey bee does not address exposure via soil and foliar contact exposure which are likely more important for some non-Apis bees. Another important aspect to consider regarding the potential exposure of non-Apis bees to imidacloprid is the extent to which they are attracted to agricultural crops to which it is registered for use. Based on a recent compilation of crop attractiveness ratings for Apis and non-Apis bees (USDA 2014), bumble bees are classified as being as (or more) attracted to the crops registered for imidacloprid use as honey bees. For certain crops (e.g., tomatoes, blueberries), bumble bees are commercially managed to provide pollination services (although tomato pollination primarily occurs in greenhouses).

280
Toxicity Considerations Tier I (Organism) Level In this section, Tier I (organism level) toxicity data for Apis and non-Apis bees are compared in order to evaluate the relative sensitivity of Apis and non-Apis bees to imidacloprid. Details of the studies from which these data were obtained are described earlier in Section 5.1. Based on these data, the overall range of acute contact toxicity is summarized below in Table 6-60 for Apis and non-Apis bees. While data for non-Apis bees are far less abundant compared to Apis bees and uncertainties have been noted previously related to the conduct of these studies, the acute contact toxicity of imidacloprid to non-Apis bees 0.02 – 0.66 µg a.i./bee) appears to be within the lower bound of that observed with Apis bees (0.013 – 0.24 µg a.i./bee), when considering all formulation types and data sources.
Table 6-60. Comparison of imidacloprid acute contact toxicity to Apis and non-Apis bees
Species Source Formulation LD50 Range (µg a.i./bee) n
Honey bee (A. mellifera) Registrant submitted TGAI 0.043 – 0.10 5
Honey bee1 (A. mellifera Open literature TGAI 0.013 – 0.23 11
Honey bee1 (A. mellifera
Registrant and open literature TEP 0.03 – 0.24 4
Bumble bee (Bombus terrestris) Open literature TEP 0.02 1
Japanese orchard bee (Osmia cornifrons) Open literature TEP 0.66 1
Stingless bee (Melipona quadrifasciata) Open literature TEP 0.023 1
1 includes subspecies carnica and caucasica. Value in bold indicates the LD50 used in to assess risks to the honey bee. Data sources are described in Section 5.1. Non-definitive (>) values are excluded from this table. The overall range in acute oral toxicity of imidacloprid to Apis and non-Apis bees is summarized below in Table 6-61. For non-Apis bees, only two definitive LD50 values were available for B. terrestris. While again the availability of data for non-Apis bees is extremely limited, these data also suggest that at an organism level, the acute oral toxicity of imidacloprid to B. terrestris is well within the ranges observed for A. mellifera. Therefore, at least for the few non-Apis bee species for which comparative toxicity data are available, the Tier I assessment conducted for the honey bee appears to be reasonably representative of these currently tested non-Apis species. Table 6-61. Comparison of imidacloprid acute oral toxicity to Apis and non-Apis bees
Species Source Formulation LD50 Range (µg a.i./bee) n
Honey bee (A. Mellifera) Registrant submitted TGAI 0.0039 – 0.15 3

281
Species Source Formulation LD50 Range (µg a.i./bee) n
Honey bee1 (A. Mellifera Open literature TGAI 0.0037 – 0.54 7
Honey bee1 (A. Mellifera
Registrant and open literature TEP 0.011 – 0.19 8
Bumble bee (Bombus terrestris)
Registrant and open literature TEP 0.02-0.17 2
1 includes subspecies carnica and caucasica. Value in bold indicates the LD50 used in to assess risks to the honey bee. Data sources are described in Section 5.1. Non-definitive (>) values are excluded from this table. Tier II (Colony Level) Data concerning the effects of imidacloprid on non-Apis social bees are available for only the bumble bee (B. terrestris or B. impatiens); however, these data are relatively plentiful (2 tunnel studies and 8 feeding studies; Table 5.2). For various reasons described in Section 5.2 including lack of raw data to verify statistical endpoints, these data are considered only for qualitative use in this risk assessment. When evaluating the effects of pesticides on bumble bees at the colony level, it is important to consider the differences in biology with respect to honey bees. Specifically, bumble bee colonies do not survive over wintering, rather only queens overwinter and are available for propagation in the following spring. Although the science behind pesticide risk assessment with bumble bees is still evolving,27 a clearly important consideration with respect to maintaining the stability of bumble bee populations is the production and propagation of queens; however, this is true for honey bee colonies as well even though the queen is not alone. With respect to the tunnel studies in which application of a formulated product to a surrogate crop is evaluated, only data from Gels (2000; MRID 47796308) are considered informative for risk characterization. In this study, Gels (ibid) reported statistically significant reductions (60%) in number of workers and brood chambers (72%) of tunneled B. impatiens colonies 28-days after spray applications of 0.3 lbs. a.i./A of Merit® 75 WP to turf containing flowering white clover. Interestingly, statistically-significant effects were not observed following application of granular Merit® 0.5 G (0.4 lbs. a.i./A) to turf nor when irrigation immediately followed the aforementioned spray application. However, the statistical power of this study appears low due to the small sample size such that reductions of up to 70% were not statistically significant for some endpoints. It is also noted that there is uncertainty in the suitability of maintaining bumble bee colonies in tunnels for 28-days. Give these uncertainties, this study suggests that spray applications of 0.3 lbs. a.i./A to turf containing bumble bee-attractive flowering plants may cause deleterious effects on bumble bee worker production. Much more data are available on the prolonged oral exposure of bumble bee colonies to imidacloprid and these data suggest a relatively congruent profile of imidacloprid effects at the colony level (Mommaerts 2010, MRID 48151502; Gill 2012, MRID 49719618; Laycock 2012, MRID 49719622; Laycock and Cresswell 2013, MRID 49719621; Bryden 2013, MRID 49719607; Gill and Raine 2014; Whitehorn 2012, MRID
27 http://pub.jki.bund.de/index.php/JKA/issue/view/1087

282
49719634; Feltham 2014, MRID 49719617). Details of these studies are summarized in Section 5.2 and Appendix D. Rather, the levels at which imidacloprid resulted in colony-level effects to bumble bees is summarized relative to the oral (sucrose) NOAEC of 25 ppb observed with the honey bee (MRID 49510001). Specifically, 6 of the 8 aforementioned studies tested sucrose concentrations fed to B. terrestris colonies that included (or spanned) 10 ppb in sucrose, as indicated in Figure 6-36,. Despite differences in the duration of exposure (14 days to 11 weeks), colony sizes and methods used to assess effects on the colonies, 4 of these studies documented major (and statistically significant) effects on B. terrestris colonies fed 10 ppb imidacloprid in sucrose, including (but not limited to) increased worker mortality, decreased numbers of worker bees produced, reductions in foraging efficiency, increased time required to collect pollen, and decreases in the quantity pollen collected. In some cases, worker bee production increased which was presumably as a compensatory response to reduced food provisions. Notably, 2 of these 6 studies (Laycock 2012; Laycock and Cresswell 2013) report 42% reduction in fecundity for microcolonies fed 1 ppb imidacloprid (TGAI) for 14 days and an EC50 of 1.4 ppb for brood production after the same duration of exposure. These levels approach the limit of detection of imidacloprid in nectar (0.7 ppb). Interestingly, when B. terrestris colonies were fed uncontaminated sucrose following the 14-day exposure, brood production recovered to the level of the control group. This suggests that the duration of exposure of B. terrestris colonies to imidacloprid is critical with respect to expression of colony-level effects and that recovery of colonies is possible given sufficient time off dose. Two other studies (Whitehorn 2012 and Feltham 2014) fed B. terrestris colonies a mixture of low levels of imidacloprid in sucrose and pollen for 14 days in the laboratory followed by 4-6 weeks off dose in the field. At 0.7 ppb (sucrose) and 6 ppb (pollen), Whitehorn (2012) report an 85% reduction in queen production and significantly reduced colony weight relative to controls. Feltham (2014) reported reductions of 28% and 31% in collected pollen and foraging efficiency, respectively, following 14 days at the same dose levels in sucrose and pollen. These findings are significant given the widespread occurrence of imidacloprid in nectar above these levels following application to crops, including seed treatment. As noted in the Section 5, however, these studies were not considered suitable for quantitative use in the risk assessment, and therefore additional data (i.e. Tier II and Tier III studies with Bombus) would benefit the risk characterization for non-Apis bees.

283
Figure 6-36. Comparison of effect levels from qualitative Tier II feeding studies on B. terrestris obtained from the open literature (numbers in parentheses refer to the magnitude of effects and/or additional exposure to pollen)
6.2.5. Additional Lines of Evidence Monitoring of residues in agricultural and hives As described in Section 4, there are several studies available in the open literature that investigated the residues of imidacloprid both in agricultural fields with known imidacloprid use, as well as the various hive matrices of colonies in areas across the United States and Europe. The agricultural field studies (Bonmatin 2005 and 2007), which sampled pollen residues from seed-treated corn and sunflower. They determined that while the frequency of quantifiable residues ranged from between 36 – 58% of the total samples analyzed, the mean concentrations of detectable residues ranged from 0.6 – 3.0 ppb, which was just above the LOQ of these studies. In the hive monitoring studies, surveys conducted across the United States and Europe measured residues in various hive matrices for the presence of imidacloprid. In some studies, known areas of diseased colonies were sampled in addition to healthy colonies while for other studies this information was not always present. These studies generally indicated (inclusive of all study areas) was generally detected in 10% or less of pollen, honey, wax or honey bee samples (highest concentration was reported in trapped pollen at 149 ppb). In studies where there was a higher frequency of imidacloprid detections (e.g. Chauzat et al. 2006 and 2009), the mean residues ranged from below the LOD – 5.7 ppb, a level 5-fold below the

284
Tier II colony feeding study. In other studies (Bee Research Institutes 2008, and Mullin et al. 2010) several hundred samples were tested in each study from various matrices with imidacloprid being detected a maximum of 2.9% across both studies. Stoner and Eitzer (2013) screened over 300 pollen samples and while imidacloprid was detected in 12% of the samples, the mean residues of 5.2 ppb were similar to those found in the work by Chauzat et al. In recent work by Lu (2015), monthly pollen and honey samples were collected across hives in Massachusetts and screened exclusively for neonicotinoid pesticides. While imidacloprid was detected in 57% of the pollen samples and 53% of the honey samples, the mean residues were 0.1 ppb (equivalent to the LOQ) and 0.58 ppb, respectively. An additional point to be made from these studies is that for all studies except Lu (2015) (which screened only for neonicotinoid pesticides), multiple pesticides were found in the same samples, with some samples containing up to 12 pesticides. In the majority of these cases, the Varroa mite treatment miticides fluvalinate, coumaphos, and amitraz were detected, in some cases in up to 98% of the assessed samples, depending on the matrix (Mullin et al., 2010). Additionally, fungicides, particularly those of the sterol biosynthesis inhibitor class that include the triazole fungicides were detected with high frequency. This discussion illustrates, that while imidacloprid has an estimated usage of over 1 million pounds of applied active ingredient on an annual basis in the U.S., monitoring surveys in agricultural fields and hive matrices generally do not detect the chemical with great frequency. In cases where the frequency of detections was 50% or more, the mean residues typically did not exceed 5 ppb (inclusive of all assessed matrices). While the suite of reported pollinator incidents originating from agricultural uses with analytical confirmation of residues is small (i.e. 6 incidents), a lack of reported incidents does not equate to the absence of honey bees and other pollinators losses due to the registered use patterns of imidacloprid.
6.2.6. Higher Tier and other General Uncertainties While the uncertainties associated with the screening-level exposure assessment were previously discussed, what follows are additional general uncertainties and those related to Tier II: Tier II Uncertainties Uncertainties at the Tier II level originate primarily from those identified for the registrant-submitted Tier II colony feeding study. These uncertainties and limitations are provided in Section 5.2. The primary uncertainty at the Tier II level relates to the interpretation of Tier 2 risks based on the 6-week, sucrose colony feeding study. It assumes that bees forage on the treated crop nearly 100% of the time to represent the nectar needs of the colony. In the field, bees may forage for significantly shorter periods of time particularly for crops such as cherries and blueberries that have a 2-3 weeks blooming duration. Bees may also forage on alternative (untreated) plants. Conversely, bees associated with migratory colonies used for pollination services may feed on treated crops for similar or possibly longer periods of time over the course of a growing season.

285
Additionally, and as was indicated previously, the 6-week duration of the exposure phase in the available colony feeding study may be an under or overestimation of the duration of exposure that is potential for bees in a given area. For example, citrus fruit trees and cotton are noted to have a bloom duration of at least 6 weeks, consistent with the colony feeding study exposure phase, while stone fruit trees have a shorter bloom duration of 2-3 weeks. Finally, as identified previously, there is uncertainty in the lack of a quantitative assessment of effects at the colony level resulting from the pollen route of exposure. This stems primarily from the fact that the available colony feeding study assessed spiked sucrose as well as an inconsistent picture of effects from the available colony-level studies assessing this route of exposure. However, as noted in Section 6.2.3., multiple lines of evidence suggest that honey bees are less exposed to pollen compared to sucrose and may be less sensitive to imidacloprid residues in pollen compared to nectar at the colony level. General Uncertainties Extrapolation of Effects to Higher Tiers There is uncertainty with respect to the Tier I suite of studies in the extrapolation of these effects at the colony level (i.e. Tier II and Tier III). This uncertainty is reduced with more thorough consideration of agronomic practices, pollinator biology, differences in bee life history, and differences in pest/pathogen/nutrition/management. Agronomic Practices One of the most important considerations within the agronomic practices is the use of managed pollinators for crop production. For some crops, growers will bring in managed bees to augment the pollination services of local bees if the crop requires pollination and wild bee populations are insufficient for adequate pollination. These commercially managed bees may include honey bees, bumble bees, blue orchard bees, alfalfa leafcutting bees, etc. When commercially managed bees are used to pollinate a crop, the potential for exposure and the magnitude of that exposure to the pollinating bees may be greatly increased. Depending on the physical-chemical property of a pesticide and use methods, agronomic practices, such as irrigation, may affect the translocation of systemic pesticides and have effects on the residues in bee food sources. The agronomic practices may also be related to the extent to which a particular registered use may be applied across the landscape of the use. Different use patterns may occupy varying spatial extents of coverage. Pollination Biology Uncertainties on the exposure of pesticides to pollinators in the field are also associated with plant/crop pollination biology. Risk assessment usually encompasses a wide variety of crops or plants that have niche pollination characteristics. These plants may include ornamental annuals or perennials, trees or bushes covered under forestry uses, or annual or perennial crops. The pollination biology of each of these plants is important to consider when developing a description of the potential risk to bees. In the problem

286
formulation stage of the assessment, information on the attractiveness of plants to pollinators covered by the proposed/existing uses should be considered to determine whether exposure may occur and the scope of a risk assessment. At the risk description phase of the assessment, information on the pollinator attractiveness of the plant as well as acreages treated and application methods will help the risk assessor to determine the spatial and temporal aspect of risk to the bee pollinators identified in the problem formulation as well as potential mitigation solutions. The pollination biology of plants relates to the intrinsic characteristics of the plant itself. These characteristics include the following considerations: Bee visitation to the flowers of the tree or crop: Not all plants produce flowers that are attractive sources of forage for honey bees, bumble bees, or solitary bees. Conversely, flowers of some plant species last only short period. The short blooming duration reduces the potential exposure of flower visitors. Bloom period of the crop: Different plant species will bloom at different times of the year. In addition, the length of the bloom period can differ between plants. Some plants bloom within a specific, relatively narrow window of time called a determinate bloom period. Other crops may produce blossoms continuously over the course of the growing season (e.g. cotton, cucurbits) or for an extended period of time, which is called indeterminate bloom. Indeterminate blooming crops provide a much longer window of potential exposure to pollinating bees. Bee diversity: In terms of the types of bees, honey bees and bumble bees are colonial while there are a variety of bees, both managed and wild, that are solitary and, depending on the plant, their foraging strategies may differ substantially; therefore, potential exposure may differ. Differences in Bee Life History As noted in the White Paper (USEPA et al. 2012) and as discussed in the FIFRA SAP’s response (SAP 2012), there is uncertainty regarding the extent to which any risk assessment process that relies on data on a specific species (e.g., A. mellifera) can be considered representative of an entire taxon or multiple taxa. This is especially true for honey bees, which are a highly social (eusocial) species, where the colony/hive is dependent on the collective tasks of multiple castes and function as a “superorganism”; whereas, the majority of other bee species, particularly those species native to North America, are solitary. Differences in Pests/Pathogens/Nutrition/Management Multiple factors can influence the strength and survival of bees whether they are solitary or social. These factors, including disease, pests (e.g., mites), nutrition, bee management practices, can confound the interpretation of studies intended to examine the relationship of the test chemical to a receptor (i.e., larval or adult bee). Therefore, most studies attempt to minimize the extent to which these other factors impact the study; however, higher-tier studies afford less control over these other factors, and their role may become increasingly prominent as the duration of the study is extended. Although studies attempt to minimize the confounding effects of other environmental factors, there is uncertainty regarding the extent to which the effects of a chemical may be substantially different had these other factors been in place.

287
7. Conclusions As previously discussed, the risk assessment approach to honey bees proceeds in a stepwise, tiered process. The agency conducted a screening level assessment (Tier I) for the various uses of imidacloprid utilizing toxicity endpoints and either conservative (modeled) exposures or, as a more refined assessment, actual residue values from pollen and/or nectar (where data were available) to determine if there are risks to individual bees. If these analysis indicated that the level of concern is not exceeded, the agency concluded that there is not a risk and that there is not a concern at the colony level. In these instances, no further analysis was necessary. However, if the analysis demonstrated a risk to individual bees, the agency did, when data were available, conduct a risk assessment to determine whether there were risks posed to the colony. As mentioned above and further described in Section 2 (Problem Formulation), the risk assessment approach to honey bees proceeds in a stepwise, tiered process evaluating risks to individual bees first and, if needed, risks to the colony. After the initial step in determining the potential for exposure of bees to agricultural uses of imidacloprid, risk quotients (or levels of concern) are estimated to evaluate the risk to individual bees using modeled/screening-level exposure estimates and the acute and chronic laboratory toxicity endpoints (i.e. adult acute contact LD50, adult acute oral LD50, adult chronic oral NOAEL, and larval chronic oral LOAEL). For all crops and application methods where on-field exposure, is expected, values exceeded risk levels of concern. Even in cases where on-field exposure was not expected, an off-field spray drift assessment was conducted and indicated that there could be risk for all foliar uses (depending on what crop is adjacent to the field, whether the crop is in bloom, whether the crop is pollinator attractive, etc). Additionally, a refined analysis was conducted using available measured residue data to supplant the modeled/screening-level estimates of exposure that were mentioned above. These refined values were compared to the hazard endpoints tabulated above. For all use patterns where residue data were available, LOCs were exceeded based on refined estimates of exposure. Table 7-1 summarizes the agency’s preliminary risk findings on a crop group-based approach. The table presents the findings for groups of crops that have similar use patterns and application methods and are further split out into three categories of risk findings. When residue data are available, the crop is identified parenthetically within the table along with the respective crop group. Crop groups/use patterns where either on-field exposure is not anticipated due to attractiveness or the crop is harvested before bloom, or the tiered process indicates a low potential for on-field risk, are listed in the green group in Table 7-1. These include all application methods of root/tuberous, bulb, leafy greens, and brassica vegetables, globe artichoke, and tobacco (harvested before bloom) as well as soil applications to blueberries (berries and small fruits) and seed treatment applications to corn (cereal grains). Additional members of the cereal grain group (which is registered for seed treatment uses only) including wheat, barley, oats, rye, and millet are either not attractive to honey bees or primarily wind pollinated. Finally, members of the fruiting vegetable group (of which soil and soil + foliar residues data for tomato are available) are largely unattractive to honey bees with the exception of okra. Therefore, a low potential for on-field risk is determined for all members of this group, except okra, for all application methods based on a lack of exposure.

288
The yellow/gold group represents crop groups/use patterns for which the assessment for individual bees indicates that the LOCs have been exceeded; however, uncertainty exists in the assessment of risk to the colony. These include uses where either no data are available (with indications of the potential to bridge to other neonicotinoid chemicals where data are expected for that same use pattern and application method) or where there is uncertainty in the nectar and pollen residue data originating from uncertainties in the available studies. For several crop groups including legumes, tree nuts, and certain application methods of stone fruits, berries/small fruits, and oilseed, residue data are unavailable but there is the potential to bridge from data for other neonicotinoid chemicals with forthcoming data for certain application methods. In other cases, data are not available and there are no data expected for the other neonicotinoid chemicals such as certain application methods for legumes, tree nuts, berries/small fruits, nectar producing cereal grain members, and herbs and spices. In the case of cucurbit vegetables (soil applications to melons data available), citrus fruits (soil applications to oranges and grapefruits data available), and berries/small fruits (soil applications to strawberries data available), there are limitations with the residue studies that create uncertainty in the risk determinations with these use patterns/application methods. This uncertainty is generally associated with these studies having an unknown timing of application relative to bloom (strawberry), no nectar data available (strawberry), no pollen data available (citrus fruits), and no available residue data from coarse soils, which are shown through several studies to yield residues in nectar and pollen up to an order of magnitude higher as compared to medium and fine soil types. Furthermore, the soil-applied citrus study was conducted with a post-bloom application while the label does not restrict pre-bloom or during bloom applications and therefore the residues from this study are likely underestimated. For soil applications to cucurbits and citrus fruits, there is a potential to bridge with forthcoming data for other neonicotinoid chemicals. In the case of cucurbit vegetables, a full field study (Tier III) on pumpkins is expected in 2016 to further refine the risk picture. Additionally, although foliar applications to stone fruits resulted in pollen residues exceeding a threshold that is indicated in the open literature to cause colony level effects, the bloom duration of stone fruits is markedly shorter than the exposure duration employed in from those studies that determined these effects and therefore there is uncertainty with this determination. Finally, while data are unavailable for pome fruits, residue data for imidacloprid are expected in 2016. Lastly, the red grouping within the table indicates use patterns with associated application methods that present a risk to individual bees as well as a risk in nectar or both nectar or pollen. These include foliar applications (with a 10-day pre-bloom interval) to citrus fruits and foliar, soil, soil + foliar, and seed treatment + foliar applications. (with no bloom restrictions) to cotton. A full field study with cotton is expected in 2016 to further refine this risk determination.

289
Table 7-1. Summary of risk findings for honey bees (Apis mellifera) for the registered use patterns of imidacloprid
Crop Group (Available
Residue Data)
Appl. Method
Individual Bee (Tier I) Risk? Colony (Tier II) Risk? Risk Conclusions
(Basis and Other Considerations ) On Field
(Screening Level)
Off Field (Screening
Level)
On Field (Refined) Nectar Pollen3
Crop Groups/Use Patterns that Present Low On-Field Risk
Root/Tuber Vegetables4
Foliar N Y
No further analysis conducted
Low On-Field Risk (all uses, lack of exposure)1; Off-Field Risk (Tier I, foliar uses only) Soil N
Seed N Bulb Vegetables
Soil N Low On-Field Risk (all uses, lack of exposure)1; Off-Field Risk (Tier I, foliar uses only) Seed N
Leafy Greens Vegetables
Foliar N Y Low On-Field Risk (all uses, lack of exposure)1; Off-Field Risk (Tier I, foliar uses only) Soil N
Brassica Vegetables
Foliar N Y Low On-Field Risk (all uses, lack of exposure)1; Off-Field Risk (Tier I, foliar uses only) Soil N
Seed N
Fruiting Vegetables (Tomatoes)
Foliar Y Y
Y No data2 N
Low On-Field Risk (Tier II, pollen; nectar not produced, lack of exposure) Off-Field Risk (Tier I, foliar uses only) (Determinations apply to all members except okra due to unattractiveness of group to honey bees, Bombus used for pollination services in greenhouse)
Soil Y
Berries/Small Fruits (Blueberry)
Soil Y Y N N Low On and Off-Field Risk (Tier II, nectar and pollen)
Cereal Grains (Corn) Seed Y Y No data2 N
Low On and Off-Field Risk (pollen; nectar not produced) (Other members such as wheat, barley, oats, millet and rye are either not attractive to bees)
Tobacco, globe artichoke
Foliar N Y No further analysis conducted Low On-Field Risk (all uses, lack of exposure)1;
Off-Field Risk (Tier I, foliar uses only) Soil N
Crop Groups/Use Patterns with Uncertainty in Colony (Tier II) Assessment
Legumes
Foliar Y Y No data No data No data On Field Risk (Tier I, all uses); Tier II Risk unknown Off Field Risk (Tier I, foliar uses only) (Honey bee attractive; no bloom restrictions; seed treatment of soybean = highest usage of all registered crops (400,000 lbs a.i/year).
Soil Y
No data No data No data
Seed Y No data No data No data

290
Crop Group (Available
Residue Data)
Appl. Method
Individual Bee (Tier I) Risk? Colony (Tier II) Risk? Risk Conclusions
(Basis and Other Considerations ) On Field
(Screening Level)
Off Field (Screening
Level)
On Field (Refined) Nectar Pollen3
(Potential bridging)
(Potential bridging)
(Potential bridging)
Cucurbit Vegetables (Melons)
Soil Y
Y Uncertain (Potential bridging)
Uncertain (Potential bridging)
On-Field Risk (Tier I); Tier II Risk uncertain (Long [6 weeks +] bloom duration; uncertainty of lower than maximum annual rate used and one sampling interval, no residues in coarse soils, unknown as to whether application closer to bloom would yield higher residues; Tier III full field study [pumpkins] expected for 2016 assessment)
Citrus Fruits (Oranges/ grapefruits)
Soil Y Y Uncertain (Potential bridging)
No data (Potential bridging)
On-Field Risk (Tier I); Tier II Risk uncertain (6 week + bloom duration; uncertainty of no residues in coarse soils and residues do not reflect worst case scenario as current labels permit pre and during bloom applications where these applications were made post-bloom)
Pome Fruits Foliar Y Y Y No data No data On-Field Risk (Tier I); Off-Field Risk (Tier I, foliar uses
only) (Residue data expected in 2016) Soil Y Y No data No data
Stone Fruits (Cherries) Foliar Y Y Y N Possible
Low On-Field Risk (Tier II, Nectar;), Tier II Risk possible (Pollen); Off-Field Risk (Tier I) (Stone fruits associated with short bloom duration [2-3 weeks] relative to exposure duration in open literature pollen feeding study [12 weeks] which likely mitigates the potential for colony level from pollen route of exposure)
Stone Fruits Soil Y Y No data
(potential bridging)
No data (potential bridging)
On-Field Risk (Tier I); Tier II Risk unknown
Berries/small fruits Foliar Y Y Y
No data (potential bridging)
No data (potential bridging)
On-Field Risk (Tier I); Tier II Risk unknown Off-Field Risk (Tier I)
Berries and small fruits Soil Y Y No data Possible On-Field Risk (Tier I); Tier II Risk possible (pollen)

291
Crop Group (Available
Residue Data)
Appl. Method
Individual Bee (Tier I) Risk? Colony (Tier II) Risk? Risk Conclusions
(Basis and Other Considerations ) On Field
(Screening Level)
Off Field (Screening
Level)
On Field (Refined) Nectar Pollen3
(Strawberries) (Long [6 weeks +] bloom duration; uncertainty of one sampling interval, no residues in coarse soils, unknown timing of application relative to bloom
Tree nuts Foliar Y Y Y
No data (potential bridging)
No data (potential bridging)
On-Field Risk (Tier I, all uses); Tier II Risk unknown (Variable bee attractiveness within group); Off-Field Risk (Tier I, foliar uses only)
Soil Y
Y No data No data
Cereal grains Seed Y Y No data No data On-Field Risk (Tier I); Tier II Risk unknown (Nectar producers within the group (i.e. sorghum, buckwheat).
Herbs/Spices Foliar Y Y Y No data No data On-Field Risk (Tier I); Tier II Risk unknown
Off-field Risk (Tier I, foliar uses only) (Variable attractiveness within group)
Soil Y
Y No data No data Seed Y Y No data No data
Oilseed5 Seed Y Y No data
(potential bridging)
No data (potential bridging)
On-field Risk (Tier I), Tier II Risk unknown
Crop Groups/Use Patterns with Colony (Tier II) Risk Indicated
Citrus Fruits (Oranges) Foliar Y Y Y Y Possible
On-field Risk (Tier I), Tier II Risk (nectar), Tier II Risk possible (pollen) Off-field Risk (Tier I) (10-d pre-bloom restriction for foliar uses; 6 week + bloom duration; used for honey production)
Oilseed5
(Cotton)
Foliar Y Y Y Y Possible On-field Risk (Tier I), Tier II Risk (nectar), Tier II Risk possible (pollen), Off-field Risk (Tier I, foliar uses only) (Tier III full field study [cotton] expected for 2016 assessment.
Soil Y Y Y Possible
Hash marks represent no off-field exposure expected for soil and seed treatment uses. 1 Crop is harvested before bloom (except for small acreage for seed production; nectar and pollen residue data were not required as minimal on-field exposure is expected. 2Nectar is not produced by representative crop where residue data are available 3Possible Tier II Risk for pollen indicated when residues in pollen from a residue study exceed 100 ppb, which is indicated in the literature to be a level where colony overwintering survival is potentially impacted. 4Two members of this group, potatoes and sweet potato, are noted to be harvested after bloom, although potatoes are not honey bee attractive and in the case of sweet potato, require pollination only for breeding, which is a small percentage of the total acreage.

292
5Cotton is registered for all application methods. All other members of the oilseed group including canola and sunflower are registered only for seed treatment use

8. References
1999a, Bumblebee (Bombus terrestris L.) Contact Toxicity Study in the Laboratory with Imidacloprid Technical., DACO: 9.2.4.1. MRID 49761208 1999b, Bumblebee (Bombus terrestris L.) Oral Toxicity Study in the Laboratory with Imidacloprid Technical., DACO: 9.2.4.2 1999c, Honey Bee (Apis mellifera L.) Contact Toxicity Study in the Laboratory with Imidacloprid Technical., DACO: 9.2.4.1. MRID 49766209 1999d, Laboratory Testing for Toxicity (Acute Oral LD50) of WAK3745 on Honey Bees (Apis mellifera L.) (Hymenoptera, Apidae) - Limit Test -. DACO: 9.2.4.2. MRID 49766202 1999e, Laboratory Testing for Toxicity (Acute Oral LD50) of WAK4103 on Honey Bees (Apis mellifera L.) (Hymenoptera, Apidae) - Limit Test, DACO: 9.2.4.2. MRID 49766203 1999f, Laboratory Testing for Toxicity (Acute Oral LD50) of WAK33893 on Honey Bees (Apis mellifera L.) (Hymenoptera, Apidae) - Limit Test. DACO: 9.2.4.2. MRID 49766204. 1999g, Honeybee (Apis mellifera L.) Oral Toxicity Study in the Laboratory with Imidacloprid Technical., DACO: 9.2.4.2. MRID 49766205. Abbott, V.A., J.L. Nadeau, H.A. Higo, and M.L. Winston. 2008. Lethal and sublethal effects of imidacloprid on Osmia lignaria and clothianidin on Megachile rotundata (Hymenoptera: Megachilidae). MRID 47812301. Alaux, C., J.L. Brunet, C. Dussaubat, F. Mondet, S. Tchamitchan, M. Cousin, J. Brillard, A. Baldy, L.P. Belzunces, Y. Le Conte. 2010. Interactions between Nosema microspores and a neonicotinoid weaken honeybees (Apis mellifera). Environmental Microbiology 12(3): 774-782. MRID 48077922. Anderson, C. (1991) Photo-degradation of NTN 33893 in Water: Lab Project Number: 88010: 101956. Unpublished study prepared by Nitokuno, ESR, Yuki Institute. 128 p. MRID 422563-76. Anderson, C.; Fritz, R.; Brauner, A. (1992) Metabolism of [Pyridinyl-(carbon 14)-Methylene] NTN 33893 in Loamy Sand Soil BBA 2.2 under Aerobic Conditions: Lab Project Number: M 1250187-4. Unpublished study prepared by Miles Incorporated. 83 p. MRID 452393-01 Anderson, C.; Fritz, R.; (1992) Degradation of [Pyridinyl-(carbon 14)-Methylene] NTN 33893 in Sandy Loam MONHEIM 1 under Aerobic Conditions: Lab Project Number: M 1250187-4. Unpublished study prepared by Miles Incorporated. MRID 452393-01

Anderson, C.; Fritz, R.; Brauner, A. (1991) Metabolism of Pyridinyl-C 14-Methylene| NTN 33893 in Sandy Loam under Anaerobic Conditions: Lab Project Number: 101241; M1250187-4. Unpublished study prepared by Bayer Ag--Leverkusen. 82 p. MRID 420735-01 Beedle, E.C., and A.M. Harbin (2011). Determination of the Residues of imidacloprid and its Metabolites 5-Hydroxy imidacloprid and imidacloprid Olefin in Bee Relevant Matrices Collected from Cotton, Grown at Locations Treated with lmidacloprid at Least Once per Year during Two Successive Years. Project Number: EBNTL056-01. Bayer CropScience, Stilwell, KS. 147p. MRID 49103301. Beedle, E.C. (2012). Determination of the Residues of lmidacloprid and its Metabolites 5-Hydroxy lmidacloprid and lmidacloprid Olefin in Bee Relevant Matrices Collected from Melons Grown at Location Treated with lmidacloprid at Least Once Per Year During Two Successive Years. Bayer CropScience, Research Triangle Park, NC. Bayer Report No. EBNTL056-02. 244p. MRID 49090501. Biddinger D.J., J.L. Robertson, C. Mullin, J. Frazier, S.A. Ashcraft SA, E.G. Rajotte, N.K. Joshi and M. Vaughn. 2013. Comparative Toxicities and Synergism of Apple Orchard Pesticides to Apis mellifera (L.) and Osmia cornifrons (Radoszkowski). PLoS ONE 8(9): e72587. MRID 49719605. Bonmatin JM, P.A. Marchand, R. Charvet, I. Moineau, E.R. Bengsch ER, and M.E. Colin. 2005. Quantification of imidacloprid uptake in maize crops. Journal of Agricultural Food Chemistry. 53: 5336-5341. MRID 47523411. Bonmatin, J.M., Marchand, P.A., Cotte, J.F., Aajoud, A., Casabianca, H., Courtiade, M. 2007. Bees and systemic insecticides (imidacloprid, fipronil) in pollen: subnano-quantification by HPLC/MS/MS and GC/MS. Environmental Fate and Ecological Effects of Pesticides, 837-845. MRID 49719606. Bonmatin J. M. et al, 2015. Environmental fate and exposure; neonicotinoids and fipronil. Environ Sci. Pollut. Res. 22:35-67. Bortolotti, L., Montanari, R., Marcelino, J., Medryzycki, P., Maini, S., and C. Porrini. 2003. Effects of sub-lethal imidacloprid doses on the homing rate and foraging activity of honeybees. Bulletin of Insectology 56 (1): 63-67. MRID 47800505. Bryden, J., R. J. Gill, R. A. A. Mitton, N. E. Raine and V. A. A. Jansen. 2013. Chronic sublethal stress causes bee colony failure. Ecology Letters. MRID 49719607. Byrne, F.J, Morse, G. J., Visscher, P. K., Grafton-Cardwell, E. E., and Leimkuehler, W. (2011). Determination of exposure levels of honey bees foraging on flowers of citrus trees previously treated with imidacloprid. Project Number: EBNTL056-7. University of California at Riverside. Riverside CA. 70p. MRID 49090504.
Byrne, F.J, Morse, G. J., Visscher, P. K., Grafton-Cardwell, E. E., Leimkuehler, W., and Fischer, D. (2012). Determination of exposure levels of honey bees foraging on spring 2011 flowers of citrus trees previously treated with imidacloprid. Project Number EBNTL056-7a. University of California at Riverside. Riverside CA. 17p. MRID 4909050.

Chauzat, M.P., Faucon, J.P., Martel, A.C., Lachaize, J., Cougoule, N., Aubert, M. 2006. A Survey of Pesticide Residues in Pollen Loads Collected by Honey Bees in France. Journal of Economuc Entomology. 99 (2): 253-262. Chauzat, Marie-Pierre et al. 2009. Influence of Pesticide Residues on Honey Bee (Hymenoptera : Apidae) Colony Health in France. Environmental Entomology, 38(3), 514-523. Cole, J.H. 1990. The Acute Oral a:nd Contact Toxicity to Honey Bees of Compound NTN 33893 Technical. Report No. 101321. Conducted by Huntingdon Research Centre Ltd., Cambridgeshire, UK. Submitted by Mobay Corporation, Kansas City, MO. EPA MRID No. 422730-03. Cresswell et al 2012. Differential sensitivity of honey bees and bumble bees to a dietary insecticide (imidacloprid). Zoology 115: 365– 371. MRID 49719610. Cresswell, J.E., Robert, F. X., Florance, H., Smirnoff, N. 2013. Clearance of ingested neonicotinoid pesticide (imidacloprid) in honey bees (Apis mellifera) and bumblebees (Bombus terrestris). Pest Management Science. doi: 10. 1002/ps.3569. MRID 49719611. Dechaume-Moncharmont, Francois-Xavier, Axel Decourtye “Statistical Analysis of Honeybee survival after chronic exposure to insecticide” Environmental Toxicology and Chemistry,(2002): Vol.22 3088-3094. MRID 47800501. Dively, G.P., M. Embrey, and J. Pettis. 2009. Assessment of sublethal effects of imidacloprid on honey bee and colony health. Department of Entomology, University of Maryland. North American Pollinator Protection Campaign. MRID 47775502. Dively, G.P., Embrey, M.S., Kamel, A., Hawthorne, D.J. and J.S. Pettis. 2015. Assessment of chronic sublethal effects of imidacloprid on honey bee colony health. PLoS ONE 10(3): e011874. Donnarumma, Lucia, Patrizio Pulcini , Daniele Pochi , Silvia Rosati , Lorenzo Lusco & Elisa Conte. 2011. Preliminary study on persistence in soil and residues in maize of imidacloprid, Journal of Environmental Science and Health, Part B: Pesticides, Food Contaminants, and Agricultural Wastes, 46:6, 469-472. MRID 49719614. Drager, G.; Bornatsch, W.; Brauner, A. (1992) Study on the Metabolism of NTN 33893 after Spray Application to Potatoes: Lab Project Number: M 173 0 162-0: 103211. Unpublished study prepared by Bayer AG. 77 p. MRID 425561-07 Drager, G.; Brauner, A.; Bornatsch, W. (1989) Investigation on the Metabolism of NTN 33893 after Application to tomatoes: Lab Project Number: M 173 0 237-3: M 173 0 238-4. Unpublished study prepared by Bayer AG. 104 p. MRID 425561-09

Dyer, D.; Helfrich, K.; Billesbach, K. (2002) Imidacloprid--Small-Scale Prospective Ground-Water Monitoring Study, Montcalm County, Michigan, 1996: Lab Project Number: N3212401: 5635.00: CMXX-95-0229. Unpublished study prepared by Bayer Corporation, LFR Levine-Fricke, and Braun Intertec Corporation. 504 p. MRID 458582-01. EFSA. 2012. Scientific Opinion on the science behind the development of a risk assessment of Plant Protection Products on bees (Apis mellifera, Bombus spp. and solitary bees). EFSA Journal 2012; 10(5) 2668. [275 pp.] doi:10.2903/j.efsa.2012.2668. Available online: www.efsa.europa.eu/efsajournal Eiri, D.M. and J.C. Nieh. 2012. A nicotinic acetylcholine receptor agonist affects honey bee sucrose responsiveness and decreases waggle dancing. The Journal of Experimental Biology. 215(12): 2022-2029. MRID 49719615. Faucon, J.P., C. Aurières, P. Drajnudel, L. Mathieu, M. Ribière, A.C. Martel, S. Zeggane, M.P. Chauzat, and M. F.A. Aubert. 2005. Experimental study on the toxicity of imidacloprid given in syrup to honey bee (Apis mellifera) colonies. Pest Manag Sci 61: 111-125. MRID 47523406. Feltham, H., K. Park and D. Goulson. 2014. Field realistic doses of pesticide imidacloprid reduce bumblebee pollen foraging efficiency. Ecotoxicology (2014) 23:317–323. MRID 49719617. Fischer, D. and Moriarty, T. 2014. Pesticide Risk Assessment for Pollinators. Wiley-Blackwell. Somerset, NJ. 248 pp. ISBN: 978-1-118-85252-1 Fischer, D.R., and Jerkins, E. (2015) Determination of the Residues of Imidacloprid, 5-Hydroxy Imidacloprid, and Imidacloprid Olefin in Bee Relevant Matrices Collected from Cotton During Two Successive Years: Final Report. Project Number: EBNTN011. Unpublished study prepared by Bayer CropScience 632pg. MRID 49665202 Forster, R. 2009. Bee poisoning caused by insecticidal seed treatment of maize in Germany in 2008. Pages 126 – 131 in P. A. Oomen and H. M. Thompson (editors) Hazards of Pesticides to Bees, 10th International Symposium of the ICP-BR Bee Protection Group, Bucharest (Romania), October 8 – 10, 2008. Julius Kühn Arch 423. Freeseman, P.L.; Harbin, A. (2011) Determination of the Residues of Imidacloprid and its Metabolites 5-Hydroxy Imidacloprid and Imidacloprid Olefin in Bee Relevant Matrices Collected from Tomato, a Fruiting Vegetable, Grown at Locations Treated with Imidacloprid at Least Once Per Year During Two Successive Years: AMENDED. Project Number: EBNTL056/05/1/AMENDED. Unpublished study prepared by Bayer Cropscience and California Agricultural Research, Inc. 144p. MRID 49090503. Fritz, C. (1992) Degradation of [Pyridinyl-(carbon 14)-Methylene] NTN 33893 in Silt Soil HOEFCHEN under Aerobic Conditions: Lab Project Number: M 1250187-4. Unpublished study prepared by Bayer AG. 54 p. MRID 452393-02

Gels, Jerome, David W. Held and David A. Potter. “Hazard of Insecticides to bumblebee Bombus impatiens (Hymenoptera Apidea) Foraging on flowering White Clover Turf” Entomological Society of America. (2002): 0722-0728. MRID 47796308. Gill, R.J., O. Ramos-Rodriguez, and N.E. Raine. 2012. Combined pesticide exposure severely affects individual- and colony-level traits in bees. Nature. doi:10.1038/nature11585. MRID 49719618. Gill RJ, Raine NE. 2014. Chronic impairment of bumblebee natural foraging behaviour induced by sublethal pesticide exposure. Funct Ecol 28(6):1459-1471. Girolami V., L. Mazzon, A. Squartini, N. Mori, and M. Marzaro, A. Di Bernardo, M. Greatti, C. Giorio and A. Tapparo. 2009. Translocation of Neonicotinoid Insecticides from Coated Seeds to Seedling Guttation Drops: A Novel Way of Intoxication for Bees. Journal of Economic Entomology, 102(5): 1808-1815. MRID 48077913. Godfray HCJ, Blacquie`re T, Field LM, Hails RS, Petrokofsky G, Potts SG, Raine NE, Vanbergen AJ, McLean AR. 2014. A restatement of the natural science evidence base concerning neonicotinoid insecticides and insect pollinators. Proc. R. Soc. B 281: 20140558. Gould, T.; Dallstream, K.; Beedle, E. (2012) Determination of the Residues of Imidacloprid and its Metabolites 5-Hydroxy Imidacloprid and Imidacloprid Olefin in Bee Relevant Matrices Collected from Strawberries, Grown at Locations Treated with Imidacloprid at Least Once Per Year During Two Successive Years. Bayer CropScience, Research Triangle Park, NC. Bayer Report No. EBNTL056-04. 186p. MRID 49090502. Gould, T.; Bowers, L.; Jerkins, E.; et al. (2014) Determination of the Residues of Imidacloprid and its Metabolites 5-Hydroxy Imidacloprid and Imidacloprid Olefin in Bee Relevant Matrices Collected from Blueberries Following Soil Application of Imidacloprid over Two Successive Years. Project Number: EBNTY006, AR12238, 12/GLARS/1606. Unpublished study prepared by Bayer CropScience, ACDS Research, Inc., Great Lakes Agricultural Research Service, Eurofins Agro-science Services, Inc., Synthec Research Laboratory Services and Intrinsik Environmental Services, Inc. 694p. MRID 495356-02 Gould, T., Bowers, L., Dyer, D., and Jerkins, E. (2014). Determination of the Residues of Imidacloprid and its Metabolites 5-Hydroxy Imidacloprid and Imidacloprid Olefin in Bee Relevant Matrices Collected from Treated Cotton During Two Successive Years and in White Clover Planted after Treated Cotton. Study ID EBNTY010. Bayer Crop Science, Research Triangle Park, NC. MRID 49511702. Gould, T., and Jerkins, E. (2015) Determination of the Residues of Imidacloprid, 5-Hydroxy Imidacloprid, and Imidacloprid Olefin in Bee Relevant Matrices Collected from Tomatoes Following Application of Imidacloprid Over Two Successive Years: Final Report. Project Number: EBNTN012. Unpublished study prepared by Bayer CropScience 466p. MRID 49665201. Gradish, A.E., Scott-Dupree, C.D., Shipp, L., Harris, C.R., Ferguson, G. 2009. Effect of reduced risk pesticides for use in greenhouse vegetable production on Bombus impatiens (Hymenoptera: Apidae). Pest Management Science. 66: 142-146. MRID 48194902.

Greatti, M., R. Barbattini, A. Stravisi, A. G. Sabatini, and S. Rossi. 2006. Presence of the a.i. imidacloprid on vegetation near corn fields sown with Gaucho® dressed seeds. Bulletin of Insectology 59 (2): 99-103. MRID 47800522. Johnston, P. et al. 2014. The Bee’s Burden: An Analysis of pesticide residues in comb pollen (beebread) and trapped pollen from honey bees in 12 European countries. Greenpeace Research Laboratories. Technical Report 03-2014. Kasiotis, K. et al. 2014. Pesticide residues in honey bees: honey and bee pollen by LC-MS/MS screening: Reported death incidents in honey bees. Science of the Total Environment. 633-642. Kemp, J. R.; Rogers, R.E.L. 2002. Imidacloprid (Admire®) Residue Levels Following In-furrow Application in Potato Fields in Prince Edward Island and New Brunswick, Final Report. Report No. MO-02-006773/M-031850-01-1. 120 pages. MRID 49719626. Kemp, J. R.; Rogers, R.E.L. 2002. Imidacloprid (Admire®) Residue Levels Following In-furrow Application in Potato Fields in Prince Edward Island and New Brunswick, Final Report. Completion Date: 2002-05-02. Report No. G201996/M-061850-01-2. 121 pages. Kling, A. (2011): Imidacloprid (tech.) – Assessment of Chronic Effects to the Honey Bee, Apis mellifera L., in a 10 Days Continuous Laboratory Feeding Test. Source: Eurofins Agroscience Services EcoChem GmbH, unpublished report No: S11-01962, 28 November 2011. Annette Kling, 2012. MRID 49511703.
Kling, A. (2012): Report Amendment No. 1 to Study S11-01962. Imidacloprid (tech.) – Assessment of Chronic Effects to the Honey Bee, Apis mellifera L., in a 10 Days Continuous Laboratory Feeding Test. Study ID: S11-01962. Koch, D. (1996) Admire 2F--Magnitude of the Residue in Field Rotational Crops: Lab Project Number: AD19RC01: 107133: 43200. Unpublished study prepared by ABC Labs., Inc. and Bayer Corp. 779 p. MRID 440637-01 Krupke, C. H., G. J. Hunt, B. D. Eitzer, G. Andino, K. Given. 2012. Multiple routes of pesticide exposure for honey bees living near agricultural fields. PLoSONE 7(1): e29268. Doi:10.1371/journal.pone.0029268. Laurent, F.M., Rathahao, E. 2003. Distribution of [14C]-Imidacloprid in Sunflowers (Helianthus annuus L.) following Seed Treatment. Journal of Agricultural and Food Chemistry. 51, 8005-8010. MRID 48077902.
Laurino, D., Manino, A. Patteta, A. Porporato, M. 2013. Toxicity of neonicotinoid insecticides on different honey bee genotypes. Bulletin of Insectology. 66 (1) 119-126. MRID 49719620.
Laycock I., K.M. Lenthall, A.T. Barratt, J.E. Cresswell. 2012. Effects of imidacloprid, a neonicotinoid pesticide on reproduction in worker bumble bees (Bombus terrestris). Ecotoxicology, 21: 1937—1945. MRID 49719622.

Laycock, I., Cresswell, J. E. 2013. Repression and Recuperation of Brood Production in Bombus terrestris Bumble Bees Exposed to a Pulse of the Neonicotinoid Pesticide Imidacloprid. PLoS One 8(11): e79872. doi: 10.1371/journal.pone.0079872. MRID 49719621. Lenz, M.; Jackson, S.; Billesbach, K. (2002) Imidacloprid Prospective Groundwater Monitoring Study: Monterey County, California: Lab Project Number: N3212402: H5034: 110889. Unpublished study prepared by Bayer Corporation and Weber, Hayes & Associates. 813 p. MRID 458787-01. Lu, Chensheng et al. 2015. Distributuins of neonicotinoid insecticides in the Commonwealth of Massachusetts: a temporal and spatial variation analysis for pollen and honey samples. Environmental Chemistry. tp://dx.doi.org/10.1071/EN15064. Marletto, F., A. Patetta, A. Manino. 2003. Laboratory assessment of pesticide toxicity to bumblebees. Bulletin of Insectology 56 (1): 155-158. MRID 47796306. Michener, C. 2007. The bees of the World. 2nd Ed. Johns Hopkins University Press. Baltimore. 953 pp. Miller, A., Bowers, L., Dyer, D., and Jerkins, E. (2014). Determination of the Residues of Imidacloprid and its Metabolites 5-Hydroxy Imidacloprid and Imidacloprid Olefin in Bee Relevant Matrices Collected from Cherry Trees following Foliar Application of Imidacloprid over Two Successive Years. Study ID EBNTY008. Bayer Crop Science, Research Triangle Park, NC. MRID 49535601 Miller, A., Bowers, L., Dyer, D., and Jerkins, E. (2014). Determination of the Residues of Imidacloprid and its Metabolites 5-Hydroxy Imidacloprid and Imidacloprid Olefin in Bee Relevant Matrices Collected from Seed Treated Seed Treated Field Corn During Two Successive Years and in White Clover Planted after Seed Treated Field Corn. Study ID EBNTY009. Bayer Crop Science, Research Triangle Park, NC. MRID 49511701. Minor, R. (1994) Admire (2.5 Granular)--Residues in Field Rotational Crops: Lab Project Number: N319RC01: 105153. Unpublished study prepared by EN-CAS Analytical Labs and Miles Inc. 1190 p. MRID 432459-01 Mommaerts, V., S. Reynders, J. Boulet, L. Besard, G. Sterk, and G. Smagghe. 2010. Risk assessment for side-effects of neonicotinoids against bumblebees with and without impairing foraging behavior. Ecotoxicology 19: 207-215. MRID 48151502. Mullin CA, Frazier M, Frazier JL, Ashcraft S, Simonds R, et al. (2010) High Levels of Miticides and Agrochemicals in North American Apiaries: Implications for Honey Bee Health. PLoS ONE 5(3): e9754. doi:10.1371/journal.pone.0009754. Murphy, I., Bowers, L., Dyer, D., and Jerkins, E. (2014). ADMIRE PRO - Magnitude of the Residues of Imidacloprid and its Metabolites 5-Hydroxy Imidacloprid and Imidacloprid Olefin in Bee Relevant Matrices Collected from Citrus Trees following Foliar Applications of Imidacloprid Over Two Successive Years. Bayer Crop Science, Research Triangle Park, NC. MRID 49521301

Nikolakis A, Theis M and Przygoda D. 2011. Imidacloprid tech.: Effects of exposure to spiked diet on honeybee larvae (Apis mellifera carnica) in an in vitro laboratory testing design. Bayer CropScience AG, unpublished report No.: E 318 4110-8; September 23, 2011. MRID 49090506. Pettis, J., E. Lichtenberg, M. Andres, J. Stitzinger, R. Rose, D. vanEngelsdorp. 2013. Crop pollination exposes honey bees to pesticides which alters their susceptibility to the gut pathogen Nosema ceranae. Plos One, 8, pp 1-9. MRID 49719624. Pistorius, J., G. Bischoff, U. Heimbach, and M. Stähler. 2009. Bee poisoning incidents in Germany in spring 2008 caused by abrasion of active substance from treated seeds during sowing of maize. Pages 118 – 126 in P. A. Oomen and H. M. Thompson (editors) Hazards of Pesticides to Bees, 10th International Symposium of the ICP-BR Bee Protection Group, Bucharest (Romania), October 8 – 10, 2008. Julius Kühn Arch 423 Pohorecka, K., Skubida, P., Semkiw, P., Miszczak, A., Teper, D., Sikorski, P., Zagibajlo, K., Skubida, M., Zdanska, D., Bober, A. 2013. Effects of Exposure of Honey Bee Colonies to Neonicotinoid Seed-Treated Maize Crops. Journal of Apicultural Science. 57 (2) pgs. 199-208. doi: 10.2478/jas-2013-0029. MRID 49719625. Ramirez-Romero, R., Chaufaux, J. and MH. Pham-Delégue. “Effects of Cry1Ab protoxin, deltamethrin and imidacloprid on the foraging activity and the learning performances of the honeybee Apis mellifera, a comparative approach.” Apidologie (2005) 36: 601-611. MRID 47796305. Rice, F.; Judy, D.; Koch, D.; et al. (1991) Terrestrial Field Dissipation for NTN 33893 in Georgia Soil: Lab Project Number: N3022101: 101987. Unpublished study prepared by ABC Laboratories, Inc. 422 p. MRID 422563-79 Rice, F.; Judy, D.; Koch, D.; et al. (1991) Terrestrial Field Dissipation for NTN 33893 in Minnesota Soil: Lab Project Number: N3022103: 101988. Unpublished study prepared by ABC Laboratories, Inc. 510 p. MRID 422563-80 Rice, F.; Judy, D.; Koch, D.; et al. (1991) Terrestrial Field Dissipation for NTN 33893 in California Soil: Lab Project Number: N3022102: 101989. Unpublished study prepared by ABC Laboratories, Inc. 561 p. MRID 422563-81 Schmuck,R.,Schoning,R., Strok, A. (2001) “Risk posed to honeybees (Apis mellifera L, Hymenoptera) by an imidacloprid seed dressing of sunflowers.” Pest Management Science . 57: 225-238. MRID 47812303. Schmuck, R., Nauen, R., Ebbinghaus-Kintscher, U. 2003. Effects of imidacloprid and common plant metabolites of imidacloprid in honeybee: toxicological and biochemical considerations. Bulletin of Insectology, 56 (1): 27-34. MRID 47796304. R. Schmuck. “Effects of a Chronic Dietary Exposure of the Honeybee Apis mellifera (Hymenoptera: Apidae) to Imidacloprid.” Arch. Environ. Contam. Toxicol. (2004) 47: 471-478. MRID 47800520.

Schneider CW, Tautz J, Grünewald B, Fuchs, S. 2012. RFID Tracking of Sublethal Effects of Two Neonicotinoid Insecticides on the Foraging Behavior of Apis mellifera. PLoS ONE 7 (1): e30023. MRID 49719629. Schnier, H.F., Wenig, G., Laubert, F., Simon, V., Schmuck, R. 2003. Honey bee safety of imidacloprid corn seed treatment. Bulletin of Insectology. 56 (1): 73-75. MRID 47800523. Scott-Dupree, C.D., L. Conroy and C.R. Harris, 2009. Impact of Currently Used or Potentially Useful Insecticides for Canola Agroecosystems on Bombus impatiens (Hymenoptera: Apidae), Megachile rotundata (Hymenoptera: Megachilidae), and Osmia lignaria (Hymenoptera: Megachilidae). J. Econ. Entomol. 102(1): 177-18200. MRID 48194901. Stadler, T., Martinez-Ginés, D., and M. Buteler. “Long-term toxicity assessment of imidacloprid to evaluate side effects on honey bees exposed to treated sunflower in Argentina.” Bulletin of Insectology (2003): 77-81. MRID 47796301. Stoner KA., Eitzer BD., 2012. Movement of Soil-Applied Imidacloprid and Thiamethoxam into Nectar and Pollen of Squash (Cucurbita pepo). PLoS One, 7:6. MRID 49719616. Stoner KA, Eitzer BD (2013) Using a Hazard Quotient to Evaluate Pesticide Residues Detected in Pollen Trapped from Honey Bees (Apis mellifera) in Connecticut . PLoS ONE 8(10): e77550. doi:10.1371/journal.pone.0077550. Suchail, S., Guez, D., Belzunces, L.P. 2000. Characteristics of Imidacloprid Toxicity in Two Apis Mellifera Subspecies. Environmental Toxicology and Chemistry. 19 (7): 1901-1905. MRID 47800513. Tan K, Chen W, Dong S, Liu X, Wang Y, Nieh JC. 2014. Imidacloprid alters foraging and decreases bee avoidance of predators. PLoS ONE 9(7):e102725. MRID 49719631. Tapparo, A., D. Marton, C. Giorio, A. Zanella, L. Soldà, M. Marzaro, L. Vivan, V. Girolami. 2012. Assessment of the environmental exposure of honey bees to particulate matter containing neonicotinoid insecticides coming from corn coated seeds. Environmental Science and Technology 46: 2592 - 2599. Tasei, J.N., G. Ripault, and E. Rivault, “Hazards of Imidacloprid Seed Coating to Bombus terrestris (Hymenoptera: Apidae) When Applied to Sunflower.” J Econ. Entomol. (2001) 94(3):623-627. MRIDs 47699435/47800503. Tautz, J. 2008. The Buzz About Bees: Biology of a Superorganism. Springer-Verlag Berlin. USEPA 2012. Final FIFRA SAP Pollinator Meeting Report. SAP Minutes No. 2012-06. A Set of Scientific Issues Being Considered by the Environmental Protection Agency Regarding Pollinator Risk Assessment Framework. September 11 – 14, 2012, FIFRA Scientific Advisory Panel Meeting. http://www.regulations.gov/#!documentDetail;D=EPA-HQ-OPP-2012-0543-0047
Thompson HM. 2000. Substance A - Acute contact toxicity to honey bees (Apis mellifera). Study number: HT0400a. MRID 49602715. Thompson HM. 2000b. Substance A - Acute oral toxicity to honey bees (Apis mellifera). Study number: HT0400b. MRID 49602716. Thompson HM, Fryday SL, Harkin S, Milner S. 2014. Potential impacts of synergism in honeybees (Apis mellifera) of exposure to neonicotinoids and sprayed fungicides in crops. Apidologie 45(5):545-553. MRID Thompson HM, Wilkins S, Harkin S, Milner S, Walters KF. 2014. Neonicotinoids and bumblebees (Bombus terrestris): Effects on nectar consumption in individual workers. Pest Manage Sci. MRID 49719632. Tomé HV, Martins GF, Lima MA, Campos, LA, Guedes, RN. 2012. Imidacloprid-induced impairment of mushroom bodies and behavior of the native stingless bee Melipona quadrifasciata anthidioides . PLoS ONE 7(6). Tomé HV, Barbosa WF, Martins GF, Guedes RN. 2015. Spinosad in the native stingless bee Melipona quadrifasciata: Regrettable non-target toxicity of a bioinsecticide. Chemosphere 124:103-109. MRID 49719633. Tomizawa, M, Casida, J. 2005. Neonicotinoid insecticide toxicology: mechanisms of Selective Action. Annual Review of Pharmacology and Toxicology, 45, 247–268. USDA. 2014. Attractiveness of Agricultural Crops to Pollinating Bees for the Collection of Nectar and/or Pollen. (available at: http://www.ree.usda.gov/ree/news/Attractiveness_of_Agriculture_crops_to_pollinating_bees_Report-FINAL.pdf USEPA. 1998. Guidelines for Ecological Risk Assessment. Published on May 14, 1998, Federal Register 63(93): 26846 – 26924. http://www.epa.gov/raf/publications/pdfs/ECOTXTBX.PDF USEPA. 2008a. Problem Formulation for the Imidacloprid Environmental Fate and Ecological Risk Assessment. Office of Pesticide Programs, Environmental Fate and Effects Division, Washington, DC. D353978, November 13, 2008. (available at www.regulations.gov, docket number EPA-HQ-OPP-2008-0844). USEPA. 2008b. Imidacloprid Summary Document. Registration Review Case No. 7605. Office of Pesticide Programs, Special Review and Reregistration Division. December 11. (available at www.regulations.gov, docket number EPA-HQ-OPP-2008-0844). USEPA. 2009. Imidacloprid Final Work Plan. Registration Review Case No. 7605. Office of Pesticide Programs, Special Review and Reregistration Division. June 30. (available at www.regulations.gov, docket number EPA-HQ-OPP-2008-0844).
USEPA. 2010a. Imidacloprid Amended Final Work Plan. Registration Review Case No. 7605. Office of Pesticide Programs, Special Review and Reregistration Division. July 23. (available at www.regulations.gov, docket number EPA-HQ-OPP-2008-0844). USEPA. 2010b. Generic Data Call In Response for Imidacloprid (PC Code 129099; ID # GDCI-129099-951). Office of Pesticide Programs, Washington, DC. November 10. (available at www.regulations.gov, docket number EPA-HQ-OPP-2008-0844). USEPA. 2012. White Paper in Support of the Proposed Risk Assessment Process for Bees. Submitted to the FIFRA Scientific Advisory Panel for Review and Comment September 11 – 14, 2012. Office of Chemical Safety and Pollution Prevention Office of Pesticide Programs Environmental Fate and Effects Division, Environmental Protection Agency, Washington DC; Environmental Assessment Directorate, Pest Management Regulatory Agency, Health Canada, Ottawa, CN; California Department of Pesticide Regulation (available at: http://www.regulations.gov/#!documentDetail;D=EPA-HQ-OPP-2012-0543-0004) USEPA/PMRA/CDPR. 2014. Guidance for Assessing Pesticide Risks to Bees. Office of Pesticide Programs, United States Environmental Protection Agency, Washington, D.C.; Health Canada Pest Management Regulatory Agency Ottawa, ON, Canada California Department of Pesticide Regulation, Sacramento, CA. June 19. (available at: http://www2.epa.gov/pollinator-protection/pollinator-risk-assessment-guidance). Vogeler, K.; Drager, G.; Brauner, A. (1991) Investigation of the Metabolism of NTN 33893 in Potatoes following Granular Application: Lab Project Number: M 173 0297-9: 103218. Unpublished study prepared by Bayer AG. 74 p. MRID 425561-06 Vogeler, K.; Brauner, A. (1992) Metabolism of NTN 33893 in Cotton after Seed Treatment: Lab Project Number: M 173 0311-6: 103818. Unpublished study prepared by Bayer AG. 83 p. MRID 425561-05 Vogeler, K.; Clark, T.; Brauner, A. (1992) Metabolism of carbon 14| NTN 33892 in Apples: Lab Project Number: M 173 0295-7: 103216. Unpublished study prepared by Bayer AG. 88 p. MRID 425561-08 Vogeler, K.; Drager, G.; Brauner, A. (1992) Metabolism of NTN 33893 in Corn after Seed Dressing: Lab Project Number: M 173 0211-5. Unpublished study prepared by Bayer AG. 105 p. MIRD 425561-11 Wiest, L. et al. 2011. Multi-residue analysis of 80 environmental contaminants in honeys, honeybees and pollens by one extraction procedure followed by liquid and gas chromatography coupled with mass spectrometric detection. Journal of Chromatography A. 5743-5756. Williams M.D., Berghaus L., Dyer, D., September 14, 1992. Soil/ Sediment Adsorption-Desorption of 12C-Imidacloprid. Performing Laboratory ABC Laboratories, Inc., 7200 East ABC Lane, P.O. Box 1097 Columbia, Missouri 65205. Submitting Laboratory: Miles Inc., Agriculture Division Research and Development Department P.O. Box 4913 Kansas City, Missouri 64120-0013,Miles Study No. N3182101. Miles Report No. 103816. MRID 425208-01.

Williams M.D., Berghaus L., Dyer, D., September 14, 1992. Soil/ Sediment Adsorption-Desorption of 12C-NTN 33823. Performing Laboratory ABC Laboratories, Inc., 7200 East ABC Lane, P.O. Box 1097 Columbia, Missouri 65205. Submitting Laboratory: Miles Inc., Agriculture Division Research and Development Department P.O. Box 4913 Kansas City, Missouri 64120-0013,Miles Study No. N3182101. Miles Report No. 103816. MRID 425208-02 Whitehorn, P. R., S. O’Connor, F. L. Wackers, D. Goulson. 2012. Neonicotinoid Pesticide Reduces Bumble Bee Colony Growth and Queen Production. MRID 49719634. Wilhelmy H., 2000. Substance A, Acute Effects on the Honeybee Apis mellifera, NON-GLP. Study No: SBA7240N, Project No: 000420BK. MRID 49602717. Yoshida, H. (1989) Hydrolysis of NTN 33893: Lab Project No: 88011/ ESR: 99708. Unpublished study prepared by Nihon Tokushu Noyaku Seizo K.K. 34 p. MRID 420553-37. Yoshida, H. (1990) Photo-degradation of NTN 33893 on Soil: Lab Project Number: 88012/ESR: 100249. Unpublished study prepared by Nihon Tokushu Noyaku Siezo K. K. 42 p. MRID 422563-77. Yoshida, H. (1991) Metabolism of NTN 33893 in Eggplant by Planting Hole Application: Lab Project Number: 89054/ESR. Unpublished study prepared by Nihon Bayer Agro-chem K.K. 102 p. MRID 425561-10 Zhang, Y, Liu, S, Gu, J, Song,F, Yao, X, Liu, Z. 2008. Imidacloprid acts as an antagonist on insect nicotinic acetylcholine receptor containing the Y151M mutation. Neuroscience Letters. 446:97–100.