Embed Size (px)
Citation preview

1
UNITED STATES DISTRICT COURT EASTERN DISTRICT OF LOUISIANA
ROBERT PARKER, ET AL., Plaintiffs
CIVIL ACTION
VERSUS NO. 15-2123
NGM INSURANCE COMPANY, ET AL., Defendants
SECTION: “E” (3)
ORDER AND REASONS
Before the Court are three motions in limine: (1) Plaintiffs’ motion in limine to
exclude the Defendants’ biomechanical expert, Dr. Charles Bain, under Federal Rule of
Evidence 702 and Daubert v. Merrell Dow Pharmaceuticals, Inc., 509 U.S. 137 (1999);1
(2) Defendants’ motion in limine to exclude Plaintiffs’ rebuttal biomechanical expert, Dr.
David Barczyk, on the grounds that Dr. Barczyk was not timely identified as an expert
witness;2 and (3) Defendants’ motion in limine to exclude Dr. Barczyk under Rule 702
and Daubert.3
BACKGROUND
This personal-injury case arises from a motor-vehicle collision in New Orleans,
Louisiana, on August 21, 2014.4 On that date, Plaintiff Robert Parker was driving his 2012
Hyundai Sonata in a southerly direction on Tulane Avenue near its intersection with
Interstate 10 (“I-10”) in New Orleans. Also traveling southbound on Tulane Avenue at
that time was Defendant Edson Rivera, who was operating a 2003 Ford E250 utility van
owned and operated by his employer, Multitec, LLC. Rivera was driving directly behind
Parker’s vehicle. According to Parker, he began to slow down as he approached congested
1 R. Doc. 64. 2 R. Doc. 46. 3 R. Doc. 65. 4 The Background Section of this Order and Reasons is taken, in part, from a prior Order and Reasons. See R. Doc. 60 at 1.
Case 2:15-cv-02123-SM-DEK Document 94 Filed 06/23/16 Page 1 of 26
2
traffic. It is undisputed that, as Parker slowed, he was rear-ended by the Ford van driven
by Rivera. As a result, on May 13, 2015, Parker filed suit against Rivera, Rivera’s employer
Multitec, LLC, and NGM Insurance Company (“Defendants”) in the Civil District Court
for the Parish of Orleans, State of Louisiana.5 The action was removed to federal court on
the basis of federal diversity jurisdiction on June 16, 2015.6 Parker alleges, due to the
collision, he “sustained serious bodily injuries, including but not limited to his back, neck,
head, shoulders and extremities,” and seeks damages for “past and future mental anguish
and physical suffering, past and future expenses for medical care, including expenses for
travel to the physicians’ office, loss of enjoyment of life, loss of consortium, and past and
future lost earnings, along with property damage to his vehicle.”7 Parker’s wife, Krista
Elaine Parker, also seeks damages for “loss of consortium, services, and society of her
husband.”8
Both sides retained experts in the field of biomechanics. The Defendants retained
Dr. Charles E. “Ted” Bain, while Plaintiffs retained Dr. David Barczyk. Dr. Bain and Dr.
Barczyk purport to be biomechanical experts with specialized knowledge of and expertise
in low-impact automobile collisions and the effect of such collisions on the human body.
Dr. Bain and Dr. Barczyk are subject to motions in limine under Daubert, and Dr. Barczyk
is also subject to a motion in limine on procedural, timeliness-of-disclosure grounds. The
Court considers and decides each motion herein.
5 R. Doc. 1-1. 6 R. Doc. 1. 7 R. Doc. 1-1 at 4. 8 R. Doc. 1-1 at 4.
Case 2:15-cv-02123-SM-DEK Document 94 Filed 06/23/16 Page 2 of 26

3
LEGAL STANDARD
The Federal Rules of Evidence permit an expert witness with “scientific, technical
or other specialized knowledge” to testify if such testimony “will help the trier of fact to
understand the evidence or to determine a fact in issue,” so long as “the testimony is based
upon sufficient facts or data,” “the testimony is the product of reliable principles and
methods,” and “the expert has reliably applied the principles and methods to the facts of
the case.”9 The threshold inquiry is whether the expert possesses the requisite
qualifications to render an opinion on a particular subject matter.10 If the expert’s
qualifications are found to be sufficient, the court then must examine whether the expert’s
opinions are reliable and relevant.11 The United States Supreme Court’s decision in
Daubert v. Merrell Dow Pharmaceuticals, Inc.,12 provides the analytical framework for
determining whether expert testimony is admissible under Rule 702. Under Daubert,
courts, as “gatekeepers,” are tasked with making a preliminary assessment of whether the
expert’s testimony is relevant and reliable.13
The party offering the expert opinion must show by a preponderance of the
evidence that the expert’s testimony is reliable and relevant.14 The reliability of expert
testimony “is determined by assessing whether the reasoning or methodology underlying
the testimony is scientifically valid.”15 In Daubert, the Supreme Court enumerated several
9 FED. R. EVID. 702. 10 Wagoner v. Exxon Mobil Corp., 813 F. Supp. 2d 771, 799 (E.D. La. 2011). See also Wilson v. Woods, 163 F.3d 935, 937 (5th Cir. 1999) (“A district court should refuse to allow an expert to testify if it finds that the witness is not qualified to testify in a particular field or a given subject.”). 11 United States v. Valencia, 600 F.3d 389, 424 (5th Cir. 2010). 12 509 U.S. 579 (1993). 13 See Pipitone v. Biomatrix, Inc., 288 F.3d 239, 243–44 (citing Daubert v. Merrell Dow Pharm., Inc., 509 U.S. 579, 592–93 (1993)). 14 Mathis v. Exxon Corp., 302 F.3d 448, 459–60 (5th Cir. 2002). 15 Knight v. Kirby Inland Marine Inc., 482 F.3d 347, 352 (5th Cir. 2007). See also Burleson v. Texas Dep’t of Criminal Justice, 393 F.3d 577, 584 (5th Cir. 2004); Bocanegra v. Vicmar Servs., Inc., 320 F.3d 581, 584–85 (5th Cir. 2003).
Case 2:15-cv-02123-SM-DEK Document 94 Filed 06/23/16 Page 3 of 26
4
non-exclusive factors that courts may consider in evaluating the reliability of expert
testimony.16 “These factors are (1) whether the expert’s theory can or has been tested, (2)
whether the theory has been subject to peer review and publication, (3) the known or
potential rate of error of a technique or theory when applied, (4) the existence and
maintenance of standards and controls, and (5) the degree to which the technique or
theory has been generally accepted in the scientific community.”17
The Supreme Court has cautioned that the reliability analysis must remain flexible.
Various Daubert factors “may or may not be pertinent in assessing reliability, depending
on the nature of the issue, the expert’s particular expertise, and the subject of his
testimony.”18 Thus, “not every Daubert factor will be applicable in every situation . . . and
a court has discretion to consider other factors it deems relevant.”19 In sum, the district
court is offered broad latitude in making expert testimony determinations.20
As a general rule, questions relating to the bases and sources of an expert’s opinion
affect the weight of the evidence rather than its admissibility and should be left for the
finder of fact.21 “Vigorous cross-examination, presentation of contrary evidence, and
careful instruction on the burden of proof are the traditional and appropriate means of
attacking shaky but admissible evidence.”22 The Court is not concerned with whether the
opinion is correct, but whether the preponderance of the evidence establishes that the
opinion is reliable. “It is the role of the adversarial system, not the court, to highlight weak
evidence.”23
16 Daubert, 509 U.S. at 592–96. 17 Bocanegra, 320 F.3d at 584–85 (citing Daubert, 509 U.S. at 593–94). 18 Kumho Tire Co., Ltd. v. Carmichael, 526 U.S. 137, 150 (1999). 19 Guy v. Crown Equip. Corp., 394 F.3d 320, 326 (5th Cir. 2004). 20 See, e.g., Kumho Tire, 526 U.S. at 151–53. 21 See Primrose Operating Co. v. Nat’l Am. Ins. Co., 382 F.3d 546, 562 (5th Cir. 2004). 22 Pipitone, 288 F.3d at 250 (quoting Daubert, 509 U.S. at 596) (internal quotation marks omitted). 23 Primrose, 382 F.3d at 562.
Case 2:15-cv-02123-SM-DEK Document 94 Filed 06/23/16 Page 4 of 26

5
LAW AND ANALYSIS
I. Dr. Charles Bain
Defendants, as the proponents of Dr. Bain’s testimony, have the burden of proving
by a preponderance of the evidence that Dr. Bain possesses the requisite qualifications to
render opinions on the subject matter of this action and that his opinions are reliable,
relevant, and admissible.24 “With respect to qualifications, the proponent must
demonstrate that the expert possesses a higher degree of knowledge, skill, experience,
training, or education than an ordinary person.”25 “Additionally, the expert[’]s
qualifications must relate to the testimony the expert witness provides.”26 With respect to
relevance and reliability, courts in the Eastern District of Louisiana have explained that,
“[t]o meet this burden, a party cannot simply rely on its expert’s assurances that he has
utilized generally accepted scientific methodology. Rather, some objective, independent
validation of the expert’s methodology is required.”27
Dr. Bain issued his expert report on April 11, 2016,28 and the report was timely
disclosed to the Plaintiffs on April 12, 2016.29 Dr. Bain concluded in his report that Robert
Parker’s lower-back injuries were not caused by his being rear-ended by the vehicle driven
by Edson Rivera.30 Dr. Bain’s opinion is summarized as follows:
In summary, Mr. Parker was involved in a low speed rear-end impact followed by a very low speed frontal impact. His low back was subjected to forces that would not cause injury. Mr. Parker may have been startled by the event and experienced reflexive muscle strains. Any symptoms that he had would have abated within days without medical treatment. Any diagnoses,
24 Moore v. Ashland Chem., Inc., 151 F.3d 269, 276 (5th Cir. 1998). 25 Louviere v. Black & Decker U.S., Inc., No. 1:00CV597 (TH), 2001 WL 36385828, at *1 (E.D. Tex. Oct. 26, 2001) (citing FED. R. EVID. 702). 26 Jimenez v. United States, No. SA-5:13-CV-096-OLG, 2014 WL 3907773, at *1 (W.D. Tex. July 25, 2014). 27 See, e.g., Martinez v. Offshore Specialty Fabricators, Inc., No. 08-4224, 2011 WL 820313, at *2 (E.D. La. Mar. 2, 2011). 28 R. Doc. 70-2. 29 See generally R. Doc. 39. 30 R. Doc. 70-2 at 12.
Case 2:15-cv-02123-SM-DEK Document 94 Filed 06/23/16 Page 5 of 26

6
and subsequent investigations and treatments related to DDD, are not causally related to the subject event.31
Plaintiffs argue Dr. Bain should be precluded from offering expert testimony in this case
because he is unqualified and because his proposed testimony does not satisfy the
requirements of Daubert. Dr. Bain’s qualifications and the relevance and reliability of his
opinions are best analyzed in two stages—(1) Dr. Bain’s collision analysis, and (2) Dr.
Bain’s medical-causation analysis.
1. Collision Analysis
According to Dr. Bain, he established the velocity of the vehicles in the crash by
determining the force necessary to cause the observed damage to the car and van
involved. As he puts it, he analyzed the rear-end collision “to characterize the necessary
force to cause damage to the component parts of the vehicle.”32 Based on the velocities of
the vehicles, Dr. Bain expressed an opinion that the load experienced by Robert Parker in
the crash must have been less than 250 pounds. Dr. Bain did not go to the accident scene,
did not inspect the vehicles, and did not speak to anyone who repaired the vehicles.
Instead, he viewed still photographs of the 2012 Hyundai Sonata after the collision and
reviewed repair estimates for that same car.33 He failed to even review photographs of or
repair estimates for the Ford Econoline van.34
The Court first examines Dr. Bain’s qualifications to render this expert opinion.
The Court will then examine the methodology employed by Dr. Bain and the facts and
data underlying his conclusions.
31 R. Doc. 70-2 at 12. 32 R. Doc. 70-2 at 5. 33 R. Doc. 70-1 at 8-9. 34 R. Doc. 70-2 at 3.
Case 2:15-cv-02123-SM-DEK Document 94 Filed 06/23/16 Page 6 of 26

7
a. Qualifications
Dr. Bain earned an undergraduate degree in nuclear engineering from the Royal
Military College in Kingston, Ontario, in 1974.35 Dr. Bain represents that, in pursuit of his
undergraduate degree, he took one-time courses titled: “Waves and Quantum Physics;
Physical Metallurgy; Mechanics of Materials; Nuclear Science; Mass Transfer Operations;
and Applied Thermodynamics.”36 His 40-year-old degree in nuclear engineering is the
extent of Dr. Bain’s formal engineering training. Dr. Bain does not hold a degree in
biomechanics or biomechanical engineering. Dr. Bain is not a registered or licensed
engineer, and he has never worked as an engineer.
For a total of three weeks in 2003, Dr. Bain took two accident-reconstruction
courses at Northwestern University, and in 2006, Dr. Bain became certified in accident
reconstruction by the Accreditation Commission for Traffic Accident Reconstruction
(ACTAR).37 Defendants have not presented any information or evidence to the Court with
respect to (1) the nature of the coursework taken and how it relates to the facts in this
case, or (2) the requirements to obtain a certification in accident reconstruction from
ACTAR. The Defendants have not explained how Dr. Bain’s accident reconstruction
courses qualify him to give the opinions he has expressed in this case.
According to Dr. Bain, he has consulted “in the scientific disciplines of vehicle
dynamics (impact analysis), occupant kinematics, biomechanics, [and] injury potential
and medical analysis” since 2003.38 He also has consulted with respect to a combined
process he refers to as an “Injury Causation Analysis (ICA).”39
35 R. Docs. 70-7 at 2, 70-8 at 2. 36 R. Doc. 70-8 at 2. 37 R. Doc. 70-8 at 2; R. Doc. 70-7 at 2; R. Doc. 70-1 at 26–27. 38 R. Doc. 70-2 at 2. 39 R. Doc. 70-2 at 2.
Case 2:15-cv-02123-SM-DEK Document 94 Filed 06/23/16 Page 7 of 26
8
Based on (1) Dr. Bain’s undergraduate engineering degree, (2) the three-week
accident reconstruction course, (2) Dr. Bain’s ACTAR certification, and (3) his work as a
forensic consultant, the Defendants contend Dr. Bain is qualified to testify as an expert in
this case with regard to the rear-end collision. Because an expert need only possess a
higher degree of knowledge, skill, experience, training, or education than an ordinary
person in the subject matter of his testimony, the Court finds that the Defendants have
established the minimal qualifications needed to qualify Dr. Bain to testify as an expert
with respect to his collision analysis.
b. Reliable Principles & Methods
The Court must now determine whether Dr. Bain’s opinions are relevant and
reliable. Dr. Bain analyzed the vehicles’ velocities immediately prior to the collision, their
pre-collision accelerations, the impact-related changes in the vehicles’ velocities as a
result of the collision (delta-v),40 and the closing velocity of the Ford Econoline van driven
by Edson Rivera. Dr. Bain opined, specifically, that the delta-v of the Ford van was 3.6
mph, the delta-v of Robert Parker’s Hyundai was 5.7 mph, the Ford’s peak acceleration
was 3.6 g, and the Hyundai’s peak acceleration was 5.6 g.41 The Ford’s closing velocity,
according to Dr. Bain, was 6.5 mph.42 Dr. Bain then concluded that “compressive lumbar
loads in frontal crashes for delta-vs less than 15 mph are typically less than 250 lbs.”43
Because he found the delta-vs in this collision to be less than 15 mph, Dr. Bain opines that
Robert Parker experienced loads of less than 250 pounds in the crash. As discussed in
40 Simply stated, delta-v is the change in velocity between pre-collision and post-collision trajectories of a vehicle. 41 R. Doc. 70-2 at 7. 42 R. Doc. 70-2 at 7. 43 R. Doc. 70-2 at 10.
Case 2:15-cv-02123-SM-DEK Document 94 Filed 06/23/16 Page 8 of 26

9
the medical causation section below, he then opined that this collision could not have
caused Robert Parker injury.44
The exact velocities of the vehicles at the time of the crash is unknown, although
the individuals involved agreed that they were not travelling at a high rate of speed. The
force or load exerted on Robert Parker as a result of the crash also is unknown. To
determine the velocity of the vehicles and the resulting force or load, Dr. Bain relied on
his quasi-static force deflection loading test. The purpose of this test, according to Dr.
Bain, was “to replicate or exceed the degree of damage observed in the subject vehicles
from the incident crash and quantify the necessary force required to create a similar
pattern of damage.”45 Dr. Bain represents that he obtained a “complete front bumper
system” for a Ford Econoline 250 van and an “undamaged rear clip of an exemplar
Hyundai,” mounted those components in a “hydraulic bumper test machine,” and used
the machine to push the components together “in horizontal motion until [the] damage
exceeded that of the subject Hyundai.”46 According to Dr. Bain, this test generated a
“bumper to bumper force profile,” which he then incorporated into a “collision simulation
model using an impact mechanics-based numerical algorithm.”47 This algorithm
generated the speed, acceleration, and delta-v figures that serve as the basis of Dr. Bain’s
conclusions in this matter.
Dr. Bain testified in his deposition that his quasi-static force deflection loading test
uses a quasi-static test to replicate what was is in reality a dynamic event, an accident
involving two moving vehicles.48 Dr. Bain admitted that the validity of his opinion is
44 R. Doc. 70-2 at 12. 45 R. Doc. 70-2 at 5. 46 R. Doc. 70-2 at 5–6. 47 R. Doc. 70-2 at 4–6. 48 R. Doc. 70-1 at 42.
Case 2:15-cv-02123-SM-DEK Document 94 Filed 06/23/16 Page 9 of 26

10
dependent upon his proving “that the quasi static compression as well as the compression
from the dynamic crash test were not rate dependent; the differences in time did not show
any rate dependence, and we proved that in our initial study.”49 In other words, for his
methodology to be scientifically valid, it must be shown that his quasi-static force
deflection test successfully predicts the velocities and force in a dynamic collision. This
determination must be based upon factors such as whether his theory can or has been
tested, whether his theory has been subject to peer review and publication, the known or
potential rate of error of his technique or theory when applied, the existence and
maintenance of standards and controls, and he degree to which the technique or theory
has been generally accepted in the scientific community.
Dr. Bain relies on four articles to support the reliability of his premise that
conducting a quasi-static force deflection loading test will reliably quantify the pre-
collision velocities and accelerations of the vehicles involved in a dynamic collision and,
in turn, allow him to “quantify the necessary force required to create a similar pattern of
damage.”50 These articles are: (1) Scott, et al., Simulation Model for Low-Speed Bumper-
to-Bumper Crashes (2010); (2) Scott, et al., Reconstruction of Low-Speed Crashes Using
the Quasi-Static Force vs. Deformation Characteristics of the Bumpers Involved in the
Crashes (2012); (3) Funk, et al., Comparison of Quasistatic Bumper Testing and
Dynamic Full Vehicle Testing for Reconstructing Low Speed Collisions (2014); and (4)
Bonugli, et al., Characterization of Force Deflection Properties for Vehicular Bumper-
to-Bumper Interactions (2014).
49 R. Doc. 70-1 at 50. It is not clear what “initial study” Dr. Bain references. If it the first Scott article, the Court was unable to find any statement to this effect in the paper. 50 R. Doc. 70-2 at 5.
Case 2:15-cv-02123-SM-DEK Document 94 Filed 06/23/16 Page 10 of 26

11
The first article cited by Dr. Bain—Scott, et al., Simulation Model for Low-Speed
Bumper-to-Bumper Crashes (2010)—describes a study the authors (“Scott”) conducted
of “collinear” low-speed bumper-to-bumper crashes.51 Initially, it should be noted that
Scott performed only three low-speed quasi-static tests, likely an inadequate study size.
The stated purpose of the study was to develop an analytical model for use in performing
“parametric studies” of low-speed crashes. Scott replicated a collinear, i.e., straight-line,
collision in a controlled environment, where the midpoint of the trailing vehicle’s front
bumper impacted the midpoint of the lead vehicle’s rear bumper.52 Scott purports only to
develop a method for reconstructing low speed collisions based on quasi-static testing of
bumpers systems and says nothing about the application of his results to dynamic
crashes. Scott does not claim that his quasi-static testing of bumper systems has been
proven to be applicable in evaluating dynamic crashes. Scott assumes the vehicles being
tested are rigid bodies with all of the compliance (force) contained in the bumper
system.53 Interestingly, the authors of the third study cited by Dr. Bain point out the
deficiencies in using the Scott article for the purpose of determining velocity and force in
collisions such as the one that occurred in this case because real world collisions are
dynamic and involve full vehicles, not just bumper systems. These deficiencies are
illustrated by the significant differences between the analytical model developed and
tested by Scott and the facts of this case:
(1) The testing done by Scott was collinear. The collision in which the Plaintiff was injured was not collinear.54 Dr. Bain did not attempt to replicate a collinear collision when he conducted his quasi-static force deflection loading test.55 Instead, Dr. Bain stated in his deposition that he used “the entire rear of a Hyundai Sonata” and “the front bumper from the Ford van” and “compressed
51 R. Doc. 70-13 at 2. 52 R. Doc. 70-13 at 2. 53 R. Doc. 70-15 at 2-3. 54 R. Doc. 70-1 at 25. 55 R. Doc. 70-1 at 41.
Case 2:15-cv-02123-SM-DEK Document 94 Filed 06/23/16 Page 11 of 26

12
them together . . . in the exact alignment that happened here,”56 referring to the alignment of the vehicles in the instant rear-end collision, which was, according to Dr. Bain, a “lateral offset” of “almost 50 percent.”57
(2) Scott used the components of two vehicles that were “modified for low-speed bumper-to-bumper impacts”: (1) a 2007 Ford Edge, and (2) a 2007 Kia Sportage.58 Scott describes in detail the components of the vehicles, the modifications he made for testing purposes, and the method of attachment to the testing apparatus.59 Dr. Bain, on the other hand, merely states that he used the entire rear section of a 2014 Hyundai Sonata and the front bumper from a Ford van “mounted on a hydraulic bumper test machine.”60 Dr. Bain failed to establish that he used comparable vehicle components or that he mounted the vehicles for testing purposes in the same manner used by Scott.
(3) Scott “assumes that the vehicle bodies are rigid structures and the only part of
the vehicles that deform are the bumper systems.”61 The damage in the collision in this case was more extensive than just bumper deformities. In fact, repair estimates for Parker’s Hyundai stated the need to replace the rear bumper cover, the rear energy absorber, and the right bumper bracket. Furthermore, Dr. Bain reports that the right quarter panel and the rear body panel required repair.62
(4) Scott states that the Ford Edge and Kia Sportage bumpers he tested each have
“the same structural characteristics.”63 Dr. Bain does not establish that the Hyundai Sonata and the 2003 Ford Econoline 250 van bumpers involved in the collision and used in his test have the same structural characteristics. In fact, it is unlikely those bumpers, which are from substantially different vehicles and were manufactured approximately nine years apart, have the same structural characteristics.
(5) Scott conducted three low-speed bumper-to-bumper crash tests with a Kia
Sportage and a 2007 Ford Edge.64 The vehicles used by Dr. Bain were a 2012 Hyundai 4-door sedan and a 2003 Ford Econoline 250 van. Dr. Bain fails to account for the differences in the vehicles involved in this crash, such as the complete extent of the damage to the vehicles; the size and weight of the vehicles; the height of their bumpers in relation to each other; road conditions; the construction and crush resistance of their bumpers; and whether either of the bumpers had any pre-existing damage.
56 R. Doc. 70-1 at 41. 57 R. Doc. 70-1 at 25. 58 R. Doc. 70-13 at 5. 59 R. Doc. 70-13 at 5. 60 R. Doc. 70-2 at 5. 61 R. Doc. 70-13 at 4. 62 R. Doc. 70-2 at 4–5. 63 R. Doc. 70-13 at 5. 64 R. Doc. 70-13 at 5.
Case 2:15-cv-02123-SM-DEK Document 94 Filed 06/23/16 Page 12 of 26

13
(6) The vehicles used by Scott had piston-type energy absorbers.65 Dr. Bain does not identify the type of energy absorbers in the bumpers involved in this case.
The second article cited by Dr. Bain—Scott, et al., Reconstruction of Low-Speed
Crashes Using the Quasi-Static Force vs. Deformation Characteristics of the Bumpers
Involved in the Crashes (2012)—does compare the results of quasi-static testing with the
results of dynamic testing. However, the dynamic testing done by Scott was with the front,
or target, vehicle stationary pre-crash; both vehicles in this case were moving at the time
of the collision. Further, only three quasi-static tests and three dynamic tests were done,
likely an inadequate study size. Scott does not state that the quasi-static testing he did
with a stationary front car is applicable to dynamic collisions in which both vehicles are
moving at the time of the crash. As with the first Scott article, the deficiencies in making
this argument are illustrated by the significant differences between the analytical model
developed and tested by Scott and the facts of this case:
(1) In this article, Scott again examined collinear low-impact rear-end collisions where “the centers of the bumpers were in line,”66 unlike the collision in this case which involved a fifty percent lateral offset.67
(2) The target vehicles in the Scott tests were stationary while the target vehicle in
this case was moving.
(3) Scott further explained, similar to the tests conducted in the first article, that “the only structures that underwent measurable deformation were the bumpers.”68 The damage in the collision in this case was more extensive than just bumper deformities. In fact, repair estimates for Parker’s Hyundai stated the need to replace the rear bumper cover, the rear energy absorber, and the right bumper bracket. Furthermore, Dr. Bain reports that the right quarter panel and the rear body panel required repair.69
(4) Scott used bumper systems from six different vehicles, including (1) a 1994
Toyota Tercel, (2) a 2003 Chevrolet Express van, (3) a 2002 Honda Civic, (4) a
65 R. Doc. 70-13 at 16. 66 R. Doc. 70-14 at 3. 67 R. Doc. 70-2 at 4. 68 R. Doc. 70-14 at 4. 69 R. Doc. 70-2 at 4–5.
Case 2:15-cv-02123-SM-DEK Document 94 Filed 06/23/16 Page 13 of 26
14
2007 Ford Escape, (5) a 2008 Honda Civic, and (6) a 2005 Kia Sedona.70 As explained above, however, the vehicles used by Dr. Bain were a 2012 Hyundai 4-door sedan and a 2003 Ford Econoline 250 van. Dr. Bain fails to account for the differences in these vehicles, such as the complete extent of the damage to the vehicles; the size and weight of the vehicles; the height of their bumpers in relation to each other; road conditions; the construction and crush resistance of their bumpers; and whether either of the bumpers had any pre-existing damage.
(5) It is also clear that Scott’s bumper systems were modified significantly for the
exemplar crash tests.71 Dr. Bain, on the other hand, merely states that he used the entire rear section of a 2014 Hyundai Sonata and the front bumper from a Ford van “mounted on a hydraulic bumper test machine.”72 Dr. Bain failed to establish that he used the same components or mounted the vehicle components for testing purposes in the same manner used by Scott.
(6) With respect to the actual device used by Scott in conducting the crash tests,
Scott stated a “device was built that quasi-statically crushes the two bumpers into each other while they are in the proper relative orientation.”73 In this case, Dr. Bain used a “hydraulic bumper test machine.”74 The Defendants have not established that Dr. Bain’s machine is the same as Scott’s device.
The third article cited by Dr. Bain—Funk, et al., Comparison of Quasistatic
Bumper Testing and Dynamic Full Vehicle Testing for Reconstructing Low Speed
Collisions (2014) —attempts to deal with the deficiencies of the methodology used in the
first two Scott articles.75 The authors (“Funk”) investigated the accuracy of quasi-static
bumper testing and dynamic full vehicle testing for purposes of low speed accident
reconstruction. Funk matched quasi-static bumper testing and full vehicle dynamic
testing. Funk performed 22 tests on only seven different vehicle pairs,76 likely an
inadequate study size. To compound this problem, not all of the pairs tested yielded
usable results. The authors could say only that “[s]everal of the cases studied
70 R. Doc. 70-14 at 3. 71 R. Doc. 70-14 at 4. 72 R. Doc. 70-2 at 5. 73 R. Doc. 70-14 at 2. 74 R. Doc. 70-2 at 6. 75 R. Doc. 70-15 at 3. 76 R. Doc. 70-15 at 3.
Case 2:15-cv-02123-SM-DEK Document 94 Filed 06/23/16 Page 14 of 26
15
demonstrated good matches in terms of both vehicle damage and mechanical response.”77
As with the second Scott article, the front vehicle in the Funk study was stationary prior
to impact, while both vehicles in this case were moving at the time of the collision. Except
for case 7, there was full overlap between the bumpers with less than 1 foot of offset
between the centerline of the vehicles,78 while in this case there was a 50 percent overlap.
Funk reported no cases in which one bumper overrode the other, but this may well have
been the case with the Hyundai Sonata sedan and the Ford Econoline van.79 Importantly,
Funk concludes that “quasistatic bumper testing is a reliable method for reconstructing
low speed collisions, provided that the test accurately reproduces the vehicle damage that
occurred in the real world collision.”80 Funk assumed damage only to the bumpers of the
cars tested, but, as noted earlier, the damage to the Hyundai Sonata was more extensive
than just the bumper.
The fourth article cited by Dr. Bain is Bonugli, et al., Characterization of Force
Deflection Properties for Vehicular Bumper-to-Bumper Interactions (2014). Dr. Bain
describes this paper as a compilation of the “hundred or so tests that we’ve done by 2013,
looking at the different characteristics of different types of vehicles, different classes of
vehicles interacting with each other.”81 Bonugli compiled the results of the quasi-static
tests done by Biodynamic Research Corporation to “investigate the behavior of road
vehicle bumper systems,” testing “various bumper-to-bumper alignments” and “various
combinations of vehicle categories.” Bonugli states the validation for this article is
described in the Scott articles,82 which the Court has already analyzed above. Bonugli
77 R. Doc. 70-15 at 7. 78 R. Doc. 70-15 at 3. 79 Id. 80 R. doc. 70-15 at 10. 81 R. Doc 70-1 at 42. By “we,” Dr. Bain is referring to Biodynamic Research Corporation. 82 R. Doc. 94-1 at 2.
Case 2:15-cv-02123-SM-DEK Document 94 Filed 06/23/16 Page 15 of 26

16
categorized each test by “vehicle type, vertical bumper alignment, horizontal bumper
alignment, and whether or not the struck vehicle was equipped with a trailer hitch ball
mount.”83 This is a recognition by Bonugli that quasi-dynamic testing will be affected by
these variables. Unfortunately for Dr. Bain, none of the test categories used by Bonugli
matches the Hyundai Sonata sedan and the Ford Econoline E250 van involved in this
case. The closest comparison is the “heavy vehicle-to-car with full overlap” category,84
but material distinctions exist. The collision in this case involved a 50 percent lateral
overlap. Equally as important, the Court takes judicial notice that a Ford Econoline 250
van is smaller than the defined heavy vehicle as it does not have a weight of 10,000 pounds
or more.
Troubling to the Court is the fact that all four studies cited by Dr. Bain are by
employees of Biodynamic Research Corporation, the corporation by which he is employed
and is a part owner. Dr. Bain has conceded that he has published no peer-reviewed articles
describing his methodology and his conclusion that his quasi-static force deflection
loading test can predict velocities and loads in dynamic crashes.85 Dr. Bain admits the
only members of his profession who have “reviewed” his testing methodology are his co-
workers at Biodynamic Research Corporation, a for-profit entity actively engaged in
consulting for litigation purposes.86 This is hardly proof that Dr. Bain’s methodology is
generally accepted by the scientific community. Dr. Bain’s report provides only his
conclusions and cursory citations to the articles he claims support his conclusions, giving
83R. Doc. 94-1 at 3. 84 R. Doc. 94-1 at 5. The heavy vehicle is defined as vehicles with a gross vehicle resting weight of 10,000 pounds or greater. 85 R. Doc. 70-1 at 14–15. 86 R. Doc. 70-1 at 16, 27. In their opposition to the motion in limine, Defendants argue that the papers on which Dr. Bain relies have been peer-reviewed. While this may be so, this does mean that Dr. Bain’s methodology has been peer-reviewed.
Case 2:15-cv-02123-SM-DEK Document 94 Filed 06/23/16 Page 16 of 26

17
little insight into his intermediate analysis, how he applied his methodology, or how his
methodology is supported by the four articles he cites.87 In his deposition Dr. Bain did
little to explain the methodology he used or the support provided by the cited articles.
With respect to relevance and reliability, courts in the Eastern District of Louisiana have
explained that, “[t]o meet this burden, a party cannot simply rely on its expert’s
assurances that he has utilized generally accepted scientific methodology. Rather, some
objective, independent validation of the expert’s methodology is required.”88 This, the
Defendants have failed to provide.
To be admissible, expert testimony must be the product of reliable principles and
methods.89 After assessing the reliability of Dr. Bain’s proffered expert testimony with
respect to the velocities and force experienced in the crash, the Court finds that it does
not meet the standards of Federal Rule of Evidence 702 and Daubert. Defendants have
not met their burden of establishing that Dr. Bain’s proposed testimony is the product of
reliable principles and methods. It has not been shown that his technique or theory is
generally accepted in the scientific community, or that his methodology has been peer
reviewed. Dr. Bain has failed to account for many factors that would affect velocity and
force in a dynamic crash, such as: the complete extent of the damage to the vehicles; the
size and weight of the vehicles; the heights of their bumpers in relation to each other; road
conditions; the construction and crush resistance of their bumpers; whether either of the
bumpers had any pre-existing damage; etc. As a result, Dr. Bain’s testimony as to the
87 See, e.g., Brown v. Miska, No. Civ.A. V-94-067, 1995 WL 723156, at *4–5 (citations omitted) (“Without any account of Cox’s intermediate reasoning or methodology, the validity of that reasoning cannot be tested. If a methodology cannot be falsified, refuted, or tested by any objective means, then it is incapable of meeting the ‘validity’ criterion of Daubert because it can never be subjected to the scrutiny that any ‘valid’ methodology must survive.”). 88 See, e.g., Martinez v. Offshore Specialty Fabricators, Inc., No. 08-4224, 2011 WL 820313, at *2 (E.D. La. Mar. 2, 2011). 89 FED. R. EVID. 702.
Case 2:15-cv-02123-SM-DEK Document 94 Filed 06/23/16 Page 17 of 26

18
velocities of the vehicles involved in the crash and the load or force experience by Robert
Parker is excluded.
Finally, based upon his opinions regarding the velocities of the vehicles and the
forces generated, Dr. Bain expressed his opinion that the load experienced by Robert
Parker must have been less than 250 pounds. Dr. Bain’s opinion that Robert Parker
experienced loads of less than 250 pounds in the crash is premised upon his opinion
regarding the velocities of the vehicles involved in the crash. This testimony has been
excluded by the Court as unreliable. As a result, Dr. Bain’s testimony regarding the load
experienced by Parker also is excluded under Federal Rule of Evidence 702 and Daubert.
As support for his conclusion for the load experienced by Robert Parker in the
crash, Dr. Bain relies on the following research article: Richards, et al., Incidence of
Thoracic and Lumbar Spine Injuries in Restrained Occupants in Frontal Collisions
(2006).90 According to Dr. Bain, the authors (“Richards”) found that “compressive
lumbar loads in frontal crashes for delta-Vs less than 15 mph are typically less than 250
lbs.”91 The Court notes that the Richards article is an evaluation of the “incidence and
potential injury mechanisms underlying thoracic and lumbar spine fractures in moderate
frontal impacts.”92 The authors found that “thoracolumbar spinal injuries are rare when
an occupant is restrained by a lap and shoulder belt, and are often accompanied by
abdominal injury. The spinal loads measured during frontal impacts with restrained and
nominally positioned ATDs were found to be well within injury thresholds.”93 The
Richards article does not provide adequate support for Dr. Bain’s opinions regarding
force.
90 R. Doc. 70-2 at 10. 91 R. Doc. 70-2 at 10. 92 R. Doc. 94-2 at 1. 93 R. Doc. 94-2 at 1–2.
Case 2:15-cv-02123-SM-DEK Document 94 Filed 06/23/16 Page 18 of 26

19
2. Medical Causation Analysis
In his expert report, Dr. Bain also expressed opinions with respect to the medical
cause of Robert Parker’s injuries. Dr. Bain’s chief conclusion is that Robert Parker’s lower-
back injuries could not have been caused by the rear-end collision but, instead, are a
product of pre-existing injuries.94 Dr. Bain’s medical-causation analysis is based on his
analysis of the collision, the forces and loads that resulted, how those forces and loads
impacted Robert Parker’s person, and whether Parker’s injuries resulted therefrom. Dr.
Bain did not speak to the Plaintiff nor to his treating physician or the doctor who did an
examination of the Plaintiff at the request of the Defendants.95
a. Qualifications
The Court first examines whether Dr. Bain is qualified to testify as a biomechanical
expert as to the medical cause of Robert Parker’s injuries. Dr. Bain has a doctorate of
medicine from Queens University in Kingston, Ontario, and maintains medical licenses
in Canada and the State of Texas. He no longer actively treats patients and has not since
2003.96 When Dr. Bain did treat patients, he did so as a general practitioner in family and
emergency medicine, not as a specialist in neck, back, or spine injuries.97 As mentioned
previously, Dr. Bain also has an undergraduate degree in nuclear engineering from the
Royal Military College in Kingston, Ontario. Dr. Bain does not have a degree in
biomechanical engineering. Furthermore, Dr. Bain is not a licensed engineer and has
never worked as an engineer. Dr. Bain has taken a limited number of courses in accident
reconstruction and obtained a certification from the Accreditation Commission for Traffic
Accident Reconstruction (ACTAR). There has been no showing that these accident-
94 R. Doc. 70-2 at 12. 95 R. Doc. 70-1 at 6-7. 96 R. Doc. 70-7 at 2; R. Doc. 70-8 at 2–3. 97 R. Doc. 70-8 at 2–3.
Case 2:15-cv-02123-SM-DEK Document 94 Filed 06/23/16 Page 19 of 26

20
reconstruction courses have any relevance to Dr. Bain’s qualifications to express these
opinions.
In Oaks v. Westfield Insurance Co., a court in this district excluded Dr. Richard
Harding, a purported biomechanical expert.98 It appears Dr. Harding is a former member
of Biodynamic Research Corporation, the firm with which Dr. Bain is affiliated. In Oaks,
Dr. Harding intended to testify with respect to both “biomechanics and medical causation
by opining that the force of impact could not have caused Plaintiff’s injuries.”99 The court
excluded Dr. Harding, in part, on the basis that he was not qualified to testify with respect
to issues of medical causation:
Dr. Harding is not qualified to testify about Plaintiff’s medical condition because he is not board certified or certified in any medical specialty, he has not practiced clinical medicine in over a decade, and he has never been licensed to practice medicine in the United States. Although he was at one time licensed to practice medicine in the United Kingdom, he has since lost his license due to inactivity.100
A review of Dr. Bain’s curriculum vitae and professional qualifications reveals that,
like Dr. Harding, Dr. Bain is not board certified or certified in any medical specialty and
has not practiced clinical medicine in approximately 13 years.101 Although Dr. Bain
maintains medical licenses in Canada and the State of Texas, those licenses alone do not
render him qualified to testify as an expert on issues of medical causation. The Court finds
that the Defendants have not carried their burden of establishing by a preponderance of
the evidence that Dr. Bain is qualified to testify as a biomechanical expert with respect to
the medical cause of Robert Parker’s injuries and, for this reason alone, excludes his
opinon as to medical causation. Out of an abundance of caution, the Court also will
98 Oaks v. Westfield Ins. Co., No. 13-1637, 2014 WL 198161 (E.D. La. Jan. 16, 2014). 99 Id. at *2. 100 Id. 101 See R. Doc. 70-8.
Case 2:15-cv-02123-SM-DEK Document 94 Filed 06/23/16 Page 20 of 26

21
determine whether Dr. Bain’s opinion with respect to medical causation is the product of
reliable principles and methods.
b. Reliable Principles & Methods and Sufficient Facts & Data
Dr. Bain expressed his medical causation opinion that (1) Parker’s “lumbar spine
did not undergo any significant bending or loading,”102 (2) Parker did not suffer a disc
herniation or protrusion,103 and (3) Parker’s “low back was subjected to forces that would
not cause injury.”104 He further opines that Parker “may have been startled by the event
and experienced some reflexive muscle strains,” and also that “[a]ny symptoms that Mr.
Parker had would have abated within days without medical treatment.”105 Finally, Dr.
Bain expressed his opinion that “[a]ny diagnoses, and subsequent investigations and
treatments related to DDD, are not causally related to the subject event.”106
First, Dr. Bain’s medical causation determination is premised upon his opinion
that Robert Parker experienced loads of less than 250 pounds in the crash. This opinion,
in turn, is premised upon his findings regarding the velocities of the vehicles and the loads
resulting from the crash. Dr. Bain’s testimony with respect to the velocities of the vehicles
and the loads experienced by Robert Parker as a result of the crash both have been
excluded as unreliable under Federal Rule of Evidence 702 and Daubert. Any opinions
he would express based on these inadmissible conclusions likewise are excluded as
unreliable under Federal Rule of Evidence 702 and Daubert.
Second, Dr. Bain’s medical causation opinion must be excluded because it is not
based upon sufficient facts or data. Even Dr. Bain admits that Robert Parker “may have
102 R. Doc. 70-2 at 10. 103 R. Doc. 70-2 104 R. Doc. 70-2 at 12. 105 R. Doc. 70-2 at 10. 106 R. Doc. 70-2 at 12.
Case 2:15-cv-02123-SM-DEK Document 94 Filed 06/23/16 Page 21 of 26
22
been startled by the event,” which might have an impact on the forces he experienced in
the crash, but he failed to take this into account when formulating his opinions. Instead,
Dr. Bain made a number of assumptions with respect to Robert Parker’s posture in the
driver’s seat, whether Parker’s seatbelt locked upon impact, the type and quality of seats
in Parker’s vehicle, and the position of Parker’s headrest.107 For example, Dr. Bain
concluded in his report that Parker’s seatbelt locked upon impact and “would have
prevented any rebound of his trunk” and “constrained his ramping up the seatback.”108
Dr. Bain admitted in his deposition, however, that he was unsure whether Parker’s
seatbelt locked but, instead, was only assuming that it did based on his experience.109 Dr.
Bain also admitted in his deposition that he did not know whether Parker had both hands
on the steering wheel at the time of the crash or whether he was sitting up straight or
leaning to one side at the time of impact.110
With respect to the headrest in Parker’s vehicle, Dr. Bain concluded in his report
that the “headrest would likely have contacted the back of [Parker’s] head,” which
“provides an alternate load path to accelerate his head forward and decreases neck forces
as well as limits neck motion.”111 In his deposition, however, Dr. Bain conceded he had no
proof that the headrest contacted the back of Parker’s head.112 In fact, Dr. Bain noted that,
by Parker’s own admission, his head never came into contact with the headrest, which, if
true, indicates that the collision was a “lower acceleration event” than what he
calculated.113
107 See generally R. Docs. 70-1, 70-2. 108 R. Doc. 70-2 at 9. 109 R. Doc. 70-1 at 10. 110 R. Doc. 70-1 at 9. 111 R. Doc. 70-2 at 9. 112 R. Doc. 70-1 at 11. 113 R. Doc. 70-1 at 11.
Case 2:15-cv-02123-SM-DEK Document 94 Filed 06/23/16 Page 22 of 26

23
With respect to Parker’s seatback, Dr. Bain concluded in his report that “there was
very little differential movement between Mr. Parker’s thorax and lumbar spine as a result
of the support provided by his seatback.”114 Dr. Bain further concluded that the
“horizontal accelerations that [Robert Parker] was subjected to (peak vehicle acceleration
less than 6 g) have been shown not to injury any spinal structure as long as the spine is
supported by a device such as the seatback and headrest that Mr. Parker had.”115 Dr. Bain
was questioned in his deposition with respect to the type of seats in Parker’s vehicle and
the level of support provided by his seatback, but Dr. Bain was unable to provide any
specifics. Dr. Bain explained that Parker’s seatback provided “excellent support” because
it “didn’t fail” and he “didn’t collapse into the rear of the seat.”116 Dr. Bain explained that
he “got an exemplar vehicle and put someone the same height and weight as Mr. Parker
into the vehicle.”117 He then looked at “the geometry of that seat” and examined how
someone of Mr. Parker’s size fit in the seat.118 Dr. Bain did not inspect Mr. Parker’s
Hyundai, so he was unsure if the seat in the exemplar vehicle was substantially the same
as the seat in Mr. Parker’s vehicle. Dr. Bain defended his analysis, saying: “But even if it
has a different seat or headrest than the exemplar surrogate vehicle that I used, my
opinions aren’t going to change. He had an excellent seat in that vehicle.”119 Of note, the
article on which Dr. Bain relied for his conclusion that Robert Parker’s seatback provided
ample support was written in 1959, over 50 years before Mr. Parker’s Hyundai and the
seats therein were manufactured.
114 R. Doc. 70-2 at 9. 115 R. Doc. 70-2 at 9. 116 R. Doc. 70-1 at 14. 117 R. Doc. 70-1 at 12. 118 R. Doc. 70-1 at 12. 119 R. Doc. 70-1 at 17–18.
Case 2:15-cv-02123-SM-DEK Document 94 Filed 06/23/16 Page 23 of 26

24
In Breaud v. Werner Enterprises, Inc., a court in the Middle District of Louisiana
excluded Dr. Bain as an expert, in part, because there were “several instances where he
lacked relevant facts and data to reach his opinions” and “he reached his conclusions by
making assumptions or using unreliable data.”120 In Breaud, a low-impact rear-end
collision case similar to this one, the court found that Dr. Bain’s opinions were based on
insufficient facts and data because he did not visit the accident scene, take measurements,
or collect data, nor was he able to conclude that certain dents on the vehicles were or were
not caused by the subject collision.121 In the present case, Dr. Bain’s opinions suffer from
similar flaws. In his deposition, Dr. Bain admitted that he assumed underlying facts. For
example, he made assumptions with respect to Robert Parker’s posture in the driver’s
seat, whether Parker’s seatbelt locked upon impact, the type and quality of seats in
Parker’s vehicle, and the position of Parker’s headrest. Although questions relating to the
bases and sources of an expert’s opinion affect the weight of the evidence rather than its
admissibility, the expert’s opinion must be based on sufficient facts or data such that the
opinion is reliable.122 In this case, Defendants have not met their burden of establishing
by a preponderance of the evidence that Dr. Bain’s opinions are based on sufficient facts
or data, such that his opinions are reliable. This serves as another reason as another
reason for Dr. Bain’s medical causation opinions.123
120 Breaud v. Werner Enters., Inc., No. 03-860-JJB-SCR (M.D. La. Mar. 20, 2006). 121 Id. 122 See, e.g., Sigur v. Emerson Process Mgmt., No. Civ.A. 05-1323-A-M2, 2007 WL 1893632, at *3 (M.D. La. Apr. 25, 2007). 123 The Court notes that Dr. Bain has been excluded on similar grounds, having been prohibited from testifying with respect to both biomechanical and medical-causation opinions, by state and federal courts across the country. See, e.g., Godchaux v. Peerless Ins. Co., 2013-1083 (La. App. 3 Cir. 06/04/2014), 140 So. 3d 817; Lascola v. Schindler Elevator Corp., No. 08-4802, 2010 WL 971792 (E.D. La. Mar. 12, 2010); Breaud v. Werner Enters., Inc., No. 03-860-JJB-SCR (M.D. La. Mar. 20, 2006); Johnny v. Bornowsky, No. 10-04008-CV-W-FJG, 2011 WL 3794082 (W.D. Mo. Aug. 24, 2011); Salvatore v. Pingel, No. 08-cv-00312-BNB-KMT (D. Colo. Apr. 6, 2009); Cockrell v. Levesque, No. 2006-CI-14200 (Tex. Dist. Ct. Apr. 16, 2008); Johnston v. Laidlaw Transit, Inc., No. 2005/1104 (N.Y. Sup. Ct. Jan. 29, 2008); Peltier v. Wright, No. A498416 (Nev. Cir. Ct. July 30, 2007); Smith v. Thompson, No. 2006-CI-02299 (Tex. Dist. Ct. July 16,
Case 2:15-cv-02123-SM-DEK Document 94 Filed 06/23/16 Page 24 of 26
25
II. Dr. David Barczyk
Defendants filed two motions in limine to exclude the proposed testimony of Dr.
David Barczyk, a purported biomechanical expert retained by Plaintiffs. First, Defendants
argue Dr. Barczyk should be precluded from testifying because Plaintiffs did not identify
him as a retained expert or disclose his report timely.124 Second, Defendants argue that,
even if the Court concludes that Dr. Barczyk’s report was timely disclosed, Dr. Barczyk
should be excluded under Federal Rule of Evidence 702 and Daubert.125
According to Plaintiffs, Dr. Barczyk is a rebuttal expert under Federal Rule of Civil
Procedure 26(a)(2)(D)(ii). Plaintiffs wish to call Dr. Barczyk for the sole purpose of
rebutting the testimony of the Defendants’ biomechanical expert, Dr. Charles Bain.126
Even if Dr. Barczyk is a proper rebuttal expert under Rule 26(a)(2)(D)(ii), an issue on
which the Court does not take a position, the Court has excluded Dr. Bain as an expert
under Rule 702 and Daubert, rendering any need to rebut Dr. Bain’s testimony moot.
Dr. Barczyk is precluded from testifying as an expert in this case.127
2007); Ballew v. Jones, No. 2004-05274 (Tex. Dist. Ct. Feb. 28, 2007); Tout v. Zsiros, No. 1438/2005 (N.Y. Sup. Ct. Feb. 5, 2007); Jones v. Lewis, No. 2004-798 (N.Y. Sup. Ct. Nov. 9, 2006); Stanton v. Fulton, No. 04-11656 (Fla. Cir. Ct. May 15, 2006); Thomas v. Reed, No. 027-J-1510 (Mo. Cir. Ct. Feb. 14, 2006); Percival v. Matson, No. 04-3576 (Fla. Cir. Ct. Apr. 2, 2005). Some courts have permitted Dr. Bain to testify on a limited basis. See, e.g., Chavez v. Marten Transport, Ltd., No. 10-0004 MV/RLP, 2012 WL 988011 (D.N.M. Mar. 22, 2012); White v. Great West Cas. Co., No. 08-1491, 2009 WL 2747795 (W.D. La. Aug. 25, 2009); Eubanks v. Cottrell, Inc., No. 05-CV-1361 JCH, 2007 WL 172566 (E.D. Mo. Jan. 19, 2007); Sport v. Continental Western Ins. Co., No. 04-1386-KMH, 2006 WL 618271 (D. Kan. Mar. 10, 2006). 124 R. Doc. 46. 125 R. Doc. 65. 126 R. Doc. 48 at 1. 127 In light of this finding, the Court need not address whether Dr. Barczyk’s proposed testimony satisfies Rule 702 and Daubert.
Case 2:15-cv-02123-SM-DEK Document 94 Filed 06/23/16 Page 25 of 26

26
CONCLUSION
For the foregoing reasons, IT IS ORDERED that Plaintiffs’ motion in limine to
exclude Dr. Charles “Ted” Bain is GRANTED, and Dr. Bain is hereby excluded from
testifying as an expert in this case.128
IT IS FURTHER ORDERED that Defendants’ motion in limine to exclude Dr.
David Barczyk on timeliness grounds is DENIED AS MOOT.129
IT IS FURTHER ORDERED that Defendants’ motion in limine to exclude Dr.
Barczyk under Federal Rule of Evidence 702 and Daubert is DENIED AS MOOT.130
New Orleans, Louisiana, this 23rd day of June, 2016.131
________________________________ SUSIE MORGAN
UNITED STATES DISTRICT JUDGE
128 R. Doc. 64. 129 R. Doc. 46. 130 R. Doc. 65. 131 The undersigned is neither an engineer nor a scientist. Nevertheless, the Court must perform its gatekeeper function under Daubert. In this case, that task was performed with little help from Dr. Bain’s report, his deposition, or Defendants’ counsel. The Court is confident she correctly evaluated Dr. Bain’s qualifications, as well as the reliability of his opinions.
Case 2:15-cv-02123-SM-DEK Document 94 Filed 06/23/16 Page 26 of 26

INTRODUCTIONAssessing impact severity in low-speed collisions is often difficult using current accident reconstruction methods. In many cases vehicle specific crush stiffness data is not applicable or difficult to incorporate when dealing with vehicles that have little to no residual crush. Reconstructionists are routinely given sparse information regarding the accident vehicles which may or may not be available for inspection. Photographs, witness testimony and repair estimates are frequently the primary source of vehicle information regarding damage.
Traditional vehicle stiffness properties were first studied by Campbell [5] which defined the plastic deformation of vehicle structures in terms of equivalent barriers speed (EBS) and residual crush. The stiffness theory was further developed and uses what are currently known as stiffness coefficients. Campbell also described a non-zero intercept term that took into account the initial energy absorbed with no residual crush. The theory allows calculation of damage energy which can be used in conjunction with conservation of momentum and
conservation of energy to determine the ΔV of the vehicles. However, the stiffness coefficients and intercept have limited application in low-speed impacts with minimal residual damage.
Strother et al. examined the use of deformation energy as an accident reconstruction tool to determine vehicle dynamics for a specific crash [10]. The method required vehicle specific crash data to establish deformation energy estimates. Various force models including the constant force, force saturation, and bilinear crush force model were explored. He stated the need for additional testing to supplement the low energy level data. He cautioned that the use of 30 to 35 mph barrier test data to estimate low speed collision could yield unrealistic stiffness estimates.
Another approach has been called the Momentum-Energy-Restitution (MER) method. This method is based on rigid body impact mechanics and uses impulse, conservation of momentum, conservation of energy and restitution to determine the ΔV of the vehicles in a low-speed crash [2,3,7].
Characterization of Force Deflection Properties for Vehicular Bumper-to-Bumper Interactions
Enrique Bonugli, Jeffrey Wirth, James Funk, Joseph Cormier, Herbert Guzman, Lisa Gwin, and Mark Freund
Biodynamic Research Corp.
ABSTRACTThis is the complete manuscript and replacement for SAE paper 2014-01-0482, which has been retracted due to incomplete content.
This paper reports on 76 quasi-static tests conducted to investigate the behavior of road vehicle bumper systems. The tests are a quasi-static replication of real world low speed collisions. The tests represented front to rear impacts between various vehicles. Force and deflection were captured in order to quantify the stiffness characteristics of the bumper-to-bumper system.
A specialized test apparatus was constructed to position and load bumper systems into each other. The purpose was to replicate or exceed damage that occurred in actual collisions. The fixture is capable of positioning the bumpers in various orientations and generates forces up to 50 kips. Various bumper-to-bumper alignments were tested including full overlap, lateral offset, and override/underride configurations. Force and displacement were recorded and the data was analyzed to develop system stiffness and crush parameters. These parameters can be used in a collision-based model to calculate vehicle delta-v (ΔV) and acceleration. The simulation uses an impact mechanics-based numerical algorithm published by Scott [6]. The paper reports on the test results of various combinations of vehicle categories. Vehicle type includes passenger, light transport and heavy vehicle bumper systems.
CITATION: Bonugli, E., Wirth, J., Funk, J., Cormier, J. et al., "Characterization of Force Deflection Properties for Vehicular Bumper-to-Bumper Interactions," SAE Int. J. Trans. Safety 2(2):2014, doi:10.4271/2014-01-1991.
2014-01-1991Published 04/01/2014
Copyright © 2014 SAE Internationaldoi:10.4271/2014-01-1991saetransaf.saejournals.org
Case 2:15-cv-02123-SM-DEK Document 94-1 Filed 06/23/16 Page 1 of 19

In order to estimate the ΔV for a vehicle in a specific crash the MER method requires a value for the coefficient of restitution (ε) and an estimate of the energy absorbed by each vehicle during the crash. An analysis of a low-speed crash with the MER method provides a ΔV for the crash but does not provide the acceleration vs. time information for the vehicles during the crash.
A third approach is to treat the vehicles as rigid structures and model the bumpers as a spring/dashpot systems and then solve the governing differential equations with the appropriate initial conditions [2,7,12]. The solution gives the accelerations of both vehicles during the crash. In order to simulate a specific crash with a spring/dashpot model the appropriate stiffness and damping coefficients must be used.
Happer et al. [6] described a method for using the IIHS low speed crash test reports to establish an upper limit for crash severity. A comparison of damaged components between the test vehicle and the vehicle being investigated is made. If lesser damage is demonstrated on the vehicle being investigated when compared to the test vehicle then the closing velocity for the test can be used as an upper limit BEV for the subject vehicle. The BEV can in turn be used in the Carpenter [3] single-degree-of-freedom (SDOF) MER method, once b1 values have been determined. This method is useful when IIHS tests are available for a particular vehicle.
Scott developed a numerical collision model to simulate low-speed collinear vehicle-to-vehicle impacts. In the analysis the impact force was directly related to the physical properties of the bumpers that were involved in the crash [8,9]. The approach allows the crash severity of a low-speed crash involving specific vehicles to be estimated, including the crash pulse. This approach takes into account the variability of the force-deformation characteristics of the bumper systems. A numerical simulation is performed which satisfies Newton's Second Law at discrete time increments The structural characteristics of both vehicles' bumpers are combined and input as a system Impact Force-Deformation (IF-D) function. The deformation is the sum of the deformation of the two bumpers involved in the crash (i.e. mutual crush). The IF-D function can be a theoretical curve, or be based on measured force-deflection data for specific bumpers. Tests were conducted to measure IF-D curves which were then used in the analysis to determine the ΔV and the acceleration vs. time information for vehicles involved in crashes.
Validation of the quasi-static bumper loading method described in this paper has been conducted by Scott et al. A series of matching quasi-static and dynamic tests were performed and compared. The study concluded that quasi-static force deflection measurement can be used to reconstruct and quantify the vehicle dynamics in low speed bumper-to-bumper collisions.
This retrospective study provides a large number of force-deformation curves taken from tests covering a wide range of bumper systems. The testing is grouped into categories and
summarized as linear IF-D functions. These functions could be used for the calculation of vehicle delta-v and acceleration in low-speed collisions when specific test data is not available. In that case the delta-v and acceleration are calculated in an analysis of the collision using a model based on Newton's Laws of Motion developed by Scott et al. The IF-D function characterizes the vehicle interaction.
METHOD
GeneralBumper-to-bumper interactions were simulated using a test fixture developed to quasi-statically load two bumper systems as described by Scott [8,9]. The working model assumes each of the vehicles involved in the collision to be a rigid body with the exception of the interacting bumper and vehicle components. Many of the tests conducted were designed and modeled based on a real world low speed collision and were used to analyze the crash mechanics for that specific crash configuration. The bumper components were aligned using information available to the reconstructionist for the particular crash being investigated. Information available to the reconstructionist often included scene photographs, photographs of one or both vehicles involved in the crash, witness testimony, repair estimates, accident reports, and/or appraisal reports. For example, in some cases the front license plate or license plate fastener of the striking vehicle created an imprint onto the rear bumper cover of the struck vehicle. This physical evidence was used to align the bumper at the point of initial contact. Exemplar vehicles were procured for each bumper system in order to obtain external bumper cover and bumper reinforcement bar heights. In some instances bumper dive measurements due to heavy braking were also documented to ensure proper vertical bumper alignment.
The interacting bumpers are treated as a one system and therefore produce the stiffness characteristics for the system as a whole. The exemplar test components were fixed to the test apparatus rigidly and in a substantially similar mounting configuration when compared to their respective vehicles including all relevant bumper brackets. All tests were conducted using original equipment manufacturer (OEM) parts and brackets.
A total of 85 quasi-static force deflection bumper tests were reviewed. The bumper tests were sorted and grouped in a variety of category permutations for comparative analysis. Nine of the 85 did not form a significant category grouping and were not used in the analysis.
Each force deflection test consisted of two general phases, a compression phase and rebound phase. The front bumper system of one vehicle and the rear bumper system of another were compressed together in order replicate and/or exceed the damage seen on the vehicles being investigated. Only compression phases were comparatively analyzed for this study.
Bonugli et al / SAE Int. J. Trans. Safety / Volume 2, Issue 2 (July 2014)
Case 2:15-cv-02123-SM-DEK Document 94-1 Filed 06/23/16 Page 2 of 19
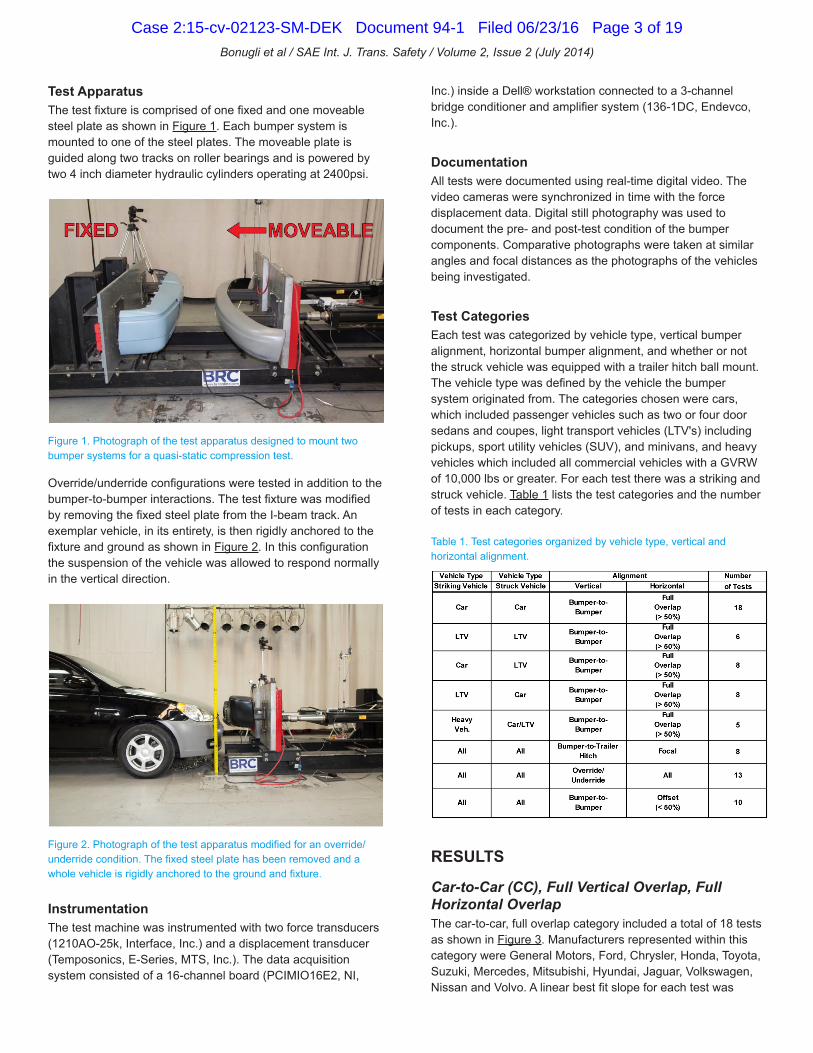
Test ApparatusThe test fixture is comprised of one fixed and one moveable steel plate as shown in Figure 1. Each bumper system is mounted to one of the steel plates. The moveable plate is guided along two tracks on roller bearings and is powered by two 4 inch diameter hydraulic cylinders operating at 2400psi.
Figure 1. Photograph of the test apparatus designed to mount two bumper systems for a quasi-static compression test.
Override/underride configurations were tested in addition to the bumper-to-bumper interactions. The test fixture was modified by removing the fixed steel plate from the I-beam track. An exemplar vehicle, in its entirety, is then rigidly anchored to the fixture and ground as shown in Figure 2. In this configuration the suspension of the vehicle was allowed to respond normally in the vertical direction.
Figure 2. Photograph of the test apparatus modified for an override/underride condition. The fixed steel plate has been removed and a whole vehicle is rigidly anchored to the ground and fixture.
InstrumentationThe test machine was instrumented with two force transducers (1210AO-25k, Interface, Inc.) and a displacement transducer (Temposonics, E-Series, MTS, Inc.). The data acquisition system consisted of a 16-channel board (PCIMIO16E2, NI,
Inc.) inside a Dell® workstation connected to a 3-channel bridge conditioner and amplifier system (136-1DC, Endevco, Inc.).
DocumentationAll tests were documented using real-time digital video. The video cameras were synchronized in time with the force displacement data. Digital still photography was used to document the pre- and post-test condition of the bumper components. Comparative photographs were taken at similar angles and focal distances as the photographs of the vehicles being investigated.
Test CategoriesEach test was categorized by vehicle type, vertical bumper alignment, horizontal bumper alignment, and whether or not the struck vehicle was equipped with a trailer hitch ball mount. The vehicle type was defined by the vehicle the bumper system originated from. The categories chosen were cars, which included passenger vehicles such as two or four door sedans and coupes, light transport vehicles (LTV's) including pickups, sport utility vehicles (SUV), and minivans, and heavy vehicles which included all commercial vehicles with a GVRW of 10,000 lbs or greater. For each test there was a striking and struck vehicle. Table 1 lists the test categories and the number of tests in each category.
Table 1. Test categories organized by vehicle type, vertical and horizontal alignment.
RESULTS
Car-to-Car (CC), Full Vertical Overlap, Full Horizontal OverlapThe car-to-car, full overlap category included a total of 18 tests as shown in Figure 3. Manufacturers represented within this category were General Motors, Ford, Chrysler, Honda, Toyota, Suzuki, Mercedes, Mitsubishi, Hyundai, Jaguar, Volkswagen, Nissan and Volvo. A linear best fit slope for each test was
Bonugli et al / SAE Int. J. Trans. Safety / Volume 2, Issue 2 (July 2014)
Case 2:15-cv-02123-SM-DEK Document 94-1 Filed 06/23/16 Page 3 of 19

determined based on a zero y-intercept to peak force criterion. In many cases, the peak force may represents a global maximum rather than the force at peak deformation as shown in Figure 4. The maximum values located within the compression phase of a force deformation test often represented the collapse of a bumper component. The overall slope of the compression phase is the bumper system stiffness measured in pounds (force) per foot. The numerical average and one standard deviation of the bumper stiffness values were then used to create a bumper stiffness corridor. The average stiffness for this category was 29,591 lbf/ft with a standard deviation of 10,524 lbf/ft.
Figure 3. Force vs. deflection plot for the car-to-car full overlap tests. The average slope and standard deviation are overlaid on the test data.
The test shown below in Figure 4 is an example of a force deflection plot in which the front bumper system (striking vehicle) collapsed and could no longer support the compressive forces. In this case, the left bumper bracket and front reinforcement bar were compromised. The stiffness for this test was determined from the peak force rather than the peak deflection to better represent the resistance prior to collapse. The average slope would have been underestimated had the peak deflection been used as a stiffness determinant.
Two-thirds (12 of 18) of the tests in this category had a bumper reinforcement bar or bumper brackets that collapsed. A list of damaged components for these tests is detailed in Table 2. The average force for bumper reinforcement bar collapse was 12,800 lbf. Of the twelve tests that included bumper bar collapse, nine were front bumper systems. It was postulated that the front bumper systems for road vehicles are softer than rear bumper system because of the airbag system. The front bumper systems are possibly tuned with the deployment sequence of the vehicle. It was also observed that bumpers constructed from aluminum had a tendency to be stiffer than any other material tested.
Figure 4. Force vs. deflection plot for test CC15 including the compression and rebound phase. The front bumper system permanently deforms at approximately 15,300 lbf.
Table 2. List of test components that permanently yielded in the car-to-car full overlap category.
LTV-to-LTV (LL), Full Vertical Overlap, Full Horizontal OverlapThe LTV-to-LTV, full overlap category included a total of 6 tests as shown in Figure 5. Manufacturers included Chrysler, Ford, General Motors and Honda. The average stiffness for this category was 32,145 lbf/ft with a standard deviation of 11,387 lbf/ft.
The bumper construction and mounting differs between pickups and sedans. Pick-ups tend to lack bumper covers and energy absorbers. Additionally, the mounting structure consisted of brackets that are directly fastened to a box frame. Because of these differences in design, component yielding occurred within the compliance of the brackets. In some tests the rear bumper pitched instead of causing the bumper reinforcement bar to permanently deform. In other cases the bumper may not collapse but rather deform through indentation of the bumper fascia.
Bonugli et al / SAE Int. J. Trans. Safety / Volume 2, Issue 2 (July 2014)
Case 2:15-cv-02123-SM-DEK Document 94-1 Filed 06/23/16 Page 4 of 19

Figure 5. Force vs. deflection plot for the LTV-to-LTV full overlap tests. The average slope and standard deviation are overlaid on the test data.
Car-to-LTV (CL), Full Vertical Overlap, Full Horizontal OverlapThe car-to-LTV, full overlap category included a total of 8 tests as shown in Figure 6. Manufacturers included Ford, General Motors, Toyota, Isuzu and Honda. The average stiffness for this category was 28,296 lbf/ft with a standard deviation of 11,608 lbf/ft.
Figure 6. Force vs. deflection plot for the car-to-LTV full overlap tests. The average slope and standard deviation are overlaid on the test data.
This category had similar damage results when compared to the LTV-to-LTV category. This is in part due to the fact that the rear bumper systems are mostly pick-up bumpers. Yielding occurred when the rear bumper system rotated rather than plastically deforming. Three of the eight tests (CL1, CL2, and CL6) involved the front bumper system of a Ford Taurus. The Ford Taurus front bumper was noted as being relatively stiff
and did not permanently deform. All three Ford Taurus tests resulted in similar stiffness slopes near the upper limit of the corridor.
LTV-to-Car (LC), Full Vertical Overlap, Full Horizontal OverlapThe LTV-to-car, full overlap category included a total of 8 tests as shown in Figure 7. Manufacturers included Ford, General Motors, Toyota, Isuzu and Honda. The average stiffness for this category was 29,245 lbf/ft with a standard deviation of 13,446 lbf/ft.
Five of the eight tests included a bumper system that collapsed, all of which were front bumpers. A majority of these front bumpers were from sport utility and minivan vehicles that closely resemble the construction of sedans. Two of the five bumpers were constructed from a fiberglass composite material. The average force for bumper reinforcement collapse for the five tests was 9,786 lbf.
Figure 7. Force vs. deflection plot for the LTV-to-car full overlap tests. The average slope and standard deviation are overlaid on the test data.
Heavy Vehicle-To-Car/LTV (HC) (HL), Full Vertical Overlap, Full Horizontal OverlapThe heavy vehicle-to-car/LTV, full overlap category included a total of 5 tests as shown in Figure 8. Manufacturers included Ford, General Motors, Toyota, Peterbilt, International, Freightliner and Honda. The average stiffness for this category was 51,799 lbf/ft with a standard deviation of 29,699 lbf/.
In general, the heavy vehicle front bumper systems were stiffer than their car and LTV counterparts. Tests HC2 and HC4 were Peterbilt front bumpers and followed a distinctly similar force deflection characteristic. Both of these tests involved subject vehicles in which the struck car was left with only bumper fastener (bolt) impressions onto the rear bumper covers. This allowed for precise alignment of the bumpers at the time of impact. Preliminary tests were first conducted to create the bolt
Bonugli et al / SAE Int. J. Trans. Safety / Volume 2, Issue 2 (July 2014)
Case 2:15-cv-02123-SM-DEK Document 94-1 Filed 06/23/16 Page 5 of 19

impression onto the bumper covers before proceeding with the tests shown in Figure 8. The subsequent tests were then performed with the intent of grossly exceeding the damage documented on the subject vehicle to present a worst case scenario. Tests HC3 and HC4 followed a different pattern in both stiffness and damage. The bumper systems of the struck vehicles were comparatively less stiff than the heavy vehicle front bumpers and deformed to a greater extent. This created a large variation in the standard deviation for this category. It should be noted that in all five tests the heavy vehicle bumper fascia's plastically deformed. The stiffness of the front bumper system was generated from the interaction with the box frame and underlying bumper brackets rather than the bumper fascia which were all constructed from a thin gauge metal.
Figure 8. Force vs. deflection plot for the heavy vehicle-to-car/LTV full overlap tests. The average slope and standard deviation are overlaid on the test data.
All Car/LTV-to-Trailer HitchThe car/LTV-to-trailer hitch, full overlap category included a total of 8 tests as shown in Figure 9. Manufacturers included Ford, General Motors, Toyota, Honda, and Nissan. The average stiffness for this category was 24,052 lbf/ft with a standard deviation of 4,163 lbf/ft.
All tests were conducted with the intent of collapsing the front bumper reinforcement bars. Trailer hitch ball mount collisions are a common crash type. They often lead to a distinct focal damage pattern ideal for aligning the vehicles at impact as shown in Figure 10. No test exceeded a peak force of 11,200 lbf. The average force for bumper collapse was 8,323 lbf. Test TH5 was the only test that did not involve a ball mount and only included the receiver box tubing although the data followed the same pattern as the remaining 7 tests. Ideally a bi-phasic slope would be used in the simulation to calculate ΔV and acceleration. The linearity of the average slope would tend to over predict the calculated values.
Figure 9. Force vs. deflection plot for all car/LTV-to-trailer hitch tests. The average slope and standard deviation are overlaid on the test data.
Figure 10. Overhead view of a trailer hitch equipped with a ball mount intruding into the front bumper system in test TH3 at maximum compression.
All Override/UnderrideThe Override/Underride category included a total of 14 tests as shown in Figure 11. Manufacturers represented within this category were General Motors, Ford, Lexus, Saturn, Hyundai, Hino, Chrysler, Nissan, Sterling and Toyota. The average stiffness for this category was 7,089 lbf/ft with a standard deviation of 3,764 lbf/ft.
During the tests the bumpers engaged and usually then slid over one another resulting in damage to components including the hood, grill, headlights, radiator support, truck lid, body panels, bumper and bumper covers. As the stiff structures were generally not damaged during the testing, the average stiffness is much lower than the other categories. There was a large variation in the vehicles tested, which included cars and LTV's. This may explain the relatively large standard deviation.
Bonugli et al / SAE Int. J. Trans. Safety / Volume 2, Issue 2 (July 2014)
Case 2:15-cv-02123-SM-DEK Document 94-1 Filed 06/23/16 Page 6 of 19
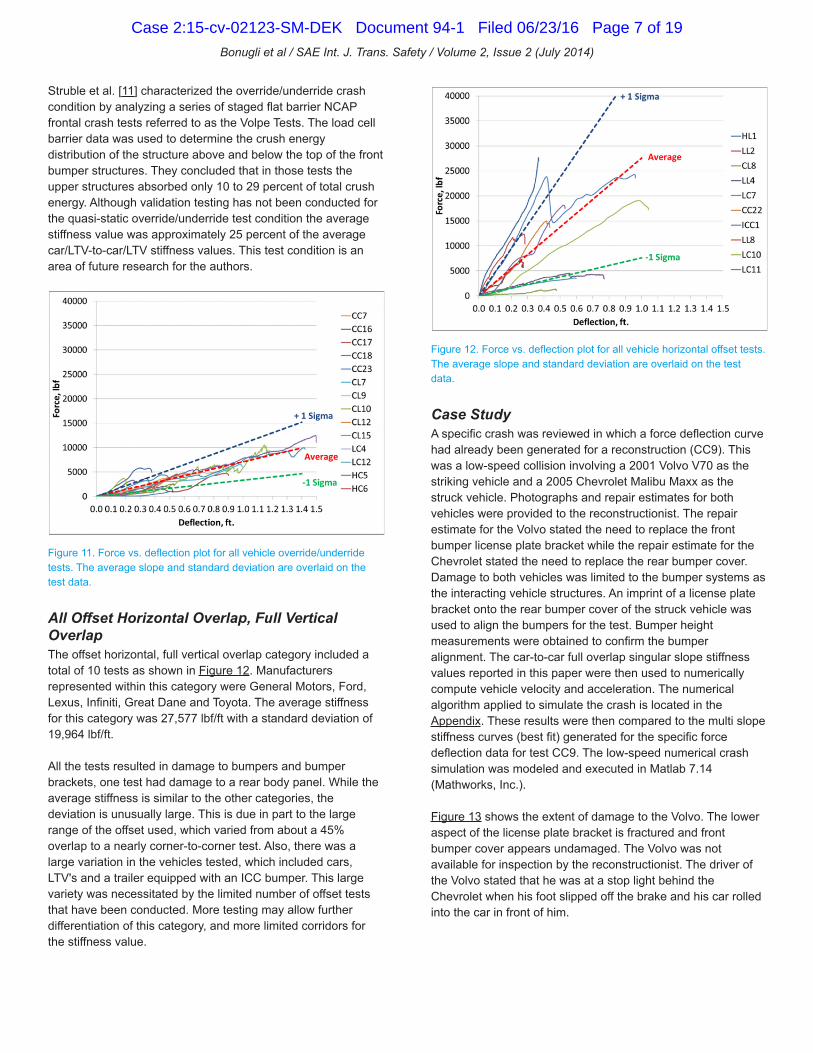
Struble et al. [11] characterized the override/underride crash condition by analyzing a series of staged flat barrier NCAP frontal crash tests referred to as the Volpe Tests. The load cell barrier data was used to determine the crush energy distribution of the structure above and below the top of the front bumper structures. They concluded that in those tests the upper structures absorbed only 10 to 29 percent of total crush energy. Although validation testing has not been conducted for the quasi-static override/underride test condition the average stiffness value was approximately 25 percent of the average car/LTV-to-car/LTV stiffness values. This test condition is an area of future research for the authors.
Figure 11. Force vs. deflection plot for all vehicle override/underride tests. The average slope and standard deviation are overlaid on the test data.
All Offset Horizontal Overlap, Full Vertical OverlapThe offset horizontal, full vertical overlap category included a total of 10 tests as shown in Figure 12. Manufacturers represented within this category were General Motors, Ford, Lexus, Infiniti, Great Dane and Toyota. The average stiffness for this category was 27,577 lbf/ft with a standard deviation of 19,964 lbf/ft.
All the tests resulted in damage to bumpers and bumper brackets, one test had damage to a rear body panel. While the average stiffness is similar to the other categories, the deviation is unusually large. This is due in part to the large range of the offset used, which varied from about a 45% overlap to a nearly corner-to-corner test. Also, there was a large variation in the vehicles tested, which included cars, LTV's and a trailer equipped with an ICC bumper. This large variety was necessitated by the limited number of offset tests that have been conducted. More testing may allow further differentiation of this category, and more limited corridors for the stiffness value.
Figure 12. Force vs. deflection plot for all vehicle horizontal offset tests. The average slope and standard deviation are overlaid on the test data.
Case StudyA specific crash was reviewed in which a force deflection curve had already been generated for a reconstruction (CC9). This was a low-speed collision involving a 2001 Volvo V70 as the striking vehicle and a 2005 Chevrolet Malibu Maxx as the struck vehicle. Photographs and repair estimates for both vehicles were provided to the reconstructionist. The repair estimate for the Volvo stated the need to replace the front bumper license plate bracket while the repair estimate for the Chevrolet stated the need to replace the rear bumper cover. Damage to both vehicles was limited to the bumper systems as the interacting vehicle structures. An imprint of a license plate bracket onto the rear bumper cover of the struck vehicle was used to align the bumpers for the test. Bumper height measurements were obtained to confirm the bumper alignment. The car-to-car full overlap singular slope stiffness values reported in this paper were then used to numerically compute vehicle velocity and acceleration. The numerical algorithm applied to simulate the crash is located in the Appendix. These results were then compared to the multi slope stiffness curves (best fit) generated for the specific force deflection data for test CC9. The low-speed numerical crash simulation was modeled and executed in Matlab 7.14 (Mathworks, Inc.).
Figure 13 shows the extent of damage to the Volvo. The lower aspect of the license plate bracket is fractured and front bumper cover appears undamaged. The Volvo was not available for inspection by the reconstructionist. The driver of the Volvo stated that he was at a stop light behind the Chevrolet when his foot slipped off the brake and his car rolled into the car in front of him.
Bonugli et al / SAE Int. J. Trans. Safety / Volume 2, Issue 2 (July 2014)
Case 2:15-cv-02123-SM-DEK Document 94-1 Filed 06/23/16 Page 7 of 19

Figure 13. Photographs of the Volvo involved in the crash being investigated.
Figure 14 demonstrates the damage incurred to the Chevrolet. The rear bumper cover has areas of abrasion just right of center. The lower photograph in Figure 14 shows an outline of the license plate bracket imprinted onto the bumper cover that resulted from the collision. The Chevrolet was also not available for inspection.
The force deflection data produce in test CC9 was used to simulate the actual collision. Areas of inflection or local maxima often represent a point in which a component is compromised during the test. Figure 15 shows the force deflection data for test CC9. The peak force of 25,554 lbf occurred at 0.94 ft of deflection, however the rear bumper reinforcement bar for the Chevrolet collapsed at 15,000 lbf with 0.52 ft of deflection. The bumper yield point was used as an upper threshold for damage and signified the end of the simulation. The hysteresis or rebound phase of the force deflection curve could be used to model the separation phase of the collision. For simplicity a coefficient of restitution (ε) of 0.3 was used for the rebound phase of the crash simulation. Inclusion of the rebound phase is an area of future research. Using a range of restitutions could address this issue. Changing the restitution value will not
affect the peak acceleration or peak force for the crash simulation, however it can alter the crash pulse duration and delta-v. In this case, the quasi-static test would ideally have been stopped once the Chevrolet reinforcement collapsed in order to capture the hysteresis at that point. Since the test was continued far beyond the bumper collapse, the restitution of the bumper system represents components being crushed beyond the point of collapse.
Figure 14. Photographs of the Chevrolet involved in the crash being investigated.
The best fit stiffness slope for the test data was divided into two phases. The first slope was measured from the test data to be 10,091 lbf/ft at 0.22 ft of deflection. The simulation continues from this point with a secondary slope of 42,200 lbf/ft until the bumper collapse at 0.52 ft of deflection. Maximum engagement is satisfied and the rebound phase begins until the forces reach zero.
Bonugli et al / SAE Int. J. Trans. Safety / Volume 2, Issue 2 (July 2014)
Case 2:15-cv-02123-SM-DEK Document 94-1 Filed 06/23/16 Page 8 of 19

Figure 15. Force deflection data set for test CC9 overlaid with the best fit, average, minus one standard deviation and plus one standard deviation stiffness slopes. The stiffness corridors were obtained from the car-to-car full overlap data.
The iterative simulation completes the crash sequence and generates a velocity and acceleration time history based on the force deflection data. The area under the force deflection curve represents the work energy produced in the collision. The velocity time history shown in Figure 16 was calculated from the best fit stiffness slope simulation. The point of common velocity at 0.75 seconds is also the point of maximum engagement.
Figure 16. Velocity time history calculated from the crash simulation using the best fit slope data.
Next, the car-to-car full overlap stiffness corridors were then used as the stiffness input to execute the crash simulation. The average stiffness for this corridor was 29,591 lbf/ft with a standard deviation of 10,524 lbf/ft. The uniform slopes were overlaid with the best fit and test CC9 force deflection plot in Figure 15. The simulation was ended at 0.52 feet of deflection for each simulation. The acceleration time histories for the struck vehicle are plotted together in Figure 17 to compare peak values and crash duration. The average stiffness slope for this simulation produced an acceleration profile closest to the best fit data.
Figure 17. Acceleration time history plot of the struck vehicle for each crash simulation.
The pertinent output data for each simulation was summarized in Table 3. Change in velocity is often the most significant metric for crash severity used in accident reconstruction. The - 1 sigma corridor produced a ΔV within 5 percent of the best fit output. For this case study the +1 sigma overestimated the crash severity by nearly 40 percent. Overall the stiffness corridor would have captured the collision event by producing an upper and lower limit within a reasonable degree of accuracy.
In the event that test data is not available to the reconstructionist, an exemplar vehicle matchup, photogrammetry or three dimensional models can be used to estimate mutual crush. The estimation of crush can provide a metric to iterate the crash simulation based on the appropriate stiffness corridors reported in this paper.
Using a classic damage based crush analysis for the Volvo with vehicle specific A and B stiffness coefficients and uniform crush of 3 inches across the front of the Volvo yielded a BEV of 10.3 mph. Utilizing the conservation of momentum, the ΔV for the Chevrolet would be in excess of 10 mph. This demonstrates how the classic damage based analysis can over predict the vehicle ΔV's in low-speed collisions.
Table 3. Summary of results for the low-speed simulations completed for various stiffness slopes.
Bonugli et al / SAE Int. J. Trans. Safety / Volume 2, Issue 2 (July 2014)
Case 2:15-cv-02123-SM-DEK Document 94-1 Filed 06/23/16 Page 9 of 19

Residual CrushThe residual crush for each of the force deflection tests was measured and plotted with the corresponding peak deflection as shown in Figure 18. The relationship is fairly linear and indicates that the bumper systems rebound approximately 30 percent from maximum deflection.
Figure 18. Residual crush for each of the force deflection tests performed.
SUMMARY/CONCLUSIONSThis paper has presented 76 quasi-static tests conducted on road vehicle bumper systems representing front to rear impacts between various vehicles. Force and deflection data for the tests was captured and plotted. These tests were conducted to obtain data to facilitate the reconstruction of various roadway crashes. In the absence of case specific testing, this large volume of test data can be used in a reconstruction. To better match specific impacts, categories were chosen representing combinations of various vehicle types common in roadway collisions. The stiffness characteristics of the bumper-to-bumper system was measured from each test and the average values for each category were determined. Table 4 gives the averages and standard deviations for the categories. The average stiffness values were similar for the various combinations of car and LTV impacts, perhaps reflecting similarity in general bumper system construction and impact response for passenger and light transport vehicles.
The average and standard deviation values create stiffness corridors as shown in Figures 6, 7, 8, 9 and 11-12. The corridors represent stiffness bounds that can be used in the calculation of collision parameters, such as ΔV and peak accelerations, using the numerical collision simulation describes by Scott [8] Mutual crush can be approximated through exemplar vehicle, three dimensional models or photogrammetry to determine peak deflection. This method
serves as an additional tool for accident reconstruction when test data is limited or damage to the vehicles being investigated is not measureable.
Table 4. Average slopes for all test categories.
Further testing and analysis will allow finer differentiation of the vehicle categories and definition of the system stiffness characteristics.
REFERENCES1. Bailey, M., Wong, B., and Lawrence, J., “Data and Methods for
Estimating the Severity of Minor Impacts,” SAE Technical Paper 950352, 1995, doi:10.4271/950352.
2. Brach, R., “Modeling of Low-Speed, Front-to-Rear Vehicle Impacts,” SAE Technical Paper 2003-01-0491, 2003, doi:10.4271/2003-01-0491.
3. Carpenter, N. and Welcher, J., “Stiffness and Crush Energy Analysis for Vehicle Collision and its Relationship to Barrier Equivalent Velocity (BEV),” SAE Technical Paper 2001-01-0500, 2001, doi:10.4271/2001-01-0500.
4. Cipriani, A., Bayan, F., Woodhouse, M., Cornetto, A. et al., “Low Speed Collinear Impact Severity: A Comparison Between Full Scale Testing and Analytical Prediction Tools with Restitution Analysis,” SAE Technical Paper 2002-01-0540, 2002, doi:10.4271/2002 01 0540.
5. Campbell, K., “Energy Basis for Collision Severity,” SAE Technical Paper 740565, 1974, doi:10.4271/740565.
6. Happer, A., Hughes, M., Peck, M., and Boehme, S., “Practical Analysis Methodology for Low Speed Vehicle Collisions Involving Vehicles with Modern Bumper Systems,” SAE Technical Paper 2003-01-0492, 2003, doi:10.4271/2003-01-0492.
7. Ojalvo, I., Weber, B., Evensen, D., Szabo, T. et al., “Low Speed Car Impacts with Different Bumper Systems: Correlation of Analytical Model with Tests,” SAE Technical Paper 980365, 1998, doi:10.4271/980365.
8. Scott, W., Bain, C., Manoogian, S., Cormier, J. et al., “Simulation Model for Low-Speed Bumper-to-Bumper Crashes,” SAE Int. J. Passeng. Cars - Mech. Syst. 3(1):21-36, 2010, doi:10.4271/2010-01-0051.
9. Scott, W., Bonugli, E., Guzman, H., and Swartzendruber, D., “Reconstruction of Low-Speed Crashes using the Quasi-Static Force vs. Deformation Characteristics of the Bumpers Involved in the Crashes,” SAE Int. J. Passeng. Cars - Mech. Syst. 5(1):592-611, 2012, doi:10.4271/2012-01-0598.
10. Strother, C., Woolley, R., James, M., and Warner, C., “Crush Energy in Accident Reconstruction,” SAE Technical Paper 860371, 1986, doi:10.4271/860371.
11. Struble, D., Welsh, K., and Struble, J., “Crush Energy Assessment in Frontal Underride/Override Crashes,” SAE Technical Paper 2009-01-0105, 2009, doi:10.4271/2009-01-0105.
12. Thompson, R.W. and Romily, D.P. “Simulation of Bumpers During Low Speed Impacts”, Proceeding of the Canadian Multidisciplinary Road Safety Conference III. Saskatoon, Saskatchewan, Canada, 1993.
Bonugli et al / SAE Int. J. Trans. Safety / Volume 2, Issue 2 (July 2014)
Case 2:15-cv-02123-SM-DEK Document 94-1 Filed 06/23/16 Page 10 of 19

CONTACT INFORMATIONEnrique BonugliBiodynamic Research Corporation5711University Heights Blvd., Suite 107San Antonio, Texas 78249Phone: (210) 691-0281Fax: (210) [email protected]
ACKNOWLEDGMENTSThe authors acknowledge the work of BRC's Research Test Center who performed all of the force deflection tests.
Bonugli et al / SAE Int. J. Trans. Safety / Volume 2, Issue 2 (July 2014)
Case 2:15-cv-02123-SM-DEK Document 94-1 Filed 06/23/16 Page 11 of 19

APPENDIX
ALGORITHM FOR THE IMPACT SIMULATION MODEL BY SCOTT ET AL.The numerical simulation starts at t=0 (j=1) with the vehicles in contact and the initial conditions required are vehicle speeds (V1,1,V2,1), and the center of mass positions (X1,1,X2,1) along the line the vehicles are traveling. Since the vehicles are in contact but not deformed the undeformed distance (UD) between the two centers of mass is
At the first time position A1,1 = A2,1=0, and the vehicles move forward through the first time step at their initial velocities and the velocities at the second time position (j=2) are the same as the initial conditions, V1,1=V1,2 and V2,1= V2,2. At the second time position the vehicles' center of mass positions are
This movement of the centers of mass of each vehicle creates an overlap of the vehicles, and the deformation (Dj) at the second and following time positions (j=>2) is
The impact force Fi,j that acts on each vehicle during the jth time step (j>=2) is based on the input IF-D function and Newton's Third Law,
The force Fi,j (i=1,2) acts on the vehicles during the jth time step where j>=2. Newton's Second Law is used to calculate the acceleration of each vehicle during the jth time step,
The impact forces accelerate the vehicles over the jth time step. The time position is incremented, j = j+1, and the velocities at the new time position j are calculated,
The algorithm then checks to see if the vehicles have reached a common velocity. If the vehicles have reached a common velocity Function (Dj) is changed to represent the rebound phase of the input IF-D function. The simulation then calculates the vehicle center of mass positions at the new time position,
The simulation then recalculates the variables and continues to move forward in time until Fi,j (i=1,2) reaches zero and the crash is over.
Bonugli et al / SAE Int. J. Trans. Safety / Volume 2, Issue 2 (July 2014)
Case 2:15-cv-02123-SM-DEK Document 94-1 Filed 06/23/16 Page 12 of 19
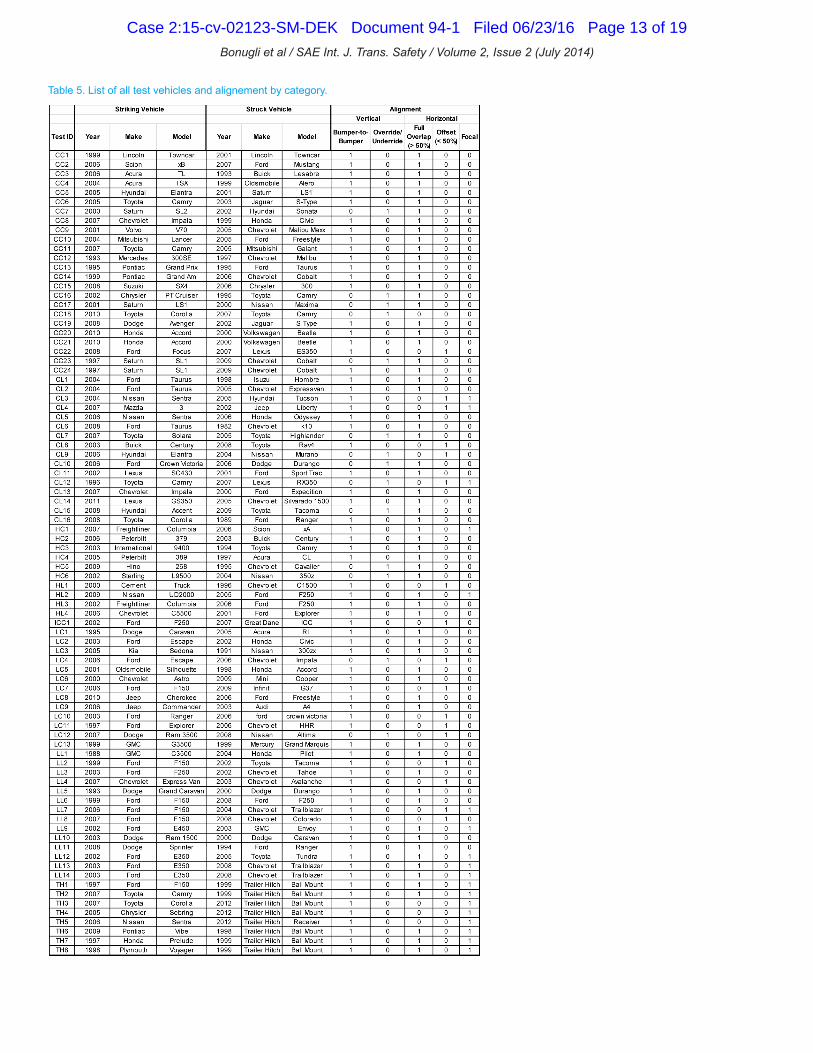
Table 5. List of all test vehicles and alignement by category.
Bonugli et al / SAE Int. J. Trans. Safety / Volume 2, Issue 2 (July 2014)
Case 2:15-cv-02123-SM-DEK Document 94-1 Filed 06/23/16 Page 13 of 19
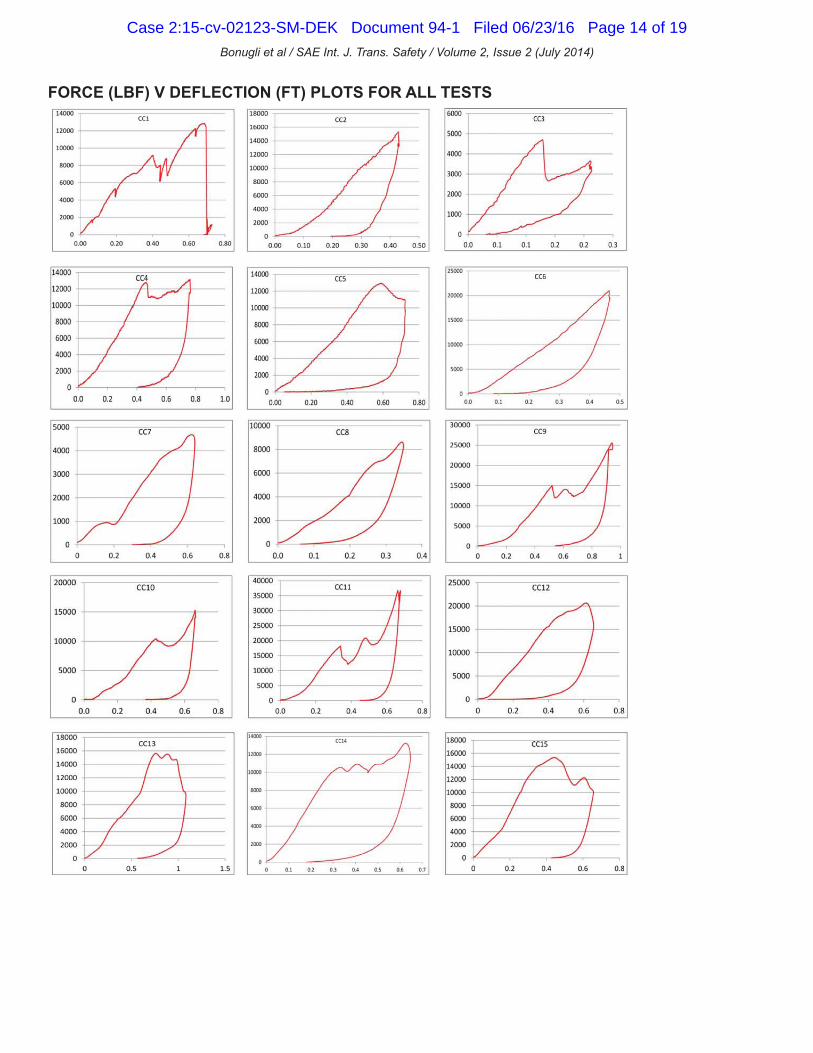
FORCE (LBF) V DEFLECTION (FT) PLOTS FOR ALL TESTS
Bonugli et al / SAE Int. J. Trans. Safety / Volume 2, Issue 2 (July 2014)
Case 2:15-cv-02123-SM-DEK Document 94-1 Filed 06/23/16 Page 14 of 19

Bonugli et al / SAE Int. J. Trans. Safety / Volume 2, Issue 2 (July 2014)
Case 2:15-cv-02123-SM-DEK Document 94-1 Filed 06/23/16 Page 15 of 19

Bonugli et al / SAE Int. J. Trans. Safety / Volume 2, Issue 2 (July 2014)
Case 2:15-cv-02123-SM-DEK Document 94-1 Filed 06/23/16 Page 16 of 19

Bonugli et al / SAE Int. J. Trans. Safety / Volume 2, Issue 2 (July 2014)
Case 2:15-cv-02123-SM-DEK Document 94-1 Filed 06/23/16 Page 17 of 19

Bonugli et al / SAE Int. J. Trans. Safety / Volume 2, Issue 2 (July 2014)
Case 2:15-cv-02123-SM-DEK Document 94-1 Filed 06/23/16 Page 18 of 19
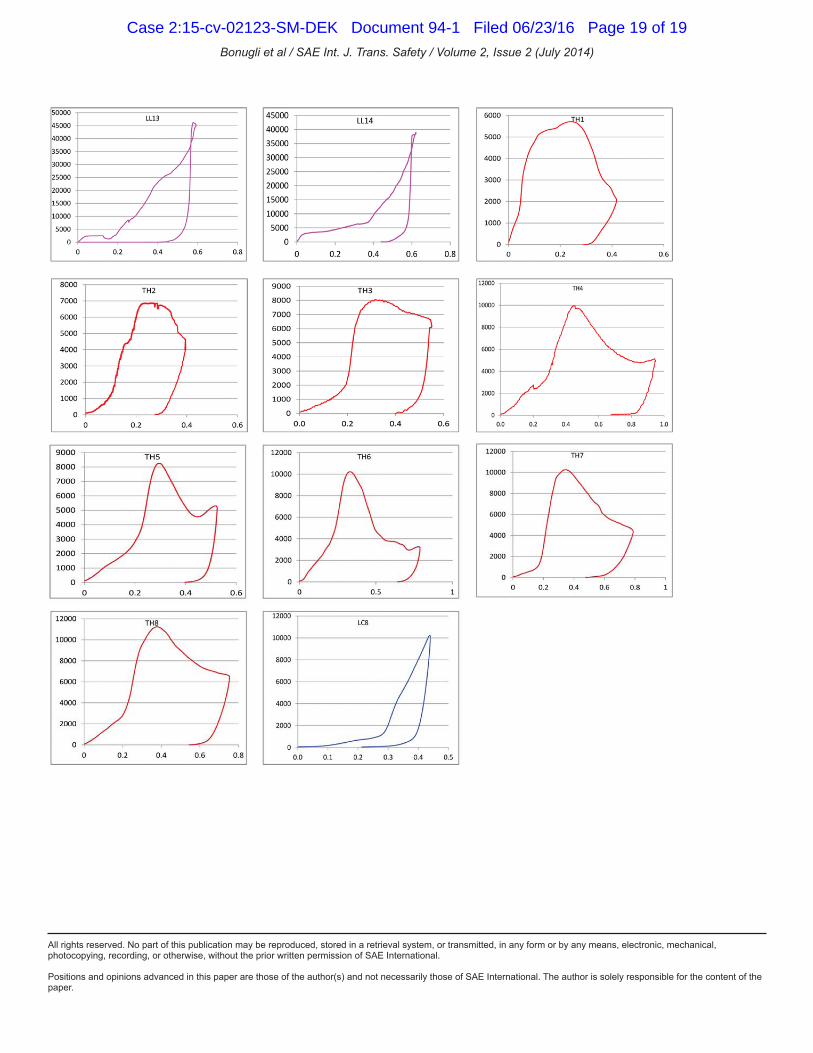
All rights reserved. No part of this publication may be reproduced, stored in a retrieval system, or transmitted, in any form or by any means, electronic, mechanical, photocopying, recording, or otherwise, without the prior written permission of SAE International.
Positions and opinions advanced in this paper are those of the author(s) and not necessarily those of SAE International. The author is solely responsible for the content of the paper.
Bonugli et al / SAE Int. J. Trans. Safety / Volume 2, Issue 2 (July 2014)
Case 2:15-cv-02123-SM-DEK Document 94-1 Filed 06/23/16 Page 19 of 19

50th ANNUAL PROCEEDINGS ASSOCIATION FOR THE ADVANCEMENT OF AUTOMOTIVE MEDICINE
October 16-18, 2006
INCIDENCE OF THORACIC AND LUMBAR SPINE INJURIES FOR RESTRAINED OCCUPANTS IN FRONTAL COLLISIONS Darrin Richards, M.S., P.Eng.1
Michael Carhart, Ph.D. 1,2
Christine Raasch, Ph.D. 1
Janine Pierce, M.S. 1
Duane Steffey, Ph.D. 3
Andrew Ostarello, M.S. 3
1Exponent Failure Analysis Associates Phoenix, Arizona 2Harrington Department of Bioengineering Arizona State University Tempe, Arizona 3Exponent Failure Analysis Associates Menlo Park, California ABSTRACT
The increased utilization of three-point restraint systems has greatly reduced the incidence of spinal injuries in motor vehicle accidents. Nevertheless, several studies which rely upon the National Automotive Sampling System (NASS) have documented lower thoracic and upper lumbar fractures in restrained occupants involved in frontal collisions of moderate severities. Although it has been postulated that the injury mechanism may be related to the occupant being out-of-position or sitting in an unusual posture, conclusions with regard to the precise mechanism of injury are difficult due to the lack of information contained in the NASS database. In addition, previous studies have not reported statistical significance of these injuries. In this study, we combined statistical analysis of frontal collisions in the NASS database with the analysis of data acquired from sled and crash tests, which utilized anthropomorphic test devices (ATDs), in order to evaluate the incidence and potential injury mechanisms underlying thoracic and lumbar spine fractures in moderate frontal impacts. In the first portion of the study, we performed a statistical analysis of the NASS database to estimate the incidence rate of spinal fracture. This was complemented with measurements and analysis of lumbar spine load data derived from frontal sled and crash tests. Analysis of the NASS database demonstrated that thoracolumbar spinal injuries are rare
Case 2:15-cv-02123-SM-DEK Document 94-2 Filed 06/23/16 Page 1 of 15

when an occupant is restrained by a lap and shoulder belt, and are often accompanied by abdominal injury. The spinal loads measured during frontal impacts with restrained and nominally positioned ATDs were found to be well below injury thresholds. Our results also suggest that the potential for isolated fracture is increased when the geometry of occupant-to-restraint interaction is compromised, as occurs when an occupant submarines the lap belt. INTRODUCTION
It is widely accepted that three-point restraint systems greatly reduce the number and severity of injuries in frontal collisions. However, case studies derived from entries in the NASS database and other crash injury databases (Huelke et al., 1995) have identified a number of cases where lap and shoulder belt restrained occupants sustained thoracic and lumbar spine fracture or dislocation in frontal collisions of moderate severity. Similar findings have been reported by Ball et al. (2000), who conducted a retrospective chart review at a regional spinal cord injury center and identified a number of cases where three-point restrained occupants sustained thoracolumbar fracture in frontal impacts. While the latter study did not involve an assessment of collision severity, the majority of the injuries involved a lower thoracic or upper lumbar burst fracture. Additionally, Miniaci and McLaren (1989) provided a collection of 4 case reports, wherein lap-shoulder belted occupants sustained an anterolateral wedge compression fracture of a thoracolumbar vertebra with lateral compression occurring on the side opposite the restrained shoulder. What is unclear from the case reports described above is the prevalence of thoracolumbar injury in three-point restrained occupants in frontal impacts, and the collision severities at which such injuries occur.
In this study, we combined statistical analysis of the NASS database with the analysis of data acquired from sled and crash tests in order to evaluate the incidence of thoracolumbar spine injuries amongst three-point restrained occupants in frontal impacts. Previous authors (Miniaci and McLaren, 1989, Huelke et al. 1995; Ball et al. 2000) reported incidents of thoracolumbar injuries occurring in cases where occupants were restrained only by three-point belts. Considering the prevalence of airbags in the modern vehicle fleet, we also conducted a NASS analysis of occupants restrained by three point belts supplemented by airbags.
In the first portion of the study, frontal collision cases were identified from the 1995 to 2004 NASS database where occupants sustained thoracic and/or lumbar AIS 2+ and 3+ injuries while
126
Case 2:15-cv-02123-SM-DEK Document 94-2 Filed 06/23/16 Page 2 of 15

restrained: (a) by a three-point belt (no airbag), or (b) by a three-point belt and deployed airbag. The incidence rate of these injuries was quantified, and accompanying abdominal injuries were identified. In the second portion of the study, experimental data from automobile crash and sled testing performed at Exponent was analyzed in order to quantify the loads present in the lower spine during frontal automobile collisions. The Hybrid III 50th-percentile-male ATD, which is widely accepted for use in frontal crash tests, was utilized in this testing.
METHODS
NASS DATABASE – NASS was developed in 1979 by the National Center for Statistics and Analysis (NCSA), part of the National Highway Traffic Safety Administration (NHTSA), as an investigative tool to aid in the reduction of motor vehicle crashes, injuries, and deaths on U.S. highways.
NASS is composed of the Crashworthiness Data System (CDS) and the General Estimates System (GES), both of which acquire data from police accident reports in randomly selected counties and cities comprising a representative segment of the United States. The CDS data specifically focuses on passenger vehicle crashes and the investigation of injury mechanisms, and contains detailed data on thousands of automobile crashes of varying severity. CDS researchers input data on approximately 5000 passenger vehicle crashes per year, and over 140,000 crashes have been included into the CDS system since its inception. CDS researchers obtain scene and accident data, inspect vehicles, document vehicle damage, estimate vehicle Delta-Vs, interview vehicle occupants, review occupants’ medical records, and classify the nature and severity of occupants’ injuries. All of these variables are coded and entered into the NASS CDS database (NASS, 2005).
Since it is not practical for researchers to investigate all automobile accidents, NASS uses an unequal probability selection procedure to obtain a sample of accidents to be included in the database. A simple random sample of all accidents would not provide effective statistics since it would result in a large percentage of low speed crashes with few injuries, since these types of crashes make up a large portion of all crashes. Instead, a weighting factor is assigned to crashes, which increase or decrease the probability of selection for inclusion in the NASS CDS database. All accidents reported in the NASS CDS database have an associated weighting factor, which can be used for statistical analysis. By using this
127
Case 2:15-cv-02123-SM-DEK Document 94-2 Filed 06/23/16 Page 3 of 15

sampling methodology the NASS CDS database is able to provide effective data across a wide range of accident severities and types.
The NASS CDS database uses the Abbreviated Injury Scale (AIS) coding system [AAAM, 1998] to classify all occupant injuries, and can record up to 10 injury entries for each occupant. Per AIS, all injuries are classified into nine body regions: head, face, neck, thorax, abdomen, spine, upper extremity, lower extremity, and unspecified. The injuries are further classified by severity, ranging in scale from 1 (minor) to 6 (currently untreatable).
The NASS CDS database from 1995-2004 was initially queried for all frontal collisions that were not preceded or followed by an additional harmful event (i.e., a vehicle-to-vehicle collision, vehicle-to-object collision, rollover, etc.). Frontal collisions were defined as a collision where the principal direction of force (PDOF) ranged between –30º and +30º. This frontal collision subset was then surveyed for front seat occupants, restrained by a lap and shoulder belt, who sustained thoracic and/or lumbar spine injuries. This query searched specifically for all AIS codes referencing injury to the thoracic or lumbar spine with a score of 2 or higher, excluding skin lacerations and lumbar nerve root injuries. The same frontal collision subset was also surveyed for front seat occupants restrained by three-point belts and deployed airbags.
The risk of injury to the occupant was assessed using the AIS injury classifications, and was evaluated in terms of an occupant sustaining at least moderate (AIS 2+) or serious (AIS 3+) injury.
CRASH TEST DATA – A total of eight vehicle-to-vehicle and sled tests, producing rearward occupant compartment Delta-Vs up to 22.9 kph, were performed. For all tests, a Hybrid III 50th-percentile-male ATD was used. The ATD had a stature of 1.7m, a weight of 78 kg, and was equipped with a seated pelvis. The sled and vehicle-to-vehicle crash tests involved ATDs restrained by lap and shoulder belts only (no airbags were deployed.) For all tests, the ATD instrumentation included a 3-channel lumbar load cell capable of measuring forces in the x and z direction as well as the moment about the y-axis. Lap and shoulder belt loads were also measured. The tests were documented using high-speed and real-time video, and still photographs.
Vehicle-To-Vehicle Tests – Six crash tests were performed in two configurations using similar 1983 Nissan Pulsar NXs (Figure 1, Table 1). Four of the six crash tests were performed with a full contact front-to-rear impact configuration, with the longitudinal centerlines of the bullet and target vehicles aligned. This configuration was run at bullet vehicle speeds of 9, 16, 24, and 33 kph. An angled contact front-to-rear impact configuration was
128
Case 2:15-cv-02123-SM-DEK Document 94-2 Filed 06/23/16 Page 4 of 15

utilized for the two remaining crash tests, with the target vehicle rotated 10 degrees counterclockwise from the aligned position. The angled configuration tests were conducted at bullet vehicle speeds of 6 and 16 kph. For all tests, the target vehicle was at rest prior to impact. Each vehicle was instrumented with two triaxial accelerometers mounted on the rocker panel at the left and right B-pillars. The Hybrid III 50th-percentile male ATD was positioned in the driver’s seat of the vehicle and secured with the available three-point restraint.
In each test the available three-point restraint system was properly utilized. The lap belt was routed over the ATD’s rigid pelvis area, and the shoulder belt was routed across the chest and over the left shoulder. Table 1 Summary of vehicle-to-vehicle crash tests.
Bullet Vehicle
Impact Speed (kph) Delta-V (kph) Impact Configuration 8.8 6.4 Full-Contact
16.3 10.4 Full-Contact 23.7 14.4 Full-Contact 32.8 18.7 Full-Contact 5.8 5.6 Angled-Contact
16.3 9.9 Angled-Contact
Figure 1 Photograph illustrating pre-impact positioning of ATD in vehicle-to-vehicle tests.
129
Case 2:15-cv-02123-SM-DEK Document 94-2 Filed 06/23/16 Page 5 of 15

Sled Tests – Two additional sled tests were performed using a Seattle Safety sled with a wire-bending decelerator (Table 2). Sled deceleration was recorded for all tests. A late-model production seat was mounted to the sled top plate, as shown in Figure 2. A Hybrid III 50th-percentile male ATD was positioned in the seat and secured with a three-point restraint that was mounted in accordance with restraint geometry measured in an exemplar vehicle.
Table 2 Summary of sled tests.
Delta-V (kph) Peak Sled Accel. (g)
13.6 8.2 22.9 14.1
Figure 2 Photograph demonstrating the occupant, seat, and restraint configurations used in sled tests.
130
Case 2:15-cv-02123-SM-DEK Document 94-2 Filed 06/23/16 Page 6 of 15

RESULTS
NASS DATABASE – The data from the 1995-2004 NASS CDS database consisted of 9262 front seat occupants involved in frontal collisions who were restrained by three-point belts (no airbags) and 4887 occupants restrained with three-points belts and deployed airbags Analysis of the distribution of impact severities (Figure 3) indicates that 80% of these impacts occurred at Delta-Vs below 37 kph. Tables 3 and 4 report statistics for occupants restrained by: (a) three-point belts only, and (b) three-point belts and airbags, respectively (Unrestrained and lap-belt only restraint conditions, as well as unknown impact severities were not included).
Of the three-point restrained occupants, 82 sustained AIS 2+ thoracolumbar injury, and 13 sustained AIS 3+. Using the weighted data, the percentage of restrained occupants sustaining AIS 2+ and AIS 3+ injuries was computed across all severities (Figures 4 and 5). Since most modern vehicles are equipped with airbags, data for three-point restrained with airbag deployment (Table 4) was also plotted on Figures 4 and 5. As shown, injury rates for moderate (AIS 2+) thoracolumbar injury is less than 0.6% for severities up to 50 kph, but increases to 10.3% and 11.3%, respectively for three-point restrained and three-point restrained with airbag deployment at Delta-Vs greater than 60 kph. AIS 3+ thoracic and lumbar spine injury rates generally increased with increasing collision severity, but were less than 1% for both three-point restrained occupants and three-point restrained occupants with airbag deployment at all Delta-V levels.
0%
10%
20%
30%
40%
50%
60%
70%
80%
90%
100%
0 20 40 60 80 100 120
Delta V (kph)
Cum
ulat
ive
Perc
ent o
f Fro
ntal
Impa
cts
Figure 3 Cumulative percent of weighted front seat occupants involved in frontal collisions, sorted by Delta-V.
131
Case 2:15-cv-02123-SM-DEK Document 94-2 Filed 06/23/16 Page 7 of 15
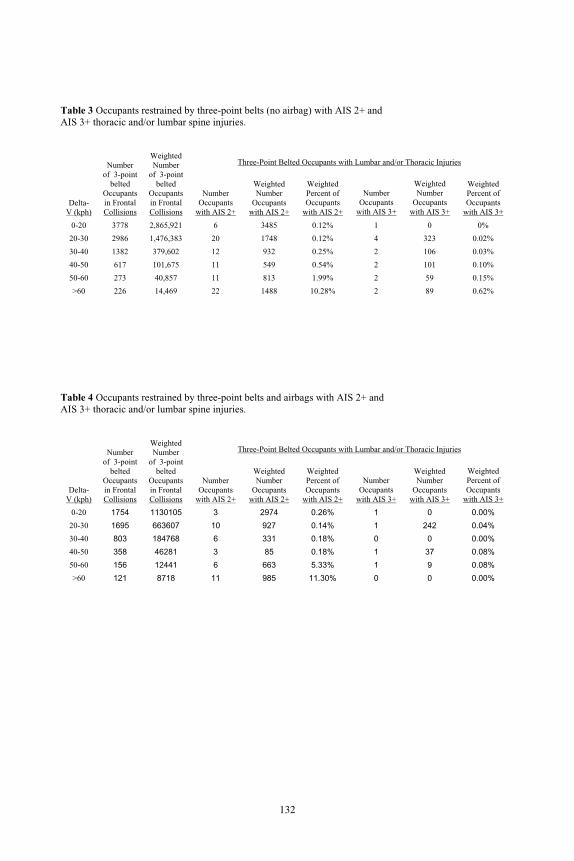
Table 3 Occupants restrained by three-point belts (no airbag) with AIS 2+ and AIS 3+ thoracic and/or lumbar spine injuries.
Three-Point Belted Occupants with Lumbar and/or Thoracic Injuries
Delta-V (kph)
Number of 3-point
belted Occupants in Frontal Collisions
Weighted Number
of 3-point belted
Occupants in Frontal Collisions
Number Occupants
with AIS 2+
Weighted Number
Occupants with AIS 2+
Weighted Percent of Occupants
with AIS 2+
Number Occupants
with AIS 3+
Weighted Number
Occupants with AIS 3+
Weighted Percent of Occupants
with AIS 3+
0-20 3778 2,865,921 6 3485 0.12% 1 0 0%
20-30 2986 1,476,383 20 1748 0.12% 4 323 0.02%
30-40 1382 379,602 12 932 0.25% 2 106 0.03%
40-50 617 101,675 11 549 0.54% 2 101 0.10%
50-60 273 40,857 11 813 1.99% 2 59 0.15%
>60 226 14,469 22 1488 10.28% 2 89 0.62%
Table 4 Occupants restrained by three-point belts and airbags with AIS 2+ and AIS 3+ thoracic and/or lumbar spine injuries.
Three-Point Belted Occupants with Lumbar and/or Thoracic Injuries
Delta-V (kph)
Number of 3-point
belted Occupants in Frontal Collisions
Weighted Number
of 3-point belted
Occupants in Frontal Collisions
Number Occupants
with AIS 2+
Weighted Number
Occupants with AIS 2+
Weighted Percent of Occupants
with AIS 2+
Number Occupants
with AIS 3+
Weighted Number
Occupants with AIS 3+
Weighted Percent of Occupants
with AIS 3+
0-20 1754 1130105 3 2974 0.26% 1 0 0.00%
20-30 1695 663607 10 927 0.14% 1 242 0.04%
30-40 803 184768 6 331 0.18% 0 0 0.00%
40-50 358 46281 3 85 0.18% 1 37 0.08%
50-60 156 12441 6 663 5.33% 1 9 0.08%
>60 121 8718 11 985 11.30% 0 0 0.00%
132
Case 2:15-cv-02123-SM-DEK Document 94-2 Filed 06/23/16 Page 8 of 15

Figure 4 Percentage of three-point belted occupants with moderate or greater (AIS 2+) thoracic and/or lumbar spine injuries as a function of collision severity, separated by the presence or absence of a deployed airbag.
Figure 5 Percentage of three-point belted occupants with serious or greater (AIS 3+) thoracic and/or lumbar spine injuries as a function of collision severity, separated by the presence or absence of a deployed airbag.
AIS 2+
0%
5%
10%
15%
20%
0-20 20-30 30-40 40-50 50-60 >60
Delta V (kph)
Perc
enta
ge (%
)3-Point Belted3-Point Belted and Airbag
AIS 3+
0%
1%
2%
3%
4%
5%
0-20 20-30 30-40 40-50 50-60 >60
Delta V (kph)
Perc
enta
ge (%
)
3-Point Belted3-Point Belted and Airbag
133
Case 2:15-cv-02123-SM-DEK Document 94-2 Filed 06/23/16 Page 9 of 15

Additional analysis was performed to evaluate the percentage of occupants restrained by the three-point belts (no airbag) who sustained moderated or greater (AIS 2+) thoracolumbar injury and also sustained moderate or greater abdominal injury (Figure 6). Overall, 35% of occupants with moderate or greater thoracolumbar injury also sustained moderate or greater abdominal injuries. For Delta-Vs in the range of 20-30 kph and over 60 kph, this percentage was over 50%.
AIS 2+ Abdominal Injuries
0%
10%
20%
30%
40%
50%
60%
0-20 20-30 30-40 40-50 50-60 >60
Delta V (kph)
Perc
enta
ge (%
)
Figure 6 Percentage of three-point belted (no airbag) occupants who also sustained AIS 2+ abdominal injuries (of those with AIS 2+ thoracic and lumbar spinal injuries).
CRASH TEST DATA – The data plotted in Figures 7 and 8 is a compilation of the lumbar load cell data from the sled and crash tests. As shown in these summary figures, the peak lumbar compression loads exhibited a maximum value of 882 N at 13.6 kph, and then leveled off with further increases in impact severity. Lumbar flexion moment, on the other hand, exhibited a linear increase (R2 = 0.8) with increasing collision severity.
134
Case 2:15-cv-02123-SM-DEK Document 94-2 Filed 06/23/16 Page 10 of 15
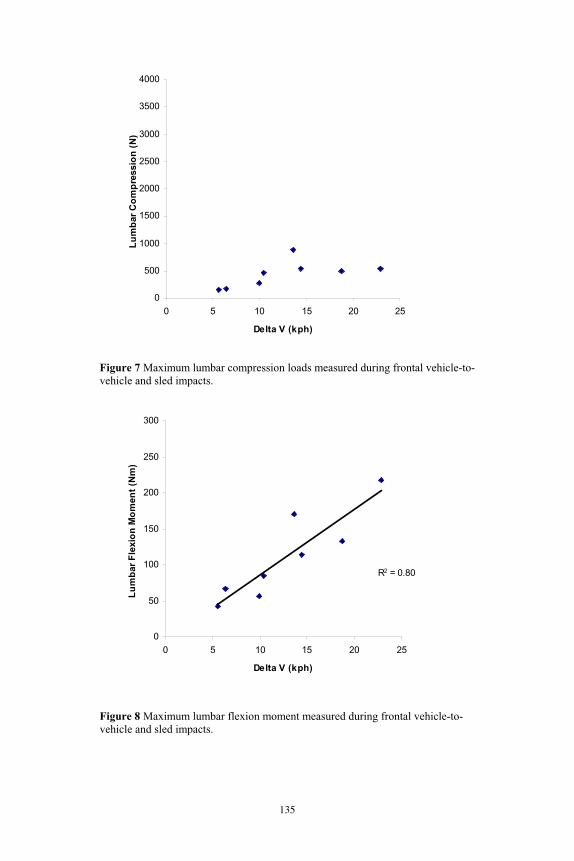
Figure 7 Maximum lumbar compression loads measured during frontal vehicle-to-vehicle and sled impacts.
Figure 8 Maximum lumbar flexion moment measured during frontal vehicle-to-vehicle and sled impacts.
0
500
1000
1500
2000
2500
3000
3500
4000
0 5 10 15 20 25
Delta V (kph)
Lum
bar C
ompr
essi
on (N
)
R2 = 0.80
0
50
100
150
200
250
300
0 5 10 15 20 25
Delta V (kph)
Lum
bar F
lexi
on M
omen
t (N
m)
135
Case 2:15-cv-02123-SM-DEK Document 94-2 Filed 06/23/16 Page 11 of 15

DISCUSSION
Previous studies (Ball et al., 2000; Huelke et al., 1995) have identified incidents of three-point restrained occupants sustaining thoracolumbar spine injuries in frontal collisions. In this study, a survey of the 1995-2004 NASS database also revealed incidents of thoracolumbar injuries in three-point belted occupants involved in frontal collisions; however, statistical analysis showed the rate of this occurrence to be quite low. At Delta-Vs of less than 50 kph, moderate or greater (AIS 2+) thoracolumbar spinal injuries occurred less than 0.6% of the time for both three-point restrained occupants and three-point restrained occupants with airbag deployment. Only at higher Delta-Vs was the incidence rate significant. At Delta-Vs of greater than 60 kph, the incidence rate increased to 10.3% for three-point restrained occupants and 11.3% for three-point restrained occupants with airbag deployment. Serious or greater (AIS 3+) injuries were exceedingly rare in collisions with Delta-Vs of less than 60 kph, as illustrated in Figure 5. For three-point restrained occupants, the rate of AIS 3+ injuries was less than 1% at all Delta-V levels, regardless of whether or not the three-point restraint was supplemented by airbag deployment.
Schmidt et al. (1975) and Kallieris et al. (1991) performed numerous frontal impact tests at 30 to 50 kph and 30 to 60 kph, respectively, which provide some insight into the increased incidence of moderate thoracic injuries (AIS 2) at Delta-Vs above 50 kph and particularly above 60 kph. In these tests, restrained cadaver occupants sustained injuries to the cervical and thoracic spine from the C1 to T4 levels; lower thoracic and lumbar injuries were not evaluated. Kallieris et al. (1991) reported the highest incidence of injury was at T1 and T2, with 46% of the vertebral column injuries classified as moderate or greater severity (AIS 2+). Unfortunately, the authors did not break down results by severity of impact.
Begeman et al. (1973) conducted a series of moderate severity sled tests using cadavers wherein strains were measured in the thoracolumbar spine, and vertical compressive forces acting along the spine were documented. In all, 40 runs were performed on 3 cadavers, with each cadaver sustaining wedging or compression fractures of the thoracolumbar spine. These investigators postulated that in frontal collisions, the curvature of the spine may result in high compressive loads in the thoracic and lumbar region. However, these tests were run with a non-automotive seat and double shoulder belts, which were horizontal as they passed over the shoulder. The non-conventional seats and belt configuration may have caused a
136
Case 2:15-cv-02123-SM-DEK Document 94-2 Filed 06/23/16 Page 12 of 15

wedging of the cadaver spine, resulting in higher than usual loads during these tests.
In contrast, our study used standard automobile seats and replicated true automobile restraint geometries. Experimental data from this series of automobile crash and sled tests at Delta-Vs ranging from 5.6 to 22.9 kph was analyzed. The maximum compressive load observed across the range of severities investigated was 882 N. For comparison, Willen et al. (1984) evaluated the strength of the L1 vertebrae under dynamic loading conditions, and identified a load level for fracture of 6000 to 10,000 N. These tolerance values are consistent with lumbar compressive strengths as collated from the literature by Jager and Luttman (1992), who indicated a mean compressive tolerance at age 40 of 6700 N for males and 4700 N females. The loads observed in our test series are also well below the 3400 N compression limit which is referenced by NIOSH in setting a Recommended Weight Limit for safe occupational lifting (Waters et al., 1993). Furthermore, biomechanical modeling studies, such as Chaffin and Page (1994), have demonstrated that loads well above 3400 N can be tolerated during lifting activities without injury.
As outlined previously, several authors have presented case studies where occupants have sustained injuries concentrated at the lower thoracic and upper lumbar spine. Although the Hybrid III ATD provides a single point load measurement at approximately the L-4 level, we anticipate this fairly captures the nature and magnitude of loading in the lumbar spine and provides a bound for the magnitude of loads in the lower thoracic spine. While this crash test series is limited to just two different productions of seats and lap-shoulder restraint geometries, it demonstrates that significant axial compression of the lower spine is not expected to occur in low-to-moderate severity frontal impacts for a properly restrained occupant, a position which is decisively confirmed by field data. Figure 7 indicates that the compressive lumbar loads do not continue their upward trend at the higher severities evaluated. It is postulated that increased forward torso motion and phase differences between the pelvic and torso restraint, associated with higher severities results in less compression in the lumbar spine.
Maximum flexion moments in the lumbar spine increased approximately linearly with increasing impact severity in this test series (Figure 8). However, even at the highest impact severities evaluated, the peak lumbar flexion moments were less than those that can be generated in the lower back during static and dynamic bi-manual lifting (approximately 300 Nm, Jager and Luttmann, 1992).
137
Case 2:15-cv-02123-SM-DEK Document 94-2 Filed 06/23/16 Page 13 of 15

Nevertheless, our study of the NASS database did reveal a number of cases where thoracolumbar injuries were sustained at moderate Delta-Vs. Analysis of the NASS data revealed a correlation between abdominal injuries and thoracolumbar injuries for three-point belted occupants. Figure 6 illustrates that as many as 51% of occupants with thoracolumbar injuries sustained moderate or greater (AIS 2+) abdominal injuries. For collision severities of 20 kph or greater, overall approximately 35% of the occupants sustained AIS 2+ abdominal injuries. These results are similar to Ball et al. (2000), who did a retrospective case study of 37 patients with thoracolumbar injuries involved in frontal impacts. He found that 27% of patients required a laparotomy, indicating abdominal injury, but he did not correlate his results to collision severity.
The relationship between abdominal injuries and thoracolumbar injuries is important because it may provide an indication that the lap belt loaded the abdomen rather than interacting with the bony pelvic region. Injury potential is increased when the restraint geometry is compromised, which suggests that these thoracolumbar injuries may be related to belt misuse. It is interesting that only a small percentage of abdominal injuries were seen below 20 kph. Belt loads at this collision severity may not have been high enough to cause AIS 2+ abdomen injuries even if worn improperly. CONCLUSIONS
Analysis of the NASS database indicates that AIS 2+ thoracolumbar injuries are rare during minor and moderate frontal collision severities when an occupant is restrained by a lap and shoulder belt with or without airbag deployment. The analysis shows that AIS 3+ injuries are exceedingly rare, demonstrating that these injuries represent an anomaly rather than the norm. NASS data further indicates that a large percentage of three-point restrained occupants sustained AIS 2+ abdominal injuries along with thoracolumbar spinal injuries, indicating that the occupant-to-restraint interaction was likely compromised. Frontal impact testing performed with properly restrained and nominally positioned ATDs revealed lumbar loads well below injury thresholds, and on par with those that can be generated during common lifting activities. The findings of this study indicate that thoracic and lumbar fractures are rare during minor and moderate frontal collisions when occupants are properly restrained with a three-point belt (no airbag) or with a three-point belt supplemented with an airbag.
138
Case 2:15-cv-02123-SM-DEK Document 94-2 Filed 06/23/16 Page 14 of 15

REFERENCES
1. Abbreviated Injury Scale – 1990 Revision, Update (1998) Association for the Advancement of Automotive Medicine, Des Plaines, IL.
2. Ball, S.T., Vaccaro, A.R., Albert, T.J., Cotler, J.M. Injuries of the Thoracolumbar Spine Associated with Restraint Use in Head-On Motor Vehicle Accidents. Journal of Spinal Disorders, Vol 13, No.4.
3. Begeman, P.C., King, A.I., Prasad, P. (1973) Spinal Loads Resulting from –Gx Acceleration. SAE 730977, Society of Automotive Engineers, Warrendale, PA.
4. Chaffin, D.B. and G.B. Page (1994). Postural Effects on Biomechanical and Psychophysical Weight-Lifting Limits, Ergonomics, Vol 37, No 4, 663-676.
5. Huelke, D.F., Mackay, G.M., Morris, A. (1995) Vertebral Column Injuries and Lap-Shoulder Belts. The Journal of Trauma: Injury, Infection, and Critical Care, Vol. 38, No. 4.
6. Jager, M. and Luttmann, A (1992). The load on the lumbar spine during asymmetrical bi-manual materials handling, Ergonomics, Vol 35, No 7/8, 783-805.
7. Kallieris, D., Mattern, R., Miltner, E., Schmidt, Gg., Stein, K. Considerations for a Neck Injury Criterion. SAE 912916, Society of Automotive Engineers, Warrendale, PA.
8. Mertz, H.J., Irwin, A.L., Prasad, P. (2003) Biomechanical and Scaling Bases for Frontal and Side Impact Injury Assessment Reference Values. Paper # 2003-22-0009, Stapp Car Crash Journal, Volume 14, October 2003.
9. Miniaci, A. and A. C. McLaren (1989). Anterolateral compression fracture of the thoracolumbar spine. A seat belt injury, Clin Orthop Relat Res (240): 153-6.
10. NASS brochure (2005) DOT HS 807 304 Rev. April 2005 11. Schmidt, G., Kallieris, D., Barz, J., Mattern, R., Klaiber, J. Neck
and Thorax Tolerance Levels of Belt-Protected Occupants in Head-On Collisions. SAE 751149, Society of Automotive Engineers, Warrendale, PA.
12. Waters, T.R., Putz-Anderson, V., Garg, A., Fine, L.J. (1993). Revised NIOSH Equation for the Design and Evaluation of Manual Lifting Tasks, Ergonomics, Vol 36, No 7, 749-776.
13. Willen, J., Lindahl, S., Irstam, L., Aldman, B., Nordwall, A. (1984). The Thoracolumbar Crush Fracture – An Experimental Study on Instant Axial Dynamic Loading: The Resulting Fracture Type and its Stability, Spine, Vol 9, No 6, 624-631.
139
Case 2:15-cv-02123-SM-DEK Document 94-2 Filed 06/23/16 Page 15 of 15