Embed Size (px)
Citation preview
United States Department of Agriculture
www.ers.usda.gov
A Report from the Economic Research Service
Kelsey Wittenberger, [email protected] Erik Dohlman, [email protected]
Peanut OutlookImpacts of the 2008-09 Foodborne Illness Outbreak Linked to Salmonella in Peanuts
AbstractBetween January and April 2009, a foodborne illness outbreak linked to Salmonella resulted in one of the largest food safety recalls ever in the United States. The source of the outbreak was linked to one peanut processor handling less than 2 percent of the U.S. peanut supply, but the scope of the recalls was magnified because the processed peanut products were used as ingredients in more than 3,900 products. Although consumer purchases of peanut-containing products initially slowed as the scope of the recalls spread, retail purchases returned to normal within several months and the total volume of peanuts processed during the 2008/09 (August-July) marketing year increased slightly from that of the previous year. These developments suggest that the recalls will not have a lasting impact on peanut demand and production.
Keywords: Peanuts, Salmonella, food safety
AcknowledgmentsThe authors are grateful to Mark Ash, Linda Calvin, Lewrene Glaser, Fred Kuchler, Janet Perry, Daniel Pick, and Greg Pompelli of the Economic Research Service for their insightful comments and suggestions on this report.We also appreciate the timely effort and helpful review comments made by Tiffany Arthur and Scott Sanford (Farm Service Agency) and Nathan Smith (University of Georgia).We extend gratitude to Linda Hatcher for excellent and precise editing and for support in preparing the manu-script for publication.
Contents
Approved by USDA’s World Agricultural
Outlook Board
Processed Peanut Recalls of 2009 Linked to Salmonella . . 2Background on the Peanut Industry . . . . . . . . . . 5Economic Implications of Peanut Product Recalls . . . . 8Current Issues in Food Safety That May Impact the Peanut Industry . . . . . . 12Conclusions . . . . . . . . . . . . . . . 13References . . . . . . . . . . . . . . . . 14Appendix 1. Investigations by the U.S. Food and Drug Administration of Peanut- Processing Plants Owned by the Peanut Corporation of America in 2009 . . . . . . . 17Appendix 2. Peanuts: Supply and Disappearance on a Shelled-Equivilant Basis, United States . . . . . . . . . . . . 18
OCS-10a-01 February 2010
2 Peanut Outlook: Impacts of the 2008-09 Foodborne Illness Outbreak Linked to Salmonella in Peanuts / OCS-10a-01
Economic Research Service/USDA
One of the Largest Food Recalls in U.S. History Is Linked to Processed PeanutsThe 2008-09 foodborne illness outbreak linked to processed peanuts caused one of the largest food recalls in U.S. history. From the time the Centers for Disease Control and Prevention (CDC)1 began tracking these outbreaks in November 2008 to the agency’s final report in April 2009, 714 cases of illness were linked to Salmonella Typhimurium and may have contributed to 9 deaths (CDC, 2009). The U.S. Food and Drug Administration (FDA) identified two peanut-processing plants owned by the Peanut Corporation of America (PCA) as the source of contamination. Both plants were primarily intermediary processors that sold ingredients to other companies. Most recalled products, such as cakes, candy, cookies, peanut crackers, and ice cream, contained peanut paste or peanut butter. Other products, including pet foods and snack mixes, contained blanched, granulated, or roasted peanuts. Some recalled products were produced in bulk and sold directly to institu-tions for use or repackaging. Total recalls involved more than 3,900 products from over 200 companies (CDC, 2009; FDA, 2009b).
The cost to consumers and producers from food safety recalls can be large. Direct costs from recalls were primarily borne by manufacturers of processed foods rather than by manufacturers typically associated with the peanut industry (such as shellers and peanut processors). U.S. peanut supplies were basically unaffected because recalled products contained less than 2 percent of the peanut supply. Nevertheless, sales of nearly all products containing peanuts declined temporarily as consumers waited for potentially harmful products to be identified and removed from store shelves. Initial data suggest that consumer purchases of products containing peanuts declined between January and February 2009 and returned to previous levels by April 2009 (Smith, 2009; The Nielsen Company, 2009a; The Nielsen Company, 2009b; The Nielson Company, 2009c; National Peanut Board, 2009).2
Foodborne Illnesses Affect a Wide Range of Products and Can be Difficult To TraceAn estimated 76 million cases of foodborne illness occur each year in the United States, causing approximately 325,000 hospitalizations and 5,000 deaths (CDC, 2005a). Local and State health departments investigate between 400 and 500 foodborne illness outbreaks each year (CDC, 2005a). These investigations often remain unresolved due to the difficulty of identi-fying and grouping cases of an outbreak within a short period. In some cases, especially at the start of an investigation, officials are only able to narrow the source of contamination to a particular commodity (such as strawberries) or a group of processors or producers (such as spinach produced in California).
When faced with a large multi-State outbreak and only partial information on the source of contamination, the CDC, along with other regulatory agencies, issues consumer warnings. Recent warnings have involved raw alfalfa sprouts
Processed Peanut Recalls of 2009 Linked to Salmonella
1The food safety role of CDC is primarily to monitor, investigate, and identify foodborne illness outbreaks. It is not a regulatory agency, but it works closely with regulators and health departments at the Federal, State, and local levels to gather information and coordinate communication about risks to the public.
2The authors did not have direct access to this retail scanner data. With access to more detailed data, a more refined analysis of consumer purchas-ing behavior by product type would be possible.
3 Peanut Outlook: Impacts of the 2008-09 Foodborne Illness Outbreak Linked to Salmonella in Peanuts / OCS-10a-01
Economic Research Service/USDA
(2009), raw jalapeño peppers and raw serrano peppers (2008), tomatoes (2008), and bagged spinach (2006). As an investigation progresses, regula-tors are often able to identify the source of contamination more precisely and target their control measures accordingly.
Events Surrounding the 2009 Recalls of Processed PeanutsCDC first noted a new outbreak of Salmonella Typhimurium3 on November 10, 2008, and worked with State and local partners to assess the outbreak. Preliminary analysis by CDC and public health officials in multiple States through January 4, 2009, suggested peanut butter as the likely source of the bacteria causing the infections (CDC, 2009). On January 8, 2009, the Minnesota Department of Health further identified the likely source as King Nut peanut butter. The next day, FDA4 initiated inspections at the processing plant that produced King Nut peanut butter, which was owned by the Peanut Corporation of America (PCA). For a timeline of FDA investigations of PCA processing facilities, see appendix 1.
On January 10, an opened 5-pound container of King Nut peanut butter tested positive for the outbreak strain of Salmonella. While it was possible that the peanut butter was contaminated after it was opened, PCA initiated a limited, voluntary recall of King Nut peanut butter. This brand was primarily sold in bulk containers to institutions rather than directly to consumers.
CDC issued 24 public reports about the foodborne disease outbreak from January 8, 2009, to March 16, 2009. CDC began reporting by citing specific recalls:5 on January 12, CDC issued a public announcement that King Nut peanut butter was the likely source of the outbreak; on January 13, CDC reported further recalls of peanut butter; and on January 16, recalls of peanut crackers were mentioned. However, after initial investigation of PCA’s processing plant in Blakely, GA, it became apparent that the recalls would be too numerous to communicate individually in CDC reports.
On January 17, CDC recommended that consumers “postpone eating other peanut butter containing products…until information became available about whether that product may be affected” (CDC, 2009). This report emphasized that major retail brands of peanut butter did not appear to be associated with the outbreak. Furthermore, this report referenced for the first time a stand-alone FDA website that detailed product recalls associated with peanuts. As this webpage was updated and improved, CDC reports shifted from listing recalled products to referencing product categories and providing a link for more specific information.
PCA, which was headquartered in Lynchburg, VA, processed peanuts in nine production facilities throughout the United States. PCA primarily sold bulk shipments to institutions (cafeterias, nursing homes, etc.) for direct use and to food manufacturers for use as an ingredient in processed foods. The first PCA plant to be investigated by FDA was located in Blakely, GA (appendix 1). Subsequently, several other PCA plants were investigated, and a second processing plant in Plainview, TX, also issued a recall. PCA faced extensive liability as a result of numerous lawsuits filed by consumers and their inter-mediaries and filed for chapter 7 bankruptcy on February 13, 2009.
3The bacteria Salmonella causes the disease salmonellosis in humans, and is the second most common identified foodborne illness for humans in the United States, causing approximately 40,000 cases of salmonellosis each year (CDC, 2008). Because many milder cases are not diagnosed or reported, the actual number of infections is likely much higher, with studies suggesting that less than 1 in 30 Salmonella cases are reported and identified by health professionals (Frenzen et al., 1999).
4FDA regulates about 80 percent of the U.S. food supply, with approximate-ly 2,700 food inspection staff through-out the United States responsible for the oversight of roughly 44,000 U.S. food manufacturers and 100,000 registered food facilities (Becker, 2009). Some of the foods in FDA’s purview include dairy products, produce, processed foods, food additives, animal feed, game and exotic meats, and veterinary drugs (Buzby et al., 2008). FDA does not regulate domestic and imported meats, poultry, and processed egg products that are otherwise inspected by USDA’s Food Safety and Inspection Service.
5All food safety recalls were volun-tary and issued by affected companies. FDA coordinated the release of this information, and CDC issued summary reports to more widely communicate this information to the public.
4 Peanut Outlook: Impacts of the 2008-09 Foodborne Illness Outbreak Linked to Salmonella in Peanuts / OCS-10a-01
Economic Research Service/USDA
The 2008-09 foodborne illness outbreak linked to Salmonella in peanuts caused one of the largest food recalls in U.S. history. National news media coverage was more sustained than usual due to the size of the recall and numerous updates. According to the final CDC report published on April 29, 2009, 714 cases of illness linked to Salmonella Typhimurium were confirmed, with 9 illnesses contributing to death.
Although peanuts processed by PCA accounted for at most 2 percent of the U.S. peanut supply, they led to the recall of over 3,900 products containing peanuts by more than 200 food manufacturing companies (CDC, 2009; FDA, 2009b). Recalled products containing peanut ingredients include brownies, cakes, pies, many types of candy, cereals, cookies, crackers, donuts, dressings and seasonings, prepared fruit and vegetable products, ice creams, peanut butter and products, pet foods, pre-packaged meals, snack bars, snack mixes, and toppings (FDA, 2009b).
5 Peanut Outlook: Impacts of the 2008-09 Foodborne Illness Outbreak Linked to Salmonella in Peanuts / OCS-10a-01
Economic Research Service/USDA
Although relatively small from the perspective of the overall farm economy, peanuts are an important crop in parts of the three main production regions: the Southeast (Georgia, Alabama, Florida, Mississippi, and South Carolina), the Southwest (Texas, Oklahoma, and New Mexico), and the Mid-Atlantic (Virginia and North Carolina). In 2007, 6,182 farms produced peanuts (U.S. Department of Agriculture (USDA), National Agricultural Statistics Service (NASS), 2009b). In 2008/09, production hit a record 5.1 billion pounds with a farm-gate value of $1.2 billion (USDA, NASS, 2009a).6
Peanut ProcessingThe peanut-processing industry is complex, with multiple transactions between firms occurring before the commodity reaches its final market. However, in terms of food safety, the peanut industry is easier to manage than many because peanuts are rarely sold fresh. Processors heat shelled and roasted peanuts to a high temperature, destroying much of the bacteria present. To date, regulation for the control of bacteria has focused on this processing step.
After harvest, raw peanuts are dried to prevent spoilage. USDA provides inspection and grading services, designed to segregate peanuts into edible and inedible classes and to determine quality premiums and producer prices. Often, raw peanuts are then stored in cold storage warehouses until they are further processed.
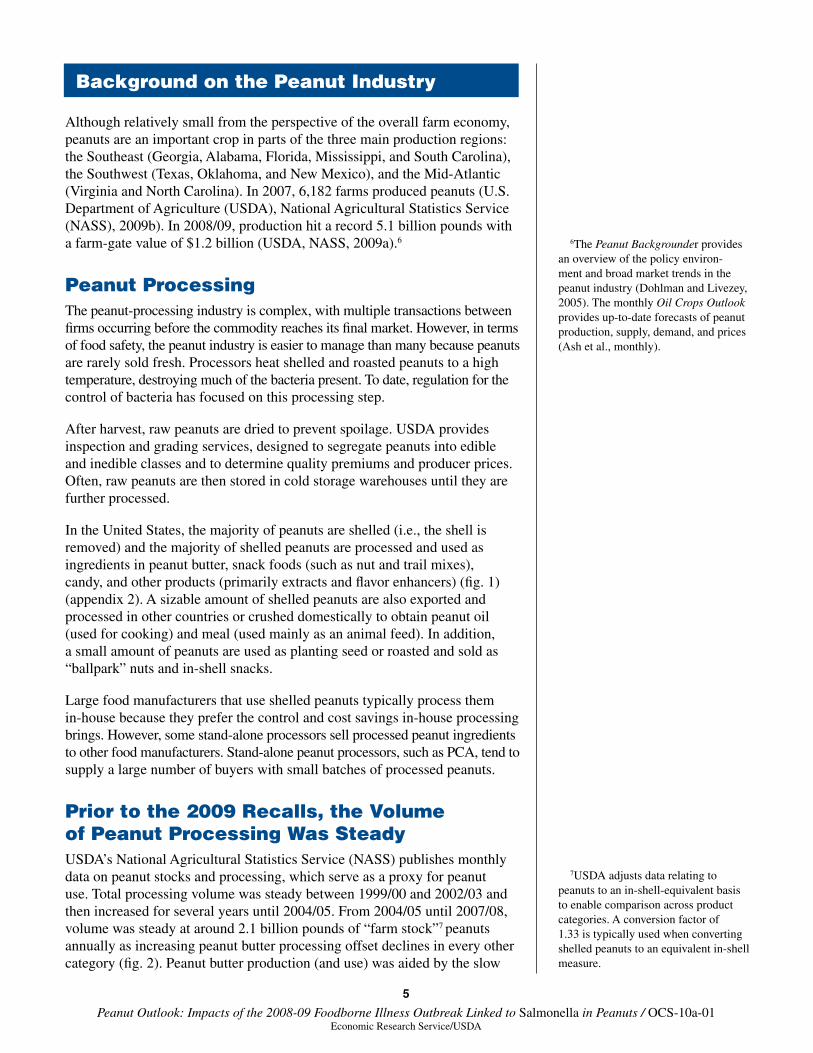
In the United States, the majority of peanuts are shelled (i.e., the shell is removed) and the majority of shelled peanuts are processed and used as ingredients in peanut butter, snack foods (such as nut and trail mixes), candy, and other products (primarily extracts and flavor enhancers) (fig. 1) (appendix 2). A sizable amount of shelled peanuts are also exported and processed in other countries or crushed domestically to obtain peanut oil (used for cooking) and meal (used mainly as an animal feed). In addition, a small amount of peanuts are used as planting seed or roasted and sold as “ballpark” nuts and in-shell snacks.
Large food manufacturers that use shelled peanuts typically process them in-house because they prefer the control and cost savings in-house processing brings. However, some stand-alone processors sell processed peanut ingredients to other food manufacturers. Stand-alone peanut processors, such as PCA, tend to supply a large number of buyers with small batches of processed peanuts.
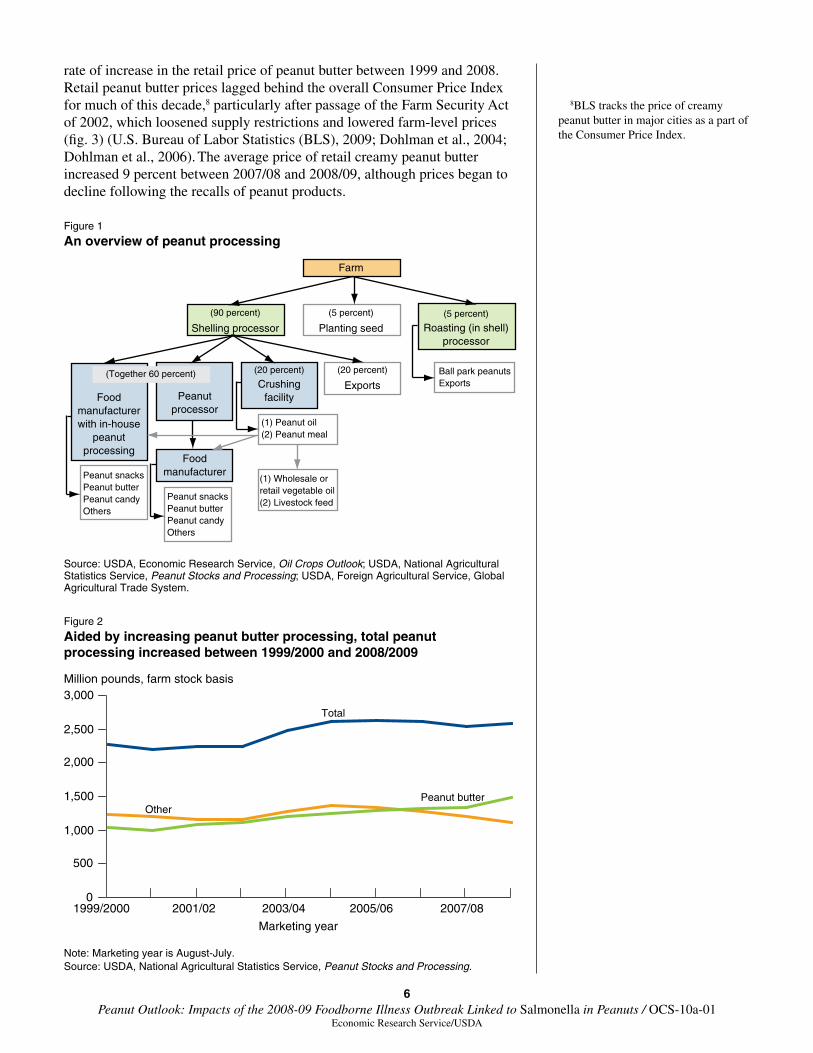
Prior to the 2009 Recalls, the Volume of Peanut Processing Was SteadyUSDA’s National Agricultural Statistics Service (NASS) publishes monthly data on peanut stocks and processing, which serve as a proxy for peanut use. Total processing volume was steady between 1999/00 and 2002/03 and then increased for several years until 2004/05. From 2004/05 until 2007/08, volume was steady at around 2.1 billion pounds of “farm stock”7 peanuts annually as increasing peanut butter processing offset declines in every other category (fig. 2). Peanut butter production (and use) was aided by the slow
Background on the Peanut Industry
6The Peanut Backgrounder provides an overview of the policy environ-ment and broad market trends in the peanut industry (Dohlman and Livezey, 2005). The monthly Oil Crops Outlook provides up-to-date forecasts of peanut production, supply, demand, and prices (Ash et al., monthly).
7USDA adjusts data relating to peanuts to an in-shell-equivalent basis to enable comparison across product categories. A conversion factor of 1.33 is typically used when converting shelled peanuts to an equivalent in-shell measure.
6 Peanut Outlook: Impacts of the 2008-09 Foodborne Illness Outbreak Linked to Salmonella in Peanuts / OCS-10a-01
Economic Research Service/USDA
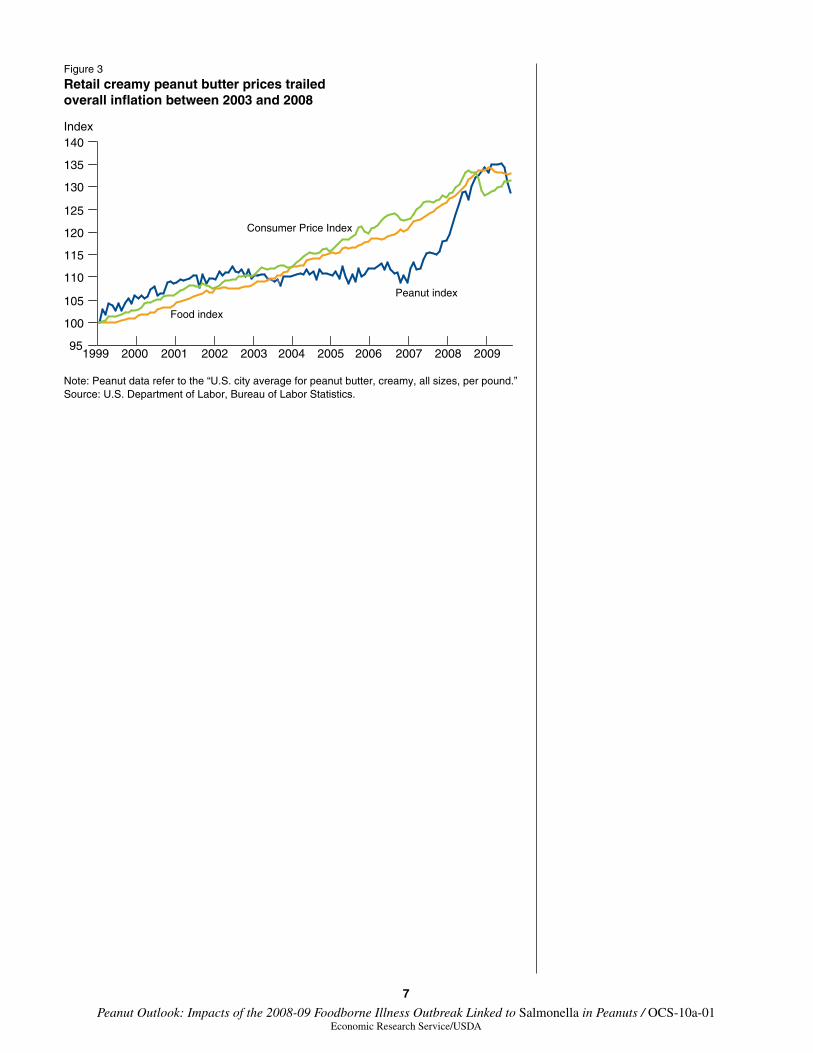
rate of increase in the retail price of peanut butter between 1999 and 2008. Retail peanut butter prices lagged behind the overall Consumer Price Index for much of this decade,8 particularly after passage of the Farm Security Act of 2002, which loosened supply restrictions and lowered farm-level prices (fig. 3) (U.S. Bureau of Labor Statistics (BLS), 2009; Dohlman et al., 2004; Dohlman et al., 2006). The average price of retail creamy peanut butter increased 9 percent between 2007/08 and 2008/09, although prices began to decline following the recalls of peanut products.
Figure 2
Aided by increasing peanut butter processing, total peanut processing increased between 1999/2000 and 2008/2009
Million pounds, farm stock basis
Note: Marketing year is August-July.Source: USDA, National Agricultural Statistics Service, Peanut Stocks and Processing.
0
500
1,000
1,500
2,000
2,500
3,000
Total
OtherPeanut butter
1999/2000 2001/02 2003/04 2007/082005/06
Marketing year
Figure 1
An overview of peanut processing
Source: USDA, Economic Research Service, Oil Crops Outlook; USDA, National Agricultural Statistics Service, Peanut Stocks and Processing; USDA, Foreign Agricultural Service, Global Agricultural Trade System.
(90 percent)
Shelling processor
(5 percent)
Planting seed
(20 percent)
Crushingfacility
(20 percent)
ExportsBall park peanutsExports
(1) Peanut oil(2) Peanut meal
FoodmanufacturerPeanut snacks
Peanut butterPeanut candyOthers
Foodmanufacturerwith in-house
peanutprocessing
Farm
(5 percent)
Roasting (in shell)processor
(Together 60 percent)
Peanutprocessor
(1) Wholesale or retail vegetable oil(2) Livestock feed
Peanut snacksPeanut butterPeanut candyOthers
8BLS tracks the price of creamy peanut butter in major cities as a part of the Consumer Price Index.
7 Peanut Outlook: Impacts of the 2008-09 Foodborne Illness Outbreak Linked to Salmonella in Peanuts / OCS-10a-01
Economic Research Service/USDA
Figure 3
Retail creamy peanut butter prices trailed overall inflation between 2003 and 2008
Index
Note: Peanut data refer to the “U.S. city average for peanut butter, creamy, all sizes, per pound.”Source: U.S. Department of Labor, Bureau of Labor Statistics.
Consumer Price Index
Food index
Peanut index
95
100
105
110
115
120
125
130
135
140
1999 2000 2001 2002 2003 2004 2005 2006 2007 2008 2009
8 Peanut Outlook: Impacts of the 2008-09 Foodborne Illness Outbreak Linked to Salmonella in Peanuts / OCS-10a-01
Economic Research Service/USDA
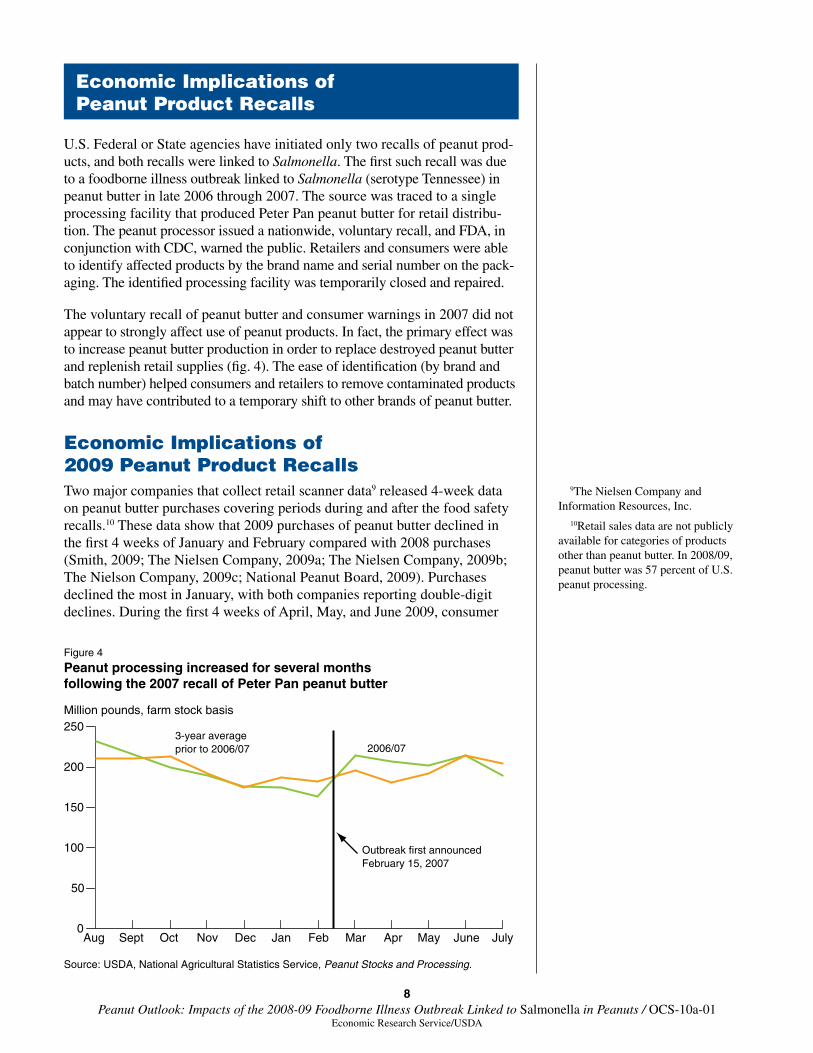
U.S. Federal or State agencies have initiated only two recalls of peanut prod-ucts, and both recalls were linked to Salmonella. The first such recall was due to a foodborne illness outbreak linked to Salmonella (serotype Tennessee) in peanut butter in late 2006 through 2007. The source was traced to a single processing facility that produced Peter Pan peanut butter for retail distribu-tion. The peanut processor issued a nationwide, voluntary recall, and FDA, in conjunction with CDC, warned the public. Retailers and consumers were able to identify affected products by the brand name and serial number on the pack-aging. The identified processing facility was temporarily closed and repaired.
The voluntary recall of peanut butter and consumer warnings in 2007 did not appear to strongly affect use of peanut products. In fact, the primary effect was to increase peanut butter production in order to replace destroyed peanut butter and replenish retail supplies (fig. 4). The ease of identification (by brand and batch number) helped consumers and retailers to remove contaminated products and may have contributed to a temporary shift to other brands of peanut butter.
Economic Implications of 2009 Peanut Product RecallsTwo major companies that collect retail scanner data9 released 4-week data on peanut butter purchases covering periods during and after the food safety recalls.10 These data show that 2009 purchases of peanut butter declined in the first 4 weeks of January and February compared with 2008 purchases (Smith, 2009; The Nielsen Company, 2009a; The Nielsen Company, 2009b; The Nielson Company, 2009c; National Peanut Board, 2009). Purchases declined the most in January, with both companies reporting double-digit declines. During the first 4 weeks of April, May, and June 2009, consumer
Economic Implications of Peanut Product Recalls
9The Nielsen Company and Information Resources, Inc.
10Retail sales data are not publicly available for categories of products other than peanut butter. In 2008/09, peanut butter was 57 percent of U.S. peanut processing.
Figure 4
Peanut processing increased for several months following the 2007 recall of Peter Pan peanut butter
Million pounds, farm stock basis
Source: USDA, National Agricultural Statistics Service, Peanut Stocks and Processing.
0
50
100
150
200
250
Aug Sept Oct Nov Dec Jan Feb Mar Apr May June July
2006/073-year averageprior to 2006/07
Outbreak first announcedFebruary 15, 2007
9 Peanut Outlook: Impacts of the 2008-09 Foodborne Illness Outbreak Linked to Salmonella in Peanuts / OCS-10a-01
Economic Research Service/USDA
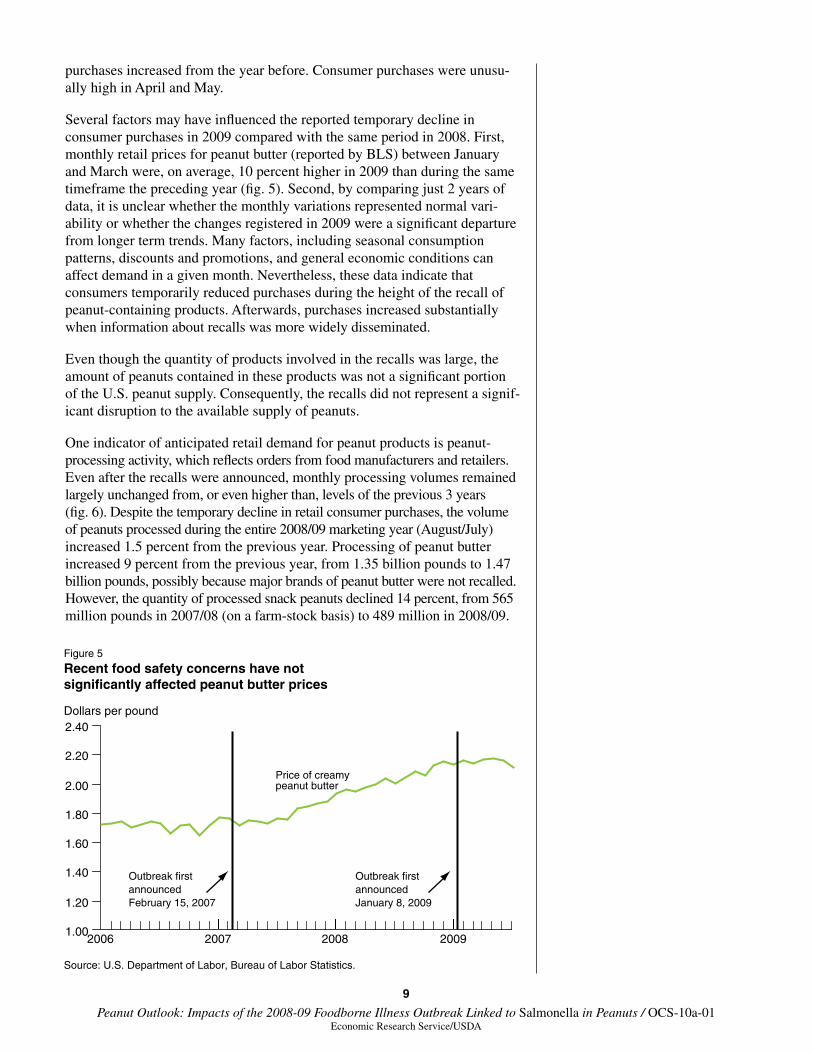
purchases increased from the year before. Consumer purchases were unusu-ally high in April and May.
Several factors may have influenced the reported temporary decline in consumer purchases in 2009 compared with the same period in 2008. First, monthly retail prices for peanut butter (reported by BLS) between January and March were, on average, 10 percent higher in 2009 than during the same timeframe the preceding year (fig. 5). Second, by comparing just 2 years of data, it is unclear whether the monthly variations represented normal vari-ability or whether the changes registered in 2009 were a significant departure from longer term trends. Many factors, including seasonal consumption patterns, discounts and promotions, and general economic conditions can affect demand in a given month. Nevertheless, these data indicate that consumers temporarily reduced purchases during the height of the recall of peanut-containing products. Afterwards, purchases increased substantially when information about recalls was more widely disseminated.
Even though the quantity of products involved in the recalls was large, the amount of peanuts contained in these products was not a significant portion of the U.S. peanut supply. Consequently, the recalls did not represent a signif-icant disruption to the available supply of peanuts.
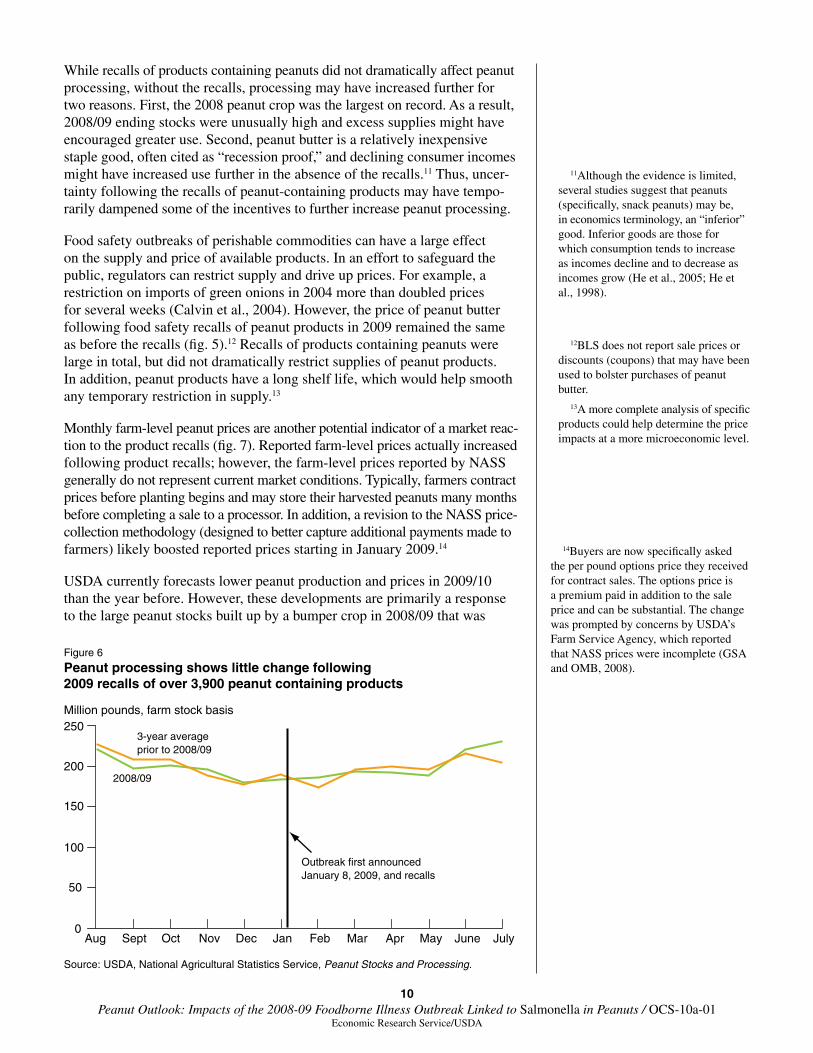
One indicator of anticipated retail demand for peanut products is peanut-processing activity, which reflects orders from food manufacturers and retailers. Even after the recalls were announced, monthly processing volumes remained largely unchanged from, or even higher than, levels of the previous 3 years (fig. 6). Despite the temporary decline in retail consumer purchases, the volume of peanuts processed during the entire 2008/09 marketing year (August/July) increased 1.5 percent from the previous year. Processing of peanut butter increased 9 percent from the previous year, from 1.35 billion pounds to 1.47 billion pounds, possibly because major brands of peanut butter were not recalled. However, the quantity of processed snack peanuts declined 14 percent, from 565 million pounds in 2007/08 (on a farm-stock basis) to 489 million in 2008/09.
Figure 5
Recent food safety concerns have not significantly affected peanut butter prices
Dollars per pound
Source: U.S. Department of Labor, Bureau of Labor Statistics.
Price of creamy peanut butter
Outbreak first announcedFebruary 15, 2007
1.00
1.20
1.40
1.60
1.80
2.00
2.20
2.40
2006 2007 20092008
Outbreak first announcedJanuary 8, 2009
10 Peanut Outlook: Impacts of the 2008-09 Foodborne Illness Outbreak Linked to Salmonella in Peanuts / OCS-10a-01
Economic Research Service/USDA
While recalls of products containing peanuts did not dramatically affect peanut processing, without the recalls, processing may have increased further for two reasons. First, the 2008 peanut crop was the largest on record. As a result, 2008/09 ending stocks were unusually high and excess supplies might have encouraged greater use. Second, peanut butter is a relatively inexpensive staple good, often cited as “recession proof,” and declining consumer incomes might have increased use further in the absence of the recalls.11 Thus, uncer-tainty following the recalls of peanut-containing products may have tempo-rarily dampened some of the incentives to further increase peanut processing.
Food safety outbreaks of perishable commodities can have a large effect on the supply and price of available products. In an effort to safeguard the public, regulators can restrict supply and drive up prices. For example, a restriction on imports of green onions in 2004 more than doubled prices for several weeks (Calvin et al., 2004). However, the price of peanut butter following food safety recalls of peanut products in 2009 remained the same as before the recalls (fig. 5).12 Recalls of products containing peanuts were large in total, but did not dramatically restrict supplies of peanut products. In addition, peanut products have a long shelf life, which would help smooth any temporary restriction in supply.13
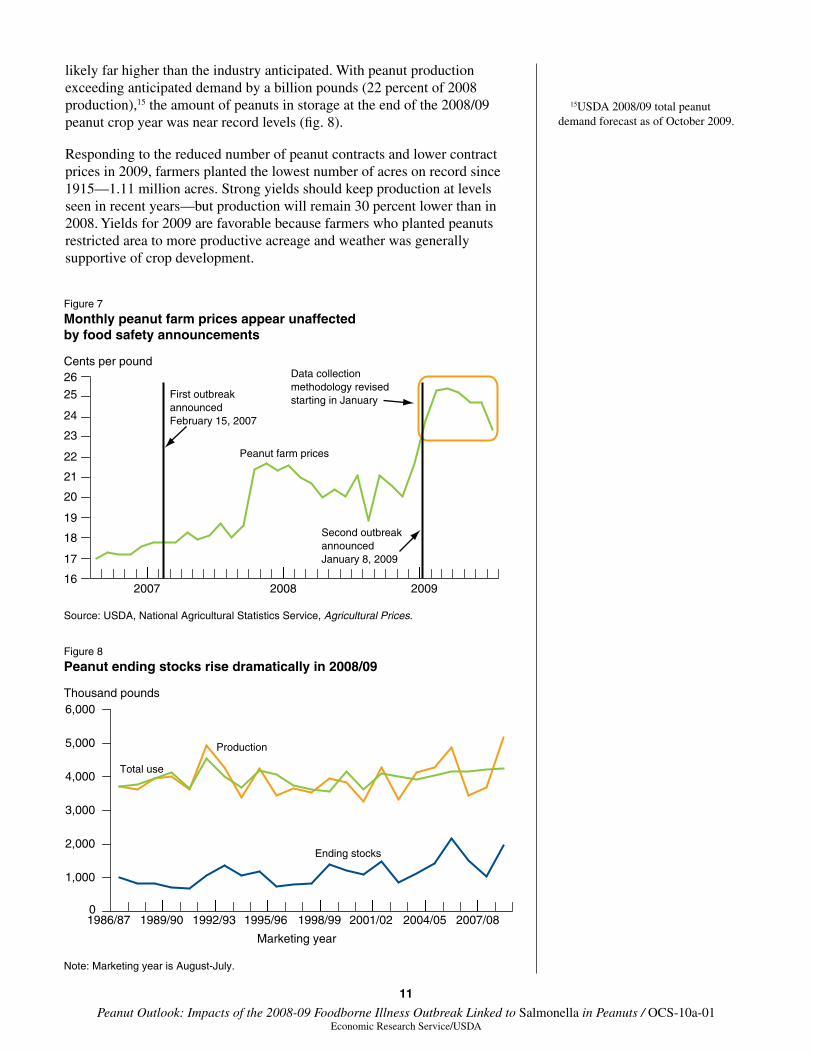
Monthly farm-level peanut prices are another potential indicator of a market reac-tion to the product recalls (fig. 7). Reported farm-level prices actually increased following product recalls; however, the farm-level prices reported by NASS generally do not represent current market conditions. Typically, farmers contract prices before planting begins and may store their harvested peanuts many months before completing a sale to a processor. In addition, a revision to the NASS price-collection methodology (designed to better capture additional payments made to farmers) likely boosted reported prices starting in January 2009.14
USDA currently forecasts lower peanut production and prices in 2009/10 than the year before. However, these developments are primarily a response to the large peanut stocks built up by a bumper crop in 2008/09 that was
11Although the evidence is limited, several studies suggest that peanuts (specifically, snack peanuts) may be, in economics terminology, an “inferior” good. Inferior goods are those for which consumption tends to increase as incomes decline and to decrease as incomes grow (He et al., 2005; He et al., 1998).
12BLS does not report sale prices or discounts (coupons) that may have been used to bolster purchases of peanut butter.
13A more complete analysis of specific products could help determine the price impacts at a more microeconomic level.
Figure 6
Peanut processing shows little change following 2009 recalls of over 3,900 peanut containing products
Million pounds, farm stock basis
Source: USDA, National Agricultural Statistics Service, Peanut Stocks and Processing.
2008/09
3-year averageprior to 2008/09
Outbreak first announcedJanuary 8, 2009, and recalls
0
50
100
150
200
250
Aug Sept Oct Nov Dec Jan Feb Mar Apr May June July
14Buyers are now specifically asked the per pound options price they received for contract sales. The options price is a premium paid in addition to the sale price and can be substantial. The change was prompted by concerns by USDA’s Farm Service Agency, which reported that NASS prices were incomplete (GSA and OMB, 2008).
11 Peanut Outlook: Impacts of the 2008-09 Foodborne Illness Outbreak Linked to Salmonella in Peanuts / OCS-10a-01
Economic Research Service/USDA
likely far higher than the industry anticipated. With peanut production exceeding anticipated demand by a billion pounds (22 percent of 2008 production),15 the amount of peanuts in storage at the end of the 2008/09 peanut crop year was near record levels (fig. 8).
Responding to the reduced number of peanut contracts and lower contract prices in 2009, farmers planted the lowest number of acres on record since 1915—1.11 million acres. Strong yields should keep production at levels seen in recent years—but production will remain 30 percent lower than in 2008. Yields for 2009 are favorable because farmers who planted peanuts restricted area to more productive acreage and weather was generally supportive of crop development.
15USDA 2008/09 total peanut demand forecast as of October 2009.
Figure 7
Monthly peanut farm prices appear unaffected by food safety announcements
Cents per pound
Source: USDA, National Agricultural Statistics Service, Agricultural Prices.
Peanut farm prices
First outbreak announcedFebruary 15, 2007
2007 2008 2009
Second outbreak announcedJanuary 8, 2009
16
17
18
19
20
21
22
23
24
25
26 Data collection methodology revised starting in January
Figure 8
Peanut ending stocks rise dramatically in 2008/09
Thousand pounds
Note: Marketing year is August-July.Source: USDA, Economic Research Service, Oil Crops Outlook.
Production
Total use
Ending stocks
0
1,000
2,000
3,000
4,000
5,000
6,000
1986/87 1989/90 1992/93 1995/96 1998/99 2001/02 2004/05 2007/08
Marketing year
12 Peanut Outlook: Impacts of the 2008-09 Foodborne Illness Outbreak Linked to Salmonella in Peanuts / OCS-10a-01
Economic Research Service/USDA
In the wake of these and other recent foodborne illness outbreaks, public officials at the national level are considering changes in policies related to prevention, surveillance and enforcement, and response and recovery for all food products.
A number of congressional committee hearings have been held to discuss the outbreak of foodborne illnesses linked to Salmonella in peanuts. On February 11, 2009, a congressional hearing by the Oversight and Investiga-tions Subcommittee of the House of Representatives’ Committee on Energy and Commerce was held to discuss the outbreak, and industry officials from PCA were issued subpoenas to attend. A subsequent hearing by the same committee on the role of the industry in the outbreak was held on March 19 (Stupak, 2009).
In March, the President created a new Food Safety Working Group, chaired by the secretaries of the U.S. Department of Health and Human Services (HHS) and USDA to review laws and regulations governing food safety (USDA and HHS, 2009). Several steps have been taken to prioritize preven-tion, strengthen surveillance and enforcement, and improve response and recovery (USDA, 2009).
The national dialogue to re-evaluate food safety laws has been elevated by recent outbreaks linked to Salmonella in peanuts and activities of the 111th Congress. On July 30, 2009, the House of Representatives passed the Food Safety Enhancement Act of 2009 (H.R. 2749) (Library of Congress, 2009). A similar version of this bill, the Food Safety Modernization Act (H.R. 875), was referred to the House Agriculture committee and subsequently referred to the subcommittee on Livestock, Dairy, and Poultry (Library of Congress, 2009). The Senate version of the bill (S. 510 - The Food Safety and Modern-ization Act) was placed on the Legislative Calendar on December 18, 2009.
Current Issues in Food Safety That May Impact the Peanut Industry
13 Peanut Outlook: Impacts of the 2008-09 Foodborne Illness Outbreak Linked to Salmonella in Peanuts / OCS-10a-01
Economic Research Service/USDA
Costs resulting from 2009 recalls of peanut-containing products were consid-erable for consumers and producers. The outbreak resulted in at least 714 illnesses, which may have contributed to 9 deaths. In addition, over 3,900 products were recalled by more than 200 companies. U.S. peanut supplies were largely unaffected by these recalls, and the primary concern of the peanut industry was reduced consumer purchases of all products containing peanuts. Retail sales data indicate that, in the months following the initial CDC warning on products containing peanut butter, use declined for several months but returned to previous-year levels 4 months later. The level of peanut processing throughout the outbreak did not diverge significantly from historical trends, suggesting that no major decline in peanut purchases were anticipated going forward.
Nevertheless, the two multistate foodborne illness outbreaks linked to Salmo-nella in peanuts have prompted increased media attention and discussions related to food safety, leading to some new measures enacted by private industry and regulators. During the 2008-09 food recalls linked to peanuts, several trade groups responded by coordinating the flow of information from the peanut industry to consumers and decisionmakers. Individual States, such as Georgia, have also produced legislation to increase oversight of food manufacturing and to establish safety guidelines. At the Federal level, debate in the 111th Congress is focused on the frequency of inspections, on-farm safety standards, preventative safeguards, recall authority, and the organiza-tion of public food safety agencies.
The production, supply, and use of peanuts will continue to be governed by fundamental supply and demand prospects. Following a bumper harvest in 2008, ending stocks in 2008/09 were very high. Large ending stocks have already resulted in reduced contracting by peanut shellers in 2009, reducing anticipated prices and lowering the number of planted acres to the lowest level since 1915. Lower production in 2009/10 is forecast to bring ending stocks back to normal, possibly supporting farm-stock peanut prices in 2010. Historically, U.S. per capita peanut consumption has been steady, with overall processing rising at about the rate of population growth (Buzby and Wells, 2009). Peanut-processing increases in 2008/09 (1.5 percent) were similar to historic trend growth despite a temporary slowdown in consumer purchases as a result of the foodborne illness outbreak associated with processed peanuts.
Conclusions
14 Peanut Outlook: Impacts of the 2008-09 Foodborne Illness Outbreak Linked to Salmonella in Peanuts / OCS-10a-01
Economic Research Service/USDA
Ash, Mark, Erik Dohlman, and Kelsey Wittenberger. Oil Crops Outlook, Monthly, U.S. Department of Agriculture, Economic Research Service, http://usda.mannlib.cornell.edu/MannUsda/viewDocumentInfo.do?documentID=1288
Becker, Geoffrey S. March 2009. The Federal Food Safety System: A Primer, RS22600, Congressional Research Service.
Buzby, Jean, Laurian Unnevehr, and Donna Roberts. September 2008. Food Safety and Imports: An Analysis of FDA Import Refusal Reports, EIB-39, U.S. Department of Agriculture, Economic Research Service, http://www.ers.usda.gov/Publications/EIB39/
Buzby, Jean, and Hodan Farah Wells. February 2009. Food Availability Data Set, U.S. Department of Agriculture, Economic Research Service, http://www.ers.usda.gov/data/foodconsumption/FoodAvailSpreadsheets.htm#nuts
Calvin, Linda, Belem Avendano, and Rita Schwentesius. December 2004. The Economics of Food Safety: The Case of Green Onions and Hepatitis A Outbreaks, Outlook Report No. VGS-30501, U.S. Department of Agriculture, Economic Research Service, http://www.ers.usda.gov/publications/vgs/nov04/vgs30501/
Centers for Disease Control and Prevention (CDC). January 2005a. Foodborne Illness: Frequently Asked Questions, http://www.cdc.gov/ncidod/dbmd/diseaseinfo/files/foodborne_illness_FAQ.pdf
Centers for Disease Control and Prevention (CDC). May 2008. Salmonellosis General Information, http://www.cdc.gov/nczved/dfbmd/disease_listing/salmonellosis_gi.html
Centers for Disease Control and Prevention (CDC). February 2009. Investigation Update: Outbreak of Salmonella Typhimurium, http://www.cdc.gov/salmonella/typhimurium/update.html
Dohlman, Erik, Linwood Hoffman, Edwin Young, and William McBride. June 2006. “The U.S. Peanut Quota Buyout: Sectoral Adjustment to Policy Change Under the 2002 Farm Act,” in Blandford, D., and B. Hill, eds., Policy Reform & Adjustment in the Agricultural Sectors of Developed Countries, Wallingford, Oxfordshire, UK: CAB International.
Dohlman, Erik, and Janet Livezey. October 2005. Peanut Backgrounder, Outlook Report No. OCS05I01, U.S. Department of Agriculture, Economic Research Service, http://www.ers.usda.gov/Publications/OCS/Oct05/OCS05I01/
References
15 Peanut Outlook: Impacts of the 2008-09 Foodborne Illness Outbreak Linked to Salmonella in Peanuts / OCS-10a-01
Economic Research Service/USDA
Dohlman, Erik, Edwin Young, Linwood Hoffman, and William McBride. July 2004. Peanut Policy Change and Adjustment Under the 2002 Farm Act, Outlook Report No. OCS04G01, U.S. Department of Agriculture, Economic Research Service, http://www.ers.usda.gov/Publications/OCS/Jul04/OCS04G01/
Frenzen, Paul, Lynn Riggs, Jean Buzby, Thomas Breauer, Tanya Roberts, Drew Voetsch, and Sudha Reddy. August 1999. “Salmonella Cost Estimate Updated Using FoodNet Data,” FoodReview 22(2):10-15, http://www.ers.usda.gov/publications/foodreview/may1999/frmay99c.pdf
General Services Administration (GSA) and Office of Management and Budget (OMB). October 2008. Justification for Non-Substantive Change Request - Peanut Prices 2008, http://www.reginfo.gov/public/do/PRAViewDocument?ref_nbr=200810-0535-001
He, Senhui, W. Florkowski, A. Elnagheeb. July 1998. “Consumer Character-istics Influencing the Consumption of Nut-containing Products,” Journal of Food Distribution Research 28(2):31-44.
He, Senhui, Stanley Fletcher, and Arbindra Rimal. March 2005. “Snack Peanut Consumption: Type Preference and Consumption Manners,” Journal of Food Distribution Research 36(1):79-85.
Library of Congress. 2009. Thomas - Home. The Library of Congress, http://thomas.loc.gov/
National Peanut Board. September 10, 2009. We’re Going Back to Peanut Butter (If We Ever Left It), http://www.energyforthegoodlife.org/
The Nielsen Company. February. 2009a. Salmonella Outbreak Taints Peanut Butter Sales, http://blog.nielsen.com/nielsenwire/tag/peanut-butter/
The Nielsen Company. March 2009b. Peanut Butter Sales Still Stuck, http://blog.nielsen.com/nielsenwire/tag/peanut-butter/
The Nielsen Company. May 2009c. Update: Peanut Butter Sales Back on Track, http://blog.nielsen.com/nielsenwire/tag/peanut-butter/
Smith, Ron. April 2009. Peanut Butter Sales Rebound Following Salmonella Scare, Southwest Farm Press, http://southwestfarmpress.com/peanuts/ peanut-butter-sales-0413/
Stupak, Bart, Chairman. March 19, 2009. The Salmonella Outbreak: The Role of Industry in Protecting the Nation’s Food Supply, Congressional hearing, Committee on Energy and Commerce, Oversight and Investigations.
U.S. Bureau of Labor Statistics (BLS). January 2009. Consumer Price Index - Average Price Data, http://www.bls.gov/data/
U.S. Department of Agriculture (USDA). July 2009. Obama Administration Delivers on Commitment to Upgrade U.S. Food Safety System, Press release no. 0292.09.
16 Peanut Outlook: Impacts of the 2008-09 Foodborne Illness Outbreak Linked to Salmonella in Peanuts / OCS-10a-01
Economic Research Service/USDA
U.S. Department of Agriculture (USDA) and U.S. Department of Health and Human Services (HHS). March 2009. President’s Food Safety Working Group, http://www.foodsafetyworkinggroup.gov/Home.htm
U.S. Department of Agriculture (USDA), Foreign Agricultural Service. Global Agricultural Trade System.
U.S. Department of Agriculture (USDA), National Agricultural Statistics Service (NASS). February 2009a. Crop Values 2008 Summary.
U.S. Department of Agriculture (USDA), National Agricultural Statistics Service (NASS). February 2009b. (Updated Sept. 2009) 2007 Census of Agriculture.
U.S. Food and Drug Administration (FDA). 2009a. Inspectional Observations for the Peanut Corporation of America, http://www.fda.gov/ora/frequent/default.htm
U.S. Food and Drug Administration (FDA). May 2009b. Peanut Product Recalls: Salmonella Typhimurium, http://www.fda.gov/oc/opacom/hottopics/salmonellatyph.html
17 Peanut Outlook: Impacts of the 2008-09 Foodborne Illness Outbreak Linked to Salmonella in Peanuts / OCS-10a-01
Economic Research Service/USDA
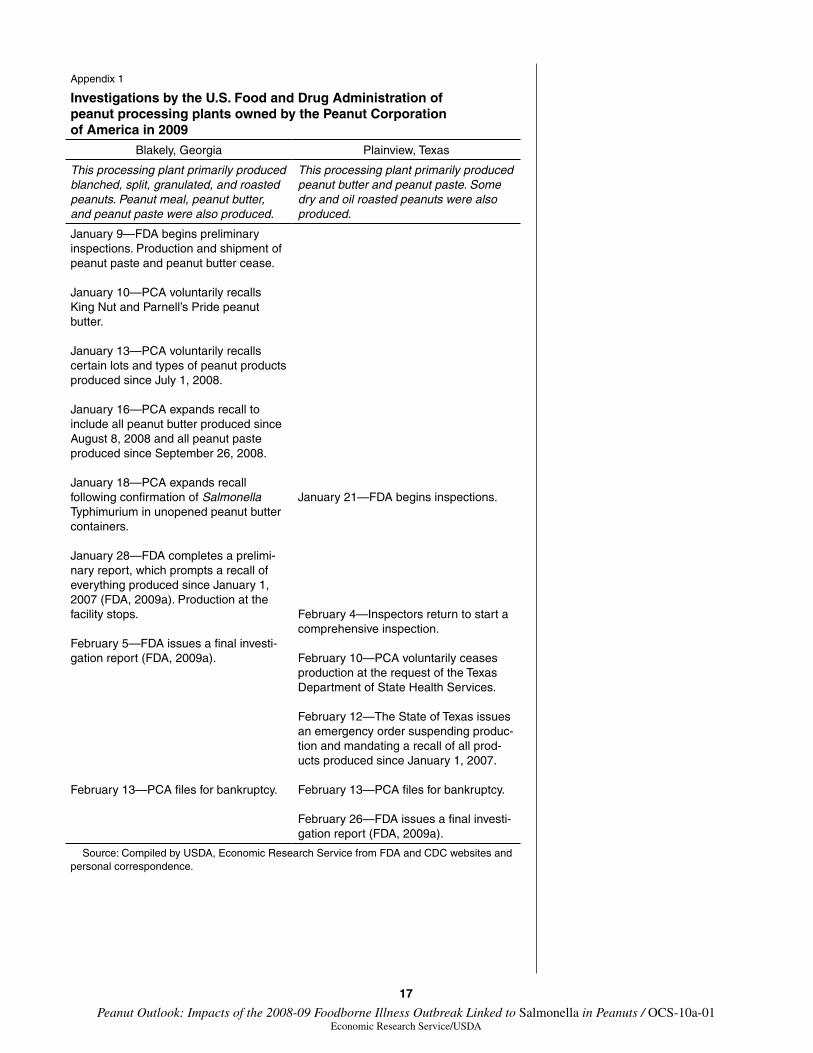
Appendix 1
Investigations by the U.S. Food and Drug Administration of peanut processing plants owned by the Peanut Corporation of America in 2009
Blakely, Georgia Plainview, Texas
This processing plant primarily produced blanched, split, granulated, and roasted peanuts. Peanut meal, peanut butter, and peanut paste were also produced.
This processing plant primarily produced peanut butter and peanut paste. Some dry and oil roasted peanuts were also produced.
January 9—FDA begins preliminary inspections. Production and shipment of peanut paste and peanut butter cease.
January 10—PCA voluntarily recalls King Nut and Parnell’s Pride peanut butter.
January 13—PCA voluntarily recalls certain lots and types of peanut products produced since July 1, 2008.
January 16—PCA expands recall to include all peanut butter produced since August 8, 2008 and all peanut paste produced since September 26, 2008.
January 18—PCA expands recall following confirmation of Salmonella Typhimurium in unopened peanut butter containers.
January 28—FDA completes a prelimi-nary report, which prompts a recall of everything produced since January 1, 2007 (FDA, 2009a). Production at the facility stops.
February 5—FDA issues a final investi-gation report (FDA, 2009a).
February 13—PCA files for bankruptcy.
January 21—FDA begins inspections.
February 4—Inspectors return to start a comprehensive inspection.
February 10—PCA voluntarily ceases production at the request of the Texas Department of State Health Services.
February 12—The State of Texas issues an emergency order suspending produc-tion and mandating a recall of all prod-ucts produced since January 1, 2007.
February 13—PCA files for bankruptcy.
February 26—FDA issues a final investi-gation report (FDA, 2009a).
Source: Compiled by USDA, Economic Research Service from FDA and CDC websites and personal correspondence.
18 Peanut Outlook: Impacts of the 2008-09 Foodborne Illness Outbreak Linked to Salmonella in Peanuts / OCS-10a-01
Economic Research Service/USDA
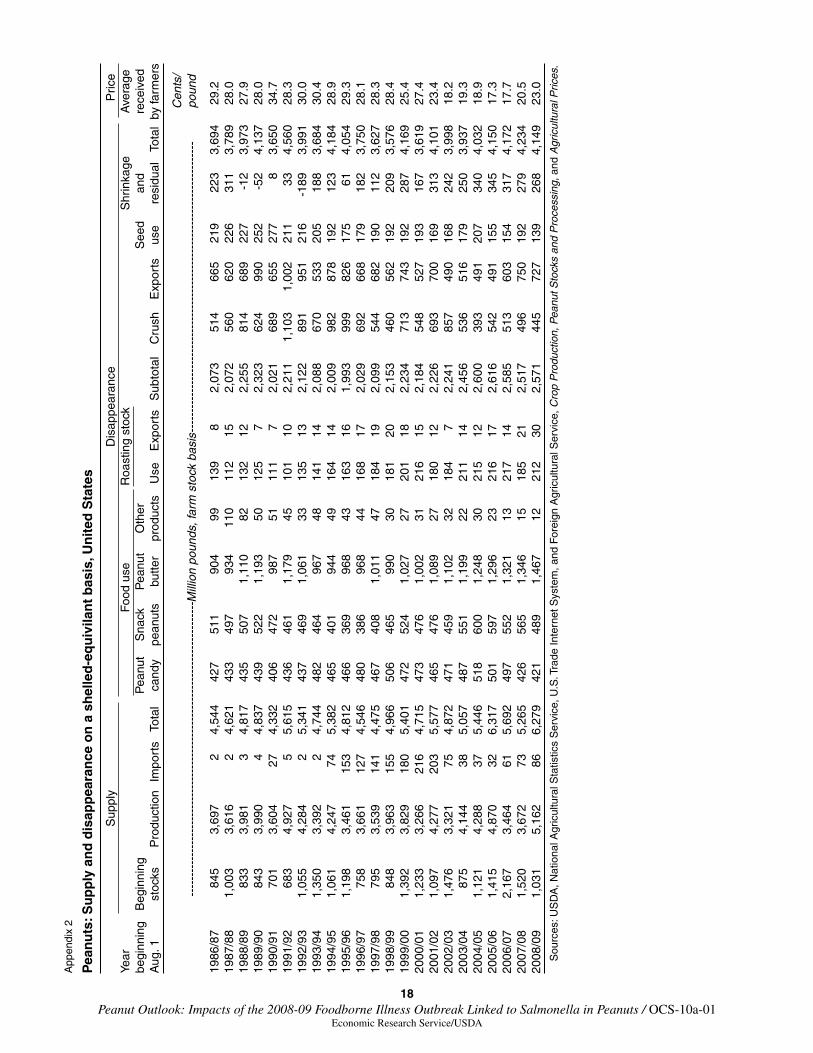
App
endi
x 2
Pea
nu
ts: S
up
ply
an
d d
isap
pea
ran
ce o
n a
sh
elle
d-e
qu
ivila
nt
bas
is, U
nit
ed S
tate
s
S
uppl
y D
isap
pear
ance
P
rice
Year
F
ood
use
Roa
stin
g st
ock
Shr
inka
ge
A
vera
gebe
ginn
ing
Beg
inni
ng
P
eanu
t S
nack
P
eanu
t O
ther
See
d an
d
rece
ived
Aug
. 1
stoc
ks
Pro
duct
ion
Impo
rts
Tota
l ca
ndy
pean
uts
butte
r pr
oduc
ts
Use
E
xpor
ts
Sub
tota
l C
rush
E
xpor
ts
use
resi
dual
To
tal
by fa
rmer
s
Cen
ts/
--
----
----
----
----
----
----
----
----
----
----
----
----
----
----
----
----
----
----
Mill
ion
poun
ds, f
arm
sto
ck b
asis
----
----
----
----
----
----
----
----
----
----
----
----
----
----
----
----
----
----
- po
und
1986
/87
845
3,69
7 2
4,54
4 42
7 51
1 90
4 99
13
9 8
2,07
3 51
4 66
5 21
9 22
3 3,
694
29.2
1987
/88
1,00
3 3,
616
2 4,
621
433
497
934
110
112
15
2,07
2 56
0 62
0 22
6 31
1 3,
789
28.0
1988
/89
833
3,98
1 3
4,81
7 43
5 50
7 1,
110
82
132
12
2,25
5 81
4 68
9 22
7 -1
2 3,
973
27.9
1989
/90
843
3,99
0 4
4,83
7 43
9 52
2 1,
193
50
125
7 2,
323
624
990
252
-52
4,13
7 28
.019
90/9
1 70
1 3,
604
27
4,33
2 40
6 47
2 98
7 51
11
1 7
2,02
1 68
9 65
5 27
7 8
3,65
0 34
.719
91/9
2 68
3 4,
927
5 5,
615
436
461
1,17
9 45
10
1 10
2,
211
1,10
3 1,
002
211
33
4,56
0 28
.319
92/9
3 1,
055
4,28
4 2
5,34
1 43
7 46
9 1,
061
33
135
13
2,12
2 89
1 95
1 21
6 -1
89
3,99
1 30
.019
93/9
4 1,
350
3,39
2 2
4,74
4 48
2 46
4 96
7 48
14
1 14
2,
088
670
533
205
188
3,68
4 30
.419
94/9
5 1,
061
4,24
7 74
5,
382
465
401
944
49
164
14
2,00
9 98
2 87
8 19
2 12
3 4,
184
28.9
1995
/96
1,19
8 3,
461
153
4,81
2 46
6 36
9 96
8 43
16
3 16
1,
993
999
826
175
61
4,05
4 29
.319
96/9
7 75
8 3,
661
127
4,54
6 48
0 38
6 96
8 44
16
8 17
2,
029
692
668
179
182
3,75
0 28
.119
97/9
8 79
5 3,
539
141
4,47
5 46
7 40
8 1,
011
47
184
19
2,09
9 54
4 68
2 19
0 11
2 3,
627
28.3
1998
/99
848
3,96
3 15
5 4,
966
506
465
990
30
181
20
2,15
3 46
0 56
2 19
2 20
9 3,
576
28.4
1999
/00
1,39
2 3,
829
180
5,40
1 47
2 52
4 1,
027
27
201
18
2,23
4 71
3 74
3 19
2 28
7 4,
169
25.4
2000
/01
1,23
3 3,
266
216
4,71
5 47
3 47
6 1,
002
31
216
15
2,18
4 54
8 52
7 19
3 16
7 3,
619
27.4
2001
/02
1,09
7 4,
277
203
5,57
7 46
5 47
6 1,
089
27
180
12
2,22
6 69
3 70
0 16
9 31
3 4,
101
23.4
2002
/03
1,47
6 3,
321
75
4,87
2 47
1 45
9 1,
102
32
184
7 2,
241
857
490
168
242
3,99
8 18
.220
03/0
4 87
5 4,
144
38
5,05
7 48
7 55
1 1,
199
22
211
14
2,45
6 53
6 51
6 17
9 25
0 3,
937
19.3
2004
/05
1,12
1 4,
288
37
5,44
6 51
8 60
0 1,
248
30
215
12
2,60
0 39
3 49
1 20
7 34
0 4,
032
18.9
2005
/06
1,41
5 4,
870
32
6,31
7 50
1 59
7 1,
296
23
216
17
2,61
6 54
2 49
1 15
5 34
5 4,
150
17.3
2006
/07
2,16
7 3,
464
61
5,69
2 49
7 55
2 1,
321
13
217
14
2,58
5 51
3 60
3 15
4 31
7 4,
172
17.7
2007
/08
1,52
0 3,
672
73
5,26
5 42
6 56
5 1,
346
15
185
21
2,51
7 49
6 75
0 19
2 27
9 4,
234
20.5
2008
/09
1,03
1 5,
162
86
6,27
9 42
1 48
9 1,
467
12
212
30
2,57
1 44
5 72
7 13
9 26
8 4,
149
23.0
Sou
rces
: US
DA
, Nat
iona
l Agr
icul
tura
l Sta
tistic
s S
ervi
ce, U
.S. T
rade
Inte
rnet
Sys
tem
, and
For
eign
Agr
icul
tura
l Ser
vice
, Cro
p P
rodu
ctio
n, P
eanu
t Sto
cks
and
Pro
cess
ing,
and
Agr
icul
tura
l Pric
es.


![Handbook of Spices, Seasonings & Flavorings [2007]](https://img.pdfslide.us/doc/110x75/55cf9cae550346d033aaac11/handbook-of-spices-seasonings-flavorings-2007.jpg)