Embed Size (px)
Citation preview
United States Department of Agriculture
Natural Resources Conservation Service
Conservation Practice Adoption on Cultivated Cropland Acres: Effects on Instream Nutrient and Sediment Dynamics and Delivery in Western Lake Erie Basin, 2003-06 and 2012
Conservation Effects Assessment Project (CEAP) - Cropland Special Study Report October 2017
i
Suggested Citation: U.S. Department of Agriculture, Natural Resources Conservation Service. 2017. Conservation Practice Adoption on Cultivated Cropland Acres: Effects on Instream Nutrient and Sediment Dynamics and Delivery in Western Lake Erie Basin, 2003-06 and 2012. 77 pp. Cover Image: Aerial view of cultivated cropland acreage (in green) in the Western Lake Erie Basin. Provided by Resource Assessment Division, Soil Science and Resource Assessment, Natural Resources Conservation Service, U.S. Department of Agriculture. Created March 23, 2017. Aerial data source: Environmental Systems Research Institute (ESRI), DigitalGlobe Aerial Imagery. Cropland data source: National Land Cover Database (NLCD), 2011, U.S. Geological Survey, Land Cover Institute.
The Conservation Effects Assessment Project (CEAP)—Strengthening the science base for natural resource conservation
The Conservation Effects Assessment Project (CEAP) was initiated by USDA’s Natural Resources Conservation Service (NRCS), Agricultural Research Service (ARS), and National Institute of Food and Agriculture (NIFA) [formerly known as Cooperative State Research, Education, and Extension Service (CSREES)] in 2002 as a means to analyze societal and environmental benefits gained from the 2002 Farm Bill’s substantial increase in conservation program funding. The CEAP-1 survey was conducted on agricultural lands across the United States in 2003-06. The goal of CEAP-1 was to establish a scientific understanding of the effects of agricultural management and conservation practices at the watershed, regional, and national scales. As CEAP evolved, the scope expanded to include analyses of the impacts and efficacy of agricultural management and adoption of various conservation practices on maintaining and improving soil and water quality at multiple spatial and temporal scales.
CEAP activities are organized into three interconnected efforts:
• Bibliographies, literature reviews, and scientific workshops to establish what is known about the agroecological effects of conservation practices at multiple spatial and temporal scales.
• National and regional assessments to estimate the impacts of agricultural management and conservation practice adoption on the landscape and to estimate conservation treatment needs. The four components of the national and regional assessment effort are Cropland, Grazing Lands, Wetlands, and Wildlife.
• Watershed studies to provide in-depth quantification of water quality and soil quality impacts of conservation practices at the local level and to provide insight on what practices are most effective and where they are needed within a watershed to achieve agroecological goals.
CEAP-1 benchmark results, published for 12 watersheds, provide a scientific basis for interpreting conservation practice implementation impacts and identifying remaining conservation practice needs. These reports continue to inform decision-makers, policymakers, and the public on the environmental and societal benefits of conservation practice use. Subsequent surveys and analyses have enabled better understanding of conservation practice adoption trends and impacts over time. Special Studies, such as the survey that informed this report, were carried out for various high-priority watersheds during the interim between the first national survey (CEAP-1, 2003-06) and the second national survey (CEAP-2, 2015-2016), which expanded to include pasturelands.
Additional information on the scope of the project can be found at http://www.nrcs.usda.gov/technical/nri/ceap/.
The U.S. Department of Agriculture (USDA) prohibits discrimination in all its programs and activities on the basis of race, color, national origin, age, disability, and where applicable, sex, marital status, familial status, parental status, religion, sexual orientation, genetic information, political beliefs, reprisal, or because all or part of an individual’s income is derived from any public assistance program. (Not all prohibited bases apply to all programs.) Persons with disabilities who require alternative means for communication of program information (Braille, large print, audiotape, etc.) should contact USDA’s TARGET Center at (202) 720-2600 (voice and TDD). To file a complaint of discrimination, write to USDA, Director, Office of Civil Rights, 1400 Independence Avenue, S.W., Washington, D.C. 20250-9410, or call (800) 795-3272 (voice) or (202) 720-6382 (TDD). USDA is an equal opportunity provider and employer.
ii
This report was prepared by the Conservation Effects Assessment Project (CEAP)-Cropland Modeling Team and published by the USDA’s Natural Resources Conservation Service (NRCS). The modeling team consists of scientists and analysts from NRCS, USDA’s Agricultural Research Service (ARS), the University of Massachusetts, and Texas A&M AgriLife Research. Natural Resources Conservation Service, USDA
M. Lee Norfleet, Project Coordinator, Temple, TX, Soil Scientist Jay D. Atwood, Temple, TX, Agricultural Economist Lisa Duriancik, Beltsville, MD, Natural Resource Manager Maria Hrebik, Temple, TX, Civil Engineer Kevin Ingram, Beltsville, MD, Agricultural Economist Mari-Vaughn V. Johnson, Temple, TX, Agronomist Chris Lester, Temple, TX, Soil Conservationist Charles Rewa, Beltsville, MD, Biologist Robert Sowers, Beltsville, MD, Information Management Specialist Evelyn Steglich, Temple, TX, Natural Resource Specialist
Agricultural Research Service, USDA, Grassland, Soil, and Water Research Laboratory, Temple, TX Jeff Arnold, Agricultural Engineer Kathrine D. Behrman, Research Scientist (contract) Mike White, Agricultural Engineer
Blackland Research & Extension Center, Texas A&M AgriLife Research, Temple, TX
Tom Gerik, Director Santhi Chinnasamy, Agricultural Engineer Mauro Di Luzio, Research Scientist Luca Doro, Research Scientist Marion Henley, Research Associate Arnold King, Resource Conservationist David C. Moffitt, Environmental Engineer Javier Osorio, Research Scientist Theresa Pitts, Programmer Xiuying (Susan) Wang, Agricultural Engineer Jimmy Williams, Agricultural Engineer
The study was conducted under the direction of Dan Mullarkey, Director of Resource Assessment Division; Michele Laur, former Director of Resource Assessment Division; and David Smith, Micheal Golden, and Douglas Lawrence, former Deputy Chiefs for Soil Science and Resource Assessment, NRCS. Executive support was provided by former NRCS Chiefs Jason Weller and Dave White. Acknowledgements The team thanks Shiela Corley, Torey Lawrence, Esmerelda Dickson, and Julia Klapproth, USDA National Agricultural Statistics Service, for leading the survey data collection effort; Mark Siemers and Todd Campbell, CARD, Iowa State University, for providing I-APEX support; NRCS field offices, for assisting in collection of conservation practice data; Kevin Ingram and Chieh (Peter) Chen, USDA-NRCS, Beltsville, MD, for geographic information systems (GIS) analysis support; Armen Kemanian, Penn State University, for improving the denitrification routine in APEX; Karl Musser, Robert (Tony) Oesterling, Susan Wallace, and George Wallace and Paradigm Systems, Beltsville, MD, for graphics support, National Resources Inventory (NRI) database support, website support, and calculation of standard errors; and many others who provided advice, guidance, and suggestions throughout the project. Last, but certainly not least, the team thanks the producers, land operators, farmers, and ranchers, without whose continued cooperation the CEAP effort, including this report, would not be possible.
iii
Foreword
Established in 2003, the Conservation Effects Assessment Project (CEAP) is an effort to quantify conservation practice adoption rates and impacts across the United States, with recent emphasis on understanding change over time. The Cropland component of CEAP provides assessment of conservation practice adoption impacts on societal and landowner benefits in relation to agroecological systems. CEAP-Cropland is led by the USDA-NRCS, with partners in other agencies and institutions. Between 2003 and 2006 thousands of farmers across the United States participated in voluntary surveys about the fields they manage as part of the seminal CEAP-Cropland National Assessment (CEAP-1). Twelve regional reports generated by CEAP-1 data provide snapshots of conservation practice adoption and impacts on the majority of cultivated cropland across the conterminous United States as of 2003-06. Regional reports are available at https://www.nrcs.usda.gov/wps/portal/nrcs/detail/national/technical/nra/ceap/na/?cid=nrcs143_014144. The CEAP-1 Cropland series of regional reports includes a Great Lakes regional report (USDA-NRCS 2011). A Special Study was undertaken in Western Lake Erie Basin (WLEB) in 2011, continuing the USDA tradition of assessing the status, conditions, and trends of natural resources to determine how to improve conservation practices and programs to best meet the Nation’s needs. As in CEAP-1, the WLEB Special Study used a sampling and modeling approach to estimate impacts of agricultural management and conservation practice adoption and explore prospects for attaining additional benefits with complementary or alternative conservation treatment. This report differs from the CEAP-1 “Assessment of the Effects of Conservation Practices on Cultivated Cropland in the Great Lakes Region” (2011) in several key aspects. The 2011 report covered the entire Great Lakes region, whereas this report focuses on the Western Lake Erie Basin. The survey informing the 2011 report was conducted over a multi-year period (2003-06), as part of the Cropland national survey that informed CEAP-1, while the survey informing this report occurred solely in the fall of 2012. During the interim between 2011 and 2017, the models and data used in these analyses have been improved and updated. More refined and extensive soils and weather data became available for both the Agricultural Policy Environmental eXtender (APEX) model, used to evaluate edge-of-field impacts, and the Soil and Water Assessment Tool (SWAT), used to evaluate watershed scale dynamics and impacts. Both models were also adapted to better simulate some processes, such as soil moisture dynamics. These model capacity improvements impacted analytic interpretation, model function, and results; the 2003-06 data were reanalyzed alongside the 2012 data in both the APEX and SWAT simulations informing this report. The more robust approach used in these analyses produced results that differ from previously reported results for the Great Lakes region (USDA-NRCS 2011). Therefore, readers of both reports will notice differences in certain results, procedures, and interpretations. This report complements the recently released report titled, “Effects of Conservation Practice Adoption on Cultivated Cropland Acres in Western Lake Erie Basin, 2003-06 and 2012” (published 2016), also based on the 2011 WLEB survey. While the 2016 report quantifies conservation practice adoption impacts at the edge-of-field scale, this report assesses the impacts of those edge-of-field impacts at the watershed scale (4-digit HUC), with consideration of watershed and instream processes. Both reports explore alternative single- and multiple-approach conservation scenarios. A second national CEAP-Cropland survey was collected over 2015 and 2016 (CEAP-2); this effort will inform a new series of regional reports, including the Great Lakes region. The 2015-2016 data is not included in this report. USDA has a rich tradition of working with farmers and ranchers to enhance agricultural productivity and environmental conservation through voluntary programs. Many USDA programs provide financial assistance to producers to encourage adoption of conservation practices appropriate to local soil and site conditions. Other USDA programs work in tandem with state and local programs to provide technical assistance to design, install, and implement conservation practices that are consistent with farmer objectives, current science, and policy goals.
As soil and water conservation remains a national priority, it is imperative to quantify the effectiveness of current conservation practices and programs and to identify possible means to improve conservation gains. Over the past several decades, as the relationship between crop production and the environment on which it depends has become better understood, goals have shifted from solely preventing erosion to achieving sustainable agricultural productivity. Expansion of the scientific understanding of agroecological systems has contributed to a broadening of USDA conservation policy objectives and development of more sophisticated conservation planning, practice design, and implementation to address multiple conservation concerns and benefit multiple ecosystem services. These more holistic conservation goals and management approaches enable NRCS to work with agricultural producers to plan, select, and apply conservation practices that best support their continuous long-term operations to produce food, forage, feed, and fiber, while conserving the Nation’s soil, air, and water resources, and maximizing benefits to the organisms that depend on them.
iv
Conservation Practice Adoption on Cultivated Cropland Acres: Effects on Instream Nutrient and Sediment Dynamics and Delivery in Western Lake Erie Basin, 2003-06 and 2012.
Table of Contents Executive Summary ................................................................................................................................................................................... v
Chapter 1: Sampling and Modeling Approach ........................................................................................................................................... 1
Scope of Study ....................................................................................................................................................................................... 1
The NRI-CEAP-Cropland Farmer Survey ............................................................................................................................................. 4
Sampling and Modeling Approach ........................................................................................................................................................ 4
Reporting Scale ..................................................................................................................................................................................... 5
Chapter 2: Agricultural Conservation Practices in WLEB ........................................................................................................................ 7
Conservation Practice Use: Historical Context ..................................................................................................................................... 7
Summary of Conservation Practice Adoption in 2003-06 and 2012 ................................................................................................... 13
Summary of the Impacts: Conservation Practice Adoption in 2003-06 and 2012 ............................................................................... 15
Chapter 3: Offsite Impacts of Conservation Practices—2003-06 and 2012 ............................................................................................ 17
The Soil and Water Assessment Tool—SWAT ...................................................................................................................................... 17
Point and Nonpoint Sources ................................................................................................................................................................ 20
Atmospheric Nitrogen Deposition ....................................................................................................................................................... 21
Routing and Channel Processes ........................................................................................................................................................... 21
Source Loads and Instream Loads ....................................................................................................................................................... 21
Simulating the Effects of Weather ....................................................................................................................................................... 22
Calibration and Validation of SWAT .................................................................................................................................................. 23
Model Results: 2003-06 and 2012 Conservation Conditions .............................................................................................................. 24
Hypothetical Conservation Scenario Simulations, Set-up, and Definitions ........................................................................................ 31
Hypothetical Conservation Scenario Simulation Results .................................................................................................................... 34
Summary of Conservation Practice Effects on Water Quality in the Western Lake Erie Basin Watershed ........................................ 47
References ................................................................................................................................................................................................ 54
Appendix A: The No-Practice Scenario ................................................................................................................................................... 64
Appendix B: Rules for Applying Practices in Hypothetical Conservation Scenarios .............................................................................. 69
Documentation Reports A series of documentation reports and associated publications by members of the modeling team and CEAP-Cropland component are available on the USDA-NRCS CEAP website at http://www.nrcs.usda.gov/technical/nri/ceap.
v
Executive Summary
The Western Lake Erie Basin (WLEB) is important economically and ecologically. Over the past half century there has been increased focus on the interactions between land-uses and water quality in the region, as has occurred across the Nation. Roughly 73 percent of the land in WLEB is managed as cultivated cropland. Since the relationship between nutrients and Lake Erie were brought to public awareness nearly 50 years ago, WLEB agricultural producers, following the advice of scientists and policy makers, have consistently sought to adopt responsible agricultural practices that reduce the impacts of agriculture on the Great Lakes system, maintain yield stability, and support farming sustainability. This report covers some of the recent history of agricultural conservation and its impacts on water quality in WLEB. This report represents the second time that the Conservation Effects Assessment Project (CEAP) has completed a voluntary farmer survey in WLEB; the first survey was conducted in 2003-06, with the second conducted in 2012. Having two survey periods allows analysis of change over time in agricultural conservation adoption and estimation of the impacts of these changes on water and soil quality.
This is the second of two CEAP reports covering the 2012 Special Study in WLEB; the first report analyzed edge-of-field loss dynamics, while this report focuses on instream channel dynamics and their role in determining the relationships between edge-of-field conservation gains and gains made towards reducing sediment and nutrient load deliveries to Lake Erie and reducing deposition of nutrients and sediment in the ditches, channels, streams, and rivers of WLEB. While reductions in edge-of-field losses and lake delivery loads may have immediate impacts on water quality across WLEB, reductions in deposition rates may have significant impacts on future conservation outcomes. Nutrients and sediment deposited in the WLEB hydrological system from current and past land-uses may serve as legacy sources of nutrients and sediment well into the future, impacting delivery loads even as edge-of-field conservation efforts continue to reduce edge-of-field losses.
Conservation Gains in Western Lake Erie Basin (WLEB)
Between the 2003-06 and 2012 surveys, farmers continued to adopt conservation practices in WLEB. The impacts of these conservation practices are most obvious when the 2003-06 or 2012 Conservation Conditions are compared with what losses, loads, and deposition rates could be like if no agricultural conservation practices were ever adopted in WLEB.
Relative to if no conservation practices were in place:
• the 2003-06 Conservation Condition: o decreases sediment losses from cultivated croplands by 61 percent; o decreases sediment load delivery to Lake Erie by 29 percent; and o decreases sediment deposition in ditches, channels, streams, and rivers in WLEB by 65 percent.
o decreases nitrogen losses from cultivated croplands by 22 percent; o decreases nitrogen load delivery to Lake Erie by 16 percent; and o decreases nitrogen deposition in ditches, channels, streams, and rivers in WLEB by 26 percent.
o decreases phosphorus losses from cultivated croplands by 53 percent; o decreases phosphorus load delivery to Lake Erie by 39 percent; and o decreases phosphorus deposition in ditches, channels, streams, and rivers in WLEB by 60 percent.
• the 2012 Conservation Condition:
o decreases sediment losses from cultivated croplands by 80 percent; o decreases sediment load delivery to Lake Erie by 40 percent; and o decreases sediment deposition in ditches, channels, streams, and rivers in WLEB by 84 percent.
o decreases nitrogen losses from cultivated croplands by 26 percent; o decreases nitrogen load delivery to Lake Erie by 17 percent; and o decreases nitrogen deposition in ditches, channels, streams, and rivers in WLEB by 37 percent.
o decreases phosphorus losses from cultivated croplands by 61 percent; o decreases phosphorus load delivery to Lake Erie by 41 percent; and o decreases phosphorus deposition in ditches, channels, streams, and rivers in WLEB by 72 percent.
vi
Comparison Between 2003-06 and 2012 Conservation Conditions A primary benefit of conducting the 2012 National Resources Inventory (NRI) CEAP-Cropland Farmer Survey is that it allows comparison of conservation benefits achieved at two points in time, in 2003-06 and 2012. Current APEX and SWAT modeling capacities allow estimation of changes in edge-of-field nutrient and sediment losses and load deliveries to Lake Erie, as well as estimation of changes in instream dynamics. Simulated instream or channel dynamics provide estimates of the amount of sediment and nutrients being deposited and or remobilized annually under simulated conditions. Sediment and nutrients deposited in the WLEB hydrological system from past, current, or future land-uses may serve as sediment and nutrient sources, impacting delivery loads and masking edge-of-field conservation gains. As shown above, relative to if no practices were in place, the 2003-06 Conservation Condition provides significant benefits to reducing sediment and nutrient losses from the edge of cultivated cropland fields, reducing the amount of sediment and nutrients delivered to Lake Erie and reducing the amount of sediment and nutrients deposited in ditches, channels, streams, and rivers. The 2012 Conservation Condition provides additional benefits to those provided in the 2003-06 Conservation Condition. The outcomes noted below call attention to the significant roles that deposition and resuspension play in instream dynamics in WLEB ditches, channels, streams, and rivers. Relative to the 2003-06 Conservation Condition, the 2012 Conservation Condition:
o decreases sediment losses from cultivated croplands by 47 percent; o decreases sediment load delivery to Lake Erie by 14 percent; and o decreases sediment deposition in ditches, channels, streams, and rivers in WLEB by 55 percent.
o decreases nitrogen losses from cultivated croplands by 6 percent; o decreases nitrogen load delivery to Lake Erie by 1 percent; and o decreases nitrogen deposition in ditches, channels, streams, and rivers in WLEB by 16 percent.
o decreases phosphorus losses from cultivated croplands by 17 percent; o decreases phosphorus load delivery to Lake Erie by 3 percent; and o decreases phosphorus deposition in ditches, channels, streams, and rivers in WLEB by 30 percent.
Hypothetical Conservation Scenario Simulations
Single-approach and Multiple-approach Conservation Scenarios were simulated and compared to the 2003-06 and 2012 Conservation Conditions. Single-approach Conservation Scenarios simulated include the adoption of structural practices, the adoption of appropriate nutrient management for all crops in all rotations, and the adoption of cover crops. Multiple-approach Conservation Scenarios simulated include the following combinations of Single-approach Conservation Scenarios: structural erosion control plus nutrient management; structural erosion control plus nutrient management plus cover crops; and structural erosion control plus nutrient management plus drainage water management. In the simulation of each hypothetical Conservation Scenario, all acres that could receive treatment under the rulesets of that Conservation Scenario were treated with the practices applied within that Scenario. Although farmers and policy makers would likely consider costs and benefits when making a decision to adopt a conservation practice or program, in these analyses we did not consider the potential impacts of conservation practices on crop yields or magnitude of conservation benefits.
This is the first CEAP-Cropland report that estimates impacts of conservation practices on legacy load dynamics in addition to edge-of-field losses and delivery loads to Lake Erie. Results demonstrate that adoption of a comprehensive conservation approach addressing all aspects of the Avoid, Control, Trap (ACT) conservation system should be undertaken on all cultivated cropland acres in WLEB in order to achieve maximum benefits from conservation practice adoption. There is no “Best Management Practice” that fits every conservation goal and every acre’s vulnerabilities. Instead, comprehensive conservation plans that pair complementary practices will provide the best management. Such plans are tailored to meet articulated conservation concerns in the context of farmer goals, soil needs, local weather, and other characteristics unique to each farmed acre. The most recent WLEB-CEAP report (2016) suggested that expansion of Variable Rate Technologies and soil testing may be important factors in achieving continued conservation gains in the region.
Relative to the 2012 Conservation Condition the most effective hypothetical Conservation Scenarios simulated here:
• for reducing edge-of-field sediment losses are: o Structural Erosion Control plus Nutrient Management plus Cover Crops (89 percent annual sediment loss reduction).
• for reducing sediment delivery loads to Lake Erie are: o Structural Erosion Control plus Nutrient Management plus Cover Crops (26 percent annual sediment load delivery
reduction).
vii
• for reducing sediment load deposition in ditches, channels, streams, and rivers in WLEB are: o Structural Erosion Control, Structural Erosion Control plus Nutrient Management, Structural Erosion Control plus
Nutrient Management plus Drainage Water Management, and Structural Erosion Control plus Nutrient Management plus Cover Crops (100 percent annual reduction in sediment deposition; these four Scenarios lead to resuspension of previously deposited sediment).
• for reducing edge-of-field nitrogen losses are: o Structural Erosion Control plus Nutrient Management plus Cover Crops (54 percent annual nitrogen loss reduction).
• for reducing nitrogen delivery loads to Lake Erie are: o Structural Erosion Control plus Nutrient Management plus Cover Crops (42 percent annual nitrogen load delivery
reduction). • for reducing nitrogen load deposition in ditches, channels, streams, and rivers in WLEB are:
o Structural Erosion Control plus Nutrient Management plus Cover Crops (59 percent annual reduction in nitrogen deposition) and Structural Erosion Control plus Nutrient Management, Structural Erosion Control plus Nutrient Management plus Drainage Water Management (42 percent annual reduction in nitrogen deposition).
• for reducing edge-of-field phosphorus losses are: o Structural Erosion Control plus Nutrient Management plus Cover Crops (50 percent annual phosphorus loss reduction).
• for reducing phosphorus delivery loads to Lake Erie are: o Structural Erosion Control plus Nutrient Management plus Cover Crops (23 percent annual phosphorus load
delivery reduction). • for reducing phosphorus load deposition in ditches, channels, streams, and rivers in WLEB are:
o Structural Erosion Control plus Nutrient Management plus Cover Crops (80 percent annual reduction in phosphorus deposition).
Conservation Investments in WLEB
Conservation practice investments in WLEB are substantial; in 2012, adoption of conservation practices in WLEB cost around $277 million annually, with funding from federal and state sources, non-profit organizations, farmers’ pockets, and more. Annualized costs associated with the hypothetical Conservation Scenarios simulations were estimated to include the following annual investments plus the annual investment ($277 million) associated with maintaining the 2012 Conservation Condition:
• Structural Erosion Control: $48.4 million for increased treatment on 68 percent of WLEB cultivated cropland acres. • Nutrient Management: $111.7 million for increased treatment on 88 percent of WLEB cultivated cropland acres. • Cover Crops: $284.1 million for increased treatment on 99 percent of WLEB cultivated cropland acres. • Erosion Control plus Nutrient Management: $154.6 million for increased treatment on 96 percent of WLEB cultivated
cropland acres. • Erosion Control plus Nutrient Management plus Cover Crops: $439.5 million for increased treatment on 100 percent of
WLEB cultivated cropland acres.
Take-Away
This research demonstrates that farmers have been willing to listen to and respond to recommendations made by scientists and policymakers in order to help address environmental concerns around Lake Erie. Voluntary conservation continues to make strides in the region, decreasing edge-of-field nutrient and sediment losses, thus reducing the amount of nutrients and sediment being deposited in WLEB waterways and the amount of nutrients and sediment being delivered to Lake Erie. As of 2012 the regional investment in agricultural conservation totaled roughly $277 million, with an average of 2.4 practices per cultivated cropland acre and an average per-acre treatment cost of $57 (USDA-NRCS 2016). Comprehensive conservation planning will continue to be essential to achieving the most effective and economical gains. There are opportunities for increased conservation gains in the region, especially through planning for emerging conservation concerns. Similarly, it is important to determine the conservation goals on which it is most desirable to focus, taking into consideration both spatial and temporal goals and realities. Edge-of-field goals are most quickly met with on-field practices, but complementary instream and in-lake conservation practices may be necessary if a faster response is desired in delivery load and lake concentration reduction. The only way to develop effective conservation success is to assess conservation needs and goals and adopt strategies and comprehensive conservation plans specific to the goals, while considering temporal and spatial constraints that may delay achievement of those goals even when appropriate conservation practices have been adopted.
1
Chapter 1: Sampling and Modeling Approach
Scope of Study This study provides a regional, watershed-scale evaluation of the anticipated impacts of long-term adoption of cultivated cropland management and agricultural conservation practices reported to be in use in Western Lake Erie Basin (WLEB) in 2003-06 and 2012 on instream dynamics and load deliveries. The area surveyed includes all of subregion 0410, the 11,900 square mile area defined by the U.S. Geologic Survey (USGS) as the Western Lake Erie Basin, including land draining into Lake Erie from the Huron River Basin boundary to and including the Vermilion River Basin.1 States with acreage in WLEB include Indiana, Michigan, and Ohio. This report complements the 2016 USDA-NRCS CEAP-Cropland report, “Effects of conservation practice adoption on cultivated cropland acres in Western Lake Erie Basin, 2003-06 and 2012,” which used the process-based model Agricultural Policy Environmental eXtender (APEX) to estimate effects of agricultural management and conservation practices on edge-of-field water, sediment, soil carbon, nitrogen, and phosphorus loss dynamics at the regional scale. APEX-derived estimates of the impacts of 2003-06 and 2012 Conservation Conditions in WLEB provide a better understanding of conservation gains at the edge-of-field scale, which contribute to conservation benefits at the watershed scale. In this report, the APEX edge-of-field outputs are used as inputs into the process-based, watershed scale Soil and Water Assessment Tool (SWAT; Arnold et al. 1999). The SWAT model is a hydrological model that simulates the impacts of other land-uses alongside cultivated cropland to provide information on the impacts of agricultural conservation on instream water quality, including nutrient and sediment deliveries from other land-uses. In these analyses, APEX and SWAT were used to estimate and compare average long-term annual impacts of agricultural conservation practices in use in WLEB in 2003-06 and 2012, as well as various simulated hypothetical Conservation Scenarios, on: • Sediment and nutrient deliveries derived from all land-
uses, including cultivated cropland, to the WLEB hydrological system;
• Sediment and nutrient deposition and resuspension dynamics in WLEB ditches, channels, streams, and rivers; and
• Sediment and nutrient load deliveries from all land-uses to Western Lake Erie.
1 Please consult https://water.usgs.gov/GIS/huc.html for an overview of the USGS hydrologic unit code (HUC) naming system and https://water.usgs.gov/GIS/wbd_huc8.pdf for a list of USGS-developed watershed names and codes.
These analyses were designed to isolate the impacts of changing agricultural management and conservation practice adoption on water quality concerns. The comparisons between the 2003-06 and 2012 Conservation Conditions hold all other land-use impacts constant. Therefore, all differences between the results of the two scenarios can be attributed to changes in agricultural management and conservation treatment, including both cultural and structural practices, between the two sampling dates. Although the exact farm fields sampled and simulated differed between the 2003-06 and 2012 Conservation Conditions, the random point selection used in both sampling periods was designed to provide model input data representative of agricultural management in WLEB at the HUC-4 scale. This study quantifies and compares the anticipated average annual impacts of long-term adoption of conservation practices reported to be in place in 2003-06 with those reported to be in place in 2012, regardless of how, when, or why the practices came to be in use. These analyses are not restricted to conservation practices implemented through federal conservation practices or programs. Rather, practices considered in simulations of the 2003-06 and 2012 Conservation Conditions include those adopted by farmers on their own, as well as practices that are the result of federal, state, or local programs or initiatives. This report is not and should not be considered an evaluation of federal conservation programs. This report uses the SWAT model to estimate the average annual impacts anticipated from long-term adoption of agricultural conservation practices and management reported to be in use on cultivated cropland acres in WLEB in 2003-06 and 2012. Two aspects of conservation practice impacts are explored at the watershed scale: impacts on loads delivered to Lake Erie (instream) and impacts on loads deposited or resuspended in the WLEB hydrological system. These simulations are not intended to account for future climate, future technology development, or future conservation decisions made by the agricultural or other sectors of society. Instead, this simulation approach represents average annual outcomes that may be expected once the reported agricultural management practices take full effect, assuming use of current technology and continuation of recent weather patterns. Recent work identifying trends related to increased river discharge in WLEB related to increased regional precipitation (Stow et al. 2015) are not discounted; the weather used in these analyses includes data from 1960-2006, so it does capture the impacts of trends in precipitation dynamics that have occurred over time. However, these analyses do not predict future weather patterns,
2
but simulate impacts under 56 years of historical weather. This is not a long-term trend analysis of changes in conservation practice impacts over time. The hypothetical Conservation Scenario Simulations explored in the final chapter of this report were all simulated by applying alternative agricultural management practices to subsets of the farm fields sampled in the 2012 survey. Across all model runs, model inputs associated with other land-uses were held constant. Therefore, differences between the outputs of the Conservation Scenario Simulations capture the impacts of hypothetical agricultural management but do not account for potential changes in conservation status or pollution from other land-uses. Further, acreage associated with various categories of all land-uses is held constant in these analyses; for example, urban area and point source inputs are static across the analyses. This report provides insights on various economic aspects of natural resource management in WLEB, including estimation of economic costs and ecological benefits associated with conservation practices in use in 2003-06 and 2012. The analyses of the costs and benefits of various hypothetical Conservation Scenario Simulations, including Single-approach Conservation Scenarios (e.g., nutrient management or structural erosion control) and Multiple-approach Conservation Scenarios (e.g., nutrient management combined with structural erosion control) are also provided. The impacts of the hypothetical Conservation Scenarios Simulations analyzed in this report are explored only in terms of impacts on nutrient and sediment loss, deposition, and load delivery dynamics. These scenarios do not take potential crop yield declines into consideration, nor do they consider values associated with ecosystems services these practices provide, beyond those related to water quality. These simulations are necessarily coarse because of the model capabilities and reporting scale. Simulation of blanket adoption of a given practice is not meant to suggest that these simulations seek to identify a “best management practice” appropriate for all acres in WLEB. Responsible conservation requires the development of a comprehensive conservation plan tailored to a farmer’s conservation and production goals and field’s particular needs and vulnerabilities. Often there are cost-benefit tradeoffs to be considered when conservation practices are selected. Agricultural conservation practices have been adopted in the Western Lake Erie Basin (WLEB) with the goal of lowering sediment, nitrogen, and phosphorus impacts on Lake Erie and contributing to an improvement of the ecological health of the region’s ditches, channels, streams, rivers, and lake. At the field scale, conservation practices have been linked to measurable effects and tangible benefits (Cherry et al. 2008; Marton et al. 2014; Tomer et al. 2014; Her et al. 2016). The previous USDA-NRCS CEAP-Cropland report (2016) provides estimates of anticipated conservation benefits at the edge-of-field scale. Edge-of-field loss reductions tend not to have a one-to-one relationship with changes in stream, river, and lake water
quality (Sharpley et al. 2009). Once the nutrients and sediment from cultivated cropland reaches ditches, channels, streams, rivers, and groundwater, they interact with water, sediment, and nutrients from other sources. In these analyses, the SWAT model is used to account for interactions between water, nutrients, and sediment lost from all land-uses to the WLEB hydrological system. SWAT analyses provide estimates of benefits of agricultural conservation practices at the watershed scale, the scale at which the public enjoys the benefits of conservation practices enacted on private lands. However, it should be noted that there are concerns around model uncertainty (of any model) at the catchment scale, due to the complexity in spatial and temporal calibration and validation (Cherry et al. 2008). Model uncertainty is not addressed in this report, but should be taken into consideration whenever policy makers or other stakeholders use modeled information to inform decision making. Beneficial impacts of conservation efforts may be masked or hampered by the impacts of a number of factors, including climate change, land-use legacies, phosphorus banking in soils and sediments, erosion reduction, increased tile drainage, changing rental agreements, increased ditch connections, alternative stable states, anoxic and hypoxic events, stream biota, and invasive species (Svendsen et al. 1995; Jarvie et al. 2013a; Kane et al. 2014; Smith et al. 2015a; Muenich et al. 2016; Powers et al. 2016; Sharpley 2016; Zhang et al. 2016a). Currents in the western basin of Lake Erie may also contribute to in-lake recycling of nutrients, slowing the impacts of conservation benefits, especially in the western portion of the Lake (Charlton et al. 1993). In-lake nutrient cycling may delay measurable remediation of the eutrophic conditions, even after external nutrient loading has been reduced (Paerl et al. 2016a; Matisoff et al. 2016). For example, it is estimated that in the Western basin of Lake Erie, annual internal phosphorus contributions average between 20-42 percent of the current loading goals (Matisoff et al. 2016). Accumulated phosphorus can take decades or even centuries to “drawdown,” making it difficult to assess long-term conservation practice impacts (Meals et al. 2010; Han et al. 2012; Mittelstet and Storm 2016). There are numerous locations in arable lands where legacy loads may be stored. Soils, subsoils, macropores, and preferential flow pathways within farm fields; structural erosion control areas like grassed waterways, vegetated buffer strips, and riparian buffers; and constructed wetlands may serve as sediment and nutrient sinks and sources, especially for phosphorus (Tomer et al. 2010; Jarvie et al. 2013b; Roberts et al. 2012; Sebilo et al. 2013; Sharpley et al. 2013; Liu et al. 2014; Andersson et al. 2015; Powers et al. 2016). Similarly, there are numerous off-farm locations where sediment and nutrients may be “banked,” including soils, subsoils, drainage ditches, riverbanks and riverbeds, streambanks and streambeds, wetlands, floodplains, reservoirs, and river deltas (Meals et al. 2010; Jarvie et al. 2012; Sharpley et al. 2013; Dupas et al. 2015a; Dodd and Sharpley 2016; Fox et al. 2016; Powers et al. 2016; Records et al. 2016). When sediment and nutrients are deposited in the hydrological system, they contribute to sediment and nutrient reservoirs, the dynamics of which can impact water quality for a long time.
3
Long-term accumulation and complex bind-and-release patterns of nutrients and sediment contribute to a “legacy effect,” which may cause a lag between when a conservation practice is enacted and when its benefits are measurable (Rosa and Burns 1987; Haygarth et al. 2014). Settling, resuspension, and redistribution of nutrients and sediments that occur as water moves through the hydrological system may contribute to lag-times of days, decades, or even centuries before conservation benefits are discernable (McDowell et al. 2002; Grizzetti et al. 2005; Cherry et al. 2008; Kleinman et al. 2011a, 2011b; Sharpley et al. 2013; Chen et al. 2014; Mittelstet and Storm 2016). For example, a meta-analysis by Meals et al. (2010) found that when phosphorus builds up in soils, it can take decades or longer of appropriate nutrient management to draw down soil phosphorus and soil nitrate to levels that would appreciably reduce edge-of-field losses. In a recent manuscript, simulated fertilizer reduction scenarios suggest it could take up to 30-40 years to achieve target reductions in WLEB because of the lag times associated with addressing legacy loads already in the system (Muenich et al. 2016). In an assessment of multiple U.S. and European watersheds, Cherry et al. (2008) report estimates of between 60-130 years for catchment scale nitrogen reduction to be achieved after conservation practice application; the authors attribute the delays to “hydrological time lags” and “catchment buffering.” It has also been shown that nitrogen retention in rivers is longer, and responses to conservation practice adoption are slower in flatlands and in areas with significant groundwater systems, typical of the majority of WLEB (Grizzetti et al. 2005). Legacy load impacts on sediment and nutrient dynamics are a primary reason that the evaluation of conservation practice success and identification of remaining challenges in watershed management cannot be regarded as solely reflective of today’s management (Meals et al. 2010; Sharpley et al. 2013). Changes in watershed management may shift system equilibria, such that previous nutrient-sink areas become nutrient-source areas (Svendsen et al. 1995; Sharpley et al. 2009) or vice-versa. In-stream measurements taken today include a mixture of nutrients from contemporary and previous sources and agricultural nutrients from current and previous years of application, which means they measure both “live” and “legacy” loads (Meals et al. 2010) and reflect both today’s and yesterday’s land-use management. Legacy loads provide chronic sources of phosphorus, while live loads act as acute sources, often in relation to runoff events (Buda et al. 2009; Kleinman et al. 2011a, 2011b). However, not all sediment and nutrient pulses come from live losses from cultivated cropland. Many streambanks have been reported to have high phosphorus concentrations (> 250 mg phosphorus per kg soil), likely derived from nutrient losses during past land management activities. In a meta-analysis, Fox et al. (2016) found that streambank and gully erosion may be responsible for up to 92 percent of suspended sediment and 93 percent of total phosphorus in a channel; however, in some cases streambank and gully contributions to sediment and phosphorus concentrations may be as low as 7 and 6 percent, respectively. In other words, legacy dynamics may be a significant
consideration in this region, but contributions are poorly understood and likely highly variable both spatially and temporally; more scientific studies of these phenomena are warranted (Fox et al. 2016; Mittelstet and Storm 2016; Powers et al. 2016). Improved understanding of the dynamics (processes regulating deposition, resuspension, and recycling) of both current and legacy loads at a river basin scale should enable policy makers and managers alike to manage systems under current conditions, whether the dominant nutrient and sediment “inputs” are from live or legacy sources (Némery and Garnier 2016). Consideration of legacy sources is especially important when using a mass balance to estimate nutrient and sediment loads from nonpoint sources, including agriculture (Svendsen et al. 1995). However, it is extremely rare to find mass balance studies that account for all legacy dynamics in a watershed, including contributions to, contributions from, and locations of legacy pools (Mittelstet and Storm 2016). Failure to account for inputs provided by legacy loads may cause over-estimation of current nonpoint source contributions to phosphorus loading (Jarvie et al. 2012). Similarly, failure to acknowledge the uncertainty around sources and sinks can lead to incorrect interpretations of nutrient dynamics in a system (Fox et al. 2016; Mittelstet and Storm 2016). A comprehensive understanding of legacy loads and their impacts on current water quality, potential future legacy loads and their impacts on water quality, and the uncertainties around these estimates is critical to setting realistic and attainable goals for nutrient and sediment load reductions, as well as to managing public and policy expectations around the rate and scale of progress to be expected. Climate change may have a significant impact on nutrient and sediment dynamics in WLEB. Some research suggests that both temperatures and flows increased in the Sandusky and Maumee Rivers between 1975 and 2005 (Richards et al. 2009). SWAT simulations suggest that climate change could decrease the efficacy of current conservation practices due to increased tributary flows, which could lead to increased sediment and nutrient losses in WLEB (Bosch et al. 2014). However, other scientists suggest a need for more research on the interactions between climate variability, conservation practices, and other land-use change in order to better understand potential impacts on nutrient dynamics in complex watersheds (Powers et al. 2016). Occasional flooding events may increase nutrient flushes more than would be expected from the volume of water moving through the system. In Danish river systems, Svendsen et al. (1995) found that up to 94 percent of phosphorus associated with stormflow discharge was derived from resuspended phosphorus. King et al. (2017) found that over a series of rainfall events in WLEB in June and July of 2015, dissolved reactive phosphorus concentrations did not decline with repeated events, indicating the presence of legacy phosphorus impacting phosphorus loss dynamics at field to basin scales. Occasional flooding events can change the redox state of soils, potentially increasing phosphorus mobilization from sinks, and/or converting particulate-bound phosphorus into more mobile forms of phosphorus (Dupas et al. 2015b). Further, flooding events may cause pulses in microbial biomass, which
4
can lead to larger than expected phosphorus losses (Dodd and Sharpley 2016). Simulation results presented here largely reflect the long-term impacts of the “live” loads lost from farm fields during the 52-year simulation period. The predicted live load losses are determined by the model’s simulated interactions with reported management systems and daily weather over the 52-year simulation period. These simulations do not capture impacts of past land management on potential sediment and nutrient reservoirs in the WLEB hydrological system. In some cases the simulations suggest sediment resuspended from the WLEB hydrological system is part of the load delivered to Lake Erie; in these instances the resuspended sediment dynamics could be considered as representative of legacy load dynamics. These simulations do not represent a transition from one management to another, nor are they intended to provide “real-time” simulations. Rather, these simulations represent anticipated long-term average annual impacts of conservation practices reported to be in use in 2003-06 and 2012. The NRI-CEAP-Cropland Farmer Survey Additional details on the National Resources Inventory (NRI) CEAP-Cropland Farmer Survey and development of the APEX modeling simulations used to populate the cropland input data for the SWAT model can be found in “Effects of conservation practice adoption on cultivated cropland acres in Western Lake Erie Basin, 2003-06 and 2012” (USDA-NRCS 2016). Simulations of the 2003-06 and 2012 Conservation Conditions are based on NRI-CEAP-Cropland Farmer Surveys administered by the USDA National Agricultural Statistics Service (NASS) in 2003-06 (492 sample points) and 2012 (1,019 sample points), respectively.2 Sixty-eight percent of the points visited in 2003-06 were resampled in 2012. Farmer participation was voluntary, and the information gathered is confidential. The sample design and survey content were specifically developed to provide information on farming activities for use with a physical process-based model, to enable estimation of the impacts of conservation practice adoption at the edge-of-field scale. In the SWAT simulations that inform this report, acreages of cultivated cropland and all other land-uses remained constant for simulation of both the 2003-06 and 2012 Conservation Conditions. This report elucidates changes in cultivated cropland management between the two survey periods and the impact of those changes on conservation concerns. This report does not consider land conversion impacts or changes in impacts of any land-use other than cultivated cropland between the two sampling dates. For purposes of this report, cultivated cropland includes land in row crops or close-grown crops, and hay and pasture grown in rotation with row crops and close-grown crops. Cultivated
2 Both surveys, the enumerator instructions, and other documentation are at http://www.nrcs.usda.gov/wps/portal/nrcs/detail/national/technical/nra/ceap/?cid=nrcs143_014163
cropland does not include land maintained in perennial hay, pasture, or horticulture for 3 or more years without inclusion of an annual crop in the rotation. Relevant to this report, the NRI-CEAP-Cropland Farmer Survey obtained the following management information for the survey year and the 2 years prior to the survey year:
• crops grown, including double crops and cover crops; • crop rotation plan; • application of commercial fertilizers (source, method,
rate, and timing); • application of manure (source and type, nutrient content,
consistency, method, rate, and timing); • irrigation practices (system type, amount, and
frequency); and • timing and equipment used for all field operations
(tillage, planting, cultivation, and harvesting).
Additional survey information included: • date and outcome of most recent soil nutrient test; • conservation practices associated with the field; • field characteristics, such as proximity to a water body
or wetland and presence of tile or surface drainage systems; and
• general characteristics of the operator and the operation.
In a separate and complementary survey, NRCS field offices provided information on the practices specified in conservation plans for the farm field associated with each sampled point, when applicable. Sampling and Modeling Approach The CEAP-Cropland sampling and modeling approach captures the diversity of land-uses, soils, climate, and topography; accounts for site-specific farming activities; estimates the loss of materials at the edge-of-field scale, where the science is most developed; and provides a statistical basis for aggregating edge-of-field results to the regional level, the scale at which society enjoys agroecological benefits of conservation. Additional details on the NRI-CEAP-Cropland Farmer Survey and development of the APEX modeling simulations used to populate the cropland input data for the SWAT model can be found in “Effects of conservation practice adoption on cultivated cropland acres in Western Lake Erie Basin, 2003-06 and 2012” (USDA-NRCS 2016). During both the 2003-06 and 2012 sampling periods the NRI-CEAP-Cropland Farmer Survey collected detailed information on farming and conservation practices in use at the sampled NRI-points. The field-level effects of these practices were estimated with APEX, a field-scale physical process model which simulates day-to-day farming activities, yields, wind and water erosion, loss or gain of soil organic carbon, and edge-of-field losses of water, soil, and nutrients.
5
The hydrological conditions of cultivated cropland acres in WLEB interact with or drive the estimates of water, sediment, and nutrient losses from these agroecological systems. The APEX model was used to simulate long-term interactions between reported management and hydrological processes at the field scale under 2003-06 and 2012 Conservation Conditions, accounting for management and nutrient and sediment movement associated with precipitation, irrigation, evapotranspiration, surface water runoff, infiltration, and percolation beyond the bottom of the soil profile. The 2003-06 and 2012 Conservation Conditions are based on model simulations that account for cropping patterns, farming activities, and conservation practices, as reported in the 2003-06 and 2012 NRI-CEAP-Cropland Farmer Surveys, respectively, and other sources. In addition to analyzing changes between the 2003-06 and 2012 Conservation Conditions, a “No-Practice” Scenario was constructed to simulate the potential long-term impacts of the absence of agricultural conservation in the region (appendix A). The No-Practice Scenario is based on model simulations that do not include any agricultural conservation practices reported to be in use on the 2003-06 or 2012 sample points. In the No-Practice Scenario, soils, weather, crop rotations, and other model inputs (with the exception of those related to conservation practices) and model parameters are held the same as for the 2003-06 Conservation Condition. The No-Practice Scenario provides perspective on the benefits of conservation practices on cultivated cropland and the loads that would leave the edge of the field if no agricultural conservation practices were adopted in WLEB. Simulations of the 2003-06 and 2012 Conservation Conditions rely on four sources of conservation practice information:
1. NRI-CEAP-Cropland Farmer Surveys, administered by NASS;
2. NRI data; 3. Conservation plans on file at NRCS field offices; and 4. Reports on Conservation Reserve Enhancement
Program (CREP) and Continuous Conservation Reserve Program (CCRP) practices from USDA Farm Service Agency (FSA) offices.
Since publication of the “Assessment of the effects of conservation practices on cultivated cropland in the Great Lakes region” (USDA-NRCS 2011), there have been improvements to the APEX model and the datasets used to inform the model. Changes in the APEX model include advances in routing capacities between surface and subsurface loss pathways and improved simulation of the impacts of edge-of-field conservation practices (USDA-NRCS 2016). Additional details on APEX model improvements and changes in soils and weather data can be found in the 2016 report (USDA-NRCS 2016). Model output used to inform SWAT runs for this report is based on analysis of the 2003-06 and 2012 data in the newest version of APEX, APEXv1307. The SWAT modeling process is covered in Chapter 3 of this report.
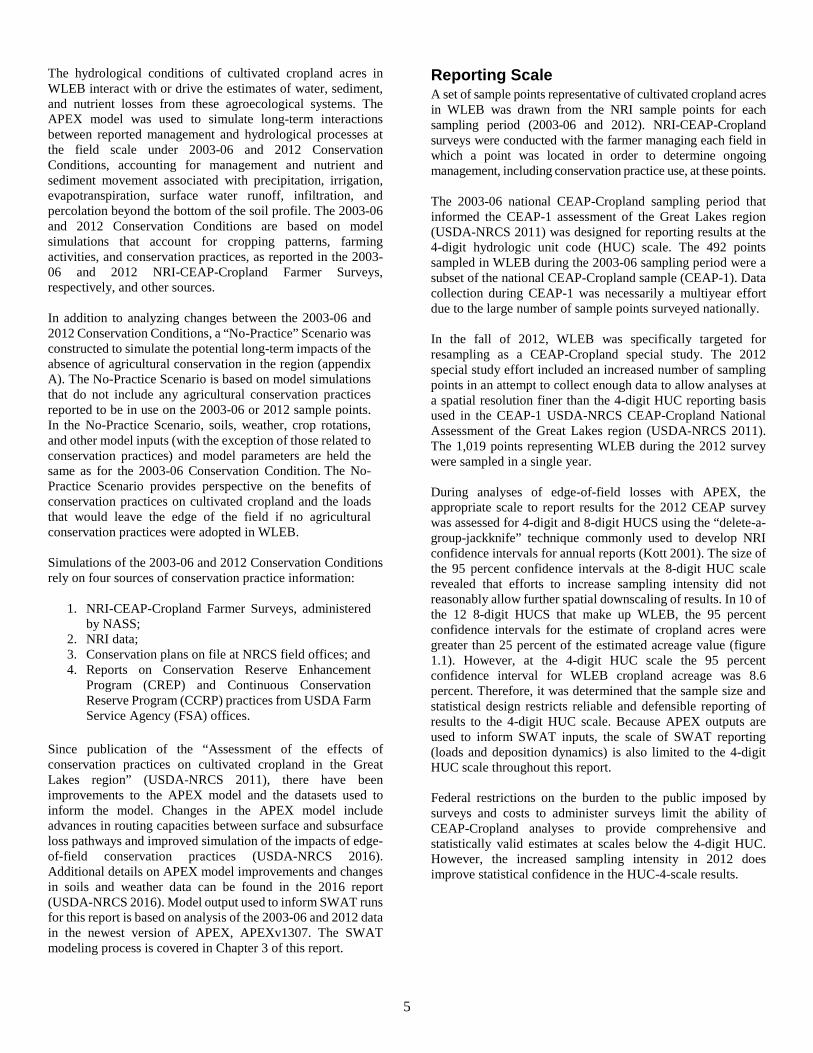
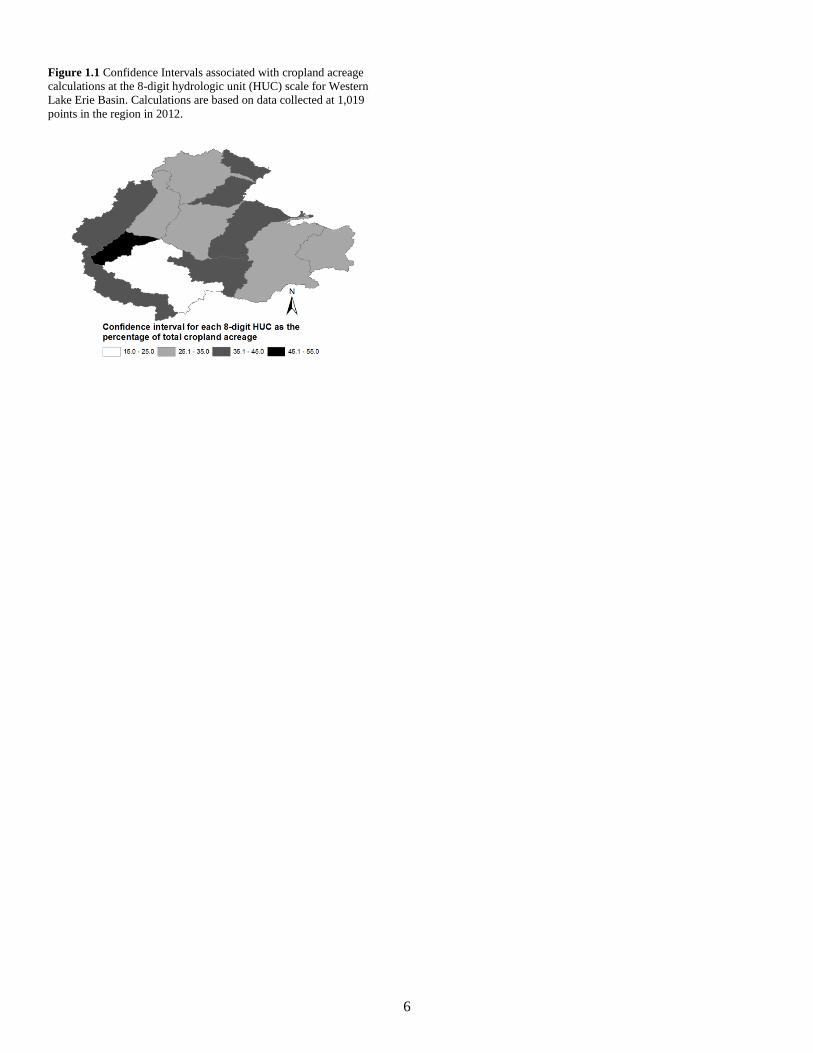
Reporting Scale A set of sample points representative of cultivated cropland acres in WLEB was drawn from the NRI sample points for each sampling period (2003-06 and 2012). NRI-CEAP-Cropland surveys were conducted with the farmer managing each field in which a point was located in order to determine ongoing management, including conservation practice use, at these points. The 2003-06 national CEAP-Cropland sampling period that informed the CEAP-1 assessment of the Great Lakes region (USDA-NRCS 2011) was designed for reporting results at the 4-digit hydrologic unit code (HUC) scale. The 492 points sampled in WLEB during the 2003-06 sampling period were a subset of the national CEAP-Cropland sample (CEAP-1). Data collection during CEAP-1 was necessarily a multiyear effort due to the large number of sample points surveyed nationally. In the fall of 2012, WLEB was specifically targeted for resampling as a CEAP-Cropland special study. The 2012 special study effort included an increased number of sampling points in an attempt to collect enough data to allow analyses at a spatial resolution finer than the 4-digit HUC reporting basis used in the CEAP-1 USDA-NRCS CEAP-Cropland National Assessment of the Great Lakes region (USDA-NRCS 2011). The 1,019 points representing WLEB during the 2012 survey were sampled in a single year. During analyses of edge-of-field losses with APEX, the appropriate scale to report results for the 2012 CEAP survey was assessed for 4-digit and 8-digit HUCS using the “delete-a-group-jackknife” technique commonly used to develop NRI confidence intervals for annual reports (Kott 2001). The size of the 95 percent confidence intervals at the 8-digit HUC scale revealed that efforts to increase sampling intensity did not reasonably allow further spatial downscaling of results. In 10 of the 12 8-digit HUCS that make up WLEB, the 95 percent confidence intervals for the estimate of cropland acres were greater than 25 percent of the estimated acreage value (figure 1.1). However, at the 4-digit HUC scale the 95 percent confidence interval for WLEB cropland acreage was 8.6 percent. Therefore, it was determined that the sample size and statistical design restricts reliable and defensible reporting of results to the 4-digit HUC scale. Because APEX outputs are used to inform SWAT inputs, the scale of SWAT reporting (loads and deposition dynamics) is also limited to the 4-digit HUC scale throughout this report. Federal restrictions on the burden to the public imposed by surveys and costs to administer surveys limit the ability of CEAP-Cropland analyses to provide comprehensive and statistically valid estimates at scales below the 4-digit HUC. However, the increased sampling intensity in 2012 does improve statistical confidence in the HUC-4-scale results.
6
Figure 1.1 Confidence Intervals associated with cropland acreage calculations at the 8-digit hydrologic unit (HUC) scale for Western Lake Erie Basin. Calculations are based on data collected at 1,019 points in the region in 2012.
7
Chapter 2: Agricultural Conservation Practices in WLEB Conservation Practice Use: Historical Context In 1909, the governments of the United States and Canada entered into the Boundary Waters Treaty (BWT). The novel agreement focused on protecting a shared ecosystem and promoting responsible enjoyment of the economic, social, and environmental services provided by the Great Lakes watershed. The binational and independent International Joint Commission (IJC) was created as the institution to guide the two nations towards the goals articulated in the BWT, including development of binational solutions to boundary water issues (De Pinto et al. 1986; Grover and Krantzberg 2015). In the mid-twentieth century scientists and the public became increasingly concerned over water quality issues and their impacts on the Great Lakes, particularly Lake Erie (Chandler and Weeks 1945; Langlois 1954; Britt 1955; Curl 1957). Increasingly large hypoxic events were observed in Central Lake Erie after 1930 (Beeton 1961) and phytoplankton populations increased markedly between 1919 and 1963 (Davis 1964). Excess nutrients introduced by anthropogenic activities in the region were suspected to be the driver behind the eutrophication symptoms observed in Lake Erie. Nitrate concentrations in Lake Erie waters rose by 50 percent between 1945 and 1962, as measured by the Toledo, Ohio, water treatment plant; similarly, phosphate concentrations were 4 times greater in 1962 than they were in 1945-46 (Verduin 1964). The IJC supported a study of Lake Erie, launched in the United States in 1963 and in Canada in 1964 (IJC 1970). Also in 1964, the Canadian and U.S. governments asked the IJC to develop a report on the status of nutrient loading, causes, and solutions in Lakes Erie and Ontario. Calls to action from citizens and scientists became increasingly more insistent (Sperry 1967; Kormondy 1970). In 1970 the IJC concluded that excessive phosphorus loading was the primary driver behind the eutrophication of Lake Erie, and 70 percent of the phosphorus entering Lake Erie was from industrial and municipal sources; these sources were targeted for immediate treatment (IJC 1970). In 1972 the IJC-driven Great Lakes Water Quality Agreement (GLWQA) was signed between the United States and Canada, with the explicit goals of reversing eutrophication and preventing algal blooms in the Great Lakes watershed through promotion of measures to reduce phosphorus discharge (De Pinto et al. 1986), much of which was in the form of dissolved reactive phosphorus (DRP). Total phosphorus loading goals of 14,600 metric tons per annum (MTA) were set for Lake Erie. Setting effluent limits for municipal sewage treatment plants (1 mg phosphorus per liter of effluent from plants discharging more than 1 million gallons per day) was emphasized as the primary means by which to achieve GLWQA phosphorus load reduction goals (De Pinto et al. 1986). Later, the effluent phosphorus reduction goals were extended to all point source discharges in WLEB (Chapra and Robertson 1977). Between 1972 and 1982 roughly $6 billion U.S. dollars were spent or obligated in the United States and
Canada to fund capital improvements to municipal wastewater facilities in the Great Lakes basin, although in 1982 there were still large wastewater treatment plants in the Lake Erie basin that had not achieved the GLWQA phosphorus loss reduction goals (IJC 1982). Lake Erie’s responses to decreased nutrient loads were not as fast or as homogenous as some had hoped, though models had predicted a lag-time in lake response (Di Toro and Connolly 1980). The Maumee and Sandusky Rivers also did not respond to phosphorus loading reductions as quickly as had been expected (Han et al. 2012). Although phosphorus loss reductions strategies were widely implemented by point sources in the early 1970s, western Lake Erie phosphorus concentrations peaked in 1979 (Maki et al. 1984). Between 1972 and 1982 total annual phosphorus loading in Lake Erie declined by about 30 percent, but phosphorus concentrations in Lake Erie water remained above the targets (De Pinto et al. 1986). The GLWQA was revised multiple times since its inception. In the 1978 iteration, the IJC recognized the potential role of nonpoint sources in phosphorus loadings and proposed a goal to reduce phosphorus inputs to Lake Erie from diffuse sources by at least 30 percent (IJC 1982). The same 1978 iteration lowered Lake Erie phosphorus loading targets to 11,000 MTA, a goal promptly met in 1981 and codified into a GLWQA Annex in 1983 (Baker et al. 2014). Though there was some concern that target loads for Lake Erie might have been set too high (De Pinto et al. 1986), scientists generally agreed that achievement of the GLWQA phosphorus load reduction goals would address the documented eutrophication symptoms in Lake Erie (Barica, 1982; Grover and Krantzberg 2015). It was anticipated that reducing phosphorus loads would lead to declines in algal blooms, which would reduce the occurrence of anoxic events caused by the decomposition of algal blooms (Lee 1973; Rosa and Burns 1987). Further, decreasing anoxic events would theoretically reduce phosphorus release from lake sediments, thus reducing internal lake loading (Maki et al. 1984). At the inception of the GLWQA, agriculture was assessed to contribute just 15-17 percent of the phosphorus loads delivered to Lake Erie (IJC 1970). Addressing agricultural phosphorus losses was considered a lower priority than addressing point sources (Kormondy 1970; Childs 1971; Di Toro and Connolly 1980), but some scientists predicted the necessity of treating nonpoint sources, particularly in Western Lake Erie, in order to reverse Lake Erie’s eutrophication (Chapra and Robertson 1977; Chapra et al. 1983). Specifically, scientists cautioned that adoption of point source “blanket phosphorus effluent criterion may lead to a false sense of security concerning eutrophication control, when in fact additional measures such as nonpoint source controls may be needed to slow accelerated eutrophication” (Gakstatter et al. 1978, page 1,157). The 1982 IJC report highlighted the importance of addressing urban and agricultural nonpoint sources to achieve phosphorus reduction
8
goals in the Great Lakes region. The same report suggested that the bioavailability of phosphorus should inform phosphorous control strategies (IJC 1982). Sedimentation rates in Lake Erie tripled between 1935 and the early 1970s; scientists suggested that such large volumes of sediment, independent of associated nutrient transfer, could negatively impact the lake’s ecosystem (Kemp et al. 1974). In 1970, roughly 66 percent of the total phosphorus in the Western Basin of Lake Erie was particulate-bound phosphorus (Burns 1976). Agricultural conservation plans developed to achieve GLWQA targets largely focused on conservation practices to provide particulate-bound phosphorous loss reduction, as particulate-bound phosphorus was the largest portion of the total phosphorus inputs from agriculture at the time reduction goals were set (Baker and Richards 2002; Richards et al. 2009). In the early 1980s, over 75 percent of the total phosphorus loading in Lake Erie was particulate-bound phosphorus; therefore, erosion reduction continued to be championed as the primary agricultural conservation goal in the region to reduce agriculture’s role in total phosphorus loading to Lake Erie (Baker and Richards 2002; Richards et al. 2009). In 1974-1975, the Lake Erie Wastewater Management Study (LEWMS) monitored and modeled 72 watersheds in WLEB to identify priority watersheds and counties that could be targeted for treatment with agricultural conservation in order to achieve the highest reductions in phosphorus and sediment losses (Forster and Rausch 2002). LEWMS-informed demonstration projects promoted adoption of “best management practices” across WLEB, including conservation tillage. From 1981-1985 the Great Lakes National Program Office also promoted the adoption of conservation tillage across the Maumee and Sandusky watersheds through the Accelerated Conservation Tillage Demonstration Project (Forster and Rausch 2002). In the 1990s Soil and Water Conservation Districts (SWCDs) in WLEB developed phosphorus reduction strategies focused on reducing sediment and total phosphorus loadings. By 1995 conservation tillage was in use on one or more crops in rotation on roughly 45 percent of cultivated cropland in the Maumee and Sandusky watersheds, primarily due to inclusion of no-till soybean in rotations (Richards et al. 2002). These changes in tillage operations were not simply due to a shift in crop rotations in WLEB. NASS data shows that during the 1990’s, corn acreage in WLEB decreased by 3 percent and soybean acreage increased by 7 percent, relative to corn and soybean acreage in the 1980’s. In that same time period, the percent of acres producing soybeans in WLEB under conservation tillage increased from 12 to 74 percent, while corn acres managed under conservation tillage increased from 19 to 31 percent (Baker et al. 2014). In Ohio, incentive-based conservation programs promoted voluntary adoption of conservation practices, including planting winter cover, adopting conservation tillage, and/or taking acres out of production by enrolling them in the Conservation Reserve Program (CRP) to provide permanent perennial vegetative cover. Adoption of streamside buffers and conversion of the region’s highly erodible lands (HEL) into
CRP management contributed to a reduction in sediment and particulate-bound phosphorus delivery to Lake Erie (Ohio Lake Erie Phosphorus Task Force 2010). By 1995, 85 percent of HEL in the Maumee River Basin and 97 percent of HEL in the Sandusky River Basin was treated with conservation practices to reduce erosion (Richards et al. 2002). In 2000, Ohio initiated the Lake Erie Conservation Reserve Enhancement Program (CREP) as part of the USDA Conservation Reserve Program, which provides incentives to farmers to install filter strips and riparian forest buffers and to restore wetlands. The multi-agency (federal, state, local, and private) Ohio Lake Erie Buffer Team was established in 2000, with the goal of enrolling 50,000 acres of conservation buffers in five years. WLEB acres enrolled in CRP or CREP increased from around 70,000 to roughly 170,000 acres between 1989 and 2002 (OLEC 2004). According to the National Resources Inventory (NRI), between 1982 and 2012 the amount of land maintained as cultivated cropland in WLEB declined from 5.4 to 4.8 million acres (USDA 2015). In the same time period, the annual rate of sheet and rill erosion on cultivated cropland acres declined from 2.8 to 1.2 tons per acre per year. The most dramatic reductions in rates of annual sheet and rill erosion in WLEB occurred between 1982 and 1997. Farmer adoption of structural erosion control practices across WLEB was complemented by improvements in nutrient management. WLEB farmers voluntarily shifted away from using nutrient management practices intended to increase soil phosphorus test levels to management designed to maintain or decrease soil phosphorus levels. This led to lower phosphorus application rates across WLEB, as farmers applied just enough phosphorus to replace the phosphorus removed by crops at harvest (Baker and Richards 2002; Sharpley et al. 2012). Between 1979 and 1995, phosphorus fertilizer application rates declined by 37 percent in the Maumee River Watershed and by 25 percent in the Sandusky River Watershed, with the largest declines in the early 1980s (Baker and Richards 2002; Richards et al. 2002). Over the twenty year period between 1975 and 1995, phosphorus surpluses in agricultural soils declined by an average of 7.1 pounds per acre in the Maumee River Basin and by 2.6 pounds per acre in the Sandusky River Basin (Baker and Richards 2002). Declining phosphorus fertilizer inputs and steady or slowly declining soil phosphorus levels were coupled with increasing crop yields and subsequent removal of nutrients at harvest. It can take a significant amount of time to draw down soil phosphorus stores to a point where phosphorus losses decline (Schulte et al. 2010; Mittelstet and Storm 2016; Sharpley 2016). However, soil test phosphorus has been identified as an excellent predictor of potential DRP losses from agricultural fields (Vadas et al. 2005; Meals et al. 2010). Therefore, it is possible that some of the soil phosphorus was lost as DRP when soil test phosphorus was high. In the Maumee and Sandusky Rivers, important tributaries to Western Lake Erie, the largest declines in total phosphorus
9
concentrations occurred in the 1990s-2000s. Between 1974 and 2004 total suspended sediment concentrations declined by 44 and 29 percent in the Maumee and Sandusky Rivers, respectively. Similarly, over the same time period particulate-bound phosphorus concentrations declined by 37 and 27 percent in the Maumee and Sandusky Rivers, respectively (Richards et al. 2009). These trends of decreasing particulate-bound phosphorus and sediment loading were attributed to “the success of agricultural management programs in these watersheds in reducing erosion and delivery of sediment and associated phosphorus to the tributary system” (Richards et al. 2009, page 211). Agricultural conservation, including no-till systems, conversion to CRP, and reduced manure use were credited with reducing total phosphorus loading in the Maumee and Sandusky by 40 percent and dissolved phosphorus by 77 percent between 1975 and 1995 (Sharpley et al. 2009). Some scientists argue that the long-term decline in total suspended solids and the apparently decoupled response exhibited by total Kjeldahl nitrogen and nitrate nitrogen as compared to total phosphorus indicates beneficial impacts of agricultural conservation practices (Miltner 2015). As recently as 2015 researchers asserted that in WLEB, “the question of whether [agricultural] management practices produce desired nutrient reductions remains largely unresolved at the watershed scale” (Betanzo et al. 2015, page 2). One of the reasons such questions remain unresolved is that historically and currently there is a paucity of monitoring data across WLEB (Maccoux et al. 2016). In fact, although new gauges are being installed across WLEB, at the time of this report there were only six extant stream gauge monitoring stations collecting data on total phosphorus, DRP, and streamflow on at least a daily basis with data records of more than 5 years (Betanzo et al. 2015). The IJC, GLWQA, and their science-based approach to addressing the eutrophication of Lake Erie have been held up as exemplary outcomes of successful binational relations (Matisoff and Ciborowski 2005; Chapra and Dolan 2012; Baker et al. 2014; Kleinman et al. 2015). In the early 1990s, total phosphorus concentrations in the central basin of Lake Erie were at or approaching desired levels, after 20 years of binational phosphorus load reduction efforts (Bertram 1993). It appeared that efforts to reduce particulate-bound phosphorus had achieved the GLWQA targets and were allowing the lake to recover. Between 1982 and 2011, annual total phosphorus loads delivered to Lake Erie averaged 9,491 MTA and the total phosphorus targets (11,000 MTA) were exceeded in 8 of the 30 years (Baker et al. 2014), with years in which the target was exceeded experiencing higher than average precipitation and runoff (Dolan and Chapra 2012). Between 2003 and 2013, the average total phosphorus loads delivered to Lake Erie ranged between 5,839 (a record low) and 11,946 MTA (Maccoux et al. 2016). By the late 1980s, total phosphorus concentration goals were largely achieved in Lake Erie, and by the 1990s, the general consensus was that the phosphorus load reduction strategies were working and Lake Erie was recovering (Makarewicz and Bertram 1991; Bertram 1993; Charlton et al. 1993; LaMP
2000). In fact, in 1991, the jurisdictions represented by the IJC stopped reporting annual total phosphorus loadings to Lake Erie (Dolan and Chapra 2012). By the mid-1990’s changes in fish diversity indices led researchers to conclude that eutrophication had been halted and reversed; Lake Erie was pronounced to be undergoing oligotrophication in response to the reduced phosphorus loading (Ludsin et al. 2001). In fact, in the late 1990s, there was concern that over-achievements in nutrient loss reduction were starving the waters of necessary nutrients (Joosse and Baker 2011). The Lake Erie Lakewide Management Plan of 2000 determined that eutrophication was no longer a widespread issue in Lake Erie and asserted that excessive phosphorus loading was a localized problem in particular regions of the lake. Total phosphorus inputs into Lake Erie continued to decline, even declining between 1991 and 2012 (Baker et al. 2014). With hindsight, researchers assert that re-eutrophication of Lake Erie began in the mid-1990s (Matisoff and Ciborowski, 2005; Sharpley et al. 2012; Baker et al. 2014; Kane et al. 2014). Data suggests that total phosphorus loads to Lake Erie declined between 1967 and 1987, after which point inter-annual load variability has been high, but there has been no statistical change in loads (Maccoux et al. 2016). However, even though total phosphorus loadings did not rise, between 1995-2001 total phosphorus concentrations in Lake Erie increased, as did DRP concentrations (Matisoff and Ciborowski 2005; Sohngren et al. 2013). Total phytoplankton biomass decreased between 1970 and 1987, but has since increased in the central basin of Lake Erie (Kane et al. 2014). By 2001, phosphorus concentrations in the Western Basin averaged 16.2µg/L, which exceeded the 15.0 µg/L goal. The nitrogen concentrations in the Western (0.6mg/L) and Central (0.3mg/L) Lake Erie Basins were below levels considered harmful, but Ohio Lake Erie Commission’s 2004 State of the Lake report noted that they were trending upward (OLEC 2004). Since the 1990s, increased incidences of hypoxia and other signs of eutrophication became increasingly common. A team of scientists from Canada and the United States found the hypoxic zone in Lake Erie’s central basin in 2005 was the largest on record (Hawley et al. 2006). Over the next decade algal blooms became common annual occurrences. NOAA began issuing short term (<1 week) algal bloom forecasts for Lake Erie in 2009 (Wynne et al. 2013). When a relatively complete suite of monitoring data is considered (1974 to 2013), there is no statistically significant change in total phosphorus loading from nonpoint sources over time (Maccoux et al. 2016). However, when shorter time periods are analyzed independently of long-term trends, short-term trends can be observed. Between 1991 and 2012, total phosphorus loads in the Maumee River Basin increased 17 percent, with the entirety of the total phosphorous load increase attributable to a 169 percent increase in DRP loading (Baker et al. 2014). Similarly, comparison of five-year running averages between 1994 and 2012 suggest that total phosphorus loads increased by 18 percent, driven by a 132 percent increase in concentrations of DRP; at the same time concentrations of total particulate-bound phosphorus declined by 11 percent in rivers
10
feeding WLEB (Bullerjahn et al. 2016). However, Maccoux et al. (2016) showed that when flow weighted mean concentrations are considered, there was no change in total phosphorus loading for 24 of the 28 tributaries to Lake Erie, with total phosphorus loading decreasing in three tributaries and increasing in only one. Furthermore, they contend that DRP made up approximately 33 percent of the total phosphorus load between 2009 and 2013 and this relationship did not change over time (Maccoux et al. 2016). Observed changes in WLEB over the past 30 years clearly suggest a need for a better understanding of the terrestrial-hydrological-aquatic dynamics driving nutrient fluxes and related processes throughout the basin (Joosse and Baker 2011; Pennuto et al. 2014a). Numerous theories have been proposed to explain the nutrient and hydrological dynamics observed in WLEB since original action was taken on the GLWQA (IJC 2009; Hawley et al. 2006; Daloğlu et al. 2012; Jarvie et al. 2015; Smith et al. 2015a). It is most likely that a combination of drivers is responsible for the observed dynamics. It is also likely that a solution to the ongoing eutrophication problems will necessarily be multi-faceted and require commitments by a variety of stakeholders in the region (Vollmer-Sanders et al. 2016). Increased phosphorus loadings to Lake Erie and its tributaries have been attributed to increased river flows observed in recent years (Sharpley et al. 2012; Maccoux et al. 2016). Since 2009, WLEB has received 33 percent more rain in intense springtime events than was received in springtime events in the previous ten years (Sharpley et al. 2015). In the wet year of 2011, the total phosphorus load delivered to Lake Erie from the Maumee during the springtime months (11,946 MTA) was large and the springtime DRP load (3,482 MTA) was the largest since 1975 (Maccoux et al. 2016). In the drought year of 2012, the total phosphorus and DRP springtime loads were only 20 and 15 percent of the 2011 loads, respectively (Pennuto et al. 2014b). However, the 2012 drought was associated with one of the largest hypoxic episodes on record in Lake Erie (Scavia et al. 2014). Since 1995, precipitation and discharge have increased in the region relative to earlier weather patterns, as have DRP concentrations and loads in the Maumee River (Baker et al. 2014; Kane et al. 2014). Comparison between the periods of 1982-1995 and 1996-2013 suggest phosphorus loading increased by 17 and 23 percent in the Maumee and Sandusky Rivers, respectively, while flows increased by 20 and 27 percent in the Maumee and Sandusky Rivers, respectively (Sohngen et al. 2013). Climate change may play a role in the observed increased phosphorus loadings and may be an important consideration regarding future conservation decisions, though there are varied predictions regarding potential implications of climate change, with varied implications for management (Pennuto et al. 2014a; Pease et al. 2017). Some climate change scenarios suggest the region will continue to experience increased stream flow and associated increased losses of sediment and nutrients in the future (Bosch et al. 2014). Other researchers suggest that climate change driven increases in losses to evapotranspiration, coupled with drainage water management may actually decrease stream flows in WLEB in the coming years (Pease et
al. 2017). Predicted increases in high intensity rainfall periods could have negative impacts on overland flow and stream processes (Joosse and Baker 2011). Soil microbial biomass dynamics have been linked to phosphorus solubilization and losses in regions where drying and rewetting and freezing and thawing events occur; increasing incidences of these events, anticipated by some climate change models, may increase DRP losses (Blackwell et al. 2010). Predicted climate change may have negative impacts on conservation practices currently functioning as phosphorus sinks and may stimulate phosphorus releases from stream, river, and lake sediments (Paerl et al. 2016a). Selection of the appropriate conservation practice for a given farm requires identification of the resource concern(s) to be addressed, followed by development of a comprehensive conservation plan designed to address those resource concerns for that farm’s particular weather, soils, and rotational management. The GLWQA goals focused on total phosphorus reductions. As noted above, when phosphorus load reduction strategies were developed in response to the GLWQA, the agricultural community, research community, private industry, and policy community all focused agricultural conservation efforts on reduction of particulate-bound phosphorus; this was the regional agricultural goal intended to complement the rigorously pursued point source phosphorus loss reduction plan. In the 1970s, when the GLWQA was being acted upon, DRP was not identified as an agricultural focus and was not adequately addressed (Richards et al. 2002; Daloğlu et al. 2012). The agricultural community’s efforts to reduce erosional and particulate-bound phosphorus losses were largely successful. Ironically, these conservation successes may have contributed to shifting the agricultural conservation concern from particulate-bound phosphorus losses to DRP losses (Sharpley et al. 2015; Sharpley 2016; Jarvie et al. 2016). Conservation practices including cover crops, riparian buffers, two-stage ditches, and improved fertilizer management, including more incorporation have been promoted by researchers (Kane et al. 2014). The International Joint Commission (IJC) advises that improved phosphorus management, manure treatment, conservation tillage, cover crops, and wetlands may reduce total phosphorus and/or DRP in WLEB (IJC 2014). Similarly, the Lake Erie Lakewide Management Plan of 2000 promoted adoption of buffer strips, conservation tillage, and no-till to reduce nutrient losses to streams. In WLEB there is no “best management practice” that will solve all conservation problems. Rather, conservation systems will have to be adopted that incorporate these recommended practices to complement each other and provide for reduced agroecological impacts. There is an ongoing and polarized debate about the impacts of various conservation practices, especially that of no-till on DRP dynamics (Kleinman et al. 2015). However, assessments of impacts are often contradictory, emphasizing the need for on-site comprehensive conservation studies and plans. Some widely recommended, scientifically supported, conservation practices may address the concern for which they were designed and assessed, but these same practices may also shift nutrient losses from one pathway to another. For example, addressing
11
erosion may retain water on farm fields, which can increase infiltration rates and losses of biologically available DRP (Wang et al. 2016). Conservation tillage has long been promoted for its benefits, such as reducing erosion, promoting biodiversity, providing improved bird nesting habitat, improving soil structure and health, and building soil organic carbon as a means to offset increasing levels of atmospheric carbon dioxide (Rodenhouse and Best 1983; Rodgers 1983; Kern and Johnson 1993; Blevins and Frye 1993; McLaughlin and Mineau 1995). However, some researchers contend that adoption of no-till or conservation tillage systems is to blame for increased DRP losses, even when total phosphorus and particulate-bound phosphorus losses are reduced (Joosse and Baker 2011; Bosch et al. 2013; Michalak et al. 2013; Scavia et al. 2014; Smith et al. 2015b; Jarvie et al. 2016). One of the reasons for this discrepancy in outcomes and opinions around no-till systems is that conservation tillage, like any conservation practice, is only one part of an agricultural management system. Although scientific studies may consider no-tillage in isolation, fertilizer and tillage management interact with each other and with drainage water management, crop rotational systems, etc., all of which must be considered when developing appropriate conservation plans (Jarvie et al. 2015). Applying conservation tillage without appropriate consideration of other aspects of agricultural management, including appropriate management of nutrient source, application method, rate, and timing (4Rs), may not achieve optimal conservation benefits (King et al. 2015). In particular, adoption of no-tillage should likely be accompanied by a nutrient management that uses some form of incorporation during application. A review by King et al. (2015) found various studies suggest subsurface phosphorus transport is greater under no-tillage systems as compared to conventional tillage systems due to preferential flow pathways that develop in the absence of soil disturbance. However, King et al. (2015) also noted that phosphorus placement during nutrient application plays an important role in subsurface phosphorus losses, with application methods that include incorporation typically leading to lower DRP and total phosphorus losses to subsurface pathways. Broadcasting nutrients without appropriate incorporation has deleterious impacts on water quality, and incorporating surface-applied nutrients can significantly decrease phosphorus losses in no-till and conservation tillage systems (Smith et al. 2016; Williams et al. 2016). In Pennsylvania, Kleinman et al. (2009) demonstrated that in no-tillage systems the impact of manure application method was more influential than soil type in determining impacts on phosphorus loss dynamics; they conclude that using incorporation when applying manure in a no-till system can significantly reduce the amount of DRP lost to surface losses. Smith et al. (2016) found that banding poultry litter and monoammonium phosphate just 1 cm deep reduced surface losses of DRP by 98 and 84 percent, respectively, relative to if the nutrients were applied via broadcasting. Farmers have a broad variety of technologies available, the adoption of which could ensure appropriate incorporation of nutrients at
application, including of manures, in order to minimize nutrient losses through volatilization, sub-surface loss pathways, and run-off pathways while preserving the many agroecological benefits of no-till systems (Kleinman et al. 2011a; Maguire et al. 2011; Jarvie et al. 2015; Smith et al. 2016). No-tillage systems are not the only conservation practices under scrutiny for their potential impacts on water quality. Implementation of buffer strips and grassed waterways may decrease total phosphorus losses; however, results are mixed regarding DRP response, with some research reporting increases in DRP losses under such management (Joosse and Baker 2011; Roberts et al. 2012; Dodd and Sharpley 2016) and others showing DRP loss reductions associated with these practices (Smith et al. 2015b). Riparian wetlands have also been identified as a potential particulate-bound phosphorus sink that may sometimes serve as a DRP source (Dupas et al. 2015b). Clearly more research is needed to determine best management systems, as most research focuses on assessment of single-practice adoption. Tile drainage, essential to agriculture in the region, has intensified across WLEB in recent years. Recent studies suggest tile drainage can be a significant source of total phosphorus and DRP in WLEB (Smith et al. 2015c; Jarvie et al. 2015; Jarvie et al. 2016). However, tile drainage impacts are not all deleterious in terms of nutrient losses. A review by Ross et al. (2016) identifies numerous studies in which tile drainage was documented to reduce subsurface nitrate nitrogen losses. More research is necessary to determine the best conservation practices to address tile drain losses and losses via other pathways when tile drains are in use (Ross et al. 2016). Considering the widespread use of tile drainage in WLEB, addressing phosphorus losses associated with tile drainage systems by applying appropriate, complementary conservation practices, will be an essential part of the phosphorus loss reduction strategy in WLEB. As noted with conservation tillage, changes in drainage systems need to have adjustments in nutrient management, in particular form and placement. Gross phosphorus inputs into the region’s hydrological system exceeded gross outputs until the 1990’s, which indicates phosphorous accumulation was occurring in the system for many decades (Powers et al. 2016). It is estimated that a phosphorus pool larger than 200,000 tons accumulated in the Maumee Basin prior to the 1990’s. Between the late 1990’s and 2010, phosphorus inputs and outputs in the Maumee Basin tended to be about equal, suggesting that the large pool of accumulated phosphorus remains in the system (Powers et al. 2016). This phosphorus may continue to interact with and impact water quality in WLEB for many years to come. Within-river phosphorus retention and subsequent remobilization dynamics are poorly understood but may exert significant control on the magnitude and timing of downstream delivery of phosphorus loads and concentrations (Jarvie et al. 2013b). Ironically, conservation practice implementation may trigger in-stream phosphorus sinks to function as phosphorus sources while the riverine system re-equilibrates to the new conditions caused by conservation practice adoption (Sharpley
12
et al. 2013). This time of re-equilibrating can mask the benefits of conservation practice adoption, which may take time to be measurable even though the adopted practices are allowing the system to progress towards those benefits. Further, the role of groundwater in nitrogen and phosphorus dynamics in the region is not well studied or understood and may interact with channel dynamics to further complicate phosphorus dynamics (Robinson 2015). Just as legacy sources may contribute to phosphorus loading in tributaries and ultimately in Lake Erie, legacy phosphorus loads in Lake Erie sediments may elevate phosphorus levels in the lake’s water column (Kane et al. 2014; Pennuto et al. 2014b; Paytan et al. 2017). The dynamics associated with internal phosphorus loading in Lake Erie are not well understood (Watson et al. 2016; Pennuto et al. 2014a), but the phenomenon has been noted in Lake Erie for decades, especially during anoxic episodes, which can cause significant releases of DRP from lake sediments (Burns 1976). Matisoff and Carson (2014) found that 52-97 percent of the suspended materials in the nearshore portions of Lake Erie are derived from lake bottom sediment. They further suggest that the amount of phosphorus resuspended in this amount of lake bottom sediment is about equal to total phosphorus provided by tributary loadings in WLEB (Matisoff and Carson 2014). Other research suggests that total phosphorus fluxes from sediments in the Central Basin of Lake Erie may on average equal up to 20 percent of the total external phosphorus inputs in Lake Erie, and fluxes from sediment in the shallower, warmer, phosphorus enriched Western Basin are likely to be much greater (Paytan et al. 2017). These lake sediments and their associated nutrients may play particularly important roles in the Lake’s nutrient dynamics in months when wind-speeds are highest and during autumnal turnover events (Matisoff and Carson 2014). Recent work suggests that decadal loading with DRP may be a significant contributor to recent algal blooms (Ho and Michalak 2017). Charlton et al. (1993) found that central basin phosphorus data suggested that phosphorus reduction strategies enacted since the 1972 GLWQA had not prevented phosphorus regeneration from sediment-bound phosphorus to DRP within Lake Erie. Contributions of lake sediment to phosphorus concentrations in Lake Erie under aerobic conditions may account for 20-40 percent of the GLWQA target concentrations of 15 µg phosphorus per liter, with significantly greater phosphorus contributions from Lake Erie sediments occurring under anoxic conditions (Matisoff et al. 2016, Watson et al. 2016). During an anoxic episode in the central basin in 1970, lake-bottom sediments contributed a DRP load equal to the phosphorus loading from outside sources, raising concerns that eutrophic conditions could be maintained by internal mechanisms, even in the absence of continued loading (Charlton et al. 1993). The Central and Western Basins of Lake Erie exchange phosphorus in the water column (Zhang et al. 2016b), so studies documenting Central Basin phenomena must be considered when discussing Western Basin conservation goals and achievements.
Between 1998 and 2001, the phosphorus loads leaving Lake Erie via the Niagara River were greater than were the loads of phosphorus entering the lake (Charlton and Milne 2004). It is estimated that pools of over 41,600 tons of total phosphorus and over 116,800 tons of total nitrogen are banked in the sediments in the 0-20 m contour of Southern Lake Erie (Pennuto et al. 2014b). It is possible that sediment and associated nutrients are still accumulating in the lake (Zhang et al. 2016b). Although there are clear benefits to reducing tributary deliveries of nutrients and sediment, the large “background flux” of phosphorus from lake sediments may contribute to a delayed lake response to phosphorus management that reduces external loading (Watson et al. 2016; Matisoff and Carson 2014; Zhang et al. 2016b). Some scientists suggest that recent re-eutrophication of Lake Erie is not purely due to current and past nutrient input dynamics, but may also be influenced by changes in internal lake dynamics related to impacts of invasive species (Matisoff and Ciborowski 2005; Burlakova et al. 2014; Ho and Michalak 2017). Colonization of Lake Erie by zebra and quagga mussels during the 1980’s and 1990’s was not anticipated in the original models used to simulate Lake Erie recovery dynamics. The impacts of their invasions may have led to erroneous conclusions about conservation successes in Lake Erie due to mussel impacts on lake-wide nutrient cycling dynamics (LaMP 2000; Pennuto et al. 2014b). Mussel invasions have altered the role of the benthic system in Lake Erie, impacting nutrient cycling in Lake Erie, as well as the response dynamics of the cyanobacteria responsible for algal blooms (Stumpf et al. 2012; Burlakova et al. 2014). It is estimated that roughly 500 tons of phosphorus and 6,426 tons of nitrogen are incorporated into the biomass of the invasive mussels annually (Pennuto et al. 2014b). Excretions by mussel populations in the Western Basin provide 27 percent or more of algal growth phosphorus demands (Zhang et al. 2016b). In 2012, the IJC classified the reduction of phosphorus and algal blooms a priority in the Lake Erie ecosystem and called for a revision of the 1983 phosphorus load targets. In order to set load targets, it was important to accurately estimate the actual loads associated with the ongoing eutrophication events. Maccoux et al. (2016) estimate that between 2003 and 2013 total phosphorus loads to Lake Erie averaged 9,125 MTA and DRP loads averaged 2,729 MTA. Dolan and Chapra (2012) estimate average total phosphorus loads to Lake Erie between 2003 and 2011 at 8,929 MTA. The EPA (2015), referring to Scavia et al. 2014, estimate the annual total phosphorus load to Lake Erie to be 11,000 MTA. The GLWQA Annex 4 Objectives and Targets Task Team recommended that WLEB annual total phosphorus loading targets be lowered to 6,000 MTA, or 13.2 million pounds (OTTT 2015). Considering that EPA (2015) attributes 61 percent of Lake Erie’s annual total phosphorus load to the WLEB, one could assume Annex 4 calls for a reduction in WLEB annual total phosphorus loads to achieve 3,660 MTA, or 8.1 million pounds of total phosphorus loading per year. The Annex 4 Task Team further recommended springtime total and soluble phosphorus target loads of 860 and 186 MTA, respectively, be specified for the Maumee River (EPA 2015).
13
Some research suggests a strong correlation between springtime total phosphorus concentrations and the severity of algal blooms later in the year in Lake Erie (Stumpf et al. 2012), though others suggest that July and August loads influence algal bloom severity (Zhang et al. 2016b). Recent work finds that total phosphorus loads do not explain algal bloom severity, but long-term cumulative DRP loads explain up to 75 percent of the yearly variability in algal bloom area in Lake Erie (Ho and Michalak 2017). Meeting the springtime reduction goal may be especially challenging, as recent research suggests that springtime phosphorus loads delivered to Lake Erie are dominated by DRP (Bridgeman et al. 2012). However, even if the annual DRP load targets set by the Annex 4 Task Team are met, the effort may be insufficient to achieve their bloom goals: DRP annual and springtime loads may need to be reduced to 240 and 78 MT, respectively, to achieve “mild bloom conditions” within a decade (Ho and Michalak 2017). Domestic phosphorus load reduction strategies and action plans are anticipated to be completed by Canada and the United States by 2018. As plans develop, the wisdom learned in the past should not be lost: Management practices intended to control DRP losses in runoff may exacerbate total phosphorus losses or shift DRP loss peaks from one season to another (Bundy et al. 2001). Conservation practices take time to show an impact at the watershed scale and should not be abandoned prematurely due to lack of documented impact. Conservation practices and agricultural management are a system and need to be considered in synergy to optimize conservation gains and prevent unforeseen complications arising from placing too much emphasis on adoption of a practice out of the context of the system (Jarvie et al. 2015). Achieving load reductions will take both time and money. It was predicted that achieving the 1978 GLWQA goals would be expensive and would become more expensive as the water quality improved, such that the final 17 percent of the water quality objectives in the Great Lakes would require 77 percent of the total investment to achieve (Chapra et al. 1983). Summary of Conservation Practice Adoption in 2003-06 and 2012 This section provides a brief summary of the findings presented in “Effects of conservation practice adoption on cultivated cropland acres in Western Lake Erie Basin, 2003-06 and 2012” (USDA-NRCS 2016). Please refer to the published report for more details. Comprehensive conservation plans utilize a three-pronged Avoid, Control, Trap (ACT) conservation systems approach to reduce nutrient and sediment losses from cultivated cropland. ACT involves application of complementary structural (including vegetative) and annual practices (including cover crops and tillage and nutrient management) to achieve conservation goals. The ACT components are:
• Avoid: Appropriate tillage and nutrient management practices (including the 4Rs: right source, right method, right rate, and right timing) help Avoid potential for sediment and nutrient losses by decreasing erosion and maximizing nutrient use efficiencies.
• Control: Structural practices slow the movement of water in the field, thus slowing the movement of sediment and nutrients and helping to Control nutrient and sediment losses.
• Trap: Structural practices Trap nutrients and sediment before they leave the edge of cultivated cropland fields.
For the purposes of this and the USDA-NRCS (2016) report, a “field” includes the cropped portion of the cultivated cropland field plus any edge-of-field filtering and buffering conservation practices, from the soil surface to the bottom of the root-zone. Agricultural fields typically contain more than one type of soil, the differences between which can be significant in terms of the potential crop yields they support and their vulnerabilities to various sediment and nutrient loss pathways. Therefore, comprehensive conservation management of cultivated cropland acres requires comprehensive conservation planning tailored to management of the vulnerabilities and needs of each soil in each field, with consideration of farmer goals, current crop rotations, weather, and other site-specific characteristics. Relatively recently GPS and Variable Rate Technologies (VRT) have emerged as means to apply annual practices with precision, including tillage and nutrient management; the use of GPS and VRT continues to increase across the country and in WLEB, specifically. Structural Practices Structural and vegetative conservation practices (referred to as “structural practices” herein), are usually kept in place for several years after implementation/installation. Structural practices include overland flow practices (e.g., terraces), concentrated flow practices (e.g., grassed water ways), edge-of-field surface runoff prevention practices (e.g., buffers), drainage water management, wind erosion practices (e.g., windbreaks), and irrigation practices (e.g., low impact irrigation). Designed primarily for erosion control, structural practices mitigate edge-of-field nutrient losses, providing both controlling and trapping benefits. The amount of cultivated cropland acreage in WLEB treated with one or more structural practice for water erosion control increased by over 1 million acres between the 2003-06 and 2012 survey periods. The percent of WLEB cultivated cropland treated with one structural practice in place to control erosion and surface runoff losses increased from 25 to 40 percent of acres, and the percent of WLEB cultivated cropland acres with more than one structural practice in place increased from 9 to 15 percent of acres. The use of overland flow practices and concentrated flow practices remained unchanged, while the percent of cultivated cropland acreage treated with edge-of-field trapping practices increased from 18 to 31 percent between the two survey periods. Annual Practices Annual practices require active management during the crop production system each year. Annual practices complement structural practices and are designed to promote soil quality and reduce in-field erosion, thereby reducing the availability of sediment and nutrients for transport by wind or water. They
14
include cover crops, residue and tillage management, and nutrient management. Cover crop adoption has likely increased in WLEB in recent years, but the shift has primarily occurred since the completion of the 2012 NRI-CEAP Farmer Survey. The surveys show that cover crops were used at least once in a 3-year rotation on 2 and 6 percent of cultivated cropland acres in WLEB in 2003-06 and 2012, respectively. Conservation tillage practices work in conjunction with structural erosion control practices and nutrient management practices to reduce sediment and nutrient losses from cultivated cropland. Appropriate tillage practices can also help build soil organic carbon (Snyder et al. 2009). Tillage management did not change appreciably in WLEB in the time between the two surveys. Some form of conservation tillage (i.e., mulch tillage, seasonal no-tillage, and continuous no-tillage) was used on 67 and 63 percent of cropland acreage in WLEB in 2003-06 and 2012, respectively. Roughly a quarter of all cultivated cropland acres were managed as continuous no-till in both survey periods. Conservation tillage systems require careful attention to nutrient management, especially nutrient source and method of application, in order to maintain the conservation tillage benefits while meeting responsible incorporation criteria. For example, light disking associated with mulch till systems allows the farmer to maintain a conservation tillage system, keep soil disturbance low, and achieve adequate incorporation to address run-off loss concerns. Nutrient management information collected in the NRI-CEAP-Cropland Farmer Surveys included data on the method, rate, and timing of application for manure and commercial fertilizer. Nutrient source or form management was not evaluated due to insufficient survey data but should be considered in the development of any comprehensive conservation plan. Studies indicate that appropriate nutrient use (4Rs) can increase crop yields while restoring or maintaining soil carbon and decreasing greenhouse gases coming from agricultural soils (Snyder et al. 2009). Soil testing is used to determine the amount of residual nutrients present in a field’s soil, available to crops, and vulnerable to losses. Soil testing is essential to informing a responsible nutrient management plan that supplements these residual nutrients with applied nutrients to ensure sustainable crop yields and reduce the likelihood of nutrient losses. In WLEB, farmers reported that a soil test had been performed within the previous five years on 66 and 71 percent of WLEB cultivated cropland acres in 2003-06 and 2012, respectively. Nitrogen: The percent of acres on which farmers reported the use of incorporation during all nitrogen applications increased from 29 to 43 percent of cultivated cropland acres between 2003-06 and 2012. The percent of WLEB cropland acres on which nitrogen applications were never managed with incorporation remained constant, at 24 and 21 percent of acres in 2003-06 and 2012, respectively. There was no discernable change in nitrogen application rate per crop yield rates (nitrogen use efficiency); nitrogen application rates on 55 and 49 percent
of acres in 2003-06 and 2012, respectively, exceeded crop demand by less than 20 percent. Five percent or less of cultivated cropland acres had nitrogen application rates that exceeded crop use by more than 40 percent, in both survey periods. There was also no change in nitrogen application timing between the two surveys. The majority of cropland acres in WLEB had well-timed nitrogen application. Roughly 60 and 54 percent of the cultivated cropland acres in WLEB in the 2003-06 and 2012 Conservation Conditions, respectively, received their first application of nitrogen between 21 days prior to planting to 7 days post planting. Phosphorus: Phosphorus application methods improved between the two survey periods; use of incorporation at every phosphorus application increased from being in use on 45 percent of WLEB cropland acres to being in use on 60 percent between 2003-06 and 2012. This finding is contrary to that reported by researchers who suggest the use of broadcasting phosphorus has increased over time in WLEB (Bullerjahn et al. 2016). Applying less phosphorus than was being removed at harvest (a “drawdown strategy”) remained a widespread practice, with 52 and 58 percent of acres in 2003-06 and 2012, respectively, receiving less phosphorus than was removed with the harvest. However, on 13 percent of cropland acres phosphorus application rates in both survey periods exceeded the crop rotation’s needs by more than 60 percent. Nutrient management rates need to be improved on these acres. Timing of phosphorus application was generally good in the region. There was no discernable change in timing of phosphorus applications between the two surveys; phosphorus application occurred within a 21-day window of planting on 71 and 63 percent of cropland acres in WLEB in 2003-06 and 2012, respectively. Dividing the total annual nutrient application over two or more applications is a practice known as “split-applications;” split-applications can enhance nutrient-use efficiency and yields by feeding the crops at the appropriate time in their growth cycles. Split-applications can also reduce the potential for high nutrient losses because smaller amounts of nutrient are applied at each application, making a smaller portion of the annual applied nutrients vulnerable to loss in the next storm event. However, only 15 and 12 percent of acres received the beneficial practice of split phosphorus applications in the 2003-06 and 2012 Conservation Conditions, respectively. Increased use of split-applications could provide more sustained nutrient availability to crops and reduce the chances of phosphorus loss; however, this practice requires more intensive annual management. Nutrient Application Management Levels: While decisions about individual aspects of nutrient management are important, the interactions between nutrient application source, method, rates, and timing determine the impacts of these decisions in the agroecological context. To assess the status of comprehensive nutrient application management during both survey periods, a numerical rating system was developed to score the farmer’s reported management of nutrient source, method of application, and timing of application for nitrogen and phosphorus. Four nutrient application management levels indicating conservation achievements in nitrogen and phosphorus management were developed: low, moderate, moderately-high, and high.
15
There were no appreciable changes in the levels of nutrient application management on WLEB cropland acres between the two survey periods. On average, nitrogen and phosphorus application management was high to moderately high on the majority of acres in both surveys. High to moderately high levels of nitrogen application management were maintained on roughly 80 percent of all cropland acres in WLEB in 2003-06 and 2012, though less than 10 percent of acres were managed with consistent use of the 4Rs for nitrogen management on each crop in every year of production. Only 2 and 4 percent of cropland acres received low levels of nitrogen application management in 2003-06 and 2012, respectively. High to moderately high levels of phosphorus application management were reported on around 60 percent of all cropland acres in WLEB in both the 2003-06 and 2012 surveys. Approximately 26 and 34 percent of cultivated cropland acres in WLEB received appropriate and consistent application of the 4Rs in phosphorus application management in 2003-06 and 2012, respectively. Approximately 20 and 18 percent of cropland acres received low levels of phosphorus application management in 2003-06 and 2012, respectively. Precision Agricultural Management Advanced technologies using GPS interfaces and precision soil mapping enable farmers to tailor nutrient application and conservation management to address the needs of individual soils in their fields, improving production efficiencies while mitigating environmental impacts. Acreage on which farmers used GPS to map soil properties quadrupled between the two survey periods, increasing from being in use on 8 percent to being in use on 36 percent of WLEB cultivated cropland acres between the 2003-06 and 2012 surveys. Variable rate technologies (VRT) allow farmers to use GPS and specialized machinery to adapt management to the needs of specific portions of their fields. The percent of acres on which VRT was reported to be used to enhance nutrient application management increased from 4 to 14 percent of cultivated cropland acres in WLEB between the 2003-06 and 2012 survey periods. VRT are some of the most promising technologies available to help farmers address conservation concerns on “critical acres,” as these acres seldom occur in large tracts. These vulnerable acres are actually vulnerable soils, which are embedded in a matrix of soils that have lower or different inherent vulnerabilities, creating management challenges for the farmer and conservation planner. If the farmer manages the entire field with a uniform strategy, the majority of the field’s soils may receive adequate treatment to address conservation concerns, while small portions of the field that are highly vulnerable to losses or to a different loss pathway may still be under treated. This is one reason that soil tests, VRT, and comprehensive conservation planning are essential to address
3 The full theoretical and technical documentation of APEX can be found at http://epicapex.tamu.edu/manuals-and-publications/.
conservation concerns on the outstanding vulnerable acres in WLEB. Technologically advanced drainage water management provides dual benefits, improving water quality by keeping nutrients in the soil and benefiting crop production by keeping nutrients and water available for plant growth (Skaggs et al. 2010 and 2012). Between 2003-06 and 2012, the percent of WLEB cultivated cropland acreage with advanced drainage water management practices increased from less than 1 percent to 9 percent of acres.
Summary of the Impacts: Conservation Practice Adoption in 2003-06 and 2012 This section provides a brief summary of the findings presented in “Effects of conservation practice adoption on cultivated cropland acres in Western Lake Erie Basin, 2003-06 and 2012” (USDA-NRCS 2016). Please refer to the published report for more details. Simulated average annual long-term impacts of reported management and conservation practice adoption are provided here. Impacts of conservation practice adoption are much greater for some acres than others, reflecting both the variability in the level of treatment applied and differences in the inherent vulnerabilities of the soils and crop rotations that make up WLEB cultivated cropland acres. The daily time step hydrological model, Agricultural Policy Environmental eXtender (APEX), was used to simulate long-term effects of reported management and conservation practice adoption at the field scale for each survey point (Williams et al. 2006; Williams et al. 2012; Gassman et al. 2009 and 2010).3 APEX can simulate interactions between weather, farming operations, crop growth and yield, and the movement of water, soil, carbon, nutrients, sediment, and pesticides within the field and to the field’s edge. APEX and its predecessor, the Environmental Policy Impact Calculator (EPIC), have a long history of use in simulation of agricultural and environmental processes and the effect of agricultural technology and government policy on natural resources (Izaurralde et al. 2006; Williams 1990; Williams et al. 1984; Gassman et al. 2009).4 Water: APEX simulations suggest that on WLEB cultivated cropland acres, roughly twice as much water is lost to subsurface loss pathways than to surface loss pathways. WLEB cultivated cropland is mostly flat; the NRI classifies less than 10 percent of WLEB’s cropland acres as highly erodible land (HEL). Erosion and Sediment Loss: Water moving across the land-surface causes sheet and rill erosion on cultivated cropland acres and may lead to sediment loss from the edge of cultivated
4 Summaries of APEX model validation studies are presented in Gassman et al. (2009) and in “APEX Model Validation for CEAP”, found at http://www.nrcs.usda.gov/technical/nri/ceap.
16
cropland fields.5 APEX simulations suggest that average annual sheet and rill erosion decreased from 1.3 to 0.8 tons per acre per year in the 2003-06 and 2012 Conservation Conditions. Sediment loss from the edge of cultivated cropland fields decreased from 1.1 to 0.5 tons per acre per year in the 2003-06 and 2012 Conservation Conditions. Because tillage management did not change appreciably between the two survey periods, it is likely that increased adoption of structural erosion control practices was largely responsible for these conservation benefits. Carbon: Building soil organic carbon (SOC) helps to reduce soil erodibility and improves soil’s structure, nutrient cycling capacity, water holding capacity, and biotic integrity. On-field benefits of carbon sequestration include increased and more sustained crop yields (Lal 2004). Additionally, increasing SOC pools in cultivated cropland soils may have offsite benefits, including improved water quality and a diminishment of agriculture’s contribution to climate change. Soil carbon dynamics did not change between the two survey periods: more than 75 percent of WLEB cropland acres gained or maintained SOC in the 2003-06 and 2012 Conservation Conditions. For the purposes of these analyses, an acre is considered to be maintaining carbon if it gains or loses less than 100 pounds of carbon per year. In both the 2003-06 and 2012 Conservation Conditions, carbon-gaining acres had more nutrients applied to them, were managed with rotations that incorporated a higher percentage of high-residue crops, and lost a smaller percentage of the nutrients applied than did carbon-losing acres. Nitrogen: Between the 2003-06 and 2012 surveys, average annual total nitrogen inputs (159.5 and 163.2 pounds per acre per year, respectively), total nitrogen removal rates at harvest (105.9 and 105.7 pounds per acre per year, respectively) and total nitrogen loss rates (61.3 and 60.3 pounds per acre per year, respectively) did not change. Nitrogen losses to volatilization increased slightly, from 18.7 to 20.7 pounds per acre per year in the 2003-06 and 2012 Conservation Conditions. Nitrogen losses in surface runoff declined from 7.1 to 4.4 pounds per acre per year in the 2003-06 and 2012 Conservation Conditions. The amount of nitrogen lost to subsurface flows did not change and was estimated at 22.4 and 22.8 pounds per acre per year in the 2003-06 and 2012 Conservation Conditions, respectively. Phosphorus: Average annual total phosphorus inputs decreased from 21.5 to 18.7 pounds per acre between the 2003-06 and 2012 surveys, primarily due to a decrease in the use of commercial fertilizer. Average total phosphorus removal rates at harvest remained constant at 16.4 and 16.3 pounds per acre per year in the 2003-06 and 2012 Conservation Conditions, respectively. Average total phosphorus loss rates declined from 2.3 to 1.9 pounds per acre per year between the 2003-06 and 2012 Conservation Conditions, primarily due to a decrease in
losses of particulate-bound phosphorus via surface loss pathways, which dropped from 0.8 to 0.5 pounds per acre per year between the 2003-06 and 2012 Conservation Conditions. The amount of phosphorus lost to subsurface flows did not change and was estimated at 1.3 pounds per acre per year in both the 2003-06 and 2012 Conservation Conditions. Tile drainage: In the 2003-06 and 2012 Conservation Conditions, 3.4 and 3.8 million cultivated cropland acres in WLEB were treated with tile drainage, respectively. While adoption of tile drainage increased by about 400,000 acres in the time between the two survey periods, average per-acre tile drainage phosphorus rates declined. In the 2003-06 Conservation Condition, 41 percent of tile-drained acres lost more than 1 pound of phosphorus per acre per year, while in the 2012 Conservation Condition 36 percent of tile-drained acres lost more than 1 pound of phosphorus per acre per year. Extreme Events: A very small portion of WLEB cropland acres is the source of a large percentage of the region’s nutrient and sediment losses. In other words, the amount of sediment and nutrients lost from these few acres is disproportionate to their prevalence in WLEB. These highly vulnerable acres are actually highly vulnerable soils and occur in a mosaic of other field soils across WLEB. Treating them will require treatment of a much larger number of acres in order to address the widely dispersed, vulnerable soils. The variability of soil vulnerabilities across the landscape emphasizes the importance of managing the needs and vulnerabilities of all of the soils that make up a field.
5 For this study, sheet and rill erosion was simulated with RUSLE2. Sediment loss was estimated using MUSLE, which uses an internal sediment delivery ratio to estimate the amount of eroded soil that actually leaves the boundaries of the field. A large percentage of the material eroded during sheet and rill erosion is redistributed and deposited within the field or trapped by buffers
and other conservation practices and does not leave the boundary of the field, which is taken into account in the sediment delivery calculation. The estimate also includes some ephemeral gully erosion. For this reason, sediment loss rates can exceed sheet and rill erosion rates.
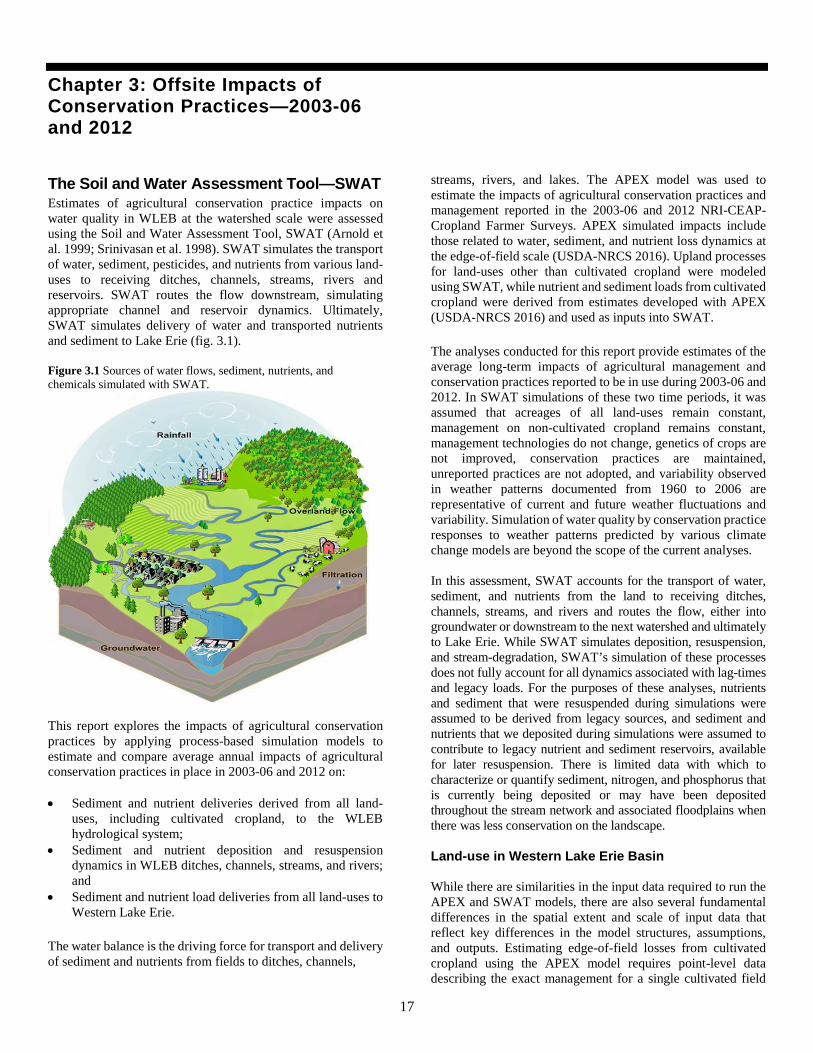
17
Chapter 3: Offsite Impacts of Conservation Practices—2003-06 and 2012
The Soil and Water Assessment Tool—SWAT Estimates of agricultural conservation practice impacts on water quality in WLEB at the watershed scale were assessed using the Soil and Water Assessment Tool, SWAT (Arnold et al. 1999; Srinivasan et al. 1998). SWAT simulates the transport of water, sediment, pesticides, and nutrients from various land-uses to receiving ditches, channels, streams, rivers and reservoirs. SWAT routes the flow downstream, simulating appropriate channel and reservoir dynamics. Ultimately, SWAT simulates delivery of water and transported nutrients and sediment to Lake Erie (fig. 3.1). Figure 3.1 Sources of water flows, sediment, nutrients, and chemicals simulated with SWAT.
This report explores the impacts of agricultural conservation practices by applying process-based simulation models to estimate and compare average annual impacts of agricultural conservation practices in place in 2003-06 and 2012 on: • Sediment and nutrient deliveries derived from all land-
uses, including cultivated cropland, to the WLEB hydrological system;
• Sediment and nutrient deposition and resuspension dynamics in WLEB ditches, channels, streams, and rivers; and
• Sediment and nutrient load deliveries from all land-uses to Western Lake Erie.
The water balance is the driving force for transport and delivery of sediment and nutrients from fields to ditches, channels,
streams, rivers, and lakes. The APEX model was used to estimate the impacts of agricultural conservation practices and management reported in the 2003-06 and 2012 NRI-CEAP-Cropland Farmer Surveys. APEX simulated impacts include those related to water, sediment, and nutrient loss dynamics at the edge-of-field scale (USDA-NRCS 2016). Upland processes for land-uses other than cultivated cropland were modeled using SWAT, while nutrient and sediment loads from cultivated cropland were derived from estimates developed with APEX (USDA-NRCS 2016) and used as inputs into SWAT.
The analyses conducted for this report provide estimates of the average long-term impacts of agricultural management and conservation practices reported to be in use during 2003-06 and 2012. In SWAT simulations of these two time periods, it was assumed that acreages of all land-uses remain constant, management on non-cultivated cropland remains constant, management technologies do not change, genetics of crops are not improved, conservation practices are maintained, unreported practices are not adopted, and variability observed in weather patterns documented from 1960 to 2006 are representative of current and future weather fluctuations and variability. Simulation of water quality by conservation practice responses to weather patterns predicted by various climate change models are beyond the scope of the current analyses. In this assessment, SWAT accounts for the transport of water, sediment, and nutrients from the land to receiving ditches, channels, streams, and rivers and routes the flow, either into groundwater or downstream to the next watershed and ultimately to Lake Erie. While SWAT simulates deposition, resuspension, and stream-degradation, SWAT’s simulation of these processes does not fully account for all dynamics associated with lag-times and legacy loads. For the purposes of these analyses, nutrients and sediment that were resuspended during simulations were assumed to be derived from legacy sources, and sediment and nutrients that we deposited during simulations were assumed to contribute to legacy nutrient and sediment reservoirs, available for later resuspension. There is limited data with which to characterize or quantify sediment, nitrogen, and phosphorus that is currently being deposited or may have been deposited throughout the stream network and associated floodplains when there was less conservation on the landscape. Land-use in Western Lake Erie Basin While there are similarities in the input data required to run the APEX and SWAT models, there are also several fundamental differences in the spatial extent and scale of input data that reflect key differences in the model structures, assumptions, and outputs. Estimating edge-of-field losses from cultivated cropland using the APEX model requires point-level data describing the exact management for a single cultivated field
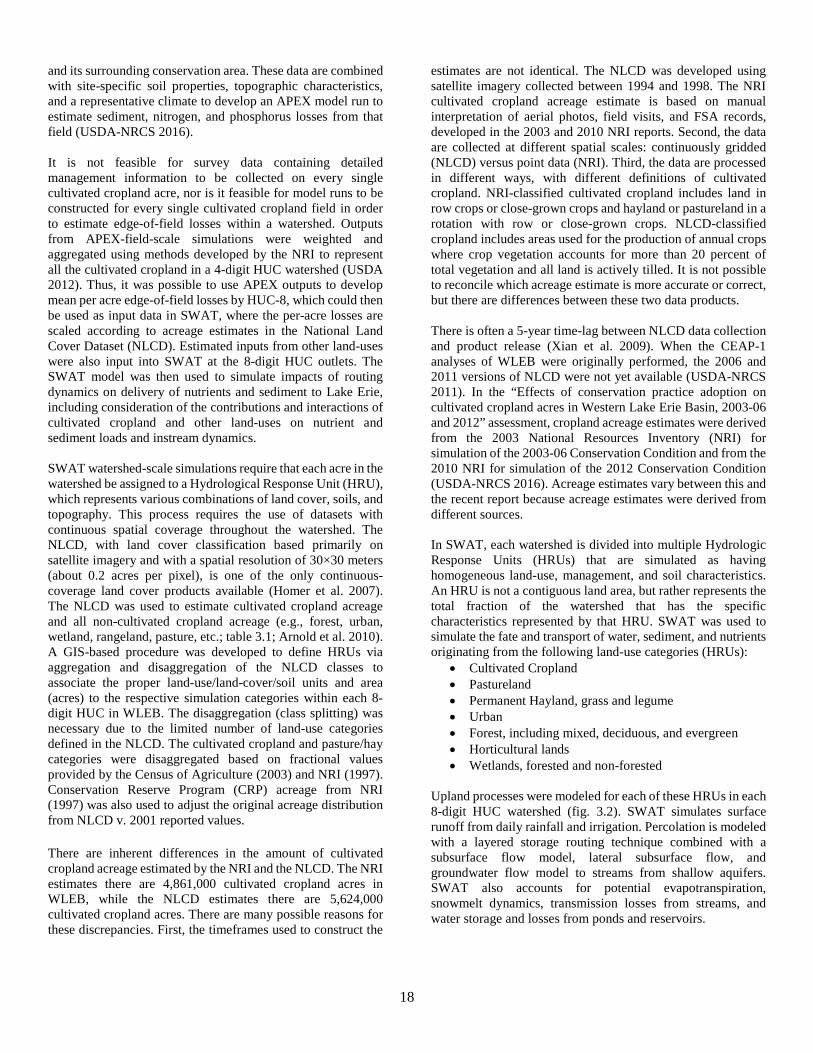
18
and its surrounding conservation area. These data are combined with site-specific soil properties, topographic characteristics, and a representative climate to develop an APEX model run to estimate sediment, nitrogen, and phosphorus losses from that field (USDA-NRCS 2016). It is not feasible for survey data containing detailed management information to be collected on every single cultivated cropland acre, nor is it feasible for model runs to be constructed for every single cultivated cropland field in order to estimate edge-of-field losses within a watershed. Outputs from APEX-field-scale simulations were weighted and aggregated using methods developed by the NRI to represent all the cultivated cropland in a 4-digit HUC watershed (USDA 2012). Thus, it was possible to use APEX outputs to develop mean per acre edge-of-field losses by HUC-8, which could then be used as input data in SWAT, where the per-acre losses are scaled according to acreage estimates in the National Land Cover Dataset (NLCD). Estimated inputs from other land-uses were also input into SWAT at the 8-digit HUC outlets. The SWAT model was then used to simulate impacts of routing dynamics on delivery of nutrients and sediment to Lake Erie, including consideration of the contributions and interactions of cultivated cropland and other land-uses on nutrient and sediment loads and instream dynamics. SWAT watershed-scale simulations require that each acre in the watershed be assigned to a Hydrological Response Unit (HRU), which represents various combinations of land cover, soils, and topography. This process requires the use of datasets with continuous spatial coverage throughout the watershed. The NLCD, with land cover classification based primarily on satellite imagery and with a spatial resolution of 30×30 meters (about 0.2 acres per pixel), is one of the only continuous-coverage land cover products available (Homer et al. 2007). The NLCD was used to estimate cultivated cropland acreage and all non-cultivated cropland acreage (e.g., forest, urban, wetland, rangeland, pasture, etc.; table 3.1; Arnold et al. 2010). A GIS-based procedure was developed to define HRUs via aggregation and disaggregation of the NLCD classes to associate the proper land-use/land-cover/soil units and area (acres) to the respective simulation categories within each 8-digit HUC in WLEB. The disaggregation (class splitting) was necessary due to the limited number of land-use categories defined in the NLCD. The cultivated cropland and pasture/hay categories were disaggregated based on fractional values provided by the Census of Agriculture (2003) and NRI (1997). Conservation Reserve Program (CRP) acreage from NRI (1997) was also used to adjust the original acreage distribution from NLCD v. 2001 reported values. There are inherent differences in the amount of cultivated cropland acreage estimated by the NRI and the NLCD. The NRI estimates there are 4,861,000 cultivated cropland acres in WLEB, while the NLCD estimates there are 5,624,000 cultivated cropland acres. There are many possible reasons for these discrepancies. First, the timeframes used to construct the
estimates are not identical. The NLCD was developed using satellite imagery collected between 1994 and 1998. The NRI cultivated cropland acreage estimate is based on manual interpretation of aerial photos, field visits, and FSA records, developed in the 2003 and 2010 NRI reports. Second, the data are collected at different spatial scales: continuously gridded (NLCD) versus point data (NRI). Third, the data are processed in different ways, with different definitions of cultivated cropland. NRI-classified cultivated cropland includes land in row crops or close-grown crops and hayland or pastureland in a rotation with row or close-grown crops. NLCD-classified cropland includes areas used for the production of annual crops where crop vegetation accounts for more than 20 percent of total vegetation and all land is actively tilled. It is not possible to reconcile which acreage estimate is more accurate or correct, but there are differences between these two data products. There is often a 5-year time-lag between NLCD data collection and product release (Xian et al. 2009). When the CEAP-1 analyses of WLEB were originally performed, the 2006 and 2011 versions of NLCD were not yet available (USDA-NRCS 2011). In the “Effects of conservation practice adoption on cultivated cropland acres in Western Lake Erie Basin, 2003-06 and 2012” assessment, cropland acreage estimates were derived from the 2003 National Resources Inventory (NRI) for simulation of the 2003-06 Conservation Condition and from the 2010 NRI for simulation of the 2012 Conservation Condition (USDA-NRCS 2016). Acreage estimates vary between this and the recent report because acreage estimates were derived from different sources. In SWAT, each watershed is divided into multiple Hydrologic Response Units (HRUs) that are simulated as having homogeneous land-use, management, and soil characteristics. An HRU is not a contiguous land area, but rather represents the total fraction of the watershed that has the specific characteristics represented by that HRU. SWAT was used to simulate the fate and transport of water, sediment, and nutrients originating from the following land-use categories (HRUs):
• Cultivated Cropland • Pastureland • Permanent Hayland, grass and legume • Urban • Forest, including mixed, deciduous, and evergreen • Horticultural lands • Wetlands, forested and non-forested
Upland processes were modeled for each of these HRUs in each 8-digit HUC watershed (fig. 3.2). SWAT simulates surface runoff from daily rainfall and irrigation. Percolation is modeled with a layered storage routing technique combined with a subsurface flow model, lateral subsurface flow, and groundwater flow model to streams from shallow aquifers. SWAT also accounts for potential evapotranspiration, snowmelt dynamics, transmission losses from streams, and water storage and losses from ponds and reservoirs.
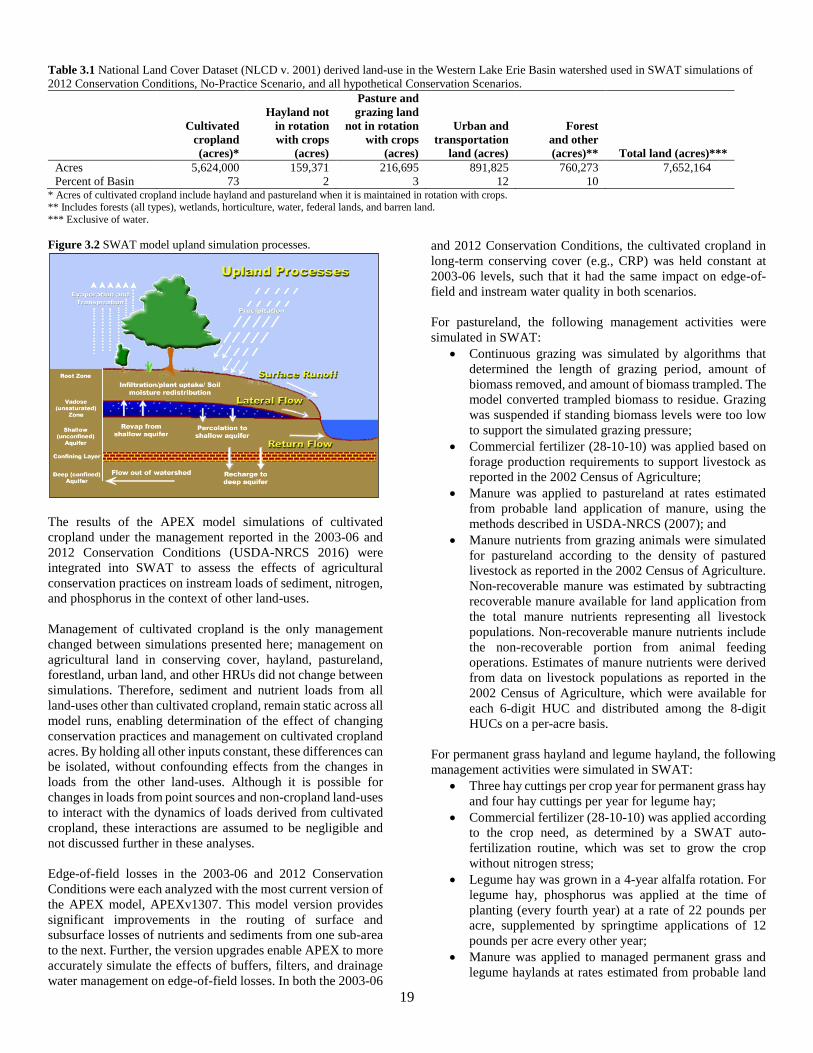
19
Table 3.1 National Land Cover Dataset (NLCD v. 2001) derived land-use in the Western Lake Erie Basin watershed used in SWAT simulations of 2012 Conservation Conditions, No-Practice Scenario, and all hypothetical Conservation Scenarios.
Cultivated cropland (acres)*
Hayland not in rotation with crops
(acres)
Pasture and grazing land
not in rotation with crops
(acres)
Urban and transportation
land (acres)
Forest and other (acres)** Total land (acres)***
Acres 5,624,000 159,371 216,695 891,825 760,273 7,652,164 Percent of Basin 73 2 3 12 10
* Acres of cultivated cropland include hayland and pastureland when it is maintained in rotation with crops. ** Includes forests (all types), wetlands, horticulture, water, federal lands, and barren land. *** Exclusive of water. Figure 3.2 SWAT model upland simulation processes.
The results of the APEX model simulations of cultivated cropland under the management reported in the 2003-06 and 2012 Conservation Conditions (USDA-NRCS 2016) were integrated into SWAT to assess the effects of agricultural conservation practices on instream loads of sediment, nitrogen, and phosphorus in the context of other land-uses. Management of cultivated cropland is the only management changed between simulations presented here; management on agricultural land in conserving cover, hayland, pastureland, forestland, urban land, and other HRUs did not change between simulations. Therefore, sediment and nutrient loads from all land-uses other than cultivated cropland, remain static across all model runs, enabling determination of the effect of changing conservation practices and management on cultivated cropland acres. By holding all other inputs constant, these differences can be isolated, without confounding effects from the changes in loads from the other land-uses. Although it is possible for changes in loads from point sources and non-cropland land-uses to interact with the dynamics of loads derived from cultivated cropland, these interactions are assumed to be negligible and not discussed further in these analyses. Edge-of-field losses in the 2003-06 and 2012 Conservation Conditions were each analyzed with the most current version of the APEX model, APEXv1307. This model version provides significant improvements in the routing of surface and subsurface losses of nutrients and sediments from one sub-area to the next. Further, the version upgrades enable APEX to more accurately simulate the effects of buffers, filters, and drainage water management on edge-of-field losses. In both the 2003-06
and 2012 Conservation Conditions, the cultivated cropland in long-term conserving cover (e.g., CRP) was held constant at 2003-06 levels, such that it had the same impact on edge-of-field and instream water quality in both scenarios. For pastureland, the following management activities were simulated in SWAT:
• Continuous grazing was simulated by algorithms that determined the length of grazing period, amount of biomass removed, and amount of biomass trampled. The model converted trampled biomass to residue. Grazing was suspended if standing biomass levels were too low to support the simulated grazing pressure;
• Commercial fertilizer (28-10-10) was applied based on forage production requirements to support livestock as reported in the 2002 Census of Agriculture;
• Manure was applied to pastureland at rates estimated from probable land application of manure, using the methods described in USDA-NRCS (2007); and
• Manure nutrients from grazing animals were simulated for pastureland according to the density of pastured livestock as reported in the 2002 Census of Agriculture. Non-recoverable manure was estimated by subtracting recoverable manure available for land application from the total manure nutrients representing all livestock populations. Non-recoverable manure nutrients include the non-recoverable portion from animal feeding operations. Estimates of manure nutrients were derived from data on livestock populations as reported in the 2002 Census of Agriculture, which were available for each 6-digit HUC and distributed among the 8-digit HUCs on a per-acre basis.
For permanent grass hayland and legume hayland, the following management activities were simulated in SWAT:
• Three hay cuttings per crop year for permanent grass hay and four hay cuttings per year for legume hay;
• Commercial fertilizer (28-10-10) was applied according to the crop need, as determined by a SWAT auto-fertilization routine, which was set to grow the crop without nitrogen stress;
• Legume hay was grown in a 4-year alfalfa rotation. For legume hay, phosphorus was applied at the time of planting (every fourth year) at a rate of 22 pounds per acre, supplemented by springtime applications of 12 pounds per acre every other year;
• Manure was applied to managed permanent grass and legume haylands at rates estimated from probable land
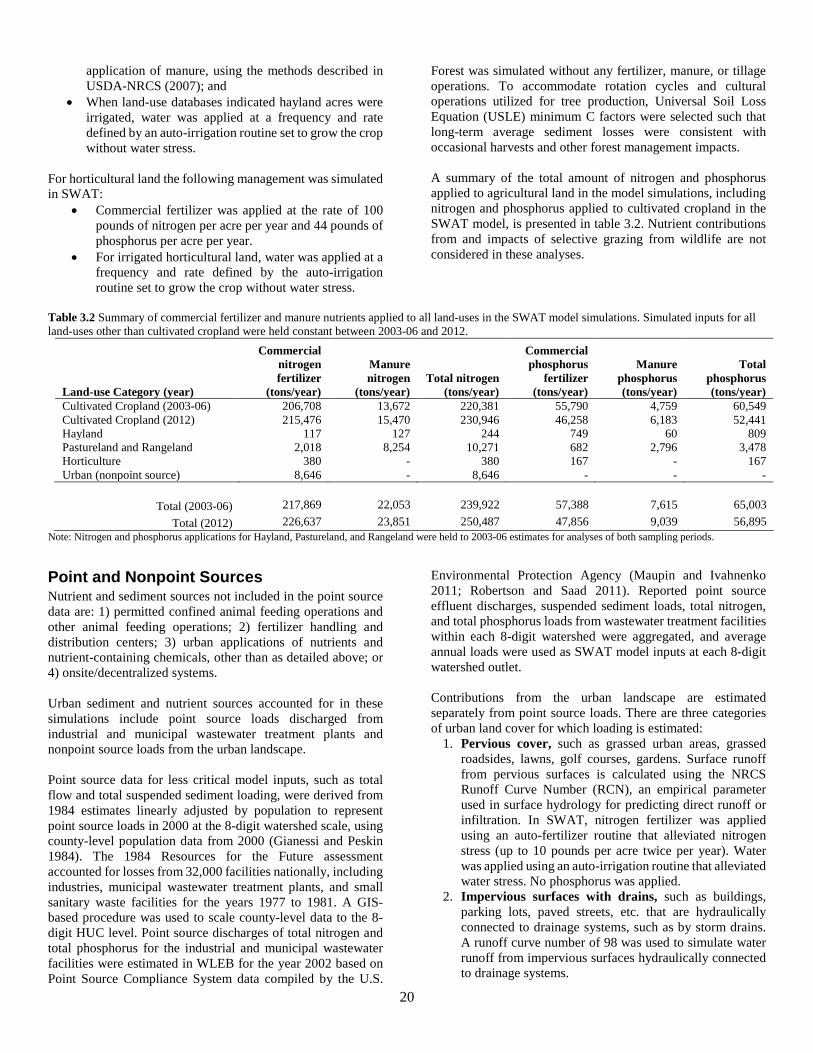
20
application of manure, using the methods described in USDA-NRCS (2007); and
• When land-use databases indicated hayland acres were irrigated, water was applied at a frequency and rate defined by an auto-irrigation routine set to grow the crop without water stress.
For horticultural land the following management was simulated in SWAT:
• Commercial fertilizer was applied at the rate of 100 pounds of nitrogen per acre per year and 44 pounds of phosphorus per acre per year.
• For irrigated horticultural land, water was applied at a frequency and rate defined by the auto-irrigation routine set to grow the crop without water stress.
Forest was simulated without any fertilizer, manure, or tillage operations. To accommodate rotation cycles and cultural operations utilized for tree production, Universal Soil Loss Equation (USLE) minimum C factors were selected such that long-term average sediment losses were consistent with occasional harvests and other forest management impacts. A summary of the total amount of nitrogen and phosphorus applied to agricultural land in the model simulations, including nitrogen and phosphorus applied to cultivated cropland in the SWAT model, is presented in table 3.2. Nutrient contributions from and impacts of selective grazing from wildlife are not considered in these analyses.
Table 3.2 Summary of commercial fertilizer and manure nutrients applied to all land-uses in the SWAT model simulations. Simulated inputs for all land-uses other than cultivated cropland were held constant between 2003-06 and 2012.
Land-use Category (year)
Commercial nitrogen fertilizer
(tons/year)
Manure nitrogen
(tons/year) Total nitrogen
(tons/year)
Commercial phosphorus
fertilizer (tons/year)
Manure phosphorus (tons/year)
Total phosphorus (tons/year)
Cultivated Cropland (2003-06) 206,708 13,672 220,381 55,790 4,759 60,549 Cultivated Cropland (2012) 215,476 15,470 230,946 46,258 6,183 52,441 Hayland 117 127 244 749 60 809 Pastureland and Rangeland 2,018 8,254 10,271 682 2,796 3,478 Horticulture 380 - 380 167 - 167 Urban (nonpoint source) 8,646 - 8,646 - - -
Total (2003-06) 217,869 22,053 239,922 57,388 7,615 65,003 Total (2012) 226,637 23,851 250,487 47,856 9,039 56,895
Note: Nitrogen and phosphorus applications for Hayland, Pastureland, and Rangeland were held to 2003-06 estimates for analyses of both sampling periods. Point and Nonpoint Sources Nutrient and sediment sources not included in the point source data are: 1) permitted confined animal feeding operations and other animal feeding operations; 2) fertilizer handling and distribution centers; 3) urban applications of nutrients and nutrient-containing chemicals, other than as detailed above; or 4) onsite/decentralized systems. Urban sediment and nutrient sources accounted for in these simulations include point source loads discharged from industrial and municipal wastewater treatment plants and nonpoint source loads from the urban landscape. Point source data for less critical model inputs, such as total flow and total suspended sediment loading, were derived from 1984 estimates linearly adjusted by population to represent point source loads in 2000 at the 8-digit watershed scale, using county-level population data from 2000 (Gianessi and Peskin 1984). The 1984 Resources for the Future assessment accounted for losses from 32,000 facilities nationally, including industries, municipal wastewater treatment plants, and small sanitary waste facilities for the years 1977 to 1981. A GIS-based procedure was used to scale county-level data to the 8-digit HUC level. Point source discharges of total nitrogen and total phosphorus for the industrial and municipal wastewater facilities were estimated in WLEB for the year 2002 based on Point Source Compliance System data compiled by the U.S.
Environmental Protection Agency (Maupin and Ivahnenko 2011; Robertson and Saad 2011). Reported point source effluent discharges, suspended sediment loads, total nitrogen, and total phosphorus loads from wastewater treatment facilities within each 8-digit watershed were aggregated, and average annual loads were used as SWAT model inputs at each 8-digit watershed outlet. Contributions from the urban landscape are estimated separately from point source loads. There are three categories of urban land cover for which loading is estimated:
1. Pervious cover, such as grassed urban areas, grassed roadsides, lawns, golf courses, gardens. Surface runoff from pervious surfaces is calculated using the NRCS Runoff Curve Number (RCN), an empirical parameter used in surface hydrology for predicting direct runoff or infiltration. In SWAT, nitrogen fertilizer was applied using an auto-fertilizer routine that alleviated nitrogen stress (up to 10 pounds per acre twice per year). Water was applied using an auto-irrigation routine that alleviated water stress. No phosphorus was applied.
2. Impervious surfaces with drains, such as buildings, parking lots, paved streets, etc. that are hydraulically connected to drainage systems, such as by storm drains. A runoff curve number of 98 was used to simulate water runoff from impervious surfaces hydraulically connected to drainage systems.
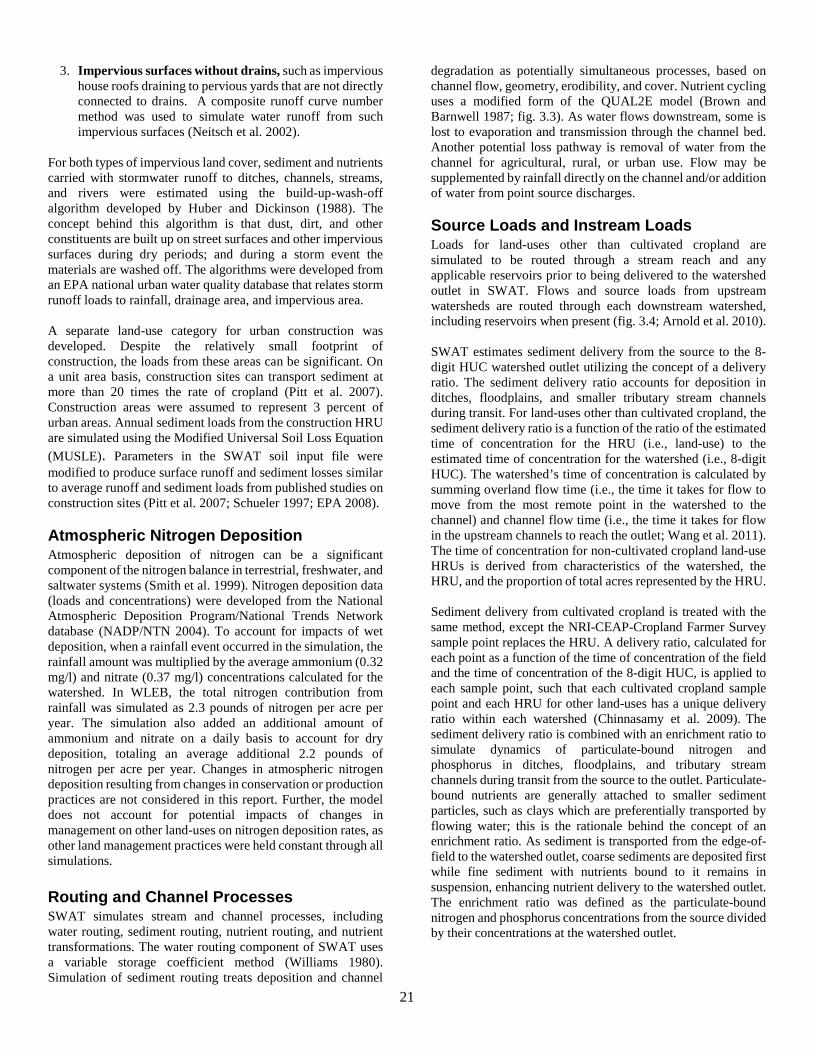
21
3. Impervious surfaces without drains, such as impervious house roofs draining to pervious yards that are not directly connected to drains. A composite runoff curve number method was used to simulate water runoff from such impervious surfaces (Neitsch et al. 2002).
For both types of impervious land cover, sediment and nutrients carried with stormwater runoff to ditches, channels, streams, and rivers were estimated using the build-up-wash-off algorithm developed by Huber and Dickinson (1988). The concept behind this algorithm is that dust, dirt, and other constituents are built up on street surfaces and other impervious surfaces during dry periods; and during a storm event the materials are washed off. The algorithms were developed from an EPA national urban water quality database that relates storm runoff loads to rainfall, drainage area, and impervious area. A separate land-use category for urban construction was developed. Despite the relatively small footprint of construction, the loads from these areas can be significant. On a unit area basis, construction sites can transport sediment at more than 20 times the rate of cropland (Pitt et al. 2007). Construction areas were assumed to represent 3 percent of urban areas. Annual sediment loads from the construction HRU are simulated using the Modified Universal Soil Loss Equation (MUSLE). Parameters in the SWAT soil input file were modified to produce surface runoff and sediment losses similar to average runoff and sediment loads from published studies on construction sites (Pitt et al. 2007; Schueler 1997; EPA 2008). Atmospheric Nitrogen Deposition Atmospheric deposition of nitrogen can be a significant component of the nitrogen balance in terrestrial, freshwater, and saltwater systems (Smith et al. 1999). Nitrogen deposition data (loads and concentrations) were developed from the National Atmospheric Deposition Program/National Trends Network database (NADP/NTN 2004). To account for impacts of wet deposition, when a rainfall event occurred in the simulation, the rainfall amount was multiplied by the average ammonium (0.32 mg/l) and nitrate (0.37 mg/l) concentrations calculated for the watershed. In WLEB, the total nitrogen contribution from rainfall was simulated as 2.3 pounds of nitrogen per acre per year. The simulation also added an additional amount of ammonium and nitrate on a daily basis to account for dry deposition, totaling an average additional 2.2 pounds of nitrogen per acre per year. Changes in atmospheric nitrogen deposition resulting from changes in conservation or production practices are not considered in this report. Further, the model does not account for potential impacts of changes in management on other land-uses on nitrogen deposition rates, as other land management practices were held constant through all simulations. Routing and Channel Processes SWAT simulates stream and channel processes, including water routing, sediment routing, nutrient routing, and nutrient transformations. The water routing component of SWAT uses a variable storage coefficient method (Williams 1980). Simulation of sediment routing treats deposition and channel
degradation as potentially simultaneous processes, based on channel flow, geometry, erodibility, and cover. Nutrient cycling uses a modified form of the QUAL2E model (Brown and Barnwell 1987; fig. 3.3). As water flows downstream, some is lost to evaporation and transmission through the channel bed. Another potential loss pathway is removal of water from the channel for agricultural, rural, or urban use. Flow may be supplemented by rainfall directly on the channel and/or addition of water from point source discharges. Source Loads and Instream Loads Loads for land-uses other than cultivated cropland are simulated to be routed through a stream reach and any applicable reservoirs prior to being delivered to the watershed outlet in SWAT. Flows and source loads from upstream watersheds are routed through each downstream watershed, including reservoirs when present (fig. 3.4; Arnold et al. 2010).
SWAT estimates sediment delivery from the source to the 8-digit HUC watershed outlet utilizing the concept of a delivery ratio. The sediment delivery ratio accounts for deposition in ditches, floodplains, and smaller tributary stream channels during transit. For land-uses other than cultivated cropland, the sediment delivery ratio is a function of the ratio of the estimated time of concentration for the HRU (i.e., land-use) to the estimated time of concentration for the watershed (i.e., 8-digit HUC). The watershed’s time of concentration is calculated by summing overland flow time (i.e., the time it takes for flow to move from the most remote point in the watershed to the channel) and channel flow time (i.e., the time it takes for flow in the upstream channels to reach the outlet; Wang et al. 2011). The time of concentration for non-cultivated cropland land-use HRUs is derived from characteristics of the watershed, the HRU, and the proportion of total acres represented by the HRU. Sediment delivery from cultivated cropland is treated with the same method, except the NRI-CEAP-Cropland Farmer Survey sample point replaces the HRU. A delivery ratio, calculated for each point as a function of the time of concentration of the field and the time of concentration of the 8-digit HUC, is applied to each sample point, such that each cultivated cropland sample point and each HRU for other land-uses has a unique delivery ratio within each watershed (Chinnasamy et al. 2009). The sediment delivery ratio is combined with an enrichment ratio to simulate dynamics of particulate-bound nitrogen and phosphorus in ditches, floodplains, and tributary stream channels during transit from the source to the outlet. Particulate-bound nutrients are generally attached to smaller sediment particles, such as clays which are preferentially transported by flowing water; this is the rationale behind the concept of an enrichment ratio. As sediment is transported from the edge-of-field to the watershed outlet, coarse sediments are deposited first while fine sediment with nutrients bound to it remains in suspension, enhancing nutrient delivery to the watershed outlet. The enrichment ratio was defined as the particulate-bound nitrogen and phosphorus concentrations from the source divided by their concentrations at the watershed outlet.
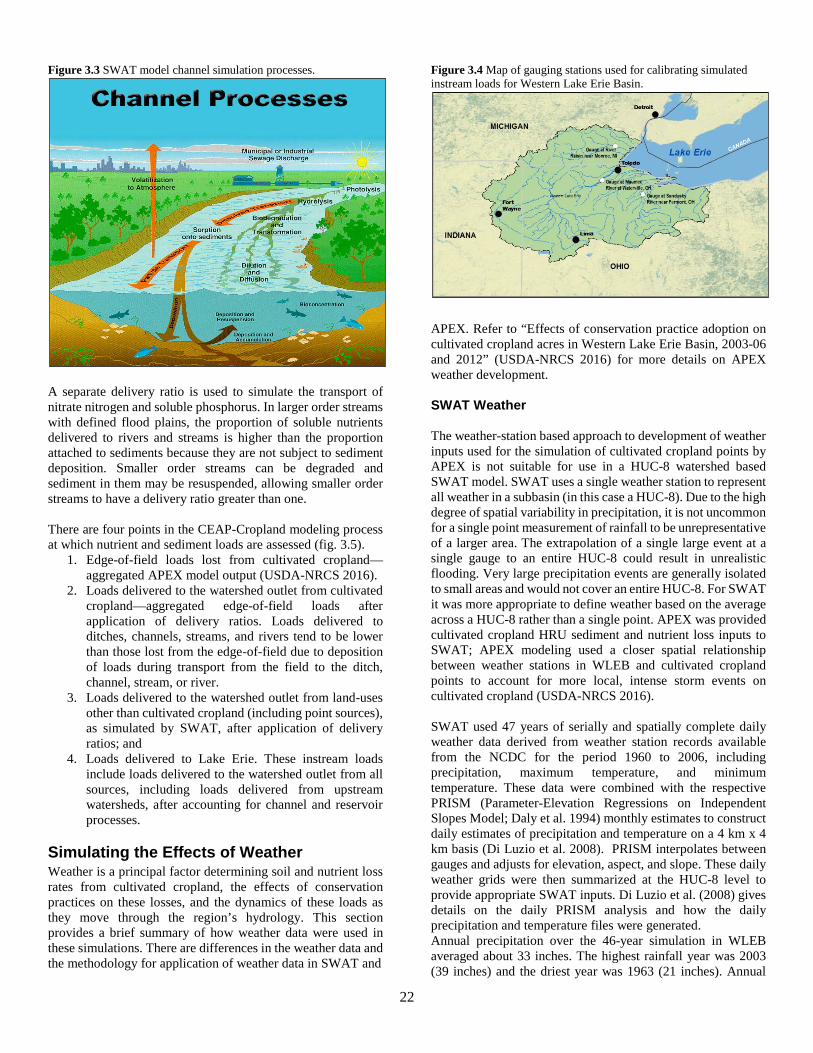
22
Figure 3.3 SWAT model channel simulation processes.
A separate delivery ratio is used to simulate the transport of nitrate nitrogen and soluble phosphorus. In larger order streams with defined flood plains, the proportion of soluble nutrients delivered to rivers and streams is higher than the proportion attached to sediments because they are not subject to sediment deposition. Smaller order streams can be degraded and sediment in them may be resuspended, allowing smaller order streams to have a delivery ratio greater than one. There are four points in the CEAP-Cropland modeling process at which nutrient and sediment loads are assessed (fig. 3.5).
1. Edge-of-field loads lost from cultivated cropland—aggregated APEX model output (USDA-NRCS 2016).
2. Loads delivered to the watershed outlet from cultivated cropland—aggregated edge-of-field loads after application of delivery ratios. Loads delivered to ditches, channels, streams, and rivers tend to be lower than those lost from the edge-of-field due to deposition of loads during transport from the field to the ditch, channel, stream, or river.
3. Loads delivered to the watershed outlet from land-uses other than cultivated cropland (including point sources), as simulated by SWAT, after application of delivery ratios; and
4. Loads delivered to Lake Erie. These instream loads include loads delivered to the watershed outlet from all sources, including loads delivered from upstream watersheds, after accounting for channel and reservoir processes.
Simulating the Effects of Weather Weather is a principal factor determining soil and nutrient loss rates from cultivated cropland, the effects of conservation practices on these losses, and the dynamics of these loads as they move through the region’s hydrology. This section provides a brief summary of how weather data were used in these simulations. There are differences in the weather data and the methodology for application of weather data in SWAT and
Figure 3.4 Map of gauging stations used for calibrating simulated instream loads for Western Lake Erie Basin.
APEX. Refer to “Effects of conservation practice adoption on cultivated cropland acres in Western Lake Erie Basin, 2003-06 and 2012” (USDA-NRCS 2016) for more details on APEX weather development. SWAT Weather The weather-station based approach to development of weather inputs used for the simulation of cultivated cropland points by APEX is not suitable for use in a HUC-8 watershed based SWAT model. SWAT uses a single weather station to represent all weather in a subbasin (in this case a HUC-8). Due to the high degree of spatial variability in precipitation, it is not uncommon for a single point measurement of rainfall to be unrepresentative of a larger area. The extrapolation of a single large event at a single gauge to an entire HUC-8 could result in unrealistic flooding. Very large precipitation events are generally isolated to small areas and would not cover an entire HUC-8. For SWAT it was more appropriate to define weather based on the average across a HUC-8 rather than a single point. APEX was provided cultivated cropland HRU sediment and nutrient loss inputs to SWAT; APEX modeling used a closer spatial relationship between weather stations in WLEB and cultivated cropland points to account for more local, intense storm events on cultivated cropland (USDA-NRCS 2016). SWAT used 47 years of serially and spatially complete daily weather data derived from weather station records available from the NCDC for the period 1960 to 2006, including precipitation, maximum temperature, and minimum temperature. These data were combined with the respective PRISM (Parameter-Elevation Regressions on Independent Slopes Model; Daly et al. 1994) monthly estimates to construct daily estimates of precipitation and temperature on a 4 km x 4 km basis (Di Luzio et al. 2008). PRISM interpolates between gauges and adjusts for elevation, aspect, and slope. These daily weather grids were then summarized at the HUC-8 level to provide appropriate SWAT inputs. Di Luzio et al. (2008) gives details on the daily PRISM analysis and how the daily precipitation and temperature files were generated. Annual precipitation over the 46-year simulation in WLEB averaged about 33 inches. The highest rainfall year was 2003 (39 inches) and the driest year was 1963 (21 inches). Annual
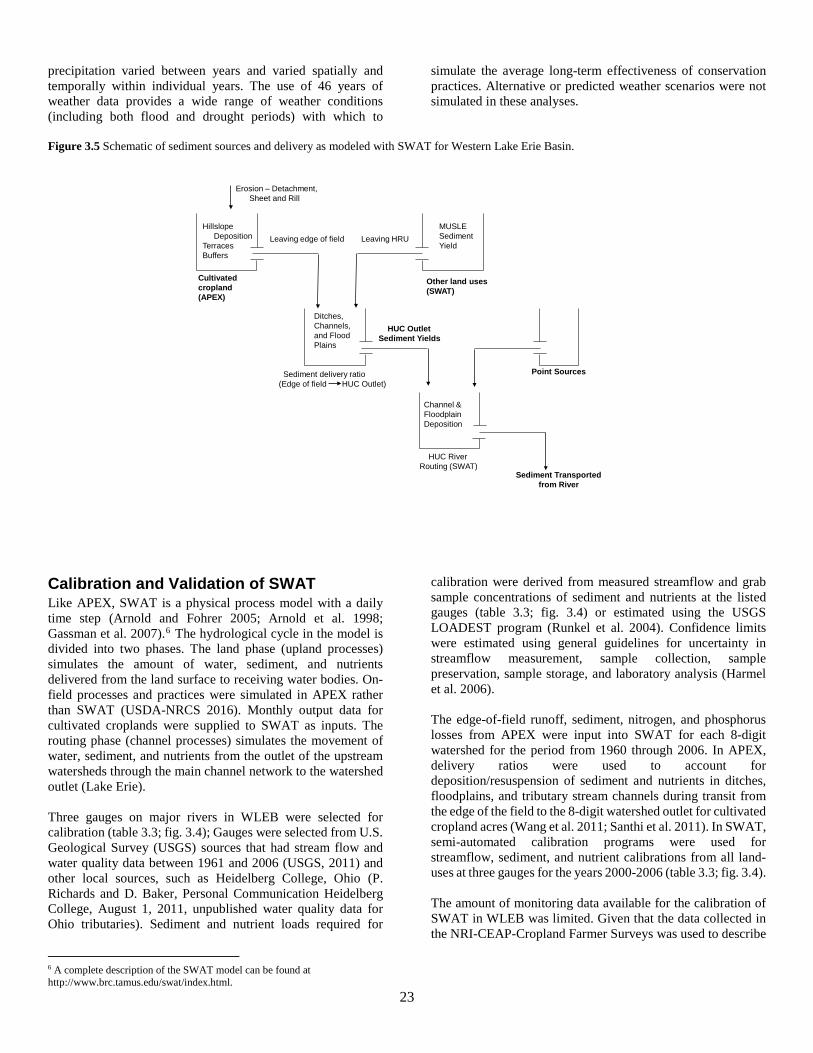
23
precipitation varied between years and varied spatially and temporally within individual years. The use of 46 years of weather data provides a wide range of weather conditions (including both flood and drought periods) with which to
simulate the average long-term effectiveness of conservation practices. Alternative or predicted weather scenarios were not simulated in these analyses.
Figure 3.5 Schematic of sediment sources and delivery as modeled with SWAT for Western Lake Erie Basin.
Erosion – Detachment,Sheet and Rill
HillslopeDeposition
TerracesBuffers
Sediment delivery ratio(Edge of field HUC Outlet)
MUSLESedimentYield
Leaving edge of field Leaving HRU
Other land uses (SWAT)
Ditches,Channels,and FloodPlains
Cultivated cropland (APEX)
HUC Outlet Sediment Yields
Point Sources
Channel &Floodplain Deposition
HUC RiverRouting (SWAT)
Sediment Transportedfrom River
Calibration and Validation of SWAT Like APEX, SWAT is a physical process model with a daily time step (Arnold and Fohrer 2005; Arnold et al. 1998; Gassman et al. 2007).6 The hydrological cycle in the model is divided into two phases. The land phase (upland processes) simulates the amount of water, sediment, and nutrients delivered from the land surface to receiving water bodies. On-field processes and practices were simulated in APEX rather than SWAT (USDA-NRCS 2016). Monthly output data for cultivated croplands were supplied to SWAT as inputs. The routing phase (channel processes) simulates the movement of water, sediment, and nutrients from the outlet of the upstream watersheds through the main channel network to the watershed outlet (Lake Erie). Three gauges on major rivers in WLEB were selected for calibration (table 3.3; fig. 3.4); Gauges were selected from U.S. Geological Survey (USGS) sources that had stream flow and water quality data between 1961 and 2006 (USGS, 2011) and other local sources, such as Heidelberg College, Ohio (P. Richards and D. Baker, Personal Communication Heidelberg College, August 1, 2011, unpublished water quality data for Ohio tributaries). Sediment and nutrient loads required for
6 A complete description of the SWAT model can be found at http://www.brc.tamus.edu/swat/index.html.
calibration were derived from measured streamflow and grab sample concentrations of sediment and nutrients at the listed gauges (table 3.3; fig. 3.4) or estimated using the USGS LOADEST program (Runkel et al. 2004). Confidence limits were estimated using general guidelines for uncertainty in streamflow measurement, sample collection, sample preservation, sample storage, and laboratory analysis (Harmel et al. 2006). The edge-of-field runoff, sediment, nitrogen, and phosphorus losses from APEX were input into SWAT for each 8-digit watershed for the period from 1960 through 2006. In APEX, delivery ratios were used to account for deposition/resuspension of sediment and nutrients in ditches, floodplains, and tributary stream channels during transit from the edge of the field to the 8-digit watershed outlet for cultivated cropland acres (Wang et al. 2011; Santhi et al. 2011). In SWAT, semi-automated calibration programs were used for streamflow, sediment, and nutrient calibrations from all land-uses at three gauges for the years 2000-2006 (table 3.3; fig. 3.4). The amount of monitoring data available for the calibration of SWAT in WLEB was limited. Given that the data collected in the NRI-CEAP-Cropland Farmer Surveys was used to describe
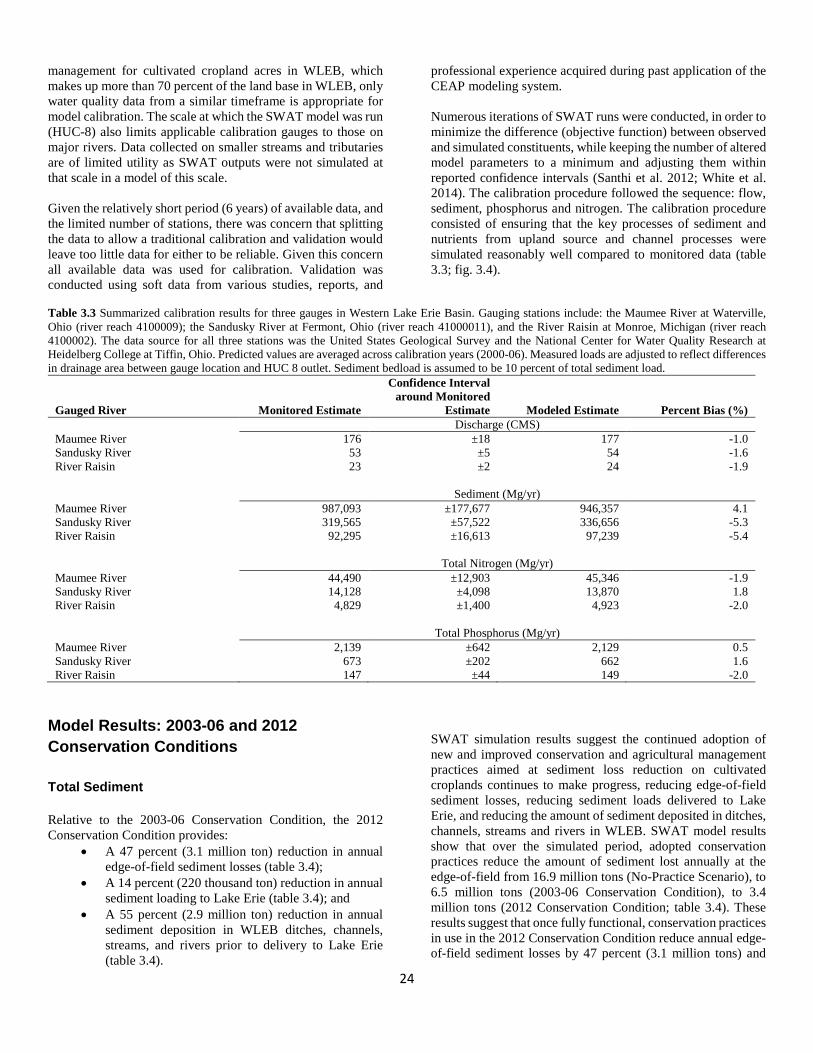
24
management for cultivated cropland acres in WLEB, which makes up more than 70 percent of the land base in WLEB, only water quality data from a similar timeframe is appropriate for model calibration. The scale at which the SWAT model was run (HUC-8) also limits applicable calibration gauges to those on major rivers. Data collected on smaller streams and tributaries are of limited utility as SWAT outputs were not simulated at that scale in a model of this scale. Given the relatively short period (6 years) of available data, and the limited number of stations, there was concern that splitting the data to allow a traditional calibration and validation would leave too little data for either to be reliable. Given this concern all available data was used for calibration. Validation was conducted using soft data from various studies, reports, and
professional experience acquired during past application of the CEAP modeling system. Numerous iterations of SWAT runs were conducted, in order to minimize the difference (objective function) between observed and simulated constituents, while keeping the number of altered model parameters to a minimum and adjusting them within reported confidence intervals (Santhi et al. 2012; White et al. 2014). The calibration procedure followed the sequence: flow, sediment, phosphorus and nitrogen. The calibration procedure consisted of ensuring that the key processes of sediment and nutrients from upland source and channel processes were simulated reasonably well compared to monitored data (table 3.3; fig. 3.4).
Table 3.3 Summarized calibration results for three gauges in Western Lake Erie Basin. Gauging stations include: the Maumee River at Waterville, Ohio (river reach 4100009); the Sandusky River at Fermont, Ohio (river reach 41000011), and the River Raisin at Monroe, Michigan (river reach 4100002). The data source for all three stations was the United States Geological Survey and the National Center for Water Quality Research at Heidelberg College at Tiffin, Ohio. Predicted values are averaged across calibration years (2000-06). Measured loads are adjusted to reflect differences in drainage area between gauge location and HUC 8 outlet. Sediment bedload is assumed to be 10 percent of total sediment load.
Gauged River Monitored Estimate
Confidence Interval around Monitored
Estimate Modeled Estimate Percent Bias (%) Discharge (CMS) Maumee River 176 ±18 177 -1.0 Sandusky River 53 ±5 54 -1.6 River Raisin 23 ±2 24 -1.9 Sediment (Mg/yr) Maumee River 987,093 ±177,677 946,357 4.1 Sandusky River 319,565 ±57,522 336,656 -5.3 River Raisin 92,295 ±16,613 97,239 -5.4 Total Nitrogen (Mg/yr) Maumee River 44,490 ±12,903 45,346 -1.9 Sandusky River 14,128 ±4,098 13,870 1.8 River Raisin 4,829 ±1,400 4,923 -2.0 Total Phosphorus (Mg/yr) Maumee River 2,139 ±642 2,129 0.5 Sandusky River 673 ±202 662 1.6 River Raisin 147 ±44 149 -2.0
Model Results: 2003-06 and 2012 Conservation Conditions Total Sediment Relative to the 2003-06 Conservation Condition, the 2012 Conservation Condition provides:
• A 47 percent (3.1 million ton) reduction in annual edge-of-field sediment losses (table 3.4);
• A 14 percent (220 thousand ton) reduction in annual sediment loading to Lake Erie (table 3.4); and
• A 55 percent (2.9 million ton) reduction in annual sediment deposition in WLEB ditches, channels, streams, and rivers prior to delivery to Lake Erie (table 3.4).
SWAT simulation results suggest the continued adoption of new and improved conservation and agricultural management practices aimed at sediment loss reduction on cultivated croplands continues to make progress, reducing edge-of-field sediment losses, reducing sediment loads delivered to Lake Erie, and reducing the amount of sediment deposited in ditches, channels, streams and rivers in WLEB. SWAT model results show that over the simulated period, adopted conservation practices reduce the amount of sediment lost annually at the edge-of-field from 16.9 million tons (No-Practice Scenario), to 6.5 million tons (2003-06 Conservation Condition), to 3.4 million tons (2012 Conservation Condition; table 3.4). These results suggest that once fully functional, conservation practices in use in the 2012 Conservation Condition reduce annual edge-of-field sediment losses by 47 percent (3.1 million tons) and
25
sediment delivery to Lake Erie by 14 percent (220 thousand tons) relative to the 2003-06 Conservation Condition (table 3.4). Relative to if no agricultural conservation were in use in WLEB, the 2012 Conservation Condition reduces annual edge-of-field sediment losses by 80 percent (13.4 million tons) and sediment delivery to Lake Erie by 40 percent (855 thousand tons; table 3.4). In these simulations, all benefits are attributable to changing agricultural management, as inputs from all other land-uses were held constant in all scenarios. Approximately 262 thousand tons of sediment are delivered to annual instream loads in WLEB from land-uses other than cultivated cropland in every scenario. These loads are not the exact equivalent to the edge-of-field cultivated cropland loads, as the loads from other land-uses were routed through SWAT prior to their estimation. Ergo these load estimates are likely lower than actual edge-of-field losses from other land-uses, as deposition is likely to have occurred between the source and the point of instream estimate (HUC-8 outlet). These analyses do not estimate amounts of sediment and nutrients deposited upstream of the HUC-8 outlets for land-uses other than cultivated cropland acres; therefore, reported deposition rates associated with losses from land-uses other than cultivated cropland may also be underestimates. In both the 2003-06 and 2012 Conservation Conditions more sediment is lost from cultivated cropland acres each year than reaches Lake Erie, indicating that sediment continues to be deposited in the ditches, channels, streams, and rivers in WLEB. However, the amount of sediment being deposited in the WLEB hydrological system decreases between the two Conservation Conditions. Relative to if no agricultural conservation were in place, the 2012 Conservation Condition keeps 13.4 million tons of sediment out of the WLEB hydrological system annually, which decreases annual deposition rates in WLEB ditches, channels, streams, and rivers by 84 percent (12.6 million tons). Relative to the 2003-06 Conservation Condition, the 2012 Conservation Condition keeps 3.1 million tons of sediment out of the WLEB hydrological system annually, which decreases annual deposition rates in WLEB ditches, channels, streams, and rivers by 55 percent (2.9 million tons). This reduction in sediment deposition may have significant impacts on future load deliveries, as less sediment will be available for resuspension. Even with ongoing reductions in losses and deposition, sediment and nutrients derived from past land-use continue to serve as sources in WLEB ditches, channels, streams, and rivers (Meals et al 2010; Sharpley et al. 2013; Fox et al. 2016; Merten et al. 2016). Ironically, as sediment losses continue to decline, resuspension of legacy sediment may increase, due to cleaner water conditions caused by successful conservation efforts or increased flow rates from increasingly efficient drainage systems for agriculture and flood control; for some time, the resuspended sediment and associated nutrients may mask the gains made by edge-of-field conservation practices towards reducing edge-of-field losses.
During the last century, conservation practices and farming both spread across WLEB. Past land-uses and the legacies of their associated management may have long-lasting impacts on aquatic systems, streambank health, and sediment dynamics, potentially masking benefits of current conservation practice adoption (Jackson et al. 2005; Tayyebi et al. 2015). While this year’s sediment losses make up the live load, the portion of the live load deposited during transit could later act as a source, or legacy load, extenuating sediment loading problems even when current edge-of-field losses have been substantially reduced through conservation practice adoption. In a study of 14 agricultural watersheds across the United States, Tomer and Locke (2011) found that sediment in streams originated mostly from channel and bank erosion rather than from edge-of-field soil losses. Yan et al. (2010) found that in tile drained systems in Iowa, past anthropogenic disturbance, including past agriculture, contributed to substantial sediment deposition in area streams and hydrological changes in streams, both of which caused increased bank erosion rates relative to historical values. Merten et al. (2016) also showed that in heavily tiled watersheds in Iowa, current sediment loads continue to be impacted by agricultural management prior to the adoption of current conservation practices. Croplands and urban lands both contribute disproportionately to the sediment loads delivered to WLEB ditches, channels, streams, and rivers in the 2012 Conservation Condition. In the 2012 Conservation Condition 73 percent of WLEB acres are maintained in cultivated cropland (table 3.1) and contribute 81 percent of the sediment delivered to watershed outlets; around 12 percent of WLEB acres are maintained in urban cover, and urban point and nonpoint sources contribute 1 and 17 percent of the total sediment loads delivered to ditches, channels, streams, and rivers in WLEB, respectively (table 3.5). Hayland, pastureland, forest, barren land, wetlands, and other idle land make up 15 percent of the landscape, but contribute only about 1 percent of the sediment delivered to ditches, channels, streams, and rivers in WLEB in the 2012 Conservation Condition. Total Nitrogen Relative to the 2003-06 Conservation Condition, the 2012 Conservation Condition provides:
• A 6 percent (10.6 million pound) reduction in annual edge-of-field nitrogen losses (table 3.6);
• A 1 percent (1.1 million pound) reduction in annual nitrogen loading to Lake Erie (table 3.6); and
• A 16 percent (9.5 million pound) reduction in annual nitrogen deposition in WLEB ditches, channels, streams, and rivers prior to delivery to Lake Erie (table 3.6).
SWAT model simulations suggest that continued adoption of new and improved conservation practices aimed at nitrogen loss reduction are working, but results are also indicative of the fact that nitrogen management has not been as prioritized in this region as has sediment and phosphorus control. In fact, as recently as 2015 the Annex 4 Objectives and Targets Task Team Final Report stated that “it is not logical to target
26
[nitrogen] reduction because most load-response analysis to date shows good quantitative relationships with [phosphorus] load, and there is no guarantee that [nitrogen] reduction alone will” (OTTT 2015; page 52). However, recent work suggests that efforts to correct the eutrophication of Lake Erie and to restore the biodiversity of WLEB streams and rivers will not be successful if conservation efforts do not address both nitrogen and phosphorus (Levy 2017; Gobler et al. 2016; Keitzer et al. 2016; Paerl et al. 2016b). Transport processes are an important consideration in nitrogen conservation planning and management, as nitrogen is vulnerable to multiple loss pathways including runoff, leaching, and volatilization. Nitrogen loss dynamics tend to differ markedly from sediment loss dynamics and sediment-associated phosphorus loss dynamics. Addressing nitrogen loss pathways may assist in addressing soluble phosphorus loss pathways, and vice-versa, but conservation practices are designed to address particular conservation concerns and loss pathways. Site specific, appropriately holistic conservation goals should be carefully set and comprehensive conservation plans should be developed to promote adoption of practices that will enable achievement of those goals. These results demonstrate both progress and the opportunity to develop a more comprehensive focus on nitrogen loss reduction in WLEB, alongside continued efforts towards phosphorus and sediment loss reduction. SWAT model results show that over the simulated period, adopted conservation practices reduce the annual amount of nitrogen lost at the edge-of-field from 233.3 million pounds (No-Practice Scenario) to 182.9 million pounds (2003-06 Conservation Condition) to 172.3 million pounds (2012 Conservation Condition; table 3.6). These results suggest that once fully functional, conservation practices in use in the 2012 Conservation Condition reduce annual edge-of-field nitrogen losses by 6 percent (10.6 million pounds) and nitrogen delivery to Lake Erie by 1 percent (1.1 million pounds) relative to the 2003-06 Conservation Condition (table 3.6). Relative to if no agricultural conservation were in use in WLEB, the 2012 Conservation Condition reduces annual edge-of-field nitrogen losses by 26 percent (60.9 million pounds) and nitrogen delivery to Lake Erie by 17 percent (30.6 million tons; table 3.6). Although the amount of nitrogen being deposited in the WLEB hydrological system or leached into groundwater declines between the 2003-06 and 2012 Conservation Conditions, in both Conservation Conditions more nitrogen is lost from cultivated cropland acres each year than reaches Lake Erie each year, indicating that nitrogen from croplands and other land-uses continues to be deposited in the ditches, channels, streams, and rivers in WLEB, or leached from them into the region’s groundwater. The edge-of-field losses delivered to ditches, channels, streams, and rivers impact surface water quality in the SWAT model, but these model simulations do not consider percolation losses to groundwater and aquifers. Numerous studies suggest groundwater is an important source of nutrients delivered to rivers and lakes and that groundwater-sourcing
may contribute to decadal lag times between when agricultural practice changes are adopted and water quality improvements are measurable (Meals et al. 2010; Sprague et al. 2011; Stoliker et al. 2016; Jurado et al. 2017), bolstering the need for additional studies on the role of groundwater in nutrient cycling within the WLEB hydrological system (Robinson 2015). Relative to if no agricultural conservation were in place, the 2012 Conservation Condition keeps 60.9 million pounds of nitrogen out of the WLEB hydrological system annually, which decreases annual deposition rates in WLEB ditches, channels, streams, and rivers by 37 percent (30.4 million pounds). Relative to the 2003-06 Conservation Condition, the 2012 Conservation Condition keeps 10.6 million pounds of nitrogen out of the WLEB hydrological system annually, which decreases annual deposition rates in WLEB ditches, channels, streams, and rivers by 16 percent (9.5 million pounds, table 3.6). This reduction in nitrogen deposition may have significant impacts on future load deliveries and groundwater quality, as less nitrogen will be available in WLEB ditches, channels, streams, and rivers and vulnerable to resuspension or leaching losses. Nutrient and sediment loads derived from past land-use have been demonstrated to function as legacy sediment and nutrient sources (Meals et al 2010; Sharpley et al. 2013; Fox et al. 2016; Merten et al. 2016). As with legacy sediment, legacy nitrogen contributes to lag-times between conservation practice adoption and measurable system response. Particulate-bound nitrogen is subject to denitrification; some nitrogen will be lost to gaseous losses. Similarly, some dissolved nitrogen may find its way through ditch, stream, and river beds into groundwater, but some deposited nitrogen may be resuspended later and could mask the benefits of upstream conservation, including conservation on cultivated cropland. In these simulations, all benefits are attributable to changing agricultural management, as inputs from all other land-uses were held constant in all scenarios. Approximately 28.9 million pounds of nitrogen are delivered to annual instream loads in WLEB from land-uses other than cultivated cropland in every scenario. These loads are not the exact equivalent to the edge-of-field cultivated cropland loads, as the loads from other land-uses have been routed through SWAT prior to their estimation. Ergo these load estimates are likely lower than actual edge-of-field losses from other land-uses, as deposition is likely to have occurred between the source and the point of instream estimate (HUC-8 outlet). These analyses do not estimate amounts of sediment and nutrients deposited upstream of the HUC-8 outlets for land-uses other than cultivated cropland acres; therefore, reported deposition rates associated with losses from land-uses other than cultivated cropland may also be underestimates. Croplands and urban lands both contribute disproportionately to nitrogen loads delivered to WLEB ditches, channels, streams, and rivers in the 2012 Conservation Condition. Roughly 73 percent of WLEB acres are maintained in cultivated cropland (table 3.1) and contribute 83 percent of the nitrogen delivered to watershed outlets in the region under the 2012 Conservation Condition (table 3.5). Approximately 12 percent of WLEB
27
acres are maintained in urban cover in the 2012 Conservation Condition and urban point and nonpoint sources contribute 9 and 5 percent of the total nitrogen loads delivered to ditches, channels, streams, and rivers in WLEB, respectively (table 3.5). Hayland, pastureland, forest, barren land, wetlands, and other idle land make up 15 percent of the landscape, but contribute only about 3 percent of the total nitrogen delivered to ditches, channels, streams, and rivers in WLEB in the 2012 Conservation Condition. Total Phosphorus Relative to the 2003-06 Conservation Condition, the 2012 Conservation Condition provides:
• A 17 percent (2.0 million pound) reduction in annual edge-of-field phosphorus losses (table 3.7);
• A 3 percent (235 thousand pound) reduction in annual phosphorus loading to Lake Erie (table 3.7); and
• A 30 percent (1.7 million pound) reduction in annual phosphorus deposition in WLEB ditches, channels, streams, and rivers prior to delivery to Lake Erie (table 3.7).
Phosphorus loss reduction remains a primary conservation objective in WLEB (OTTT 2015). SWAT simulation results suggest the continued adoption of new and improved conservation and agricultural management practices aimed at phosphorus loss reduction on cultivated croplands continues to make progress, reducing edge-of-field phosphorus losses, reducing phosphorus loads delivered to Lake Erie, and reducing the amount of phosphorus deposited in ditches, channels, streams, and rivers in WLEB. SWAT model simulation results show that over the simulated period, adopted conservation practices reduce the annual amount of phosphorus lost at the edge-of-field from 24.4 million pounds (No-Practice Scenario) to 11.5 million pounds (2003-06 Conservation Condition) to 9.5 million pounds (2012 Conservation Condition; table 3.7). These results suggest that once fully functional, conservation practices in use in the 2012 Conservation Condition reduce annual edge-of-field phosphorus losses by 17 percent (2.0 million pounds) and phosphorus delivery to Lake Erie by 3 percent (235 thousand pounds) relative to the 2003-06 Conservation Condition (table 3.7). Relative to if no agricultural conservation were in use in WLEB, the 2012 Conservation Condition reduces annual edge-of-field phosphorus losses by 61 percent (14.9 million pounds) and phosphorus delivery to Lake Erie by 41 percent (4.7 million pounds; table 3.7). When considering impacts of current conservation efforts on load deliveries, it is important to keep in mind the impacts that current edge-of-field losses may have on the accumulation of phosphorus in WLEB’s hydrological system. Although the amount of phosphorus being deposited in the WLEB hydrological system or leached into groundwater declines between the 2003-06 and 2012 Conservation Conditions, in both Conservation Conditions more phosphorus is lost from cultivated cropland acres each year than reaches Lake Erie each
year, indicating that phosphorus from croplands and other land-uses continues to be deposited in the ditches, channels, streams, and rivers in WLEB, or leached from them into the region’s groundwater. The edge-of-field losses delivered to ditches, channels, streams, and rivers impact surface water quality in the SWAT model, but these model simulations do not consider percolation losses to groundwater and aquifers. Studies suggest groundwater is an important source of phosphorus and nitrogen delivered to rivers and lakes and that groundwater-sourcing may contribute to decadal lag times between when agricultural practice changes are adopted and water quality improvements are measureable (Meals et al. 2010; Sprague et al. 2011), bolstering the need for additional WLEB-specific studies on the role of groundwater in nutrient cycling within the WLEB hydrological system (Robinson et al. 2015). Sediment and nutrients derived from past land-uses continue to function as legacy sediment and nutrient sources in WLEB ditches, channels, streams, and rivers (Meals et al 2010; Sharpley et al. 2013; Fox et al. 2016; Merten et al. 2016). Continued deposition suggests it is likely the legacy phosphorus in the WLEB hydrological system will continue to contribute to Lake Erie loadings until a new equilibrium is reached. Relative to if no agricultural conservation were in place, the 2012 Conservation Condition keeps 14.9 million pounds of phosphorus out of the WLEB hydrological system annually, which decreases annual deposition rates in WLEB ditches, channels, streams, and rivers by 72 percent (10.2 million pounds; table 3.7). This means under the 2012 Conservation Condition, every year 10.2 million pounds of phosphorus that could contribute to future water quality problems in Lake Erie are kept out of the WLEB’s ditches, channels, streams, and rivers. Relative to the 2003-06 Conservation Condition, the 2012 Conservation Condition keeps 2.0 million pounds of phosphorus out of the WLEB hydrological system annually, which decreases annual deposition rates in WLEB ditches, channels, streams, and rivers by 30 percent (1.7 million pounds; table 3.7). This reduction in phosphorus deposition may have significant impacts on future load deliveries and groundwater quality, as less phosphorus will be vulnerable to resuspension or leaching losses in the WLEB hydrological system. In these simulations, all benefits are attributable to changing agricultural management, as inputs from all other land-uses were held constant in all scenarios. Approximately 1.3 million pounds of phosphorus are delivered to annual instream loads in WLEB from land-uses other than cultivated cropland in every scenario. These loads are not the exact equivalent to the edge-of-field cultivated cropland loads, as the loads from other land-uses have been routed through SWAT prior to their estimation. Ergo these load estimates are likely lower than actual edge-of-field losses from other land-uses, as deposition is likely to have occurred between the source and the point of instream estimate (HUC-8 outlet). These analyses do not estimate amounts of sediment and nutrients deposited upstream of the HUC-8 outlets for land-uses other than cultivated cropland acres; therefore, reported deposition rates associated with losses from land-uses other than cultivated cropland may also be underestimates.
28
Croplands and urban lands both contribute disproportionately to the phosphorus loads being delivered to WLEB ditches, channels, streams, and rivers in the 2012 Conservation Condition; roughly 73 percent of WLEB acres are maintained in cultivated cropland (table 3.1) and contribute 79 percent of the phosphorus delivered to watershed outlets in the region (table 3.5). In the 2012 Conservation Condition approximately 12 percent of the acres in the region are maintained in urban cover; urban point and nonpoint sources contribute 15 and 4 percent of the total phosphorus loads delivered to ditches, channels, streams, and rivers in WLEB, respectively (table 3.5). Hayland, pastureland, forest, barren land, wetlands, and other idle land make up 15 percent of the landscape, but contribute only about 2 percent of the phosphorus delivered to ditches, channels, streams, and rivers in WLEB in the 2012 Conservation Condition.
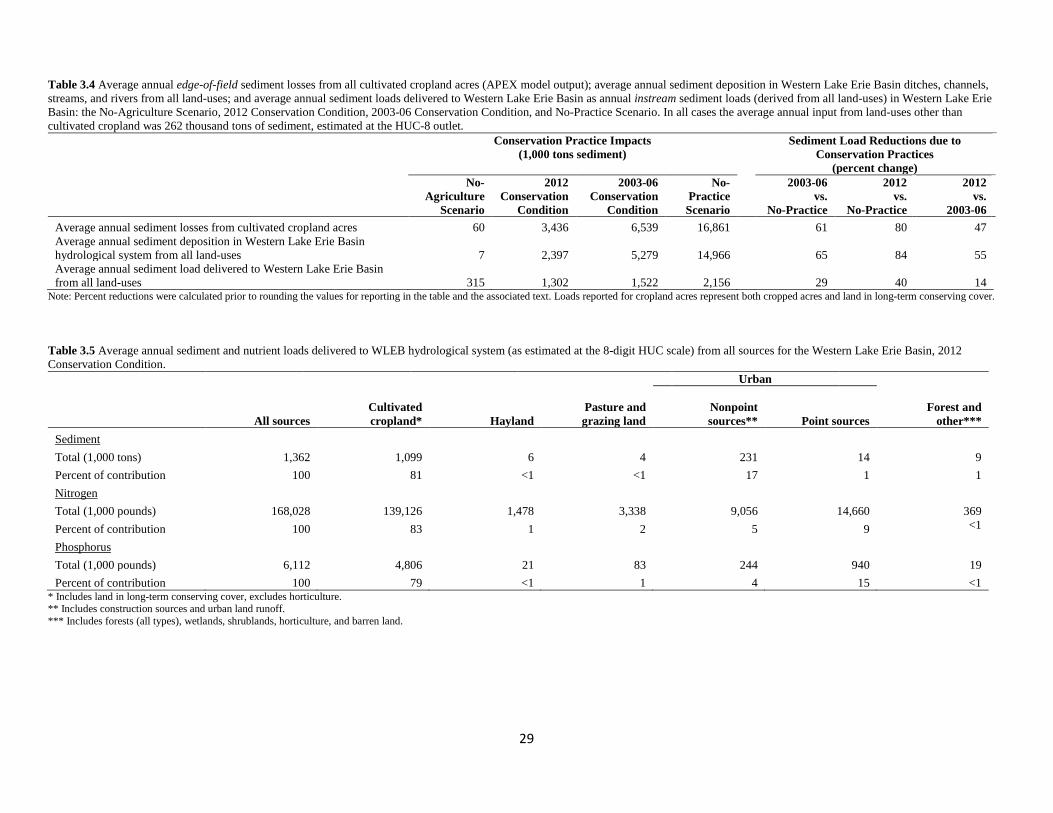
29
Table 3.4 Average annual edge-of-field sediment losses from all cultivated cropland acres (APEX model output); average annual sediment deposition in Western Lake Erie Basin ditches, channels, streams, and rivers from all land-uses; and average annual sediment loads delivered to Western Lake Erie Basin as annual instream sediment loads (derived from all land-uses) in Western Lake Erie Basin: the No-Agriculture Scenario, 2012 Conservation Condition, 2003-06 Conservation Condition, and No-Practice Scenario. In all cases the average annual input from land-uses other than cultivated cropland was 262 thousand tons of sediment, estimated at the HUC-8 outlet.
Conservation Practice Impacts (1,000 tons sediment)
Sediment Load Reductions due to Conservation Practices
(percent change)
No-Agriculture
Scenario
2012 Conservation
Condition
2003-06 Conservation
Condition
No-Practice Scenario
2003-06 vs.
No-Practice
2012 vs.
No-Practice
2012 vs.
2003-06 Average annual sediment losses from cultivated cropland acres 60 3,436 6,539 16,861 61 80 47 Average annual sediment deposition in Western Lake Erie Basin hydrological system from all land-uses 7 2,397 5,279 14,966 65 84 55 Average annual sediment load delivered to Western Lake Erie Basin from all land-uses 315 1,302 1,522 2,156 29 40 14
Note: Percent reductions were calculated prior to rounding the values for reporting in the table and the associated text. Loads reported for cropland acres represent both cropped acres and land in long-term conserving cover. Table 3.5 Average annual sediment and nutrient loads delivered to WLEB hydrological system (as estimated at the 8-digit HUC scale) from all sources for the Western Lake Erie Basin, 2012 Conservation Condition.
Urban
All sources Cultivated cropland* Hayland
Pasture and grazing land
Nonpoint sources** Point sources
Forest and
other*** Sediment Total (1,000 tons) 1,362 1,099 6 4 231 14 9 Percent of contribution 100 81 <1 <1 17 1 1 Nitrogen Total (1,000 pounds) 168,028 139,126 1,478 3,338 9,056 14,660 369 Percent of contribution 100 83 1 2 5 9 <1
Phosphorus Total (1,000 pounds) 6,112 4,806 21 83 244 940 19 Percent of contribution 100 79 <1 1 4 15 <1
* Includes land in long-term conserving cover, excludes horticulture. ** Includes construction sources and urban land runoff. *** Includes forests (all types), wetlands, shrublands, horticulture, and barren land.
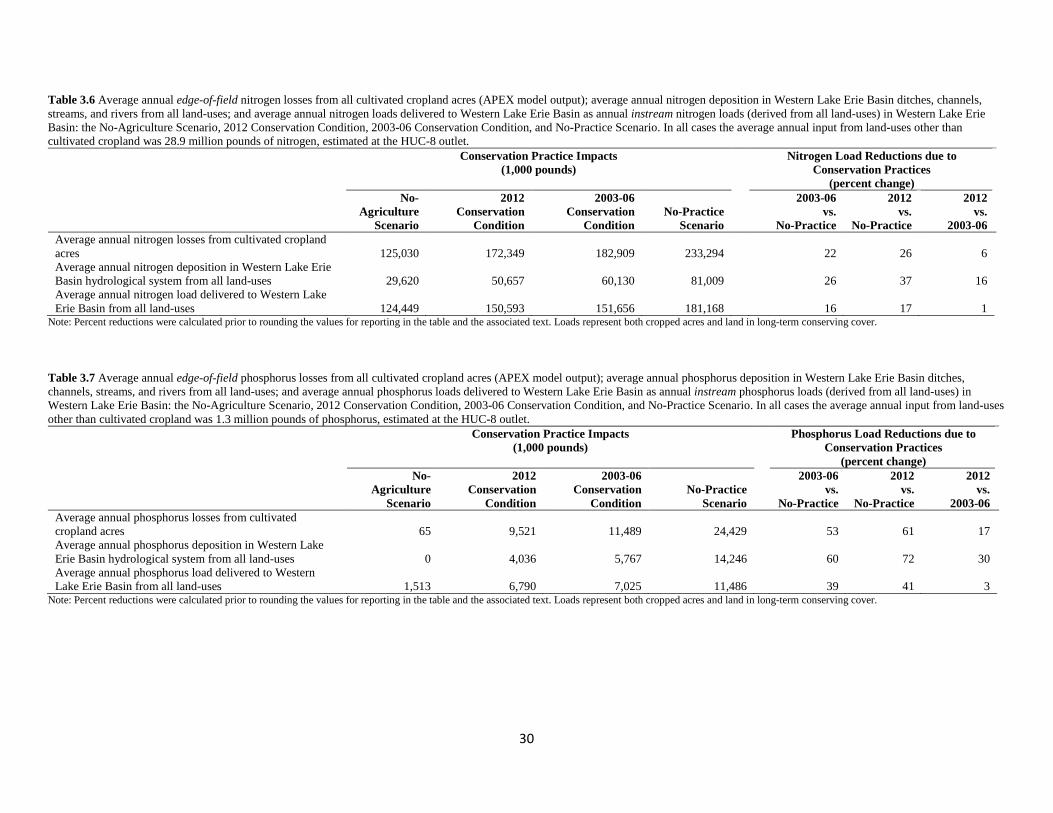
30
Table 3.6 Average annual edge-of-field nitrogen losses from all cultivated cropland acres (APEX model output); average annual nitrogen deposition in Western Lake Erie Basin ditches, channels, streams, and rivers from all land-uses; and average annual nitrogen loads delivered to Western Lake Erie Basin as annual instream nitrogen loads (derived from all land-uses) in Western Lake Erie Basin: the No-Agriculture Scenario, 2012 Conservation Condition, 2003-06 Conservation Condition, and No-Practice Scenario. In all cases the average annual input from land-uses other than cultivated cropland was 28.9 million pounds of nitrogen, estimated at the HUC-8 outlet.
Conservation Practice Impacts (1,000 pounds)
Nitrogen Load Reductions due to Conservation Practices
(percent change)
No-Agriculture
Scenario
2012 Conservation
Condition
2003-06 Conservation
Condition No-Practice
Scenario
2003-06 vs.
No-Practice
2012 vs.
No-Practice
2012 vs.
2003-06 Average annual nitrogen losses from cultivated cropland acres 125,030 172,349 182,909 233,294 22 26 6 Average annual nitrogen deposition in Western Lake Erie Basin hydrological system from all land-uses 29,620 50,657 60,130 81,009 26 37 16 Average annual nitrogen load delivered to Western Lake Erie Basin from all land-uses 124,449 150,593 151,656 181,168 16 17 1
Note: Percent reductions were calculated prior to rounding the values for reporting in the table and the associated text. Loads represent both cropped acres and land in long-term conserving cover. Table 3.7 Average annual edge-of-field phosphorus losses from all cultivated cropland acres (APEX model output); average annual phosphorus deposition in Western Lake Erie Basin ditches, channels, streams, and rivers from all land-uses; and average annual phosphorus loads delivered to Western Lake Erie Basin as annual instream phosphorus loads (derived from all land-uses) in Western Lake Erie Basin: the No-Agriculture Scenario, 2012 Conservation Condition, 2003-06 Conservation Condition, and No-Practice Scenario. In all cases the average annual input from land-uses other than cultivated cropland was 1.3 million pounds of phosphorus, estimated at the HUC-8 outlet.
Conservation Practice Impacts (1,000 pounds)
Phosphorus Load Reductions due to Conservation Practices
(percent change)
No-Agriculture
Scenario
2012 Conservation
Condition
2003-06 Conservation
Condition No-Practice
Scenario
2003-06 vs.
No-Practice
2012 vs.
No-Practice
2012 vs.
2003-06 Average annual phosphorus losses from cultivated cropland acres 65 9,521 11,489 24,429 53 61 17 Average annual phosphorus deposition in Western Lake Erie Basin hydrological system from all land-uses 0 4,036 5,767 14,246 60 72 30 Average annual phosphorus load delivered to Western Lake Erie Basin from all land-uses 1,513 6,790 7,025 11,486 39 41 3
Note: Percent reductions were calculated prior to rounding the values for reporting in the table and the associated text. Loads represent both cropped acres and land in long-term conserving cover.
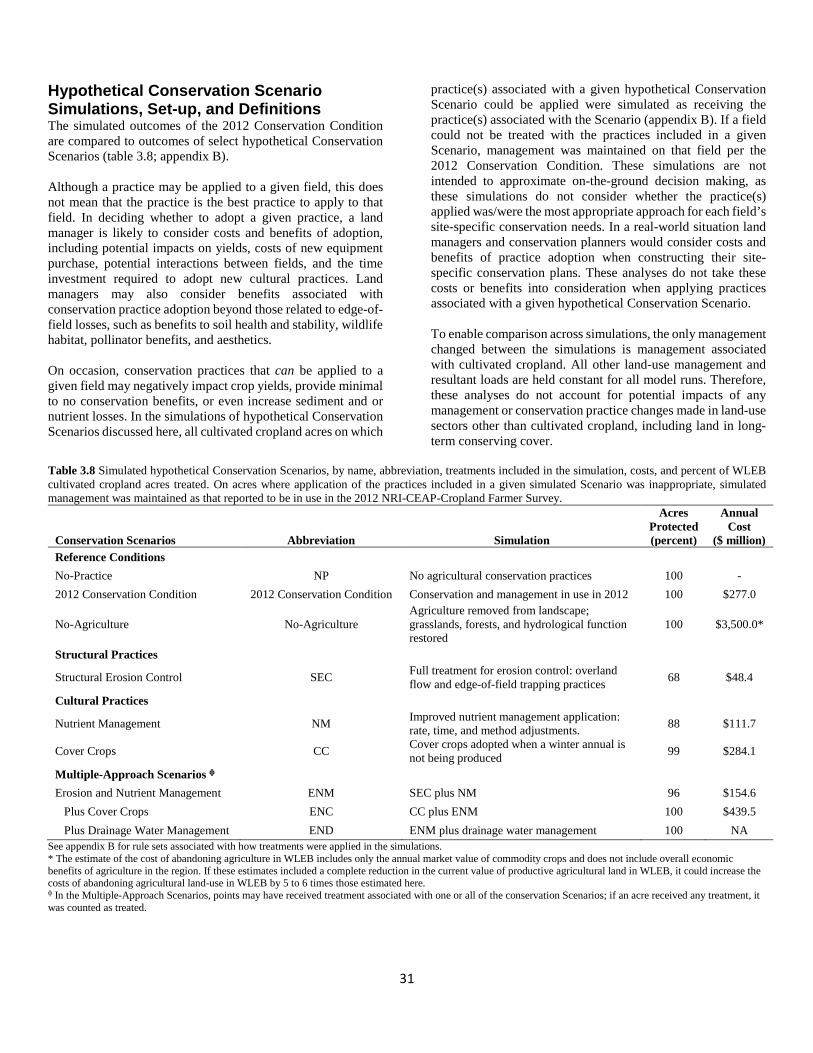
31
Hypothetical Conservation Scenario Simulations, Set-up, and Definitions The simulated outcomes of the 2012 Conservation Condition are compared to outcomes of select hypothetical Conservation Scenarios (table 3.8; appendix B). Although a practice may be applied to a given field, this does not mean that the practice is the best practice to apply to that field. In deciding whether to adopt a given practice, a land manager is likely to consider costs and benefits of adoption, including potential impacts on yields, costs of new equipment purchase, potential interactions between fields, and the time investment required to adopt new cultural practices. Land managers may also consider benefits associated with conservation practice adoption beyond those related to edge-of-field losses, such as benefits to soil health and stability, wildlife habitat, pollinator benefits, and aesthetics. On occasion, conservation practices that can be applied to a given field may negatively impact crop yields, provide minimal to no conservation benefits, or even increase sediment and or nutrient losses. In the simulations of hypothetical Conservation Scenarios discussed here, all cultivated cropland acres on which
practice(s) associated with a given hypothetical Conservation Scenario could be applied were simulated as receiving the practice(s) associated with the Scenario (appendix B). If a field could not be treated with the practices included in a given Scenario, management was maintained on that field per the 2012 Conservation Condition. These simulations are not intended to approximate on-the-ground decision making, as these simulations do not consider whether the practice(s) applied was/were the most appropriate approach for each field’s site-specific conservation needs. In a real-world situation land managers and conservation planners would consider costs and benefits of practice adoption when constructing their site-specific conservation plans. These analyses do not take these costs or benefits into consideration when applying practices associated with a given hypothetical Conservation Scenario. To enable comparison across simulations, the only management changed between the simulations is management associated with cultivated cropland. All other land-use management and resultant loads are held constant for all model runs. Therefore, these analyses do not account for potential impacts of any management or conservation practice changes made in land-use sectors other than cultivated cropland, including land in long-term conserving cover.
Table 3.8 Simulated hypothetical Conservation Scenarios, by name, abbreviation, treatments included in the simulation, costs, and percent of WLEB cultivated cropland acres treated. On acres where application of the practices included in a given simulated Scenario was inappropriate, simulated management was maintained as that reported to be in use in the 2012 NRI-CEAP-Cropland Farmer Survey.
Conservation Scenarios Abbreviation Simulation
Acres Protected (percent)
Annual Cost
($ million) Reference Conditions
No-Practice NP No agricultural conservation practices 100 - 2012 Conservation Condition 2012 Conservation Condition Conservation and management in use in 2012 100 $277.0
No-Agriculture No-Agriculture Agriculture removed from landscape; grasslands, forests, and hydrological function restored
100 $3,500.0*
Structural Practices
Structural Erosion Control SEC Full treatment for erosion control: overland flow and edge-of-field trapping practices 68 $48.4
Cultural Practices
Nutrient Management NM Improved nutrient management application: rate, time, and method adjustments. 88 $111.7
Cover Crops CC Cover crops adopted when a winter annual is not being produced 99 $284.1
Multiple-Approach Scenarios ф Erosion and Nutrient Management ENM SEC plus NM 96 $154.6 Plus Cover Crops ENC CC plus ENM 100 $439.5 Plus Drainage Water Management END ENM plus drainage water management 100 NA
See appendix B for rule sets associated with how treatments were applied in the simulations. * The estimate of the cost of abandoning agriculture in WLEB includes only the annual market value of commodity crops and does not include overall economic benefits of agriculture in the region. If these estimates included a complete reduction in the current value of productive agricultural land in WLEB, it could increase the costs of abandoning agricultural land-use in WLEB by 5 to 6 times those estimated here. ф In the Multiple-Approach Scenarios, points may have received treatment associated with one or all of the conservation Scenarios; if an acre received any treatment, it was counted as treated.
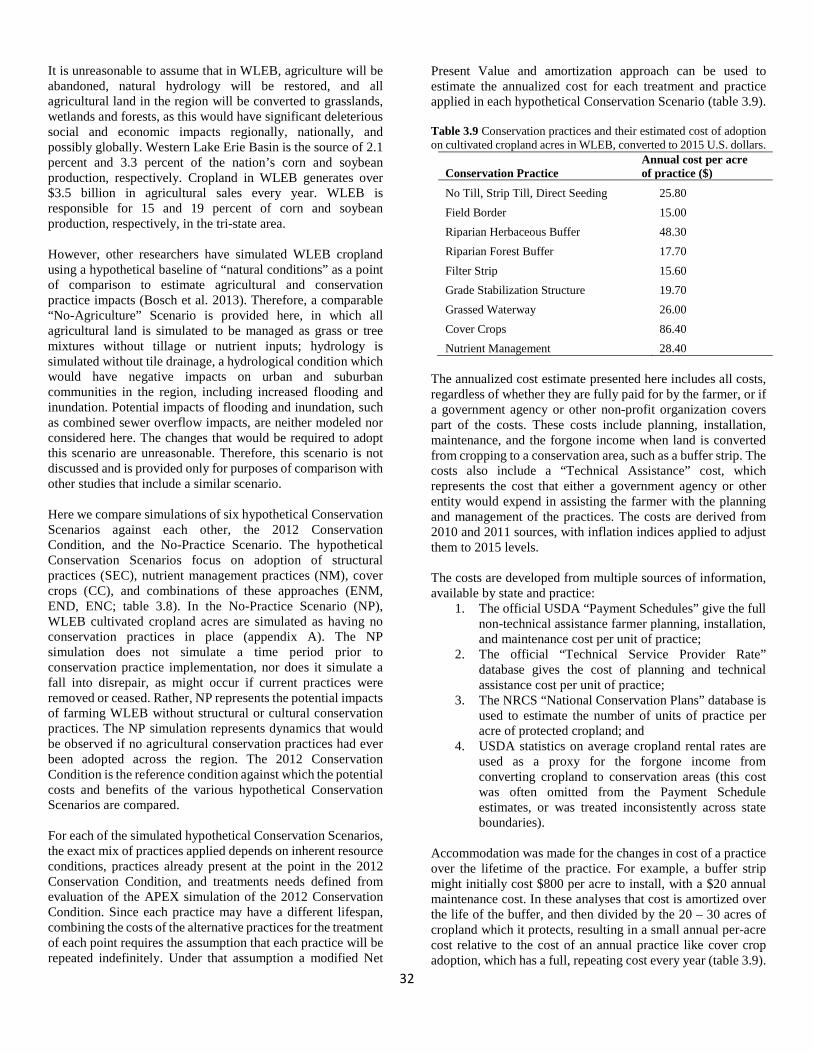
32
It is unreasonable to assume that in WLEB, agriculture will be abandoned, natural hydrology will be restored, and all agricultural land in the region will be converted to grasslands, wetlands and forests, as this would have significant deleterious social and economic impacts regionally, nationally, and possibly globally. Western Lake Erie Basin is the source of 2.1 percent and 3.3 percent of the nation’s corn and soybean production, respectively. Cropland in WLEB generates over $3.5 billion in agricultural sales every year. WLEB is responsible for 15 and 19 percent of corn and soybean production, respectively, in the tri-state area. However, other researchers have simulated WLEB cropland using a hypothetical baseline of “natural conditions” as a point of comparison to estimate agricultural and conservation practice impacts (Bosch et al. 2013). Therefore, a comparable “No-Agriculture” Scenario is provided here, in which all agricultural land is simulated to be managed as grass or tree mixtures without tillage or nutrient inputs; hydrology is simulated without tile drainage, a hydrological condition which would have negative impacts on urban and suburban communities in the region, including increased flooding and inundation. Potential impacts of flooding and inundation, such as combined sewer overflow impacts, are neither modeled nor considered here. The changes that would be required to adopt this scenario are unreasonable. Therefore, this scenario is not discussed and is provided only for purposes of comparison with other studies that include a similar scenario. Here we compare simulations of six hypothetical Conservation Scenarios against each other, the 2012 Conservation Condition, and the No-Practice Scenario. The hypothetical Conservation Scenarios focus on adoption of structural practices (SEC), nutrient management practices (NM), cover crops (CC), and combinations of these approaches (ENM, END, ENC; table 3.8). In the No-Practice Scenario (NP), WLEB cultivated cropland acres are simulated as having no conservation practices in place (appendix A). The NP simulation does not simulate a time period prior to conservation practice implementation, nor does it simulate a fall into disrepair, as might occur if current practices were removed or ceased. Rather, NP represents the potential impacts of farming WLEB without structural or cultural conservation practices. The NP simulation represents dynamics that would be observed if no agricultural conservation practices had ever been adopted across the region. The 2012 Conservation Condition is the reference condition against which the potential costs and benefits of the various hypothetical Conservation Scenarios are compared. For each of the simulated hypothetical Conservation Scenarios, the exact mix of practices applied depends on inherent resource conditions, practices already present at the point in the 2012 Conservation Condition, and treatments needs defined from evaluation of the APEX simulation of the 2012 Conservation Condition. Since each practice may have a different lifespan, combining the costs of the alternative practices for the treatment of each point requires the assumption that each practice will be repeated indefinitely. Under that assumption a modified Net
Present Value and amortization approach can be used to estimate the annualized cost for each treatment and practice applied in each hypothetical Conservation Scenario (table 3.9). Table 3.9 Conservation practices and their estimated cost of adoption on cultivated cropland acres in WLEB, converted to 2015 U.S. dollars.
Conservation Practice Annual cost per acre of practice ($)
No Till, Strip Till, Direct Seeding 25.80 Field Border 15.00 Riparian Herbaceous Buffer 48.30 Riparian Forest Buffer 17.70 Filter Strip 15.60 Grade Stabilization Structure 19.70 Grassed Waterway 26.00 Cover Crops 86.40 Nutrient Management 28.40
The annualized cost estimate presented here includes all costs, regardless of whether they are fully paid for by the farmer, or if a government agency or other non-profit organization covers part of the costs. These costs include planning, installation, maintenance, and the forgone income when land is converted from cropping to a conservation area, such as a buffer strip. The costs also include a “Technical Assistance” cost, which represents the cost that either a government agency or other entity would expend in assisting the farmer with the planning and management of the practices. The costs are derived from 2010 and 2011 sources, with inflation indices applied to adjust them to 2015 levels. The costs are developed from multiple sources of information, available by state and practice:
1. The official USDA “Payment Schedules” give the full non-technical assistance farmer planning, installation, and maintenance cost per unit of practice;
2. The official “Technical Service Provider Rate” database gives the cost of planning and technical assistance cost per unit of practice;
3. The NRCS “National Conservation Plans” database is used to estimate the number of units of practice per acre of protected cropland; and
4. USDA statistics on average cropland rental rates are used as a proxy for the forgone income from converting cropland to conservation areas (this cost was often omitted from the Payment Schedule estimates, or was treated inconsistently across state boundaries).
Accommodation was made for the changes in cost of a practice over the lifetime of the practice. For example, a buffer strip might initially cost $800 per acre to install, with a $20 annual maintenance cost. In these analyses that cost is amortized over the life of the buffer, and then divided by the 20 – 30 acres of cropland which it protects, resulting in a small annual per-acre cost relative to the cost of an annual practice like cover crop adoption, which has a full, repeating cost every year (table 3.9).
33
Costs vary across state lines; average per-acre costs per practice used here are weighted by the amount of cultivated cropland acres in each of the WLEB states and their associated costs. Three Single-approach Conservation Scenarios are explored (table 3.8). Each approach may involve adoption of a variety of practices intended to achieve a specified conservation goal (table 3.10). One hypothetical Conservation Scenario
simulating widespread adoption of structural erosion control (SEC) was simulated. Two cultural conservation practice Scenarios were also simulated: cover crop adoption (CC) and enhanced nutrient management (NM), which improves the method, rate, and timing of every nutrient application. Rules used to apply practices in these hypothetical Conservation Scenario simulations are outlined in Appendix B.
Table 3.10 Conservation practices that may be included in the simulation of each hypothetical Conservation Scenario. If a practice was already present in the 2012 Conservation Condition, it was maintained, regardless of whether it was prescribed by the Conservation Scenario being simulated.
Hypothetical Conservation Scenario Conservation Practice SEC NM CC ENM ENC END Contour Farming X X X X Windbreak or Shelterbelt X X X X Herbaceous Riparian Buffer X X X X Forest Riparian Buffer X X X X Filter Strip X X X X Contour Strip Cropping X X X X Herbaceous Wind Barrier X X X X Terraces X X X X Cover Crops X X Drainage Water Management X Nutrient Management Planning X X X X
Single-approach Conservation Scenarios do not address the full array of conservation concerns and loss pathways as effectively as do strategies that apply suites of complementary conservation practices that combine various approaches to conservation. However, there is interest in understanding the impacts of Single-approach Conservation Scenarios for multiple reasons. Simulating Single-approach Conservation Scenarios demonstrates the potential that widespread promotion and use of a given approach or practice could achieve. Also, simulating Single-approach Conservation Scenarios provides benchmarks against which to compare and contrast approaches that use suites of conservation practices. Finally, simulating hypothetical Single-approach Conservation Scenarios in comparison with hypothetical Multiple-approach Conservation Scenarios demonstrates the need for a holistic and site-specific approach to conservation practice implementation. Conservation practices are each designed to achieve a specific conservation goal. Not all practices meet all goals and not all practices are applicable on every field. In real-world conservation planning, appropriate and complementary practices would be applied to each field, sometimes providing benefits that each practice individually would not provide. This exemplifies part of the concept behind site-specific comprehensive conservation planning, in which suites of practices are used to address the diverse needs of agricultural fields to improve conservation benefits on all acres. A comprehensive conservation plan includes suites of conservation practices intended to reduce nutrient and sediment losses via the ACT (Avoid, Control, Trap) conservation approach. Nutrient management practices, which help avoid nutrient losses, are applied in conjunction with structural management practices that control and trap nutrients and sediment before they leave the field. In comprehensive conser-
vation planning, practices like tillage management, cover crops, and drainage water management augment the structural and nutrient management practices. Use of variable rate technologies is also increasingly a part of comprehensive conservation planning and actuation. Several hypothetical Conservation Scenarios simulated here explore impacts of the adoption of suites of practices. SEC and NM are combined in the simulation of a Scenario representing adoption of structural erosion controls and nutrient management (ENM). The inclusion of cover crops as part of a suite of conservation practices is explored in ENC, which applies ENM and CC to all appropriate cultivated cropland acreage. Finally, drainage water management is a significant practice in WLEB; here drainage water management is combined with ENM as END. In the simulations of the hypothetical Conservation Scenarios that include nutrient management (NM, ENM, ENC, and END), treatment rules (appendix B) may make minor changes to method, rate, or timing of nutrient applications to one or more crops on acres already managed with a high conservation treatment level in the 2012 Conservation Condition. The simulated hypothetical Multi-approach Conservation Scenarios provide coarse approximations of the potential benefits of comprehensive conservation plans, though they likely underestimate the benefits that could be gained by implementing a truly comprehensive conservation plan, with conservation practices specifically designed for the heterogeneity of a given farmer’s soils, landscape context, and production goals. These simulations are aggregated at the 4-digit HUC scale to evaluate tradeoffs, while comprehensive conservation planning must be conducted at the field-scale. Additionally, the process-based models used in these analyses
34
have not been calibrated and validated to simulate every single potential conservation practice that a farmer and land planner could choose to apply. Ergo, the Multiple-approach Conservation Scenarios presented here are necessarily somewhat generic in their prescription of practices and likely underrepresent the benefits that could be achieved across WLEB if each and every cropland acre were treated with suites of conservation practices prescribed by individualized, site-specific plans tailored to the particular needs of the local soils, current and past production systems, farmer goals, and ecological sensitivities. Still, regional analyses of the potential impacts of implementing Multiple-approach Scenarios provide context for estimating current and potential agroecological impacts of improved conservation practice strategies. In these simulations, the 2012 Conservation Condition is used as both the baseline reference condition and the scaffold on which to apply the hypothetical Conservation Scenarios. In each simulated Scenario, the conservation practices in place in the 2012 Conservation Condition are supplemented by practices implemented in the Conservation Scenario. It is predictable, therefore, that the simulated hypothetical Conservation Scenarios provide enhanced conservation benefits relative to the 2012 Conservation Condition, since the Scenarios augment practices in use in the 2012 condition. Because certain practices are inappropriate on some acres and because the Scenarios were run on the 2012 Conservation Condition, which includes acres that have already adopted some of the simulated practices, the number of acres simulated as receiving treatment under each hypothetical Conservation Scenario varies (table 3.8). Each conservation practice was simulated to be 100 percent efficient on the acres treated. Annual practices were simulated as being repeated and structural practices were assumed to be maintained, such that 100 percent efficiencies were maintained over the 52-year simulation. Similarly, practices in use in the 2012 Conservation Condition that did not conflict with practices imposed by the applied Conservation Scenario were also simulated as continuing to function at 100 percent efficiency throughout the duration of the simulation. All practices were simulated as being placed efficiently on the field for maximum effectiveness, but variability in the soils across a field was not simulated. Hypothetical conservation scenarios altering tillage management or cropping systems are not explored in these simulations. However, both tillage management and cropping system management may be valuable tools to consider in conjunction with other conservation practices in order to develop site-specific plans and achieve specific conservation goals. As with any conservation practice, the best practice for one acre may not be the best for an adjacent acre. Similarly, one practice seldom achieves all conservation goals.
Hypothetical Conservation Scenario Simulation Results (Tables 3.8, 3.11, 3.12, and 3.13 summarize the following results.) Single-approach Conservation Scenarios: Structural Structural Erosion Control (SEC): The SEC Scenario applies erosion control practices to cultivated cropland to prevent overland flow and provide edge-of-field trapping benefits (table 3.10, appendix B). Relative to the 2012 Conservation Condition, Application of the SEC Scenario:
• Adds additional practices to 68 percent of WLEB cropland acres.
• Increases annual costs by 17 percent (additional $48.4 million per year).
• Impacts edge-of-field losses to reduce: o annual sediment losses by 83 percent (2.9
million tons); o annual nitrogen losses by 9 percent (15.7
million pounds); and o annual phosphorus losses by 23 percent
(2.2 million pounds). • Impacts Lake Erie loading to reduce:
o annual sediment loading by 22 percent (282 thousand tons);
o annual nitrogen loading by 2 percent (2.7 million pounds); and
o annual phosphorus loading by 3 percent (237 thousand pounds).
• Impacts deposition in ditches, channels, streams, and rivers in the WLEB hydrological system prior to delivery to Lake Erie to reduce:
o annual sediment deposition by 100 percent (2.4 million tons); annual resuspension by 183 thousand tons of sediment;
o annual nitrogen deposition by 26 percent (13.0 million pounds); and
o annual phosphorus deposition by 49 percent (2.0 million pounds).
SEC’s primary benefit is sediment loss reduction, though SEC also demonstrates marked benefits towards reducing sediment and phosphorus deposition in WLEB’s hydrological system prior to delivery to Lake Erie (table 3.11). Relative to the 2012 Conservation Condition, SEC also provides benefits in terms of reductions in total nitrogen and total phosphorus losses, total nitrogen and total phosphorus load deliveries, and nitrogen deposition (tables 3.12 and 3.13; fig. 3.6). The cost of the SEC Scenario is estimated at $48.4 million per year, in addition to costs associated with adoption of practices in the 2012 Conservation Condition ($277.0 million per year).
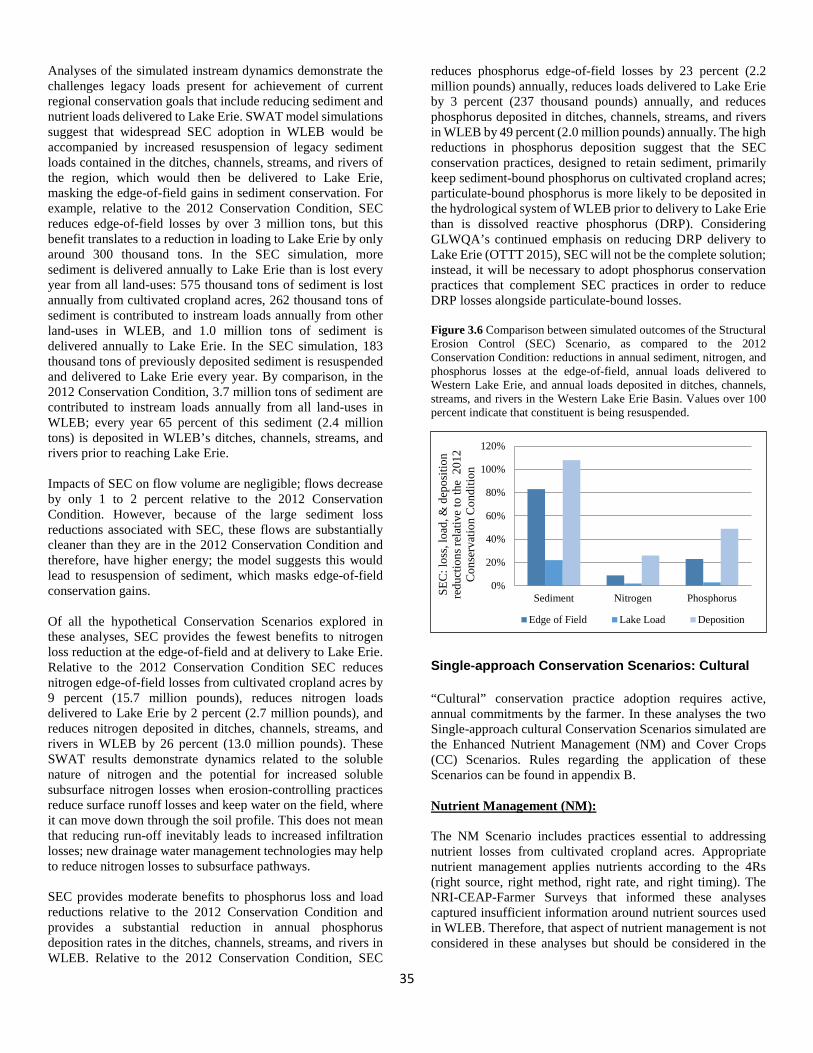
35
Analyses of the simulated instream dynamics demonstrate the challenges legacy loads present for achievement of current regional conservation goals that include reducing sediment and nutrient loads delivered to Lake Erie. SWAT model simulations suggest that widespread SEC adoption in WLEB would be accompanied by increased resuspension of legacy sediment loads contained in the ditches, channels, streams, and rivers of the region, which would then be delivered to Lake Erie, masking the edge-of-field gains in sediment conservation. For example, relative to the 2012 Conservation Condition, SEC reduces edge-of-field losses by over 3 million tons, but this benefit translates to a reduction in loading to Lake Erie by only around 300 thousand tons. In the SEC simulation, more sediment is delivered annually to Lake Erie than is lost every year from all land-uses: 575 thousand tons of sediment is lost annually from cultivated cropland acres, 262 thousand tons of sediment is contributed to instream loads annually from other land-uses in WLEB, and 1.0 million tons of sediment is delivered annually to Lake Erie. In the SEC simulation, 183 thousand tons of previously deposited sediment is resuspended and delivered to Lake Erie every year. By comparison, in the 2012 Conservation Condition, 3.7 million tons of sediment are contributed to instream loads annually from all land-uses in WLEB; every year 65 percent of this sediment (2.4 million tons) is deposited in WLEB’s ditches, channels, streams, and rivers prior to reaching Lake Erie. Impacts of SEC on flow volume are negligible; flows decrease by only 1 to 2 percent relative to the 2012 Conservation Condition. However, because of the large sediment loss reductions associated with SEC, these flows are substantially cleaner than they are in the 2012 Conservation Condition and therefore, have higher energy; the model suggests this would lead to resuspension of sediment, which masks edge-of-field conservation gains. Of all the hypothetical Conservation Scenarios explored in these analyses, SEC provides the fewest benefits to nitrogen loss reduction at the edge-of-field and at delivery to Lake Erie. Relative to the 2012 Conservation Condition SEC reduces nitrogen edge-of-field losses from cultivated cropland acres by 9 percent (15.7 million pounds), reduces nitrogen loads delivered to Lake Erie by 2 percent (2.7 million pounds), and reduces nitrogen deposited in ditches, channels, streams, and rivers in WLEB by 26 percent (13.0 million pounds). These SWAT results demonstrate dynamics related to the soluble nature of nitrogen and the potential for increased soluble subsurface nitrogen losses when erosion-controlling practices reduce surface runoff losses and keep water on the field, where it can move down through the soil profile. This does not mean that reducing run-off inevitably leads to increased infiltration losses; new drainage water management technologies may help to reduce nitrogen losses to subsurface pathways. SEC provides moderate benefits to phosphorus loss and load reductions relative to the 2012 Conservation Condition and provides a substantial reduction in annual phosphorus deposition rates in the ditches, channels, streams, and rivers in WLEB. Relative to the 2012 Conservation Condition, SEC
reduces phosphorus edge-of-field losses by 23 percent (2.2 million pounds) annually, reduces loads delivered to Lake Erie by 3 percent (237 thousand pounds) annually, and reduces phosphorus deposited in ditches, channels, streams, and rivers in WLEB by 49 percent (2.0 million pounds) annually. The high reductions in phosphorus deposition suggest that the SEC conservation practices, designed to retain sediment, primarily keep sediment-bound phosphorus on cultivated cropland acres; particulate-bound phosphorus is more likely to be deposited in the hydrological system of WLEB prior to delivery to Lake Erie than is dissolved reactive phosphorus (DRP). Considering GLWQA’s continued emphasis on reducing DRP delivery to Lake Erie (OTTT 2015), SEC will not be the complete solution; instead, it will be necessary to adopt phosphorus conservation practices that complement SEC practices in order to reduce DRP losses alongside particulate-bound losses. Figure 3.6 Comparison between simulated outcomes of the Structural Erosion Control (SEC) Scenario, as compared to the 2012 Conservation Condition: reductions in annual sediment, nitrogen, and phosphorus losses at the edge-of-field, annual loads delivered to Western Lake Erie, and annual loads deposited in ditches, channels, streams, and rivers in the Western Lake Erie Basin. Values over 100 percent indicate that constituent is being resuspended.
Single-approach Conservation Scenarios: Cultural “Cultural” conservation practice adoption requires active, annual commitments by the farmer. In these analyses the two Single-approach cultural Conservation Scenarios simulated are the Enhanced Nutrient Management (NM) and Cover Crops (CC) Scenarios. Rules regarding the application of these Scenarios can be found in appendix B. Nutrient Management (NM): The NM Scenario includes practices essential to addressing nutrient losses from cultivated cropland acres. Appropriate nutrient management applies nutrients according to the 4Rs (right source, right method, right rate, and right timing). The NRI-CEAP-Farmer Surveys that informed these analyses captured insufficient information around nutrient sources used in WLEB. Therefore, that aspect of nutrient management is not considered in these analyses but should be considered in the
0%
20%
40%
60%
80%
100%
120%
Sediment Nitrogen PhosphorusSEC
: los
s, lo
ad, &
dep
ositi
on
redu
ctio
ns re
lativ
e to
the
201
2 C
onse
rvat
ion
Con
ditio
n
Edge of Field Lake Load Deposition
36
development and application of any comprehensive conser-vation plan. In the NM Scenario simulated here, nitrogen and phosphorus methods, rates, and timing of application are all optimized according to the needs of the crop rotations being maintained at each sample point (appendix B). Like all conservation practices, nutrient management practices require comple-mentary conservation practices to address concerns that the nutrient management practices do not address. Conservation practices that could complement nutrient management practices include structural practices, such as controlling and trapping practices that could help a farmer fully implement the ACT (Avoid, Control, Trap) Conservation Systems Approach. The majority of cropland acres in WLEB have some form of nutrient management applied to them, though most would also benefit from adjustments in their management of the 4Rs. Most points treated in NM received adjustments to only one or two of the 4Rs, often only in one crop in the rotation. The degree to which NM adjusts the 4Rs varies greatly from point to point, with a minority of points receiving complete alterations of all aspects of nutrient management throughout the rotation. Relative to the 2012 Conservation Condition, Application of the NM Scenario:
• Adds additional practices to 88 percent of WLEB cropland acres.
• Increases annual costs by 40 percent (an additional $111.7 million per year).
• Impacts edge-of-field losses to reduce: o annual sediment losses by 3 percent (112
thousand tons); o annual nitrogen losses by 22 percent (38.6
million pounds); and o annual phosphorus losses by 14 percent
(1.3 million pounds). • Impacts Lake Erie loading to:
o not substantially change annual sediment loading (<1 percent, 3 thousand tons);
o reduce annual nitrogen loading by 19 percent (29.3 million pounds); and
o reduce annual phosphorus loading by 8 percent (527 thousand pounds).
• Impacts deposition in ditches, channels, streams, and rivers in the WLEB hydrological system prior to delivery to Lake Erie to reduce:
o annual sediment deposition by 5 percent (110 thousand tons);
o annual nitrogen deposition by 18 percent (9.3 million pounds); and
o annual phosphorus deposition by 20 percent (820 thousand pounds).
NM includes a suite of conservation practices designed to reduce nutrient losses through avoidance measures; applying the principles of the 4Rs (nutrients from the right source, with
the right application method, right rate, and right timing) helps to avoid losses to weather-related events by supplying the growing crops with nutrients when they need them and minimizing the chances of a large loss event. NM slightly increases flows in the WLEB, by about 1 percent at both the edge-of-field and delivery to Lake Erie. The cost of the NM Scenario is estimated at $111.7 million per year, in addition to costs associated with adoption of practices in the 2012 Conservation Condition ($277.0 million per year). The practices applied in NM are designed to achieve nutrient loss reduction. Therefore, it is not surprising that relative to the 2012 Conservation Condition, NM has little impact on sediment loss dynamics. In NM, only 3 percent less sediment is lost from the edge-of-field each year than is lost in the 2012 Conservation Condition. In NM, 3.3 million tons of sediment is lost annually from cultivated cropland acres, 262 thousand tons of sediment is contributed to instream loads annually from other land-uses in WLEB, and 1.3 million tons of sediment is delivered annually to Lake Erie. NM’s low impacts on sediment loss dynamics suggest that a unilateral NM approach is inappropriate for reducing sediment deposition rates, as in NM 2.3 million tons of sediment are deposited in the ditches, channels, streams, and rivers of WLEB every year, only slightly less than what is deposited in the 2012 Conservation Condition (2.4 million tons, annually). The nutrient management practices simulated in NM were never intended to provide benefits to sediment loss reduction; the impetus behind their development, design, and adoption is nutrient loss reduction. The NM Scenario provides clear benefits to reducing nitrogen and phosphorus losses, loads, and deposition rates (tables 3.11, 3.12, and 3.13; fig. 3.7). Relative to the simulated dynamics of the 2012 Conservation Conditions, NM reduces nitrogen edge-of-field losses from cultivated cropland acres by 22 percent (38.6 million pounds) annually, reduces nitrogen loads delivered to Lake Erie by 19 percent (29.3 million pounds) annually, and reduces nitrogen deposited in ditches, channels, streams, and rivers in WLEB by 18 percent (9.3 million pounds) annually. NM also provides benefits to phosphorus loss, load, and deposition rate reductions relative to the 2012 Conservation Condition. Relative to the 2012 Conservation Condition NM reduces phosphorus edge-of-field losses by 14 percent (1.3 million pounds) annually, reduces loads delivered to Lake Erie by 8 percent (527 thousand pounds) annually, and reduces phosphorus deposited in ditches, channels, streams, and rivers in WLEB by 20 percent (820 thousand pounds) annually. Comparing NM and SEC results demonstrates that SEC and NM practices were designed for very different, but complementary conservation purposes. SEC practices provide significant benefits to reducing loss, deposition and loading of sediment and therefore, sediment-bound nutrients. NM, on the other hand provides very little sediment loss reduction relative to the 2012 Conservation Condition, only 3 percent, compared to SEC’s 83 percent reduction in edge-of-field sediment losses. These results suggest the respective 19 and 8 percent reductions in nitrogen and phosphorus loads provided by NM, relative to
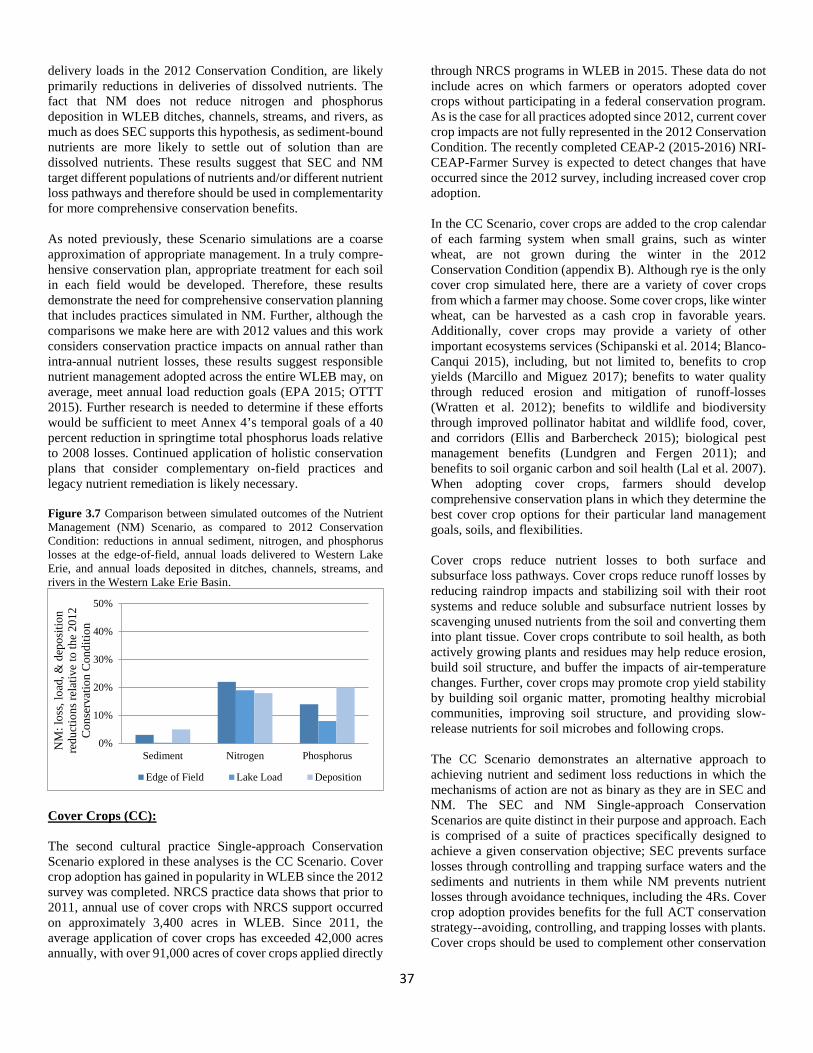
37
delivery loads in the 2012 Conservation Condition, are likely primarily reductions in deliveries of dissolved nutrients. The fact that NM does not reduce nitrogen and phosphorus deposition in WLEB ditches, channels, streams, and rivers, as much as does SEC supports this hypothesis, as sediment-bound nutrients are more likely to settle out of solution than are dissolved nutrients. These results suggest that SEC and NM target different populations of nutrients and/or different nutrient loss pathways and therefore should be used in complementarity for more comprehensive conservation benefits. As noted previously, these Scenario simulations are a coarse approximation of appropriate management. In a truly compre-hensive conservation plan, appropriate treatment for each soil in each field would be developed. Therefore, these results demonstrate the need for comprehensive conservation planning that includes practices simulated in NM. Further, although the comparisons we make here are with 2012 values and this work considers conservation practice impacts on annual rather than intra-annual nutrient losses, these results suggest responsible nutrient management adopted across the entire WLEB may, on average, meet annual load reduction goals (EPA 2015; OTTT 2015). Further research is needed to determine if these efforts would be sufficient to meet Annex 4’s temporal goals of a 40 percent reduction in springtime total phosphorus loads relative to 2008 losses. Continued application of holistic conservation plans that consider complementary on-field practices and legacy nutrient remediation is likely necessary. Figure 3.7 Comparison between simulated outcomes of the Nutrient Management (NM) Scenario, as compared to 2012 Conservation Condition: reductions in annual sediment, nitrogen, and phosphorus losses at the edge-of-field, annual loads delivered to Western Lake Erie, and annual loads deposited in ditches, channels, streams, and rivers in the Western Lake Erie Basin.
Cover Crops (CC): The second cultural practice Single-approach Conservation Scenario explored in these analyses is the CC Scenario. Cover crop adoption has gained in popularity in WLEB since the 2012 survey was completed. NRCS practice data shows that prior to 2011, annual use of cover crops with NRCS support occurred on approximately 3,400 acres in WLEB. Since 2011, the average application of cover crops has exceeded 42,000 acres annually, with over 91,000 acres of cover crops applied directly
through NRCS programs in WLEB in 2015. These data do not include acres on which farmers or operators adopted cover crops without participating in a federal conservation program. As is the case for all practices adopted since 2012, current cover crop impacts are not fully represented in the 2012 Conservation Condition. The recently completed CEAP-2 (2015-2016) NRI-CEAP-Farmer Survey is expected to detect changes that have occurred since the 2012 survey, including increased cover crop adoption. In the CC Scenario, cover crops are added to the crop calendar of each farming system when small grains, such as winter wheat, are not grown during the winter in the 2012 Conservation Condition (appendix B). Although rye is the only cover crop simulated here, there are a variety of cover crops from which a farmer may choose. Some cover crops, like winter wheat, can be harvested as a cash crop in favorable years. Additionally, cover crops may provide a variety of other important ecosystems services (Schipanski et al. 2014; Blanco-Canqui 2015), including, but not limited to, benefits to crop yields (Marcillo and Miguez 2017); benefits to water quality through reduced erosion and mitigation of runoff-losses (Wratten et al. 2012); benefits to wildlife and biodiversity through improved pollinator habitat and wildlife food, cover, and corridors (Ellis and Barbercheck 2015); biological pest management benefits (Lundgren and Fergen 2011); and benefits to soil organic carbon and soil health (Lal et al. 2007). When adopting cover crops, farmers should develop comprehensive conservation plans in which they determine the best cover crop options for their particular land management goals, soils, and flexibilities. Cover crops reduce nutrient losses to both surface and subsurface loss pathways. Cover crops reduce runoff losses by reducing raindrop impacts and stabilizing soil with their root systems and reduce soluble and subsurface nutrient losses by scavenging unused nutrients from the soil and converting them into plant tissue. Cover crops contribute to soil health, as both actively growing plants and residues may help reduce erosion, build soil structure, and buffer the impacts of air-temperature changes. Further, cover crops may promote crop yield stability by building soil organic matter, promoting healthy microbial communities, improving soil structure, and providing slow-release nutrients for soil microbes and following crops. The CC Scenario demonstrates an alternative approach to achieving nutrient and sediment loss reductions in which the mechanisms of action are not as binary as they are in SEC and NM. The SEC and NM Single-approach Conservation Scenarios are quite distinct in their purpose and approach. Each is comprised of a suite of practices specifically designed to achieve a given conservation objective; SEC prevents surface losses through controlling and trapping surface waters and the sediments and nutrients in them while NM prevents nutrient losses through avoidance techniques, including the 4Rs. Cover crop adoption provides benefits for the full ACT conservation strategy--avoiding, controlling, and trapping losses with plants. Cover crops should be used to complement other conservation
0%
10%
20%
30%
40%
50%
Sediment Nitrogen Phosphorus
NM
: los
s, lo
ad, &
dep
ositi
on
redu
ctio
ns re
lativ
e to
the
2012
C
onse
rvat
ion
Con
ditio
n
Edge of Field Lake Load Deposition
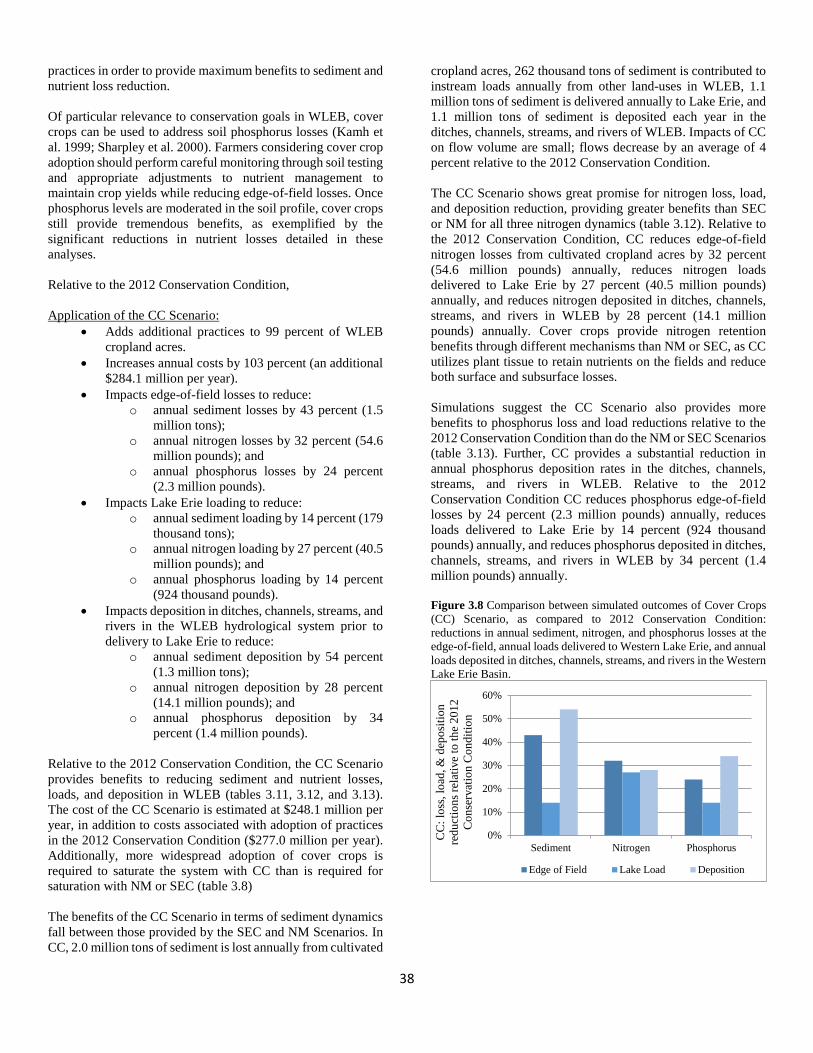
38
practices in order to provide maximum benefits to sediment and nutrient loss reduction. Of particular relevance to conservation goals in WLEB, cover crops can be used to address soil phosphorus losses (Kamh et al. 1999; Sharpley et al. 2000). Farmers considering cover crop adoption should perform careful monitoring through soil testing and appropriate adjustments to nutrient management to maintain crop yields while reducing edge-of-field losses. Once phosphorus levels are moderated in the soil profile, cover crops still provide tremendous benefits, as exemplified by the significant reductions in nutrient losses detailed in these analyses. Relative to the 2012 Conservation Condition, Application of the CC Scenario:
• Adds additional practices to 99 percent of WLEB cropland acres.
• Increases annual costs by 103 percent (an additional $284.1 million per year).
• Impacts edge-of-field losses to reduce: o annual sediment losses by 43 percent (1.5
million tons); o annual nitrogen losses by 32 percent (54.6
million pounds); and o annual phosphorus losses by 24 percent
(2.3 million pounds). • Impacts Lake Erie loading to reduce:
o annual sediment loading by 14 percent (179 thousand tons);
o annual nitrogen loading by 27 percent (40.5 million pounds); and
o annual phosphorus loading by 14 percent (924 thousand pounds).
• Impacts deposition in ditches, channels, streams, and rivers in the WLEB hydrological system prior to delivery to Lake Erie to reduce:
o annual sediment deposition by 54 percent (1.3 million tons);
o annual nitrogen deposition by 28 percent (14.1 million pounds); and
o annual phosphorus deposition by 34 percent (1.4 million pounds).
Relative to the 2012 Conservation Condition, the CC Scenario provides benefits to reducing sediment and nutrient losses, loads, and deposition in WLEB (tables 3.11, 3.12, and 3.13). The cost of the CC Scenario is estimated at $248.1 million per year, in addition to costs associated with adoption of practices in the 2012 Conservation Condition ($277.0 million per year). Additionally, more widespread adoption of cover crops is required to saturate the system with CC than is required for saturation with NM or SEC (table 3.8) The benefits of the CC Scenario in terms of sediment dynamics fall between those provided by the SEC and NM Scenarios. In CC, 2.0 million tons of sediment is lost annually from cultivated
cropland acres, 262 thousand tons of sediment is contributed to instream loads annually from other land-uses in WLEB, 1.1 million tons of sediment is delivered annually to Lake Erie, and 1.1 million tons of sediment is deposited each year in the ditches, channels, streams, and rivers of WLEB. Impacts of CC on flow volume are small; flows decrease by an average of 4 percent relative to the 2012 Conservation Condition. The CC Scenario shows great promise for nitrogen loss, load, and deposition reduction, providing greater benefits than SEC or NM for all three nitrogen dynamics (table 3.12). Relative to the 2012 Conservation Condition, CC reduces edge-of-field nitrogen losses from cultivated cropland acres by 32 percent (54.6 million pounds) annually, reduces nitrogen loads delivered to Lake Erie by 27 percent (40.5 million pounds) annually, and reduces nitrogen deposited in ditches, channels, streams, and rivers in WLEB by 28 percent (14.1 million pounds) annually. Cover crops provide nitrogen retention benefits through different mechanisms than NM or SEC, as CC utilizes plant tissue to retain nutrients on the fields and reduce both surface and subsurface losses. Simulations suggest the CC Scenario also provides more benefits to phosphorus loss and load reductions relative to the 2012 Conservation Condition than do the NM or SEC Scenarios (table 3.13). Further, CC provides a substantial reduction in annual phosphorus deposition rates in the ditches, channels, streams, and rivers in WLEB. Relative to the 2012 Conservation Condition CC reduces phosphorus edge-of-field losses by 24 percent (2.3 million pounds) annually, reduces loads delivered to Lake Erie by 14 percent (924 thousand pounds) annually, and reduces phosphorus deposited in ditches, channels, streams, and rivers in WLEB by 34 percent (1.4 million pounds) annually. Figure 3.8 Comparison between simulated outcomes of Cover Crops (CC) Scenario, as compared to 2012 Conservation Condition: reductions in annual sediment, nitrogen, and phosphorus losses at the edge-of-field, annual loads delivered to Western Lake Erie, and annual loads deposited in ditches, channels, streams, and rivers in the Western Lake Erie Basin.
0%
10%
20%
30%
40%
50%
60%
Sediment Nitrogen Phosphorus
CC
: los
s, lo
ad, &
dep
ositi
on
redu
ctio
ns re
lativ
e to
the
2012
C
onse
rvat
ion
Con
ditio
n
Edge of Field Lake Load Deposition
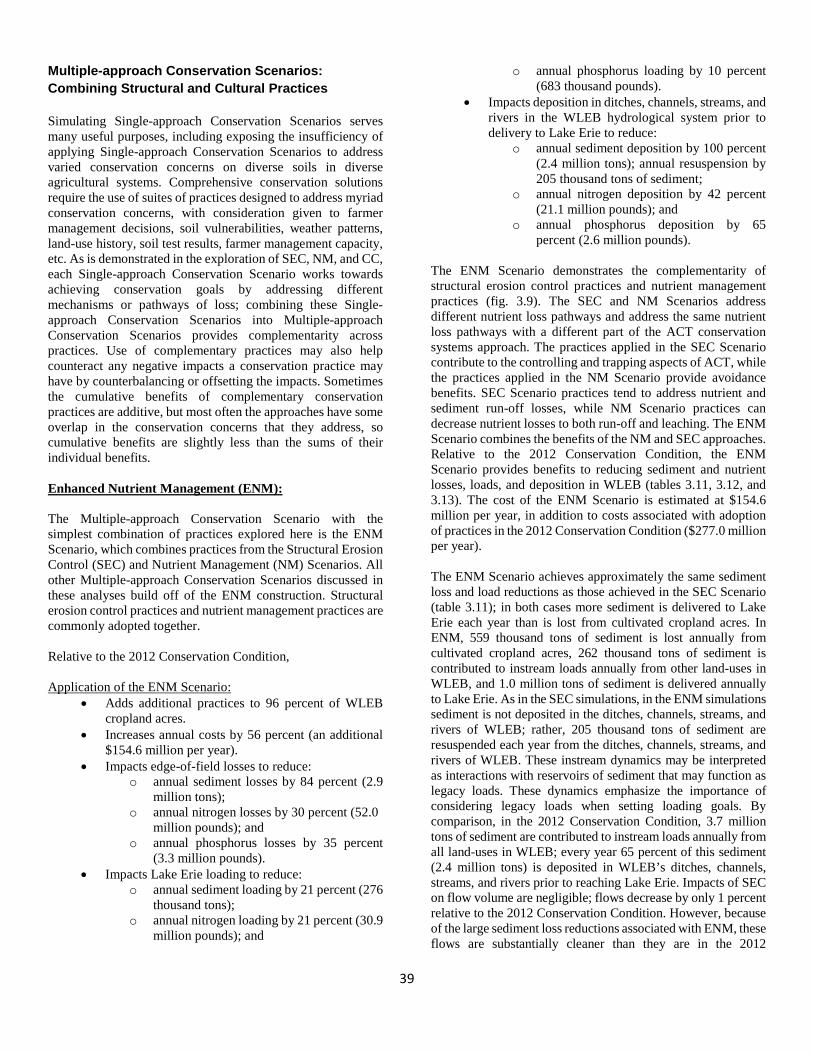
39
Multiple-approach Conservation Scenarios: Combining Structural and Cultural Practices Simulating Single-approach Conservation Scenarios serves many useful purposes, including exposing the insufficiency of applying Single-approach Conservation Scenarios to address varied conservation concerns on diverse soils in diverse agricultural systems. Comprehensive conservation solutions require the use of suites of practices designed to address myriad conservation concerns, with consideration given to farmer management decisions, soil vulnerabilities, weather patterns, land-use history, soil test results, farmer management capacity, etc. As is demonstrated in the exploration of SEC, NM, and CC, each Single-approach Conservation Scenario works towards achieving conservation goals by addressing different mechanisms or pathways of loss; combining these Single-approach Conservation Scenarios into Multiple-approach Conservation Scenarios provides complementarity across practices. Use of complementary practices may also help counteract any negative impacts a conservation practice may have by counterbalancing or offsetting the impacts. Sometimes the cumulative benefits of complementary conservation practices are additive, but most often the approaches have some overlap in the conservation concerns that they address, so cumulative benefits are slightly less than the sums of their individual benefits. Enhanced Nutrient Management (ENM): The Multiple-approach Conservation Scenario with the simplest combination of practices explored here is the ENM Scenario, which combines practices from the Structural Erosion Control (SEC) and Nutrient Management (NM) Scenarios. All other Multiple-approach Conservation Scenarios discussed in these analyses build off of the ENM construction. Structural erosion control practices and nutrient management practices are commonly adopted together. Relative to the 2012 Conservation Condition, Application of the ENM Scenario:
• Adds additional practices to 96 percent of WLEB cropland acres.
• Increases annual costs by 56 percent (an additional $154.6 million per year).
• Impacts edge-of-field losses to reduce: o annual sediment losses by 84 percent (2.9
million tons); o annual nitrogen losses by 30 percent (52.0
million pounds); and o annual phosphorus losses by 35 percent
(3.3 million pounds). • Impacts Lake Erie loading to reduce:
o annual sediment loading by 21 percent (276 thousand tons);
o annual nitrogen loading by 21 percent (30.9 million pounds); and
o annual phosphorus loading by 10 percent (683 thousand pounds).
• Impacts deposition in ditches, channels, streams, and rivers in the WLEB hydrological system prior to delivery to Lake Erie to reduce:
o annual sediment deposition by 100 percent (2.4 million tons); annual resuspension by 205 thousand tons of sediment;
o annual nitrogen deposition by 42 percent (21.1 million pounds); and
o annual phosphorus deposition by 65 percent (2.6 million pounds).
The ENM Scenario demonstrates the complementarity of structural erosion control practices and nutrient management practices (fig. 3.9). The SEC and NM Scenarios address different nutrient loss pathways and address the same nutrient loss pathways with a different part of the ACT conservation systems approach. The practices applied in the SEC Scenario contribute to the controlling and trapping aspects of ACT, while the practices applied in the NM Scenario provide avoidance benefits. SEC Scenario practices tend to address nutrient and sediment run-off losses, while NM Scenario practices can decrease nutrient losses to both run-off and leaching. The ENM Scenario combines the benefits of the NM and SEC approaches. Relative to the 2012 Conservation Condition, the ENM Scenario provides benefits to reducing sediment and nutrient losses, loads, and deposition in WLEB (tables 3.11, 3.12, and 3.13). The cost of the ENM Scenario is estimated at $154.6 million per year, in addition to costs associated with adoption of practices in the 2012 Conservation Condition ($277.0 million per year). The ENM Scenario achieves approximately the same sediment loss and load reductions as those achieved in the SEC Scenario (table 3.11); in both cases more sediment is delivered to Lake Erie each year than is lost from cultivated cropland acres. In ENM, 559 thousand tons of sediment is lost annually from cultivated cropland acres, 262 thousand tons of sediment is contributed to instream loads annually from other land-uses in WLEB, and 1.0 million tons of sediment is delivered annually to Lake Erie. As in the SEC simulations, in the ENM simulations sediment is not deposited in the ditches, channels, streams, and rivers of WLEB; rather, 205 thousand tons of sediment are resuspended each year from the ditches, channels, streams, and rivers of WLEB. These instream dynamics may be interpreted as interactions with reservoirs of sediment that may function as legacy loads. These dynamics emphasize the importance of considering legacy loads when setting loading goals. By comparison, in the 2012 Conservation Condition, 3.7 million tons of sediment are contributed to instream loads annually from all land-uses in WLEB; every year 65 percent of this sediment (2.4 million tons) is deposited in WLEB’s ditches, channels, streams, and rivers prior to reaching Lake Erie. Impacts of SEC on flow volume are negligible; flows decrease by only 1 percent relative to the 2012 Conservation Condition. However, because of the large sediment loss reductions associated with ENM, these flows are substantially cleaner than they are in the 2012
40
Conservation Condition and therefore, have higher energy; the model suggests this leads to resuspension of sediment. Combining the NM and SEC approaches to nutrient loss reduction in the ENM Scenario leads to lower rates of loss, deposition, and load delivery than is achieved under either the NM or SEC Scenarios individually (tables 3.12 and 3.13). Relative to the 2012 Conservation Condition, ENM reduces edge-of-field nitrogen losses from cultivated cropland acres by 30 percent (52.0 million pounds) annually, reduces nitrogen loads delivered to Lake Erie by 21 percent (30.9 million pounds) annually, and reduces nitrogen deposited in ditches, channels, streams, and rivers in WLEB by 42 percent (21.1 million pounds) annually. Simulations suggest the ENM Scenario also provides more benefits to phosphorus loss, load, and deposition reductions than do either SEC or NM alone (table 3.13). Relative to the 2012 Conservation Condition the ENM Scenario reduces phosphorus edge-of-field losses by 35 percent (3.3 million pounds) annually, reduces loads delivered to Lake Erie by 10 percent (683 thousand pounds) annually, and reduces phosphorus deposited in ditches, channels, streams, and rivers in WLEB by 65 percent (2.6 million pounds) annually. Figure 3.9 Comparison between simulated outcomes of the Structural Erosion Control plus Nutrient Management (ENM) Scenario, as compared to 2012 Conservation Condition: reductions in annual sediment, nitrogen, and phosphorus losses at the edge-of-field, annual loads delivered to Western Lake Erie, and annual loads deposited in ditches, channels, streams, and rivers in the Western Lake Erie Basin. Values over 100 percent indicate that constituent is being resuspended.
Enhanced Nutrient Management plus Cover Crops (ENC): The final two Multiple-approach Conservation Scenarios explored here simulate the addition of a third suite of practices to complement the nutrient management (NM) and structural erosion control (SEC) practices in ENM. The ENC Scenario adds the Cover Crops (CC) Scenario to the ENM Scenario, enhancing the benefits that ENM provides. The Multiple-approach Scenarios are more similar to a comprehensive conservation plan than are the previously discussed Single-approach Scenarios. However, these Scenarios are still necessarily coarse; field scale planning and conservation practice planning would provide greater benefits than do these simulations, as the diversity of needs in a given field could be individually accommodated.
Relative to the 2012 Conservation Condition, Application of ENC:
• Adds additional practices to 100 percent of WLEB cropland acres.
• Increases annual costs by 159 percent (an additional $439.5 million per year).
• Impacts edge-of-field losses to reduce: o annual sediment losses by 89 percent (3.1
million tons); o annual nitrogen losses by 54 percent (92.8
million pounds); and o annual phosphorus losses by 50 percent
(4.8 million pounds). • Impacts Lake Erie loading to reduce:
o annual sediment loading by 26 percent (334 thousand tons);
o annual nitrogen loading by 42 percent (62.9 million pounds); and
o annual phosphorus loading by 23 percent (1.5 million pounds).
• Impacts deposition in ditches, channels, streams, and rivers in the WLEB hydrological system prior to delivery to Lake Erie to reduce:
o annual sediment deposition by 100 percent (2.4 million tons); annual resuspension by 322 thousand tons of sediment;
o annual nitrogen deposition by 59 percent (29.9 million pounds); and
o annual phosphorus deposition by 80 percent (3.2 million pounds).
As noted in the CC Scenario, cover crop benefits quantified in these analyses are limited to sediment, nitrogen, and phosphorus dynamics in relation to water quality vis-à-vis edge-of-field losses, transportation, and delivery processes in ditches, channels, streams, and rivers in WLEB. However, ENC provides numerous other benefits, both economic and ecological, that merit continued study and analyses. Coupling structural erosion controls (SEC) with proper nutrient management (NM) and cover crops (CC) can provide enhanced water quality benefits through a multifunctional approach while also providing the ecosystem service benefits unique to cover crops. Cover crops provide a variety of important ecosystems services including, but not limited to benefits to water quality through reduced erosion and mitigation of runoff-losses (Wratten et al. 2012); benefits to wildlife and biodiversity through improved pollinator habitat and wildlife food, cover, and corridors (Ellis and Barbercheck 2015); biological pest management benefits (Lundgren and Fergen 2011); benefits to soil organic carbon and soil health (Lal et al. 2007); and benefits to crop yields (Marcillo and Miguez 2017). When adopting cover crops, farmers should develop comprehensive conser-vation plans in which they determine the best cover crop for their particular land management goals, soils, and flexibilities, while also maximizing the broad variety of ecosystem services that cover crops can provide (Schipanski et al. 2014; Blanco-Canqui 2015).
0%
20%
40%
60%
80%
100%
120%
Sediment Nitrogen PhosphorusENM
: los
s, lo
ad, &
dep
ositi
on
redu
ctio
ns re
lativ
e to
the
2012
C
onse
rvat
ion
Con
ditio
n
Edge of Field Lake Load Deposition
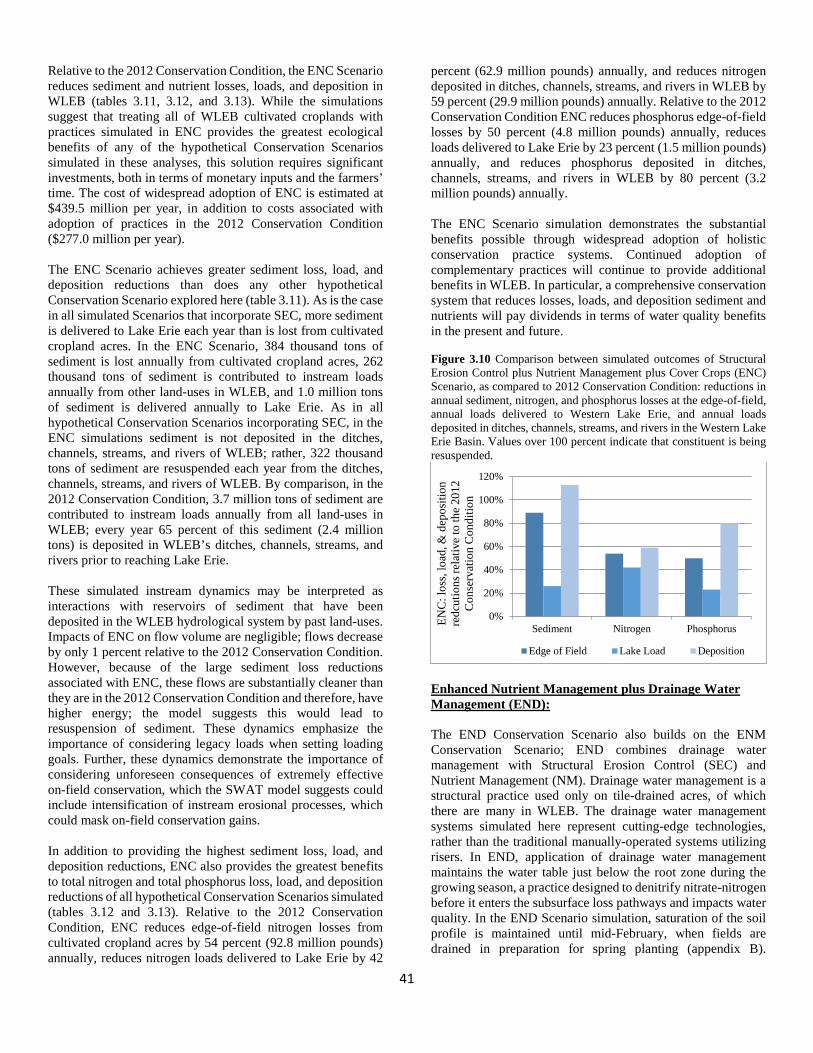
41
Relative to the 2012 Conservation Condition, the ENC Scenario reduces sediment and nutrient losses, loads, and deposition in WLEB (tables 3.11, 3.12, and 3.13). While the simulations suggest that treating all of WLEB cultivated croplands with practices simulated in ENC provides the greatest ecological benefits of any of the hypothetical Conservation Scenarios simulated in these analyses, this solution requires significant investments, both in terms of monetary inputs and the farmers’ time. The cost of widespread adoption of ENC is estimated at $439.5 million per year, in addition to costs associated with adoption of practices in the 2012 Conservation Condition ($277.0 million per year). The ENC Scenario achieves greater sediment loss, load, and deposition reductions than does any other hypothetical Conservation Scenario explored here (table 3.11). As is the case in all simulated Scenarios that incorporate SEC, more sediment is delivered to Lake Erie each year than is lost from cultivated cropland acres. In the ENC Scenario, 384 thousand tons of sediment is lost annually from cultivated cropland acres, 262 thousand tons of sediment is contributed to instream loads annually from other land-uses in WLEB, and 1.0 million tons of sediment is delivered annually to Lake Erie. As in all hypothetical Conservation Scenarios incorporating SEC, in the ENC simulations sediment is not deposited in the ditches, channels, streams, and rivers of WLEB; rather, 322 thousand tons of sediment are resuspended each year from the ditches, channels, streams, and rivers of WLEB. By comparison, in the 2012 Conservation Condition, 3.7 million tons of sediment are contributed to instream loads annually from all land-uses in WLEB; every year 65 percent of this sediment (2.4 million tons) is deposited in WLEB’s ditches, channels, streams, and rivers prior to reaching Lake Erie. These simulated instream dynamics may be interpreted as interactions with reservoirs of sediment that have been deposited in the WLEB hydrological system by past land-uses. Impacts of ENC on flow volume are negligible; flows decrease by only 1 percent relative to the 2012 Conservation Condition. However, because of the large sediment loss reductions associated with ENC, these flows are substantially cleaner than they are in the 2012 Conservation Condition and therefore, have higher energy; the model suggests this would lead to resuspension of sediment. These dynamics emphasize the importance of considering legacy loads when setting loading goals. Further, these dynamics demonstrate the importance of considering unforeseen consequences of extremely effective on-field conservation, which the SWAT model suggests could include intensification of instream erosional processes, which could mask on-field conservation gains. In addition to providing the highest sediment loss, load, and deposition reductions, ENC also provides the greatest benefits to total nitrogen and total phosphorus loss, load, and deposition reductions of all hypothetical Conservation Scenarios simulated (tables 3.12 and 3.13). Relative to the 2012 Conservation Condition, ENC reduces edge-of-field nitrogen losses from cultivated cropland acres by 54 percent (92.8 million pounds) annually, reduces nitrogen loads delivered to Lake Erie by 42
percent (62.9 million pounds) annually, and reduces nitrogen deposited in ditches, channels, streams, and rivers in WLEB by 59 percent (29.9 million pounds) annually. Relative to the 2012 Conservation Condition ENC reduces phosphorus edge-of-field losses by 50 percent (4.8 million pounds) annually, reduces loads delivered to Lake Erie by 23 percent (1.5 million pounds) annually, and reduces phosphorus deposited in ditches, channels, streams, and rivers in WLEB by 80 percent (3.2 million pounds) annually. The ENC Scenario simulation demonstrates the substantial benefits possible through widespread adoption of holistic conservation practice systems. Continued adoption of complementary practices will continue to provide additional benefits in WLEB. In particular, a comprehensive conservation system that reduces losses, loads, and deposition sediment and nutrients will pay dividends in terms of water quality benefits in the present and future. Figure 3.10 Comparison between simulated outcomes of Structural Erosion Control plus Nutrient Management plus Cover Crops (ENC) Scenario, as compared to 2012 Conservation Condition: reductions in annual sediment, nitrogen, and phosphorus losses at the edge-of-field, annual loads delivered to Western Lake Erie, and annual loads deposited in ditches, channels, streams, and rivers in the Western Lake Erie Basin. Values over 100 percent indicate that constituent is being resuspended.
Enhanced Nutrient Management plus Drainage Water Management (END): The END Conservation Scenario also builds on the ENM Conservation Scenario; END combines drainage water management with Structural Erosion Control (SEC) and Nutrient Management (NM). Drainage water management is a structural practice used only on tile-drained acres, of which there are many in WLEB. The drainage water management systems simulated here represent cutting-edge technologies, rather than the traditional manually-operated systems utilizing risers. In END, application of drainage water management maintains the water table just below the root zone during the growing season, a practice designed to denitrify nitrate-nitrogen before it enters the subsurface loss pathways and impacts water quality. In the END Scenario simulation, saturation of the soil profile is maintained until mid-February, when fields are drained in preparation for spring planting (appendix B).
0%
20%
40%
60%
80%
100%
120%
Sediment Nitrogen PhosphorusENC
: los
s, lo
ad, &
dep
ositi
on
redc
utio
ns re
lativ
e to
the
2012
C
onse
rvat
ion
Con
ditio
n
Edge of Field Lake Load Deposition
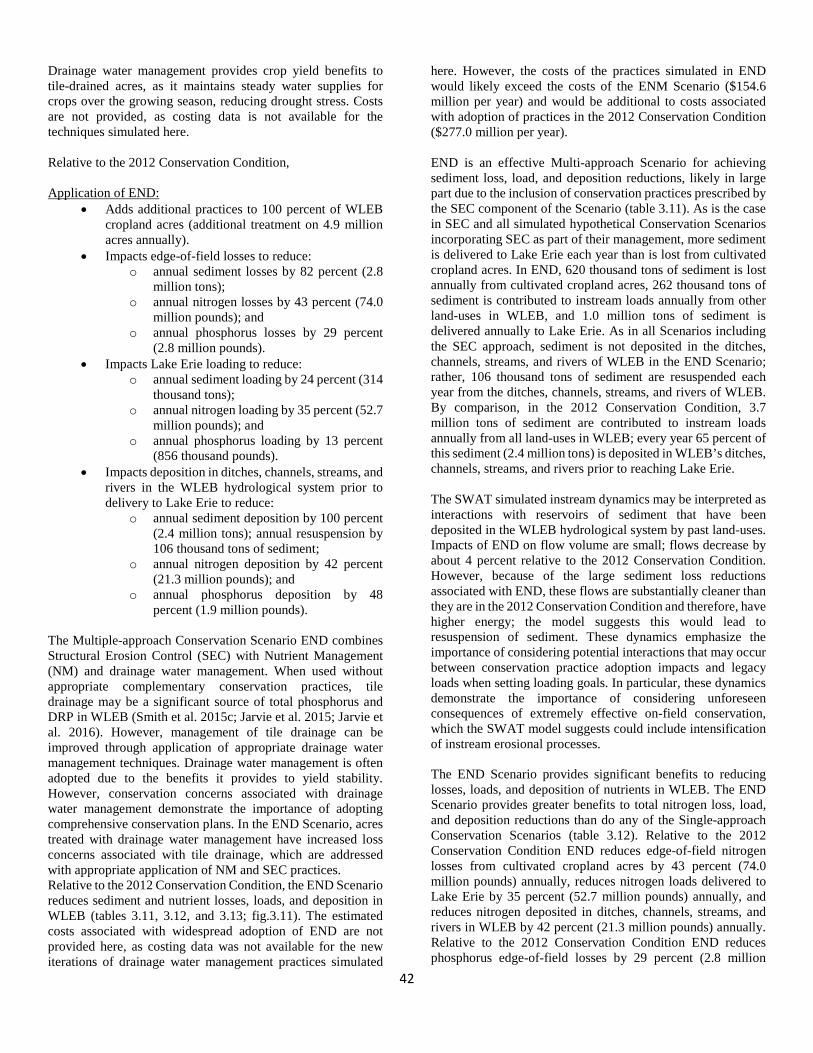
42
Drainage water management provides crop yield benefits to tile-drained acres, as it maintains steady water supplies for crops over the growing season, reducing drought stress. Costs are not provided, as costing data is not available for the techniques simulated here. Relative to the 2012 Conservation Condition, Application of END:
• Adds additional practices to 100 percent of WLEB cropland acres (additional treatment on 4.9 million acres annually).
• Impacts edge-of-field losses to reduce: o annual sediment losses by 82 percent (2.8
million tons); o annual nitrogen losses by 43 percent (74.0
million pounds); and o annual phosphorus losses by 29 percent
(2.8 million pounds). • Impacts Lake Erie loading to reduce:
o annual sediment loading by 24 percent (314 thousand tons);
o annual nitrogen loading by 35 percent (52.7 million pounds); and
o annual phosphorus loading by 13 percent (856 thousand pounds).
• Impacts deposition in ditches, channels, streams, and rivers in the WLEB hydrological system prior to delivery to Lake Erie to reduce:
o annual sediment deposition by 100 percent (2.4 million tons); annual resuspension by 106 thousand tons of sediment;
o annual nitrogen deposition by 42 percent (21.3 million pounds); and
o annual phosphorus deposition by 48 percent (1.9 million pounds).
The Multiple-approach Conservation Scenario END combines Structural Erosion Control (SEC) with Nutrient Management (NM) and drainage water management. When used without appropriate complementary conservation practices, tile drainage may be a significant source of total phosphorus and DRP in WLEB (Smith et al. 2015c; Jarvie et al. 2015; Jarvie et al. 2016). However, management of tile drainage can be improved through application of appropriate drainage water management techniques. Drainage water management is often adopted due to the benefits it provides to yield stability. However, conservation concerns associated with drainage water management demonstrate the importance of adopting comprehensive conservation plans. In the END Scenario, acres treated with drainage water management have increased loss concerns associated with tile drainage, which are addressed with appropriate application of NM and SEC practices. Relative to the 2012 Conservation Condition, the END Scenario reduces sediment and nutrient losses, loads, and deposition in WLEB (tables 3.11, 3.12, and 3.13; fig.3.11). The estimated costs associated with widespread adoption of END are not provided here, as costing data was not available for the new iterations of drainage water management practices simulated
here. However, the costs of the practices simulated in END would likely exceed the costs of the ENM Scenario ($154.6 million per year) and would be additional to costs associated with adoption of practices in the 2012 Conservation Condition ($277.0 million per year). END is an effective Multi-approach Scenario for achieving sediment loss, load, and deposition reductions, likely in large part due to the inclusion of conservation practices prescribed by the SEC component of the Scenario (table 3.11). As is the case in SEC and all simulated hypothetical Conservation Scenarios incorporating SEC as part of their management, more sediment is delivered to Lake Erie each year than is lost from cultivated cropland acres. In END, 620 thousand tons of sediment is lost annually from cultivated cropland acres, 262 thousand tons of sediment is contributed to instream loads annually from other land-uses in WLEB, and 1.0 million tons of sediment is delivered annually to Lake Erie. As in all Scenarios including the SEC approach, sediment is not deposited in the ditches, channels, streams, and rivers of WLEB in the END Scenario; rather, 106 thousand tons of sediment are resuspended each year from the ditches, channels, streams, and rivers of WLEB. By comparison, in the 2012 Conservation Condition, 3.7 million tons of sediment are contributed to instream loads annually from all land-uses in WLEB; every year 65 percent of this sediment (2.4 million tons) is deposited in WLEB’s ditches, channels, streams, and rivers prior to reaching Lake Erie. The SWAT simulated instream dynamics may be interpreted as interactions with reservoirs of sediment that have been deposited in the WLEB hydrological system by past land-uses. Impacts of END on flow volume are small; flows decrease by about 4 percent relative to the 2012 Conservation Condition. However, because of the large sediment loss reductions associated with END, these flows are substantially cleaner than they are in the 2012 Conservation Condition and therefore, have higher energy; the model suggests this would lead to resuspension of sediment. These dynamics emphasize the importance of considering potential interactions that may occur between conservation practice adoption impacts and legacy loads when setting loading goals. In particular, these dynamics demonstrate the importance of considering unforeseen consequences of extremely effective on-field conservation, which the SWAT model suggests could include intensification of instream erosional processes. The END Scenario provides significant benefits to reducing losses, loads, and deposition of nutrients in WLEB. The END Scenario provides greater benefits to total nitrogen loss, load, and deposition reductions than do any of the Single-approach Conservation Scenarios (table 3.12). Relative to the 2012 Conservation Condition END reduces edge-of-field nitrogen losses from cultivated cropland acres by 43 percent (74.0 million pounds) annually, reduces nitrogen loads delivered to Lake Erie by 35 percent (52.7 million pounds) annually, and reduces nitrogen deposited in ditches, channels, streams, and rivers in WLEB by 42 percent (21.3 million pounds) annually. Relative to the 2012 Conservation Condition END reduces phosphorus edge-of-field losses by 29 percent (2.8 million
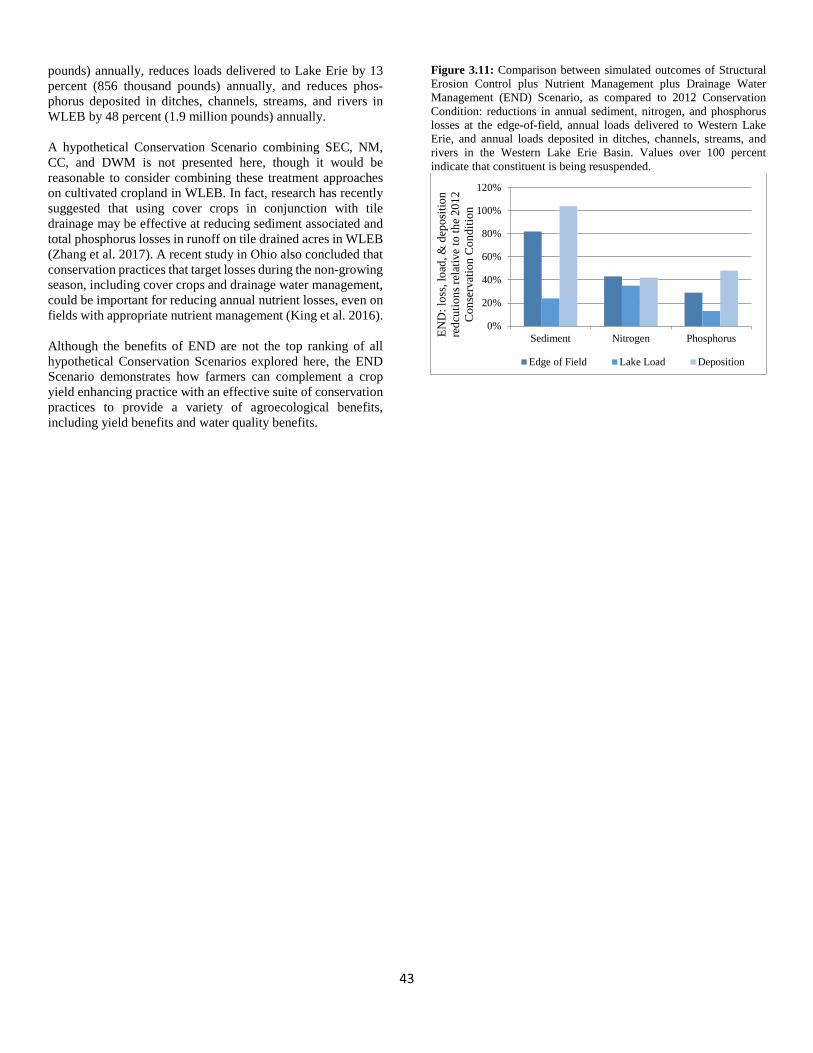
43
pounds) annually, reduces loads delivered to Lake Erie by 13 percent (856 thousand pounds) annually, and reduces phos-phorus deposited in ditches, channels, streams, and rivers in WLEB by 48 percent (1.9 million pounds) annually. A hypothetical Conservation Scenario combining SEC, NM, CC, and DWM is not presented here, though it would be reasonable to consider combining these treatment approaches on cultivated cropland in WLEB. In fact, research has recently suggested that using cover crops in conjunction with tile drainage may be effective at reducing sediment associated and total phosphorus losses in runoff on tile drained acres in WLEB (Zhang et al. 2017). A recent study in Ohio also concluded that conservation practices that target losses during the non-growing season, including cover crops and drainage water management, could be important for reducing annual nutrient losses, even on fields with appropriate nutrient management (King et al. 2016). Although the benefits of END are not the top ranking of all hypothetical Conservation Scenarios explored here, the END Scenario demonstrates how farmers can complement a crop yield enhancing practice with an effective suite of conservation practices to provide a variety of agroecological benefits, including yield benefits and water quality benefits.
Figure 3.11: Comparison between simulated outcomes of Structural Erosion Control plus Nutrient Management plus Drainage Water Management (END) Scenario, as compared to 2012 Conservation Condition: reductions in annual sediment, nitrogen, and phosphorus losses at the edge-of-field, annual loads delivered to Western Lake Erie, and annual loads deposited in ditches, channels, streams, and rivers in the Western Lake Erie Basin. Values over 100 percent indicate that constituent is being resuspended.
0%
20%
40%
60%
80%
100%
120%
Sediment Nitrogen PhosphorusEND
: los
s, lo
ad, &
dep
ositi
on
redc
utio
ns re
lativ
e to
the
2012
C
onse
rvat
ion
Con
ditio
n
Edge of Field Lake Load Deposition
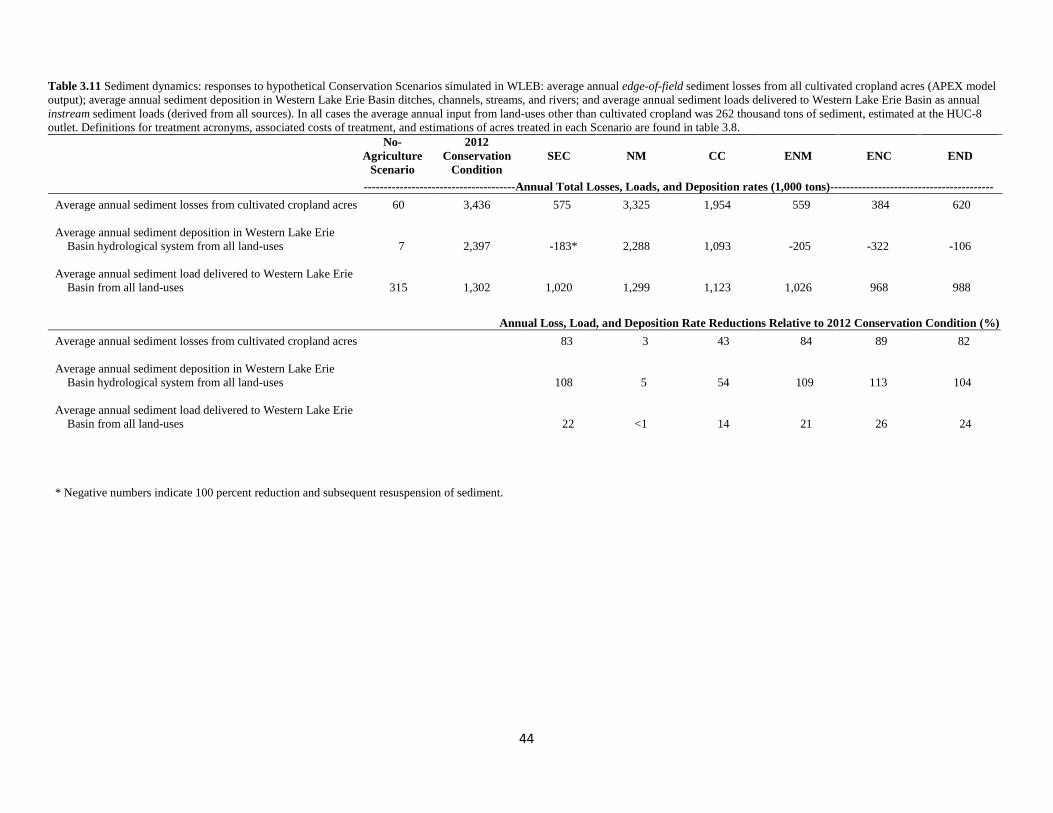
44
Table 3.11 Sediment dynamics: responses to hypothetical Conservation Scenarios simulated in WLEB: average annual edge-of-field sediment losses from all cultivated cropland acres (APEX model output); average annual sediment deposition in Western Lake Erie Basin ditches, channels, streams, and rivers; and average annual sediment loads delivered to Western Lake Erie Basin as annual instream sediment loads (derived from all sources). In all cases the average annual input from land-uses other than cultivated cropland was 262 thousand tons of sediment, estimated at the HUC-8 outlet. Definitions for treatment acronyms, associated costs of treatment, and estimations of acres treated in each Scenario are found in table 3.8.
No-Agriculture
Scenario
2012 Conservation
Condition SEC
NM
CC
ENM
ENC
END
--------------------------------------Annual Total Losses, Loads, and Deposition rates (1,000 tons)-----------------------------------------
Average annual sediment losses from cultivated cropland acres 60 3,436 575 3,325 1,954 559 384 620 Average annual sediment deposition in Western Lake Erie Basin hydrological system from all land-uses 7 2,397 -183* 2,288 1,093 -205 -322 -106 Average annual sediment load delivered to Western Lake Erie Basin from all land-uses 315 1,302 1,020 1,299 1,123 1,026 968 988
Annual Loss, Load, and Deposition Rate Reductions Relative to 2012 Conservation Condition (%) Average annual sediment losses from cultivated cropland acres 83 3 43 84 89 82 Average annual sediment deposition in Western Lake Erie Basin hydrological system from all land-uses 108 5 54 109 113 104 Average annual sediment load delivered to Western Lake Erie Basin from all land-uses 22 <1 14 21 26 24 * Negative numbers indicate 100 percent reduction and subsequent resuspension of sediment.
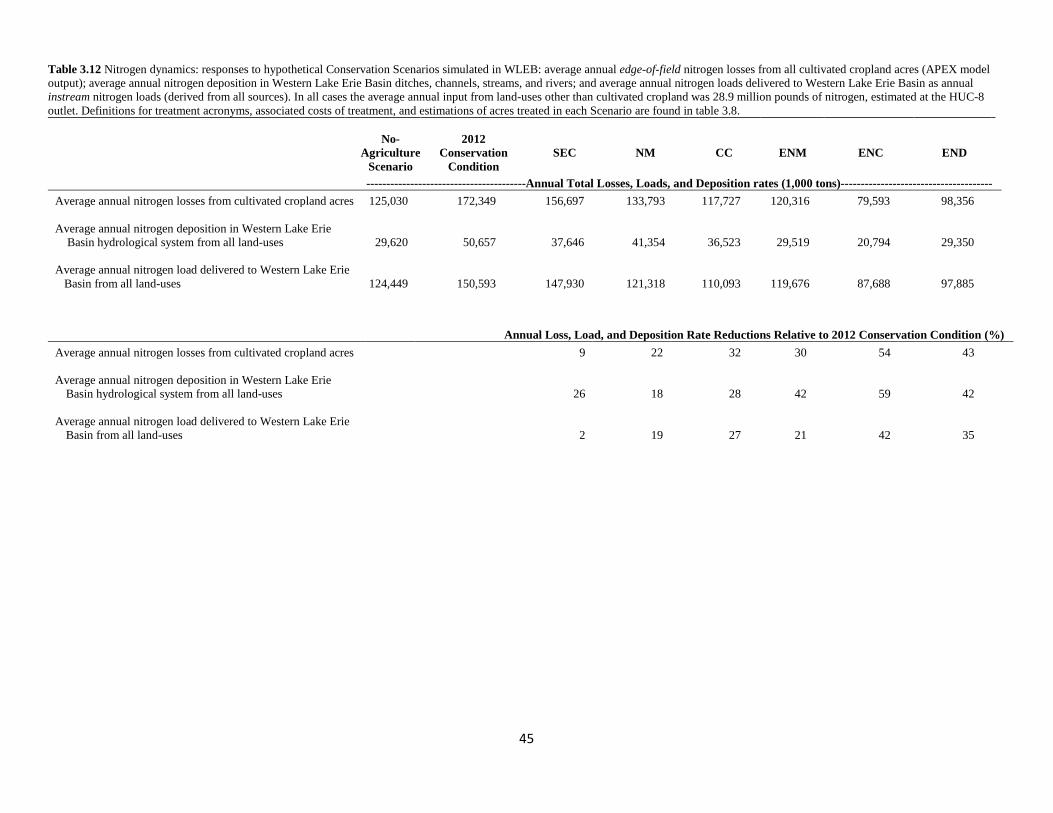
45
Table 3.12 Nitrogen dynamics: responses to hypothetical Conservation Scenarios simulated in WLEB: average annual edge-of-field nitrogen losses from all cultivated cropland acres (APEX model output); average annual nitrogen deposition in Western Lake Erie Basin ditches, channels, streams, and rivers; and average annual nitrogen loads delivered to Western Lake Erie Basin as annual instream nitrogen loads (derived from all sources). In all cases the average annual input from land-uses other than cultivated cropland was 28.9 million pounds of nitrogen, estimated at the HUC-8 outlet. Definitions for treatment acronyms, associated costs of treatment, and estimations of acres treated in each Scenario are found in table 3.8.
No-
Agriculture Scenario
2012 Conservation
Condition SEC
NM
CC
ENM
ENC
END
----------------------------------------Annual Total Losses, Loads, and Deposition rates (1,000 tons)-------------------------------------- Average annual nitrogen losses from cultivated cropland acres 125,030 172,349 156,697 133,793 117,727 120,316 79,593 98,356 Average annual nitrogen deposition in Western Lake Erie Basin hydrological system from all land-uses 29,620 50,657 37,646 41,354 36,523 29,519 20,794 29,350 Average annual nitrogen load delivered to Western Lake Erie Basin from all land-uses 124,449 150,593 147,930 121,318 110,093 119,676 87,688 97,885
Annual Loss, Load, and Deposition Rate Reductions Relative to 2012 Conservation Condition (%)
Average annual nitrogen losses from cultivated cropland acres 9 22 32 30 54 43 Average annual nitrogen deposition in Western Lake Erie
Basin hydrological system from all land-uses 26 18 28 42 59 42 Average annual nitrogen load delivered to Western Lake Erie
Basin from all land-uses 2 19 27 21 42 35
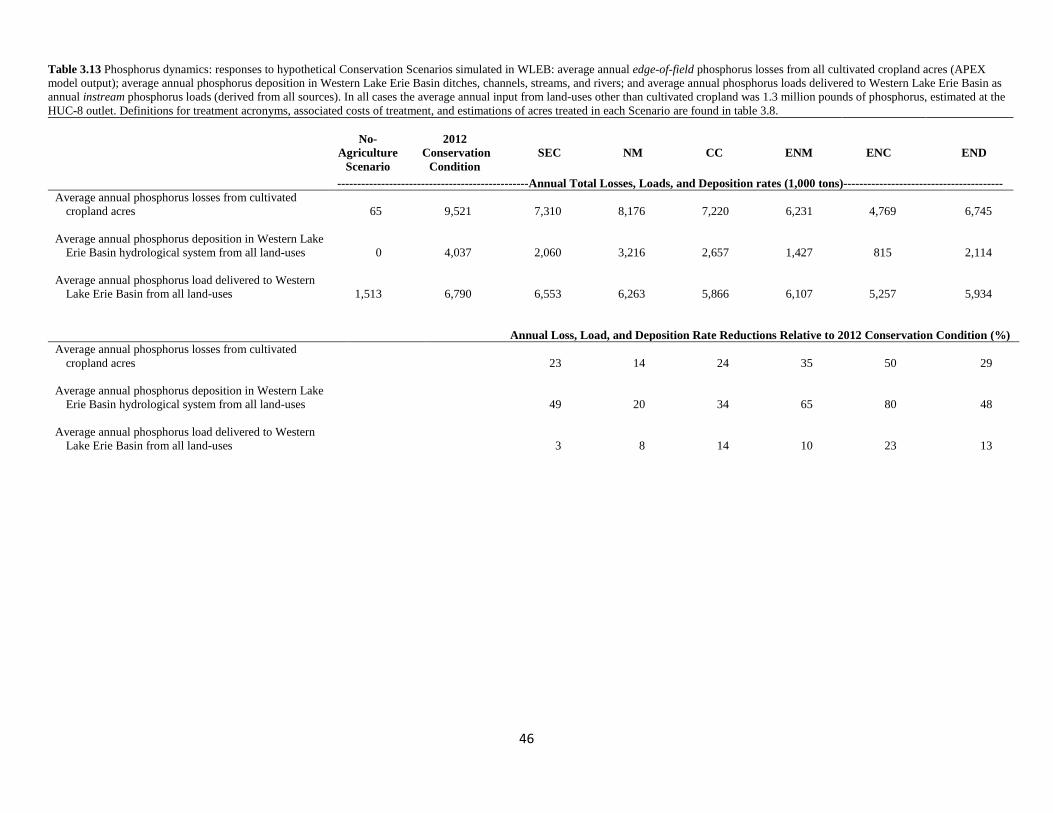
46
Table 3.13 Phosphorus dynamics: responses to hypothetical Conservation Scenarios simulated in WLEB: average annual edge-of-field phosphorus losses from all cultivated cropland acres (APEX model output); average annual phosphorus deposition in Western Lake Erie Basin ditches, channels, streams, and rivers; and average annual phosphorus loads delivered to Western Lake Erie Basin as annual instream phosphorus loads (derived from all sources). In all cases the average annual input from land-uses other than cultivated cropland was 1.3 million pounds of phosphorus, estimated at the HUC-8 outlet. Definitions for treatment acronyms, associated costs of treatment, and estimations of acres treated in each Scenario are found in table 3.8.
No-
Agriculture Scenario
2012
Conservation Condition
SEC
NM
CC
ENM
ENC
END
------------------------------------------------Annual Total Losses, Loads, and Deposition rates (1,000 tons)---------------------------------------- Average annual phosphorus losses from cultivated
cropland acres 65 9,521 7,310 8,176 7,220 6,231 4,769 6,745 Average annual phosphorus deposition in Western Lake
Erie Basin hydrological system from all land-uses 0 4,037 2,060 3,216 2,657 1,427 815 2,114 Average annual phosphorus load delivered to Western
Lake Erie Basin from all land-uses 1,513 6,790 6,553 6,263 5,866 6,107 5,257 5,934
Annual Loss, Load, and Deposition Rate Reductions Relative to 2012 Conservation Condition (%) Average annual phosphorus losses from cultivated
cropland acres 23 14 24 35 50 29 Average annual phosphorus deposition in Western Lake
Erie Basin hydrological system from all land-uses 49 20 34 65 80 48 Average annual phosphorus load delivered to Western
Lake Erie Basin from all land-uses 3 8 14 10 23 13
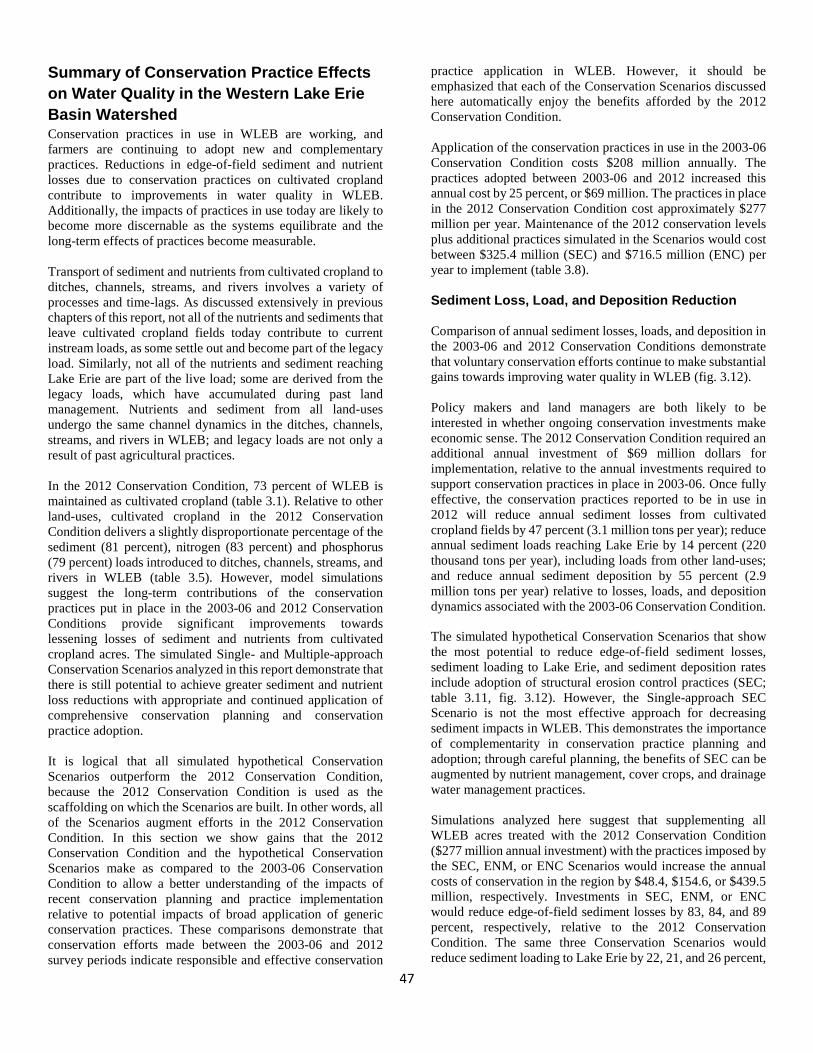
47
Summary of Conservation Practice Effects on Water Quality in the Western Lake Erie Basin Watershed Conservation practices in use in WLEB are working, and farmers are continuing to adopt new and complementary practices. Reductions in edge-of-field sediment and nutrient losses due to conservation practices on cultivated cropland contribute to improvements in water quality in WLEB. Additionally, the impacts of practices in use today are likely to become more discernable as the systems equilibrate and the long-term effects of practices become measurable. Transport of sediment and nutrients from cultivated cropland to ditches, channels, streams, and rivers involves a variety of processes and time-lags. As discussed extensively in previous chapters of this report, not all of the nutrients and sediments that leave cultivated cropland fields today contribute to current instream loads, as some settle out and become part of the legacy load. Similarly, not all of the nutrients and sediment reaching Lake Erie are part of the live load; some are derived from the legacy loads, which have accumulated during past land management. Nutrients and sediment from all land-uses undergo the same channel dynamics in the ditches, channels, streams, and rivers in WLEB; and legacy loads are not only a result of past agricultural practices. In the 2012 Conservation Condition, 73 percent of WLEB is maintained as cultivated cropland (table 3.1). Relative to other land-uses, cultivated cropland in the 2012 Conservation Condition delivers a slightly disproportionate percentage of the sediment (81 percent), nitrogen (83 percent) and phosphorus (79 percent) loads introduced to ditches, channels, streams, and rivers in WLEB (table 3.5). However, model simulations suggest the long-term contributions of the conservation practices put in place in the 2003-06 and 2012 Conservation Conditions provide significant improvements towards lessening losses of sediment and nutrients from cultivated cropland acres. The simulated Single- and Multiple-approach Conservation Scenarios analyzed in this report demonstrate that there is still potential to achieve greater sediment and nutrient loss reductions with appropriate and continued application of comprehensive conservation planning and conservation practice adoption. It is logical that all simulated hypothetical Conservation Scenarios outperform the 2012 Conservation Condition, because the 2012 Conservation Condition is used as the scaffolding on which the Scenarios are built. In other words, all of the Scenarios augment efforts in the 2012 Conservation Condition. In this section we show gains that the 2012 Conservation Condition and the hypothetical Conservation Scenarios make as compared to the 2003-06 Conservation Condition to allow a better understanding of the impacts of recent conservation planning and practice implementation relative to potential impacts of broad application of generic conservation practices. These comparisons demonstrate that conservation efforts made between the 2003-06 and 2012 survey periods indicate responsible and effective conservation
practice application in WLEB. However, it should be emphasized that each of the Conservation Scenarios discussed here automatically enjoy the benefits afforded by the 2012 Conservation Condition. Application of the conservation practices in use in the 2003-06 Conservation Condition costs $208 million annually. The practices adopted between 2003-06 and 2012 increased this annual cost by 25 percent, or $69 million. The practices in place in the 2012 Conservation Condition cost approximately $277 million per year. Maintenance of the 2012 conservation levels plus additional practices simulated in the Scenarios would cost between $325.4 million (SEC) and $716.5 million (ENC) per year to implement (table 3.8). Sediment Loss, Load, and Deposition Reduction Comparison of annual sediment losses, loads, and deposition in the 2003-06 and 2012 Conservation Conditions demonstrate that voluntary conservation efforts continue to make substantial gains towards improving water quality in WLEB (fig. 3.12). Policy makers and land managers are both likely to be interested in whether ongoing conservation investments make economic sense. The 2012 Conservation Condition required an additional annual investment of $69 million dollars for implementation, relative to the annual investments required to support conservation practices in place in 2003-06. Once fully effective, the conservation practices reported to be in use in 2012 will reduce annual sediment losses from cultivated cropland fields by 47 percent (3.1 million tons per year); reduce annual sediment loads reaching Lake Erie by 14 percent (220 thousand tons per year), including loads from other land-uses; and reduce annual sediment deposition by 55 percent (2.9 million tons per year) relative to losses, loads, and deposition dynamics associated with the 2003-06 Conservation Condition. The simulated hypothetical Conservation Scenarios that show the most potential to reduce edge-of-field sediment losses, sediment loading to Lake Erie, and sediment deposition rates include adoption of structural erosion control practices (SEC; table 3.11, fig. 3.12). However, the Single-approach SEC Scenario is not the most effective approach for decreasing sediment impacts in WLEB. This demonstrates the importance of complementarity in conservation practice planning and adoption; through careful planning, the benefits of SEC can be augmented by nutrient management, cover crops, and drainage water management practices. Simulations analyzed here suggest that supplementing all WLEB acres treated with the 2012 Conservation Condition ($277 million annual investment) with the practices imposed by the SEC, ENM, or ENC Scenarios would increase the annual costs of conservation in the region by $48.4, $154.6, or $439.5 million, respectively. Investments in SEC, ENM, or ENC would reduce edge-of-field sediment losses by 83, 84, and 89 percent, respectively, relative to the 2012 Conservation Condition. The same three Conservation Scenarios would reduce sediment loading to Lake Erie by 22, 21, and 26 percent,
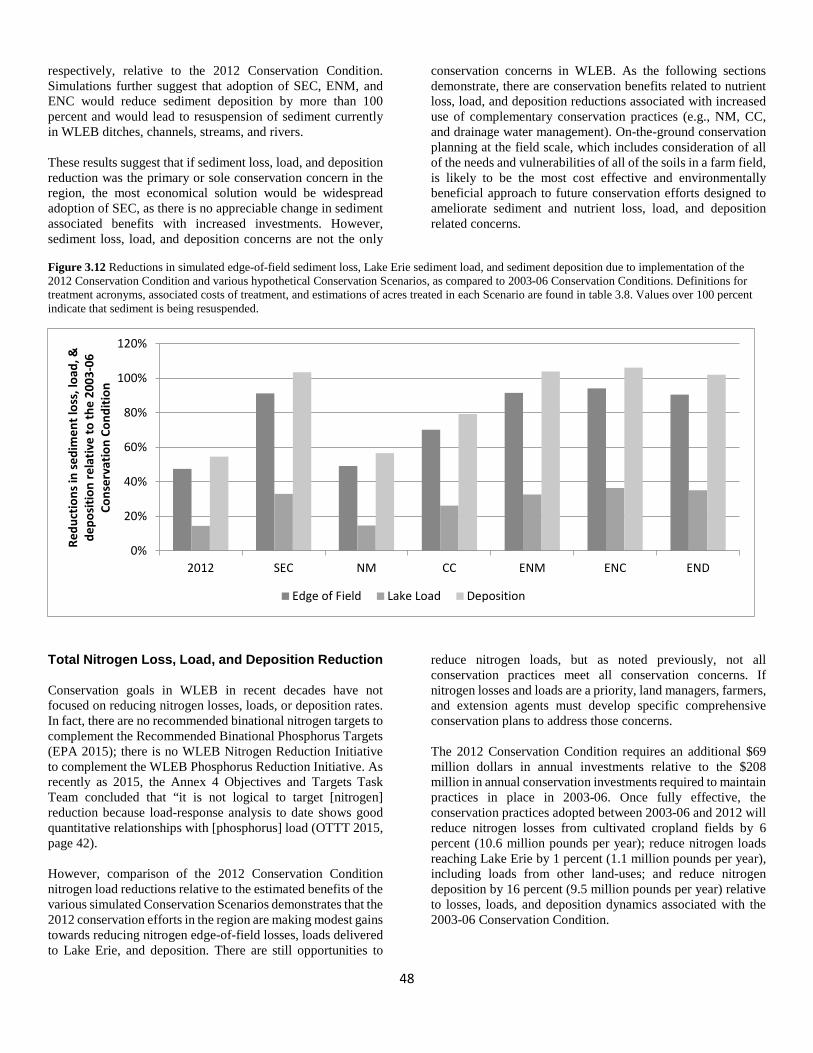
48
respectively, relative to the 2012 Conservation Condition. Simulations further suggest that adoption of SEC, ENM, and ENC would reduce sediment deposition by more than 100 percent and would lead to resuspension of sediment currently in WLEB ditches, channels, streams, and rivers. These results suggest that if sediment loss, load, and deposition reduction was the primary or sole conservation concern in the region, the most economical solution would be widespread adoption of SEC, as there is no appreciable change in sediment associated benefits with increased investments. However, sediment loss, load, and deposition concerns are not the only
conservation concerns in WLEB. As the following sections demonstrate, there are conservation benefits related to nutrient loss, load, and deposition reductions associated with increased use of complementary conservation practices (e.g., NM, CC, and drainage water management). On-the-ground conservation planning at the field scale, which includes consideration of all of the needs and vulnerabilities of all of the soils in a farm field, is likely to be the most cost effective and environmentally beneficial approach to future conservation efforts designed to ameliorate sediment and nutrient loss, load, and deposition related concerns.
Figure 3.12 Reductions in simulated edge-of-field sediment loss, Lake Erie sediment load, and sediment deposition due to implementation of the 2012 Conservation Condition and various hypothetical Conservation Scenarios, as compared to 2003-06 Conservation Conditions. Definitions for treatment acronyms, associated costs of treatment, and estimations of acres treated in each Scenario are found in table 3.8. Values over 100 percent indicate that sediment is being resuspended.
Total Nitrogen Loss, Load, and Deposition Reduction Conservation goals in WLEB in recent decades have not focused on reducing nitrogen losses, loads, or deposition rates. In fact, there are no recommended binational nitrogen targets to complement the Recommended Binational Phosphorus Targets (EPA 2015); there is no WLEB Nitrogen Reduction Initiative to complement the WLEB Phosphorus Reduction Initiative. As recently as 2015, the Annex 4 Objectives and Targets Task Team concluded that “it is not logical to target [nitrogen] reduction because load-response analysis to date shows good quantitative relationships with [phosphorus] load (OTTT 2015, page 42). However, comparison of the 2012 Conservation Condition nitrogen load reductions relative to the estimated benefits of the various simulated Conservation Scenarios demonstrates that the 2012 conservation efforts in the region are making modest gains towards reducing nitrogen edge-of-field losses, loads delivered to Lake Erie, and deposition. There are still opportunities to
reduce nitrogen loads, but as noted previously, not all conservation practices meet all conservation concerns. If nitrogen losses and loads are a priority, land managers, farmers, and extension agents must develop specific comprehensive conservation plans to address those concerns. The 2012 Conservation Condition requires an additional $69 million dollars in annual investments relative to the $208 million in annual conservation investments required to maintain practices in place in 2003-06. Once fully effective, the conservation practices adopted between 2003-06 and 2012 will reduce nitrogen losses from cultivated cropland fields by 6 percent (10.6 million pounds per year); reduce nitrogen loads reaching Lake Erie by 1 percent (1.1 million pounds per year), including loads from other land-uses; and reduce nitrogen deposition by 16 percent (9.5 million pounds per year) relative to losses, loads, and deposition dynamics associated with the 2003-06 Conservation Condition.
0%
20%
40%
60%
80%
100%
120%
2012 SEC NM CC ENM ENC END
Redu
ctio
ns in
sedi
men
t los
s, lo
ad, &
de
posi
tion
rela
tive
to th
e 20
03-0
6 Co
nser
vatio
n Co
nditi
on
Edge of Field Lake Load Deposition
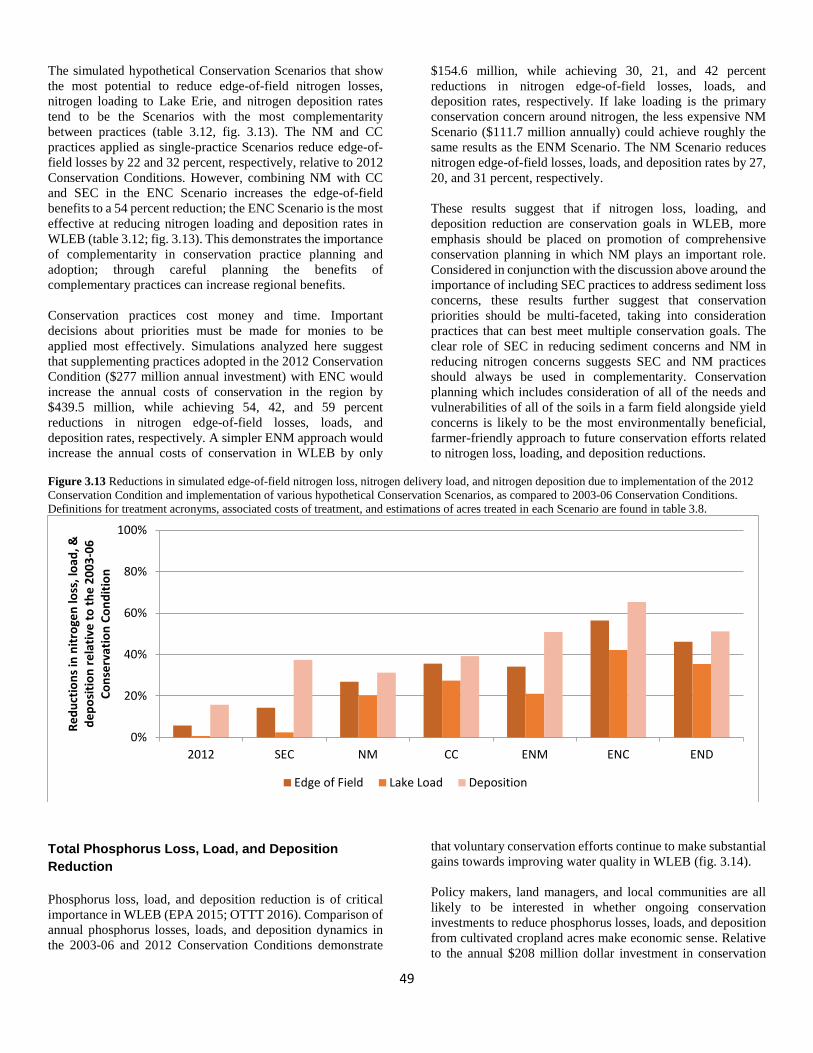
49
The simulated hypothetical Conservation Scenarios that show the most potential to reduce edge-of-field nitrogen losses, nitrogen loading to Lake Erie, and nitrogen deposition rates tend to be the Scenarios with the most complementarity between practices (table 3.12, fig. 3.13). The NM and CC practices applied as single-practice Scenarios reduce edge-of-field losses by 22 and 32 percent, respectively, relative to 2012 Conservation Conditions. However, combining NM with CC and SEC in the ENC Scenario increases the edge-of-field benefits to a 54 percent reduction; the ENC Scenario is the most effective at reducing nitrogen loading and deposition rates in WLEB (table 3.12; fig. 3.13). This demonstrates the importance of complementarity in conservation practice planning and adoption; through careful planning the benefits of complementary practices can increase regional benefits. Conservation practices cost money and time. Important decisions about priorities must be made for monies to be applied most effectively. Simulations analyzed here suggest that supplementing practices adopted in the 2012 Conservation Condition ($277 million annual investment) with ENC would increase the annual costs of conservation in the region by $439.5 million, while achieving 54, 42, and 59 percent reductions in nitrogen edge-of-field losses, loads, and deposition rates, respectively. A simpler ENM approach would increase the annual costs of conservation in WLEB by only
$154.6 million, while achieving 30, 21, and 42 percent reductions in nitrogen edge-of-field losses, loads, and deposition rates, respectively. If lake loading is the primary conservation concern around nitrogen, the less expensive NM Scenario ($111.7 million annually) could achieve roughly the same results as the ENM Scenario. The NM Scenario reduces nitrogen edge-of-field losses, loads, and deposition rates by 27, 20, and 31 percent, respectively. These results suggest that if nitrogen loss, loading, and deposition reduction are conservation goals in WLEB, more emphasis should be placed on promotion of comprehensive conservation planning in which NM plays an important role. Considered in conjunction with the discussion above around the importance of including SEC practices to address sediment loss concerns, these results further suggest that conservation priorities should be multi-faceted, taking into consideration practices that can best meet multiple conservation goals. The clear role of SEC in reducing sediment concerns and NM in reducing nitrogen concerns suggests SEC and NM practices should always be used in complementarity. Conservation planning which includes consideration of all of the needs and vulnerabilities of all of the soils in a farm field alongside yield concerns is likely to be the most environmentally beneficial, farmer-friendly approach to future conservation efforts related to nitrogen loss, loading, and deposition reductions.
Figure 3.13 Reductions in simulated edge-of-field nitrogen loss, nitrogen delivery load, and nitrogen deposition due to implementation of the 2012 Conservation Condition and implementation of various hypothetical Conservation Scenarios, as compared to 2003-06 Conservation Conditions. Definitions for treatment acronyms, associated costs of treatment, and estimations of acres treated in each Scenario are found in table 3.8.
Total Phosphorus Loss, Load, and Deposition Reduction Phosphorus loss, load, and deposition reduction is of critical importance in WLEB (EPA 2015; OTTT 2016). Comparison of annual phosphorus losses, loads, and deposition dynamics in the 2003-06 and 2012 Conservation Conditions demonstrate
that voluntary conservation efforts continue to make substantial gains towards improving water quality in WLEB (fig. 3.14). Policy makers, land managers, and local communities are all likely to be interested in whether ongoing conservation investments to reduce phosphorus losses, loads, and deposition from cultivated cropland acres make economic sense. Relative to the annual $208 million dollar investment in conservation
0%
20%
40%
60%
80%
100%
2012 SEC NM CC ENM ENC END
Redu
ctio
ns in
nitr
ogen
loss
, loa
d, &
de
posi
tion
rela
tive
to th
e 20
03-0
6 Co
nser
vatio
n Co
nditi
on
Edge of Field Lake Load Deposition
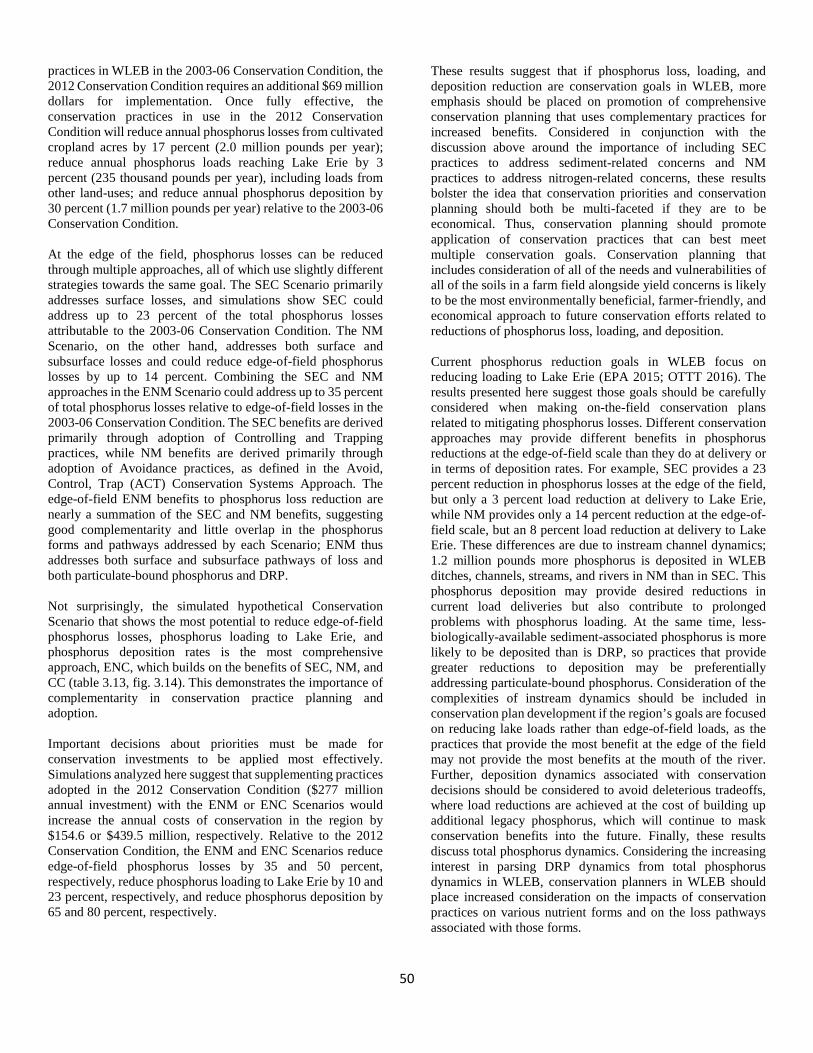
50
practices in WLEB in the 2003-06 Conservation Condition, the 2012 Conservation Condition requires an additional $69 million dollars for implementation. Once fully effective, the conservation practices in use in the 2012 Conservation Condition will reduce annual phosphorus losses from cultivated cropland acres by 17 percent (2.0 million pounds per year); reduce annual phosphorus loads reaching Lake Erie by 3 percent (235 thousand pounds per year), including loads from other land-uses; and reduce annual phosphorus deposition by 30 percent (1.7 million pounds per year) relative to the 2003-06 Conservation Condition. At the edge of the field, phosphorus losses can be reduced through multiple approaches, all of which use slightly different strategies towards the same goal. The SEC Scenario primarily addresses surface losses, and simulations show SEC could address up to 23 percent of the total phosphorus losses attributable to the 2003-06 Conservation Condition. The NM Scenario, on the other hand, addresses both surface and subsurface losses and could reduce edge-of-field phosphorus losses by up to 14 percent. Combining the SEC and NM approaches in the ENM Scenario could address up to 35 percent of total phosphorus losses relative to edge-of-field losses in the 2003-06 Conservation Condition. The SEC benefits are derived primarily through adoption of Controlling and Trapping practices, while NM benefits are derived primarily through adoption of Avoidance practices, as defined in the Avoid, Control, Trap (ACT) Conservation Systems Approach. The edge-of-field ENM benefits to phosphorus loss reduction are nearly a summation of the SEC and NM benefits, suggesting good complementarity and little overlap in the phosphorus forms and pathways addressed by each Scenario; ENM thus addresses both surface and subsurface pathways of loss and both particulate-bound phosphorus and DRP. Not surprisingly, the simulated hypothetical Conservation Scenario that shows the most potential to reduce edge-of-field phosphorus losses, phosphorus loading to Lake Erie, and phosphorus deposition rates is the most comprehensive approach, ENC, which builds on the benefits of SEC, NM, and CC (table 3.13, fig. 3.14). This demonstrates the importance of complementarity in conservation practice planning and adoption. Important decisions about priorities must be made for conservation investments to be applied most effectively. Simulations analyzed here suggest that supplementing practices adopted in the 2012 Conservation Condition ($277 million annual investment) with the ENM or ENC Scenarios would increase the annual costs of conservation in the region by $154.6 or $439.5 million, respectively. Relative to the 2012 Conservation Condition, the ENM and ENC Scenarios reduce edge-of-field phosphorus losses by 35 and 50 percent, respectively, reduce phosphorus loading to Lake Erie by 10 and 23 percent, respectively, and reduce phosphorus deposition by 65 and 80 percent, respectively.
These results suggest that if phosphorus loss, loading, and deposition reduction are conservation goals in WLEB, more emphasis should be placed on promotion of comprehensive conservation planning that uses complementary practices for increased benefits. Considered in conjunction with the discussion above around the importance of including SEC practices to address sediment-related concerns and NM practices to address nitrogen-related concerns, these results bolster the idea that conservation priorities and conservation planning should both be multi-faceted if they are to be economical. Thus, conservation planning should promote application of conservation practices that can best meet multiple conservation goals. Conservation planning that includes consideration of all of the needs and vulnerabilities of all of the soils in a farm field alongside yield concerns is likely to be the most environmentally beneficial, farmer-friendly, and economical approach to future conservation efforts related to reductions of phosphorus loss, loading, and deposition. Current phosphorus reduction goals in WLEB focus on reducing loading to Lake Erie (EPA 2015; OTTT 2016). The results presented here suggest those goals should be carefully considered when making on-the-field conservation plans related to mitigating phosphorus losses. Different conservation approaches may provide different benefits in phosphorus reductions at the edge-of-field scale than they do at delivery or in terms of deposition rates. For example, SEC provides a 23 percent reduction in phosphorus losses at the edge of the field, but only a 3 percent load reduction at delivery to Lake Erie, while NM provides only a 14 percent reduction at the edge-of-field scale, but an 8 percent load reduction at delivery to Lake Erie. These differences are due to instream channel dynamics; 1.2 million pounds more phosphorus is deposited in WLEB ditches, channels, streams, and rivers in NM than in SEC. This phosphorus deposition may provide desired reductions in current load deliveries but also contribute to prolonged problems with phosphorus loading. At the same time, less-biologically-available sediment-associated phosphorus is more likely to be deposited than is DRP, so practices that provide greater reductions to deposition may be preferentially addressing particulate-bound phosphorus. Consideration of the complexities of instream dynamics should be included in conservation plan development if the region’s goals are focused on reducing lake loads rather than edge-of-field loads, as the practices that provide the most benefit at the edge of the field may not provide the most benefits at the mouth of the river. Further, deposition dynamics associated with conservation decisions should be considered to avoid deleterious tradeoffs, where load reductions are achieved at the cost of building up additional legacy phosphorus, which will continue to mask conservation benefits into the future. Finally, these results discuss total phosphorus dynamics. Considering the increasing interest in parsing DRP dynamics from total phosphorus dynamics in WLEB, conservation planners in WLEB should place increased consideration on the impacts of conservation practices on various nutrient forms and on the loss pathways associated with those forms.
51
Figure 3.14 Reductions in simulated edge-of-field phosphorus loss, phosphorus delivery load, and phosphorus deposition due to implementation of the 2012 Conservation Condition and implementation of various hypothetical Conservation Scenarios, as compared to 2003-06 Conservation Conditions. Definitions for treatment acronyms, associated costs of treatment, and estimations of acres treated in each Scenario are found in table 3.8.
Comprehensive Conservation Planning The simulated sediment, nitrogen, and phosphorus loss, loading, and deposition reductions associated with the simulated hypothetical Conservation Scenarios demonstrate the importance of applying complementary conservation practices to a field to address a variety of conservation concerns. There are tradeoffs among the Scenarios, but in all cases the Multi-approach Scenarios outperform the Single-approach Scenarios, demonstrating the benefits of adopting complementary conservation practices to achieve conservation goals. At the edge-of-field scale, some Scenarios are best at reducing sediment losses (Scenarios incorporating SEC); others are most effective at reducing nitrogen losses (ENC and END); and others are most effective at reducing phosphorus losses (ENM and ENC). In efforts to reduce load deliveries to Lake Erie, some Scenarios are best at reducing sediment and nitrogen loads (ENC and END), while others are more effective at reducing phosphorus loads (ENM and ENC). Finally, when the purpose is to reduce deposition rates, some practices are more effective for sediment (Scenarios incorporating SEC), while ENC is the most effective Scenario for reducing nitrogen and phosphorus deposition. The ENC Scenario stands out in terms of benefits provided, likely due to the complementarity between structural practices, nutrient management practices, and cover
crops; these practices address multiple resource concerns and multiple loss pathways through slightly different approaches. Thus, their complementarity provides better protection across the Avoid, Control, Trap (ACT) Conservation Systems approach. As noted previously, the ENM, ENC, and END Multi-approach Scenarios provide coarse approximations of comprehensive conservation planning. Therefore, although these results are promising, they likely underestimate potential benefits of what ubiquitous, on-the-ground, comprehensive conservation planning could achieve in WLEB. These Multi-approach Scenarios show that there is no single “Best Management Practice” that will address all conservation concerns in WLEB. Rather, comprehensive conservation planning that takes into consideration regional conservation goals alongside site-specific farmer needs and the vulnerabilities of all of the soils in a farm field is the most effective approach to achieving nutrient and sediment loss, load, and deposition reductions. Emerging technologies that allow more controlled in-field management by soil needs, especially variable rate application and GIS, may be important factors in attaining maximum conservation benefits in WLEB.
0%
20%
40%
60%
80%
100%
2012 SEC NM CC ENM ENC END
Redu
ctio
ns in
pho
spho
rus l
oss,
load
, &
depo
sitio
n re
lativ
e to
the
2003
-06
Cons
erva
tion
Cond
ition
Edge of Field Lake Load Deposition
52
Western Lake Erie Basin CEAP-Wildlife Assessment
In 2016, work was completed on a 4-year collaborative project between the CEAP-Wildlife and CEAP-Cropland components. The project focused on nutrient and sediment impacts on fishes in streams throughout WLEB. This project convened partners from The Nature Conservancy, USDA’s Agricultural Research Service and NRCS, Ohio Sea Grant, The Ohio State University and Texas A&M University to model and assess in-stream ecological impacts of agriculture at spatial scales ranging from the entire basin down to small watersheds. Data from the CEAP-1 National survey (2003-06) and model simulations based on these data were used to provide agricultural management inputs (USDA-NRCS 2011).
The team focused on WLEB in part because of the region’s connections to the harmful algal blooms (HABs) that have plagued the lake in late summer and early fall. Improvements to stream health, even high up in the watershed, may help reduce algal blooms in Lake Erie. The streams themselves also offer important services like drinking water and recreational opportunities and are home to a number of fish species that have declined dramatically over the past century.
The assessment used two indicators of stream condition reflected by fish communities:
• Top predators in a stream are fish (often sportfish like bass) that consume other fishes but do not have predators themselves. Because these species are sensitive to environmental damage, an index of their presence can be used to determine how healthy an ecosystem is overall.
• The Index of Biotic Integrity (IBI) uses fish community structure to gauge stream conditions. It connects human disturbance on streams and watersheds to fish diversity and gives managers a standard tool to use when targeting improvements to a damaged watershed.
These biological indicators were generated from hundreds of fish community samples collected by state agencies between 1990 and 2012 and were linked to a fine-scale (NHDPlus resolution) SWAT model developed for this project to model water quality effects on stream fish communities. Details on modeling procedures used are in Daggupati et al. (2015), Yen et al. (2016), and Keitzer et al. (2016).
Results showed high levels of sediment and nutrients are potentially limiting fish community health in more than 10,000 km of streams and rivers in WLEB, representing more than 50% of the watershed, and that a suite of structural and annual practices, including nutrient management, is needed to achieve measurable improvements to fish communities. The assessment showed that, while improvements in stream health can be made by maintaining current conservation practice treatment levels and further treating farm acres in high need of treatment (~8% of the watershed), a much larger portion of the watershed (~48%) needs to be treated to achieve widespread benefits for stream fishes.
The assessment found that while agricultural conservation practices have an important role to play in WLEB stream conservation, they likely are not a panacea. Water quality is expected to limit fish communities to some degree in as much as 8,500 km of streams even if erosion control and nutrient management practices are implemented across the majority (~80%) of farm acres in the watershed. Thus, expectations for practice benefits to stream fish communities should be realistic. Farmland treatment with conservation practices can be an integral component of a comprehensive watershed management strategy to benefit aquatic communities, but other potential sources of water pollution (e.g., point sources, urban and exurban runoff) and non-water quality stressors (e.g., dispersal barriers, in-stream habitat, altered hydrology, and invasive species) also need to be addressed.
The findings are being used to help identify areas within the WLEB where water quality improvement through additional agricultural conservation treatment is most likely to result in benefits to stream fish communities.
Additional information and the full report is available at lakeerieceap.com.
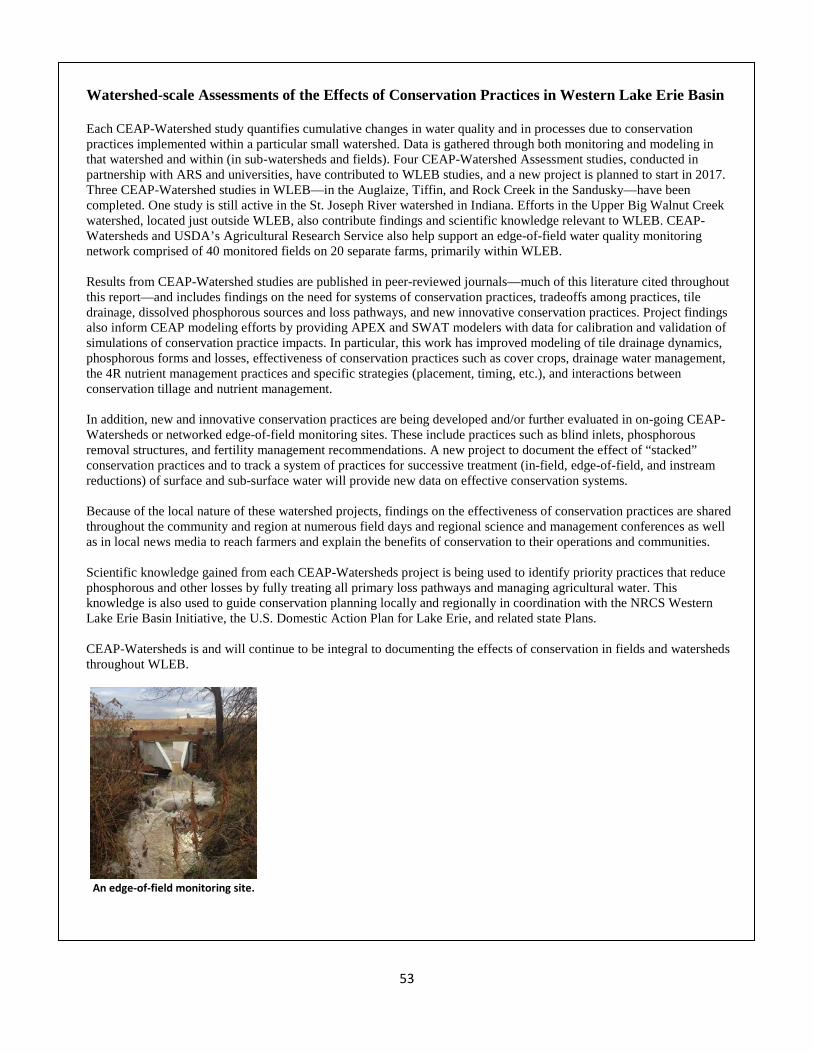
53
Watershed-scale Assessments of the Effects of Conservation Practices in Western Lake Erie Basin Each CEAP-Watershed study quantifies cumulative changes in water quality and in processes due to conservation practices implemented within a particular small watershed. Data is gathered through both monitoring and modeling in that watershed and within (in sub-watersheds and fields). Four CEAP-Watershed Assessment studies, conducted in partnership with ARS and universities, have contributed to WLEB studies, and a new project is planned to start in 2017. Three CEAP-Watershed studies in WLEB—in the Auglaize, Tiffin, and Rock Creek in the Sandusky—have been completed. One study is still active in the St. Joseph River watershed in Indiana. Efforts in the Upper Big Walnut Creek watershed, located just outside WLEB, also contribute findings and scientific knowledge relevant to WLEB. CEAP-Watersheds and USDA’s Agricultural Research Service also help support an edge-of-field water quality monitoring network comprised of 40 monitored fields on 20 separate farms, primarily within WLEB. Results from CEAP-Watershed studies are published in peer-reviewed journals—much of this literature cited throughout this report—and includes findings on the need for systems of conservation practices, tradeoffs among practices, tile drainage, dissolved phosphorous sources and loss pathways, and new innovative conservation practices. Project findings also inform CEAP modeling efforts by providing APEX and SWAT modelers with data for calibration and validation of simulations of conservation practice impacts. In particular, this work has improved modeling of tile drainage dynamics, phosphorous forms and losses, effectiveness of conservation practices such as cover crops, drainage water management, the 4R nutrient management practices and specific strategies (placement, timing, etc.), and interactions between conservation tillage and nutrient management. In addition, new and innovative conservation practices are being developed and/or further evaluated in on-going CEAP-Watersheds or networked edge-of-field monitoring sites. These include practices such as blind inlets, phosphorous removal structures, and fertility management recommendations. A new project to document the effect of “stacked” conservation practices and to track a system of practices for successive treatment (in-field, edge-of-field, and instream reductions) of surface and sub-surface water will provide new data on effective conservation systems. Because of the local nature of these watershed projects, findings on the effectiveness of conservation practices are shared throughout the community and region at numerous field days and regional science and management conferences as well as in local news media to reach farmers and explain the benefits of conservation to their operations and communities. Scientific knowledge gained from each CEAP-Watersheds project is being used to identify priority practices that reduce phosphorous and other losses by fully treating all primary loss pathways and managing agricultural water. This knowledge is also used to guide conservation planning locally and regionally in coordination with the NRCS Western Lake Erie Basin Initiative, the U.S. Domestic Action Plan for Lake Erie, and related state Plans. CEAP-Watersheds is and will continue to be integral to documenting the effects of conservation in fields and watersheds throughout WLEB.
An edge-of-field monitoring site.
54
References Andersson, H., L. Bergstrom, B. Ulen, F. Djodjic, and H. Kirchmann. 2015. The role of subsoil as a source or sink for phosphorus
leaching. Journal of Environmental Quality 44:535-544.
Arnold, J.G., S. Chinnasamy, M. Di Luzio, E.B. Haney, N. Kannan, and M. White. 2010. The HUMUS/SWAT national water quality modeling system. https://www.nrcs.usda.gov/Internet/FSE_DOCUMENTS/stelprdb1042103.pdf Accessed 16 June, 2017.
Arnold, J.G., and N. Fohrer. 2005. SWAT2000: Current capabilities and research opportunities in applied watershed modeling. Hydrological Processes 19:563-572.
Arnold, J.G., R. Srinivasan, R.S. Muttiah, and P.M. Allen. 1999. Continental scale simulation of the hydrologic balance. Journal of the American Water Resources Association 35(5):1037-1052.
Arnold, J.G., R. Srinivasan, R.S. Muttiah, and P.M. Williams. 1998. Large area hydrologic modeling and assessment part I: Model development. Journal of the American Water Resources Association 34(1):73-89.
Baker, D.B., and R.P. Richards. 2002. Phosphorus budgets and riverine phosphorus export in northwestern Ohio watersheds. Journal of Environmental Quality 31:96-108.
Baker, D.B., R. Confesor, D.E. Ewing, L.T. Johnson, J.W. Kramer, and B.J. Merryfield. 2014. Phosphorus loading from the Maumee, Sandusky, and Cuyahoga Rivers: The importance of bioavailability. Journal of Great Lakes Research 40:502-517.
Barica, J. 1982. Lake Erie oxygen depletion controversy. Journal of Great Lakes Research 8:719-722.
Beeton, A.M. 1961. Environmental changes in Lake Erie. Transactions of the American Fisheries Society 90:153-159.
Bertram, P.E. 1993. Total phosphorus and dissolved oxygen trends in the central basin of Lake Erie, 1970-1991. Journal of Great Lakes Research 19:224-236.
Betanzo, E.A., A.F. Choquette, K.H. Reckhow, L. Hayes, E.R. Hagen, D.M. Argue, and A.A. Cangelosi. 2015. Water data to answer urgent water policy questions: Monitoring design, available data, and filling data gaps for determining the effectiveness of agricultural management practices for reducing tributary nutrient loads to Lake Erie, Addendum describing new, expanded, and planned monitoring sites. Northeast-Midwest Institute Report, 169 pp. http://www.nemw.org/ DOI: 10.13140/RG.2.1.1102.5684
Blackwell, M.S.A., P.C. Brookes, N. de la Fuente-Martinez, H. Gordon, P.J. Murray, K.E. Snars, J.K. Williams, R. Bol, and P.M. Haygarth. 2010. Chapter 1: Phosphorus solubilization and potential transfer to surface waters from the soil microbial biomass following drying-rewetting and freezing-thawing in Advances in Agronomy 106:1-35.
Blanco-Canqui, H., T.M. Shaver, J.L. Lindquist, C.A. Shapiro, R.W. Elmore, C.A. Francis, and G.W. Hergert. 2015. Cover crops and ecosystem services: Insights from studies in temperate soils. Agronomy Journal 107:2449-2474.
Blevins, R.L., and W.W. Frye. 1993. Conservation tillage: An ecological approach to soil management. Advances in Agronomy 51: 33-78.
Bosch, N.S., J.D. Allan, J.P. Selegean, and D. Scavia. 2013. Scenario-testing of agricultural best practices in Lake Erie watersheds. Journal of Great Lakes Research 39:429-436.
Bosch, N.S., M.A. Evans, D. Scavia, and J.D. Allan. 2014. Interacting effects of climate change and agricultural BMPs on nutrient runoff entering Lake Erie. Journal of Great Lakes Research 40:581-589.
Bridgeman, T.B., J.D. Chaffin, D.D. Kane, J.D. Conroy, S.E. Panek, and P.M. Armenio. 2012. From river to lake: Phosphorus partitioning and algal community compositional changes in Western Lake Erie. Journal of Great Lakes Research 38:90-97.
Britt, N.W. 1955. Stratification in western Lake Erie in summer of 1953: Effects on Hexagenia (Ephemeroptera) population. Ecology 36:239-244.
Brown, L.C., and T.O. Barnwell, Jr. 1987. The enhanced stream water quality models QUAL2E and QUAL2E-UNCAS documentation and user manual. EPA/600/3-87/0007. http://personales.unican.es/tempranj/CALIDAD%20DE%20AGUAS/sect1-1.pdf Accessed January, 18, 2017.
Buda, A.R., P.J.A. Kleinman, M.S. Srinivasan, R.B. Bryant, and G.W. Feyereisen. 2009. Effects of hydrology and field management on phosphorus transport in surface runoff. Journal of Environmental Quality 38:2273-2284.
Bullerjahn, G.S., R.M. McKay, T.W. Davis, D.B. Baker, G.L. Boyer, L.V. D’Anglada, G.J. Doucette, J.C. Ho, E.G. Irwin, C.L. Kling, R.M. Kudela, R. Kurmayer, A.M. Michalak, J.D. Ortiz, T.G. Otten, H.W. Paerl, B. Qin, B.L. Sohngen, R.P. Stumpf, P.M. Visser,
55
and S.W. Wilhelm. 2016. Global solutions to regional problems: collecting global expertise to address the problem of harmful cyanobacterial blooms. A Lake Erie case study. Harmful Algae 54:223-238.
Bundy, L.G., T.W. Andraski, and J.M. Powell. 2001. Management practice effects on phosphorus losses in runoff in corn production systems. Journal of Environmental Quality 30:1822-1828.
Burlakova, L.E., A.Y. Karatayev, C. Pennuto, and C. Mayer. 2014. Changes in Lake Erie benthos over the last 50 years: Historical perspectives, current status, and main drivers. Journal of Great Lakes Research 40:560-573.
Burns, N.M. 1976. Temperature, oxygen, and nutrient distribution patterns in Lake Erie, 1970. Journal of the Fisheries Research Board of Canada 33:485-511.
Chandler, D.C., and O.B. Weeks. 1945. Limnological studies of Western Lake Erie: V. relation of limnological and meteorological conditions to the production of phytoplankton in 1942. Ecological Monographs 15:435-457.
Chapra, S.C., and D.M. Dolan. 2012. Great Lakes total phosphorus revisited: 2. Mass balance modeling. Journal of Great Lakes Research 38:741-754.
Chapra, S.C., and A. Robertson. 1977. Great Lakes eutrophication – Effect of point source control of total phosphorus. Science 196:1448-1450.
Chapra, S.C., H.D. Wicke, and T.M. Heidtke. 1983. Effectiveness of treatment to meet phosphorus objectives in the Great Lakes. Water Pollution Control Federation 55(1):81-91.
Charlton, M.N., and J.E. Milne. 2004. Thirty Years of Change in Lake Erie Water Quality. NWRI Contribution no. 04-167, Environment Canada, Burlington, Ontario.
Charlton, M.N., J.E. Milne, W.G. Booth, and F. Chiocchio. 1993. Lake Erie Offshore in 1990: Restoration and resilience in the Central Basin. Journal of Great Lakes Research 19:291-309.
Chen, D.J., H. Huang, M.P. Hu, and R.A. Dahlgren. 2014. Influence of lag effect, soil release, and climate change on watershed anthropogenic nitrogen inputs and riverine export dynamics. Environmental Science and Technology 48:5863-5690.
Cherry, K.A., M. Shepherd, P.J.A. Withers, and S.J. Mooney. 2008. Assessing the effectiveness of actions to mitigate nutrient loss from agriculture: A review of methods. Science of the Total Environment 406:1-23.
Childs, C.W. 1971. Lake Erie – to be or not to be. Chemistry in New Zealand: Journal of the New Zealand Institute of Chemistry 35: 185-189
Chinnasamy, S.X. Wang, J. Arnold, J. Williams, M. White, N. Kannan, and M. DiLuzio. 2009. Documentation on delivery ratios used for CEAP cropland modeling for various river basins in the United States. Texas AgriLife Research and USDA Agricultural Research Service. Available online: https://www.nrcs.usda.gov/Internet/FSE_DOCUMENTS/stelprdb1045451.pdf Accessed 23 January, 2017.
Curl, H. 1957. A source of phosphorus for the western basin of Lake Erie. Limnology and Oceanography 2:315-320.
Daggupati, P., H. Yen, M.J. White, R. Srinivasan, J.G. Arnold, S.C. Keitzer, and S.P. Sowa. 2015. Impact of model development, calibration and validation decisions on hydrological simulations in West Lake Erie Basin. Hydrological Processes 29:5307-5320.
Daloğlu I., K.H. Cho, and D. Scavia. 2012. Evaluating causes of trends in long-term dissolved reactive phosphorus loads to Lake Erie. Environmental Science and Technology 46:10660-10666.
Daly, C., R. P. Neilson, and D. L. Phillips. 1994. A statistical-topographic model for mapping climatological precipitation over mountainous terrain. J. Appl. Meteor. 33:140–158.
Davis, C.C. 1964. Evidence for the eutrophication of Lake Erie from phytoplankton records. Limnology and Oceanography 9:275-283.
De Pinto, J.V., T.C. Young, and L.M. McIlroy. 1986. Great Lakes water quality improvement: The strategy of phosphorus discharge control is evaluated. Environmental Science and Technology 20:752-759.
Di Luzio, M., G.L. Johnson, C. Daly, Jon K. Eischeid, J.G. Arnold. 2008. Constructing retrospective gridded daily precipitation and temperature datasets for the conterminous United States. Journal of Applied Meteorology and Climatology 47(2):475–497.
Di Toro, D.M., and J.P. Connolly. 1980. Mathematical models of water quality in large lakes. Part 2: Lake Erie. EPA-600/3-80-065. Available online at http://udspace.udel.edu/handle/19716/1443 Accessed 12 August, 2016.
56
Dodd, R.J., and A.N. Sharpley. 2016. Conservation practice effectiveness and adoption: Unintended consequences and implications for sustainable phosphorus management. Nutrient Cycling in Agroecosystems 104:373-392.
Dolan, D.M., and S.C. Chapra. 2012. Great Lakes total phosphorus revisited: 1. Loading analysis and update (1994-2008). Journal of Great Lakes Research 38:730-740.
Dupas, R., C. Gascuel-Odoux, N. Gilliet, C. Grimaldi, and G. Gruau. 2015a. Distinct export dynamics for dissolved and particulate phosphorus reveal independent mechanisms in an arable headwater catchment. Hydrological Processes 29:3162-3178.
Dupas, R., G. Gruau, S. Gu, G. Humbert, A. Jaffrezic, and C. Gascuel-Odoux. 2015b. Groundwater control of biogeochemical processes causing phosphorus release from riparian wetlands. Water Research 84:307-314.
Ellis, K.E., and M.E. Barbercheck. 2015. Management of overwintering cover crops influences floral resources and visitation by native bees. Environmental Entomology 44:999-1010.
EPA (Environmental Protection Agency) 2008. Development document for proposed effluent guidelines and standards for the construction and development category. US-EPA, Office of Water, 1200 Pennsylvania Avenue, NW, Washington, D.C.
EPA (Environmental Protection Agency). 2015. Recommended binational phosphorus targets to combat Lake Erie algal blooms. Available at https://www.epa.gov/sites/production/files/2015-06/documents/recommended-binational-phosphorus-targets-20150625-8pp.pdf Accessed 4 August, 2016.
Forster, D.L., and J.N. Rausch. 2002. Evaluating agricultural nonpoint source pollution programs in two Lake Erie tributaries. Journal of Environmental Quality 31:24-31.
Fox, G.A., R.A. Purvis, and C.J. Penn. 2016. Streambanks: A net source of sediment and phosphorus to streams and rivers. Journal of Environmental Management 181:602-614.
Gakstatter, J.H., A.F. Bartsch, and C.A. Callahan. 1978. The impact of broadly applied effluent phosphorus standards on eutrophication control. Water Resources Research 14:1155-1158.
Gassman, P.W., M.R. Reyes, C.H. Green, and J.G. Arnold. 2007. The Soil and Water Assessment Tool: Historical development, applications, and future research directions. Transactions of the American Society of Agricultural and Biological Engineers 50(4):122-1250.
Gassman, P.W., J.R. Williams, S. Wang, A. Saleh, E. Osei, L. Hauck, C. Izaurralde, and J. Flowers. 2009. The agricultural policy environmental extender (APEX) model: An emerging tool for landscape and watershed environmental analyses. Technical Report 09-TR 49. CARD, Iowa State University, Ames, IA. Available at: http://www.card.iastate.edu/publications/synopsis.aspx?id=1101.
Gassman, P.W., J.R. Williams, S. Wang, A. Saleh, E. Osei, L. Hauck, C. Izaurralde, and J. Flowers. 2010. The agricultural policy environmental Extender (APEX) model: An emerging tool for landscape and watershed environmental analyses. Transactions of the American Society of Agricultural and Biological Engineers 711-740.
Gianessi, L.P., and H.M. Peskin. 1984. An Overview of the RFF Environmental Data Inventory – Methods and preliminary Results. Resources for the Future, Washington, D.C. 111pp.
Gobler, C.J., J.M. Burkholder, T.W. Davis, M.J. Harke, T. Johengen, C.A. Stow, D.B. Van de Waal. 2016. The dual role of nitrogen supply in controlling the growth and toxicity of cyanobacterial blooms. Harmful Algae 54:87-97.
Grizzetti, B., F. Bouraoui, G. de Marsily, and G. Bidoglio. 2005. A statistical method for source apportionment of riverine nitrogen loads. Journal of Hydrology 304:302-315.
Grover, V.I., and G. Krantzberg. 2015. Transboundary water management: Lessons learnt from North America. Water International 40:183-198.
Han, H., J.D. Allan, and N.S. Bosch. 2012. Historical pattern of phosphorus loading to Lake Erie watersheds. Journal of Great Lakes Research 38:289-298.
Harmel, R.D., R.J. Cooper, R.M. Slade, R.L. Haney, and J.G. Arnold. 2006. Cumulative uncertainty in measured streamflow and water quality data for small watersheds. Transaction of the American Society of Agricultural and Biological Engineers 49(3):689−701.
Hawley, N., T.H. Johengen, Y.R. Rao, S.A. Ruberg, D. Beletsky, S.A. Ludsin, B.J. Eadie, D.J. Schwab, T.E. Croley, and S.B. Brandt. 2006. Lake Erie hypoxia prompts Canada-US study. EOS Transactions, American Geophysical Union 87:313-324.
57
Haygarth, P.M., H.P. Jarvie, S.M. Powers, A.N. Sharpley, J.J. Elser, J. Shen, H.M. Peterson, N-I Shan, N.J.K. Howden, T. Burt, F. Worrall, F. Zhang, and X. Liu. 2014. Sustainable phosphorus management and the need for a long-term perspective: The legacy hypothesis. Environmental Science and Technology 8419.
Her, Y., I. Chaubey, J. Frankenburger, and D. Smith. 2016. Effect of conservation practices implemented by USDA programs at field and watershed scales. Journal of Soil and Water Conservation 71:249-266.
Ho, J.C., and A.M. Michalak. 2017. Phytoplankton blooms in Lake Erie impacted by both long-term and springtime phosphorus loading. Journal of Great Lakes Research 43:221-228.
Homer, C., J. Dewitz, J. Fry, M. Coan, N. Hossain, C. Larson, N. Herold, A. McKerrow, J.N. VanDriel, and J. Wickman. 2007. Completion of the 2001 National Land Cover Database for the Conterminous United States. Photogrammetric Engineering and Remote Sensing 73:337-341.
Huber, W., and R. Dickinson. 1988. Stormwater management model. Version 4 Part A. User’s Manual. U.S. Environmental Protection Agency. Office of Research and Development. EPA/600/3-88/001a.
IJC (International Joint Commission). 1970. Pollution of Lake Erie, Lake Ontario and the International Section of the St. Lawrence River. 105 pp.
IJC (International Joint Commission). 1982. First Biennial Report under the Great Lakes Water Quality Agreement of 1978. 37 pp.
IJC (International Joint Commission). 2009. Great Lakes Water Quality Agreement Priorities 2007-09 Series. Eutrophication Advisory Work Group Report on Eutrophication, 2009, IJC Special Publication 2009-02, Windsor, ON.
IJC (International Joint Commission). 2014. A Balanced Diet for Lake Erie: Reducing Phosphorus Loadings and Harmful Algal Blooms. Report of the Lake Erie Ecosystem Priority, Washington, D.C., and Ottawa, Ontario, 100 pp.
Izaurralde, R.C., J.R. Williams, W.B. McGill, N.J. Rosenberg, and M.C. Quiroga Jakas. 2006. Simulating soil C dynamics with EPIC: Model description and testing against long-term data. Ecological Modelling 192:362-384.
Jackson, C.R, J.K. Martin, D.S. Leigh, and L.T. West. 2005. A southeastern piedmont watershed sediment budget: Evidence for a multi-millennial agricultural legacy. Journal of Soil and Water Conservation 60:298-310.
Jarvie, H.P., L.T. Johnson, A.N. Sharpley, D.R. Smith, D.B. Baker, T. Bruulsema, and R. Confesor. 2017. Increased soluble phosphorus loads to Lake Erie: Unintended consequences of conservation practices? Journal of Environmental Quality. 46:123-132.
Jarvie, H.P., A.N. Sharpley, D. Flaten, P.J.A. Kleinman, A. Jenkins, and T. Simmons. 2015. The pivotal role of phosphorus in a resilient water-energy-food security nexus. Journal of Environmental Quality 44:1049-1062.
Jarvie, H.P, A.N. Sharpley, J.T. Scott, B.E. Haggard, M.J. Bowes, and L.B. Massey. 2012. Within-river phosphorus retention: Accounting for a missing piece in the watershed phosphorus puzzle. Environmental Science and Technology 46:13284-13292.
Jarvie, H.P., A.N. Sharpley, P.J.A. Withers, J.T. Scott, B.E. Haggard, and C. Neal. 2013a. Phosphorus mitigation to control river eutrophication: Murky waters, inconvenient truths and “postnormal” science. Journal of Environmental Quality 42:295-304.
Jarvie, H.P., A.N. Sharpley, B. Spears, A.R. Buda, L. May, and P.J.A. Kleinman. 2013b. Water quality remediation faces unprecedented challenges from “legacy phosphorus.” Environmental Science and Technology 47:8997-8998.
Joosse, P.J., and D.B. Baker. 2011. Context for re-evaluating agricultural source phosphorus loadings to the Great Lakes. Canadian Journal of Soil Science 91:317-327.
Jurado, A., A.V. Borges, and S. Brouyère. 2017. Dynamics and emissions of N2O in groundwater: A review. Science of the Total Environment 584-585:207-218.
Kamh, M., W.J. Horst, F. Amer, H. Mostafa, and P. Maier. 1999. Mobilization of soil and fertilizer phosphate by cover crops. Plant and Soil 211:19-27.
Kane, D.D., J.D. Conroy, R.P. Richards, D.B. Baker, and D.A. Culver. 2014. Re-eutrophication of Lake Erie: Correlations between tributary nutrient loads and phytoplankton biomass. Journal of Great Lakes Research 40:496-501.
Keitzer, S.C., S.A. Ludsin, S.P. Sowa, G. Annis, J.G. Arnold, P. Daggupati, A.M. Froelich, M.E. Herbert, M.V.V. Johnson, A.M. Sasson, H. Yen, M.J. White, and C.A. Rewa. 2016. Thinking outside of the lake: Can controls on nutrient inputs into Lake Erie benefit stream conservation in its watershed? Journal of Great Lakes Research 42:1322-1331.
Kemp, A.L.W., T.W. Anderson, R.L. Thomas, and A. Mudrochova. 1974. Sedimentation rates and recent sediment history of Lakes Ontario, Erie, and Huron. Journal of Sedimentary Petrology 44:207-218.
58
Kern, J.S., and M.G. Johnson. 1993. Conservation tillage impacts on national soil and atmospheric carbon levels. Soil Science Society of America Journal 57:200-210.
King, K.W., M.R. Williams, and N.R. Fausey. 2016. Effect of crop type and season on nutrient leaching to tile drainage under a corn-soybean rotation. Journal of Soil and Water Conservation 71: 56-68.
King, K.W., M.R. Williams, L.T. Johnson, D.R. Smith, G.A. LaBarge, and N.R. Fausey. 2017. Phosphorus availability in Western Lake Erie Basin drainage waters: Legacy evidence across spatial scales. Journal of Environmental Quality 46:466-469.
King, K.W., M.R. Williams, M.L. Macrae, N.R. Fausey, J. Frankenberger, D.R. Smith, P.J.A. Kleinman, and L.C. Brown. 2015. Phosphorus transport in agricultural subsurface drainage: A review. Journal of Environmental Quality 44: 467-485.
Kleinman, P.J.A., A.N. Sharpley, A.R. Buda, R.W. McDowell, A.L. Allen. 2011a. Soil controls of phosphorus runoff: Management barriers and opportunities. Canadian Journal of Soil Science 91:329-338.
Kleinman, P.J.A., A.N. Sharpley, R.W. McDowell, D.N. Flaten, A.R. Buda, L. Tao, L. Bergstrom, and Q. Zhu. 2011b. Managing agricultural phosphorus for water quality protection: Principles for progress. Plant and Soil 349:169-182.
Kleinman, P.J.A., A.N. Sharpley, L.S. Saporito, A.R. Buda, and R.B. Bryant. 2009. Application of manure to no-till soils: Phosphorus losses by sub-surface and surface pathways. Nutrient Cycling in Agroecosystems 84:215-227.
Kleinman, P.G.A., A.N. Sharpley, P.J.A. Withers, L. Bergstrom, L.T. Johnson, and D.G. Doody. 2015. Implementing agricultural phosphorus science and management to combat eutrophication. Ambio 44:S297-S310.
Kormondy, E.J. 1970. Lake Erie is aging, but effort can save it from death. Smithsonian 1:26-35.
Kott, P.S. 2001. The delete a group jackknife. Journal of Official Statistics 17:521-526.
Lal, R. 2004. Soil carbon sequestration impacts on global climate change and food security. Science 304:1623-1627.
Lal, R., F. Follett, B.A. Stewart, and J.M. Kimble. 2007. Soil carbon sequestration to mitigate climate change and advance food security. Soil Science 172:943-956.
LaMP (Lake Erie Lakewide Management Plan) 2000. Available online at https://www.epa.gov/sites/production/files/2015-10/documents/lake-erie-lamp-2000-267pp.pdf Accessed August 18, 2016.
Langlois, T.H. 1954. The Western End of Lake Erie and its Ecology. J. Edwards Publishing Company. Ann Arbor, Michigan, 479 pp.
Lee, G.F. 1973. Role of phosphorus in eutrophication and diffuse source control. Water Research 7:111-128.
Levy, S. 2017. Microcystis rising: Why phosphorus isn’t enough to stop cyanoHABs. Environmental Health Perspectives 125:A34-A39.
Liu, J., Y. Hu, J. Yang, D. Abdi, and B.J. Cade-Menun. 2014. Investigation of soil legacy phosphorus transformation in long-term agricultural fields using sequential fractionation, P K-edge XANES and solution P NMR spectroscopy. Environmental Science and Technology 49:168-176.
Ludsin, S.A., M.W. Kershner, K.A. Blocksom, R.L. Knight, and R.A. Stein. 2001. Life after death in Lake Erie: Nutrient controls drive fish species richness, rehabilitation. Ecological Applications 11:731-746.
Lundgren, J.G., and J.K. Fergen. 2011. Enhancing predation of a subterranean insect pest: A conservation benefit of winter vegetation in agroecosystems. Applied Soil Ecology 51: 9-16.
Maccoux, M.J., A. Dove, S.M. Backus, and D.M. Dolan. 2016. Total and soluble reactive phosphorus loadings to Lake Erie: A detailed accounting by year, basin, country, and tributary. Journal of Great Lakes Research 42:1151-1165.
Maguire, R.O., P.J.A. Kleinman, C.J. Dell, D.B. Beegle, R.C. Brandt, J.M. McGrath, and Q.M. Ketterings. 2011. Manure application technology in reduced tillage and forage systems: A review. Journal of Environmental Quality 40:292-301.
Makarewicz, J.C., and P. Bertram. 1991. Evidence for the restoration of the Lake Erie ecosystem – Water quality, oxygen levels, and pelagic function appear to be improving. Bioscience 41:216-223.
Maki, A.W., D.B. Porcella, and R.H. Wendt. 1984. The impact of detergent phosphorus bans on receiving water-quality. Water Research 18: 893-903.
Marcillo, G.S., and F.E. Miguez. 2017. Corn yield response to winter cover crops: An updated meta-analysis. Journal of Soil and Water Conservation 72:226-239.
59
Marton, J.M., M.S. Fennessy, and C.B. Craft. 2014. USDA Conservation practices increase carbon storage and water quality improvement functions: An example from Ohio. Restoration Ecology 22:117-124.
Matisoff, G., and M.L. Carson. 2014. Sediment resuspension in the Lake Erie nearshore. Journal of Great Lakes Research 40:532-540.
Matisoff, G., and J.J.H. Ciborowski. 2005. Lake Erie trophic status collaborative study. Journal of Great Lakes Research 31:1-10.
Matisoff, G., E.M. Kaltenberg, R.L. Steely, S.K. Hummel, J. Seo, K.J. Gibbons, T.B. Bridgeman, Y. Seo, M. Behbahani, W.F. James, L.T. Johnson, P. Doan, M. Dittrich, M.A. Evans, and J.D. Chaffin. 2016. Internal loading of phosphorus in western Lake Erie. Journal of Great Lakes Research 42:775-788.
Maupin, M.A., and T. Ivahnenko. 2011. Nutrient loadings to streams of the continental United States from municipal and industrial effluent. Journal of American Water Resources Association 47:950-964.
McDowell, R.W., A.N. Sharpley, and P.J.A. Kleinman. 2002. Integrating phosphorus and nitrogen decision management at watershed scales. Journal of the American Water Resources Association 38(2):479-491.
McLaughlin, A., and P. Mineau. 1995. The impact of agricultural practices on biodiversity. Agriculture, Ecosystems, and Environment 55:201-212.
Meals, D.W., S.A. Dressing, and T.E. Davenport. 2010. Lag time in water quality response to best management practices: A review. Journal of Environmental Quality 39:85-96.
Merten, G.H., H.L. Welch, and M.D. Tomer. 2016. Effets of hydrology, watershed size, and agricultural practices on sediment yields in two river basins in Iowa and Mississippi. Journal of Soil and Water Conservation 71:267-278.
Michalak, A.M., E.J. Anderson, D. Beletsky, S. Boland, N.S. Bosch, T.B. Bridgeman, J.D. Chaffin, K. Cho, R. Confesor, et al. 2013. Record-setting algal bloom in Lake Erie caused by agricultural and meteorological trends consistent with expected future conditions. PNAS 110:6448-6452.
Miltner, R.J. 2015. Measuring the contribution of agricultural conservation practices to observed trends and recent condition in water quality indicators in Ohio, USA. Journal of Environmental Quality 44:1821-1831.
Mittelstet, A.R., and D.E. Storm. 2016. Quantifying legacy phosphorus using a mass balance approach and uncertainty analysis. Journal of the American Water Resources Association 52:1297-1310.
Muenich, R.L., M. Kalcic, and D. Scavia. 2016. Evaluating the impact of legacy P and agricultural conservation practices on nutrient loads from the Maumee River Watershed. Environmental Science and Technology 50:8146-8154.
Neitsch, S.L., J.G. Arnold, J.R. Kiniry, and J.R. Williams. 2002. Soil and Water Assessment Tool (Version 2002). Theoretical documentation. Grassland, Soil, and Water Research Laboratory, Blackland Research Center, Temple, Texas.
Némery, J., and J. Garnier. 2016. The fate of phosphorus. Nature Geoscience 9:343-344.
Ohio Lake Erie Phosphorus Task Force. 2010. Ohio Lake Erie phosphorus task force final report. Ohio Environmental Protection Agency, Division of Surface Water. 109 pp. Available online: http://epa.ohio.gov/portals/35/lakeerie/ptaskforce/Task_Force_Final_Report_April_2010.pdf Accessed 30 October, 2015.
OLEC (Ohio Lake Erie Commission). 2004. State of the lake report, Lake Erie quality index. Ohio Lake Erie Commission, Toledo, Ohio, 80pp.
OTTT (Objectives and Targets Task Team). 2015. Recommended phosphorus loading targets. Annex 4 Objectives and Targets Task Team Final Report to the Nutrient Annex Subcommittee. Available online at https://www.epa.gov/sites/production/files/2015-06/documents/report-recommended-phosphorus-loading-targets-lake-erie-201505.pdf Accessed June 19, 2017.
Paerl, H.W., W.S. Gardner, K.E. Havens, A.R. Joyner, M.J. McCarthy, S.E. Newell, B. Qin, and J.T. Scott. 2016a. Mitigating cyanobacterial harmful algal blooms in aquatic ecosystems impacted by climate change and anthropogenic nutrients. 2016. Harmful Algae 54:213-222.
Paerl, H.W., J.T. Scott, M.J. McCarthy, S.E. Newell, W.S. Gardner, K.E. Havens, D.K. Hoffman, S.W. Wilhelm, and W.A. Wurtsbaugh. 2016b. It takes two to tango: When and where dual nutrient (N & P) reductions are needed to protect lakes and downstream ecosystems. Environmental Science & Technology 50:10805-10813.
Paytan, A., K. Roberts, S. Watson, S. Peek, P.C. Chuang, D. Defforey, and C. Kendall. 2017. Internal loading of phosphorus in Lake Erie Central Basin. Science of the Total Environment 579:1356-1365.
Pease, L.A., N.R. Fausey, J.F. Martin, and L.C. Brown. 2017. Projected climate change effects on subsurface drainage and the performance of controlled drainage in the Western Lake Erie Basin. Journal of Soil and Water Conservation 72:240-250.
60
Pennuto, C.M., L.E. Burlakova, A.Y. Karatayev, J. Kramer, A. Fischer, and C. Mayer. 2014b. Spatiotemporal characteristics of nitrogen and phosphorus in the benthos of nearshore Lake Erie. Journal of Great Lakes Research 40:541-549.
Pennuto, C.M., D.D. Kane, L. Dayton, and T.B. Bridgeman. 2014a. Lake Erie nutrients: From watersheds to open water. Journal of Great Lakes Research 40:469-472.
Pitt, R.E., S.E. Clark, and D.W. Lake. 2007. Construction site erosion control: Planning, design, and control. Desteetch Publications Inc., Lancaster, Pennsylvania, pp. 1-2.
Powers, S.M., T.W. Bruulsema, T.P. Burt, N.L. Chan, J.J. Elser, P.M. Haygarth, N.J.K. Howden, H.P. Jarvie, Y. Lyu, H.M. Peterson, A.N. Sharpley, J. Shen, F. Worrall, and F. Zhang. 2016. Long-term accumulation and transport of anthropogenic phosphorus in three river basins. Nature Geoscience 9:353-356.
Records, R.M., E. Wohl, and M. Arabi. 2016. Phosphorus in the river corridor. Earth-Science Reviews 158:65-88.
Richards, R.P., D.B. Baker, and J.P. Crumrine. 2009. Improved water quality in Ohio tributaries to Lake Erie: A consequence of conservation practices. Journal of Soil and Water Conservation 64:200-211.
Richards, R.P., D.B. Baker, and D.J. Eckert. 2002. Trends in agriculture in the LEASEQ watersheds, 1975-1995. Journal of Environmental Quality 31:17-24.
Roberts, W.M., M.I. Stutter, and P.M. Haygarth. 2012. Phosphorus retention and remobilization in vegetated buffer strips: A review. Journal of Environmental Quality 41:389-399.
Robertson, D.M., and D.A. Saad. 2011. Nutrient inputs to the Laurentian Great Lakes by source and watershed estimated using SPARROW watershed models. Journal of the American Water Resources Association 47:1011-1033.
Robinson, C. 2015. Review on groundwater as a source of nutrients to the Great Lakes and their tributaries. Journal of Great Lakes Research 41:941-950.
Rodenhouse, N.L., and L.B. Best. 1983. Breeding ecology of vesper sparrows in corn and soybean fields. American Midland Naturalist 110:265-275.
Rodgers, R.D. 1983. Reducing wildlife losses to tillage in fallow wheat fields. Wildlife Society Bulletin 11:31-38.
Rosa, F., and N.M. Burns. 1987. Lake Erie Central basin oxygen depletion changes from 1929-1980. Journal of Great Lakes Research 13:684-696.
Ross, J.A., M.E. Herbert, S.P. Sowa, J.R. Frankenberger, K.W. King, S.F. Christopher, J.L. Tank, J.G. Arnold, M.J. White, and H. Yen. 2016. A synthesis and comparative evaluation of factors influencing the effectiveness of drainage water management. Agricultural Water Management 178:366-376.
Runkel, R.L., C.G. Crawflord, and T.A. Cohn. 2004. Load estimator (LOADEST): A FORTRAN program for estimating constituent loads in streams and rivers. U.S. Geol. Survey Techniques and Methods, Book 4, Chapter A5. USGS, Reston, VA. Available at http://pubs.usgs.gov/tm/2005/tm4A5/ pdf/508fi nal.pdf. Accessed June 2009.
Santhi, C., N. Kannan, M. White, M. Di Luzio, J.G. Arnold, X. Wang, and J.R. Williams. 2012. An integrated modeling approach for estimating the water quality benefits of conservation practices at river basin scale. Journal of Environmental Quality 43(1):177-198.
Santhi, C., X. Wang, J.G. Arnold, J.R. Williams, M. White, N. Kannan, and M. Di Luzio. 2011. Documentation on Delivery Ratio Used for CEAP Cropland Modeling for Various River Basins in the United States. Grassland, Soil and Water Research Laboratory, USDA-ARS, Temple, TX and Texas AgriLife Research-Blackland Research and Extension Center, Temple, Texas.
Scavia, D., J.D. Allan, K.K. Arend, S. Bartell, D. Beletsky, N.S. Bosch, S.B. Brandt, R.D. Briland, I. Daloğlu, J.V. DePinto, D.M. Dolan, M.A. Evans, T.M. Farmer, D. Goto, H. Han, T.O. Höök, R. Knight, S.A. Ludsin, D. Mason, A.M. Michalak, R.P. Richards, J.J. Roberts, D.K. Rucinski, E. Rutherford, D.J. Schwab, T.M. Sesterhenn, H. Zhang, and Y. Zhou. 2014. Assessing and addressing the re-eutrophication of Lake Erie: Central basin hypoxia. Journal of Great Lakes 40:226-246.
Schipanski, M.E., M. Barbercheck, M.R. Douglas, D.M. Finney, K. Haider, J.P. Kaye, A.R. Kemanian, D.A. Mortensen, M.R. Ryan, J. Tooker, and C. White. 2014. A framework for evaluating ecosystem services provided by cover crops in agroecosystems. Agricultural Systems 125:12-22.
Schueler, T. 1997. Impact of suspended and deposited sediment. Article 14, pp. 64-65. In: T.R. Schueler and H.K. Holland, eds., The practice of watershed protection. Center for Watershed Protection. Ellicott City, Maryland.
61
Schulte, R.P.O., A.R. Melland, O. Fenton, M. Herlihy, K. Richards, and P. Jordan. 2010. Modelling soil phosphorus decline: Expectations of Water Framework Directive policies. Environmental Science and Policy 6:472-484.
Sebilo, M., B. Mayer, B. Nicolardot, G. Pinay, and A. Marriotti. 2013. Long-term fate of nitrate fertilizer in agricultural soils. Proceedings of the National Academy of Sciences of the United States of America 110:18185-18189.
Sharpley, A. 2016. Managing agricultural phosphorus to minimize water quality impacts. Scientia Agricola 73:1-8.
Sharpley, A.N., L. Bergstrom, H. Aronsson, M. Bechmann, C.H. Bolster, K. Borling, F. Djodjic, H.P. Jarvie, O.F. Schoumans, C. Stamm, K.S. Tonderski, B. Ulen, R. Uusitalo, and PJ.A. Withers. 2015. Future agriculture with minimized phosphorus losses to waters: Research needs and direction. Ambio 44:S163-179.
Sharpley, A.N., B. Foy, and P. Withers. 2000. Practical and innovative measures for the control of agricultural phosphorus losses to water: An overview. Journal of Environmental Quality 29:1-9.
Sharpley, A., H.P. Jarvie, A. Buda, L. May, B. Spears, and P. Kleinman. 2013. Phosphorus legacy: Overcoming the effects of past management practices to mitigate future water quality impairment. Journal of Environmental Quality 42:1308-1326.
Sharpley, A.N., P.J.A. Kleinman, P. Jordan, L. Bergström, and A.L. Allen. 2009. Evaluating the success of phosphorus management from field to watershed. Journal of Environmental Quality 38:1981-1988.
Sharpley, A., P. Richards, S. Herron, and D. Baker. 2012. Case study comparison between litigated and voluntary nutrient management strategies. Journal of Soil and Water Conservation 67:442-450.
Skaggs, R.W., N.R. Fausey, and R.O. Evans. 2012. Drainage water management. Journal of Soil and Water Conservation 67:167A-172A.
Skaggs, R.W., M.A. Youssef, J.W. Gilliam, and R.O. Evans. 2010. Effect of controlled drainage on water and nitrogen balances in drained lands. Transactions of the American Society of Agricultural and Biological Engineers 53:1843-1850.
Smith, D.R., K.W. King, and M.R. Williams. 2015a. What is causing the harmful algal blooms in Lake Erie? Journal of Soil and Water Conservation 70:27A-29A.
Smith, D.R., W. Francesconi, S.J. Livingtson, and C.H. Huang. 2015b. Phosphorus losses from monitored fields with conservation practices in the Lake Erie Basin, USA. Ambio 44:S319-S331
Smith, D.R., K.W. King, L. Johnson, W. Francesconi, P. Richards, D. Baker, and A.N. Sharpley. 2015c. Surface runoff and tile drainage transport of phosphorus in the Midwestern United States. Journal of Environmental Quality 44:495-502.
Smith, D.R., R.D. Harmel, M. Williams, R. Haney, and K.W. King. 2016. Managing acute phosphorus loss with fertilizer source and placement: Proof of concept. Agricultural and Environmental Letters 1:1-4.
Smith V.H., G.D. Tilman, and J.C. Nekola. 1999. Eutrophication: Impacts of excess nutrient inputs on freshwater, marine, and terrestrial ecosystems. Environmental Pollution 100:179-196.
Snyder, C.S., T.W. Bruulsema, T.L. Jensen, and P.E. Fixen. 2009. Review of greenhouse gas emissions from crop production systems and fertilizer management effects. Agriculture Ecosystems & Environment 133:247-266.
Sohngen, G., S.J. Kim, A. Sam, and K. King. 2013. The implications of environmental policy on nutrient outputs in agricultural watersheds. Selected papers prepared for presentation at that Agricultural Applied Economics Association’s 2013 AAEA CAES Joint Annual Meeting, Washington, D.C., August, 4-6, 2013. Available at http://ageconsearch.umn.edu/bitstream/151215/2/WQ_dailydata_3.pdf Accessed 1 August 1, 2013.
Sperry, K. 1967. Water and air pollution: Two reports on cleanup efforts. Science 158:351-355.
Sprague, L.A., R.M. Hirsch, and B.T. Aulenbach. 2011. Nitrate in the Mississippi River and its tributaries, 1980-2008: Are we making progress? Environmental Science and Technology 45:7209-7216.
Srinivasan, R.S., J.G. Arnold, and C.A. Jones. 1998. Hydrologica modeling of the United States with the Soil and Water Assessment Tool. International Journal of Water Resources Development 14:315-325.
Stoliker, D.L., D.A. Repert, R.L. Smith, B. Song, D.R. LeBlanc, T.D. McCobb, C.H. Conaway, S.P. Hyun, D.-C. Koh, H.S. Moon, and D.B. Kent. 2016. Hydrologic controls on nitrogen cycling processes and functional gene abundance in sediments of a groundwater flow-through lake. Environmental Science and Technology 50:3649-3657.
Stow, C.A., Y. Cha, L.T. Johnson, R. Confesor, and R.P. Richards. 2015. Long-term and season trend decomposition of Maumee River nutrient inputs to Wester Lake Erie. Environmental Science and Technology 49:3392-3400.
62
Stumpf, R.P, T.T. Wynne, D.B. Baker, and G.L. Fahnenstiel. 2012. Interannual variability of cyanobacterial blooms in Lake Erie. Plos ONE 7:e42444. 11p. Available at https://www-ncbi-nlm-nih-gov.ezproxy.library.tamu.edu/pmc/articles/PMC3409863/pdf/pone.0042444.pdf Accessed August 19, 2016.
Svendsen, L.M., B.Kronvang, P. Kristensen, and P. Græsbøl. 1995. Dynamics of phosphorus compounds in a lowland river system: Importance of retention and nonpoint sources. Hydrological Processes 9:119-142.
Tayyebi, A., B.C. Pijanowski, and B.K. Pekin. 2015. Land use legacies of the Ohio River Basin: Using a spatially explicit land use change model to assess past and future impacts on aquatic resources. Applied Geography 57:100-111.
Tomer, M.D., and M.A. Locke. 2011. The challenge of documenting water quality benefits of conservation practices: A review of USDA-ARS’s Conservation Effects Assessment Project watershed studies. Water Science and Technology 64:300-310.
Tomer, M.D., E.J. Sadler, R.E. Lizotte, R.B. Bryant, T.L. Potter, M.T. Moore, T.L. Veith, C. Baffaut, M.A. Locke, and M.R. Walbridge. 2014. A decade of conservation effects assessment research by the USDA Agricultural Research Service: Progress overview and future outlook. Journal of Soil and Water Conservation 69:365-373.
Tomer, M.D., K.E. Schilling, C.A. Cambardella, P. Jacobson, P. Drobney. 2010. Groundwater nutrient concentrations during prairie reconstruction on an Iowa landscape. Agriculture, Ecosystems, and the Environment 139:206-213.
USDA (U.S. Department of Agriculture) 2015. Summary Report: 2012 National Resources Inventory, Natural Resources Conservation Service, Washington, D.C. and Center for Survey Statistics and Methodology, Iowa State University, Ames, Iowa. Available online at http://www.nrcs.usda.gov/technical/nri/12summary Accessed August, 22, 2016.
USDA-NRCS (U.S. Department of Agriculture, Natural Resources Conservation Service). 2007. 2003 National Resources Inventory, http://www.nrcs.usda.gov/nri. USDA, National Agricultural Statistics Service. 2009. 2007 Census of Agriculture Database.
USDA-NRCS (U.S. Department of Agriculture, Natural Resources Conservation Service). 2011. Assessment of the Effects of Conservation Practices on Cultivated Cropland in the Great Lakes Region. 174 pages. http://www.nrcs.usda.gov/wps/portal/nrcs/detail/national/technical/nra/ceap/pub/?cid=stelprdb1045403
USDA-NRCS (U.S. Department of Agriculture, Natural Resources Conservation Service) 2016. Effects of Conservation Practice Adoption on Cultivated Cropland Acres in Western Lake Erie Basin, 2003-06 and 2012, 120pp. https://www.nrcs.usda.gov/Internet/FSE_DOCUMENTS/nrcseprd889806.pdf
Vadas, P.S., P.J.A. Kleinman, A.N. Sharpley, and B.L. Turner. 2005. Relating soil phosphorus to dissolved phosphorus in runoff: A single extraction coefficient. Journal of Environmental Quality 34:572-580.
Verduin, J. 1964. Changes in western Lake Erie during the period 1948-1962. International Association of Theoretical and Applied Limnology Communications 15:639-644.
Vollmer-Sanders, C., A. Allman, D. Busdeker, L.B. Moody, and W.G. Stanley. 2016. Building partnerships to scale up conservation:4R Nutrient Stewardship Certification Program in the Lake Erie watershed. Journal of Great Lakes Research 42:1395-1402.
Wang, C., K.-S. Chan, and K.E. Schilling. 2016. Journal of Environmental Quality 45:1351-1358.
Wang, X., N. Kannan, C. Santhi, S.R. Potter, J.R. Williams, and J.G. Arnold. 2011. Integrating APEX output for cultivated cropland with SWAT simulation for regional modeling. Transactions of the American Society of Agricultural and Biological Engineers 54(4):1281-1298.
Watson, S.B., C. Miller, G. Arhonditsis, G.L. Boyer, W. Carmichael, M.N. Charlton, R. Confesor, D.C. Depew, T.O. Höök, S.A. Ludsin, G. Matisoff, S.P. McElmurry, M.W. Murray, R.P. Richards, Y.R. Rao, M.M. Steffen, and S.W. Wilhelm. 2016. The re-eutrophication of Lake Erie: Harmful algal blooms and hypoxia. Harmful Algae 56:44-66.
White, M.J., C. Santhi, N. Kannan, J.G. Arnold, D. Harmel, L. Norfleet, P. Allen, M. Di Luzio, X. Wang, J. Atwood, E. Haney, and M. Johnson. 2014). Nutrient delivery from the Mississippi River to the Gulf of Mexico and effects of cropland conservation. Journal of Soil and Water Conservation Doi:10.2489/jswc.69.1.26.
Williams, J.R. 1980. SPNM, a Model for predicting sediment, phosphorus, and nitrogen yields from agricultural basins. Journal of the American Water Resources Association 16:843–848.
Williams, J.R. 1990. The erosion productivity impact calculator (EPIC) model: A case history. Philosophical Transactions of the Royal Society of London 329:421-428.
Williams, J. R., W. L. Harman, M. Magre, U. Kizil, J.A. Lindley, G. Padmanabhan, and E. Wang. 2006. APEX feedlot water quality simulation. Transactions of the American Society of Agricultural and Biological Engineers 49(1):61-73.
63
Williams, J.R., R.C. Izaurralde, and E.M. Steglich. 2012. Agricultural policy/environmental eXtender model: Theoretical documentation version 0806. Temple, Texas: Texas AgriLife Research, Texas A&M University, Blackland Research and Extension Center. Available at http://epicapex.tamu.edu/files/2014/10/APEX0806-theoretical-documentation.pdf. Accessed January 22, 2016.
Williams, J.R., C.A. Jones, and P.T. Dyke. 1984. A modeling approach to determining the relationship between erosion and soil productivity. Transactions of the American Society of Agricultural and Biological Engineers 27(1):129-144.
Williams, M.R., K.W. King, W. Ford, A.R. Buda, and C.D. Kennedy. 2016. Effect of tillage on macropore flow and phosphorus transport to tile drains. Water Resources Research 52:2868-2882.
Wratten, S.D., M. Gillespie, A. Decourtye, E. Mader, and N. Desneux. 2012. Pollinator habitat enhancement: Benefits to other ecosystem services. Agriculture Ecosystems & Environment 159:112-122.
Wynne, T.T., R.P. Stumpf, M.C. Tomlinson, G.L. Fahnensteil, D.J. Schwab, J. Dyble, and S. Joshi. 2013. Evolution of a cyanobacterial bloom forecast system in western Lake Erie: Development and initial evaluation. Journal of Great Lakes Research 39:90-99.
Xian, G., C. Homer, and J. Fry, 2009. Updating the 2001 National Land Cover Database land cover classification to 2006 by using Landsat imagery change detection methods. Remote Sensing of Environment 113:1133–1147.
Yan, B., M.D. Tomer, and D.E. James. 2010. Historical channel movement and sediment accretion along the South Fork of the Iowa River. Journal of Soil and Water Conservation 65:1-8.
Yen, H., M.J. White, J.G. Arnold, S.C. Keitzer, M.V. Johnson, J.D. Atwood, P. Daggupat, M.E. Herbert, S.P. Sowa, S.A. Ludsin, D.M. Robertson, R. Srinivasan, and C.A. Rewa. 2016. Western Lake Erie Basin: Soft-data-constrained, NHDPlus resolution watershed modeling and exploration of applicable conservation scenarios. Science of the Total Environment 569-570:1265-1281.
Zhang, Q., W.P. Ball, and D.L. Moyer. 2016a. Decadal-scale export of nitrogen, phosphorus, and sediment from the Susquehanna River basin, USA: Analysis and synthesis of temporal and spatial scales. Science of the Total Environment 563-564:1016-1029.
Zhang, H., L. Boegman, D. Scavia, and D.A. Culver. 2016b. Spatial distributions of external and internal phosphorus loads in Lake Erie and their impacts on phytoplankton and water quality. Journal of Great Lakes Research 42:1212-1227.
Zhang, T.Q., C.S. Tan, Z.M. Zheng, T. Welacky, and Y.T. Wang. 2017. Drainage water management combined with cover crop enhances reduction of soil phosphorus loss. Science of the Total Environment 586:362-371.
64
Appendix A: The No-Practice Scenario
Simulating the No-Practice Scenario The purpose of the No-Practice Scenario is to provide an estimate of sediment, nitrogen, and phosphorus losses from cultivated cropland under conditions without the use of conservation practices. The No-Practice Scenario is simulated as if the conservation practices reported to be in use in 2003-06 or 2012 were never adopted. The No-Practice representations derived for use in this study conformed to the following guidelines. • Consistency: It is impossible to know what an individual
farmer would be doing if he or she had not adopted certain practices, so it is important to represent all practices on all sample points in a consistent manner based on the intended purpose of each practice.
• Simplicity: Complex rules for assigning “No-Practice”
activities could lead to complex simulations that are difficult to substantiate and sometimes difficult to explain and accept. Complexity would not only complicate the modeling process but also hamper the interpretation of results.
• Historical context avoided: The No-Practice Scenario is
a technological step backward for conservation, not a chronological step back to a prior era when conservation practices were not used. Although the advent of certain conservation technologies can be dated, the adoption of technology is gradual, regionally diverse, and ongoing. Also, the overall crop mix in the region, which in part reflects 2003-06 and 2012 market forces is not changed in the No-Practice simulation. Therefore, moving the clock back is not the goal of the No-Practice Scenario. Taking away the conservation ethic is the goal.
• Moderation: The No-Practice Scenario should provide a
reasonable level of “poor” conservation so that a believable benefit can be determined, where warranted, but not so severe as to generate exaggerated conservation gains by simulating the worst-case condition. Tremendous benefits could be generated if, for example, nutrients were applied at twice the recommended rates with poor timing or application methods in the No-Practice simulation. Similarly, large erosion benefits could be calculated if the No-Practice representation for tillage was fall plowing with moldboard plows and heavy disking, which was once common but today would generally be considered economically inefficient.
• Maintenance of crop yield or efficacy: It is impossible to
avoid small changes in crop yields, but care was taken to avoid No-Practice representations that would significantly
change crop yields and regional production capabilities. The same guideline was followed for pest control—the suite of pesticides used was not adjusted in the No-Practice Scenario because of the likelihood that alternative pesticides would not be as effective and would result in lower crop yields under actual conditions.
A deliberate effort was made to adhere to these guidelines to the same degree for all conservation practices so that the overall level of representation would be equally moderate for all practices. Table A.1 summarizes the adjustments to conservation practices used in simulation of the No-Practice Scenario. No-Practice representation of structural practices The No-Practice field condition for structural practices is simply the removal of the structural practices from the modeling process. In addition, the soil condition (a model input) is changed from “Good” to “Poor” for the determination of the runoff curve number for erosion prediction in the model. Overland flow. This group of practices includes terraces and contouring, which slow the flow of water across the field. For the practices affecting overland flow of water and therefore the P factor of the USLE-based equations, the P factor was increased to 1. Slope length is also changed for practices such as terraces to reflect the absence of these slope-interrupting practices. Concentrated flow. This group of practices is designed to address channelized flow and includes grassed waterways and grade stabilization structures. These practices are designed to prevent areas of concentrated flow from developing gullies or to stabilize gullies that have developed. The No-Practice protocol for these practices removes the structure or waterway and replaces it with a “ditch” as a separate subarea. This ditch, or channel, represents a gully; however, the only sediment contributions from the gully come from simulated downcutting processes. Dynamics associated with headcutting and sloughing of the sides are not simulated in APEX. Edge-of-field. These practices include buffers, filters, and other practices that occur outside the primary production area and act to mitigate the losses from the field. The No-Practice protocol removes these areas and their management. When the practices are removed, the slope length is also restored to the undisturbed length that it would be if the practices were not in place. (When simulating a buffer in APEX, the slope length reported in the NRI is adjusted.)
65
Wind control. Practices such as windbreaks or shelterbelts, cross wind ridges, stripcropping or trap strips, and hedgerows are examples of practices used for wind control. The unsheltered distance reflects the dimensions of the field as modeled, 400 meters or 1,312 feet. Any practices reducing the unsheltered distance are removed and the unsheltered distance is set to 400 meters. No-Practice representation of conservation tillage The No-Practice tillage protocols are designed to remove the benefits of conservation tillage. For all crops grown with some kind of reduced tillage, including cover crops, the No-Practice Scenario simulates conventional tillage, based on the STIR (Soil Tillage Intensity Rating) value. Conventional tillage for the purpose of estimating conservation benefits is defined as any crop grown with a STIR value above 80. (To put this in context, no-till or direct seed systems have a STIR of less than 20, and that value is part of the technical standard for Residue Management, No-Till/Strip Till/Direct Seed [NRCS Practice Standard 329]). Those crops grown with a STIR value of less than 80 in the baseline Conservation Condition had tillage operations added in the No-Practice Scenario. Simulating conventional tillage for crops with a STIR value of less than 80 requires the introduction of additional tillage operations in the field operations schedule. For the No-Practice Scenario, two consecutive tandem disk operations were added prior to planting. In addition to adding tillage, the hydrological condition for assignment of the runoff curve number was changed from good to poor on all points receiving additional tillage. Points that are reported to be conventionally tilled for all crops in a given Conservation Condition or Scenario are also modeled with a “poor” hydrological condition curve number. The most common type of tillage operation in the survey was disking, and the most common disk used was a tandem disk for nearly all crops, in all parts of the region, and for both dryland and irrigated agriculture. The tandem disk has a STIR value of 39 for a single use. Two consecutive disking operations will add 78 to the existing tillage intensity, which allows for more than 90 percent of the crops to exceed a STIR of 80 and yet maintain the unique suite and timing of operations for each crop in the rotation. These additional two tillage operations were inserted in the simulation one week prior to planting, one of the least vulnerable times for tillage operations because it is close to the time when vegetation will begin to provide cover and protection. No-Practice representation of cover crops The No-Practice protocol for this practice removes the planting of the crop and all associated management practices such as tillage and fertilization. In a few cases the cover crops were grazed; when the cover crops were removed so were the grazing operations.
No-Practice representation of irrigation practices The No-Practice irrigation protocols were designed to remove the benefits of better water management and the increased efficiencies of modern irrigation systems. Irrigation efficiencies are represented in APEX by a combination of three coefficients that recognize water losses from the water source to the field, evaporation losses with sprinkler systems, percolation losses below the root-zone during irrigation, and runoff at the lower end of the field. These coefficients are combined to form an overall system efficiency that varies with soil type and land slope. The quantity of water applied for all scenarios was simulated in APEX using an “auto-irrigation” procedure that applied irrigation water when the degree of plant stress exceeded a threshold. “Auto-irrigation” amounts were determined within pre-set single event minimums and maximums, and an annual maximum irrigation amount. APEX also used a pre-determined minimum number of days before another irrigation event regardless of plant stress. In the No-Practice representation, all conservation practices, such as Irrigation Water Management and Irrigation Land Leveling, were removed and samples with pressurized systems, such as center pivot, side roll, and low flow (drip), were changed to “hand move sprinklers,” which represents an early form of pressure system. The “Big Gun” systems, which comprise 9.1 percent of the irrigated acres, are by and large already less efficient than the “hand move sprinklers,” and most were not converted. However, 1.3 percent of the irrigated acres served by “Big Gun” systems are more efficient than the “hand move sprinklers,” and these were converted in the No-Practice representation. “Open discharge” gravity systems are used on approximately 5,300 acres or 2.5 percent of the irrigated area. The No-Practice representation of gravity systems would use a ditch system with portals which is more efficient than the open discharge configuration, so these also were not converted. For the No-Practice Scenario, the percentage of irrigated acreage with hand-move lines with impact sprinkler heads was increased to 89.7 percent (from 43.9 percent in the baseline Conservation Condition); 7.8 percent retained the Big Gun systems that were in use, and 2.5 percent were simulated with open discharge flood irrigation. No-Practice representation of nutrient management practices The No-Practice nutrient management protocols are designed to remove the benefits of proper nutrient management techniques. The NRCS Nutrient Management standard (590) allows a variety of methods to reduce nutrient losses while supplying a sufficient amount of nutrient to meet realistic crop yield goals. The standard addresses nutrient loss in one of two primary ways: (1) by altering rates, form, timing, and methods of application, or (2) by installing buffers, filters, or erosion or
66
runoff control practices to reduce mechanisms of loss. The latter method is covered by the structural practices protocols for the No-Practice Scenario. The goals of the nutrient management No-Practice protocols are to alter three of the four basic aspects of nutrient application—rate, timing, and method. The form of application was not addressed because of the inability to determine if proper form was being applied. Nitrogen rate. For the No-Practice Scenario, the amount of commercial nitrogen fertilizer applied was: • increased to 1.98 times harvest removal for non-legume
crops receiving less than or equal to 1.40 times the amount of nitrogen removed at harvest in the baseline scenario, except for cotton and small grain crops;
• increased to 2.0 times harvest removal for small grain crops receiving less than or equal to 1.60 times the amount of nitrogen removed at harvest in the baseline scenario; and
• increased to 90 pounds per bale for cotton crops receiving less than 60 pounds of nitrogen per bale in the baseline scenario.
The ratio of 1.98 for the increased nitrogen rate was determined by the average application-rate-to-crop yield-removal ratio for crops exceeding the application-removal ratio of 1.4. Where nitrogen was applied in multiple applications, each application was increased proportionately. For sites receiving manure, the threshold for identifying good management was the total nitrogen application rate, both manure and fertilizer, and both fertilizer and manure were increased proportionately to reach the No-Practice Scenario rate. The assessment for using appropriate nitrogen application rates was made on an average annual basis for each crop in the rotation using average annual model output on nitrogen removed with the crop yield at harvest in the baseline Conservation Condition scenario. Phosphorus rate. The threshold for identifying proper phosphorus application rates was 1.2 times the amount of phosphorus taken up by all the crops in rotation and removed at harvest. The lower threshold for phosphorus was used because phosphorus is not lost through volatilization to the atmosphere and much less is lost through other pathways owing to strong bonding of phosphorus to soil particles. For the No-Practice Scenario, the amount of commercial phosphorus fertilizer applied was increased to 2 times the harvest removal rate. For crops receiving manure, any increase in phosphorus from manure added to meet the nitrogen criteria for No-Practice was taken into account in setting the No-Practice application rate. However, no adjustment was made to manure applied at rates below the phosphorus threshold because the appropriate manure rate was based on the nitrogen level in the manure. The ratio of 2 for the increased phosphorus rate was determined by the average application-rate-to-crop-yield-removal ratio for crops with phosphorus applications exceeding 1.2 times the amount of phosphorus taken up by all the crops in rotation and
7 The APEX model can simulate pesticide applications, but it does not currently include a pest population model that would allow simulation of the effectiveness of pest management practices. Thus, the relative effectiveness of
removed at harvest. Multiple commercial phosphorus fertilizer applications were increased proportionately to meet the threshold. Timing of application. Nutrients applied closest to the time when a plant needs them are the most efficiently utilized and least likely to be lost to the surrounding environment. All commercial fertilizer applications occurring within 3 weeks prior to planting, at planting, or within 60 days after planting were moved back to 3 weeks prior to planting for the No-Practice Scenario. For example, split applications that occur within 60 days after planting are moved to a single application 3 weeks before planting. Timing of manure applications was not adjusted in the No-Practice Scenario. Method of application. Nutrient applications, including manure applications, which were incorporated or banded were changed to a surface broadcast application method. No-Practice representation of pesticide management practices Pesticide management for conservation purposes is a combination of three types of interrelated management activities: 1. A mix of soil erosion control practices that retain pesticide
residues within the field boundaries. 2. Pesticide use and application practices that minimize the
risk that pesticide residues pose to the surrounding environment.
3. The practice of Integrated Pest Management (IPM), including partial field applications and spot treatment.
The first activity is covered by the No-Practice representation of structural practices and residue and tillage management. The second activity, for the most part, cannot be simulated in large-scale regional modeling because of the difficulty in assuring that any changes in the types of pesticides applied or in the method or timing of application would provide sufficient protection against pests to maintain crop yields.7 Farmers, of course, have such options, and environmentally conscientious farmers make tradeoffs to reduce environmental risk. But without better information on the nature of the pest problem both at the field level and in the surrounding area, modelers have to resort to prescriptive and generalized approaches to simulate alternative pesticides and application techniques, which would inevitably be inappropriate for many, if not most, of the acres simulated. The No-Practice representation for pesticide management is therefore based on the third type of activity—practicing IPM. One of the choices for methods of pesticide application on the survey was “spot treatment.” Typically, spot treatments apply to a small area within a field and are often treated using a hand-held sprayer. Spot treatment is an IPM practice, as it requires
pesticide substitution or changes in other pest management practices cannot be evaluated.
67
scouting to determine what part of the field to treat and avoids treatment of parts of the field that do not have the pest problem. The reported rate of application for spot treatments was the rate per acre treated. For the baseline simulation, it was assumed that all spot treatments covered 5 percent of the field. Since the APEX model run and associated acreage weight for the sample point represented the whole field, the application rate was adjusted downward to 5 percent of the per-acre rate reported for the baseline scenario. For the No-Practice Scenario, the rate as originally reported was used, simulating treatment of the entire field rather than 5 percent of the field. In the region, there were four sample points with spot treatments, representing less than 1 percent of cropped acres. Partial field treatments were simulated in a manner similar to spot treatments. For the baseline scenario, application rates were reduced proportionately according to how much of the field was treated. For the No-Practice Scenario, the rate as reported in the survey was used, simulating treatment of the entire field. However, this adjustment for the No-Practice Scenario was only done for partial field treatments less than one-third of the field, as larger partial field treatments could have been for reasons unrelated to IPM. In the region, there were eight sample points with partial field treatments, representing about 1 percent of cropped acres. The IPM indicator, described in the previous chapter, was used to adjust pesticide application methods and to increase the frequency of applications to represent “no IPM practice.” For samples classified as having either high or moderate IPM use, all soil-incorporated pesticide applications reported to be in use in a Conservation Condition were changed to surface applications in the No-Practice Scenario. For high IPM cases, the first application event between planting and 30 days before harvest was replicated twice for each crop, one week and two weeks after its original application. For moderate IPM cases, the first application event was replicated one time for each crop, one week after its original application. No-Practice representation of land in long-term conserving cover The No-Practice representation of land in long-term conserving cover is cultivated cropping with no conservation practices in use. For each CRP sample point, a set of cropping simulations was developed to represent the probable mix of management that would be applied to the point if it were cropped. Cropped sample points were matched to each CRP sample point on the basis of slope, soil texture, soil hydrologic group, and geographic proximity. The cropped sample points that matched most closely were used to represent the cropped condition that would be expected at each CRP sample point if the field had not been enrolled in CRP. In most cases, seven “donor” points were used to represent the crops that were grown and the various management activities to represent crops and management for the CRP sample point “as if” the acres had not been enrolled in CRP. The crops and management activities of each donor crop sample were combined with the site and soil characteristics of the CRP point for the No-Practice representation of land in long-term conserving cover.
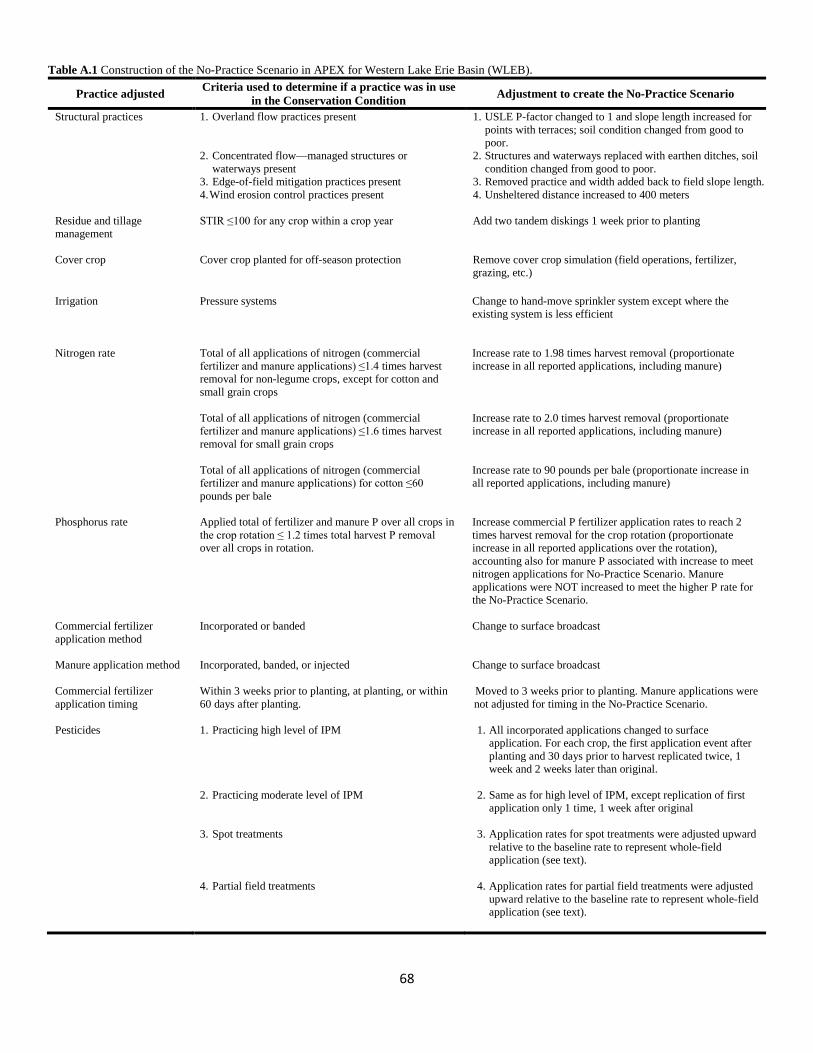
68
Table A.1 Construction of the No-Practice Scenario in APEX for Western Lake Erie Basin (WLEB).
Practice adjusted Criteria used to determine if a practice was in use in the Conservation Condition Adjustment to create the No-Practice Scenario
Structural practices 1. Overland flow practices present 2. Concentrated flow—managed structures or
waterways present 3. Edge-of-field mitigation practices present 4. Wind erosion control practices present
1. USLE P-factor changed to 1 and slope length increased for points with terraces; soil condition changed from good to poor.
2. Structures and waterways replaced with earthen ditches, soil condition changed from good to poor.
3. Removed practice and width added back to field slope length. 4. Unsheltered distance increased to 400 meters
Residue and tillage management
STIR ≤100 for any crop within a crop year
Add two tandem diskings 1 week prior to planting
Cover crop
Cover crop planted for off-season protection Remove cover crop simulation (field operations, fertilizer, grazing, etc.)
Irrigation Pressure systems
Change to hand-move sprinkler system except where the existing system is less efficient
Nitrogen rate
Total of all applications of nitrogen (commercial fertilizer and manure applications) ≤1.4 times harvest removal for non-legume crops, except for cotton and small grain crops Total of all applications of nitrogen (commercial fertilizer and manure applications) ≤1.6 times harvest removal for small grain crops Total of all applications of nitrogen (commercial fertilizer and manure applications) for cotton ≤60 pounds per bale
Increase rate to 1.98 times harvest removal (proportionate increase in all reported applications, including manure) Increase rate to 2.0 times harvest removal (proportionate increase in all reported applications, including manure) Increase rate to 90 pounds per bale (proportionate increase in all reported applications, including manure)
Phosphorus rate Applied total of fertilizer and manure P over all crops in the crop rotation ≤ 1.2 times total harvest P removal over all crops in rotation.
Increase commercial P fertilizer application rates to reach 2 times harvest removal for the crop rotation (proportionate increase in all reported applications over the rotation), accounting also for manure P associated with increase to meet nitrogen applications for No-Practice Scenario. Manure applications were NOT increased to meet the higher P rate for the No-Practice Scenario.
Commercial fertilizer application method
Incorporated or banded
Change to surface broadcast
Manure application method Incorporated, banded, or injected
Change to surface broadcast
Commercial fertilizer application timing
Within 3 weeks prior to planting, at planting, or within 60 days after planting.
Moved to 3 weeks prior to planting. Manure applications were not adjusted for timing in the No-Practice Scenario.
Pesticides
1. Practicing high level of IPM 2. Practicing moderate level of IPM 3. Spot treatments 4. Partial field treatments
1. All incorporated applications changed to surface application. For each crop, the first application event after planting and 30 days prior to harvest replicated twice, 1 week and 2 weeks later than original.
2. Same as for high level of IPM, except replication of first
application only 1 time, 1 week after original
3. Application rates for spot treatments were adjusted upward relative to the baseline rate to represent whole-field application (see text).
4. Application rates for partial field treatments were adjusted
upward relative to the baseline rate to represent whole-field application (see text).
69
Appendix B: Rules for Applying Practices in Hypothetical Conservation Scenarios The following rules illustrate how simulations of the hypo-thetical Conservation Scenarios were constructed. In all cases addition of a practice was simulated only if the practice was not in use on the simulated land. Structural Erosion Control (SEC) Practices Treatment to control water erosion and surface water runoff consists of structural and vegetative practices that slow water runoff and capture nutrient and sediments before they leave the field. SEC practices are also incorporated into the ENM, ENC, and END hypothetical Conservation Scenarios. The following in-field and edge-of-field erosion control practices were added or enhanced in the modeling exercise for each hypothetical Conservation Scenario that included SEC, according to the following rules. In-field mitigation: • Terraces were added to all fields with slopes greater than 6
percent, and to all fields with slopes greater than 4 percent that also had a high potential for runoff (signified by hydrologic soil groups C or D).
• Contouring or strip-cropping (overland flow practices) was added to all fields with a slope greater than 2 percent.
• Concentrated flow practices were not applied in these simulations since they are used on unique situations within the field which could not be identified using the landscape data available at CEAP sample points.
Edge-of-field mitigation: • Fields adjacent to water were simulated to have a riparian
buffer in addition to a filter strip. • Fields not adjacent to water were simulated to have a filter
strip. The implementation of SEC practices also influences the land condition parameter used to estimate the NRCS Runoff Curve Number (RCN). The RCN is an empirical parameter used in surface hydrology for predicting direct runoff or infiltration. The hydrologic condition (a component in the determination of the RCN) was adjusted from “poor” to “good” for fields where SEC practices were added. Soils already classified as “good” maintained a “good” status. Nutrient Management (NM) Nutrient management includes application of nutrients using an appropriate nutrient source, application method, application rate, and application timing. Enhanced nutrient management aims to provide sufficient nutrients for crop growth while minimizing potential for losses to the environment.
Nutrient source: • For no-till, commercial fertilizer was adjusted to a form
applied by knifing or injecting below the soil surface. This change did not impact the ammonium or nitrate ratio of the fertilizer.
• Nutrient source was not adjusted if the fields were not no-till.
Application method: • On fields reporting applications with no incorporation, all
application methods were switched to a method that incorporated or injected the manure or commercial fertilizer.
• On no-till fields with sprayed or broadcast liquid or slurry manure applications, all application methods were changed to injected or placed under the soil surface.
• All applications of manure of solid consistency was incorporated by disking regardless of reported tillage management type. On no-till fields, the incorporation of every application of manure changed the tillage type to mulch tillage.
Application rate: • On fields where the nitrogen application rates were above
1.4 times the crop removal rate, nitrogen application rates were reduced to 1.4 times the crop removal rate for all crops except small grain crops.
• On fields on which small grain crops (wheat, barley, oats, rice, rye, buckwheat, emmer, spelt, and triticale) were grown with nitrogen applications above 1.6 times the crop removal rate, nitrogen application rates were reduced to 1.6 times the crop removal rate.
• On fields where the phosphorus application rates for the crop rotation were above 1.2 times the amount of phosphorus removed in the crop at harvest over the crop rotation, phosphorus application rates were adjusted to be equal to 1.2 times the amount of phosphorus removed in the crop at harvest over the crop rotation. When reductions were necessary, all phosphorus applications in the rotation were reduced in equal proportions.
Application timing: • Commercial fertilizer applications were adjusted to occur
21 days prior to planting except on acres susceptible to leaching loss, as signified by hydrologic soil group A, soils with sandy textures, or tile drained fields.
• On fields susceptible to leaching loss, nitrogen was applied in split applications, with 25 percent of the total applied 21 days before planting and 75 percent of the total applied 28 days after planting.
70
• Manure applications during winter months (November, December, January, February, and March) were moved to 21 days prior to planting or April 1, whichever came first.
Cover Crops (CC) Cover crops were inserted into crop rotations if no crop was grown during the traditional winter period. Rye was used as the cover crop in all cases and was “planted” the day after harvest or the day after the last fall tillage operation. The rye was allowed to grow until the first spring tillage operation. On no-till fields the rye was chemically terminated one week before planting. Structural Erosion Control and Nutrient Management (ENM) If a field required either structural erosion control or nutrient management, or both, per the rules outlined above, it was simulated as so treated in the ENM hypothetical Conservation Scenario. In this way, in the ENM Scenario all acres in the WLEB received appropriate erosion control and nutrient management according to their needs. Structural Erosion Control and Nutrient Management Plus Cover Crops (ENC) If a field required either structural erosion control, nutrient management, cover crops and/or some combination of the three Conservation Scenarios, per the rules outlined above, it was simulated as so-treated in the ENC hypothetical Conservation Scenario. In this way, in the ENC Scenario all acres in the WLEB received appropriate erosion control and nutrient management according to their needs, and cover crops were also grown on all possible acres. Structural Erosion Control and Nutrient Management Plus Drainage Water Management (END) If a field required either structural erosion control, nutrient management, drainage water management, and/or some combination of the three Conservation Scenarios, per the rules outlined above, it was simulated as so-treated in the END hypothetical Conservation Scenario. In this way, in the END Scenario all acres in the WLEB received appropriate erosion control and nutrient management according to their needs, and the potential efficiency of drainage water management was also maximized on all tiled acres. Drainage water management can be applied in numerous ways. Older technology simply blocks channels with risers and water tables are regulated manually. Newer technology consists of contoured drain lines with automated control structures that minimize labor and maximize control. The END Scenario simulated the newer technologies in drainage water management. In END, drainage water management was applied only to fields with existing artificial drainage noted in the survey. No additional drain lines were added. Water tables were managed to remain below the root zone as crop roots developed and rooting depth increased; water tables were maintained below
the root zone throughout the growing season. Between the fall harvest dates and February 14th, soils were maintained in a saturated condition throughout the soil profile, when water was available, but ponding was not allowed to occur. On February 15th, soils were drained to below the root zone in preparation for field operations associated with spring planting. If a winter annual was planted for cover or grain or if a perennial crop was grown, drainage water management was not applied.


![[ORDERS (INCOMPLETE MATTERS / IAs / CRLMPs)]supremecourtofindia.nic.in/jonew/cl/2018-01-30/M_R_1.pdf · dindigul taluk national textile mills thozhilalar sangam m. a. chinnasamy versus](https://img.pdfslide.us/doc/110x75/5a9edccc7f8b9a84178bf420/orders-incomplete-matters-ias-crlmps-taluk-national-textile-mills-thozhilalar.jpg)