Embed Size (px)
Citation preview

United States Department of Agriculture Cotton: Foreign Agricultural Service World Markets and Trade Circular Series FC-4-06 April
Thou
sand
Bal
es
Brazil's Cotton Exports Surge to China
450
400
350
300
250
200
150
100
50
0
Aug-Feb 03/04
Aug-Feb 04/05
Aug-Feb 05/06
China Pakistan Indonesia Japan
Through the first seven months of the current marketing year (Aug. 2005-Feb. 2006), Brazilian cotton export shipments soared to a seven-month record of 1.73 million bales. Brazilian cotton has started to make in-roads into new markets, primarily in Asia. China accounts for a sizable share of this trade, importing 387,000 bales, followed by Pakistan, importing 377,000 bales. These two countries combined with Indonesia and Japan account for over 60 percent of Brazil’s cotton exports. Exports are forecast to grow 28 percent reaching a record 2 million bales in 2005/06. In the 2004/05 season, a record volume of Brazilian cotton was consumed in Asia, with Indonesia, Japan and Pakistan being the leading markets.
Much of the growth in Brazil’s cotton exports can be attributed to a large crop size in 2004/05. Brazil’s cotton production in 2004/05 reached 5.9 million bales, just short of the record 6.0 million bales produced in 2003/04. For 2005/06, Brazilian cotton area is forecast to decrease 27 percent pushing production down 20 percent.
With exports increasing and domestic cotton consumption remaining strong, the lower crop size forecast in 2005/06 will push Brazil’s ending stocks down 20 percent from last year’s record levels. Cotton imports were over 600,000 bales in 2000/01, but higher production levels during the last five years has reduced import requirements to just over 200,000 bales for 2005/06. The U.S. exports several varieties of cotton to Brazil, including long and short staple varieties to the Brazilian apparel and textile industry.
Approved by the World Agricultural Outlook Board
Further Information Contact:
U.S. Department of Agriculture Foreign Agricultural Service
Cotton, Oilseeds, Tobacco, and Seeds Division Stop 1051
1400 Independence Ave., SW Washington, D.C. 20250-1051 Telephone -- (202) 720-9516
Fax -- (202) 690-1171
J. Lawrence Blum, Director Patrick Packnett, Deputy Director for Analysis
Peter W. Burr, Group Leader, Cotton and Tobacco
Principle Contributors
James Johnson.......................................................................................Senior Cotton Analyst [email protected]
Teresa McKeivier.............................................Chairperson for Foreign Area and Production [email protected]
Hooshang Fazel..............................Analyst, Middle East, Sub-continent, and Southeast Asia [email protected]
Keith Scearce ........................................................ Analyst, Europe and Western [email protected]
Morgan Haas ........................................................................ Analyst, Africa and Central Asia [email protected]
Ryan Hajen.................................................................................. Analyst, Mexico and Russia [email protected]
Page 2, April 2006
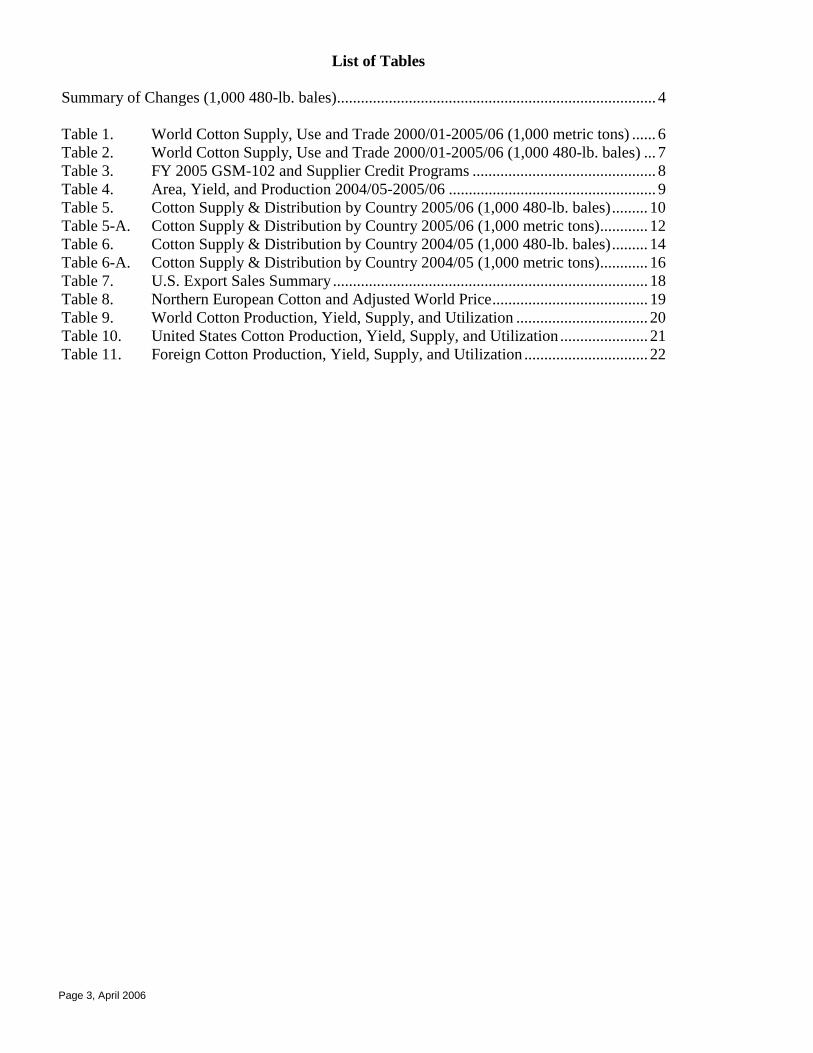
List of Tables
Summary of Changes (1,000 480-lb. bales)................................................................................ 4
Table 1. World Cotton Supply, Use and Trade 2000/01-2005/06 (1,000 metric tons) ...... 6 Table 2. World Cotton Supply, Use and Trade 2000/01-2005/06 (1,000 480-lb. bales) ... 7 Table 3. FY 2005 GSM-102 and Supplier Credit Programs .............................................. 8 Table 4. Area, Yield, and Production 2004/05-2005/06 .................................................... 9 Table 5. Cotton Supply & Distribution by Country 2005/06 (1,000 480-lb. bales)......... 10 Table 5-A. Cotton Supply & Distribution by Country 2005/06 (1,000 metric tons)............ 12 Table 6. Cotton Supply & Distribution by Country 2004/05 (1,000 480-lb. bales)......... 14 Table 6-A. Cotton Supply & Distribution by Country 2004/05 (1,000 metric tons)............ 16 Table 7. U.S. Export Sales Summary ............................................................................... 18 Table 8. Northern European Cotton and Adjusted World Price....................................... 19 Table 9. World Cotton Production, Yield, Supply, and Utilization ................................. 20 Table 10. United States Cotton Production, Yield, Supply, and Utilization ...................... 21 Table 11. Foreign Cotton Production, Yield, Supply, and Utilization ............................... 22
Page 3, April 2006

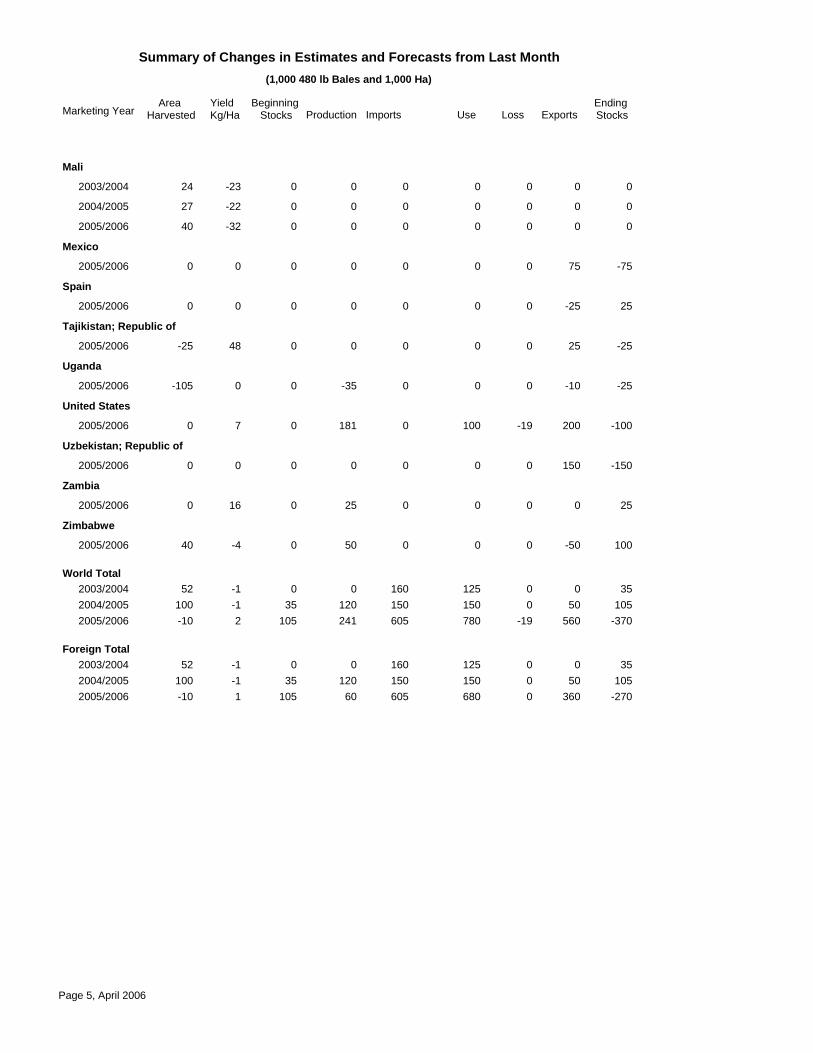
Summary of Changes in Estimates and Forecasts from Last Month (1,000 480 lb Bales and 1,000 Ha)
Marketing Year Area
Harvested Yield Kg/Ha
Beginning Stocks Production Imports Use Loss Exports
Ending Stocks
Argentina
2005/2006 -15 -23 0 -60 0 -20 0 -10 -30
Austria
2005/2006 0 0 0 0 -30 -25 0 0 -5
Bangladesh
2003/2004 0 0 0 0 160 125 0 0 35
2004/2005 0 0 35 0 150 150 0 0 35
2005/2006 0 0 35 0 300 275 0 0 60
Belgium-Luxembourg
2005/2006 0 0 0 0 -15 0 0 -15 0
Benin
2004/2005 10 41 0 80 0 0 0 50 30
2005/2006 0 0 30 0 0 0 0 25 5
Brazil
2005/2006 0 51 0 200 0 0 0 0 200
Burkina
2004/2005 35 -28 0 0 0 0 0 0 0
2005/2006 55 -63 0 -50 0 0 0 0 -50
Canada
2005/2006 0 0 0 0 -50 -25 0 0 -25
China; Peoples Republic of
2005/2006 0 0 0 0 500 500 0 0 0
Cote d'Ivoire
2003/2004 28 -41 0 0 0 0 0 0 0
2004/2005 28 -11 0 40 0 0 0 0 40
2005/2006 0 -58 40 -70 0 0 0 -25 -5
Greece
2005/2006 0 0 0 0 0 0 0 50 -50
Hong Kong
2005/2006 0 0 0 0 50 0 0 25 25
India
2005/2006 0 0 0 0 -100 0 0 100 -200
Italy
2005/2006 0 0 0 0 -25 -25 0 20 -20
Kazakhstan; Republic of
2005/2006 0 0 0 0 0 0 0 25 -25
Korea; Republic of
2005/2006 0 0 0 0 -25 0 0 0 -25
Page 4, April 2006
2003/20042004/20052005/2006
Summary of Changes in Estimates and Forecasts from Last Month (1,000 480 lb Bales and 1,000 Ha)
Marketing Year Area
Harvested Yield Kg/Ha
Beginning Stocks Production Imports Use Loss Exports
Ending Stocks
Mali
2003/2004 24 -23 0 0 0 0 0 0 0
2004/2005 27 -22 0 0 0 0 0 0 0
2005/2006 40 -32 0 0 0 0 0 0 0
Mexico
2005/2006 0 0 0 0 0 0 0 75 -75
Spain
2005/2006 0 0 0 0 0 0 0 -25 25
Tajikistan; Republic of
2005/2006 -25 48 0 0 0 0 0 25 -25
Uganda
2005/2006 -105 0 0 -35 0 0 0 -10 -25
United States
2005/2006 0 7 0 181 0 100 -19 200 -100
Uzbekistan; Republic of
2005/2006 0 0 0 0 0 0 0 150 -150
Zambia
2005/2006 0 16 0 25 0 0 0 0 25
Zimbabwe
2005/2006 40 -4 0 50 0 0 0 -50 100
World Total 2003/2004 52 -1 0 0 160 125 0 0 35 2004/2005 100 -1 35 120 150 150 0 50 105 2005/2006 -10 2 105 241 605 780 -19 560 -370
Foreign Total 2003/2004 52 -1 0 0 160 125 0 0 35 2004/2005 100 -1 35 120 150 150 0 50 105 2005/2006 -10 1 105 60 605 680 0 360 -270
Page 5, April 2006
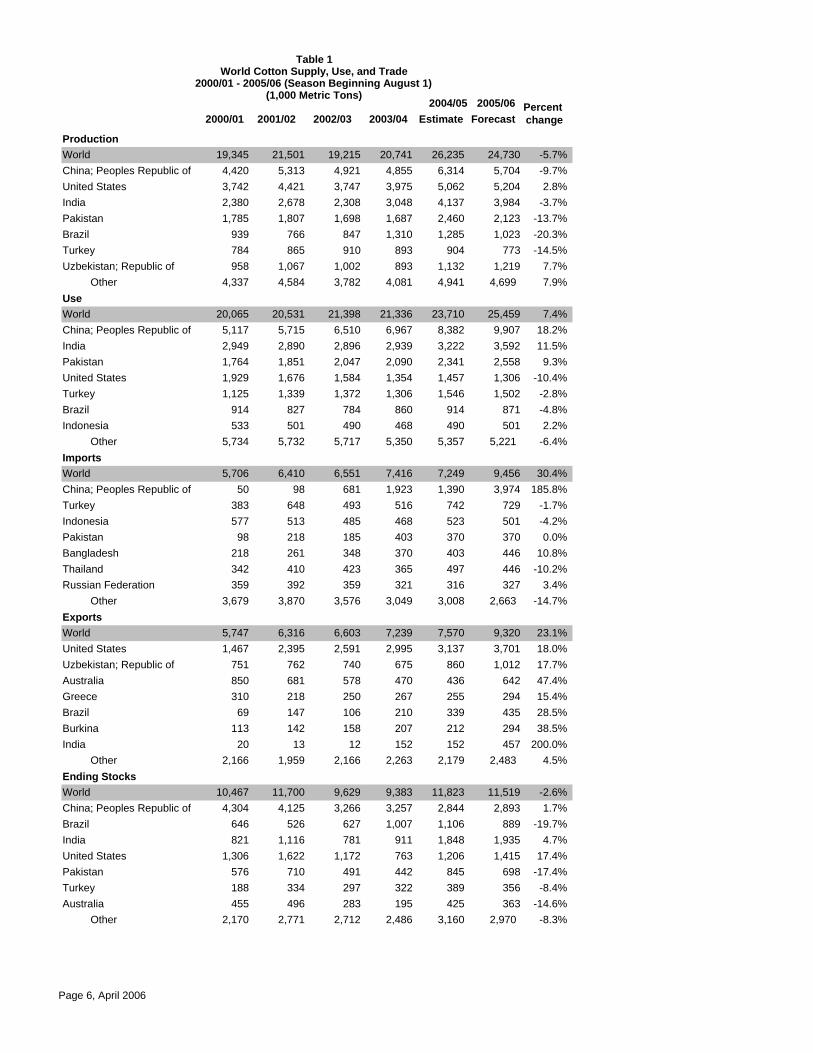
Table 1 World Cotton Supply, Use, and Trade
2000/01 - 2005/06 (Season Beginning August 1) (1,000 Metric Tons)
2004/05 2005/06 Percent 2000/01 2001/02 2002/03 2003/04 Estimate Forecast change
Production World China; Peoples Republic of United States India Pakistan Brazil Turkey Uzbekistan; Republic of
Other Use
19,345 4,420 3,742 2,380 1,785
939 784 958
4,337
21,501 5,313 4,421 2,678 1,807
766 865
1,067 4,584
19,215 4,921 3,747 2,308 1,698
847 910
1,002 3,782
20,741 4,855 3,975 3,048 1,687 1,310
893 893
4,081
26,235 6,314 5,062 4,137 2,460 1,285
904 1,132 4,941
24,730 5,704 5,204 3,984 2,123 1,023
773 1,219
4,699
-5.7% -9.7% 2.8%
-3.7% -13.7% -20.3% -14.5%
7.7% 7.9%
World China; Peoples Republic of India Pakistan United States Turkey Brazil Indonesia
Other Imports
20,065 5,117 2,949 1,764 1,929 1,125
914 533
5,734
20,531 5,715 2,890 1,851 1,676 1,339
827 501
5,732
21,398 6,510 2,896 2,047 1,584 1,372
784 490
5,717
21,336 6,967 2,939 2,090 1,354 1,306
860 468
5,350
23,710 8,382 3,222 2,341 1,457 1,546
914 490
5,357
25,459 9,907 3,592 2,558 1,306 1,502
871 501
5,221
7.4% 18.2% 11.5%
9.3% -10.4% -2.8% -4.8% 2.2%
-6.4%
World China; Peoples Republic of Turkey Indonesia Pakistan Bangladesh Thailand Russian Federation
Other Exports
5,706 50
383 577 98
218 342 359
3,679
6,410 98
648 513 218 261 410 392
3,870
6,551 681 493 485 185 348 423 359
3,576
7,416 1,923
516 468 403 370 365 321
3,049
7,249 1,390
742 523 370 403 497 316
3,008
9,456 3,974
729 501 370 446 446 327
2,663
30.4% 185.8%
-1.7% -4.2% 0.0%
10.8% -10.2%
3.4% -14.7%
World United States Uzbekistan; Republic of Australia Greece Brazil Burkina India
Other Ending Stocks
5,747 1,467
751 850 310 69
113 20
2,166
6,316 2,395
762 681 218 147 142 13
1,959
6,603 2,591
740 578 250 106 158
12 2,166
7,239 2,995
675 470 267 210 207 152
2,263
7,570 3,137
860 436 255 339 212 152
2,179
9,320 3,701 1,012
642 294 435 294 457
2,483
23.1% 18.0% 17.7% 47.4% 15.4% 28.5% 38.5%
200.0% 4.5%
World 10,467 11,700 9,629 9,383 11,823 11,519 -2.6% China; Peoples Republic of 4,304 4,125 3,266 3,257 2,844 2,893 1.7% Brazil 646 526 627 1,007 1,106 889 -19.7% India 821 1,116 781 911 1,848 1,935 4.7% United States 1,306 1,622 1,172 763 1,206 1,415 17.4% Pakistan 576 710 491 442 845 698 -17.4% Turkey 188 334 297 322 389 356 -8.4% Australia 455 496 283 195 425 363 -14.6%
Other 2,170 2,771 2,712 2,486 3,160 2,970 -8.3%
Page 6, April 2006
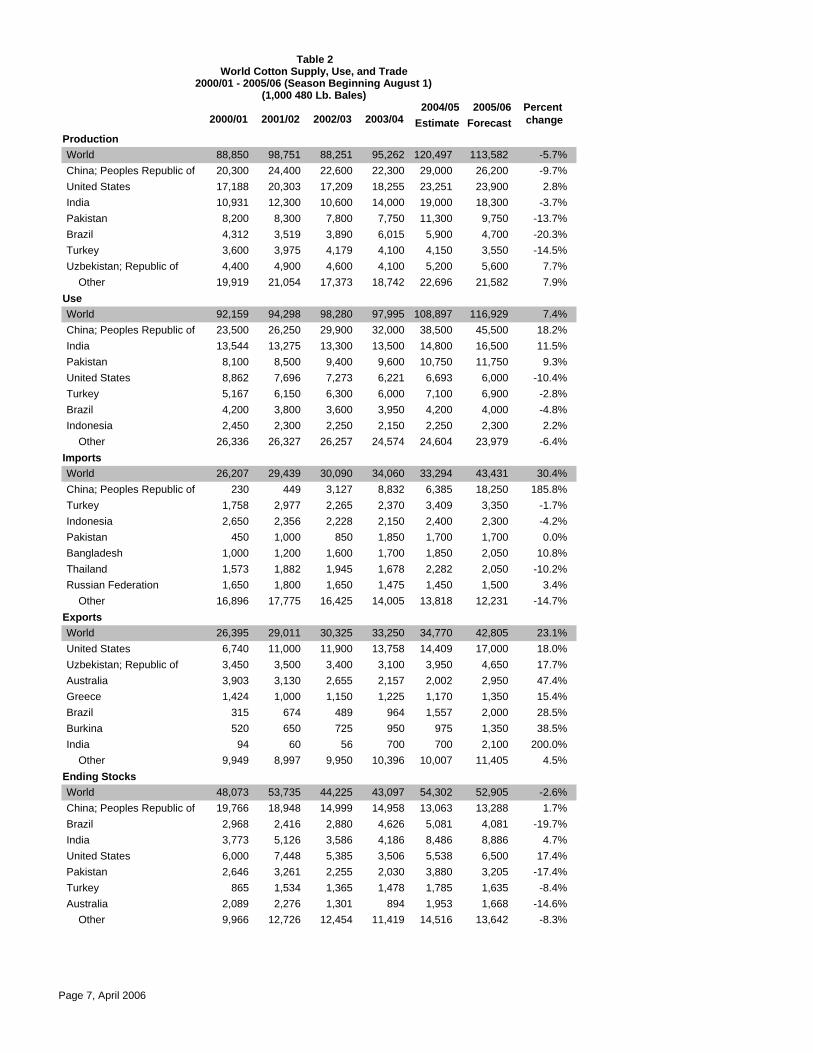
Table 2 World Cotton Supply, Use, and Trade
2000/01 - 2005/06 (Season Beginning August 1) (1,000 480 Lb. Bales)
Percent2005/06 2004/05 change 2002/03 2000/01 2001/02 Estimate Forecast2003/04
Production World China; Peoples Republic of United States India Pakistan Brazil Turkey Uzbekistan; Republic of
Other Use World
88,850 20,300 17,188 10,931 8,200 4,312 3,600 4,400
19,919
92,159
98,751 24,400 20,303 12,300 8,300 3,519 3,975 4,900
21,054
94,298
88,251 22,600 17,209 10,600 7,800 3,890 4,179 4,600
17,373
98,280
95,262 22,300 18,255 14,000 7,750 6,015 4,100 4,100
18,742
97,995
120,497 29,000 23,251 19,000 11,300
5,900 4,150 5,200
22,696
108,897
113,582 26,200 23,900 18,300
9,750 4,700 3,550 5,600
21,582
116,929
-5.7% -9.7% 2.8%
-3.7% -13.7% -20.3% -14.5%
7.7% 7.9%
7.4% China; Peoples Republic of India Pakistan United States Turkey Brazil Indonesia
Other Imports
23,500 13,544 8,100 8,862 5,167 4,200 2,450
26,336
26,250 13,275 8,500 7,696 6,150 3,800 2,300
26,327
29,900 13,300 9,400 7,273 6,300 3,600 2,250
26,257
32,000 13,500 9,600 6,221 6,000 3,950 2,150
24,574
38,500 14,800 10,750
6,693 7,100 4,200 2,250
24,604
45,500 16,500 11,750
6,000 6,900 4,000 2,300
23,979
18.2% 11.5%
9.3% -10.4%
-2.8% -4.8% 2.2%
-6.4%
World China; Peoples Republic of Turkey Indonesia Pakistan Bangladesh Thailand Russian Federation
Other Exports
26,207 230
1,758 2,650
450 1,000 1,573 1,650
16,896
29,439 449
2,977 2,356 1,000 1,200 1,882 1,800
17,775
30,090 3,127 2,265 2,228
850 1,600 1,945 1,650
16,425
34,060 8,832 2,370 2,150 1,850 1,700 1,678 1,475
14,005
33,294 6,385 3,409 2,400 1,700 1,850 2,282 1,450
13,818
43,431 18,250
3,350 2,300 1,700 2,050 2,050 1,500
12,231
30.4% 185.8%
-1.7% -4.2% 0.0%
10.8% -10.2%
3.4% -14.7%
World United States Uzbekistan; Republic of Australia Greece Brazil Burkina India
Other Ending Stocks
26,395 6,740 3,450 3,903 1,424
315 520 94
9,949
29,011 11,000 3,500 3,130 1,000
674 650 60
8,997
30,325 11,900 3,400 2,655 1,150
489 725 56
9,950
33,250 13,758 3,100 2,157 1,225
964 950 700
10,396
34,770 14,409
3,950 2,002 1,170 1,557
975 700
10,007
42,805 17,000
4,650 2,950 1,350 2,000 1,350 2,100
11,405
23.1% 18.0% 17.7% 47.4% 15.4% 28.5% 38.5%
200.0% 4.5%
World 48,073 53,735 44,225 43,097 54,302 52,905 -2.6% China; Peoples Republic of 19,766 18,948 14,999 14,958 13,063 13,288 1.7% Brazil 2,968 2,416 2,880 4,626 5,081 4,081 -19.7% India 3,773 5,126 3,586 4,186 8,486 8,886 4.7% United States 6,000 7,448 5,385 3,506 5,538 6,500 17.4% Pakistan 2,646 3,261 2,255 2,030 3,880 3,205 -17.4% Turkey 865 1,534 1,365 1,478 1,785 1,635 -8.4% Australia 2,089 2,276 1,301 894 1,953 1,668 -14.6%
Other 9,966 12,726 12,454 11,419 14,516 13,642 -8.3%
Page 7, April 2006
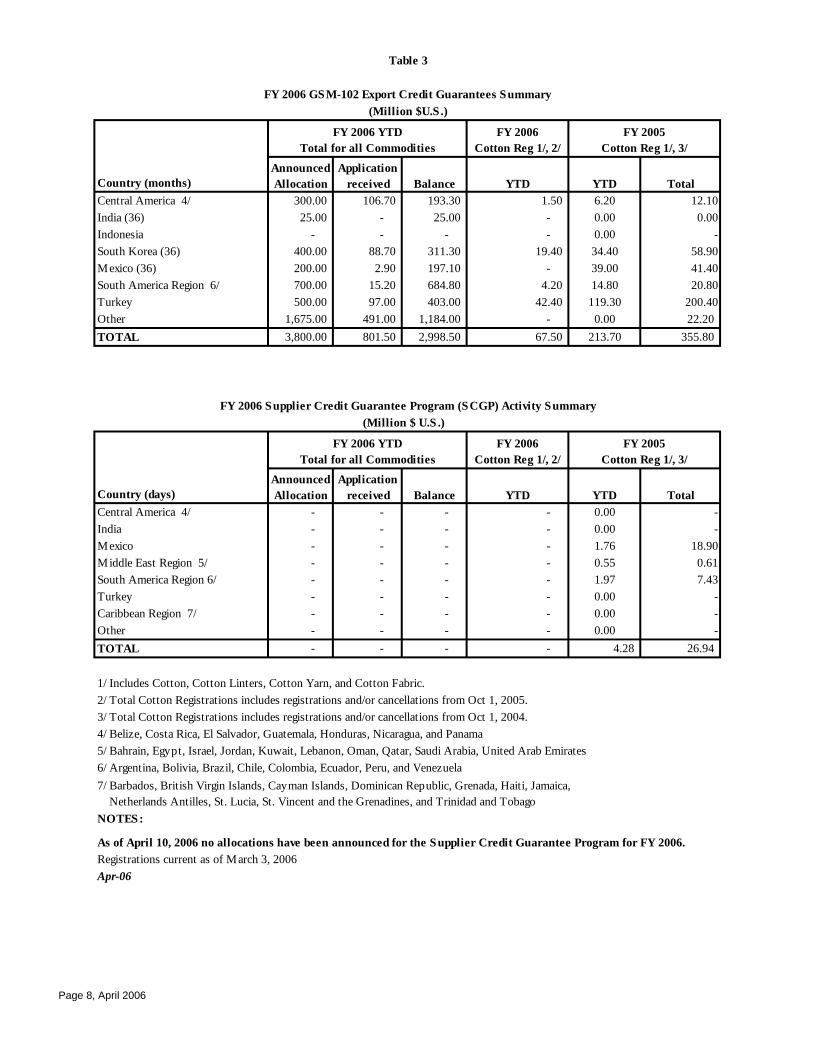
Table 3
FY 2006 GS M-102 Export Credit Guarantees S ummary (Million $U.S .)
FY 2006 YTD FY 2006 FY 2005
Country (months)
Total for all Commodities Cotton Reg 1/, 2/ Cotton Reg 1/, 3/
Announced Allocation
Application received Balance YTD YTD Total
Central America 4/ 300.00 106.70 193.30 1.50 6.20 12.10 India (36) 25.00 - 25.00 - 0.00 0.00 Indonesia - - - - 0.00 -South Korea (36) 400.00 88.70 311.30 19.40 34.40 58.90 M exico (36) 200.00 2.90 197.10 - 39.00 41.40 South America Region 6/ 700.00 15.20 684.80 4.20 14.80 20.80 Turkey 500.00 97.00 403.00 42.40 119.30 200.40 Other 1,675.00 491.00 1,184.00 - 0.00 22.20 TOTAL 3,800.00 801.50 2,998.50 67.50 213.70 355.80
FY 2006 S upplier Credit Guarantee Program (S CGP) Activity S ummary (Million $ U.S .)
FY 2006 YTD FY 2006 FY 2005
Country (days)
Total for all Commodities Cotton Reg 1/, 2/ Cotton Reg 1/, 3/
Announced Allocation
Application received Balance YTD YTD Total
Central America 4/ - - - - 0.00 -India - - - 0.00 -Mexico - - - 1.76 18.90 M iddle East Region 5/ - - - - 0.55 0.61 South America Region 6/ - - - - 1.97 7.43 Turkey - - - 0.00 -Caribbean Region 7/ - - - - 0.00 -Other - - - - 0.00 -TOTAL - - - - 4.28 26.94
1/ Includes Cotton, Cotton Linters, Cotton Yarn, and Cotton Fabric.2/ Total Cotton Registrations includes registrations and/or cancellations from Oct 1, 2005.3/ Total Cotton Registrations includes registrations and/or cancellations from Oct 1, 2004.4/ Belize, Costa Rica, El Salvador, Guatemala, Honduras, Nicaragua, and Panama
5/ Bahrain, Egypt, Israel, Jordan, Kuwait, Lebanon, Oman, Qatar, Saudi Arabia, United Arab Emirates
6/ Argentina, Bolivia, Brazil, Chile, Colombia, Ecuador, Peru, and Venezuela
7/ Barbados, British Virgin Islands, Cay man Islands, Dominican Republic, Grenada, Haiti, Jamaica, Netherlands Antilles, St. Lucia, St. Vincent and the Grenadines, and Trinidad and Tobago
NOTES :
As of April 10, 2006 no allocations have been announced for the S upplier Credit Guarantee Program for FY 2006. Registrations current as of M arch 3, 2006 Apr-06
Page 8, April 2006
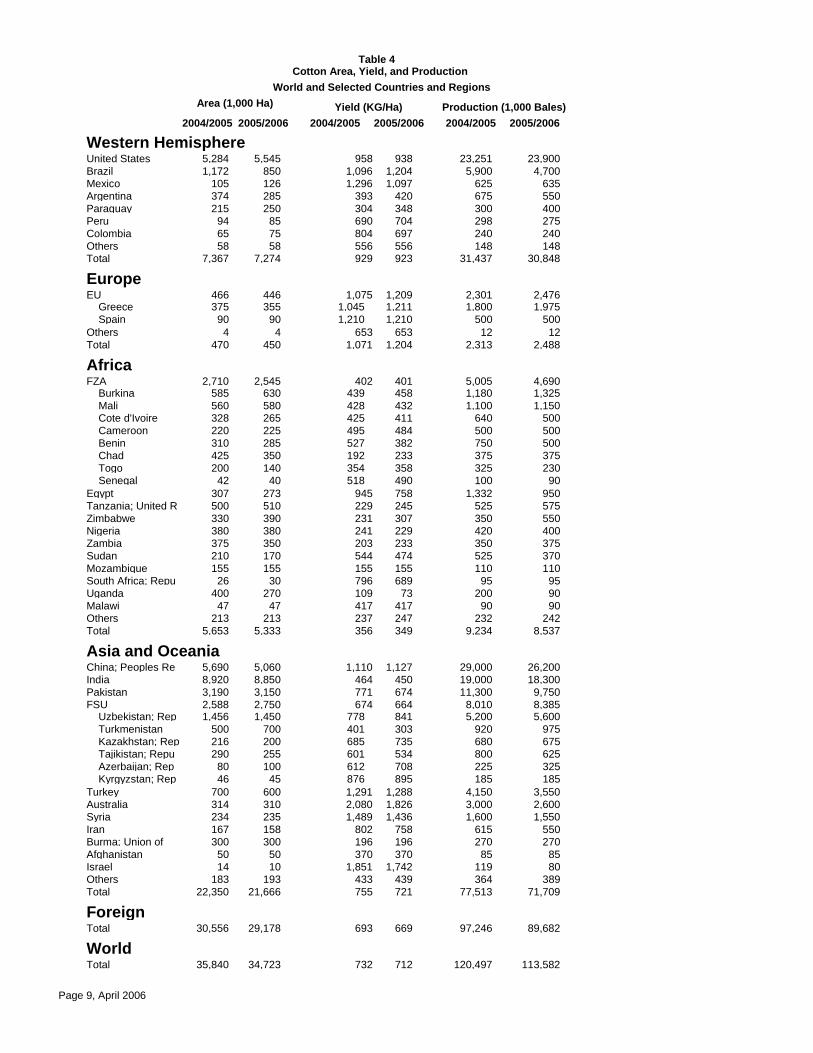
Table 4 Cotton Area, Yield, and Production
World and Selected Countries and Regions Area (1,000 Ha) Yield (KG/Ha) Production (1,000 Bales)
2004/2005 2005/2006 2004/2005 2005/2006 2004/2005 2005/2006
Western Hemisphere United States 5,284 5,545 958 938 23,251 23,900 Brazil 1,172 850 1,096 1,204 5,900 4,700 Mexico 105 126 1,296 1,097 625 635 Argentina 374 285 393 420 675 550 Paraguay 215 250 304 348 300 400 Peru 94 85 690 704 298 275 Colombia 65 75 804 697 240 240 Others 58 58 556 556 148 148 Total 7,367 7,274 929 923 31,437 30,848
Europe EU 466 446 1,075 1,209 2,301 2,476
Greece 375 355 1,045 1,211 1,800 1,975 Spain 90 90 1,210 1,210 500 500
Others 4 4 653 653 12 12 Total 470 450 1,071 1,204 2,313 2,488
Africa FZA 2,710 2,545 402 401 5,005 4,690
Burkina 585 630 439 458 1,180 1,325 Mali 560 580 428 432 1,100 1,150 Cote d'Ivoire 328 265 425 411 640 500 Cameroon 220 225 495 484 500 500 Benin 310 285 527 382 750 500 Chad 425 350 192 233 375 375 Togo 200 140 354 358 325 230 Senegal 42 40 518 490 100 90
Egypt 307 273 945 758 1,332 950 Tanzania; United R 500 510 229 245 525 575 Zimbabwe 330 390 231 307 350 550 Nigeria 380 380 241 229 420 400 Zambia 375 350 203 233 350 375 Sudan 210 170 544 474 525 370 Mozambique 155 155 155 155 110 110 South Africa; Repu 26 30 796 689 95 95 Uganda 400 270 109 73 200 90 Malawi 47 47 417 417 90 90 Others 213 213 237 247 232 242 Total 5,653 5,333 356 349 9,234 8,537
Asia and OceaniaChina; Peoples Re 5,690 5,060 1,110 1,127 29,000 26,200 India 8,920 8,850 464 450 19,000 18,300 Pakistan 3,190 3,150 771 674 11,300 9,750 FSU 2,588 2,750 674 664 8,010 8,385
Uzbekistan; Rep 1,456 1,450 778 841 5,200 5,600 Turkmenistan 500 700 401 303 920 975 Kazakhstan; Rep 216 200 685 735 680 675 Tajikistan; Repu 290 255 601 534 800 625 Azerbaijan; Rep 80 100 612 708 225 325 Kyrgyzstan; Rep 46 45 876 895 185 185
Turkey 700 600 1,291 1,288 4,150 3,550 Australia 314 310 2,080 1,826 3,000 2,600 Syria 234 235 1,489 1,436 1,600 1,550 Iran 167 158 802 758 615 550 Burma; Union of 300 300 196 196 270 270 Afghanistan 50 50 370 370 85 85 Israel 14 10 1,851 1,742 119 80 Others 183 193 433 439 364 389 Total 22,350 21,666 755 721 77,513 71,709
Foreign Total 30,556 29,178 693 669 97,246 89,682
World Total 35,840 34,723 732 712 120,497 113,582
Page 9, April 2006
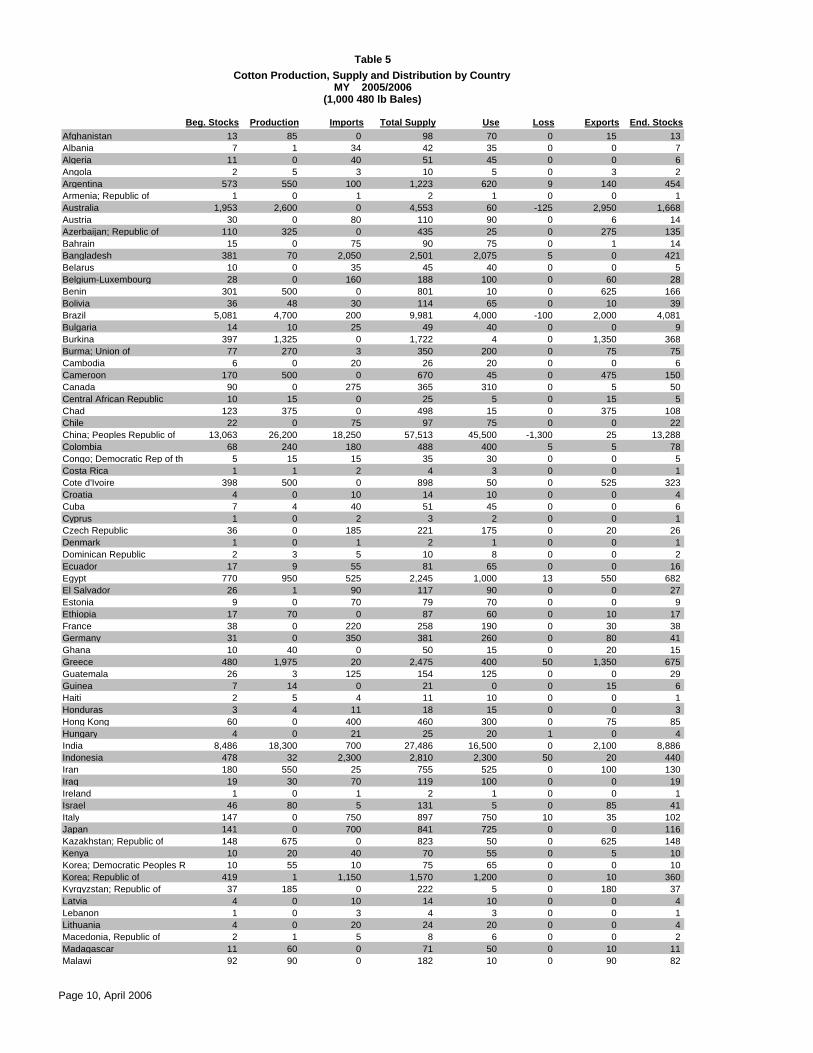
Table 5
2005/2006Cotton Production, Supply and Distribution by Country
(1,000 480 lb Bales) MY
Afghanistan Beg. Stocks UseTotal Supply Imports Production
13 85 0 98 70 Loss
0 Exports
15 End. Stocks
13 Albania 7 1 34 42 35 0 0 7 Algeria 11 0 40 51 45 0 0 6 Angola 2 5 3 10 5 0 3 2 Argentina 573 550 100 1,223 620 9 140 454 Armenia; Republic of 1 0 1 2 1 0 0 1 Australia 1,953 2,600 0 4,553 60 -125 2,950 1,668 Austria 30 0 80 110 90 0 6 14 Azerbaijan; Republic of 110 325 0 435 25 0 275 135 Bahrain 15 0 75 90 75 0 1 14 Bangladesh 381 70 2,050 2,501 2,075 5 0 421 Belarus 10 0 35 45 40 0 0 5 Belgium-Luxembourg 28 0 160 188 100 0 60 28 Benin 301 500 0 801 10 0 625 166 Bolivia 36 48 30 114 65 0 10 39 Brazil 5,081 4,700 200 9,981 4,000 -100 2,000 4,081 Bulgaria 14 10 25 49 40 0 0 9 Burkina 397 1,325 0 1,722 4 0 1,350 368 Burma; Union of 77 270 3 350 200 0 75 75 Cambodia 6 0 20 26 20 0 0 6 Cameroon 170 500 0 670 45 0 475 150 Canada 90 0 275 365 310 0 5 50 Central African Republic 10 15 0 25 5 0 15 5 Chad 123 375 0 498 15 0 375 108 Chile 22 0 75 97 75 0 0 22 China; Peoples Republic of 13,063 26,200 18,250 57,513 45,500 -1,300 25 13,288 Colombia 68 240 180 488 400 5 5 78 Congo; Democratic Rep of th 5 15 15 35 30 0 0 5 Costa Rica 1 1 2 4 3 0 0 1 Cote d'Ivoire 398 500 0 898 50 0 525 323 Croatia 4 0 10 14 10 0 0 4 Cuba 7 4 40 51 45 0 0 6 Cyprus 1 0 2 3 2 0 0 1 Czech Republic 36 0 185 221 175 0 20 26 Denmark 1 0 1 2 1 0 0 1 Dominican Republic 2 3 5 10 8 0 0 2 Ecuador 17 9 55 81 65 0 0 16 Egypt 770 950 525 2,245 1,000 13 550 682 El Salvador 26 1 90 117 90 0 0 27 Estonia 9 0 70 79 70 0 0 9 Ethiopia 17 70 0 87 60 0 10 17 France 38 0 220 258 190 0 30 38 Germany 31 0 350 381 260 0 80 41 Ghana 10 40 0 50 15 0 20 15 Greece 480 1,975 20 2,475 400 50 1,350 675 Guatemala 26 3 125 154 125 0 0 29 Guinea 7 14 0 21 0 0 15 6 Haiti 2 5 4 11 10 0 0 1 Honduras 3 4 11 18 15 0 0 3 Hong Kong 60 0 400 460 300 0 75 85 Hungary 4 0 21 25 20 1 0 4 India 8,486 18,300 700 27,486 16,500 0 2,100 8,886 Indonesia 478 32 2,300 2,810 2,300 50 20 440 Iran 180 550 25 755 525 0 100 130 Iraq 19 30 70 119 100 0 0 19 Ireland 1 0 1 2 1 0 0 1 Israel 46 80 5 131 5 0 85 41 Italy 147 0 750 897 750 10 35 102 Japan 141 0 700 841 725 0 0 116 Kazakhstan; Republic of 148 675 0 823 50 0 625 148 Kenya 10 20 40 70 55 0 5 10 Korea; Democratic Peoples R 10 55 10 75 65 0 0 10 Korea; Republic of 419 1 1,150 1,570 1,200 0 10 360 Kyrgyzstan; Republic of 37 185 0 222 5 0 180 37 Latvia 4 0 10 14 10 0 0 4 Lebanon 1 0 3 4 3 0 0 1 Lithuania 4 0 20 24 20 0 0 4 Macedonia, Republic of 2 1 5 8 6 0 0 2 Madagascar 11 60 0 71 50 0 10 11 Malawi 92 90 0 182 10 0 90 82
Page 10, April 2006

Table 5
2005/2006Cotton Production, Supply and Distribution by Country
(1,000 480 lb Bales) MY
Malaysia Mali
Beg. Stocks UseTotal Supply Imports Production 39 0 250 289 250
387 1,150 0 1,537 20
Loss 0 0
Exports 0
1,150
End. Stocks 39
367 Mauritius 14 0 65 79 65 0 0 14 Mexico 1,319 635 1,400 3,354 2,000 25 300 1,029 Moldova; Republic of 4 0 10 14 10 0 0 4 Morocco 30 1 150 181 150 0 0 31 Mozambique 43 110 5 158 10 0 100 48 Netherlands 3 0 5 8 5 0 1 2 Nicaragua 2 10 0 12 1 0 9 2 Niger 3 5 0 8 4 0 1 3 Nigeria 144 400 70 614 360 0 125 129 Norway 0 0 0 0 0 0 0 0 Pakistan 3,880 9,750 1,700 15,330 11,750 25 350 3,205 Panama 1 0 3 4 3 0 0 1 Paraguay 102 400 0 502 30 0 375 97 Peru 322 275 200 797 475 0 10 312 Philippines 51 12 125 188 150 0 0 38 Poland 19 0 180 199 180 0 1 18 Portugal 98 1 275 374 300 0 2 72 Romania 32 0 50 82 60 0 0 22 Russian Federation 222 0 1,500 1,722 1,500 0 0 222 Senegal 36 90 0 126 20 0 70 36 Serbia and Montenegro 2 0 8 10 8 0 0 2 Singapore 8 0 55 63 0 0 55 8 Slovakia 2 0 10 12 10 0 0 2 Slovenia 12 0 30 42 35 0 0 7 Somalia 1 7 5 13 12 0 0 1 South Africa; Republic of 68 95 120 283 225 0 0 58 Spain 174 500 50 724 260 0 300 164 Sri Lanka 1 5 5 11 10 0 0 1 Sudan 310 370 0 680 8 0 425 247 Sweden 1 0 1 2 1 0 0 1 Switzerland 10 0 40 50 40 0 0 10 Syria 499 1,550 0 2,049 725 0 825 499 Taiwan 488 0 1,125 1,613 1,200 0 0 413 Tajikistan; Republic of 195 625 0 820 150 0 525 145 Tanzania; United Republic of 232 575 0 807 70 0 450 287 Thailand 580 54 2,050 2,684 2,125 25 1 533 Togo 147 230 0 377 15 0 230 132 Tunisia 13 10 100 123 110 0 0 13 Turkey 1,785 3,550 3,350 8,685 6,900 0 150 1,635 Turkmenistan 529 975 0 1,504 425 0 550 529 Uganda 135 90 0 225 20 0 115 90 Ukraine 19 0 60 79 65 0 0 14 United Kingdom 13 0 85 98 85 0 0 13 United States 5,538 23,900 30 29,468 6,000 -32 17,000 6,500 Uruguay 1 0 3 4 3 0 0 1 Uzbekistan; Republic of 1,298 5,600 0 6,898 800 0 4,650 1,448 Venezuela 34 60 40 134 100 0 0 34 Vietnam 188 65 700 953 750 0 0 203 Yemen 9 65 0 74 25 0 40 9 Zambia 315 375 0 690 65 0 325 300 Zimbabwe 161 550 0 711 90 15 325 281
World Total 54,302 113,582 43,431 211,315 116,929 -1,324 42,805 52,905
* Loss for countries outside the United States reflects cotton lost or destroyed while in the marketing channel. For the United States, loss reflects the difference between stocks as reported by the Bureau of the Census and implict stocks based on supply plus total use. A negative "loss" is a positive number.
Page 11, April 2006

Table 5A
2005/2006Cotton Production, Supply and Distribution by Country
1,000 Metric Tons MY
Afghanistan Beg. Stocks UseTotal Supply Imports Production
3 19 0 21 15 Loss
0 Exports
3 End. Stocks
3 Albania 2 0 7 9 8 0 0 2 Algeria 2 0 9 11 10 0 0 1 Angola 0 1 1 2 1 0 1 0 Argentina 125 120 22 266 135 2 30 99 Armenia; Republic of 0 0 0 0 0 0 0 0 Australia 425 566 0 991 13 -27 642 363 Austria 7 0 17 24 20 0 1 3 Azerbaijan; Republic of 24 71 0 95 5 0 60 29 Bahrain 3 0 16 20 16 0 0 3 Bangladesh 83 15 446 545 452 1 0 92 Belarus 2 0 8 10 9 0 0 1 Belgium-Luxembourg 6 0 35 41 22 0 13 6 Benin 66 109 0 174 2 0 136 36 Bolivia 8 10 7 25 14 0 2 8 Brazil 1,106 1,023 44 2,173 871 -22 435 889 Bulgaria 3 2 5 11 9 0 0 2 Burkina 86 288 0 375 1 0 294 80 Burma; Union of 17 59 1 76 44 0 16 16 Cambodia 1 0 4 6 4 0 0 1 Cameroon 37 109 0 146 10 0 103 33 Canada 20 0 60 79 67 0 1 11 Central African Republic 2 3 0 5 1 0 3 1 Chad 27 82 0 108 3 0 82 24 Chile 5 0 16 21 16 0 0 5 China; Peoples Republic of 2,844 5,704 3,974 12,522 9,907 -283 5 2,893 Colombia 15 52 39 106 87 1 1 17 Congo; Democratic Rep of th 1 3 3 8 7 0 0 1 Costa Rica 0 0 0 1 1 0 0 0 Cote d'Ivoire 87 109 0 196 11 0 114 70 Croatia 1 0 2 3 2 0 0 1 Cuba 2 1 9 11 10 0 0 1 Cyprus 0 0 0 1 0 0 0 0 Czech Republic 8 0 40 48 38 0 4 6 Denmark 0 0 0 0 0 0 0 0 Dominican Republic 0 1 1 2 2 0 0 0 Ecuador 4 2 12 18 14 0 0 3 Egypt 168 207 114 489 218 3 120 148 El Salvador 6 0 20 25 20 0 0 6 Estonia 2 0 15 17 15 0 0 2 Ethiopia 4 15 0 19 13 0 2 4 France 8 0 48 56 41 0 7 8 Germany 7 0 76 83 57 0 17 9 Ghana 2 9 0 11 3 0 4 3 Greece 105 430 4 539 87 11 294 147 Guatemala 6 1 27 34 27 0 0 6 Guinea 2 3 0 5 0 0 3 1 Haiti 0 1 1 2 2 0 0 0 Honduras 1 1 2 4 3 0 0 1 Hong Kong 13 0 87 100 65 0 16 19 Hungary 1 0 5 5 4 0 0 1 India 1,848 3,984 152 5,984 3,592 0 457 1,935 Indonesia 104 7 501 612 501 11 4 96 Iran 39 120 5 164 114 0 22 28 Iraq 4 7 15 26 22 0 0 4 Ireland 0 0 0 0 0 0 0 0 Israel 10 17 1 29 1 0 19 9 Italy 32 0 163 195 163 2 8 22 Japan 31 0 152 183 158 0 0 25 Kazakhstan; Republic of 32 147 0 179 11 0 136 32 Kenya 2 4 9 15 12 0 1 2 Korea; Democratic Peoples R 2 12 2 16 14 0 0 2 Korea; Republic of 91 0 250 342 261 0 2 78 Kyrgyzstan; Republic of 8 40 0 48 1 0 39 8 Latvia 1 0 2 3 2 0 0 1 Lebanon 0 0 1 1 1 0 0 0 Lithuania 1 0 4 5 4 0 0 1 Macedonia, Republic of 0 0 1 2 1 0 0 0 Madagascar 2 13 0 15 11 0 2 2 Malawi 20 20 0 40 2 0 20 18
Page 12, April 2006
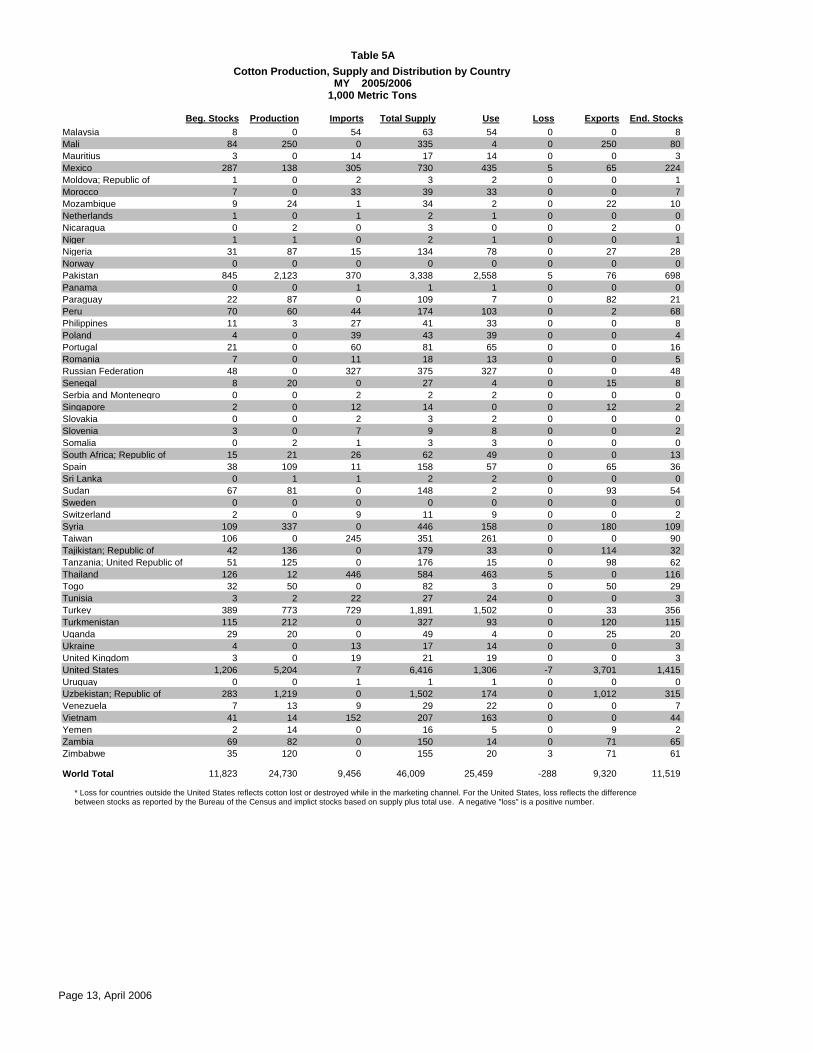
Table 5A
2005/2006Cotton Production, Supply and Distribution by Country
1,000 Metric Tons MY
Malaysia Mali
Beg. Stocks UseTotal Supply Imports Production 8 0 54 63 54
84 250 0 335 4
Loss 0 0
Exports 0
250
End. Stocks 8
80 Mauritius 3 0 14 17 14 0 0 3 Mexico 287 138 305 730 435 5 65 224 Moldova; Republic of 1 0 2 3 2 0 0 1 Morocco 7 0 33 39 33 0 0 7 Mozambique 9 24 1 34 2 0 22 10 Netherlands 1 0 1 2 1 0 0 0 Nicaragua 0 2 0 3 0 0 2 0 Niger 1 1 0 2 1 0 0 1 Nigeria 31 87 15 134 78 0 27 28 Norway 0 0 0 0 0 0 0 0 Pakistan 845 2,123 370 3,338 2,558 5 76 698 Panama 0 0 1 1 1 0 0 0 Paraguay 22 87 0 109 7 0 82 21 Peru 70 60 44 174 103 0 2 68 Philippines 11 3 27 41 33 0 0 8 Poland 4 0 39 43 39 0 0 4 Portugal 21 0 60 81 65 0 0 16 Romania 7 0 11 18 13 0 0 5 Russian Federation 48 0 327 375 327 0 0 48 Senegal 8 20 0 27 4 0 15 8 Serbia and Montenegro 0 0 2 2 2 0 0 0 Singapore 2 0 12 14 0 0 12 2 Slovakia 0 0 2 3 2 0 0 0 Slovenia 3 0 7 9 8 0 0 2 Somalia 0 2 1 3 3 0 0 0 South Africa; Republic of 15 21 26 62 49 0 0 13 Spain 38 109 11 158 57 0 65 36 Sri Lanka 0 1 1 2 2 0 0 0 Sudan 67 81 0 148 2 0 93 54 Sweden 0 0 0 0 0 0 0 0 Switzerland 2 0 9 11 9 0 0 2 Syria 109 337 0 446 158 0 180 109 Taiwan 106 0 245 351 261 0 0 90 Tajikistan; Republic of 42 136 0 179 33 0 114 32 Tanzania; United Republic of 51 125 0 176 15 0 98 62 Thailand 126 12 446 584 463 5 0 116 Togo 32 50 0 82 3 0 50 29 Tunisia 3 2 22 27 24 0 0 3 Turkey 389 773 729 1,891 1,502 0 33 356 Turkmenistan 115 212 0 327 93 0 120 115 Uganda 29 20 0 49 4 0 25 20 Ukraine 4 0 13 17 14 0 0 3 United Kingdom 3 0 19 21 19 0 0 3 United States 1,206 5,204 7 6,416 1,306 -7 3,701 1,415 Uruguay 0 0 1 1 1 0 0 0 Uzbekistan; Republic of 283 1,219 0 1,502 174 0 1,012 315 Venezuela 7 13 9 29 22 0 0 7 Vietnam 41 14 152 207 163 0 0 44 Yemen 2 14 0 16 5 0 9 2 Zambia 69 82 0 150 14 0 71 65 Zimbabwe 35 120 0 155 20 3 71 61
World Total 11,823 24,730 9,456 46,009 25,459 -288 9,320 11,519
* Loss for countries outside the United States reflects cotton lost or destroyed while in the marketing channel. For the United States, loss reflects the difference between stocks as reported by the Bureau of the Census and implict stocks based on supply plus total use. A negative "loss" is a positive number.
Page 13, April 2006

Table 6
2004/2005Cotton Production, Supply and Distribution by Country
(1,000 480 lb Bales) MY
Afghanistan Beg. Stocks UseTotal Supply Imports Production
13 85 0 98 70 Loss
0 Exports
15 End. Stocks
13 Albania 7 1 34 42 35 0 0 7 Algeria 4 0 52 56 45 0 0 11 Angola 4 5 3 12 5 0 5 2 Argentina 515 675 110 1,300 620 9 98 573 Armenia; Republic of 1 0 1 2 1 0 0 1 Australia 894 3,000 1 3,895 65 -125 2,002 1,953 Austria 17 0 144 161 125 0 6 30 Azerbaijan; Republic of 70 225 0 295 25 0 160 110 Bahrain 16 0 75 91 75 0 1 15 Bangladesh 351 60 1,850 2,261 1,875 5 0 381 Belarus 15 0 45 60 50 0 0 10 Belgium-Luxembourg 11 0 205 216 115 0 73 28 Benin 186 750 0 936 10 0 625 301 Bolivia 22 48 36 106 60 0 10 36 Brazil 4,626 5,900 212 10,738 4,200 -100 1,557 5,081 Bulgaria 20 10 34 64 50 0 0 14 Burkina 196 1,180 0 1,376 4 0 975 397 Burma; Union of 64 270 3 337 210 0 50 77 Cambodia 6 0 20 26 20 0 0 6 Cameroon 115 500 0 615 45 0 400 170 Canada 87 0 365 452 360 0 2 90 Central African Republic 10 30 0 40 5 0 25 10 Chad 63 375 0 438 15 0 300 123 Chile 15 0 77 92 70 0 0 22 China; Peoples Republic of 14,958 29,000 6,385 50,343 38,500 -1,250 30 13,063 Colombia 103 240 141 484 400 5 11 68 Congo; Democratic Rep of th 5 15 15 35 30 0 0 5 Costa Rica 1 1 2 4 3 0 0 1 Cote d'Ivoire 323 640 0 963 65 0 500 398 Croatia 3 0 10 13 9 0 0 4 Cuba 8 4 40 52 45 0 0 7 Cyprus 1 0 2 3 2 0 0 1 Czech Republic 36 0 230 266 220 0 10 36 Denmark 1 0 1 2 1 0 0 1 Dominican Republic 2 3 5 10 8 0 0 2 Ecuador 16 9 57 82 65 0 0 17 Egypt 601 1,332 400 2,333 950 13 600 770 El Salvador 25 1 95 121 95 0 0 26 Estonia 12 0 67 79 70 0 0 9 Ethiopia 17 70 0 87 60 0 10 17 France 44 0 242 286 215 0 33 38 Germany 23 0 373 396 280 0 85 31 Ghana 10 30 10 50 30 0 10 10 Greece 390 1,800 10 2,200 500 50 1,170 480 Guatemala 22 3 115 140 110 0 4 26 Guinea 10 14 0 24 0 0 17 7 Haiti 3 5 4 12 10 0 0 2 Honduras 3 4 11 18 15 0 0 3 Hong Kong 72 0 318 390 300 0 30 60 Hungary 7 0 27 34 25 1 4 4 India 4,186 19,000 800 23,986 14,800 0 700 8,486 Indonesia 366 32 2,400 2,798 2,250 50 20 478 Iran 115 615 50 780 550 0 50 180 Iraq 19 30 70 119 100 0 0 19 Ireland 1 0 1 2 1 0 0 1 Israel 43 119 3 165 5 0 114 46 Italy 143 0 962 1,105 925 10 23 147 Japan 141 0 815 956 815 0 0 141 Kazakhstan; Republic of 133 680 0 813 40 0 625 148 Kenya 10 20 40 70 55 0 5 10 Korea; Democratic Peoples R 10 55 10 75 65 0 0 10 Korea; Republic of 409 1 1,343 1,753 1,325 0 9 419 Kyrgyzstan; Republic of 32 185 0 217 5 0 175 37 Latvia 4 0 15 19 15 0 0 4 Lebanon 1 0 3 4 3 0 0 1 Lithuania 7 0 24 31 25 0 2 4 Macedonia, Republic of 2 1 5 8 6 0 0 2 Madagascar 11 60 0 71 50 0 10 11 Malawi 102 90 0 192 10 0 90 92
Page 14, April 2006

Table 6
2004/2005Cotton Production, Supply and Distribution by Country
(1,000 480 lb Bales) MY
Malaysia Mali
Beg. Stocks UseTotal Supply Imports Production 36 0 254 290 250
257 1,100 0 1,357 20
Loss 0 0
Exports 1
950
End. Stocks 39
387 Mauritius 19 0 65 84 65 0 5 14 Mexico 1,144 625 1,810 3,579 2,100 25 135 1,319 Moldova; Republic of 4 0 10 14 10 0 0 4 Morocco 29 1 150 180 150 0 0 30 Mozambique 38 110 5 153 10 0 100 43 Netherlands 4 0 10 14 8 0 3 3 Nicaragua 2 10 0 12 1 0 9 2 Niger 3 5 0 8 4 0 1 3 Nigeria 129 420 70 619 375 0 100 144 Norway 0 0 0 0 0 0 0 0 Pakistan 2,030 11,300 1,700 15,030 10,750 25 375 3,880 Panama 1 0 3 4 3 0 0 1 Paraguay 129 300 0 429 30 0 297 102 Peru 226 298 221 745 415 0 8 322 Philippines 43 11 157 211 160 0 0 51 Poland 15 0 205 220 200 0 1 19 Portugal 99 1 325 425 325 0 2 98 Romania 40 0 77 117 85 0 0 32 Russian Federation 197 0 1,450 1,647 1,425 0 0 222 Senegal 26 100 0 126 20 0 70 36 Serbia and Montenegro 4 0 8 12 10 0 0 2 Singapore 8 0 55 63 0 0 55 8 Slovakia 4 0 15 19 10 0 7 2 Slovenia 11 0 47 58 45 0 1 12 Somalia 1 7 5 13 12 0 0 1 South Africa; Republic of 98 95 124 317 249 0 0 68 Spain 114 500 75 689 280 0 235 174 Sri Lanka 3 5 3 11 10 0 0 1 Sudan 78 525 0 603 9 0 284 310 Sweden 2 0 1 3 2 0 0 1 Switzerland 13 0 47 60 45 0 5 10 Syria 299 1,600 0 1,899 700 0 700 499 Taiwan 351 0 1,337 1,688 1,200 0 0 488 Tajikistan; Republic of 157 800 0 957 150 0 612 195 Tanzania; United Republic of 152 525 0 677 70 0 375 232 Thailand 418 57 2,282 2,757 2,150 25 2 580 Togo 122 325 0 447 15 0 285 147 Tunisia 13 10 100 123 110 0 0 13 Turkey 1,478 4,150 3,409 9,037 7,100 0 152 1,785 Turkmenistan 399 920 0 1,319 415 0 375 529 Uganda 80 200 0 280 20 15 110 135 Ukraine 13 0 66 79 60 0 0 19 United Kingdom 15 0 83 98 85 0 0 13 United States 3,506 23,251 29 26,786 6,693 146 14,409 5,538 Uruguay 1 0 3 4 3 0 0 1 Uzbekistan; Republic of 923 5,200 0 6,123 875 0 3,950 1,298 Venezuela 29 60 45 134 100 0 0 34 Vietnam 135 48 680 863 675 0 0 188 Yemen 9 65 0 74 25 0 40 9 Zambia 255 350 0 605 65 0 225 315 Zimbabwe 176 350 0 526 100 15 250 161
World Total 43,097 120,497 33,294 196,888 108,897 -1,081 34,770 54,302
* Loss for countries outside the United States reflects cotton lost or destroyed while in the marketing channel. For the United States, loss reflects the difference between stocks as reported by the Bureau of the Census and implict stocks based on supply plus total use. A negative "loss" is a positive number.
Page 15, April 2006
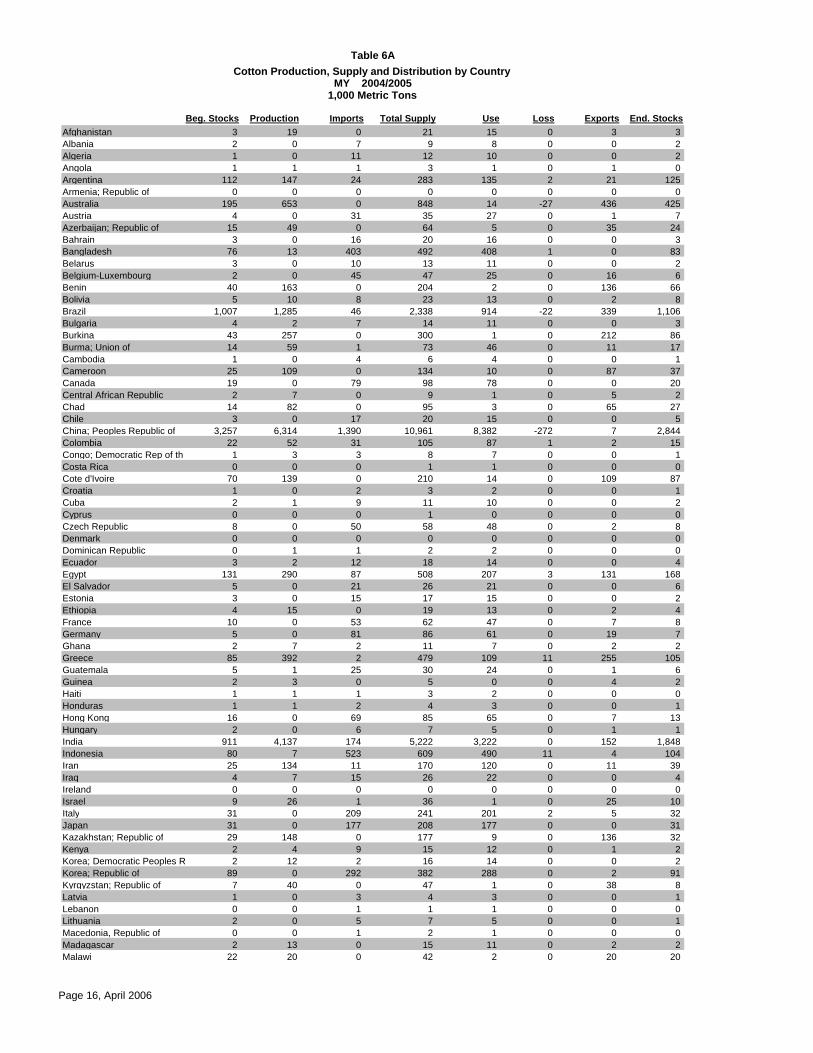
Table 6A
2004/2005Cotton Production, Supply and Distribution by Country
1,000 Metric Tons MY
Afghanistan Beg. Stocks UseTotal Supply Imports Production
3 19 0 21 15 Loss
0 Exports
3 End. Stocks
3 Albania 2 0 7 9 8 0 0 2 Algeria 1 0 11 12 10 0 0 2 Angola 1 1 1 3 1 0 1 0 Argentina 112 147 24 283 135 2 21 125 Armenia; Republic of 0 0 0 0 0 0 0 0 Australia 195 653 0 848 14 -27 436 425 Austria 4 0 31 35 27 0 1 7 Azerbaijan; Republic of 15 49 0 64 5 0 35 24 Bahrain 3 0 16 20 16 0 0 3 Bangladesh 76 13 403 492 408 1 0 83 Belarus 3 0 10 13 11 0 0 2 Belgium-Luxembourg 2 0 45 47 25 0 16 6 Benin 40 163 0 204 2 0 136 66 Bolivia 5 10 8 23 13 0 2 8 Brazil 1,007 1,285 46 2,338 914 -22 339 1,106 Bulgaria 4 2 7 14 11 0 0 3 Burkina 43 257 0 300 1 0 212 86 Burma; Union of 14 59 1 73 46 0 11 17 Cambodia 1 0 4 6 4 0 0 1 Cameroon 25 109 0 134 10 0 87 37 Canada 19 0 79 98 78 0 0 20 Central African Republic 2 7 0 9 1 0 5 2 Chad 14 82 0 95 3 0 65 27 Chile 3 0 17 20 15 0 0 5 China; Peoples Republic of 3,257 6,314 1,390 10,961 8,382 -272 7 2,844 Colombia 22 52 31 105 87 1 2 15 Congo; Democratic Rep of th 1 3 3 8 7 0 0 1 Costa Rica 0 0 0 1 1 0 0 0 Cote d'Ivoire 70 139 0 210 14 0 109 87 Croatia 1 0 2 3 2 0 0 1 Cuba 2 1 9 11 10 0 0 2 Cyprus 0 0 0 1 0 0 0 0 Czech Republic 8 0 50 58 48 0 2 8 Denmark 0 0 0 0 0 0 0 0 Dominican Republic 0 1 1 2 2 0 0 0 Ecuador 3 2 12 18 14 0 0 4 Egypt 131 290 87 508 207 3 131 168 El Salvador 5 0 21 26 21 0 0 6 Estonia 3 0 15 17 15 0 0 2 Ethiopia 4 15 0 19 13 0 2 4 France 10 0 53 62 47 0 7 8 Germany 5 0 81 86 61 0 19 7 Ghana 2 7 2 11 7 0 2 2 Greece 85 392 2 479 109 11 255 105 Guatemala 5 1 25 30 24 0 1 6 Guinea 2 3 0 5 0 0 4 2 Haiti 1 1 1 3 2 0 0 0 Honduras 1 1 2 4 3 0 0 1 Hong Kong 16 0 69 85 65 0 7 13 Hungary 2 0 6 7 5 0 1 1 India 911 4,137 174 5,222 3,222 0 152 1,848 Indonesia 80 7 523 609 490 11 4 104 Iran 25 134 11 170 120 0 11 39 Iraq 4 7 15 26 22 0 0 4 Ireland 0 0 0 0 0 0 0 0 Israel 9 26 1 36 1 0 25 10 Italy 31 0 209 241 201 2 5 32 Japan 31 0 177 208 177 0 0 31 Kazakhstan; Republic of 29 148 0 177 9 0 136 32 Kenya 2 4 9 15 12 0 1 2 Korea; Democratic Peoples R 2 12 2 16 14 0 0 2 Korea; Republic of 89 0 292 382 288 0 2 91 Kyrgyzstan; Republic of 7 40 0 47 1 0 38 8 Latvia 1 0 3 4 3 0 0 1 Lebanon 0 0 1 1 1 0 0 0 Lithuania 2 0 5 7 5 0 0 1 Macedonia, Republic of 0 0 1 2 1 0 0 0 Madagascar 2 13 0 15 11 0 2 2 Malawi 22 20 0 42 2 0 20 20
Page 16, April 2006

Table 6A
2004/2005Cotton Production, Supply and Distribution by Country
1,000 Metric Tons MY
Malaysia Mali
Beg. Stocks UseTotal Supply Imports Production 8 0 55 63 54
56 239 0 295 4
Loss 0 0
Exports 0
207
End. Stocks 8
84 Mauritius 4 0 14 18 14 0 1 3 Mexico 249 136 394 779 457 5 29 287 Moldova; Republic of 1 0 2 3 2 0 0 1 Morocco 6 0 33 39 33 0 0 7 Mozambique 8 24 1 33 2 0 22 9 Netherlands 1 0 2 3 2 0 1 1 Nicaragua 0 2 0 3 0 0 2 0 Niger 1 1 0 2 1 0 0 1 Nigeria 28 91 15 135 82 0 22 31 Norway 0 0 0 0 0 0 0 0 Pakistan 442 2,460 370 3,272 2,341 5 82 845 Panama 0 0 1 1 1 0 0 0 Paraguay 28 65 0 93 7 0 65 22 Peru 49 65 48 162 90 0 2 70 Philippines 9 2 34 46 35 0 0 11 Poland 3 0 45 48 44 0 0 4 Portugal 22 0 71 93 71 0 0 21 Romania 9 0 17 25 19 0 0 7 Russian Federation 43 0 316 359 310 0 0 48 Senegal 6 22 0 27 4 0 15 8 Serbia and Montenegro 1 0 2 3 2 0 0 0 Singapore 2 0 12 14 0 0 12 2 Slovakia 1 0 3 4 2 0 2 0 Slovenia 2 0 10 13 10 0 0 3 Somalia 0 2 1 3 3 0 0 0 South Africa; Republic of 21 21 27 69 54 0 0 15 Spain 25 109 16 150 61 0 51 38 Sri Lanka 1 1 1 2 2 0 0 0 Sudan 17 114 0 131 2 0 62 67 Sweden 0 0 0 1 0 0 0 0 Switzerland 3 0 10 13 10 0 1 2 Syria 65 348 0 413 152 0 152 109 Taiwan 76 0 291 368 261 0 0 106 Tajikistan; Republic of 34 174 0 208 33 0 133 42 Tanzania; United Republic of 33 114 0 147 15 0 82 51 Thailand 91 12 497 600 468 5 0 126 Togo 27 71 0 97 3 0 62 32 Tunisia 3 2 22 27 24 0 0 3 Turkey 322 904 742 1,968 1,546 0 33 389 Turkmenistan 87 200 0 287 90 0 82 115 Uganda 17 44 0 61 4 3 24 29 Ukraine 3 0 14 17 13 0 0 4 United Kingdom 3 0 18 21 19 0 0 3 United States 763 5,062 6 5,832 1,457 32 3,137 1,206 Uruguay 0 0 1 1 1 0 0 0 Uzbekistan; Republic of 201 1,132 0 1,333 191 0 860 283 Venezuela 6 13 10 29 22 0 0 7 Vietnam 29 10 148 188 147 0 0 41 Yemen 2 14 0 16 5 0 9 2 Zambia 56 76 0 132 14 0 49 69 Zimbabwe 38 76 0 115 22 3 54 35
World Total 9,383 26,235 7,249 42,868 23,710 -235 7,570 11,823
* Loss for countries outside the United States reflects cotton lost or destroyed while in the marketing channel. For the United States, loss reflects the difference between stocks as reported by the Bureau of the Census and implict stocks based on supply plus total use. A negative "loss" is a positive number.
Page 17, April 2006
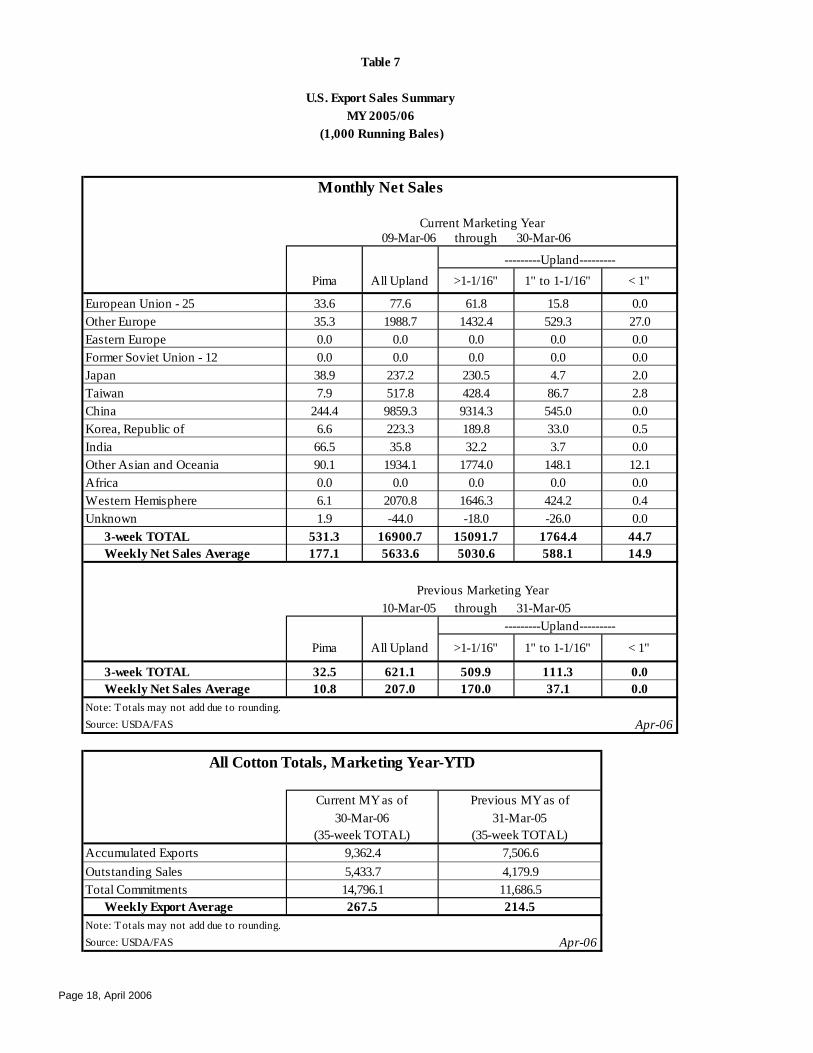
Table 7
U.S. Export Sales Summary MY 2005/06
(1,000 Running Bales)
Monthly Net Sales
Current Marketing Year 09-Mar-06 through 30-Mar-06
---------Upland---------Pima All Upland >1-1/16" 1" to 1-1/16" < 1"
European Union - 25 33.6 77.6 61.8 15.8 0.0 Other Europe 35.3 1988.7 1432.4 529.3 27.0 Eastern Europe 0.0 0.0 0.0 0.0 0.0 Former Soviet Union - 12 0.0 0.0 0.0 0.0 0.0 Japan 38.9 237.2 230.5 4.7 2.0 Taiwan 7.9 517.8 428.4 86.7 2.8 China 244.4 9859.3 9314.3 545.0 0.0 Korea, Republic of 6.6 223.3 189.8 33.0 0.5 India 66.5 35.8 32.2 3.7 0.0 Other Asian and Oceania 90.1 1934.1 1774.0 148.1 12.1 Africa 0.0 0.0 0.0 0.0 0.0 W es tern Hemis phere 6.1 2070.8 1646.3 424.2 0.4 Unknown 1.9 -44.0 -18.0 -26.0 0.0
3-week TOTAL 531.3 16900.7 15091.7 1764.4 44.7 Weekly Net Sales Average 177.1 5633.6 5030.6 588.1 14.9
Previous Marketing Year10-Mar-05 through 31-Mar-05
---------Upland---------
Pima All Upland >1-1/16" 1" to 1-1/16" < 1"
3-week TOTAL 32.5 621.1 509.9 111.3 0.0 Weekly Net Sales Average 10.8 207.0 170.0 37.1 0.0
Note: T ot als may not add due t o rounding. Source: USDA/FAS Apr-06
All Cotton Totals, Marketing Year-YTD
Current MY as of Previous MY as of 30-Mar-06 31-Mar-05
(35-week TOTAL) (35-week TOTAL) Accumulated Exports 9,362.4 7,506.6 Outstanding Sales 5,433.7 4,179.9 Total Commitments 14,796.1 11,686.5
Weekly Export Average 267.5 214.5 Note: T ot als may not add due t o rounding. Source: USDA/FAS Apr-06
Page 18, April 2006

Table 8
Northern European Cotton Price Quotations and USDA's Adjusted World Price (in cents per pound)
Date Cotlook Northen Europe (NE)
Lowest U.S. Quote
U.S. - NE Lowest NE Quote Adjusted World Price
Yearly Average 1994/1995 91.08 1995/1996 85.52 1996/1997 78.60 1997/1998 72.15 1998/1999 58.90 1999/2000 52.88 2000/2001 57.34 2001/2002 41.80 2002/2003 55.68 2003/2004 69.18 2004/2005 53.53 2005/2006 57.22
94.02 93.02 82.71 77.23 69.42 60.98 61.91 45.06 60.07 72.76 56.70 60.65
2.94 7.50 4.12 5.08
10.53 8.10 4.57 3.26 4.40 3.58 3.18 3.42
81.06 76.12 81.95 71.14 74.89 64.12 66.91 58.24 57.81 44.64 49.35 38.91 54.79 44.00 41.39 28.49 53.44 43.09 69.23 55.06 50.23 38.91 56.50 41.22
Monthly Average August 2004 53.56 September 2004 56.57 October 2004 52.68 November 2004 49.21 December 2004 48.60 January 2005 51.28 February 2005 52.17 March 2005 56.40 April 2005 56.95 May 2005 55.84 June 2005 53.99 July 2005 55.06 August 2005 54.07 September 2005 54.86 October 2005 58.37 November 2005 56.83 December 2005 56.53 January 2006 59.10 February 2006 60.75 March 2006 59.22
53.21 56.08 53.75 52.57 52.62 55.10 54.05 60.20 61.26 59.81 59.06 62.79 56.83 59.40 62.67 60.16 60.76 62.14 62.68 61.75
-0.35 -0.49 1.07 3.36 4.02 3.82 1.89 3.81 4.31 3.97 5.07 7.73 2.76 4.53 4.30 3.33 4.24 3.04 1.93 2.53
52.02 38.13 53.00 41.54 51.45 37.65 47.84 34.33 48.17 33.54 50.16 36.08 51.95 36.65 55.73 41.27 55.79 42.12 55.54 42.30 53.01 40.91 53.21 42.07 53.26 38.54 54.34 38.49 56.68 42.92 55.51 41.58 55.48 41.01 58.27 43.38 60.16 45.22 58.95 44.60
Weekly Average 10/6/2005 57.11 61.70 4.59 55.80 41.63 10/13/2005 58.48 62.90 4.42 56.60 43.00 10/20/2005 59.34 63.85 4.51 57.65 43.86 10/27/2005 58.68 62.80 4.12 57.00 43.20 11/3/2005 57.47 60.95 3.48 55.75 41.99 11/10/2005 57.16 59.95 2.79 55.70 41.68 11/17/2005 57.02 59.90 2.88 55.80 41.54 11/24/2005 56.57 60.30 3.73 55.35 41.09 12/1/2005 56.02 59.95 3.93 54.95 40.54 12/8/2005 55.75 59.60 3.85 54.75 40.27 12/15/2005 56.51 60.95 4.44 55.30 41.03 12/22/2005 56.77 61.10 4.33 55.65 41.29 12/30/2005 57.35 61.50 4.15 56.50 1/5/2006 57.88 62.08 4.20 57.25 42.27 1/12/2006 58.63 62.00 3.37 58.00 43.15 1/19/2006 59.06 61.90 2.84 58.25 43.58 1/26/2006 59.96 62.65 2.69 58.85 44.52 2/2/2006 59.73 62.05 2.32 58.85 44.29 2/9/2006 60.92 62.90 1.98 59.95 45.48 2/16/2006 61.00 62.65 1.65 60.20 45.56 2/23/2006 60.98 62.80 1.82 60.65 45.54 3/2/2006 60.04 62.40 2.36 59.95 44.60 3/7/2006 59.00 61.42 2.42 58.58
1. The Cotlook Northern Europe quote is the average of the five lowest quotes of the following descriptions (all 1-3/32"): Memphis Terr.; Calif. Ariz; Mexico; Central America; Paraguayan; Turkish; Uzbeki; Pakistani 1503; Indian H-4; Chinese Type 329; West African; Tanzanian; Greek; Syrian; and Australian. Prior to 1 August 2004, was refered to as the "A-Index"
2. Reflects incorporation of forward shipment quotations but does not include the Secretary's discretionary adjustments Averages for August 1998 and forward reflect 1998/99 quotations; others are 1997/98 quotations SOURCE: Cotlook, Ltd. United Kingdom
Page 19, April 2006
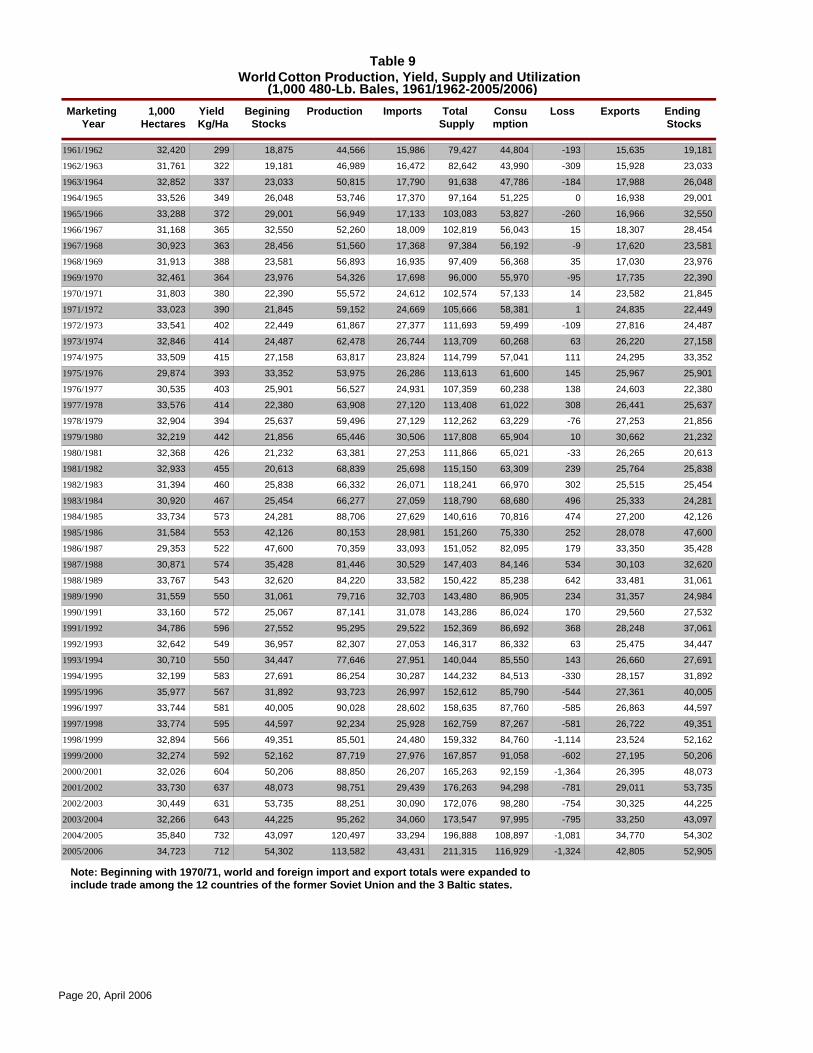
Table 9 World Cotton Production, Yield, Supply and Utilization
(1,000 480-Lb. Bales, 1961/1962-2005/2006) Marketing 1,000 Yield Begining Production Imports Total Consu Loss Exports Ending
Year Hectares Kg/Ha Stocks Supply mption Stocks
-19315,986299/
-30916,472322/
-18417,790337/
017,370349/
-26017,133372/
1518,009365/
-917,368363/
3516,935388/
-9517,698364/
1424,612380/
124,669390/
-10927,377402/
6326,744414/
11123,824415/
14526,286393/
13824,931403/
30827,120414/
-7627,129394/
1030,506442/
-3327,253426/
23925,698455/
30226,071460/
49627,059467/
47427,629573/
25228,981553/
17933,093522/
53430,529574/
64233,582543/
23432,703550/
17031,078572/
36829,522596/
6327,053549/
14327,951550/
-33030,287583/
-54426,997567/
-58528,602581/
-58125,928595/
-1,11424,480566/
-60227,976592/
-1,36426,207604/
-78129,439637/
-75430,090631/
-79534,060643/
-1,08133,294732/
-1,32443,431712/
18,875 44,566 19,181 44,804 15,635 79,427 1961 1962 32,420
19,181 46,989 23,033 43,990 15,928 82,642 1962 1963 31,761
23,033 50,815 26,048 47,786 17,988 91,638 1963 1964 32,852
26,048 53,746 29,001 51,225 16,938 97,164 1964 1965 33,526
29,001 56,949 32,550 53,827 16,966 103,083 1965 1966 33,288
32,550 52,260 28,454 56,043 18,307 102,819 1966 1967 31,168
28,456 51,560 23,581 56,192 17,620 97,384 1967 1968 30,923
23,581 56,893 23,976 56,368 17,030 97,409 1968 1969 31,913
23,976 54,326 22,390 55,970 17,735 96,000 1969 1970 32,461
22,390 55,572 21,845 57,133 23,582 102,574 1970 1971 31,803
21,845 59,152 22,449 58,381 24,835 105,666 1971 1972 33,023
22,449 61,867 24,487 59,499 27,816 111,693 1972 1973 33,541
24,487 62,478 27,158 60,268 26,220 113,709 1973 1974 32,846
27,158 63,817 33,352 57,041 24,295 114,799 1974 1975 33,509
33,352 53,975 25,901 61,600 25,967 113,613 1975 1976 29,874
25,901 56,527 22,380 60,238 24,603 107,359 1976 1977 30,535
22,380 63,908 25,637 61,022 26,441 113,408 1977 1978 33,576
25,637 59,496 21,856 63,229 27,253 112,262 1978 1979 32,904
21,856 65,446 21,232 65,904 30,662 117,808 1979 1980 32,219
21,232 63,381 20,613 65,021 26,265 111,866 1980 1981 32,368
20,613 68,839 25,838 63,309 25,764 115,150 1981 1982 32,933
25,838 66,332 25,454 66,970 25,515 118,241 1982 1983 31,394
25,454 66,277 24,281 68,680 25,333 118,790 1983 1984 30,920
24,281 88,706 42,126 70,816 27,200 140,616 1984 1985 33,734
42,126 80,153 47,600 75,330 28,078 151,260 1985 1986 31,584
47,600 70,359 35,428 82,095 33,350 151,052 1986 1987 29,353
35,428 81,446 32,620 84,146 30,103 147,403 1987 1988 30,871
32,620 84,220 31,061 85,238 33,481 150,422 1988 1989 33,767
31,061 79,716 24,984 86,905 31,357 143,480 1989 1990 31,559
25,067 87,141 27,532 86,024 29,560 143,286 1990 1991 33,160
27,552 95,295 37,061 86,692 28,248 152,369 1991 1992 34,786
36,957 82,307 34,447 86,332 25,475 146,317 1992 1993 32,642
34,447 77,646 27,691 85,550 26,660 140,044 1993 1994 30,710
27,691 86,254 31,892 84,513 28,157 144,232 1994 1995 32,199
31,892 93,723 40,005 85,790 27,361 152,612 1995 1996 35,977
40,005 90,028 44,597 87,760 26,863 158,635 1996 1997 33,744
44,597 92,234 49,351 87,267 26,722 162,759 1997 1998 33,774
49,351 85,501 52,162 84,760 23,524 159,332 1998 1999 32,894
52,162 87,719 50,206 91,058 27,195 167,857 1999 2000 32,274
50,206 88,850 48,073 92,159 26,395 165,263 2000 2001 32,026
48,073 98,751 53,735 94,298 29,011 176,263 2001 2002 33,730
53,735 88,251 44,225 98,280 30,325 172,076 2002 2003 30,449
44,225 95,262 43,097 97,995 33,250 173,547 2003 2004 32,266
43,097 120,497 54,302 108,897 34,770 196,888 2004 2005 35,840
54,302 113,582 52,905 116,929 42,805 211,315 2005 2006 34,723
Note: Beginning with 1970/71, world and foreign import and export totals were expanded to include trade among the 12 countries of the former Soviet Union and the 3 Baltic states.
Page 20, April 2006

Table 10 United States Cotton Production, Yield, Supply and Utilization
(1,000 480-Lb. Bales, 1961/1962-2005/2006) Marketing 1,000 Yield Begining Production Imports Total Consu Loss Exports Ending
Year Hectares Kg/Ha Stocks Supply mption Stocks
7,699-280153492/
-386137512/
-257135579/
-92118580/
-341118591/
-62105538/
6,584-86149501/
6,544-12468579/
5,843-24952486/
4,203-23237492/
3,258-15072491/
4,221-30534568/
3,808-16048583/
5,708-11234494/
3,681-14092508/
2,928-8638522/
5,34785583/
3,958-2834471/
3,000-1435613/
2,668-33528453/
6,632-12326608/
7,937-4220661/
2,77523812569/
4,102-7424673/
9,348-15433706/
5,026-803618/
5,771-1822792/
7,0921655694/
3,000-1632688/
2,344-2854711/
3,704813731/
4,662-1901785/
3,530-86679/
2,650-3820794/
2,60927408602/
3,971-8403791/
3,8874113754/
3,939-394439701/
3,91514597680/
6,000-48316708/
7,44818021790/
5,38516667746/
3,50620045818/
5,53814629958/
6,500-3230938/
7,056 14,283 9,017 5,056 21,492 1961 1962 6,327
7,699 14,827 11,136 8,484 3,429 22,663 1962 1963 6,301
11,136 15,294 12,351 8,696 5,775 26,565 1963 1964 5,752
12,351 15,144 14,249 9,261 4,195 27,613 1964 1965 5,689
14,249 14,951 17,028 9,596 3,035 29,318 1965 1966 5,510
17,028 9,555 12,344 9,574 4,832 26,688 1966 1967 3,866
12,344 7,443 9,077 4,361 19,936 1967 1968 3,236
6,584 10,925 8,332 2,825 17,577 1968 1969 4,112
6,544 9,990 8,114 2,878 16,586 1969 1970 4,474
5,843 10,192 8,204 3,897 16,072 1970 1971 4,514
4,203 10,477 8,259 3,385 14,752 1971 1972 4,643
3,258 13,704 7,769 5,311 16,996 1972 1973 5,255
4,221 12,974 7,472 6,123 17,243 1973 1974 4,844
3,808 11,540 5,860 3,926 15,382 1974 1975 5,086
5,708 8,302 7,250 3,311 14,102 1975 1976 3,560
3,681 10,581 6,674 4,784 14,300 1976 1977 4,417
2,928 14,389 6,483 5,484 17,322 1977 1978 5,372
5,347 10,856 6,352 6,180 16,207 1978 1979 5,018
3,958 14,629 6,506 9,229 18,592 1979 1980 5,193
3,000 11,122 5,891 5,926 14,150 1980 1981 5,348
2,668 15,646 5,264 6,567 18,340 1981 1982 5,601
6,632 11,963 5,513 5,207 18,615 1982 1983 3,939
7,937 7,771 5,921 6,786 15,720 1983 1984 2,973
2,775 12,982 5,538 6,215 15,781 1984 1985 4,200
4,102 13,432 6,413 1,960 17,567 1985 1986 4,140
9,348 9,731 7,452 6,684 19,082 1986 1987 3,427
5,026 14,760 7,617 6,582 19,788 1987 1988 4,059
5,771 15,411 7,782 6,148 21,187 1988 1989 4,835
7,092 12,196 8,759 7,694 19,290 1989 1990 3,860
3,000 15,505 8,657 7,793 18,509 1990 1991 4,748
2,344 17,614 9,613 6,646 19,971 1991 1992 5,245
3,704 16,218 10,250 5,201 19,923 1992 1993 4,501
4,662 16,134 10,418 6,862 20,802 1993 1994 5,173
3,530 19,662 11,198 9,402 23,212 1994 1995 5,391
2,650 17,900 10,647 7,675 20,958 1995 1996 6,478
2,609 18,942 11,126 6,865 21,954 1996 1997 5,216
3,971 18,793 11,349 7,500 22,777 1997 1998 5,425
3,887 13,918 10,401 4,298 18,244 1998 1999 4,324
3,939 16,968 10,194 6,750 21,004 1999 2000 5,433
3,915 17,188 8,862 6,740 21,119 2000 2001 5,282
6,000 20,303 7,696 11,000 26,324 2001 2002 5,596
7,448 17,209 7,273 11,900 24,724 2002 2003 5,025
5,385 18,255 6,221 13,758 23,685 2003 2004 4,858
3,506 23,251 6,693 14,409 26,786 2004 2005 5,284
5,538 23,900 6,000 17,000 29,468 2005 2006 5,545
Note: Beginning with 1970/71, world and foreign import and export totals were expanded to include trade among the 12 countries of the former Soviet Union and the 3 Baltic states.
Page 21, April 2006
1
01 2
02 3
03 4
04 5
05 6
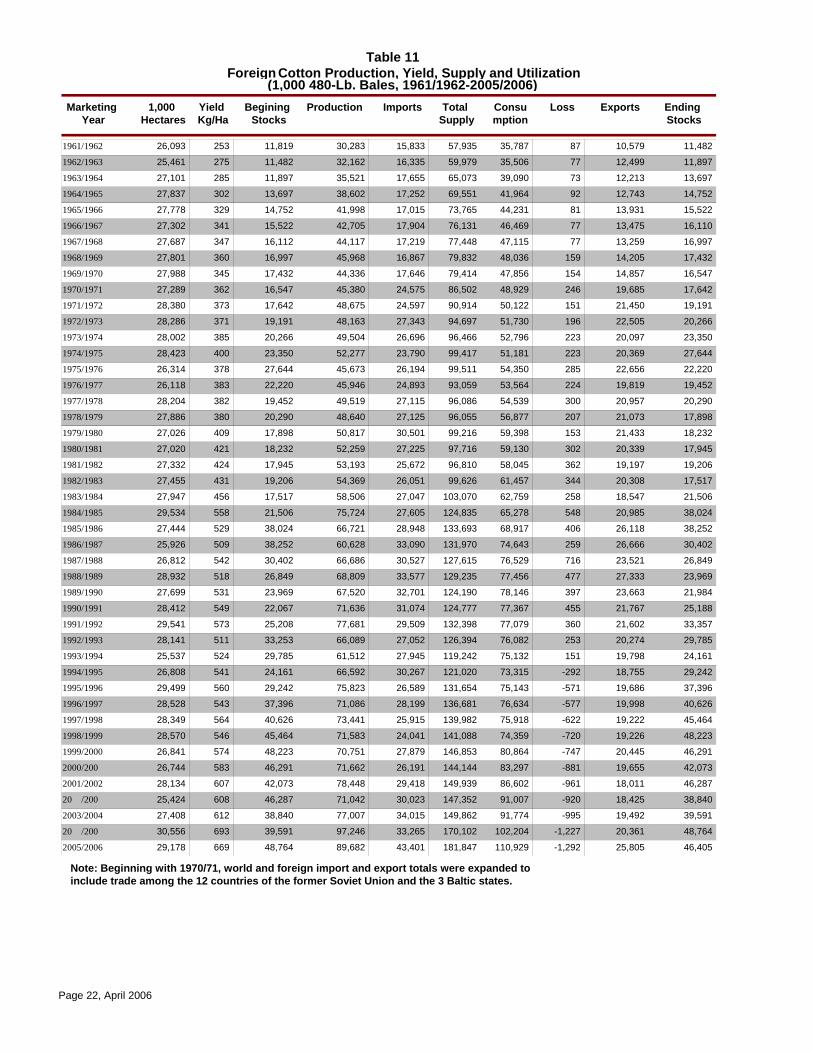
Table 11 Foreign Cotton Production, Yield, Supply and Utilization
(1,000 480-Lb. Bales, 1961/1962-2005/2006) Marketing 1,000 Yield Begining Production Imports Total Consu Loss Exports Ending
Year Hectares Kg/Ha Stocks Supply mption Stocks
8715,833253/
7716,335275/
7317,655285/
9217,252302/
8117,015329/
7717,904341/
7717,219347/
15916,867360/
15417,646345/
24624,575362/
15124,597373/
19627,343371/
22326,696385/
22323,790400/
28526,194378/
22424,893383/
30027,115382/
20727,125380/
15330,501409/
30227,225421/
36225,672424/
34426,051431/
25827,047456/
54827,605558/
40628,948529/
25933,090509/
71630,527542/
47733,577518/
39732,701531/
45531,074549/
36029,509573/
25327,052511/
15127,945524/
-29230,267541/
-57126,589560/
-57728,199543/
-62225,915564/
-72024,041546/
-74727,879574/
-88126,191583/
-96129,418607/
-92030,023608/
-99534,015612/
-1,22733,265693/
-1,29243,401669/
11,819 30,283 11,482 35,787 10,579 57,935 1961 1962 26,093
11,482 32,162 11,897 35,506 12,499 59,979 1962 1963 25,461
11,897 35,521 13,697 39,090 12,213 65,073 1963 1964 27,101
13,697 38,602 14,752 41,964 12,743 69,551 1964 1965 27,837
14,752 41,998 15,522 44,231 13,931 73,765 1965 1966 27,778
15,522 42,705 16,110 46,469 13,475 76,131 1966 1967 27,302
16,112 44,117 16,997 47,115 13,259 77,448 1967 1968 27,687
16,997 45,968 17,432 48,036 14,205 79,832 1968 1969 27,801
17,432 44,336 16,547 47,856 14,857 79,414 1969 1970 27,988
16,547 45,380 17,642 48,929 19,685 86,502 1970 1971 27,289
17,642 48,675 19,191 50,122 21,450 90,914 1971 1972 28,380
19,191 48,163 20,266 51,730 22,505 94,697 1972 1973 28,286
20,266 49,504 23,350 52,796 20,097 96,466 1973 1974 28,002
23,350 52,277 27,644 51,181 20,369 99,417 1974 1975 28,423
27,644 45,673 22,220 54,350 22,656 99,511 1975 1976 26,314
22,220 45,946 19,452 53,564 19,819 93,059 1976 1977 26,118
19,452 49,519 20,290 54,539 20,957 96,086 1977 1978 28,204
20,290 48,640 17,898 56,877 21,073 96,055 1978 1979 27,886
17,898 50,817 18,232 59,398 21,433 99,216 1979 1980 27,026
18,232 52,259 17,945 59,130 20,339 97,716 1980 1981 27,020
17,945 53,193 19,206 58,045 19,197 96,810 1981 1982 27,332
19,206 54,369 17,517 61,457 20,308 99,626 1982 1983 27,455
17,517 58,506 21,506 62,759 18,547 103,070 1983 1984 27,947
21,506 75,724 38,024 65,278 20,985 124,835 1984 1985 29,534
38,024 66,721 38,252 68,917 26,118 133,693 1985 1986 27,444
38,252 60,628 30,402 74,643 26,666 131,970 1986 1987 25,926
30,402 66,686 26,849 76,529 23,521 127,615 1987 1988 26,812
26,849 68,809 23,969 77,456 27,333 129,235 1988 1989 28,932
23,969 67,520 21,984 78,146 23,663 124,190 1989 1990 27,699
22,067 71,636 25,188 77,367 21,767 124,777 1990 1991 28,412
25,208 77,681 33,357 77,079 21,602 132,398 1991 1992 29,541
33,253 66,089 29,785 76,082 20,274 126,394 1992 1993 28,141
29,785 61,512 24,161 75,132 19,798 119,242 1993 1994 25,537
24,161 66,592 29,242 73,315 18,755 121,020 1994 1995 26,808
29,242 75,823 37,396 75,143 19,686 131,654 1995 1996 29,499
37,396 71,086 40,626 76,634 19,998 136,681 1996 1997 28,528
40,626 73,441 45,464 75,918 19,222 139,982 1997 1998 28,349
45,464 71,583 48,223 74,359 19,226 141,088 1998 1999 28,570
48,223 70,751 46,291 80,864 20,445 146,853 1999 2000 26,841
46,291 71,662 42,073 83,297 19,655 144,144 2000 200 26,744
42,073 78,448 46,287 86,602 18,011 149,939 20 200 28,134
46,287 71,042 38,840 91,007 18,425 147,352 20 200 25,424
38,840 77,007 39,591 91,774 19,492 149,862 20 200 27,408
39,591 97,246 48,764 102,204 20,361 170,102 20 200 30,556
48,764 89,682 46,405 110,929 25,805 181,847 20 200 29,178
Note: Beginning with 1970/71, world and foreign import and export totals were expanded to include trade among the 12 countries of the former Soviet Union and the 3 Baltic states.
Page 22, April 2006