Embed Size (px)
Citation preview

2018 U.S. Seniors Housing Development Costs Report
December 2018
U.S. SENIORS HOUSING DEVELOPMENT COSTS REPORT
In This Issue:
•ExecutiveSummary..................................................................................................2
•Introduction............................................................................................................3
•SiteAcquisitionCosts.............................................................................................4
•HardCosts...............................................................................................................5
•SoftCosts.................................................................................................................5
•FF&ECosts...............................................................................................................6
•ReturnsonCost........................................................................................................7
•DevelopmentActivity&2019CostsForecast...........................................................8
CBRE Valuation & Advisory Services | CBRE Research © 2018 CBRE, Inc. | 2
December 2018U.S. SENIORS HOUSING DEVELOPMENT COSTS REPORT
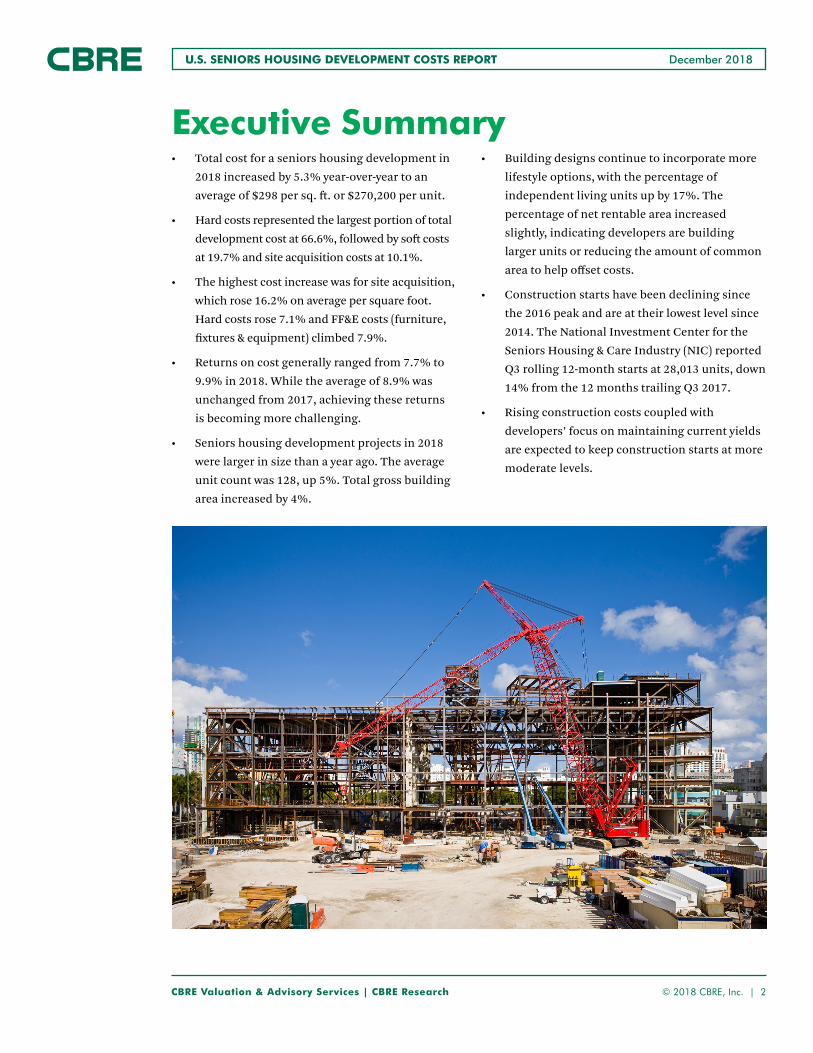
• Total cost for a seniors housing development in
2018 increased by 5.3% year-over-year to an
average of $298 per sq. ft. or $270,200 per unit.
• Hard costs represented the largest portion of total
development cost at 66.6%, followed by soft costs
at 19.7% and site acquisition costs at 10.1%.
• The highest cost increase was for site acquisition,
which rose 16.2% on average per square foot.
Hard costs rose 7.1% and FF&E costs (furniture,
fixtures & equipment) climbed 7.9%.
• Returns on cost generally ranged from 7.7% to
9.9% in 2018. While the average of 8.9% was
unchanged from 2017, achieving these returns
is becoming more challenging.
• Seniors housing development projects in 2018
were larger in size than a year ago. The average
unit count was 128, up 5%. Total gross building
area increased by 4%.
Executive Summary• Building designs continue to incorporate more
lifestyle options, with the percentage of
independent living units up by 17%. The
percentage of net rentable area increased
slightly, indicating developers are building
larger units or reducing the amount of common
area to help offset costs.
• Construction starts have been declining since
the 2016 peak and are at their lowest level since
2014. The National Investment Center for the
Seniors Housing & Care Industry (NIC) reported
Q3 rolling 12-month starts at 28,013 units, down
14% from the 12 months trailing Q3 2017.
• Rising construction costs coupled with
developers’ focus on maintaining current yields
are expected to keep construction starts at more
moderate levels.

CBRE Valuation & Advisory Services | CBRE Research © 2018 CBRE, Inc. | 3
December 2018U.S. SENIORS HOUSING DEVELOPMENT COSTS REPORT
Figure 2: Development Cost Breakout (%)
Source: CBRE Valuation & Advisory Services and CBRE Research, Q4 2018.
Development cost metrics are vitally important for parties involved in the development process, for construction
lenders and for buyers and sellers of seniors housing assets. Costs determine replacement value and provide
intelligence for investment decisions. This report is primarily focused on measuring the annual change in
seniors housing development costs and their impact on developers’ return on costs.
CBRE Valuation & Advisory Services’ Seniors Housing Practice completed valuations of more than 2,000 seniors
housing properties across the U.S. in 2018. The data and analysis in this report were derived from the valuations
of 330 seniors housing developments that were scheduled for delivery in 2018 and 2019.
Introduction
CHARACTERISTICS SUMMARY
Cost ($) Average Year-over-Year Change (%) First Quartile Median Third Quartile
Total 35,750,000 23,200,000 30,975,000 43,525,000Per Revenue Unit 270,200 5.5 227,200 261,500 316,000
Per Sq. Ft. 298 5.3 226 298 346
Property Characteristics Average
Year of Construction 2018-2019
Total Revenue Units 128
Independent Living 41
Assisted Living 50
Memory Care 37
Site Area (Acres) 7.74
Gross Building Area (Sq. Ft.) 129,000
Net Rentable Area (Sq. Ft.) 75,100
Figure 1: Seniors Housing Development Costs Summary
Source: CBRE Valuation & Advisory Services and CBRE Research, Q4 2018. Note: The first quartile is the median of the values below the complete set median; the third quartile is the median of the values which are greater than the complete set median. % change reflects variation from 2017 data.
Total cost for a seniors housing development in 2018
increased by 5.3% year-over-year to an average of $298
per sq. ft. or $270,200 per unit. Hard costs
represented the largest portion of total development
cost at 66.6%, followed by soft costs at 19.7% and site
costs at 10.1%.
Returns on cost, when measured as stabilized net
operating income as a percentage of overall
development costs, generally ranged from 7.7% to
9.9% in 2018. The average of 8.9% was unchanged
from 2017.
The properties in the data set include either stand-
alone or a combination of independent living,
assisted living and memory care communities.
10.1
66.6
19.7
3.6Site
Hard
Soft
FF&E

CBRE Valuation & Advisory Services | CBRE Research © 2018 CBRE, Inc. | 4
December 2018U.S. SENIORS HOUSING DEVELOPMENT COSTS REPORT
Site acquisition costs for fully permitted land represent a significant component of total development cost—an
average of $32.25 per sq. ft. of the gross building area. Site costs range from $16,900 to $33,100 per revenue unit for
an average of $28,100.
While the average land cost increased by 15.2% per revenue unit and 16.2% per sq. ft. of gross building area this
year, its percentage of total construction cost rose to 10.1% from 9.5%.
Site acquisition costs range significantly based on metropolitan market and the project’s location within the metro
area, density, regulatory climate and demographic trends.
An example at the lower end of the range is Syracuse, N.Y. with land cost accounting for 6% of total construction
cost ($10,000 per unit), while a high-end example is Southern California with land cost accounting for 18% of
total construction cost ($50,000 per unit).
Site Acquisition Costs
Figure 3: Site Acquisition Costs
Source: CBRE Valuation & Advisory Services and CBRE Research, Q4 2018.
Note: The first quartile is the median of the values below the complete set median; the third quartile is the median of the values which are greater than the complete set median. % change reflects variation from 2017 data.
Site Acquisition Costs Average Year-over-Year Change (%) First Quartile Median Third Quartile
Site Area (Acres) 7.74 23.9 4.90 6.23 7.86
Nominal Site Cost ($) 3,575,000 23.3 1,775,000 2,550,000 4,025,000
Cost Per ($)
Site Area Sq. Ft. 18.30 17.3 5.50 10.00 15.00
Revenue Unit 28,100 15.2 16,900 23,500 33,100
Gross Building Area (Sq. Ft.) 32.25 16.2 18.50 24.25 41.00
% of Total Development Cost 10.1 6.3 6.6 9.5 11.5
CBRE Valuation & Advisory Services | CBRE Research © 2018 CBRE, Inc. | 5
December 2018U.S. SENIORS HOUSING DEVELOPMENT COSTS REPORT
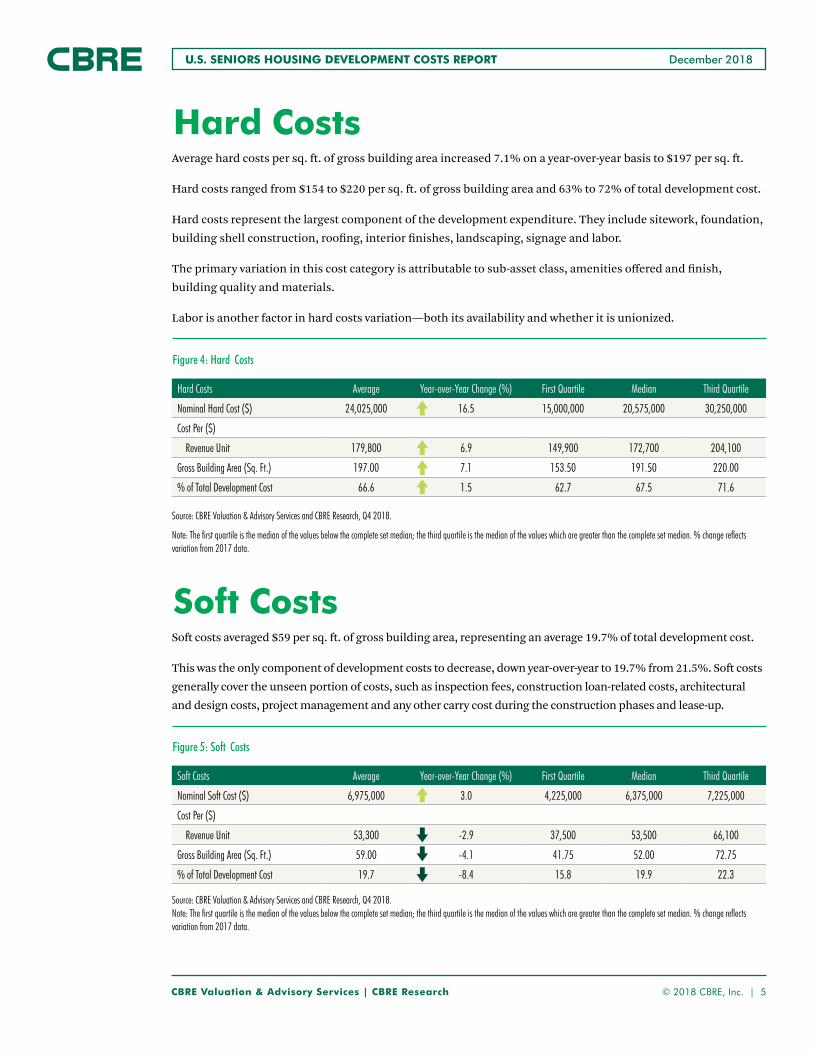
Average hard costs per sq. ft. of gross building area increased 7.1% on a year-over-year basis to $197 per sq. ft.
Hard costs ranged from $154 to $220 per sq. ft. of gross building area and 63% to 72% of total development cost.
Hard costs represent the largest component of the development expenditure. They include sitework, foundation,
building shell construction, roofing, interior finishes, landscaping, signage and labor.
The primary variation in this cost category is attributable to sub-asset class, amenities offered and finish,
building quality and materials.
Labor is another factor in hard costs variation—both its availability and whether it is unionized.
Soft costs averaged $59 per sq. ft. of gross building area, representing an average 19.7% of total development cost.
This was the only component of development costs to decrease, down year-over-year to 19.7% from 21.5%. Soft costs
generally cover the unseen portion of costs, such as inspection fees, construction loan-related costs, architectural
and design costs, project management and any other carry cost during the construction phases and lease-up.
Hard Costs
Soft Costs
Figure 4: Hard Costs
Figure 5: Soft Costs
Source: CBRE Valuation & Advisory Services and CBRE Research, Q4 2018.
Note: The first quartile is the median of the values below the complete set median; the third quartile is the median of the values which are greater than the complete set median. % change reflects variation from 2017 data.
Source: CBRE Valuation & Advisory Services and CBRE Research, Q4 2018. Note: The first quartile is the median of the values below the complete set median; the third quartile is the median of the values which are greater than the complete set median. % change reflects variation from 2017 data.
Hard Costs Average Year-over-Year Change (%) First Quartile Median Third Quartile
Nominal Hard Cost ($) 24,025,000 16.5 15,000,000 20,575,000 30,250,000
Cost Per ($)
Revenue Unit 179,800 6.9 149,900 172,700 204,100
Gross Building Area (Sq. Ft.) 197.00 7.1 153.50 191.50 220.00
% of Total Development Cost 66.6 1.5 62.7 67.5 71.6
Soft Costs Average Year-over-Year Change (%) First Quartile Median Third Quartile
Nominal Soft Cost ($) 6,975,000 3.0 4,225,000 6,375,000 7,225,000
Cost Per ($)
Revenue Unit 53,300 -2.9 37,500 53,500 66,100
Gross Building Area (Sq. Ft.) 59.00 -4.1 41.75 52.00 72.75
% of Total Development Cost 19.7 -8.4 15.8 19.9 22.3

CBRE Valuation & Advisory Services | CBRE Research © 2018 CBRE, Inc. | 6
December 2018U.S. SENIORS HOUSING DEVELOPMENT COSTS REPORT
Figure 6: FF&E Costs
Source: CBRE Valuation & Advisory Services and CBRE Research, Q4 2018.
Note: The first quartile is the median of the values below the complete set median; the third quartile is the median of the values which are greater than the complete set median. % change reflects variation from 2017 data.
Furniture, fixtures & equipment (FF&E) costs represented an average of 3.6% of the total development cost and
$9,000 per revenue unit, up by 4.7% year-over-year.
FF&E costs generally cover items that can be moved and have no permanent connection to the structure of
the building.
This cost can be considerable for seniors housing development due to the significant amount of amenity space
and support areas, such as commercial laundry and kitchen facilities.
FF&E Costs
FF&E Costs Average Year-over-Year Change (%) First Quartile Median Third Quartile
Nominal FF&E Cost ($) 1,150,000 7.0 750,000 975,000 1,475,000
Cost Per ($)
Revenue Unit 9,000 4.7 7,000 9,800 11,900
Gross Building Area (Sq. Ft.) 10.25 7.9 7.25 10.50 13.50
% of Total Development Cost 3.6 5.9 2.9 3.7 4.4
CBRE Valuation & Advisory Services | CBRE Research © 2018 CBRE, Inc. | 7
December 2018U.S. SENIORS HOUSING DEVELOPMENT COSTS REPORT
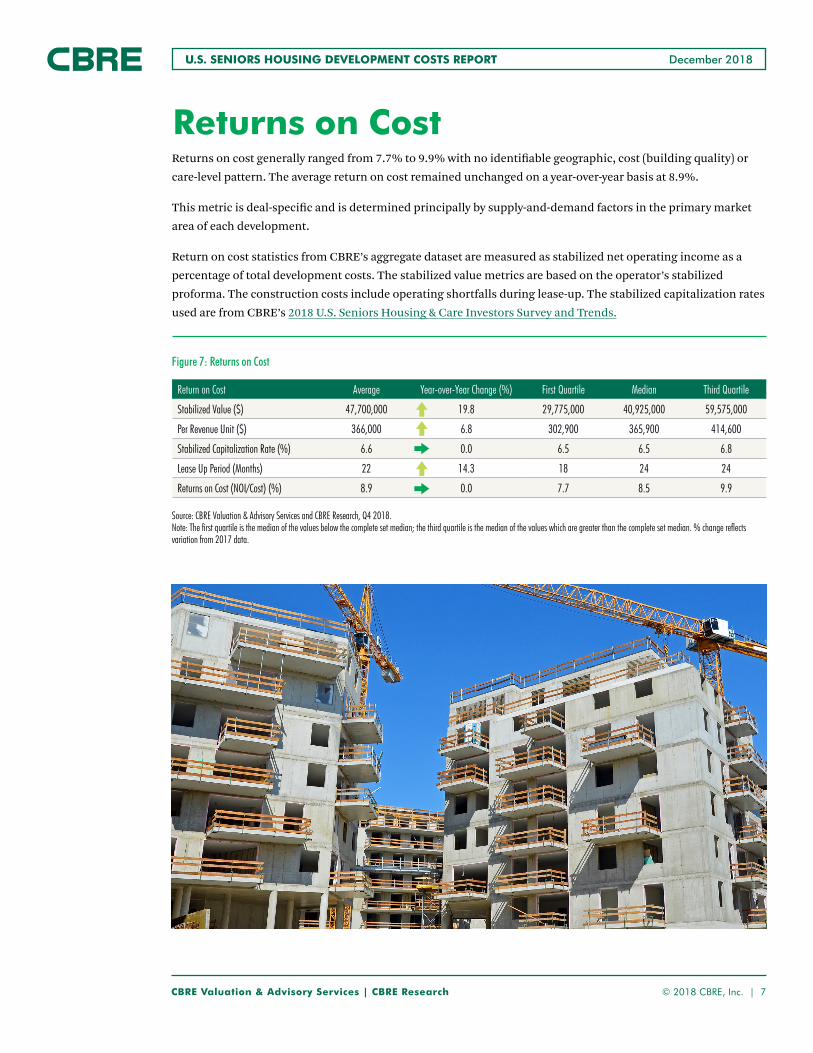
Figure 7: Returns on Cost
Source: CBRE Valuation & Advisory Services and CBRE Research, Q4 2018. Note: The first quartile is the median of the values below the complete set median; the third quartile is the median of the values which are greater than the complete set median. % change reflects variation from 2017 data.
Returns on cost generally ranged from 7.7% to 9.9% with no identifiable geographic, cost (building quality) or
care-level pattern. The average return on cost remained unchanged on a year-over-year basis at 8.9%.
This metric is deal-specific and is determined principally by supply-and-demand factors in the primary market
area of each development.
Return on cost statistics from CBRE’s aggregate dataset are measured as stabilized net operating income as a
percentage of total development costs. The stabilized value metrics are based on the operator’s stabilized
proforma. The construction costs include operating shortfalls during lease-up. The stabilized capitalization rates
used are from CBRE’s 2018 U.S. Seniors Housing & Care Investors Survey and Trends.
Returns on Cost
Return on Cost Average Year-over-Year Change (%) First Quartile Median Third Quartile
Stabilized Value ($) 47,700,000 19.8 29,775,000 40,925,000 59,575,000
Per Revenue Unit ($) 366,000 6.8 302,900 365,900 414,600
Stabilized Capitalization Rate (%) 6.6 0.0 6.5 6.5 6.8
Lease Up Period (Months) 22 14.3 18 24 24
Returns on Cost (NOI/Cost) (%) 8.9 0.0 7.7 8.5 9.9

CBRE Valuation & Advisory Services | CBRE Research © 2018 CBRE, Inc. | 8
December 2018U.S. SENIORS HOUSING DEVELOPMENT COSTS REPORT
Development Activity & 2019 Costs ForecastTwo government statistics portray a rising cost
environment. The construction industry inputs of
the Producer Price Index were up 6.6% year-over-year
in October (the inputs represent all the goods and
services used in construction). The U.S. Bureau of
Labor Statistics also reported a 3.9% year-over-year
increase in weekly hourly earnings for all
construction workers in October.
Construction costs are rising in all commercial real
estate sectors due to increased land, labor and
materials costs. For conventional multifamily assets
(mid-rise: four to seven stories), Fannie Mae reports
that the average construction cost (excluding land)
rose by 6.3% to $211 per sq. ft. this year from $199
per sq. ft. in 2017.
A total of 55,462 units in 498 seniors housing
development projects across the U.S. were under
construction as of Q3 2018, according to the National
Investment Center for the Seniors Housing & Care
Industry (NIC). The total excludes majority nursing
care projects.
Construction starts have been declining since the
2016 peak and are at their lowest level since 2014.
NIC reported Q3 rolling 12-month starts at 28,013
units, down 14% from the year ending Q3 2017.
Continued moderation in development activity is
healthy for the seniors housing market because
demand has not kept pace with new supply, resulting
in dips in occupancy as well as slower year-over-year
rent growth.
Yet, even with lower levels of seniors housing
construction development and less competition for
sites, labor and materials, development costs likely
will rise in 2019.
Labor and materials will remain the chief drivers of
higher costs. While seniors housing development is
slowing, the sector competes with other types of
construction—particularly multifamily, which is
expected to remain at a high level in 2019. Therefore,
the pressure on labor costs should remain. Materials
costs will also continue to climb, especially if trade
tariffs remain.
CBRE expects seniors housing development costs to
rise modestly in 2019, as they did this year.
Rising construction costs, coupled with developers’
focus on maintaining current yields, are expected to
keep construction starts at moderate levels.

December 2018U.S. SENIORS HOUSING DEVELOPMENT COSTS REPORT
Disclaimer: Information contained herein, including projections, has been obtained from sources believed to be reliable. While we do not doubt its accuracy, we have not verified it and make no guarantee, warranty or representation about it. It is your responsibility to confirm independently its accuracy and completeness. This information is presented exclusively for use by CBRE clients and professionals and all rights to the material are reserved and cannot be reproduced without prior written permission of CBRE.
To learn more about CBRE Research, or to access additional research reports, please visit the Global Research Gateway at www.cbre.com/researchgateway.
Additional U.S. research from CBRE can be found here.
SpencerG.Levy Chairman of Americas Research and Senior Economic Advisor +1 617 912 5236 [email protected] Follow Spencer on Twitter: @SpencerGLevy
ZachBowyer,MAI Senior Managing Director Seniors Housing & Care Practice Leader +1 617 217 6032 [email protected]
DanielLincoln,MAIVice President Seniors Housing & Care +1 205 5825733 [email protected]
BennettJohnsonVice President Seniors Housing & Care Practice Leader +1 213 613 3081 [email protected]
RichardWest,MAIExecutive Managing Director Valuation & Advisory Services 213 613 3344 [email protected]
CBRE Valuation & Advisory Services’ seniors housing & care specialty practice is dedicated to assisting our clients to better understand the dynamics of a thriving seniors housing and health care market. CBRE offers corporate-wide access to the most advanced information systems and analytical tools in the real estate industry. This allows for accurate and reliable valuations that are critical to the health of every real estate investment and loan.
Contact our team to arrange a customized presentation of these results or for more detailed information on a specific market or property type.
www.cbre.com/SHVAS
Join our Mailing List
JeanetteI.RiceCRE®Americas Head of Multifamily Research +1 214 979 6169 [email protected] Follow Jeanette on Twitter: @RiceJeanette