Embed Size (px)
Citation preview

United States Department of Agriculture
Forest Service
Forest Products Laboratory
Research PaperFPL-RP-492
Structural Performance of Light-Frame Roof Assemblies I. Truss Assemblies With High Truss Stiffness Variability
Ronald W. Wolfe Monica McCarthy

Abstract Contents
The first report of a three-part series that covers results of a full-scale roof assemblies research program. The focus of this report is the structural performance of truss assemblies comprising trusses with abnormally high stiffness variability and critical joint strength. Results discussed include properties of truss members and connections. individual truss stiffness and strength. and the structural performance of two full-scale truss roof assemblies. Findings support the use of linear models to predict the behavior of trusses used in residential roof assemblies. linear superposition models to characterize assembly load disbursement. and use of a load sharing increase factor to adjust individual truss load capacity when used in a repetitive member assembly.
Keywords: Roof assembly, Fink truss, truss plate connections, superposition, assembly performance.
September 1989
Wolfe, Ronald W. ; McCarthy, Monica. 1989. Structural performance of light-frame roof assemblies – I. Truss assemblies designed for high variability and wood failure. Res. Pap. FPL-RP-492. Madison. WI: U.S. Department of Agriculture. Forest Service. Forest Products Laboratory.
A limited number of free copies of this publication are available to the public from the Forest Products Laboratory. One Gifford Pinchot Drive, Madison, WI 53705-2398. Laboratory publications are sent to more than 1,000 libraries in the United States and elsewhere.
The Forest Products Laboratory is maintained in cooperation with the University of Wisconsin. This article was written and prepared by U.S. Government employees on official time, and it is therefore in the public domain and not subject to copyright.
This study was conducted in cooperation with Forintek Canada Corp. in an effort to provide an analytical tool to model the behavior of light-frame roof assembly.
Page
Introduction 1 Materials and Methods 2
Truss Fabrication 2 Roof Assembly 2 Testing Facility 3
Loading System 4 Data Acquisition 5
Test Procedure 7 Individual Truss Tests Outside
the Assembly 7 Individual Truss Tests in the Assembly 8
Results 10 Individual Truss Tests 10 Assembly Tests 10
Individual Truss Load 11 Assembly Loads 14 Assembly Load to Failure 15 Failure Sequence 15 Sheathing Displacement 17
Analysis of Results 18 Test Equipment 18 Individual Truss Tests 19 Assembly Loading 20
Individual Trusses 20 Load Distribution 20 Deflection Distribution 24
Assembly Effects on Truss Stiffness Strength 24
Truss Stiffness 26 Truss Strength 27
Summary and Conclusions 30 Acknowledgments 31 Literature Cited 31 Appendix A – Literature Review 32 Appendix B – Sheathing and
Lumber Stiffness Properties 35
Structural Performance of Light-Frame Roof Assemblies I. Truss Assemblies With High Truss Stiffness Variability
Ronald W. Wolfe, Research General Engineer Monica McCarthy, Engineer1
Forest Products Laboratory, Madison, WI
Introduction
Current methods of designing light-frame truss roof assemblies limit innovation potential by ignoring the inherent performance advantages of these assemblies. Truss roof assemblies are currently viewed as a collection of individual trusses connected by a load-distributing element. If the members are spaced less than 24 in. apart, current standards allow a 15 percent increase in individual member bending stresses for load sharing regardless of truss span, spacing, pitch, or material variability. The contribution of the roof sheathing to stiffness or to actual assembly boundary conditions is not considered.
Although current design procedures have resulted in an admirable record of safe performance, roof assembly designs could be improved by more precise definition of the performance mechanics.
The series of three reports will discuss the structural performance of light-frame roof assemblies. This report, part I of the series, provides an evaluation of the structural performance of two full-scale, light-framed, metal-plate-connected wood truss roof assemblies. The purpose of this report is to provide information on assembly interactions that will facilitate development of structural models to predict assembly load distribution and capacity.
1Now Engineer, Sonoco Products Company, Madison, WI.
Appendix A provides a literature review that explains the evolution of light-frame assembly design from the 1830s to present. This evolution has been largely trial and error, influenced in recent years by significant advances in engineered design and the accessibility of computers. The literature review points to a need for research to provide the data base and analysis methods necessary to quantify current performance and to encourage future development of more efficient methods and materials for light-frame roof assemblies.

Materials and Methods
No standard procedures have been established for the testing of full-scale light-frame roof assemblies. Therefore, methods we used to evaluate the mechanics of redundant assembly performance are unique to this study.
Truss Fabrication The report by Wolfe and others (1986) on initial tests of individual trusses used to construct the roof assemblies for this study gives a detailed description of the truss fabrication materials. In summary, the trusses were fabricated using No. 2 Southern Pine 2 by 4’s and a combination of 16-gauge (0.06-in.) and 20-gauge (0.04-in.) galvanized steel connector plates; referred to as “plates” throughout this report. The lumber was divided into three modulus of elasticity (MOE) categories-low, medium, and high. Lumber from only one of these categories was used to fabricate each truss. Due to the fact that wood strength is reduced for long-term load duration effects and steel is not, a truss design following conventional design standards but tested to failure in a short-term test should have a greater tendency to fail in steel than in wood. The heavier connector plates used at the critical joints were intended to counteract this bias.
Trusses were fabricated within six categories. These included two truss configurations and three truss stiffness groups. The difference between the two truss designs was limited to the top chord slope. One had a slope of 3:12 and the other had a slope of 6:12. All trusses were of a Fink style, as shown in Figure 1, and designed for a 2-ft spacing and a 28-ft span. Stiffness groups were determined from the lumber MOE category.
Truss design loads (TDL), as determined by the truss plate suppliers in accordance with the Truss Plate Institute (TPI) design standards (TPI 1985b), were 66 lb/ft for the 6:12 trusses and 55 lb/ft for the 3:12 trusses. In each case, a dead load of 20 lb/ft and a load duration factor of 1.15 were used. These values were derived to fit the assembly specifications that included truss span (28 ft), truss spacing (2 ft), lumber grade (No. 2 Southern Pine), and truss configuration (Fink, 3:12 and 6:12). In deriving these values, analog loads, applied only to the top chord, were limited by member stresses resulting in a combined stress index (CSI) of 1.0 in the top chord. Maximum CSI values in the
bottom chords were 0.28 for the 6:12 truss and 0.46 for the 3:12 truss at TDL.
The plywood sheathing used was 15/32-in.-thick C-D exterior grade. Its stiffness, as determined by a plate bending test, averaged 196,000 lb · in2/ft of width. For each roof, 20 sheets were randomly selected from a sample of 80 sheets.
Nails used to connect the sheathing to the trusses were 6d common.
Roof Assembly Test roofs were constructed to represent a 16-ft section from the middle of a conventional gable-style roof. Nine trusses, spaced 2 ft on center and spanning 28 ft, were each fastened to a 2 by 4 bearing plate using wind clips (Fig. 2) and braced using 2 by 4 lateral bracing attached to the bottom chord at one-third span points. The wind clips, fastened to both the trusses and the plates using 1-in. No. 10 machine screws, were used in place of toenailing to facilitate construction and to reduce possible effects of variability in this connection. Use of these clips enabled reuse of the same calibrated bearing plates for both assembly tests. The lateral bracing followed recommendations of the TPI for truss erection (TPI 1985a).
Throughout this report, two methods are used to refer to individual trusses. The first method uses the individual truss identification of the form P-S-i, where P designates the top chord pitch (3 or 6), S designates the stiffness category of lumber used (low, medium, or high), and i designates the sequence number of the truss within its stiffness category (1 to 7) for the original tests conducted by the Small Homes Council (SHC) (Wolfe and others 1986). This method is used whenever the discussion deals with performance of the individual trusses. The second method refers to truss location in the assembly. In this case, the trusses are numbered from 1 to 9 starting at the west end of the roof as tested. This designation is used for discussions when truss location is the primary focus.
For both roof assemblies, the trusses were located according to their stiffness category to evaluate the interactive effects of relative truss stiffness and load redistribution. The trusses were arranged in three groups of three, each consisting of one truss of each stiffness category. The groups were arranged so that
2

Figure 1 – Trusses with 3:12 and 6:12 top chord slopes. (ML89 5591)
medium- and high-stiffness trusses would be used on the ends where stiffness and strength would be most critical. In addition, each low-stiffness truss would be located in the middle of a unique pattern of three truss stiffnesses (high-low-medium, high-low-low, and low-low-medium). The truss placement pattern is shown in Figure 3.
Plywood roof sheathing was installed according to the APA (1984) recommendations. The sheets were placed with offset joints and nailed using 6d common nails spaced 6 in. on center on the perimeter and 12 in. on the interior of each sheet. Additional information on the specifics of location of each sheet used in each assembly is given in Appendix B.
Testing Facility All individual truss tests and full roof assembly tests at the Forest Products Laboratory (FPL) were conducted using a three-dimensional steel frame constructed specifically for testing full-scale structural modules (Boller 1972) (Fig. 4).
The trusses were supported on wood-framed walls. These walls were 3 ft high, 18 ft long, and positioned to give an inside clear span of 27 ft 5 in. They were constructed of 2 by 6 lumber with vertical studs spaced 2 ft on center to line up with the truss reaction points. A 10,000-lb-capacity load cell was positioned directly over each stud (Fig. 5) to measure the vertical truss reaction forces.
The trusses were attached to bearing plates that were end pinned to the support walls. Each bearing plate consisted of an 18-ft-long piece of laminated veneer lumber 2 by 3.5 in. in cross section, with a bending MOE of 2.56 x 10⁶ lb/in2. Holes were drilled through the thickness of the plates, 6 in. from each end, to allow a I-in.-diameter steel pipe to pass through and restrain horizontal movement of the ends. Pipe flanges with the threads removed were fastened to the plates over the holes to resist the reaction bearing stresses.
The load cells were designed to measure only vertical reactions. Therefore, to minimize the transfer of horizontal thrust to the load cells, slip planes were placed between the bottom of the bearing plate and
3

Figure 2 – Wind clip used to fasten the truss to the bearing plate. (ML89 5592)
each load cell. These planes, consisting of a 3/8-in. steel plate and two layers of 0.006-in.-thick polyethylene, allowed the bearing plate to move in a horizontal plane perpendicular to the wall without affecting the measurement of vertical reactions. Details of the wall construction are shown in Figure 5.
Loading System
Loads were applied in the vertical direction using hydraulic ram loading units (Fig. 6). Each loading unit consisted of one single-acting ram, 12 ft of 3/8-in. cable, and two double-rod loading assemblies. Under static load conditions, the system had the capability of applying 13,000 lb per loading unit with up to 8 in. of vertical deflection. With four of these loading units used for each truss in the assembly, anticipated load to cause failure was less than 25 percent of the capacity.
The loading system was designed to give eight loading points spaced at 41.125-in. intervals over each truss span (Figs. 3 and 7). Each of these loads was distributed to the roof through a 4- by 4- by 20-in. wood load distribution block. The total dead load of the truss plus weight from the portion of the loading system carried by the truss averaged 19 percent of the
Figure 3 – Plan view of roof system with trusses spaced 24 in. on center, showing pattern of truss stiffnesses (low L, medium M, high H), truss location numbering, and loading points. (ML89 5593)
TDL for both the 3:12 and 6:12 trusses. When the plywood sheathing was added, the test assembly dead load averaged 23 percent of TDL.
Loading units were controlled by an 18-valve manifold that permitted loading half a truss at a time. For the 3:12 roof assembly, the loads were monitored using a test cylinder in series with a loading cell in a steel confinement frame. For the 6:12 assembly, a pressure transducer was installed to indicate manifold pressure.
4
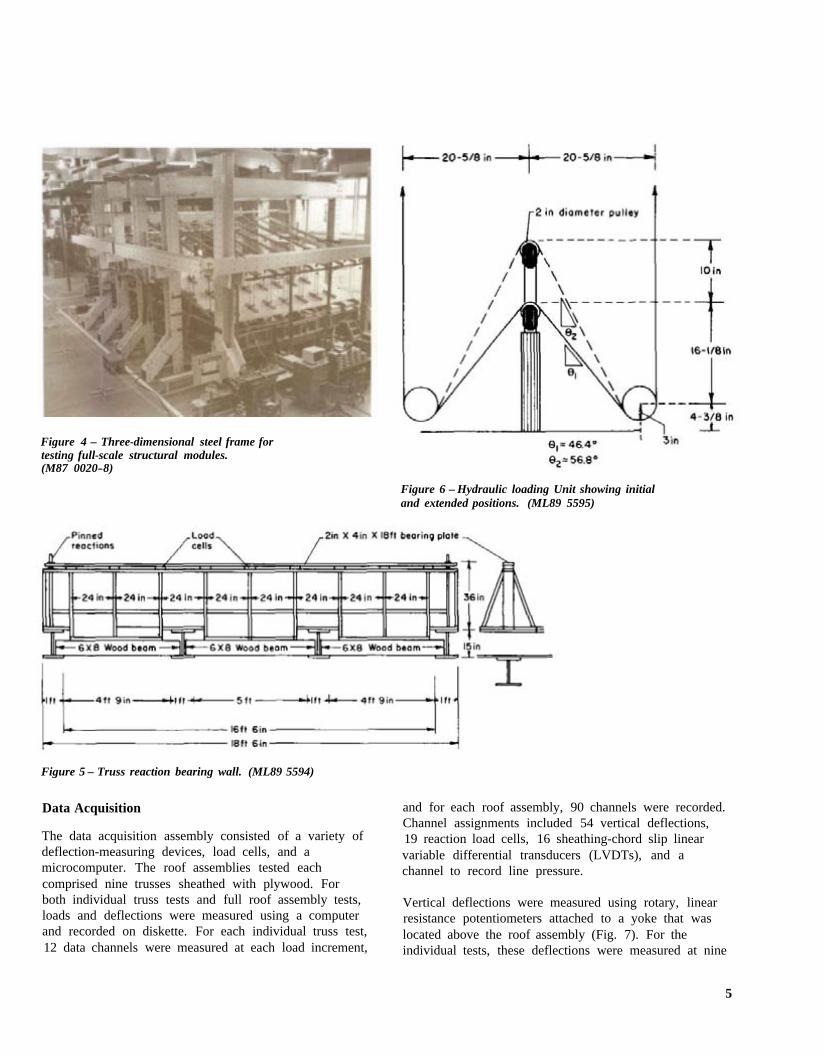
Figure 4 – Three-dimensional steel frame for testing full-scale structural modules. (M87 0020-8)
Figure 6 – Hydraulic loading Unit showing initial and extended positions. (ML89 5595)
Figure 5 – Truss reaction bearing wall. (ML89 5594)
Data Acquisition
The data acquisition assembly consisted of a variety of deflection-measuring devices, load cells, and a microcomputer. The roof assemblies tested each comprised nine trusses sheathed with plywood. For both individual truss tests and full roof assembly tests, loads and deflections were measured using a computer and recorded on diskette. For each individual truss test, 12 data channels were measured at each load increment,
and for each roof assembly, 90 channels were recorded. Channel assignments included 54 vertical deflections, 19 reaction load cells, 16 sheathing-chord slip linear variable differential transducers (LVDTs), and a channel to record line pressure.
Vertical deflections were measured using rotary, linear resistance potentiometers attached to a yoke that was located above the roof assembly (Fig. 7). For the individual tests, these deflections were measured at nine
5

Figure 7 – Assembly test diagram showing reaction detail, load placement, and deflection measuring points. Reaction and loading details were the same for both the individual truss and full assembly tests. For the individual truss tests, however, additional deflection measurements were taken at the two bottom chord nodes, the peak, midspan of the top chordpanel adjacent to the south reaction, and midspan of the top chord panel on the north side of the peak. (ML89 5596)
locations: two reactions, two bottom chord nodes, the peak, and four midpanel points along the top chord. For the full assembly tests, the number of channels available restricted the number of vertical deflections per truss to six: two reactions, two top chord nodes, and two midpanel points-south side adjacent to the peak and north side adjacent to the heel. Assembly deflections were measured by attaching the line from the rotary potentiometer to a hook screwed into the top surface of the top chord. A 0.5-in. hole was drilled through the sheathing at this point of attachment to avoid sheathing movement interference.
For the full assembly tests, the displacement of the sheathing relative to the truss chords was measured using LVDTs with a 0.5-in. working range and an accuracy of ±0.5 percent. The LVDTs were attached to the truss top chord and reacted against a metal angle attached to the sheathing (Fig. 8). A total of 16 channels were dedicated to these slip measurements. For the 3:12 assembly, the slips were measured at each midpanel point (4 per truss) along trusses 3, 4, 6, and 7. For the 6:12 assembly, one LVDT was placed 6 ft on either side of the peak of trusses 2 through 8. Truss 1 had one LVDT placed 6 ft from the peak on the north,
and truss 9 had one LVDT placed 6 ft from the peak on the south. For the 6:12 assembly load to failure, these measurements were not taken due to problems with the computer multiplexer board.
For each assembly, 19 data acquisition channels were allotted for measurement of reactions. Each truss end support reaction was measured using a 10,000-lb load cell (Fig. 7), and a single movable 5,000-lb load cell was used to simulate the effects of partition support on assembly displacements. This movable cell was mounted on a loading ram that could be placed under any truss in the assembly to represent a compliant wall support. Deflections of the partition bearing point were controlled using a linear resistance scale device accurate to 0.001 in.
Lateral movement of the roof, the supporting wall, and the horizontal reaction component were also measured to help characterize boundary conditions. For the 3:12 assembly, mirrored scales marked in units of 0.01 in. and a taut wire were used to detect movement of the individual trusses with respect to the pinned supports of the wall plates. The reaction wall movement was measured with reference to the test frame using dial
6

gauges with an accuracy of 0.001 in. For the 3:12 assembly, two dial gauges were used for each wall, one at each end. For the 6:12 assembly, an additional dial gauge was added to the middle of each wall. These visual readings were used to give an indication of reaction components in the horizontal plane. For the 6:12 roof, two 1,000-lb load cells were used to measure horizontal thrust for tests up to 1.25 TDL. They were placed in series with cables connecting the ends of the support walls and stressed in tension by any outward thrust on the walls.
A total of 89 data channels were recorded for the 3:12 roof assembly, and 90 channels were recorded for the first phase of testing on the 6:12 assembly. Due to computer hardware problems, only 76 channels were used for the second and third phases of the 6:12 assembly tests. In each case, the computer was able to scan all channels in less than a second and record the information in a form that could be readily accessed for data analysis on a microcomputer.
Test Procedure Soon after fabrication, the individual trusses used in this study were tested for stiffness at the SHC test facilities, University of Illinois (Wolfe and others 1986). In August of 1984, they were delivered to the FPL for use in the construction of full-scale roof assemblies. The trusses were stored under cover outside for 7 months while the FPL test facility was being prepared and evaluated.
The FPL tests included a reevaluation of individual trusses and a three-phase test of the full assembly. Because the trusses had been handled several times and
stored for at least 8 months since the original tests at the SHC, we decided to retest them before constructing the roof assembly. Another factor that influenced this decision was the presumption that differences in the support and loading conditions used at the first test at SHC and those proposed for the FPL full assembly tests could have a significant effect on variations in truss performance.
The three test phases for the roof assemblies included (1) load applied to individual trusses in the assembly, (2) load applied to defined sections of the roof, and (3) load to failure for the full assembly. In each phase, the entire assembly response was measured for each load application.
Individual Truss Tests Outside the Assembly
Prior to testing, each truss was inspected for characteristics such as large knots, splits, truss plate pullout, and plate misplacement. Gaps between members at each joint were measured. The trusses were then mounted in position 1 on the roof assembly test facility (Fig. 9).
Before taking readings to characterize the stiffness of the trusses, we applied an initial settling load of 0.2 TDL. After releasing the line pressure, we took a zero reading on all channels. In all cases, loads were applied at a rate of approximately 0.5 TDL per minute with 1-min stops at each increment before data
Figure 8-Measurement of sheathing chord slip Figure 9-Individual 6:12 truss being tested in (ML89 5597) test frame. (M85 0321-2)
7

channels were recorded. The actual test of each truss comprised three loading sequences.
For the 3:12 trusses, tests included two full-span uniform load sequences and one half-span loading. In the first full-span loading, the truss was supported only at its end reactions. The second loading included a third support inserted at the bottom chord intersection of webs and bottom chord (node) on the south half, intended to simulate a partition bearing point. Finally, the south half of the truss was loaded with the south node partition bearing in place. In each case, load was applied in increments of 0.25 TDL, beginning at 0.5 TDL. In the single-span case, load was applied up to 1.25 TDL and then decreased to dead load with one intermediate stop at 0.75 TDL. For the two-span cases, load was applied to TDL with a two-step decrease to dead load (0.75 and 0.5 TDL). A partition bearing would not be expected to be rigid, thus the test sequence included controlled deflections in the partition support. It was held rigid up to design load and then, as load was held constant, the partition bearing support was lowered 0.1 in. The load was then decreased to dead load with stops at 0.75 and 0.5 TDL.
For the 6:12 assembly, tests included two half-span uniform load sequences and one full-span loading. Due to the predictability of effects of the partition bearing support on the 3:12 trusses, we did not feel that it was worth the time and potentially damaging effects to repeat these tests for the 6:12 assembly. In the first test sequence, the north half of the truss was loaded to 0.75 TDL in five increments. The second sequence was a repeat of the first with the load applied on the south half of the truss. The third was a full assembly loading with five increments to 1.25 TDL. No intermediate readings were taken between the maximum load and dead load on the down side.
Individual Truss Tests in the Assembly
The first series of tests on each roof assembly consisted of loads applied directly to one truss at a time; deflections and reactions were measured for the entire assembly. These tests of individual trusses in the assembly included two support and three loading variations. Support conditions included simple span with supports at designated heel reaction points and a double span with an intermediate support at the south bottom chord node as was done for the single 3:12 truss
tests. Trusses located at the ends of the roof were tested with a third support condition, an intermediate support at the north bottom chord node. For each of these variations in boundary conditions, three loading configurations were used to evaluate structural performance. Loads were first applied to the south half, then to the north half, and finally full span. They were increased approximately 0.50 TDL per minute from dead load to 1.25 TDL with data scans taken after a 1-min hold at each of several intermediate load levels.
Tests conducted with no intermediate supports consisted of five loading steps. Beginning at dead load, line pressure was increased to give 0.5, 1.0, and 1.25 TDL, then decreased to 1.0 TDL load, and finally decreased to the dead load as the first step in the next cycle.
With partition reactions in place, the loads were applied in six steps. First, the partition support point was held at zero displacement as load was applied to 0.5 and then to 1.0 TDL. The truss was then allowed to deflect slightly (0.05 in. for the 3:12 assembly and 0.01 in. for the 6:12 assembly), and a second reading was taken at TDL before load was increased to 1.25 TDL. At this point, the partition reaction was reduced again to let the support point deflect an additional amount (a total of 0.1 in. for the 3:12 assembly and 0.075 in. for the 6:12 assembly). All load was then removed.
This series of tests provided a collection of influence matrices calibrated to half truss loads anywhere in the assembly.
Section loading – Assembly response measurements were then taken for loads applied to the sections of each roof (Fig. 10). These sections included a minimum of three half trusses. A total of six different section loads were used for the 3:12 assembly and eight were used for the 6:12 assembly. In each case, displacements were recorded at four incremental loads to TDL (0, 0.25, 0.75, and 1.00 TDL) with 1-min holding periods at each.
The final test in this series was a test of the full assembly. In this case, all nine trusses were loaded to design load.
Full assembly loaded to failure-The final test of each roof assembly was intended to characterize assembly performance beyond design load. Due to the limitation
8

Figure 10 – Roof sections loaded during pattern loading phase of tests of the full assemblies. (ML89 5598)
that all active cylinders received the same line pressure, loading all nine trusses at once would introduce an unrealistic bias for initial failure of the end trusses. As the ends of a normally constructed gable roof are continuously supported, this would not be a representative mode of failure. We therefore decided to apply direct load only to the interior seven trusses and let the end trusses appear relatively stiff and pick up load by way of assembly load redistribution.
For the 3:12 assembly, we loaded the assembly in 0.5 TDL increments to 2.5 TDL beginning at 1.25 TDL. We had planned to load continuously from this point, with data scans taken every second to failure. Due to an early failure, we were not able to get scans immediately prior to failure. This plan was changed slightly for the 6:12 assembly. In this case, we scanned between each load increment beginning at dead
load and increased load in steps of 0.5 TDL. At each step, the load was held for 5 min.
During the test to failure, observers made note of any significant events, such as excessive displacements, noise, and member fractures. Immediately after failure, all failed members and joints were documented.
Samples were cut from each roof for use in characterizing the sheathing connector performance, member moisture contents, and specific gravity. Plywood samples were cut from undamaged sections of the roof sheathing and chord sections were taken from each truss. Nail performance tests included lateral resistance, parallel and perpendicular to the grain, and direct withdrawal. These tests were conducted according to the ASTM D 1761 (1977) standard recommendations.
9

Results
Test results provide a basis for a direct evaluation of assembly interaction effects as well as a basis for developing analytical models to be used in future sensitivity analyses of the effects of assembly boundary conditions. In addition to measurement of material properties and truss stiffness and strength outside and inside the assembly, results include characterization of load deflection distribution and observations of the boundary conditions that significantly affect assembly performance.
Individual Truss Tests Truss inspections conducted prior to individual tests outside the roof assembly suggested that the 3:12 trusses may have been more highly stressed than the 6:12 trusses due to prior tests and handling. Visual inspections showed tighter joint gaps on compression chords and a greater occurrence of incomplete plate embedment for the 3:12 trusses. As all trusses were made at the same plant, the chances for fabrication differences in member placement and plate pressing were small. Plate pullout was most likely caused by incomplete pressing, improper handling, or gap closure during test causing partial buckling and plate withdrawal. In some cases, the incomplete embedment was greatest directly over the member ends in a tight joint giving support for the overload hypothesis.
Load-deflection curves for trusses within each pitch-stiffness category were initially very similar (Fig. 11). All load-deflection curves for the 6:12 trusses appeared to be linear to design load. Four of the 3:12 trusses, however, showed significant nonlinearity for loads in excess of 1,000 lb.
Results of the 3:12 single truss tests, with an internal third reaction point, led us to drop this sequence of tests from the 6:12 test procedure. For the first truss tested (3H3), the internal bearing was added as a concentrated upward incremental loading applied at the bottom chord node point after the design load had been applied to the top chord. This was intended to simulate the effect of various levels of compliance in a partition reaction. The upward force resulted in increases in the line pressure supplying the main loading rams and caused a net increase in the total load on the truss. The procedure was then modified to start from dead load and restrict deflection at the node. Effects of compliance were measured by letting the node point deflect once the truss was loaded to design. Results of these
tests were predictable; therefore, to avoid the possibility of damage to the trusses and to facilitate the test procedure, they were not conducted on the 6:12 trusses.
A potential problem with our single truss test setup was insufficient buckling restraint. In an attempt to minimize effects of vertical friction forces, we had initially placed lateral restraint braces only at the middle of each top chord panel. This was sufficient for most of the 3:12 trusses. However, trusses that displayed some top chord twisting as a result of drying began to buckle in the region of the top chord node point when loads approached the design level. Therefore, two more braces were added at the node points for the 6:12 truss tests.
Failure modes observed for trusses tested individually outside the assembly were predominantly wood related (Wolfe and others 1986). For the 3:12 trusses, 8 of the 12 failures were associated with knots, 1 was a splintery failure in clear wood, and 1 was a brash failure close to a heel joint. The remaining two 3:12 truss failures were due to plate tooth withdrawal from a web member at the peak. For the 6:12 trusses, 6 of the 12 failures were associated with knots. Four failures were associated with the combined bearing and axial compression stresses over the top chord-web connection. Two of these were brash, occurring in sections immediately over or adjacent to the web contact area, and two were splintery extending from the web connection to the top chord splice. The remaining two 6:12 truss failures were at the bottom chord-web connection and were due to wood being cleaved from the end of the tension web by the connection plate.
Assembly Tests After the assemblies were constructed and all load cells were positioned at the truss reaction points, we noticed that dead loads were not uniformly distributed throughout the assembly. This effect is shown in Figure 12. For the 3:12 assembly, some reaction load cells registered loads of 30 lb and others were as high as 400 lb. For this assembly, the bearing plate was checked to assure that it was level, but no further attempt was made to even out the reactions. For the 6:12 assembly, the heights of reaction bearing posts were adjusted to even out the reactions. In this case, we were able to get all reactions within the range of 140 to 280 lb. The uneven distribution of truss reactions appeared to be due in part to variations in truss camber and stiffness.
10

Figure 11 – Typical load-defection curves for the individual truss tests. (ML89 5599, ML89 5600)
Individual Truss Load cases, an initial increase of 200 lb in the sum of reactions was required before the truss began to follow
The appearance of the load-deflection curve for a single its characteristic load-slip curve. Once deflection began, truss tested in the assembly (Fig. 13) suggests a friction increasing the load in steps did not show signs of a influence in the assembly response. In a majority of friction force. When the load was released in steps,
11

Figure 12 – Assembly reaction profile. (ML89 5601)
however, the first occurrence of a load drop, approximately 100 lb, had little effect on deflection recovery. This behavior results in a load-deflection cycle represented as a parallelogram.
As loads were applied to individual trusses in the assembly, it became apparent that a large share of the load applied to a single truss was redistributed to adjacent trusses. Figure 14 shows a typical example of the assembly response to loads applied to a single truss. These plots show how individual truss loads affected truss reactions throughout the assembly. The three plots in this figure show the assembly reaction profile for a uniformly distributed load applied to the south half, the north half, and the full span of the third truss from the west end of the roof assembly.
An interesting aspect of the assembly response, apparent in Figure 14, is that when half the truss is loaded, the opposite end reactions of adjacent trusses each received more load than the corresponding reaction of the loaded truss.
When the partition reactions were used with the 3:12 assembly tests, little load was distributed past the adjacent trusses. Figure 15 shows the effects of the partition reaction on truss 4. In this case, the partition
reaction (not shown) took a large share of the load away from the loaded truss reactions and the other assembly reactions.
Individual truss reaction supports within the assembly behaved as something between fixed and roller. We had no way of measuring the degree of moment restraint afforded by the upper chord connection to the sheathing and the bottom chord connection to the bearing plate, but we did get some indication of lateral movement of the bearing plate with individual truss loading. Figure 16 shows how the bearing walls moved as a result of the horizontal thrust from each truss loaded in the assembly. The horizontal movement of both bearing plates was measured at truss locations 1, 5, and 9. Figure 16 shows the sum of the movements of the two walls at these locations as each truss was loaded. Although the plate movements are small (<0.035 in.), these plots show that the ends of the support wall were less rigidly supported than the middle. The greatest movement occurred at the ends when the corresponding end truss was loaded. The smallest amount of horizontal movement at the supports occurred when the middle truss was loaded. Note that when the trusses in locations 1, 2, 3, 8, and 9 were loaded, the far end of the wall moved in a negative or inward direction.
12

Figure 13 – Single truss load-deflection curve when loaded individually in the assembly. (ML89 5602)
Figure 14 – Assembly response lo loads applied to the third truss in the 3:12 assembly: (Top) south half loaded; (middle) north half loaded; and (bottom) full-span load. (ML89 5603)
13
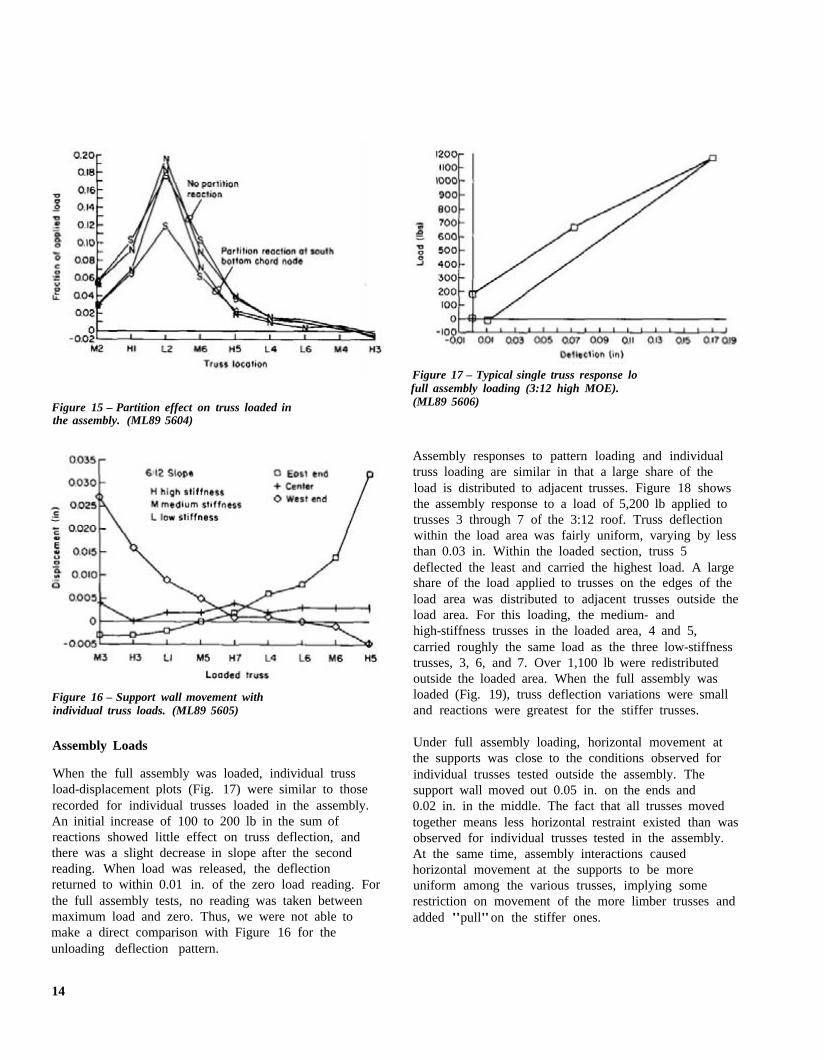
Figure 15 – Partition effect on truss loaded in the assembly. (ML89 5604)
Figure 16 – Support wall movement with individual truss loads. (ML89 5605)
Assembly Loads
When the full assembly was loaded, individual truss load-displacement plots (Fig. 17) were similar to those recorded for individual trusses loaded in the assembly. An initial increase of 100 to 200 lb in the sum of reactions showed little effect on truss deflection, and there was a slight decrease in slope after the second reading. When load was released, the deflection returned to within 0.01 in. of the zero load reading. For the full assembly tests, no reading was taken between maximum load and zero. Thus, we were not able to make a direct comparison with Figure 16 for the unloading deflection pattern.
Figure 17 – Typical single truss response lo full assembly loading (3:12 high MOE). (ML89 5606)
Assembly responses to pattern loading and individual truss loading are similar in that a large share of the load is distributed to adjacent trusses. Figure 18 shows the assembly response to a load of 5,200 lb applied to trusses 3 through 7 of the 3:12 roof. Truss deflection within the load area was fairly uniform, varying by less than 0.03 in. Within the loaded section, truss 5 deflected the least and carried the highest load. A large share of the load applied to trusses on the edges of the load area was distributed to adjacent trusses outside the load area. For this loading, the medium- and high-stiffness trusses in the loaded area, 4 and 5, carried roughly the same load as the three low-stiffness trusses, 3, 6, and 7. Over 1,100 lb were redistributed outside the loaded area. When the full assembly was loaded (Fig. 19), truss deflection variations were small and reactions were greatest for the stiffer trusses.
Under full assembly loading, horizontal movement at the supports was close to the conditions observed for individual trusses tested outside the assembly. The support wall moved out 0.05 in. on the ends and 0.02 in. in the middle. The fact that all trusses moved together means less horizontal restraint existed than was observed for individual trusses tested in the assembly. At the same time, assembly interactions caused horizontal movement at the supports to be more uniform among the various trusses, implying some restriction on movement of the more limber trusses and added "pull"on the stiffer ones.
14

Figure 18 – Assembly response to full-span loads applied to middle jive trusses of the 3:12 roof. Plot (a) shows the distribution of assembly loads in terms of the individual truss reactions and (b) shows the assembly defection profile. (ML89 5607)
During the assembly loading sequence, the roof assembly appeared to perform elastically with no signs of overstressing. Deflections were not excessive, there were no sounds emitted, and the assembly appeared to return to its original position after loads were released.
Assembly Load to Failure
When the roof assemblies were loaded to failure, the end trusses received only that load distributed to them from adjacent trusses. Thus, while trusses 3 through 7 (Figs. 20b and 21b) show a fairly uniform deflection at various load increments prior to failure, there was less deflection for the two trusses on either end of the roof assembly.
At the maximum assembly load, the distribution of individual truss reactions (Figs. 20a and 21a) shows the parallel nature of assembly structural response. In each
Figure 19 – Reaction (a) and deflection profiles (b) for uniform load on all trusses in the assembly (3:12 and 6:12 slopes). (ML89 5608)
case, truss reactions ranged from a low value for a low stiffness truss (4,140 lb for 3L4 and 6,320 lb for 6L4) to a high value for either a medium or high stiffness truss (5,850 lb for truss 3M6 and 9,425 lb for 6H4).
Failure Sequence
For both roof assemblies, failures appeared to initiate in the low-stiffness truss, just to the right of the center position, truss 6. For the 3:12 assembly, failure was abrupt, appearing as a combined bending-tension failure of the bottom chord 1 ft from the north heel joint (Fig. 22a). This was closely followed by similar failures in trusses 4, 5, 7, and 8. We were not able to determine the exact sequence of these failures, because they happened quickly, and we were not scanning all data channels continuously at the time of the initial failure. For the 6:12 assembly, failure appeared to initiate in truss 6, but the continuous scan data file indicated that it actually started with the high-stiffness truss in the center location. After the maximum load of 9,700 lb was reached on truss 5, an additional 1,260-lb load was added to the assembly over a period of 6 min. Then truss 6 exhibited a splintery bending failure in the top chord panel on the north side of the peak (Fig. 22b).
15
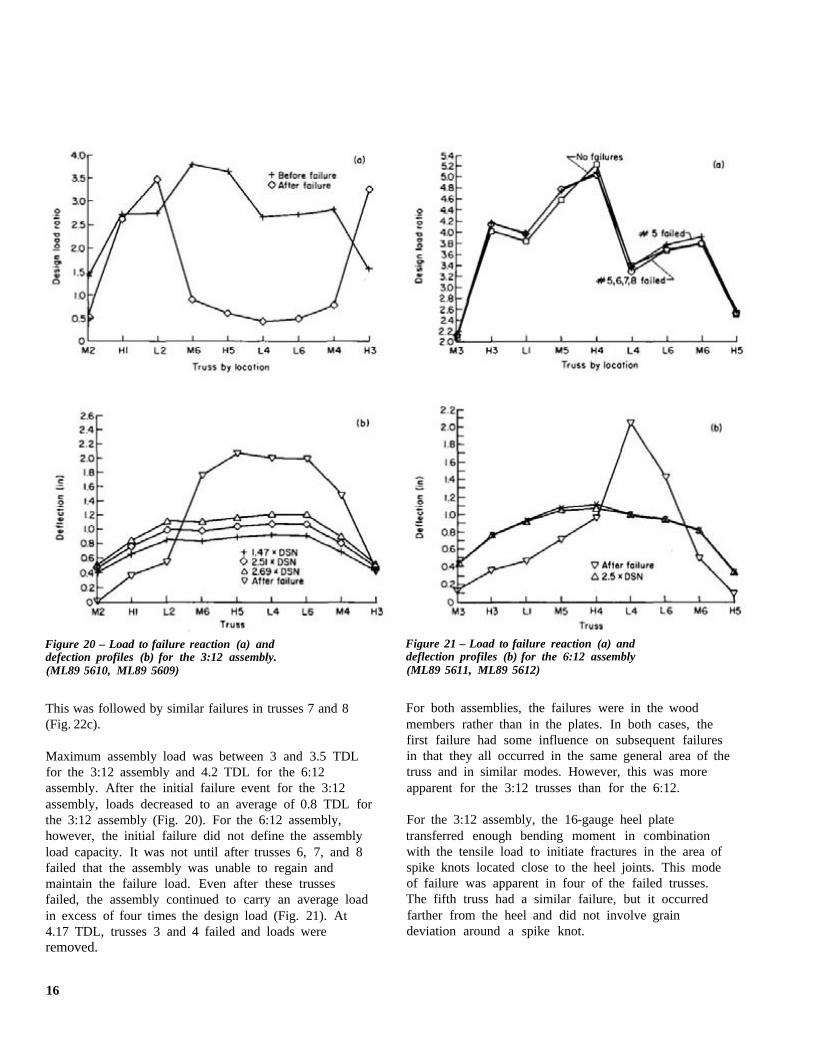
Figure 20 – Load to failure reaction (a) and defection profiles (b) for the 3:12 assembly. (ML89 5610, ML89 5609)
This was followed by similar failures in trusses 7 and 8 (Fig. 22c).
Maximum assembly load was between 3 and 3.5 TDL for the 3:12 assembly and 4.2 TDL for the 6:12 assembly. After the initial failure event for the 3:12 assembly, loads decreased to an average of 0.8 TDL for the 3:12 assembly (Fig. 20). For the 6:12 assembly, however, the initial failure did not define the assembly load capacity. It was not until after trusses 6, 7, and 8 failed that the assembly was unable to regain and maintain the failure load. Even after these trusses failed, the assembly continued to carry an average load in excess of four times the design load (Fig. 21). At 4.17 TDL, trusses 3 and 4 failed and loads were removed.
Figure 21 – Load to failure reaction (a) and deflection profiles (b) for the 6:12 assembly (ML89 5611, ML89 5612)
For both assemblies, the failures were in the wood members rather than in the plates. In both cases, the first failure had some influence on subsequent failures in that they all occurred in the same general area of the truss and in similar modes. However, this was more apparent for the 3:12 trusses than for the 6:12.
For the 3:12 assembly, the 16-gauge heel plate transferred enough bending moment in combination with the tensile load to initiate fractures in the area of spike knots located close to the heel joints. This mode of failure was apparent in four of the failed trusses. The fifth truss had a similar failure, but it occurred farther from the heel and did not involve grain deviation around a spike knot.
16

For the 6:12 assembly, failures occurred in the top chord on the north side of the roof. These failures were due to a combination of bending, axial compression, and bearing stresses. The truss 5 failure was due primarily to axial compression around a knot located between the web connection and the heel joint. The top chord splice plate was also buckled, and teeth had pulled out on either side of the chord. Truss 6 exhibited a horizontal shear-type failure that initiated in the top chord splice and a compression perpendicular to the grain failure over the web. Truss 7 failed due to a combination of bending stresses around a knot at midpanel between the web and peak connections and compression and tension failures over the web connection. The truss 8 failure initiated in grain deviation around a knot on the bottom edge of the top chord close to the midpanel point. Some plate buckling was also apparent at the peak and web connections.
Sheathing Displacement
Displacement of the sheathing relative to the truss chords did not appear to be significant for individual truss tests or for assembly pattern loading up to design load. Most data obtained in these tests were outside the range of accuracy of the LVDTs. When the full system was loaded, however, measured displacements were significant. When only the middle seven trusses of the 3:12 assembly were loaded to the full assembly design load, sheathing displacement readings ranged up to 0.008 in. and appeared to be fairly linear. When the assembly was tested to failure, sheathing displacements as high as 0.03 in. were measured (Fig. 23).
Figure 22 – Typical truss failures: (a) 3:12 assembly test, (b) 6:12 assembly test, (c) 6:12 assembly. (M88 0380, M85 00335-3, M85 0335-6)
17

Analysis of Results
The main purpose of this analysis is to compare the structural performance of trusses loaded as part of a roof assembly to their performance when loaded individually. Included is a discussion of the observed effects of relative truss stiffness, location within the roof assembly, load level, and roof pitch. These observations will he used to evaluate structural models being developed as a tool to identify critical elements and assembly interactions and to assist in developing a roof assembly reliability-based design methodology. Although the discussion refers only to the effects of these parameters on the assemblies tested, subsequent analysis using full assembly analytical models will quantify their effects on a wider variety of assembly configurations.
Test Equipment Due to the lack of standard test procedures for full roof assemblies, methods and equipment used in this
study present another set of variables comparing these results to those found in other roof assembly studies. The most important variables had to do with load control. Our major concerns included controlling the load magnitude and assuring a uniform load distribution. For load control, the pressure transducer, attached directly to the fluid distribution manifold, was superior to the use of the confined cylinder in series with a load cell. Load cells placed in series with loading cables indicated that load distribution was not significantly affected by proximity to the hydraulic pump.
A problem with single acting cylinders is the load-pressure relationship varying with ram extension. This leads to problems in estimating applied load as well as in consistently repeating the same load. Estimating the load applied by a cylinder that is extending on the basis of the load applied by a
Figure 23-Sheathing-chordslip for 3:12 load to failure. (ML89 5613, ML89 5614)
18

confined cylinder gives an error that increases with load. Use of the line pressure transducer provided a more direct approach to measurement of line pressure and a slightly more accurate estimate of system load.
Individual Truss Tests The appearance of the individual trusses prior to our tests, as well as their performance on their second loading to 1.25 TDL, suggests that the 3:12 and 6:12 Fink truss configurations did not have the same inherent margin of safety between design and ultimate load. The 3:12 trusses showed signs of stress, such as some tooth withdrawal and tight joints on compression members, whereas the 6:12 trusses had measurable gaps in most joints and no signs of tooth withdrawal. If handling was not a factor, then load levels of 1.25 TDL may have been more critical for the 3:12 trusses. Of the nine 3:12 trusses we tested, four showed definite signs of nonlinear performance prior to design load. For the 6:12 tests, all load-deflection curves could be modeled closely with a linear model.
Statistical analyses were conducted to evaluate differences between the load-deflection curves obtained from the FPL and SHC tests. Results indicated no consistent patterns, which suggest no significant difference between the two test setups. Thus, any significant differences in measured stiffness were assumed indicative of damage due to prior testing or handling.
Truss stiffness values determined outside the roof assembly required slight adjustment for comparison to those values determined in the assembly. For this purpose, truss stiffness is defined as the slope of the load-displacement curve. Outside the assembly (FPL test), deflections were measured at the peak and two bottom chord nodes. Inside the assembly, deflections were measured at the two top chord nodes. On the basis of tests conducted at the SHC, the average top chord node deflection was slightly greater than the average of the peak and bottom chord node deflections. The average difference was estimated to be 7 percent for the 3:12 trusses and 4 percent for the 6:12 trusses. These findings were used in evaluating assembly effects on truss stiffness.
Figure 24 compares the SHC and FPL tests for the 3:12 truss in each MOE category that showed the greatest deviation from linearity. These trusses each showed
Figure 24 – Comparison of the FPL and SHC individual truss (3:12) test results. (ML89 5615)
signs of plate pullout, possibly due to handling or buckling caused by gap closure. The apparent nonlinear behavior may also have been due, in part, to inadequate lateral bracing of the top chord. For the
19

SHC tests, chords were braced at closer intervals. In the case of truss 3H3, the FPL test shows a lower initial slope, which may have been due to previous damage, and a decrease in the slope beyond 900 lb, which may indicate slight buckling. Truss 3L6 appeared to be slightly stiffer initially with a decrease in stiffness beyond 1,300 lb. For other trusses, the stiffness values determined for the two tests were very close. Although the FPL values in many cases did appear to be slightly lower, the difference was within the range of accuracy of the deflection readings.
Values given in Table 1 permit direct comparison of individual and assembly stiffness performance. These values represent slope of the load-deflection curves determined using linear least squares regression. Individual truss slope values, I, were determined for the full range of loading to 1.25 TDL for all but four of the 3:12 trusses. These displayed nonlinear deflection beyond 0.75 TDL due primarily to slight chord buckling. Slopes reported for these trusses represent only the linear range. In all cases, the individual truss stiffness values have been adjusted for differences due to deflection measurement location.
Assembly stiffness values were calculated using two approaches for determination of truss load: the sum of reactions, AR, and tributary area loading, AT. Reaction measurement seems to be more accurate, because it is a direct measure of load, however, the tributary area method relates more closely to conventional design of redundant assemblies. Neither of these methods can be defended as giving the actual load carried by each truss in the assembly.
Assembly Loading This section compares results obtained from the individual truss tests to those obtained for the pattern and full assembly loading. Superposition of loads and deflections was evaluated as a possible means of predicting assembly performance under unsymmetric, nonuniform loading patterns. Truss stiffness-strength correlations were evaluated as a means of predicting truss load capacity.
Individual Trusses
The theory of superposition basically states that the whole is equal to the sum of its parts. The sum of the deflections or reaction forces measured at any given
point in the assembly in response to loads applied to incremental areas of the assembly surface should be equal to the value measured when the load is applied to all these areas simultaneously. Our evaluation of the roof assemblies indicated that the sum of vertical forces measured at each assembly reaction in response to load on each truss gave an accurate estimate of assembly reaction forces when the entire assembly was loaded. The sum of individual deflections, however, did not give as accurate a prediction of deflections under full assembly loading.
Load Distribution
We defined a load influence matrix for an individual truss as the change in all assembly reactions in response to a change in load on the target truss. Within the design load range, this influence matrix, expressed as a fraction of the applied load, changed little with load level. Therefore, each truss influence matrix, expressed in terms of the fraction of applied load, is applicable throughout the linear load range for the assembly. Figure 25 shows an example of adding the influence matrices measured for half-truss loads on a single truss to predict the full-truss load influence matrix.
Influence matrices derived for each truss in the two roof assemblies are shown in Figure 26. In each case, a three-dimensional graph shows how load applied to the truss designated along the “Loaded Truss’’ axis (z) among assembly “Truss Reactions” (x). The fraction of the load carried by each truss, depicted as the height of the graph, is shown in each cell of the (x,z ) matrix as a percentage of the total load that was applied to truss z. This quantity is denoted in matrix form as the value I(x,z ).
The value of I(x,z ) varies with location and relative stiffness of the loaded truss. End trusses could redistribute load in only one direction. Trusses closer to the middle of the roof redistributed loads equally in both directions. Thus, redistributed load varied from 35 to 43 percent for end trusses, and their influence matrices are very asymmetric. For trusses in the middle of the roof, however, redistributed loads varied from 55 to 66 percent, and the influence matrices were symmetric. In each case, stiffer trusses tended to carry a greater share of their applied load. For a conventional roof, in which truss stiffness would be less variable, the portion of the load redistributed in the assembly would
20
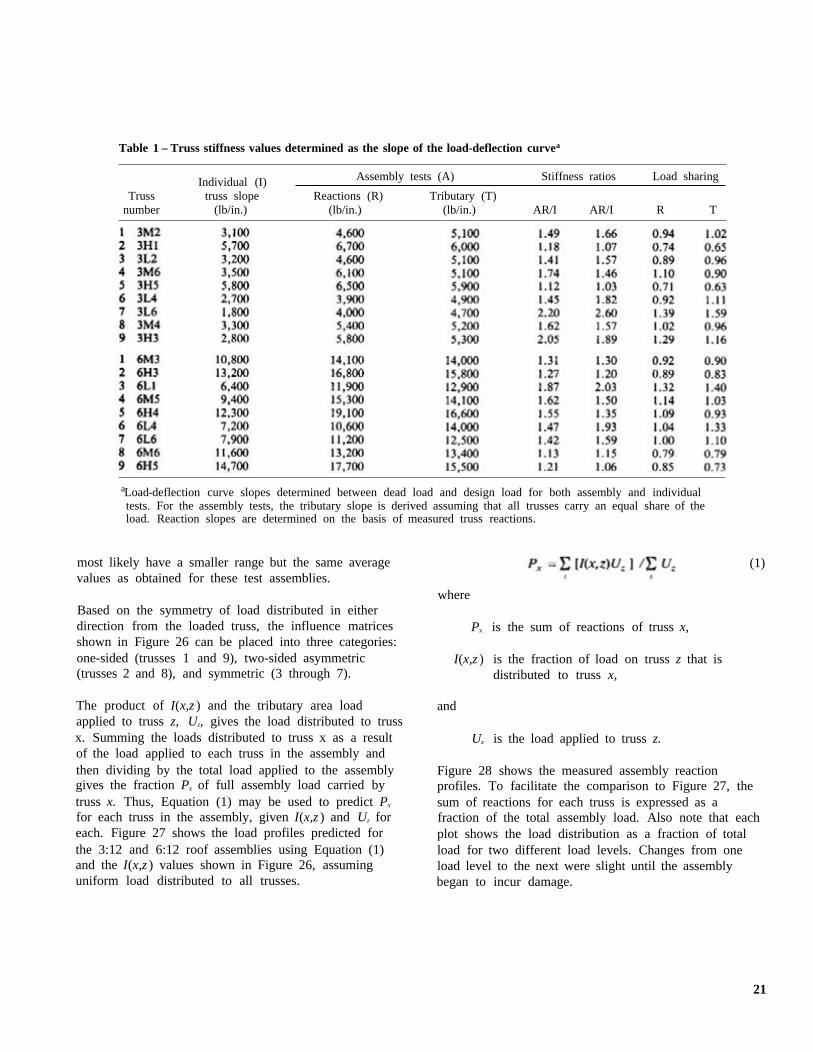
Table 1 – Truss stiffness values determined as the slope of the load-deflection curvea
Individual (I) Assembly tests (A) Stiffness ratios Load sharing Truss truss slope Reactions (R) Tributary (T)
number (lb/in.) (lb/in.) (lb/in.) AR/I AR/I R T
aLoad-deflection curve slopes determined between dead load and design load for both assembly and individual tests. For the assembly tests, the tributary slope is derived assuming that all trusses carry an equal share of the load. Reaction slopes are determined on the basis of measured truss reactions.
most likely have a smaller range but the same average (1) values as obtained for these test assemblies.
where Based on the symmetry of load distributed in either direction from the loaded truss, the influence matrices Px is the sum of reactions of truss x, shown in Figure 26 can be placed into three categories: one-sided (trusses 1 and 9), two-sided asymmetric I(x,z ) is the fraction of load on truss z that is (trusses 2 and 8), and symmetric (3 through 7). distributed to truss x,
The product of I(x,z ) and the tributary area load and applied to truss z, Uz, gives the load distributed to truss x. Summing the loads distributed to truss x as a result of the load applied to each truss in the assembly and then dividing by the total load applied to the assembly gives the fraction Px of full assembly load carried by truss x. Thus, Equation (1) may be used to predict Px
for each truss in the assembly, given I(x,z ) and Uz for each. Figure 27 shows the load profiles predicted for the 3:12 and 6:12 roof assemblies using Equation (1) and the I(x,z ) values shown in Figure 26, assuming uniform load distributed to all trusses.
Uz is the load applied to truss z.
Figure 28 shows the measured assembly reaction profiles. To facilitate the comparison to Figure 27, the sum of reactions for each truss is expressed as a fraction of the total assembly load. Also note that each plot shows the load distribution as a fraction of total load for two different load levels. Changes from one load level to the next were slight until the assembly began to incur damage.
21
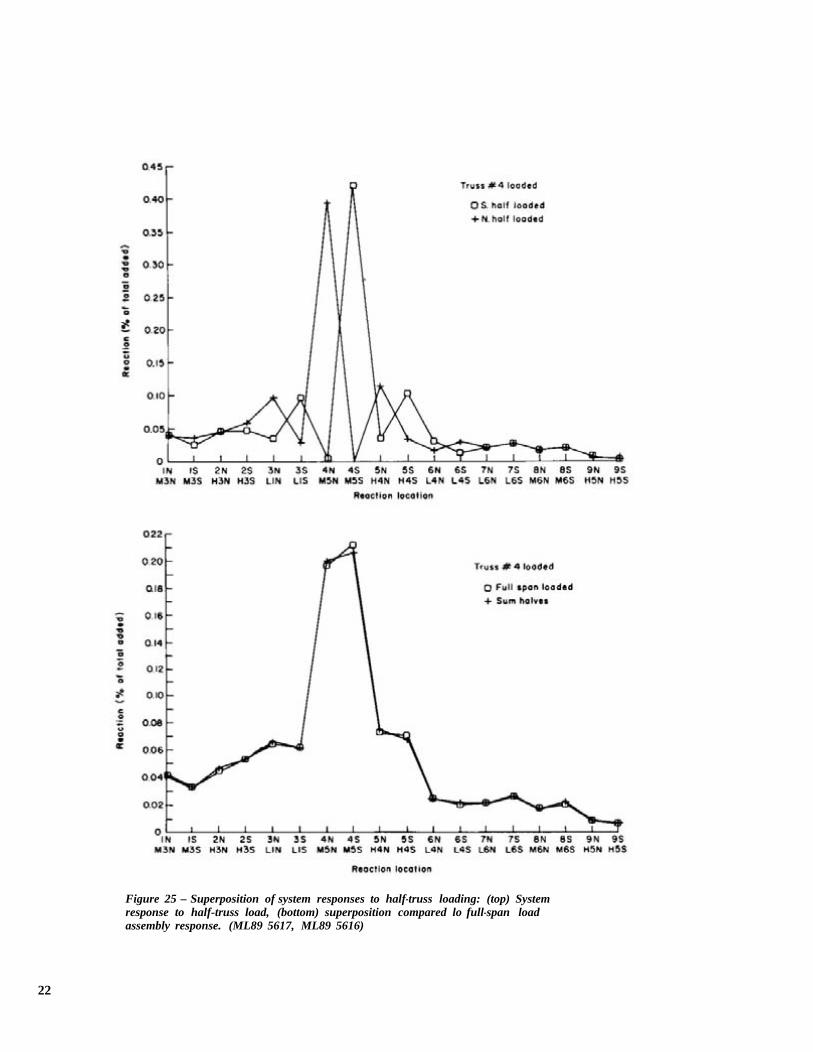
Figure 25 – Superposition of system responses to half-truss loading: (top) System response to half-truss load, (bottom) superposition compared lo full-span load assembly response. (ML89 5617, ML89 5616)
22

Figure 26 – Graphic representation of the assembly load distribution. Numbers shown indicate the percentage of load distributed to each truss. (a) represents the 3:12 Fink roof assembly and (b) represents the 6:12 Fink assembly. (ML87 5580, ML89 5618)
23

Figure 27 – Prediction of reaction profile for full assembly load on the basis of response to individual truss loads. (ML89 5619)
Figure 29 shows the relative effects of truss location, MOE, and pitch on load taken by each truss in the assembly. In this plot, the trusses are grouped in three location categories according to the symmetry of their load distribution matrix. For each category, the sums of individual truss reactions are plotted as a percentage of applied load. Points in the plot are labeled with assembly pitch (6:12 or 3:12) and truss location number, 1 to 9.
Deflection Distribution
A similar superposition approach was taken for truss deflections. For individual truss loading, deflections for each truss were normalized by dividing by the sum of deflections measured for all trusses in the assembly. All values are expressed as a percentage of the sum of deflections at a given load. The average deflection of the top chord nodes, measured relative to the truss reactions, was evaluated in this manner for each load increment. These normalized deflections show little variation from one load step to the next within the linear range of truss load capacity. The average normalized values obtained for each truss in the assembly when one truss was loaded are reported in Table 2. The average value represents the superposition prediction of the fraction of full assembly deflection when all trusses are loaded. Assembly load refers to values measured when all trusses were loaded.
Figure 28 – Reaction profiles represented as the fraction on applied assembly load compared at different load levels. (ML89 5620)
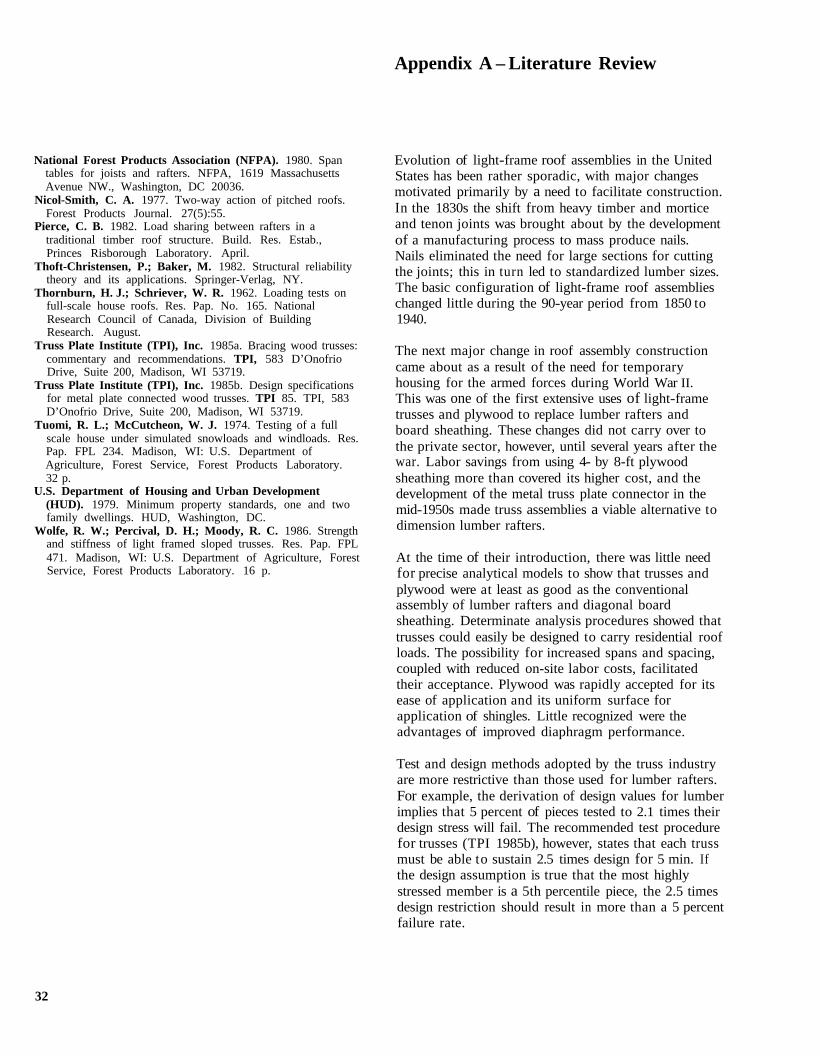
Figure 30 compares the predicted and measured truss deflections under full assembly load. The superposition estimates show fairly good agreement with measured values. There is some discrepancy, however, over deflections of the two low-stiffness trusses, 6 and 7, in the 6:12 assembly.
Assembly Effects on Truss Stiffness and Strength Design standards for redundant wood roof assemblies give little recognition to assembly effects in the derivation of design load. They assume that all members of a wood truss have the minimum strength and the average MOE expected for the grade and
24

Table 2-Deflectioninfluence matrixa
Total deflections (percent) at each truss when a single truss is loaded
Loaded truss 1 2 3 4 5 6 7 8 9
3:12 Truss assembly
6:12 Truss assembly
a Truss deflections are determined as the average top chord node deflection measured relative to the individual truss reaction points.
species used. As a result, a truss assembly is designed as a collection of identical trusses under uniform load in which each truss carries the same load, exhibits the same deflection, and fails when the stress in the most highly stressed member exceeds the allowable limit for its grade. Results of this study, however, show a wide variation in truss loads at assembly failure; trusses did tend to deflect together, but not because they all had the same stiffness, and assembly capacity was not necessarily controlled by the most highly stressed member.
In general, these design standards provide a conservative representation of how redundant assemblies carry loads. Their accuracy can he improved through recognition of assembly interaction mechanisms.
System redundancy serves to cancel effects of material variability by distributing load away from limber members and local defects toward stiffer (and hopefully stronger) members. This action of redistributing load is often called load sharing. In addition to load sharing, the interaction of various components in the assembly may also increase the effective stiffness over that of members acting separately. This effect will be referred to as composite action.
To account for load sharing and composite design, a design methodology must he developed to recognize the distribution of loads within an assembly and how it affects the ratio between assembly load capacity and the weakest truss capacity.
In this analysis, we made some attempt to evaluate how assembly load distribution affects both stiffness and strength. To do this, we made a number of assumptions
25
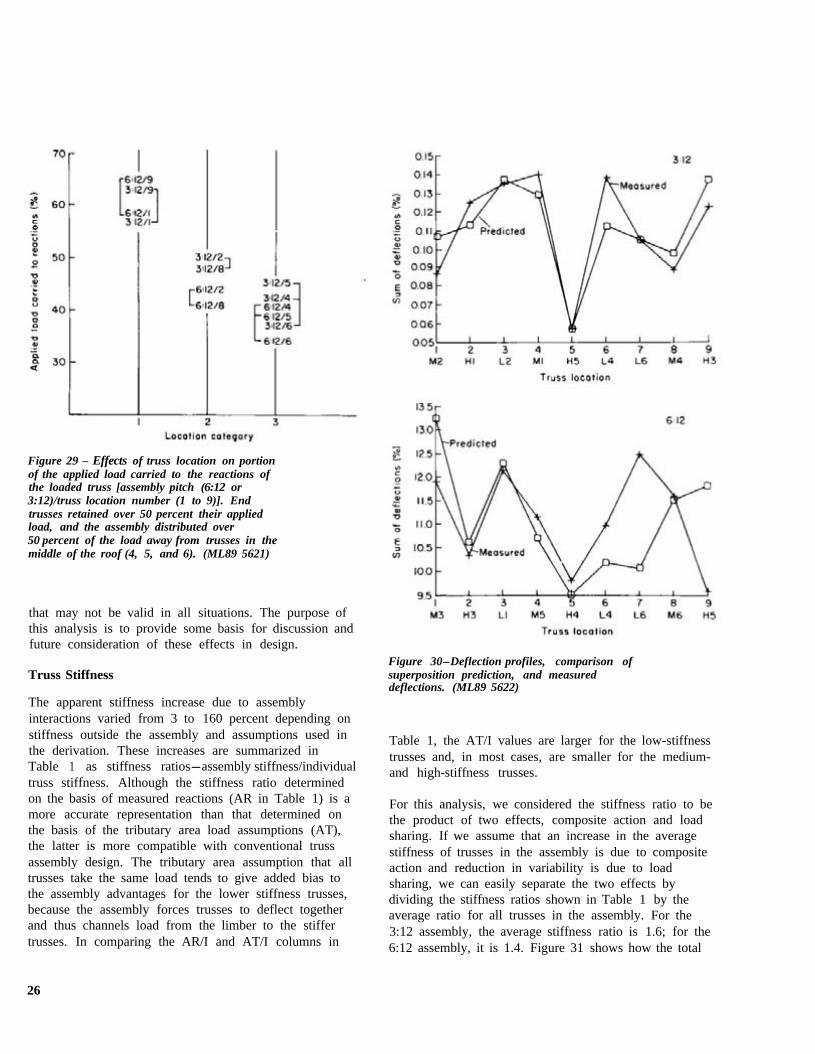
Figure 29 – Effects of truss location on portion of the applied load carried to the reactions of the loaded truss [assembly pitch (6:12 or 3:12)/truss location number (1 to 9)]. End trusses retained over 50 percent their applied load, and the assembly distributed over 50 percent of the load away from trusses in the middle of the roof (4, 5, and 6). (ML89 5621)
that may not be valid in all situations. The purpose of this analysis is to provide some basis for discussion and future consideration of these effects in design.
Truss Stiffness
The apparent stiffness increase due to assembly interactions varied from 3 to 160 percent depending on stiffness outside the assembly and assumptions used in the derivation. These increases are summarized in Table 1 as stiffness ratios-assembly stiffness/individual truss stiffness. Although the stiffness ratio determined on the basis of measured reactions (AR in Table 1) is a more accurate representation than that determined on the basis of the tributary area load assumptions (AT), the latter is more compatible with conventional truss assembly design. The tributary area assumption that all trusses take the same load tends to give added bias to the assembly advantages for the lower stiffness trusses, because the assembly forces trusses to deflect together and thus channels load from the limber to the stiffer trusses. In comparing the AR/I and AT/I columns in
Figure 30-Deflection profiles, comparison of superposition prediction, and measured deflections. (ML89 5622)
Table 1, the AT/I values are larger for the low-stiffness trusses and, in most cases, are smaller for the medium-and high-stiffness trusses.
For this analysis, we considered the stiffness ratio to be the product of two effects, composite action and load sharing. If we assume that an increase in the average stiffness of trusses in the assembly is due to composite action and reduction in variability is due to load sharing, we can easily separate the two effects by dividing the stiffness ratios shown in Table 1 by the average ratio for all trusses in the assembly. For the 3:12 assembly, the average stiffness ratio is 1.6; for the 6:12 assembly, it is 1.4. Figure 31 shows how the total
26

Figure 31 – The ratio of apparent truss stiffness in the assembly to stiffness measured outside the assembly is greatest for trusses with the lowest relative stiffness. Total system effect is due partially to composite action, considered to be independent of relative stiffness and load sharing effects. (ML89 5623)
assembly effect and the load-sharing effect vary with the relative stiffness of the trusses within the assembly when assembly stiffness is determined on the basis of the tributary area loading assumption.
The tributary area assumption has a greater effect on the load-sharing value for the 3:12 assembly than for the 6:12 assembly. For the lower sloped roof, the maximum load-sharing factor was 1.39 based on measured reactions and 1.59 assuming tributary area loading. For the 6:12 assembly, these maximum load-sharing factors were 1.32 and 1.40, respectively.
Figure 32 shows how load sharing and composite action affect the deflection profile of the roof assembly. Truss deflection at design load, measured outside the assembly, is shown as being more variable and greater than that measured inside the assembly. In each case, the values shown were derived by interpolation to the same sum of measured reactions from actual measured load-deflection data.
Truss Strength
Any evaluation of assembly effect on truss strength on the basis of test observation is by necessity purely hypothetical. For this evaluation, we made two basic assumptions:
Figure 32-Design load deflections for trusses tested inside and outside the assembly. (ML89 5624)
1. Truss stiffness and load capacity were unaffected by preliminary loading outside the assembly.
2. Truss strength is strongly correlated to truss stiffness within its linear load range.
Using these two assumptions, we first derived an empirical strength prediction equation for trusses tested to failure outside the assembly. This equation was based on a linear regression of strength on stiffness and deflection at design load for trusses tested to failure at the SHC as part of this test program (Wolfe and others 1986). This equation was then used to estimate the strength of trusses tested to design load at the FPL. Finally, truss failure load measured in the assembly
27

Figure 33 – Truss strength prediction for tests conducted at the SHC. (ML89 5625)
tests was compared to the predicted load capacities to give some measure of assembly effect.
Table 3 gives the data used to determine the strength prediction equations for the 3:12 and 6:12 assemblies. Figure 33 compares the resulting strength predictions to measured strength for the trusses tested to failure outside the assembly.
Table 4 gives the individual truss strength predictions for trusses tested in the roof assemblies. On the basis of this evaluation, three of the 3:12 trusses and four of the 6:12 trusses would be expected to fail at or below three times their design load value.
For the assembly tests, we did not measure failure load on each truss, but we were able to measure the load carried by each truss prior to the first failure. In the
case of the 3:12 assembly tests, we did not accurately measure failure load, because failure occurred between load steps and data channels were not scanned continuously at the time of failure. The last scan prior to failure showed a minimum load of 2.75 TDL for a truss predicted to fail at 1.3 TDL. For the 6:12 assembly, the minimum truss load at failure was 3.5 TDL for a truss predicted to fail at 2.0 TDL.
At three times design on the 3:12 assembly, the five trusses that eventually failed carried an average of 3.14 times the individual truss design value. This averaged 1.2 times the value predicted for these trusses on the basis of the individual truss tests outside the assembly (Table 4). If our evaluation procedure is valid, this is a conservative estimate of the total assembly effect.
The continuous scan test results obtained for the 6:12 assembly allowed us to identify the sequence of failure as well as the design load ratio (DLR) at maximum load for each truss. The first truss to show a sudden increase in deflection and a decrease in reactions was 6H4, the fifth truss from the west end. Its maximum DLR was 5.2, 1.4 times the predicted value. Although its load capacity showed a marked decrease after this event, truss 6H4 continued to support five times the design load as other trusses in the assembly showed signs of failure. The sixth truss also showed a sudden deflection at this point but continued to increase its load to a DLR of 3.4, 1.7 times the predicted value, until the seventh truss hit its maximum at a DLR of 3.8, 1.5 times predicted. After trusses 5, 6, and 7 failed, truss 8 failed at its predicted value of 3.9 times design.
Of the four trusses that constituted failure in the 6:12 assembly, the average failure load was 1.4 times that predicted on the basis of individual truss performance data. The only truss to fail below 1.4 times the predicted value was truss 8, the last truss failure in the sequence.
28

Table 3–Small Homes Council tests to failurea
Average modulus of Deflection Failure load
Truss ID
elasticity of members
(× 106 lb/in2 Slope
(in./lb)
at design load (in.)
Actual value (lb)
Ratio to design load
Predicted capacity
(lb)
a Correlations between stiffness, design load deflection, and maximum load were used to estimate single truss load capacity for the trusses tested for stiffness.
Table 4–Strength predictions of truss failurea
Average Predicted failure load modulus of elasticity of
Truss members Slope ID (× 106 lb/in2 ) (in./lb)
Deflection at design Ratio to
load Value design (in.) (lb) load
a Relationship derived from Small Homes Council test data.
29

Summary and Conclusions
The results of these two roof assembly tests provide a basis for evaluating current roof assembly design practice and developing more precise analytical procedures. Although these two assembly tests are insufficient to provide confidence in a quantitative measure of the degree of conservatism in current design practice, they do indicate that factors such as truss stiffness variability, roof pitch, and assembly configuration can have significant effects on the ratio of assembly load capacity to the load capacity of the weakest individual truss in the assembly.
The increase in apparent truss stiffness due to assembly interactions ranged from 3 to 160 percent for the two assemblies. This increase is dependent on individual truss stiffness and roof configuration and is based on the assumption of tributary area loading in the assembly. It comprises effects of composite action as well as load sharing, with average apparent stiffness increase attributed to composite action and the reduction in variability attributed to load sharing. For the most limber truss in each assembly, load-sharing accounted for a 40 percent increase in truss stiffness. Before firm conclusions are drawn about an increase that can be accounted for in design, this effect will be reevaluated using analytical models and additional assembly tests with less variable truss stiffnesses and less rigid truss joints.
These tests also provide some basis for developing a theoretical evaluation of load capacity increase for a roof assembly over that of individual trusses. The fact that the trusses in the assembly deflected less, on the average, than they did under comparable load when tested individually indicates that the sheathing does more than simply redistribute load. A comparison of individual failure loads in the roof assembly to those measured outside the assembly suggests that assembly effects on load capacity may exceed the 15 percent currently allowed for bending stress, but this will vary with assembly configuration. Analytical models being developed for evaluating roof assemblies will be used to more accurately evaluate these assembly effects.
Failure modes we observed may not be indicative of those to be expected in conventional roof assemblies. Because the truss plates used in critical locations were of a heavier gauge than is normally used in residential roof trusses, failures occurred predominantly in wood members. Shear buckling-type failures or plate distortions likely to influence performance of
conventional trusses had little effect on these roof assemblies. Additional research is being conducted to evaluate the efficacy of using interaction equations similar to those currently published in the National Design Specification for wood construction (NFPA 1980) to detect wood failure modes in assemblies. Future assembly research should allow an evaluation of possible plate failure modes so that analytical models may be developed with the capacity to detect connector-type failures.
Our objective was to provide a data base for use in developing analytical models for light-frame metal-plate-connected truss roof assemblies. As part of this task, we attempted to characterize the effects of material variability, roof pitch boundary conditions, and loading configuration on assembly performance. We found the following:
1. Material variability effects decrease with assembly redundancy. Stiffer trusses carry a greater share of the full assembly load because all trusses tend to deflect together when the assembly is loaded.
2. Superposition methods may be used to predict assembly reactions as well as deflections. Within the assembly, truss load-deflection performance was close to linear. This facilitated the summation of individual truss load and deflection influence matrices to predict assembly performance.
3. In addition to reducing the importance of material variability, assembly interactions also appeared to increase individual truss stiffness and strength. Under full assembly loading, the reduction in truss deflection at a given load, within the range of design load, averaged better than 50 percent by comparison to individual tests outside the assembly. A comparison of individual truss failure loads inside the assembly to those measured outside the assembly suggests an average increase of as much as 40 percent for the 6:12 assembly and more than 20 percent for the 3:12 assembly.
The results obtained from this study provide a basis for estimating how truss load capacity, predicted using conventional working stress analysis methods, is influenced by assembly interactions. They are too limited in scope, however, to serve as the basis for developing a new approach to light-frame roof assembly design. Future tests of conventional roof assemblies
30

Literature Cited
along with a broader data base for evaluating the influence of nonlinear connection behavior are needed to develop the design tools necessary to truly evaluate how the distribution of loads in a repetitive member assembly affects its load capacity.
Acknowledgments
The success of this study was strongly dependent upon the work of the lab technicians involved. We wish to give special recognition to Roy Traver who took the lead role in assembling and maintaining the test equipment, setting up the individual truss tests, and constructing the test roof assemblies.
This study was partially supported by several wood industry organizations. Lumber and sheathing were provided by the Southern Pine Inspection Bureau and the American Plywood Association, respectively. Truss design, fabrication, transportation, and initial stiffness tests by the Small Homes Council were funded by the Truss Plate Institute. The Wood Truss Council of America provided financial support for the purchase of equipment needed to conduct the tests at the Forest Products Laboratory.
American Plywood Association (APA). 1984. APA design/construction guide- residential and commercial. Form No. E30D, December. APA, P.O. Box 11700, Tacoma, WA 98411.
American Society of Civil Engineers (ASCE). 1979. Proceedings of the specialty conference on probabilistic mechanics and structural reliability. ASCE, 345 East 47th Street, New York 10017.
Anderson, L. O. 1970. Wood-frame house construction. Agric. Handb. 73. Washington, DC: U.S. Department of Agriculture.
ASTM. 1976. Standard method of testing plywood in flexure. ASTM D 3043. American Standard for Testing and Materials, 1916 Race St., Philadelphia, PA 19103.
ASTM. 1977. Standard methods of testing mechanical fasteners in wood. ASTM D 1761-77. American Standard for Testing and Materials, 1916 Race St., Philadelphia, PA 19103.
Boller, K. H. 1972. A facility to evaluate three-dimensional performance of house modules. Res. Note FPL-0225. Madison, WI: U.S. Department of Agriculture, Forest Service, Forest Products Laboratory. 12 p.
Brown, D. H. 1958. Plywood folded plate design method. Douglas-fir Plywood Association (DFPA) Bull. 58-B. DFPA, Tacoma, WA.
Foschi, R. O. 1977. Analysis of wood diaphragms and trusses. Part II: Truss-plate connections. Canadian Journal of Civil Engineering. 4:353-362.
Foschi, R. O. 1984. Reliability of wood structural systems. ASCE Journal of Structural Engineering. 110(12): 2995-3013.
Gromala, D. S.; Wheat, D. L. 1983. Structural analysis of light frame subassemblies. In: Workshop on structural wood research. State of the art and research needs; 1983 October 5; American Society of Civil Engineers, 345 E. 47th Street, New York, NY 10017-2398.
Leicester, R. H. 1974. Reliability model for prototype testing. Conference on applications of probability theory to structural design; 1974 November 14; Melbourne, Australia: Institution of Engineers, CSIRO, Division of Building Research.
Lendrum, J. T. 1955. Performance of roofs and ceilings under load, 10th annual short course in residential construction. Issued by the Small Homes Council, University of Illinois, Urbana.
Mayo, A. P. 1978. Trussed rafter roofs-load distribution and lateral stability. Princes Risborough Laboratory, Build. Res. Estab. info paper. November.
McCarthy, M.; Wolfe, R. W. 1987. Assessment of truss plate performance model applied to southern pine truss joints. Res. Pap. FPL-RP-483. Madison, WI: U.S. Department of Agriculture, Forest Service, Forest Products Laboratory. 13 p.
National Association of Home Builders (NAHB). 1975. Load sharing in roof assemblies utilizing roof trusses with plywood sheathing and spaced board sheathing. Report for NAHB, Canadian Wood Council, USDA Forest Service and WWPA. NAHB Research Foundation, 627 Southlawn Lane, Rockville, MD 20850.
31
National Forest Products Association (NFPA). 1980. Span tables for joists and rafters. NFPA, 1619 Massachusetts Avenue NW., Washington, DC 20036.
Nicol-Smith, C. A. 1977. Two-way action of pitched roofs. Forest Products Journal. 27(5):55.
Pierce, C. B. 1982. Load sharing between rafters in a traditional timber roof structure. Build. Res. Estab., Princes Risborough Laboratory. April.
Thoft-Christensen, P.; Baker, M. 1982. Structural reliability theory and its applications. Springer-Verlag, NY.
Thornburn, H. J.; Schriever, W. R. 1962. Loading tests on full-scale house roofs. Res. Pap. No. 165. National Research Council of Canada, Division of Building Research. August.
Truss Plate Institute (TPI), Inc. 1985a. Bracing wood trusses: commentary and recommendations. TPI, 583 D’Onofrio Drive, Suite 200, Madison, WI 53719.
Truss Plate Institute (TPI), Inc. 1985b. Design specifications for metal plate connected wood trusses. TPI 85. TPI, 583 D’Onofrio Drive, Suite 200, Madison, WI 53719.
Tuomi, R. L.; McCutcheon, W. J. 1974. Testing of a full scale house under simulated snowloads and windloads. Res. Pap. FPL 234. Madison, WI: U.S. Department of Agriculture, Forest Service, Forest Products Laboratory. 32 p.
U.S. Department of Housing and Urban Development (HUD). 1979. Minimum property standards, one and two family dwellings. HUD, Washington, DC.
Wolfe, R. W.; Percival, D. H.; Moody, R. C. 1986. Strength and stiffness of light framed sloped trusses. Res. Pap. FPL 471. Madison, WI: U.S. Department of Agriculture, Forest Service, Forest Products Laboratory. 16 p.
Appendix A – Literature Review
Evolution of light-frame roof assemblies in the United States has been rather sporadic, with major changes motivated primarily by a need to facilitate construction. In the 1830s the shift from heavy timber and mortice and tenon joints was brought about by the development of a manufacturing process to mass produce nails. Nails eliminated the need for large sections for cutting the joints; this in turn led to standardized lumber sizes. The basic configuration of light-frame roof assemblies changed little during the 90-year period from 1850 to 1940.
The next major change in roof assembly construction came about as a result of the need for temporary housing for the armed forces during World War II. This was one of the first extensive uses of light-frame trusses and plywood to replace lumber rafters and board sheathing. These changes did not carry over to the private sector, however, until several years after the war. Labor savings from using 4- by 8-ft plywood sheathing more than covered its higher cost, and the development of the metal truss plate connector in the mid-1950s made truss assemblies a viable alternative to dimension lumber rafters.
At the time of their introduction, there was little need for precise analytical models to show that trusses and plywood were at least as good as the conventional assembly of lumber rafters and diagonal board sheathing. Determinate analysis procedures showed that trusses could easily be designed to carry residential roof loads. The possibility for increased spans and spacing, coupled with reduced on-site labor costs, facilitated their acceptance. Plywood was rapidly accepted for its ease of application and its uniform surface for application of shingles. Little recognized were the advantages of improved diaphragm performance.
Test and design methods adopted by the truss industry are more restrictive than those used for lumber rafters. For example, the derivation of design values for lumber implies that 5 percent of pieces tested to 2.1 times their design stress will fail. The recommended test procedure for trusses (TPI 1985b), however, states that each truss must be able to sustain 2.5 times design for 5 min. If the design assumption is true that the most highly stressed member is a 5th percentile piece, the 2.5 times design restriction should result in more than a 5 percent failure rate.
32
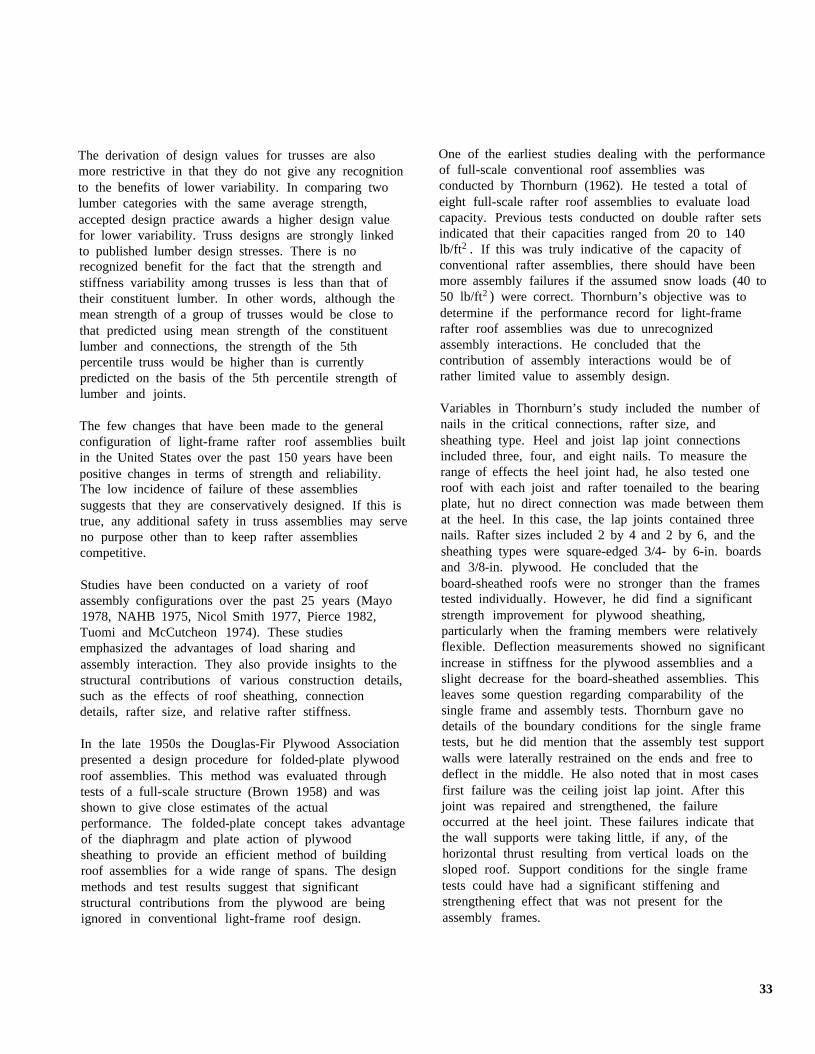
The derivation of design values for trusses are also more restrictive in that they do not give any recognition to the benefits of lower variability. In comparing two lumber categories with the same average strength, accepted design practice awards a higher design value for lower variability. Truss designs are strongly linked to published lumber design stresses. There is no recognized benefit for the fact that the strength and stiffness variability among trusses is less than that of their constituent lumber. In other words, although the mean strength of a group of trusses would be close to that predicted using mean strength of the constituent lumber and connections, the strength of the 5th percentile truss would be higher than is currently predicted on the basis of the 5th percentile strength of lumber and joints.
The few changes that have been made to the general configuration of light-frame rafter roof assemblies built in the United States over the past 150 years have been positive changes in terms of strength and reliability. The low incidence of failure of these assemblies suggests that they are conservatively designed. If this is true, any additional safety in truss assemblies may serve no purpose other than to keep rafter assemblies competitive.
Studies have been conducted on a variety of roof assembly configurations over the past 25 years (Mayo 1978, NAHB 1975, Nicol Smith 1977, Pierce 1982, Tuomi and McCutcheon 1974). These studies emphasized the advantages of load sharing and assembly interaction. They also provide insights to the structural contributions of various construction details, such as the effects of roof sheathing, connection details, rafter size, and relative rafter stiffness.
In the late 1950s the Douglas-Fir Plywood Association presented a design procedure for folded-plate plywood roof assemblies. This method was evaluated through tests of a full-scale structure (Brown 1958) and was shown to give close estimates of the actual performance. The folded-plate concept takes advantage of the diaphragm and plate action of plywood sheathing to provide an efficient method of building roof assemblies for a wide range of spans. The design methods and test results suggest that significant structural contributions from the plywood are being ignored in conventional light-frame roof design.
One of the earliest studies dealing with the performance of full-scale conventional roof assemblies was conducted by Thornburn (1962). He tested a total of eight full-scale rafter roof assemblies to evaluate load capacity. Previous tests conducted on double rafter sets indicated that their capacities ranged from 20 to 140 lb/ft2 . If this was truly indicative of the capacity of conventional rafter assemblies, there should have been more assembly failures if the assumed snow loads (40 to 50 lb/ft2 ) were correct. Thornburn’s objective was to determine if the performance record for light-frame rafter roof assemblies was due to unrecognized assembly interactions. He concluded that the contribution of assembly interactions would be of rather limited value to assembly design.
Variables in Thornburn’s study included the number of nails in the critical connections, rafter size, and sheathing type. Heel and joist lap joint connections included three, four, and eight nails. To measure the range of effects the heel joint had, he also tested one roof with each joist and rafter toenailed to the bearing plate, hut no direct connection was made between them at the heel. In this case, the lap joints contained three nails. Rafter sizes included 2 by 4 and 2 by 6, and the sheathing types were square-edged 3/4- by 6-in. boards and 3/8-in. plywood. He concluded that the board-sheathed roofs were no stronger than the frames tested individually. However, he did find a significant strength improvement for plywood sheathing, particularly when the framing members were relatively flexible. Deflection measurements showed no significant increase in stiffness for the plywood assemblies and a slight decrease for the board-sheathed assemblies. This leaves some question regarding comparability of the single frame and assembly tests. Thornburn gave no details of the boundary conditions for the single frame tests, but he did mention that the assembly test support walls were laterally restrained on the ends and free to deflect in the middle. He also noted that in most cases first failure was the ceiling joist lap joint. After this joint was repaired and strengthened, the failure occurred at the heel joint. These failures indicate that the wall supports were taking little, if any, of the horizontal thrust resulting from vertical loads on the sloped roof. Support conditions for the single frame tests could have had a significant stiffening and strengthening effect that was not present for the assembly frames.
33

Tests conducted by the NAHB (1975) gave some results that may clarify some of Thornburn’s test results. The NAHB tests, conducted on a truss assembly, showed that the average deflection for all the trusses in the assembly did not change significantly from that found in testing the trusses individually. The variation in deflection between trusses, however, was less in the assembly than it was for individuals. The stiffer trusses deflected more and the limber trusses deflected less in the assembly. They concluded that because stiffer trusses accept more load in the assembly, the load-sharing increase factor permitted for bending should be applied to all strength values. Research at the Princes Risborough Laboratory in England (Mayo 1978, Pierce 1982) indicated significant load sharing between rafters within the roof assembly without the use of a roof diaphragm. In the European-style roof assemblies, load redistribution occurs primarily through bending of transverse purlins or battens. Tests conducted by Mayo (1978) on a trussed rafter assembly indicated that 40 percent of the load applied directly to one truss was distributed to adjacent trusses through the combined bending action of roof battens and a plasterboard ceiling. Pierce (1982) evaluated a dimension lumber rafter assembly to compare assembly response to computer model predictions. His results suggest that loads applied to a single rafter may be redistributed as far as two rafters in either direction. Pierce reported that load sharing resulted in a 35.5-percent reduction in deflection and a 27.4-percent reduction in maximum moment. In simulating different geometries and stiffnesses, he concluded that the deflection-based load-sharing factor varied from 8 to 40 percent depending on the ratio of rafter to batten stiffness and rafter stiffness of the rafter and load. The distributing element was also apparent in Thornburn’s (1962) study. Thornburn gave no information about the stiffness of the rafters, but the relative stiffness of the 3/8-in. plywood in his study was roughly 25 percent as great for the 2 by 6 as it was for the 2 by 4 rafters. So it is logical that the plywood would have a greater effect on load redistribution in the 2 by 4 assembly. If Thornburn bad placed loads on one rafter set at a time, he would have seen some of the same effects found in other studies.
In 1977, a roof assembly test conducted by Nicol-Smith suggested that the role of plywood may be more than that of a load-distributing element. He loaded a half-scale plywood-sheathed truss roof assembly to its design load and then removed all intermediate supports.
Supported only at its four corners, the roof assembly still supported the load. In this case, intermediate trusses served as load distributing elements to enable the diaphragm action of the sheathing to carry the load. Although this work does not quantify the sheathing contribution to load capacity, it does suggest that it may be worth considering.
In reviewing literature on the performance of light-frame roof assemblies, we were unable to find any single study that evaluated the distribution of loads within a roof assembly or that provided a means of quantifying the inherent safety of truss and lumber rafter assemblies. The majority of the literature suggests that assembly interactions have a significant effect on roof performance, but the cost of full assembly tests has limited the value of most assembly studies. Research completed on floor assemblies (Gromala and Wheat 1983) resulted in full assembly computer models that enable researchers to evaluate assembly effects more completely. Similar computer models are now needed to evaluate roof assemblies.
34

Appendix B – Sheathing and Lumber Stiffness Properties
Plywood sheathing for the roof assemblies was supplied by the American Plywood Association (APA). As part of this study, APA obtained and tested a sample of eighty 4- by 8-ft sheets of 15/32-in. 3-ply Southern Pine plywood with a span rating 32/16. Their stiffness tests, conducted in bending parallel to the face grain using the ASTM D 3043 (1976) method C, showed an average stiffness of 1.99 x 10⁵ lb-in2 /ft with a coefficient of variation of 15 percent for the 80 sheets. Seventy-two of the sheets were shipped to the FPL for use in the construction of four roof assemblies tested as part of the light-frame roof assembly testing program.
Figure B-1 shows the 3:12 and 6:12 sheathing patterns. The numbers shown indicate the stiffness value (105 lb-in.2 /ft) determined by APA for the sheet used in that location. In each case, the sheathing was applied according to the APA guidelines, with a 1/8-in. gap between adjacent sheets and fastened with 6d common nails with a spacing of 6 in.
Plywood and truss chord material taken from undamaged parts of the roof assembly, after the full assembly tests were complete, was used to evaluate the load-displacement characteristics of the nailed connections. These tests were conducted in lateral and direct withdrawal following the procedures recommended in the ASTM D 1761 standard (1977). The lateral nail tests included loads applied both parallel and perpendicular to the grain of the chord section.
The lateral nail tests resulted in a continuous nonlinear load displacement. The three-parameter model proposed by Foschi (1977) for truss plates was used to model the curves for each of the joints tested. Table B-l summarizes the average parameters derived for each test configuration in each lumber MOE category. The results shown in Table B-l indicate that the lumber MOE category definitely has an effect on the lateral nail performance.
Direct withdrawal tests for the sheathing nails were also conducted according to ASTM D 1761 (1977). For these tests, the primary concern was the maximum load value. An evaluation of the results showed that for tests that reached their maximum load after 0.02 in. withdrawal, the slope of the load-displacement curve increased in the second 0.01-in. interval. Many tests hit maximum load before 0.02 in., therefore, the slope values given in Table B-2 and shown in Figure B-2
correspond to the initial slope of the load-displacement curve between 0 and 0.01 in. The distribution of maximum loads is shown in Figure B-3.
Table B-3 gives the mean values and the lower 95 percent confidence limits for maximum withdrawal loads and initial slip moduli measured for three MOE categories of lumber. These MOE categories correspond to the truss lumber used in the roof tests. The higher MOE material definitely had higher maximum loads and higher maximum load displacements. The initial slope values show no such trend, however.
Table B-3 gives a summary of the Foschi parameters determined for the 20-gauge and 16-gauge plates used in the fabrication of the trusses. Test details are described in the report by McCarthy and Wolfe (1987).
At the time the nail tests were conducted, samples were also taken to determine specific gravity and moisture content. The distribution of moisture contents (Fig. B-4) averaged 10 percent, varying from 8.5 to 11 percent. Specific gravity values (Fig. B-5) show a definite relation to lumber MOE category. The low MOE sample had an average value of 0.45, the medium MOE sample averaged 0.55, and the high MOE sample averaged 0.77. These measurements were not matched to the nail tests, so it was difficult to get a direct relation between the nail performance and specific gravity.
Lumber used to construct the roof trusses was divided into three stiffness categories on the basis of average MOE determined using a commercial lumber-stressgrading machine. For each truss, the lumber was randomly selected from one of the MOE categories. Table B-4 gives the normal distribution parameters that may be used to characterize the lumber sample used for each truss slope and stiffness category. Tables B-5 and B-6 give a breakdown of average MOE values measured for each truss member.
35

Figure B-1 – Placement of plywood sheathing on 3:12 and 6:12 roof assemblies. Numbers shown are the measured MOE values in 105 lb.in2 /ft. (ML89 5626)
Figure B-2 – Distribution of initial slopes of nail withdrawal tests conducted using 6d common nails in three MOE categories of Southern Pine. (ML89 5627)
36
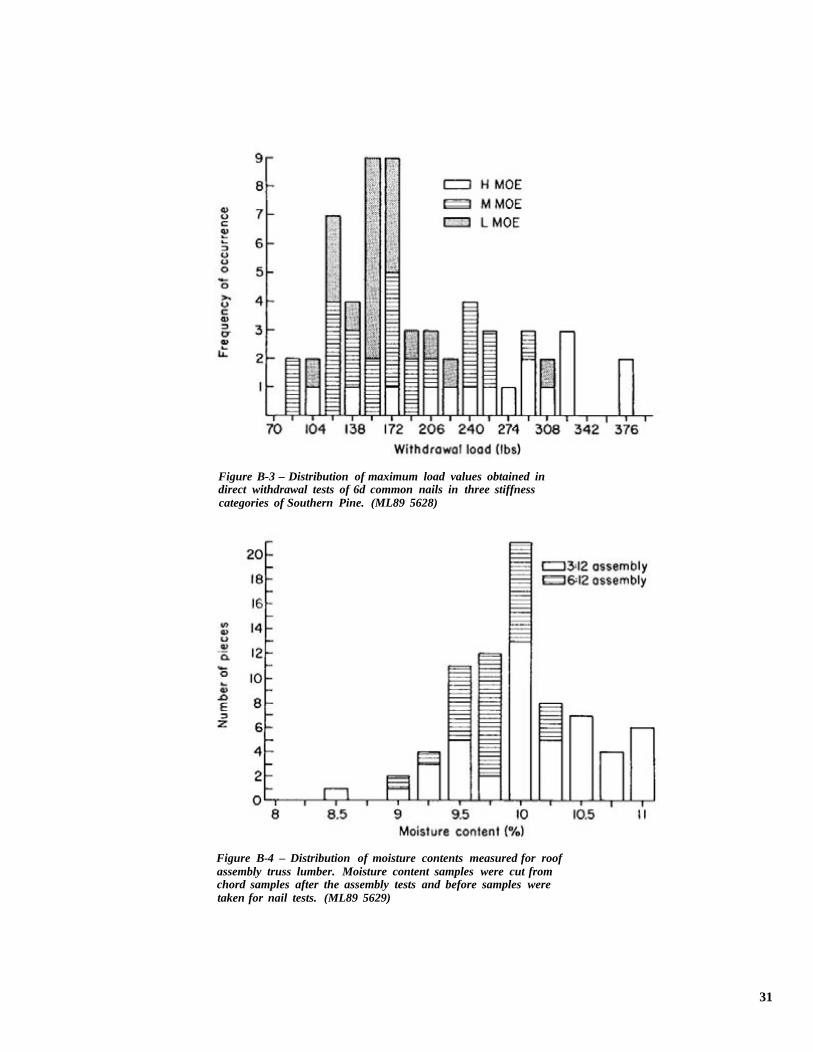
Figure B-3 – Distribution of maximum load values obtained in direct withdrawal tests of 6d common nails in three stiffness categories of Southern Pine. (ML89 5628)
Figure B-4 – Distribution of moisture contents measured for roof assembly truss lumber. Moisture content samples were cut from chord samples after the assembly tests and before samples were taken for nail tests. (ML89 5629)
31

Figure B-5 – Distribution of lumber specifc gravities. Samples token from truss chords after assembly tests. (ML89 5630)
Table B-1 – Foschi model parameters for lateral nail tests of sheathing chord-type connections
Parallel high MOE Parallel medium MOE Parallel low MOE Perpendicular high MOE Perpendicular medium MOE Perpendicular low MOE
a Nonlinear connection model parameters (Foschi 1977); K is initial stiffness, Mo is intercept of M1 tangent, M1 is tangent to curve beyond elastic range.
Table B-2 – Results of direct withdrawal tests
95 percent Mean confidence on mean
Maximum Modulus Panel load of elasticity number (lb/in2 )
Maximum load
Slope (lb/in2 ) Slope
High Medium Low
38

Table B-3–Model parameters and strength for each joint type (60 teeth)
Ka a aMaximum load Mo M1
Plate Average COVb Average COV Average COV Average COV Orientation Joint gauge (lb) (percent) (lb/in.) (percent) (lb) (percent) (lb/in.) (percent)
(AA)
(AA)
PO GO P90 GO (EA) PO G90 (AE) P90 G90 (EE) PO G30 PO G60 PO GO
a Nonlinear connection model developed by Foschi (1977); K is initial stiffness, Mo is intercept of the M1 tangent, M1 is tangent to nonlinear curve beyond elastic limit.
b Coefficient of variation.
Table B-4–Modulus of elasticity (MOE) values for lumber in each truss category
3:12 slope 6:12 slope
AverageMOE MOE category (× 106 lb/in2 )
Coefficient Average Coefficient of variation MOE of variation
(percent) ( × 106 lb/in2 ) (percent)
Low Medium High
39
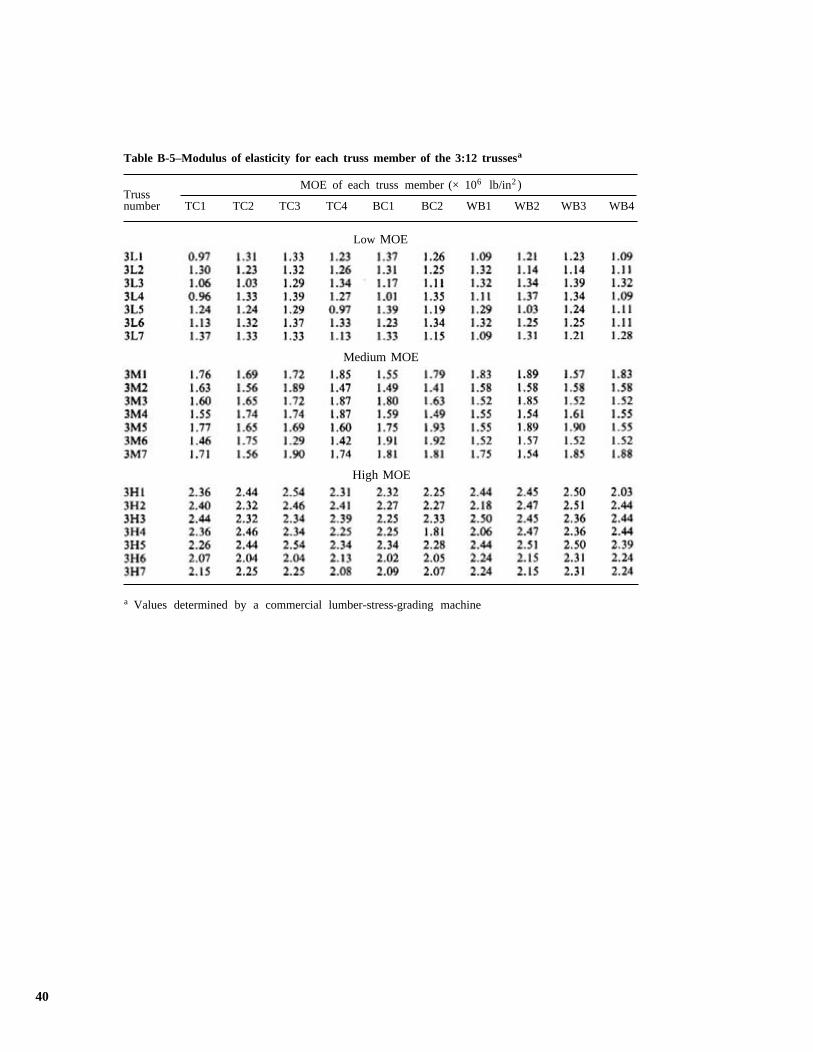
Table B-5–Modulus of elasticity for each truss member of the 3:12 trussesa
Truss MOE of each truss member (× 106 lb/in2 )
number TC1 TC2 TC3 TC4 BC1 BC2 WB1 WB2 WB3 WB4
Low MOE
Medium MOE
High MOE
a Values determined by a commercial lumber-stress-grading machine
40

Table B-6–Modulus of elasticity for each truss member of the 6:12 trussesa
Truss MOE of each truss member (× 106 lb/in2 )
number TC1 TC2 TC3 TC4 BC1 BC2 WB1 WB2 WB3 WB4
Low MOE
Medium MOE
High MOE
'Values determined by a commercial lumber-stress-grading machine
41