Embed Size (px)
Citation preview
UNITED STATES
SECURITIES AND EXCHANGE COMMISSIONWashington, D.C. 20549
FORM 10-K(Mark One) R ANNUAL REPORT PURSUANT TO SECTION 13 OR 15(d) OF THE SECURITIES EXCHANGE ACT OF 1934 FOR THE FISCAL YEARENDED SEPTEMBER 30, 2017£ TRANSITION REPORT PURSUANT TO SECTION 13 OR 15(d) OF THE SECURITIES EXCHANGE ACT OF 1934
Commission file number 001-16445
Rockwell Collins, Inc .
(Exact name of registrant as specified in its charter)
Delaware 52-2314475(State or other jurisdiction (I.R.S. Employer
of incorporation or organization) Identification No.)
400 Collins Road NE Cedar Rapids, Iowa 52498
(Address of principal executive offices) (Zip Code)Registrant's telephone number, including area code: (319) 295-1000
SECURITIES REGISTERED PURSUANT TO SECTION 12(b) OF THE ACT:Title of each class Name of each exchange on which registered
Common Stock, par value $.01 per share New York Stock ExchangeSECURITIES REGISTERED PURSUANT TO SECTION 12(g) OF THE ACT: None
Indicate by check mark if the registrant is a well-known seasoned issuer, as defined in Rule 405 of the Securities Act. Yes R No £
Indicate by check mark if the registrant is not required to file reports pursuant to Section 13 or Section 15(d) of the Act. Yes £ No R
Indicate by check mark whether the registrant (1) has filed all reports required to be filed by Section 13 or 15(d) of the Securities Exchange Act of 1934 during thepreceding 12 months (or for such shorter period that the registrant was required to file such reports), and (2) has been subject to such filing requirements for thepast 90 days. Yes R No £
Indicate by check mark whether the registrant has submitted electronically and posted on its corporate Web site, if any, every Interactive Data File required to besubmitted and posted pursuant to Rule 405 of Regulations S-T during the preceding 12 months (or for such shorter period that the registrant was required to submitand post such files). Yes R No £
Indicate by check mark if disclosure of delinquent filers pursuant to Item 405 of Regulation S-K is not contained herein, and will not be contained, to the best of theregistrant's knowledge, in definitive proxy or information statements incorporated by reference in Part III of this Form 10-K or any amendment to this Form 10-K. £
Indicate by check mark whether the registrant is a large accelerated filer, an accelerated filer, a non-accelerated filer or a smaller reporting company. See thedefinitions of "large accelerated filer," "accelerated filer," "smaller reporting company," and "emerging growth company" in Rule 12b-2 of the Exchange Act.(Check one):
Large accelerated filer R Accelerated filer £Non-accelerated filer £ (Do not check if a smaller reporting company) Smaller reporting company £ Emerging growth company £
If an emerging growth company, indicate by check mark if the registrant has elected not to use the extended transition period for complying with any new orrevised financial accounting standards provided pursuant to Section 13(a) of the Exchange Act. o
Indicate by check mark whether the registrant is a shell company (as defined in Rule 12b-2 of the Exchange Act). Yes £ No R
The aggregate market value of the registrant's voting stock held by non-affiliates of the registrant on March 31, 2017 was approximately $12.71 billion. Forpurposes of this calculation, the registrant has assumed that its directors and executive officers are affiliates.
162,904,627 shares of the registrant's Common Stock were outstanding on October 31, 2017.
DOCUMENTS INCORPORATED BY REFERENCECertain information contained in the Proxy Statement for the Annual Meeting of Shareowners of the registrant to be held on February 1, 2018 is incorporated byreference into Part III.

ROCKWELL COLLINS, INC.
Annual Report on Form 10-K
Table of contents
Page No.PART I Item 1. Business 1 Item 1A. Risk Factors 10 Item 1B. Unresolved Staff Comments 21 Item 2. Properties 22 Item 3. Legal Proceedings 23 Item 4. Mine Safety Disclosures 23 Item 4A. Executive Officers of the Company 24 PART II Item 5. Market for the Company's Common Equity, Related Stockholder Matters and Company Purchases of Equity
Securities25
Item 6. Selected Financial Data 26 Item 7. Management's Discussion and Analysis of Financial Condition and Results of Operations 27 Item 7A. Quantitative and Qualitative Disclosures About Market Risk 55 Item 8. Financial Statements and Supplementary Data 57 Item 9. Changes in and Disagreements with Accountants on Accounting and Financial Disclosure 108 Item 9A. Controls and Procedures 108 Item 9B. Other Information 110
PART III Item 10. Directors, Executive Officers and Corporate Governance 110 Item 11. Executive Compensation 110 Item 12. Security Ownership of Certain Beneficial Owners and Management and Related Stockholder Matters 110 Item 13. Certain Relationships and Related Transactions, and Director Independence 111 Item 14. Principal Accounting Fees and Services 111
PART IV Item 15. Exhibits and Financial Statement Schedules 112
SIGNATURES S-1
i
PART I
Item 1. Business.
General
Rockwell Collins, Inc. (the Company or Rockwell Collins) designs, produces and supports cabin interior, communications and aviation systems and products forcommercial and military customers and provides information management services through voice and data communication networks and solutions worldwide. Theintegrated system solutions and products we provide to our served markets are oriented around a set of core competencies: communications, navigation, automatedflight control, displays/surveillance, bespoke interior products, simulation and training, integrated electronics and information management systems. We alsoprovide a wide range of services and support to our customers through a worldwide network of service centers, including equipment repair and overhaul, serviceparts, field service engineering, training, technical information services and aftermarket used equipment sales. The structure of our business allows us to leveragethese core competencies across markets and applications to bring high value solutions to customers. We operate in multiple countries and are headquartered inCedar Rapids, Iowa.
Our Company's heritage is rooted in the Collins Radio Company, established in 1933. Rockwell Collins, Inc., the parent company, is incorporated in Delaware. Asused herein, the terms "we", "us", "our", "Rockwell Collins" or the "Company" include subsidiaries and predecessors unless the context indicates otherwise.
Whenever reference is made in any Item of this Annual Report on Form 10-K to information in our Proxy Statement for the Annual Meeting of Shareowners to beheld on February 1, 2018 ( 2018 Proxy Statement), such information shall be deemed to be incorporated herein by such reference.
All date references contained herein relate to our fiscal year ending on the Friday closest to September 30 unless otherwise stated. For ease of presentation,September 30 is utilized consistently throughout this report to represent the fiscal year end date. Fiscal years 2017 , 2016 and 2015 were 52-week fiscal years.
Proposed Acquisition by United Technologies Corporation
On September 4, 2017, the Company entered into an Agreement and Plan of Merger (the “Merger Agreement”) with United Technologies Corporation, a Delawarecorporation (“UTC”), and Riveter Merger Sub Corp., a Delaware corporation and a wholly owned subsidiary of UTC (“Merger Sub”). Upon the terms and subjectto the conditions set forth in the Merger Agreement, at the closing, Merger Sub will merge with and into Rockwell Collins, with Rockwell Collins surviving as awholly owned subsidiary of UTC (the “UTC Merger”).
Pursuant to the Merger Agreement, at the effective time of the UTC Merger (the “Effective Time”), each share of Rockwell Collins common stock, par value $0.01per share, issued and outstanding immediately prior to the Effective Time (other than (1) shares held by Rockwell Collins as treasury stock, UTC, or anysubsidiaries of Rockwell Collins or UTC and (2) shares held by a holder who has properly exercised and perfected (and not effectively withdrawn or lost) suchholder’s demand for appraisal rights under Section 262 of the General Corporation Law of the State of Delaware, which in each case will be treated as described inthe Merger Agreement) will be converted into the right to receive (1) $93.33 in cash, without interest, plus (2) a fraction of a share of UTC common stock having avalue equal to the quotient obtained by dividing $46.67 by the average of the volume-weighted average prices per share of UTC common stock on the New YorkStock Exchange for each of the 20 consecutive trading days ending with the trading day immediately prior to the closing date (the “UTC stock price”), subject to atwo-way collar mechanism described below (together, the “Merger Consideration”), less any applicable withholding taxes.
The fraction of a share of UTC common stock into which each such share of Rockwell Collins common stock will be converted is referred to as the exchange ratio.The exchange ratio will depend upon the UTC stock price. If the UTC stock price is greater than $107.01 but less than $124.37, the exchange ratio will be equal tothe quotient of (i) $46.67 divided by (ii) the UTC stock price, which, in each case, will result in the stock consideration having a value equal to $46.67. If the UTCstock price is less than or equal to $107.01 or greater than or equal to $124.37, a two-way collar mechanism will apply, pursuant to which (i) if the UTC stock priceis greater than or equal to $124.37, the exchange ratio will be fixed at 0.37525 and the value of the stock consideration will be more than $46.67, and (ii) if theUTC stock price is less than or equal to $107.01, the exchange ratio will be fixed at 0.43613 and the value of the stock consideration will be less than $46.67.
The completion of the UTC Merger is subject to customary conditions, including, without limitation, (1) the approval of the UTC Merger by Rockwell Collinsshareowners, (2) the expiration or termination of the applicable waiting period under the
1
Hart-Scott-Rodino Antitrust Improvements Act of 1976, as amended, (3) the receipt of other required regulatory approvals, (4) the absence of any order or law thathas the effect of enjoining or otherwise prohibiting the completion of the UTC Merger or resulting in the occurrence of certain conditions specified in the MergerAgreement, (5) the absence of a material adverse effect on Rockwell Collins and UTC and (6) the approval for listing of the shares of common stock of UTCforming part of the Merger Consideration on the New York Stock Exchange and the effectiveness of a registration statement on Form S-4 with respect to suchcommon stock. The completion of the UTC Merger is not subject to the approval of UTC’s shareowners or the receipt of financing by UTC.
The Company and UTC have made customary representations and warranties in the Merger Agreement. The Merger Agreement also contains customary covenantsand agreements, including covenants and agreements relating to (a) the conduct of each of the Company’s and UTC’s respective businesses between the date of thesigning of the Merger Agreement and the consummation of the UTC Merger, and (b) the efforts of the parties to cause the UTC Merger to be completed.
The Merger Agreement includes termination provisions for both Rockwell Collins and UTC. The Merger Agreement provides that the Company may be requiredto pay UTC a termination fee equal to $695 million if the Merger Agreement is terminated by the Company under certain circumstances described in the MergerAgreement.
Financial Information About Our Operating Segments
Financial information with respect to our operating segments, including product line disclosures, revenues, operating earnings and total assets, is contained underthe caption Segment Financial Results in Management's Discussion and Analysis of Financial Condition and Results of Operations in Item 7 below and inNote 21 of the Notes to Consolidated Financial Statements in Item 8 below.
Access to the Company's Reports and Governance Information
We maintain an internet website at www.rockwellcollins.com . Our Annual Reports on Form 10-K, Quarterly Reports on Form 10-Q, Current Reports on Form 8-K and amendments to such reports filed or furnished pursuant to Section 13(a) or 15(d) of the Securities Exchange Act of 1934, as amended, are available free ofcharge on this site as soon as reasonably practicable after the reports are filed with or furnished to the Securities and Exchange Commission (SEC). All reports wefile with the SEC are also available free of charge via EDGAR through the SEC website at www.sec.gov . We also post corporate governance information(including our corporate governance guidelines and Board committee charters) and other information related to our Company on our internet website where it isavailable free of charge. We will provide, without charge, upon written request, copies of our SEC reports and corporate governance information. Our internetwebsite and the information contained therein or connected thereto are not incorporated into this Annual Report on Form 10-K.
Description of Business by Segment
We serve a worldwide customer base through our Interior Systems, Commercial Systems, Government Systems and Information Management Services operatingsegments. These four segments are described in detail below.
Interior Systems
On April 13, 2017, we acquired B/E Aerospace and formed the new Interior Systems business segment. Our Interior Systems business manufactures cabin interiorproducts for commercial aircraft and business aviation customers. We sell our products and provide our services directly to virtually all of the world’s majorairlines and aerospace manufacturers. We have achieved a leading global market position in each of our major product categories, which include:
• commercial aircraft seats, including an extensive line of super first class, first class, business class, economy class and regional aircraft seats
• a full line of aircraft food and beverage preparation and storage equipment, including coffee and espresso makers, water boilers, beverage containers,refrigerators, freezers, chillers and a line of microwave, high efficiency convection and steam ovens
• modular lavatory systems, wastewater management systems and galley systems
• both chemical and gaseous aircraft oxygen storage, distribution and delivery systems, protective breathing equipment and a broad range oflighting products
2
• business jet and general aviation interior products, including an extensive line of executive aircraft and helicopter seats, direct and indirect overheadlighting systems, exterior lighting systems, passenger and crew oxygen systems, air valve systems and high-end aircraft monuments
Interior Systems sales are categorized by product type into interior products and services and aircraft seating.
Interior products and services includes a portfolio of interior structure products (galley structures, food and beverage preparation equipment, water and wastesystems), integrated engineering services, oxygen and passenger service equipment, cabin lighting systems, de-icing equipment and aftermarket services. Theseproducts and services are marketed and sold to original equipment manufacturers (OEMs) as well as airliner customers. Additionally, interior products and servicesmanufactures customized fully integrated thermal and power management solutions for participants in the defense industry, OEMs and the airlines.
Aircraft seating includes a portfolio of innovative and bespoke seating products for applications on all classes of commercial, business aviation, executive andhelicopter platforms for line fit and retrofit programs. These products are marketed and sold directly to OEMs, airlines and completion centers across the globe.
Commercial Systems
Our Commercial Systems segment supplies aviation electronics systems, products and services to customers located throughout the world. The customer base iscomprised of OEMs of commercial air transport, business and regional aircraft, commercial airlines and business aircraft operators. Our systems and products areused in both OEM applications as well as in retrofit and upgrade applications designed to increase the efficiency and enhance the value of existing aircraft.
Our commercial aviation electronics systems, products and services include:
• integrated avionics systems, such as Pro Line Fusion ®, which provide advanced avionics capabilities to meet the challenges of operating in the nextgeneration global airspace. Pro Line Fusion ®capabilities include: touch control primary flight displays, advanced flight and performance management,flight guidance and information management
• integrated cabin electronics solutions, including cabin management systems with touch-screen controls, wireless connectivity equipment, high definitionvideo and audio, and entertainment and information content such as Airshow moving maps
• communications systems and products, such as data link, high frequency (HF), very high frequency (VHF) and satellite communications systems
• navigation systems and products, including landing sensors to enable fully automatic landings, radio navigation and geophysical sensors, as well as flightmanagement systems
• situational awareness and surveillance systems and products, such as synthetic and enhanced vision systems, surface surveillance and guidance solutions,head-up guidance systems, weather radar and collision avoidance systems
• integrated flight controls including fly-by-wire, advanced flight guidance with auto-land capability, pilot controls, and primary and secondary electro-mechanical actuation
• simulation and training systems, including full-flight simulators for crew training, visual system products, training systems and engineering services
• maintenance, repair, parts, after-sales support services and aftermarket used equipment
Commercial Systems sales are categorized into air transport aviation electronics and business and regional aviation electronics. Product category sales aredelineated based upon the difference in the underlying customer base, size of aircraft and markets served.
Air transport aviation electronics include avionics, cabin systems and flight control systems for large commercial transport aircraft platforms. We design theseitems as sub-systems and work with OEMs to integrate with other suppliers' products into the flight deck and broader aircraft systems. Our products offered forOEM applications in the air transport category are
3
marketed directly to aircraft OEMs and airline operators, while our products offered for aftermarket applications are primarily marketed to airline operators.
Business and regional aviation electronics include integrated avionics, cabin management and flight control systems for application on regional and businessaircraft platforms. We develop integrated avionics, cabin and flight control solutions for business and regional aircraft OEMs and support them with integrationinto other aircraft systems. Products offered for OEM applications in the business and regional aircraft category are marketed directly to the aircraftOEMs. Products offered for aftermarket applications are primarily marketed through distributors for business aviation and directly to regional airline operators.
Government Systems
Our Government Systems segment provides a broad range of electronic products, systems and services to customers including the U.S. Department of Defense,various ministries of defense, other government agencies and defense contractors around the world. Our defense electronic solutions are designed to meet a widerange of customer requirements, but tend to share certain characteristics including design for rugged environments and use in size, weight and power constrainedapplications. These applications also typically have stringent product integrity and certification requirements with a high degree of customer oversight. Theseproducts, systems and services support airborne, precision weapon, ground and maritime applications on new equipment as well as in retrofit and upgradeapplications designed to extend the service life and enhance the capability of existing aircraft, vehicle and weapon platforms.
Our defense-related systems, products and services include:
• communications systems and products designed to enable the transmission of information across the communications spectrum
• navigation products and systems, including radio navigation products, global positioning system (GPS) equipment and multi-mode receivers
• avionics systems for aircraft flight decks, including cockpit display products (multipurpose flat panel head-down displays, wide field of view head-up andhelmet-mounted displays), flight controls, information/data processing and communications, navigation, safety and surveillance systems
• precision targeting, electronic warfare and range and training systems
• simulation and training systems, including visual system products, training systems and services
• space wheels for satellite stabilization
• maintenance, repair, parts, after-sales support services and aftermarket used equipment
Government Systems sales are categorized into avionics and communication and navigation products. Product category sales are delineated based upon underlyingproduct technologies.
Avionics consists of electronic solutions for a broad range of airborne platforms including fixed wing aircraft and military and civil rotary wing aircraft, unmannedaerial systems (UASs) and the associated aircrew and maintenance training devices and services. We provide complete avionics solutions, including cockpitavionics, mission system applications and system integration, and also provide individual avionics products to platform integrators. We serve various roles withinthese markets including system and sub-systems integrator as well as provider of various electronic products. For the UAS market we provide cost effective, highperformance integrated flight control, navigation, communication and sensor capabilities. Simulation and training solutions are provided for both fixed and rotarywing aircraft.
Communication and navigation products include full spectrum communication solutions for voice and data connectivity for government and military use in the air,on the ground and at sea. These communication products support military user requirements for high availability, highly secure, jam resistant wirelesscommunication. Products include radio communication, data links, electronic warfare and networked communication systems. The navigation products areprimarily comprised of global positioning system based products used for precision navigation and targeting applications. These applications include airborne,vehicular, maritime, soldier navigation devices, precision targeting subsystems, precision-guided weapons products, range and training systems and a variety ofembedded GPS applications.
4
Information Management Services
Our Information Management Services segment provides communications services, systems integration and security solutions across the aviation, airport, rail andnuclear security markets to customers located around the world. The customer base includes commercial airlines, business aircraft operators, the U.S. FederalAviation Administration (FAA), airport and critical infrastructure operators and major passenger and freight railroads.
Our information management services include:
• voice and data communication services, such as air-to-ground GLOBALink SM and ground-to-ground AviNet ® services, which enable satellite, VHF andHF transmissions between the cockpit, air traffic control, airline operation centers, reservation systems and other third parties ensuring safety andefficiency for commercial airlines and other related entities in the aviation ecosystem
• global, high throughput cabin connectivity solutions enabling airlines to provide an enhanced experience for their passengers and improved operationalefficiency for crews
• robust connectivity management services that ensure interoperability between smart aircraft and legacy airline systems, allowing airlines to increaseefficiency, reduce costs and enhance operations
• cybersecurity as a service to protect the integrity of our customers’ information systems across a wide variety of domains including aviation, airports, railand critical infrastructure
• around the clock global flight support services for business aircraft operators, under the ARINCDirect SM brand, including flight planning and datalink,international trip support, cabin connectivity solutions and flight operations management software
• airport communications and information systems designed to ease congestion and improve airport efficiency via airline agent and self-service check-in,airport operations, baggage management, boarding and access control solutions
• train dispatching and information systems including solutions to support positive train control as mandated by the 2008 Railroad Safety Improvement Act
• mission critical security command and control systems for nuclear power facilities with functions such as intrusion detection, access control, video andcredential management and vehicle identification
Customers, Sales and Marketing
We serve a broad range of customers worldwide, including the U.S. Department of Defense, U.S. Coast Guard, civil agencies, airports, defense contractors, foreignministries of defense, manufacturers of commercial helicopters, manufacturers of commercial air transport, airframe manufacturers, defense manufacturers,business and regional aircraft, commercial airlines, aerospace OEMs, fractional and other business jet operators, the FAA, critical infrastructure operators andmajor passenger and freight railroads. We market our systems, products and services directly to our customers through an internal marketing and sales force. Inaddition, we utilize a worldwide dealer network to distribute our products and international sales representatives to assist with international sales and marketing. In2017 , various branches of the U.S. Government, both directly and indirectly through subcontracts, accounted for 25 percent of our total sales. Our largest customers have substantial bargaining power with respect to price and other commercial terms. Although we believe that we generally enjoy goodrelations with our customers, the loss of all or a substantial portion of our sales to any of our large volume customers for any reason, including the loss of contracts,bankruptcy, reduced or delayed customer requirements, strikes or other work stoppages affecting production by these customers, could have a material adverseeffect on our business, financial condition, results of operations and cash flows.
5
Competition
We operate in a highly competitive environment. Principal competitive factors include total cost of ownership, product and system performance, network coverage,quality, service, warranty and indemnification terms, technology, design engineering capabilities, new product innovation and timely delivery. We competeworldwide with a number of U.S. and non-U.S. companies in each of our businesses. Many of these competitors are also our suppliers or customers. Principalcompetitors include BAE Systems Aerospace, Inc.; CAE Inc.; Diehl Aerosystems Holding GmBH; Elbit Systems Ltd.; Esterline Technologies Corp.; FlightSafetyInternational; Garmin International Inc.; General Dynamics Corporation; General Electric Co.; Groupe Zodiac Aerospace S.A.; Harris Corp.; HoneywellInternational, Inc.; Jamco America, Inc.; L3 Communications, Inc.; Northrop Grumman Corp.; Raytheon Co.; Recaro Aircraft Seating GmbH & Co. KG; SatcomDirect, Inc.; SITA; Thales S.A.; The Boeing Company; and Thompson Aero Seating Ltd. Several of our competitors are significantly larger than we are in terms ofresources and market share and can offer a broader range of products. We believe that our systems, products and services are well positioned to compete in ourserved markets.
Industry consolidation has from time to time had a major impact on the competitive environment in which we operate. Our competitors periodically undertakemergers, alliances and realignments that contribute to a dynamic competitive landscape. We have contributed to this changing landscape in the past three years bycompleting a significant acquisition (B/E Aerospace, Inc.), four smaller acquisitions and several strategic alliances to improve our competitive position and expandour market reach.
Raw Materials, Supplies and Working Capital
We believe we have adequate sources for the supply of raw materials and components for our manufacturing and service needs with suppliers located around theworld. Electronic components and other raw materials used in the manufacturing of our products are generally available from several suppliers. We continue towork with our supply base for raw materials and components to ensure an adequate source of supply, utilizing strategic alliances, dual sourcing, identification ofsubstitute or alternate parts that meet performance requirements and life-time buys. These life-time buys involve purchases of multiple years of supply in order tomeet production and service requirements over the life span of a product. Although historically we have not experienced any significant difficulties in obtaining anadequate supply of raw materials and components necessary for our manufacturing operations or service needs, the loss of a significant supplier or the inability of asupplier to meet performance and quality specifications or delivery schedules could have a material adverse effect on our business, financial condition, results ofoperations and cash flows.
Our investment in inventory is a significant part of our working capital, and historically we have maintained sufficient inventory to meet our customers'requirements on a timely basis. This investment includes production stock, work-in-process, pre-production engineering costs, finished goods, spare parts andgoods on consignment. Our accounts receivable also constitute a significant part of our working capital. Accounts receivable includes unbilled receivables whichare primarily related to sales recorded under the percentage-of-completion method of accounting in accordance with applicable contract terms that have not beenbilled to customers. The critical accounting policies involving pre-production engineering costs and long-term contracts are discussed under the captionManagement's Discussion and Analysis of Financial Condition and Results of Operations in Item 7 below. Additional information relating to accountsreceivable and inventory is contained in Notes 2, 5 and 6 of the Notes to Consolidated Financial Statements in Item 8 below.
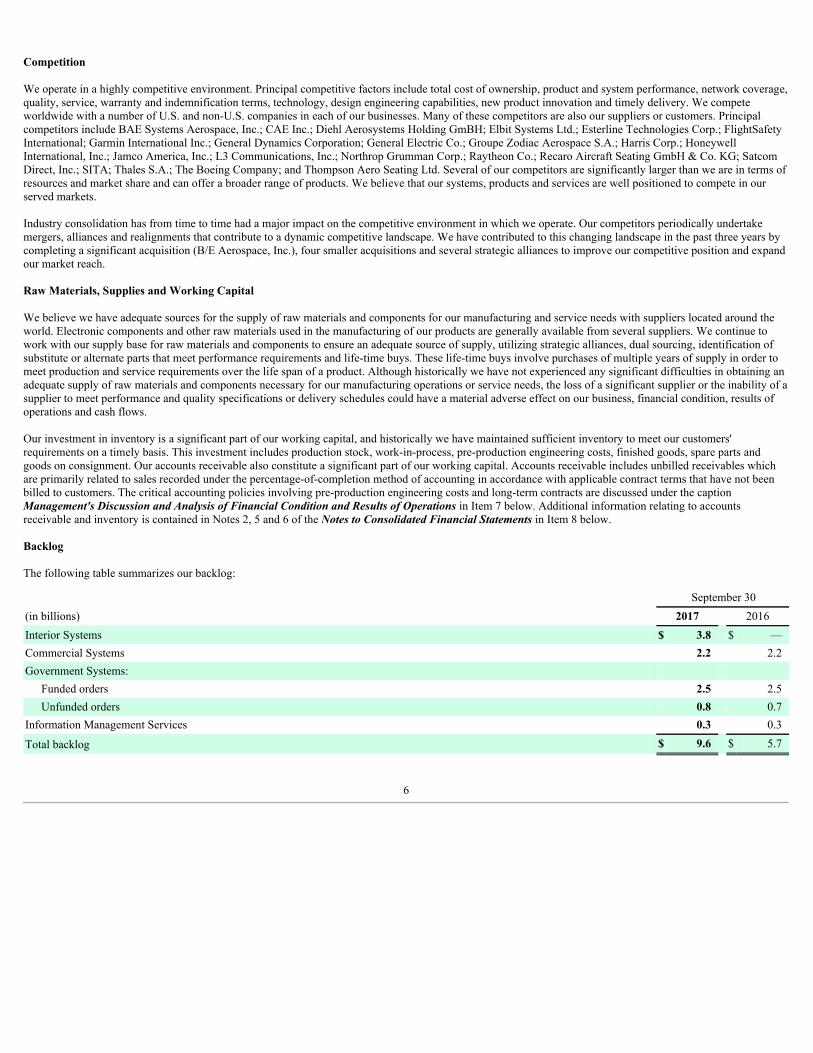
Backlog
The following table summarizes our backlog:
September 30(in billions) 2017 2016Interior Systems $ 3.8 $ —Commercial Systems 2.2 2.2Government Systems:
Funded orders 2.5 2.5Unfunded orders 0.8 0.7
Information Management Services 0.3 0.3
Total backlog $ 9.6 $ 5.7
6
Our backlog represents the aggregate of the sales price of orders received from customers, but not recognized as revenue, and excludes unexercised options.Although we believe that the orders included in backlog are firm, most of our backlog orders can be modified or terminated by the customer. Our backlog atSeptember 30, 2017 includes approximately $4.8 billion of orders that are expected to be filled after 2018 .
Joint Ventures
Joint ventures, strategic alliances, strategic investments and other cooperative arrangements are part of our business strategies to broaden the market for ourproducts and develop new technologies.
We have a 50 percent ownership interest in each of the following:
• ACCEL (Tianjin) Flight Simulation Co., Ltd, a joint venture with Haite Group, for the joint development and production of commercial flight simulatorsin China
• ADARI Aviation Technology Limited, a joint venture with Aviation Data Communication Corporation Co., LTD, operates remote ground stations aroundChina and develops certain content delivery management software
• AVIC Leihua Rockwell Collins Avionics Company, a joint venture with China Leihua Electronic Technology Research Institute, a subsidiary of theAviation Industry Corporation of China (AVIC), which provides integrated surveillance system products for the C919 aircraft in China
• Data Link Solutions LLC, a joint venture with BAE Systems, plc, for joint pursuit of the worldwide military data link market
• ESA Vision Systems LLC, a joint venture with Elbit Systems, Ltd., for joint pursuit of helmet-mounted cueing systems for the worldwide military fixedwing aircraft market
• Quest Flight Training Limited, a joint venture with Quadrant Group, plc, which provides aircrew training services primarily for the United KingdomMinistry of Defence
• Rockwell Collins CETC Avionics Co., Ltd. a joint venture with CETC Avionics Co., Ltd. to develop and deliver products for the C919 program
Acquisitions and Dispositions
We regularly consider various business opportunities, including strategic acquisitions and alliances, licenses and marketing arrangements. We review the prospectsof our existing businesses to determine whether any of them should be modified, sold or otherwise discontinued.
We completed five acquisitions in the past three years to augment our growth plans. These acquisitions were:
• in April 2017, we acquired B/E Aerospace, which provides aircraft cabin interior products and services
• in December 2016, we acquired Pulse.aero, a company specializing in self-bag drop technologies used by airlines and airports
• in February 2016, we acquired the Matrix series projector product line from Christie Digital Systems, a global visual, audio and collaboration solutionscompany
• in August 2015, we acquired International Communications Group, Inc. (ICG), which provides satellite-based global voice and data communicationproducts and services for the aviation industry
• in March 2015, we acquired Pacific Avionics Pty. Limited (Pacific Avionics), which provides technologies used for wireless information distribution
7
We completed one material divestiture in the past three years as part of our strategy to reshape our business and focus on opportunities in addressed markets for ourcore products and solutions. In March 2015, we divested our Aerospace Systems Engineering and Support business (ASES), which provided military aircraftintegration and modifications, maintenance, logistics and support.
Additional information relating to our acquisitions, dispositions and joint ventures is contained in Notes 3, 4 and 8 of the Notes to Consolidated FinancialStatements in Item 8 below.
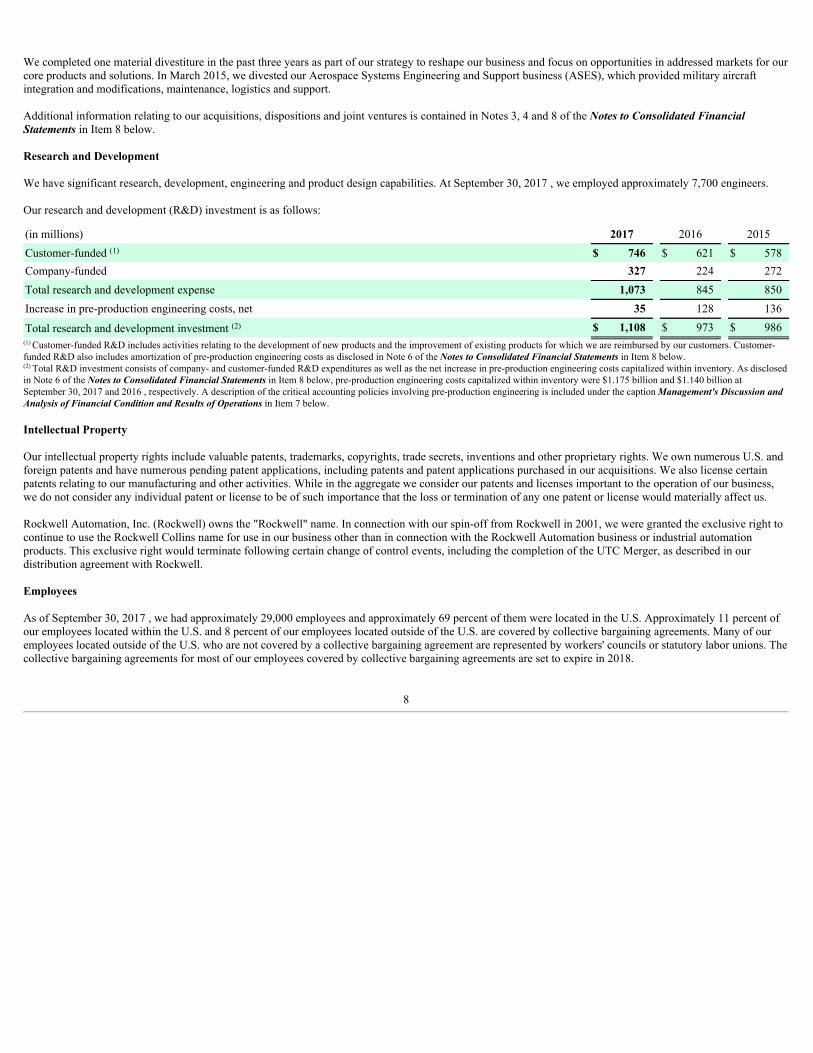
Research and Development
We have significant research, development, engineering and product design capabilities. At September 30, 2017 , we employed approximately 7,700 engineers.
Our research and development (R&D) investment is as follows:
(in millions) 2017 2016 2015Customer-funded (1) $ 746 $ 621 $ 578Company-funded 327 224 272Total research and development expense 1,073 845 850Increase in pre-production engineering costs, net 35 128 136
Total research and development investment (2) $ 1,108 $ 973 $ 986(1) Customer-funded R&D includes activities relating to the development of new products and the improvement of existing products for which we are reimbursed by our customers. Customer-funded R&D also includes amortization of pre-production engineering costs as disclosed in Note 6 of the Notes to Consolidated Financial Statements in Item 8 below.(2) Total R&D investment consists of company- and customer-funded R&D expenditures as well as the net increase in pre-production engineering costs capitalized within inventory. As disclosedin Note 6 of the Notes to Consolidated Financial Statements in Item 8 below, pre-production engineering costs capitalized within inventory were $1.175 billion and $1.140 billion atSeptember 30, 2017 and 2016 , respectively. A description of the critical accounting policies involving pre-production engineering is included under the caption Management's Discussion andAnalysis of Financial Condition and Results of Operations in Item 7 below.
Intellectual Property
Our intellectual property rights include valuable patents, trademarks, copyrights, trade secrets, inventions and other proprietary rights. We own numerous U.S. andforeign patents and have numerous pending patent applications, including patents and patent applications purchased in our acquisitions. We also license certainpatents relating to our manufacturing and other activities. While in the aggregate we consider our patents and licenses important to the operation of our business,we do not consider any individual patent or license to be of such importance that the loss or termination of any one patent or license would materially affect us.
Rockwell Automation, Inc. (Rockwell) owns the "Rockwell" name. In connection with our spin-off from Rockwell in 2001, we were granted the exclusive right tocontinue to use the Rockwell Collins name for use in our business other than in connection with the Rockwell Automation business or industrial automationproducts. This exclusive right would terminate following certain change of control events, including the completion of the UTC Merger, as described in ourdistribution agreement with Rockwell.
Employees
As of September 30, 2017 , we had approximately 29,000 employees and approximately 69 percent of them were located in the U.S. Approximately 11 percent ofour employees located within the U.S. and 8 percent of our employees located outside of the U.S. are covered by collective bargaining agreements. Many of ouremployees located outside of the U.S. who are not covered by a collective bargaining agreement are represented by workers' councils or statutory labor unions. Thecollective bargaining agreements for most of our employees covered by collective bargaining agreements are set to expire in 2018.
8
Cyclicality and Seasonality
The markets in which we sell our products are, to varying degrees, cyclical and have experienced periodic upswings and downturns. For example, markets for ourcommercial aerospace products have experienced downturns during periods of slowdowns in the commercial airline industry and during periods of weak conditionsin the economy in general, as demand for new aircraft generally declines during these periods. We believe that we are currently benefiting from robust backlogs incommercial air transportation and increasing content as next generation aircraft enter into service. While we believe our Government Systems business is wellpositioned, it is also subject to some cyclicality, primarily as a result of U.S. Government defense budget cycles. Additional information related to the defensebudget environment can be found under the caption Risk Factors in Item 1A below.
Our business tends to be seasonal with our fourth quarter usually producing relatively higher sales and cash flow and our first quarter usually producing relativelylower sales and cash flow. A large part of this seasonality variance is attributable to our Government Systems business and relates to the U.S. Governmentprocurement cycle.
Regulatory Matters
As a defense contractor, our contract costs are audited and reviewed on a continual basis by the Defense Contract Management Agency and the Defense ContractAudit Agency. Audits and investigations are conducted from time to time to determine if our performance and administration of our U.S. Government contracts arecompliant with applicable contractual requirements and procurement regulations and other applicable federal statutes and regulations. Under present U.S.Government procurement regulations, if indicted or adjudged in violation of procurement or other federal civil laws, a contractor, such as us, could be subject tofines, penalties, repayments or other damages. U.S. Government regulations also provide that certain findings against a contractor may lead to suspension ordebarment from eligibility for awards of new U.S. Government contracts for up to three years. In addition, we are subject to various non-U.S. governmentalcontracting requirements.
The sale, installation and operation of our products in commercial aviation applications is subject to continued compliance with applicable regulatory requirementsand future changes to those requirements. In the U.S., our commercial aviation products are required to comply with FAA regulations governing production andquality systems, airworthiness and installation approvals, repair procedures and continuing operational safety. Some of our products, such as radio frequencytransmitters and receivers, must also comply with Federal Communications Commission (FCC) regulations governing authorization and operational approval oftelecommunications equipment. Our communication services offered in the Information Management Services business are also subject to certain FCC regulations.
Internationally, similar requirements exist for communication services, airworthiness, installation and operational approvals. These requirements are administeredby the national aviation authorities of each country and, in the case of Europe, coordinated by the European Joint Aviation Authorities. Many countries also imposespecific telecommunications equipment requirements, administered through their national aviation authorities or telecommunications authorities. In Europe,approval to import products also requires compliance with European Commission directives, such as those associated with electrical safety, electro-magneticcompatibility, use of metric units of measurement and restrictions on the use of lead.
Products already in service may also become subject to mandatory changes for continued regulatory compliance as a result of any identified safety issue, which canarise from an aircraft accident, incident or service difficulty report.
Our products and technical data are controlled for export and import under various regulatory agencies. Audits and investigations by these agencies are a regularoccurrence to ensure compliance with applicable federal statutes and regulations. Violations, including as a successor to an acquired business, can result in finesand penalties assessed against the Company as well as individuals, and the most egregious acts may result in a complete loss of export privileges.
Various anti-bribery and anti-corruption laws, as well as data privacy laws, are applicable to our business operations throughout the world.
Although we do not have any significant regulatory action pending against us, any such action could have a material adverse impact on our business, financialcondition, results of operations and cash flows.
9
Environmental Matters
Federal, state and local requirements relating to the discharge of substances into the environment, the disposal of hazardous waste and other activities affecting theenvironment have had and will continue to have an impact on our manufacturing operations. To date, compliance with environmental requirements and resolutionof environmental claims have been accomplished without material effect on our liquidity and capital resources, competitive position or financial condition. Webelieve that our expenditures for environmental capital investment and remediation necessary to comply with present regulations governing environmentalprotection and other expenditures for the resolution of environmental claims will not have a material adverse effect on our business or financial condition.Additional information on environmental matters is contained in Note 18 of the Notes to Consolidated Financial Statements in Item 8 below.
Geographic Information
Our principal markets outside the U.S. are in France, Canada, China, the United Kingdom, the United Arab Emirates, Germany, Japan, Qatar, Brazil, South Korea,Taiwan, Russia, Singapore, Italy, Australia and Hong Kong. In addition to normal business risks, operations outside the U.S. are subject to other risks, includingpolitical, economic and social environments, governmental laws and regulations and currency revaluations and fluctuations.
Selected financial information by major geographic area for each of the three years in the period ended September 30, 2017 , 2016 and 2015 is contained inNote 21 of the Notes to Consolidated Financial Statements in Item 8 below.
Item 1A. Risk Factors.
Risks Related to Our Business/Industry:
Reduction in U.S. Government spending adversely impacts Government Systems sales and profitability.
In 2017 , 25 percent of our sales were derived from U.S. Government contracts, both directly and indirectly through subcontracts. Defense funding by the U.S.Government is expected to continue to be under pressure due to the overall economic environment, budget deficits and competing budget priorities. Cost cutting,efficiency initiatives, reprioritization and other affordability analysis by the U.S. Government on defense spending could present some additional opportunities forus, but continued pressure on U.S. Government spending on defense could also adversely impact our Government Systems sales and profitability.
The U.S. Government has implemented various initiatives to address its fiscal challenges. In August 2011, Congress enacted the Budget Control Act (BCA) of2011 which imposed spending caps and certain reductions in defense spending over a ten-year period through 2021. These spending caps and reductions, referredto as sequestration, went into effect in March 2013. Through a series of bipartisan agreements, Congress has been able to temporarily lift discretionary spendinglimits every year through 2017. However, unless a new agreement is enacted, the BCA will again be in force beginning in 2018. The continued uncertaintysurrounding the U.S. defense budget could have a material adverse effect on the Company and the defense industry in general.
In years when the U.S. Government does not complete its annual budget and appropriations process prior to the beginning of its fiscal year (October 1),government operations are typically funded through a continuing resolution that authorizes agencies of the U.S. Government to continue to operate in the new year,but generally does not authorize new spending initiatives. During periods covered by a continuing resolution (or until the regular appropriation bills are passed), wemay experience delays by the government in the procurement of new or existing products and services which can adversely impact our results of operations andcause variability in the timing of revenue between periods. The government began operations in fiscal year 2018 under a continuing resolution that is set to expirein December 2017.
We offer a diverse range of defense products and services. We believe that this makes it less likely that cuts in any specific contract or program will have a long-term effect on our business; however, delays or termination of multiple or large programs or contracts could adversely affect our business and future financialperformance. Potential changes in funding priorities may afford new or additional opportunities for our businesses in terms of existing, follow-on or replacementprograms. While we would expect to compete and be well positioned as the incumbent on existing programs, we may not be successful, and any replacementprograms may be funded at lower levels.
10
We depend to a significant degree on U.S. Government contracts, which are subject to unique risks.
In addition to normal business risks, our supply of systems and products to the U.S. Government is subject to unique risks which are largely beyond our control.These risks include:
• dependence on Congressional appropriations and administrative allotment of funds
• the ability of the U.S. Government to terminate, without prior notice, partially completed government programs and contracts that were previouslyauthorized (although we may recover certain costs if terminated for convenience)
• changes in governmental procurement legislation and regulations and other policies which may reflect military and political developments, including U.S.Government initiatives to gain increased access to intellectual property
• significant changes in contract scheduling or program structure, which generally result in delays or reductions in deliveries
• intense competition for available U.S. Government business necessitating increases in time and investment for design and development
• difficulty of forecasting costs and schedules when bidding on developmental and highly sophisticated technical work
• changes over the life of U.S. Government contracts, particularly development contracts, which generally result in adjustments of contract prices
• claims based on U.S. Government work and violation of associated compliance and other requirements, which may result in fines, the cancellation orsuspension of payments or suspension or debarment proceedings affecting potential further business with the U.S. Government
We are subject to risks arising from changes in the competitive environment in which we operate.
We operate in a highly competitive environment. Many of our competitors are also our suppliers or customers on our programs and may be significantly larger thanus. Among others, risks in the competitive environment include:
• original equipment manufacturers' efforts to vertically integrate
• customers seeking more rights in intellectual property developed in connection with their program, price concessions, extensive liability protections andother customer favorable contract terms
• competitors offering lower prices and new solutions, developing new technologies or otherwise capturing more market share
International conflicts and terrorism may adversely affect our business.
International conflicts and political turmoil in the Middle East and elsewhere and the possibility of future terrorist attacks cause significant uncertainty with respectto business and financial markets and may adversely affect our business. These international conflicts also affect the price of oil, which has a significant impact onthe financial health of our commercial customers. Although our Government Systems business may experience greater demand for its products as a result ofincreased government defense spending, factors arising (directly or indirectly) from international conflicts or terrorism which may adversely affect our commercialbusiness include reduced aircraft build rates, upgrades, maintenance and spending on discretionary products, as well as increases in the cost of property andaviation products insurance and increased restrictions placed on our insurance policies.
Our business is heavily concentrated in the aviation industry.
As a provider of products and services to the aviation industry, we are significantly affected by the overall economic condition of that industry. The aviationindustry is historically cyclical.
11
Our business, financial condition, results of operations and cash flows may be adversely impacted, among other things, by the following:
• reductions in demand for aircraft and delayed aircraft delivery schedules
• bankruptcy or other significant financial difficulties of our existing and potential customers
• reductions in the need for, or the deferral of, aircraft maintenance and repair services and spare parts support
• deferral of discretionary spending by our airline customers for cabin retrofit activities
• retirement or storage of older generation aircraft, resulting in fewer retrofits and less demand for services for those aircraft, as well as the increasedavailability of used or recycled equipment on the market
• limited availability of financing for airlines or aircraft
• impact on the aviation industry due to the volatility of fuel prices
• disruptions to commercial air travel demand
A global or regional recession may adversely affect us.
If a recession emerges that impacts where we do business, risks may include:
• declines in revenues, profitability and cash flows from reduced orders, payment delays or other factors caused by the economic problems of our customers
• adverse impacts on our access to short-term commercial paper borrowings or other credit sources
• supply problems associated with any financial constraints faced by our suppliers
We derive a significant portion of our revenues from international sales and are subject to the risks of doing business outside the U.S.
In 2017 , 45 percent of our total revenues were from sales of our products and services internationally, including foreign military sales. We expect that internationalsales will continue to account for a significant portion of our total sales. As a result, we are subject to risks of doing business internationally, including:
• laws, regulations and policies of non-U.S. governments relating to investments and operations, as well as U.S. laws affecting the activities of U.S.companies abroad
• regulatory requirements and potential changes, including imposition of tariffs or embargoes, export controls and other trade restrictions, anti-bribery, anti-money laundering, antitrust and data privacy requirements
• changes in government spending on defense programs
• uncertainties and restrictions concerning the availability of funding, credit or guarantees
• requirements of certain customers which obligate us to specified levels of in-country purchases, manufacturing or investments, known as offsets, andpenalties in the event we fail to perform in accordance with the offset requirements
• impacts associated with foreign currency volatility
• uncertainties as to local laws and enforcement of contract and intellectual property rights
• rapid changes in government, economic and political policies, political or civil unrest or the threat of international boycotts or U.S. anti-boycott legislation
12
We have made, and expect to continue to make, strategic acquisitions and partnerships that involve risks and uncertainties.
We completed five acquisitions and several joint ventures and strategic alliances (partnerships) in the past three fiscal years. We will consider making minoracquisitions and partnerships in the future in an effort to enhance shareowner value. Acquisitions and partnerships involve certain risks and uncertainties, such as:
• difficulty in integrating newly-acquired businesses and commencing partnership operations in an efficient and cost-effective manner and the risk that weencounter significant unanticipated costs or other problems associated with integration or commencement
• challenges in achieving strategic objectives, cost and revenue synergies and other expected benefits
• risk that our markets do not evolve as anticipated and the targeted technologies do not prove to be those needed to be successful in those markets
• risk that we assume significant liabilities that exceed the limitations of any applicable indemnification provisions or the financial resources of anyindemnifying parties
• loss of key employees of the acquired businesses or joint venture
• risk of diverting the attention of senior management from our existing operations
• risk of litigation associated with an acquisition
We enter into fixed-price contracts that could subject us to losses in the event that we have cost overruns.
During 2017 , approximately 94 percent of our total sales were, and a significant portion of our anticipated future sales will be, from fixed-price contracts. Thisallows us to benefit from cost savings, but it carries the burden of potential cost overruns since we assume all of the cost risk. If our initial cost estimates areincorrect, we can incur losses on these contracts. These fixed-price contracts can expose us to potentially large losses because the customer may compel us tocomplete a project or, in the event of a termination for default, pay the entire incremental cost of its replacement by another provider regardless of the size of anycost overruns that occur over the life of the contract. Because many of these projects involve new technologies and applications and can last for years, unforeseenevents such as technological difficulties, fluctuations in the price of rawmaterials, problems with subcontractors and cost overruns can result in the contractual price becoming less favorable or even unprofitable to us over time.Furthermore, if we do not meet project deadlines or specifications, we may need to renegotiate contracts on less favorable terms, be forced to pay penalties orliquidated damages or suffer major losses if the customer exercises its right to terminate. In addition, some of our contracts have provisions relating to cost controlsand audit rights, and if we fail to meet the terms specified in those contracts we may not realize their full benefits. Our results of operations are dependent on ourability to maximize earnings from our contracts. Lower earnings caused by cost overruns could have an adverse impact on our financial condition, results ofoperations and cash flows.
We are subject to risks in our integration processes and production systems, including potential issues in meeting stringent performance and reliabilitystandards.
The aerospace and defense business is complex, involving extensive coordination and integration with U.S. and non-U.S. suppliers and customers, highly-skilledlabor, stringent regulatory and contractual requirements and performance and reliability standards. As a result, our ability to deliver products and systems on time,satisfy regulatory and customer requirements, and achieve or maintain program profitability is subject to significant risk. Operational delays or defects could resultin increased production costs, as well as delayed deliveries and disruption to our customers.
Costs of certain employee and retiree benefits may rise.
Although we have taken action seeking to contain volatility in the costs related to medical and pension benefits, there are risks that our costs for these benefits willincrease as a result of:
• continued increases in medical costs related to current employees due to increased usage of medical benefits, medical inflation and the impact of U.S.Government health care legislation
• continued increases in the average life span of retirees
13
• material changes in legislation or market dynamics impacting medical or pension matters
• the effect declines in the stock and bond markets have on our pension plan assets
• reductions in the discount rate used to determine the present value of our retirement benefit obligations
Tax changes could affect our effective tax rate and future profitability.
Our future results could be adversely affected by changes in the effective tax rate as a result of changes in our overall profitability and changes in the mix ofearnings in countries with differing statutory tax rates, changes in tax legislation, the results of audits and examination of previously filed tax returns andcontinuing assessment of our tax exposures.
We depend on critical suppliers and subcontractors.
We do not always have alternate sources of supply readily available for certain goods or services, such as liquid crystal displays. The loss of a significant supplieror subcontractor or their inability to meet performance, quality or delivery requirements due to natural disaster, financial stress, capacity constraints, militaryconflicts or other causes could have a material adverse effect on our business, financial condition, results of operations and cash flows.
We depend on specialized test equipment.
Some of our specialized test equipment that supports the reliability of our products and systems is the result of significant investment. Back-up test equipment maynot be readily available. Damage to our specialized test equipment may result in protracted production recovery and may adversely impact our ability to service ourproducts.
A cybersecurity incident, network failure or other business disruption could have negative impacts.
We face cyber threats, threats to the physical security of our facilities, potential cyber attacks to the integrity of our networks and/or products, and the potentialrelease or theft of our intellectual property, as well as the potential for business disruptions associated with information technology (IT) failures. Possible areas ofsignificant exposure to cyber threats or other disruptions include our enterprise information technology resources, our information management network thatprovides communication services to customers and our flight deck communication products and solutions. Any of these threats or disruptions may result in amaterial adverse effect on our business, financial condition, results of operations and cash flows. Risks may include:
• adverse effects to future results due to the theft, destruction, loss, corruption or release of personal data, confidential information or intellectual property
• operational or business disruptions resulting from the failure of IT or other systems and subsequent mitigation activities
• negative publicity resulting in reputation or brand damage with our customers, suppliers, employees, shareowners and others
Risks Related to Our B/E Aerospace Transaction:
We may be unable to successfully integrate B/E Aerospace's business and realize the anticipated benefits of the merger.
The success of the merger will depend, in part, on our ability to successfully combine our business with B/E Aerospace's business and realize the anticipatedbenefits, including synergies, cost savings, innovation and operational efficiencies, from the combination. If we are unable to achieve these objectives within theanticipated time frame, or at all, the anticipated benefits may not be realized fully, or at all, or may take longer to realize than expected.
The merger involves the integration of B/E Aerospace's business with our existing business, which is a complex, costly and time-consuming process. We have notpreviously completed a transaction comparable in size or scope to the merger. The integration of the two companies may result in material challenges, including,without limitation:
• the diversion of management's attention from ongoing business concerns and performance shortfalls at one or both of the companies as a result of thedevotion of management's attention to the integration
14
• maintaining employee morale and retaining key management and other employees
• the possibility of faulty assumptions underlying expectations regarding the integration process
• retaining existing business and operational relationships and attracting new business and operational relationships
• consolidating corporate and administrative infrastructures and eliminating duplicative operations
• coordinating geographically separate organizations
• unanticipated issues in integrating information technology, communications and other systems
• unforeseen expenses or delays associated with the integration
Many of these factors are outside of our control and any one of them could result in delays, increased costs, decreases in the amount of expected revenues anddiversion of management's time and energy, which could materially affect our financial position, results of operations and cash flows.
Between signing of the merger agreement and closing of the merger, we were permitted to conduct only limited planning for the integration of the two companiesfollowing the merger. The actual integration may result in additional and unforeseen expenses, and the anticipated benefits of the integration plan may not berealized on a timely basis, if at all.
Our future results may be adversely impacted if we do not effectively manage the expanded operations following the completion of the B/E Aerospace merger.
Following the completion of the merger, our business is significantly larger. Our ability to successfully manage this expanded business depends, in part, uponmanagement's ability to design and implement strategic initiatives that address not only the integration of two discrete companies, but also the increased scale andscope of the combined business with its associated increased costs and complexity. There can be no assurances that we will be successful or that we will realize theexpected operating efficiencies, cost savings and other benefits currently anticipated from the merger.
We are incurring substantial expenses related to the merger and the integration of B/E Aerospace.
There are a large number of processes, policies, procedures, operations, technologies and systems that must be integrated, including purchasing, accounting andfinance, sales, payroll, pricing, revenue recognition, marketing, employee benefits, legal and compliance, strategic and financial planning, information technologyand treasury. The substantial majority of costs for these integration activities will be non-recurring expenses related to the merger (including financing of themerger and the refinancing of certain indebtedness), facilities and systems consolidation costs. We may incur additional costs to maintain employee morale and toretain key employees. We are also incurring transaction fees and costs related to integration plans for the combined business, and the execution of these plans maylead to additional unanticipated costs and time delays. These incremental transaction and merger-related costs may exceed the savings we expect to achieve fromthe elimination of duplicative costs and the realization of other efficiencies related to the integration of the businesses, particularly in the near term and in the eventthere are material unanticipated costs.
We are significantly more leveraged.
In connection with the B/E Aerospace merger, we incurred $5.9 billion in additional indebtedness. We have consolidated indebtedness of approximately$7.2 billion, which is greater than what our indebtedness was prior to the merger. The increased indebtedness and higher debt-to-total capitalization ratio may havethe effect, among other things, of reducing our flexibility to respond to changing business and economic conditions, requiring us to use substantial amounts of cashflow to repay indebtedness, increasing borrowing costs and placing us at a disadvantage compared to competitors with less leverage.
15
The financing arrangements entered into in connection with the merger contain restrictions and limitations that could, under certain circumstances,significantly impact our ability to operate the business.
We incurred significant new indebtedness in connection with the merger. The agreements governing the indebtedness incurred in connection with the mergercontain covenants that, among other things, may, under certain circumstances, place limitations on the dollar amounts paid or other actions relating to:
• consolidating with or merging into any other corporation or conveying or transferring all or substantially all its properties and assets
• incurring secured debt
• entering into sale and leaseback transactions
• designating subsidiaries as restricted or unrestricted
Such agreements also require us to maintain a debt-to-capitalization ratio below a specified threshold, which may further limit discretion in the operation of ourbusiness following the merger. Such agreements also contain additional restrictive covenants. Various risks, uncertainties and events beyond our control couldaffect our ability to comply with the covenants contained in our debt agreements. Failure to comply with any of the covenants in our existing or future financingagreements could result in a default under those agreements and under other agreements containing cross-default provisions. A default would permit lenders toaccelerate the maturity of the debt under these agreements. Under these circumstances, we might not have sufficient funds or other resources to satisfy all of ourobligations. In addition, the limitations imposed by financing agreements on our ability to incur additional debt and to take other actions might significantly impairour ability to obtain other financing.
The merger could result in significant liability to us if the merger causes the KLX spin-off to fail to qualify for the KLX spin-off tax treatment.
In 2014, the Consumables Management Segment of B/E Aerospace, which consisted of its aerospace distribution and energy services businesses, was spun-off toform KLX, Inc., which is referred to as KLX. At the time of the KLX spin-off, B/E Aerospace received an opinion of Shearman & Sterling to the effect that,subject to the limitations and assumptions set forth therein, the KLX spin-off that occurred in December 2014 will qualify for the KLX spin-off tax treatment,which generally means a transaction tax-free to B/E Aerospace and its stockholders under the U.S. federal income tax rules for spin-offs in Section 355 of the Codeand related provisions. If, however, the KLX spin-off were to fail to qualify for the KLX spin-off tax treatment, B/E Aerospace would be subject to tax onsubstantial gain as if B/E Aerospace had sold the KLX common stock in a taxable sale for its fair market value at the time of the KLX spin-off. In addition, if theKLX spin-off failed to qualify for tax-free treatment, each B/E Aerospace stockholder at the time of the KLX spin-off would be treated as if it had received adistribution from B/E Aerospace in an amount equal to the fair market value of the KLX common stock that they received; this distribution generally would betaxed as a dividend to the extent of the stockholder's pro rata share of B/E Aerospace's current and accumulated earnings and profits at the time of the KLX spin-offand then treated as a non-taxable return of capital to the extent of the stockholder's basis in the B/E Aerospace common stock and finally as capital gain from thesale or exchange of B/E Aerospace common stock.
Under current U.S. federal income tax law, the KLX spin-off would fail to qualify for the KLX spin-off tax treatment if the KLX spin-off was determined to havebeen used by B/E Aerospace principally as a device for the distribution of earnings and profits by, for example, facilitating a taxable sale of the stock of B/EAerospace or KLX through a planned or intended change-in-control transaction identified prior to the KLX spin-off rather than principally to achieve one or morevalid corporate business purposes. Furthermore, even if the KLX spin-off were otherwise to qualify for tax-free treatment under Section 355 and related provisionsof the Code, it would be taxable to B/E Aerospace (but not to B/E Aerospace's stockholders) under Section 355(e) of the Code, if the KLX spin-off was determinedto be part of a plan (or series of related transactions) pursuant to which one or more persons acquire, directly or indirectly, stock representing a 50% or greaterinterest in B/E Aerospace or KLX.
If it is determined that the KLX spin-off fails to qualify for the KLX spin-off tax treatment as a result of the merger (for example, if the merger is viewed as part ofa plan or series of related transactions that includes the KLX spin-off or the KLX spin-off is found to have been used principally as a device for the distribution ofearnings and profits), or because of the failure of the KLX spin-off to initially qualify for the KLX spin-off tax treatment, B/E Aerospace could incur significant taxliabilities. Because B/E Aerospace is our wholly owned subsidiary, any such tax liabilities of B/E Aerospace could also adversely affect us. If the KLX spin-offfails to qualify for the KLX spin-off tax treatment, this may also result in adverse tax consequences to
16
stockholders of B/E Aerospace at the time of the KLX spin-off because they would be taxed on the distribution of KLX stock as described above.
In connection with the merger, we received an opinion from our counsel, Skadden, Arps, Slate, Meagher & Flom LLP and Shearman & Sterling to the effect that,subject to the limitations and assumptions set fourth therein, the merger will not cause the KLX spin-off to fail to qualify for the KLX spin-off tax treatment. Thetax opinions received in connection with the merger rely on certain representations, assumptions, undertakings and covenants, including representation letters fromeach of us and B/E Aerospace. These representations relate to, among other items, confirming the accuracy of the representations and warranties originally madewith respect to the KLX spin-off, along with compliance with covenants, the actions taken in pursuit of the corporate business purposes of the KLX spin-off, theinteraction of the parties, and business developments since the KLX spin-off. If any of the factual representations in any of the representation letters, or any of theassumptions in the tax opinions is untrue or incomplete, an undertaking or covenant is not complied with or the facts upon which a tax opinion is based arematerially different from the facts at the time of the merger, the opinions may not be valid. Moreover, opinions of counsel are not binding on the IRS or the courts.As a result, the conclusions expressed in the tax opinions could be challenged by the IRS, and a court may sustain such a challenge. None of Rockwell Collins, B/EAerospace or KLX has requested a ruling from the IRS regarding the impact of the merger on the qualification of the KLX spin-off for the KLX spin-off taxtreatment.
Risks Related to the Proposed Acquisition of the Company by UTC:
The UTC Merger is subject to conditions, some or all of which may not be satisfied, or completed on a timely basis, if at all. Failure to complete the UTCMerger could have material adverse effects on us.
The completion of the UTC Merger is subject to a number of conditions, including, among other things, receipt of the shareowner approval and receipt of certainregulatory approvals, which make the completion and timing of the completion of the UTC Merger uncertain. The failure to satisfy all of the required conditionscould delay the completion of the UTC Merger for a significant period of time or prevent it from occurring at all. There can be no assurance that the conditions tothe closing of the UTC Merger will be satisfied or waived or that the UTC Merger will be completed. Also, subject to limited exceptions, either we or UTC mayterminate the Merger Agreement if the UTC Merger has not been completed by 5:00 p.m. (Eastern time) on September 4, 2018, subject to extension through March4, 2019, if all conditions other than certain antitrust-related conditions are or would be satisfied on that date.
If the UTC Merger is not completed, our ongoing business may be materially adversely affected and, without realizing any of the benefits of having completed theUTC Merger, we will be subject to a number of risks, including the following:
• the market price of our common stock could decline
• we could owe a substantial termination fee to UTC under certain circumstances
• if the Merger Agreement is terminated and our board seeks another business combination, our shareowners cannot be certain that we will be able to find aparty willing to enter into a transaction on terms equivalent to or more attractive than the terms that UTC has agreed to in the Merger Agreement
• time and resources, financial and other, committed by our management to matters relating to the UTC Merger could otherwise have been devoted topursuing other beneficial opportunities
• we may experience negative reactions from the financial markets or from our customers, suppliers or employees
• we will be required to pay our costs relating to the UTC Merger, such as legal, accounting, financial advisory and printing fees, whether or not the UTCMerger is completed
In addition, if the UTC Merger is not completed, we could be subject to litigation related to any failure to complete the UTC Merger or related to any enforcementproceeding commenced against us to perform our obligations under the UTC Merger Agreement. Any of these risks could materially and adversely impact ourongoing business, financial condition, financial results and stock price.
Similarly, delays in the completion of the UTC Merger could, among other things, result in additional transaction costs, loss of revenue or other negative effectsassociated with uncertainty about completion of the UTC Merger and could materially and adversely affect our ongoing business, financial condition, financialresults and stock price.
17
The Merger Agreement contains provisions that limit our ability to pursue alternatives to the UTC Merger, could discourage a potential competing acquiror ofthe Company from making a favorable alternative transaction proposal and, in specified circumstances, could require us to pay a substantial termination fee toUTC.
The Merger Agreement contains provisions that make it more difficult for us to be acquired by any company other than UTC. The Merger Agreement containscertain provisions that restrict our ability to, among other things, initiate, seek, solicit, knowingly facilitate, knowingly encourage, knowingly induce or knowinglytake any other action reasonably expected to lead to, or engage in negotiations or discussions relating to, or approve or recommend, any third-party acquisitionproposal. Further, even if our Board of Directors withdraws or qualifies its recommendation to the shareowners of Rockwell Collins to adopt the MergerAgreement and approve the UTC Merger (the “merger proposal”), unless the Merger Agreement is terminated in accordance with its terms, we will still be requiredto submit the merger proposal to a vote at the special meeting of our shareowners (the “special meeting”). In addition, following our receipt of any third-partyacquisition proposal that constitutes a “superior proposal,” UTC will have an opportunity to offer to modify the terms of the Merger Agreement before our Boardof Directors may withdraw or qualify its recommendation with respect to the merger proposal in favor of such superior proposal.
In some circumstances, upon termination of the Merger Agreement, we would be required to pay a termination fee of $695 million to UTC or reimburse certainexpenses of UTC in connection with the transactions contemplated by the Merger Agreement.
These provisions could discourage a potential third-party acquiror or merger partner that might have an interest in acquiring all or a significant portion of us orpursuing an alternative transaction from considering or proposing such a transaction, even if it were prepared to pay consideration with a higher per share valuethan the value proposed to be received in the UTC Merger. In particular, the termination fee, if applicable, would be substantial, and could result in a potentialthird-party acquiror or merger partner proposing to pay a lower price to our shareowners than it might otherwise have proposed to pay absent such a fee.
If the Merger Agreement is terminated and we determine to seek another business combination, we may not be able to negotiate a transaction with another party onterms comparable to, or better than, the terms of the UTC Merger.
The UTC Merger is subject to the expiration or termination of applicable waiting periods and the receipt of approvals, consents or clearances from severalregulatory authorities that may impose conditions that could have an adverse effect on us or, if not obtained, could prevent completion of the UTC Merger.
Before the UTC Merger may be completed, any applicable waiting period (and any extension thereof) under the Hart-Scott-Rodino Antitrust Improvements Act of1976 relating to the completion of the UTC Merger must have expired or been terminated and any authorization or consent from a governmental authority requiredto be obtained with respect to the UTC Merger under certain other applicable foreign regulatory laws must have been obtained. In deciding whether to grant therequired regulatory authorization or consent, the relevant governmental entities will consider the effect of the UTC Merger within their relevant jurisdiction,including the impact on the parties’ respective customers and suppliers. The terms and conditions of the authorizations and consents that are granted, if any, mayimpose requirements, limitations or costs or place restrictions on the conduct of the combined company’s business or may materially delay the completion of theUTC Merger.
Under the Merger Agreement, UTC and Rockwell Collins have agreed to use their respective reasonable best efforts to obtain such authorizations and consents andUTC has agreed to take any and all steps necessary to avoid or eliminate impediments under any antitrust or certain other laws that may be asserted by anygovernmental authority so as to enable the completion of the UTC Merger as promptly as practicable. However, UTC’s obligation to take actions required to obtainauthorizations and consents under such laws is subject to limitations, including that UTC will not be required to commit to or effect (1) any sale, divestiture orother transfer if such action would require the sale, divestiture or other transfer of any assets, properties, businesses or product lines representing, in the aggregate,more than $850 million in annual revenues or (2) any other restriction or action if such restriction or action, individually or taken together with all sales,divestitures, transfers or other restrictions or actions in the aggregate, would or would reasonably be expected to have a materially adverse impact on us, UTC orany of their respective subsidiaries (in each case measured on a scale relative to the size of Rockwell Collins and its subsidiaries, taken as a whole) or on theexpected benefits to UTC of the UTC Merger.
In addition, at any time before or after the completion of the UTC Merger, and notwithstanding the termination of applicable waiting periods, the applicable U.S. orforeign antitrust authorities or any state attorney general could take such action under the antitrust laws as such party deems necessary or desirable in the publicinterest. Such action could include, among other things, seeking to enjoin the completion of the UTC Merger or seeking divestiture of substantial assets of theparties. In addition, in some circumstances, a third party could initiate a private action under antitrust laws challenging, seeking to enjoin,
18
or seeking to impose conditions on the UTC Merger. We and UTC may not prevail and we may incur significant costs in defending or settling any such action.There can be no assurance that the conditions to the completion of the UTC Merger set forth in the Merger Agreement relating to applicable regulatory laws will besatisfied.
The value of the stock portion of the Merger Consideration is subject to changes based on fluctuations in the value of UTC common stock, and ourshareowners may, in certain circumstances, receive stock consideration with a value that, at the time received, is less than $46.67 per share of our commonstock.
The market value of UTC common stock will fluctuate during the period before the date of our special meeting to approve the UTC Merger, during the 20 tradingday period that the exchange ratio will be based upon, and the time between the last day of the 20 trading day period and the time our shareowners receive theportion of the Merger Consideration to be issued in the form of UTC common stock, as well as thereafter. Accordingly, at the time of our special meeting, ourshareowners will not be able to determine the market value of the stock portion of the per share Merger Consideration they would receive upon completion of theUTC Merger.
Upon completion of the UTC Merger, each issued and outstanding share of Rockwell Collins common stock (other than certain excluded shares) will be convertedinto the right to receive the Merger Consideration, which is equal to $93.33 in cash, without interest, plus a fraction of a share of UTC common stock having avalue equal to the quotient obtained by dividing $46.67 by the average of the volume-weighted average prices per share of UTC common stock on the NYSE oneach of the 20 consecutive trading days ending with the trading day immediately prior to the closing date, subject to adjustment based on a two-way collarmechanism as described below. If the UTC stock price is greater than $107.01 but less than $124.37, the exchange ratio will be equal to the quotient of (1) $46.67divided by (2) the UTC stock price. However, if the UTC stock price is less than or equal to $107.01 or greater than or equal to $124.37, then a two-way collarmechanism will apply, pursuant to which (a) if the UTC stock price is greater than or equal to $124.37, the exchange ratio will be fixed at 0.37525 and result inmore than $46.67 in value, and (b) if the UTC stock price is less than or equal to $107.01, the exchange ratio will be fixed at 0.43613 and result in less than $46.67in value. Accordingly, the actual number of shares and the value of UTC common stock delivered to our shareowners will depend on the UTC stock price, and thevalue of the shares of UTC common stock delivered for each such share of our common stock may be greater than, less than or equal to $46.67.
It is impossible to accurately predict the market price of UTC common stock at the completion of the UTC Merger or during the period over which the UTC stockprice is calculated and, therefore, impossible to accurately predict the number or value of the shares of UTC common stock that our shareowners will receive in theUTC Merger. The market price for UTC common stock may fluctuate both prior to completion of the UTC Merger and thereafter for a variety of reasons,including, among others, general market and economic conditions, the demand for UTC’s or our products and services, changes in laws and regulations, otherchanges in UTC’s and our respective businesses, operations, prospects and financial results of operations, market assessments of the likelihood that the UTCMerger will be completed, and the expected timing of the UTC Merger. Many of these factors are beyond our control.
We are subject to business uncertainties and contractual restrictions while the UTC Merger is pending, which could adversely affect our business andoperations.
In connection with the pendency of the UTC Merger, it is possible that some customers, suppliers and other persons with whom we have a business relationshipmay delay or defer certain business decisions or might decide to seek to terminate, change or renegotiate their relationships with us as a result of the UTC Merger,which could negatively affect our revenues, earnings and/or cash flows, as well as the market price of our common stock, regardless of whether the UTC Merger iscompleted.
Under the terms of the Merger Agreement, we are subject to certain restrictions on the conduct of our business prior to completing the UTC Merger which mayadversely affect our ability to execute certain of our business strategies, including the ability in certain cases to enter into or amend contracts, acquire or dispose ofassets, incur indebtedness or incur capital expenditures. Such limitations could adversely affect our business and operations prior to the completion of the UTCMerger. Each of the risks described above may be exacerbated by delays or other adverse developments with respect to the completion of the UTC Merger.
19
Completion of the UTC Merger will trigger change in control or other provisions in certain customer and other agreements to which we are a party, which mayhave an adverse impact on our or UTC’s business and results of operations following completion of the UTC Merger.
The completion of the UTC Merger will trigger change in control and other provisions in certain customer and other agreements to which we are a party. If we orUTC are unable to negotiate waivers of those provisions, customers or other counterparties may exercise their rights and remedies under the agreements,potentially terminating the agreements or seeking monetary damages or equitable remedies. Even if we and UTC are able to negotiate consents or waivers, thecustomers or other counterparties may require a fee for such waivers or seek to renegotiate the agreements on terms less favorable to us or the combined company.Certain of our customers have commented on the potential impact of the UTC Merger, including potential benefits, questions and concerns. Any of the foregoing orsimilar developments may have an adverse impact on our or UTC’s business and results of operations following completion of the UTC Merger.
Uncertainties associated with the UTC Merger may cause a loss of management personnel and other key employees, which could adversely affect our futurebusiness and operations.
We are dependent on the experience and industry knowledge of our officers and other key employees to execute their business plans. Our success will depend inpart upon our ability to retain certain key management personnel and employees. Prior to completion of the UTC Merger, current and prospective employees of usand UTC may experience uncertainty about their roles within UTC following the completion of the UTC Merger, which may have an adverse effect on our abilityto attract or retain key management and other key personnel. In addition, no assurance can be given that UTC, after the completion of the UTC Merger, will be ableto attract or retain key management personnel and other key employees to the same extent that we and UTC have previously been able to attract or retain their ownemployees.
The UTC common stock to be received by our shareowners upon completion of the UTC Merger will have different rights from shares of Rockwell Collinscommon stock.
Upon completion of the UTC Merger, our shareowners will no longer be shareowners of Rockwell Collins, but will instead become shareowners of UTC and theirrights as UTC shareowners will be governed by the terms of UTC’s certificate of incorporation and by-laws. The terms of UTC’s certificate of incorporation andby-laws are in some respects materially different than the terms of our certificate of incorporation and by-laws, which currently govern the rights of ourshareowners.
Litigation filed or that may be filed against the Company, UTC, Merger Sub and the members of the Board of Directors could prevent or delay theconsummation of the UTC Merger.
In connection with the UTC Merger, several lawsuits have been filed by purported Rockwell Collins shareowners. The lawsuits seek an injunction barring the UTCMerger, rescission of the UTC Merger in the event it has been consummated, recovery of damages and other relief. The outcome of these lawsuits or any otherlawsuit that may be filed challenging the UTC Merger is uncertain. One of the conditions to the closing of the UTC Merger is that no governmental authority hasissued or entered any order after the date of the UTC Merger Agreement having the effect of enjoining or otherwise prohibiting the consummation of the UTCMerger, and these lawsuits seek and potential other lawsuits may seek an order enjoining consummation of the UTC Merger. Accordingly, if these lawsuits or anyfuture lawsuit is successful in obtaining an order enjoining consummation of the UTC Merger, then such order may prevent the UTC Merger from beingcompleted, or from being completed within the expected time frame, and could result in substantial costs to Rockwell Collins including, but not limited to, costsassociated with the indemnification of directors and officers. Any such injunction or delay in the UTC Merger being completed may adversely affect RockwellCollins’ business, financial condition, results of operations and cash flows.
20
Cautionary Statement
This Annual Report on Form 10-K, and documents that are incorporated by reference in this Annual Report on Form 10-K, contains statements, includingstatements regarding the proposed acquisition of Rockwell Collins by UTC, that are forward-looking statements as defined in the Private Securities LitigationReform Act of 1995. Actual results may differ materially from those projected as a result of certain risks and uncertainties, including but not limited to thosedisclosed in Risk Factors in Item 1A above and otherwise detailed herein, as well as other risks and uncertainties, including but not limited to those detailed fromtime to time in our SEC filings and, with respect to the proposed acquisition of Rockwell Collins, UTC’s filings with the SEC. With respect to the business andoperations of Rockwell Collins, these risks include but are not limited to: the financial condition of our customers and suppliers, including bankruptcies; the healthof the global economy, including potential deterioration in economic and financial market conditions; adjustments to the commercial OEM production rates and theaftermarket; the impacts of natural disasters and pandemics, including operational disruption, potential supply shortages and other economic impacts; cybersecuritythreats, including the potential misappropriation of assets or sensitive information, corruption of data or operational disruption; delays related to the award ofdomestic and international contracts; delays in customer programs, including new aircraft programs entering service later than anticipated; the continued supportfor military transformation and modernization programs; potential impact of volatility in oil prices, currency exchange rates or interest rates on the commercialaerospace industry or our business; the impact of terrorist events, regional conflicts or governmental sanctions on other nations on the commercial aerospaceindustry; changes in domestic and foreign government spending, budgetary, procurement and trade policies adverse to our businesses; market acceptance of ournew and existing technologies, products and services; reliability of and customer satisfaction with our products and services; potential unavailability of ourmission-critical data and voice communication networks; unfavorable outcomes on or potential cancellation or restructuring of contracts, orders or programpriorities by our customers; recruitment and retention of qualified personnel; regulatory restrictions on air travel due to environmental concerns; effectivenegotiation of collective bargaining agreements by us, our customers, and our suppliers; performance of our customers and subcontractors; risks inherent indevelopment and fixed-price contracts, particularly the risk of cost overruns; risk of significant reduction to air travel or aircraft capacity beyond our forecasts; ourability to execute to internal performance plans such as restructuring activities, productivity and quality improvements and cost reduction initiatives; achievementof B/E Aerospace integration and synergy plans; continuing to maintain our planned effective tax rates; our ability to develop contract compliant systems andproducts on schedule and within anticipated cost estimates; risk of fines and penalties related to noncompliance with laws and regulations including compliancerequirements associated with U.S. Government work, export control and environmental regulations; risk of asset impairments; our ability to win new business andconvert those orders to sales within the fiscal year in accordance with our annual operating plan; the uncertainties of the outcome of lawsuits, claims and legalproceedings. With respect to the proposed acquisition, these risks include but are not limited to: the ability of Rockwell Collins and UTC to receive the requiredregulatory approvals for the proposed acquisition of Rockwell Collins by UTC (and the risk that such approvals may result in the imposition of conditions thatcould adversely affect the combined company or the expected benefits of the transaction) and approval of Rockwell Collins’ shareowners and to satisfy the otherconditions to the closing of the transaction on a timely basis or at all; the occurrence of events that may give rise to a right of one or both of the parties to terminatethe merger agreement; negative effects of the announcement or the consummation of the transaction on the market price of UTC and/or Rockwell Collins commonstock and/or on their respective businesses, financial conditions, results of operations and financial performance; risks relating to the value of UTC’s shares to beissued in the transaction, significant transaction costs and/or unknown liabilities; the possibility that the anticipated benefits from the proposed transaction cannotbe realized in full or at all or may take longer to realize than expected; risks associated with third party contracts containing consent and/or other provisions thatmay be triggered by the proposed transaction; risks associated with transaction-related litigation; the possibility that costs or difficulties related to the integration ofRockwell Collins’ operations with those of UTC will be greater than expected; the outcome of legally required consultation with employees, their works councilsor other employee representatives; and the ability of Rockwell Collins and the combined company to retain and hire key personnel. There can be no assurance thatthe proposed acquisition will in fact be consummated in the manner described or at all. These risks, as well as other risks associated with the proposed merger, aremore fully discussed in the preliminary proxy statement/prospectus included in the Registration Statement on Form S-4 that UTC filed with the SEC on October10, 2017, in connection with the proposed merger. Readers are cautioned not to place undue reliance on these forward-looking statements. These forward-lookingstatements are made only as of the date hereof and Rockwell Collins assumes no obligation to update any forward-looking statement, except as otherwise requiredby law.
Item 1B. Unresolved Staff Comments.
None.
21
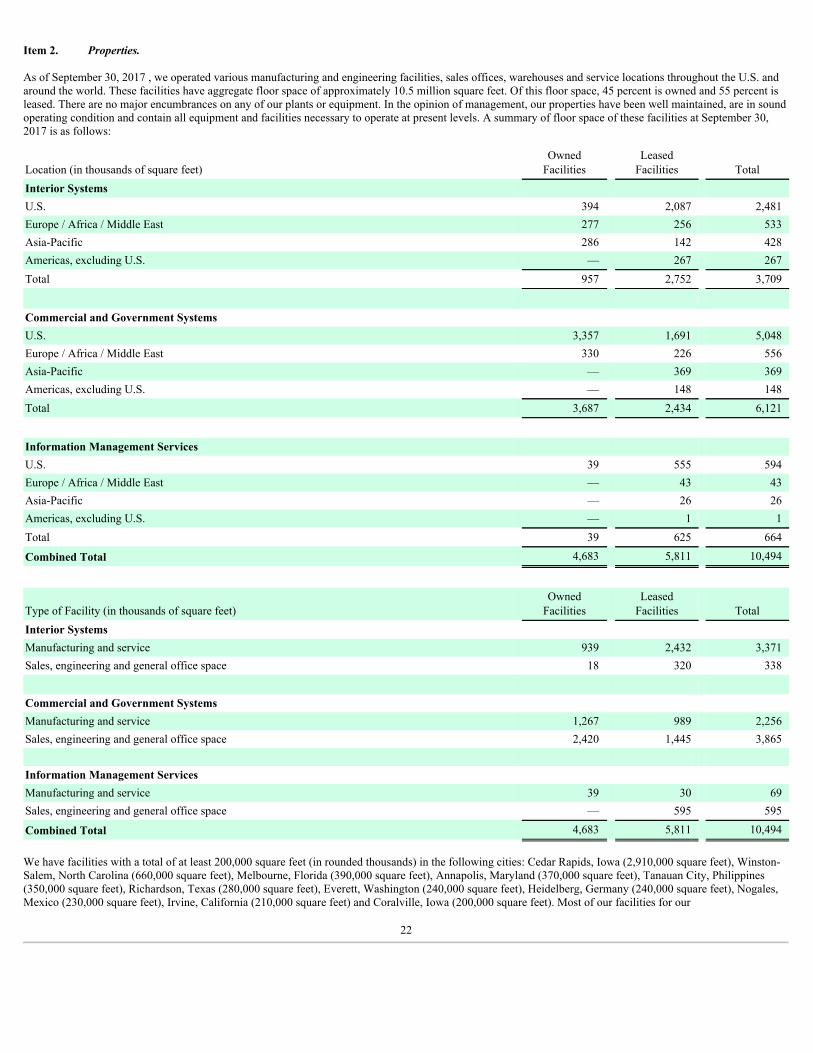
Item 2. Properties.
As of September 30, 2017 , we operated various manufacturing and engineering facilities, sales offices, warehouses and service locations throughout the U.S. andaround the world. These facilities have aggregate floor space of approximately 10.5 million square feet. Of this floor space, 45 percent is owned and 55 percent isleased. There are no major encumbrances on any of our plants or equipment. In the opinion of management, our properties have been well maintained, are in soundoperating condition and contain all equipment and facilities necessary to operate at present levels. A summary of floor space of these facilities at September 30,2017 is as follows:
Location (in thousands of square feet) Owned
Facilities Leased
Facilities TotalInterior Systems U.S. 394 2,087 2,481Europe / Africa / Middle East 277 256 533Asia-Pacific 286 142 428Americas, excluding U.S. — 267 267Total 957 2,752 3,709
Commercial and Government SystemsU.S. 3,357 1,691 5,048Europe / Africa / Middle East 330 226 556Asia-Pacific — 369 369Americas, excluding U.S. — 148 148Total 3,687 2,434 6,121
Information Management Services U.S. 39 555 594Europe / Africa / Middle East — 43 43Asia-Pacific — 26 26Americas, excluding U.S. — 1 1Total 39 625 664
Combined Total 4,683 5,811 10,494
Type of Facility (in thousands of square feet) Owned
Facilities Leased
Facilities TotalInterior Systems Manufacturing and service 939 2,432 3,371Sales, engineering and general office space 18 320 338
Commercial and Government Systems Manufacturing and service 1,267 989 2,256Sales, engineering and general office space 2,420 1,445 3,865 Information Management Services Manufacturing and service 39 30 69Sales, engineering and general office space — 595 595
Combined Total 4,683 5,811 10,494
We have facilities with a total of at least 200,000 square feet (in rounded thousands) in the following cities: Cedar Rapids, Iowa (2,910,000 square feet), Winston-Salem, North Carolina (660,000 square feet), Melbourne, Florida (390,000 square feet), Annapolis, Maryland (370,000 square feet), Tanauan City, Philippines(350,000 square feet), Richardson, Texas (280,000 square feet), Everett, Washington (240,000 square feet), Heidelberg, Germany (240,000 square feet), Nogales,Mexico (230,000 square feet), Irvine, California (210,000 square feet) and Coralville, Iowa (200,000 square feet). Most of our facilities for our
22
Commercial Systems and Government Systems businesses are shared and have therefore been presented together in the tables above. We have excluded from thetables above hundreds of leased locations wherein our Information Management Services business has radio frequency equipment in various locations throughoutthe world.
We purchase property insurance covering physical damage to our facilities and resulting business interruption from perils including fire, windstorm, flood andearthquake. This insurance generally provides replacement cost coverage subject to a $10 million deductible with certain exceptions. For example, certain of ourfacilities, including those located in California and Mexico, are located near major earthquake fault lines. For those facilities we maintain earthquake insurancewith limits that may be less than full replacement cost. These exceptions are largely driven by the availability and cost of catastrophe coverage from the insurancemarkets.
Item 3. Legal Proceedings.
Various lawsuits, claims and proceedings have been or may be instituted or asserted against us relating to the conduct of our business, including those pertaining toproduct liability, intellectual property, environmental, safety and health, exporting or importing, contract, employment and regulatory matters. Although theoutcome of litigation cannot be predicted with certainty and some lawsuits, claims or proceedings may be disposed of unfavorably to us, management believesthere are no material pending legal proceedings.
Item 4. Mine Safety Disclosures.
Not applicable.
23
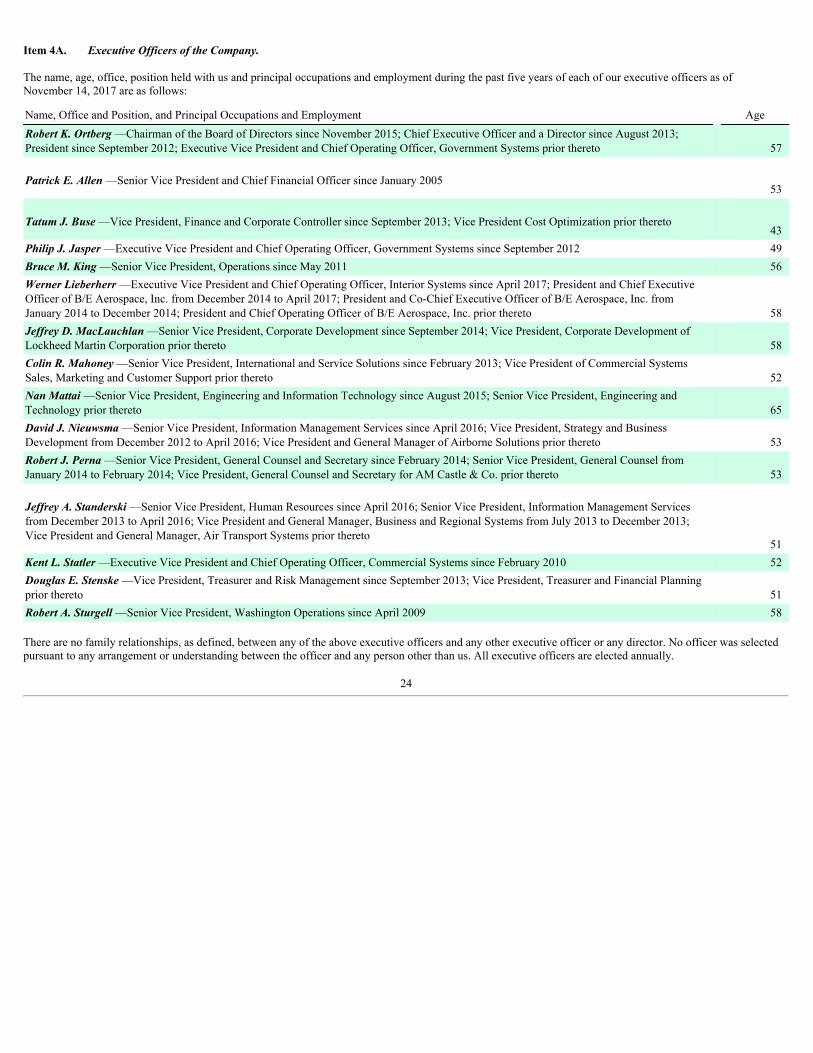
Item 4A. Executive Officers of the Company.
The name, age, office, position held with us and principal occupations and employment during the past five years of each of our executive officers as ofNovember 14, 2017 are as follows:
Name, Office and Position, and Principal Occupations and Employment AgeRobert K. Ortberg —Chairman of the Board of Directors since November 2015; Chief Executive Officer and a Director since August 2013;President since September 2012; Executive Vice President and Chief Operating Officer, Government Systems prior thereto 57
Patrick E. Allen —Senior Vice President and Chief Financial Officer since January 2005 53
Tatum J. Buse —Vice President, Finance and Corporate Controller since September 2013; Vice President Cost Optimization prior thereto 43
Philip J. Jasper —Executive Vice President and Chief Operating Officer, Government Systems since September 2012 49Bruce M. King —Senior Vice President, Operations since May 2011 56Werner Lieberherr —Executive Vice President and Chief Operating Officer, Interior Systems since April 2017; President and Chief ExecutiveOfficer of B/E Aerospace, Inc. from December 2014 to April 2017; President and Co-Chief Executive Officer of B/E Aerospace, Inc. fromJanuary 2014 to December 2014; President and Chief Operating Officer of B/E Aerospace, Inc. prior thereto 58Jeffrey D. MacLauchlan —Senior Vice President, Corporate Development since September 2014; Vice President, Corporate Development ofLockheed Martin Corporation prior thereto 58Colin R. Mahoney —Senior Vice President, International and Service Solutions since February 2013; Vice President of Commercial SystemsSales, Marketing and Customer Support prior thereto 52Nan Mattai —Senior Vice President, Engineering and Information Technology since August 2015; Senior Vice President, Engineering andTechnology prior thereto 65David J. Nieuwsma —Senior Vice President, Information Management Services since April 2016; Vice President, Strategy and BusinessDevelopment from December 2012 to April 2016; Vice President and General Manager of Airborne Solutions prior thereto 53Robert J. Perna —Senior Vice President, General Counsel and Secretary since February 2014; Senior Vice President, General Counsel fromJanuary 2014 to February 2014; Vice President, General Counsel and Secretary for AM Castle & Co. prior thereto 53
Jeffrey A. Standerski —Senior Vice President, Human Resources since April 2016; Senior Vice President, Information Management Servicesfrom December 2013 to April 2016; Vice President and General Manager, Business and Regional Systems from July 2013 to December 2013;Vice President and General Manager, Air Transport Systems prior thereto
51Kent L. Statler —Executive Vice President and Chief Operating Officer, Commercial Systems since February 2010 52Douglas E. Stenske —Vice President, Treasurer and Risk Management since September 2013; Vice President, Treasurer and Financial Planningprior thereto 51Robert A. Sturgell —Senior Vice President, Washington Operations since April 2009 58
There are no family relationships, as defined, between any of the above executive officers and any other executive officer or any director. No officer was selectedpursuant to any arrangement or understanding between the officer and any person other than us. All executive officers are elected annually.
24
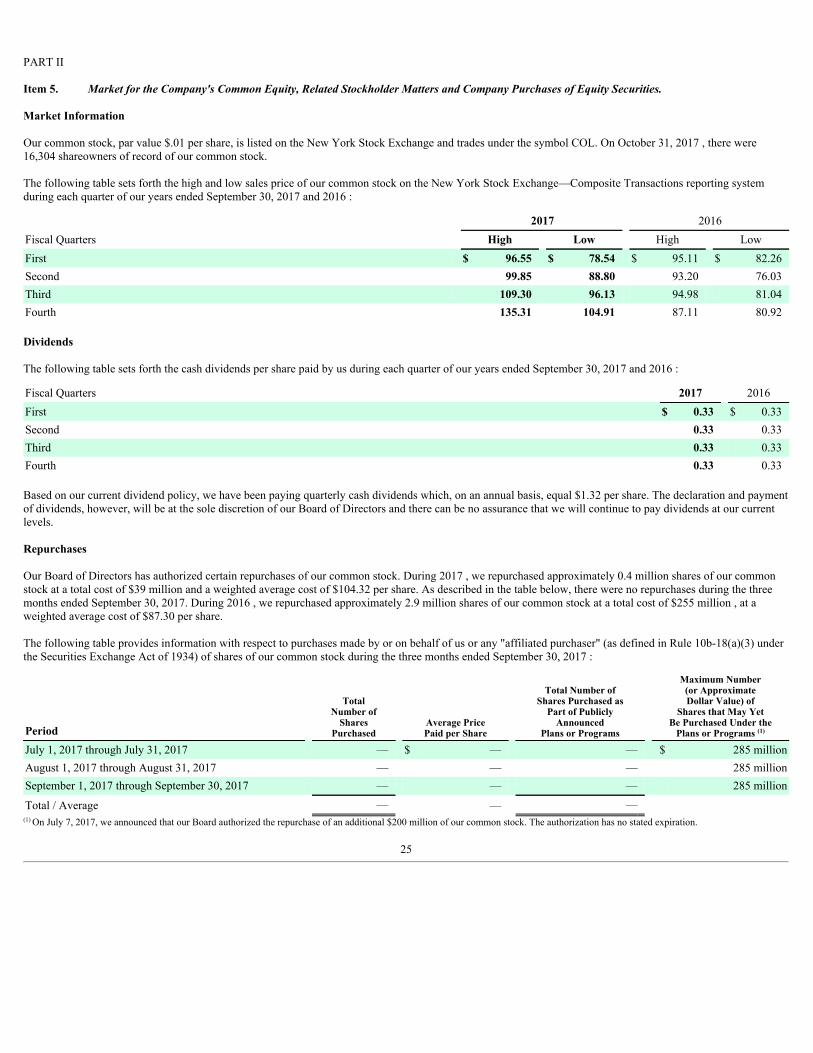
PART II
Item 5. Market for the Company's Common Equity, Related Stockholder Matters and Company Purchases of Equity Securities.
Market Information
Our common stock, par value $.01 per share, is listed on the New York Stock Exchange and trades under the symbol COL. On October 31, 2017 , there were16,304 shareowners of record of our common stock.
The following table sets forth the high and low sales price of our common stock on the New York Stock Exchange—Composite Transactions reporting systemduring each quarter of our years ended September 30, 2017 and 2016 :
2017 2016Fiscal Quarters High Low High LowFirst $ 96.55 $ 78.54 $ 95.11 $ 82.26Second 99.85 88.80 93.20 76.03Third 109.30 96.13 94.98 81.04Fourth 135.31 104.91 87.11 80.92
Dividends
The following table sets forth the cash dividends per share paid by us during each quarter of our years ended September 30, 2017 and 2016 :
Fiscal Quarters 2017 2016First $ 0.33 $ 0.33Second 0.33 0.33Third 0.33 0.33Fourth 0.33 0.33
Based on our current dividend policy, we have been paying quarterly cash dividends which, on an annual basis, equal $1.32 per share. The declaration and paymentof dividends, however, will be at the sole discretion of our Board of Directors and there can be no assurance that we will continue to pay dividends at our currentlevels.
Repurchases
Our Board of Directors has authorized certain repurchases of our common stock. During 2017 , we repurchased approximately 0.4 million shares of our commonstock at a total cost of $39 million and a weighted average cost of $104.32 per share. As described in the table below, there were no repurchases during the threemonths ended September 30, 2017. During 2016 , we repurchased approximately 2.9 million shares of our common stock at a total cost of $255 million , at aweighted average cost of $87.30 per share.
The following table provides information with respect to purchases made by or on behalf of us or any "affiliated purchaser" (as defined in Rule 10b-18(a)(3) underthe Securities Exchange Act of 1934) of shares of our common stock during the three months ended September 30, 2017 :
Period
TotalNumber of
SharesPurchased
Average PricePaid per Share
Total Number ofShares Purchased as
Part of PubliclyAnnounced
Plans or Programs
Maximum Number(or ApproximateDollar Value) of
Shares that May YetBe Purchased Under the
Plans or Programs (1)
July 1, 2017 through July 31, 2017 — $ — — $ 285 millionAugust 1, 2017 through August 31, 2017 — — — 285 millionSeptember 1, 2017 through September 30, 2017 — — — 285 million
Total / Average — — — (1) On July 7, 2017, we announced that our Board authorized the repurchase of an additional $200 million of our common stock. The authorization has no stated expiration.
25
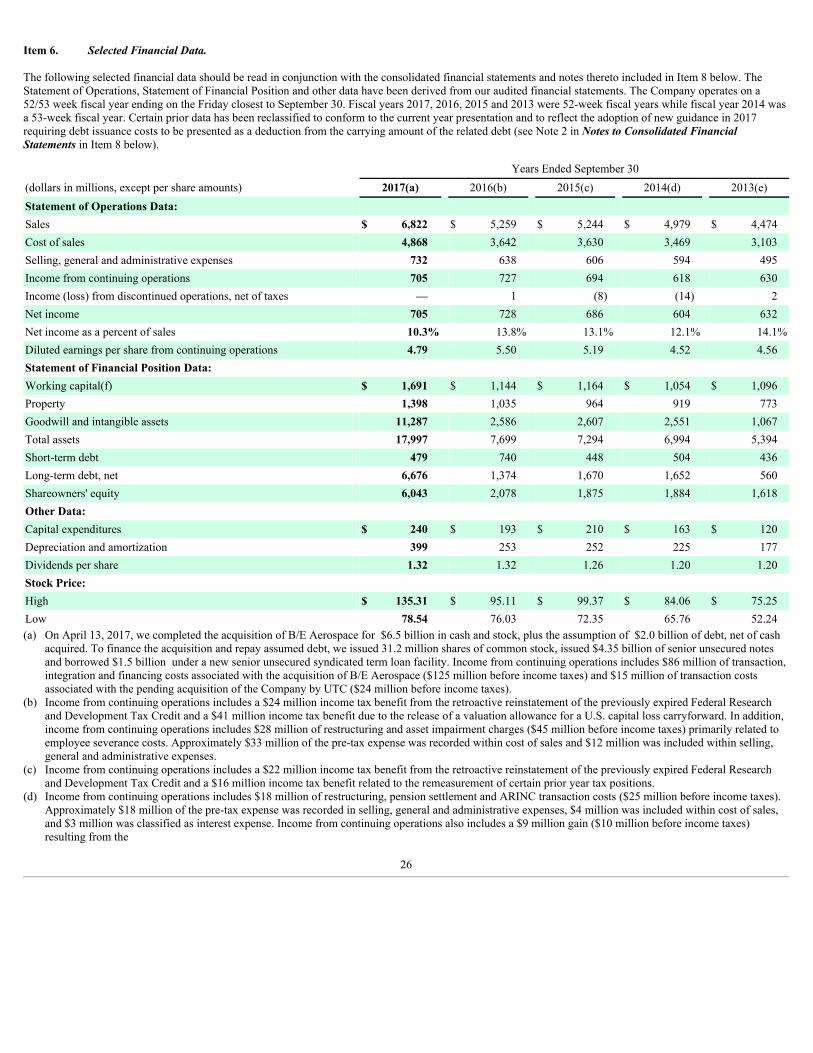
Item 6. Selected Financial Data.
The following selected financial data should be read in conjunction with the consolidated financial statements and notes thereto included in Item 8 below. TheStatement of Operations, Statement of Financial Position and other data have been derived from our audited financial statements. The Company operates on a52/53 week fiscal year ending on the Friday closest to September 30. Fiscal years 2017, 2016, 2015 and 2013 were 52-week fiscal years while fiscal year 2014 wasa 53-week fiscal year. Certain prior data has been reclassified to conform to the current year presentation and to reflect the adoption of new guidance in 2017requiring debt issuance costs to be presented as a deduction from the carrying amount of the related debt (see Note 2 in Notes to Consolidated FinancialStatements in Item 8 below).
Years Ended September 30(dollars in millions, except per share amounts) 2017(a) 2016(b) 2015(c) 2014(d) 2013(e)Statement of Operations Data: Sales $ 6,822 $ 5,259 $ 5,244 $ 4,979 $ 4,474Cost of sales 4,868 3,642 3,630 3,469 3,103Selling, general and administrative expenses 732 638 606 594 495Income from continuing operations 705 727 694 618 630Income (loss) from discontinued operations, net of taxes — 1 (8) (14) 2Net income 705 728 686 604 632Net income as a percent of sales 10.3% 13.8% 13.1% 12.1% 14.1%Diluted earnings per share from continuing operations 4.79 5.50 5.19 4.52 4.56Statement of Financial Position Data: Working capital(f) $ 1,691 $ 1,144 $ 1,164 $ 1,054 $ 1,096Property 1,398 1,035 964 919 773Goodwill and intangible assets 11,287 2,586 2,607 2,551 1,067Total assets 17,997 7,699 7,294 6,994 5,394Short-term debt 479 740 448 504 436Long-term debt, net 6,676 1,374 1,670 1,652 560Shareowners' equity 6,043 2,078 1,875 1,884 1,618Other Data: Capital expenditures $ 240 $ 193 $ 210 $ 163 $ 120Depreciation and amortization 399 253 252 225 177Dividends per share 1.32 1.32 1.26 1.20 1.20Stock Price: High $ 135.31 $ 95.11 $ 99.37 $ 84.06 $ 75.25Low 78.54 76.03 72.35 65.76 52.24(a) On April 13, 2017, we completed the acquisition of B/E Aerospace for $6.5 billion in cash and stock, plus the assumption of $2.0 billion of debt, net of cash
acquired. To finance the acquisition and repay assumed debt, we issued 31.2 million shares of common stock, issued $4.35 billion of senior unsecured notesand borrowed $1.5 billion under a new senior unsecured syndicated term loan facility. Income from continuing operations includes $86 million of transaction,integration and financing costs associated with the acquisition of B/E Aerospace ($125 million before income taxes) and $15 million of transaction costsassociated with the pending acquisition of the Company by UTC ($24 million before income taxes).
(b) Income from continuing operations includes a $24 million income tax benefit from the retroactive reinstatement of the previously expired Federal Researchand Development Tax Credit and a $41 million income tax benefit due to the release of a valuation allowance for a U.S. capital loss carryforward. In addition,income from continuing operations includes $28 million of restructuring and asset impairment charges ($45 million before income taxes) primarily related toemployee severance costs. Approximately $33 million of the pre-tax expense was recorded within cost of sales and $12 million was included within selling,general and administrative expenses.
(c) Income from continuing operations includes a $22 million income tax benefit from the retroactive reinstatement of the previously expired Federal Researchand Development Tax Credit and a $16 million income tax benefit related to the remeasurement of certain prior year tax positions.
(d) Income from continuing operations includes $18 million of restructuring, pension settlement and ARINC transaction costs ($25 million before income taxes).Approximately $18 million of the pre-tax expense was recorded in selling, general and administrative expenses, $4 million was included within cost of sales,and $3 million was classified as interest expense. Income from continuing operations also includes a $9 million gain ($10 million before income taxes)resulting from the
26
sale of the KOSI business. On December 23, 2013, we acquired ARINC for $1.405 billion. This acquisition was funded through a combination of new long-term debt and short-term commercial paper borrowings.
(e) Net income includes a $19 million income tax benefit related to the retroactive reinstatement of the previously expired Federal Research and Development TaxCredit. Short-term debt includes commercial paper borrowings incurred to fund a portion of our share repurchase program and also includes $200 millionrelated to debt that matured in December 2013.
(f) Working capital consists of all current assets and liabilities, including cash and short-term debt.
Item 7. Management's Discussion and Analysis of Financial Condition and Results of Operations.
The following discussion and analysis should be read in conjunction with our consolidated financial statements and notes thereto in Item 8 below. The followingdiscussion and analysis contains forward-looking statements and estimates that involve risks and uncertainties. Actual results could differ materially from theseestimates. Factors that could cause or contribute to differences from estimates include those discussed under Cautionary Statement and Risk Factors contained inItem 1A above.
We operate on a 52/53 week fiscal year ending on the Friday closest to September 30. For ease of presentation, September 30 is utilized consistently throughoutManagement's Discussion and Analysis of Financial Condition and Results of Operations to represent the fiscal year end date. Fiscal years 2017, 2016 and 2015were 52-week fiscal years. All date references contained herein relate to our fiscal year unless otherwise stated.
As discussed in Note 4 of the Notes to Consolidated Financial Statements in Item 8 below, on March 10, 2015, the Company divested the ASES business. As aresult of the divestiture, the operating results of ASES have been accounted for as discontinued operations for all periods presented.
OVERVIEW AND OUTLOOK
On September 4, 2017, we entered into the Merger Agreement providing for the acquisition of the Company by UTC. If the UTC Merger is consummated, we willbecome a wholly owned subsidiary of UTC. The agreement includes covenants and agreements relating to the conduct of our business between the date of signingthe Merger Agreement and the consummation of the UTC Merger. In light of the announced transaction with UTC, we will not be issuing guidance for fiscal year2018. During 2017, we incurred $24 million of transaction costs associated with the pending UTC Merger.
On April 13, 2017, we completed our acquisition of B/E Aerospace for $6.5 billion in cash and stock, plus the assumption of $2.0 billion of debt, net of cashacquired. To finance the acquisition and repay assumed debt, we issued 31.2 million shares of common stock, issued $4.35 billion of senior unsecured notesand borrowed $1.5 billion under a new senior unsecured syndicated term loan facility. The results of operations of the acquired business are reported in a newlyformed Interior Systems business segment.
The B/E Aerospace acquisition expands our reach and broadens our portfolio of aircraft content with the addition of a wide range of cabin interior products forcommercial aircraft and business jets including seating, food and beverage preparation and storage equipment, lighting and oxygen systems and modular galley andlavatory systems. The Company's portfolio of aircraft content now spans the aircraft from cockpit to cabin, communications to connectivity. The acquisition alsofurther diversifies our geographic presence and customer mix as Interior Systems products and services are sold to airlines and original equipment manufacturersacross the globe. In addition, the acquisition enhances our diversified and balanced business, serving both commercial and government markets. During 2017, weincurred $125 million of transaction, integration and financing costs associated with the acquisition of B/E Aerospace.
Our Commercial Systems business supplies aviation electronics systems, products and services to customers located throughout the world. The CommercialSystems customer base is comprised of commercial air transport and business and regional aircraft OEMs, commercial airlines and business aircraft operators. TheGovernment Systems business provides communication and navigation products and avionics to the U.S. Department of Defense, state and local governments,other government agencies, civil agencies, defense contractors and foreign ministries of defense around the world. These systems, products and services supportairborne (fixed and rotary wing), ground and shipboard applications. Our Information Management Services business enables mission-critical data and voicecommunications throughout the world to customers including the U.S. Federal Aviation Administration, commercial airlines, business aircraft operators, airportand critical infrastructure operators and major passenger and freight railroads. These communications are enabled by our high-performance, high-quality and high-assurance proprietary radio and terrestrial networks, enhancing customer efficiency, safety and connectivity.
27
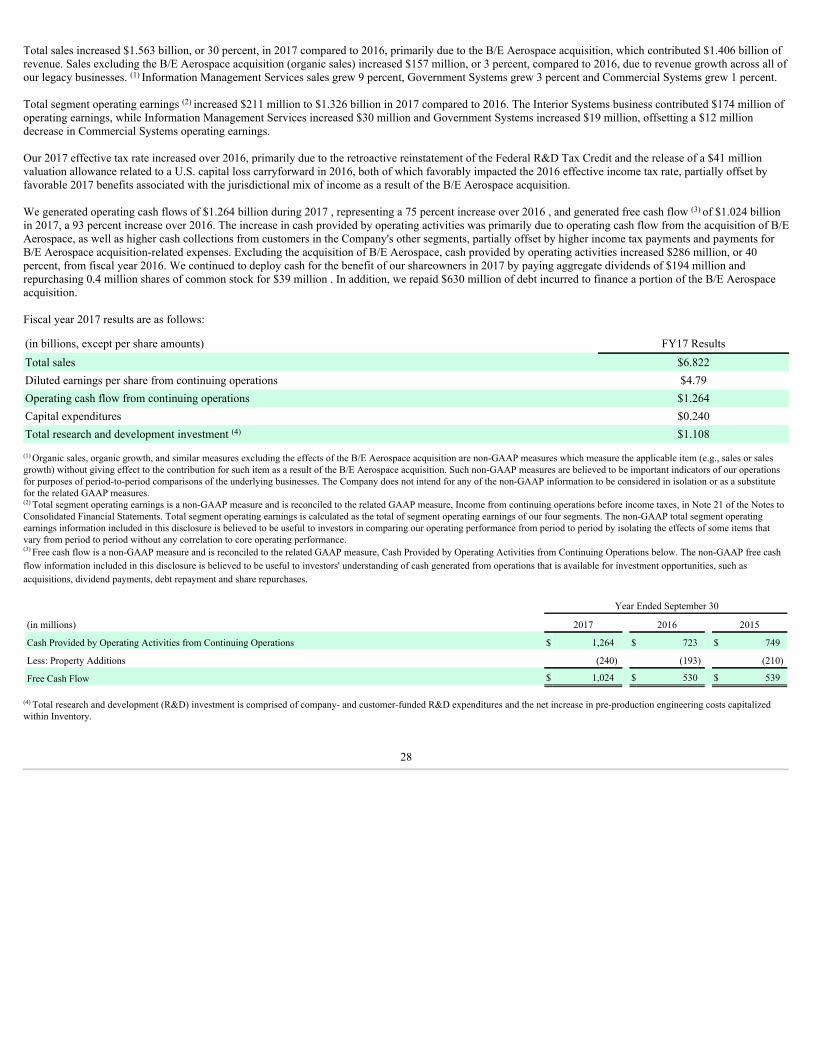
Total sales increased $1.563 billion, or 30 percent, in 2017 compared to 2016, primarily due to the B/E Aerospace acquisition, which contributed $1.406 billion ofrevenue. Sales excluding the B/E Aerospace acquisition (organic sales) increased $157 million, or 3 percent, compared to 2016, due to revenue growth across all ofour legacy businesses. (1) Information Management Services sales grew 9 percent, Government Systems grew 3 percent and Commercial Systems grew 1 percent.
Total segment operating earnings (2) increased $211 million to $1.326 billion in 2017 compared to 2016. The Interior Systems business contributed $174 million ofoperating earnings, while Information Management Services increased $30 million and Government Systems increased $19 million, offsetting a $12 milliondecrease in Commercial Systems operating earnings.
Our 2017 effective tax rate increased over 2016, primarily due to the retroactive reinstatement of the Federal R&D Tax Credit and the release of a $41 millionvaluation allowance related to a U.S. capital loss carryforward in 2016, both of which favorably impacted the 2016 effective income tax rate, partially offset byfavorable 2017 benefits associated with the jurisdictional mix of income as a result of the B/E Aerospace acquisition.
We generated operating cash flows of $1.264 billion during 2017 , representing a 75 percent increase over 2016 , and generated free cash flow (3) of $1.024 billionin 2017, a 93 percent increase over 2016. The increase in cash provided by operating activities was primarily due to operating cash flow from the acquisition of B/EAerospace, as well as higher cash collections from customers in the Company's other segments, partially offset by higher income tax payments and payments forB/E Aerospace acquisition-related expenses. Excluding the acquisition of B/E Aerospace, cash provided by operating activities increased $286 million, or 40percent, from fiscal year 2016. We continued to deploy cash for the benefit of our shareowners in 2017 by paying aggregate dividends of $194 million andrepurchasing 0.4 million shares of common stock for $39 million . In addition, we repaid $630 million of debt incurred to finance a portion of the B/E Aerospaceacquisition.
Fiscal year 2017 results are as follows:
(in billions, except per share amounts) FY17 ResultsTotal sales $6.822Diluted earnings per share from continuing operations $4.79Operating cash flow from continuing operations $1.264Capital expenditures $0.240Total research and development investment (4) $1.108
(1) Organic sales, organic growth, and similar measures excluding the effects of the B/E Aerospace acquisition are non-GAAP measures which measure the applicable item (e.g., sales or salesgrowth) without giving effect to the contribution for such item as a result of the B/E Aerospace acquisition. Such non-GAAP measures are believed to be important indicators of our operationsfor purposes of period-to-period comparisons of the underlying businesses. The Company does not intend for any of the non-GAAP information to be considered in isolation or as a substitutefor the related GAAP measures.(2) Total segment operating earnings is a non-GAAP measure and is reconciled to the related GAAP measure, Income from continuing operations before income taxes, in Note 21 of the Notes toConsolidated Financial Statements. Total segment operating earnings is calculated as the total of segment operating earnings of our four segments. The non-GAAP total segment operatingearnings information included in this disclosure is believed to be useful to investors in comparing our operating performance from period to period by isolating the effects of some items thatvary from period to period without any correlation to core operating performance.(3) Free cash flow is a non-GAAP measure and is reconciled to the related GAAP measure, Cash Provided by Operating Activities from Continuing Operations below. The non-GAAP free cashflow information included in this disclosure is believed to be useful to investors' understanding of cash generated from operations that is available for investment opportunities, such asacquisitions, dividend payments, debt repayment and share repurchases.
Year Ended September 30
(in millions) 2017 2016 2015
Cash Provided by Operating Activities from Continuing Operations $ 1,264 $ 723 $ 749
Less: Property Additions (240) (193) (210)
Free Cash Flow $ 1,024 $ 530 $ 539
(4) Total research and development (R&D) investment is comprised of company- and customer-funded R&D expenditures and the net increase in pre-production engineering costs capitalizedwithin Inventory.
28
Our long-term strategies are focused on the following:
• accelerate sales growth
• expand operating margins and improve cash flow conversion
• deploy capital with priorities on growth and shareowner return
Accelerate sales growth
Accelerating our business growth is a fundamental objective of our management team. For the past decade we have been in a period of significant investment inresearch and development for our company to support market share gains throughout our businesses. Our record of success in migrating technologies across theenterprise is a core strength and enables us to realize the benefits of investment even if market conditions change. We are realizing the benefits of completinginvestments in these programs as new platforms enter service. Our focus on developing solutions aimed at making Rockwell Collins the supplier of choice isevidenced by our significant investment in research and development. Over the past 5 years, we invested approximately $4.9 billion in research and development,which has allowed us to develop new systems, products and software solutions for our customers and capture strategically important positions on a variety of airtransport, business aviation and military aircraft.
Highlights of our strategy to accelerate top-line sales growth are as follows:
StrongpositionswillfuelgrowthOur Interior Systems segment was created in April 2017 with the acquisition of B/E Aerospace. The Interior Systems current backlog of $3.8 billion increased$247 million since the acquisition date. Increased aircraft production rates at commercial air transport and business jet OEMs fuel opportunities to expand ourproduct offering. Backlog growth results from favorable trends in airline selectable equipment, including seating, lighting systems and food preparation andstorage, as well as increased production of aircraft with standard Interior Systems equipment. Additionally, the large installed base provides a robust flow ofaftermarket retrofit and spares opportunities to support long-term growth.
Within Commercial Systems, over the past several years we have captured key positions and market share gains on platforms such as the Boeing 737 MAX and777X, as well as the Bombardier CSeries. We successfully completed numerous milestones on these and other aircraft development programs throughout the year,and we achieved top customer support ratings from our largest customers. We believe these accomplishments have positioned us to continue to grow our marketshare. We recently announced that Airbus has selected our flight operations and maintenance exchanger solution, called FOMAX, as standard on their A320family. Under this agreement, we will supply each A320 aircraft with a secure router to wirelessly send aircraft performance and maintenance data to ground-basedoperations.
Within Government Systems, we increased our backlog by $171 million during 2017. Defense budgets have been improving not only in the United States, but alsothroughout the world. During 2017, we were selected as one of two companies on the HMS Manpack program, which has the potential to be a significant program.We also were selected by the U.S. N avy to supply our encrypted, next-generation tactical training system for the Tactical Combat Training System Increment IIprogram. This program will increase war-fighter readiness at a reduced training cost, enabling interaction between a number of participants in live, virtual andconstructive training.
Wearecapitalizingonaviation’sinformationageIn today’s information-enabled world, the industry continues to trend away from hardware-based solutions to more software-based applications and the needs forconnectivity are increasing for airlines, airports and passengers. Through organic innovations and acquisitions, our Information Management Services portfoliopositions us as a leader in aviation information management, delivering efficiency and safety to our customers and their passengers.
As traffic on our air-to-ground network increases, we’re taking steps to enhance its capacity and usefulness. In the cockpit, more robust data streams andsophisticated applications are enhancing operational efficiencies, safety and on-time flight performance. In the cabin, broadband connectivity is enablingpassengers to stay connected throughout their flight, and it also provides new ways to enhance the passenger experience. In 2017, we were awarded a contract byNorwegian Air Shuttle to provide a nose-to-tail integrated digital aircraft solution for their fleet of Boeing 737 MAX and 787 aircraft. This solution combines ouravionics, cockpit communication, cabin connectivity and information management solutions to deliver enhanced operational efficiency for the airline and high-bandwidth wireless in-flight connectivity for passengers. Our cabin connectivity
29
solution for passengers is underpinned by Inmarsat's Global Xpress satellite network, allowing passengers a range of connectivity options including e-mail, internetaccess, video streaming and electronic commerce.
WewillcontinuetogrowgloballyMarket opportunities outside the United States continue to evolve, driven in part by expanding populations and emerging economies. Security needs are on the risein places around the globe, as countries seek to establish indigenous capabilities to protect their borders, infrastructure and resources. At the same time, globalcommercial air travel is expected to increase as we see a growing middle class in developing countries, generating higher traffic and demand for new aircraft. Webelieve we are positioned to grow by capturing new programs at emerging international OEMs, strategically positioning service centers around the globe and bylaunching joint ventures.
Expand operating margins and improve cash flow conversion
Operational excellence is a fundamental objective at our Company. We have extended Lean concepts beyond the factory floor to virtually every aspect of ourbusiness. We focus on streamlining processes, reducing costs and increasing quality while enhancing our ability to respond quickly to customer needs. In addition,our shared service model uses a centralized organizational structure to leverage resources across the business. This is evidenced by our product and technologycenters of excellence, through which we apply our core competencies to solutions across our segments. By applying common tools and systems across ourbusinesses, we can better manage our cost structure and maximize our R&D investments.
We believe our Company has a proven ability to both react quickly to changing business conditions and to execute business plans. For example, as we facedchallenging conditions in business aviation and the defense environment in the past several years, we took actions to manage our cost structure, while focusing onour customers, continuing our commitment to operational excellence and maintaining our balanced business model. We will also distinguish ourselves throughstrong customer relationships, high returns on invested capital and continued investment in market differentiating technologies and programs. As we grow ourCompany, our goal is to generate long-term double-digit cash flow growth. In 2017, our operating cash flow grew 75 percent (40 percent organically) as we wounddown some of our major program investments.
Deploy capital with priorities on growth and shareowner return
We plan to allocate capital across our Company to prioritize debt repayment and to fund growth through investments in R&D, capital expenditures and minoracquisitions. On April 13, 2017, the Company completed the acquisition of B/E Aerospace for $6.5 billion in cash and stock, plus the assumption of $2.0 billion innet debt. The transaction combines our capabilities in flight deck avionics, cabin electronics, mission communications, simulation and training, and informationmanagement systems with B/E Aerospace's range of cabin interior products, which include seating, food and beverage preparation and storage equipment, lightingand oxygen systems, and modular galley and lavatory systems for commercial airliners and business jets. The acquisition significantly increases our scale anddiversifies our product portfolio, customer mix and geographic presence.
See the following sections for further discussion of our results of operations. For additional disclosure on segment operating earnings see Note 21 of the Notes toConsolidated Financial Statements in Item 8 below. Please also see our Risk Factors and Cautionary Statement in Item 1A of this Form 10-K.
30
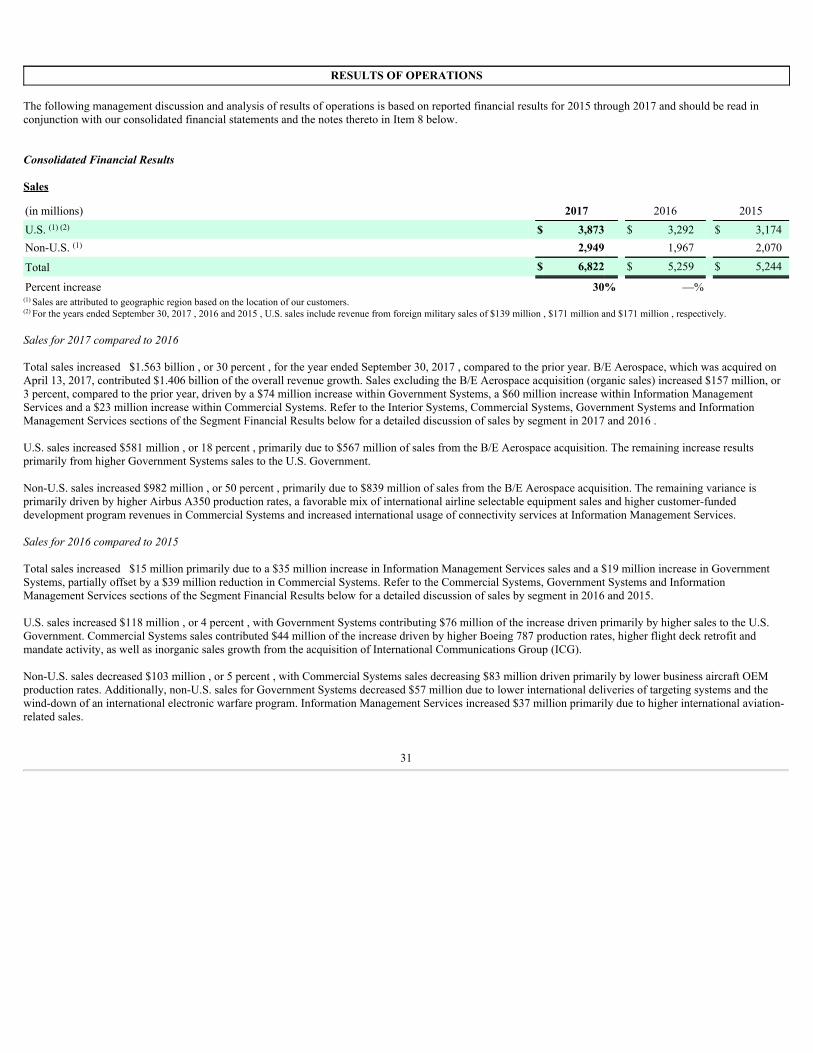
RESULTS OF OPERATIONS
The following management discussion and analysis of results of operations is based on reported financial results for 2015 through 2017 and should be read inconjunction with our consolidated financial statements and the notes thereto in Item 8 below.
Consolidated Financial Results
Sales
(in millions) 2017 2016 2015U.S. (1) (2) $ 3,873 $ 3,292 $ 3,174Non-U.S. (1) 2,949 1,967 2,070
Total $ 6,822 $ 5,259 $ 5,244
Percent increase 30% —% (1) Sales are attributed to geographic region based on the location of our customers.(2) For the years ended September 30, 2017 , 2016 and 2015 , U.S. sales include revenue from foreign military sales of $139 million , $171 million and $171 million , respectively.
Salesfor2017comparedto2016
Total sales increased $1.563 billion , or 30 percent , for the year ended September 30, 2017 , compared to the prior year. B/E Aerospace, which was acquired onApril 13, 2017, contributed $1.406 billion of the overall revenue growth. Sales excluding the B/E Aerospace acquisition (organic sales) increased $157 million, or3 percent, compared to the prior year, driven by a $74 million increase within Government Systems, a $60 million increase within Information ManagementServices and a $23 million increase within Commercial Systems. Refer to the Interior Systems, Commercial Systems, Government Systems and InformationManagement Services sections of the Segment Financial Results below for a detailed discussion of sales by segment in 2017 and 2016 .
U.S. sales increased $581 million , or 18 percent , primarily due to $567 million of sales from the B/E Aerospace acquisition. The remaining increase resultsprimarily from higher Government Systems sales to the U.S. Government.
Non-U.S. sales increased $982 million , or 50 percent , primarily due to $839 million of sales from the B/E Aerospace acquisition. The remaining variance isprimarily driven by higher Airbus A350 production rates, a favorable mix of international airline selectable equipment sales and higher customer-fundeddevelopment program revenues in Commercial Systems and increased international usage of connectivity services at Information Management Services.
Salesfor2016comparedto2015
Total sales increased $15 million primarily due to a $35 million increase in Information Management Services sales and a $19 million increase in GovernmentSystems, partially offset by a $39 million reduction in Commercial Systems. Refer to the Commercial Systems, Government Systems and InformationManagement Services sections of the Segment Financial Results below for a detailed discussion of sales by segment in 2016 and 2015.
U.S. sales increased $118 million , or 4 percent , with Government Systems contributing $76 million of the increase driven primarily by higher sales to the U.S.Government. Commercial Systems sales contributed $44 million of the increase driven by higher Boeing 787 production rates, higher flight deck retrofit andmandate activity, as well as inorganic sales growth from the acquisition of International Communications Group (ICG).
Non-U.S. sales decreased $103 million , or 5 percent , with Commercial Systems sales decreasing $83 million driven primarily by lower business aircraft OEMproduction rates. Additionally, non-U.S. sales for Government Systems decreased $57 million due to lower international deliveries of targeting systems and thewind-down of an international electronic warfare program. Information Management Services increased $37 million primarily due to higher international aviation-related sales.
31
Cost of Sales
(in millions) 2017 2016 2015Total cost of sales $ 4,868 $ 3,642 $ 3,630Percent of total sales 71.4% 69.3% 69.2%
Cost of sales consists of all costs incurred to design and manufacture our products and provide our services and includes R&D, raw material, labor, facility, productwarranty, depreciation, amortization, service and support and other related expenses.
Costofsalesfor2017comparedto2016
Total cost of sales increased $1.226 billion primarily due to the following:
• $1.140 billion of cost of sales from the recently acquired B/E Aerospace business
• an $83 million increase from higher organic sales, which was favorably impacted by benefits from cost savings initiatives
• a $40 million increase in employee incentive compensation costs
• partially offset by $33 million of asset and restructuring charges recorded in 2016
• further offset by a $9 million decrease in company-funded R&D expense in Government Systems and Information Management Services, as detailed inthe Research and Development Expense section below
The increase in cost of sales as a percent of revenues was primarily due to the recently acquired B/E Aerospace business.
Costofsalesfor2016comparedto2015
Total cost of sales increased $12 million primarily due to the following:
• a $45 million increase from higher sales volume, which was negatively impacted by less favorable program sales mix
• $33 million of asset and restructuring charges recorded in 2016
• partially offset by a $48 million reduction in company-funded R&D expense, as detailed in the Research and Development Expense section below
• in addition, pension costs decreased $16 million
32
Research and Development Expense
R&D expense is included as a component of cost of sales and is summarized as follows:
(in millions) 2017 2016 2015Customer-funded:
Interior Systems $ 54 $ — $ —Commercial Systems 262 231 187Government Systems 421 381 382Information Management Services 9 9 9Total customer-funded 746 621 578
Company-funded: Interior Systems 112 — —Commercial Systems 143 143 182Government Systems 72 79 88Information Management Services (1) — 2 2Total company-funded 327 224 272
Total research and development expense $ 1,073 $ 845 $ 850
Percent of total sales 15.7% 16.1% 16.2%(1) R&D expenses for the Information Management Services segment do not include costs of internally developed software and other costs associated with the expansion and construction ofnetwork-related assets. These costs are capitalized as Property on the Consolidated Statement of Financial Position.
We make significant investments in research and development to allow our customers to benefit from the latest technological advancements. Total R&D expense iscomprised of both company-funded and customer-funded expenditures. In addition to the R&D expenditures shown in the table above, we capitalize in inventorythe cost of certain pre-production engineering effort incurred during the development phase of programs when the customer has provided us a long-term supplyarrangement and a contractual guarantee for reimbursement. Pre-production engineering costs are then amortized over their useful lives. This amortization cost isincluded within customer-funded R&D expense and totaled $59 million , $49 million and $47 million for 2017 , 2016 and 2015 , respectively. Refer to theResearch and Development section found in Item 1 and the Critical Accounting Policies section found in Item 7 below for further discussion of our incrementalinvestments in pre-production engineering effort.
Customer-funded R&D expenditures are incurred pursuant to contractual arrangements and are typically accounted for as contract costs within cost of sales, withthe reimbursement accounted for as a sale in accordance with the percentage-of-completion method of accounting.
Company-funded R&D expenditures relate to the development of new products and the improvement of existing products and are expensed as incurred andincluded in cost of sales, as disclosed in Note 2 of the Notes to Consolidated Financial Statements . Company-funded R&D expense consists primarily of payroll-related expenses of employees engaged in R&D activities, engineering-related product materials and equipment and subcontracting costs.
Total R&D expense increased $228 million from 2016 to 2017 . The customer-funded portion of R&D increased $125 million from 2016 to 2017 , primarily due to$54 million of customer-funded expenditure from the recently acquired B/E Aerospace business. In addition, customer-funded expenditures for GovernmentSystems increased $40 million due to fixed wing programs and Commercial Systems increased $31 million due to international regional jet programs and higheramortization of pre-production engineering costs. Company-funded R&D expenditures increased $103 million from 2016 to 2017 , primarily due to $112 million ofcompany-funded expenditure from the recently acquired B/E Aerospace business.
Total R&D expense decreased $5 million from 2015 to 2016 . The customer-funded portion of R&D increased $43 million from 2015 to 2016 , primarily due todevelopment expenditures in Commercial Systems for international regional jet programs. Company-funded R&D expenditures decreased $48 million from 2015to 2016 primarily due to lower business jet development costs in Commercial Systems as well as lower development costs for software-defined radio programs inGovernment Systems.
In addition to the R&D expenses above, development expenditures incurred on the Bombardier Global 7000/8000 and CSeries programs, the Boeing 737 MAXplatform, and certain military transport programs in 2017 resulted in a net $35 million increase to our investments in pre-production engineering programscapitalized within inventory. The net increase of $35 million for 2017 was $93 million less than the $128 million net increase in pre-production engineering costscapitalized within inventory
33
during 2016 , primarily due to lower costs incurred for the Boeing 737 MAX platform and a $10 million increase in amortization.
Development expenditures incurred on the Boeing 737 MAX platform, the Bombardier CSeries and Global 7000/8000 programs and certain military transportprogram in 2016 resulted in a net $128 million increase to our investments in pre-production engineering programs capitalized within inventory. The net increaseof $128 million for 2016 was $8 million less than the $136 million net increase in pre-production engineering costs capitalized within inventory during 2015 ,primarily due to lower costs incurred for the Bombardier CSeries program, partially offset by higher costs incurred for certain military transport programs inGovernment Systems and the Bombardier Global 7000/8000 program.
Refer to Note 6 of the Notes to Consolidated Financial Statements for further discussion of our incremental investments in pre-production engineering effort.
Selling, General and Administrative Expenses
(in millions) 2017 2016 2015Selling, general and administrative expenses $ 732 $ 638 $ 606Percent of total sales 10.7% 12.1% 11.6%
Selling, general and administrative (SG&A) expenses consist primarily of personnel, facility and other expenses related to employees not directly engaged inmanufacturing or R&D activities. These activities include marketing and business development, finance, legal, information technology and other administrativeand management functions.
Total SG&A expenses increased $94 million , or 15 percent , in 2017 compared to 2016 , primarily due to the following:
• $99 million of SG&A costs from the recently acquired B/E Aerospace business
• international customer bankruptcy and employee severance charges in 2017
• a $3 million increase in employee incentive compensation costs
• partially offset by $12 million of restructuring and asset impairment charges recorded in 2016 and the benefits of cost savings initiatives
Total SG&A expenses increased $32 million , or 5 percent , in 2016 compared to 2015 , primarily due to the following:
• $12 million of restructuring and asset impairment charges recorded in 2016
• higher costs from further expansion in international emerging markets
• incremental costs associated with the acquisitions of ICG and Pacific Avionics
Interest Expense
(in millions) 2017 2016 2015Interest expense $ 187 $ 64 $ 61
Interest expense increased by $123 million in 2017 compared to 2016 , primarily due to the following:
• $92 million of incremental interest on the new debt issued to fund the B/E Aerospace acquisition
• $29 million of fees incurred in 2017 associated with the bridge credit agreement entered into in December 2016 pursuant to the acquisition of B/EAerospace
Interest expense increased by $3 million in 2016 compared to 2015 , primarily due to higher interest rates on commercial paper borrowings in 2016. See Note 9 of the Notes to Consolidated Financial Statements in Item 8 below for more detail regarding outstanding debt.
34
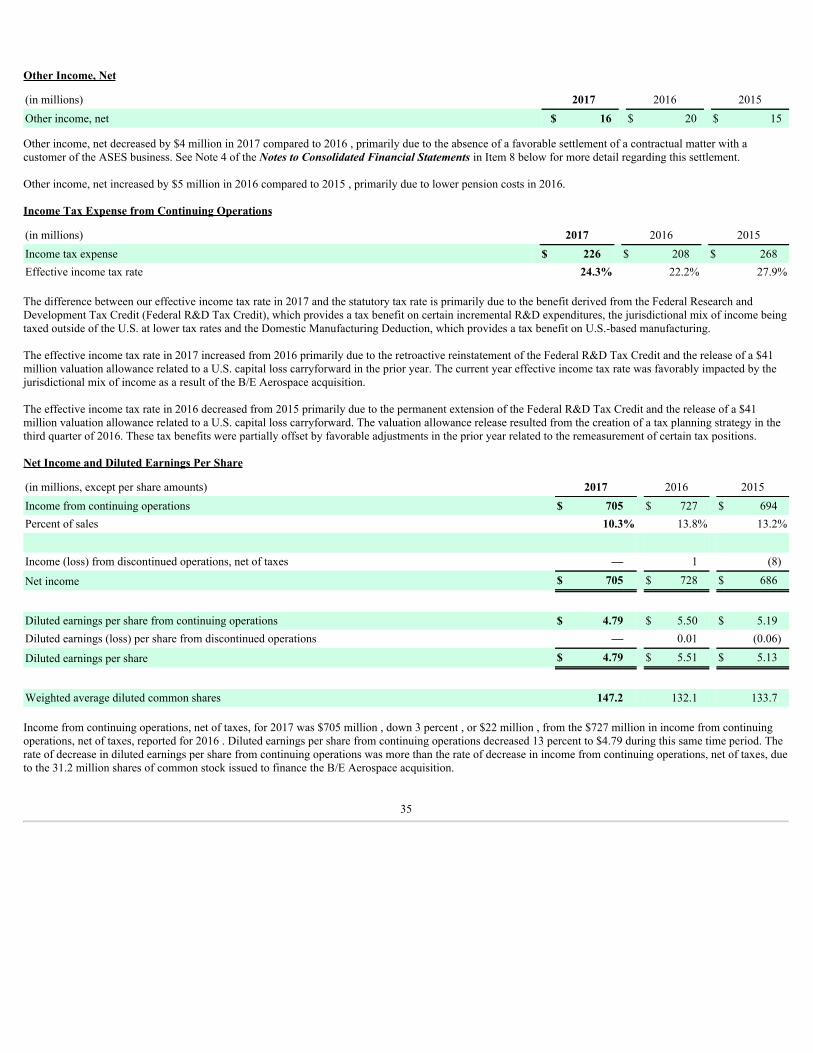
Other Income, Net
(in millions) 2017 2016 2015Other income, net $ 16 $ 20 $ 15
Other income, net decreased by $4 million in 2017 compared to 2016 , primarily due to the absence of a favorable settlement of a contractual matter with acustomer of the ASES business. See Note 4 of the Notes to Consolidated Financial Statements in Item 8 below for more detail regarding this settlement.
Other income, net increased by $5 million in 2016 compared to 2015 , primarily due to lower pension costs in 2016.
Income Tax Expense from Continuing Operations
(in millions) 2017 2016 2015Income tax expense $ 226 $ 208 $ 268Effective income tax rate 24.3% 22.2% 27.9%
The difference between our effective income tax rate in 2017 and the statutory tax rate is primarily due to the benefit derived from the Federal Research andDevelopment Tax Credit (Federal R&D Tax Credit), which provides a tax benefit on certain incremental R&D expenditures, the jurisdictional mix of income beingtaxed outside of the U.S. at lower tax rates and the Domestic Manufacturing Deduction, which provides a tax benefit on U.S.-based manufacturing.
The effective income tax rate in 2017 increased from 2016 primarily due to the retroactive reinstatement of the Federal R&D Tax Credit and the release of a $41million valuation allowance related to a U.S. capital loss carryforward in the prior year. The current year effective income tax rate was favorably impacted by thejurisdictional mix of income as a result of the B/E Aerospace acquisition. The effective income tax rate in 2016 decreased from 2015 primarily due to the permanent extension of the Federal R&D Tax Credit and the release of a $41million valuation allowance related to a U.S. capital loss carryforward. The valuation allowance release resulted from the creation of a tax planning strategy in thethird quarter of 2016. These tax benefits were partially offset by favorable adjustments in the prior year related to the remeasurement of certain tax positions.
Net Income and Diluted Earnings Per Share
(in millions, except per share amounts) 2017 2016 2015Income from continuing operations $ 705 $ 727 $ 694Percent of sales 10.3% 13.8% 13.2%
Income (loss) from discontinued operations, net of taxes — 1 (8)
Net income $ 705 $ 728 $ 686
Diluted earnings per share from continuing operations $ 4.79 $ 5.50 $ 5.19Diluted earnings (loss) per share from discontinued operations — 0.01 (0.06)
Diluted earnings per share $ 4.79 $ 5.51 $ 5.13
Weighted average diluted common shares 147.2 132.1 133.7
Income from continuing operations, net of taxes, for 2017 was $705 million , down 3 percent , or $22 million , from the $727 million in income from continuingoperations, net of taxes, reported for 2016 . Diluted earnings per share from continuing operations decreased 13 percent to $4.79 during this same time period. Therate of decrease in diluted earnings per share from continuing operations was more than the rate of decrease in income from continuing operations, net of taxes, dueto the 31.2 million shares of common stock issued to finance the B/E Aerospace acquisition.
35
Income from continuing operations, net of taxes, and diluted earnings per share from continuing operations in 2017 decreased primarily due to:
• $125 million of pre-tax transaction, integration and financing costs associated with the acquisition of B/E Aerospace
• $92 million of incremental interest expense on the new debt issued to fund the B/E Aerospace acquisition
• $24 million of pre-tax transaction costs associated with the pending acquisition of Rockwell Collins by UTC
• an $18 million increase in income tax expense as detailed in the Income Tax Expense from Continuing Operations section above
• partially offset by a $174 million increase in operating earnings from the recently acquired Interior Systems business, a $30 million increase inInformation Management Services operating earnings and a $19 million increase in Government Systems operating earnings, net of a $12 milliondecrease in Commercial Systems operating earnings
• also offset by the absence of $45 million of pre-tax restructuring and asset impairment charges recorded in 2016
Income from continuing operations, net of taxes, for 2016 was $727 million , up 5 percent , or $33 million , from the $694 million in income from continuingoperations, net of taxes, reported for 2015 . Diluted earnings per share from continuing operations increased 6 percent to $5.50 during this same time period. Therate of increase in diluted earnings per share from continuing operations was more than the rate of increase in income from continuing operations, net of taxes,because of the favorable impacts from our share repurchase program.
Income from continuing operations, net of taxes, and diluted earnings per share from continuing operations in 2016 increased primarily due to:
• a $60 million decrease in income tax expense primarily due to the release of a valuation allowance for a U.S. capital loss carryforward, the retroactivereinstatement of the Federal R&D Tax Credit and lower pre-tax income from continuing operations
• a total segment operating earnings increase of $9 million as operating earnings increased $20 million in Government Systems and $12 million inInformation Management Services, partially offset by a $23 million decrease in Commercial Systems
• partially offset by $45 million of pre-tax restructuring and asset impairment charges recorded in 2016
Segment Financial Results
One of the key metrics we use to describe year-over-year changes in operating income for each segment is the incremental (or reduced) earnings derived fromhigher (or lower) sales volumes. Similarly, the gross margin derived from these incremental (or reduced) earnings is often used to describe changes in segmentoperating margins. The incremental (or reduced) margin realized on the sales volume change tends to be disproportionately higher than the overall operatingmargin reported for the segment. This is because the overall operating margin for the segment contemplates more elements of our cost structure, such as company-funded R&D expense, depreciation, amortization and selling, general and administrative expenses.
Interior Systems
Overview
On April 13, 2017, we acquired B/E Aerospace and formed the new Interior Systems business segment, in which the sales and earnings of the acquired business arereported. See Note 3 of the Notes to Consolidated Financial Statements for more information regarding the acquisition.
The Interior Systems business manufactures cabin interior products for the commercial aircraft and business aviation markets. We sell our products and provide ourservices directly to virtually all of the world’s major airlines and aerospace manufacturers. We have achieved a leading global market position in each of our majorproduct categories, which include:
36
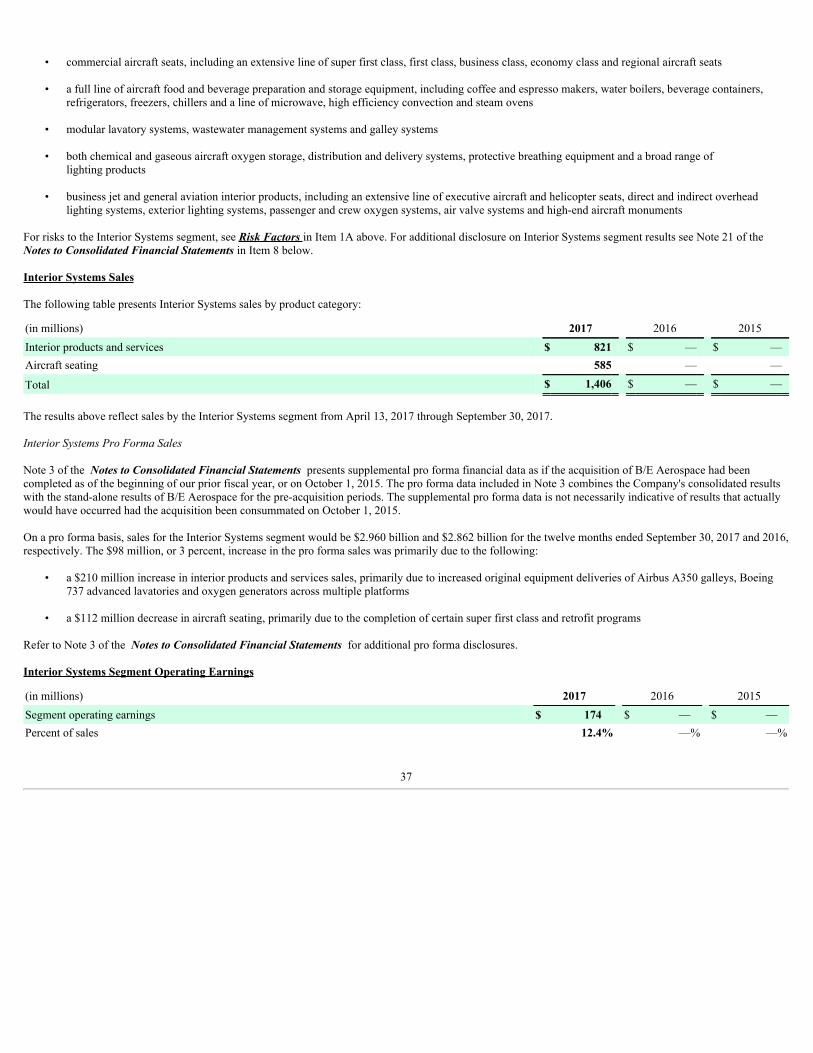
• commercial aircraft seats, including an extensive line of super first class, first class, business class, economy class and regional aircraft seats
• a full line of aircraft food and beverage preparation and storage equipment, including coffee and espresso makers, water boilers, beverage containers,refrigerators, freezers, chillers and a line of microwave, high efficiency convection and steam ovens
• modular lavatory systems, wastewater management systems and galley systems
• both chemical and gaseous aircraft oxygen storage, distribution and delivery systems, protective breathing equipment and a broad range oflighting products
• business jet and general aviation interior products, including an extensive line of executive aircraft and helicopter seats, direct and indirect overheadlighting systems, exterior lighting systems, passenger and crew oxygen systems, air valve systems and high-end aircraft monuments
For risks to the Interior Systems segment, see Risk Factors in Item 1A above. For additional disclosure on Interior Systems segment results see Note 21 of theNotes to Consolidated Financial Statements in Item 8 below.
Interior Systems Sales
The following table presents Interior Systems sales by product category:
(in millions) 2017 2016 2015Interior products and services $ 821 $ — $ —Aircraft seating 585 — —
Total $ 1,406 $ — $ —
The results above reflect sales by the Interior Systems segment from April 13, 2017 through September 30, 2017.
InteriorSystemsProFormaSales
Note 3 of the Notes to Consolidated Financial Statements presents supplemental pro forma financial data as if the acquisition of B/E Aerospace had beencompleted as of the beginning of our prior fiscal year, or on October 1, 2015. The pro forma data included in Note 3 combines the Company's consolidated resultswith the stand-alone results of B/E Aerospace for the pre-acquisition periods. The supplemental pro forma data is not necessarily indicative of results that actuallywould have occurred had the acquisition been consummated on October 1, 2015.
On a pro forma basis, sales for the Interior Systems segment would be $2.960 billion and $2.862 billion for the twelve months ended September 30, 2017 and 2016,respectively. The $98 million, or 3 percent, increase in the pro forma sales was primarily due to the following:
• a $210 million increase in interior products and services sales, primarily due to increased original equipment deliveries of Airbus A350 galleys, Boeing737 advanced lavatories and oxygen generators across multiple platforms
• a $112 million decrease in aircraft seating, primarily due to the completion of certain super first class and retrofit programs
Refer to Note 3 of the Notes to Consolidated Financial Statements for additional pro forma disclosures.
Interior Systems Segment Operating Earnings
(in millions) 2017 2016 2015Segment operating earnings $ 174 $ — $ —Percent of sales 12.4% —% —%
37
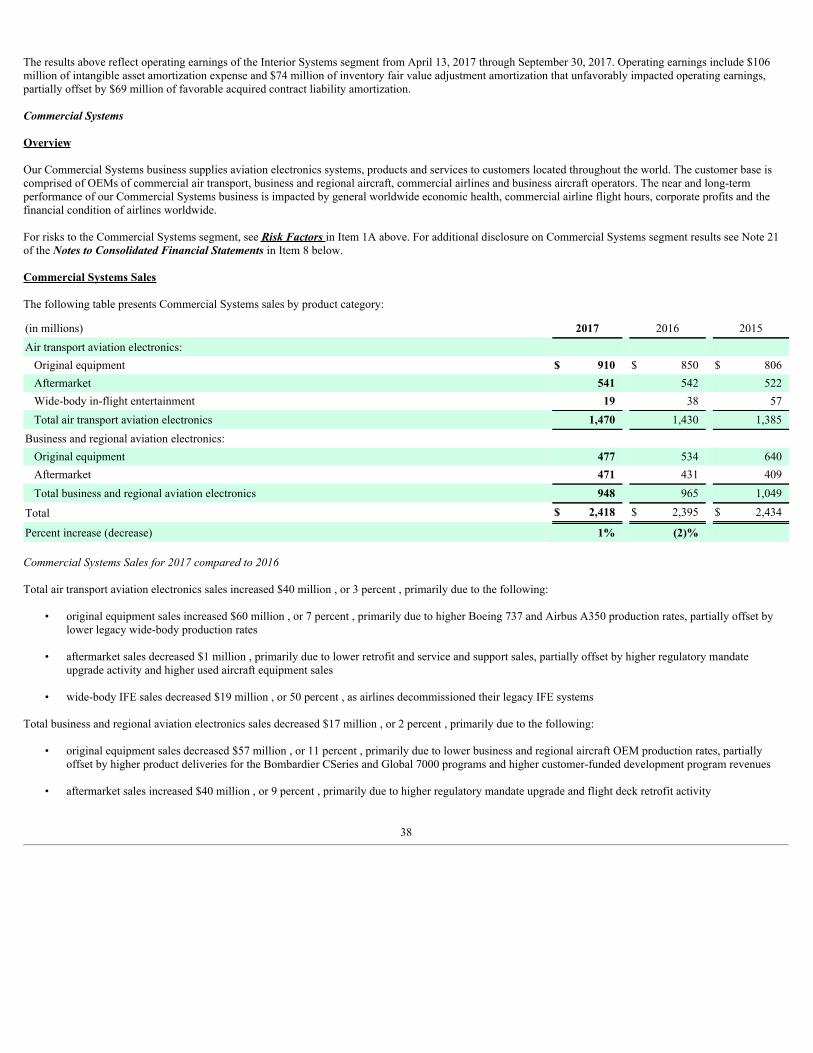
The results above reflect operating earnings of the Interior Systems segment from April 13, 2017 through September 30, 2017. Operating earnings include $106million of intangible asset amortization expense and $74 million of inventory fair value adjustment amortization that unfavorably impacted operating earnings,partially offset by $69 million of favorable acquired contract liability amortization.
Commercial Systems
Overview
Our Commercial Systems business supplies aviation electronics systems, products and services to customers located throughout the world. The customer base iscomprised of OEMs of commercial air transport, business and regional aircraft, commercial airlines and business aircraft operators. The near and long-termperformance of our Commercial Systems business is impacted by general worldwide economic health, commercial airline flight hours, corporate profits and thefinancial condition of airlines worldwide.
For risks to the Commercial Systems segment, see Risk Factors in Item 1A above. For additional disclosure on Commercial Systems segment results see Note 21of the Notes to Consolidated Financial Statements in Item 8 below.
Commercial Systems Sales
The following table presents Commercial Systems sales by product category:
(in millions) 2017 2016 2015Air transport aviation electronics:
Original equipment $ 910 $ 850 $ 806Aftermarket 541 542 522Wide-body in-flight entertainment 19 38 57Total air transport aviation electronics 1,470 1,430 1,385
Business and regional aviation electronics: Original equipment 477 534 640Aftermarket 471 431 409Total business and regional aviation electronics 948 965 1,049
Total $ 2,418 $ 2,395 $ 2,434
Percent increase (decrease) 1% (2)%
CommercialSystemsSalesfor2017comparedto2016
Total air transport aviation electronics sales increased $40 million , or 3 percent , primarily due to the following:
• original equipment sales increased $60 million , or 7 percent , primarily due to higher Boeing 737 and Airbus A350 production rates, partially offset bylower legacy wide-body production rates
• aftermarket sales decreased $1 million , primarily due to lower retrofit and service and support sales, partially offset by higher regulatory mandateupgrade activity and higher used aircraft equipment sales
• wide-body IFE sales decreased $19 million , or 50 percent , as airlines decommissioned their legacy IFE systems
Total business and regional aviation electronics sales decreased $17 million , or 2 percent , primarily due to the following:
• original equipment sales decreased $57 million , or 11 percent , primarily due to lower business and regional aircraft OEM production rates, partiallyoffset by higher product deliveries for the Bombardier CSeries and Global 7000 programs and higher customer-funded development program revenues
• aftermarket sales increased $40 million , or 9 percent , primarily due to higher regulatory mandate upgrade and flight deck retrofit activity
38
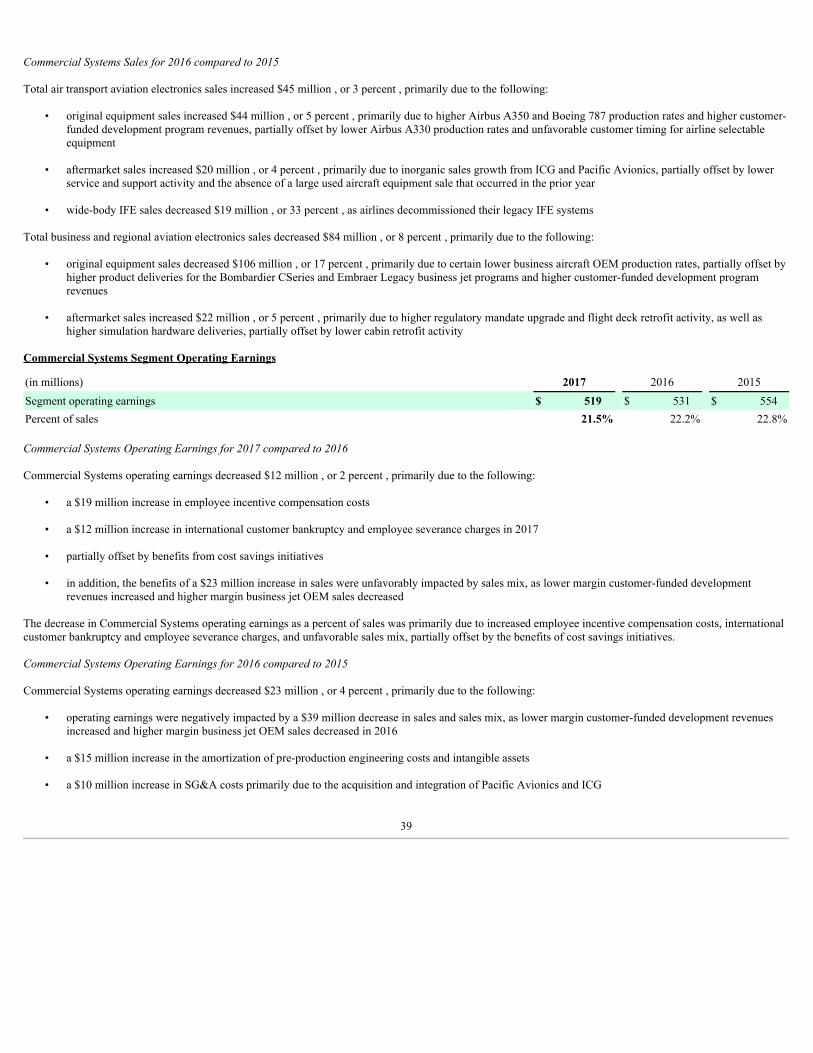
CommercialSystemsSalesfor2016comparedto2015
Total air transport aviation electronics sales increased $45 million , or 3 percent , primarily due to the following:
• original equipment sales increased $44 million , or 5 percent , primarily due to higher Airbus A350 and Boeing 787 production rates and higher customer-funded development program revenues, partially offset by lower Airbus A330 production rates and unfavorable customer timing for airline selectableequipment
• aftermarket sales increased $20 million , or 4 percent , primarily due to inorganic sales growth from ICG and Pacific Avionics, partially offset by lowerservice and support activity and the absence of a large used aircraft equipment sale that occurred in the prior year
• wide-body IFE sales decreased $19 million , or 33 percent , as airlines decommissioned their legacy IFE systems
Total business and regional aviation electronics sales decreased $84 million , or 8 percent , primarily due to the following:
• original equipment sales decreased $106 million , or 17 percent , primarily due to certain lower business aircraft OEM production rates, partially offset byhigher product deliveries for the Bombardier CSeries and Embraer Legacy business jet programs and higher customer-funded development programrevenues
• aftermarket sales increased $22 million , or 5 percent , primarily due to higher regulatory mandate upgrade and flight deck retrofit activity, as well ashigher simulation hardware deliveries, partially offset by lower cabin retrofit activity
Commercial Systems Segment Operating Earnings
(in millions) 2017 2016 2015Segment operating earnings $ 519 $ 531 $ 554Percent of sales 21.5% 22.2% 22.8%
CommercialSystemsOperatingEarningsfor2017comparedto2016
Commercial Systems operating earnings decreased $12 million , or 2 percent , primarily due to the following:
• a $19 million increase in employee incentive compensation costs
• a $12 million increase in international customer bankruptcy and employee severance charges in 2017
• partially offset by benefits from cost savings initiatives
• in addition, the benefits of a $23 million increase in sales were unfavorably impacted by sales mix, as lower margin customer-funded developmentrevenues increased and higher margin business jet OEM sales decreased
The decrease in Commercial Systems operating earnings as a percent of sales was primarily due to increased employee incentive compensation costs, internationalcustomer bankruptcy and employee severance charges, and unfavorable sales mix, partially offset by the benefits of cost savings initiatives.
CommercialSystemsOperatingEarningsfor2016comparedto2015
Commercial Systems operating earnings decreased $23 million , or 4 percent , primarily due to the following:
• operating earnings were negatively impacted by a $39 million decrease in sales and sales mix, as lower margin customer-funded development revenuesincreased and higher margin business jet OEM sales decreased in 2016
• a $15 million increase in the amortization of pre-production engineering costs and intangible assets
• a $10 million increase in SG&A costs primarily due to the acquisition and integration of Pacific Avionics and ICG
39
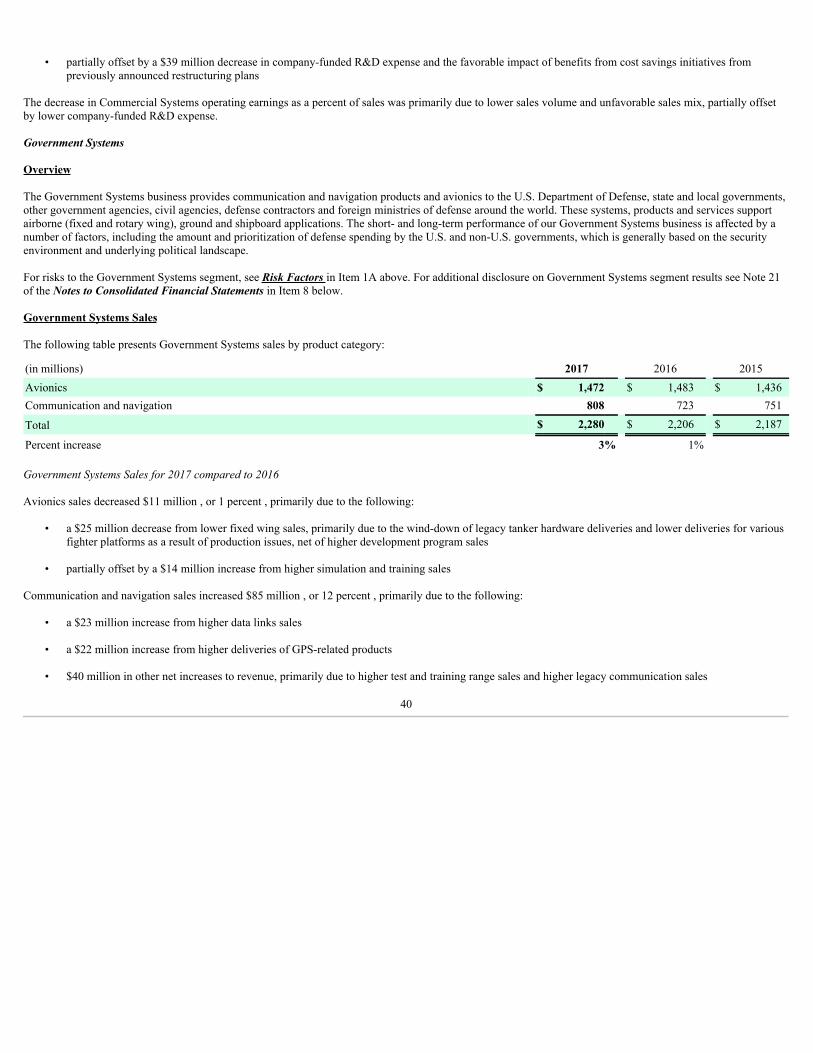
• partially offset by a $39 million decrease in company-funded R&D expense and the favorable impact of benefits from cost savings initiatives frompreviously announced restructuring plans
The decrease in Commercial Systems operating earnings as a percent of sales was primarily due to lower sales volume and unfavorable sales mix, partially offsetby lower company-funded R&D expense.
Government Systems
Overview
The Government Systems business provides communication and navigation products and avionics to the U.S. Department of Defense, state and local governments,other government agencies, civil agencies, defense contractors and foreign ministries of defense around the world. These systems, products and services supportairborne (fixed and rotary wing), ground and shipboard applications. The short- and long-term performance of our Government Systems business is affected by anumber of factors, including the amount and prioritization of defense spending by the U.S. and non-U.S. governments, which is generally based on the securityenvironment and underlying political landscape.
For risks to the Government Systems segment, see Risk Factors in Item 1A above. For additional disclosure on Government Systems segment results see Note 21of the Notes to Consolidated Financial Statements in Item 8 below.
Government Systems Sales
The following table presents Government Systems sales by product category:
(in millions) 2017 2016 2015Avionics $ 1,472 $ 1,483 $ 1,436Communication and navigation 808 723 751
Total $ 2,280 $ 2,206 $ 2,187
Percent increase 3% 1%
GovernmentSystemsSalesfor2017comparedto2016
Avionics sales decreased $11 million , or 1 percent , primarily due to the following:
• a $25 million decrease from lower fixed wing sales, primarily due to the wind-down of legacy tanker hardware deliveries and lower deliveries for variousfighter platforms as a result of production issues, net of higher development program sales
• partially offset by a $14 million increase from higher simulation and training sales
Communication and navigation sales increased $85 million , or 12 percent , primarily due to the following:
• a $23 million increase from higher data links sales
• a $22 million increase from higher deliveries of GPS-related products
• $40 million in other net increases to revenue, primarily due to higher test and training range sales and higher legacy communication sales
40
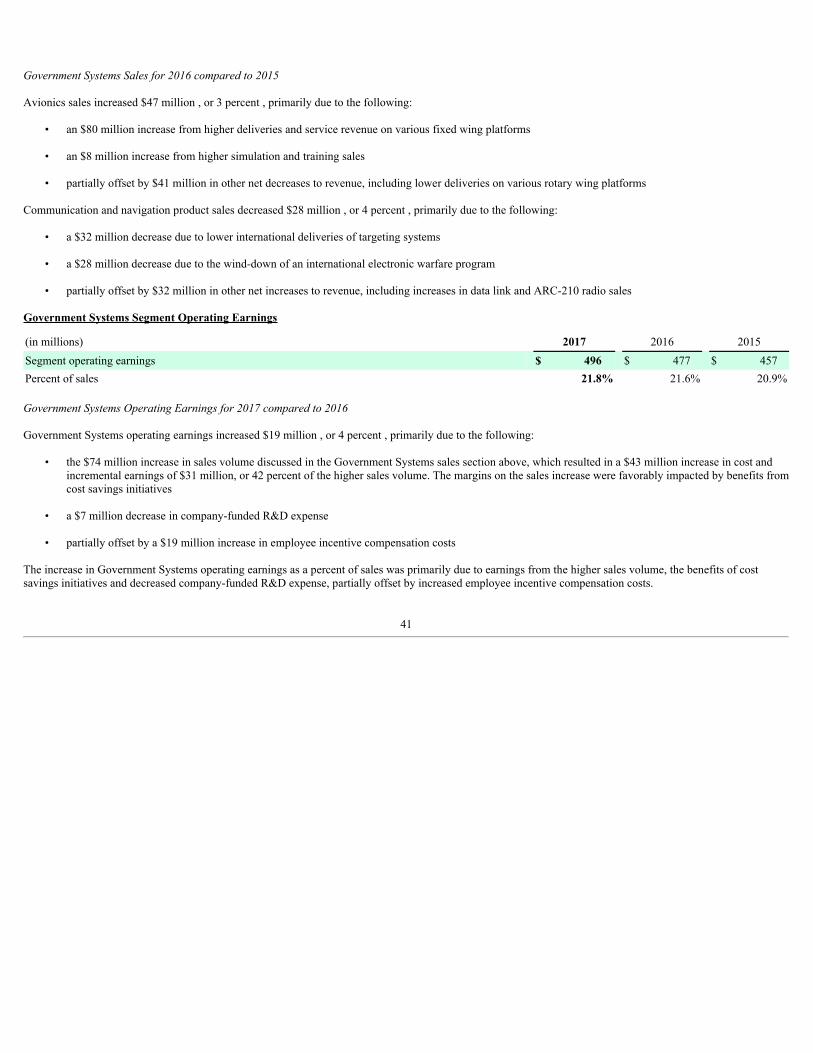
GovernmentSystemsSalesfor2016comparedto2015
Avionics sales increased $47 million , or 3 percent , primarily due to the following:
• an $80 million increase from higher deliveries and service revenue on various fixed wing platforms
• an $8 million increase from higher simulation and training sales
• partially offset by $41 million in other net decreases to revenue, including lower deliveries on various rotary wing platforms
Communication and navigation product sales decreased $28 million , or 4 percent , primarily due to the following:
• a $32 million decrease due to lower international deliveries of targeting systems
• a $28 million decrease due to the wind-down of an international electronic warfare program
• partially offset by $32 million in other net increases to revenue, including increases in data link and ARC-210 radio sales
Government Systems Segment Operating Earnings
(in millions) 2017 2016 2015Segment operating earnings $ 496 $ 477 $ 457Percent of sales 21.8% 21.6% 20.9%
GovernmentSystemsOperatingEarningsfor2017comparedto2016
Government Systems operating earnings increased $19 million , or 4 percent , primarily due to the following:
• the $74 million increase in sales volume discussed in the Government Systems sales section above, which resulted in a $43 million increase in cost andincremental earnings of $31 million, or 42 percent of the higher sales volume. The margins on the sales increase were favorably impacted by benefits fromcost savings initiatives
• a $7 million decrease in company-funded R&D expense
• partially offset by a $19 million increase in employee incentive compensation costs
The increase in Government Systems operating earnings as a percent of sales was primarily due to earnings from the higher sales volume, the benefits of costsavings initiatives and decreased company-funded R&D expense, partially offset by increased employee incentive compensation costs.
41
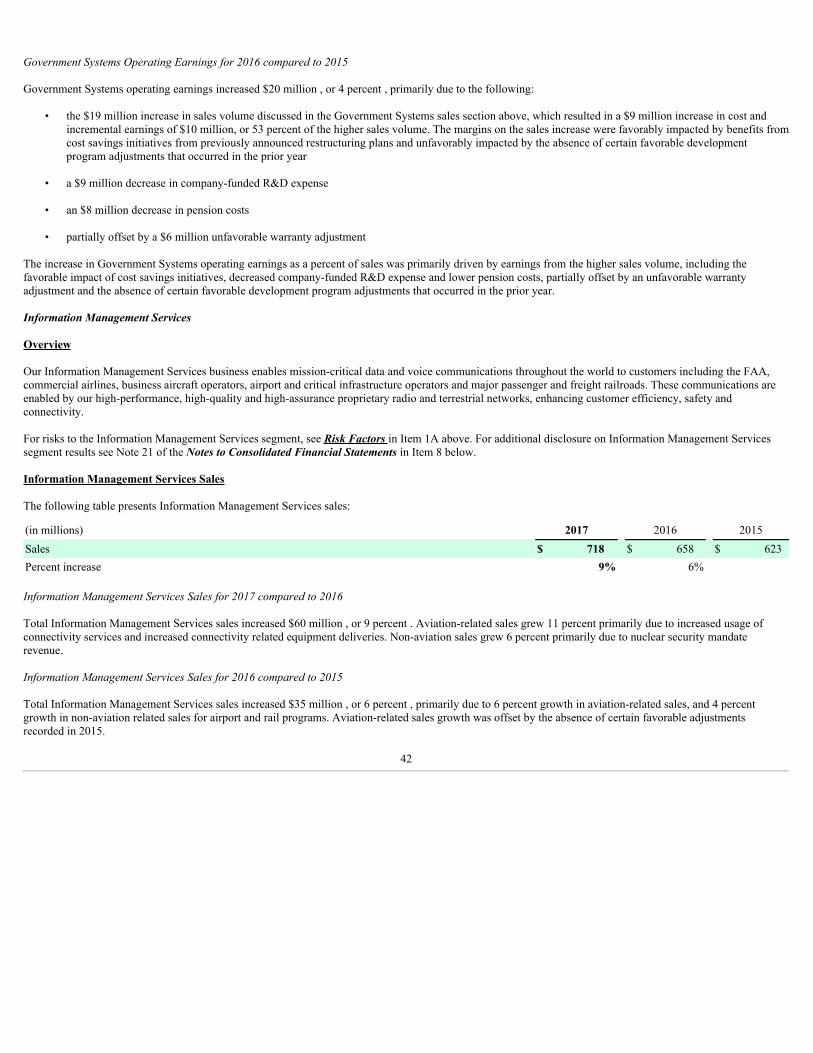
GovernmentSystemsOperatingEarningsfor2016comparedto2015
Government Systems operating earnings increased $20 million , or 4 percent , primarily due to the following:
• the $19 million increase in sales volume discussed in the Government Systems sales section above, which resulted in a $9 million increase in cost andincremental earnings of $10 million, or 53 percent of the higher sales volume. The margins on the sales increase were favorably impacted by benefits fromcost savings initiatives from previously announced restructuring plans and unfavorably impacted by the absence of certain favorable developmentprogram adjustments that occurred in the prior year
• a $9 million decrease in company-funded R&D expense
• an $8 million decrease in pension costs
• partially offset by a $6 million unfavorable warranty adjustment
The increase in Government Systems operating earnings as a percent of sales was primarily driven by earnings from the higher sales volume, including thefavorable impact of cost savings initiatives, decreased company-funded R&D expense and lower pension costs, partially offset by an unfavorable warrantyadjustment and the absence of certain favorable development program adjustments that occurred in the prior year.
Information Management Services
Overview
Our Information Management Services business enables mission-critical data and voice communications throughout the world to customers including the FAA,commercial airlines, business aircraft operators, airport and critical infrastructure operators and major passenger and freight railroads. These communications areenabled by our high-performance, high-quality and high-assurance proprietary radio and terrestrial networks, enhancing customer efficiency, safety andconnectivity.
For risks to the Information Management Services segment, see Risk Factors in Item 1A above. For additional disclosure on Information Management Servicessegment results see Note 21 of the Notes to Consolidated Financial Statements in Item 8 below.
Information Management Services Sales
The following table presents Information Management Services sales:
(in millions) 2017 2016 2015Sales $ 718 $ 658 $ 623Percent increase 9% 6%
InformationManagementServicesSalesfor2017comparedto2016
Total Information Management Services sales increased $60 million , or 9 percent . Aviation-related sales grew 11 percent primarily due to increased usage ofconnectivity services and increased connectivity related equipment deliveries. Non-aviation sales grew 6 percent primarily due to nuclear security mandaterevenue.
InformationManagementServicesSalesfor2016comparedto2015
Total Information Management Services sales increased $35 million , or 6 percent , primarily due to 6 percent growth in aviation-related sales, and 4 percentgrowth in non-aviation related sales for airport and rail programs. Aviation-related sales growth was offset by the absence of certain favorable adjustmentsrecorded in 2015.
42
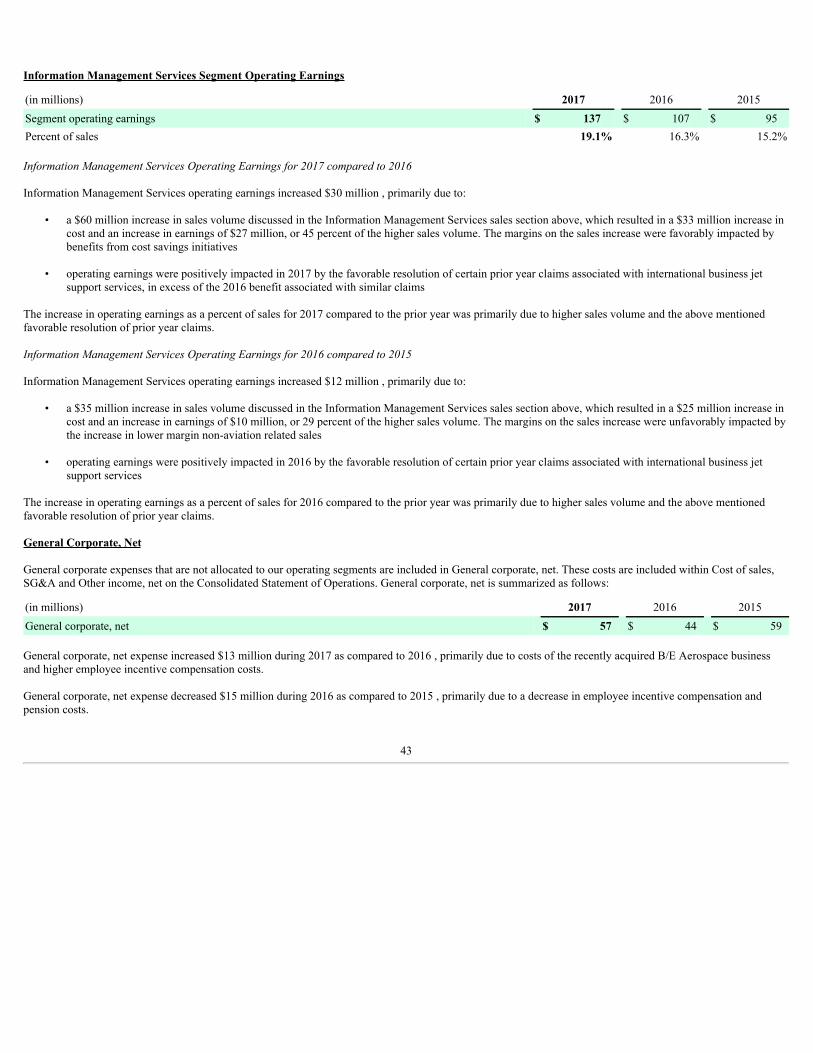
Information Management Services Segment Operating Earnings
(in millions) 2017 2016 2015Segment operating earnings $ 137 $ 107 $ 95Percent of sales 19.1% 16.3% 15.2%
InformationManagementServicesOperatingEarningsfor2017comparedto2016
Information Management Services operating earnings increased $30 million , primarily due to:
• a $60 million increase in sales volume discussed in the Information Management Services sales section above, which resulted in a $33 million increase incost and an increase in earnings of $27 million, or 45 percent of the higher sales volume. The margins on the sales increase were favorably impacted bybenefits from cost savings initiatives
• operating earnings were positively impacted in 2017 by the favorable resolution of certain prior year claims associated with international business jetsupport services, in excess of the 2016 benefit associated with similar claims
The increase in operating earnings as a percent of sales for 2017 compared to the prior year was primarily due to higher sales volume and the above mentionedfavorable resolution of prior year claims.
InformationManagementServicesOperatingEarningsfor2016comparedto2015
Information Management Services operating earnings increased $12 million , primarily due to:
• a $35 million increase in sales volume discussed in the Information Management Services sales section above, which resulted in a $25 million increase incost and an increase in earnings of $10 million, or 29 percent of the higher sales volume. The margins on the sales increase were unfavorably impacted bythe increase in lower margin non-aviation related sales
• operating earnings were positively impacted in 2016 by the favorable resolution of certain prior year claims associated with international business jetsupport services
The increase in operating earnings as a percent of sales for 2016 compared to the prior year was primarily due to higher sales volume and the above mentionedfavorable resolution of prior year claims.
General Corporate, Net General corporate expenses that are not allocated to our operating segments are included in General corporate, net. These costs are included within Cost of sales,SG&A and Other income, net on the Consolidated Statement of Operations. General corporate, net is summarized as follows:
(in millions) 2017 2016 2015General corporate, net $ 57 $ 44 $ 59
General corporate, net expense increased $13 million during 2017 as compared to 2016 , primarily due to costs of the recently acquired B/E Aerospace businessand higher employee incentive compensation costs.
General corporate, net expense decreased $15 million during 2016 as compared to 2015 , primarily due to a decrease in employee incentive compensation andpension costs.
43
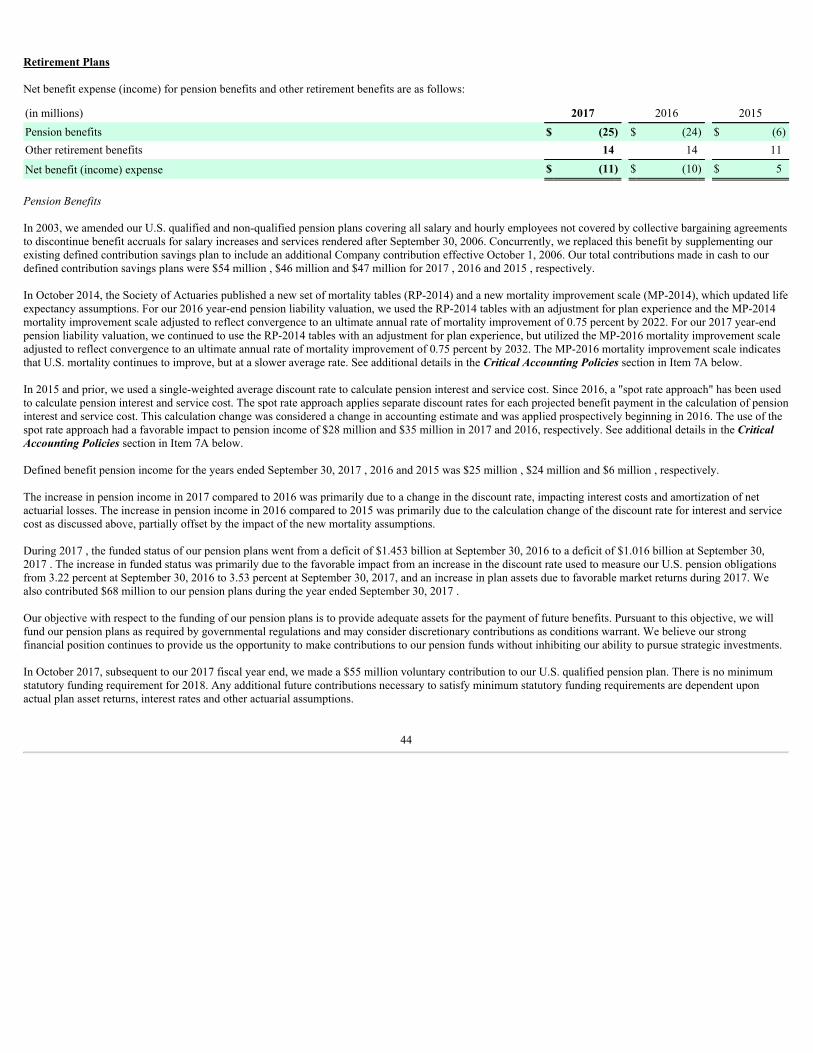
Retirement Plans
Net benefit expense (income) for pension benefits and other retirement benefits are as follows:
(in millions) 2017 2016 2015Pension benefits $ (25) $ (24) $ (6)Other retirement benefits 14 14 11
Net benefit (income) expense $ (11) $ (10) $ 5
PensionBenefits
In 2003, we amended our U.S. qualified and non-qualified pension plans covering all salary and hourly employees not covered by collective bargaining agreementsto discontinue benefit accruals for salary increases and services rendered after September 30, 2006. Concurrently, we replaced this benefit by supplementing ourexisting defined contribution savings plan to include an additional Company contribution effective October 1, 2006. Our total contributions made in cash to ourdefined contribution savings plans were $54 million , $46 million and $47 million for 2017 , 2016 and 2015 , respectively.
In October 2014, the Society of Actuaries published a new set of mortality tables (RP-2014) and a new mortality improvement scale (MP-2014), which updated lifeexpectancy assumptions. For our 2016 year-end pension liability valuation, we used the RP-2014 tables with an adjustment for plan experience and the MP-2014mortality improvement scale adjusted to reflect convergence to an ultimate annual rate of mortality improvement of 0.75 percent by 2022. For our 2017 year-endpension liability valuation, we continued to use the RP-2014 tables with an adjustment for plan experience, but utilized the MP-2016 mortality improvement scaleadjusted to reflect convergence to an ultimate annual rate of mortality improvement of 0.75 percent by 2032. The MP-2016 mortality improvement scale indicatesthat U.S. mortality continues to improve, but at a slower average rate. See additional details in the Critical Accounting Policies section in Item 7A below.
In 2015 and prior, we used a single-weighted average discount rate to calculate pension interest and service cost. Since 2016, a "spot rate approach" has been usedto calculate pension interest and service cost. The spot rate approach applies separate discount rates for each projected benefit payment in the calculation of pensioninterest and service cost. This calculation change was considered a change in accounting estimate and was applied prospectively beginning in 2016. The use of thespot rate approach had a favorable impact to pension income of $28 million and $35 million in 2017 and 2016, respectively. See additional details in the CriticalAccounting Policies section in Item 7A below.
Defined benefit pension income for the years ended September 30, 2017 , 2016 and 2015 was $25 million , $24 million and $6 million , respectively.
The increase in pension income in 2017 compared to 2016 was primarily due to a change in the discount rate, impacting interest costs and amortization of netactuarial losses. The increase in pension income in 2016 compared to 2015 was primarily due to the calculation change of the discount rate for interest and servicecost as discussed above, partially offset by the impact of the new mortality assumptions.
During 2017 , the funded status of our pension plans went from a deficit of $1.453 billion at September 30, 2016 to a deficit of $1.016 billion at September 30,2017 . The increase in funded status was primarily due to the favorable impact from an increase in the discount rate used to measure our U.S. pension obligationsfrom 3.22 percent at September 30, 2016 to 3.53 percent at September 30, 2017, and an increase in plan assets due to favorable market returns during 2017. Wealso contributed $68 million to our pension plans during the year ended September 30, 2017 .
Our objective with respect to the funding of our pension plans is to provide adequate assets for the payment of future benefits. Pursuant to this objective, we willfund our pension plans as required by governmental regulations and may consider discretionary contributions as conditions warrant. We believe our strongfinancial position continues to provide us the opportunity to make contributions to our pension funds without inhibiting our ability to pursue strategic investments.
In October 2017, subsequent to our 2017 fiscal year end, we made a $55 million voluntary contribution to our U.S. qualified pension plan. There is no minimumstatutory funding requirement for 2018. Any additional future contributions necessary to satisfy minimum statutory funding requirements are dependent uponactual plan asset returns, interest rates and other actuarial assumptions.
44
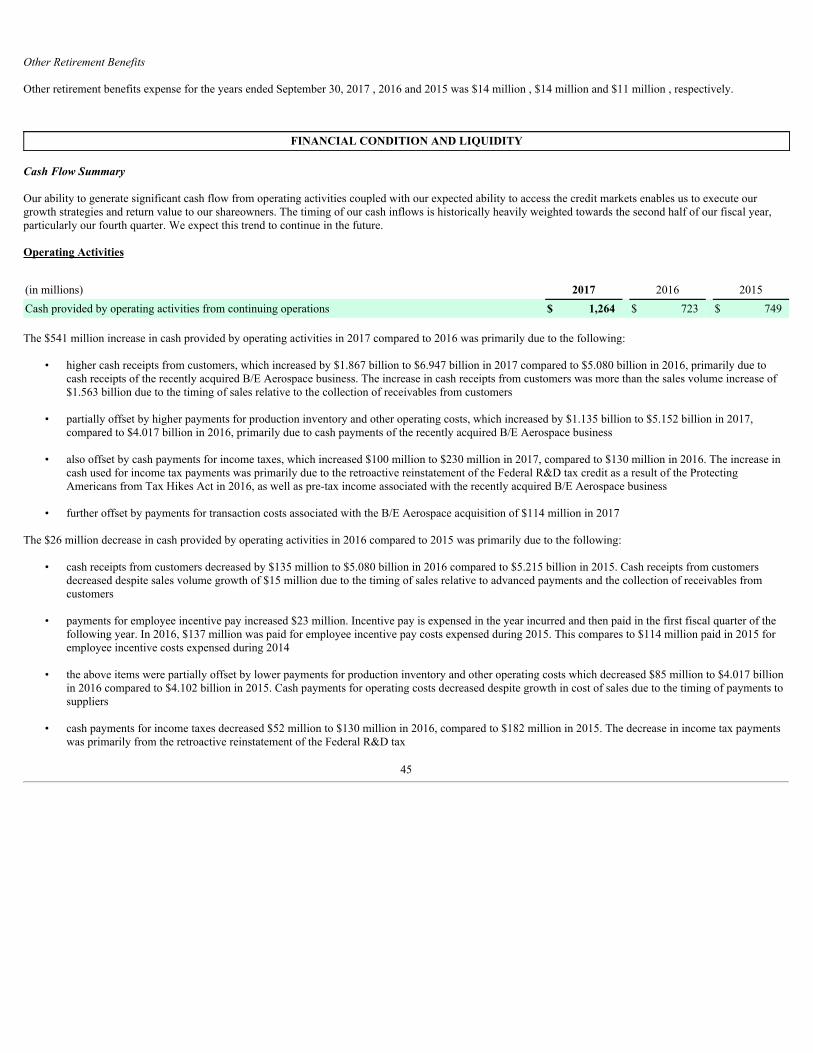
OtherRetirementBenefits
Other retirement benefits expense for the years ended September 30, 2017 , 2016 and 2015 was $14 million , $14 million and $11 million , respectively.
FINANCIAL CONDITION AND LIQUIDITY
Cash Flow Summary
Our ability to generate significant cash flow from operating activities coupled with our expected ability to access the credit markets enables us to execute ourgrowth strategies and return value to our shareowners. The timing of our cash inflows is historically heavily weighted towards the second half of our fiscal year,particularly our fourth quarter. We expect this trend to continue in the future.
Operating Activities
(in millions) 2017 2016 2015Cash provided by operating activities from continuing operations $ 1,264 $ 723 $ 749
The $541 million increase in cash provided by operating activities in 2017 compared to 2016 was primarily due to the following:
• higher cash receipts from customers, which increased by $1.867 billion to $6.947 billion in 2017 compared to $5.080 billion in 2016, primarily due tocash receipts of the recently acquired B/E Aerospace business. The increase in cash receipts from customers was more than the sales volume increase of$1.563 billion due to the timing of sales relative to the collection of receivables from customers
• partially offset by higher payments for production inventory and other operating costs, which increased by $1.135 billion to $5.152 billion in 2017,compared to $4.017 billion in 2016, primarily due to cash payments of the recently acquired B/E Aerospace business
• also offset by cash payments for income taxes, which increased $100 million to $230 million in 2017, compared to $130 million in 2016. The increase incash used for income tax payments was primarily due to the retroactive reinstatement of the Federal R&D tax credit as a result of the ProtectingAmericans from Tax Hikes Act in 2016, as well as pre-tax income associated with the recently acquired B/E Aerospace business
• further offset by payments for transaction costs associated with the B/E Aerospace acquisition of $114 million in 2017
The $26 million decrease in cash provided by operating activities in 2016 compared to 2015 was primarily due to the following:
• cash receipts from customers decreased by $135 million to $5.080 billion in 2016 compared to $5.215 billion in 2015. Cash receipts from customersdecreased despite sales volume growth of $15 million due to the timing of sales relative to advanced payments and the collection of receivables fromcustomers
• payments for employee incentive pay increased $23 million. Incentive pay is expensed in the year incurred and then paid in the first fiscal quarter of thefollowing year. In 2016, $137 million was paid for employee incentive pay costs expensed during 2015. This compares to $114 million paid in 2015 foremployee incentive costs expensed during 2014
• the above items were partially offset by lower payments for production inventory and other operating costs which decreased $85 million to $4.017 billionin 2016 compared to $4.102 billion in 2015. Cash payments for operating costs decreased despite growth in cost of sales due to the timing of payments tosuppliers
• cash payments for income taxes decreased $52 million to $130 million in 2016, compared to $182 million in 2015. The decrease in income tax paymentswas primarily from the retroactive reinstatement of the Federal R&D tax
45
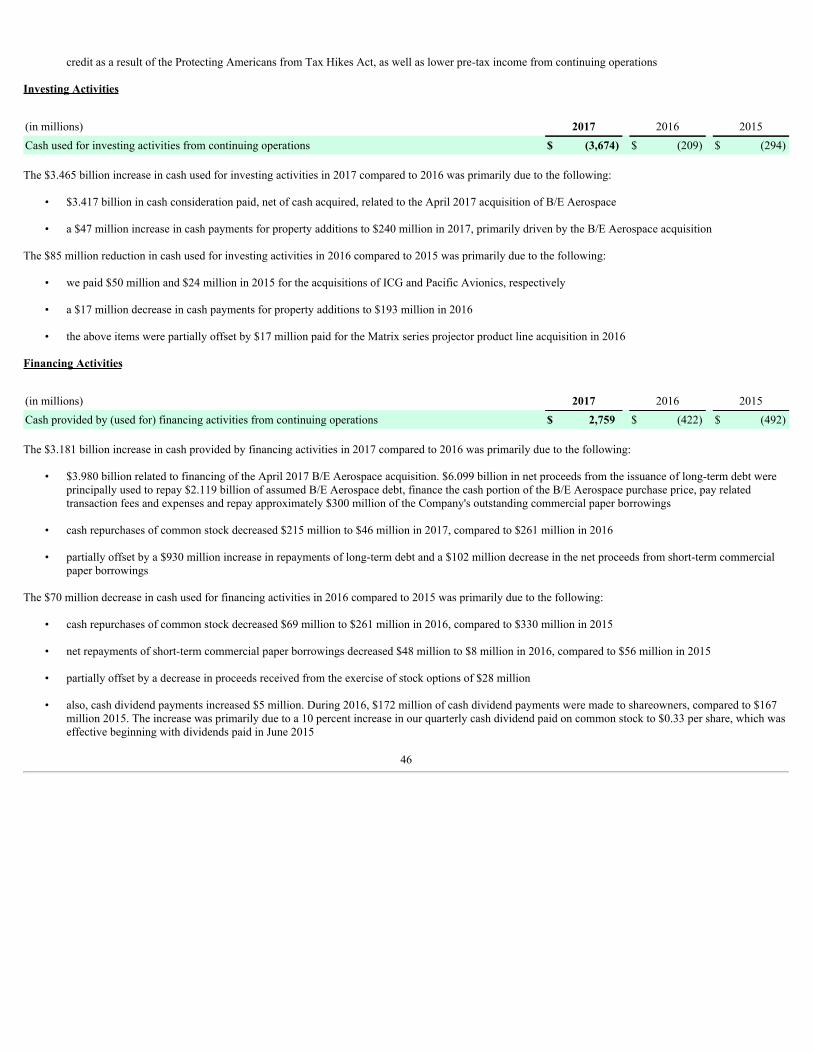
credit as a result of the Protecting Americans from Tax Hikes Act, as well as lower pre-tax income from continuing operations
Investing Activities
(in millions) 2017 2016 2015Cash used for investing activities from continuing operations $ (3,674) $ (209) $ (294)
The $3.465 billion increase in cash used for investing activities in 2017 compared to 2016 was primarily due to the following:
• $3.417 billion in cash consideration paid, net of cash acquired, related to the April 2017 acquisition of B/E Aerospace
• a $47 million increase in cash payments for property additions to $240 million in 2017, primarily driven by the B/E Aerospace acquisition
The $85 million reduction in cash used for investing activities in 2016 compared to 2015 was primarily due to the following:
• we paid $50 million and $24 million in 2015 for the acquisitions of ICG and Pacific Avionics, respectively
• a $17 million decrease in cash payments for property additions to $193 million in 2016
• the above items were partially offset by $17 million paid for the Matrix series projector product line acquisition in 2016
Financing Activities
(in millions) 2017 2016 2015Cash provided by (used for) financing activities from continuing operations $ 2,759 $ (422) $ (492)
The $3.181 billion increase in cash provided by financing activities in 2017 compared to 2016 was primarily due to the following:
• $3.980 billion related to financing of the April 2017 B/E Aerospace acquisition. $6.099 billion in net proceeds from the issuance of long-term debt wereprincipally used to repay $2.119 billion of assumed B/E Aerospace debt, finance the cash portion of the B/E Aerospace purchase price, pay relatedtransaction fees and expenses and repay approximately $300 million of the Company's outstanding commercial paper borrowings
• cash repurchases of common stock decreased $215 million to $46 million in 2017, compared to $261 million in 2016
• partially offset by a $930 million increase in repayments of long-term debt and a $102 million decrease in the net proceeds from short-term commercialpaper borrowings
The $70 million decrease in cash used for financing activities in 2016 compared to 2015 was primarily due to the following:
• cash repurchases of common stock decreased $69 million to $261 million in 2016, compared to $330 million in 2015
• net repayments of short-term commercial paper borrowings decreased $48 million to $8 million in 2016, compared to $56 million in 2015
• partially offset by a decrease in proceeds received from the exercise of stock options of $28 million
• also, cash dividend payments increased $5 million. During 2016, $172 million of cash dividend payments were made to shareowners, compared to $167million 2015. The increase was primarily due to a 10 percent increase in our quarterly cash dividend paid on common stock to $0.33 per share, which waseffective beginning with dividends paid in June 2015
46
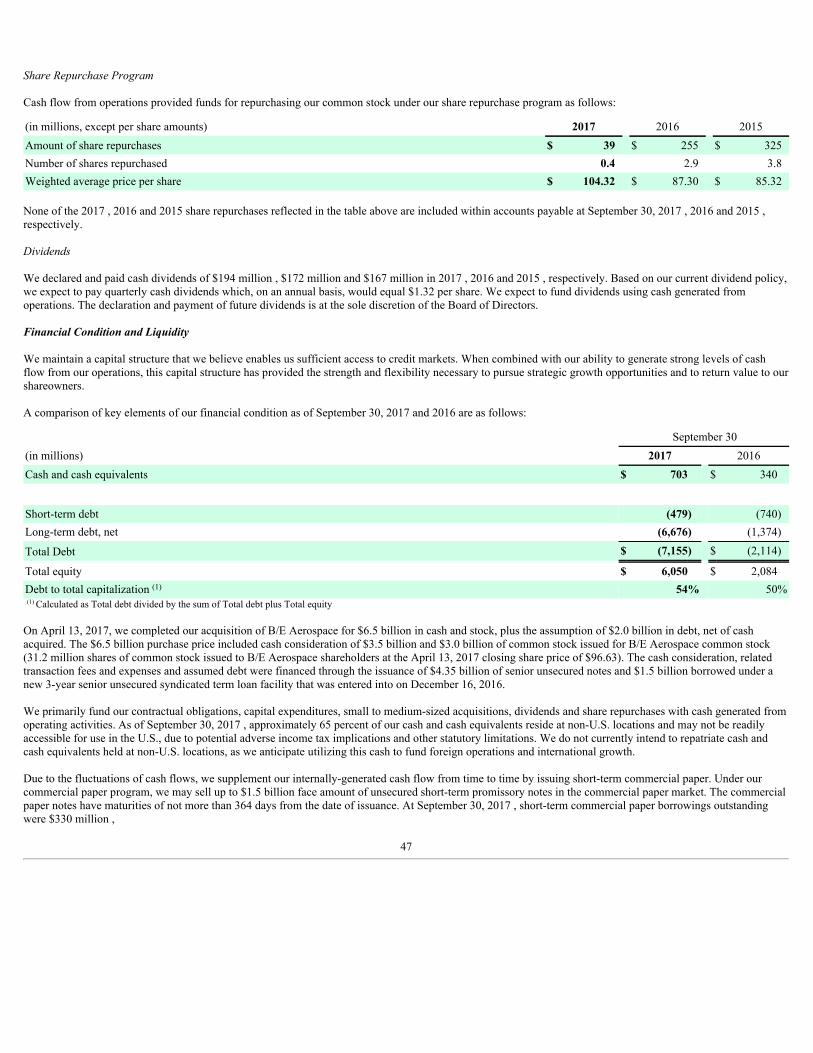
ShareRepurchaseProgram
Cash flow from operations provided funds for repurchasing our common stock under our share repurchase program as follows:
(in millions, except per share amounts) 2017 2016 2015Amount of share repurchases $ 39 $ 255 $ 325Number of shares repurchased 0.4 2.9 3.8Weighted average price per share $ 104.32 $ 87.30 $ 85.32
None of the 2017 , 2016 and 2015 share repurchases reflected in the table above are included within accounts payable at September 30, 2017 , 2016 and 2015 ,respectively.
Dividends
We declared and paid cash dividends of $194 million , $172 million and $167 million in 2017 , 2016 and 2015 , respectively. Based on our current dividend policy,we expect to pay quarterly cash dividends which, on an annual basis, would equal $1.32 per share. We expect to fund dividends using cash generated fromoperations. The declaration and payment of future dividends is at the sole discretion of the Board of Directors.
Financial Condition and Liquidity
We maintain a capital structure that we believe enables us sufficient access to credit markets. When combined with our ability to generate strong levels of cashflow from our operations, this capital structure has provided the strength and flexibility necessary to pursue strategic growth opportunities and to return value to ourshareowners.
A comparison of key elements of our financial condition as of September 30, 2017 and 2016 are as follows:
September 30(in millions) 2017 2016Cash and cash equivalents $ 703 $ 340
Short-term debt (479) (740)Long-term debt, net (6,676) (1,374)
Total Debt $ (7,155) $ (2,114)
Total equity $ 6,050 $ 2,084Debt to total capitalization (1) 54% 50%(1) Calculated as Total debt divided by the sum of Total debt plus Total equity
On April 13, 2017, we completed our acquisition of B/E Aerospace for $6.5 billion in cash and stock, plus the assumption of $2.0 billion in debt, net of cashacquired. The $6.5 billion purchase price included cash consideration of $3.5 billion and $3.0 billion of common stock issued for B/E Aerospace common stock(31.2 million shares of common stock issued to B/E Aerospace shareholders at the April 13, 2017 closing share price of $96.63). The cash consideration, relatedtransaction fees and expenses and assumed debt were financed through the issuance of $4.35 billion of senior unsecured notes and $1.5 billion borrowed under anew 3-year senior unsecured syndicated term loan facility that was entered into on December 16, 2016.
We primarily fund our contractual obligations, capital expenditures, small to medium-sized acquisitions, dividends and share repurchases with cash generated fromoperating activities. As of September 30, 2017 , approximately 65 percent of our cash and cash equivalents reside at non-U.S. locations and may not be readilyaccessible for use in the U.S., due to potential adverse income tax implications and other statutory limitations. We do not currently intend to repatriate cash andcash equivalents held at non-U.S. locations, as we anticipate utilizing this cash to fund foreign operations and international growth.
Due to the fluctuations of cash flows, we supplement our internally-generated cash flow from time to time by issuing short-term commercial paper. Under ourcommercial paper program, we may sell up to $1.5 billion face amount of unsecured short-term promissory notes in the commercial paper market. The commercialpaper notes have maturities of not more than 364 days from the date of issuance. At September 30, 2017 , short-term commercial paper borrowings outstandingwere $330 million ,
47
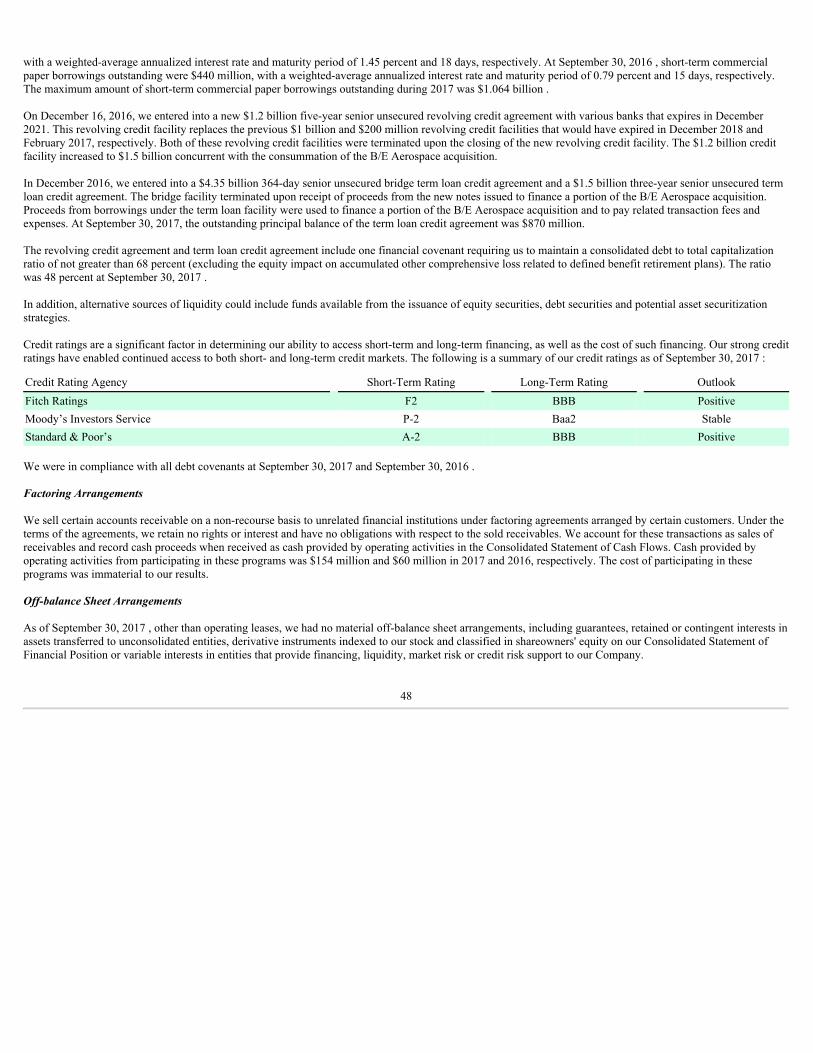
with a weighted-average annualized interest rate and maturity period of 1.45 percent and 18 days, respectively. At September 30, 2016 , short-term commercialpaper borrowings outstanding were $440 million, with a weighted-average annualized interest rate and maturity period of 0.79 percent and 15 days, respectively.The maximum amount of short-term commercial paper borrowings outstanding during 2017 was $1.064 billion .
On December 16, 2016, we entered into a new $1.2 billion five-year senior unsecured revolving credit agreement with various banks that expires in December2021. This revolving credit facility replaces the previous $1 billion and $200 million revolving credit facilities that would have expired in December 2018 andFebruary 2017, respectively. Both of these revolving credit facilities were terminated upon the closing of the new revolving credit facility. The $1.2 billion creditfacility increased to $1.5 billion concurrent with the consummation of the B/E Aerospace acquisition.
In December 2016, we entered into a $4.35 billion 364-day senior unsecured bridge term loan credit agreement and a $1.5 billion three-year senior unsecured termloan credit agreement. The bridge facility terminated upon receipt of proceeds from the new notes issued to finance a portion of the B/E Aerospace acquisition.Proceeds from borrowings under the term loan facility were used to finance a portion of the B/E Aerospace acquisition and to pay related transaction fees andexpenses. At September 30, 2017, the outstanding principal balance of the term loan credit agreement was $870 million.
The revolving credit agreement and term loan credit agreement include one financial covenant requiring us to maintain a consolidated debt to total capitalizationratio of not greater than 68 percent (excluding the equity impact on accumulated other comprehensive loss related to defined benefit retirement plans). The ratiowas 48 percent at September 30, 2017 .
In addition, alternative sources of liquidity could include funds available from the issuance of equity securities, debt securities and potential asset securitizationstrategies.
Credit ratings are a significant factor in determining our ability to access short-term and long-term financing, as well as the cost of such financing. Our strong creditratings have enabled continued access to both short- and long-term credit markets. The following is a summary of our credit ratings as of September 30, 2017 :
Credit Rating Agency Short-Term Rating Long-Term Rating OutlookFitch Ratings F2 BBB PositiveMoody’s Investors Service P-2 Baa2 StableStandard & Poor’s A-2 BBB Positive
We were in compliance with all debt covenants at September 30, 2017 and September 30, 2016 .
Factoring Arrangements
We sell certain accounts receivable on a non-recourse basis to unrelated financial institutions under factoring agreements arranged by certain customers. Under theterms of the agreements, we retain no rights or interest and have no obligations with respect to the sold receivables. We account for these transactions as sales ofreceivables and record cash proceeds when received as cash provided by operating activities in the Consolidated Statement of Cash Flows. Cash provided byoperating activities from participating in these programs was $154 million and $60 million in 2017 and 2016, respectively. The cost of participating in theseprograms was immaterial to our results.
Off-balance Sheet Arrangements
As of September 30, 2017 , other than operating leases, we had no material off-balance sheet arrangements, including guarantees, retained or contingent interests inassets transferred to unconsolidated entities, derivative instruments indexed to our stock and classified in shareowners' equity on our Consolidated Statement ofFinancial Position or variable interests in entities that provide financing, liquidity, market risk or credit risk support to our Company.
48
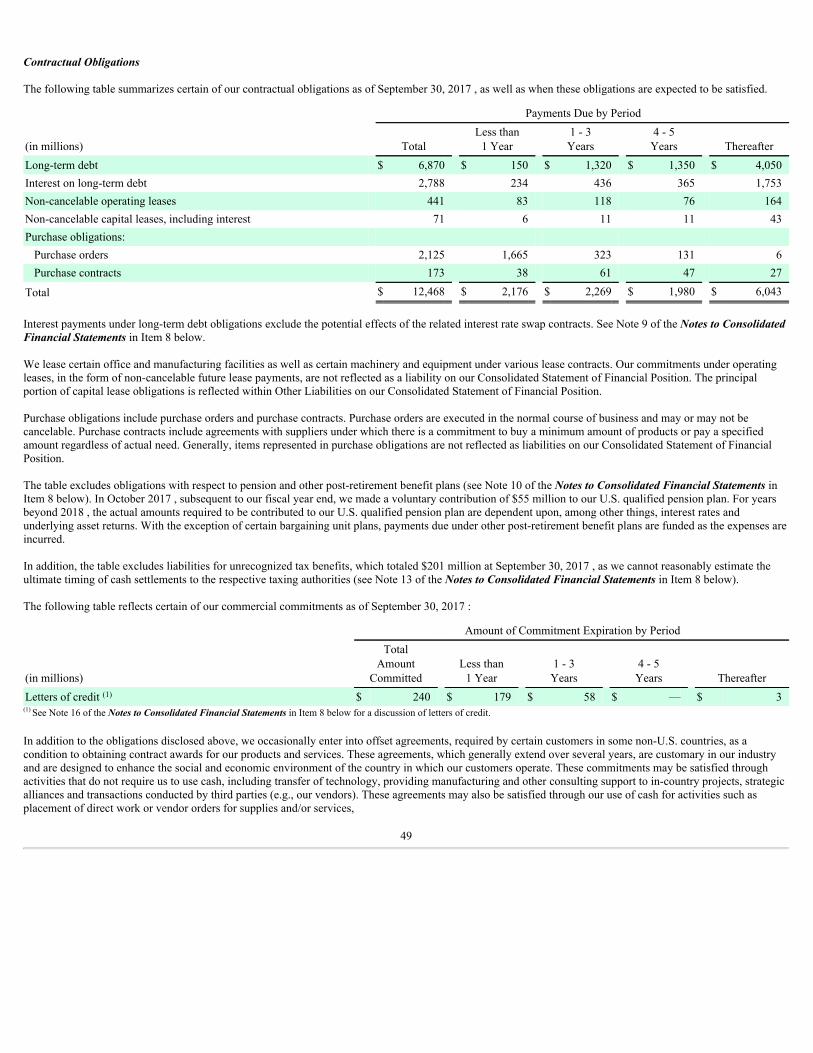
Contractual Obligations
The following table summarizes certain of our contractual obligations as of September 30, 2017 , as well as when these obligations are expected to be satisfied.
Payments Due by Period
(in millions) Total Less than
1 Year 1 - 3
Years 4 - 5Years Thereafter
Long-term debt $ 6,870 $ 150 $ 1,320 $ 1,350 $ 4,050Interest on long-term debt 2,788 234 436 365 1,753Non-cancelable operating leases 441 83 118 76 164Non-cancelable capital leases, including interest 71 6 11 11 43Purchase obligations:
Purchase orders 2,125 1,665 323 131 6Purchase contracts 173 38 61 47 27
Total $ 12,468 $ 2,176 $ 2,269 $ 1,980 $ 6,043
Interest payments under long-term debt obligations exclude the potential effects of the related interest rate swap contracts. See Note 9 of the Notes to ConsolidatedFinancial Statements in Item 8 below.
We lease certain office and manufacturing facilities as well as certain machinery and equipment under various lease contracts. Our commitments under operatingleases, in the form of non-cancelable future lease payments, are not reflected as a liability on our Consolidated Statement of Financial Position. The principalportion of capital lease obligations is reflected within Other Liabilities on our Consolidated Statement of Financial Position.
Purchase obligations include purchase orders and purchase contracts. Purchase orders are executed in the normal course of business and may or may not becancelable. Purchase contracts include agreements with suppliers under which there is a commitment to buy a minimum amount of products or pay a specifiedamount regardless of actual need. Generally, items represented in purchase obligations are not reflected as liabilities on our Consolidated Statement of FinancialPosition.
The table excludes obligations with respect to pension and other post-retirement benefit plans (see Note 10 of the Notes to Consolidated Financial Statements inItem 8 below). In October 2017 , subsequent to our fiscal year end, we made a voluntary contribution of $55 million to our U.S. qualified pension plan. For yearsbeyond 2018 , the actual amounts required to be contributed to our U.S. qualified pension plan are dependent upon, among other things, interest rates andunderlying asset returns. With the exception of certain bargaining unit plans, payments due under other post-retirement benefit plans are funded as the expenses areincurred.
In addition, the table excludes liabilities for unrecognized tax benefits, which totaled $201 million at September 30, 2017 , as we cannot reasonably estimate theultimate timing of cash settlements to the respective taxing authorities (see Note 13 of the Notes to Consolidated Financial Statements in Item 8 below).
The following table reflects certain of our commercial commitments as of September 30, 2017 :
Amount of Commitment Expiration by Period
(in millions)
TotalAmount
Committed Less than
1 Year 1 - 3
Years 4 - 5
Years ThereafterLetters of credit (1) $ 240 $ 179 $ 58 $ — $ 3
(1) See Note 16 of the Notes to Consolidated Financial Statements in Item 8 below for a discussion of letters of credit.
In addition to the obligations disclosed above, we occasionally enter into offset agreements, required by certain customers in some non-U.S. countries, as acondition to obtaining contract awards for our products and services. These agreements, which generally extend over several years, are customary in our industryand are designed to enhance the social and economic environment of the country in which our customers operate. These commitments may be satisfied throughactivities that do not require us to use cash, including transfer of technology, providing manufacturing and other consulting support to in-country projects, strategicalliances and transactions conducted by third parties (e.g., our vendors). These agreements may also be satisfied through our use of cash for activities such asplacement of direct work or vendor orders for supplies and/or services,
49
building or leasing facilities for in-country operations, in-country employment of a non-U.S. country's citizens and other forms of assistance in the applicablecountry. The offset rules and regulations, as well as the underlying contracts, may differ from one country to another.
We typically do not commit to offset agreements until contract awards for our products or services are definitive. Should we be unable to meet the offsetobligations we may be subject to contractual penalties, and our chances of receiving additional business from the applicable customers could be reduced or, incertain cases, eliminated. We historically have not been required to pay material penalties related to offset obligations and are currently in compliance with ouroffset commitments.
At September 30, 2017 , we had outstanding offset obligations totaling approximately $483 million that extend through 2036. The amounts ultimately appliedagainst our offset requirements are based on negotiations with the customer and the cost to fulfill the obligation is typically only a fraction of the originalobligation.
RECENTLY ISSUED ACCOUNTING STANDARDS
For information related to recently issued accounting standards, see Note 2 of the Notes to Consolidated Financial Statements in Item 8 below.
ENVIRONMENTAL
For information related to environmental claims, remediation efforts and related matters, see Note 18 of the Notes to Consolidated Financial Statements in Item 8below.
CRITICAL ACCOUNTING POLICIES
The preparation of our financial statements in accordance with accounting principles generally accepted in the United States of America requires us to makeestimates, judgments and assumptions that affect our financial condition and results of operations that are reported in the accompanying consolidated financialstatements as well as the related disclosure of assets and liabilities contingent upon future events.
Understanding the critical accounting policies discussed below and related risks is important in evaluating our financial condition and results of operations. Webelieve the following accounting policies used in the preparation of the consolidated financial statements are critical to our financial condition and results ofoperations as they involve a significant use of management judgment on matters that are inherently uncertain. If actual results differ significantly frommanagement's estimates, there could be a material effect on our financial condition, results of operations and cash flows. Management regularly discusses theidentification and development of these critical accounting policies with the Audit Committee of the Board of Directors.
Accounting for Long-Term Contracts
A substantial portion of our sales to government customers and certain of our sales to commercial customers are made pursuant to long-term contracts requiringdevelopment and delivery of products over several years and often contain fixed-price purchase options for additional products. Certain of these contracts areaccounted for under the percentage-of-completion method of accounting. Sales and earnings under the percentage-of-completion method are recorded either asproducts are shipped under the units-of-delivery method, or based on the ratio of actual costs incurred to total estimated costs expected to be incurred related to thecontract under the cost-to-cost method. Approximately 17 percent of our sales are accounted for under the percentage-of-completion method of accounting.
The percentage-of-completion method of accounting requires management to estimate the profit margin for each individual contract and to apply that profit marginon a uniform basis as sales are recorded under the contract. The estimation of profit margins requires management to make projections of the total sales to begenerated and the total costs that will be incurred under a contract. These projections require management to make numerous assumptions and estimates relating toitems such as the complexity of design and related development costs, performance of subcontractors, availability and cost of materials, labor productivity and cost,overhead and capital costs and manufacturing efficiency. These contracts often include purchase options for additional quantities and customer change orders foradditional or revised product functionality. Sales and costs related to profitable purchase options are included in our estimates only when the options are exercisedwhile sales and costs related to
50
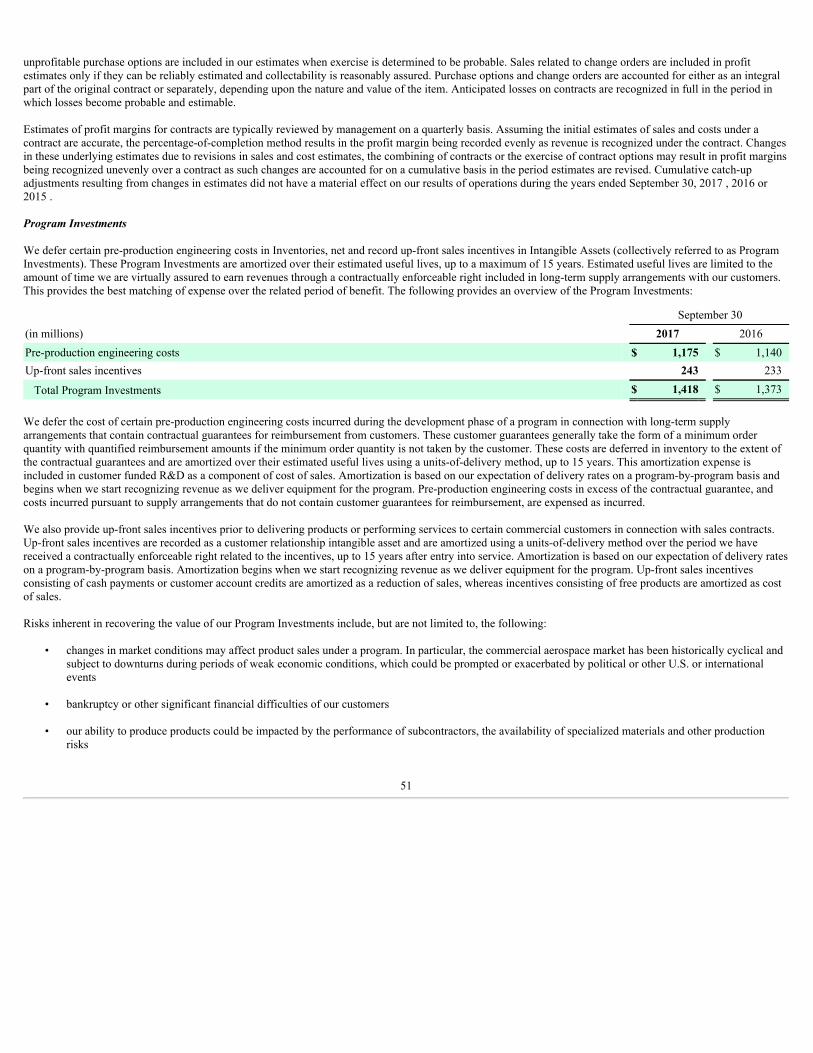
unprofitable purchase options are included in our estimates when exercise is determined to be probable. Sales related to change orders are included in profitestimates only if they can be reliably estimated and collectability is reasonably assured. Purchase options and change orders are accounted for either as an integralpart of the original contract or separately, depending upon the nature and value of the item. Anticipated losses on contracts are recognized in full in the period inwhich losses become probable and estimable.
Estimates of profit margins for contracts are typically reviewed by management on a quarterly basis. Assuming the initial estimates of sales and costs under acontract are accurate, the percentage-of-completion method results in the profit margin being recorded evenly as revenue is recognized under the contract. Changesin these underlying estimates due to revisions in sales and cost estimates, the combining of contracts or the exercise of contract options may result in profit marginsbeing recognized unevenly over a contract as such changes are accounted for on a cumulative basis in the period estimates are revised. Cumulative catch-upadjustments resulting from changes in estimates did not have a material effect on our results of operations during the years ended September 30, 2017 , 2016 or2015 .
Program Investments
We defer certain pre-production engineering costs in Inventories, net and record up-front sales incentives in Intangible Assets (collectively referred to as ProgramInvestments). These Program Investments are amortized over their estimated useful lives, up to a maximum of 15 years. Estimated useful lives are limited to theamount of time we are virtually assured to earn revenues through a contractually enforceable right included in long-term supply arrangements with our customers.This provides the best matching of expense over the related period of benefit. The following provides an overview of the Program Investments:
September 30(in millions) 2017 2016Pre-production engineering costs $ 1,175 $ 1,140Up-front sales incentives 243 233
Total Program Investments $ 1,418 $ 1,373
We defer the cost of certain pre-production engineering costs incurred during the development phase of a program in connection with long-term supplyarrangements that contain contractual guarantees for reimbursement from customers. These customer guarantees generally take the form of a minimum orderquantity with quantified reimbursement amounts if the minimum order quantity is not taken by the customer. These costs are deferred in inventory to the extent ofthe contractual guarantees and are amortized over their estimated useful lives using a units-of-delivery method, up to 15 years. This amortization expense isincluded in customer funded R&D as a component of cost of sales. Amortization is based on our expectation of delivery rates on a program-by-program basis andbegins when we start recognizing revenue as we deliver equipment for the program. Pre-production engineering costs in excess of the contractual guarantee, andcosts incurred pursuant to supply arrangements that do not contain customer guarantees for reimbursement, are expensed as incurred.
We also provide up-front sales incentives prior to delivering products or performing services to certain commercial customers in connection with sales contracts.Up-front sales incentives are recorded as a customer relationship intangible asset and are amortized using a units-of-delivery method over the period we havereceived a contractually enforceable right related to the incentives, up to 15 years after entry into service. Amortization is based on our expectation of delivery rateson a program-by-program basis. Amortization begins when we start recognizing revenue as we deliver equipment for the program. Up-front sales incentivesconsisting of cash payments or customer account credits are amortized as a reduction of sales, whereas incentives consisting of free products are amortized as costof sales.
Risks inherent in recovering the value of our Program Investments include, but are not limited to, the following:
• changes in market conditions may affect product sales under a program. In particular, the commercial aerospace market has been historically cyclical andsubject to downturns during periods of weak economic conditions, which could be prompted or exacerbated by political or other U.S. or internationalevents
• bankruptcy or other significant financial difficulties of our customers
• our ability to produce products could be impacted by the performance of subcontractors, the availability of specialized materials and other productionrisks
51
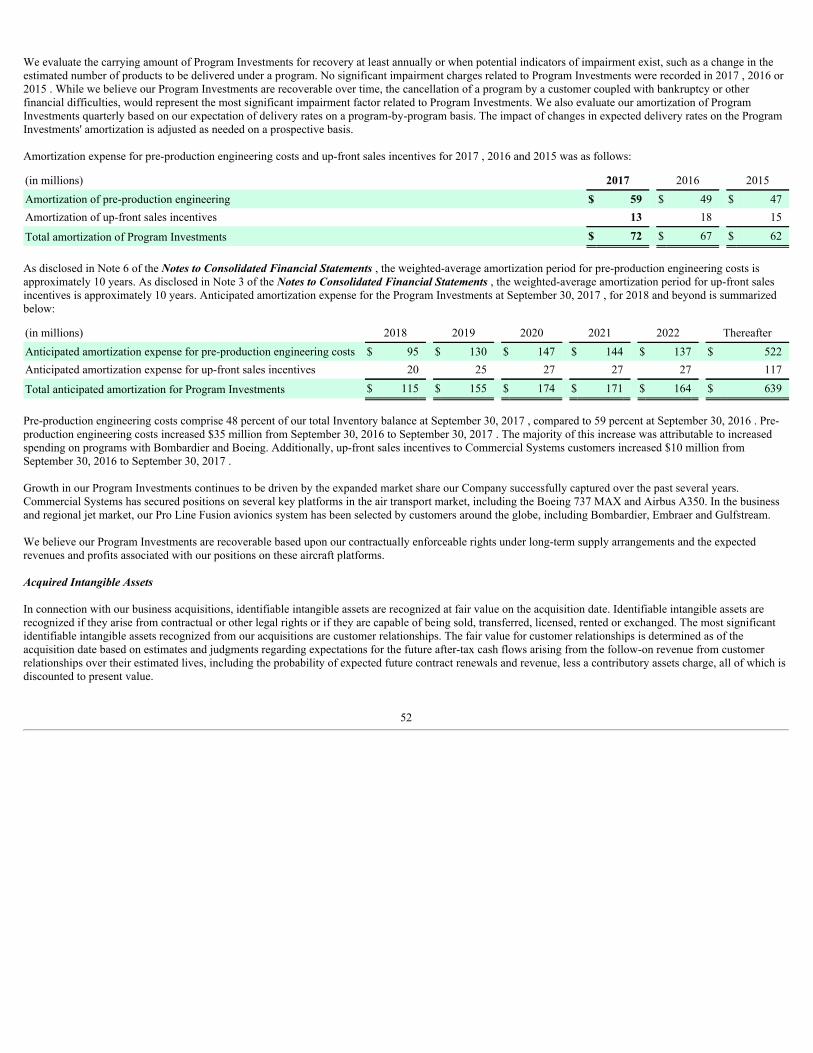
We evaluate the carrying amount of Program Investments for recovery at least annually or when potential indicators of impairment exist, such as a change in theestimated number of products to be delivered under a program. No significant impairment charges related to Program Investments were recorded in 2017 , 2016 or2015 . While we believe our Program Investments are recoverable over time, the cancellation of a program by a customer coupled with bankruptcy or otherfinancial difficulties, would represent the most significant impairment factor related to Program Investments. We also evaluate our amortization of ProgramInvestments quarterly based on our expectation of delivery rates on a program-by-program basis. The impact of changes in expected delivery rates on the ProgramInvestments' amortization is adjusted as needed on a prospective basis.
Amortization expense for pre-production engineering costs and up-front sales incentives for 2017 , 2016 and 2015 was as follows:
(in millions) 2017 2016 2015Amortization of pre-production engineering $ 59 $ 49 $ 47Amortization of up-front sales incentives 13 18 15
Total amortization of Program Investments $ 72 $ 67 $ 62
As disclosed in Note 6 of the Notes to Consolidated Financial Statements , the weighted-average amortization period for pre-production engineering costs isapproximately 10 years. As disclosed in Note 3 of the Notes to Consolidated Financial Statements , the weighted-average amortization period for up-front salesincentives is approximately 10 years. Anticipated amortization expense for the Program Investments at September 30, 2017 , for 2018 and beyond is summarizedbelow:
(in millions) 2018 2019 2020 2021 2022 ThereafterAnticipated amortization expense for pre-production engineering costs $ 95 $ 130 $ 147 $ 144 $ 137 $ 522Anticipated amortization expense for up-front sales incentives 20 25 27 27 27 117
Total anticipated amortization for Program Investments $ 115 $ 155 $ 174 $ 171 $ 164 $ 639
Pre-production engineering costs comprise 48 percent of our total Inventory balance at September 30, 2017 , compared to 59 percent at September 30, 2016 . Pre-production engineering costs increased $35 million from September 30, 2016 to September 30, 2017 . The majority of this increase was attributable to increasedspending on programs with Bombardier and Boeing. Additionally, up-front sales incentives to Commercial Systems customers increased $10 million fromSeptember 30, 2016 to September 30, 2017 .
Growth in our Program Investments continues to be driven by the expanded market share our Company successfully captured over the past several years.Commercial Systems has secured positions on several key platforms in the air transport market, including the Boeing 737 MAX and Airbus A350. In the businessand regional jet market, our Pro Line Fusion avionics system has been selected by customers around the globe, including Bombardier, Embraer and Gulfstream.
We believe our Program Investments are recoverable based upon our contractually enforceable rights under long-term supply arrangements and the expectedrevenues and profits associated with our positions on these aircraft platforms.
Acquired Intangible Assets
In connection with our business acquisitions, identifiable intangible assets are recognized at fair value on the acquisition date. Identifiable intangible assets arerecognized if they arise from contractual or other legal rights or if they are capable of being sold, transferred, licensed, rented or exchanged. The most significantidentifiable intangible assets recognized from our acquisitions are customer relationships. The fair value for customer relationships is determined as of theacquisition date based on estimates and judgments regarding expectations for the future after-tax cash flows arising from the follow-on revenue from customerrelationships over their estimated lives, including the probability of expected future contract renewals and revenue, less a contributory assets charge, all of which isdiscounted to present value.
52
Identifiable intangible assets are amortized over their useful lives, generally on a straight-line basis, and tested for impairment whenever events or changes incircumstances indicate that the carrying amount of these assets may not be recoverable and are amortized over their estimated useful lives as the economic benefitsare consumed. To the extent events or changes in circumstances indicate the carrying amount of these assets may not be recoverable, we test for impairment basedon our projection of the undiscounted future operating cash flows of the related asset group. To the extent such projections indicate that future undiscounted cashflows are not sufficient to recover the carrying amount, we recognize a non-cash impairment charge to reduce the carrying amount to fair value.
Acquired Contract Liabilities
In connection with our acquisition of B/E Aerospace, we assumed existing long-term contracts. Based upon our review of those contracts, we concluded that theterms of certain contracts were less favorable than could be realized in market transactions as of the acquisition date. As a result, we recognized acquired contractliabilities as of the acquisition date based on the present value of the difference between the contractual cash flows of the executory contracts and the estimatedcash flows had the contracts been executed at the acquisition date. The liabilities principally relate to long-term contracts that were initially executed several yearsprior to the acquisition. See Note 3 of the Notes to Consolidated Financial Statements in Item 8 below for further discussion. The acquired contract liabilities arebeing amortized as non-cash reductions to Cost of sales over the terms of the respective contracts.
Income Taxes
At the end of each quarterly reporting period, we estimate an effective income tax rate that is expected to be applicable for the full fiscal year. The estimate of oureffective income tax rate involves significant judgments resulting from uncertainties in the application of complex tax laws and regulations across manyjurisdictions, implementation of tax planning strategies and estimates as to the jurisdictions where income is expected to be earned. These estimates may be furthercomplicated by new laws, new interpretations of existing laws and rulings by taxing authorities. Due to the subjectivity and complex nature of these underlyingissues, our actual effective income tax rate and related tax liabilities may differ from our initial estimates. Differences between our estimated and actual effectiveincome tax rates and related liabilities are recorded in the period they become known or as our estimates are revised based on additional information. The resultingadjustment to our income tax expense could have a material effect on our results of operations in the period the adjustment is recorded. A one percentage pointchange in our effective income tax rate would change our annual income from continuing operations by approximately $9 million .
Deferred tax assets and liabilities are recorded for tax carryforwards and the net tax effects of temporary differences between the carrying amounts of assets andliabilities for financial reporting and income tax purposes. The future realization of our deferred tax assets ultimately depends on our ability to generate sufficienttaxable income of the appropriate character (for example, ordinary income or capital gains) within the carryback and carryforward periods available under the taxlaw and our ability to execute successful tax planning strategies. Management believes it is more likely than not that the long-term deferred tax assets will berealized through the reduction of future taxable income. A change in the ability of our operations to continue to generate future taxable income, or our ability toimplement tax planning strategies, could affect our ability to realize the future tax deductions underlying our net deferred tax assets, and require us to record avaluation allowance against our net deferred tax assets. The recognition of a valuation allowance would result in a reduction to net income and if significant, couldhave a material impact on our effective tax rate, results of operations and financial position in any given period.
As part of the determination of our tax liability, management exercises considerable judgment in evaluating tax positions taken by us in determining the income taxprovision and establishes reserves for tax contingencies in accordance with the Income Taxes topic of the FASB Accounting Standards Codification. See Note 13of the Notes to Consolidated Financial Statements in Item 8 below for further detail regarding unrecognized tax benefits, deferred taxes and the factors consideredin evaluating deferred tax asset realization.
Goodwill
As of September 30, 2017 , we had $9.158 billion of goodwill related to various business acquisitions. We perform goodwill impairment tests on an annual basisduring the fourth quarter of each fiscal year, or on an interim basis if events or circumstances indicate that it is more likely than not that impairment has occurred.In 2017, we changed the goodwill impairment testing date from the second quarter to the fourth quarter to better align with the timing of our annual strategicplanning process. This change required the Company to test goodwill for impairment during both the second and fourth quarter of 2017.
53
Goodwill is potentially impaired if the carrying value of the reporting unit that contains the goodwill exceeds its estimated fair value. The fair values of ourreporting units are generally determined using a combination of an income approach, which estimates fair value based upon future discounted cash flows, and amarket approach, which estimates fair value using market multiples, ratios and valuations of a set of comparable public companies within our industry. Wecompleted our annual goodwill impairment test in the fourth quarter of 2017 and concluded no impairment of goodwill exists, as all goodwill reporting units had acalculated fair value in excess of carrying value of greater than 25 percent. Goodwill associated with the B/E Aerospace acquisition was not discretely tested forimpairment as we are still within the one year measurement period to determine the fair value of net assets acquired. Although goodwill is not currently impaired,there can be no assurance that future impairments will not occur. Significant negative industry or economic trends, disruptions to our business, failure to achievesynergies from recent acquisitions, or other unexpected significant changes in the use of certain assets could all have a negative effect on fair values in the future.
Pension Benefits
In 2003, we amended our U.S. qualified and non-qualified pension plans covering all salary and hourly employees not covered by collective bargaining agreementsto close the plans to new participants and to discontinue benefit accruals for salary increases and services rendered after September 30, 2006. In addition, ARINCfroze the majority of its pension plans for employees not covered by bargaining unit agreements in 2006, prior to being acquired by us. Accounting standardsrequire these plans to be measured on an actuarial basis. These accounting standards will generally reduce, but not eliminate, the volatility of pension expense asactuarial gains and losses resulting from both normal year-to-year changes in valuation assumptions and the differences from actual experience are deferred andamortized. The application of these accounting standards requires management to make numerous assumptions and judgments that can significantly affect thesemeasurements. Critical assumptions made by management in performing these actuarial valuations include the selection of discount rates and expectations on thefuture rate of return on pension plan assets.
In October 2014, the Society of Actuaries published a new set of mortality tables (RP-2014) and a new mortality improvement scale (MP-2014), which updated lifeexpectancy assumptions. While accounting standards do not prescribe the use of a specific set of mortality tables in the measurement of pension obligations,mortality is a key assumption in developing actuarial estimates. For our 2016 year-end pension liability valuation, we used the RP-2014 tables with an adjustmentfor plan experience and the MP-2014 mortality improvement scale adjusted to reflect convergence to an ultimate annual rate of mortality improvement of 0.75percent by 2022. For our 2017 year-end pension liability valuation, we continued to use the RP-2014 tables with an adjustment for plan experience, but utilized theMP-2016 mortality improvement scale adjusted to reflect convergence to an ultimate annual rate of mortality improvement of 0.75 percent by 2032. The MP-2016mortality improvement scale indicates that U.S. mortality continues to improve, but at a slower average rate. These changes resulted in a decrease to the 2017projected pension benefit obligation of $41 million.
Discount rates are used to determine the present value of our pension obligations and also affect the amount of pension expense recorded in any given period. Weestimate the discount rate based on the rates of return of high quality, fixed-income investments with maturity dates that reflect the expected time horizon overwhich benefits will be paid (see Note 10 of the Notes to Consolidated Financial Statements in Item 8 below). Changes to the discount rate could have a materialeffect on our reported pension obligations and would also impact the related pension expense.
In 2015 and prior, the weighted-average discount rate was used in the calculation of service and interest costs, both of which are components of pension expense.Beginning in 2016, we utilized a "spot rate approach" in the calculation of pension interest and service cost. The spot rate approach applies separate discount ratesfor each projected benefit payment in the calculation of pension interest and service cost. This calculation change is considered a change in accounting estimate andwas applied prospectively in 2016. The use of the spot rate approach resulted in a favorable impact to pension income of $28 million and $35 million in 2017 and2016 respectively, relative to the estimated pension income amount had we not changed our approach.
The expected rate of return is our estimate of the long-term earnings rate on our pension plan assets and is based upon both historical long-term actual and expectedfuture investment returns considering the current investment mix of plan assets. Differences between the actual and expected rate of return on plan assets canimpact our expense for pension benefits.
54
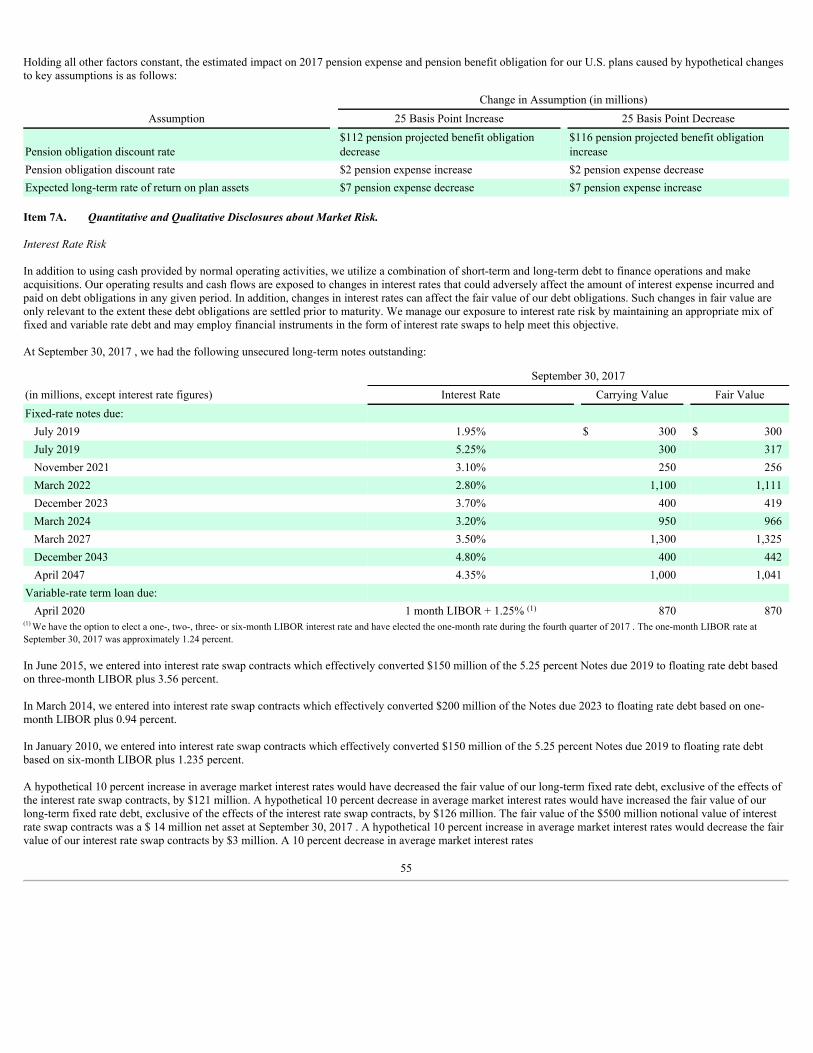
Holding all other factors constant, the estimated impact on 2017 pension expense and pension benefit obligation for our U.S. plans caused by hypothetical changesto key assumptions is as follows:
Change in Assumption (in millions)Assumption 25 Basis Point Increase 25 Basis Point Decrease
Pension obligation discount rate $112 pension projected benefit obligationdecrease
$116 pension projected benefit obligationincrease
Pension obligation discount rate $2 pension expense increase $2 pension expense decreaseExpected long-term rate of return on plan assets $7 pension expense decrease $7 pension expense increase
Item 7A. Quantitative and Qualitative Disclosures about Market Risk.
InterestRateRisk
In addition to using cash provided by normal operating activities, we utilize a combination of short-term and long-term debt to finance operations and makeacquisitions. Our operating results and cash flows are exposed to changes in interest rates that could adversely affect the amount of interest expense incurred andpaid on debt obligations in any given period. In addition, changes in interest rates can affect the fair value of our debt obligations. Such changes in fair value areonly relevant to the extent these debt obligations are settled prior to maturity. We manage our exposure to interest rate risk by maintaining an appropriate mix offixed and variable rate debt and may employ financial instruments in the form of interest rate swaps to help meet this objective.
At September 30, 2017 , we had the following unsecured long-term notes outstanding:
September 30, 2017(in millions, except interest rate figures) Interest Rate Carrying Value Fair ValueFixed-rate notes due:
July 2019 1.95% $ 300 $ 300July 2019 5.25% 300 317November 2021 3.10% 250 256March 2022 2.80% 1,100 1,111December 2023 3.70% 400 419March 2024 3.20% 950 966March 2027 3.50% 1,300 1,325December 2043 4.80% 400 442April 2047 4.35% 1,000 1,041
Variable-rate term loan due: April 2020 1 month LIBOR + 1.25% (1) 870 870
(1) We have the option to elect a one-, two-, three- or six-month LIBOR interest rate and have elected the one-month rate during the fourth quarter of 2017 . The one-month LIBOR rate atSeptember 30, 2017 was approximately 1.24 percent.
In June 2015, we entered into interest rate swap contracts which effectively converted $150 million of the 5.25 percent Notes due 2019 to floating rate debt basedon three-month LIBOR plus 3.56 percent.
In March 2014, we entered into interest rate swap contracts which effectively converted $200 million of the Notes due 2023 to floating rate debt based on one-month LIBOR plus 0.94 percent.
In January 2010, we entered into interest rate swap contracts which effectively converted $150 million of the 5.25 percent Notes due 2019 to floating rate debtbased on six-month LIBOR plus 1.235 percent.
A hypothetical 10 percent increase in average market interest rates would have decreased the fair value of our long-term fixed rate debt, exclusive of the effects ofthe interest rate swap contracts, by $121 million. A hypothetical 10 percent decrease in average market interest rates would have increased the fair value of ourlong-term fixed rate debt, exclusive of the effects of the interest rate swap contracts, by $126 million. The fair value of the $500 million notional value of interestrate swap contracts was a $ 14 million net asset at September 30, 2017 . A hypothetical 10 percent increase in average market interest rates would decrease the fairvalue of our interest rate swap contracts by $3 million. A 10 percent decrease in average market interest rates
55

would increase the fair value of our interest rate swap contract by $3 million. Our results of operations are affected by changes in market interest rates related tovariable rate debt. Inclusive of the effect of the interest rate swaps, a hypothetical 10 percent increase or decrease in average market interest rates would not have amaterial effect on our operations or cash flows. For more information related to outstanding debt obligations and derivative financial instruments, see Notes 9, 14and 15 in the Notes to Consolidated Financial Statements .
ForeignCurrencyRisk
We transact business in various foreign currencies which exposes our cash flows and earnings to changes in foreign currency exchange rates. We attempt tomanage this exposure through operational strategies and the use of foreign currency forward exchange contracts (foreign currency contracts). All foreign currencycontracts are executed with banks we believe to be creditworthy and are primarily denominated in currencies of major industrial countries. The majority of ournon-functional currency firm and anticipated receivables and payables are hedged using foreign currency contracts. It is our policy not to manage exposure to netinvestments in non-U.S. subsidiaries or enter into derivative financial instruments for speculative purposes. Notional amounts of outstanding foreign currencycontracts were $1.312 billion and $384 million at September 30, 2017 and 2016 , respectively. The increase in the notional amount of outstanding foreign currencycontracts is primarily due to forward exchange contracts entered into to offset remeasurement of certain intercompany loans originating in the current year.Notional amounts are stated in U.S. dollar equivalents at spot exchange rates at the respective dates. Principal currencies that are hedged include the British poundsterling and European euro. The duration of foreign currency contracts is generally five years or less. The net fair value of these foreign currency contracts was a $1million net asset at September 30, 2017 and a $2 million net liability at September 30, 2016 . A 10 percent increase in the value of the U.S. dollar against allcurrencies would decrease the fair value of our foreign currency contracts at September 30, 2017 by $103 million. A 10 percent decrease in the value of the U.S.dollar against all currencies would increase the fair value of our foreign currency contracts at September 30, 2017 by $102 million. For more information related tooutstanding currency forward exchange contracts, see Notes 14 and 15 in the Notes to Consolidated Financial Statements in Item 8 below.
56
Item 8. Financial Statements and Supplementary Data.
MANAGEMENT'S REPORT ON INTERNAL CONTROL OVER FINANCIAL REPORTING
Management is responsible for establishing and maintaining adequate internal control over financial reporting as defined in Rules 13a-15(f) and 15d-15(f) underthe Securities Exchange Act of 1934. Rockwell Collins' internal control over financial reporting is a process designed, under the supervision of the Chief ExecutiveOfficer and Chief Financial Officer, to provide reasonable assurance regarding the reliability of financial reporting and the preparation of consolidated financialstatements for external purposes in accordance with accounting principles generally accepted in the United States of America. Our internal control over financialreporting includes those policies and procedures that (1) pertain to the maintenance of records that, in reasonable detail, accurately and fairly reflect thetransactions and dispositions of the assets of Rockwell Collins; (2) provide reasonable assurance that transactions are recorded as necessary to permit preparation ofconsolidated financial statements in accordance with accounting principles generally accepted in the United States of America, and that our receipts andexpenditures are being made only in accordance with authorizations of Rockwell Collins' management and directors; and (3) provide reasonable assuranceregarding prevention or timely detection of unauthorized acquisition, use, or disposition of our assets that could have a material effect on the consolidated financialstatements.
Because of its inherent limitations, internal control over financial reporting may not prevent or detect misstatements. Also, projections of any evaluation ofeffectiveness to future periods are subject to the risk that controls may become inadequate because of changes in conditions, or that the degree of compliance withthe policies or procedures may deteriorate.
On April 13, 2017, Rockwell Collins completed the acquisition of B/E Aerospace. Accordingly, the acquired assets and liabilities of B/E Aerospace are included inour consolidated balance sheet as of September 30, 2017 and the results of its operations and cash flows are reported in our consolidated statements of operationsand cash flows from April 13, 2017 through September 30, 2017. With the exception of goodwill and intangible assets, which were integrated into the RockwellCollins’ control environment, we have elected to exclude B/E Aerospace from the scope of our report on internal control over financial reporting as of September30, 2017. The excluded financial position of B/E Aerospace represented 9 percent of our total assets at September 30, 2017, and its results of operations increasedour total sales by 26 percent and increased income from continuing operations before income taxes by 23 percent during the year ended September 30, 2017.
Management assessed the effectiveness of Rockwell Collins' internal control over financial reporting as of September 30, 2017 . In making this assessment,management used the criteria set forth by the Committee of Sponsoring Organizations of the Treadway Commission in InternalControl-IntegratedFramework(2013). Based on this assessment, management determined that Rockwell Collins maintained effective internal control over financial reporting as of September 30,2017 .
Rockwell Collins' internal control over financial reporting as of September 30, 2017 has been audited by Deloitte & Touche LLP, an independent registered publicaccounting firm, as stated in their report which is included within the Controls and Procedures section in Item 9A of this Form 10-K.
/s/ ROBERT K. ORTBERG /s/ PATRICK E. ALLEN
Robert K. OrtbergChairman, President andChief Executive Officer
Patrick E. AllenSenior Vice President andChief Financial Officer
57
REPORT OF INDEPENDENT REGISTERED PUBLIC ACCOUNTING FIRM
To the Board of Directors and Shareowners ofRockwell Collins, Inc.
We have audited the accompanying consolidated statements of financial position of Rockwell Collins, Inc. and subsidiaries (the "Company") as of September 29,2017 and September 30, 2016, and the related consolidated statements of operations, comprehensive income, cash flows, and equity for each of the three years inthe period ended September 29, 2017. These financial statements are the responsibility of the Company's management. Our responsibility is to express an opinionon the financial statements based on our audits.
We conducted our audits in accordance with the standards of the Public Company Accounting Oversight Board (United States). Those standards require that weplan and perform the audit to obtain reasonable assurance about whether the financial statements are free of material misstatement. An audit includes examining,on a test basis, evidence supporting the amounts and disclosures in the financial statements. An audit also includes assessing the accounting principles used andsignificant estimates made by management, as well as evaluating the overall financial statement presentation. We believe that our audits provide a reasonable basisfor our opinion.
In our opinion, such consolidated financial statements present fairly, in all material respects, the financial position of the Company as of September 29, 2017 andSeptember 30, 2016, and the results of their operations and their cash flows for each of the three years in the period ended September 29, 2017, in conformity withaccounting principles generally accepted in the United States of America.
We have also audited, in accordance with the standards of the Public Company Accounting Oversight Board (United States), the Company’s internal control overfinancial reporting as of September 29, 2017, based on the criteria established in InternalControl-IntegratedFramework(2013)issued by the Committee ofSponsoring Organizations of the Treadway Commission and our report dated November 14, 2017 expressed an unqualified opinion on the Company's internalcontrol over financial reporting.
/s/ DELOITTE & TOUCHE LLP
Chicago, IllinoisNovember 14, 2017
58
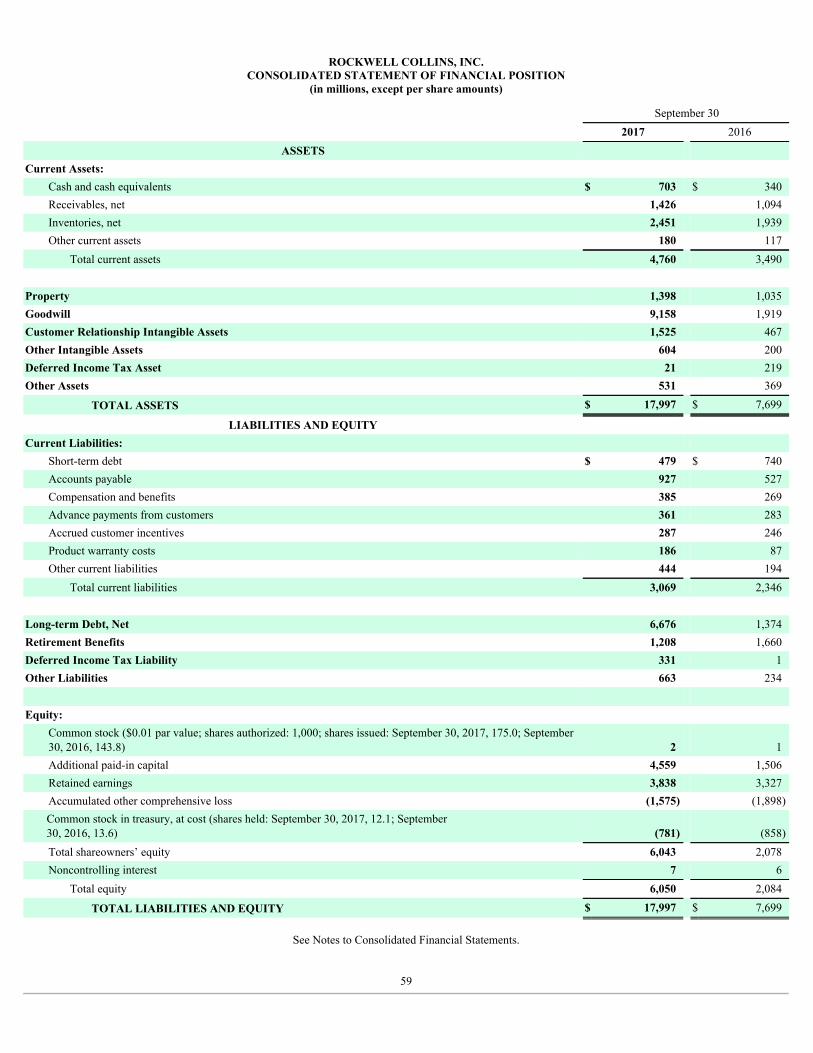
ROCKWELL COLLINS, INC.CONSOLIDATED STATEMENT OF FINANCIAL POSITION
(in millions, except per share amounts)
September 30 2017 2016
ASSETS Current Assets:
Cash and cash equivalents $ 703 $ 340Receivables, net 1,426 1,094Inventories, net 2,451 1,939Other current assets 180 117
Total current assets 4,760 3,490 Property 1,398 1,035Goodwill 9,158 1,919Customer Relationship Intangible Assets 1,525 467Other Intangible Assets 604 200Deferred Income Tax Asset 21 219Other Assets 531 369
TOTAL ASSETS $ 17,997 $ 7,699
LIABILITIES AND EQUITY Current Liabilities:
Short-term debt $ 479 $ 740Accounts payable 927 527Compensation and benefits 385 269Advance payments from customers 361 283Accrued customer incentives 287 246Product warranty costs 186 87Other current liabilities 444 194
Total current liabilities 3,069 2,346 Long-term Debt, Net 6,676 1,374Retirement Benefits 1,208 1,660Deferred Income Tax Liability 331 1Other Liabilities 663 234 Equity:
Common stock ($0.01 par value; shares authorized: 1,000; shares issued: September 30, 2017, 175.0; September30, 2016, 143.8) 2 1Additional paid-in capital 4,559 1,506Retained earnings 3,838 3,327Accumulated other comprehensive loss (1,575) (1,898)Common stock in treasury, at cost (shares held: September 30, 2017, 12.1; September30, 2016, 13.6) (781) (858)Total shareowners’ equity 6,043 2,078Noncontrolling interest 7 6
Total equity 6,050 2,084
TOTAL LIABILITIES AND EQUITY $ 17,997 $ 7,699
See Notes to Consolidated Financial Statements.
59
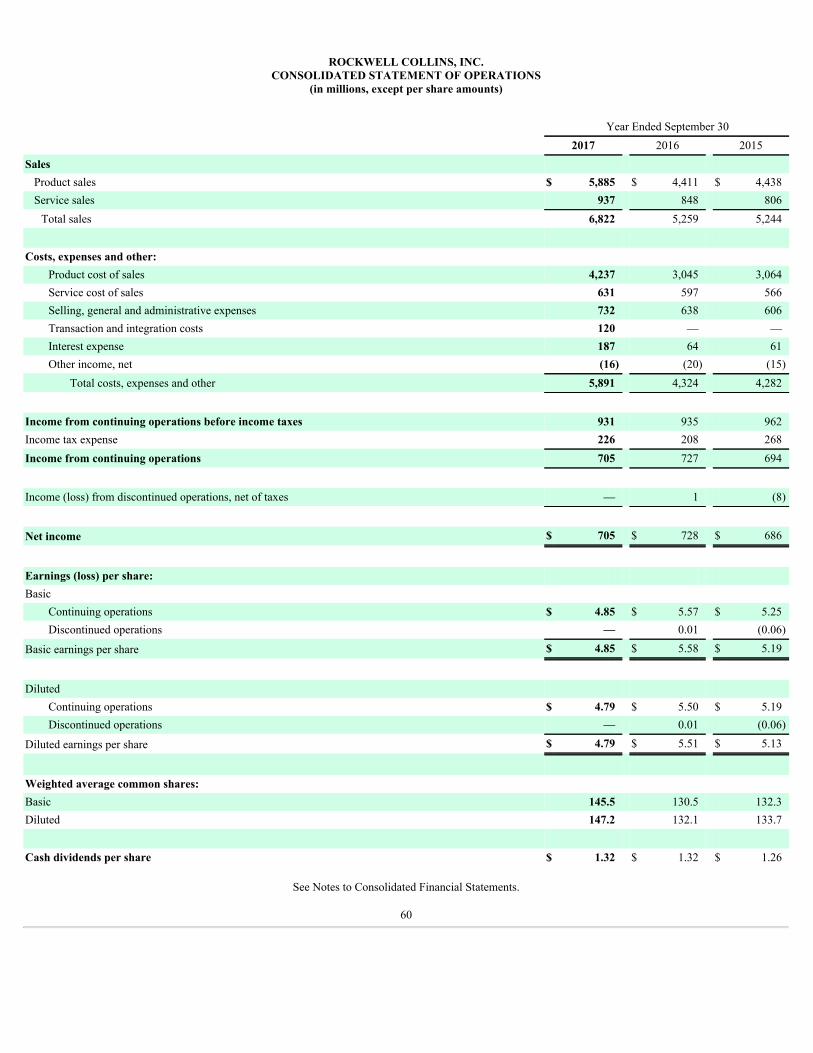
ROCKWELL COLLINS, INC.CONSOLIDATED STATEMENT OF OPERATIONS
(in millions, except per share amounts)
Year Ended September 30 2017 2016 2015Sales
Product sales $ 5,885 $ 4,411 $ 4,438Service sales 937 848 806
Total sales 6,822 5,259 5,244
Costs, expenses and other: Product cost of sales 4,237 3,045 3,064Service cost of sales 631 597 566Selling, general and administrative expenses 732 638 606Transaction and integration costs 120 — —Interest expense 187 64 61Other income, net (16) (20) (15)
Total costs, expenses and other 5,891 4,324 4,282
Income from continuing operations before income taxes 931 935 962Income tax expense 226 208 268Income from continuing operations 705 727 694
Income (loss) from discontinued operations, net of taxes — 1 (8)
Net income $ 705 $ 728 $ 686
Earnings (loss) per share: Basic
Continuing operations $ 4.85 $ 5.57 $ 5.25Discontinued operations — 0.01 (0.06)
Basic earnings per share $ 4.85 $ 5.58 $ 5.19
Diluted Continuing operations $ 4.79 $ 5.50 $ 5.19Discontinued operations — 0.01 (0.06)
Diluted earnings per share $ 4.79 $ 5.51 $ 5.13
Weighted average common shares: Basic 145.5 130.5 132.3Diluted 147.2 132.1 133.7
Cash dividends per share $ 1.32 $ 1.32 $ 1.26
See Notes to Consolidated Financial Statements.
60
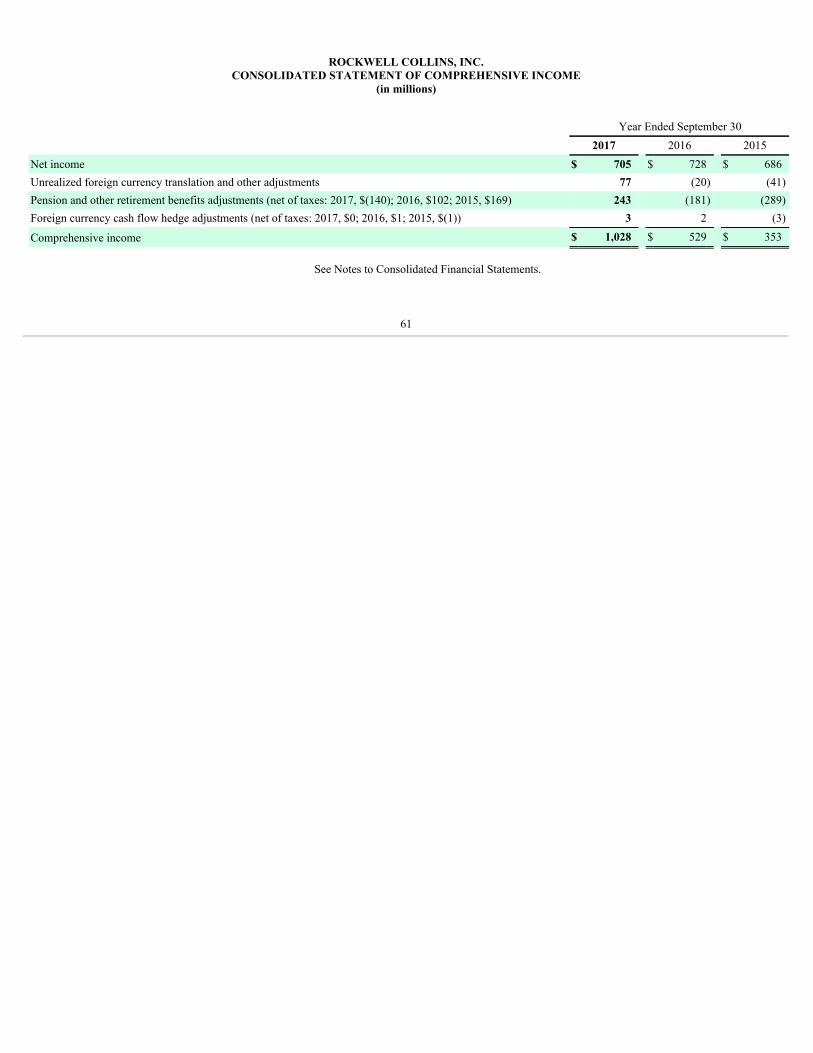
ROCKWELL COLLINS, INC.CONSOLIDATED STATEMENT OF COMPREHENSIVE INCOME
(in millions)
Year Ended September 30 2017 2016 2015Net income $ 705 $ 728 $ 686Unrealized foreign currency translation and other adjustments 77 (20) (41)Pension and other retirement benefits adjustments (net of taxes: 2017, $(140); 2016, $102; 2015, $169) 243 (181) (289)Foreign currency cash flow hedge adjustments (net of taxes: 2017, $0; 2016, $1; 2015, $(1)) 3 2 (3)
Comprehensive income $ 1,028 $ 529 $ 353
See Notes to Consolidated Financial Statements.
61
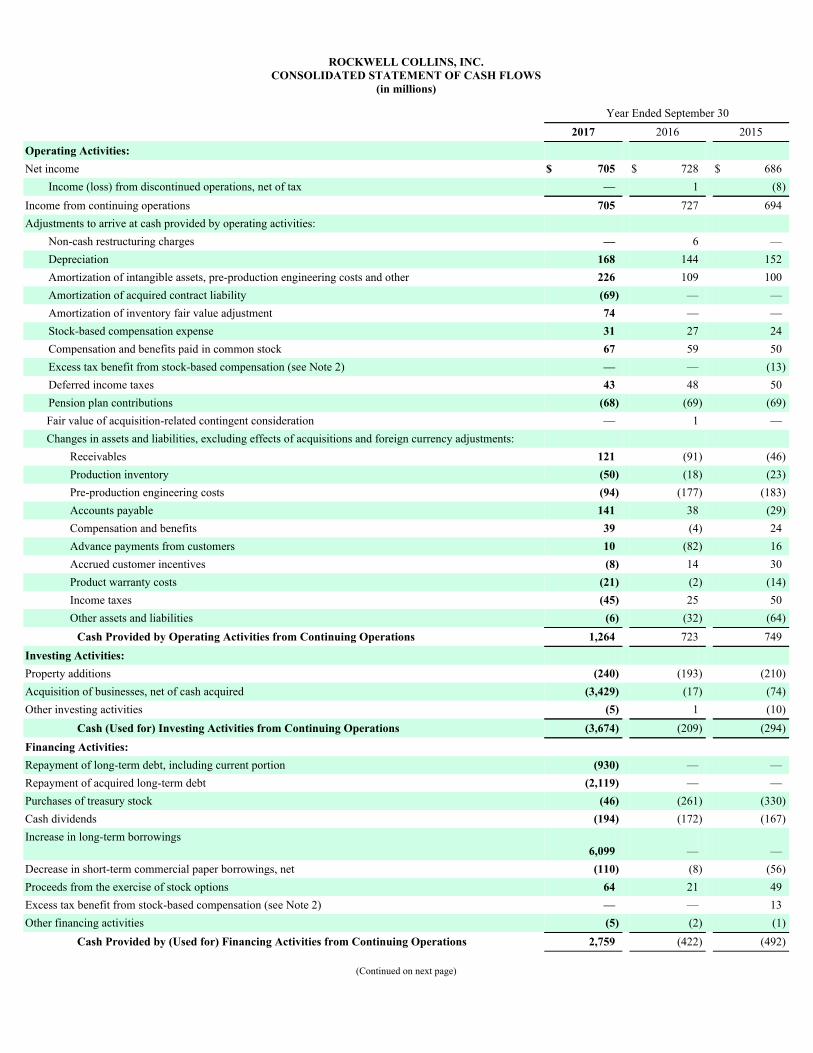
ROCKWELL COLLINS, INC.CONSOLIDATED STATEMENT OF CASH FLOWS
(in millions)
Year Ended September 30 2017 2016 2015Operating Activities: Net income $ 705 $ 728 $ 686
Income (loss) from discontinued operations, net of tax — 1 (8)Income from continuing operations 705 727 694Adjustments to arrive at cash provided by operating activities:
Non-cash restructuring charges — 6 —Depreciation 168 144 152Amortization of intangible assets, pre-production engineering costs and other 226 109 100Amortization of acquired contract liability (69) — —Amortization of inventory fair value adjustment 74 — —Stock-based compensation expense 31 27 24Compensation and benefits paid in common stock 67 59 50Excess tax benefit from stock-based compensation (see Note 2) — — (13)Deferred income taxes 43 48 50Pension plan contributions (68) (69) (69)Fair value of acquisition-related contingent consideration — 1 —Changes in assets and liabilities, excluding effects of acquisitions and foreign currency adjustments:
Receivables 121 (91) (46)Production inventory (50) (18) (23)Pre-production engineering costs (94) (177) (183)Accounts payable 141 38 (29)Compensation and benefits 39 (4) 24Advance payments from customers 10 (82) 16Accrued customer incentives (8) 14 30Product warranty costs (21) (2) (14)Income taxes (45) 25 50Other assets and liabilities (6) (32) (64)
Cash Provided by Operating Activities from Continuing Operations 1,264 723 749Investing Activities: Property additions (240) (193) (210)Acquisition of businesses, net of cash acquired (3,429) (17) (74)Other investing activities (5) 1 (10)
Cash (Used for) Investing Activities from Continuing Operations (3,674) (209) (294)Financing Activities: Repayment of long-term debt, including current portion (930) — —Repayment of acquired long-term debt (2,119) — —Purchases of treasury stock (46) (261) (330)Cash dividends (194) (172) (167)Increase in long-term borrowings
6,099 — —Decrease in short-term commercial paper borrowings, net (110) (8) (56)Proceeds from the exercise of stock options 64 21 49Excess tax benefit from stock-based compensation (see Note 2) — — 13Other financing activities (5) (2) (1)
Cash Provided by (Used for) Financing Activities from Continuing Operations 2,759 (422) (492)
(Continued on next page)

62
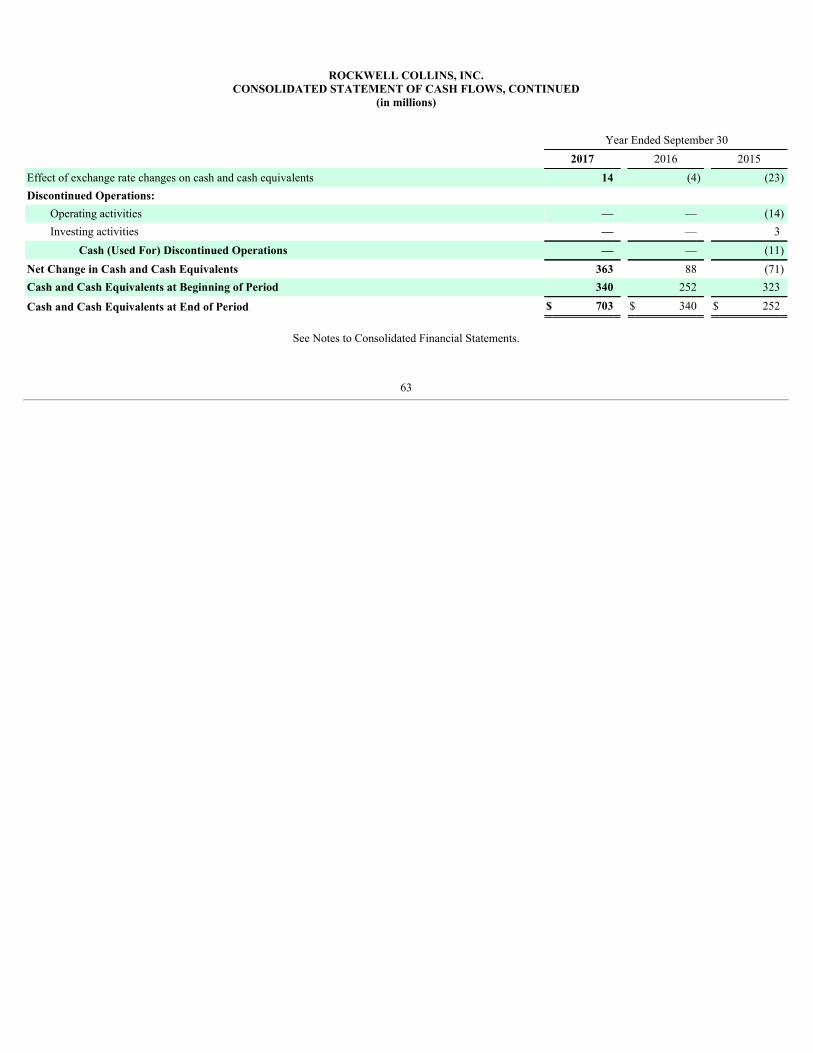
ROCKWELL COLLINS, INC.CONSOLIDATED STATEMENT OF CASH FLOWS, CONTINUED
(in millions)
Year Ended September 30 2017 2016 2015Effect of exchange rate changes on cash and cash equivalents 14 (4) (23)Discontinued Operations:
Operating activities — — (14)Investing activities — — 3
Cash (Used For) Discontinued Operations — — (11)Net Change in Cash and Cash Equivalents 363 88 (71)Cash and Cash Equivalents at Beginning of Period 340 252 323
Cash and Cash Equivalents at End of Period $ 703 $ 340 $ 252
See Notes to Consolidated Financial Statements.
63
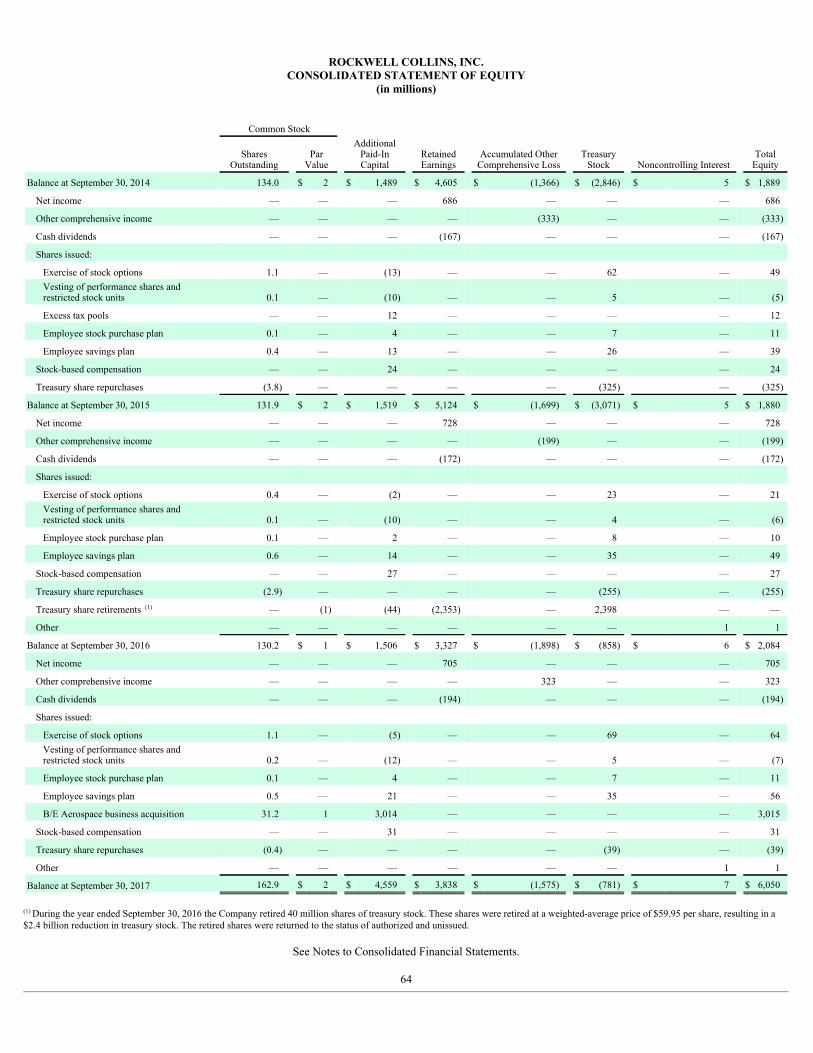
ROCKWELL COLLINS, INC.CONSOLIDATED STATEMENT OF EQUITY
(in millions)
Common Stock
Shares
Outstanding Par
Value
AdditionalPaid-InCapital
RetainedEarnings
Accumulated OtherComprehensive Loss
TreasuryStock Noncontrolling Interest
TotalEquity
Balance at September 30, 2014 134.0 $ 2 $ 1,489 $ 4,605 $ (1,366) $ (2,846) $ 5 $ 1,889
Net income — — — 686 — — — 686
Other comprehensive income — — — — (333) — — (333)
Cash dividends — — — (167) — — — (167)
Shares issued:
Exercise of stock options 1.1 — (13) — — 62 — 49Vesting of performance shares andrestricted stock units 0.1 — (10) — — 5 — (5)
Excess tax pools — — 12 — — — — 12
Employee stock purchase plan 0.1 — 4 — — 7 — 11
Employee savings plan 0.4 — 13 — — 26 — 39
Stock-based compensation — — 24 — — — — 24
Treasury share repurchases (3.8) — — — — (325) — (325)
Balance at September 30, 2015 131.9 $ 2 $ 1,519 $ 5,124 $ (1,699) $ (3,071) $ 5 $ 1,880
Net income — — — 728 — — — 728
Other comprehensive income — — — — (199) — — (199)
Cash dividends — — — (172) — — — (172)
Shares issued:
Exercise of stock options 0.4 — (2) — — 23 — 21Vesting of performance shares andrestricted stock units 0.1 — (10) — — 4 — (6)
Employee stock purchase plan 0.1 — 2 — — 8 — 10
Employee savings plan 0.6 — 14 — — 35 — 49
Stock-based compensation — — 27 — — — — 27
Treasury share repurchases (2.9) — — — — (255) — (255)
Treasury share retirements (1) — (1) (44) (2,353) — 2,398 — —
Other — — — — — — 1 1
Balance at September 30, 2016 130.2 $ 1 $ 1,506 $ 3,327 $ (1,898) $ (858) $ 6 $ 2,084
Net income — — — 705 — — — 705
Other comprehensive income — — — — 323 — — 323
Cash dividends — — — (194) — — — (194)
Shares issued:
Exercise of stock options 1.1 — (5) — — 69 — 64Vesting of performance shares andrestricted stock units 0.2 — (12) — — 5 — (7)
Employee stock purchase plan 0.1 — 4 — — 7 — 11
Employee savings plan 0.5 — 21 — — 35 — 56
B/E Aerospace business acquisition 31.2 1 3,014 — — — — 3,015
Stock-based compensation — — 31 — — — — 31
Treasury share repurchases (0.4) — — — — (39) — (39)
Other — — — — — — 1 1
Balance at September 30, 2017 162.9 $ 2 $ 4,559 $ 3,838 $ (1,575) $ (781) $ 7 $ 6,050
(1) During the year ended September 30, 2016 the Company retired 40 million shares of treasury stock. These shares were retired at a weighted-average price of $59.95 per share, resulting in a$2.4 billion reduction in treasury stock. The retired shares were returned to the status of authorized and unissued.
See Notes to Consolidated Financial Statements.
64
ROCKWELL COLLINS, INC.
NOTES TO CONSOLIDATED FINANCIAL STATEMENTS 1. Business Description and Basis of Presentation
Rockwell Collins, Inc. (the Company or Rockwell Collins) designs, produces and supports cabin interior, communications and aviation systems and products forcommercial and military customers and provides information management services through voice and data communication networks and solutions worldwide.
The Company operates on a 52/53 week fiscal year ending on the Friday closest to September 30. Each of 2017 , 2016 , and 2015 were 52-week fiscal years. Forease of presentation, September 30 is utilized consistently throughout these financial statements and notes to represent the fiscal year end date. All date referencescontained herein relate to the Company's fiscal year unless otherwise stated.
On September 4, 2017, the Company entered into an Agreement and Plan of Merger (Merger Agreement) with United Technologies Corporation (UTC). TheMerger Agreement provides that the Company will be acquired by UTC. Each Company shareowner will receive $93.33 per share in cash and $46.67 in shares ofUTC common stock in the merger, subject to a 7.5 percent collar centered on UTC's August 22, 2017 closing share price of $115.69 . The transaction, which isexpected to close by the fourth quarter of 2018, is subject to the satisfaction of customary closing conditions and approval by certain regulators and the Company'sshareowners. The Company incurred $24 million of merger-related costs for the year ended September 30, 2017. These costs are included in Transaction andintegration costs in the Consolidated Statement of Operations. At September 30, 2017, $24 million of the merger-related costs were unpaid and included inAccounts payable on the Consolidated Statement of Financial Position.
On April 13, 2017, the Company acquired B/E Aerospace, a leading manufacturer of aircraft cabin interior products and services. As a result of the acquisition, anew Interior Systems segment was created. See Note 3 for additional information.
2. Significant Accounting Policies
ConsolidationThe consolidated financial statements include the accounts of the Company and all majority-owned subsidiaries. The Company has two consolidated subsidiarieswith income attributable to a noncontrolling interest. The net income and comprehensive income attributable to the noncontrolling interest is insignificant. TheCompany's investments in entities it does not control but over which it has the ability to exercise significant influence are accounted for under the equity methodand are included in Other Assets. All intercompany transactions are eliminated.
ForeignCurrencyTranslationandTransactionsThe functional currency for significant subsidiaries operating outside the United States is typically their respective local currency. Assets and liabilities ofsubsidiaries operating outside the United States with a functional currency other than the U.S. dollar are translated into U.S. dollars using the exchange rate at thebalance sheet date. Sales, costs and expenses are translated at the average exchange rates in effect during the period. Foreign currency translation gains and lossesare included as a component of Accumulated other comprehensive loss within the Consolidated Statements of Comprehensive Income and Equity.
Foreign exchange transaction losses due to the remeasurement of account balances in foreign currencies are included within the Consolidated Statement ofOperations and were $23 million for 2017 and were not material to the Company's results of operations for 2016 and 2015 .
RevenueRecognitionThe Company enters into sales arrangements that may provide for multiple deliverables to a customer. The Company identifies all goods and/or services that are tobe delivered separately under a sales arrangement and allocates revenue to each deliverable based on relative fair values. Fair values are generally established basedon the prices charged when sold separately by the Company. In general, revenues are separated between products, engineering, maintenance, communication andinstallation services. The allocated revenue for each deliverable is then recognized using appropriate revenue recognition methods.
Sales related to long-term contracts requiring development and delivery of products over several years are generally accounted for under the percentage-of-completion method of accounting in accordance with the Construction-Type and Production-Type Contracts subtopic of the Financial Accounting Standards Board(FASB) Accounting Standards Codification. The percentage-
65
ROCKWELL COLLINS, INC.
NOTES TO CONSOLIDATED FINANCIAL STATEMENTS (Continued)
of-completion method is predominately used in the Government Systems and Interior Systems segments and sales and earnings under qualifying contracts arerecorded either as products are shipped under the units-of-delivery method, or based on the ratio of actual costs incurred to total estimated costs expected to beincurred related to the contract under the cost-to-cost method. Purchase options and change orders are accounted for either as an integral part of the originalcontract or separately depending upon the nature and value of the item. Sales and costs related to profitable purchase options are included in estimates only whenthe options are exercised whereas sales and costs related to unprofitable purchase options are included in estimates when exercise is determined to be probable.Sales related to change orders are included in estimates only if they can be reliably estimated and collectability is reasonably assured. Anticipated losses oncontracts are recognized in full in the period in which losses become probable and estimable. Changes in estimates of profit or loss on contracts are included inearnings on a cumulative basis in the period the estimate is changed.
Sales related to long-term separately priced product maintenance or warranty contracts are accounted for based on the terms of the underlying agreements. Certaincontracts are fixed-price contracts with sales recognized ratably over the contractual life, while other contracts have a fixed hourly rate with sales recognized basedon actual labor or flight hours incurred. The cost of providing these services is expensed as incurred.
The Company recognizes sales for most other products or services when all of the following criteria are met: an agreement of sale exists, product delivery andacceptance has occurred or services have been rendered, pricing is fixed or determinable and collection is reasonably assured.
CashandCashEquivalentsCash and cash equivalents include time deposits, certificates of deposit with original maturity dates of three months or less and money market funds.
AllowanceforDoubtfulAccountsAllowances are established in order to report receivables at net realizable value on the Company's Consolidated Statement of Financial Position. The determinationof these allowances requires Company management to make estimates and judgments as to the collectability of customer account balances. The allowance fordoubtful accounts reflects the Company's best estimate of probable losses inherent in the accounts receivable balance. The Company determines the allowancebased on known troubled accounts, historical experience and other currently available evidence.
InventoriesInventories are stated at the lower of cost or market using costs which approximate the first-in, first-out method, less related progress payments received.Inventoried costs include direct costs of manufacturing, certain engineering costs and allocable overhead costs. The Company regularly compares inventoryquantities on hand on a part level basis to estimated forecasts of product demand and production requirements as well as historical usage. Based on thesecomparisons, management establishes an excess and obsolete inventory reserve as needed. Inventory valuation reserves were $89 million and $95 million atSeptember 30, 2017 and 2016, respectively.
The Company defers certain pre-production engineering costs during the development phase of a program in connection with long-term supply arrangements thatcontain contractual guarantees for reimbursement from customers. Such customer guarantees generally take the form of a minimum order quantity with quantifiedreimbursement amounts if the minimum order quantity is not taken by the customer. These costs are deferred to the extent of the contractual guarantees and areamortized over their estimated useful lives using a units-of-delivery method, up to 15 years. This amortization expense is included as a component of cost of sales.Amortization is based on the Company’s expectation of delivery rates on a program-by-program basis and begins when the Company starts recognizing revenue asthe Company delivers equipment for the program. The estimated useful life is limited to the amount of time the Company is virtually assured to earn revenuesunder long-term supply arrangements with the Company’s customers. Pre-production engineering costs incurred pursuant to supply arrangements that do notcontain customer guarantees for reimbursement are expensed as incurred.
ProgressPaymentsProgress payments relate to both receivables and inventories and represent cash collected from government-related contracts whereby the governments have a legalright of offset related to the receivable or legal title to the work-in-process inventory.
66
ROCKWELL COLLINS, INC.
NOTES TO CONSOLIDATED FINANCIAL STATEMENTS (Continued)
PropertyProperty is stated at acquisition cost, net of accumulated depreciation. Depreciation of property is generally provided using straight-line methods over the followingestimated useful lives: buildings and improvements, 15 - 50 years; machinery and equipment (including internally developed software and other costs associatedwith the expansion and construction of Information Management Services network-related assets), 5 - 20 years; information systems software and hardware, 5 - 17 years; and furniture and fixtures, 12 - 16 years. Depreciation methods and lives are reviewed periodically with any changes recorded on a prospective basis.
Significant renewals and betterments are capitalized and replaced units are written off. Maintenance and repairs, as well as renewals of minor amounts, are chargedto expense in the period incurred. The fair value of liabilities associated with the retirement of property is recorded when there is a legal or contractual requirementto incur such costs and the costs can be reasonably estimated. Upon the initial recognition of a contractual or legal liability for an asset retirement obligation, theCompany capitalizes the asset retirement cost by increasing the carrying amount of the property by the same amount as the liability. This asset retirement cost isthen depreciated over the estimated useful life of the underlying property. The Company did not have any significant asset retirement obligations at September 30,2017 and 2016 .
GoodwillandIntangibleAssetsGoodwill and intangible assets generally result from business acquisitions. The purchase price of the acquisition is assigned to tangible and intangible assets andliabilities assumed based on fair value. The excess of the purchase price over the amounts assigned is recorded as goodwill. Assets acquired and liabilities assumedare allocated to the Company's reporting units based on the Company's integration plans and internal reporting structure. As of September 30, 2017 the Companyhad eight reporting units. Purchased intangible assets with finite lives are amortized, generally on a straight-line basis, over their estimated useful lives, rangingfrom 4 - 23 years. Goodwill and intangible assets with indefinite lives are not amortized, but are reviewed at least annually for impairment.
CustomerRelationshipUp-FrontSalesIncentivesThe Company provides up-front sales incentives prior to delivering products or performing services to certain commercial customers in connection with salescontracts. Up-front sales incentives are recorded as a customer relationship intangible asset and are amortized using a units-of-delivery method over the period theCompany has received a contractually enforceable right related to the incentives, up to 15 years after entry into service. Amortization is based on the Company’sexpectation of delivery rates on a program-by-program basis. Amortization begins when the Company starts recognizing revenue as the Company deliversequipment for the program. Up-front sales incentives consisting of cash payments or customer account credits are amortized as a reduction of sales, whereasincentives consisting of free products are amortized as cost of sales.
AccruedCustomerIncentivesIncentives earned by customers based on purchases of Company products or services are recognized as a liability when the related sale is recorded. Incentivesconsisting of cash payments or customer account credits are recognized as a reduction of sales, while incentives consisting of free products and account creditswhere the customer's use is restricted to future purchases are recognized as cost of sales.
ImpairmentofLong-LivedAssetsLong-lived assets are reviewed for impairment when management plans to dispose of assets or when events or circumstances indicate that the carrying amount of along-lived asset is more-likely-than-not unrecoverable. Assets held for disposal are reported at the lower of the carrying amount or fair value less cost to sell.Management determines fair value using a discounted future cash flow analysis or other accepted valuation techniques. Long-lived assets held for use are reviewedfor impairment by comparing the carrying amount of an asset to the undiscounted future cash flows expected to be generated by the asset over its remaining usefullife. If an asset is considered to be impaired, the impairment to be recognized is measured as the amount by which the carrying amount of the asset exceeds its fairvalue.
Goodwill and indefinite-lived intangible assets are tested annually for impairment with more frequent tests performed if indications of impairment exist. In 2017,the Company changed the goodwill impairment testing date from the second quarter to the fourth quarter to better align with the timing of the annual strategicplanning process. This change required the Company to test goodwill for impairment during both the second and fourth quarter of 2017. Impairment for intangibleassets with indefinite lives exists if the carrying value of the intangible asset exceeds its fair value. Goodwill is potentially impaired if the carrying value of areporting unit exceeds its estimated fair value.
67
ROCKWELL COLLINS, INC.
NOTES TO CONSOLIDATED FINANCIAL STATEMENTS (Continued)
AdvancePaymentsfromCustomersAdvance payments from customers represent cash collected from customers in advance of revenue recognition.
CapitalLeasesAssets under capital lease and capital lease obligation are initially measured at the lower of estimated fair value or present value of the minimum lease payments.The present value of minimum lease payments is calculated for payments during the noncancelable lease term using the lower of the Company's estimatedincremental borrowing rate or the rate implicit in the lease, if known. Capital lease obligation is recorded within Other Liabilities and the related assets are recordedin Property or Other Assets based upon their intended use. Payments are allocated between a reduction of the lease obligation and interest expense using theinterest method. Assets under capital lease are depreciated over the noncancelable lease term, ranging from 5 - 15 years, consistent with the Company'sdepreciation policy.
ResearchandDevelopmentThe Company performs R&D activities relating to the development of new products and the improvement of existing products. Company-funded R&D programsare expensed as incurred and included in cost of sales. Company-funded R&D expenditures were $327 million , $224 million and $272 million for fiscal yearsended September 30, 2017 , 2016 and 2015 , respectively.
EnvironmentalLiabilities for environmental matters are recorded in the period in which it is probable that an obligation has been incurred and the cost can be reasonablyestimated. At environmental sites in which more than one potentially responsible party has been identified, the Company records a liability for its estimatedallocable share of costs related to its involvement with the site as well as an estimated allocable share of costs related to the involvement of insolvent orunidentified parties. At environmental sites in which the Company is the only responsible party, the Company records a liability for the total estimated costs ofremediation.
IncomeTaxesCurrent tax liabilities and assets are based upon an estimate of taxes payable or refundable in the current year for each jurisdiction in which the Company is subjectto tax. As part of the determination of its tax liability, management exercises considerable judgment in evaluating tax positions taken by the Company indetermining the income tax provision and establishes reserves for uncertain tax positions in accordance with the Income Taxes topic of the FASB AccountingStandards Codification. Deferred tax assets and liabilities are recorded for the estimated future tax effects attributable to temporary differences between thecarrying amounts of assets and liabilities used for financial reporting purposes and their respective carrying amounts for income tax purposes. Deferred tax assetsare reduced by a valuation allowance when, in the opinion of management, it is more likely than not that some portion or all of the deferred tax assets will not berealized.
DerivativeFinancialInstrumentsThe Company uses derivative financial instruments in the form of foreign currency forward exchange contracts and interest rate swap contracts for the purpose ofreducing exposure to changes in foreign currency exchange rates on business transactions and interest rates, respectively. The Company's policy is to execute suchinstruments with banks the Company believes to be creditworthy and not enter into derivative financial instruments for speculative purposes or to manage exposurefor net investments in non-U.S. subsidiaries. These derivative financial instruments do not subject the Company to undue risk as gains and losses on theseinstruments generally offset gains and losses on the underlying assets, liabilities or anticipated transactions that are being hedged.
All derivative financial instruments are recorded at fair value in the Consolidated Statement of Financial Position. For a derivative that has not been designated asan accounting hedge, the change in fair value is recognized immediately through earnings. For a derivative that has been designated as an accounting hedge of anexisting asset or liability (a fair value hedge), the change in the fair value of both the derivative and underlying asset or liability is recognized immediately throughearnings. For a derivative designated as an accounting hedge of an anticipated transaction (a cash flow hedge), the change in the fair value is recorded on theConsolidated Statement of Financial Position in Accumulated other comprehensive loss to the extent the derivative is effective in mitigating the exposure related tothe anticipated transaction. The change in the fair value related to the ineffective portion of the hedge, if any, is immediately recognized in earnings. The amountrecorded within Accumulated other comprehensive loss is reclassified into earnings in the same period during which the underlying hedged transaction
68
ROCKWELL COLLINS, INC.
NOTES TO CONSOLIDATED FINANCIAL STATEMENTS (Continued)
affects earnings. The Company does not exclude any amounts from the measure of effectiveness for both fair value and cash flow hedges.
UseofEstimatesThe financial statements of the Company have been prepared in accordance with accounting principles generally accepted in the United States of America, whichrequire management to make estimates and assumptions that affect the amounts reported in the financial statements. Actual results could differ from thoseestimates. Estimates are used in accounting for, among other items, long-term contracts, allowances for doubtful accounts, inventory obsolescence, productwarranty cost liabilities, customer incentives, retirement benefits, income taxes, environmental matters, pre-production engineering costs, recoverability of long-lived assets and contingencies. Estimates and assumptions are reviewed periodically and the effects of changes, if any, are reflected in the Consolidated Statementof Operations in the period they are determined.
ConcentrationofRisksThe Company's products and services are concentrated within the aerospace and defense industries with customers consisting primarily of military and commercialaircraft manufacturers, commercial airlines, the U.S. Government and non-U.S. governments. As a result of this industry focus, the Company's current and futurefinancial performance is largely dependent upon the overall economic conditions within these industries. In particular, the commercial aerospace market has beenhistorically cyclical and subject to downturns during periods of weak economic conditions, which could be prompted or exacerbated by political or other U.S. orinternational events. The defense market may be affected by changes in budget appropriations, procurement policies, political developments both in the U.S. andabroad and other factors. The Company depends to a large degree on U.S. Government spending, as a significant portion of the Company's sales are derived fromU.S. Government contracts, both directly and indirectly through subcontracts.
The U.S. Government has implemented various initiatives to address its fiscal challenges. In August 2011, Congress enacted the Budget Control Act (BCA) of2011 which imposed spending caps and certain reductions in security spending over a ten-year period through 2021. These spending caps and reductions, referredto as sequestration, went into effect in March 2013. Through a series of bipartisan agreements, Congress has been able to temporarily lift discretionary spendinglimits every year through 2017. However, unless a new agreement is enacted, the BCA will again be in force beginning in 2018. The continued uncertaintysurrounding the U.S. defense budget could have a material adverse effect on the Company and the defense industry in general.
In years when the U.S. Government does not complete its annual budget and appropriations process prior to the beginning of its fiscal year (October 1),government operations are typically funded through a continuing resolution that authorizes agencies of the U.S. Government to continue to operate in the new year,but generally does not authorize new spending initiatives. During periods covered by a continuing resolution (or until the regular appropriation bills are passed), theCompany may experience delays by the government in the procurement of new or existing products and services which can adversely impact results of operationsand cause variability in the timing of revenue between periods. The government began operations in fiscal year 2018 under a continuing resolution that is set toexpire in December 2017. The Company remains confident that its product offerings are well positioned to meet the needs of government customers in thisuncertain environment and the Company continues to enhance international strategies and make proactive adjustments to the Company's cost structure asnecessary.
In addition to the overall business risks associated with the Company's concentration within the aerospace and defense industries, the Company is also exposed to aconcentration of collection risk on credit extended to certain aircraft manufacturers and airlines. The Company performs ongoing credit evaluations on the financialcondition of all of its customers and maintains allowances for uncollectible accounts receivable based on expected collectability. Although management believes itsallowances are adequate, the Company is not able to predict with certainty the changes in the financial stability of its customers. Any material change in thefinancial status of any one customer or group of customers could have a material adverse effect on the Company's results of operations, financial position or cashflows.
As of September 30, 2017 , approximately 11 percent of the Company's employees in the U.S. were represented by U.S. collective bargaining agreements, most ofwhich were renewed without disruption in May 2013 and are set to expire in 2018.
RecentlyAdoptedAccountingStandardsIn April 2015, the FASB issued a new standard on the presentation of debt issuance costs, which requires debt issuance costs to be presented on the balance sheetas a deduction from the carrying amount of the related debt liability, consistent with the
69
ROCKWELL COLLINS, INC.
NOTES TO CONSOLIDATED FINANCIAL STATEMENTS (Continued)
presentation of unamortized debt discounts. Previously, debt issuance costs were presented as a deferred asset. The Company adopted the new guidance during thethree months ended December 31, 2016 on a retrospective basis, which resulted in the reclassification of $8 million and $10 million of Other assets to Long-termdebt, net as of September 30, 2016 and September 30, 2015, respectively.
In March 2016, the FASB issued a new standard simplifying certain aspects of accounting for share-based payments (see Note 12). The new standard requires thatexcess tax benefits and shortfalls be recorded as income tax benefit or expense in the income statement, rather than in equity, and requires excess tax benefits fromstock-based compensation to be classified within operating cash flow. Additionally, the new standard allows a policy election to either estimate the number ofawards expected to be forfeited at the time of award issuance or record stock-based compensation for forfeitures as they occur. In order to simplify accounting forshare-based payments, the Company adopted the new guidance during the second quarter of 2016, which resulted in a $4 million benefit to tax expense and afavorable impact to operating cash flows of $4 million in 2016. With respect to forfeitures, the Company will continue to estimate the number of awards expectedto be forfeited upon award issuance.
RecentlyIssuedAccountingStandardsIn August 2017, the FASB issued a new standard on the hedge accounting and recognition requirements. The standard is intended to improve the transparency ofinformation presented in the financial statements along with simplifying hedge accounting requirements. The new standard is effective for the Company in 2020,with early adoption permitted. The Company has completed an evaluation of the new standard and does not expect that adoption will have a material impact on theCompany's consolidated financial statements.
In March 2017, the FASB issued a new standard on the presentation of the net periodic cost of postretirement benefit programs. The new standard requiressponsors of defined benefit postretirement plans to present the non-service cost components of net periodic benefit cost separate from the service cost componenton the income statement. The new standard also requires that the non-service cost components of net periodic benefit cost no longer be capitalized within assets.The Company is evaluating the effects the standard will have on the Company's consolidated financial statements and related disclosures beyond the change inincome statement presentation. This new standard is effective for the Company in 2019, with early adoption permitted.
In January 2017, the FASB issued a new standard which simplifies testing for goodwill impairment. The new standard eliminates Step 2 of the goodwillimpairment test, which requires determining the fair value of assets acquired or liabilities assumed in a business combination. Under the amendments in thisupdate, a goodwill impairment test is performed by comparing the fair value of the reporting unit with its carrying amount. This new standard is effective for theCompany in 2021, with early adoption permitted. The Company has completed an evaluation of the new standard and does not expect that adoption will have amaterial impact on the Company's consolidated financial statements.
In June 2016, the FASB issued a new standard on the measurement of credit losses, which will impact the Company's measurement of trade receivables. The newstandard replaces the current incurred loss model with a forward-looking expected loss model that is likely to result in earlier recognition of losses. The newstandard also increases disclosure requirements and is effective for the Company in 2021, with early adoption permitted, but not earlier than 2020. The Companyhas completed an evaluation of the new standard and does not expect that adoption will have a material impact on the Company's consolidated financial statements.
In February 2016, the FASB issued a comprehensive new lease accounting standard, which provides revised guidance on accounting for lease arrangements byboth lessors and lessees. The central requirement of the new standard is that lessees must recognize lease-related assets and liabilities for all leases with a termlonger than 12 months. The Company is evaluating the effect the standard will have on the Company's consolidated financial statements and related disclosures,but expects a material change to the balance sheet due to the recognition of right-of-use assets and lease liabilities related to the Company's portfolio of real estateleases. The new guidance is not expected to materially impact accounting for those leases the Company enters with customers. The new standard is effective for theCompany in 2020, with early adoption permitted.
In May 2014, the FASB issued a comprehensive new revenue recognition standard that effectively replaces all current guidance on the topic. Several amendmentsto the new standard have been issued, which are intended to resolve potential implementation challenges and drive consistent interpretation and application of thenew standard. The new standard is effective for the
70
ROCKWELL COLLINS, INC.
NOTES TO CONSOLIDATED FINANCIAL STATEMENTS (Continued)
Company in 2019, with early adoption permitted, but not earlier than 2018. The guidance permits use of either a retrospective or cumulative effect transitionmethod.
The Company's interpretation of the new standard is substantially complete, and the Company has prepared an initial assessment of the impacts of adoption on itsconsolidated financial statements and disclosures. Anticipated changes under the new standard include, among other items, accounting for development costs andassociated customer funding related to commercial contracts, increased use of over time revenue recognition based on costs incurred for government contracts andthe elimination of customer relationship intangible assets related to free products provided to customers as up-front sales incentives. The new standard alsosignificantly enhances required disclosures regarding revenue and related assets and liabilities.
Of the anticipated changes, the Company expects that the change in accounting for commercial contract development costs and associated customer funding islikely to have the most significant impact on its financial statements. Customer funding received for development effort is currently recognized as revenue as thedevelopment activities are performed. Under the new standard, the Company has concluded that the development effort does not represent a performanceobligation. Therefore, customer funding specific to the development effort must be deferred as a contract liability and recognized as revenue when products aredelivered to the customer, delaying the timing of revenue recognition. The Company currently expenses development costs associated with commercial contractsunless the arrangement includes a contractual guarantee for reimbursement from the customer. Upon adoption of the new standard, development costs will beexpensed as incurred except for those costs incurred pursuant to customer funding. The amount of development costs eligible for deferral will be equivalent to theassociated customer funding. Subsequent to adoption, those deferred development costs will be recognized as expense when products are delivered to the customer,consistent with the amortization of deferred development specific customer funding into revenue. Development costs incurred pursuant to contractual guaranteesfor reimbursement will no longer be capitalized within Inventory as pre-production engineering costs. The balance of capitalized development costs withinInventory as of the adoption date will be eliminated and the related post-adoption amortization expense avoided.
The Company continues to evaluate the impacts associated with the new standard, assess the implications of the B/E Aerospace acquisition on the implementationplan and refine estimated impacts of adoption on the financial statements and related disclosures. The Company is in the process of implementing changes tobusiness processes, systems and internal controls required to implement the new accounting standard. As the Company recently entered into a Merger Agreementwith UTC, the Company is reassessing its adoption transition method in light of UTC's planned implementation approach.
Other new accounting standards issued but not effective until after September 30, 2017 are not expected to have a material impact on the Company's financialstatements.
3. Acquisitions, Goodwill and Intangible Assets
Acquisitions
B/EAerospaceOn April 13, 2017, the Company completed the acquisition of B/E Aerospace, a leading manufacturer of aircraft cabin interior products and services, for $6.5billion in cash and stock, plus the assumption of $2.0 billion of debt, net of cash acquired. The transaction combines the Company's capabilities in flight deckavionics, cabin electronics, mission communication and navigation, simulation and training and information management services with B/E Aerospace's range ofcabin interior products, which include seating, food and beverage preparation and storage equipment, lighting and oxygen systems, and modular galley and lavatorysystems for commercial airliners and business jets. The acquisition advances the Company’s global growth strategy by expanding the Company's previous focus oncockpit, cabin management, communication and connectivity solutions, and diversifies the Company's product portfolio and customer mix. Results of the acquiredbusiness are reported in the newly formed Interior Systems business segment.
71
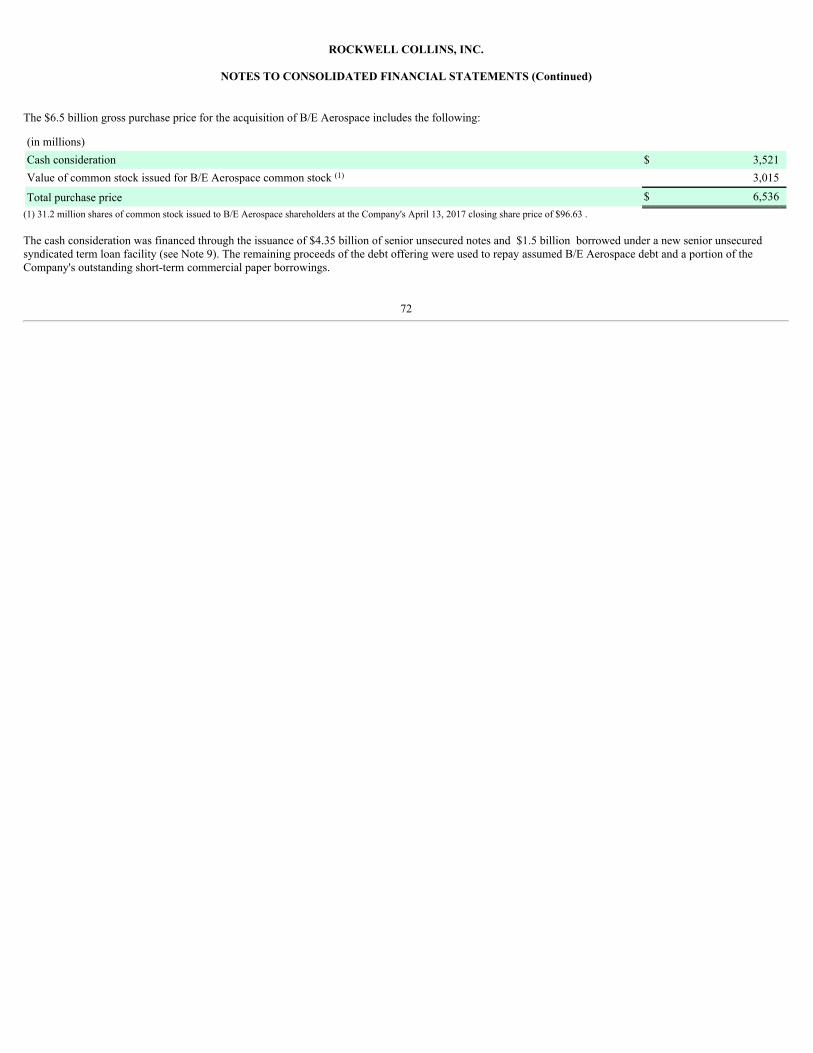
ROCKWELL COLLINS, INC.
NOTES TO CONSOLIDATED FINANCIAL STATEMENTS (Continued)
The $6.5 billion gross purchase price for the acquisition of B/E Aerospace includes the following:
(in millions) Cash consideration $ 3,521Value of common stock issued for B/E Aerospace common stock (1) 3,015
Total purchase price $ 6,536(1) 31.2 million shares of common stock issued to B/E Aerospace shareholders at the Company's April 13, 2017 closing share price of $96.63 .
The cash consideration was financed through the issuance of $4.35 billion of senior unsecured notes and $1.5 billion borrowed under a new senior unsecuredsyndicated term loan facility (see Note 9). The remaining proceeds of the debt offering were used to repay assumed B/E Aerospace debt and a portion of theCompany's outstanding short-term commercial paper borrowings.
72
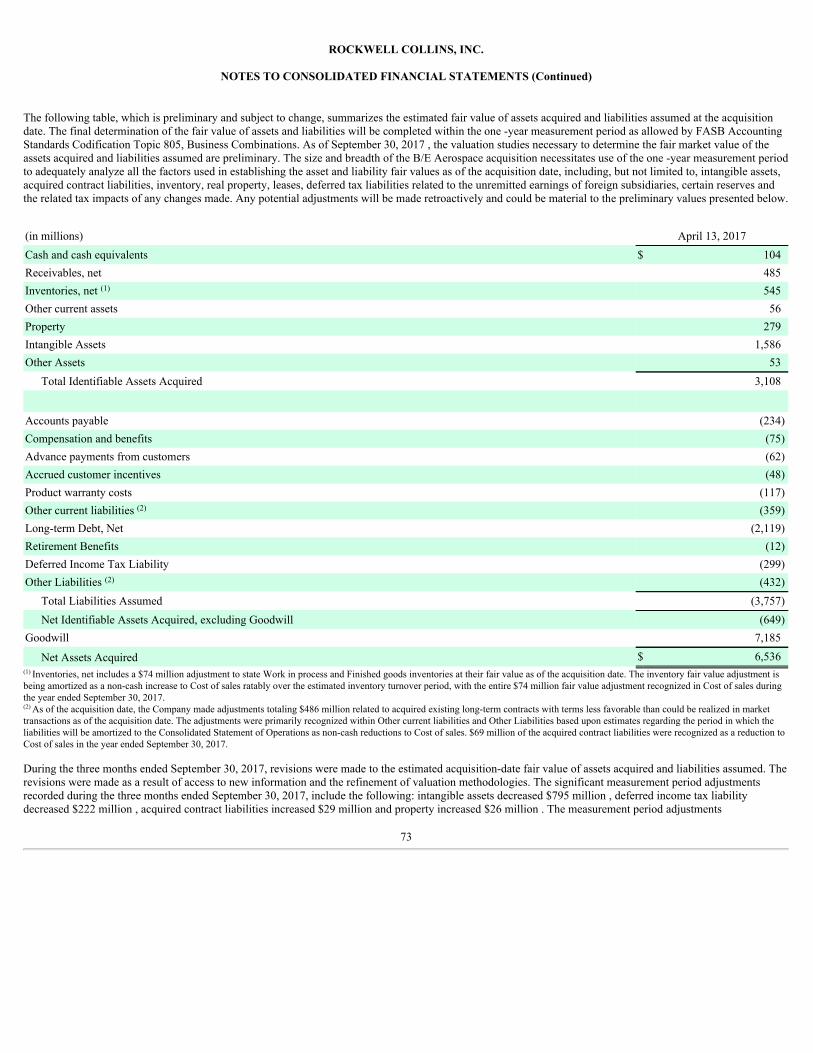
ROCKWELL COLLINS, INC.
NOTES TO CONSOLIDATED FINANCIAL STATEMENTS (Continued)
The following table, which is preliminary and subject to change, summarizes the estimated fair value of assets acquired and liabilities assumed at the acquisitiondate. The final determination of the fair value of assets and liabilities will be completed within the one -year measurement period as allowed by FASB AccountingStandards Codification Topic 805, Business Combinations. As of September 30, 2017 , the valuation studies necessary to determine the fair market value of theassets acquired and liabilities assumed are preliminary. The size and breadth of the B/E Aerospace acquisition necessitates use of the one -year measurement periodto adequately analyze all the factors used in establishing the asset and liability fair values as of the acquisition date, including, but not limited to, intangible assets,acquired contract liabilities, inventory, real property, leases, deferred tax liabilities related to the unremitted earnings of foreign subsidiaries, certain reserves andthe related tax impacts of any changes made. Any potential adjustments will be made retroactively and could be material to the preliminary values presented below.
(in millions) April 13, 2017Cash and cash equivalents $ 104Receivables, net 485Inventories, net (1) 545Other current assets 56Property 279Intangible Assets 1,586Other Assets 53
Total Identifiable Assets Acquired 3,108
Accounts payable (234)Compensation and benefits (75)Advance payments from customers (62)Accrued customer incentives (48)Product warranty costs (117)Other current liabilities (2) (359)Long-term Debt, Net (2,119)Retirement Benefits (12)Deferred Income Tax Liability (299)Other Liabilities (2) (432)
Total Liabilities Assumed (3,757)Net Identifiable Assets Acquired, excluding Goodwill (649)
Goodwill 7,185
Net Assets Acquired $ 6,536(1) Inventories, net includes a $74 million adjustment to state Work in process and Finished goods inventories at their fair value as of the acquisition date. The inventory fair value adjustment isbeing amortized as a non-cash increase to Cost of sales ratably over the estimated inventory turnover period, with the entire $74 million fair value adjustment recognized in Cost of sales duringthe year ended September 30, 2017.(2) As of the acquisition date, the Company made adjustments totaling $486 million related to acquired existing long-term contracts with terms less favorable than could be realized in markettransactions as of the acquisition date. The adjustments were primarily recognized within Other current liabilities and Other Liabilities based upon estimates regarding the period in which theliabilities will be amortized to the Consolidated Statement of Operations as non-cash reductions to Cost of sales. $69 million of the acquired contract liabilities were recognized as a reduction toCost of sales in the year ended September 30, 2017.
During the three months ended September 30, 2017, revisions were made to the estimated acquisition-date fair value of assets acquired and liabilities assumed. Therevisions were made as a result of access to new information and the refinement of valuation methodologies. The significant measurement period adjustmentsrecorded during the three months ended September 30, 2017, include the following: intangible assets decreased $795 million , deferred income tax liabilitydecreased $222 million , acquired contract liabilities increased $29 million and property increased $26 million . The measurement period adjustments
73
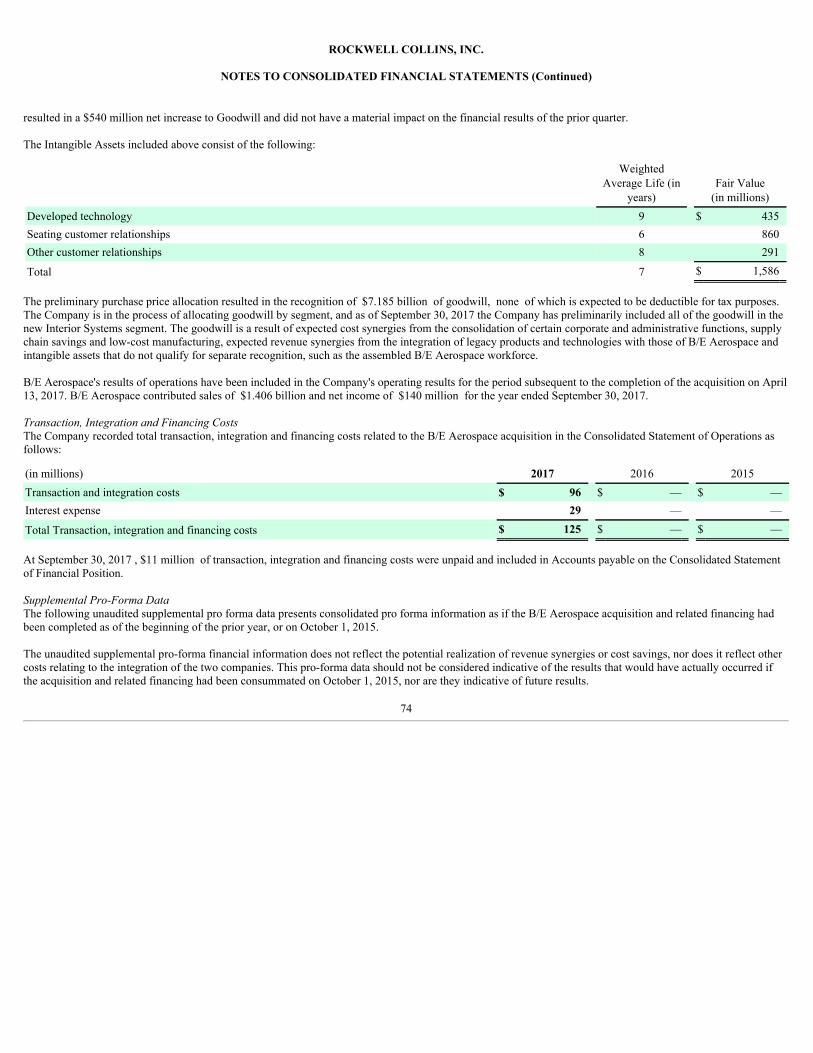
ROCKWELL COLLINS, INC.
NOTES TO CONSOLIDATED FINANCIAL STATEMENTS (Continued)
resulted in a $540 million net increase to Goodwill and did not have a material impact on the financial results of the prior quarter.
The Intangible Assets included above consist of the following:
WeightedAverage Life (in
years) Fair Value
(in millions)Developed technology 9 $ 435Seating customer relationships 6 860Other customer relationships 8 291
Total 7 $ 1,586
The preliminary purchase price allocation resulted in the recognition of $7.185 billion of goodwill, none of which is expected to be deductible for tax purposes.The Company is in the process of allocating goodwill by segment, and as of September 30, 2017 the Company has preliminarily included all of the goodwill in thenew Interior Systems segment. The goodwill is a result of expected cost synergies from the consolidation of certain corporate and administrative functions, supplychain savings and low-cost manufacturing, expected revenue synergies from the integration of legacy products and technologies with those of B/E Aerospace andintangible assets that do not qualify for separate recognition, such as the assembled B/E Aerospace workforce.
B/E Aerospace's results of operations have been included in the Company's operating results for the period subsequent to the completion of the acquisition on April13, 2017. B/E Aerospace contributed sales of $1.406 billion and net income of $140 million for the year ended September 30, 2017.
Transaction,IntegrationandFinancingCostsThe Company recorded total transaction, integration and financing costs related to the B/E Aerospace acquisition in the Consolidated Statement of Operations asfollows:
(in millions) 2017 2016 2015Transaction and integration costs $ 96 $ — $ —Interest expense 29 — —
Total Transaction, integration and financing costs $ 125 $ — $ —
At September 30, 2017 , $11 million of transaction, integration and financing costs were unpaid and included in Accounts payable on the Consolidated Statementof Financial Position.
SupplementalPro-FormaDataThe following unaudited supplemental pro forma data presents consolidated pro forma information as if the B/E Aerospace acquisition and related financing hadbeen completed as of the beginning of the prior year, or on October 1, 2015. The unaudited supplemental pro-forma financial information does not reflect the potential realization of revenue synergies or cost savings, nor does it reflect othercosts relating to the integration of the two companies. This pro-forma data should not be considered indicative of the results that would have actually occurred ifthe acquisition and related financing had been consummated on October 1, 2015, nor are they indicative of future results.
74

ROCKWELL COLLINS, INC.
NOTES TO CONSOLIDATED FINANCIAL STATEMENTS (Continued)
The unaudited supplemental pro forma financial information was calculated by combining the Company's results with the stand-alone results of B/E Aerospace forthe pre-acquisition periods, which were adjusted to account for certain transactions and other costs that would have been incurred during this pre-acquisitionperiod. The pro forma information included herein is preliminary and may be revised as additional information becomes available and as additional analysis isperformed within the one-year measurement period allowed by ASC 805. Any potential future adjustments could be material.
(in millions, except per share amounts) 2017 2016Pro forma sales $ 8,376 $ 8,121Pro forma net income attributable to common shareowners from continuing operations 886 691Pro forma basic earnings per share from continuing operations 6.09 4.27Pro forma diluted earnings per share from continuing operations 6.02 4.23
The following significant adjustments were made to account for certain transactions and costs that would have occurred if the B/E Aerospace acquisition had beencompleted on October 1, 2015. These adjustments are net of any applicable tax impact and were included to arrive at the pro forma results above. As theacquisition of B/E Aerospace was completed on April 13, 2017, the pro forma adjustments for the year ended September 30, 2017 in the table below include onlythe required adjustments through April 13, 2017.
(in millions) 2017 2016Increases (decreases) to pro forma net income:
Net reduction to depreciation resulting from fixed asset adjustments (1) $ 12 $ 21Advisory, legal and accounting service fees (2) 156 (123)Amortization of acquired B/E Aerospace intangible assets, net (3) (83) (152)Interest expense incurred on acquisition financing, net (4) (17) (65)Long-term contract program adjustments (5) (59) (128)Acquired contract liability amortization (6) 47 119Inventory fair value adjustment amortization (7) 56 (56)Compensation adjustments (8) 6 14
(1) Captures the net impact to depreciation expense resulting from various purchase accounting adjustments to fixed assets.(2) Reflects the elimination of transaction-related fees incurred by B/E Aerospace and Rockwell Collins in connection with the acquisition and assumes all of the fees were incurred during thefirst quarter of 2016.(3) Eliminates amortization of the historical B/E Aerospace intangible assets and replaces it with the new amortization for the acquired intangible assets.(4) Reflects the addition of interest expense for the debt incurred by Rockwell Collins to finance the B/E Aerospace acquisition, net of interest expense that was eliminated on the historical B/EAerospace debt that was repaid at the acquisition date. The adjustment also reflects the elimination of interest expense incurred by Rockwell Collins for bridge loan financing which wasassumed to not be required for purposes of the pro forma periods presented.(5) Eliminates B/E Aerospace capitalized development costs and deferred revenues on certain long-term contracts.(6) Reflects amortization of liabilities recognized for acquired contracts with terms less favorable than could be realized in market transactions as of the acquisition date.(7) Reflects amortization of adjustment made to state Work in process and Finished goods inventories at fair value as of the acquisition date.(8) Reflects reduction in compensation expense due to the vesting of B/E Aerospace stock awards upon the acquisition and the termination of certain B/E Aerospace executives and boardmembers.
75
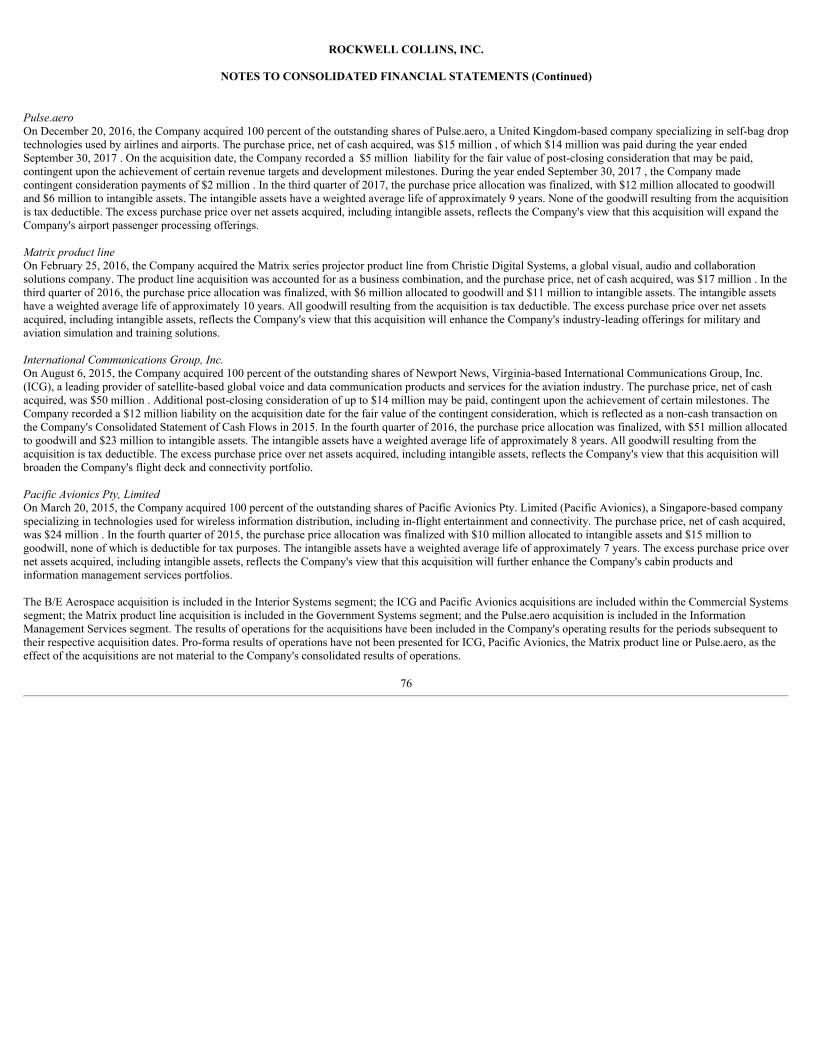
ROCKWELL COLLINS, INC.
NOTES TO CONSOLIDATED FINANCIAL STATEMENTS (Continued)
Pulse.aeroOn December 20, 2016, the Company acquired 100 percent of the outstanding shares of Pulse.aero, a United Kingdom-based company specializing in self-bag droptechnologies used by airlines and airports. The purchase price, net of cash acquired, was $15 million , of which $14 million was paid during the year endedSeptember 30, 2017 . On the acquisition date, the Company recorded a $5 million liability for the fair value of post-closing consideration that may be paid,contingent upon the achievement of certain revenue targets and development milestones. During the year ended September 30, 2017 , the Company madecontingent consideration payments of $2 million . In the third quarter of 2017, the purchase price allocation was finalized, with $12 million allocated to goodwilland $6 million to intangible assets. The intangible assets have a weighted average life of approximately 9 years. None of the goodwill resulting from the acquisitionis tax deductible. The excess purchase price over net assets acquired, including intangible assets, reflects the Company's view that this acquisition will expand theCompany's airport passenger processing offerings.
MatrixproductlineOn February 25, 2016, the Company acquired the Matrix series projector product line from Christie Digital Systems, a global visual, audio and collaborationsolutions company. The product line acquisition was accounted for as a business combination, and the purchase price, net of cash acquired, was $17 million . In thethird quarter of 2016, the purchase price allocation was finalized, with $6 million allocated to goodwill and $11 million to intangible assets. The intangible assetshave a weighted average life of approximately 10 years. All goodwill resulting from the acquisition is tax deductible. The excess purchase price over net assetsacquired, including intangible assets, reflects the Company's view that this acquisition will enhance the Company's industry-leading offerings for military andaviation simulation and training solutions.
InternationalCommunicationsGroup,Inc.On August 6, 2015, the Company acquired 100 percent of the outstanding shares of Newport News, Virginia-based International Communications Group, Inc.(ICG), a leading provider of satellite-based global voice and data communication products and services for the aviation industry. The purchase price, net of cashacquired, was $50 million . Additional post-closing consideration of up to $14 million may be paid, contingent upon the achievement of certain milestones. TheCompany recorded a $12 million liability on the acquisition date for the fair value of the contingent consideration, which is reflected as a non-cash transaction onthe Company's Consolidated Statement of Cash Flows in 2015. In the fourth quarter of 2016, the purchase price allocation was finalized, with $51 million allocatedto goodwill and $23 million to intangible assets. The intangible assets have a weighted average life of approximately 8 years. All goodwill resulting from theacquisition is tax deductible. The excess purchase price over net assets acquired, including intangible assets, reflects the Company's view that this acquisition willbroaden the Company's flight deck and connectivity portfolio.
PacificAvionicsPty,LimitedOn March 20, 2015, the Company acquired 100 percent of the outstanding shares of Pacific Avionics Pty. Limited (Pacific Avionics), a Singapore-based companyspecializing in technologies used for wireless information distribution, including in-flight entertainment and connectivity. The purchase price, net of cash acquired,was $24 million . In the fourth quarter of 2015, the purchase price allocation was finalized with $10 million allocated to intangible assets and $15 million togoodwill, none of which is deductible for tax purposes. The intangible assets have a weighted average life of approximately 7 years. The excess purchase price overnet assets acquired, including intangible assets, reflects the Company's view that this acquisition will further enhance the Company's cabin products andinformation management services portfolios.
The B/E Aerospace acquisition is included in the Interior Systems segment; the ICG and Pacific Avionics acquisitions are included within the Commercial Systemssegment; the Matrix product line acquisition is included in the Government Systems segment; and the Pulse.aero acquisition is included in the InformationManagement Services segment. The results of operations for the acquisitions have been included in the Company's operating results for the periods subsequent totheir respective acquisition dates. Pro-forma results of operations have not been presented for ICG, Pacific Avionics, the Matrix product line or Pulse.aero, as theeffect of the acquisitions are not material to the Company's consolidated results of operations.
76
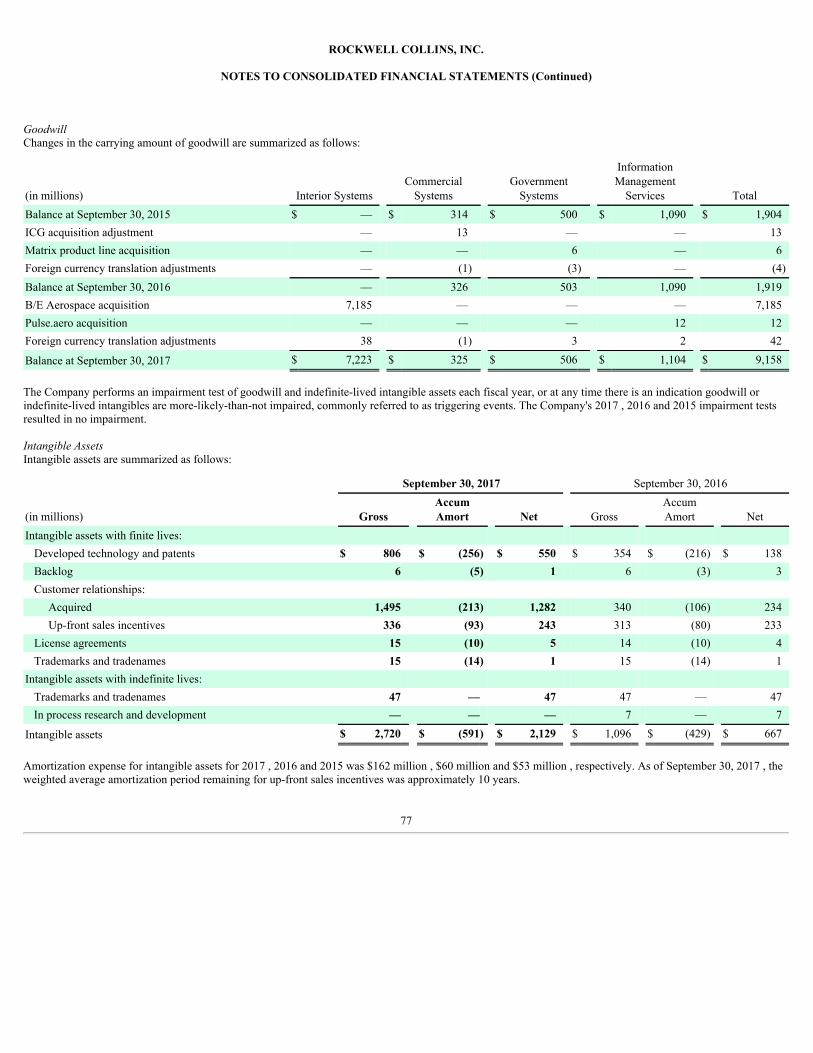
ROCKWELL COLLINS, INC.
NOTES TO CONSOLIDATED FINANCIAL STATEMENTS (Continued)
GoodwillChanges in the carrying amount of goodwill are summarized as follows:
(in millions) Interior Systems Commercial
Systems Government
Systems
InformationManagement
Services TotalBalance at September 30, 2015 $ — $ 314 $ 500 $ 1,090 $ 1,904ICG acquisition adjustment — 13 — — 13Matrix product line acquisition — — 6 — 6Foreign currency translation adjustments — (1) (3) — (4)Balance at September 30, 2016 — 326 503 1,090 1,919B/E Aerospace acquisition 7,185 — — — 7,185Pulse.aero acquisition — — — 12 12Foreign currency translation adjustments 38 (1) 3 2 42
Balance at September 30, 2017 $ 7,223 $ 325 $ 506 $ 1,104 $ 9,158
The Company performs an impairment test of goodwill and indefinite-lived intangible assets each fiscal year, or at any time there is an indication goodwill orindefinite-lived intangibles are more-likely-than-not impaired, commonly referred to as triggering events. The Company's 2017 , 2016 and 2015 impairment testsresulted in no impairment.
IntangibleAssetsIntangible assets are summarized as follows:
September 30, 2017 September 30, 2016
(in millions) Gross AccumAmort Net Gross
AccumAmort Net
Intangible assets with finite lives: Developed technology and patents $ 806 $ (256) $ 550 $ 354 $ (216) $ 138Backlog 6 (5) 1 6 (3) 3Customer relationships:
Acquired 1,495 (213) 1,282 340 (106) 234Up-front sales incentives 336 (93) 243 313 (80) 233
License agreements 15 (10) 5 14 (10) 4Trademarks and tradenames 15 (14) 1 15 (14) 1
Intangible assets with indefinite lives: Trademarks and tradenames 47 — 47 47 — 47
In process research and development — — — 7 — 7
Intangible assets $ 2,720 $ (591) $ 2,129 $ 1,096 $ (429) $ 667
Amortization expense for intangible assets for 2017 , 2016 and 2015 was $162 million , $60 million and $53 million , respectively. As of September 30, 2017 , theweighted average amortization period remaining for up-front sales incentives was approximately 10 years.
77
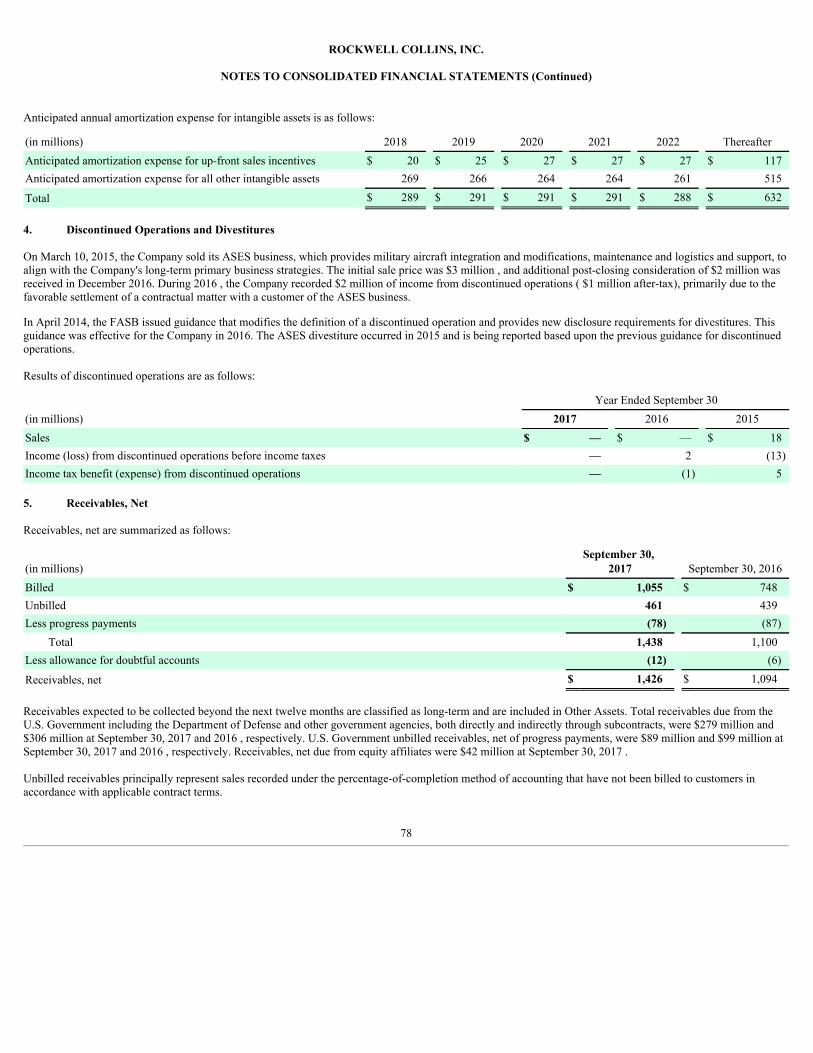
ROCKWELL COLLINS, INC.
NOTES TO CONSOLIDATED FINANCIAL STATEMENTS (Continued)
Anticipated annual amortization expense for intangible assets is as follows:
(in millions) 2018 2019 2020 2021 2022 ThereafterAnticipated amortization expense for up-front sales incentives $ 20 $ 25 $ 27 $ 27 $ 27 $ 117Anticipated amortization expense for all other intangible assets 269 266 264 264 261 515
Total $ 289 $ 291 $ 291 $ 291 $ 288 $ 632
4. Discontinued Operations and Divestitures
On March 10, 2015, the Company sold its ASES business, which provides military aircraft integration and modifications, maintenance and logistics and support, toalign with the Company's long-term primary business strategies. The initial sale price was $3 million , and additional post-closing consideration of $2 million wasreceived in December 2016. During 2016 , the Company recorded $2 million of income from discontinued operations ( $1 million after-tax), primarily due to thefavorable settlement of a contractual matter with a customer of the ASES business.
In April 2014, the FASB issued guidance that modifies the definition of a discontinued operation and provides new disclosure requirements for divestitures. Thisguidance was effective for the Company in 2016. The ASES divestiture occurred in 2015 and is being reported based upon the previous guidance for discontinuedoperations.
Results of discontinued operations are as follows:
Year Ended September 30(in millions) 2017 2016 2015Sales $ — $ — $ 18Income (loss) from discontinued operations before income taxes — 2 (13)Income tax benefit (expense) from discontinued operations — (1) 5
5. Receivables, Net
Receivables, net are summarized as follows:
(in millions)September 30,
2017 September 30, 2016Billed $ 1,055 $ 748Unbilled 461 439Less progress payments (78) (87)
Total 1,438 1,100Less allowance for doubtful accounts (12) (6)
Receivables, net $ 1,426 $ 1,094
Receivables expected to be collected beyond the next twelve months are classified as long-term and are included in Other Assets. Total receivables due from theU.S. Government including the Department of Defense and other government agencies, both directly and indirectly through subcontracts, were $279 million and$306 million at September 30, 2017 and 2016 , respectively. U.S. Government unbilled receivables, net of progress payments, were $89 million and $99 million atSeptember 30, 2017 and 2016 , respectively. Receivables, net due from equity affiliates were $42 million at September 30, 2017 .
Unbilled receivables principally represent sales recorded under the percentage-of-completion method of accounting that have not been billed to customers inaccordance with applicable contract terms.
78
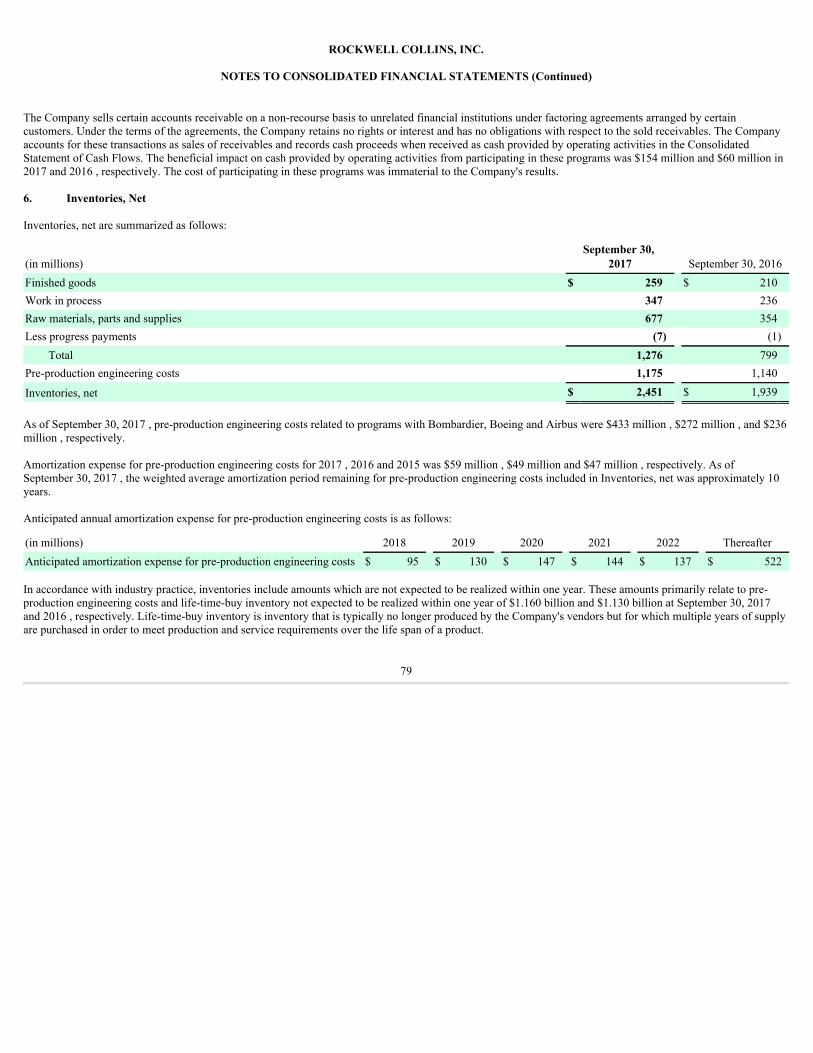
ROCKWELL COLLINS, INC.
NOTES TO CONSOLIDATED FINANCIAL STATEMENTS (Continued)
The Company sells certain accounts receivable on a non-recourse basis to unrelated financial institutions under factoring agreements arranged by certaincustomers. Under the terms of the agreements, the Company retains no rights or interest and has no obligations with respect to the sold receivables. The Companyaccounts for these transactions as sales of receivables and records cash proceeds when received as cash provided by operating activities in the ConsolidatedStatement of Cash Flows. The beneficial impact on cash provided by operating activities from participating in these programs was $154 million and $60 million in2017 and 2016 , respectively. The cost of participating in these programs was immaterial to the Company's results.
6. Inventories, Net
Inventories, net are summarized as follows:
(in millions)September 30,
2017 September 30, 2016Finished goods $ 259 $ 210Work in process 347 236Raw materials, parts and supplies 677 354Less progress payments (7) (1)
Total 1,276 799Pre-production engineering costs 1,175 1,140
Inventories, net $ 2,451 $ 1,939
As of September 30, 2017 , pre-production engineering costs related to programs with Bombardier, Boeing and Airbus were $433 million , $272 million , and $236million , respectively. Amortization expense for pre-production engineering costs for 2017 , 2016 and 2015 was $59 million , $49 million and $47 million , respectively. As ofSeptember 30, 2017 , the weighted average amortization period remaining for pre-production engineering costs included in Inventories, net was approximately 10years.
Anticipated annual amortization expense for pre-production engineering costs is as follows:
(in millions) 2018 2019 2020 2021 2022 ThereafterAnticipated amortization expense for pre-production engineering costs $ 95 $ 130 $ 147 $ 144 $ 137 $ 522 In accordance with industry practice, inventories include amounts which are not expected to be realized within one year. These amounts primarily relate to pre-production engineering costs and life-time-buy inventory not expected to be realized within one year of $1.160 billion and $1.130 billion at September 30, 2017and 2016 , respectively. Life-time-buy inventory is inventory that is typically no longer produced by the Company's vendors but for which multiple years of supplyare purchased in order to meet production and service requirements over the life span of a product.
79
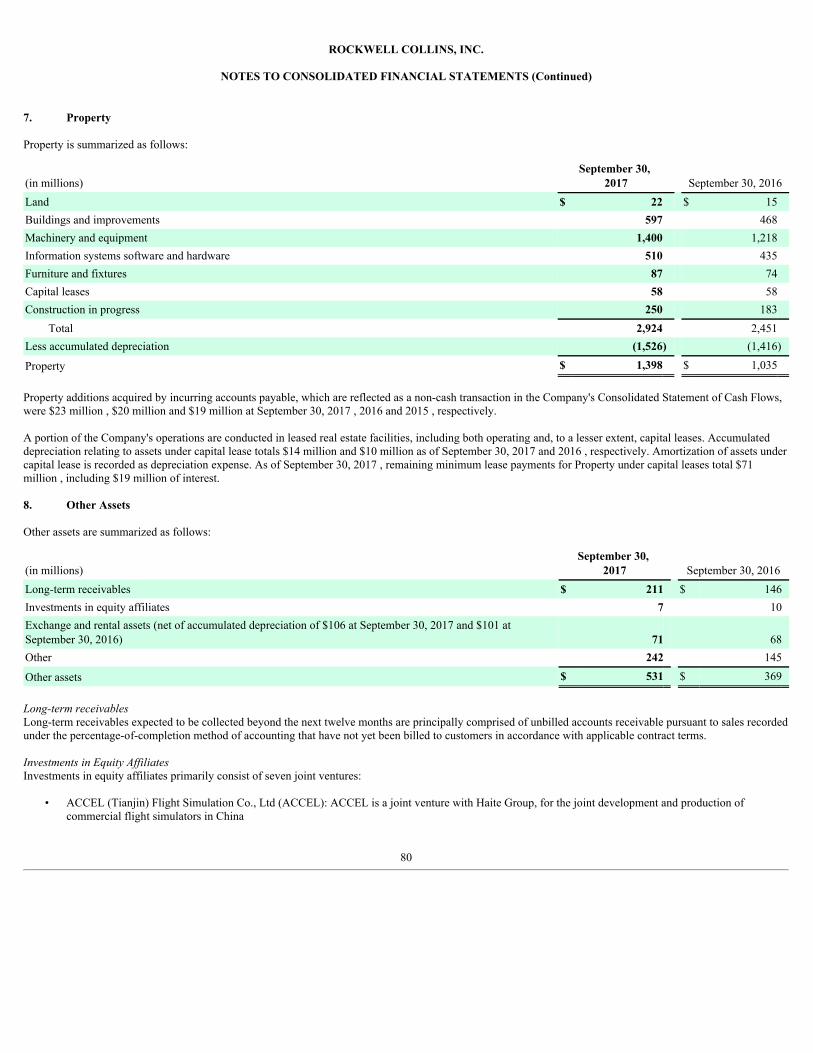
ROCKWELL COLLINS, INC.
NOTES TO CONSOLIDATED FINANCIAL STATEMENTS (Continued)
7. Property
Property is summarized as follows:
(in millions)September 30,
2017 September 30, 2016Land $ 22 $ 15Buildings and improvements 597 468Machinery and equipment 1,400 1,218Information systems software and hardware 510 435Furniture and fixtures 87 74Capital leases 58 58Construction in progress 250 183
Total 2,924 2,451Less accumulated depreciation (1,526) (1,416)
Property $ 1,398 $ 1,035
Property additions acquired by incurring accounts payable, which are reflected as a non-cash transaction in the Company's Consolidated Statement of Cash Flows,were $23 million , $20 million and $19 million at September 30, 2017 , 2016 and 2015 , respectively.
A portion of the Company's operations are conducted in leased real estate facilities, including both operating and, to a lesser extent, capital leases. Accumulateddepreciation relating to assets under capital lease totals $14 million and $10 million as of September 30, 2017 and 2016 , respectively. Amortization of assets undercapital lease is recorded as depreciation expense. As of September 30, 2017 , remaining minimum lease payments for Property under capital leases total $71million , including $19 million of interest.
8. Other Assets
Other assets are summarized as follows:
(in millions)September 30,
2017 September 30, 2016Long-term receivables $ 211 $ 146Investments in equity affiliates 7 10Exchange and rental assets (net of accumulated depreciation of $106 at September 30, 2017 and $101 atSeptember 30, 2016) 71 68Other 242 145
Other assets $ 531 $ 369
Long-termreceivablesLong-term receivables expected to be collected beyond the next twelve months are principally comprised of unbilled accounts receivable pursuant to sales recordedunder the percentage-of-completion method of accounting that have not yet been billed to customers in accordance with applicable contract terms.
InvestmentsinEquityAffiliatesInvestments in equity affiliates primarily consist of seven joint ventures:
• ACCEL (Tianjin) Flight Simulation Co., Ltd (ACCEL): ACCEL is a joint venture with Haite Group, for the joint development and production ofcommercial flight simulators in China
80
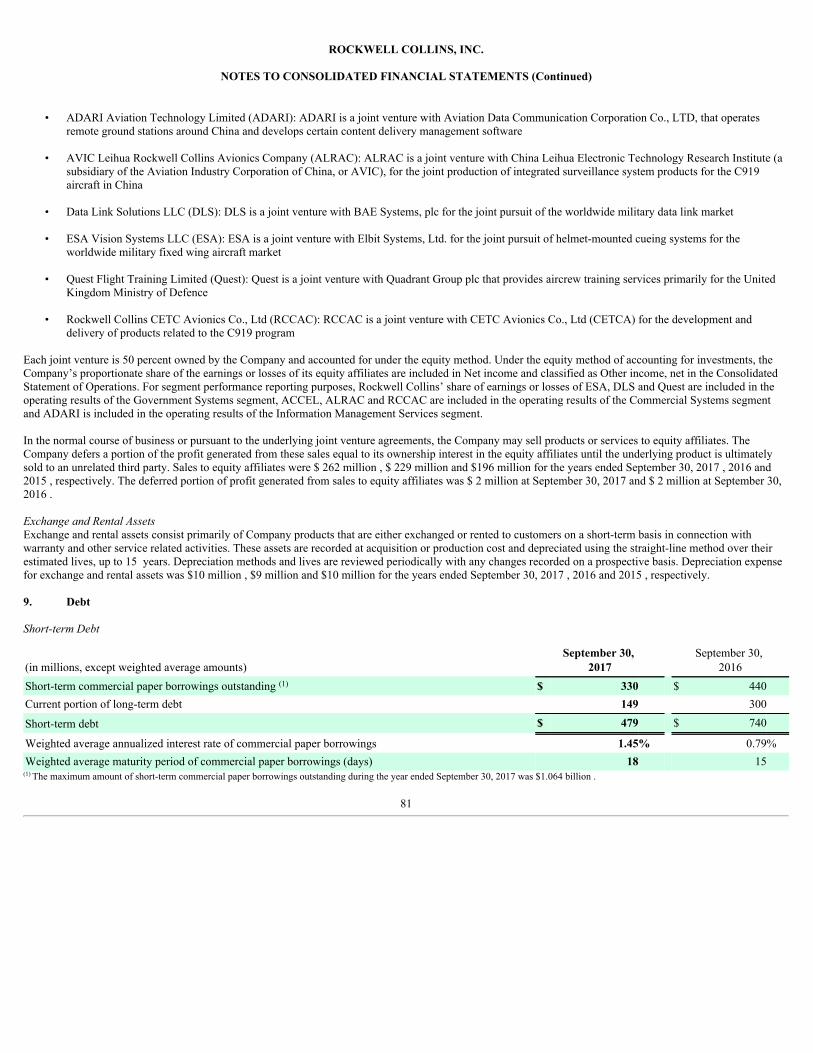
ROCKWELL COLLINS, INC.
NOTES TO CONSOLIDATED FINANCIAL STATEMENTS (Continued)
• ADARI Aviation Technology Limited (ADARI): ADARI is a joint venture with Aviation Data Communication Corporation Co., LTD, that operatesremote ground stations around China and develops certain content delivery management software
• AVIC Leihua Rockwell Collins Avionics Company (ALRAC): ALRAC is a joint venture with China Leihua Electronic Technology Research Institute (asubsidiary of the Aviation Industry Corporation of China, or AVIC), for the joint production of integrated surveillance system products for the C919aircraft in China
• Data Link Solutions LLC (DLS): DLS is a joint venture with BAE Systems, plc for the joint pursuit of the worldwide military data link market
• ESA Vision Systems LLC (ESA): ESA is a joint venture with Elbit Systems, Ltd. for the joint pursuit of helmet-mounted cueing systems for theworldwide military fixed wing aircraft market
• Quest Flight Training Limited (Quest): Quest is a joint venture with Quadrant Group plc that provides aircrew training services primarily for the UnitedKingdom Ministry of Defence
• Rockwell Collins CETC Avionics Co., Ltd (RCCAC): RCCAC is a joint venture with CETC Avionics Co., Ltd (CETCA) for the development anddelivery of products related to the C919 program
Each joint venture is 50 percent owned by the Company and accounted for under the equity method. Under the equity method of accounting for investments, theCompany’s proportionate share of the earnings or losses of its equity affiliates are included in Net income and classified as Other income, net in the ConsolidatedStatement of Operations. For segment performance reporting purposes, Rockwell Collins’ share of earnings or losses of ESA, DLS and Quest are included in theoperating results of the Government Systems segment, ACCEL, ALRAC and RCCAC are included in the operating results of the Commercial Systems segmentand ADARI is included in the operating results of the Information Management Services segment.
In the normal course of business or pursuant to the underlying joint venture agreements, the Company may sell products or services to equity affiliates. TheCompany defers a portion of the profit generated from these sales equal to its ownership interest in the equity affiliates until the underlying product is ultimatelysold to an unrelated third party. Sales to equity affiliates were $ 262 million , $ 229 million and $196 million for the years ended September 30, 2017 , 2016 and2015 , respectively. The deferred portion of profit generated from sales to equity affiliates was $ 2 million at September 30, 2017 and $ 2 million at September 30,2016 .
ExchangeandRentalAssetsExchange and rental assets consist primarily of Company products that are either exchanged or rented to customers on a short-term basis in connection withwarranty and other service related activities. These assets are recorded at acquisition or production cost and depreciated using the straight-line method over theirestimated lives, up to 15 years. Depreciation methods and lives are reviewed periodically with any changes recorded on a prospective basis. Depreciation expensefor exchange and rental assets was $10 million , $9 million and $10 million for the years ended September 30, 2017 , 2016 and 2015 , respectively.
9. Debt
Short-termDebt
(in millions, except weighted average amounts)September 30,
2017 September 30,
2016Short-term commercial paper borrowings outstanding (1) $ 330 $ 440Current portion of long-term debt 149 300
Short-term debt $ 479 $ 740
Weighted average annualized interest rate of commercial paper borrowings 1.45% 0.79%Weighted average maturity period of commercial paper borrowings (days) 18 15
(1) The maximum amount of short-term commercial paper borrowings outstanding during the year ended September 30, 2017 was $1.064 billion .
81
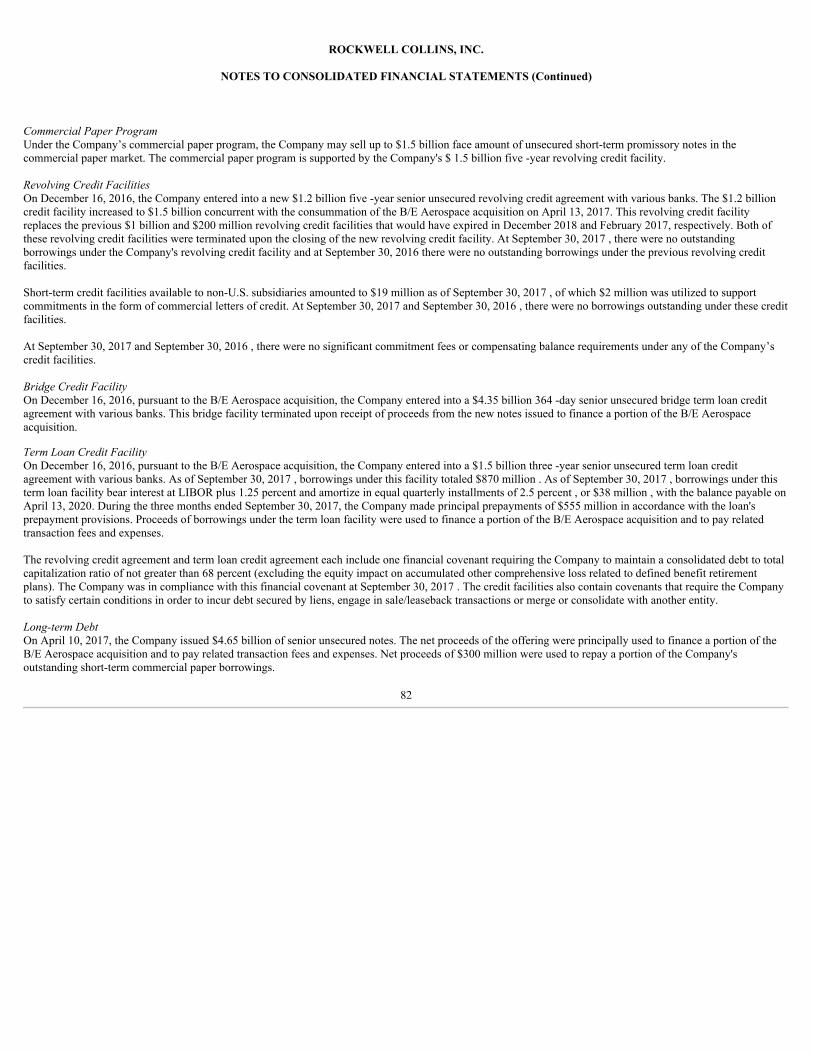
ROCKWELL COLLINS, INC.
NOTES TO CONSOLIDATED FINANCIAL STATEMENTS (Continued)
CommercialPaperProgramUnder the Company’s commercial paper program, the Company may sell up to $1.5 billion face amount of unsecured short-term promissory notes in thecommercial paper market. The commercial paper program is supported by the Company's $ 1.5 billion five -year revolving credit facility.
RevolvingCreditFacilitiesOn December 16, 2016, the Company entered into a new $1.2 billion five -year senior unsecured revolving credit agreement with various banks. The $1.2 billioncredit facility increased to $1.5 billion concurrent with the consummation of the B/E Aerospace acquisition on April 13, 2017. This revolving credit facilityreplaces the previous $1 billion and $200 million revolving credit facilities that would have expired in December 2018 and February 2017, respectively. Both ofthese revolving credit facilities were terminated upon the closing of the new revolving credit facility. At September 30, 2017 , there were no outstandingborrowings under the Company's revolving credit facility and at September 30, 2016 there were no outstanding borrowings under the previous revolving creditfacilities.
Short-term credit facilities available to non-U.S. subsidiaries amounted to $19 million as of September 30, 2017 , of which $2 million was utilized to supportcommitments in the form of commercial letters of credit. At September 30, 2017 and September 30, 2016 , there were no borrowings outstanding under these creditfacilities.
At September 30, 2017 and September 30, 2016 , there were no significant commitment fees or compensating balance requirements under any of the Company’scredit facilities.
BridgeCreditFacilityOn December 16, 2016, pursuant to the B/E Aerospace acquisition, the Company entered into a $4.35 billion 364 -day senior unsecured bridge term loan creditagreement with various banks. This bridge facility terminated upon receipt of proceeds from the new notes issued to finance a portion of the B/E Aerospaceacquisition.
TermLoanCreditFacilityOn December 16, 2016, pursuant to the B/E Aerospace acquisition, the Company entered into a $1.5 billion three -year senior unsecured term loan creditagreement with various banks. As of September 30, 2017 , borrowings under this facility totaled $870 million . As of September 30, 2017 , borrowings under thisterm loan facility bear interest at LIBOR plus 1.25 percent and amortize in equal quarterly installments of 2.5 percent , or $38 million , with the balance payable onApril 13, 2020. During the three months ended September 30, 2017, the Company made principal prepayments of $555 million in accordance with the loan'sprepayment provisions. Proceeds of borrowings under the term loan facility were used to finance a portion of the B/E Aerospace acquisition and to pay relatedtransaction fees and expenses.
The revolving credit agreement and term loan credit agreement each include one financial covenant requiring the Company to maintain a consolidated debt to totalcapitalization ratio of not greater than 68 percent (excluding the equity impact on accumulated other comprehensive loss related to defined benefit retirementplans). The Company was in compliance with this financial covenant at September 30, 2017 . The credit facilities also contain covenants that require the Companyto satisfy certain conditions in order to incur debt secured by liens, engage in sale/leaseback transactions or merge or consolidate with another entity.
Long-termDebtOn April 10, 2017, the Company issued $4.65 billion of senior unsecured notes. The net proceeds of the offering were principally used to finance a portion of theB/E Aerospace acquisition and to pay related transaction fees and expenses. Net proceeds of $300 million were used to repay a portion of the Company'soutstanding short-term commercial paper borrowings.
82
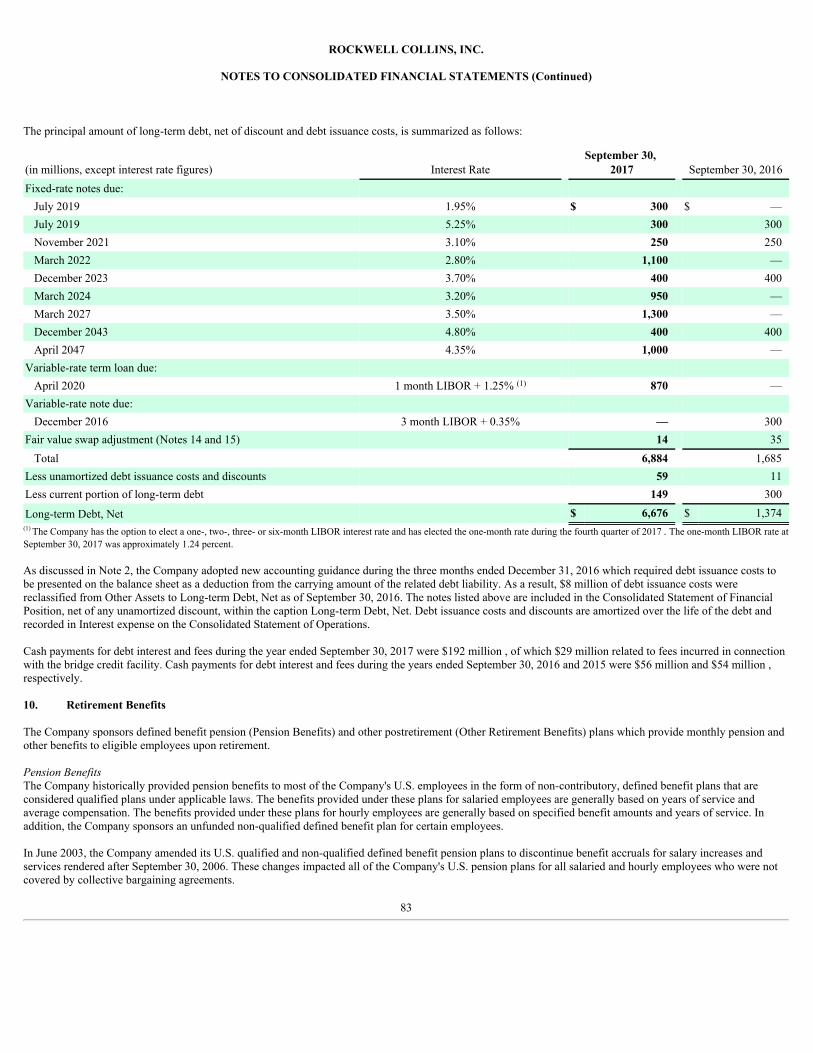
ROCKWELL COLLINS, INC.
NOTES TO CONSOLIDATED FINANCIAL STATEMENTS (Continued)
The principal amount of long-term debt, net of discount and debt issuance costs, is summarized as follows:
(in millions, except interest rate figures) Interest Rate September 30,
2017 September 30, 2016Fixed-rate notes due:
July 2019 1.95% $ 300 $ —July 2019 5.25% 300 300November 2021 3.10% 250 250March 2022 2.80% 1,100 —December 2023 3.70% 400 400March 2024 3.20% 950 —March 2027 3.50% 1,300 —December 2043 4.80% 400 400April 2047 4.35% 1,000 —
Variable-rate term loan due: April 2020 1 month LIBOR + 1.25% (1) 870 —
Variable-rate note due: December 2016 3 month LIBOR + 0.35% — 300
Fair value swap adjustment (Notes 14 and 15) 14 35Total 6,884 1,685
Less unamortized debt issuance costs and discounts 59 11Less current portion of long-term debt 149 300
Long-term Debt, Net $ 6,676 $ 1,374(1) The Company has the option to elect a one-, two-, three- or six-month LIBOR interest rate and has elected the one-month rate during the fourth quarter of 2017 . The one-month LIBOR rate atSeptember 30, 2017 was approximately 1.24 percent.
As discussed in Note 2, the Company adopted new accounting guidance during the three months ended December 31, 2016 which required debt issuance costs tobe presented on the balance sheet as a deduction from the carrying amount of the related debt liability. As a result, $8 million of debt issuance costs werereclassified from Other Assets to Long-term Debt, Net as of September 30, 2016. The notes listed above are included in the Consolidated Statement of FinancialPosition, net of any unamortized discount, within the caption Long-term Debt, Net. Debt issuance costs and discounts are amortized over the life of the debt andrecorded in Interest expense on the Consolidated Statement of Operations.
Cash payments for debt interest and fees during the year ended September 30, 2017 were $192 million , of which $29 million related to fees incurred in connectionwith the bridge credit facility. Cash payments for debt interest and fees during the years ended September 30, 2016 and 2015 were $56 million and $54 million ,respectively.
10. Retirement Benefits
The Company sponsors defined benefit pension (Pension Benefits) and other postretirement (Other Retirement Benefits) plans which provide monthly pension andother benefits to eligible employees upon retirement.
PensionBenefitsThe Company historically provided pension benefits to most of the Company's U.S. employees in the form of non-contributory, defined benefit plans that areconsidered qualified plans under applicable laws. The benefits provided under these plans for salaried employees are generally based on years of service andaverage compensation. The benefits provided under these plans for hourly employees are generally based on specified benefit amounts and years of service. Inaddition, the Company sponsors an unfunded non-qualified defined benefit plan for certain employees. In June 2003, the Company amended its U.S. qualified and non-qualified defined benefit pension plans to discontinue benefit accruals for salary increases andservices rendered after September 30, 2006. These changes impacted all of the Company's U.S. pension plans for all salaried and hourly employees who were notcovered by collective bargaining agreements.
83
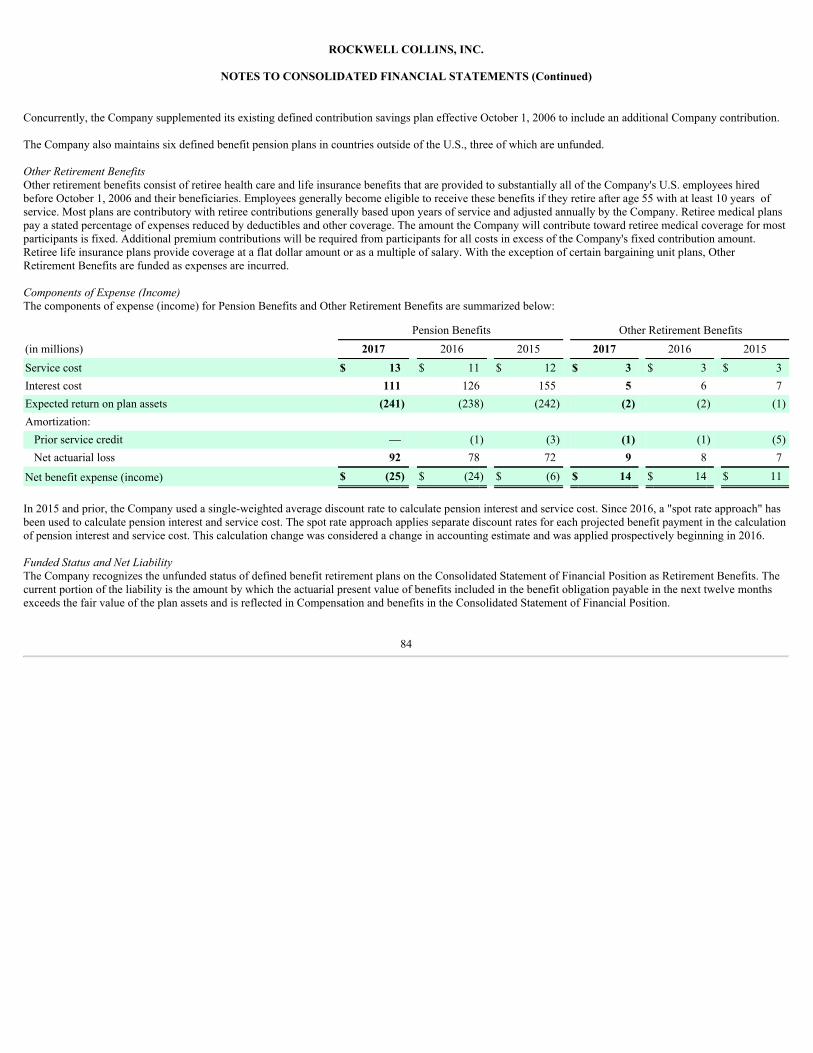
ROCKWELL COLLINS, INC.
NOTES TO CONSOLIDATED FINANCIAL STATEMENTS (Continued)
Concurrently, the Company supplemented its existing defined contribution savings plan effective October 1, 2006 to include an additional Company contribution.
The Company also maintains six defined benefit pension plans in countries outside of the U.S., three of which are unfunded.
OtherRetirementBenefitsOther retirement benefits consist of retiree health care and life insurance benefits that are provided to substantially all of the Company's U.S. employees hiredbefore October 1, 2006 and their beneficiaries. Employees generally become eligible to receive these benefits if they retire after age 55 with at least 10 years ofservice. Most plans are contributory with retiree contributions generally based upon years of service and adjusted annually by the Company. Retiree medical planspay a stated percentage of expenses reduced by deductibles and other coverage. The amount the Company will contribute toward retiree medical coverage for mostparticipants is fixed. Additional premium contributions will be required from participants for all costs in excess of the Company's fixed contribution amount.Retiree life insurance plans provide coverage at a flat dollar amount or as a multiple of salary. With the exception of certain bargaining unit plans, OtherRetirement Benefits are funded as expenses are incurred.
ComponentsofExpense(Income)The components of expense (income) for Pension Benefits and Other Retirement Benefits are summarized below:
Pension Benefits Other Retirement Benefits(in millions) 2017 2016 2015 2017 2016 2015Service cost $ 13 $ 11 $ 12 $ 3 $ 3 $ 3Interest cost 111 126 155 5 6 7Expected return on plan assets (241) (238) (242) (2) (2) (1)Amortization:
Prior service credit — (1) (3) (1) (1) (5)Net actuarial loss 92 78 72 9 8 7
Net benefit expense (income) $ (25) $ (24) $ (6) $ 14 $ 14 $ 11
In 2015 and prior, the Company used a single-weighted average discount rate to calculate pension interest and service cost. Since 2016, a "spot rate approach" hasbeen used to calculate pension interest and service cost. The spot rate approach applies separate discount rates for each projected benefit payment in the calculationof pension interest and service cost. This calculation change was considered a change in accounting estimate and was applied prospectively beginning in 2016.
FundedStatusandNetLiabilityThe Company recognizes the unfunded status of defined benefit retirement plans on the Consolidated Statement of Financial Position as Retirement Benefits. Thecurrent portion of the liability is the amount by which the actuarial present value of benefits included in the benefit obligation payable in the next twelve monthsexceeds the fair value of the plan assets and is reflected in Compensation and benefits in the Consolidated Statement of Financial Position.
84
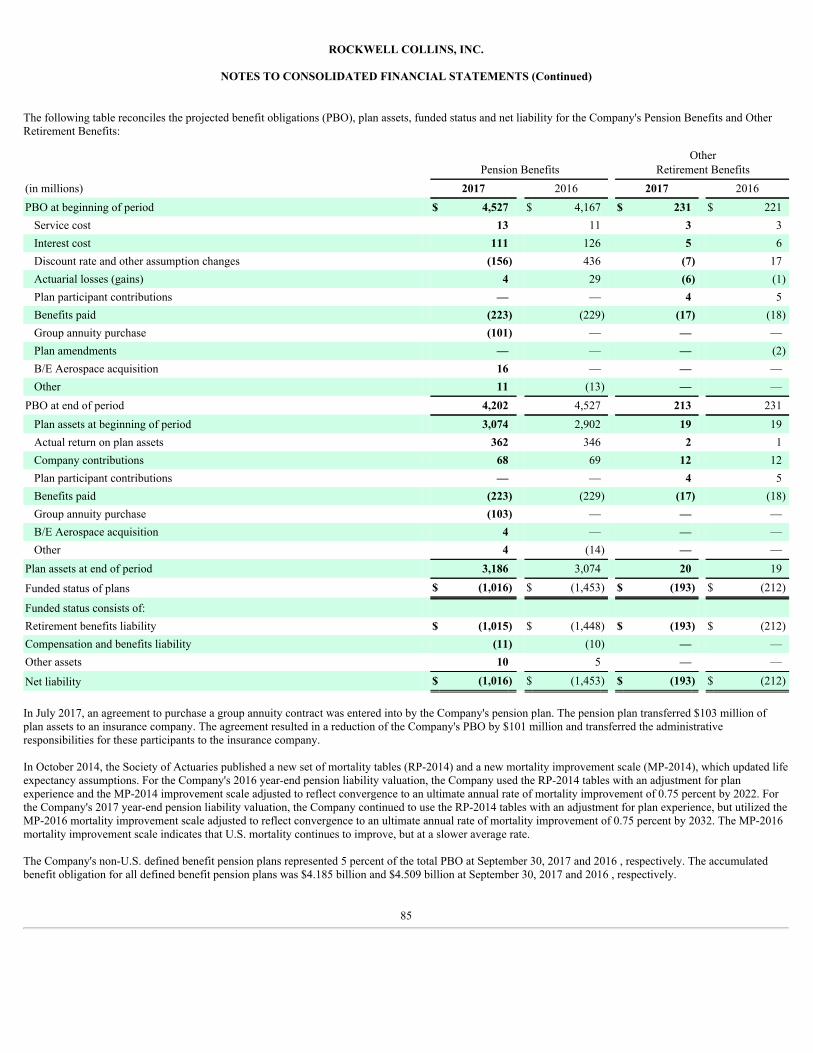
ROCKWELL COLLINS, INC.
NOTES TO CONSOLIDATED FINANCIAL STATEMENTS (Continued)
The following table reconciles the projected benefit obligations (PBO), plan assets, funded status and net liability for the Company's Pension Benefits and OtherRetirement Benefits:
Pension Benefits Other
Retirement Benefits(in millions) 2017 2016 2017 2016PBO at beginning of period $ 4,527 $ 4,167 $ 231 $ 221
Service cost 13 11 3 3Interest cost 111 126 5 6Discount rate and other assumption changes (156) 436 (7) 17Actuarial losses (gains) 4 29 (6) (1)Plan participant contributions — — 4 5Benefits paid (223) (229) (17) (18)Group annuity purchase (101) — — —Plan amendments — — — (2)B/E Aerospace acquisition 16 — — —Other 11 (13) — —
PBO at end of period 4,202 4,527 213 231Plan assets at beginning of period 3,074 2,902 19 19Actual return on plan assets 362 346 2 1Company contributions 68 69 12 12Plan participant contributions — — 4 5Benefits paid (223) (229) (17) (18)Group annuity purchase (103) — — —B/E Aerospace acquisition 4 — — —Other 4 (14) — —
Plan assets at end of period 3,186 3,074 20 19
Funded status of plans $ (1,016) $ (1,453) $ (193) $ (212)
Funded status consists of: Retirement benefits liability $ (1,015) $ (1,448) $ (193) $ (212)Compensation and benefits liability (11) (10) — —Other assets 10 5 — —
Net liability $ (1,016) $ (1,453) $ (193) $ (212)
In July 2017, an agreement to purchase a group annuity contract was entered into by the Company's pension plan. The pension plan transferred $103 million ofplan assets to an insurance company. The agreement resulted in a reduction of the Company's PBO by $101 million and transferred the administrativeresponsibilities for these participants to the insurance company.
In October 2014, the Society of Actuaries published a new set of mortality tables (RP-2014) and a new mortality improvement scale (MP-2014), which updated lifeexpectancy assumptions. For the Company's 2016 year-end pension liability valuation, the Company used the RP-2014 tables with an adjustment for planexperience and the MP-2014 improvement scale adjusted to reflect convergence to an ultimate annual rate of mortality improvement of 0.75 percent by 2022. Forthe Company's 2017 year-end pension liability valuation, the Company continued to use the RP-2014 tables with an adjustment for plan experience, but utilized theMP-2016 mortality improvement scale adjusted to reflect convergence to an ultimate annual rate of mortality improvement of 0.75 percent by 2032. The MP-2016mortality improvement scale indicates that U.S. mortality continues to improve, but at a slower average rate.
The Company's non-U.S. defined benefit pension plans represented 5 percent of the total PBO at September 30, 2017 and 2016 , respectively. The accumulatedbenefit obligation for all defined benefit pension plans was $4.185 billion and $4.509 billion at September 30, 2017 and 2016 , respectively.
85
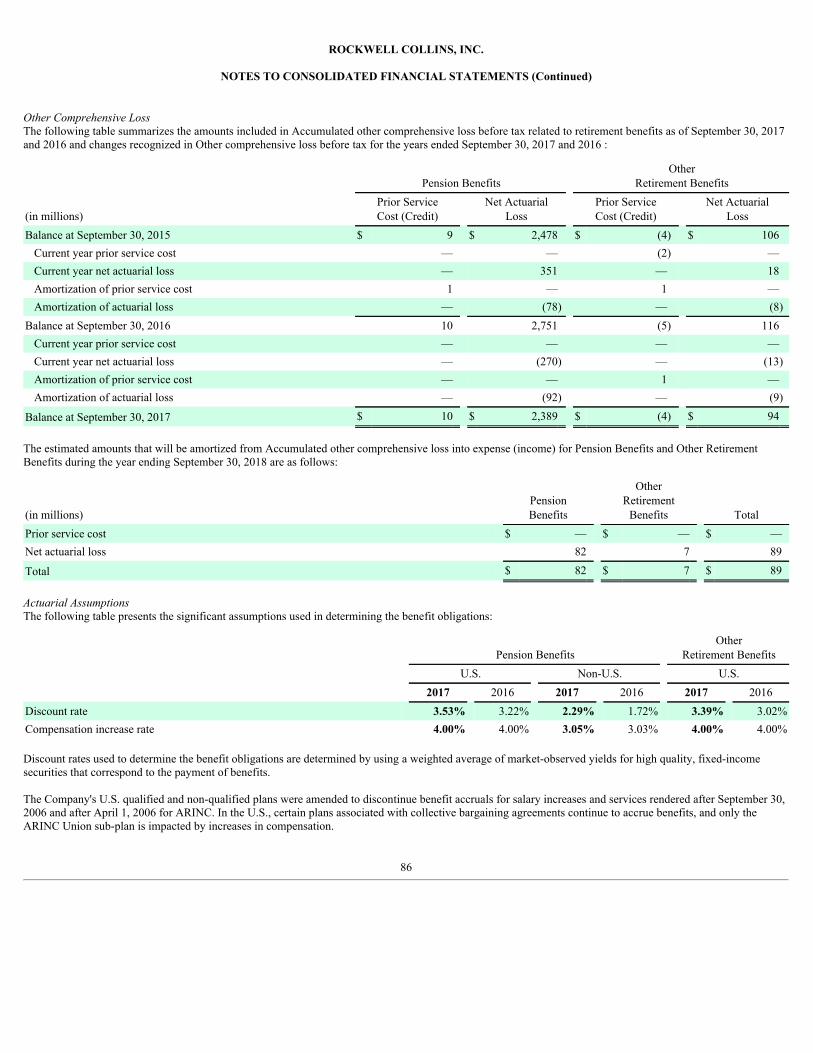
ROCKWELL COLLINS, INC.
NOTES TO CONSOLIDATED FINANCIAL STATEMENTS (Continued)
OtherComprehensiveLossThe following table summarizes the amounts included in Accumulated other comprehensive loss before tax related to retirement benefits as of September 30, 2017and 2016 and changes recognized in Other comprehensive loss before tax for the years ended September 30, 2017 and 2016 :
Pension Benefits Other
Retirement Benefits
(in millions) Prior ServiceCost (Credit)
Net ActuarialLoss
Prior ServiceCost (Credit)
Net ActuarialLoss
Balance at September 30, 2015 $ 9 $ 2,478 $ (4) $ 106Current year prior service cost — — (2) —Current year net actuarial loss — 351 — 18Amortization of prior service cost 1 — 1 —Amortization of actuarial loss — (78) — (8)
Balance at September 30, 2016 10 2,751 (5) 116Current year prior service cost — — — —Current year net actuarial loss — (270) — (13)Amortization of prior service cost — — 1 —Amortization of actuarial loss — (92) — (9)
Balance at September 30, 2017 $ 10 $ 2,389 $ (4) $ 94
The estimated amounts that will be amortized from Accumulated other comprehensive loss into expense (income) for Pension Benefits and Other RetirementBenefits during the year ending September 30, 2018 are as follows:
(in millions) PensionBenefits
OtherRetirement
Benefits TotalPrior service cost $ — $ — $ —Net actuarial loss 82 7 89
Total $ 82 $ 7 $ 89
ActuarialAssumptionsThe following table presents the significant assumptions used in determining the benefit obligations:
Pension Benefits Other
Retirement Benefits U.S. Non-U.S. U.S. 2017 2016 2017 2016 2017 2016Discount rate 3.53% 3.22% 2.29% 1.72% 3.39% 3.02%Compensation increase rate 4.00% 4.00% 3.05% 3.03% 4.00% 4.00%
Discount rates used to determine the benefit obligations are determined by using a weighted average of market-observed yields for high quality, fixed-incomesecurities that correspond to the payment of benefits.
The Company's U.S. qualified and non-qualified plans were amended to discontinue benefit accruals for salary increases and services rendered after September 30,2006 and after April 1, 2006 for ARINC. In the U.S., certain plans associated with collective bargaining agreements continue to accrue benefits, and only theARINC Union sub-plan is impacted by increases in compensation.
86
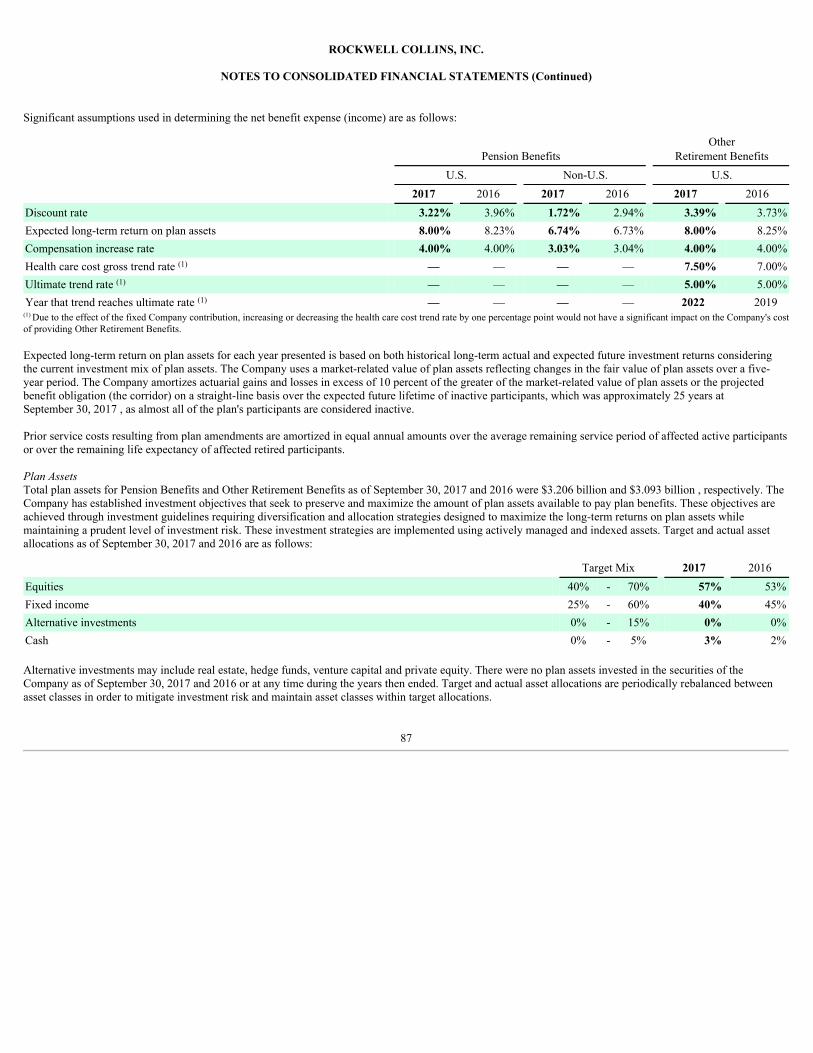
ROCKWELL COLLINS, INC.
NOTES TO CONSOLIDATED FINANCIAL STATEMENTS (Continued)
Significant assumptions used in determining the net benefit expense (income) are as follows:
Pension Benefits Other
Retirement Benefits U.S. Non-U.S. U.S. 2017 2016 2017 2016 2017 2016Discount rate 3.22% 3.96% 1.72% 2.94% 3.39% 3.73%Expected long-term return on plan assets 8.00% 8.23% 6.74% 6.73% 8.00% 8.25%Compensation increase rate 4.00% 4.00% 3.03% 3.04% 4.00% 4.00%Health care cost gross trend rate (1) — — — — 7.50% 7.00%Ultimate trend rate (1) — — — — 5.00% 5.00%Year that trend reaches ultimate rate (1) — — — — 2022 2019
(1) Due to the effect of the fixed Company contribution, increasing or decreasing the health care cost trend rate by one percentage point would not have a significant impact on the Company's costof providing Other Retirement Benefits.
Expected long-term return on plan assets for each year presented is based on both historical long-term actual and expected future investment returns consideringthe current investment mix of plan assets. The Company uses a market-related value of plan assets reflecting changes in the fair value of plan assets over a five-year period. The Company amortizes actuarial gains and losses in excess of 10 percent of the greater of the market-related value of plan assets or the projectedbenefit obligation (the corridor) on a straight-line basis over the expected future lifetime of inactive participants, which was approximately 25 years atSeptember 30, 2017 , as almost all of the plan's participants are considered inactive.
Prior service costs resulting from plan amendments are amortized in equal annual amounts over the average remaining service period of affected active participantsor over the remaining life expectancy of affected retired participants.
PlanAssetsTotal plan assets for Pension Benefits and Other Retirement Benefits as of September 30, 2017 and 2016 were $3.206 billion and $3.093 billion , respectively. TheCompany has established investment objectives that seek to preserve and maximize the amount of plan assets available to pay plan benefits. These objectives areachieved through investment guidelines requiring diversification and allocation strategies designed to maximize the long-term returns on plan assets whilemaintaining a prudent level of investment risk. These investment strategies are implemented using actively managed and indexed assets. Target and actual assetallocations as of September 30, 2017 and 2016 are as follows:
Target Mix 2017 2016Equities 40% - 70% 57% 53%Fixed income 25% - 60% 40% 45%Alternative investments 0% - 15% 0% 0%Cash 0% - 5% 3% 2%
Alternative investments may include real estate, hedge funds, venture capital and private equity. There were no plan assets invested in the securities of theCompany as of September 30, 2017 and 2016 or at any time during the years then ended. Target and actual asset allocations are periodically rebalanced betweenasset classes in order to mitigate investment risk and maintain asset classes within target allocations.
87

ROCKWELL COLLINS, INC.
NOTES TO CONSOLIDATED FINANCIAL STATEMENTS (Continued)
The following table presents the fair value of the Company's pension plans' assets as of September 30, 2017 and 2016 , by asset category segregated by level withinthe fair value hierarchy, as described in Note 14:
September 30, 2017 September 30, 2016
Asset category (in millions) Level 1 Level 2 Level 3 Not Leveled
(1) Total Level 1 Level 2 Level 3 Not Leveled
(1) TotalEquity securities:
U.S. equity $ 558 $ 15 $ — $ 394 $ 967 $ 560 $ 7 $ — $ 340 $ 907Non-U.S. equity 814 28 — — 842 683 40 — — 723
Fixed income securities: Corporate — 795 — 305 1,100 — 798 — 345 1,143U.S. government 42 24 — 68 134 94 31 — 58 183Mortgage and asset-backed — 1 — — 1 — 2 — — 2Other — 50 3 — 53 — 42 3 — 45
Cash and cash equivalents — 82 — — 82 — 93 — — 93Sub-total $ 1,414 $ 995 $ 3 $ 767 3,179 $ 1,337 $ 1,013 $ 3 $ 743 3,096Net receivables (payables)related to investmenttransactions 7 (22)Total $ 3,186 $ 3,074
(1) Certain investments measured using the net asset value (NAV) practical expedient have not been classified in the fair value hierarchy.
The following table presents the fair value of the Company's other retirement benefits plan's assets as of September 30, 2017 and 2016 , by asset categorysegregated by level within the fair value hierarchy, as described in Note 14:
September 30, 2017 September 30, 2016Asset category (in millions) Level 1 Level 2 Level 3 Not Leveled Total Level 1 Level 2 Level 3 Not Leveled TotalEquity securities:
U.S. equity $ 9 $ — $ — $ — $ 9 $ 8 $ — $ — $ — $ 8Non-U.S. equity — — — — — 1 — — — 1
Fixed income securities: Corporate — 3 — — 3 — 2 — — 2U.S. government 2 1 — — 3 2 1 — — 3Mortgage and asset-backed — 1 — — 1 — — — — —
Cash and cash equivalents — 4 — — 4 — 5 — — 5
Total $ 11 $ 9 $ — $ — $ 20 $ 11 $ 8 $ — $ — $ 19
ValuationTechniquesLevel 1 assets for the pension plans and other retirement benefits plan are primarily comprised of equity and fixed income securities. Level 1 equity securities areactively traded on U.S. and non-U.S. exchanges and are valued using the market approach at quoted market prices on the measurement date. Level 1 fixed incomesecurities are valued using quoted market prices.
Level 2 equity securities contain equity funds that hold investments with values based on quoted market prices, but for which the funds are not valued on a quotedmarket basis. Level 2 fixed income securities are primarily valued using pricing models that use observable market data or bids provided by independentinvestment brokerage firms.
Cash and cash equivalents includes cash which is used to pay benefits and cash invested in a short-term investment fund that holds securities with values based onquoted market prices, but for which the funds are not valued on a quoted market basis. As such, the cash and cash equivalents in our pension and other retirementplan assets are classified as Level 2 in the tables above.
88
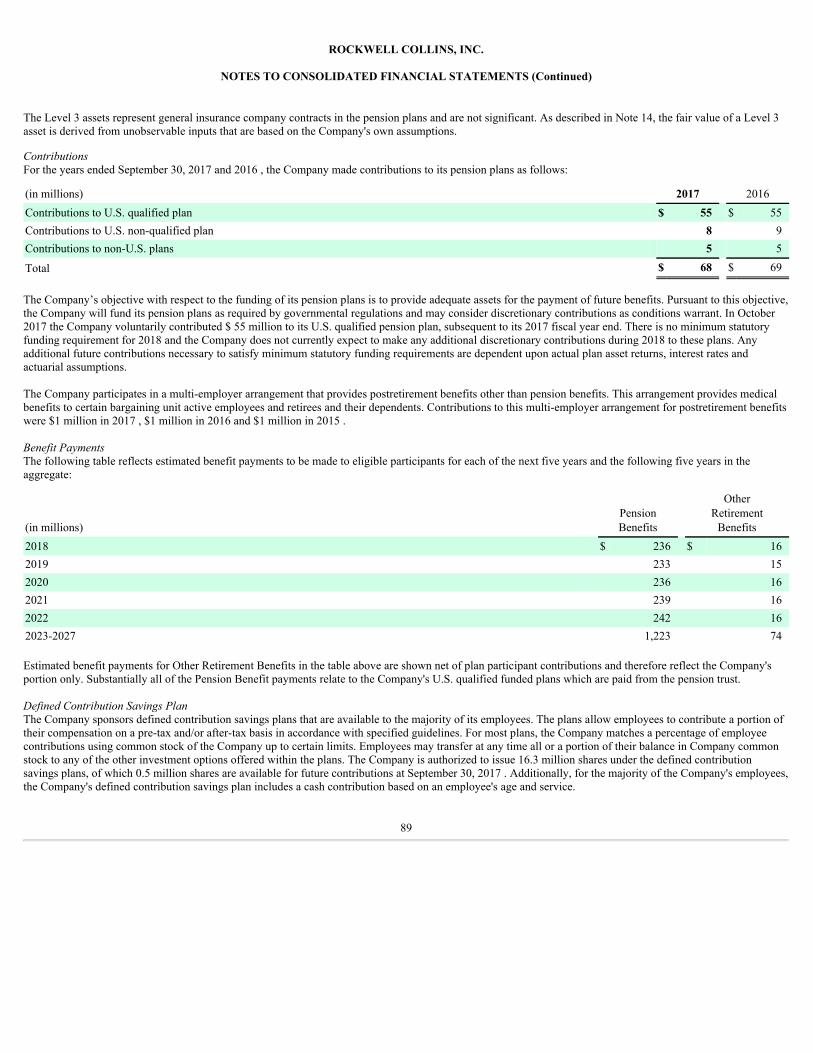
ROCKWELL COLLINS, INC.
NOTES TO CONSOLIDATED FINANCIAL STATEMENTS (Continued)
The Level 3 assets represent general insurance company contracts in the pension plans and are not significant. As described in Note 14, the fair value of a Level 3asset is derived from unobservable inputs that are based on the Company's own assumptions.
ContributionsFor the years ended September 30, 2017 and 2016 , the Company made contributions to its pension plans as follows:
(in millions) 2017 2016Contributions to U.S. qualified plan $ 55 $ 55Contributions to U.S. non-qualified plan 8 9Contributions to non-U.S. plans 5 5
Total $ 68 $ 69
The Company’s objective with respect to the funding of its pension plans is to provide adequate assets for the payment of future benefits. Pursuant to this objective,the Company will fund its pension plans as required by governmental regulations and may consider discretionary contributions as conditions warrant. In October2017 the Company voluntarily contributed $ 55 million to its U.S. qualified pension plan, subsequent to its 2017 fiscal year end. There is no minimum statutoryfunding requirement for 2018 and the Company does not currently expect to make any additional discretionary contributions during 2018 to these plans. Anyadditional future contributions necessary to satisfy minimum statutory funding requirements are dependent upon actual plan asset returns, interest rates andactuarial assumptions.
The Company participates in a multi-employer arrangement that provides postretirement benefits other than pension benefits. This arrangement provides medicalbenefits to certain bargaining unit active employees and retirees and their dependents. Contributions to this multi-employer arrangement for postretirement benefitswere $1 million in 2017 , $1 million in 2016 and $1 million in 2015 .
BenefitPaymentsThe following table reflects estimated benefit payments to be made to eligible participants for each of the next five years and the following five years in theaggregate:
(in millions) PensionBenefits
OtherRetirement
Benefits2018 $ 236 $ 162019 233 152020 236 162021 239 162022 242 162023-2027 1,223 74
Estimated benefit payments for Other Retirement Benefits in the table above are shown net of plan participant contributions and therefore reflect the Company'sportion only. Substantially all of the Pension Benefit payments relate to the Company's U.S. qualified funded plans which are paid from the pension trust.
DefinedContributionSavingsPlanThe Company sponsors defined contribution savings plans that are available to the majority of its employees. The plans allow employees to contribute a portion oftheir compensation on a pre-tax and/or after-tax basis in accordance with specified guidelines. For most plans, the Company matches a percentage of employeecontributions using common stock of the Company up to certain limits. Employees may transfer at any time all or a portion of their balance in Company commonstock to any of the other investment options offered within the plans. The Company is authorized to issue 16.3 million shares under the defined contributionsavings plans, of which 0.5 million shares are available for future contributions at September 30, 2017 . Additionally, for the majority of the Company's employees,the Company's defined contribution savings plan includes a cash contribution based on an employee's age and service.
89
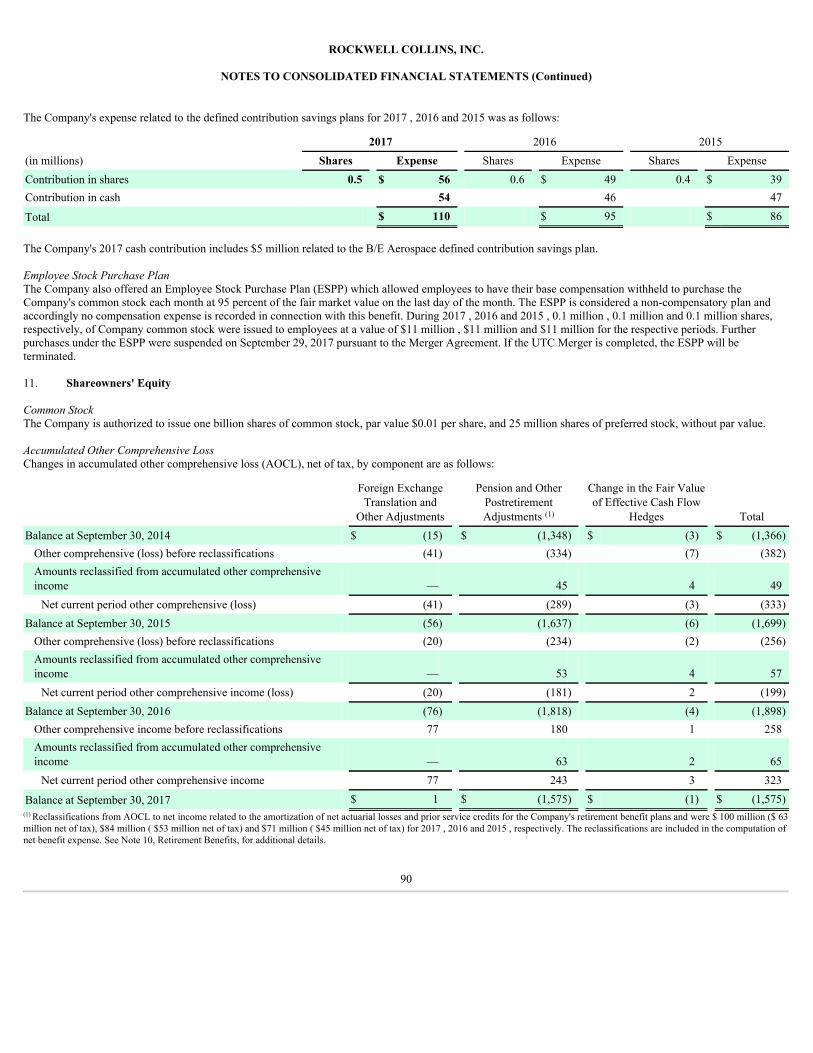
ROCKWELL COLLINS, INC.
NOTES TO CONSOLIDATED FINANCIAL STATEMENTS (Continued)
The Company's expense related to the defined contribution savings plans for 2017 , 2016 and 2015 was as follows:
2017 2016 2015(in millions) Shares Expense Shares Expense Shares ExpenseContribution in shares 0.5 $ 56 0.6 $ 49 0.4 $ 39Contribution in cash 54 46 47
Total $ 110 $ 95 $ 86
The Company's 2017 cash contribution includes $5 million related to the B/E Aerospace defined contribution savings plan. EmployeeStockPurchasePlanThe Company also offered an Employee Stock Purchase Plan (ESPP) which allowed employees to have their base compensation withheld to purchase theCompany's common stock each month at 95 percent of the fair market value on the last day of the month. The ESPP is considered a non-compensatory plan andaccordingly no compensation expense is recorded in connection with this benefit. During 2017 , 2016 and 2015 , 0.1 million , 0.1 million and 0.1 million shares,respectively, of Company common stock were issued to employees at a value of $11 million , $11 million and $11 million for the respective periods. Furtherpurchases under the ESPP were suspended on September 29, 2017 pursuant to the Merger Agreement. If the UTC Merger is completed, the ESPP will beterminated.
11. Shareowners' Equity
CommonStockThe Company is authorized to issue one billion shares of common stock, par value $0.01 per share, and 25 million shares of preferred stock, without par value.
AccumulatedOtherComprehensiveLoss Changes in accumulated other comprehensive loss (AOCL), net of tax, by component are as follows:
Foreign ExchangeTranslation and
Other Adjustments
Pension and OtherPostretirementAdjustments (1)
Change in the Fair Valueof Effective Cash Flow
Hedges TotalBalance at September 30, 2014 $ (15) $ (1,348) $ (3) $ (1,366)
Other comprehensive (loss) before reclassifications (41) (334) (7) (382)Amounts reclassified from accumulated other comprehensiveincome — 45 4 49
Net current period other comprehensive (loss) (41) (289) (3) (333)Balance at September 30, 2015 (56) (1,637) (6) (1,699)
Other comprehensive (loss) before reclassifications (20) (234) (2) (256)Amounts reclassified from accumulated other comprehensiveincome — 53 4 57
Net current period other comprehensive income (loss) (20) (181) 2 (199)Balance at September 30, 2016 (76) (1,818) (4) (1,898)
Other comprehensive income before reclassifications 77 180 1 258Amounts reclassified from accumulated other comprehensiveincome — 63 2 65
Net current period other comprehensive income 77 243 3 323
Balance at September 30, 2017 $ 1 $ (1,575) $ (1) $ (1,575)(1) Reclassifications from AOCL to net income related to the amortization of net actuarial losses and prior service credits for the Company's retirement benefit plans and were $ 100 million ($ 63million net of tax), $84 million ( $53 million net of tax) and $71 million ( $45 million net of tax) for 2017 , 2016 and 2015 , respectively. The reclassifications are included in the computation ofnet benefit expense. See Note 10, Retirement Benefits, for additional details.
90
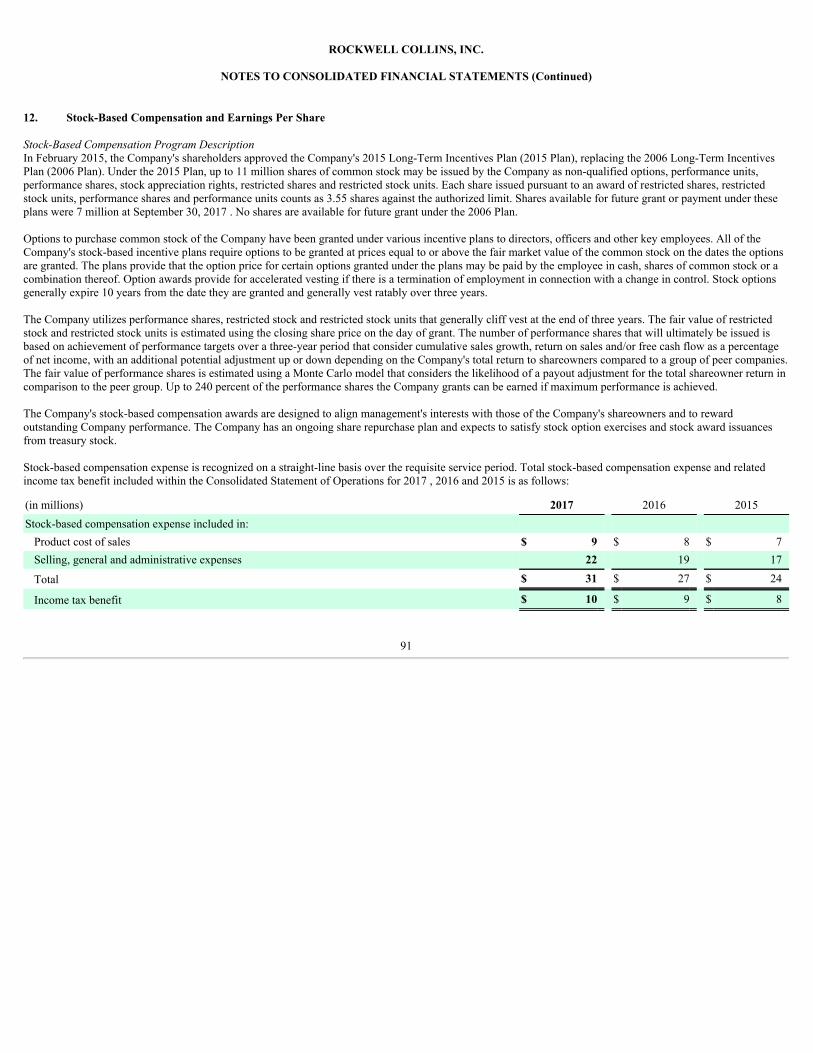
ROCKWELL COLLINS, INC.
NOTES TO CONSOLIDATED FINANCIAL STATEMENTS (Continued)
12. Stock-Based Compensation and Earnings Per Share
Stock-BasedCompensationProgramDescriptionIn February 2015, the Company's shareholders approved the Company's 2015 Long-Term Incentives Plan (2015 Plan), replacing the 2006 Long-Term IncentivesPlan (2006 Plan). Under the 2015 Plan, up to 11 million shares of common stock may be issued by the Company as non-qualified options, performance units,performance shares, stock appreciation rights, restricted shares and restricted stock units. Each share issued pursuant to an award of restricted shares, restrictedstock units, performance shares and performance units counts as 3.55 shares against the authorized limit. Shares available for future grant or payment under theseplans were 7 million at September 30, 2017 . No shares are available for future grant under the 2006 Plan.
Options to purchase common stock of the Company have been granted under various incentive plans to directors, officers and other key employees. All of theCompany's stock-based incentive plans require options to be granted at prices equal to or above the fair market value of the common stock on the dates the optionsare granted. The plans provide that the option price for certain options granted under the plans may be paid by the employee in cash, shares of common stock or acombination thereof. Option awards provide for accelerated vesting if there is a termination of employment in connection with a change in control. Stock optionsgenerally expire 10 years from the date they are granted and generally vest ratably over three years.
The Company utilizes performance shares, restricted stock and restricted stock units that generally cliff vest at the end of three years. The fair value of restrictedstock and restricted stock units is estimated using the closing share price on the day of grant. The number of performance shares that will ultimately be issued isbased on achievement of performance targets over a three-year period that consider cumulative sales growth, return on sales and/or free cash flow as a percentageof net income, with an additional potential adjustment up or down depending on the Company's total return to shareowners compared to a group of peer companies.The fair value of performance shares is estimated using a Monte Carlo model that considers the likelihood of a payout adjustment for the total shareowner return incomparison to the peer group. Up to 240 percent of the performance shares the Company grants can be earned if maximum performance is achieved.
The Company's stock-based compensation awards are designed to align management's interests with those of the Company's shareowners and to rewardoutstanding Company performance. The Company has an ongoing share repurchase plan and expects to satisfy stock option exercises and stock award issuancesfrom treasury stock.
Stock-based compensation expense is recognized on a straight-line basis over the requisite service period. Total stock-based compensation expense and relatedincome tax benefit included within the Consolidated Statement of Operations for 2017 , 2016 and 2015 is as follows:
(in millions) 2017 2016 2015Stock-based compensation expense included in:
Product cost of sales $ 9 $ 8 $ 7Selling, general and administrative expenses 22 19 17
Total $ 31 $ 27 $ 24
Income tax benefit $ 10 $ 9 $ 8
91
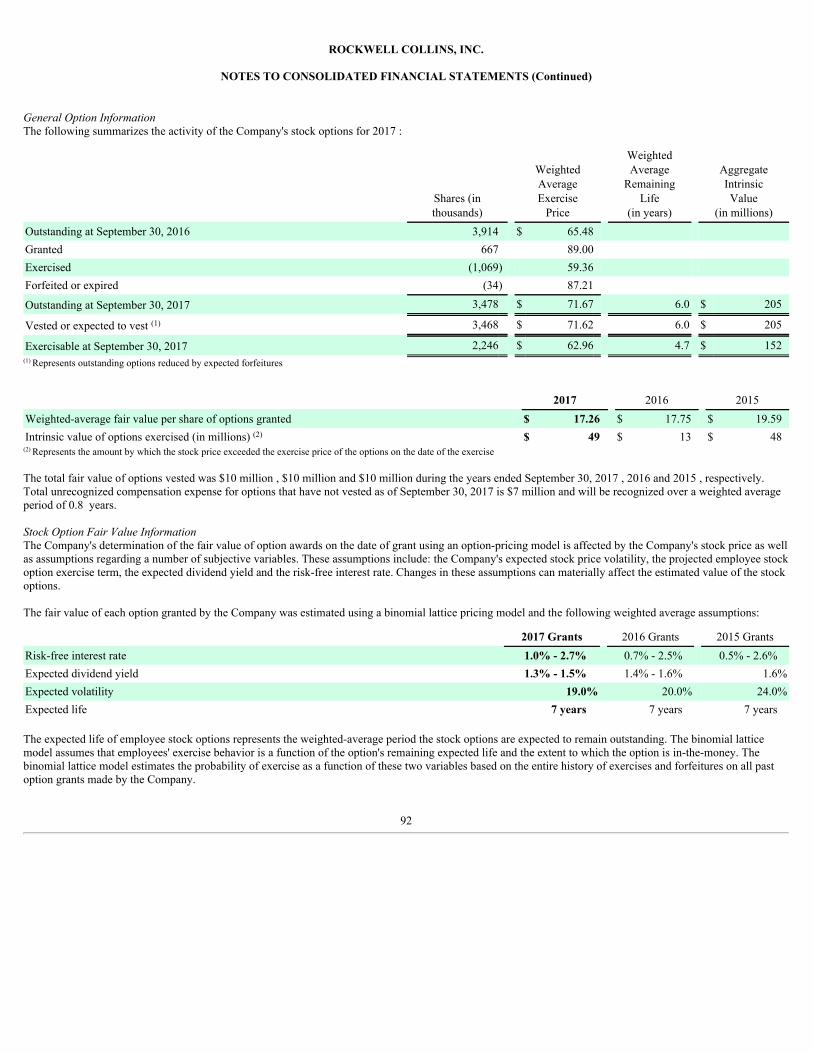
ROCKWELL COLLINS, INC.
NOTES TO CONSOLIDATED FINANCIAL STATEMENTS (Continued)
GeneralOptionInformationThe following summarizes the activity of the Company's stock options for 2017 :
Shares (inthousands)
WeightedAverageExercise
Price
WeightedAverage
RemainingLife
(in years)
AggregateIntrinsicValue
(in millions)Outstanding at September 30, 2016 3,914 $ 65.48 Granted 667 89.00 Exercised (1,069) 59.36 Forfeited or expired (34) 87.21
Outstanding at September 30, 2017 3,478 $ 71.67 6.0 $ 205
Vested or expected to vest (1) 3,468 $ 71.62 6.0 $ 205
Exercisable at September 30, 2017 2,246 $ 62.96 4.7 $ 152(1) Represents outstanding options reduced by expected forfeitures
2017 2016 2015Weighted-average fair value per share of options granted $ 17.26 $ 17.75 $ 19.59Intrinsic value of options exercised (in millions) (2) $ 49 $ 13 $ 48
(2) Represents the amount by which the stock price exceeded the exercise price of the options on the date of the exercise
The total fair value of options vested was $10 million , $10 million and $10 million during the years ended September 30, 2017 , 2016 and 2015 , respectively.Total unrecognized compensation expense for options that have not vested as of September 30, 2017 is $7 million and will be recognized over a weighted averageperiod of 0.8 years.
StockOptionFairValueInformationThe Company's determination of the fair value of option awards on the date of grant using an option-pricing model is affected by the Company's stock price as wellas assumptions regarding a number of subjective variables. These assumptions include: the Company's expected stock price volatility, the projected employee stockoption exercise term, the expected dividend yield and the risk-free interest rate. Changes in these assumptions can materially affect the estimated value of the stockoptions.
The fair value of each option granted by the Company was estimated using a binomial lattice pricing model and the following weighted average assumptions:
2017 Grants 2016 Grants 2015 GrantsRisk-free interest rate 1.0% - 2.7% 0.7% - 2.5% 0.5% - 2.6%Expected dividend yield 1.3% - 1.5% 1.4% - 1.6% 1.6%Expected volatility 19.0% 20.0% 24.0%Expected life 7 years 7 years 7 years
The expected life of employee stock options represents the weighted-average period the stock options are expected to remain outstanding. The binomial latticemodel assumes that employees' exercise behavior is a function of the option's remaining expected life and the extent to which the option is in-the-money. Thebinomial lattice model estimates the probability of exercise as a function of these two variables based on the entire history of exercises and forfeitures on all pastoption grants made by the Company.
92
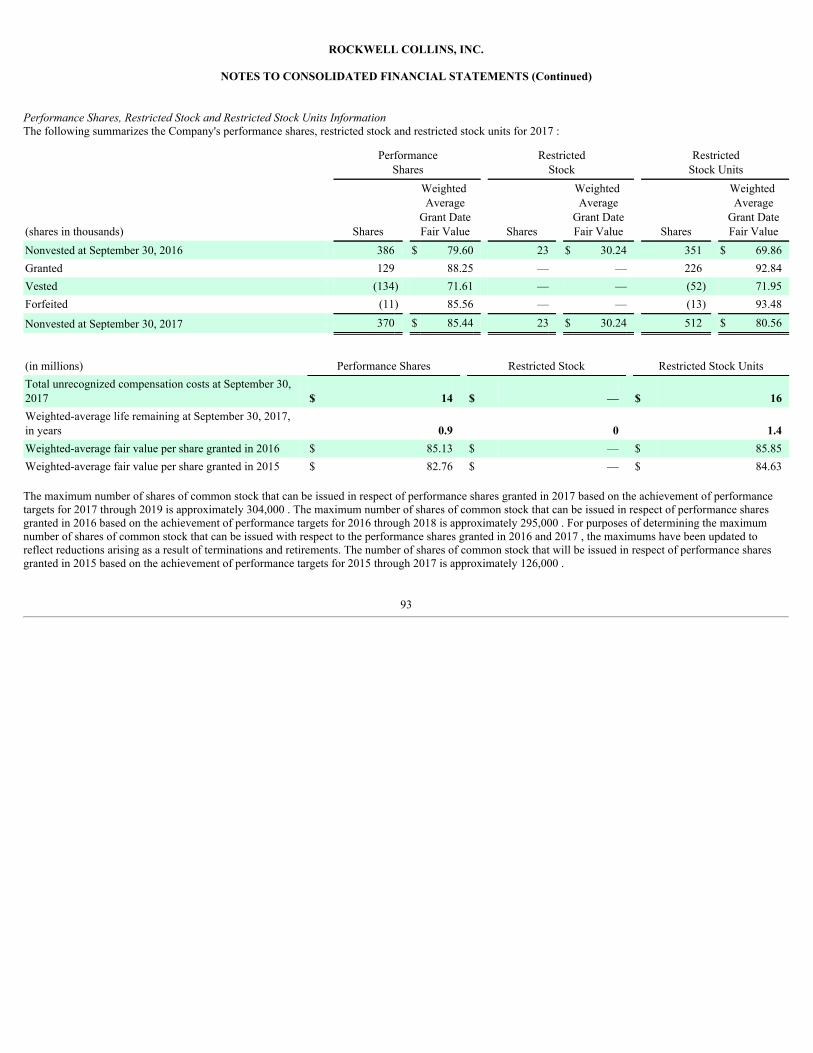
ROCKWELL COLLINS, INC.
NOTES TO CONSOLIDATED FINANCIAL STATEMENTS (Continued)
PerformanceShares,RestrictedStockandRestrictedStockUnitsInformationThe following summarizes the Company's performance shares, restricted stock and restricted stock units for 2017 :
Performance
Shares Restricted
Stock Restricted
Stock Units
(shares in thousands) Shares
Weighted Average
Grant DateFair Value Shares
Weighted Average
Grant DateFair Value Shares
Weighted Average
Grant DateFair Value
Nonvested at September 30, 2016 386 $ 79.60 23 $ 30.24 351 $ 69.86Granted 129 88.25 — — 226 92.84Vested (134) 71.61 — — (52) 71.95Forfeited (11) 85.56 — — (13) 93.48
Nonvested at September 30, 2017 370 $ 85.44 23 $ 30.24 512 $ 80.56
(in millions) Performance Shares Restricted Stock Restricted Stock UnitsTotal unrecognized compensation costs at September 30,2017 $ 14 $ — $ 16Weighted-average life remaining at September 30, 2017,in years 0.9 0 1.4Weighted-average fair value per share granted in 2016 $ 85.13 $ — $ 85.85Weighted-average fair value per share granted in 2015 $ 82.76 $ — $ 84.63
The maximum number of shares of common stock that can be issued in respect of performance shares granted in 2017 based on the achievement of performancetargets for 2017 through 2019 is approximately 304,000 . The maximum number of shares of common stock that can be issued in respect of performance sharesgranted in 2016 based on the achievement of performance targets for 2016 through 2018 is approximately 295,000 . For purposes of determining the maximumnumber of shares of common stock that can be issued with respect to the performance shares granted in 2016 and 2017 , the maximums have been updated toreflect reductions arising as a result of terminations and retirements. The number of shares of common stock that will be issued in respect of performance sharesgranted in 2015 based on the achievement of performance targets for 2015 through 2017 is approximately 126,000 .
93
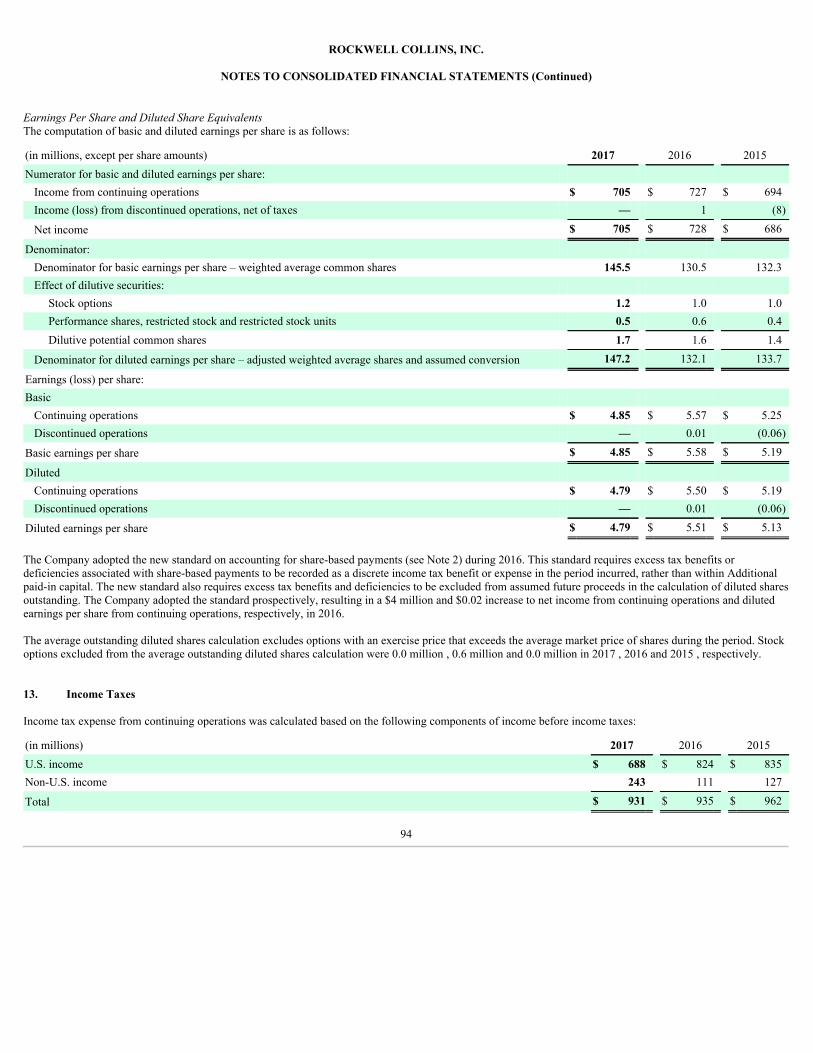
ROCKWELL COLLINS, INC.
NOTES TO CONSOLIDATED FINANCIAL STATEMENTS (Continued)
EarningsPerShareandDilutedShareEquivalentsThe computation of basic and diluted earnings per share is as follows:
(in millions, except per share amounts) 2017 2016 2015Numerator for basic and diluted earnings per share:
Income from continuing operations $ 705 $ 727 $ 694Income (loss) from discontinued operations, net of taxes — 1 (8)
Net income $ 705 $ 728 $ 686
Denominator: Denominator for basic earnings per share – weighted average common shares 145.5 130.5 132.3Effect of dilutive securities:
Stock options 1.2 1.0 1.0Performance shares, restricted stock and restricted stock units 0.5 0.6 0.4Dilutive potential common shares 1.7 1.6 1.4
Denominator for diluted earnings per share – adjusted weighted average shares and assumed conversion 147.2 132.1 133.7
Earnings (loss) per share: Basic
Continuing operations $ 4.85 $ 5.57 $ 5.25Discontinued operations — 0.01 (0.06)
Basic earnings per share $ 4.85 $ 5.58 $ 5.19
Diluted Continuing operations $ 4.79 $ 5.50 $ 5.19Discontinued operations — 0.01 (0.06)
Diluted earnings per share $ 4.79 $ 5.51 $ 5.13
The Company adopted the new standard on accounting for share-based payments (see Note 2) during 2016. This standard requires excess tax benefits ordeficiencies associated with share-based payments to be recorded as a discrete income tax benefit or expense in the period incurred, rather than within Additionalpaid-in capital. The new standard also requires excess tax benefits and deficiencies to be excluded from assumed future proceeds in the calculation of diluted sharesoutstanding. The Company adopted the standard prospectively, resulting in a $4 million and $0.02 increase to net income from continuing operations and dilutedearnings per share from continuing operations, respectively, in 2016.
The average outstanding diluted shares calculation excludes options with an exercise price that exceeds the average market price of shares during the period. Stockoptions excluded from the average outstanding diluted shares calculation were 0.0 million , 0.6 million and 0.0 million in 2017 , 2016 and 2015 , respectively.
13. Income Taxes
Income tax expense from continuing operations was calculated based on the following components of income before income taxes:
(in millions) 2017 2016 2015U.S. income $ 688 $ 824 $ 835Non-U.S. income 243 111 127
Total $ 931 $ 935 $ 962
94
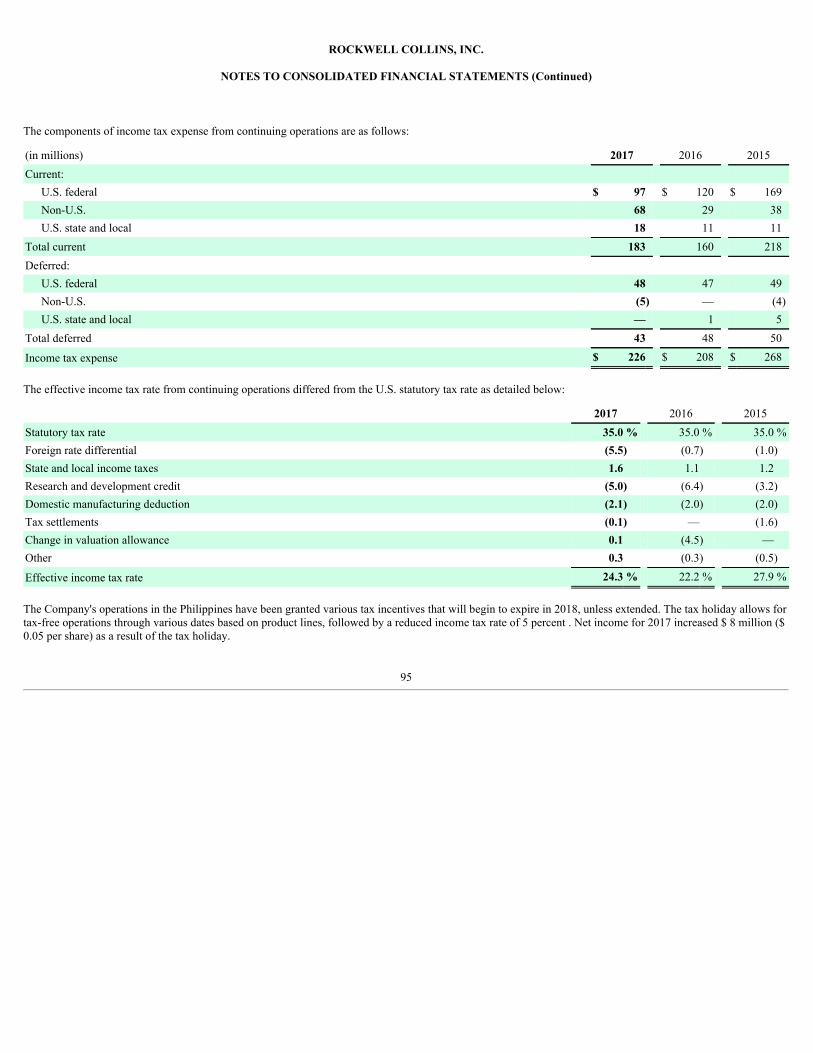
ROCKWELL COLLINS, INC.
NOTES TO CONSOLIDATED FINANCIAL STATEMENTS (Continued)
The components of income tax expense from continuing operations are as follows:
(in millions) 2017 2016 2015Current:
U.S. federal $ 97 $ 120 $ 169Non-U.S. 68 29 38U.S. state and local 18 11 11
Total current 183 160 218Deferred:
U.S. federal 48 47 49Non-U.S. (5) — (4)U.S. state and local — 1 5
Total deferred 43 48 50
Income tax expense $ 226 $ 208 $ 268
The effective income tax rate from continuing operations differed from the U.S. statutory tax rate as detailed below:
2017 2016 2015Statutory tax rate 35.0 % 35.0 % 35.0 %Foreign rate differential (5.5) (0.7) (1.0)State and local income taxes 1.6 1.1 1.2Research and development credit (5.0) (6.4) (3.2)Domestic manufacturing deduction (2.1) (2.0) (2.0)Tax settlements (0.1) — (1.6)Change in valuation allowance 0.1 (4.5) —Other 0.3 (0.3) (0.5)
Effective income tax rate 24.3 % 22.2 % 27.9 %
The Company's operations in the Philippines have been granted various tax incentives that will begin to expire in 2018, unless extended. The tax holiday allows fortax-free operations through various dates based on product lines, followed by a reduced income tax rate of 5 percent . Net income for 2017 increased $ 8 million ($0.05 per share) as a result of the tax holiday.
95
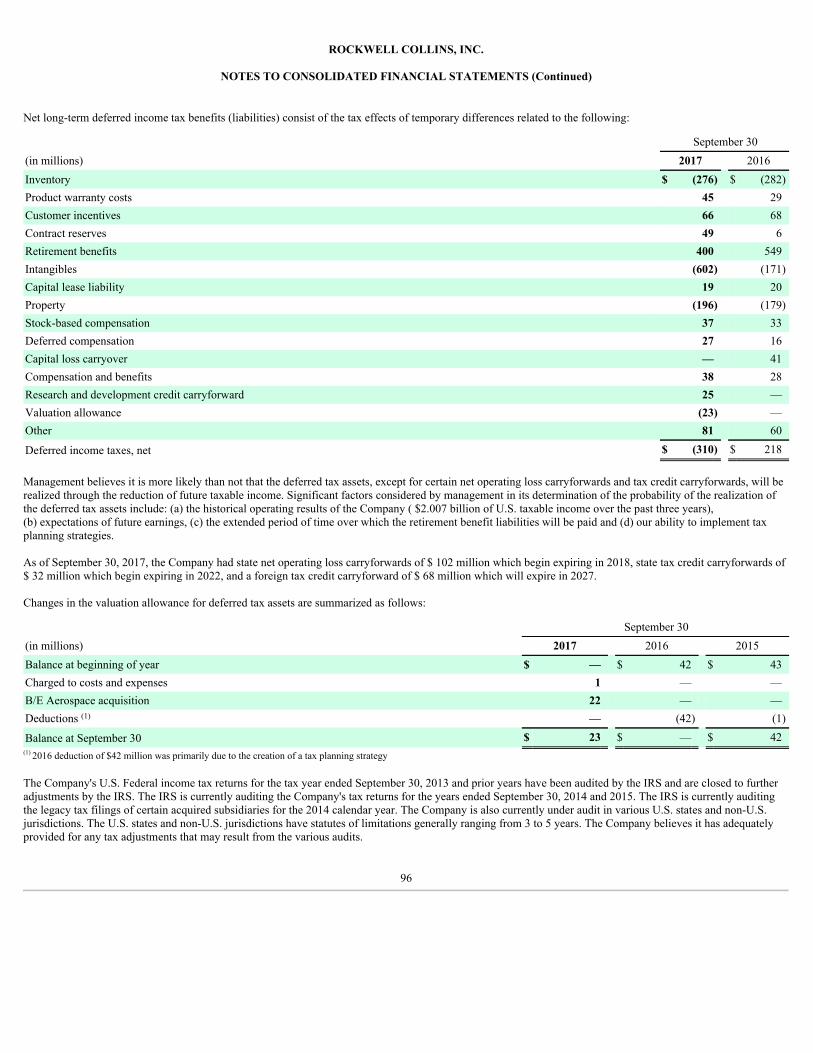
ROCKWELL COLLINS, INC.
NOTES TO CONSOLIDATED FINANCIAL STATEMENTS (Continued)
Net long-term deferred income tax benefits (liabilities) consist of the tax effects of temporary differences related to the following:
September 30(in millions) 2017 2016Inventory $ (276) $ (282)Product warranty costs 45 29Customer incentives 66 68Contract reserves 49 6Retirement benefits 400 549Intangibles (602) (171)Capital lease liability 19 20Property (196) (179)Stock-based compensation 37 33Deferred compensation 27 16Capital loss carryover — 41Compensation and benefits 38 28Research and development credit carryforward 25 —Valuation allowance (23) —Other 81 60
Deferred income taxes, net $ (310) $ 218
Management believes it is more likely than not that the deferred tax assets, except for certain net operating loss carryforwards and tax credit carryforwards, will berealized through the reduction of future taxable income. Significant factors considered by management in its determination of the probability of the realization ofthe deferred tax assets include: (a) the historical operating results of the Company ( $2.007 billion of U.S. taxable income over the past three years),(b) expectations of future earnings, (c) the extended period of time over which the retirement benefit liabilities will be paid and (d) our ability to implement taxplanning strategies.
As of September 30, 2017, the Company had state net operating loss carryforwards of $ 102 million which begin expiring in 2018, state tax credit carryforwards of$ 32 million which begin expiring in 2022, and a foreign tax credit carryforward of $ 68 million which will expire in 2027.
Changes in the valuation allowance for deferred tax assets are summarized as follows:
September 30(in millions) 2017 2016 2015Balance at beginning of year $ — $ 42 $ 43Charged to costs and expenses 1 — —B/E Aerospace acquisition 22 — —Deductions (1) — (42) (1)
Balance at September 30 $ 23 $ — $ 42(1) 2016 deduction of $42 million was primarily due to the creation of a tax planning strategy
The Company's U.S. Federal income tax returns for the tax year ended September 30, 2013 and prior years have been audited by the IRS and are closed to furtheradjustments by the IRS. The IRS is currently auditing the Company's tax returns for the years ended September 30, 2014 and 2015. The IRS is currently auditingthe legacy tax filings of certain acquired subsidiaries for the 2014 calendar year. The Company is also currently under audit in various U.S. states and non-U.S.jurisdictions. The U.S. states and non-U.S. jurisdictions have statutes of limitations generally ranging from 3 to 5 years. The Company believes it has adequatelyprovided for any tax adjustments that may result from the various audits.
96
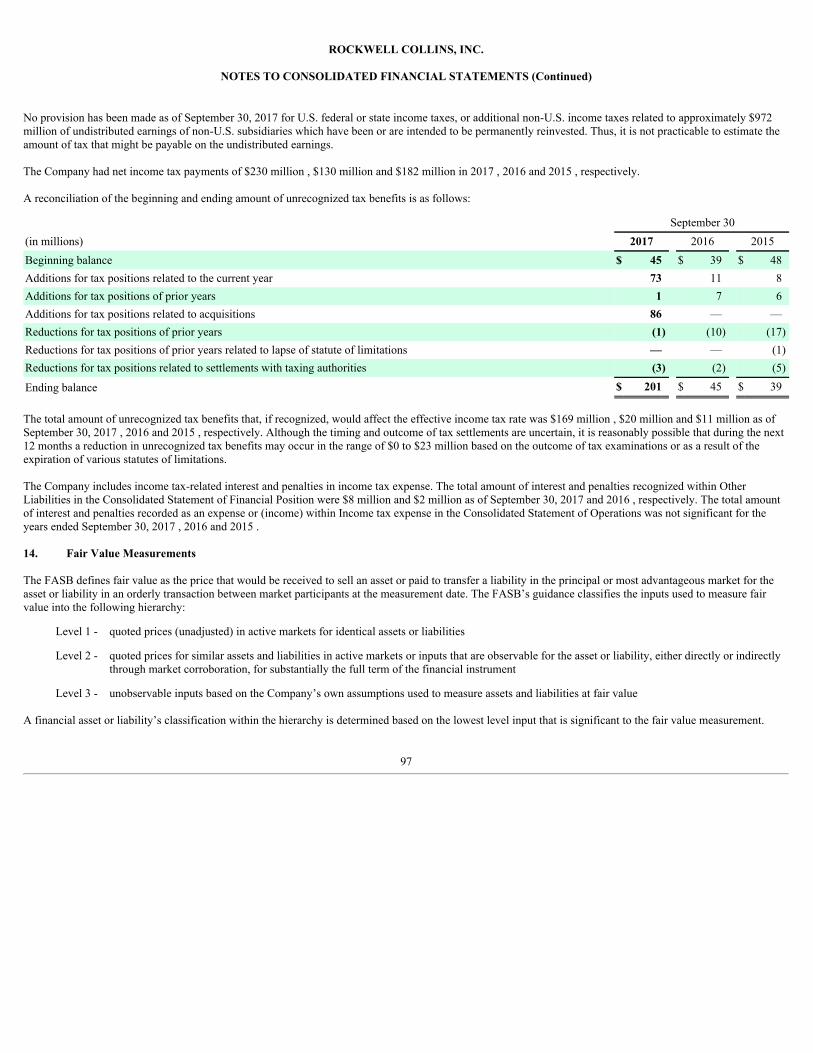
ROCKWELL COLLINS, INC.
NOTES TO CONSOLIDATED FINANCIAL STATEMENTS (Continued)
No provision has been made as of September 30, 2017 for U.S. federal or state income taxes, or additional non-U.S. income taxes related to approximately $972million of undistributed earnings of non-U.S. subsidiaries which have been or are intended to be permanently reinvested. Thus, it is not practicable to estimate theamount of tax that might be payable on the undistributed earnings.
The Company had net income tax payments of $230 million , $130 million and $182 million in 2017 , 2016 and 2015 , respectively.
A reconciliation of the beginning and ending amount of unrecognized tax benefits is as follows:
September 30(in millions) 2017 2016 2015Beginning balance $ 45 $ 39 $ 48Additions for tax positions related to the current year 73 11 8Additions for tax positions of prior years 1 7 6Additions for tax positions related to acquisitions 86 — —Reductions for tax positions of prior years (1) (10) (17)Reductions for tax positions of prior years related to lapse of statute of limitations — — (1)Reductions for tax positions related to settlements with taxing authorities (3) (2) (5)
Ending balance $ 201 $ 45 $ 39
The total amount of unrecognized tax benefits that, if recognized, would affect the effective income tax rate was $169 million , $20 million and $11 million as ofSeptember 30, 2017 , 2016 and 2015 , respectively. Although the timing and outcome of tax settlements are uncertain, it is reasonably possible that during the next12 months a reduction in unrecognized tax benefits may occur in the range of $0 to $23 million based on the outcome of tax examinations or as a result of theexpiration of various statutes of limitations.
The Company includes income tax-related interest and penalties in income tax expense. The total amount of interest and penalties recognized within OtherLiabilities in the Consolidated Statement of Financial Position were $8 million and $2 million as of September 30, 2017 and 2016 , respectively. The total amountof interest and penalties recorded as an expense or (income) within Income tax expense in the Consolidated Statement of Operations was not significant for theyears ended September 30, 2017 , 2016 and 2015 .
14. Fair Value Measurements
The FASB defines fair value as the price that would be received to sell an asset or paid to transfer a liability in the principal or most advantageous market for theasset or liability in an orderly transaction between market participants at the measurement date. The FASB’s guidance classifies the inputs used to measure fairvalue into the following hierarchy:
Level 1 - quoted prices (unadjusted) in active markets for identical assets or liabilities
Level 2 - quoted prices for similar assets and liabilities in active markets or inputs that are observable for the asset or liability, either directly or indirectlythrough market corroboration, for substantially the full term of the financial instrument
Level 3 - unobservable inputs based on the Company’s own assumptions used to measure assets and liabilities at fair value
A financial asset or liability’s classification within the hierarchy is determined based on the lowest level input that is significant to the fair value measurement.
97
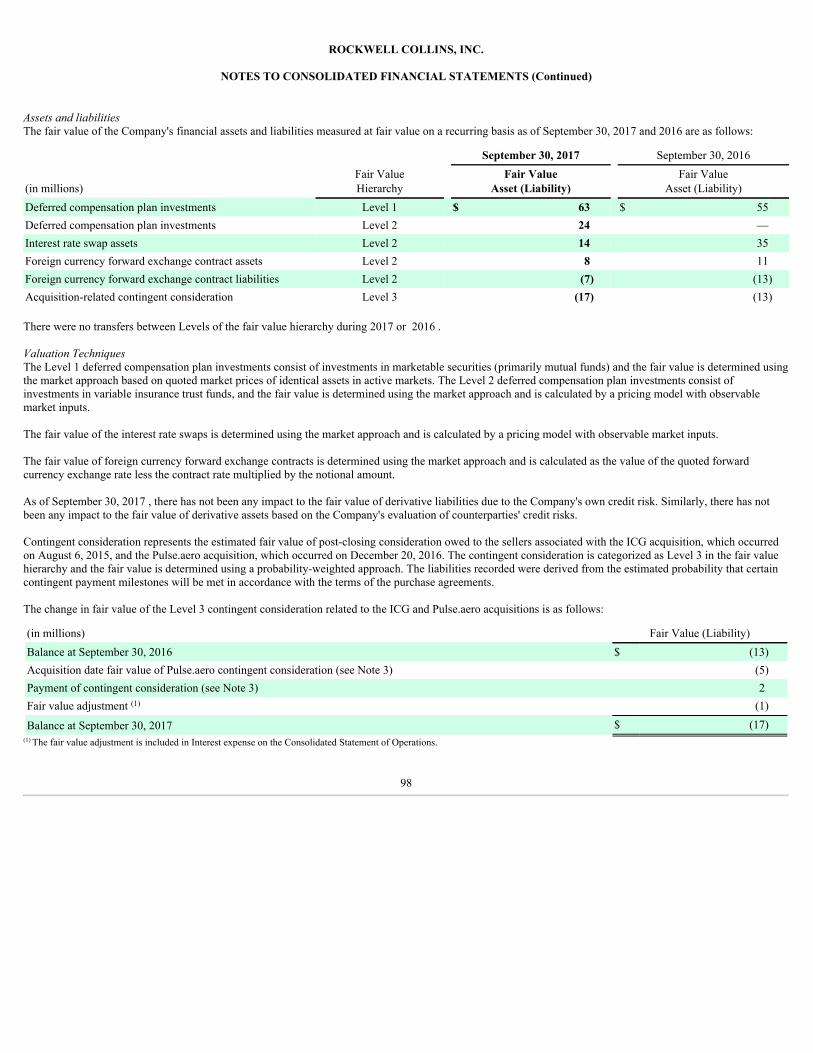
ROCKWELL COLLINS, INC.
NOTES TO CONSOLIDATED FINANCIAL STATEMENTS (Continued)
AssetsandliabilitiesThe fair value of the Company's financial assets and liabilities measured at fair value on a recurring basis as of September 30, 2017 and 2016 are as follows:
September 30, 2017 September 30, 2016
(in millions)Fair ValueHierarchy
Fair ValueAsset (Liability)
Fair ValueAsset (Liability)
Deferred compensation plan investments Level 1 $ 63 $ 55Deferred compensation plan investments Level 2 24 —Interest rate swap assets Level 2 14 35Foreign currency forward exchange contract assets Level 2 8 11Foreign currency forward exchange contract liabilities Level 2 (7) (13)Acquisition-related contingent consideration Level 3 (17) (13)
There were no transfers between Levels of the fair value hierarchy during 2017 or 2016 .
ValuationTechniquesThe Level 1 deferred compensation plan investments consist of investments in marketable securities (primarily mutual funds) and the fair value is determined usingthe market approach based on quoted market prices of identical assets in active markets. The Level 2 deferred compensation plan investments consist ofinvestments in variable insurance trust funds, and the fair value is determined using the market approach and is calculated by a pricing model with observablemarket inputs.
The fair value of the interest rate swaps is determined using the market approach and is calculated by a pricing model with observable market inputs.
The fair value of foreign currency forward exchange contracts is determined using the market approach and is calculated as the value of the quoted forwardcurrency exchange rate less the contract rate multiplied by the notional amount.
As of September 30, 2017 , there has not been any impact to the fair value of derivative liabilities due to the Company's own credit risk. Similarly, there has notbeen any impact to the fair value of derivative assets based on the Company's evaluation of counterparties' credit risks.
Contingent consideration represents the estimated fair value of post-closing consideration owed to the sellers associated with the ICG acquisition, which occurredon August 6, 2015, and the Pulse.aero acquisition, which occurred on December 20, 2016. The contingent consideration is categorized as Level 3 in the fair valuehierarchy and the fair value is determined using a probability-weighted approach. The liabilities recorded were derived from the estimated probability that certaincontingent payment milestones will be met in accordance with the terms of the purchase agreements.
The change in fair value of the Level 3 contingent consideration related to the ICG and Pulse.aero acquisitions is as follows:
(in millions) Fair Value (Liability)Balance at September 30, 2016 $ (13)Acquisition date fair value of Pulse.aero contingent consideration (see Note 3) (5)Payment of contingent consideration (see Note 3) 2Fair value adjustment (1) (1)
Balance at September 30, 2017 $ (17)(1) The fair value adjustment is included in Interest expense on the Consolidated Statement of Operations.
98
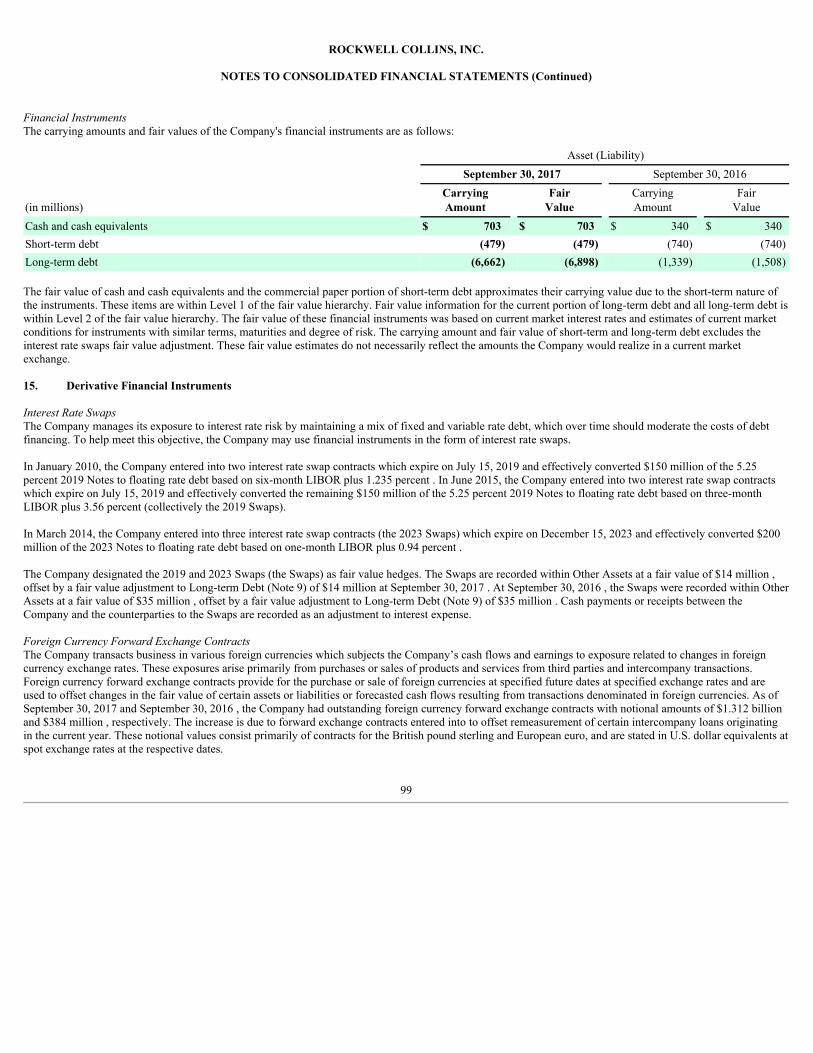
ROCKWELL COLLINS, INC.
NOTES TO CONSOLIDATED FINANCIAL STATEMENTS (Continued)
FinancialInstrumentsThe carrying amounts and fair values of the Company's financial instruments are as follows:
Asset (Liability) September 30, 2017 September 30, 2016
(in millions)CarryingAmount
FairValue
CarryingAmount
FairValue
Cash and cash equivalents $ 703 $ 703 $ 340 $ 340Short-term debt (479) (479) (740) (740)Long-term debt (6,662) (6,898) (1,339) (1,508)
The fair value of cash and cash equivalents and the commercial paper portion of short-term debt approximates their carrying value due to the short-term nature ofthe instruments. These items are within Level 1 of the fair value hierarchy. Fair value information for the current portion of long-term debt and all long-term debt iswithin Level 2 of the fair value hierarchy. The fair value of these financial instruments was based on current market interest rates and estimates of current marketconditions for instruments with similar terms, maturities and degree of risk. The carrying amount and fair value of short-term and long-term debt excludes theinterest rate swaps fair value adjustment. These fair value estimates do not necessarily reflect the amounts the Company would realize in a current marketexchange.
15. Derivative Financial Instruments
InterestRateSwapsThe Company manages its exposure to interest rate risk by maintaining a mix of fixed and variable rate debt, which over time should moderate the costs of debtfinancing. To help meet this objective, the Company may use financial instruments in the form of interest rate swaps.
In January 2010, the Company entered into two interest rate swap contracts which expire on July 15, 2019 and effectively converted $150 million of the 5.25percent 2019 Notes to floating rate debt based on six-month LIBOR plus 1.235 percent . In June 2015, the Company entered into two interest rate swap contractswhich expire on July 15, 2019 and effectively converted the remaining $150 million of the 5.25 percent 2019 Notes to floating rate debt based on three-monthLIBOR plus 3.56 percent (collectively the 2019 Swaps).
In March 2014, the Company entered into three interest rate swap contracts (the 2023 Swaps) which expire on December 15, 2023 and effectively converted $200million of the 2023 Notes to floating rate debt based on one-month LIBOR plus 0.94 percent .
The Company designated the 2019 and 2023 Swaps (the Swaps) as fair value hedges. The Swaps are recorded within Other Assets at a fair value of $14 million ,offset by a fair value adjustment to Long-term Debt (Note 9) of $14 million at September 30, 2017 . At September 30, 2016 , the Swaps were recorded within OtherAssets at a fair value of $35 million , offset by a fair value adjustment to Long-term Debt (Note 9) of $35 million . Cash payments or receipts between theCompany and the counterparties to the Swaps are recorded as an adjustment to interest expense.
ForeignCurrencyForwardExchangeContractsThe Company transacts business in various foreign currencies which subjects the Company’s cash flows and earnings to exposure related to changes in foreigncurrency exchange rates. These exposures arise primarily from purchases or sales of products and services from third parties and intercompany transactions.Foreign currency forward exchange contracts provide for the purchase or sale of foreign currencies at specified future dates at specified exchange rates and areused to offset changes in the fair value of certain assets or liabilities or forecasted cash flows resulting from transactions denominated in foreign currencies. As ofSeptember 30, 2017 and September 30, 2016 , the Company had outstanding foreign currency forward exchange contracts with notional amounts of $1.312 billionand $384 million , respectively. The increase is due to forward exchange contracts entered into to offset remeasurement of certain intercompany loans originatingin the current year. These notional values consist primarily of contracts for the British pound sterling and European euro, and are stated in U.S. dollar equivalents atspot exchange rates at the respective dates.
99
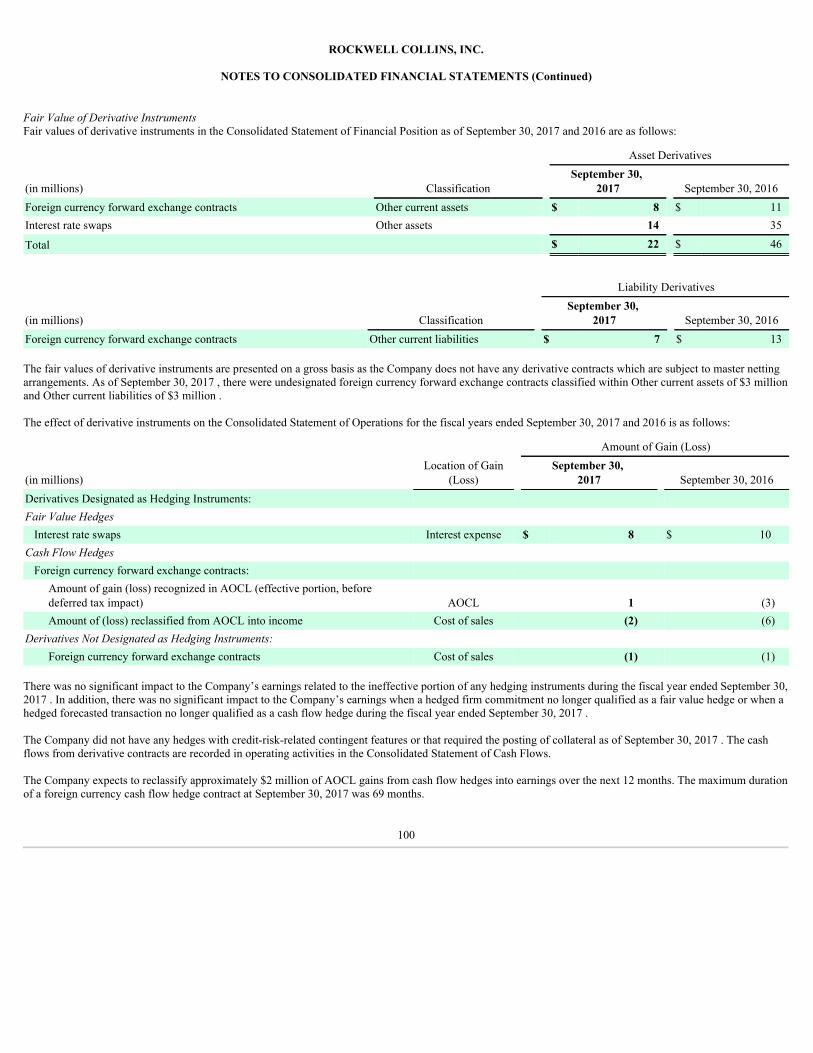
ROCKWELL COLLINS, INC.
NOTES TO CONSOLIDATED FINANCIAL STATEMENTS (Continued)
FairValueofDerivativeInstrumentsFair values of derivative instruments in the Consolidated Statement of Financial Position as of September 30, 2017 and 2016 are as follows:
Asset Derivatives
(in millions) Classification September 30,
2017 September 30, 2016Foreign currency forward exchange contracts Other current assets $ 8 $ 11Interest rate swaps Other assets 14 35
Total $ 22 $ 46
Liability Derivatives
(in millions) Classification September 30,
2017 September 30, 2016Foreign currency forward exchange contracts Other current liabilities $ 7 $ 13
The fair values of derivative instruments are presented on a gross basis as the Company does not have any derivative contracts which are subject to master nettingarrangements. As of September 30, 2017 , there were undesignated foreign currency forward exchange contracts classified within Other current assets of $3 millionand Other current liabilities of $3 million .
The effect of derivative instruments on the Consolidated Statement of Operations for the fiscal years ended September 30, 2017 and 2016 is as follows:
Amount of Gain (Loss)
(in millions)Location of Gain
(Loss) September 30,
2017 September 30, 2016Derivatives Designated as Hedging Instruments: FairValueHedges
Interest rate swaps Interest expense $ 8 $ 10CashFlowHedges
Foreign currency forward exchange contracts: Amount of gain (loss) recognized in AOCL (effective portion, beforedeferred tax impact) AOCL 1 (3)Amount of (loss) reclassified from AOCL into income Cost of sales (2) (6)
DerivativesNotDesignatedasHedgingInstruments: Foreign currency forward exchange contracts Cost of sales (1) (1)
There was no significant impact to the Company’s earnings related to the ineffective portion of any hedging instruments during the fiscal year ended September 30,2017 . In addition, there was no significant impact to the Company’s earnings when a hedged firm commitment no longer qualified as a fair value hedge or when ahedged forecasted transaction no longer qualified as a cash flow hedge during the fiscal year ended September 30, 2017 .
The Company did not have any hedges with credit-risk-related contingent features or that required the posting of collateral as of September 30, 2017 . The cashflows from derivative contracts are recorded in operating activities in the Consolidated Statement of Cash Flows.
The Company expects to reclassify approximately $2 million of AOCL gains from cash flow hedges into earnings over the next 12 months. The maximum durationof a foreign currency cash flow hedge contract at September 30, 2017 was 69 months.
100
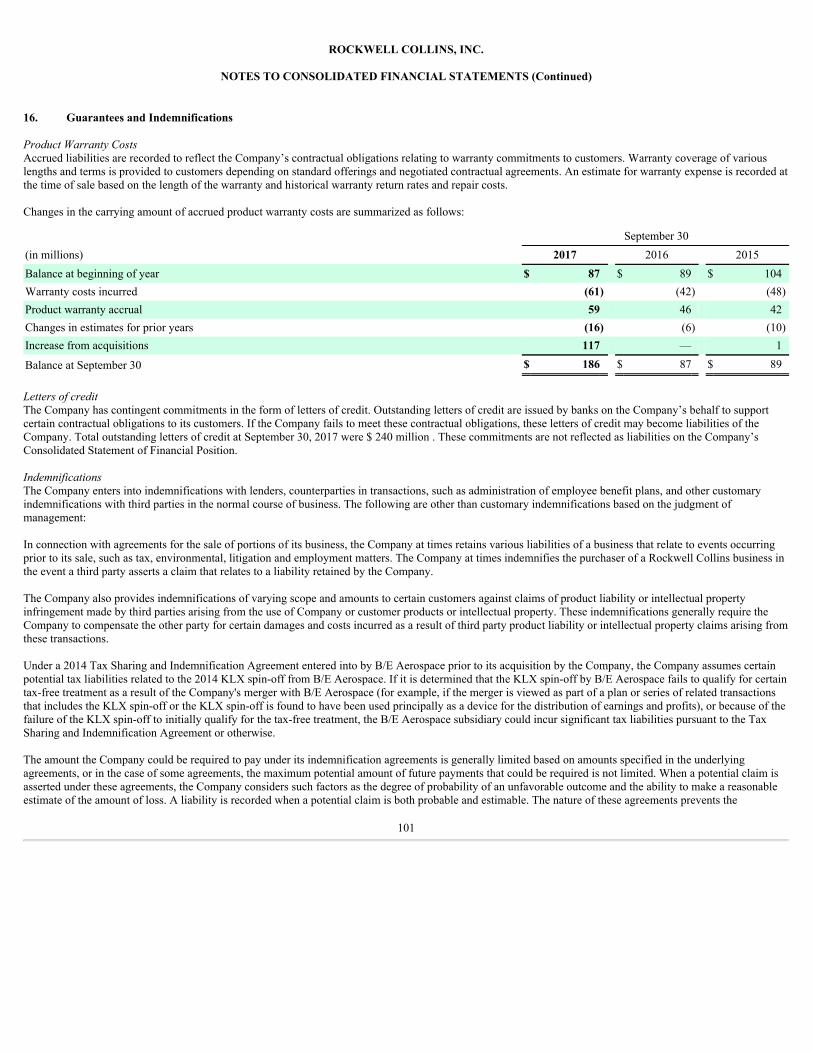
ROCKWELL COLLINS, INC.
NOTES TO CONSOLIDATED FINANCIAL STATEMENTS (Continued)
16. Guarantees and Indemnifications
ProductWarrantyCostsAccrued liabilities are recorded to reflect the Company’s contractual obligations relating to warranty commitments to customers. Warranty coverage of variouslengths and terms is provided to customers depending on standard offerings and negotiated contractual agreements. An estimate for warranty expense is recorded atthe time of sale based on the length of the warranty and historical warranty return rates and repair costs.
Changes in the carrying amount of accrued product warranty costs are summarized as follows:
September 30(in millions) 2017 2016 2015Balance at beginning of year $ 87 $ 89 $ 104Warranty costs incurred (61) (42) (48)Product warranty accrual 59 46 42Changes in estimates for prior years (16) (6) (10)Increase from acquisitions 117 — 1
Balance at September 30 $ 186 $ 87 $ 89
LettersofcreditThe Company has contingent commitments in the form of letters of credit. Outstanding letters of credit are issued by banks on the Company’s behalf to supportcertain contractual obligations to its customers. If the Company fails to meet these contractual obligations, these letters of credit may become liabilities of theCompany. Total outstanding letters of credit at September 30, 2017 were $ 240 million . These commitments are not reflected as liabilities on the Company’sConsolidated Statement of Financial Position.
IndemnificationsThe Company enters into indemnifications with lenders, counterparties in transactions, such as administration of employee benefit plans, and other customaryindemnifications with third parties in the normal course of business. The following are other than customary indemnifications based on the judgment ofmanagement:
In connection with agreements for the sale of portions of its business, the Company at times retains various liabilities of a business that relate to events occurringprior to its sale, such as tax, environmental, litigation and employment matters. The Company at times indemnifies the purchaser of a Rockwell Collins business inthe event a third party asserts a claim that relates to a liability retained by the Company.
The Company also provides indemnifications of varying scope and amounts to certain customers against claims of product liability or intellectual propertyinfringement made by third parties arising from the use of Company or customer products or intellectual property. These indemnifications generally require theCompany to compensate the other party for certain damages and costs incurred as a result of third party product liability or intellectual property claims arising fromthese transactions.
Under a 2014 Tax Sharing and Indemnification Agreement entered into by B/E Aerospace prior to its acquisition by the Company, the Company assumes certainpotential tax liabilities related to the 2014 KLX spin-off from B/E Aerospace. If it is determined that the KLX spin-off by B/E Aerospace fails to qualify for certaintax-free treatment as a result of the Company's merger with B/E Aerospace (for example, if the merger is viewed as part of a plan or series of related transactionsthat includes the KLX spin-off or the KLX spin-off is found to have been used principally as a device for the distribution of earnings and profits), or because of thefailure of the KLX spin-off to initially qualify for the tax-free treatment, the B/E Aerospace subsidiary could incur significant tax liabilities pursuant to the TaxSharing and Indemnification Agreement or otherwise.
The amount the Company could be required to pay under its indemnification agreements is generally limited based on amounts specified in the underlyingagreements, or in the case of some agreements, the maximum potential amount of future payments that could be required is not limited. When a potential claim isasserted under these agreements, the Company considers such factors as the degree of probability of an unfavorable outcome and the ability to make a reasonableestimate of the amount of loss. A liability is recorded when a potential claim is both probable and estimable. The nature of these agreements prevents the
101
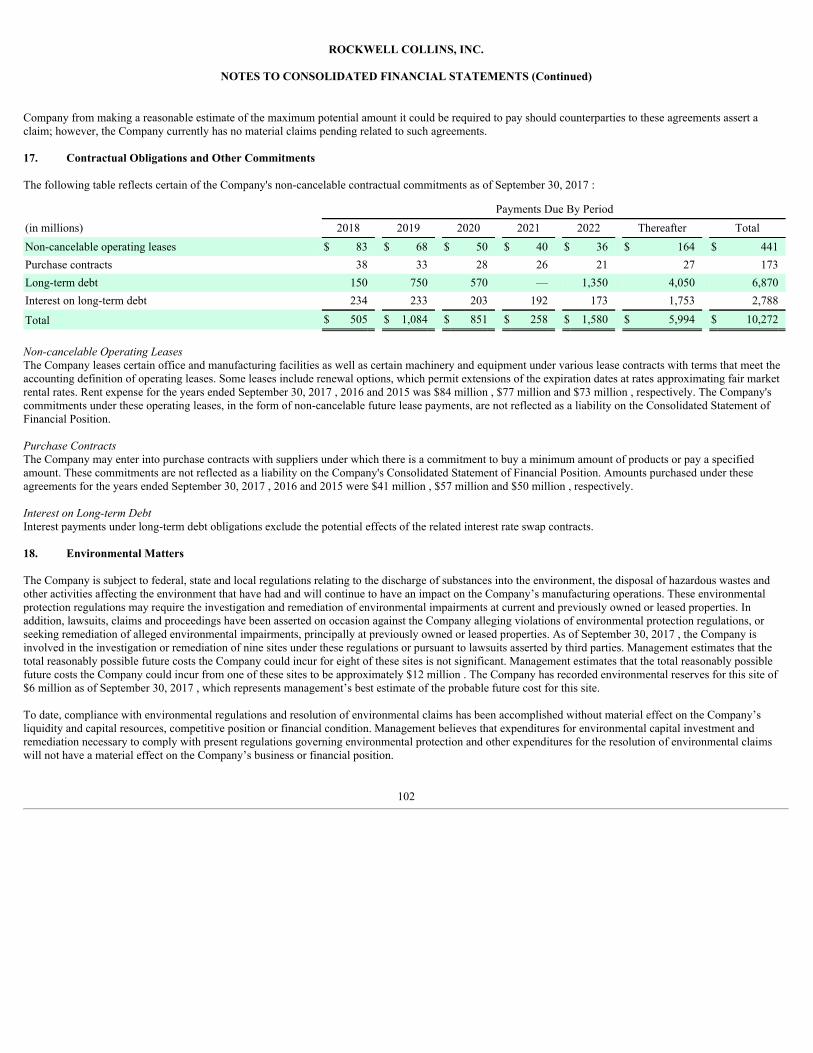
ROCKWELL COLLINS, INC.
NOTES TO CONSOLIDATED FINANCIAL STATEMENTS (Continued)
Company from making a reasonable estimate of the maximum potential amount it could be required to pay should counterparties to these agreements assert aclaim; however, the Company currently has no material claims pending related to such agreements.
17. Contractual Obligations and Other Commitments
The following table reflects certain of the Company's non-cancelable contractual commitments as of September 30, 2017 :
Payments Due By Period(in millions) 2018 2019 2020 2021 2022 Thereafter TotalNon-cancelable operating leases $ 83 $ 68 $ 50 $ 40 $ 36 $ 164 $ 441Purchase contracts 38 33 28 26 21 27 173Long-term debt 150 750 570 — 1,350 4,050 6,870Interest on long-term debt 234 233 203 192 173 1,753 2,788
Total $ 505 $ 1,084 $ 851 $ 258 $ 1,580 $ 5,994 $ 10,272
Non-cancelableOperatingLeasesThe Company leases certain office and manufacturing facilities as well as certain machinery and equipment under various lease contracts with terms that meet theaccounting definition of operating leases. Some leases include renewal options, which permit extensions of the expiration dates at rates approximating fair marketrental rates. Rent expense for the years ended September 30, 2017 , 2016 and 2015 was $84 million , $77 million and $73 million , respectively. The Company'scommitments under these operating leases, in the form of non-cancelable future lease payments, are not reflected as a liability on the Consolidated Statement ofFinancial Position.
PurchaseContractsThe Company may enter into purchase contracts with suppliers under which there is a commitment to buy a minimum amount of products or pay a specifiedamount. These commitments are not reflected as a liability on the Company's Consolidated Statement of Financial Position. Amounts purchased under theseagreements for the years ended September 30, 2017 , 2016 and 2015 were $41 million , $57 million and $50 million , respectively.
InterestonLong-termDebtInterest payments under long-term debt obligations exclude the potential effects of the related interest rate swap contracts.
18. Environmental Matters
The Company is subject to federal, state and local regulations relating to the discharge of substances into the environment, the disposal of hazardous wastes andother activities affecting the environment that have had and will continue to have an impact on the Company’s manufacturing operations. These environmentalprotection regulations may require the investigation and remediation of environmental impairments at current and previously owned or leased properties. Inaddition, lawsuits, claims and proceedings have been asserted on occasion against the Company alleging violations of environmental protection regulations, orseeking remediation of alleged environmental impairments, principally at previously owned or leased properties. As of September 30, 2017 , the Company isinvolved in the investigation or remediation of nine sites under these regulations or pursuant to lawsuits asserted by third parties. Management estimates that thetotal reasonably possible future costs the Company could incur for eight of these sites is not significant. Management estimates that the total reasonably possiblefuture costs the Company could incur from one of these sites to be approximately $12 million . The Company has recorded environmental reserves for this site of$6 million as of September 30, 2017 , which represents management’s best estimate of the probable future cost for this site.
To date, compliance with environmental regulations and resolution of environmental claims has been accomplished without material effect on the Company’sliquidity and capital resources, competitive position or financial condition. Management believes that expenditures for environmental capital investment andremediation necessary to comply with present regulations governing environmental protection and other expenditures for the resolution of environmental claimswill not have a material effect on the Company’s business or financial position.
102
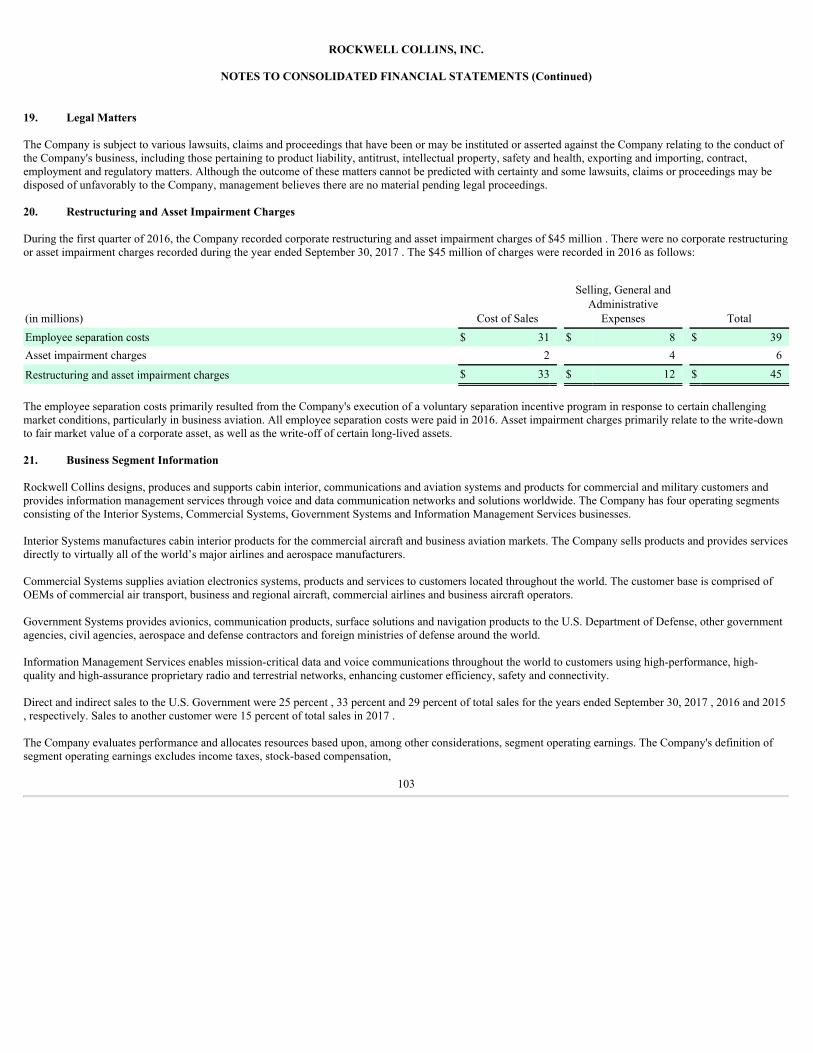
ROCKWELL COLLINS, INC.
NOTES TO CONSOLIDATED FINANCIAL STATEMENTS (Continued)
19. Legal Matters
The Company is subject to various lawsuits, claims and proceedings that have been or may be instituted or asserted against the Company relating to the conduct ofthe Company's business, including those pertaining to product liability, antitrust, intellectual property, safety and health, exporting and importing, contract,employment and regulatory matters. Although the outcome of these matters cannot be predicted with certainty and some lawsuits, claims or proceedings may bedisposed of unfavorably to the Company, management believes there are no material pending legal proceedings.
20. Restructuring and Asset Impairment Charges
During the first quarter of 2016, the Company recorded corporate restructuring and asset impairment charges of $45 million . There were no corporate restructuringor asset impairment charges recorded during the year ended September 30, 2017 . The $45 million of charges were recorded in 2016 as follows:
(in millions) Cost of Sales
Selling, General andAdministrative
Expenses TotalEmployee separation costs $ 31 $ 8 $ 39Asset impairment charges 2 4 6
Restructuring and asset impairment charges $ 33 $ 12 $ 45
The employee separation costs primarily resulted from the Company's execution of a voluntary separation incentive program in response to certain challengingmarket conditions, particularly in business aviation. All employee separation costs were paid in 2016. Asset impairment charges primarily relate to the write-downto fair market value of a corporate asset, as well as the write-off of certain long-lived assets.
21. Business Segment Information
Rockwell Collins designs, produces and supports cabin interior, communications and aviation systems and products for commercial and military customers andprovides information management services through voice and data communication networks and solutions worldwide. The Company has four operating segmentsconsisting of the Interior Systems, Commercial Systems, Government Systems and Information Management Services businesses.
Interior Systems manufactures cabin interior products for the commercial aircraft and business aviation markets. The Company sells products and provides servicesdirectly to virtually all of the world’s major airlines and aerospace manufacturers.
Commercial Systems supplies aviation electronics systems, products and services to customers located throughout the world. The customer base is comprised ofOEMs of commercial air transport, business and regional aircraft, commercial airlines and business aircraft operators.
Government Systems provides avionics, communication products, surface solutions and navigation products to the U.S. Department of Defense, other governmentagencies, civil agencies, aerospace and defense contractors and foreign ministries of defense around the world.
Information Management Services enables mission-critical data and voice communications throughout the world to customers using high-performance, high-quality and high-assurance proprietary radio and terrestrial networks, enhancing customer efficiency, safety and connectivity.
Direct and indirect sales to the U.S. Government were 25 percent , 33 percent and 29 percent of total sales for the years ended September 30, 2017 , 2016 and 2015, respectively. Sales to another customer were 15 percent of total sales in 2017 .
The Company evaluates performance and allocates resources based upon, among other considerations, segment operating earnings. The Company's definition ofsegment operating earnings excludes income taxes, stock-based compensation,
103
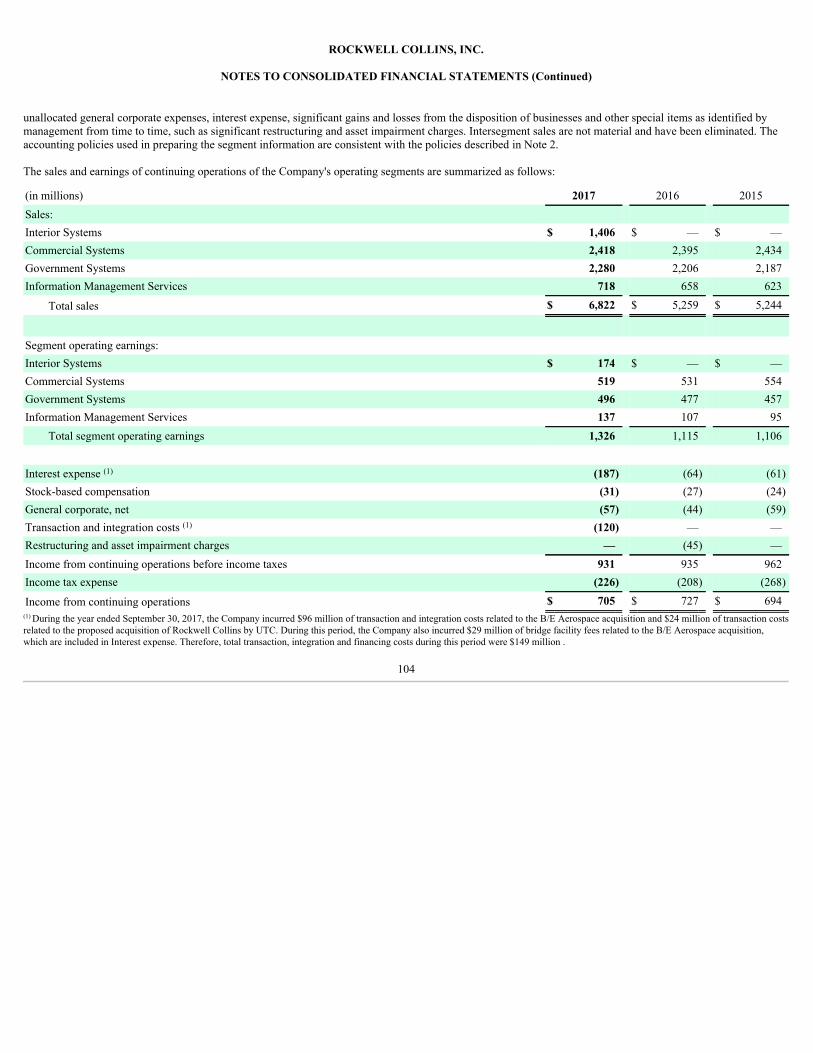
ROCKWELL COLLINS, INC.
NOTES TO CONSOLIDATED FINANCIAL STATEMENTS (Continued)
unallocated general corporate expenses, interest expense, significant gains and losses from the disposition of businesses and other special items as identified bymanagement from time to time, such as significant restructuring and asset impairment charges. Intersegment sales are not material and have been eliminated. Theaccounting policies used in preparing the segment information are consistent with the policies described in Note 2.
The sales and earnings of continuing operations of the Company's operating segments are summarized as follows:
(in millions) 2017 2016 2015Sales: Interior Systems $ 1,406 $ — $ —Commercial Systems 2,418 2,395 2,434Government Systems 2,280 2,206 2,187Information Management Services 718 658 623
Total sales $ 6,822 $ 5,259 $ 5,244
Segment operating earnings: Interior Systems $ 174 $ — $ —Commercial Systems 519 531 554Government Systems 496 477 457Information Management Services 137 107 95
Total segment operating earnings 1,326 1,115 1,106
Interest expense (1) (187) (64) (61)Stock-based compensation (31) (27) (24)General corporate, net (57) (44) (59)Transaction and integration costs (1) (120) — —Restructuring and asset impairment charges — (45) —Income from continuing operations before income taxes 931 935 962Income tax expense (226) (208) (268)
Income from continuing operations $ 705 $ 727 $ 694(1) During the year ended September 30, 2017, the Company incurred $96 million of transaction and integration costs related to the B/E Aerospace acquisition and $24 million of transaction costsrelated to the proposed acquisition of Rockwell Collins by UTC. During this period, the Company also incurred $29 million of bridge facility fees related to the B/E Aerospace acquisition,which are included in Interest expense. Therefore, total transaction, integration and financing costs during this period were $149 million .
104
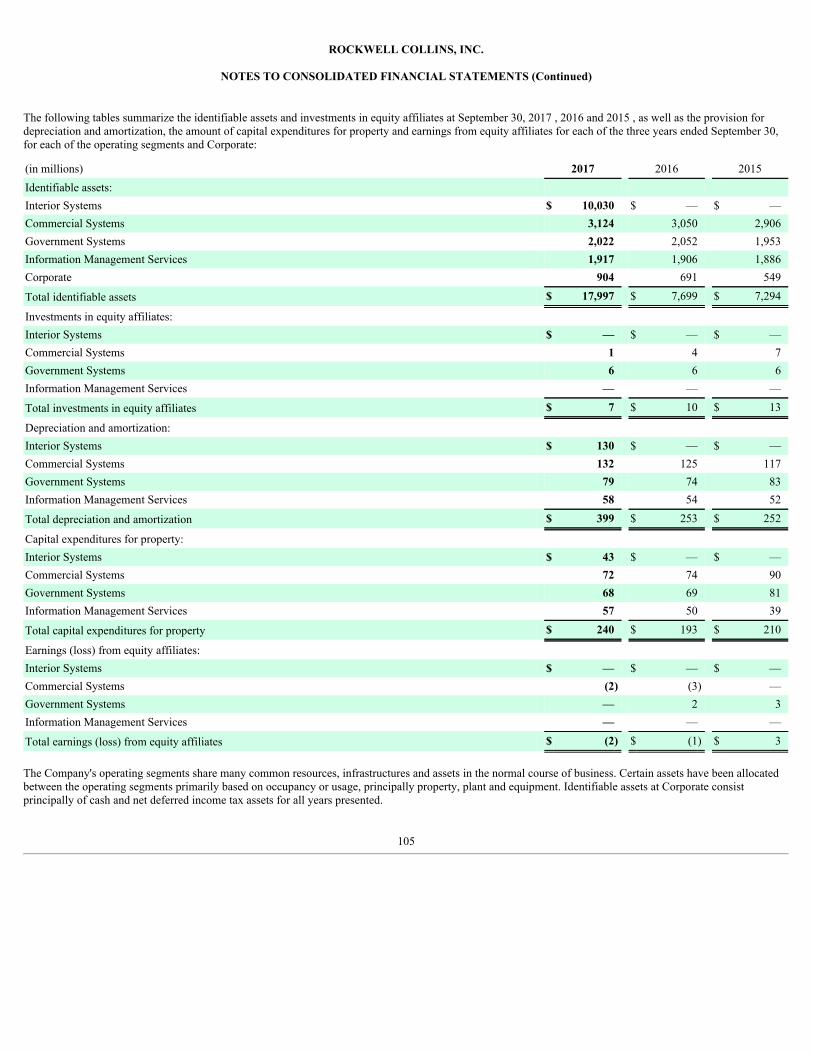
ROCKWELL COLLINS, INC.
NOTES TO CONSOLIDATED FINANCIAL STATEMENTS (Continued)
The following tables summarize the identifiable assets and investments in equity affiliates at September 30, 2017 , 2016 and 2015 , as well as the provision fordepreciation and amortization, the amount of capital expenditures for property and earnings from equity affiliates for each of the three years ended September 30,for each of the operating segments and Corporate:
(in millions) 2017 2016 2015Identifiable assets: Interior Systems $ 10,030 $ — $ —Commercial Systems 3,124 3,050 2,906Government Systems 2,022 2,052 1,953Information Management Services 1,917 1,906 1,886Corporate 904 691 549
Total identifiable assets $ 17,997 $ 7,699 $ 7,294
Investments in equity affiliates: Interior Systems $ — $ — $ —Commercial Systems 1 4 7Government Systems 6 6 6Information Management Services — — —
Total investments in equity affiliates $ 7 $ 10 $ 13
Depreciation and amortization: Interior Systems $ 130 $ — $ —Commercial Systems 132 125 117Government Systems 79 74 83Information Management Services 58 54 52
Total depreciation and amortization $ 399 $ 253 $ 252
Capital expenditures for property: Interior Systems $ 43 $ — $ —Commercial Systems 72 74 90Government Systems 68 69 81Information Management Services 57 50 39
Total capital expenditures for property $ 240 $ 193 $ 210
Earnings (loss) from equity affiliates: Interior Systems $ — $ — $ —Commercial Systems (2) (3) —Government Systems — 2 3Information Management Services — — —
Total earnings (loss) from equity affiliates $ (2) $ (1) $ 3
The Company's operating segments share many common resources, infrastructures and assets in the normal course of business. Certain assets have been allocatedbetween the operating segments primarily based on occupancy or usage, principally property, plant and equipment. Identifiable assets at Corporate consistprincipally of cash and net deferred income tax assets for all years presented.
105
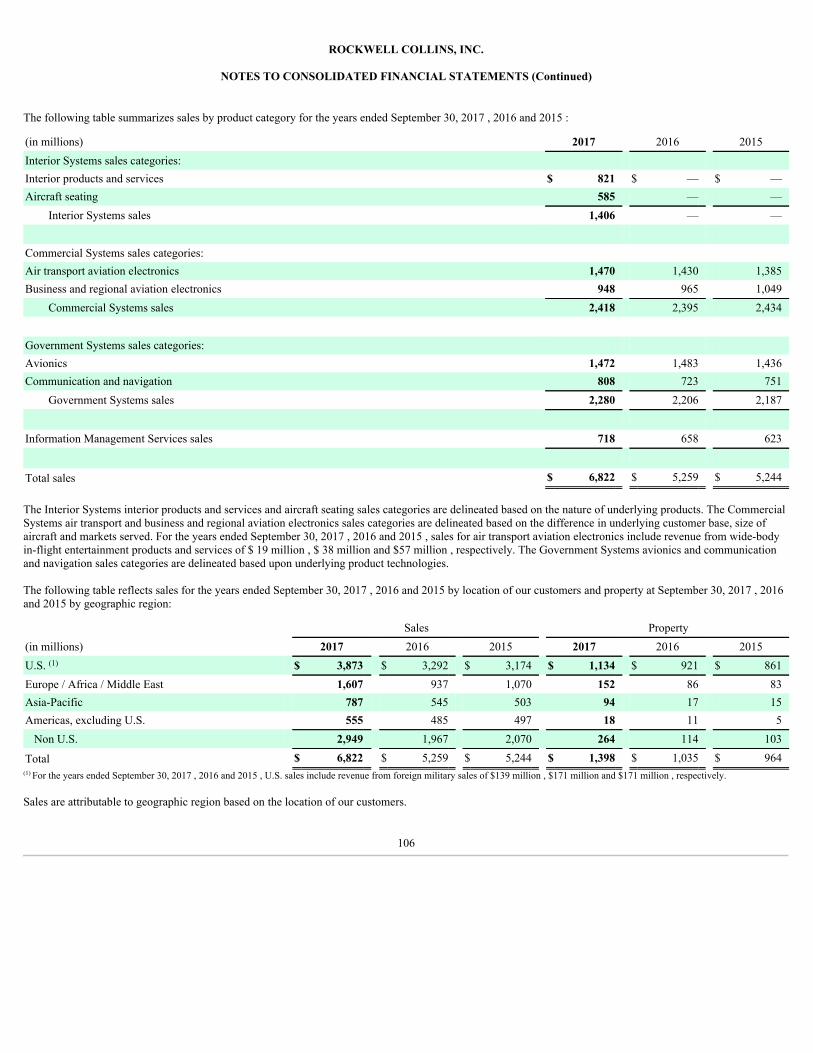
ROCKWELL COLLINS, INC.
NOTES TO CONSOLIDATED FINANCIAL STATEMENTS (Continued)
The following table summarizes sales by product category for the years ended September 30, 2017 , 2016 and 2015 :
(in millions) 2017 2016 2015Interior Systems sales categories: Interior products and services $ 821 $ — $ —Aircraft seating 585 — —
Interior Systems sales 1,406 — —
Commercial Systems sales categories: Air transport aviation electronics 1,470 1,430 1,385Business and regional aviation electronics 948 965 1,049
Commercial Systems sales 2,418 2,395 2,434
Government Systems sales categories: Avionics 1,472 1,483 1,436Communication and navigation 808 723 751
Government Systems sales 2,280 2,206 2,187
Information Management Services sales 718 658 623
Total sales $ 6,822 $ 5,259 $ 5,244
The Interior Systems interior products and services and aircraft seating sales categories are delineated based on the nature of underlying products. The CommercialSystems air transport and business and regional aviation electronics sales categories are delineated based on the difference in underlying customer base, size ofaircraft and markets served. For the years ended September 30, 2017 , 2016 and 2015 , sales for air transport aviation electronics include revenue from wide-bodyin-flight entertainment products and services of $ 19 million , $ 38 million and $57 million , respectively. The Government Systems avionics and communicationand navigation sales categories are delineated based upon underlying product technologies.
The following table reflects sales for the years ended September 30, 2017 , 2016 and 2015 by location of our customers and property at September 30, 2017 , 2016and 2015 by geographic region:
Sales Property(in millions) 2017 2016 2015 2017 2016 2015U.S. (1) $ 3,873 $ 3,292 $ 3,174 $ 1,134 $ 921 $ 861Europe / Africa / Middle East 1,607 937 1,070 152 86 83Asia-Pacific 787 545 503 94 17 15Americas, excluding U.S. 555 485 497 18 11 5
Non U.S. 2,949 1,967 2,070 264 114 103
Total $ 6,822 $ 5,259 $ 5,244 $ 1,398 $ 1,035 $ 964(1) For the years ended September 30, 2017 , 2016 and 2015 , U.S. sales include revenue from foreign military sales of $139 million , $171 million and $171 million , respectively.
Sales are attributable to geographic region based on the location of our customers.
106
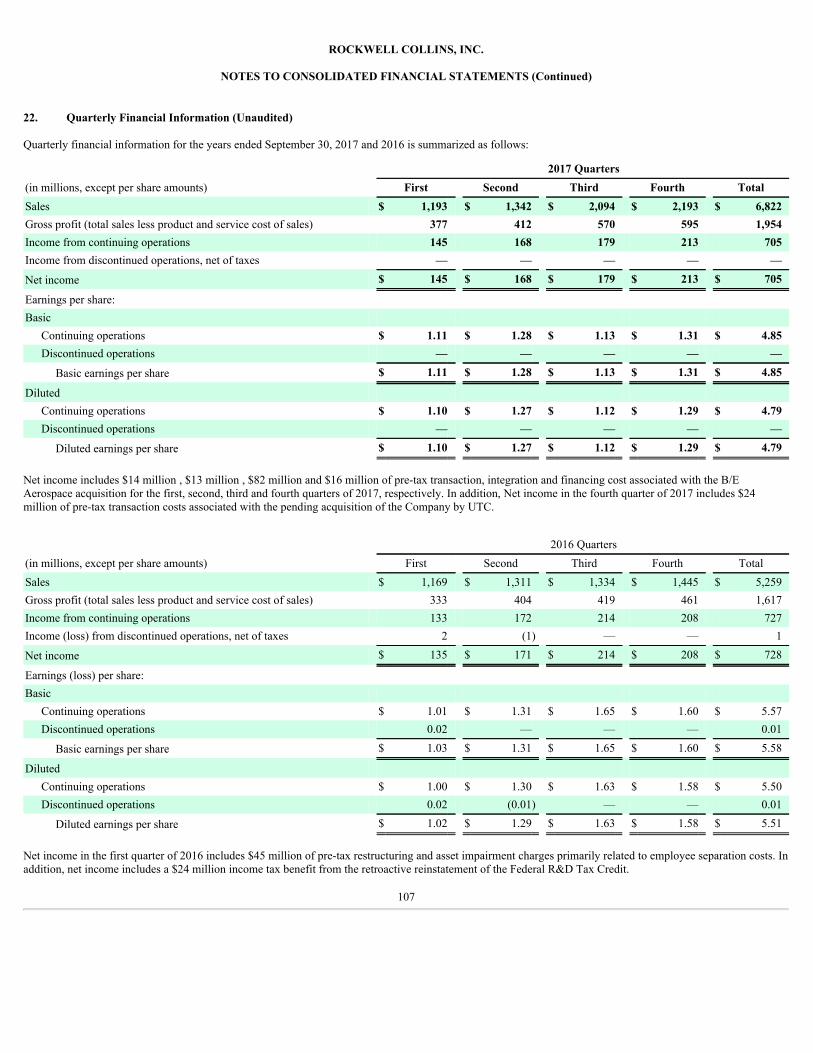
ROCKWELL COLLINS, INC.
NOTES TO CONSOLIDATED FINANCIAL STATEMENTS (Continued)
22. Quarterly Financial Information (Unaudited)
Quarterly financial information for the years ended September 30, 2017 and 2016 is summarized as follows:
2017 Quarters(in millions, except per share amounts) First Second Third Fourth TotalSales $ 1,193 $ 1,342 $ 2,094 $ 2,193 $ 6,822Gross profit (total sales less product and service cost of sales) 377 412 570 595 1,954Income from continuing operations 145 168 179 213 705Income from discontinued operations, net of taxes — — — — —
Net income $ 145 $ 168 $ 179 $ 213 $ 705
Earnings per share: Basic
Continuing operations $ 1.11 $ 1.28 $ 1.13 $ 1.31 $ 4.85Discontinued operations — — — — —
Basic earnings per share $ 1.11 $ 1.28 $ 1.13 $ 1.31 $ 4.85
Diluted Continuing operations $ 1.10 $ 1.27 $ 1.12 $ 1.29 $ 4.79Discontinued operations — — — — —
Diluted earnings per share $ 1.10 $ 1.27 $ 1.12 $ 1.29 $ 4.79
Net income includes $14 million , $13 million , $82 million and $16 million of pre-tax transaction, integration and financing cost associated with the B/EAerospace acquisition for the first, second, third and fourth quarters of 2017, respectively. In addition, Net income in the fourth quarter of 2017 includes $24million of pre-tax transaction costs associated with the pending acquisition of the Company by UTC.
2016 Quarters(in millions, except per share amounts) First Second Third Fourth TotalSales $ 1,169 $ 1,311 $ 1,334 $ 1,445 $ 5,259Gross profit (total sales less product and service cost of sales) 333 404 419 461 1,617Income from continuing operations 133 172 214 208 727Income (loss) from discontinued operations, net of taxes 2 (1) — — 1
Net income $ 135 $ 171 $ 214 $ 208 $ 728
Earnings (loss) per share: Basic
Continuing operations $ 1.01 $ 1.31 $ 1.65 $ 1.60 $ 5.57Discontinued operations 0.02 — — — 0.01
Basic earnings per share $ 1.03 $ 1.31 $ 1.65 $ 1.60 $ 5.58
Diluted Continuing operations $ 1.00 $ 1.30 $ 1.63 $ 1.58 $ 5.50Discontinued operations 0.02 (0.01) — — 0.01
Diluted earnings per share $ 1.02 $ 1.29 $ 1.63 $ 1.58 $ 5.51
Net income in the first quarter of 2016 includes $45 million of pre-tax restructuring and asset impairment charges primarily related to employee separation costs. Inaddition, net income includes a $24 million income tax benefit from the retroactive reinstatement of the Federal R&D Tax Credit.
107
ROCKWELL COLLINS, INC.
NOTES TO CONSOLIDATED FINANCIAL STATEMENTS (Continued)
Net income in the third quarter of 2016 includes a $41 million income tax benefit due to the release of a valuation allowance for a U.S. capital loss carryforward.
Earnings per share amounts are computed independently each quarter. As a result, the sum of each quarter's per share amount may not equal the total per shareamount for the respective year.
Item 9. Changes in and Disagreements with Accountants on Accounting and Financial Disclosure.
None.
Item 9A. Controls and Procedures.
Evaluation of Disclosure Controls and Procedures
We maintain disclosure controls and procedures (as defined in Exchange Act Rule 13a-15(e)) that are designed to ensure that information required to be disclosedin our reports filed or submitted under the Securities Exchange Act of 1934 is recorded, processed, summarized and reported within the time periods specified inthe SEC's rules and forms, including controls and procedures designed to ensure that such information is accumulated and communicated to our management,including our Chairman, President and Chief Executive Officer and our Senior Vice President and Chief Financial Officer, as appropriate, to allow timely decisionsregarding required disclosure. Management necessarily applied its judgment in assessing the costs and benefits of such controls and procedures, which, by theirnature, can provide only reasonable assurance regarding management's disclosure control objectives.
We have carried out an evaluation, under the supervision and with the participation of our management, including our Chairman, President and Chief ExecutiveOfficer and our Senior Vice President and Chief Financial Officer, of the effectiveness of the design and operation of our disclosure controls and procedures as ofthe end of the period covered by this Annual Report (the "Evaluation Date"). Based upon that evaluation, our Chairman, President and Chief Executive Officer andour Senior Vice President and Chief Financial Officer concluded that our disclosure controls and procedures were effective at a reasonable assurance level as of theEvaluation Date.
Evaluation of Internal Control Over Financial Reporting
Management's report on internal control over financial reporting as of September 30, 2017 is included within Item 8 of this Annual Report on Form 10-K. Thereport of Deloitte & Touche LLP on the effectiveness of internal control over financial reporting is included within Item 9A of this Annual Report on Form 10-K.
On April 13, 2017, Rockwell Collins completed the acquisition of B/E Aerospace. Accordingly, the acquired assets and liabilities of B/E Aerospace are included inour consolidated balance sheet as of September 30, 2017, and the results of its operations and cash flows are reported in our consolidated statements of operationsand cash flows from April 13, 2017 through September 30, 2017. With the exception of goodwill and intangible assets, which were integrated into the RockwellCollins’ control environment, we have elected to exclude B/E Aerospace from the scope of our report on internal control over financial reporting as of September30, 2017. The excluded financial position of B/E Aerospace represented 9 percent of our total assets at September 30, 2017, and its results of operations increasedour total sales by 26 percent and increased income from continuing operations before income taxes by 23 percent during the year ended September 30, 2017.
Changes in Internal Control Over Financial Reporting
There were no changes in our internal control over financial reporting (as defined in Exchange Act Rule 13a-15(f)) that occurred during our last fiscal quarter thathave materially affected, or are reasonably likely to materially affect, our internal control over financial reporting.
108
Report of Independent Registered Public Accounting Firm
To the Board of Directors and Shareowners ofRockwell Collins, Inc.
We have audited the internal control over financial reporting of Rockwell Collins, Inc. and subsidiaries (the "Company") as of September 29, 2017, based oncriteria established in InternalControl-IntegratedFramework(2013)issued by the Committee of Sponsoring Organizations of the Treadway Commission. Asdescribed in Management’sReportonInternalControlOverFinancialReporting, with the exception of goodwill and intangible assets which were integrated intothe Company’s control environment, management has elected to exclude B/E Aerospace, Inc. (“B/E Aerospace”), which was acquired on April 13, 2017, from itsassessment of internal control over financial reporting. B/E Aerospace’s financial position constituted 9 percent of the Company’s total assets at September 29,2017, and its results of operations increased total sales by 26 percent and increased income from continuing operations before income taxes by 23 percent, duringthe year ended September 29, 2017. Accordingly, our audit did not include the internal control over financial reporting at B/E Aerospace. The Company'smanagement is responsible for maintaining effective internal control over financial reporting and for its assessment of the effectiveness of internal control overfinancial reporting, included in the accompanying Management’sReportonInternalControlOverFinancialReporting. Our responsibility is to express an opinionon the Company's internal control over financial reporting based on our audit.
We conducted our audit in accordance with the standards of the Public Company Accounting Oversight Board (United States). Those standards require that weplan and perform the audit to obtain reasonable assurance about whether effective internal control over financial reporting was maintained in all material respects.Our audit included obtaining an understanding of internal control over financial reporting, assessing the risk that a material weakness exists, testing and evaluatingthe design and operating effectiveness of internal control based on the assessed risk, and performing such other procedures as we considered necessary in thecircumstances. We believe that our audit provides a reasonable basis for our opinion.
A company's internal control over financial reporting is a process designed by, or under the supervision of, the company's principal executive and principalfinancial officers, or persons performing similar functions, and effected by the company's board of directors, management, and other personnel to providereasonable assurance regarding the reliability of financial reporting and the preparation of financial statements for external purposes in accordance with generallyaccepted accounting principles. A company's internal control over financial reporting includes those policies and procedures that (1) pertain to the maintenance ofrecords that, in reasonable detail, accurately and fairly reflect the transactions and dispositions of the assets of the company; (2) provide reasonable assurance thattransactions are recorded as necessary to permit preparation of financial statements in accordance with generally accepted accounting principles, and that receiptsand expenditures of the company are being made only in accordance with authorizations of management and directors of the company; and (3) provide reasonableassurance regarding prevention or timely detection of unauthorized acquisition, use, or disposition of the company's assets that could have a material effect on thefinancial statements.
Because of the inherent limitations of internal control over financial reporting, including the possibility of collusion or improper management override of controls,material misstatements due to error or fraud may not be prevented or detected on a timely basis. Also, projections of any evaluation of the effectiveness of theinternal control over financial reporting to future periods are subject to the risk that the controls may become inadequate because of changes in conditions, or thatthe degree of compliance with the policies or procedures may deteriorate.
In our opinion, the Company maintained, in all material respects, effective internal control over financial reporting as of September 29, 2017, based on the criteriaestablished in InternalControl-IntegratedFramework(2013)issued by the Committee of Sponsoring Organizations of the Treadway Commission.
We have also audited, in accordance with the standards of the Public Company Accounting Oversight Board (United States), the consolidated financial statementsas of and for the year ended September 29, 2017 of the Company and our report dated November 14, 2017 expressed an unqualified opinion on those financialstatements.
/s/ DELOITTE & TOUCHE LLP
Chicago, IllinoisNovember 14, 2017
109
Item 9B. Other Information.
None.
PART III
Item 10. Directors, Executive Officers and Corporate Governance.
See the information under the captions Election of Directors, Information as to Nominees for Directors and Continuing Directors, Audit Committee Report andSection 16(a) Beneficial Ownership Reporting Compliance in the 2018 Proxy Statement. See also the information with respect to executive officers of theCompany under Item 4A of Part I.
We have adopted a handbook entitled Rockwell Collins Standards of Business Conduct, and we have supporting policies covering standards of business conductand conflicts of interest (collectively, the "code of ethics"). The code of ethics applies to our Chief Executive Officer, Chief Financial Officer, Vice President,Finance & Controller (who serves as our principal accounting officer), as well as to all of our other employees and to the members of our Board of Directors. Thecode of ethics is publicly available on our website at www.rockwellcollins.com . If we make any amendments to the code of ethics or grant any waiver, includingany implicit waiver, from a provision of the code applicable to our Chief Executive Officer, Chief Financial Officer or principal accounting officer requiringdisclosure under applicable SEC rules, we intend to disclose the nature of such amendment or waiver on our website.
Item 11. Executive Compensation.
See the information under the captions Compensation of Directors, Compensation Discussion and Analysis, Compensation Committee Report, SummaryCompensation Table, Grants of Plan-Based Awards, Outstanding Equity Awards at Fiscal Year End, Option Exercises and Stock Vested, Pension Benefits,Non-Qualified Deferred Compensation and Potential Payments Upon Termination of Change of Control in the 2018 Proxy Statement.
Item 12. Security Ownership of Certain Beneficial Owners and Management and Related Stockholder Matters.
See the information under the captions Voting Securities andEquity Ownership of Certain Beneficial Owners and Management in the 2018 Proxy Statement.
110
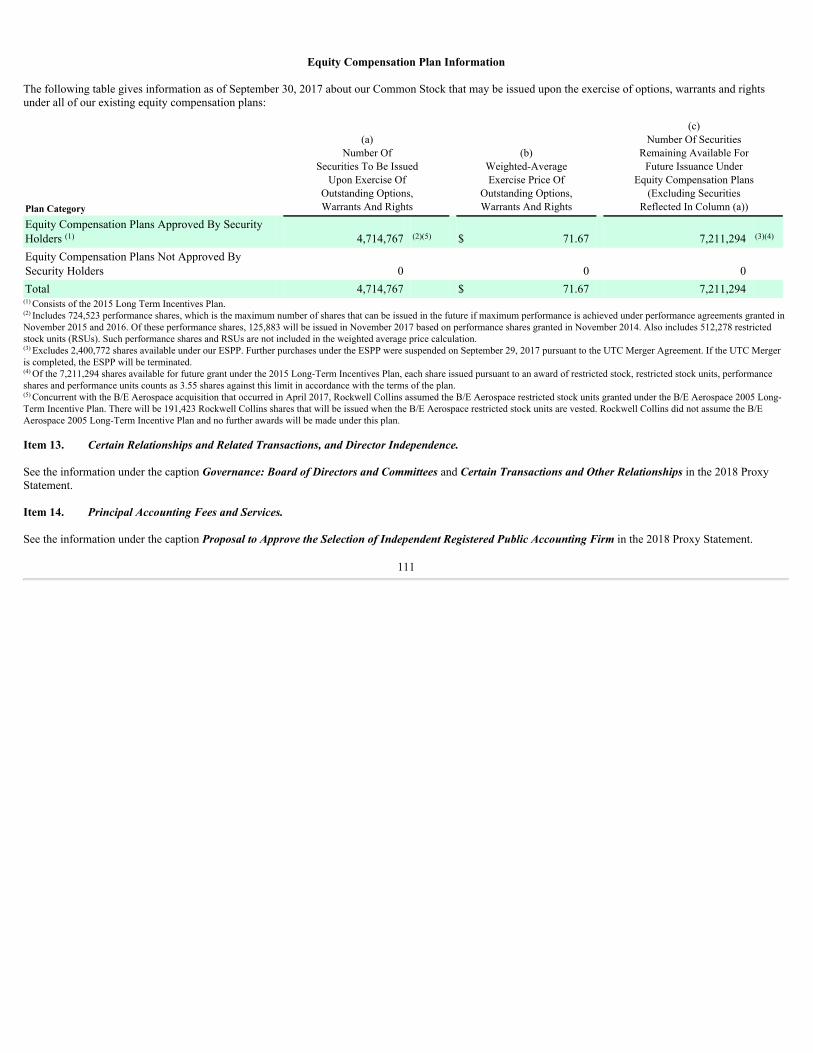
Equity Compensation Plan Information
The following table gives information as of September 30, 2017 about our Common Stock that may be issued upon the exercise of options, warrants and rightsunder all of our existing equity compensation plans:
Plan Category
(a)Number Of
Securities To Be IssuedUpon Exercise Of
Outstanding Options,Warrants And Rights
(b)Weighted-AverageExercise Price Of
Outstanding Options,Warrants And Rights
(c)Number Of Securities
Remaining Available ForFuture Issuance Under
Equity Compensation Plans(Excluding Securities
Reflected In Column (a))
Equity Compensation Plans Approved By SecurityHolders (1) 4,714,767 (2)(5) $ 71.67 7,211,294 (3)(4) Equity Compensation Plans Not Approved BySecurity Holders 0 0 0 Total 4,714,767 $ 71.67 7,211,294
(1) Consists of the 2015 Long Term Incentives Plan.(2) Includes 724,523 performance shares, which is the maximum number of shares that can be issued in the future if maximum performance is achieved under performance agreements granted inNovember 2015 and 2016. Of these performance shares, 125,883 will be issued in November 2017 based on performance shares granted in November 2014. Also includes 512,278 restrictedstock units (RSUs). Such performance shares and RSUs are not included in the weighted average price calculation.(3) Excludes 2,400,772 shares available under our ESPP. Further purchases under the ESPP were suspended on September 29, 2017 pursuant to the UTC Merger Agreement. If the UTC Mergeris completed, the ESPP will be terminated.(4) Of the 7,211,294 shares available for future grant under the 2015 Long-Term Incentives Plan, each share issued pursuant to an award of restricted stock, restricted stock units, performanceshares and performance units counts as 3.55 shares against this limit in accordance with the terms of the plan.(5) Concurrent with the B/E Aerospace acquisition that occurred in April 2017, Rockwell Collins assumed the B/E Aerospace restricted stock units granted under the B/E Aerospace 2005 Long-Term Incentive Plan. There will be 191,423 Rockwell Collins shares that will be issued when the B/E Aerospace restricted stock units are vested. Rockwell Collins did not assume the B/EAerospace 2005 Long-Term Incentive Plan and no further awards will be made under this plan.
Item 13. Certain Relationships and Related Transactions, and Director Independence.
See the information under the caption Governance: Board of Directors and Committees and Certain Transactions and Other Relationships in the 2018 ProxyStatement.
Item 14. Principal Accounting Fees and Services.
See the information under the caption Proposal to Approve the Selection of Independent Registered Public Accounting Firm in the 2018 Proxy Statement.
111
PART IV
Item 15. Exhibits and Financial Statement Schedules.
(a) Financial Statements, Financial Statement Schedules and Exhibits. (1) Financial Statements The financial statements are included under Item 8 of this Annual Report on Form 10-K: Consolidated Statement of Financial Position, as of September 30, 2017 and 2016 Consolidated Statement of Operations, years ended September 30, 2017, 2016 and 2015 Consolidated Statement of Comprehensive Income, years ended September 30, 2017, 2016 and 2015 Consolidated Statement of Cash Flows, years ended September 30, 2017, 2016 and 2015 Consolidated Statement of Equity, years ended September 30, 2017, 2016 and 2015 Notes to Consolidated Financial Statements Report of Independent Registered Public Accounting Firm
All other schedules not filed herewith are omitted because of the absence of conditions under which they are required or because theinformation called for is shown in the financial statements or notes thereto.
Exhibits
3-a-1
Restated Certificate of Incorporation of the Company, as amended, filed as Exhibit 3-a-1 to the Company's Form 10-K for year endedSeptember 30, 2001, is incorporated herein by reference.
3-a-2
Certificate of Merger effecting name change of the Company from "New Rockwell Collins, Inc." to "Rockwell Collins, Inc.", filed asExhibit 3-a-2 to the Company's Form 10-K for year ended September 30, 2001, is incorporated herein by reference.
3-b-1
By-Laws of the Company, as amended and restated effective April 20, 2016, filed as Exhibit 3-b-1 to the Company's Form 8-K dated April20, 2016, is incorporated herein by reference.
4-a-1
Indenture dated as of November 1, 2001 between the Company and Citibank, N.A., as Trustee, filed as Exhibit 4.b.1 to the Company'sRegistration Statement on Form S-3 (No. 333-72914), is incorporated herein by reference.
4-a-2
Form of Supplemental Indenture dated as of December 4, 2006 between the Company and The Bank of New York Trust Company, N.A.(as incoming trustee), filed as Exhibit 4-a-4 to the Company's Form 8-K dated November 9, 2006, is incorporated herein by reference.
4-a-3
Second Supplemental Indenture, dated as of April 10, 2017, between the Company, as Issuer, and The Bank of New York Mellon TrustCompany, N.A., as Trustee, filed as Exhibit 4.1 to the Company’s Form 8-K dated April 10, 2017, is incorporated herein by reference.
4-a-4
Form of certificate for the Company's 5.25% Notes due July 15, 2019, filed as Exhibit 4 to the Company's Form 8-K dated May 1, 2009, isincorporated herein by reference.
4-a-5
Form of certificate for the Company's 3.100% notes due November 15, 2021, filed as Exhibit 4 to the Company's Form 8-K datedNovember 16, 2011, is incorporated herein by reference.
4-a-6
Underwriting Agreement, dated December 11, 2013, between the Company and Citigroup Global Markets Inc., J.P. Morgan SecuritiesLLC, Merrill Lynch, Pierce, Fenner & Smith Incorporated and Wells Fargo Securities, LLC, as representatives of the several Underwritersnamed in Schedule 1 to the Underwriting Agreement, filed as Exhibit 1 to the Company's Form 8-K dated December 17, 2013, isincorporated herein by reference.
4-a-7
Form of certificate for the Company's Floating Rate Notes due 2016, filed as Exhibit 4.1 to the Company's Form 8-K dated December 17,2013, is incorporated herein by reference.
4-a-8
Form of certificate for the Company's 3.700% Notes due 2023, filed as Exhibit 4.2 to the Company's Form 8-K dated December 17, 2013,is incorporated herein by reference.
4-a-9
Form of certificate for the Company's 4.800% Notes due 2043, filed as Exhibit 4.3 to the Company's Form 8-K dated December 17, 2013,is incorporated herein by reference.
4-a-10
Underwriting Agreement, dated March 28, 2017, between the Company and J.P. Morgan Securities LLC, Citigroup Global Markets Inc.and Wells Fargo Securities, LLC, as representatives of the several Underwriters named in Schedule 1 to the Underwriting Agreement, filedas Exhibit 1 to the Company's Form 8-K dated March 28, 2017, is incorporated herein by reference.
112
4-a-11
Form of certificate for the Company’s 1.950% Notes due July 15, 2019, filed as Exhibit 4.2 to the Company’s Form 8-K dated April 10,2017, is incorporated herein by reference.
4-a-12
Form of certificate for the Company’s 2.800% Notes due March 15, 2022, filed as Exhibit 4.3 to the Company’s Form 8-K dated April 10,2017, is incorporated herein by reference.
4-a-13
Form of certificate for the Company’s 3.200% Notes due March 15, 2024, filed as Exhibit 4.4 to the Company’s Form 8-K dated April 10,2017, is incorporated herein by reference.
4-a-14
Form of certificate for the Company’s 3.500% Notes due March 15, 2027, filed as Exhibit 4.5 to the Company’s Form 8-K dated April 10,2017, is incorporated herein by reference.
4-a-15
Form of certificate for the Company’s 4.350% Notes due April 15, 2047, filed as Exhibit 4.6 to the Company’s Form 8-K dated April 10,2017, is incorporated herein by reference.
*10-a-1
The Company's 2006 Long-Term Incentives Plan, as amended, filed as Appendix A to the Company's Notice and Proxy Statement datedDecember 18, 2009, is incorporated herein by reference .
*10-a-2
The Company's First Amendment to the Amended and Restated 2006 Long-Term Incentives Plan, as amended, filed as Exhibit 10-a-1 tothe Company's Form 10-Q for the quarter ended June 30, 2012, is incorporated herein by reference.
*10-a-3
Form of Restricted Stock Unit Award under the Company's 2006 Long-Term Incentives Plan, filed as Exhibit 10.1 to the Company'sForm 8-K dated February 7, 2006, is incorporated herein by reference.
*10-a-4
Forms of Stock Option Agreements under the Company's 2006 Long-Term Incentives Plan filed as Exhibit 10-a-8 to the Company'sForm 10-K for year ended September 30, 2006, is incorporated herein by reference.
*10-a-5
The Company's 2006 Annual Incentive Compensation Plan for Senior Executives, as amended and restated, filed as Exhibit 10-a-1 to theCompany's Form 10-Q for quarter ended December 31, 2015, is incorporated herein by reference.
*10-a-6
Forms of Stock Option Agreements, adopted November 20, 2009, under the Company's 2006 Long-Term Incentives Plan, filed asExhibit 10-a-9 to the Company's Form 10-K for year ended September 30, 2009, is incorporated herein by reference.
*10-a-7
The Company’s 2015 Long-Term Incentives Plan filed as Appendix B to the Company’s Notice and Proxy Statement dated December 17,2014, is incorporated herein by reference.
*10-a-8
Form of Stock Option Agreement under the Company’s 2006 and 2015 Long-Term Incentives Plans, filed as Exhibit 10-a-1 to theCompany’s Form 10-Q for the quarter ended December 31, 2014, is incorporated herein by reference.
*10-a-9
Form of Three-Year Performance Share Agreement filed as Exhibit 10-q-1 to the Company's Form 10-Q for the quarter ended December31, 2015, is incorporated herein by reference.
*10-a-10
Form of Performance Share Agreement under the Company’s 2015 Long-Term Incentives Plan, filed as Exhibit 10-a-1 to the Company’sForm 10-Q for the quarter ended March 31, 2017, is incorporated herein by reference.
*10-a-11
Form of Restricted Stock Unit Award for Non-Employee Directors under the Company’s 2015 Long-Term Incentives Plan, filed as Exhibit10-a-13 to the Company’s Form 10-K for the year ended September 30, 2015, is incorporated herein by reference.
*10-a-12
Restricted Stock Unit Agreement for Werner Lieberherr dated November 15, 2016, filed as Exhibit 10-a-1 to the Company’s Form 10-Q forthe quarter ended July 28, 2017, is incorporated herein by reference.
*10-a-13
Restricted Stock Unit Cash Replacement Letter for Werner Lieberherr dated April 17, 2017, filed as Exhibit 10-a-2 to the Company’s Form10-Q for the quarter ended July 28, 2017, is incorporated herein by reference.
*10-b-1
The Company's Directors Stock Plan, adopted by the Company's Board of Directors on June 1, 2001 and approved by the Company'sshareowners at the 2002 Annual Meeting of Shareowners, filed as Exhibit 10.2 to the Company's Registration Statement on Form 10 (FileNo. 001-16445) (the "Form 10"), is incorporated herein by reference.
*10-b-3
Form of Restricted Stock Agreement under the Company's Directors Stock Plan, filed as Exhibit 10-b-3 to the Company's Form 10-K foryear ended September 30, 2001, is incorporated herein by reference.
*10-c-1
Compensation Recovery Policy acknowledgment and agreement filed as Exhibit 10-c-1 to the Company's Form 10-Q for the quarter endedDecember 31, 2012, is incorporated herein by reference.
*10-d-1
The Company's Incentive Compensation Plan, as amended, filed as Exhibit 10-a-1 to the Company's Form 10-Q for the quarter endedDecember 31, 2015, is incorporated herein by reference.
*10-e-1
Employment Agreement for Werner Lieberherr dated as of October 21, 2016, filed as Exhibit 10-e-1 to the Company’s Form 10-Q for thequarter ended July 28, 2017, is incorporated herein by reference.
113
*10-e-2
Death Benefit Agreement dated November 30, 2012, between B/E Aerospace, Inc. and Werner Lieberherr, filed as Exhibit 10-e-2 to theCompany’s Form 10-Q for the quarter ended July 28, 2017, is incorporated herein by reference.
*10-f-1
The Company's Deferred Compensation Plan, as amended, filed as Exhibit 10-f-2 to the Company's Form 10-K for year endedSeptember 30, 2007, is incorporated herein by reference.
*10-f-2
The Company's 2005 Deferred Compensation Plan, as amended and restated, filed as Exhibit 10-f-1 to the Company's Form 10-Q forquarter ended March 31, 2014, is incorporated herein by reference.
*10-f-3
The Company’s 2005 Deferred Compensation Plan, as amended and restated as of June 27, 2017, filed as Exhibit 10-f-1 to the Company’sForm 10-Q for quarter ended July 28, 2017, is incorporated herein by reference.
*10-g-1
The Company's Non-Qualified Savings Plan, as amended, filed as Exhibit 10-g-2 to the Company's Form 10-K for year endedSeptember 30, 2007, is incorporated herein by reference.
*10-g-2
The Company's 2005 Non-Qualified Retirement Savings Plan, as amended, filed as Exhibit 10-g-3 to the Company's Form 10-Q for quarterended December 31, 2010, is incorporated herein by reference .
*10-g-3
Amendment No. 1 to the Company's 2005 Non-Qualified Retirement Savings Plan as amended, filed as Exhibit 10-h-2 to the Company'sForm 10-Q for the quarter ended December 31, 2015, is incorporated herein by reference.
*10-h-1
The Company's 2005 Non-Qualified Pension Plan, as amended, filed as Exhibit 10-h-1 to the Company's Form 10-Q for quarter ended June30, 2012, is incorporated herein by reference.
*10-h-2
Amendment No. 1 to the Company's 2005 Non-Qualified Pension Plan, as amended, filed as Exhibit 10-h-1 to the Company's Form 10-Qfor the quarter ended December 31, 2015, incorporated herein by reference.
*10-h-3
Amendment No. 2 to the Company’s 2005 Non-Qualified Pension Plan, as amended, filed as Exhibit 10-h-1 to the Company’s Form 10-Qfor the quarter ended March 31, 2017, is incorporated herein by reference.
*10-h-4
The Company's Non-Qualified Pension Plan, as amended, filed as Exhibit 10-h-3 to the Company's Form 10-K for the year endedSeptember 30, 2008, is incorporated herein by reference.
*10-i-1
The Company's Master Trust, as amended, filed as Exhibit 10-i-2 to the Company's Form 10-K for year ended September 30, 2007, isincorporated herein by reference.
10-k-1
Distribution Agreement dated as of June 29, 2001 by and among Rockwell International Corporation, the Company and Rockwell ScientificCompany LLC, filed as Exhibit 2.1 to the Company's Form 8-K dated July 11, 2001, is incorporated herein by reference.
10-l-1
Employee Matters Agreement dated as of June 29, 2001 by and among Rockwell International Corporation, the Company and RockwellScientific Company LLC, filed as Exhibit 2.2 to the Company's Form 8-K dated July 11, 2001, is incorporated herein by reference.
10-m-1
Tax Allocation Agreement dated as of June 29, 2001 by and between Rockwell International Corporation and the Company, filed asExhibit 2.3 to the Company's Form 8-K dated July 11, 2001, is incorporated herein by reference.
*10-n-1
Form of Change of Control Agreement between the Company and certain executives of the Company (Three-Year Agreement), asamended, filed as Exhibit 10-n-1 to the Company's Form 8-K dated April 21, 2009, is incorporated herein by reference.
*10-n-2 Schedule identifying executives of the Company who are party to a Change of Control Agreement.
10-o-1
Bridge Credit Agreement dated as of December 16, 2016, among us, the lenders listed therein and JPMorgan Chase Bank, N.A., asadministrative agent, filed as Exhibit 10.1 to the Company’s Form 8-K dated December 16, 2016, is incorporated herein by reference.
10-o-2
Term Loan Credit Agreement dated as of December 16, 2016, among us, the lenders listed therein and JPMorgan Chase Bank, N.A., asadministrative agent, filed as Exhibit 10.2 to the Company’s Form 8-K dated December 16, 2016, is incorporated herein by reference.
10-o-3
Five-Year Credit Agreement dated as of December 16, 2016, among us, the lenders listed therein and JPMorgan Chase Bank, N.A., asadministrative agent, filed as Exhibit 10.3 to the Company’s Form 8-K dated December 16, 2016, is incorporated herein by reference.
*10-s-1
Non-Employee Director Compensation Summary, filed as Exhibit 10-s-1 to the Company’s Form 10-K for the year ended September 30,2016, is incorporated herein by reference.
*10-s-2
Non-Employee Director Deferral Election Forms, filed as Exhibit 10-s-2 to the Company’s Form 10-K for the year ended September 30,2016, is incorporated herein by reference.
10-t-1
Agreement and Plan of Merger, dated as of October 23, 2016, by and among Rockwell Collins, Inc., Quarterback Merger Sub Corp., andB/E Aerospace, Inc., filed as Exhibit 2.1 to the Company’s Form 8-K dated October 23, 2016, is incorporated herein by reference.
114
10-t-2
Agreement and Plan of Merger, dated as of September 4, 2017, by and among United Technologies Corporation, Riveter Merger Sub Corp.and Rockwell Collins, Inc., filed as Exhibit 2.1 to the Company’s Form 8-K dated September 6, 2017, is incorporated herein by reference.
12 Statement re: Computation of Ratio of Earnings to Fixed Charges. 21 List of subsidiaries of the Company. 23 Consent of Independent Registered Public Accounting Firm.
24
Powers of Attorney authorizing certain persons to sign this Annual Report on Form 10-K on behalf of certain directors and officers of theCompany.
31.1 Section 302 Certification of Chief Executive Officer. 31.2 Section 302 Certification of Chief Financial Officer. 32.1 Section 906 Certification of Chief Executive Officer. 32.2 Section 906 Certification of Chief Financial Officer. 101.INS XBRL Instance Document. 101.SCH XBRL Taxonomy Extension Schema. 101.CAL XBRL Taxonomy Extension Calculation Linkbase. 101.DEF XBRL Taxonomy Extension Definition Linkbase. 101.LAB XBRL Taxonomy Extension Label Linkbase. 101.PRE XBRL Taxonomy Extension Presentation Linkbase.
* Management contract or compensatory plan or arrangement.
115
SIGNATURES
Pursuant to the requirements of Section 13 or 15(d) of the Securities Exchange Act of 1934, the registrant has duly caused this report to be signed on its behalf bythe undersigned, thereunto duly authorized.
ROCKWELL COLLINS, INC. By /s/ ROBERT J. PERNA
Robert J. PernaSenior Vice President, General Counsel and Secretary
Dated: November 14, 2017
Pursuant to the requirements of the Securities Exchange Act of 1934, this report has been signed below on the 14th day of November 2017 by the followingpersons on behalf of the registrant and in the capacities indicated.
/s/ ROBERT K. ORTBERG Chairman, President and Chief Executive Officer (principal executiveofficer)Robert K. Ortberg
ANTHONY J. CARBONE* DirectorCHRIS A. DAVIS* DirectorRALPH E. EBERHART* DirectorJOHN A. EDWARDSON* DirectorRICHARD G. HAMERMESH* DirectorDAVID LILLEY* DirectorANDREW J. POLICANO* DirectorCHERYL L. SHAVERS* DirectorJEFFREY L. TURNER* DirectorJOHN T. WHATES* Director
/s/ PATRICK E. ALLEN Senior Vice President and Chief Financial Officer(principal financial officer)Patrick E. Allen
/s/ TATUM J. BUSE Vice President, Finance and Corporate Controller(principal accounting officer)Tatum J. Buse
*By /s/ ROBERT J. PERNA Robert J. Perna, Attorney-in-fact**
** By authority of the powers of attorney filed herewith.
S-1
Exhibit 10-n-2
Schedule of Executives of the Company who are a party to the Change of Control Agreement:
Three-Year Agreement
1. Patrick E. Allen2. Bruce M. King3. Nan Mattai4. Robert K. Ortberg5. Kent L. Statler6. Robert A. Sturgell
Two-Year Agreement
1. Tatum J. Buse2. Philip J. Jasper3. Werner Lieberherr4. Jeffrey D. MacLauchlan5. Colin R. Mahoney6. David Nieuwsma7. Robert J. Perna8. Jeffrey A. Standerski9. Douglas E. Stenske
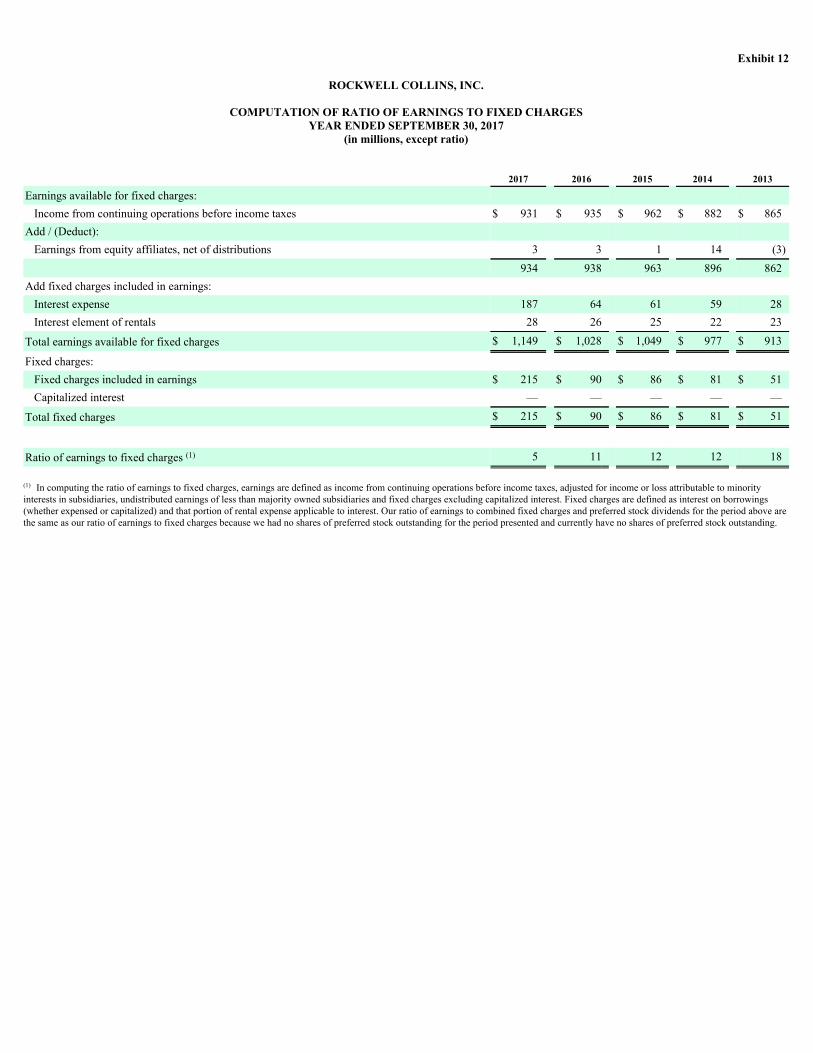
Exhibit 12
ROCKWELL COLLINS, INC.
COMPUTATION OF RATIO OF EARNINGS TO FIXED CHARGESYEAR ENDED SEPTEMBER 30, 2017
(in millions, except ratio)
2017 2016 2015 2014 2013
Earnings available for fixed charges: Income from continuing operations before income taxes $ 931 $ 935 $ 962 $ 882 $ 865
Add / (Deduct): Earnings from equity affiliates, net of distributions 3 3 1 14 (3)
934 938 963 896 862Add fixed charges included in earnings:
Interest expense 187 64 61 59 28Interest element of rentals 28 26 25 22 23
Total earnings available for fixed charges $ 1,149 $ 1,028 $ 1,049 $ 977 $ 913
Fixed charges: Fixed charges included in earnings $ 215 $ 90 $ 86 $ 81 $ 51Capitalized interest — — — — —
Total fixed charges $ 215 $ 90 $ 86 $ 81 $ 51
Ratio of earnings to fixed charges (1) 5 11 12 12 18
(1) In computing the ratio of earnings to fixed charges, earnings are defined as income from continuing operations before income taxes, adjusted for income or loss attributable to minorityinterests in subsidiaries, undistributed earnings of less than majority owned subsidiaries and fixed charges excluding capitalized interest. Fixed charges are defined as interest on borrowings(whether expensed or capitalized) and that portion of rental expense applicable to interest. Our ratio of earnings to combined fixed charges and preferred stock dividends for the period above arethe same as our ratio of earnings to fixed charges because we had no shares of preferred stock outstanding for the period presented and currently have no shares of preferred stock outstanding.
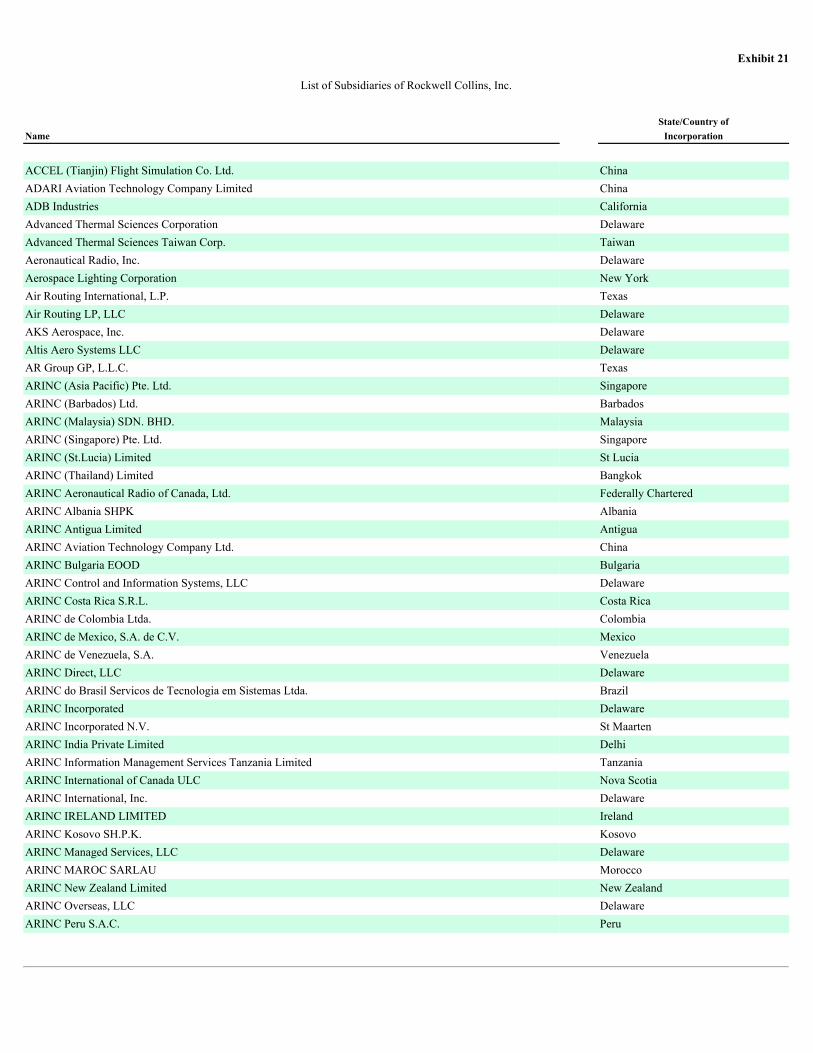
Exhibit 21
List of Subsidiaries of Rockwell Collins, Inc.
State/Country ofName
Incorporation
ACCEL (Tianjin) Flight Simulation Co. Ltd. ChinaADARI Aviation Technology Company Limited ChinaADB Industries CaliforniaAdvanced Thermal Sciences Corporation DelawareAdvanced Thermal Sciences Taiwan Corp. TaiwanAeronautical Radio, Inc. DelawareAerospace Lighting Corporation New YorkAir Routing International, L.P. TexasAir Routing LP, LLC DelawareAKS Aerospace, Inc. DelawareAltis Aero Systems LLC DelawareAR Group GP, L.L.C. TexasARINC (Asia Pacific) Pte. Ltd. SingaporeARINC (Barbados) Ltd. BarbadosARINC (Malaysia) SDN. BHD. MalaysiaARINC (Singapore) Pte. Ltd. SingaporeARINC (St.Lucia) Limited St LuciaARINC (Thailand) Limited BangkokARINC Aeronautical Radio of Canada, Ltd. Federally CharteredARINC Albania SHPK AlbaniaARINC Antigua Limited AntiguaARINC Aviation Technology Company Ltd. ChinaARINC Bulgaria EOOD BulgariaARINC Control and Information Systems, LLC DelawareARINC Costa Rica S.R.L. Costa RicaARINC de Colombia Ltda. ColombiaARINC de Mexico, S.A. de C.V. MexicoARINC de Venezuela, S.A. VenezuelaARINC Direct, LLC DelawareARINC do Brasil Servicos de Tecnologia em Sistemas Ltda. BrazilARINC Incorporated DelawareARINC Incorporated N.V. St MaartenARINC India Private Limited DelhiARINC Information Management Services Tanzania Limited TanzaniaARINC International of Canada ULC Nova ScotiaARINC International, Inc. DelawareARINC IRELAND LIMITED IrelandARINC Kosovo SH.P.K. KosovoARINC Managed Services, LLC DelawareARINC MAROC SARLAU MoroccoARINC New Zealand Limited New ZealandARINC Overseas, LLC DelawareARINC Peru S.A.C. Peru
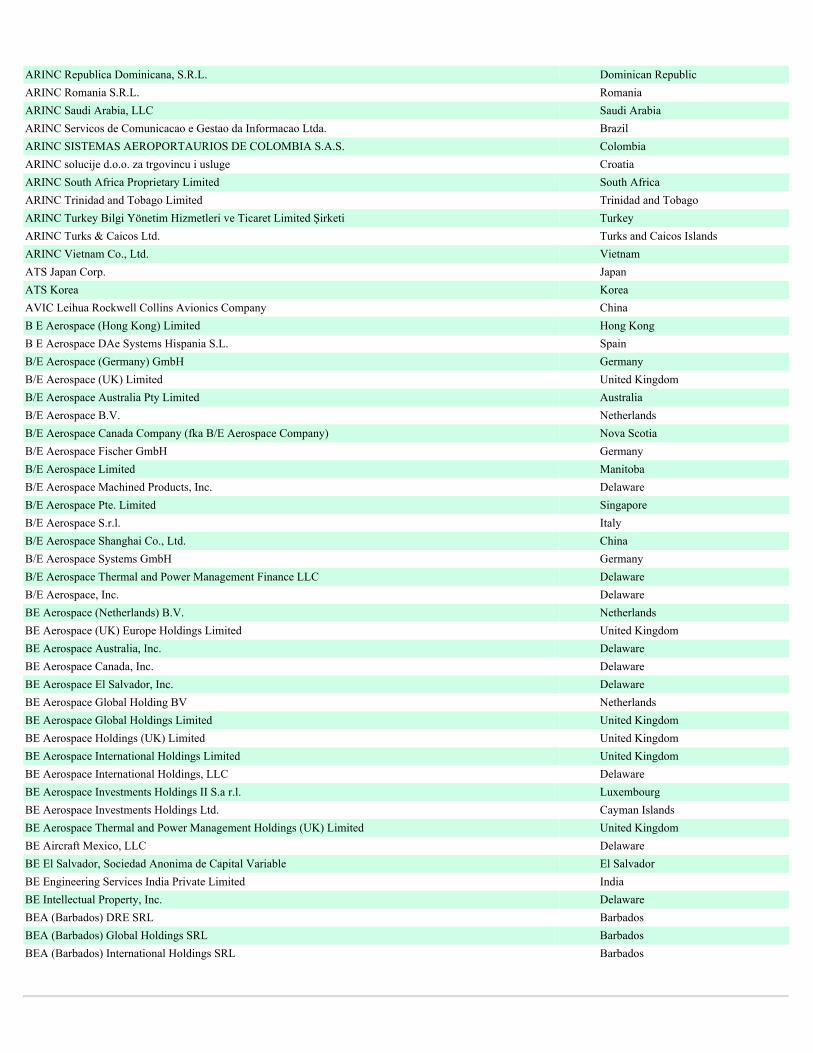
ARINC Republica Dominicana, S.R.L. Dominican RepublicARINC Romania S.R.L. RomaniaARINC Saudi Arabia, LLC Saudi ArabiaARINC Servicos de Comunicacao e Gestao da Informacao Ltda. BrazilARINC SISTEMAS AEROPORTAURIOS DE COLOMBIA S.A.S. ColombiaARINC solucije d.o.o. za trgovincu i usluge CroatiaARINC South Africa Proprietary Limited South AfricaARINC Trinidad and Tobago Limited Trinidad and TobagoARINC Turkey Bilgi Yönetim Hizmetleri ve Ticaret Limited Şirketi TurkeyARINC Turks & Caicos Ltd. Turks and Caicos IslandsARINC Vietnam Co., Ltd. VietnamATS Japan Corp. JapanATS Korea KoreaAVIC Leihua Rockwell Collins Avionics Company ChinaB E Aerospace (Hong Kong) Limited Hong KongB E Aerospace DAe Systems Hispania S.L. SpainB/E Aerospace (Germany) GmbH GermanyB/E Aerospace (UK) Limited United KingdomB/E Aerospace Australia Pty Limited AustraliaB/E Aerospace B.V. NetherlandsB/E Aerospace Canada Company (fka B/E Aerospace Company) Nova ScotiaB/E Aerospace Fischer GmbH GermanyB/E Aerospace Limited ManitobaB/E Aerospace Machined Products, Inc. DelawareB/E Aerospace Pte. Limited SingaporeB/E Aerospace S.r.l. ItalyB/E Aerospace Shanghai Co., Ltd. ChinaB/E Aerospace Systems GmbH GermanyB/E Aerospace Thermal and Power Management Finance LLC DelawareB/E Aerospace, Inc. DelawareBE Aerospace (Netherlands) B.V. NetherlandsBE Aerospace (UK) Europe Holdings Limited United KingdomBE Aerospace Australia, Inc. DelawareBE Aerospace Canada, Inc. DelawareBE Aerospace El Salvador, Inc. DelawareBE Aerospace Global Holding BV NetherlandsBE Aerospace Global Holdings Limited United KingdomBE Aerospace Holdings (UK) Limited United KingdomBE Aerospace International Holdings Limited United KingdomBE Aerospace International Holdings, LLC DelawareBE Aerospace Investments Holdings II S.a r.l. LuxembourgBE Aerospace Investments Holdings Ltd. Cayman IslandsBE Aerospace Thermal and Power Management Holdings (UK) Limited United KingdomBE Aircraft Mexico, LLC DelawareBE El Salvador, Sociedad Anonima de Capital Variable El SalvadorBE Engineering Services India Private Limited IndiaBE Intellectual Property, Inc. DelawareBEA (Barbados) DRE SRL BarbadosBEA (Barbados) Global Holdings SRL BarbadosBEA (Barbados) International Holdings SRL Barbados
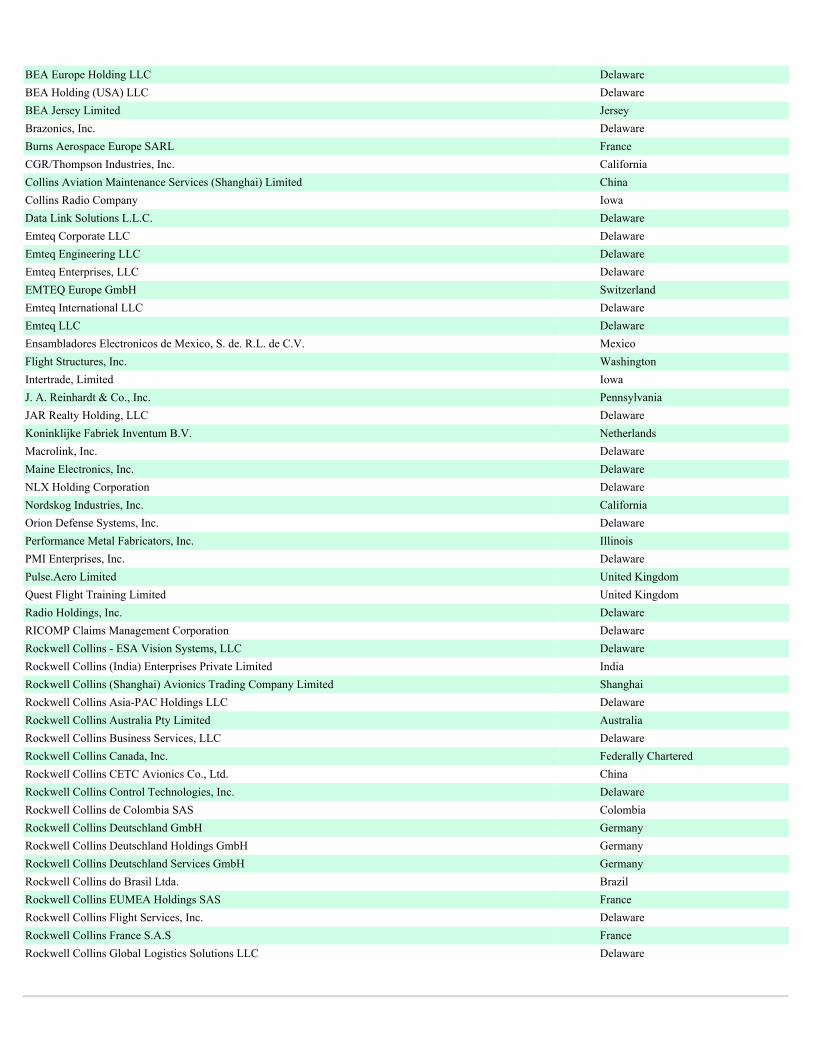
BEA Europe Holding LLC DelawareBEA Holding (USA) LLC DelawareBEA Jersey Limited JerseyBrazonics, Inc. DelawareBurns Aerospace Europe SARL FranceCGR/Thompson Industries, Inc. CaliforniaCollins Aviation Maintenance Services (Shanghai) Limited ChinaCollins Radio Company IowaData Link Solutions L.L.C. DelawareEmteq Corporate LLC DelawareEmteq Engineering LLC DelawareEmteq Enterprises, LLC DelawareEMTEQ Europe GmbH SwitzerlandEmteq International LLC DelawareEmteq LLC DelawareEnsambladores Electronicos de Mexico, S. de. R.L. de C.V. MexicoFlight Structures, Inc. WashingtonIntertrade, Limited IowaJ. A. Reinhardt & Co., Inc. PennsylvaniaJAR Realty Holding, LLC DelawareKoninklijke Fabriek Inventum B.V. NetherlandsMacrolink, Inc. DelawareMaine Electronics, Inc. DelawareNLX Holding Corporation DelawareNordskog Industries, Inc. CaliforniaOrion Defense Systems, Inc. DelawarePerformance Metal Fabricators, Inc. IllinoisPMI Enterprises, Inc. DelawarePulse.Aero Limited United KingdomQuest Flight Training Limited United KingdomRadio Holdings, Inc. DelawareRICOMP Claims Management Corporation DelawareRockwell Collins - ESA Vision Systems, LLC DelawareRockwell Collins (India) Enterprises Private Limited IndiaRockwell Collins (Shanghai) Avionics Trading Company Limited ShanghaiRockwell Collins Asia-PAC Holdings LLC DelawareRockwell Collins Australia Pty Limited AustraliaRockwell Collins Business Services, LLC DelawareRockwell Collins Canada, Inc. Federally CharteredRockwell Collins CETC Avionics Co., Ltd. ChinaRockwell Collins Control Technologies, Inc. DelawareRockwell Collins de Colombia SAS ColombiaRockwell Collins Deutschland GmbH GermanyRockwell Collins Deutschland Holdings GmbH GermanyRockwell Collins Deutschland Services GmbH GermanyRockwell Collins do Brasil Ltda. BrazilRockwell Collins EUMEA Holdings SAS FranceRockwell Collins Flight Services, Inc. DelawareRockwell Collins France S.A.S FranceRockwell Collins Global Logistics Solutions LLC Delaware
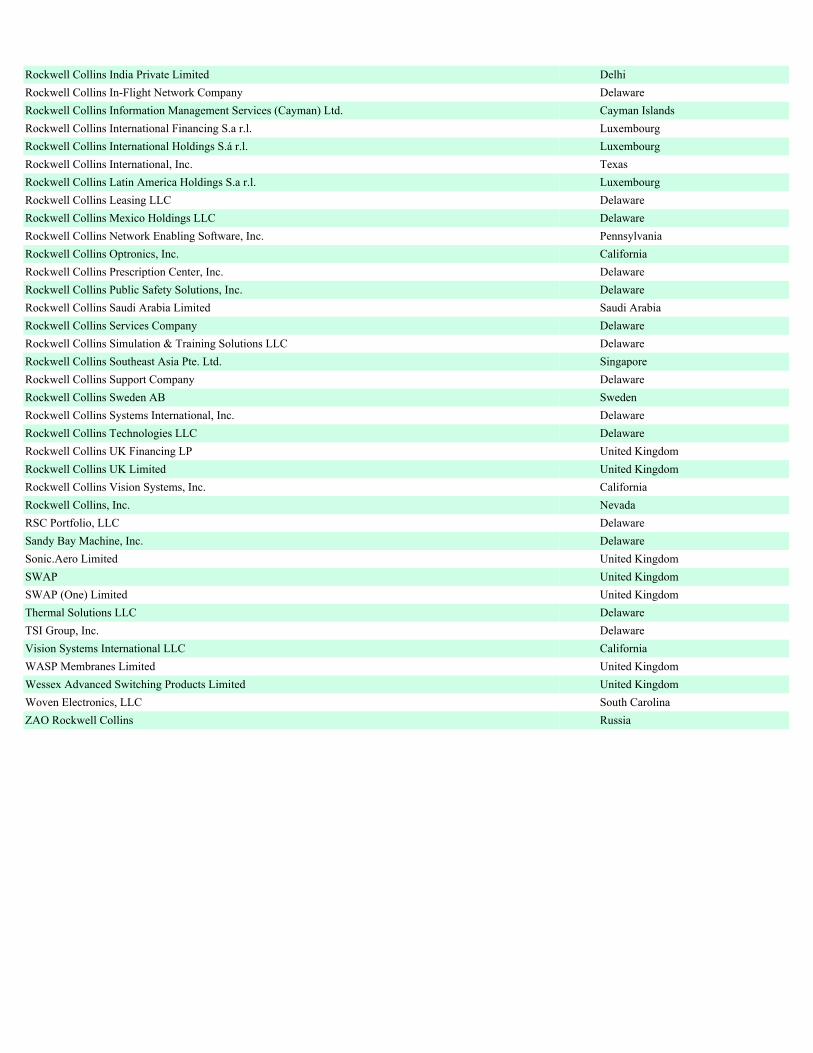
Rockwell Collins India Private Limited DelhiRockwell Collins In-Flight Network Company DelawareRockwell Collins Information Management Services (Cayman) Ltd. Cayman IslandsRockwell Collins International Financing S.a r.l. LuxembourgRockwell Collins International Holdings S.á r.l. LuxembourgRockwell Collins International, Inc. TexasRockwell Collins Latin America Holdings S.a r.l. LuxembourgRockwell Collins Leasing LLC DelawareRockwell Collins Mexico Holdings LLC DelawareRockwell Collins Network Enabling Software, Inc. PennsylvaniaRockwell Collins Optronics, Inc. CaliforniaRockwell Collins Prescription Center, Inc. DelawareRockwell Collins Public Safety Solutions, Inc. DelawareRockwell Collins Saudi Arabia Limited Saudi ArabiaRockwell Collins Services Company DelawareRockwell Collins Simulation & Training Solutions LLC DelawareRockwell Collins Southeast Asia Pte. Ltd. SingaporeRockwell Collins Support Company DelawareRockwell Collins Sweden AB SwedenRockwell Collins Systems International, Inc. DelawareRockwell Collins Technologies LLC DelawareRockwell Collins UK Financing LP United KingdomRockwell Collins UK Limited United KingdomRockwell Collins Vision Systems, Inc. CaliforniaRockwell Collins, Inc. NevadaRSC Portfolio, LLC DelawareSandy Bay Machine, Inc. DelawareSonic.Aero Limited United KingdomSWAP United KingdomSWAP (One) Limited United KingdomThermal Solutions LLC DelawareTSI Group, Inc. DelawareVision Systems International LLC CaliforniaWASP Membranes Limited United KingdomWessex Advanced Switching Products Limited United KingdomWoven Electronics, LLC South CarolinaZAO Rockwell Collins Russia

Exhibit 23
CONSENT OF INDEPENDENT REGISTERED PUBLIC ACCOUNTING FIRM
CONSENT OF INDEPENDENT REGISTERED PUBLIC ACCOUNTING FIRM
We consent to the incorporation by reference in Registration Statement Nos. 333-63100, 333-63120, 333-102047, 333-132764, 333-160384, 333-165235, 333-186532 and 333-201892 on Form S-8 and Nos. 333-63142, 333-192761 and 333-216736 on Form S-3 of our reports dated November 14, 2017, relating to theconsolidated financial statements of Rockwell Collins, Inc. and subsidiaries (the "Company”), and the effectiveness of the Company’s internal control overfinancial reporting, appearing in this Annual Report on Form 10-K of the Company for the year ended September 29, 2017.
/s/ DELOITTE & TOUCHE LLP
Chicago, IllinoisNovember 14, 2017
Exhibit 24
POWER OF ATTORNEY
I, the undersigned Director of Rockwell Collins, Inc., a Delaware corporation (the "Company"), hereby constitute ROBERT J.PERNA , PATRICK E. ALLEN and TATUM J. BUSE, and each of them singly, my true and lawful attorneys with full power to them andeach of them to sign for me, and in my name and in the capacity or capacities indicated below, the Company's Annual Report on Form 10-Kfor the fiscal year ended September 30, 2017, and any amendments thereto.
Signature
Title
Date
/s/ Robert K. Ortberg
Chairman, President and ChiefExecutive Officer
November 14, 2017Robert K. Ortberg
/s/ Anthony J. Carbone Director November 14, 2017Anthony J. Carbone
/s/ Chris A Davis
Director
November 14, 2017Chris A. Davis
/s/ Ralph E. Eberhart
Director
November 14, 2017Ralph E. Eberhart
/s/ John A. Edwardson Director November 14, 2017John A. Edwardson
/s/ Richard G. Hamermesh Director November 14, 2017Richard G. Hamermesh
/s/ David Lilley
Director
November 14, 2017David Lilley
/s/ Andrew J. Policano
Director
November 14, 2017Andrew J. Policano
/s/ Cheryl L. Shavers
Director
November 14, 2017Cheryl L. Shavers
/s/ Jeffrey L. Turner
Director November 14, 2017Jeffrey L. Turner
/s/ John T. Whates
Director November 14, 2017John T. Whates
Exhibit 31.1
CERTIFICATION I, Robert K. Ortberg, Chairman, President and Chief Executive Officer of Rockwell Collins, Inc., certify that: 1. I have reviewed the annual report on Form 10-K for the fiscal year ended September 30, 2017 of Rockwell Collins, Inc.;
2. Based on my knowledge, this report does not contain any untrue statement of a material fact or omit to state a material fact necessary to make thestatements made, in light of the circumstances under which such statements were made, not misleading with respect to the period covered by this report;
3. Based on my knowledge, the financial statements, and other financial information included in this report, fairly present in all material respects thefinancial condition, results of operations and cash flows of the registrant as of, and for, the periods presented in this report;
4. The registrant's other certifying officer and I are responsible for establishing and maintaining disclosure controls and procedures (as defined in ExchangeAct Rules 13a-15(e) and 15d-15(e)) and internal control over financial reporting (as defined in Exchange Act Rules 13a-15(f) and 15d-15(f)) for theregistrant and have:
a) Designed such disclosure controls and procedures, or caused such disclosure controls and procedures to be designed under our supervision, toensure that material information relating to the registrant, including its consolidated subsidiaries, is made known to us by others within thoseentities, particularly during the period in which this report is being prepared;
b) Designed such internal control over financial reporting, or caused such internal control over financial reporting to be designed under oursupervision, to provide reasonable assurance regarding the reliability of financial reporting and the preparation of financial statements forexternal purposes in accordance with generally accepted accounting principles;
c) Evaluated the effectiveness of the registrant's disclosure controls and procedures and presented in this report our conclusions about theeffectiveness of the disclosure controls and procedures, as of the end of the period covered by this report based on such evaluation; and
d) Disclosed in this report any change in the registrant’s internal control over financial reporting that occurred during the registrant’s most recentfiscal quarter (the registrant’s fourth fiscal quarter in the case of an annual report) that has materially affected, or is reasonably likely tomaterially affect, the registrant’s internal control over financial reporting;
5. The registrant's other certifying officer and I have disclosed, based on our most recent evaluation of internal control over financial reporting, to theregistrant's auditors and the audit committee of the registrant's board of directors (or persons performing the equivalent functions):
a) All significant deficiencies and material weaknesses in the design or operation of internal control over financial reporting which are reasonablylikely to adversely affect the registrant's ability to record, process, summarize and report financial information; and
b) Any fraud, whether or not material, that involves management or other employees who have a significant role in the registrant's internal controlover financial reporting.
Date: November 14, 2017 /s/ Robert K. Ortberg Robert K. Ortberg Chairman, President and Chief Executive Officer
Exhibit 31.2
CERTIFICATION I, Patrick E. Allen, Senior Vice President and Chief Financial Officer of Rockwell Collins, Inc., certify that:
1. I have reviewed the annual report on Form 10-K for the fiscal year ended September 30, 2017 of Rockwell Collins, Inc.;
2. Based on my knowledge, this report does not contain any untrue statement of a material fact or omit to state a material fact necessary to make thestatements made, in light of the circumstances under which such statements were made, not misleading with respect to the period covered by this report;
3. Based on my knowledge, the financial statements, and other financial information included in this report, fairly present in all material respects thefinancial condition, results of operations and cash flows of the registrant as of, and for, the periods presented in this report;
4. The registrant's other certifying officer and I are responsible for establishing and maintaining disclosure controls and procedures (as defined in ExchangeAct Rules 13a-15(e) and 15d-15(e)) and internal control over financial reporting (as defined in Exchange Act Rules 13a-15(f) and 15d-15(f)) for theregistrant and have:
a) Designed such disclosure controls and procedures, or caused such disclosure controls and procedures to be designed under our supervision, toensure that material information relating to the registrant, including its consolidated subsidiaries, is made known to us by others within thoseentities, particularly during the period in which this report is being prepared;
b) Designed such internal control over financial reporting, or caused such internal control over financial reporting to be designed under oursupervision, to provide reasonable assurance regarding the reliability of financial reporting and the preparation of financial statements forexternal purposes in accordance with generally accepted accounting principles;
c) Evaluated the effectiveness of the registrant's disclosure controls and procedures and presented in this report our conclusions about theeffectiveness of the disclosure controls and procedures, as of the end of the period covered by this report based on such evaluation; and
d) Disclosed in this report any change in the registrant’s internal control over financial reporting that occurred during the registrant’s most recentfiscal quarter (the registrant’s fourth fiscal quarter in the case of an annual report) that has materially affected, or is reasonably likely tomaterially affect, the registrant’s internal control over financial reporting;
5. The registrant's other certifying officer and I have disclosed, based on our most recent evaluation of internal control over financial reporting, to theregistrant's auditors and the audit committee of the registrant's board of directors (or persons performing the equivalent functions):
a) All significant deficiencies and material weaknesses in the design or operation of internal control over financial reporting which are reasonablylikely to adversely affect the registrant's ability to record, process, summarize and report financial information; and
b) Any fraud, whether or not material, that involves management or other employees who have a significant role in the registrant's internal controlover financial reporting.
Date: November 14, 2017 /s/ Patrick E. Allen Patrick E. Allen Senior Vice President and Chief Financial Officer
Exhibit 32.1
CERTIFICATION BY CHIEF EXECUTIVE OFFICERPURSUANT TO 18 U.S.C. SECTION 1350,
AS ADOPTED PURSUANT TOSECTION 906 OF THE SARBANES-OXLEY ACT OF 2002
In connection with the Annual Report of Rockwell Collins, Inc. (the Company) on Form 10-K for the fiscal year ended September 30, 2017 (the Report)filed with the Securities and Exchange Commission, I, Robert K. Ortberg, Chairman, President and Chief Executive Officer of the Company, certify, pursuant to 18U.S.C. Section 1350, as adopted pursuant to Section 906 of the Sarbanes-Oxley Act of 2002, that:
(1) The Company’s Report fully complies with the requirements of section 13(a) or 15(d) of the Securities Exchange Act of 1934; and
(2) The information contained in the Report fairly presents, in all material respects, the financial condition and results of operations of the Company.
Date: November 14, 2017 /s/ Robert K. Ortberg Robert K. Ortberg Chairman, President and Chief Executive Officer
Exhibit 32.2
CERTIFICATION BY CHIEF FINANCIAL OFFICERPURSUANT TO 18 U.S.C. SECTION 1350,
AS ADOPTED PURSUANT TOSECTION 906 OF THE SARBANES-OXLEY ACT OF 2002
In connection with the Annual Report of Rockwell Collins, Inc. (the Company) on Form 10-K for the fiscal year ended September 30, 2017 (the Report)filed with the Securities and Exchange Commission, I, Patrick E. Allen, Senior Vice President and Chief Financial Officer of the Company, certify, pursuant to 18U.S.C. Section 1350, as adopted pursuant to Section 906 of the Sarbanes-Oxley Act of 2002, that:
(1) The Company’s Report fully complies with the requirements of section 13(a) or 15(d) of the Securities Exchange Act of 1934; and
(2) The information contained in the Report fairly presents, in all material respects, the financial condition and results of operations of the Company.
Date: November 14, 2017 /s/ Patrick E. Allen Patrick E. Allen Senior Vice President and Chief Financial Officer