Embed Size (px)
Citation preview
United Nations Sub-Regional Workshop on Census Data EvaluationPhnom Penh, Cambodia, 14-17 November 2011
Evaluation of Fertility Data Collected from Population Censuses
United Nations Statistics Division
United Nations Sub-Regional Workshop on Census Data EvaluationPhnom Penh, Cambodia, 14-17 November 2011
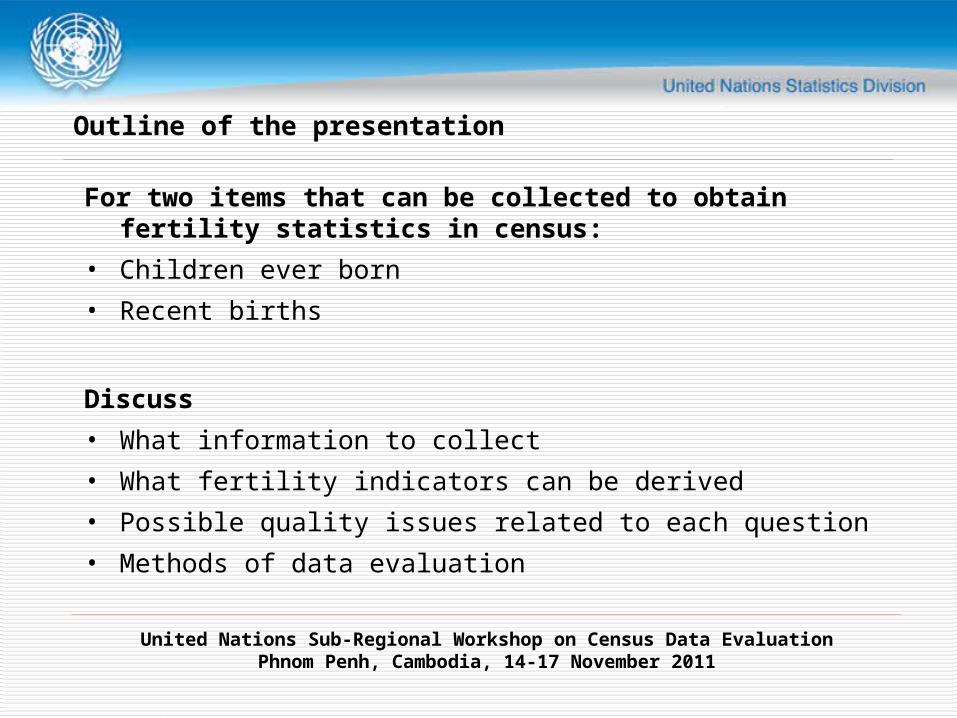
For two items that can be collected to obtain fertility statistics in census:
• Children ever born
• Recent births
Discuss
• What information to collect
• What fertility indicators can be derived
• Possible quality issues related to each question
• Methods of data evaluation
Outline of the presentation
United Nations Sub-Regional Workshop on Census Data EvaluationPhnom Penh, Cambodia, 14-17 November 2011
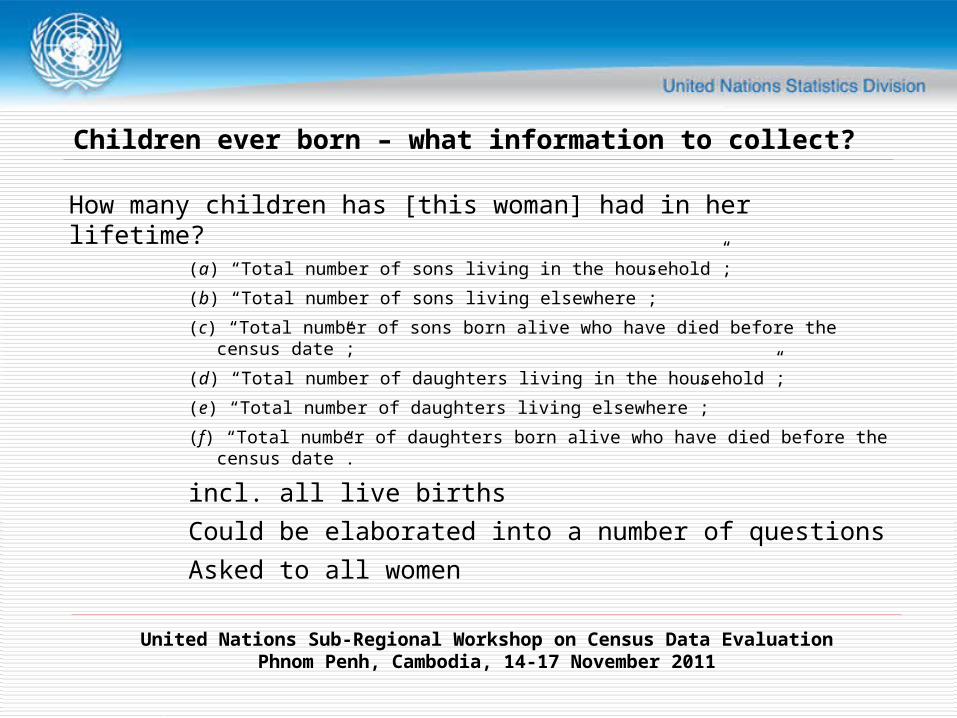
Children ever born – what information to collect?
How many children has [this woman] had in her lifetime? (a) “Total number of sons living in the household”;
(b) “Total number of sons living elsewhere”;
(c) “Total number of sons born alive who have died before the census date”;
(d) “Total number of daughters living in the household”;
(e) “Total number of daughters living elsewhere”;
(f) “Total number of daughters born alive who have died before the census date”.
incl. all live births
Could be elaborated into a number of questions
Asked to all women

United Nations Sub-Regional Workshop on Census Data EvaluationPhnom Penh, Cambodia, 14-17 November 2011
When is it used?
• Widely used for over 50 years
• Important for countries without complete birth registration
• Also important for countries with complete birth registration
Study fertility by detailed socio-economic characteristics
Children ever born – the use of
What can we get?
Parity distributions Average number of children ever born
Age-specific fertility rate Total fertility rate (TFR)
United Nations Sub-Regional Workshop on Census Data EvaluationPhnom Penh, Cambodia, 14-17 November 2011
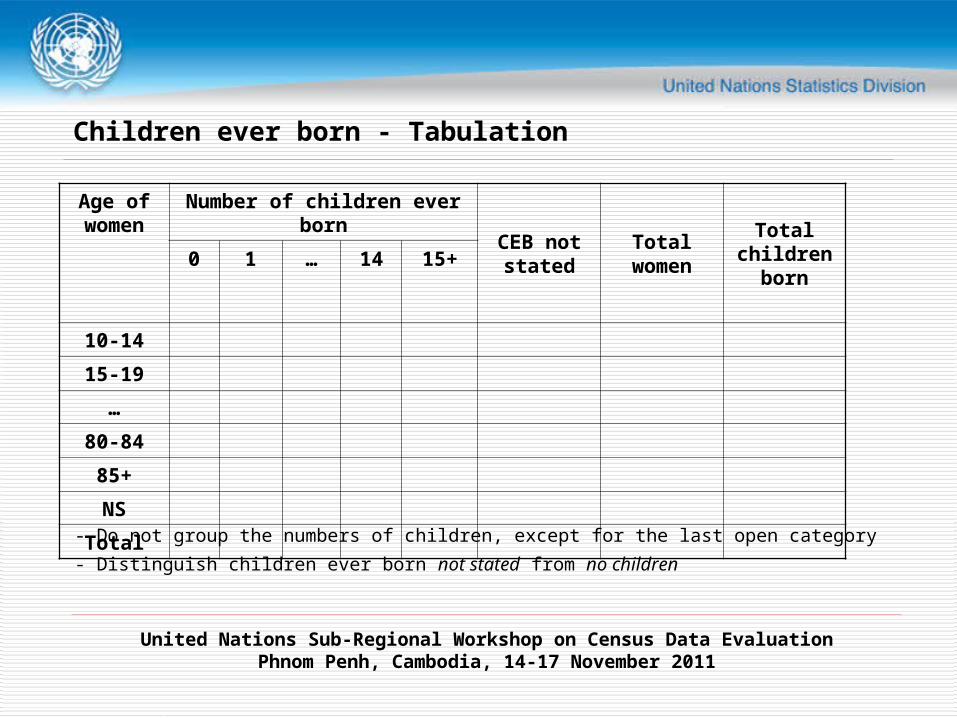
Children ever born - Tabulation
Age of women
Number of children ever born
CEB not stated
Total women
Total children
born
0 1 … 14 15+
10-14
15-19
…
80-84
85+
NS
Total- Do not group the numbers of children, except for the last open category
- Distinguish children ever born not stated from no children
United Nations Sub-Regional Workshop on Census Data EvaluationPhnom Penh, Cambodia, 14-17 November 2011
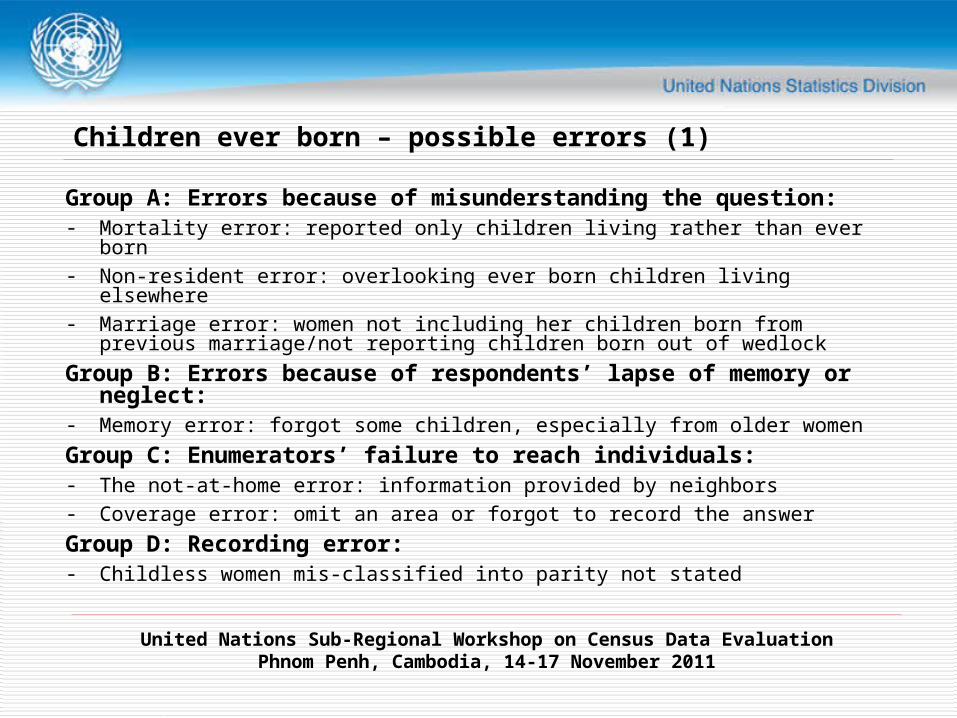
Children ever born – possible errors (1)
Group A: Errors because of misunderstanding the question:- Mortality error: reported only children living rather than ever born- Non-resident error: overlooking ever born children living elsewhere- Marriage error: women not including her children born from previous marriage/not
reporting children born out of wedlock
Group B: Errors because of respondents’ lapse of memory or neglect:- Memory error: forgot some children, especially from older women
Group C: Enumerators’ failure to reach individuals:- The not-at-home error: information provided by neighbors- Coverage error: omit an area or forgot to record the answer
Group D: Recording error:- Childless women mis-classified into parity not stated
United Nations Sub-Regional Workshop on Census Data EvaluationPhnom Penh, Cambodia, 14-17 November 2011
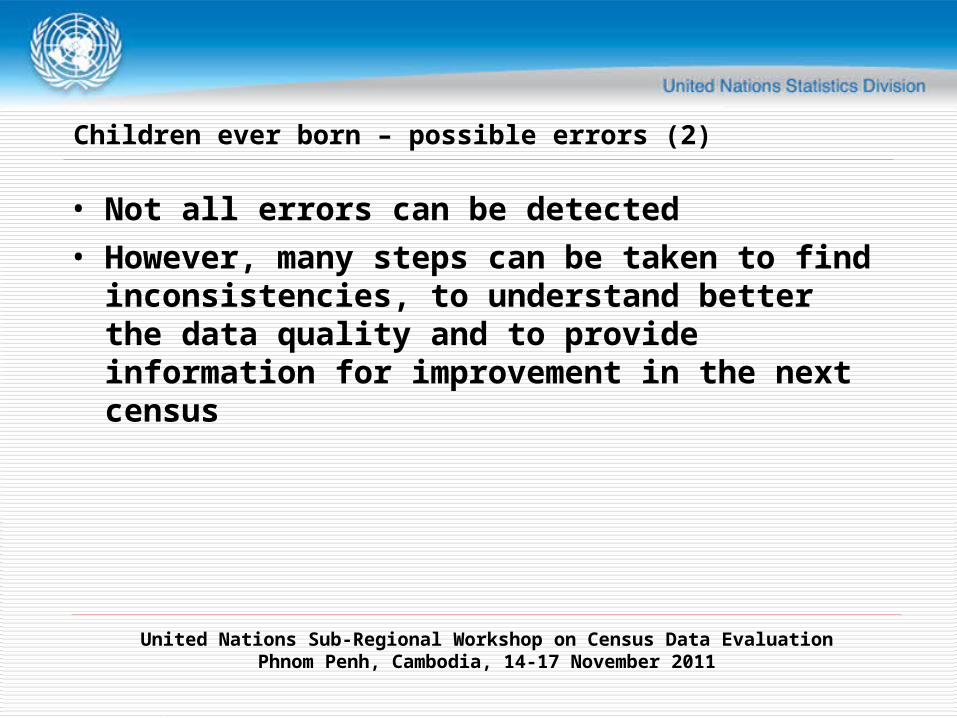
• Not all errors can be detected
• However, many steps can be taken to find inconsistencies, to understand better the data quality and to provide information for improvement in the next census
Children ever born – possible errors (2)
United Nations Sub-Regional Workshop on Census Data EvaluationPhnom Penh, Cambodia, 14-17 November 2011
Children ever born – quality assessment Methods (1)
- Initial assessment:
- Any missing values in children ever born data?
- Missing value for any relevant variables? (age of mother, sex of child, survival status of the child)
- Comparing children ever born and children surviving data

United Nations Sub-Regional Workshop on Census Data EvaluationPhnom Penh, Cambodia, 14-17 November 2011
Children ever born – quality assessment Methods (2)
- For tabulated data:- Sex ratio of children ever born consistent with national average of sex
ratio at birth?- Check whether women with parity “not stated” are childless instead
(El-Badry method)- Plausibility of data – graphics help and best with other sources
- Average children ever born should increase with age (Group B error) – with constant or declining fertility assumption
- Proportion of women by parity, for older age groups- Time plot of mean number of children ever born, based on
multiple data sources (cohort analysis)- Age-specific fertility rates- TFR
United Nations Sub-Regional Workshop on Census Data EvaluationPhnom Penh, Cambodia, 14-17 November 2011
P/F ratio method• Usually used to adjust current fertility data derived from recent births
question
• May also be used to assess the quality of both current (derived from recent births) and life time fertility data (derived from children ever born)
• Certain assumptions (discuss in more details later)
Children ever born – quality assessment Methods (3)
United Nations Sub-Regional Workshop on Census Data EvaluationPhnom Penh, Cambodia, 14-17 November 2011
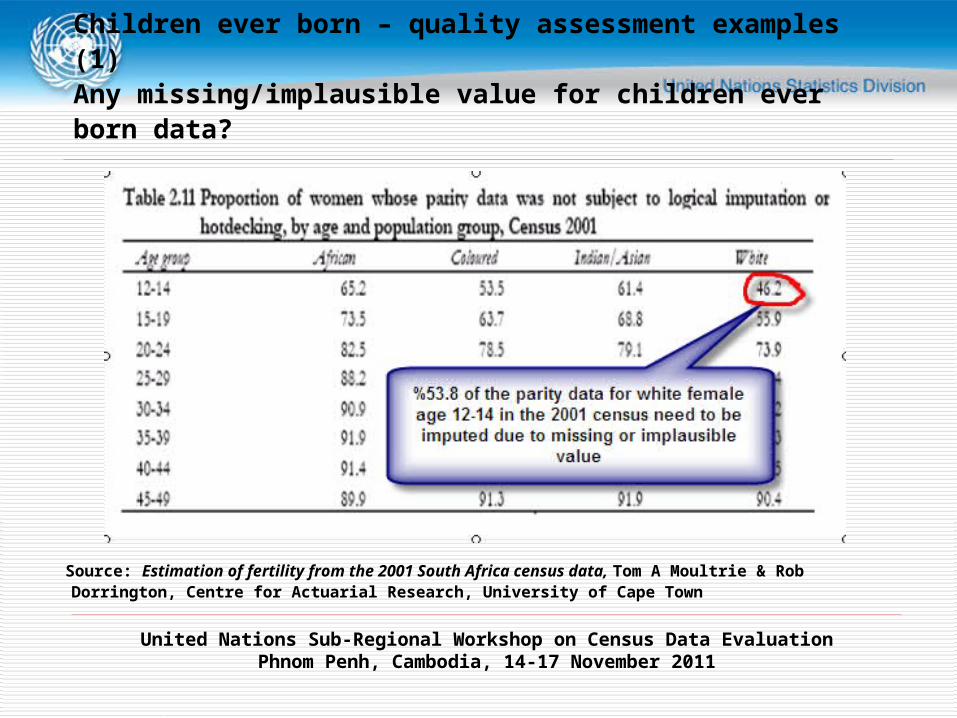
Children ever born – quality assessment examples (1) Any missing/implausible value for children ever born data?
Source: Estimation of fertility from the 2001 South Africa census data, Tom A Moultrie & Rob Dorrington, Centre for Actuarial Research, University of Cape Town
United Nations Sub-Regional Workshop on Census Data EvaluationPhnom Penh, Cambodia, 14-17 November 2011
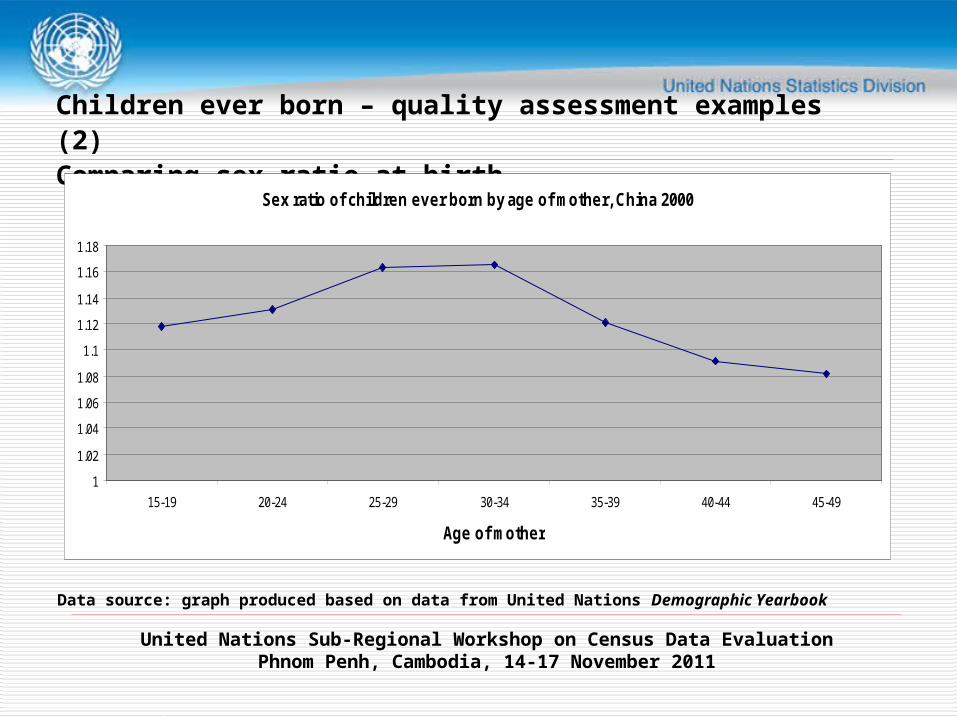
Children ever born – quality assessment examples (2)Comparing sex ratio at birth
Data source: graph produced based on data from United Nations Demographic Yearbook
Sex ratio of children ever born by age of mother, China 2000
1
1.02
1.04
1.06
1.08
1.1
1.12
1.14
1.16
1.18
15-19 20-24 25-29 30-34 35-39 40-44 45-49
Age of mother
United Nations Sub-Regional Workshop on Census Data EvaluationPhnom Penh, Cambodia, 14-17 November 2011
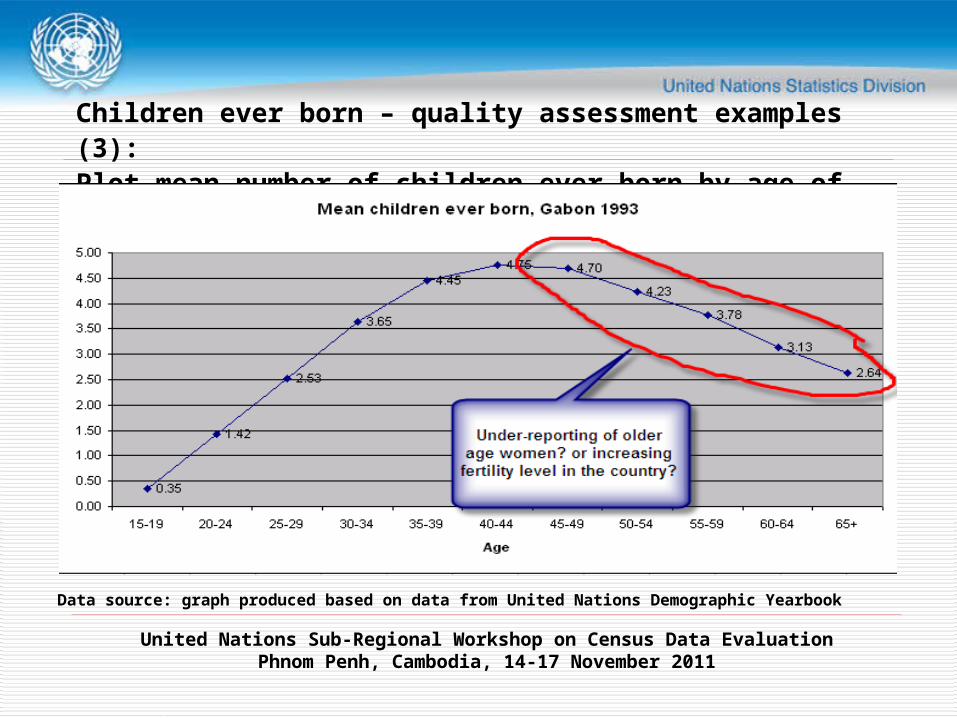
Children ever born – quality assessment examples (3): Plot mean number of children ever born by age of women
Data source: graph produced based on data from United Nations Demographic Yearbook
United Nations Sub-Regional Workshop on Census Data EvaluationPhnom Penh, Cambodia, 14-17 November 2011
Mean children ever born for Cambodia
0.00
1.00
2.00
3.00
4.00
5.00
6.00
Age
Avera
ge C
EB
1998 census
2008 census
2000 DHS
2005 DHS
1998 DHS
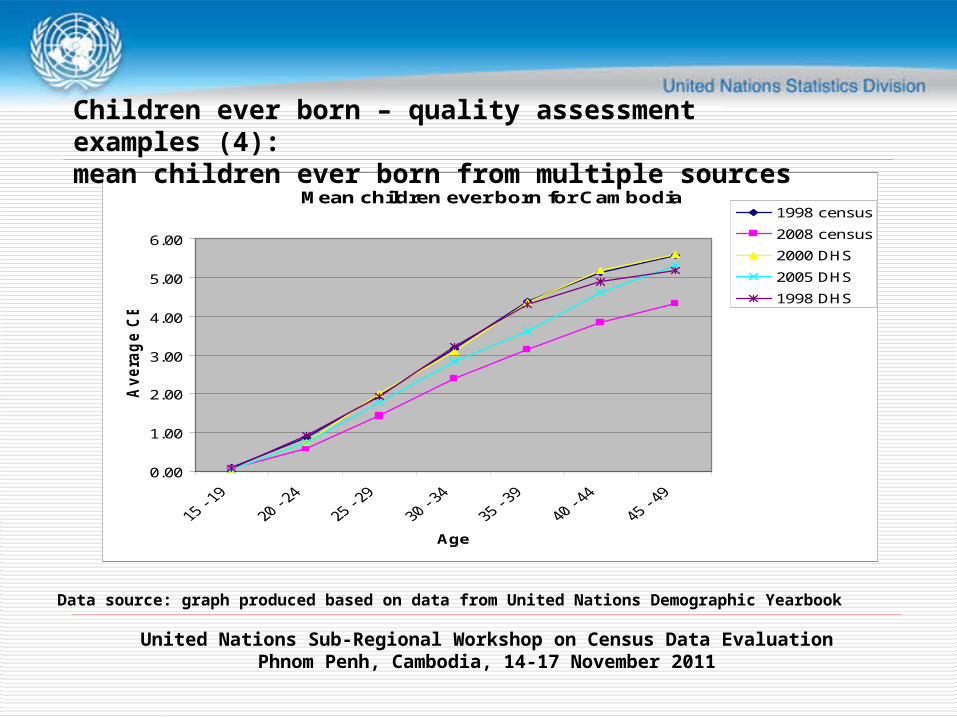
Children ever born – quality assessment examples (4): mean children ever born from multiple sources
Data source: graph produced based on data from United Nations Demographic Yearbook
United Nations Sub-Regional Workshop on Census Data EvaluationPhnom Penh, Cambodia, 14-17 November 2011
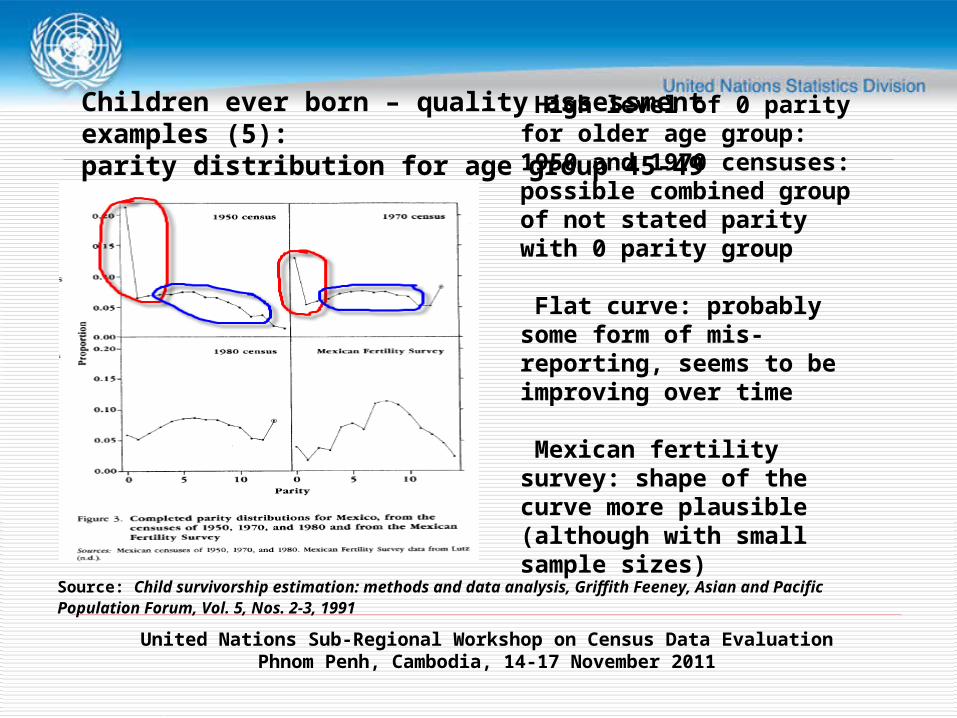
Children ever born – quality assessment examples (5): parity distribution for age group 45-49
High level of 0 parity for older age group: 1950 and 1970 censuses: possible combined group of not stated parity with 0 parity group
Flat curve: probably some form of mis-reporting, seems to be improving over time
Mexican fertility survey: shape of the curve more plausible (although with small sample sizes)
Source: Child survivorship estimation: methods and data analysis, Griffith Feeney, Asian and Pacific Population Forum, Vol. 5, Nos. 2-3, 1991
United Nations Sub-Regional Workshop on Census Data EvaluationPhnom Penh, Cambodia, 14-17 November 2011
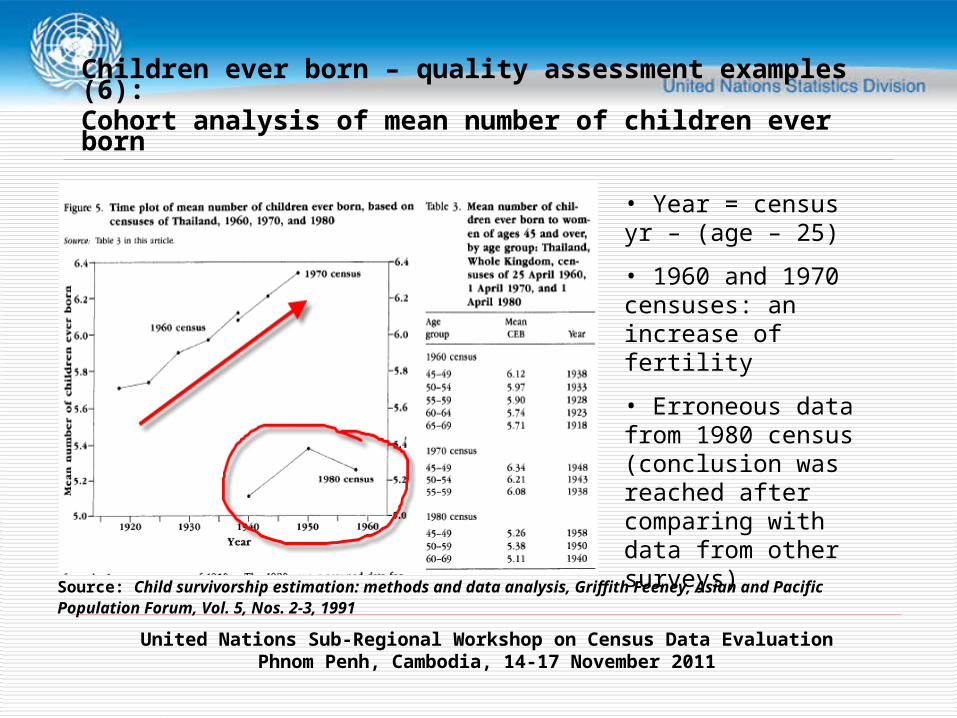
• Year = census yr – (age – 25)
• 1960 and 1970 censuses: an increase of fertility
• Erroneous data from 1980 census (conclusion was reached after comparing with data from other surveys)
Children ever born – quality assessment examples (6): Cohort analysis of mean number of children ever born
Source: Child survivorship estimation: methods and data analysis, Griffith Feeney, Asian and Pacific Population Forum, Vol. 5, Nos. 2-3, 1991
United Nations Sub-Regional Workshop on Census Data EvaluationPhnom Penh, Cambodia, 14-17 November 2011
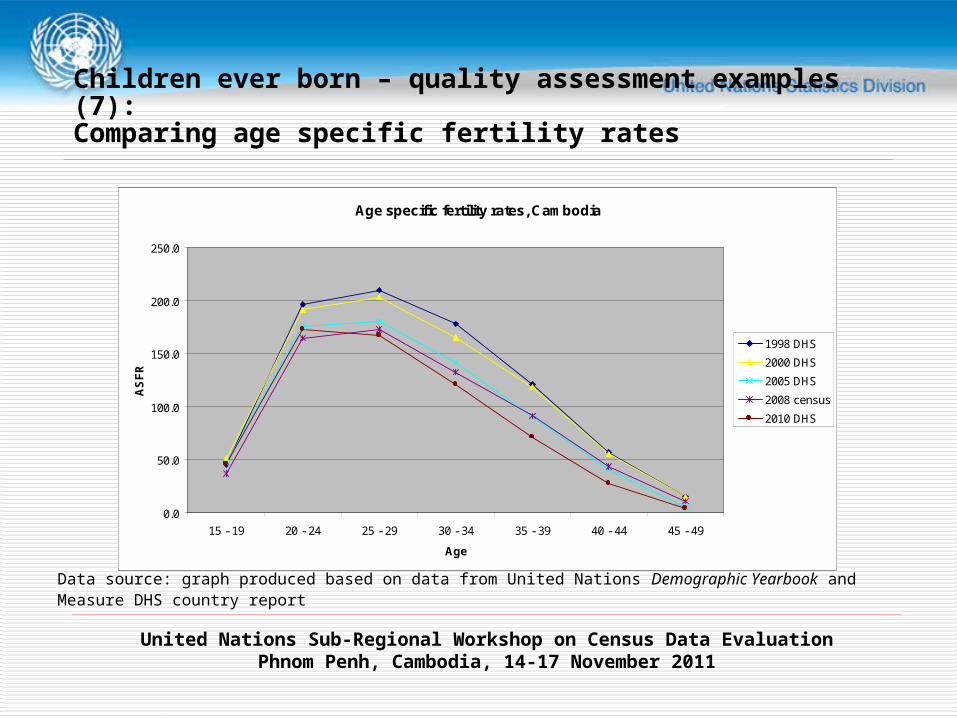
Children ever born – quality assessment examples (7): Comparing age specific fertility rates
Data source: graph produced based on data from United Nations Demographic Yearbook and Measure DHS country report
Age specific fertility rates, Cambodia
0.0
50.0
100.0
150.0
200.0
250.0
15 - 19 20 - 24 25 - 29 30 - 34 35 - 39 40 - 44 45 - 49
Age
AS
FR
1998 DHS
2000 DHS
2005 DHS
2008 census
2010 DHS
United Nations Sub-Regional Workshop on Census Data EvaluationPhnom Penh, Cambodia, 14-17 November 2011
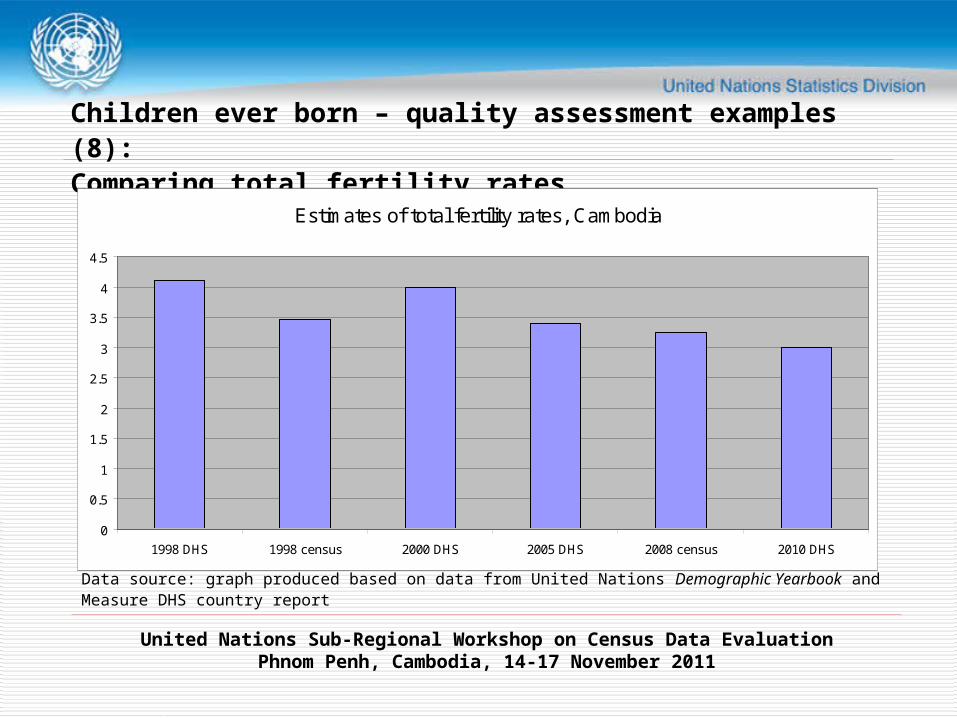
Children ever born – quality assessment examples (8): Comparing total fertility rates
Data source: graph produced based on data from United Nations Demographic Yearbook and Measure DHS country report
Estimates of total fertility rates, Cambodia
0
0.5
1
1.5
2
2.5
3
3.5
4
4.5
1998 DHS 1998 census 2000 DHS 2005 DHS 2008 census 2010 DHS
United Nations Sub-Regional Workshop on Census Data EvaluationPhnom Penh, Cambodia, 14-17 November 2011
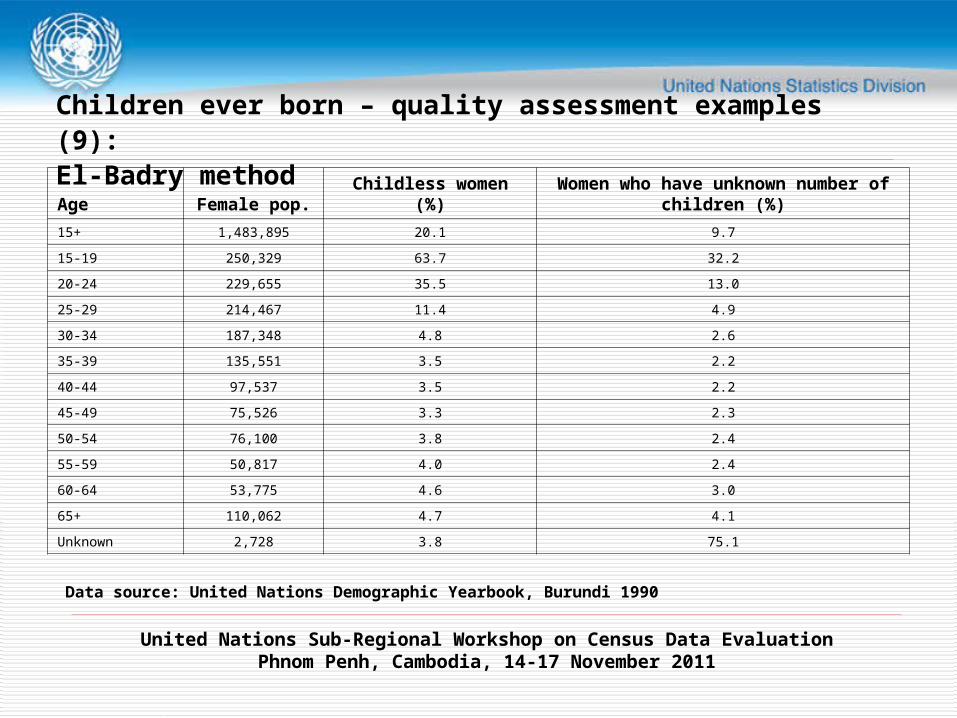
Children ever born – quality assessment examples (9): El-Badry method
Age Female pop. Childless women (%)Women who have unknown number of children
(%)
15+ 1,483,895 20.1 9.7
15-19 250,329 63.7 32.2
20-24 229,655 35.5 13.0
25-29 214,467 11.4 4.9
30-34 187,348 4.8 2.6
35-39 135,551 3.5 2.2
40-44 97,537 3.5 2.2
45-49 75,526 3.3 2.3
50-54 76,100 3.8 2.4
55-59 50,817 4.0 2.4
60-64 53,775 4.6 3.0
65+ 110,062 4.7 4.1
Unknown 2,728 3.8 75.1
Data source: United Nations Demographic Yearbook, Burundi 1990
United Nations Sub-Regional Workshop on Census Data EvaluationPhnom Penh, Cambodia, 14-17 November 2011
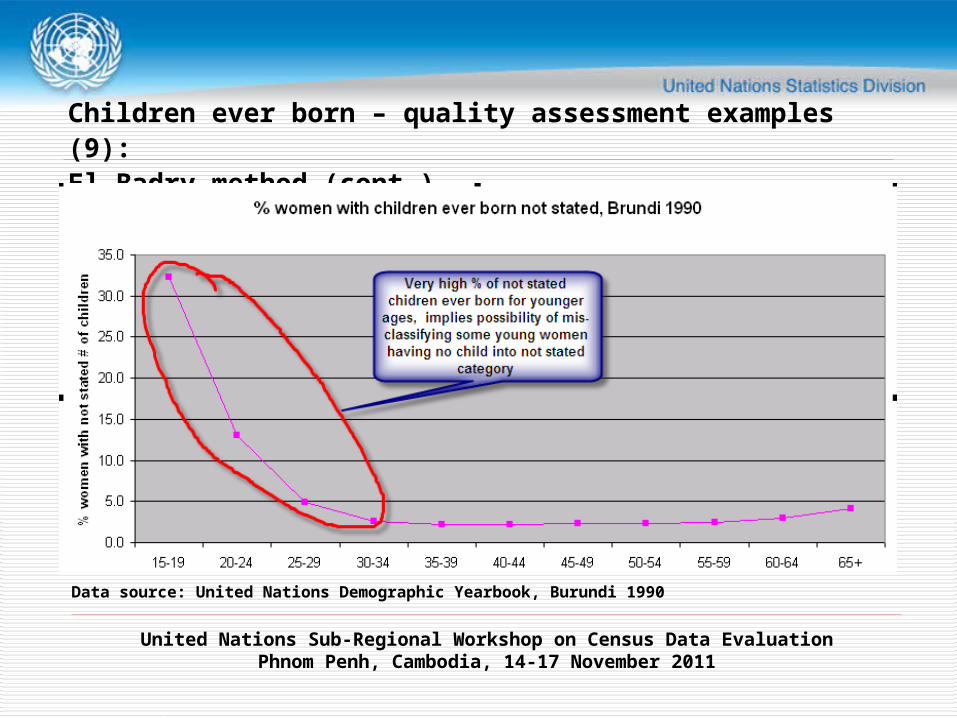
Children ever born – quality assessment examples (9): El-Badry method (cont.)
Data source: United Nations Demographic Yearbook, Burundi 1990
United Nations Sub-Regional Workshop on Census Data EvaluationPhnom Penh, Cambodia, 14-17 November 2011
0
5
10
15
20
25
30
35
0 20 40 60 80
% women childless
% w
om
en
sta
tele
ss
ch
ildre
n
Y Predicted Y Linear (Predicted Y)
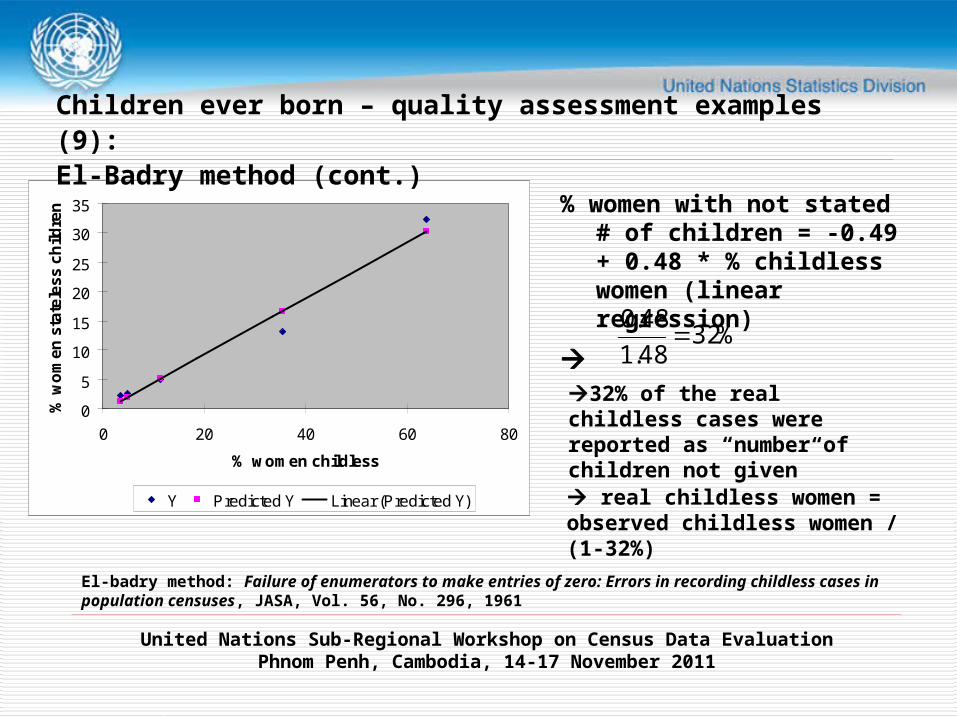
% women with not stated # of children = -0.49 + 0.48 * % childless women (linear regression)
%3248.1
48.0
32% of the real childless cases were reported as “number of children not given”
El-badry method: Failure of enumerators to make entries of zero: Errors in recording childless cases in population censuses, JASA, Vol. 56, No. 296, 1961
Children ever born – quality assessment examples (9): El-Badry method (cont.)
real childless women = observed childless women / (1-32%)

United Nations Sub-Regional Workshop on Census Data EvaluationPhnom Penh, Cambodia, 14-17 November 2011
Children ever born – quality assessment examples (10)Using the P/F ratio method
Rational: - Compare cumulative fertility level derived from current fertility data F(trusting the
distribution but not level) and life time fertility data P (trusting the overall level but assumes under-reporting varies by age)
- The method is typically used to adjust current fertility level (may be generated from recent births question in census or birth data from civil registration)
- However the method is also used to assess the quality of children ever born data and sometimes, the age reporting of mother
Current fertility data: • Births in the last 12 months (from censuses or civil registration)
Life time fertility data:• Children ever born in the life time of women
United Nations Sub-Regional Workshop on Census Data EvaluationPhnom Penh, Cambodia, 14-17 November 2011
Assumptions:
• Constant proportion of under-reporting of current fertility for all age groups
• Increasing under-reporting of parity (children ever born) by age of women
• Constant fertility (relaxed by a modification of the original P/F ratio method)
Children ever born – quality assessment examples (10)Using the P/F ratio method (cont.)
United Nations Sub-Regional Workshop on Census Data EvaluationPhnom Penh, Cambodia, 14-17 November 2011
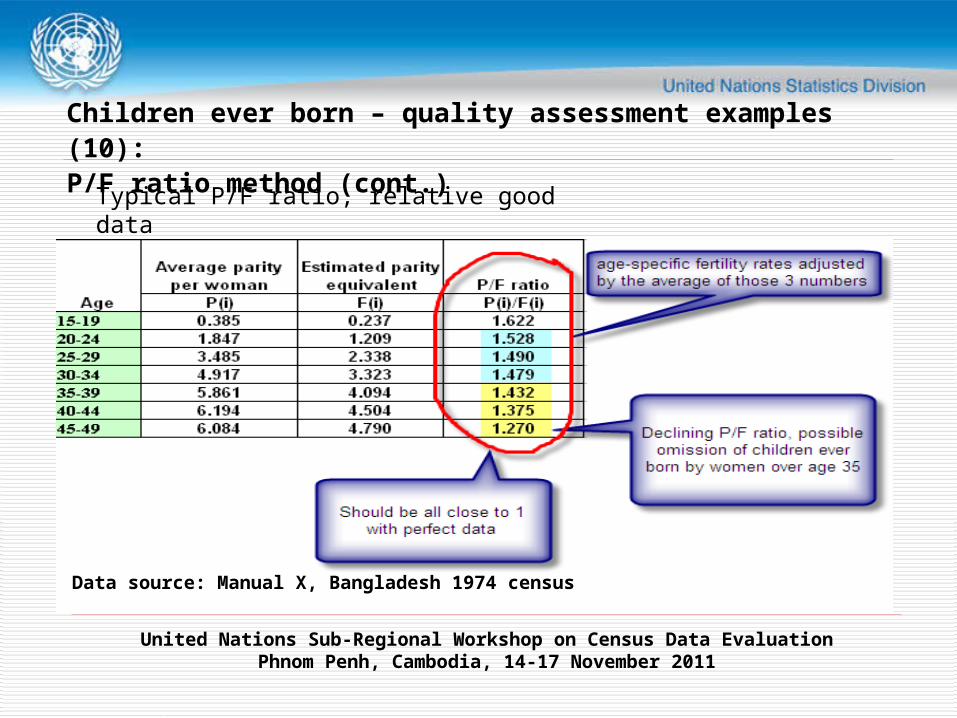
Children ever born – quality assessment examples (10): P/F ratio method (cont.)
Data source: Manual X, Bangladesh 1974 census
Typical P/F ratio, relative good data
United Nations Sub-Regional Workshop on Census Data EvaluationPhnom Penh, Cambodia, 14-17 November 2011
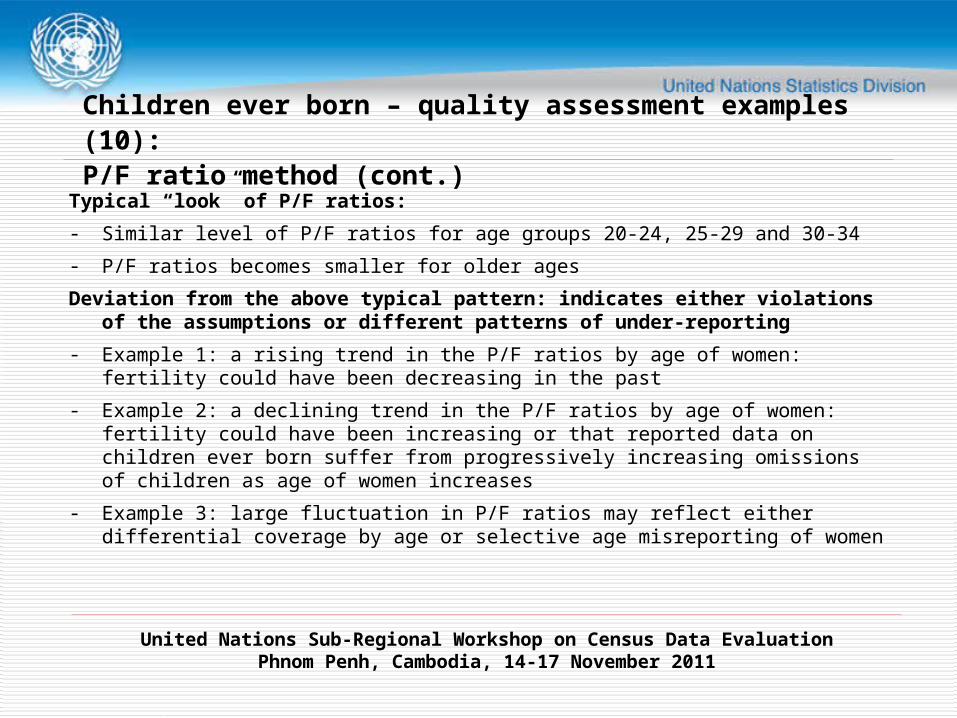
Typical “look” of P/F ratios:
- Similar level of P/F ratios for age groups 20-24, 25-29 and 30-34
- P/F ratios becomes smaller for older ages
Deviation from the above typical pattern: indicates either violations of the assumptions or different patterns of under-reporting
- Example 1: a rising trend in the P/F ratios by age of women: fertility could have been decreasing in the past
- Example 2: a declining trend in the P/F ratios by age of women: fertility could have been increasing or that reported data on children ever born suffer from progressively increasing omissions of children as age of women increases
- Example 3: large fluctuation in P/F ratios may reflect either differential coverage by age or selective age misreporting of women
Children ever born – quality assessment examples (10): P/F ratio method (cont.)
United Nations Sub-Regional Workshop on Census Data EvaluationPhnom Penh, Cambodia, 14-17 November 2011
Recent births - basics
How?
Date of birth of last child born alive (preferred question)
OR
Births in the last twelve months (to a woman) or in the household
However,
The questions are subject to under-reporting of births
Age of women during the census to be adjusted to age at giving birth (usually -0.5 year)
What can we get?
Age specific fertility rate and TFR
United Nations Sub-Regional Workshop on Census Data EvaluationPhnom Penh, Cambodia, 14-17 November 2011
Recent births – Possible errors
Reporting errors:
Enumerator’s error
“reference period error”: uncertain of the date of birth vs the reference period
Proxy respondent
Births reported not including:
Women had a birth recently but died before the census
Household had a birth recently but the household dissolved before the census
Not significant in most cases, however could become an issue when many deaths occurred in a short period (HIV/AIDS)
United Nations Sub-Regional Workshop on Census Data EvaluationPhnom Penh, Cambodia, 14-17 November 2011
Recent births – assessment (1)Methods
Initial assessment:any missing values in data? (month/date/year of births)
Missing data for any relevant variables? (age of mother, sex of child, survival status of the child)
For tabulated data:
Sex ratio at birth consistent with national average?
Plausibility of data – graphics help and best with other sources
Age-specific fertility rate
TFR
United Nations Sub-Regional Workshop on Census Data EvaluationPhnom Penh, Cambodia, 14-17 November 2011
Recent births – assessment (1)Methods (cont.)
- Compare with civil registration data on live births
- P/F ratio method to compare with children ever born data for coverage
United Nations Sub-Regional Workshop on Census Data EvaluationPhnom Penh, Cambodia, 14-17 November 2011
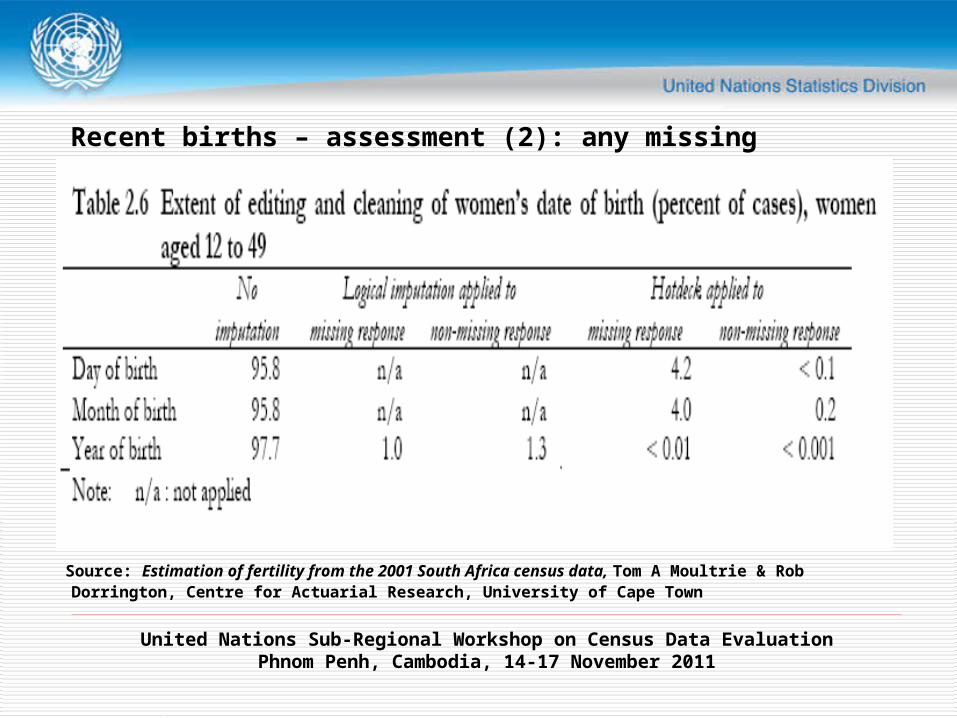
Recent births – assessment (2): any missing values?
Source: Estimation of fertility from the 2001 South Africa census data, Tom A Moultrie & Rob Dorrington, Centre for Actuarial Research, University of Cape Town
United Nations Sub-Regional Workshop on Census Data EvaluationPhnom Penh, Cambodia, 14-17 November 2011
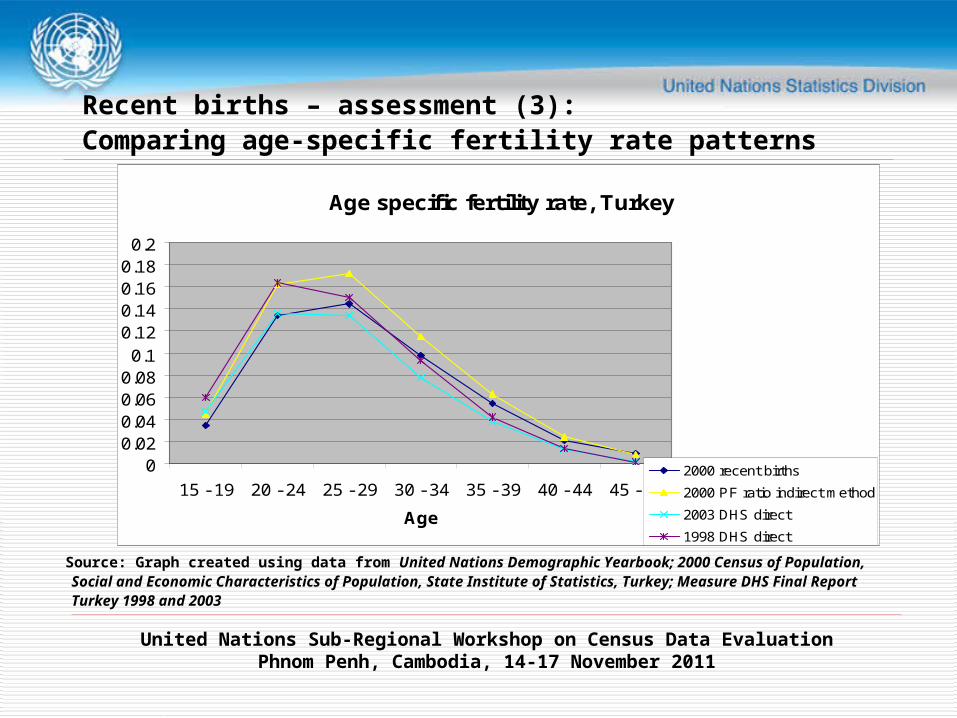
Recent births – assessment (3): Comparing age-specific fertility rate patterns
Source: Graph created using data from United Nations Demographic Yearbook; 2000 Census of Population, Social and Economic Characteristics of Population, State Institute of Statistics, Turkey; Measure DHS Final Report Turkey 1998 and 2003
Age specific fertility rate, Turkey
00.020.040.060.08
0.10.120.140.160.18
0.2
15 - 19 20 - 24 25 - 29 30 - 34 35 - 39 40 - 44 45 - 49
Age
2000 recent births
2000 PF ratio indirect method
2003 DHS direct
1998 DHS direct
United Nations Sub-Regional Workshop on Census Data EvaluationPhnom Penh, Cambodia, 14-17 November 2011
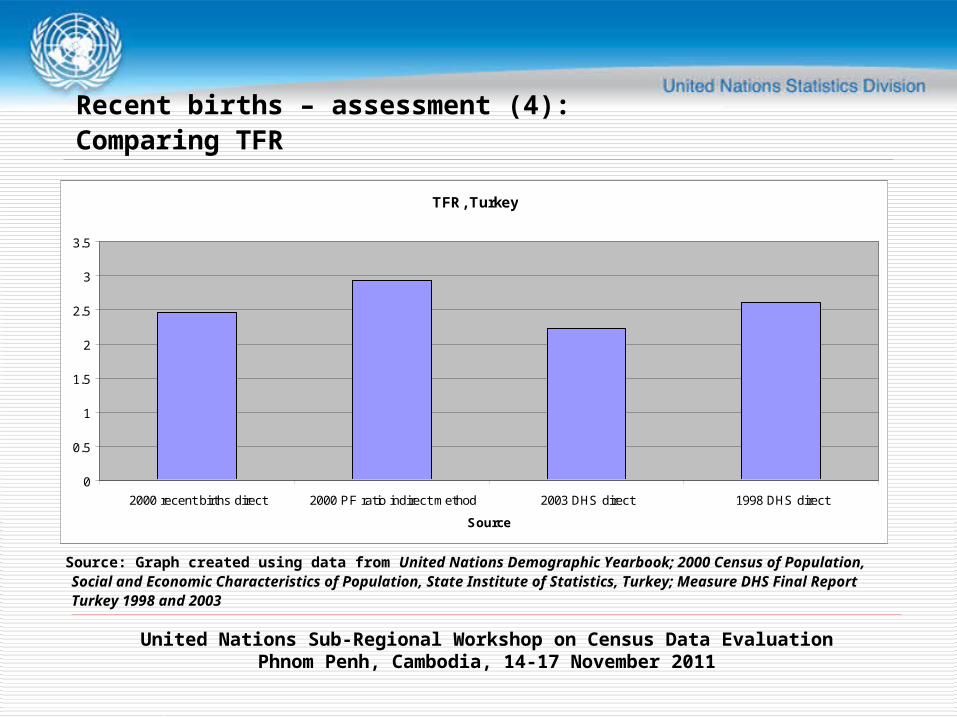
Recent births – assessment (4): Comparing TFR
Source: Graph created using data from United Nations Demographic Yearbook; 2000 Census of Population, Social and Economic Characteristics of Population, State Institute of Statistics, Turkey; Measure DHS Final Report Turkey 1998 and 2003
TFR, Turkey
0
0.5
1
1.5
2
2.5
3
3.5
2000 recent births direct 2000 PF ratio indirect method 2003 DHS direct 1998 DHS direct
Source
United Nations Sub-Regional Workshop on Census Data EvaluationPhnom Penh, Cambodia, 14-17 November 2011
Recent births – assessment (6): Comparing TFR
Yes under-estimated: but may reflect recent fertility pattern; adjusting for under-count and will be useful for sub-national and small area fertility estimates.
How to adjust: use household survey data
Only source for small area
Date of last birth data better quality than births in the last 12 months
United Nations Sub-Regional Workshop on Census Data EvaluationPhnom Penh, Cambodia, 14-17 November 2011
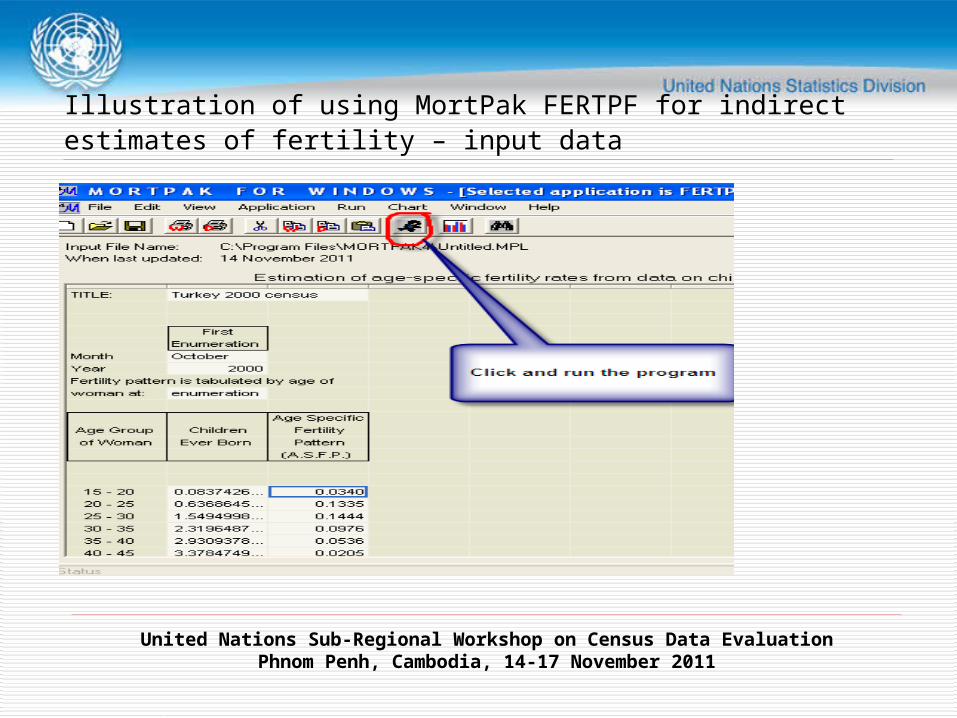
Illustration of using MortPak FERTPF for indirect estimates of fertility – input data
United Nations Sub-Regional Workshop on Census Data EvaluationPhnom Penh, Cambodia, 14-17 November 2011
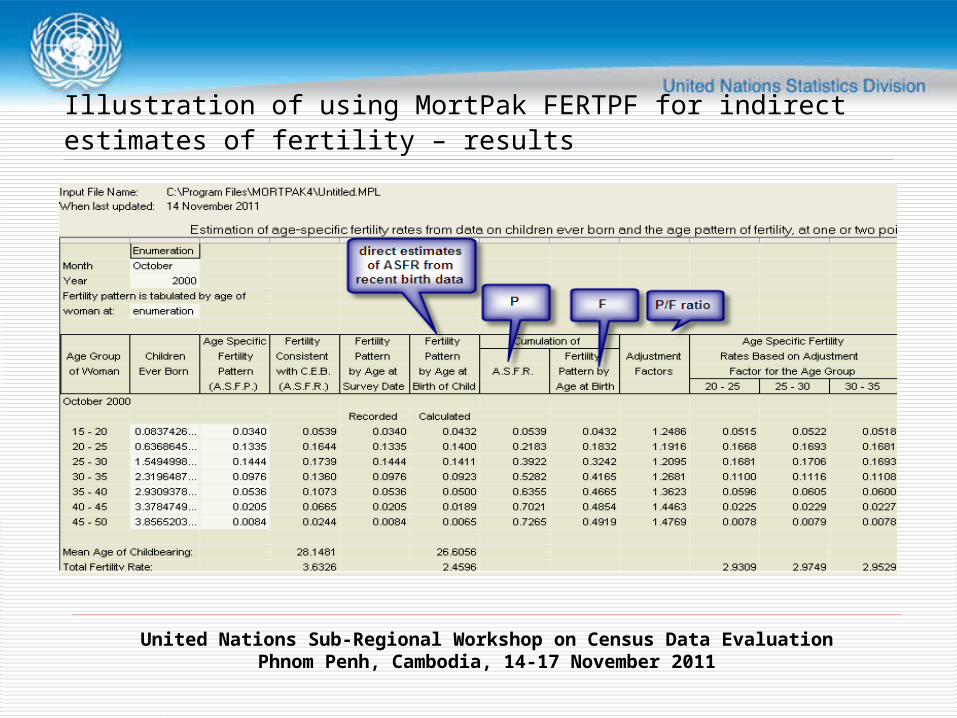
Illustration of using MortPak FERTPF for indirect estimates of fertility – results
United Nations Sub-Regional Workshop on Census Data EvaluationPhnom Penh, Cambodia, 14-17 November 2011
Thank you!