Embed Size (px)
Citation preview

United Nations Oslo City Group on Energy Statistics
8th Oslo Group Meeting, Baku, Azerbaijan
24-27 September 2013
ESCM Chapter 8:
Data Quality and Metadata
1

2
Outline of the presentation Background ESCM Chapter 8 outline Comments from OG7 and VM3 Chapter structure and content Changes to quality dimensions Examples/issues of data quality Metadata and examples General Statistical Business Process Model
and examples of implementation Next steps

3
Background – ESCM Chapter 8 outline
Provide guidance on the compilation of energy indicators and the preparation of metadata for energy statistics:
A. Data quality indicators for energy statistics B. Metadata
– Description of metadata specific to energy statistics
– Presentation and dissemination of metadata

4
Comments from OG7 OG7:
• Specific energy issues that will affect quality.• The challenges with consistency within energy statistics itself and in
relation to other statistical areas.• The practice of using secondary sources for validating purposes.• The use of the balances as a quality check.• General Statistical Business Process Model to include
administrative data sources.• Quality in a decentralised model vs. a centralised system.• Guidance for countries that do not have yet a well developed
energy system.
5
Comments from VM3 VM3:
• Overall good description of data quality and metadata.• Incorporate energy specific examples and references to
energy issues.

6
Chapter structure and content
Three main sections to the chapter Data quality Metadata Ensuring data quality and metadata using the General Statistical
Business Process Model (GSBPM)
Each section followed by energy related examples

Changes to quality dimensionsUpdated data quality dimensions and indicators for measuring quality from UN’s International Recommendations for Energy Statistics.
Static elements• Relevance• Credibility/objectivity• Accuracy• Timeliness• Coherence• Accessibility
Dynamic elements• Non-response• Coverage• Sampling
7
Other dimension of quality for metadata:• Interpretability

8
Energy specific examples/issues of data quality
Statistics Austria’s country practice on Energy Balances for Austria and the Laender of Austria.
Report on Energy Supply and Demand (RESD) from Statistics Canada.
Use of standard concepts, definitions, classifications – North American Industry Classification System
The Swedish Official Statistics decentralized system.

9
Metadata
Important for assessing “fitness for use” and ensuring interpretability.
Required at every step of the survey process. Critical for enabling comparisons with other data. Used to prescribe definitions, concepts, variables and
standards. Supports the harmonization of international surveys and
data.
10
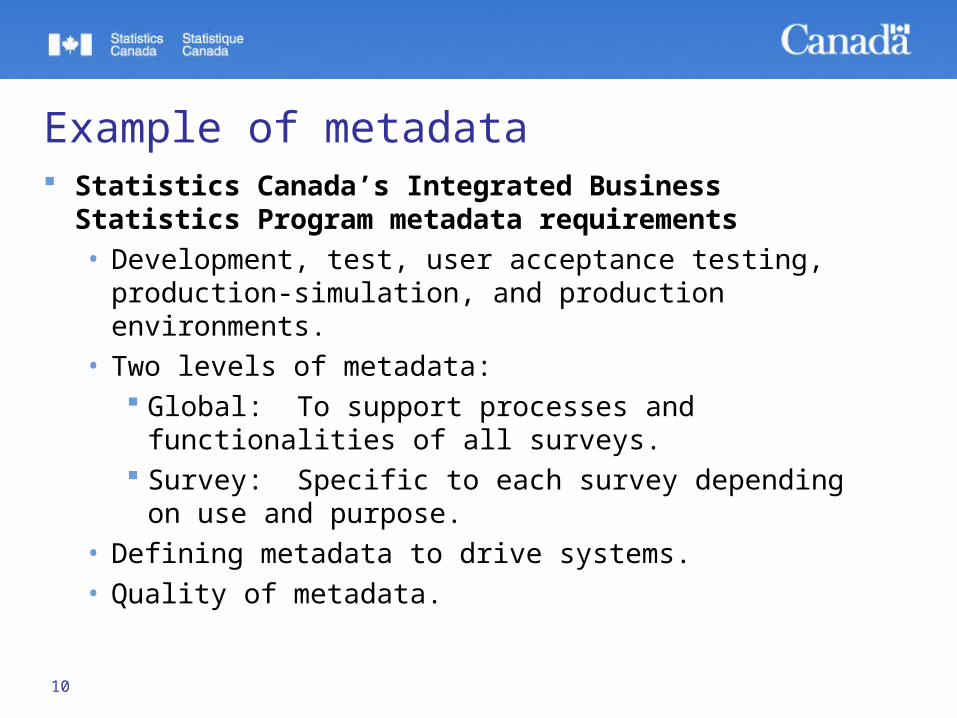
Example of metadata Statistics Canada’s Integrated Business Statistics
Program metadata requirements
• Development, test, user acceptance testing, production-simulation, and production environments.
• Two levels of metadata: Global: To support processes and functionalities of
all surveys. Survey: Specific to each survey depending on use
and purpose.
• Defining metadata to drive systems.
• Quality of metadata.

Example of metadata characteristics to drive systems and the GSBPM phases
GSBPM Design phase 2.1 Design outputs
2.2 Design variable descriptions
2.3 Design data collection methodology
2.4 Design frame and sample methodology
2.5 Design statistical processing
methodology
2.6 Design production and systems
workflow
1. metadata is defined in the design and build phases of development
2. high-level concepts underpin system content and metadata is used to describe concepts at various levels of abstraction
4. metadata is managed through a user interface (or several); metadata concepts underpin the browse functionality for locating information objects, such as variables and questionnaires, and their relationships and attributes
5. uses centralized management supporting single entry and single source of, e.g. codesets: change once and propagate across system wherever codeset is used, and is flexible, not hard-coded
8. applies administrative metadata or ‘settings’ at different levels in the system
11

Example of metadata and quality dimensionsCriterion Accuracy
Definition Names, codesets and other metadata are created and implemented according to the IBSP naming convention, the hierarchy of identifiers and other standards to ensure that metadata are aligned with the established semantics that reflect the business survey management.
Metric Test different features of the system, such as the Questionnaire Development Application, to verify that the logic required by the various standards is reflected in the system functionality. Gather information during user testing regarding the quality and suitability of codesets to their purpose.
Frequency Every fiscal year.
Example A questionnaire can be retrieved by its Survey ID, SDDS number or name.
Level System
Follow-up Log any issues concerning the standards and structure in the system and address the issues by working with the Standards Division or by fixing the problem in the metadata registry, as the case dictates.
12

Quality assurance must be built into all stages of the survey process General Statistical Business Process
Model (GSBPM) Survey Stages:
1. Specify needs
2. Design
3. Build
4. Collect
5. Process
6. Analyze
7. Disseminate
8. Archive
9. Evaluate
13
Quality Assurance Framework

14
Examples of GSBPM implementation
Implementation of GSBPM on crude oil in the State Statistical Committee of the Republic of Azerbaijan
Statistics Canada Integrated Business Statistics Program (IBSP) Initiative• Redesign of the Business Statistics Program• Approximately 120 business surveys including the content
redesign of 23 energy surveys.• Common sampling, collection and processing methodologies,
and sharing of common systems and analytical tools.• Will be done in several phases to be completed by 2016.

15
IBSP - Monthly Refined Petroleum Products Survey Data on the activities of refineries and other producers of
refined petroleum products. Consultations with clients and respondents across
Canada to identify the statistical needs for the future, review of concepts, and respondents’ ability to provide the information requested.
New content includes biofuels contained in light fuel oil, diesel and aviation fuel.
Meetings with the IBSP collection, processing and analysis working group to identify the processing requirements.

16
IBSP - Monthly Refined Petroleum Products Survey Report is prepared outlining the sampling methodology,
collection strategy, content of the questionnaire and collection edits, standards for classifications and metadata, survey processing, data integration, edit and imputation, adjustments and additions, estimation, reports, dissemination, break in the series, and documentation.
The design of electronic questionnaires is starting and field testing will take place this winter with production/collection to be ready for January 2015.

17
Next steps…
Determine if need for different or additional energy related examples and issues.
Review structure, content, and length of chapter for approval.
18
Thank you!
Andy Kohut, DirectorManufacturing and Energy DivisionStatistics CanadaSection B-8, 11th Floor, Jean Talon BuildingOttawa, Ontario Canada K1A 0T6
Telephone: 613-951-5858E-mail: [email protected]


![ESCM CLv1[1].1,Part2 Sin Protección](https://img.pdfslide.us/doc/110x75/577cc9fa1a28aba711a517eb/escm-clv111part2-sin-proteccion.jpg)