Embed Size (px)
Citation preview
8/8/2019 United Nations - Global Biodiversity Outlook 3 (2010)
http://slidepdf.com/reader/full/united-nations-global-biodiversity-outlook-3-2010 1/96
Global Biodiversity Outlook 3
8/8/2019 United Nations - Global Biodiversity Outlook 3 (2010)
http://slidepdf.com/reader/full/united-nations-global-biodiversity-outlook-3-2010 2/96
Global Biodiversity Outlook 3 | 2
Table of Contents
8/8/2019 United Nations - Global Biodiversity Outlook 3 (2010)
http://slidepdf.com/reader/full/united-nations-global-biodiversity-outlook-3-2010 3/96
Global Biodiversity Outlook 3 | 3
© Secretariat o the Convention on Biological Diversity.
Global Biodiversity Outlook 3 (ISBN-92-9225-220-8) is an open access publication,subject to the terms o the Creative Commons Attribution License(http://creativecommons.org/licenses/by-nc/3.0/).
Copyright is retained by the Secretariat.Global Biodiversity Outlook 3 is reely available online: www.cbd.int/GBO3. An annotatedversion o the publication with complete reerences is also available rom the website.Users may download, reuse, reprint, modiy, distribute, and/or copy text, gures, graphsand photos rom Global Biodiversity Outlook 3, so long as the original source is credited.
The designations employed and the presentation o material in Global Biodiversity Outlook 3 do not imply the expression o any opinion whatsoever on the part o the Secretariat o theConvention on Biological Diversity concerning the legal status o any country, territory,city or area or o its authorities, or concerning the delimitation o its rontiers or boundaries.
Citation:Secretariat o the Convention on Biological Diversity (2010) Global Biodiversity Outlook 3.
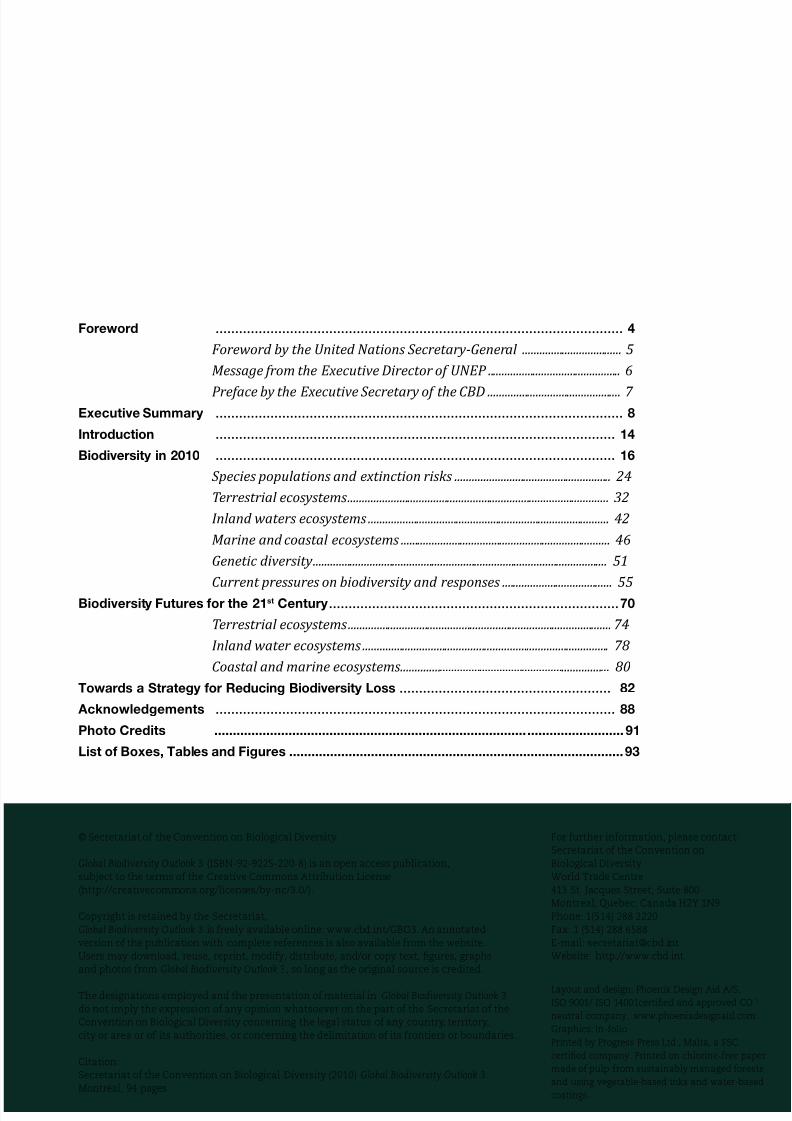
Foreword ........................................................................................................ 4
Foreword by the United Ntions Secretry-Generl ................................... 5
Messge from the Executive Director of UNEP ............................................... 6
Prefce by the Executive Secretry of the CBD ............................................... 7 Executive Summary ........................................................................................................ 8
Introduction ...................................................................................................... 14
Biodiversity in 2010 ...................................................................................................... 16
Species popultions nd extinction risks ....................................................... 24
Terrestril ecosystems ............................................................................................ 32
Inlnd wters ecosystems ..................................................................................... 42
Mrine nd costl ecosystems .......................................................................... 46
Genetic diversity ........................................................................................................ 51
Current pressures on biodiversity nd responses ....................................... 55 Biodiversity Futures for the 21st Century.......................................................................... 70
Terrestril ecosystems ............................................................................................. 74
Inlnd wter ecosystems ....................................................................................... 78
Costl nd mrine ecosystems .......................................................................... 80
Towards a Strategy for Reducing Biodiversity Loss ...................................................... 82
Acknowledgements ...................................................................................................... 88
Photo Credits .............................................................................................................. 91
List of Boxes, Tables and Figures ..........................................................................................93
For urther inormation, please contact:Secretariat o the Convention onBiological DiversityWorld Trade Centre413 St. Jacques Street, Suite 800Montreal, Quebec, Canada H2Y 1N9Phone: 1(514) 288 2220Fax: 1 (514) 288 6588E-mail: [email protected]: http://www.cbd.int
Layout and design: Phoenix Design Aid A/S,
ISO 9001/ ISO 14001certied and approved CO2
neutral company. www.phoenixdesignaid.com.
Graphics: In-olio
Printed by Progress Press Ltd., Malta, a FSC
certied company. Printed on chlorine-ree paper
made o pulp rom sustainably managed orests
and using vegetable based inks and water based
8/8/2019 United Nations - Global Biodiversity Outlook 3 (2010)
http://slidepdf.com/reader/full/united-nations-global-biodiversity-outlook-3-2010 4/96
Global Biodiversity Outlook 3 | 4
Foreword
8/8/2019 United Nations - Global Biodiversity Outlook 3 (2010)
http://slidepdf.com/reader/full/united-nations-global-biodiversity-outlook-3-2010 5/96
Global Biodiversity Outlook 3 | 5
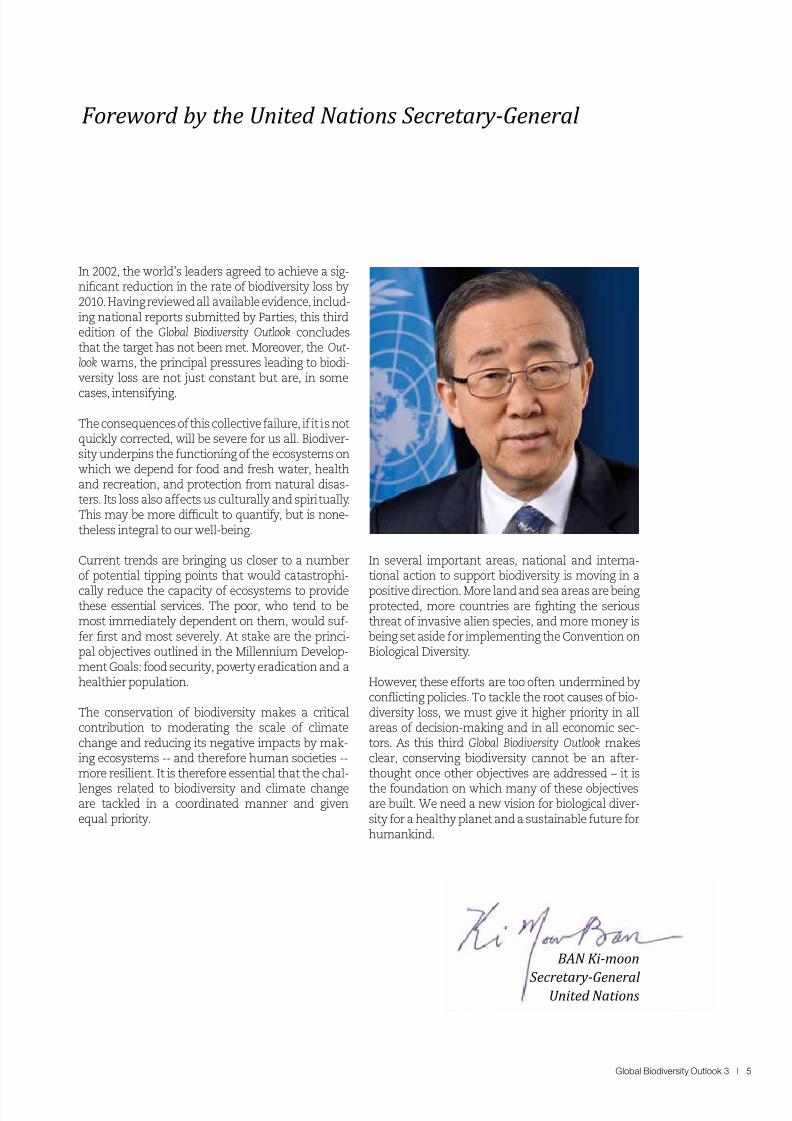
In 2002, the world’s leaders agreed to achieve a sig-nicant reduction in the rate o biodiversity loss by2010. Having reviewed all available evidence, includ-ing national reports submitted by Parties, this thirdedition o the Global Biodiversity Outlook concludesthat the target has not been met. Moreover, the Out-look warns, the principal pressures leading to biodi-versity loss are not just constant but are, in some
cases, intensiying.
The consequences o this collective ailure, i it is notquickly corrected, will be severe or us all. Biodiver-sity underpins the unctioning o the ecosystems onwhich we depend or ood and resh water, healthand recreation, and protection rom natural disas-ters. Its loss also aects us culturally and spiritually.This may be more dicult to quantiy, but is none-theless integral to our well-being.
Current trends are bringing us closer to a numbero potential tipping points that would catastrophi-
cally reduce the capacity o ecosystems to providethese essential services. The poor, who tend to bemost immediately dependent on them, would su-er rst and most severely. At stake are the princi-pal objectives outlined in the Millennium Develop-ment Goals: ood security, poverty eradication and ahealthier population.
The conservation o biodiversity makes a criticalcontribution to moderating the scale o climatechange and reducing its negative impacts by mak-ing ecosystems -- and thereore human societies --more resilient. It is thereore essential that the chal-
lenges related to biodiversity and climate changeare tackled in a coordinated manner and givenequal priority.
In several important areas, national and interna-tional action to support biodiversity is moving in a
positive direction. More land and sea areas are beingprotected, more countries are ghting the seriousthreat o invasive alien species, and more money isbeing set aside or implementing the Convention onBiological Diversity.
However, these eorts are too oten undermined byconficting policies. To tackle the root causes o bio-diversity loss, we must give it higher priority in allareas o decision-making and in all economic sec-tors. As this third Global Biodiversity Outlook makesclear, conserving biodiversity cannot be an ater-thought once other objectives are addressed – it is
the oundation on which many o these objectivesare built. We need a new vision or biological diver-sity or a healthy planet and a sustainable uture orhumankind.
BaN Ki-moon
Secretry-Generl United Ntions
Foreword by the United Ntions Secretry-Generl
8/8/2019 United Nations - Global Biodiversity Outlook 3 (2010)
http://slidepdf.com/reader/full/united-nations-global-biodiversity-outlook-3-2010 6/96
Global Biodiversity Outlook 3 | 6
A new and more intelligent compact between hu-
manity and the Earth’s lie-support systems isurgently needed in 2010—the UN’s InternationalYear o Biodiversity. This was the year when govern-ments had agreed to substantially reduce the rateo biodiversity loss: this has not happened. Insteado refecting, governments, business and society asa whole need to urgently renew and recommit tothis enterprise i sustainability is to be realized inthe 21st century.
The Global Biodiversity Outlook-3 contains the so-bering acts and gures while pin pointing severalkey reasons as to why the challenge o conserving
and indeed enhancing biodiversity remains un-met. One key area is economics: many economiesremain blind to the huge value o the diversity o animals, plants and other lie-orms and their rolein healthy and unctioning ecosystems rom orestsand reshwaters to soils, oceans and even the at-mosphere.
The Economics o Ecosystems and Biodiversity,hosted by UNEP, is a major exercise aimed at bridg-ing understanding and driving action in this area.It will complement the GBO-3 in advance o theConvention on Biological Diversity meeting in
Nagoya later in the year. Already some compellingand catalyzing acts are emerging.
✤Annual losses as a result o deorestation andorest degradation alone may equate to losses o US$2 trillion to over US$4.5 trillion alone. Thesecould be secured by an annual investment o justUS$45 billion: a 100 to 1 return.
Many countries are beginning to actor naturalcapital into some areas o economic and social liewith important returns, but this needs rapid andsustained scaling-up.
✤In Venezuela, investment in the national protect-ed area system is preventing sedimentation thatotherwise could reduce arm earnings by aroundUS$3.5 million a year.
✤Planting and protecting nearly 12,000 hectareso mangroves in Vietnam costs just over US$1million but saved annual expenditures on dykemaintenance o well over US$7 million.
Mainstreaming the economics o biodiversity andthe multi-trillion dollar services o the ecosystems
which it supports into development, decision-mak-ing can make 2010 a success.
Other ‘litmus tests’ include bridging the gap be-tween science and policy-makers by perhaps theestablishment o an Intergovernmental Panel onBiodiversity and Ecosystem Services. Public aware-ness will also be key: de-mystiying terms such asbiodiversity and ecosystems is one challenge. Theother is to make the link between biodiversity andlivelihoods and the important role o biodiversityand natural systems in meeting other sustainabilitychallenges such as climate change, water scarcityand agriculture.
Governments also need to rise to the challenge o Alien Invasive Species. By some estimates, theymay be costing the global economy US$1.4 tril-lion or more. In sub-Saharan Arica, the invasivewitchweed is responsible or annual maize lossesamounting to US$7 billion: overall losses to aliensmay amount to over US$12 billion in respect to A-rica's eight principal crops.
Last but not least, a successul conclusion to nego-tiations on an international regime on access andbenet sharing o genetic resources is needed. Thisis the missing pillar o the CBD and perhaps its -
nancial mechanism: a successul conclusion wouldindeed make 2010 a year to applaud.
The arrogance o humanity is that somehow weimagine we can get by without biodiversity or that itis somehow peripheral: the truth is we need it morethan ever on a planet o six billion heading to overnine billion people by 2050.
achim Steiner United Ntions Under-Secretry Generl
nd Executive Director, United Ntions
Environment Progrmme
Messge from the Executive Director of UNEP
8/8/2019 United Nations - Global Biodiversity Outlook 3 (2010)
http://slidepdf.com/reader/full/united-nations-global-biodiversity-outlook-3-2010 7/96
Global Biodiversity Outlook 3 | 7
The third edition o Global Biodiversity Outlook
(GBO-3) comes at a critical period in the history o the Convention on Biological Diversity. It coincideswith the deadline agreed in Johannesburg by worldleaders to substantially reduce the rate o biodi-versity loss by 2010 as a contribution to poverty al-leviation and to the benet o all lie on Earth. Tothis end the United Nations has designated 2010 asthe International Year o Biodiversity. For the rsttime in its history, the United Nations General As-sembly, during its 65th session, will convene a highlevel meeting on biodiversity with the participationo Heads o State and Government. Further duringthe tenth meeting o the Conerence o Parties to
the Convention, to be held in Nagoya, Aichi Preec-ture, Japan, Parties will develop a new strategic planor the coming decades including a 2050 vision and2020 mission or biodiversity as well as means orimplementation and mechanism to monitor andevaluate our progress towards our shared globalobjectives.
More than teen years ater the Convention cameinto orce, and when the international communityis actively preparing or the Rio+20 summit, this isa time o reckoning or decision-makers commit-ted to the global eort to saeguard the variety lie
on Earth and its contribution to human well-being.GBO-3 is a vital tool to inorm decision-makers andthe wider public, about the state o biodiversity in2010, the implications o current trends, and our op-tions or the uture.
Drawing extensively rom the approximately 120national reports submitted by Parties to the Con-vention, GBO-3 makes it clear that we have muchwork to do over the months and years to come. Nocountry has reported that it will completely meetthe 2010 target, and a ew Parties have unequivo-cally stated they will not meet it. Moreover, most
Parties have reported that at least one, but in mostcases several species and habitats within their na-tional territories, were in a state o decline.
Most Parties have conrmed that ve main pres-sures continue to aect biodiversity within their bor-ders: habitat loss, the unsustainable use and overex-ploitation o resources, climate change, invasive alienspecies, and pollution. Many positive steps have beentaken by the Parties to help address these issues.These include the development o new biodiversity-related legislation; the establishment o mechanismsor environmental impact assessment; participation
in transboundary management or cooperation initi-atives; and ostering community involvement in themanagement o biological resources.
At the same time, the ourth national reports giveus a clear picture o the obstacles that need to beovercome to better implement the objectives o theConvention. These include limited capacity in bothdeveloped and developing nations, including nan-cial, human and technical issues; the absence o, ordiculties in, accessing scientic inormation; lim-ited awareness o biodiversity issues amongst thegeneral public and decision makers; limited biodi-versity mainstreaming; ragmented decision mak-ing and limited communication between dierentministries or sectors; and the absence o economic
valuation o biodiversity.
As this Outlook makes clear, it is essential that theseobstacles are removed i we are to make progress intackling biodiversity loss. It is increasingly urgentthat we make such progress, as the consequenceso current trends have implications that jeopard-ize many o the objectives shared by the wider UNamily to change the world or the better. We havean opportunity, equipped with the knowledge andanalysis contained in this document and its under-lying sources, to move biodiversity into the main-stream o decision-making. Let us, individually and
collectively, seize this opportunity, or the sake o current and uture generations as indeed biodiver-sity is lie, biodiversity is our lie.
ahmed Djoghlf assistnt Secretry-Generl
nd Executive Secretry
Convention on Biologicl Diversity
Prefce by the Executive Secretry of the CBD
8/8/2019 United Nations - Global Biodiversity Outlook 3 (2010)
http://slidepdf.com/reader/full/united-nations-global-biodiversity-outlook-3-2010 8/96
Global Biodiversity Outlook 3 | 8
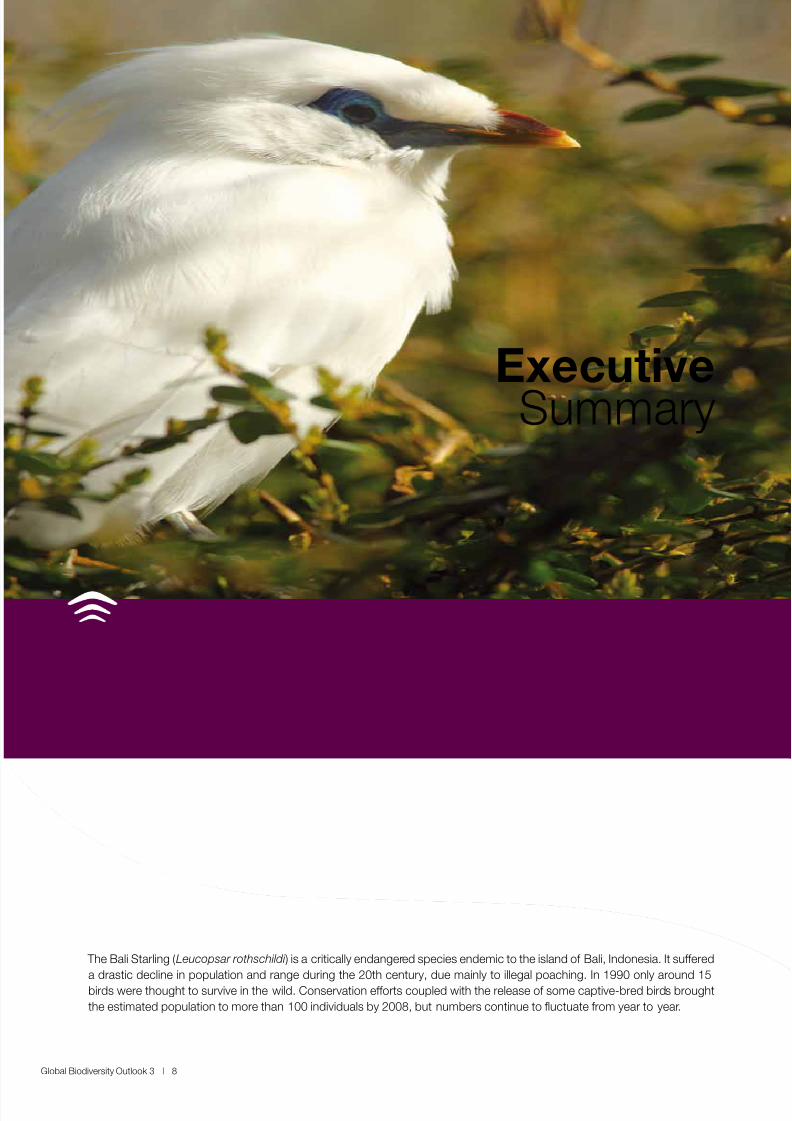
The Bali Starling (Leucopsar rothschildi ) is a critically endangered species endemic to the island o Bali, Indonesia. It suered
a drastic decline in population and range during the 20th century, due mainly to illegal poaching. In 1990 only around 15
birds were thought to survive in the wild. Conservation eorts coupled with the release o some captive-bred birds brought
the estimated population to more than 100 individuals by 2008, but numbers continue to uctuate rom year to year.
ExecutiveSummary
8/8/2019 United Nations - Global Biodiversity Outlook 3 (2010)
http://slidepdf.com/reader/full/united-nations-global-biodiversity-outlook-3-2010 9/96
Global Biodiversity Outlook 3 | 9
The target agreed by the world’s Govern-ments in 2002, “to achieve by 2010 a sig-niicant reduction of the current rate of bi -odiversity loss at the global, regional and
national level as a contribution to poverty alleviation and to the beneit of all life onEarth”, has not been met.
There are multiple indications o continuing declinein biodiversity in all three o its main components —genes, species and ecosystems — including:
✤ Species which have been assessed or extinc-tion risk are on average moving closer to ex-tinction. Amphibians ace the greatest risk andcoral species are deteriorating most rapidly instatus. Nearly a quarter o plant species are es-
timated to be threatened with extinction.
✤ The abundance o vertebrate species, based onassessed populations, ell by nearly a third onaverage between 1970 and 2006, and continuesto all globally, with especially severe declinesin the tropics and among reshwater species.
✤ Natural habitats in most parts o the worldcontinue to decline in extent and integrity,although there has been signicant progressin slowing the rate o loss or tropical orestsand mangroves, in some regions. Freshwater
wetlands, sea ice habitats, salt marshes, coralrees, seagrass beds and shellsh rees are allshowing serious declines.
✤ Extensive ragmentation and degradation o orests, rivers and other ecosystems have alsoled to loss o biodiversity and ecosystem serv-ices.
✤ Crop and livestock genetic diversity continuesto decline in agricultural systems.
✤ The ve principal pressures directly driving
biodiversity loss (habitat change, overexploita-tion, pollution, invasive alien species and cli-mate change) are either constant or increasingin intensity.
✤ The ecological ootprint o humanity exceedsthe biological capacity o the Earth by a widermargin than at the time the 2010 target wasagreed.
The loss o biodiversity is an issue o pro-ound concern or its own sake. Biodiversityalso underpins the unctioning o ecosystems
which provide a wide range o services to hu-man societies. Its continued loss, thereore,
has major implications or current and uturehuman well-being. The provision o ood, bre,medicines and resh water, pollination o crops,ltration o pollutants, and protection rom
natural disasters are among those ecosystemservices potentially threatened by declines andchanges in biodiversity. Cultural services suchas spiritual and religious values, opportunitiesor knowledge and education, as well as recrea-tional and aesthetic values, are also declining.
The existence o the 2010 biodiversity targethas helped to stimulate important action tosaeguard biodiversity, such as creating moreprotected areas (both on land and in coastal wa-ters), the conservation o particular species, andinitiatives to tackle some o the direct causes o
ecosystem damage, such as pollution and al-ien species invasions. Some 170 countries nowhave national biodiversity strategies and ac-tion plans. At the international level, nancialresources have been mobilized and progresshas been made in developing mechanisms orresearch, monitoring and scientic assessmento biodiversity.
Many actions in support o biodiversity havehad signicant and measurable results inparticular areas and amongst targeted spe-cies and ecosystems. This suggests that with
adequate resources and political will, thetools exist or loss o biodiversity to be re-duced at wider scales. For example, recentgovernment policies to curb deorestation havebeen ollowed by declining rates o orest lossin some tropical countries. Measures to controlalien invasive species have helped a numbero species to move to a lower extinction riskcategory. It has been estimated that at least 31bird species (out o 9,800) would have becomeextinct in the past century, in the absence o conservation measures.
However, action to implement the Conventionon Biological Diversity has not been takenon a sucient scale to address the pressureson biodiversity in most places. There hasbeen insucient integration o biodiversityissues into broader policies, strategies andprogrammes, and the underlying drivers o biodiversity loss have not been addressedsignicantly. Actions to promote the conserva-tion and sustainable use o biodiversity receivea tiny raction o unding compared to activi-ties aimed at promoting inrastructure and in-dustrial developments. Moreover, biodiversity
considerations are oten ignored when suchdevelopments are designed, and opportunities
8/8/2019 United Nations - Global Biodiversity Outlook 3 (2010)
http://slidepdf.com/reader/full/united-nations-global-biodiversity-outlook-3-2010 10/96
Global Biodiversity Outlook 3 | 10
to plan in ways that minimize unnecessarynegative impacts on biodiversity are missed.Actions to address the underlying drivers o biodiversity loss, including demographic, eco-
nomic, technological, socio-political and cul-tural pressures, in meaningul ways, have alsobeen limited.
Most uture scenarios project continuinghigh levels o extinctions and loss o habitatsthroughout this century, with associated de-cline o some ecosystem services important tohuman well-being.
For example:
✤ Tropical orests would continue to be cleared
in avour o crops and pastures, and poten-tially or biouel production.
✤ Climate change, the introduction o invasivealien species, pollution and dam constructionwould put urther pressure on reshwater bi-odiversity and the services it underpins.
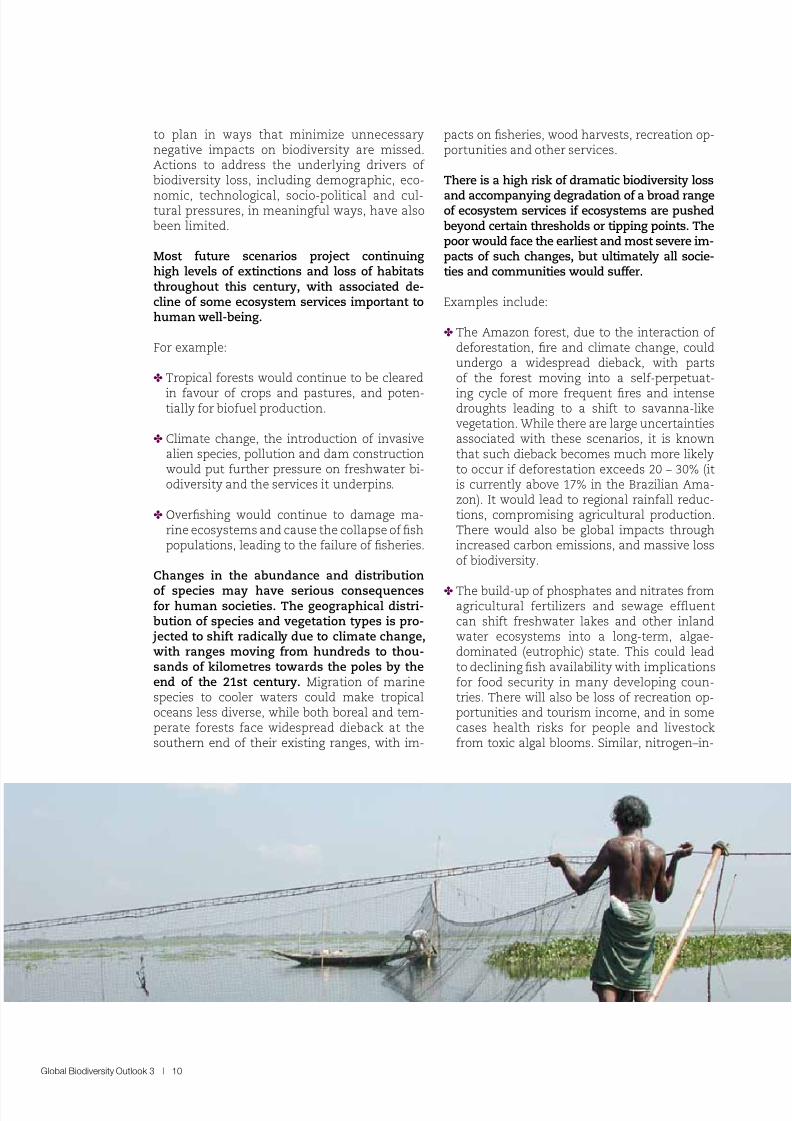
✤ Overshing would continue to damage ma-rine ecosystems and cause the collapse o shpopulations, leading to the ailure o sheries.
Changes in the abundance and distribution
o species may have serious consequencesor human societies. The geographical distri-bution o species and vegetation types is pro- jected to shit radically due to climate change,with ranges moving rom hundreds to thou-sands o kilometres towards the poles by theend o the 21st century. Migration o marinespecies to cooler waters could make tropicaloceans less diverse, while both boreal and tem-perate orests ace widespread dieback at thesouthern end o their existing ranges, with im-
pacts on sheries, wood harvests, recreation op-portunities and other services.
There is a high risk o dramatic biodiversity loss
and accompanying degradation o a broad rangeo ecosystem services i ecosystems are pushedbeyond certain thresholds or tipping points. Thepoor would ace the earliest and most severe im-pacts o such changes, but ultimately all socie-ties and communities would suer.
Examples include:
✤ The Amazon orest, due to the interaction o deorestation, re and climate change, couldundergo a widespread dieback, with partso the orest moving into a sel-perpetuat-
ing cycle o more requent res and intensedroughts leading to a shit to savanna-likevegetation. While there are large uncertaintiesassociated with these scenarios, it is knownthat such dieback becomes much more likelyto occur i deorestation exceeds 20 – 30% (itis currently above 17% in the Brazilian Ama-zon). It would lead to regional rainall reduc-tions, compromising agricultural production.There would also be global impacts throughincreased carbon emissions, and massive losso biodiversity.
✤ The build-up o phosphates and nitrates romagricultural ertilizers and sewage efuentcan shit reshwater lakes and other inlandwater ecosystems into a long-term, algae-dominated (eutrophic) state. This could leadto declining sh availability with implicationsor ood security in many developing coun-tries. There will also be loss o recreation op-portunities and tourism income, and in somecases health risks or people and livestockrom toxic algal blooms. Similar, nitrogen–in-
8/8/2019 United Nations - Global Biodiversity Outlook 3 (2010)
http://slidepdf.com/reader/full/united-nations-global-biodiversity-outlook-3-2010 11/96
Global Biodiversity Outlook 3 | 11
duced eutrophication phenomena in coastalenvironments lead to more oxygen-starveddead zones, with major economic losses re-sulting rom reduced productivity o sheries
and decreased tourism revenues.
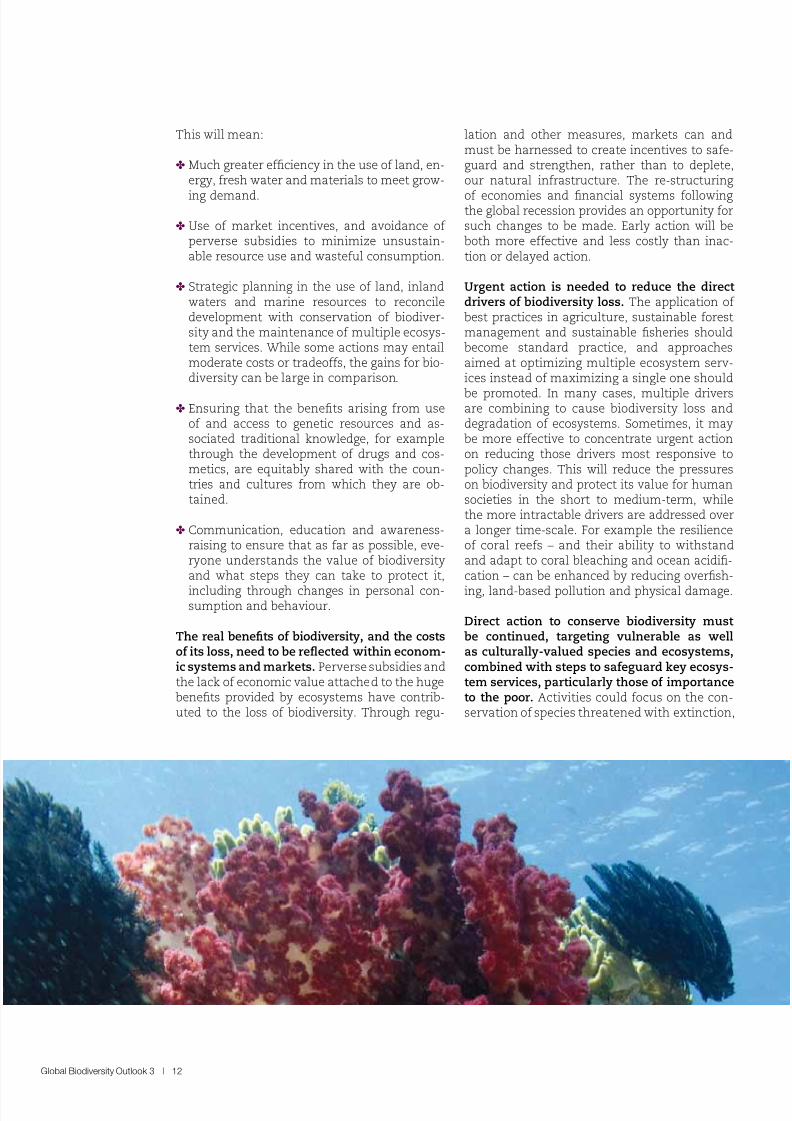
✤ The combined impacts o ocean acidication,warmer sea temperatures and other human-induced stresses make tropical coral ree eco-systems vulnerable to collapse. More acidicwater — brought about by higher carbon di-oxide concentrations in the atmosphere — de-creases the availability o the carbonate ionsrequired to build coral skeletons. Together withthe bleaching impact o warmer water, elevat-ed nutrient levels rom pollution, overshing,sediment deposition arising rom inland deor-
estation, and other pressures, rees worldwideincreasingly become algae-dominated withcatastrophic loss o biodiversity and ecosystemunctioning, threatening the livelihoods andood security o hundreds o millions o people.
There are greater opportunities than previ-ously recognized to address the biodiversitycrisis while contributing to other social objec-tives. For example, analyses conducted or thisOutlook identied scenarios in which climatechange is mitigated while maintaining and evenexpanding the current extent o orests and
other natural ecosystems (avoiding additionalhabitat loss rom the widespread deployment o biouels). Other opportunities include “rewild-ing” abandoned armland in some regions, andthe restoration o river basins and other wet-land ecosystems to enhance water supply, foodcontrol and the removal o pollutants.
Well-targeted policies ocusing on critical ar-eas, species and ecosystem services are es-sential to avoid the most dangerous impactson people and societies. Preventing urtherhuman-induced biodiversity loss or the near-
term uture will be extremely challenging, butbiodiversity loss may be halted and in someaspects reversed in the longer term, i urgent,concerted and eective action is initiated nowin support o an agreed long-term vision.Such action to conserve biodiversity and use itscomponents sustainably will reap rich rewards -through better health, greater ood security, lesspoverty and a greater capacity to cope with, andadapt to, environmental change.
Placing greater priority on biodiversity is centralto the success o development and poverty-alle-
viation measures. It is clear that continuing with
“business as usual” will jeopardize the uture o all human societies, and none more so than thepoorest who depend directly on biodiversity or aparticularly high proportion o their basic needs.
The loss o biodiversity is requently linked to theloss o cultural diversity, and has an especially highnegative impact on indigenous communities.
The linked challenges o biodiversity loss andclimate change must be addressed by policy-makers with equal priority and in close co-ordi-nation, i the most severe impacts o each are tobe avoided. Reducing the urther loss o carbon-storing ecosystems such as tropical orests, saltmarshes and peatlands will be a crucial step inlimiting the build-up o greenhouse gases in theatmosphere. At the same time, reducing other
pressures on ecosystems can increase their re-silience, make them less vulnerable to those im-pacts o climate change which are already una-voidable, and allow them to continue to provideservices to support people’s livelihoods and helpthem adapt to climate change.
Better protection o biodiversity should be seenas a prudent and cost-eective investment inrisk-avoidance or the global community. Theconsequences o abrupt ecosystem changes ona large scale aect human security to such anextent, that it is rational to minimize the risk o
triggering them - even i we are not clear aboutthe precise probability that they will occur. Eco-system degradation, and the consequent losso ecosystem services, has been identied asone o the main sources o disaster risk. Invest-ment in resilient and diverse ecosystems, ableto withstand the multiple pressures they aresubjected to, may be the best-value insurancepolicy yet devised.
Scientic uncertainty surrounding the preciseconnections between biodiversity and humanwell-being, and the unctioning o ecosystems,
should not be used as an excuse or inaction.No one can predict with accuracy how close weare to ecosystem tipping points, and how muchadditional pressure might bring them about.What is known rom past examples, however, isthat once an ecosystem shits to another state,it can be dicult or impossible to return it tothe ormer conditions on which economies andpatterns o settlement have been built or gen-erations.
Eective action to address biodiversity loss de-pends on addressing the underlying causes or
indirect drivers o that decline.
8/8/2019 United Nations - Global Biodiversity Outlook 3 (2010)
http://slidepdf.com/reader/full/united-nations-global-biodiversity-outlook-3-2010 12/96
Global Biodiversity Outlook 3 | 12
This will mean:
✤ Much greater eciency in the use o land, en-ergy, resh water and materials to meet grow-
ing demand.
✤ Use o market incentives, and avoidance o perverse subsidies to minimize unsustain-able resource use and wasteul consumption.
✤ Strategic planning in the use o land, inlandwaters and marine resources to reconciledevelopment with conservation o biodiver-sity and the maintenance o multiple ecosys-tem services. While some actions may entailmoderate costs or tradeos, the gains or bio-diversity can be large in comparison.
✤ Ensuring that the benets arising rom useo and access to genetic resources and as-sociated traditional knowledge, or examplethrough the development o drugs and cos-metics, are equitably shared with the coun-tries and cultures rom which they are ob-tained.
✤ Communication, education and awareness-raising to ensure that as ar as possible, eve-ryone understands the value o biodiversityand what steps they can take to protect it,
including through changes in personal con-sumption and behaviour.
The real benets o biodiversity, and the costso its loss, need to be refected within econom-ic systems and markets. Perverse subsidies andthe lack o economic value attached to the hugebenets provided by ecosystems have contrib-uted to the loss o biodiversity. Through regu-
lation and other measures, markets can andmust be harnessed to create incentives to sae-guard and strengthen, rather than to deplete,our natural inrastructure. The re-structuring
o economies and nancial systems ollowingthe global recession provides an opportunity orsuch changes to be made. Early action will beboth more eective and less costly than inac-tion or delayed action.
Urgent action is needed to reduce the directdrivers o biodiversity loss. The application o best practices in agriculture, sustainable orestmanagement and sustainable sheries shouldbecome standard practice, and approachesaimed at optimizing multiple ecosystem serv-ices instead o maximizing a single one should
be promoted. In many cases, multiple driversare combining to cause biodiversity loss anddegradation o ecosystems. Sometimes, it maybe more eective to concentrate urgent actionon reducing those drivers most responsive topolicy changes. This will reduce the pressureson biodiversity and protect its value or humansocieties in the short to medium-term, whilethe more intractable drivers are addressed overa longer time-scale. For example the resilienceo coral rees – and their ability to withstandand adapt to coral bleaching and ocean acidi-cation – can be enhanced by reducing oversh-
ing, land-based pollution and physical damage.
Direct action to conserve biodiversity mustbe continued, targeting vulnerable as wellas culturally-valued species and ecosystems,combined with steps to saeguard key ecosys-tem services, particularly those o importanceto the poor. Activities could ocus on the con-servation o species threatened with extinction,
8/8/2019 United Nations - Global Biodiversity Outlook 3 (2010)
http://slidepdf.com/reader/full/united-nations-global-biodiversity-outlook-3-2010 13/96
Global Biodiversity Outlook 3 | 13
those harvested or commercial purposes, orspecies o cultural signicance. They shouldalso ensure the protection o unctional eco-logical groups – that is, groups o species that
collectively perorm particular, essential roleswithin ecosystems, such as pollination, controlo herbivore numbers by top predators, cyclingo nutrients and soil ormation.
Increasingly, restoration o terrestrial, inlandwater and marine ecosystems will be neededto re-establish ecosystem unctioning and theprovision o valuable services. Economic analy-sis shows that ecosystem restoration can givegood economic rates o return. However thebiodiversity and associated services o restoredecosystems usually remain below the levels o
natural ecosystems. This reinorces the argu-ment that, where possible, avoiding degradationthrough conservation is preerable (and evenmore cost-eective) than restoration ater theevent.
Better decisions or biodiversity must be madeat all levels and in all sectors, in particularthe major economic sectors, and governmenthas a key enabling role to play. National pro-grammes or legislation can be crucial in creat-ing a avourable environment to support eec-tive “bottom-up” initiatives led by communities,
local authorities, or businesses. This also in-cludes empowering indigenous peoples and lo-cal communities to take responsibility or bio-diversity management and decision-making;and developing systems to ensure that the ben-ets arising rom access to genetic resourcesare equitably shared.
We can no longer see the continued loss o and changes to biodiversity as an issue sepa-rate rom the core concerns o society: to tacklepoverty, to improve the health, prosperity and
security o our populations, and to deal withclimate change. Each o those objectives is un-dermined by current trends in the state o ourecosystems, and each will be greatly strength-ened i we correctly value the role o biodiver-sity in supporting the shared priorities o theinternational community. Achieving this willinvolve placing biodiversity in the mainstreamo decision-making in government, the privatesector, and other institutions rom the local tointernational scales.
The action taken over the next decade or two,
and the direction charted under the Conven-tion on Biological Diversity, will determinewhether the relatively stable environmentalconditions on which human civilization hasdepended or the past 10,000 years will con-tinue beyond this century. I we ail to use thisopportunity, many ecosystems on the planetwill move into new, unprecedented states inwhich the capacity to provide or the needs o present and uture generations is highly un-certain.
8/8/2019 United Nations - Global Biodiversity Outlook 3 (2010)
http://slidepdf.com/reader/full/united-nations-global-biodiversity-outlook-3-2010 14/96
Global Biodiversity Outlook 3 | 14
Introduction
8/8/2019 United Nations - Global Biodiversity Outlook 3 (2010)
http://slidepdf.com/reader/full/united-nations-global-biodiversity-outlook-3-2010 15/96
Global Biodiversity Outlook 3 | 15
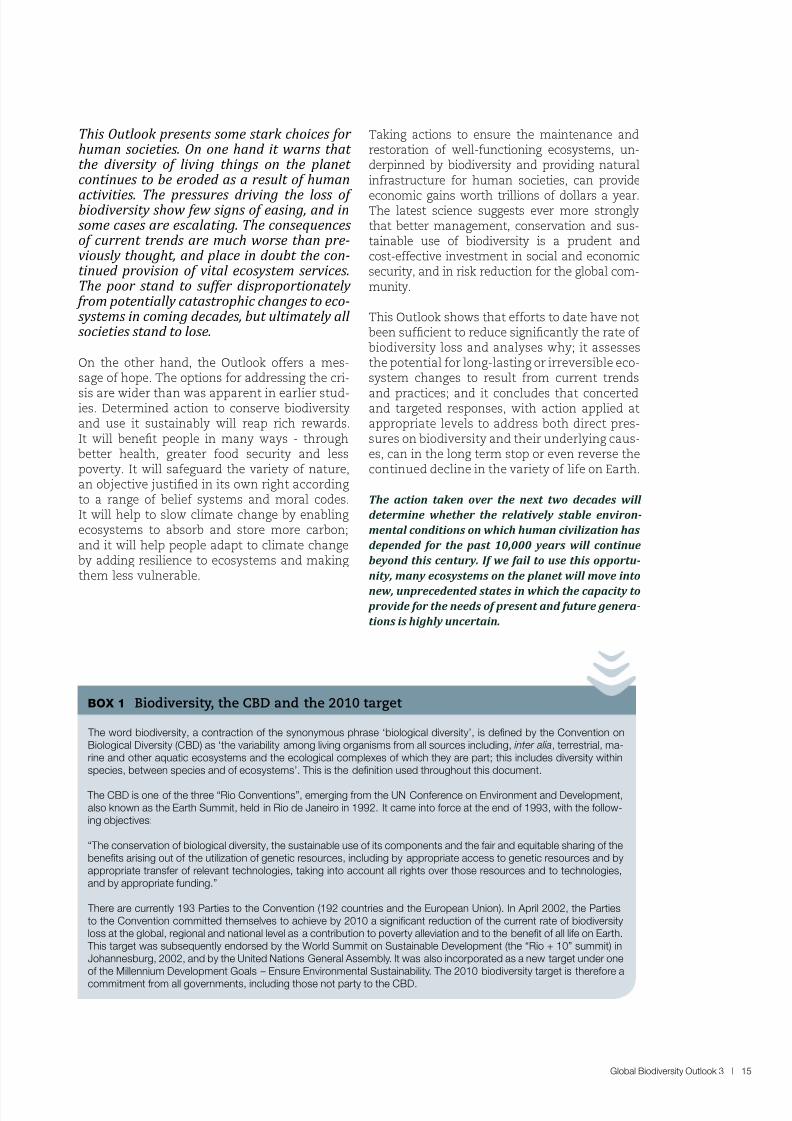
This Outlook presents some strk choices for humn societies. On one hnd it wrns tht the diversity of living things on the plnet continues to be eroded s result of humn
ctivities. The pressures driving the loss of biodiversity show few signs of esing, nd insome cses re esclting. The consequencesof current trends re much worse thn pre-viously thought, nd plce in doubt the con-tinued provision of vitl ecosystem services.The poor stnd to suffer disproportiontely from potentilly ctstrophic chnges to eco-systems in coming decdes, but ultimtely ll societies stnd to lose.
On the other hand, the Outlook oers a mes-sage o hope. The options or addressing the cri-
sis are wider than was apparent in earlier stud-ies. Determined action to conserve biodiversityand use it sustainably will reap rich rewards.It will benet people in many ways - throughbetter health, greater ood security and lesspoverty. It will saeguard the variety o nature,an objective justied in its own right accordingto a range o belie systems and moral codes.It will help to slow climate change by enablingecosystems to absorb and store more carbon;and it will help people adapt to climate changeby adding resilience to ecosystems and makingthem less vulnerable.
Taking actions to ensure the maintenance andrestoration o well-unctioning ecosystems, un-derpinned by biodiversity and providing naturalinrastructure or human societies, can provide
economic gains worth trillions o dollars a year.The latest science suggests ever more stronglythat better management, conservation and sus-tainable use o biodiversity is a prudent andcost-eective investment in social and economicsecurity, and in risk reduction or the global com-munity.
This Outlook shows that eorts to date have notbeen sucient to reduce signicantly the rate o biodiversity loss and analyses why; it assessesthe potential or long-lasting or irreversible eco-system changes to result rom current trends
and practices; and it concludes that concertedand targeted responses, with action applied atappropriate levels to address both direct pres-sures on biodiversity and their underlying caus-es, can in the long term stop or even reverse thecontinued decline in the variety o lie on Earth.
The action taken over the next two decades will
determine whether the relatively stable environ-
mental conditions on which human civilization has
depended for the past 10,000 years will continue
beyond this century. If we fail to use this opportu-
nity, many ecosystems on the planet will move into
new, unprecedented states in which the capacity to provide for the needs of present and future genera-
tions is highly uncertain.
BOX 1 Biodiversity, the CBD and the 2010 target
The word biodiversity, a contraction o the synonymous phrase ‘biological diversity’, is defned by the Convention onBiological Diversity (CBD) as ‘the variability among living organisms rom all sources including, inter alia, terrestrial, ma-rine and other aquatic ecosystems and the ecological complexes o which they are part; this includes diversity withinspecies, between species and o ecosystems’. This is the defnition used throughout this document.
The CBD is one o the three “Rio Conventions”, emerging rom the UN Conerence on Environment and Development,also known as the Earth Summit, held in Rio de Janeiro in 1992. It came into orce at the end o 1993, with the ollow-ing objectives:
“The conservation o biological diversity, the sustainable use o its components and the air and equitable sharing o thebenefts arising out o the utilization o genetic resources, including by appropriate access to genetic resources and byappropriate transer o relevant technologies, taking into account all rights over those resources and to technologies,and by appropriate unding.”
There are currently 193 Parties to the Convention (192 countries and the European Union). In April 2002, the Partiesto the Convention committed themselves to achieve by 2010 a signifcant reduction o the current rate o biodiversityloss at the global, regional and national level as a contribution to poverty alleviation and to the beneft o all lie on Earth. This target was subsequently endorsed by the World Summit on Sustainable Development (the “Rio + 10” summit) inJohannesburg, 2002, and by the United Nations General Assembly. It was also incorporated as a new target under oneo the Millennium Development Goals – Ensure Environmental Sustainability. The 2010 biodiversity target is thereore a
commitment rom all governments, including those not party to the CBD.
8/8/2019 United Nations - Global Biodiversity Outlook 3 (2010)
http://slidepdf.com/reader/full/united-nations-global-biodiversity-outlook-3-2010 16/96
Global Biodiversity Outlook 3 | 16
Biodiversityin 2010
8/8/2019 United Nations - Global Biodiversity Outlook 3 (2010)
http://slidepdf.com/reader/full/united-nations-global-biodiversity-outlook-3-2010 17/96
Global Biodiversity Outlook 3 | 17
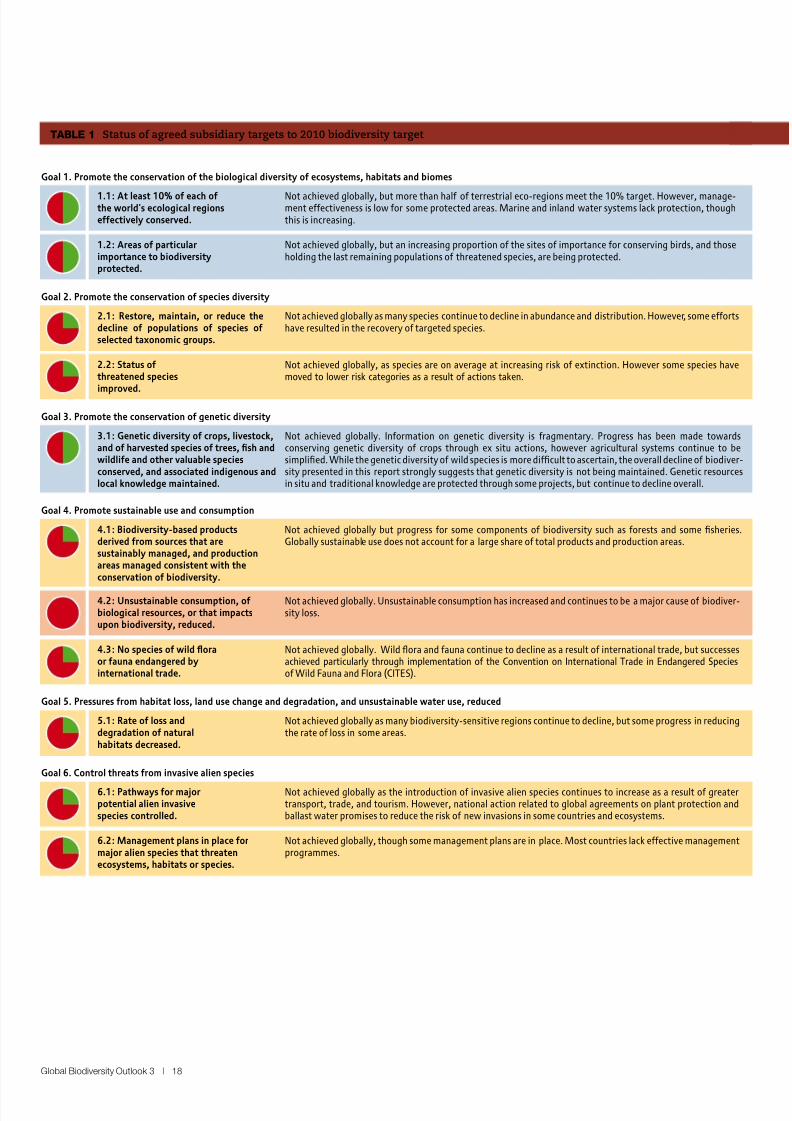
The 2010 biodiversity trget hs not been
met t the globl level. None of the twenty-one sub-trgets ccompnying the overll target of signiicantly reducing the rate of bi-odiversity loss by 2010 can be said deinitive-ly to hve been chieved globlly, lthoughsome hve been prtilly or loclly chieved.Despite n increse in conservtion efforts,the stte of biodiversity continues to decline,ccording to most indictors, lrgely becusethe pressures on biodiversity continue to in-crease. There is no indication of a signiicant reduction in the rte of decline in biodiversi-ty, nor of a signiicant reduction in pressures
upon it. However, negtive trends hve beenslowed or reversed in some ecosystems. Therere severl indictions tht responses to bio-diversity loss re incresing nd improving,although not yet on a scale suficient to affect overll negtive trends in the stte of biodi-versity or the pressures upon it.
When governments agreed to the 2010 targetor signicantly reducing the rate o biodiversityloss [See Box 1], a number o tools were put inplace within the Convention on Biological Di-versity and other conventions to help ocus ac-
tion towards achieving the target, to monitorprogress towards it, and eventually to determinewhether it had in act been achieved. Twenty-one sub-targets were dened, to be reached by2010 towards eleven principal goals related tobiodiversity.
While none o the sub-targets can be said de-
nitively to have been met, some have beenachieved partially or at regional or nationalscales [See Table 1]. In act, the 2010 biodiversitytarget has inspired action at many levels. Some170 countries now have national biodiversitystrategies and action plans [See Box 2 and Fig-ure 1]. Protected areas have been expanded innumber and extent, on both land and in coastalwaters. Environmental impact assessment ismore widely applied with most countries report-ing that they have some measures in place orits use.
Most countries are also undertaking activitiesrelated to communication, education and publicawareness as well biodiversity monitoring, re-search and the development o databases. At theinternational level, nancial resources have beenmobilized and progress has been made in devel-oping mechanisms or research, monitoring andscientic assessment o biodiversity.
Overview
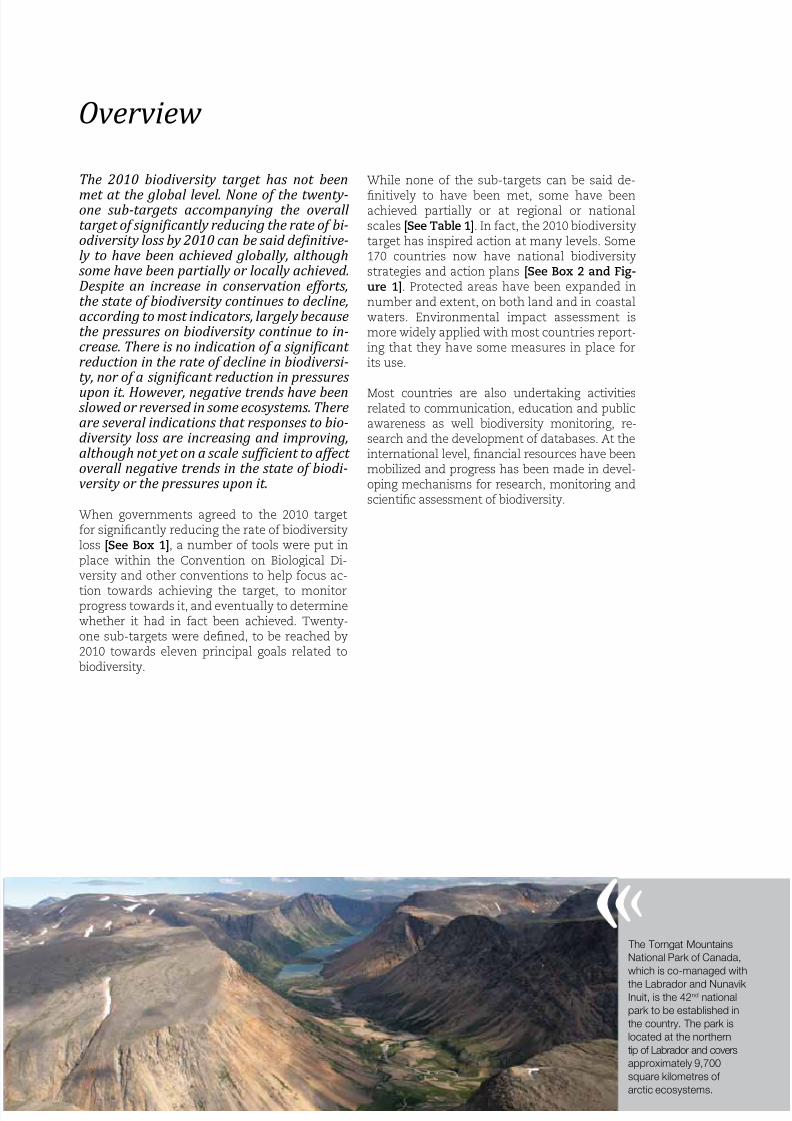
The Torngat MountainsNational Park o Canada,which is co-managed with
the Labrador and NunavikInuit, is the 42nd nationalpark to be established inthe country. The park islocated at the northerntip o Labrador and coversapproximately 9,700square kilometres o
8/8/2019 United Nations - Global Biodiversity Outlook 3 (2010)
http://slidepdf.com/reader/full/united-nations-global-biodiversity-outlook-3-2010 18/96
Global Biodiversity Outlook 3 | 18
TaBle 1 Status o agreed subsidiary targets to 2010 biodiversity target
Goal 1. Promote the conservation of the biological diversity of ecosystems, habitats and biomes
Not achieved globally, but more than half of terrestrial eco-regions meet the 10% target. However, manage-ment effectiveness is low for some protected areas. Marine and inland water systems lack protection, thoughthis is increasing.
1.1: At least 10% of each ofthe world's ecological regionseffectively conserved.
Goal 3. Promote the conservation of genetic diversity
Not achieved globally. Information on genetic diversity is fragmentary. Progress has been made towardsconserving genetic diversity of crops through ex situ actions, however agricultural systems continue to besimplified. While the genetic diversity of wild species is more difficult to ascertain, the overall decline of biodiver-sity presented in this report strongly suggests that genetic diversity is not being maintained. Genetic resourcesin situ and traditional knowledge are protected through some projects, but continue to decline overall.
3.1: Genetic diversity of crops, livestock,and of harvested species of trees, fish andwildlife and other valuable speciesconserved, and associated indigenous andlocal knowledge maintained.
Goal 4. Promote sustainable use and consumption
Not achieved globally but progress for some components of biodiversity such as forests and some fisheries.Globally sustainable use does not account for a large share of total products and production areas.
4.1: Biodiversity-based productsderived from sources that aresustainably managed, and productionareas managed consistent with theconservation of biodiversity.
Goal 5. Pressures from habitat loss, land use change and degradation, and unsustainable water use, reduced
Not achieved globally as many biodiversity-sensitive regions continue to decline, but some progress in reducingthe rate of loss in some areas.
5.1: Rate of loss anddegradation of naturalhabitats decreased.
Goal 6. Control threats from invasive alien species
Not achieved globally as the introduction of invasive alien species continues to increase as a result of greatertransport, trade, and tourism. However, national action related to global agreements on plant protection andballast water promises to reduce the risk of new invasions in some countries and ecosystems.
6.1: Pathways for majorpotential alien invasivespecies controlled.
Not achieved globally, though some management plans are in place. Most countries lack effective managementprogrammes.
6.2: Management plans in place formajor alien species that threatenecosystems, habitats or species.
Not achieved globally. Unsustainable consumption has increased and continues to be a major cause of biodiver-sity loss.
4.2: Unsustainable consumption, ofbiological resources, or that impactsupon biodiversity, reduced.
Not achieved globally. Wild flora and fauna continue to decline as a result of international trade, but successesachieved particularly through implementation of the Convention on International Trade in Endangered Speciesof Wild Fauna and Flora (CITES).
4.3: No species of wild floraor fauna endangered byinternational trade.
Not achieved globally, but an increasing proportion of the sites of importance for conserving birds, and thoseholding the last remaining populations of threatened species, are being protected.
1.2: Areas of particularimportance to biodiversityprotected.
Goal 2. Promote the conservation of species diversity
Not achieved globally as many species continue to decline in abundance and distribution. However, some effortshave resulted in the recovery of targeted species.
2.1: Restore, maintain, or reduce thedecline of populations of species ofselected taxonomic groups.
Not achieved globally, as species are on average at increasing risk of extinction. However some species havemoved to lower risk categories as a result of actions taken.
2.2: Status ofthreatened species
improved.
8/8/2019 United Nations - Global Biodiversity Outlook 3 (2010)
http://slidepdf.com/reader/full/united-nations-global-biodiversity-outlook-3-2010 19/96
Global Biodiversity Outlook 3 | 19
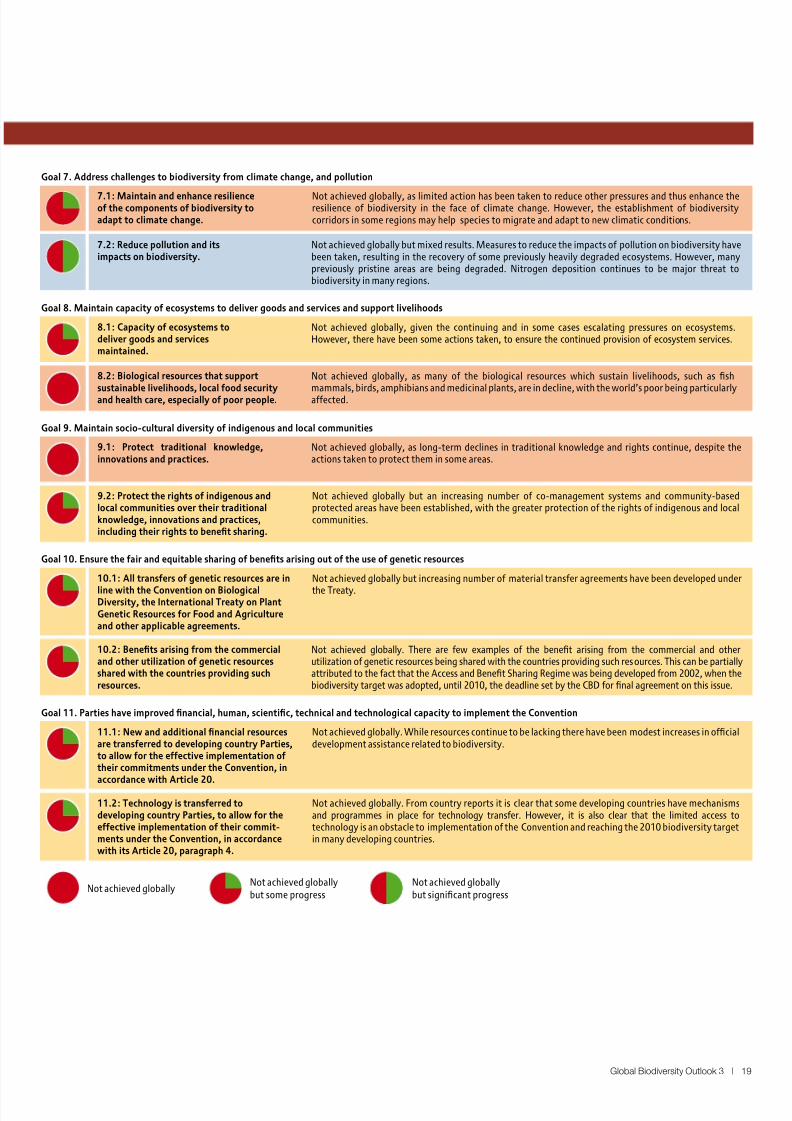
Goal 7. Address challenges to biodiversity from climate change, and pollution
Not achieved globally, as limited action has been taken to reduce other pressures and thus enhance theresilience of biodiversity in the face of climate change. However, the establishment of biodiversitycorridors in some regions may help species to migrate and adapt to new climatic conditions.
7.1: Maintain and enhance resilienceof the components of biodiversity toadapt to climate change.
Not achieved globally but mixed results. Measures to reduce the impacts of pollution on biodiversity havebeen taken, resulting in the recovery of some previously heavily degraded ecosystems. However, manypreviously pristine areas are being degraded. Nitrogen deposition continues to be major threat tobiodiversity in many regions.
7.2: Reduce pollution and itsimpacts on biodiversity.
Goal 8. Maintain capacity of ecosystems to deliver goods and services and support livelihoods
Not achieved globally, given the continuing and in some cases escalating pressures on ecosystems.However, there have been some actions taken, to ensure the continued provision of ecosystem services.
8.1: Capacity of ecosystems todeliver goods and servicesmaintained.
Goal 10. Ensure the fair and equitable sharing of benefits arising out of the use of genetic resources
Not achieved globally but increasing number of material transfer agreements have been developed under
the Treaty.
10.1: All transfers of genetic resources are in
line with the Convention on BiologicalDiversity, the International Treaty on PlantGenetic Resources for Food and Agricultureand other applicable agreements.
Goal 11. Parties have improved financial, human, scientific, technical and technological capacity to implement the Convention
Not achieved globally. There are few examples of the benefit arising from the commercial and otherutilization of genetic resources being shared with the countries providing such resources. This can be partiallyattributed to the fact that the Access and Benefit Sharing Regime was being developed from 2002, when thebiodiversity target was adopted, until 2010, the deadline set by the CBD for final agreement on this issue.
10.2: Benefits arising from the commercialand other utilization of genetic resourcesshared with the countries providing suchresources.
Not achieved globally. While resources continue to be lacking there have been modest increases in officialdevelopment assistance related to biodiversity.
11.1: New and additional financial resourcesare transferred to developing country Parties,to allow for the effective implementation oftheir commitments under the Convention, inaccordance with Article 20.
Not achieved globally. From country reports it is clear that some developing countries have mechanismsand programmes in place for technology transfer. However, it is also clear that the limited access totechnology is an obstacle to implementation of the Convention and reaching the 2010 biodiversity targetin many developing countries.
11.2: Technology is transferred todeveloping country Parties, to allow for theeffective implementation of their commit-ments under the Convention, in accordancewith its Article 20, paragraph 4.
Not achieved globally, as many of the biological resources which sustain livelihoods, such as fish
mammals, birds, amphibians and medicinal plants, are in decline, with the world’s poor being particularlyaffected.
8.2: Biological resources that support
sustainable livelihoods, local food securityand health care, especially of poor people.
Goal 9. Maintain socio-cultural diversity of indigenous and local communities
Not achieved globally, as long-term declines in traditional knowledge and rights continue, despite theactions taken to protect them in some areas.
9.1: Protect traditional knowledge,innovations and practices.
Not achieved globally but an increasing number of co-management systems and community-basedprotected areas have been established, with the greater protection of the rights of indigenous and localcommunities.
9.2: Protect the rights of indigenous andlocal communities over their traditionalknowledge, innovations and practices,including their rights to benefit sharing.
Not achieved globallyNot achieved globallybut some progress
Not achieved globallybut significant progress
8/8/2019 United Nations - Global Biodiversity Outlook 3 (2010)
http://slidepdf.com/reader/full/united-nations-global-biodiversity-outlook-3-2010 20/96
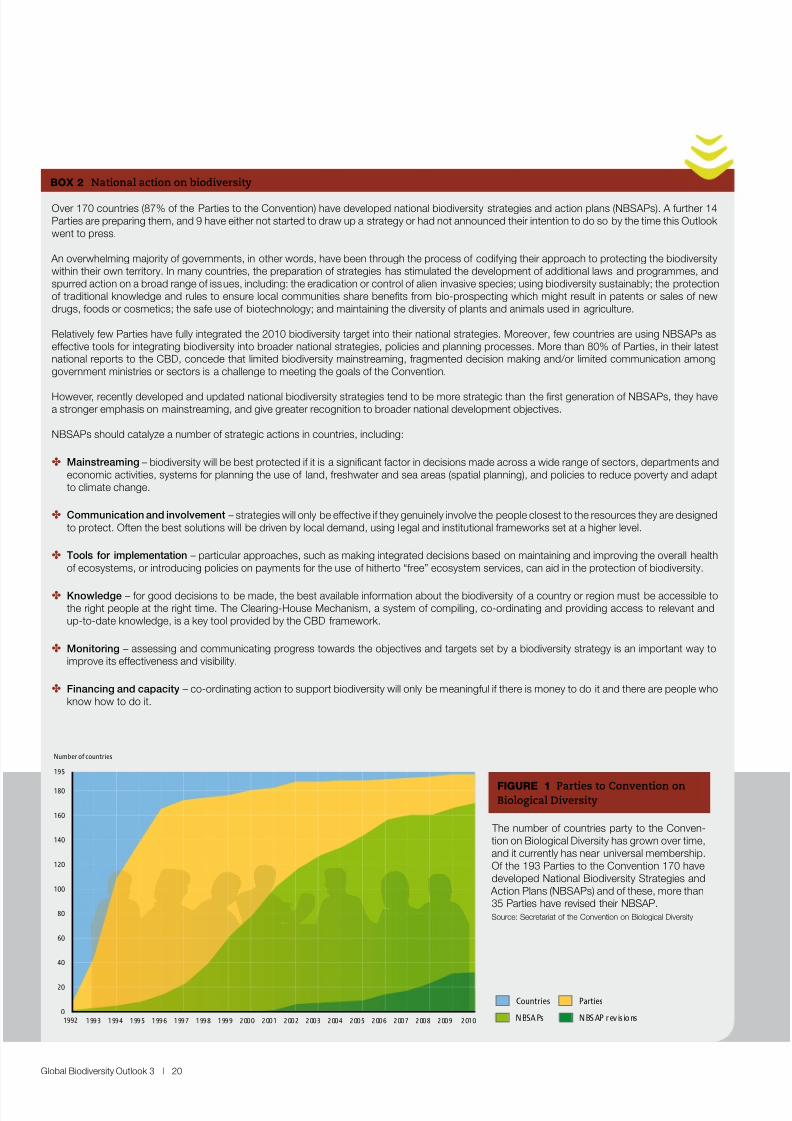
Over 170 countries (87% o the Parties to the Convention) have developed national biodiversity strategies and action plans (NBSAPs). A urther 14Parties are preparing them, and 9 have either not started to draw up a strategy or had not announced their intention to do so by the time this Outlookwent to press.
An overwhelming majority o governments, in other words, have been through the process o codiying their approach to protecting the biodiversitywithin their own territory. In many countries, the preparation o strategies has stimulated the development o additional laws and programmes, andspurred action on a broad range o issues, including: the eradication or control o alien invasive species; using biodiversity sustainably; the protectiono traditional knowledge and rules to ensure local communities share benefts rom bio-prospecting which might result in patents or sales o newdrugs, oods or cosmetics; the sae use o biotechnology; and maintaining the diversity o plants and animals used in agriculture.
Relatively ew Parties have ully integrated the 2010 biodiversity target into their national strategies. Moreover, ew countries are using NBSAPs aseective tools or integrating biodiversity into broader national strategies, policies and planning processes. More than 80% o Parties, in their latestnational reports to the CBD, concede that limited biodiversity mainstreaming, ragmented decision making and/or limited communication amonggovernment ministries or sectors is a challenge to meeting the goals o the Convention.
However, recently developed and updated national biodiversity strategies tend to be more strategic than the frst generation o NBSAPs, they havea stronger emphasis on mainstreaming, and give greater recognition to broader national development objectives.
NBSAPs should catalyze a number o strategic actions in countries, including:
✤ Mainstreaming – biodiversity will be best protected i it is a signifcant actor in decisions made across a wide range o sectors, departments andeconomic activities, systems or planning the use o land, reshwater and sea areas (spatial planning), and policies to reduce poverty and adaptto climate change.
✤ Communication and involvement – strategies will only be eective i they genuinely involve the people closest to the resources they are designedto protect. Oten the best solutions will be driven by local demand, using legal and institutional rameworks set at a higher level.
✤ Tools or implementation – particular approaches, such as making integrated decisions based on maintaining and improving the overall healtho ecosystems, or introducing policies on payments or the use o hitherto “ree” ecosystem services, can aid in the protection o biodiversity.
✤ Knowledge – or good decisions to be made, the best available inormation about the biodiversity o a country or region must be accessible tothe right people at the right time. The Clearing-House Mechanism, a system o compiling, co-ordinating and providing access to relevant andup-to-date knowledge, is a key tool provided by the CBD ramework.
✤ Monitoring – assessing and communicating progress towards the objectives and targets set by a biodiversity strategy is an important way toimprove its eectiveness and visibility.
✤ Financing and capacity – co-ordinating action to support biodiversity will only be meaningul i there is money to do it and there are people whoknow how to do it.
BOX 2 National action on biodiversity
1992 1993 1994 1995 1996 1997 1998 1999 2000 2001 2002 2003 2004 2005 2006 2007 2008 2009 2010
0
20
40
60
80
100
120
140
160
180
195
Number of countries
The number o countries party to the Conven-tion on Biological Diversity has grown over time,and it currently has near universal membership.O the 193 Parties to the Convention 170 havedeveloped National Biodiversity Strategies and Action Plans (NBSAPs) and o these, more than35 Parties have revised their NBSAP.Source: Secretariat o the Convention on Biological Diversity
FIGURe 1 Parties to Convention onBiological Diversity
Global Biodiversity Outlook 3 | 20
NBSAPs NBSAP revis ions
Parties
Countries
8/8/2019 United Nations - Global Biodiversity Outlook 3 (2010)
http://slidepdf.com/reader/full/united-nations-global-biodiversity-outlook-3-2010 21/96
Global Biodiversity Outlook 3 | 21
There is no single measurement that captures
the current status or trends in global biodiversity.Thereore a range o indicators was developedor the Convention on Biological Diversity, to pro-vide scientically rigorous assessments o trendsin the state o the various components o biodi-versity (genes, populations, species, ecosystems);the pressures being imposed upon it; and theresponses being adopted to address biodiversityloss. Ten o the teen headline indicators showtrends unavourable or biodiversity [See Table2]. Yet, or certain indicators the amount andcoverage o data is not sucient to make state-ments with condence. The assessment o status
and trends o biodiversity on the ollowing pagesthereore relies on multiple lines o evidence,including scientic literature and recent assess-ments, as well as national reports rom the Par-ties to the Convention. Not a single governmentin the latest reports submitted to the CBD claimsthat the 2010 biodiversity target has been com-pletely met at the national level. Around one inve governments state explicitly that they havemissed the target.
Although the evidence does not show a signi-
cant decline in the rate o biodiversity loss, someinterventions have had a measurable, positiveimpact by making the decline less severe than itwould otherwise have been. For example, it is es-timated that 31 bird species, out o a total o some9,800, would have become extinct in the absenceo conservation actions.
Missing the 2010 target has serious implicationsor human societies. Biodiversity underpins awide range o services that support economies,ood production systems and secure living condi-tions [See Box 3]. The loss o biodiversity (at the
genetic, species and ecosystem levels) also aectshuman health in many ways.
Projections o the impacts o continued biodi-versity loss, some associated costs and how theymight be avoided, are outlined in this synthesis.First, the current status and trends o biodiversity,the pressures upon it and responses to its loss aredescribed in more detail.
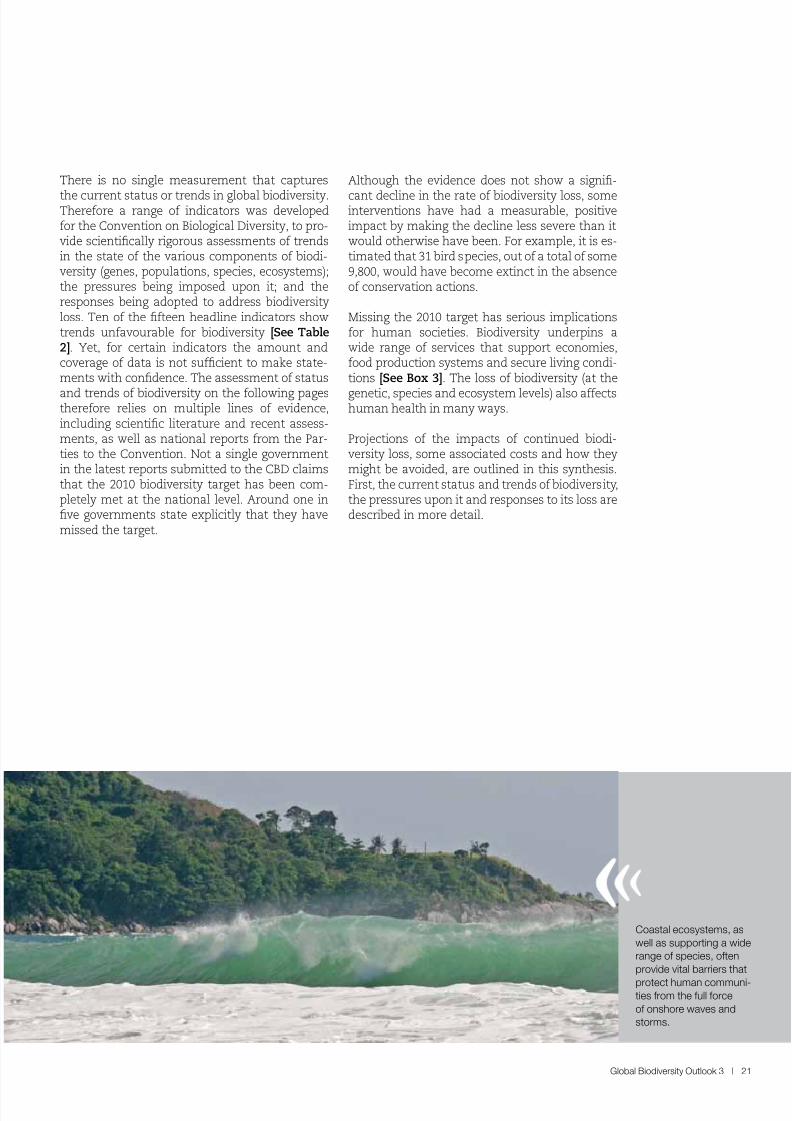
Coastal ecosystems, aswell as supporting a widerange o species, otenprovide vital barriers that
protect human communi-ties rom the ull orceo onshore waves andstorms.
8/8/2019 United Nations - Global Biodiversity Outlook 3 (2010)
http://slidepdf.com/reader/full/united-nations-global-biodiversity-outlook-3-2010 22/96
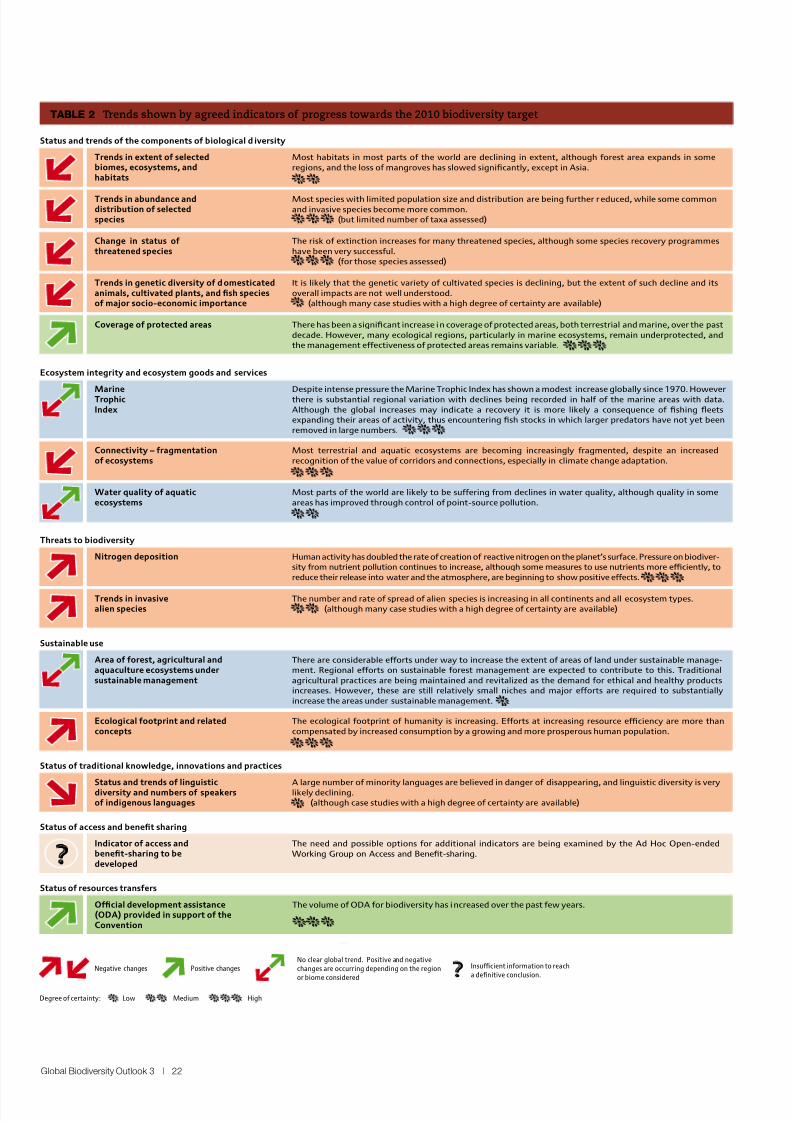
Global Biodiversity Outlook 3 | 22
?
Most species with limited population size and distribution are being further reduced, while some commonand invasive species become more common. (but limited number of taxa assessed)
Status and trends of the components of biological diversity
Most habitats in most parts of the world are declining in extent, although forest area expands in someregions, and the loss of mangroves has slowed significantly, except in Asia.
Trends in extent of selectedbiomes, ecosystems, andhabitats
There has been a significant increase in coverage of protected areas, both terrestrial and marine, over the pastdecade. However, many ecological regions, particularly in marine ecosystems, remain underprotected, andthe management effectiveness of protected areas remains variable.
Coverage of protected areas
Ecosystem integrity and ecosystem goods and services
Despite intense pressure the Marine Trophic Index has shown a modest increase globally since 1970. Howeverthere is substantial regional variation with declines being recorded in half of the marine areas with data.Although the global increases may indicate a recovery it is more likely a consequence of fishing fleetsexpanding their areas of activity, thus encountering fish stocks in which larger predators have not yet beenremoved in large numbers.
MarineTrophicIndex
Threats to biodiversity
Human activity has doubled the rate of creation of reactive nitrogen on the planet’s surface. Pressure on biodiver-sity from nutrient pollution continues to increase, although some measures to use nutrients more efficiently, toreduce their release into water and the atmosphere, are beginning to show positive effects.
Nitrogen deposition
Status of traditional knowledge, innovations and practices
A large number of minority languages are believed in danger of disappearing, and linguistic diversity is verylikely declining.(although case studies with a high degree of certainty are available)
Status and trends of linguisticdiversity and numbers of speakersof indigenous languages
Status of access and benefit sharing
The need and possible options for additional indicators are being examined by the Ad Hoc Open-endedWorking Group on Access and Benefit-sharing.
Indicator of access andbenefit-sharing to bedeveloped
Status of resources transfers
The volume of ODA for biodiversity has increased over the past few years.Official development assistance(ODA) provided in support of theConvention
The number and rate of spread of alien species is increasing in all continents and all ecosystem types. (although many case studies with a high degree of certainty are available)
Trends in invasivealien species
Sustainable use
There are considerable efforts under way to increase the extent of areas of land under sustainable manage-ment. Regional efforts on sustainable forest management are expected to contribute to this. Traditionalagricultural practices are being maintained and revitalized as the demand for ethical and healthy productsincreases. However, these are still relatively small niches and major efforts are required to substantiallyincrease the areas under sustainable management.
Area of forest, agricultural andaquaculture ecosystems undersustainable management
The ecological footprint of humanity is increasing. Efforts at increasing resource efficiency are more thancompensated by increased consumption by a growing and more prosperous human population.
Ecological footprint and relatedconcepts
Most terrestrial and aquatic ecosystems are becoming increasingly fragmented, despite an increasedrecognition of the value of corridors and connections, especially in climate change adaptation.
Connectivity – fragmentationof ecosystems
Most parts of the world are likely to be suffering from declines in water quality, although quality in someareas has improved through control of point-source pollution.
Water quality of aquaticecosystems
Trends in abundance anddistribution of selectedspecies
The risk of extinction increases for many threatened species, although some species recovery programmeshave been very successful. (for those species assessed)
Change in status ofthreatened species
It is likely that the genetic variety of cultivated species is declining, but the extent of such decline and itsoverall impacts are not well understood. (although many case studies with a high degree of certainty are available)
Trends in genetic diversity of domesticatedanimals, cultivated plants, and fish speciesof major socio-economic importance
TaBle 2 Trends shown by agreed indicators o progress towards the 2010 biodiversity target
Negative changes Positive changes ?Insufficient information to reacha definitive conclusion.
No clear global trend. Positive and negativechanges are occurring depending on the regionor biome considered
Low Medium HighDegree of certainty:
8/8/2019 United Nations - Global Biodiversity Outlook 3 (2010)
http://slidepdf.com/reader/full/united-nations-global-biodiversity-outlook-3-2010 23/96
Global Biodiversity Outlook 3 | 23
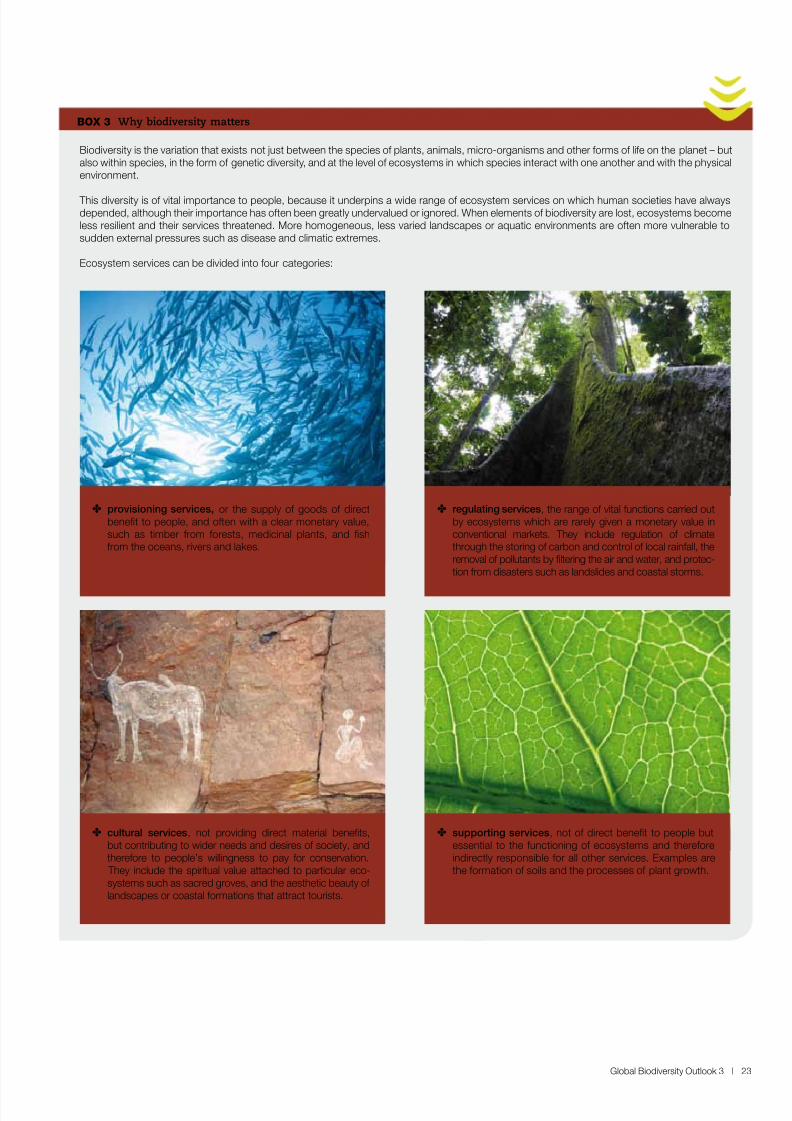
BOX 3 Why biodiversity matters
Biodiversity is the variation that exists not just between the species o plants, animals, micro-organisms and other orms o lie on the planet – butalso within species, in the orm o genetic diversity, and at the level o ecosystems in which species interact with one another and with the physicalenvironment.
This diversity is o vital importance to people, because it underpins a wide range o ecosystem services on which human societies have alwaysdepended, although their importance has oten been greatly undervalued or ignored. When elements o biodiversity are lost, ecosystems becomeless resilient and their services threatened. More homogeneous, less varied landscapes or aquatic environments are oten more vulnerable tosudden external pressures such as disease and climatic extremes.
Ecosystem services can be divided into our categories:
✤ provisioning services, or the supply o goods o directbeneft to people, and oten with a clear monetary value,such as timber rom orests, medicinal plants, and fshrom the oceans, rivers and lakes.
✤ cultural services, not providing direct material benefts,but contributing to wider needs and desires o society, andthereore to people’s willingness to pay or conservation. They include the spiritual value attached to particular eco-systems such as sacred groves, and the aesthetic beauty o landscapes or coastal ormations that attract tourists.
✤ regulating services, the range o vital unctions carried outby ecosystems which are rarely given a monetary value inconventional markets. They include regulation o climatethrough the storing o carbon and control o local rainall, theremoval o pollutants by fltering the air and water, and protec-tion rom disasters such as landslides and coastal storms.
✤ supporting services, not o direct beneft to people butessential to the unctioning o ecosystems and thereoreindirectly responsible or all other services. Examples arethe ormation o soils and the processes o plant growth.
8/8/2019 United Nations - Global Biodiversity Outlook 3 (2010)
http://slidepdf.com/reader/full/united-nations-global-biodiversity-outlook-3-2010 24/96
Global Biodiversity Outlook 3 | 24
Species popultions nd extinction risks
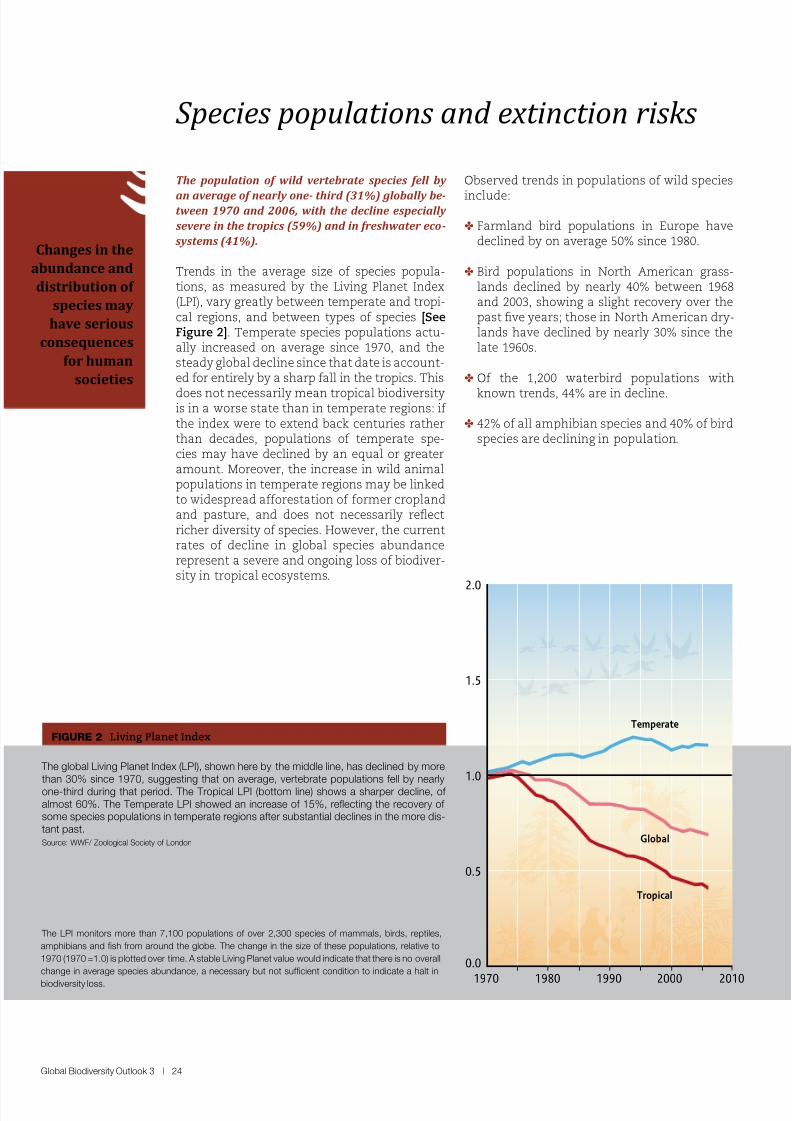
The population of wild vertebrate species fell by
an average of nearly one- third (31%) globally be-tween 1970 and 2006, with the decline especially
severe in the tropics (59%) and in freshwater eco-
systems (41%).
Trends in the average size o species popula-tions, as measured by the Living Planet Index(LPI), vary greatly between temperate and tropi-cal regions, and between types o species [SeeFigure 2]. Temperate species populations actu-ally increased on average since 1970, and thesteady global decline since that date is account-ed or entirely by a sharp all in the tropics. This
does not necessarily mean tropical biodiversityis in a worse state than in temperate regions: i the index were to extend back centuries ratherthan decades, populations o temperate spe-cies may have declined by an equal or greateramount. Moreover, the increase in wild animalpopulations in temperate regions may be linkedto widespread aorestation o ormer croplandand pasture, and does not necessarily refectricher diversity o species. However, the currentrates o decline in global species abundancerepresent a severe and ongoing loss o biodiver-sity in tropical ecosystems.
Observed trends in populations o wild species
include:
✤ Farmland bird populations in Europe havedeclined by on average 50% since 1980.
✤ Bird populations in North American grass-lands declined by nearly 40% between 1968and 2003, showing a slight recovery over thepast ve years; those in North American dry-lands have declined by nearly 30% since thelate 1960s.
✤ O the 1,200 waterbird populations with
known trends, 44% are in decline.
✤ 42% o all amphibian species and 40% o birdspecies are declining in population.
Changes in the
abundance and
distribution of
species may
have serious
consequences
for human
societies
FIGURe 2 Living Planet Index
1970 1980 1990
Temperate
Global
Tropical
0.5
1.0
1.5
2.0
2000 2010
0.0
The global Living Planet Index (LPI), shown here by the middle line, has declined by morethan 30% since 1970, suggesting that on average, vertebrate populations ell by nearlyone-third during that period. The Tropical LPI (bottom line) shows a sharper decline, o almost 60%. The Temperate LPI showed an increase o 15%, reecting the recovery o some species populations in temperate regions ater substantial declines in the more dis-tant past.Source: WWF/ Zoological Society o London
The LPI monitors more than 7,100 populations o over 2,300 species o mammals, birds, reptiles,
amphibians and fsh rom around the globe. The change in the size o these populations, relative to
1970 (1970 =1.0) is plotted over time. A stable Living Planet value would indicate that there is no overall
change in average species abundance, a necessary but not sufcient condition to indicate a halt in
biodiversity loss.
8/8/2019 United Nations - Global Biodiversity Outlook 3 (2010)
http://slidepdf.com/reader/full/united-nations-global-biodiversity-outlook-3-2010 25/96
Global Biodiversity Outlook 3 | 25
8/8/2019 United Nations - Global Biodiversity Outlook 3 (2010)
http://slidepdf.com/reader/full/united-nations-global-biodiversity-outlook-3-2010 26/96
Global Biodiversity Outlook 3 | 26
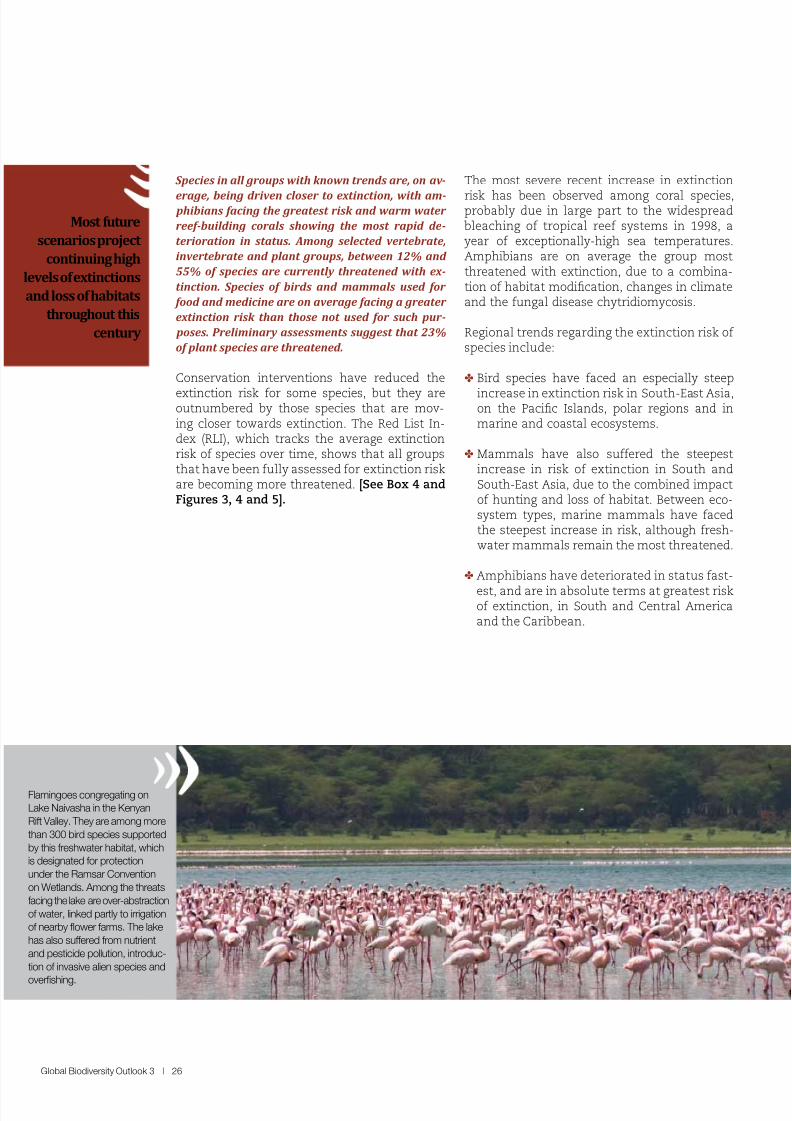
Species in all groups with known trends are, on av -
erage, being driven closer to extinction, with am- phibians facing the greatest risk and warm water
reef-building corals showing the most rapid de-
terioration in status. Among selected vertebrate,
invertebrate and plant groups, between 12% and
55% of species are currently threatened with ex -
tinction. Species of birds and mammals used for
food and medicine are on average facing a greater
extinction risk than those not used for such pur -
poses. Preliminary assessments suggest that 23%
of plant species are threatened.
Conservation interventions have reduced the
extinction risk or some species, but they areoutnumbered by those species that are mov-ing closer towards extinction. The Red List In-dex (RLI), which tracks the average extinctionrisk o species over time, shows that all groupsthat have been ully assessed or extinction riskare becoming more threatened. [See Box 4 andFigures 3, 4 and 5].
The most severe recent increase in extinction
risk has been observed among coral species,probably due in large part to the widespreadbleaching o tropical ree systems in 1998, ayear o exceptionally-high sea temperatures.Amphibians are on average the group mostthreatened with extinction, due to a combina-tion o habitat modication, changes in climateand the ungal disease chytridiomycosis.
Regional trends regarding the extinction risk o species include:
✤ Bird species have aced an especially steep
increase in extinction risk in South-East Asia,on the Pacic Islands, polar regions and inmarine and coastal ecosystems.
✤ Mammals have also suered the steepestincrease in risk o extinction in South andSouth-East Asia, due to the combined impacto hunting and loss o habitat. Between eco-system types, marine mammals have acedthe steepest increase in risk, although resh-water mammals remain the most threatened.
✤ Amphibians have deteriorated in status ast-
est, and are in absolute terms at greatest risko extinction, in South and Central Americaand the Caribbean.
Most future
scenarios project
continuing high
vels of extinctions
nd loss of habitats
throughout this
century
amingoes congregating onake Naivasha in the Kenyanit Valley. They are among more
han 300 bird species supportedy this reshwater habitat, whichdesignated or protection
nder the Ramsar Conventionn Wetlands. Among the threats
acing the lake are over-abstraction water, linked partly to irrigation nearby ower arms. The lakeas also suered rom nutrientnd pesticide pollution, introduc-on o invasive alien species and
verfshing.
8/8/2019 United Nations - Global Biodiversity Outlook 3 (2010)
http://slidepdf.com/reader/full/united-nations-global-biodiversity-outlook-3-2010 27/96
Global Biodiversity Outlook 3 | 27
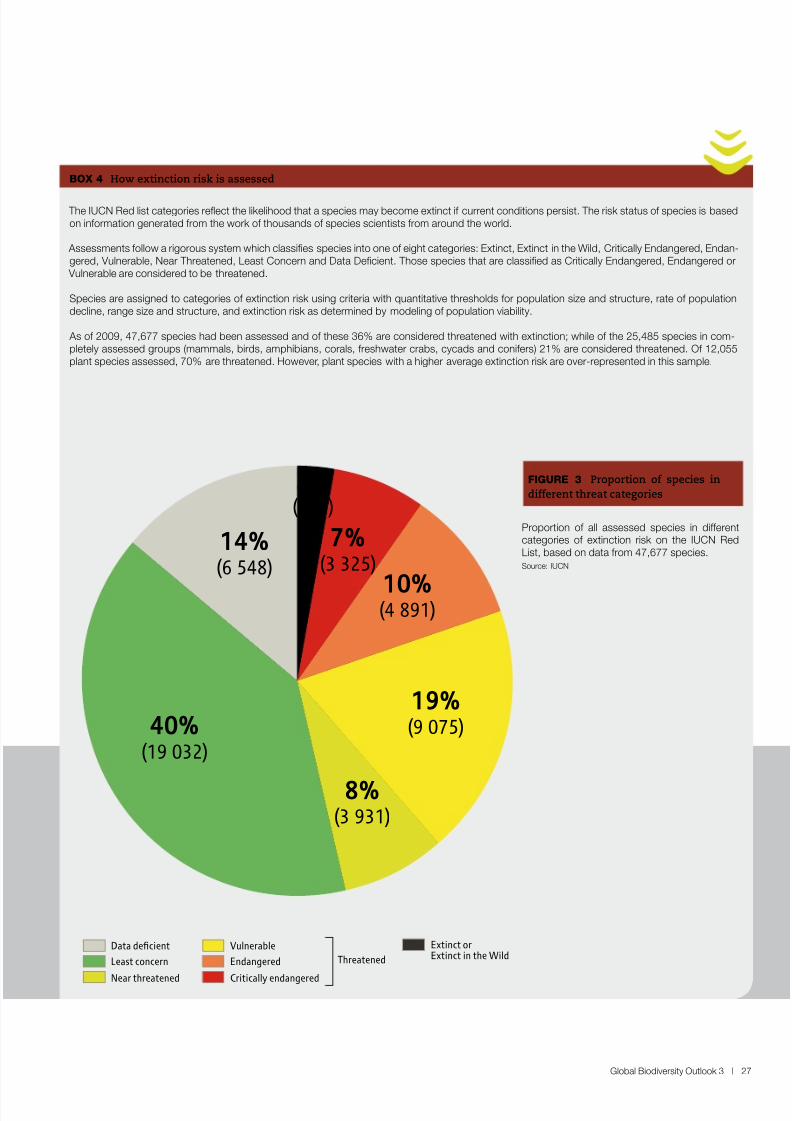
FIGURe 3 Proportion o species in
dierent threat categories
Proportion o all assessed species in dierentcategories o extinction risk on the IUCN RedList, based on data rom 47,677 species.Source: IUCN
40%
(19 032)
2%
(875)
7%
(3 325)
10%(4 891)
19%
(9 075)
8%(3 931)
14%
(6 548)
The IUCN Red list categories reect the likelihood that a species may become extinct i current conditions persist. The risk status o species is basedon inormation generated rom the work o thousands o species scientists rom around the world.
Assessments ollow a rigorous system which classifes species into one o eight categories: Extinct, Extinct in the Wild, Critically Endangered, Endan-gered, Vulnerable, Near Threatened, Least Concern and Data Defcient. Those species that are classifed as Critically Endangered, Endangered or Vulnerable are considered to be threatened.
Species are assigned to categories o extinction risk using criteria with quantitative thresholds or population size and structure, rate o populationdecline, range size and structure, and extinction risk as determined by modeling o population viability.
As o 2009, 47,677 species had been assessed and o these 36% are considered threatened with extinction; while o the 25,485 species in com-pletely assessed groups (mammals, birds, amphibians, corals, reshwater crabs, cycads and coniers) 21% are considered threatened. O 12,055plant species assessed, 70% are threatened. However, plant species with a higher average extinction risk are over-represented in this sample.
BOX 4 How extinction risk is assessed
Data deficient
Least concern
Near threatened
Vulnerable
Endangered
Critically endangered
Threatened
Extinct orExtinct in the Wild
8/8/2019 United Nations - Global Biodiversity Outlook 3 (2010)
http://slidepdf.com/reader/full/united-nations-global-biodiversity-outlook-3-2010 28/96
Global Biodiversity Outlook 3 | 28
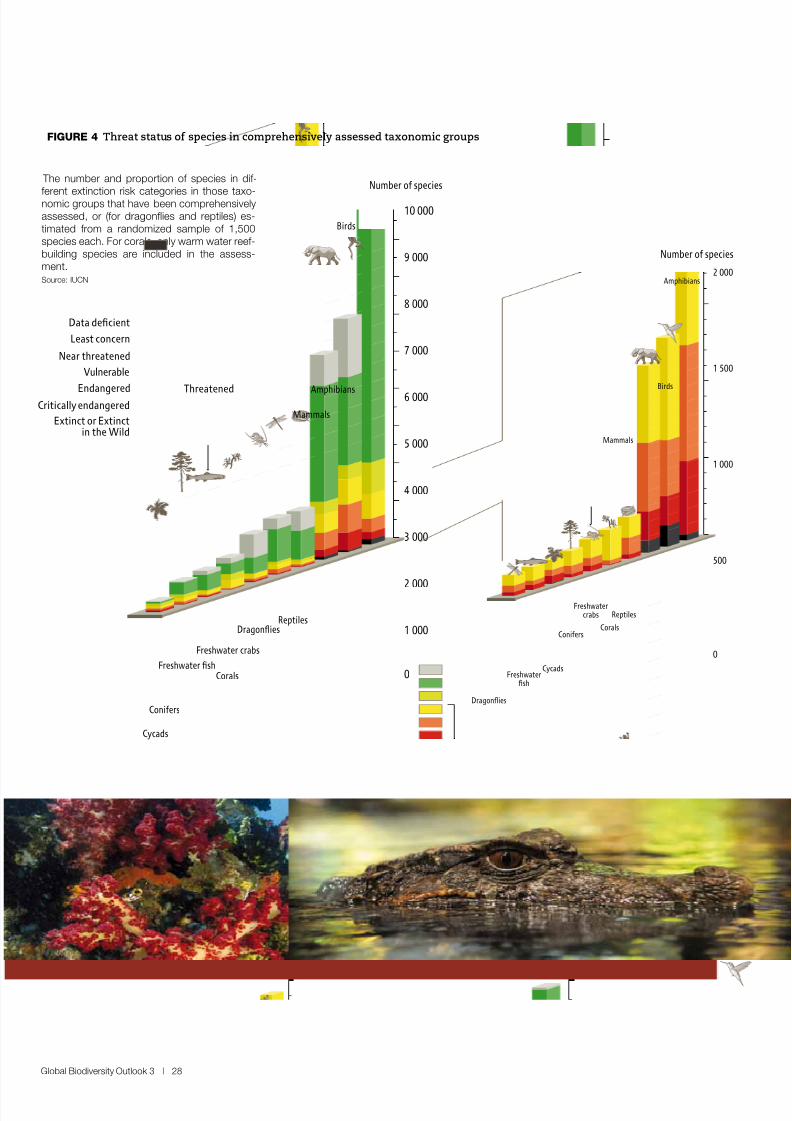
The number and proportion o species in di-
erent extinction risk categories in those taxo-nomic groups that have been comprehensivelyassessed, or (or dragonies and reptiles) es-timated rom a randomized sample o 1,500species each. For corals, only warm water ree-building species are included in the assess-ment.Source: IUCN
FIGURe 4 Threat status o species in comprehensively assessed taxonomic groups
0
2 000
4 000
6 000
8 000
10 000
1 000
3 000
5 000
7 000
9 000
Birds
Mammals
Dragonflies
Freshwater crabs
CoralsFreshwater fish
Cycads
Conifers
Number of species
Number of species
Reptiles
Amphibians
0
500
1 000
1 500
2 000
Birds
Amphibians
Mammals
Dragonflies
ReptilesFreshwater
crabs
Corals
Freshwaterfish
Cycads
Conifers
Vulnerable
EndangeredCritically endangered
Data deficient
Least concern
Near threatened
Extinct or Extinctin the Wild
Threatened
8/8/2019 United Nations - Global Biodiversity Outlook 3 (2010)
http://slidepdf.com/reader/full/united-nations-global-biodiversity-outlook-3-2010 29/96
Global Biodiversity Outlook 3 | 29
Birds
Mammals
Corals
Amphibians
1980 1985 1990 1995 2000 2005 2010
0.70
0.75
0.80
0.85
0.90
0.95
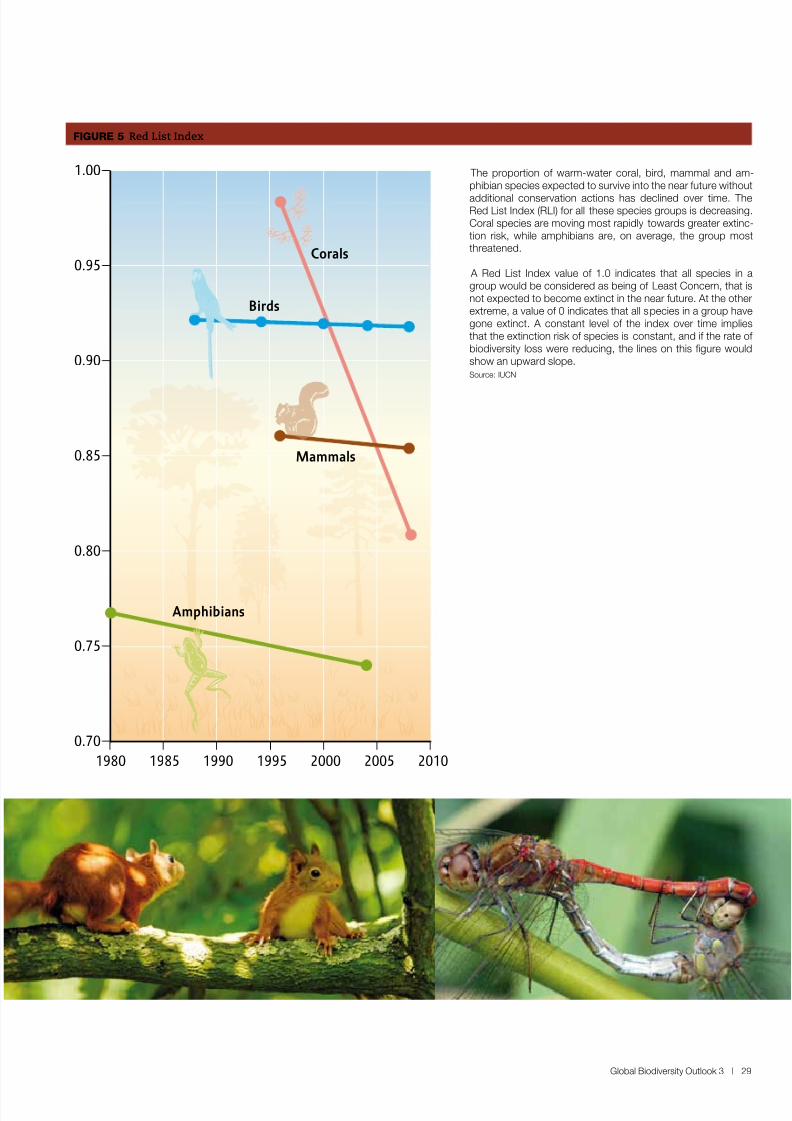
1.00 The proportion o warm-water coral, bird, mammal and am-phibian species expected to survive into the near uture without
additional conservation actions has declined over time. TheRed List Index (RLI) or all these species groups is decreasing.Coral species are moving most rapidly towards greater extinc-tion risk, while amphibians are, on average, the group mostthreatened.
A Red List Index value o 1.0 indicates that all species in agroup would be considered as being o Least Concern, that isnot expected to become extinct in the near uture. At the otherextreme, a value o 0 indicates that all species in a group havegone extinct. A constant level o the index over time impliesthat the extinction risk o species is constant, and i the rate o biodiversity loss were reducing, the lines on this fgure wouldshow an upward slope.Source: IUCN
FIGURe 5 Red List Index
8/8/2019 United Nations - Global Biodiversity Outlook 3 (2010)
http://slidepdf.com/reader/full/united-nations-global-biodiversity-outlook-3-2010 30/96
Global Biodiversity Outlook 3 | 30
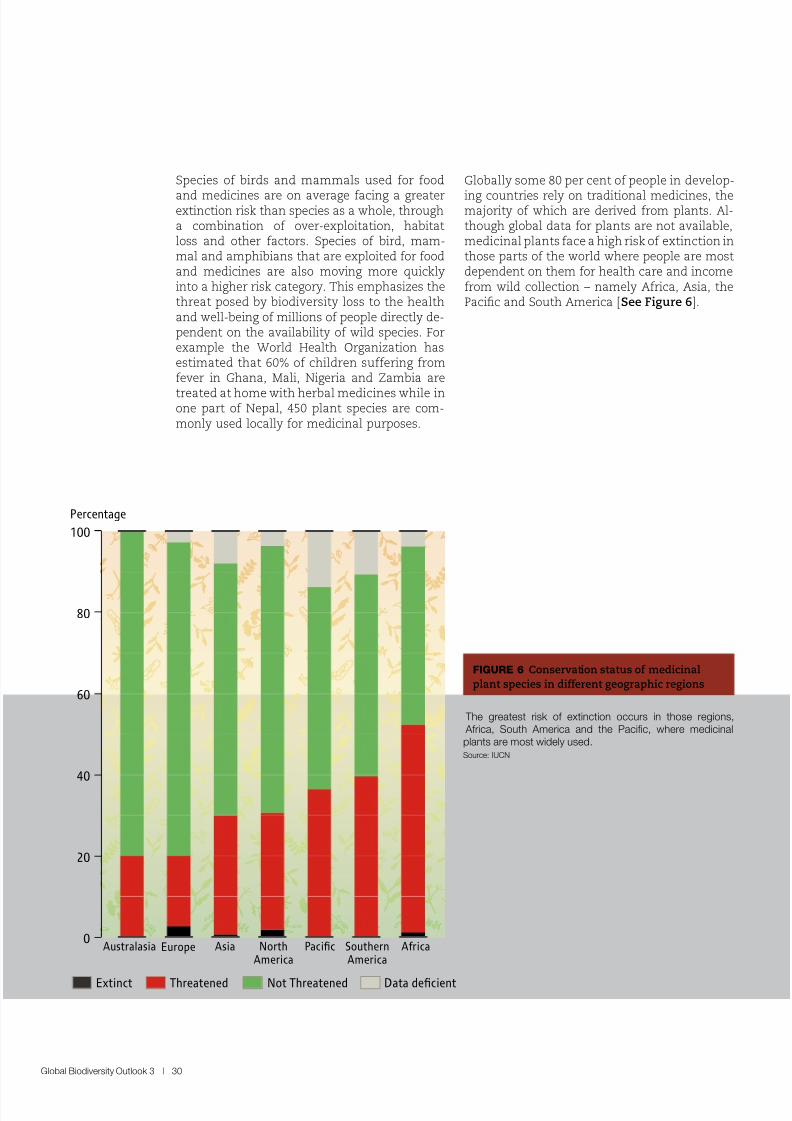
Species o birds and mammals used or ood
and medicines are on average acing a greaterextinction risk than species as a whole, througha combination o over-exploitation, habitatloss and other actors. Species o bird, mam-mal and amphibians that are exploited or oodand medicines are also moving more quicklyinto a higher risk category. This emphasizes thethreat posed by biodiversity loss to the healthand well-being o millions o people directly de-pendent on the availability o wild species. Forexample the World Health Organization hasestimated that 60% o children suering romever in Ghana, Mali, Nigeria and Zambia are
treated at home with herbal medicines while inone part o Nepal, 450 plant species are com-monly used locally or medicinal purposes.
Globally some 80 per cent o people in develop-
ing countries rely on traditional medicines, themajority o which are derived rom plants. Al-though global data or plants are not available,medicinal plants ace a high risk o extinction inthose parts o the world where people are mostdependent on them or health care and incomerom wild collection – namely Arica, Asia, thePacic and South America [See Figure 6].
FIGURe 6 Conservation status o medicinal
plant species in dierent geographic regions
Percentage
0
20
40
60
80
100
SouthernAmerica
Asia AfricaAustralasia PacificNorthAmerica
Europe
Threatened Data deficientNot ThreatenedExtinct
The greatest risk o extinction occurs in those regions, Arica, South America and the Pacifc, where medicinalplants are most widely used.Source: IUCN
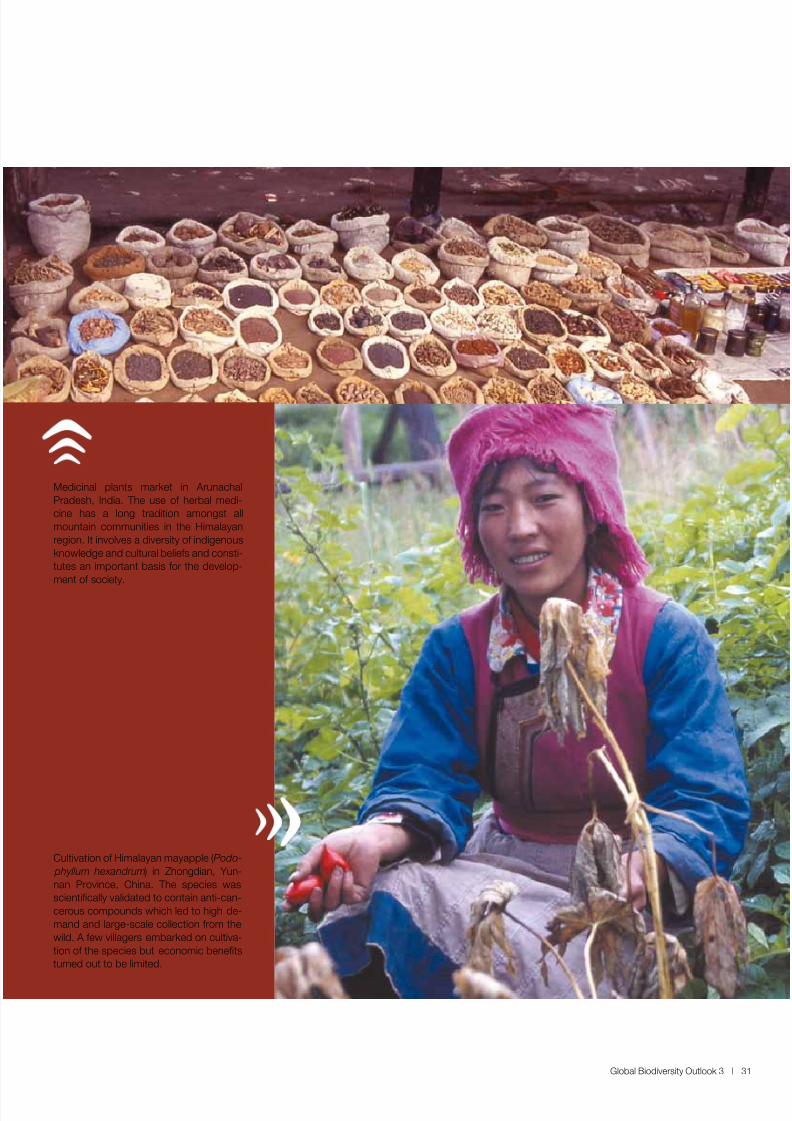
8/8/2019 United Nations - Global Biodiversity Outlook 3 (2010)
http://slidepdf.com/reader/full/united-nations-global-biodiversity-outlook-3-2010 31/96
Global Biodiversity Outlook 3 | 31
Medicinal plants market in ArunachalPradesh, India. The use o herbal medi-cine has a long tradition amongst allmountain communities in the Himalayanregion. It involves a diversity o indigenousknowledge and cultural belies and consti-tutes an important basis or the develop-ment o society.
Cultivation o Himalayan mayapple (Podo-
phyllum hexandrum) in Zhongdian, Yun-nan Province, China. The species wasscientifcally validated to contain anti-can-cerous compounds which led to high de-mand and large-scale collection rom thewild. A ew villagers embarked on cultiva-tion o the species but economic beneftsturned out to be limited.
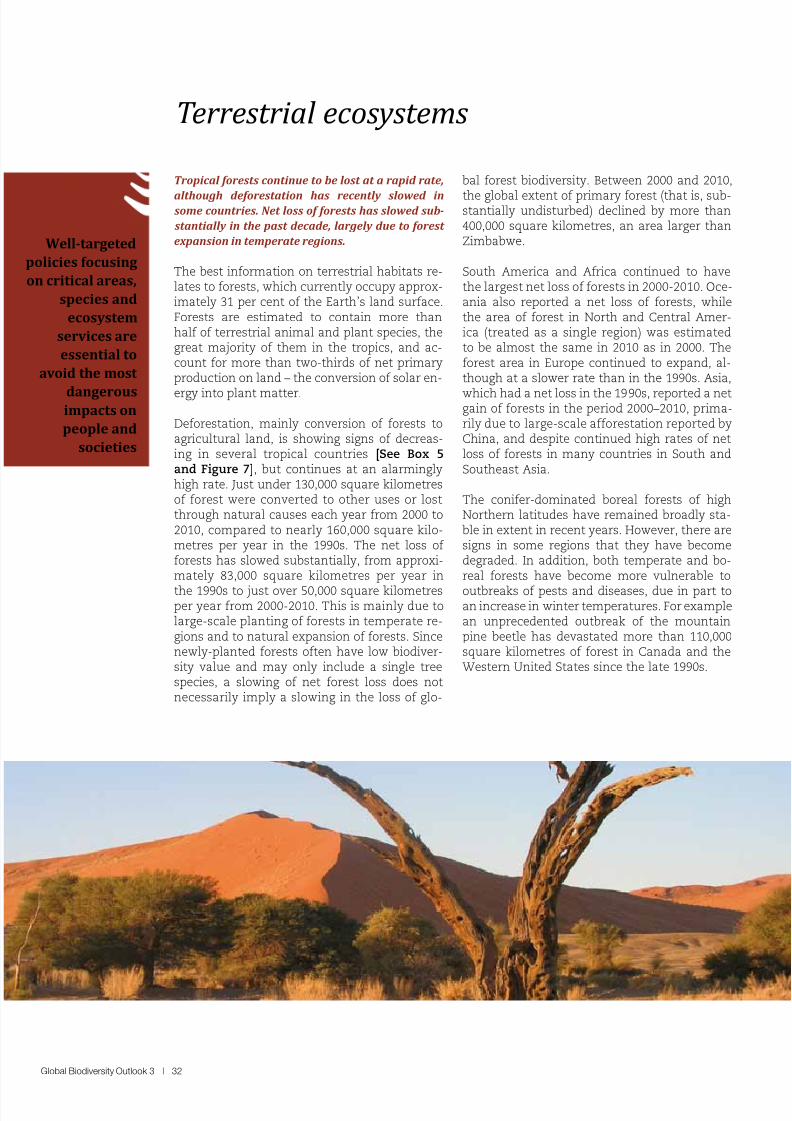
8/8/2019 United Nations - Global Biodiversity Outlook 3 (2010)
http://slidepdf.com/reader/full/united-nations-global-biodiversity-outlook-3-2010 32/96
Global Biodiversity Outlook 3 | 32
Tropical forests continue to be lost at a rapid rate,
although deforestation has recently slowed in some countries. Net loss of forests has slowed sub-
stantially in the past decade, largely due to forest
expansion in temperate regions.
The best inormation on terrestrial habitats re-lates to orests, which currently occupy approx-imately 31 per cent o the Earth’s land surace.Forests are estimated to contain more thanhal o terrestrial animal and plant species, thegreat majority o them in the tropics, and ac-count or more than two-thirds o net primaryproduction on land – the conversion o solar en-
ergy into plant matter.
Deorestation, mainly conversion o orests toagricultural land, is showing signs o decreas-ing in several tropical countries [See Box 5and Figure 7], but continues at an alarminglyhigh rate. Just under 130,000 square kilometreso orest were converted to other uses or lostthrough natural causes each year rom 2000 to2010, compared to nearly 160,000 square kilo-metres per year in the 1990s. The net loss o orests has slowed substantially, rom approxi-mately 83,000 square kilometres per year in
the 1990s to just over 50,000 square kilometresper year rom 2000-2010. This is mainly due tolarge-scale planting o orests in temperate re-gions and to natural expansion o orests. Sincenewly-planted orests oten have low biodiver-sity value and may only include a single treespecies, a slowing o net orest loss does notnecessarily imply a slowing in the loss o glo-
bal orest biodiversity. Between 2000 and 2010,
the global extent o primary orest (that is, sub-stantially undisturbed) declined by more than400,000 square kilometres, an area larger thanZimbabwe.
South America and Arica continued to havethe largest net loss o orests in 2000-2010. Oce-ania also reported a net loss o orests, whilethe area o orest in North and Central Amer-ica (treated as a single region) was estimatedto be almost the same in 2010 as in 2000. Theorest area in Europe continued to expand, al-though at a slower rate than in the 1990s. Asia,
which had a net loss in the 1990s, reported a netgain o orests in the period 2000–2010, prima-rily due to large-scale aorestation reported byChina, and despite continued high rates o netloss o orests in many countries in South andSoutheast Asia.
The conier-dominated boreal orests o highNorthern latitudes have remained broadly sta-ble in extent in recent years. However, there aresigns in some regions that they have becomedegraded. In addition, both temperate and bo-real orests have become more vulnerable to
outbreaks o pests and diseases, due in part toan increase in winter temperatures. For examplean unprecedented outbreak o the mountainpine beetle has devastated more than 110,000square kilometres o orest in Canada and theWestern United States since the late 1990s.
Terrestril ecosystems
Well-targeted
olicies focusing
n critical areas,
species and
ecosystem
services are
essential to
avoid the most
dangerousimpacts on
people and
societies
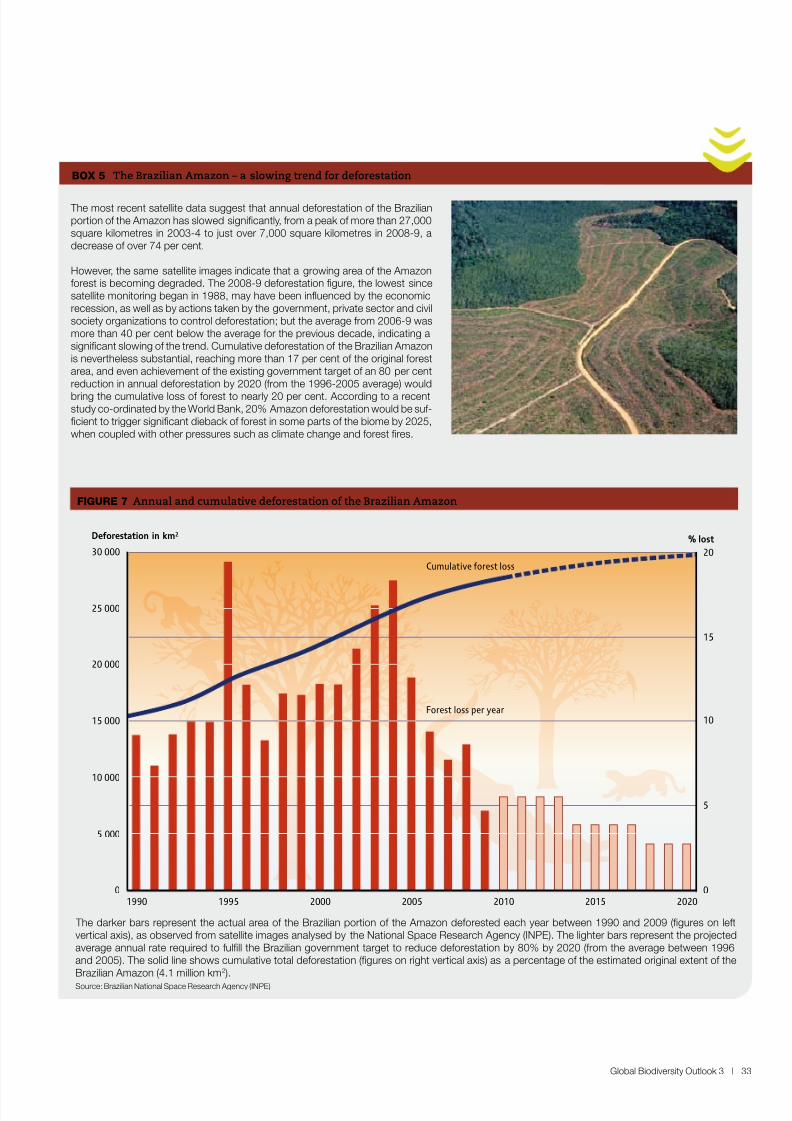
8/8/2019 United Nations - Global Biodiversity Outlook 3 (2010)
http://slidepdf.com/reader/full/united-nations-global-biodiversity-outlook-3-2010 33/96
Global Biodiversity Outlook 3 | 33
The most recent satellite data suggest that annual deorestation o the Brazilianportion o the Amazon has slowed signifcantly, rom a peak o more than 27,000square kilometres in 2003-4 to just over 7,000 square kilometres in 2008-9, adecrease o over 74 per cent.
However, the same satellite images indicate that a growing area o the Amazonorest is becoming degraded. The 2008-9 deorestation fgure, the lowest sincesatellite monitoring began in 1988, may have been inuenced by the economicrecession, as well as by actions taken by the government, private sector and civilsociety organizations to control deorestation; but the average rom 2006-9 wasmore than 40 per cent below the average or the previous decade, indicating asignifcant slowing o the trend. Cumulative deorestation o the Brazilian Amazonis nevertheless substantial, reaching more than 17 per cent o the original orestarea, and even achievement o the existing government target o an 80 per centreduction in annual deorestation by 2020 (rom the 1996-2005 average) would
bring the cumulative loss o orest to nearly 20 per cent. According to a recentstudy co-ordinated by the World Bank, 20% Amazon deorestation would be su-fcient to trigger signifcant dieback o orest in some parts o the biome by 2025,when coupled with other pressures such as climate change and orest fres.
BOX 5 The Brazilian Amazon – a slowing trend or deorestation
% lost
1990 1995 2000 2005 2010 2015 20200
5 000
10 000
15 000
20 000
25 000
30 000
Deforestation in km2
0
5
10
15
20
Cumulative forest loss
Forest loss per year
The darker bars represent the actual area o the Brazilian portion o the Amazon deorested each year between 1990 and 2009 (fgures on letvertical axis), as observed rom satellite images analysed by the National Space Research Agency (INPE). The lighter bars represent the projectedaverage annual rate required to ulfll the Brazilian government target to reduce deorestation by 80% by 2020 (rom the average between 1996and 2005). The solid line shows cumulative total deorestation (fgures on right vertical axis) as a percentage o the estimated original extent o theBrazilian Amazon (4.1 million km2).Source: Brazilian National Space Research Agency (INPE)
FIGURe 7 Annual and cumulative deorestation o the Brazilian Amazon
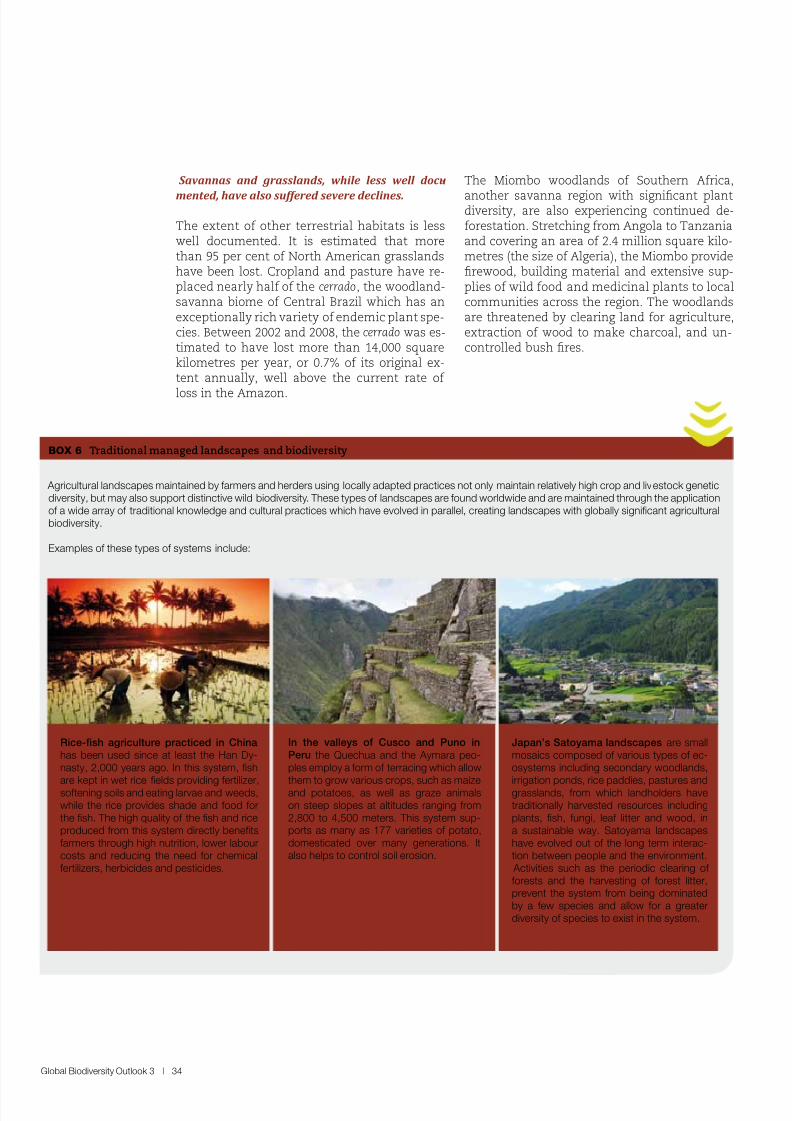
8/8/2019 United Nations - Global Biodiversity Outlook 3 (2010)
http://slidepdf.com/reader/full/united-nations-global-biodiversity-outlook-3-2010 34/96
Global Biodiversity Outlook 3 | 34
Savannas and grasslands, while less well docu-
mented, have also suffered severe declines.
The extent o other terrestrial habitats is lesswell documented. It is estimated that morethan 95 per cent o North American grasslandshave been lost. Cropland and pasture have re-placed nearly hal o the cerrado, the woodland-savanna biome o Central Brazil which has anexceptionally rich variety o endemic plant spe-cies. Between 2002 and 2008, the cerrado was es-timated to have lost more than 14,000 squarekilometres per year, or 0.7% o its original ex-tent annually, well above the current rate o
loss in the Amazon.
The Miombo woodlands o Southern Arica,
another savanna region with signicant plantdiversity, are also experiencing continued de-orestation. Stretching rom Angola to Tanzaniaand covering an area o 2.4 million square kilo-metres (the size o Algeria), the Miombo providerewood, building material and extensive sup-plies o wild ood and medicinal plants to localcommunities across the region. The woodlandsare threatened by clearing land or agriculture,extraction o wood to make charcoal, and un-controlled bush res.
Agricultural landscapes maintained by armers and herders using locally adapted practices not only maintain relatively high crop and livestock geneticdiversity, but may also support distinctive wild biodiversity. These types o landscapes are ound worldwide and are maintained through the applicationo a wide array o traditional knowledge and cultural practices which have evolved in parallel, creating landscapes with globally signifcant agriculturalbiodiversity.
Examples o these types o systems include:
BOX 6 Traditional managed landscapes and biodiversity
Rice-fsh agriculture practiced in China
has been used since at least the Han Dy-nasty, 2,000 years ago. In this system, fsh
are kept in wet rice felds providing ertilizer,sotening soils and eating larvae and weeds,while the rice provides shade and ood orthe fsh. The high quality o the fsh and riceproduced rom this system directly beneftsarmers through high nutrition, lower labourcosts and reducing the need or chemicalertilizers, herbicides and pesticides.
In the valleys o Cusco and Puno in
Peru the Quechua and the Aymara peo-ples employ a orm o terracing which allow
them to grow various crops, such as maizeand potatoes, as well as graze animalson steep slopes at altitudes ranging rom2,800 to 4,500 meters. This system sup-ports as many as 177 varieties o potato,domesticated over many generations. Italso helps to control soil erosion.
Japan’s Satoyama landscapes are smallmosaics composed o various types o ec-osystems including secondary woodlands,
irrigation ponds, rice paddies, pastures andgrasslands, rom which landholders havetraditionally harvested resources includingplants, fsh, ungi, lea litter and wood, ina sustainable way. Satoyama landscapeshave evolved out o the long term interac-tion between people and the environment. Activities such as the periodic clearing o orests and the harvesting o orest litter,prevent the system rom being dominatedby a ew species and allow or a greaterdiversity o species to exist in the system.
8/8/2019 United Nations - Global Biodiversity Outlook 3 (2010)
http://slidepdf.com/reader/full/united-nations-global-biodiversity-outlook-3-2010 35/96
Global Biodiversity Outlook 3 | 35
Abandonment of traditional agricultural practices
may cause loss of cultural landscapes and associ -ated biodiversity.
Traditional techniques o managing land or ag-riculture, some dating back thousands o years,have served an important unction in keepinghuman settlements in harmony with the natu-ral resources on which people depend [See Box6]. In many parts o the world, these systemsare being lost, due partly to the intensica-tion o production, and partly to abandonmentlinked to migration rom rural to urban areas. Insome cases, this trend may create opportunities
or biodiversity through the re-establishmento natural ecosystems on abandoned armland.However, the changes may also involve impor-tant losses o distinctive biodiversity, amongboth domesticated and wild species, and o ecosystem services provided by managed land-scapes.
Terrestrial habitats have become highly fragment -
ed, threatening the viability of species and their
ability to adapt to climate change.
Ecosystems across the planet, including some
with exceptionally high levels o biodiversity, havebecome severely ragmented, threatening thelong-term viability o many species and ecosystemservices. Global data regarding this process arehard to obtain, but some well-studied ecosystemsprovide illustrations o the scale o ragmentationand its impacts. For example, the remaining SouthAmerican Atlantic Forest, estimated to contain upto eight per cent o all terrestrial species, is largelycomposed o ragments less than one square kilo-metre in size. More than 50 per cent lies within 100metres o the orest edge.
When ecosystems become ragmented theymay be too small or some animals to establisha breeding territory, or orce plants and animalsto breed with close relatives. The in-breeding o species can increase vulnerability to disease byreducing the genetic diversity o populations.A study in the central Amazon region o Brazilound that orest ragments o less than onesquare kilometre lost hal o their bird species inless than teen years. In addition, isolated rag-ments o habitat make species vulnerable to cli-mate change, as their ability to migrate to areaswith more avourable conditions is limited.
One-quarter of the world’s land is becoming de-
graded.
The condition o many terrestrial habitats is de-teriorating. The Global Analysis o Land Degra-dation and Improvement estimated that nearlyone quarter (24%) o the world’s land area wasundergoing degradation, as measured by a de-cline in primary productivity, over the period1980-2003. Degrading areas included around30% o all orests, 20% o cultivated areas and10% o grasslands. Geographically they wereound mainly in Arica south o the Equator,South-East Asia and southern China, north-cen-
tral Australia, the Pampas grasslands in SouthAmerica, and parts o the Siberian and NorthAmerican boreal orests. Around 16 per cent o land was ound to be improving in productivity,the largest proportion (43%) being in rangelands.
The areas where a degrading trend was observedbarely overlapped with the 15% o land identi-ed as degraded in 1991, indicating that new ar-eas are being aected and that some regions o historical degradation remain at stubbornly lowlevels o productivity. About 1.5 billion people di-rectly depend on ecosystem services provided by
areas that are undergoing degradation. The de-cline in xation o carbon rom the atmosphereassociated with this degradation is estimated atnearly a billion tonnes rom 1980 to 2003, (al-most the equivalent o annual carbon dioxideemissions rom the European Union) and emis-sions rom the loss o soil carbon are likely tohave been many times greater.
Despite more than 12 per cent of land now being
covered by protected areas, nearly half (44%) of
terrestrial eco-regions fall below 10 per cent pro-
tection, and many of the most critical sites for bio -
diversity lie outside protected areas. Of those pro-tected areas where effectiveness of management
has been assessed, 13% were judged to be clearly
inadequate, while more than one ifth demonstrat -
ed sound management, and the remainder were
classed as “basic”.
An increasing proportion o global land suracehas been designated as protected areas [SeeBox 7 and Figure 8]. In total, some 12.2% enjoyslegal protection, made up o more than 120,000protected areas. However, the target o protect-ing at least 10% o each the world’s ecological
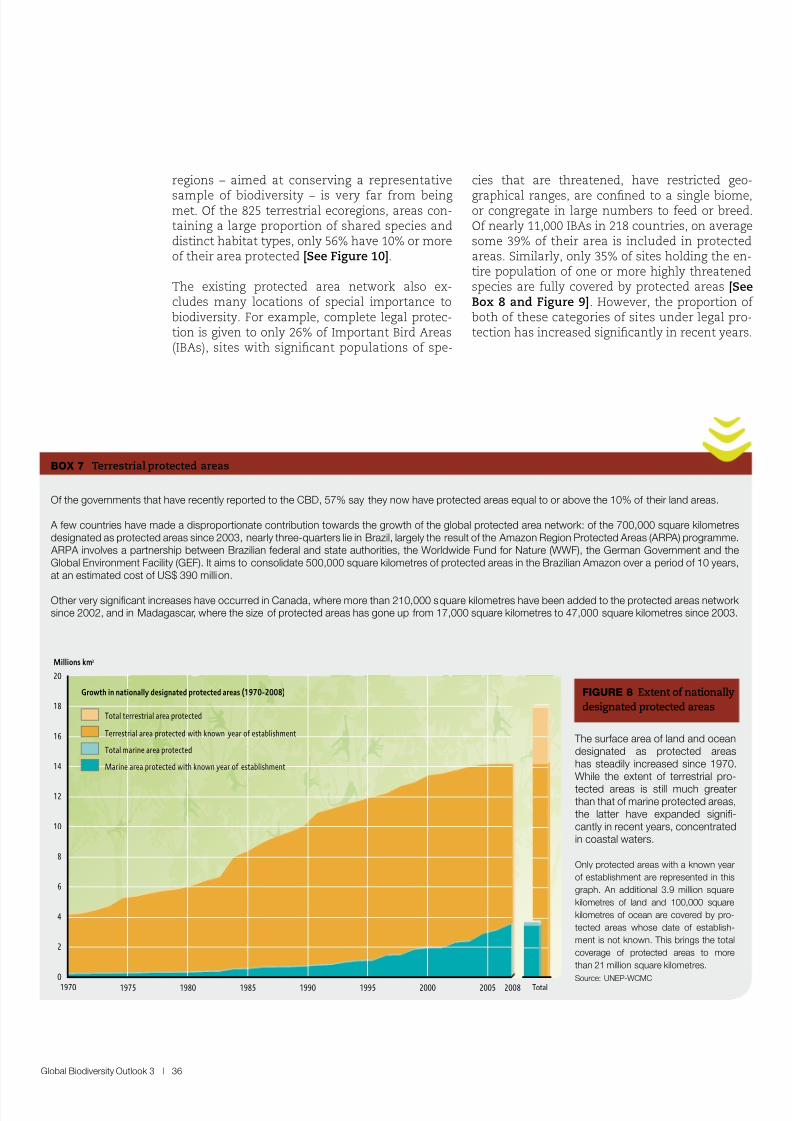
8/8/2019 United Nations - Global Biodiversity Outlook 3 (2010)
http://slidepdf.com/reader/full/united-nations-global-biodiversity-outlook-3-2010 36/96
Global Biodiversity Outlook 3 | 36
O the governments that have recently reported to the CBD, 57% say they now have protected areas equal to or above the 10% o their land areas.
A ew countries have made a disproportionate contribution towards the growth o the global protected area network: o the 700,000 square kilometresdesignated as protected areas since 2003, nearly three-quarters lie in Brazil, largely the result o the Amazon Region Protected Areas (ARPA) programme. ARPA involves a partnership between Brazilian ederal and state authorities, the Worldwide Fund or Nature (WWF), the German Government and theGlobal Environment Facility (GEF). It aims to consolidate 500,000 square kilometres o protected areas in the Brazilian Amazon over a period o 10 years,at an estimated cost o US$ 390 million.
Other very signifcant increases have occurred in Canada, where more than 210,000 square kilometres have been added to the protected areas networksince 2002, and in Madagascar, where the size o protected areas has gone up rom 17,000 square kilometres to 47,000 square kilometres since 2003.
BOX 7 Terrestrial protected areas
regions – aimed at conserving a representative
sample o biodiversity – is very ar rom beingmet. O the 825 terrestrial ecoregions, areas con-taining a large proportion o shared species anddistinct habitat types, only 56% have 10% or moreo their area protected [See Figure 10].
The existing protected area network also ex-cludes many locations o special importance tobiodiversity. For example, complete legal protec-tion is given to only 26% o Important Bird Areas(IBAs), sites with signicant populations o spe-
cies that are threatened, have restricted geo-
graphical ranges, are conned to a single biome,or congregate in large numbers to eed or breed.O nearly 11,000 IBAs in 218 countries, on averagesome 39% o their area is included in protectedareas. Similarly, only 35% o sites holding the en-tire population o one or more highly threatenedspecies are ully covered by protected areas [SeeBox 8 and Figure 9]. However, the proportion o both o these categories o sites under legal pro-tection has increased signicantly in recent years.
Millions km2
1970 2005200019951990198519801975 2008
0
2
4
6
8
10
12
14
16
18
20
Terrestrial area protected with known year of establishment
Total terrestrial area protected
Marine area protected with known year of establishment
Total marine area protected
Growth in nationally designated protected areas (1970-2008)
Total
FIGURe 8 Extent o nationally
designated protected areas
The surace area o land and oceandesignated as protected areashas steadily increased since 1970.While the extent o terrestrial pro-
tected areas is still much greaterthan that o marine protected areas,the latter have expanded signif-cantly in recent years, concentratedin coastal waters.
Only protected areas with a known year
o establishment are represented in this
graph. An additional 3.9 million square
kilometres o land and 100,000 square
kilometres o ocean are covered by pro-
tected areas whose date o establish-
ment is not known. This brings the total
coverage o protected areas to more
than 21 million square kilometres.
Source: UNEP-WCMC
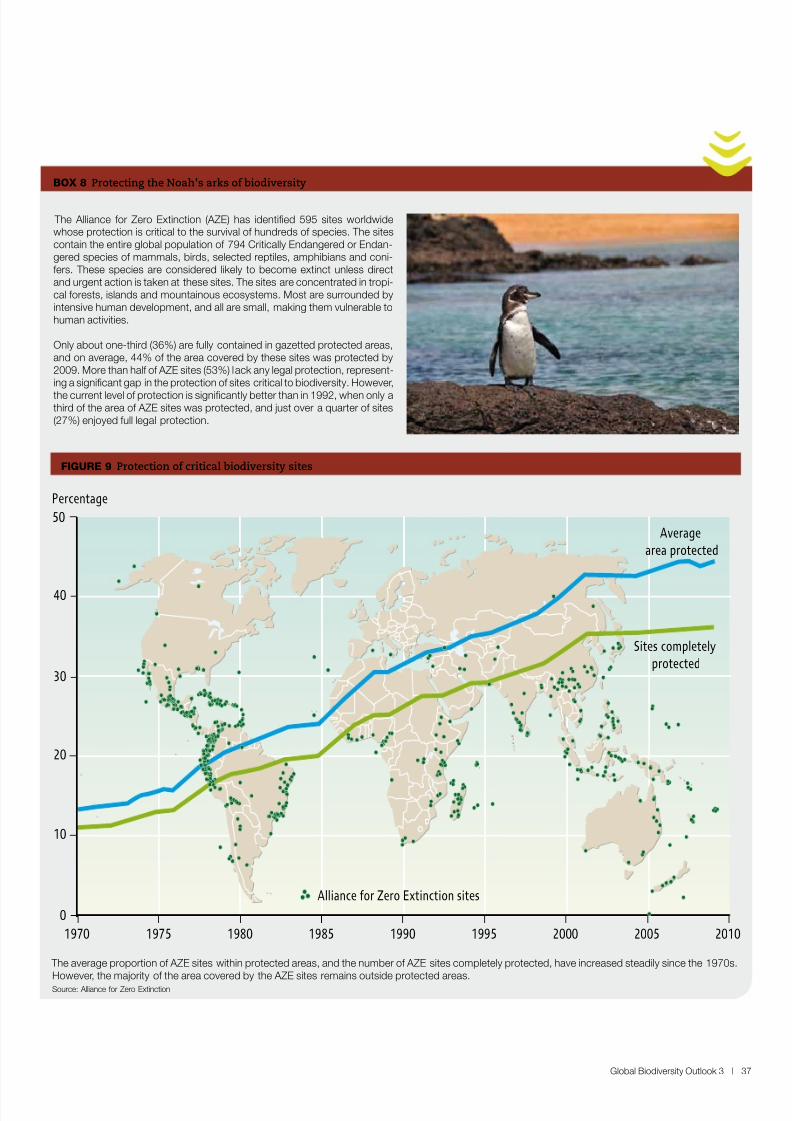
8/8/2019 United Nations - Global Biodiversity Outlook 3 (2010)
http://slidepdf.com/reader/full/united-nations-global-biodiversity-outlook-3-2010 37/96
Global Biodiversity Outlook 3 | 37
BOX 8 Protecting the Noah’s arks o biodiversity
The Alliance or Zero Extinction (AZE) has identifed 595 sites worldwidewhose protection is critical to the survival o hundreds o species. The sitescontain the entire global population o 794 Critically Endangered or Endan-gered species o mammals, birds, selected reptiles, amphibians and coni-ers. These species are considered likely to become extinct unless directand urgent action is taken at these sites. The sites are concentrated in tropi-cal orests, islands and mountainous ecosystems. Most are surrounded byintensive human development, and all are small, making them vulnerable tohuman activities.
Only about one-third (36%) are ully contained in gazetted protected areas,and on average, 44% o the area covered by these sites was protected by2009. More than hal o AZE sites (53%) lack any legal protection, represent-ing a signifcant gap in the protection o sites critical to biodiversity. However,
the current level o protection is signifcantly better than in 1992, when only athird o the area o AZE sites was protected, and just over a quarter o sites(27%) enjoyed ull legal protection.
The average proportion o AZE sites within protected areas, and the number o AZE sites completely protected, have increased steadily since the 1970s.However, the majority o the area covered by the AZE sites remains outside protected areas.Source: Alliance or Zero Extinction
20
1970 1975 1980 1985 1990 1995 2000 2005 2010
Percentage
0
30
50
10
40
Average
area protected
Sites completely
protected
Alliance for Zero Extinction sites
FIGURe 9 Protection o critical biodiversity sites
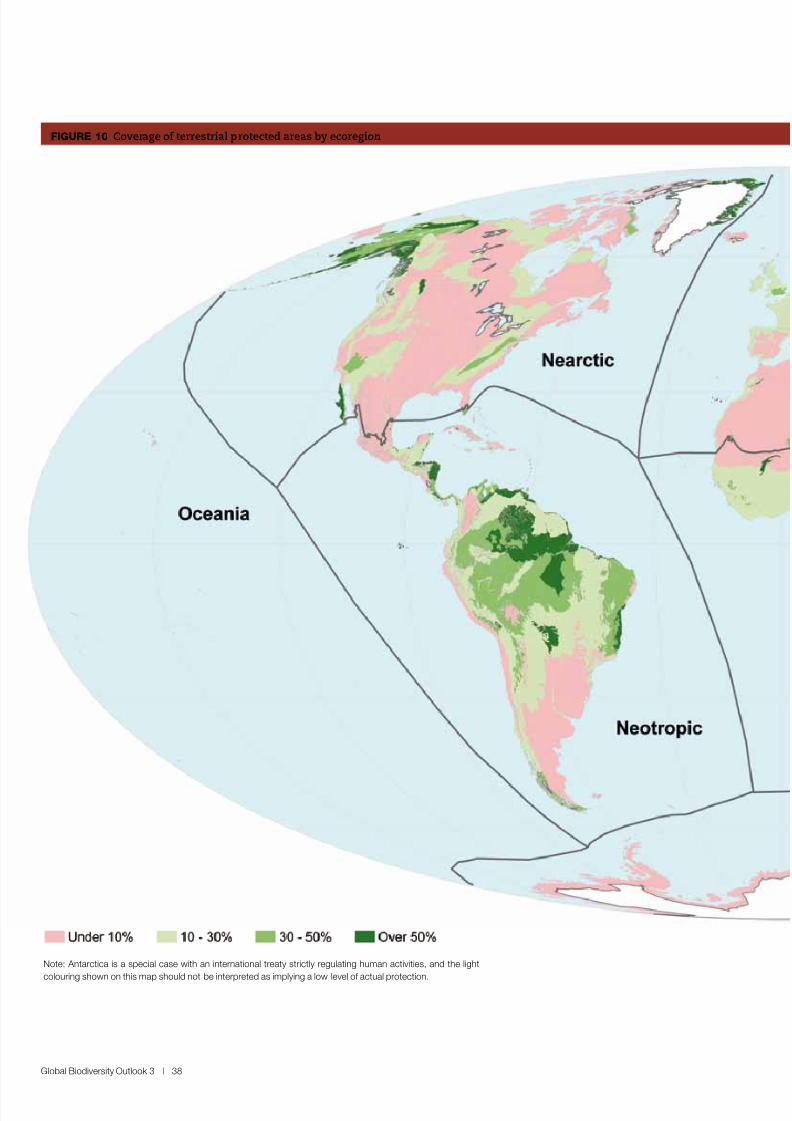
8/8/2019 United Nations - Global Biodiversity Outlook 3 (2010)
http://slidepdf.com/reader/full/united-nations-global-biodiversity-outlook-3-2010 38/96
Global Biodiversity Outlook 3 | 38
FIGURe 10 Coverage o terrestrial protected areas by ecoregion
Note: Antarctica is a special case with an international treaty strictly regulating human activities, and the light
colouring shown on this map should not be interpreted as implying a low level o actual protection.
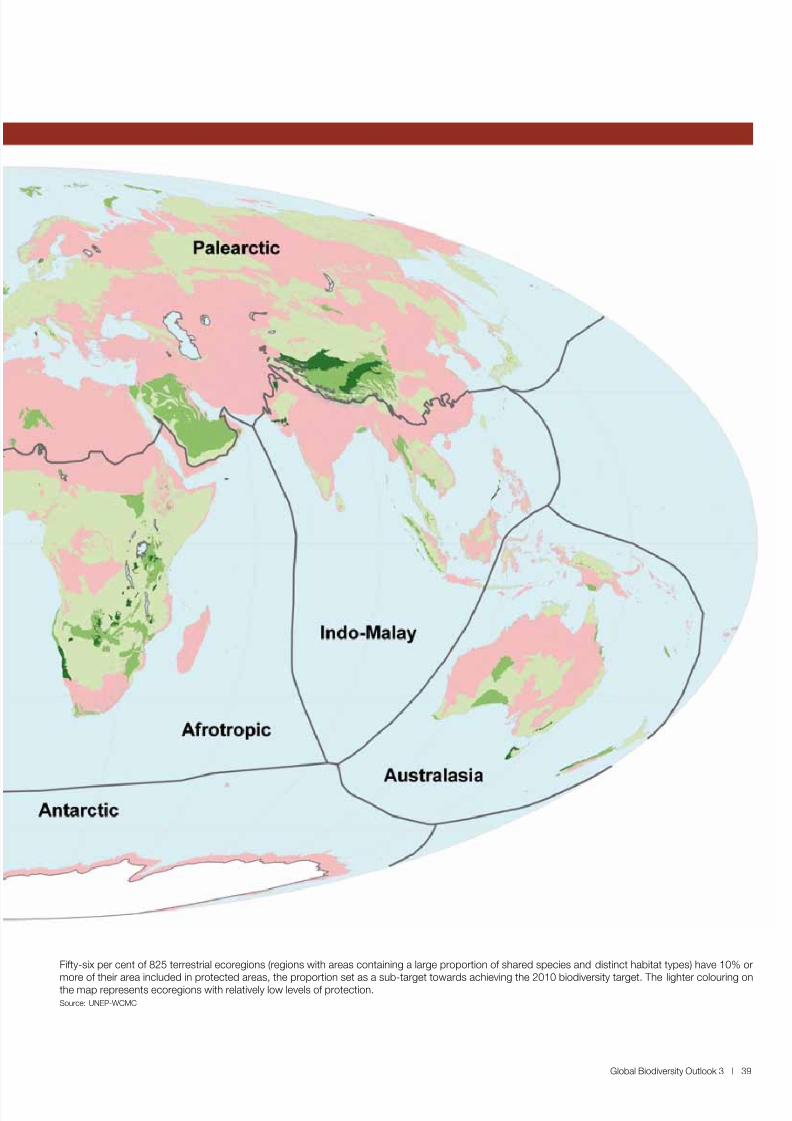
8/8/2019 United Nations - Global Biodiversity Outlook 3 (2010)
http://slidepdf.com/reader/full/united-nations-global-biodiversity-outlook-3-2010 39/96
Global Biodiversity Outlook 3 | 39
Fity-six per cent o 825 terrestrial ecoregions (regions with areas containing a large proportion o shared species and distinct habitat types) have 10% or
more o their area included in protected areas, the proportion set as a sub-target towards achieving the 2010 biodiversity target. The lighter colouring onthe map represents ecoregions with relatively low levels o protection.Source: UNEP-WCMC
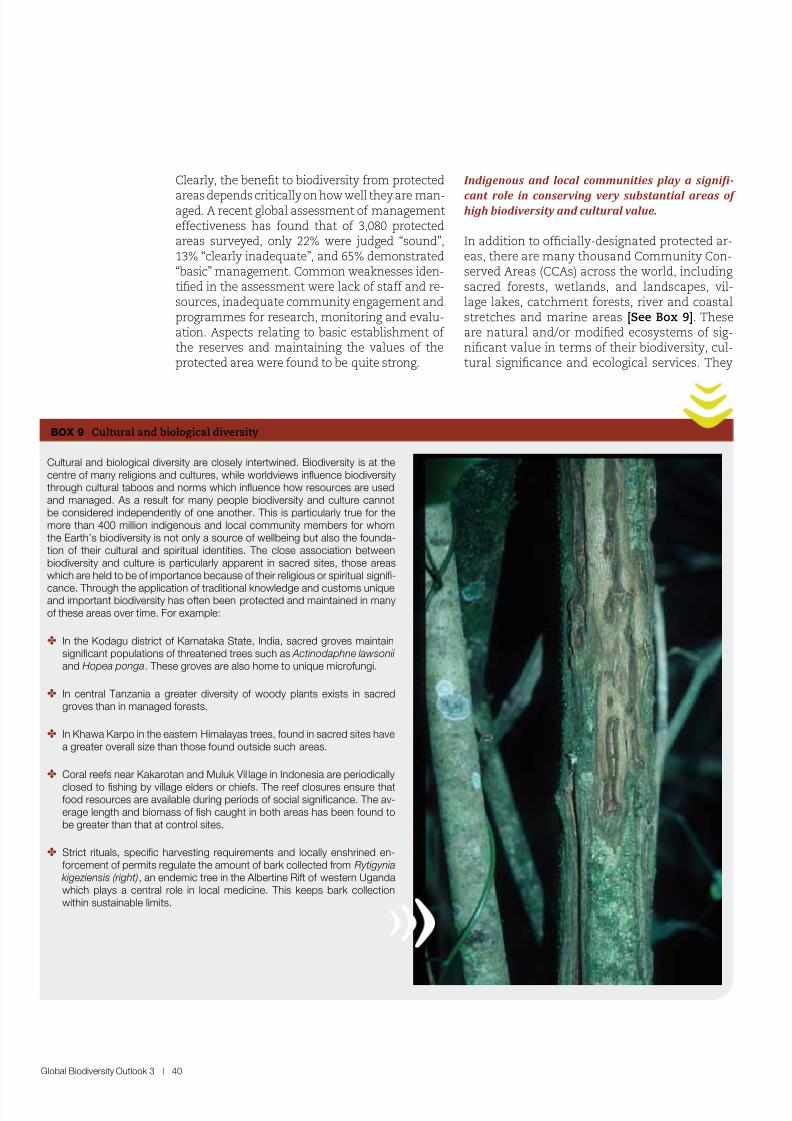
8/8/2019 United Nations - Global Biodiversity Outlook 3 (2010)
http://slidepdf.com/reader/full/united-nations-global-biodiversity-outlook-3-2010 40/96
Global Biodiversity Outlook 3 | 40
Clearly, the benet to biodiversity rom protected
areas depends critically on how well they are man-aged. A recent global assessment o managementeectiveness has ound that o 3,080 protectedareas surveyed, only 22% were judged “sound”,13% “clearly inadequate”, and 65% demonstrated“basic” management. Common weaknesses iden-tied in the assessment were lack o sta and re-sources, inadequate community engagement andprogrammes or research, monitoring and evalu-ation. Aspects relating to basic establishment o the reserves and maintaining the values o theprotected area were ound to be quite strong.
Indigenous and local communities play a signii -
cant role in conserving very substantial areas of high biodiversity and cultural value.
In addition to ocially-designated protected ar-eas, there are many thousand Community Con-served Areas (CCAs) across the world, includingsacred orests, wetlands, and landscapes, vil-lage lakes, catchment orests, river and coastalstretches and marine areas [See Box 9]. Theseare natural and/or modied ecosystems o sig-nicant value in terms o their biodiversity, cul-tural signicance and ecological services. They
Cultural and biological diversity are closely intertwined. Biodiversity is at thecentre o many religions and cultures, while worldviews inuence biodiversitythrough cultural taboos and norms which inuence how resources are usedand managed. As a result or many people biodiversity and culture cannotbe considered independently o one another. This is particularly true or themore than 400 million indigenous and local community members or whomthe Earth’s biodiversity is not only a source o wellbeing but also the ounda-tion o their cultural and spiritual identities. The close association betweenbiodiversity and culture is particularly apparent in sacred sites, those areaswhich are held to be o importance because o their religious or spiritual signif-
cance. Through the application o traditional knowledge and customs uniqueand important biodiversity has oten been protected and maintained in manyo these areas over time. For example:
✤ In the Kodagu district o Karnataka State, India, sacred groves maintainsignifcant populations o threatened trees such as Actinodaphne lawsonii and Hopea ponga. These groves are also home to unique microungi.
✤ In central Tanzania a greater diversity o woody plants exists in sacredgroves than in managed orests.
✤ In Khawa Karpo in the eastern Himalayas trees, ound in sacred sites havea greater overall size than those ound outside such areas.
✤ Coral rees near Kakarotan and Muluk Vil lage in Indonesia are periodically
closed to fshing by village elders or chies. The ree closures ensure thatood resources are available during periods o social signifcance. The av-erage length and biomass o fsh caught in both areas has been ound tobe greater than that at control sites.
✤ Strict rituals, specifc harvesting requirements and locally enshrined en-orcement o permits regulate the amount o bark collected rom Rytigynia
kigeziensis (right), an endemic tree in the Albertine Rit o western Ugandawhich plays a central role in local medicine. This keeps bark collectionwithin sustainable limits.
BOX 9 Cultural and biological diversity
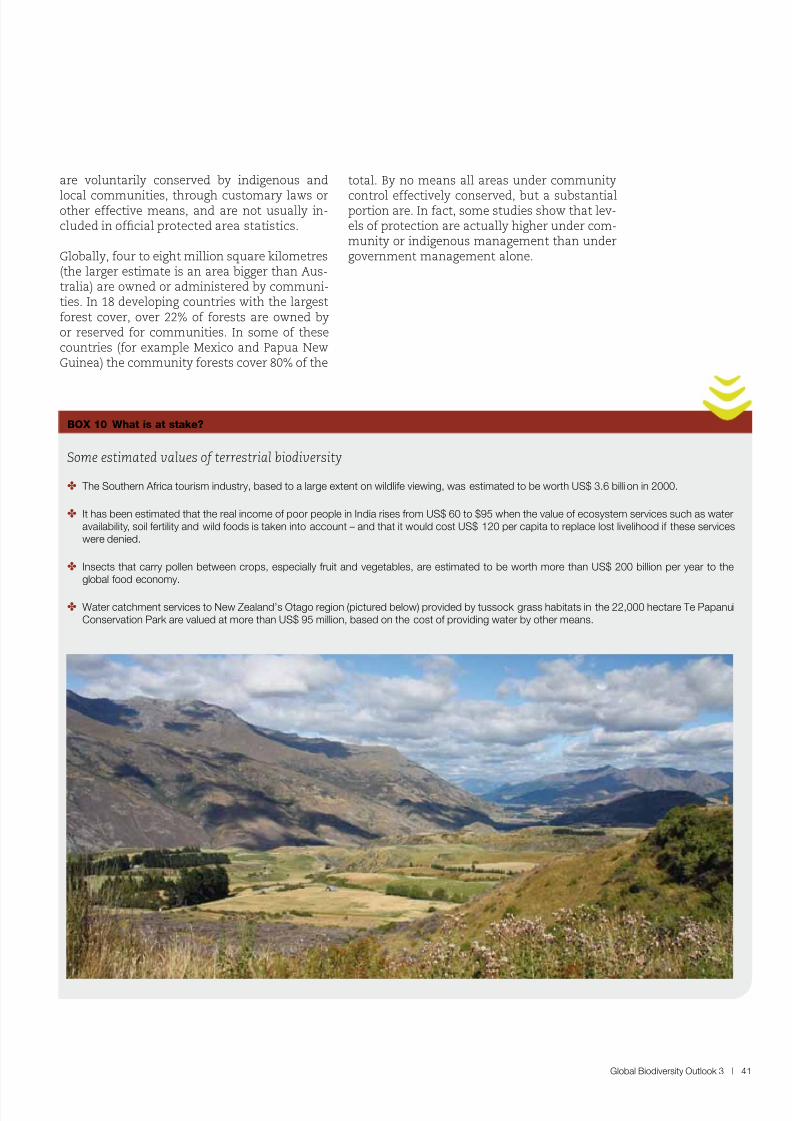
8/8/2019 United Nations - Global Biodiversity Outlook 3 (2010)
http://slidepdf.com/reader/full/united-nations-global-biodiversity-outlook-3-2010 41/96
Global Biodiversity Outlook 3 | 41
are voluntarily conserved by indigenous and
local communities, through customary laws orother eective means, and are not usually in-cluded in ocial protected area statistics. Globally, our to eight million square kilometres(the larger estimate is an area bigger than Aus-tralia) are owned or administered by communi-ties. In 18 developing countries with the largestorest cover, over 22% o orests are owned byor reserved or communities. In some o thesecountries (or example Mexico and Papua NewGuinea) the community orests cover 80% o the
total. By no means all areas under community
control eectively conserved, but a substantialportion are. In act, some studies show that lev-els o protection are actually higher under com-munity or indigenous management than undergovernment management alone.
Some estimated values o terrestrial biodiversity
✤ The Southern Arica tourism industry, based to a large extent on wildlie viewing, was estimated to be worth US$ 3.6 billion in 2000.
✤ It has been estimated that the real income o poor people in India rises rom US$ 60 to $95 when the value o ecosystem services such as wateravailability, soil ertility and wild oods is taken into account – and that it would cost US$ 120 per capita to replace lost livelihood i these serviceswere denied.
✤ Insects that carry pollen between crops, especially ruit and vegetables, are estimated to be worth more than US$ 200 billion per year to theglobal ood economy.
✤ Water catchment services to New Zealand’s Otago region (pictured below) provided by tussock grass habitats in the 22,000 hectare Te PapanuiConservation Park are valued at more than US$ 95 million, based on the cost o providing water by other means.
BOX 10 Wht is t stk?
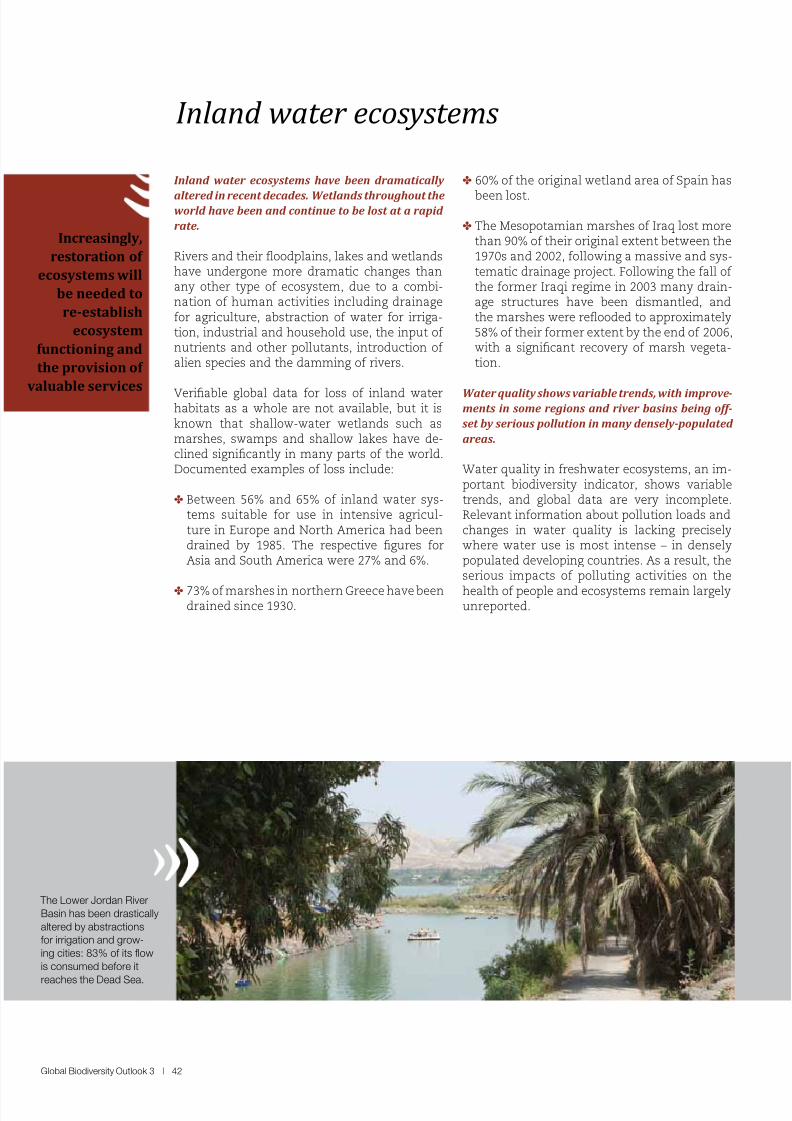
8/8/2019 United Nations - Global Biodiversity Outlook 3 (2010)
http://slidepdf.com/reader/full/united-nations-global-biodiversity-outlook-3-2010 42/96
Global Biodiversity Outlook 3 | 42
Inland water ecosystems have been dramatically
altered in recent decades. Wetlands throughout theworld have been and continue to be lost at a rapid
rate.
Rivers and their foodplains, lakes and wetlandshave undergone more dramatic changes thanany other type o ecosystem, due to a combi-nation o human activities including drainageor agriculture, abstraction o water or irriga-tion, industrial and household use, the input o nutrients and other pollutants, introduction o alien species and the damming o rivers.
Veriable global data or loss o inland waterhabitats as a whole are not available, but it isknown that shallow-water wetlands such asmarshes, swamps and shallow lakes have de-clined signicantly in many parts o the world.Documented examples o loss include:
✤ Between 56% and 65% o inland water sys-tems suitable or use in intensive agricul-ture in Europe and North America had beendrained by 1985. The respective gures orAsia and South America were 27% and 6%.
✤ 73% o marshes in northern Greece have beendrained since 1930.
✤ 60% o the original wetland area o Spain has
been lost.
✤ The Mesopotamian marshes o Iraq lost morethan 90% o their original extent between the1970s and 2002, ollowing a massive and sys-tematic drainage project. Following the all o the ormer Iraqi regime in 2003 many drain-age structures have been dismantled, andthe marshes were refooded to approximately58% o their ormer extent by the end o 2006,with a signicant recovery o marsh vegeta-tion.
Water quality shows variable trends, with improve-ments in some regions and river basins being off -
set by serious pollution in many densely-populated
areas.
Water quality in reshwater ecosystems, an im-portant biodiversity indicator, shows variabletrends, and global data are very incomplete.Relevant inormation about pollution loads andchanges in water quality is lacking preciselywhere water use is most intense – in denselypopulated developing countries. As a result, theserious impacts o polluting activities on the
health o people and ecosystems remain largelyunreported.
Inlnd wter ecosystems
Increasingly,
restoration of
ecosystems will
be needed to
re-establish
ecosystem
functioning and
the provision of
aluable services
The Lower Jordan RiverBasin has been drasticallyaltered by abstractionsor irrigation and grow-ing cities: 83% o its owis consumed beore it
reaches the Dead Sea.
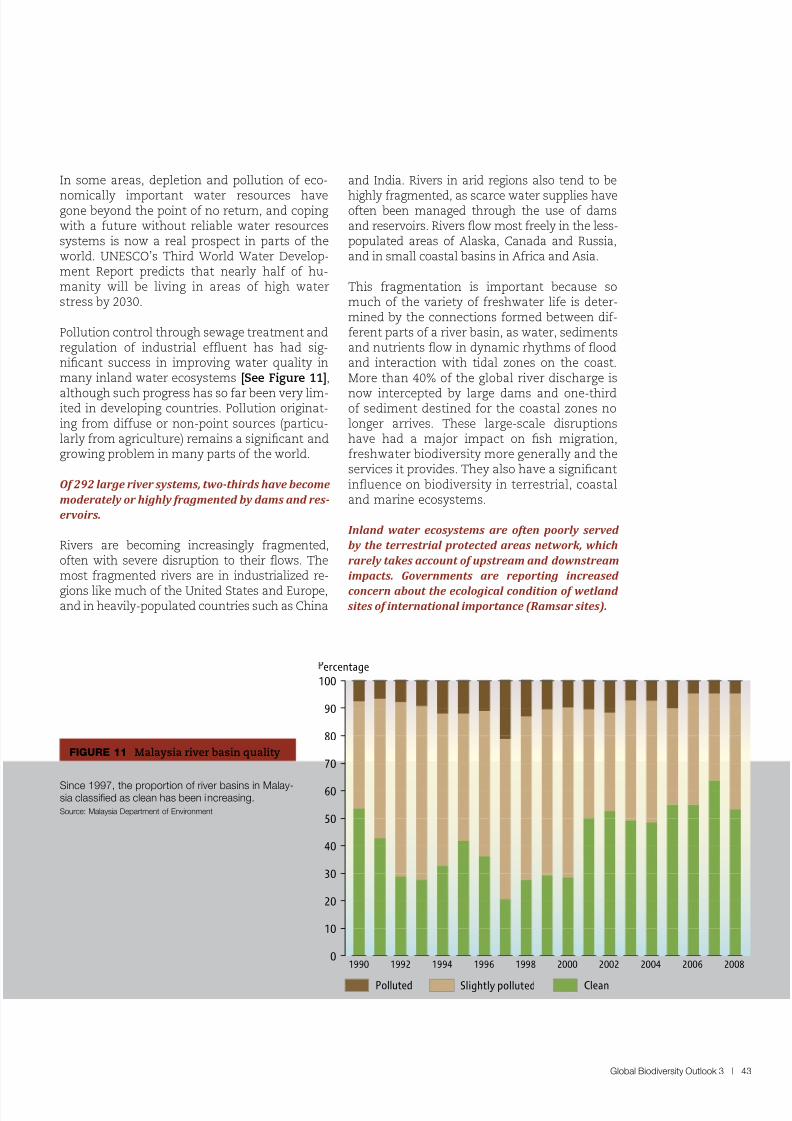
8/8/2019 United Nations - Global Biodiversity Outlook 3 (2010)
http://slidepdf.com/reader/full/united-nations-global-biodiversity-outlook-3-2010 43/96
Global Biodiversity Outlook 3 | 43
In some areas, depletion and pollution o eco-
nomically important water resources havegone beyond the point o no return, and copingwith a uture without reliable water resourcessystems is now a real prospect in parts o theworld. UNESCO’s Third World Water Develop-ment Report predicts that nearly hal o hu-manity will be living in areas o high waterstress by 2030.
Pollution control through sewage treatment andregulation o industrial efuent has had sig-nicant success in improving water quality inmany inland water ecosystems [See Figure 11],
although such progress has so ar been very lim-ited in developing countries. Pollution originat-ing rom diuse or non-point sources (particu-larly rom agriculture) remains a signicant andgrowing problem in many parts o the world.
Of 292 large river systems, two-thirds have become
moderately or highly fragmented by dams and res-
ervoirs.
Rivers are becoming increasingly ragmented,oten with severe disruption to their fows. Themost ragmented rivers are in industrialized re-
gions like much o the United States and Europe,and in heavily-populated countries such as China
and India. Rivers in arid regions also tend to be
highly ragmented, as scarce water supplies haveoten been managed through the use o damsand reservoirs. Rivers fow most reely in the less-populated areas o Alaska, Canada and Russia,and in small coastal basins in Arica and Asia.
This ragmentation is important because somuch o the variety o reshwater lie is deter-mined by the connections ormed between di-erent parts o a river basin, as water, sedimentsand nutrients fow in dynamic rhythms o foodand interaction with tidal zones on the coast.More than 40% o the global river discharge is
now intercepted by large dams and one-thirdo sediment destined or the coastal zones nolonger arrives. These large-scale disruptionshave had a major impact on sh migration,reshwater biodiversity more generally and theservices it provides. They also have a signicantinfuence on biodiversity in terrestrial, coastaland marine ecosystems.
Inland water ecosystems are often poorly served
by the terrestrial protected areas network, which
rarely takes account of upstream and downstream
impacts. Governments are reporting increased
concern about the ecological condition of wetland sites of international importance (Ramsar sites).
Since 1997, the proportion o river basins in Malay-sia classifed as clean has been increasing.Source: Malaysia Department o Environment
ercentage
0
20
40
60
80
100
10
30
50
70
90
Slightly polluted CleanPolluted
1990 1992 1994 1996 1998 2000 2002 2004 2006 2008
FIGURe 11 Malaysia river basin quality
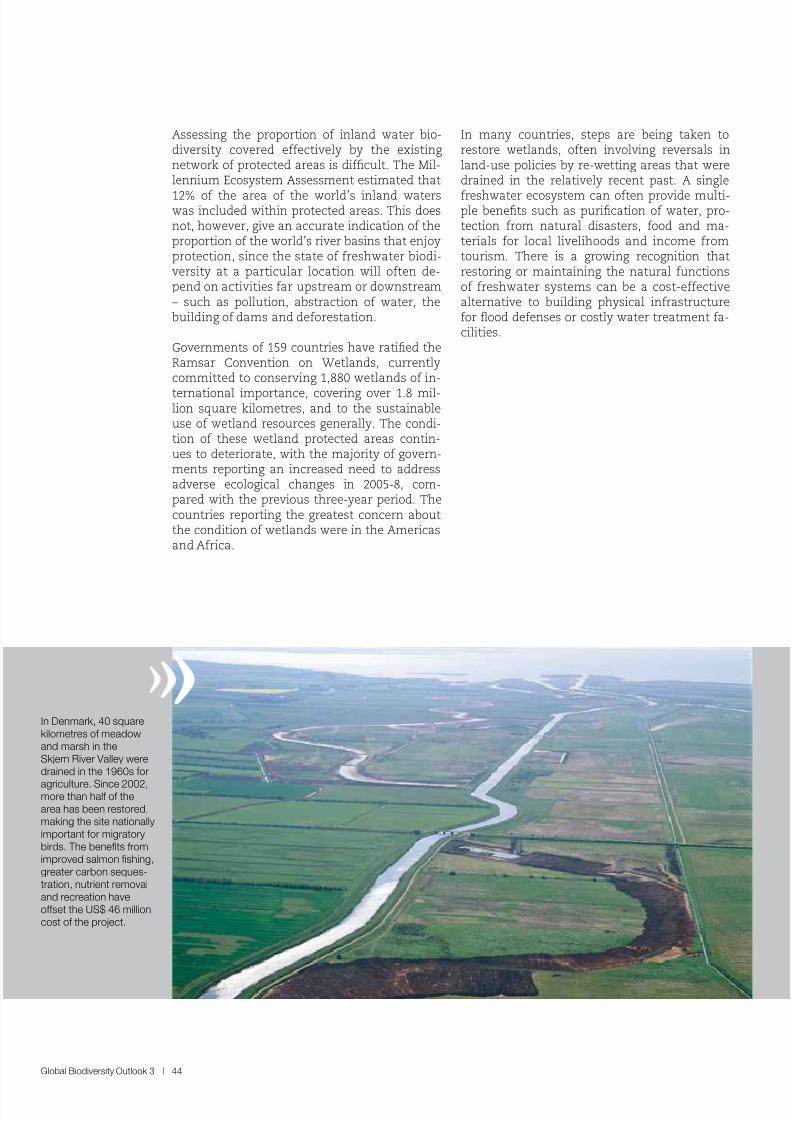
8/8/2019 United Nations - Global Biodiversity Outlook 3 (2010)
http://slidepdf.com/reader/full/united-nations-global-biodiversity-outlook-3-2010 44/96
Global Biodiversity Outlook 3 | 44
In Denmark, 40 squarekilometres o meadowand marsh in theSkjern River Valley weredrained in the 1960s or
agriculture. Since 2002,more than hal o thearea has been restored,making the site nationallyimportant or migratorybirds. The benefts romimproved salmon fshing,greater carbon seques-tration, nutrient removaland recreation haveoset the US$ 46 millioncost o the project.
Assessing the proportion o inland water bio-diversity covered eectively by the existingnetwork o protected areas is dicult. The Mil-lennium Ecosystem Assessment estimated that
12% o the area o the world’s inland waterswas included within protected areas. This doesnot, however, give an accurate indication o theproportion o the world’s river basins that enjoyprotection, since the state o reshwater biodi-versity at a particular location will oten de-pend on activities ar upstream or downstream– such as pollution, abstraction o water, thebuilding o dams and deorestation.
Governments o 159 countries have ratied theRamsar Convention on Wetlands, currentlycommitted to conserving 1,880 wetlands o in-
ternational importance, covering over 1.8 mil-lion square kilometres, and to the sustainableuse o wetland resources generally. The condi-tion o these wetland protected areas contin-ues to deteriorate, with the majority o govern-ments reporting an increased need to addressadverse ecological changes in 2005-8, com-pared with the previous three-year period. Thecountries reporting the greatest concern aboutthe condition o wetlands were in the Americasand Arica.
In many countries, steps are being taken torestore wetlands, oten involving reversals inland-use policies by re-wetting areas that weredrained in the relatively recent past. A single
reshwater ecosystem can oten provide multi-ple benets such as purication o water, pro-tection rom natural disasters, ood and ma-terials or local livelihoods and income romtourism. There is a growing recognition thatrestoring or maintaining the natural unctionso reshwater systems can be a cost-eectivealternative to building physical inrastructureor food deenses or costly water treatment a-cilities.
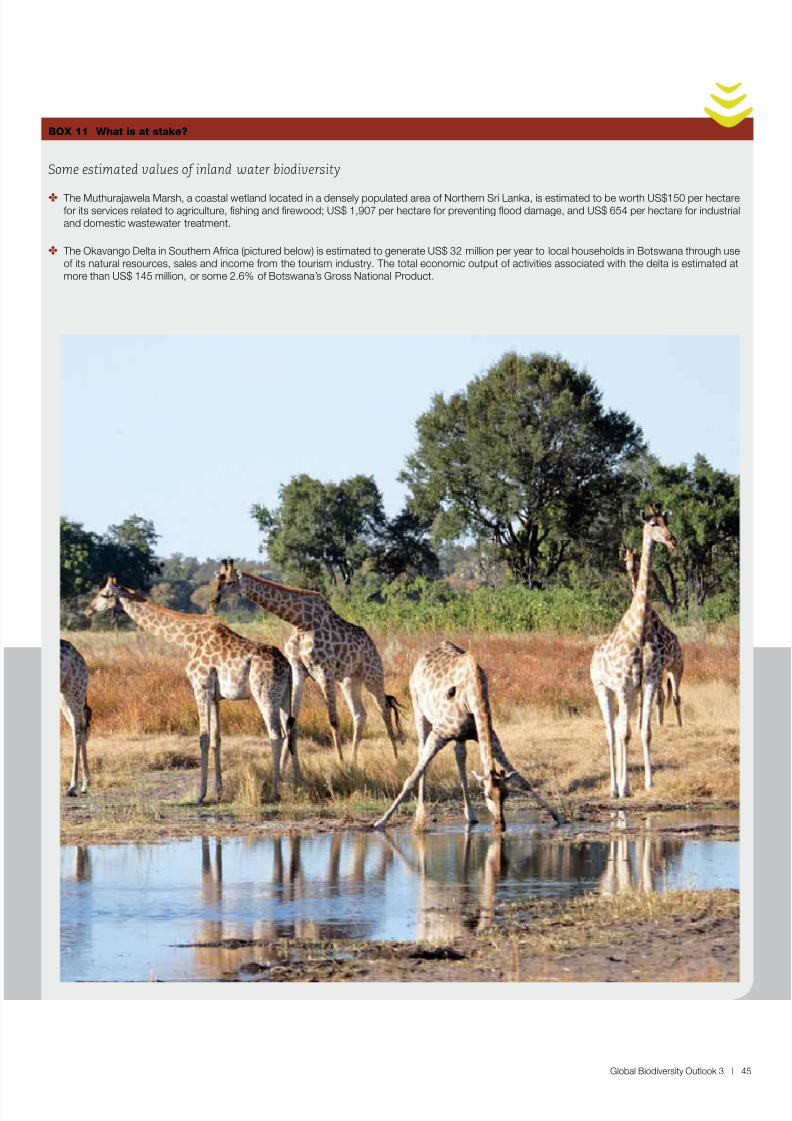
8/8/2019 United Nations - Global Biodiversity Outlook 3 (2010)
http://slidepdf.com/reader/full/united-nations-global-biodiversity-outlook-3-2010 45/96
Global Biodiversity Outlook 3 | 45
Some estimated values o inland water biodiversity
✤ The Muthurajawela Marsh, a coastal wetland located in a densely populated area o Northern Sri Lanka, is estimated to be worth US$150 per hectareor its services related to agriculture, fshing and frewood; US$ 1,907 per hectare or preventing ood damage, and US$ 654 per hectare or industrialand domestic wastewater treatment.
✤ The Okavango Delta in Southern Arica (pictured below) is estimated to generate US$ 32 million per year to local households in Botswana through useo its natural resources, sales and income rom the tourism industry. The total economic output o activities associated with the delta is estimated atmore than US$ 145 million, or some 2.6% o Botswana’s Gross National Product.
BOX 11 Wht is t stk?
8/8/2019 United Nations - Global Biodiversity Outlook 3 (2010)
http://slidepdf.com/reader/full/united-nations-global-biodiversity-outlook-3-2010 46/96
Global Biodiversity Outlook 3 | 46
Coastal habitats such as mangroves, seagrass beds,
salt marshes and shellish reefs continue to declinein extent, threatening highly valuable ecosystem
services including the removal of signiicant quan-
tities of carbon dioxide from the atmosphere; but
there has been some slowing in the rate of loss of
mangrove forests, except in Asia.
Some o the best-studied examples o recentdecline in the extent and integrity o marinehabitats are in coastal ecosystems o greatimportance to human societies and econo-mies. Coastal habitats have come under pres-sure rom many orms o development includ-
ing tourism and urban inrastructure, shrimparming and port acilities including dredging.This is compounded by sea level rise, creatingwhat might be termed a “coastal squeeze”.
Mangrove orests are highly-productive ecosys-tems in the inter-tidal zones o many tropicalcoastlines. They not only provide wood or lo-cal communities, but also act as nursery areasor a wide range o commercially-valuable shand crustacean stocks, and act as vital energybarriers, protecting low-lying coastal commu-nities rom oshore storms. The FAO estimates
that about one-th o the world’s mangroves,covering 36,000 square kilometres, were lostbetween 1980 and 2005. The rate at which man-groves are declining globally seems to have re-duced more recently, although the loss is stilldisturbingly high. During the 1980s, an averageo 1,850 square kilometres was lost each year.In the 1990s the annual average dropped to1,185 square kilometres, and rom 2000-2005 itwas 1,020 square kilometres – a 45% reductionin the annual rate o loss. The trend o reducedrate o loss has not been observed in Asia,which holds a larger proportion o remaining
mangroves than any other region.
Seagrass beds or meadows, ringing coastlinesthroughout the world, perorm a number o vi-tal but under recognized ecosystem unctions,including support or commercial sheries, aood source or species such as manatees anddugongs, and the stabilization o sediments. Itis estimated that some 29% o seagrass habitatshave disappeared since the 19th century, witha sharp acceleration in recent decades. Since1980, the loss o seagrass beds has averagedapproximately 110 square kilometres per year,
a rate o loss comparable to mangroves, coralrees and tropical orests.
Salt marshes, important as natural storm bar-
riers and as habitats or shorebirds, have lostsome 25% o the area they originally coveredglobally, and current rates o loss are estimatedto be between one and two per cent per year.Salt marshes are especially important ecosys-tems or removing carbon dioxide rom theatmosphere. For example in the United Statesthey are estimated to account or more thanone-th o the carbon absorbed by all ecosys-tems, despite covering a relatively small area.
Shellsh rees are an even more threatenedcoastal habitat, and play an important role in
ltering seawater and providing ood and habi-tat or sh, crabs and seabirds. It is estimatedthat 85% o oyster rees have been lost globally,and that they are unctionally extinct in 37% o estuaries and 28% o ecoregions.
The quantity o carbon buried each year by veg-etated coastal habitats such as mangroves, saltmarshes and seagrass beds has been estimatedat between 120 and 329 million tonnes. Thehigher estimate is almost equal to the annualgreenhouse gas emissions o Japan.
Tropical coral reefs have suffered a signiicant global decline in biodiversity since the 1970s. Al -
though the overall extent of living coral cover has
remained roughly in balance since the 1980s, it has
not recovered to earlier levels. Even where local re-
covery has occurred, there is evidence that the new
reef structures are more uniform and less diverse
than the ones they replaced.
Tropical coral rees contribute signicantly tothe livelihoods and security o coastal regions inthe areas where they occur, including throughtourism based on their aesthetic beauty, income
and nutrition rom the sh species they support,and protection o coastlines rom storms andwaves.
Although they cover just 1.2% o the world’s con-tinental shelves, it is estimated that between 500million and more than one billion people rely oncoral rees as a ood resource. Around 30 mil-lion people in the poorest and most vulnerablecoastal and inland communities are entirely de-pendent on resources derived rom coral reesor their wellbeing. They also support betweenone and three million species, including approxi-
mately 25% o all marine sh species.
Mrine nd costl ecosystems
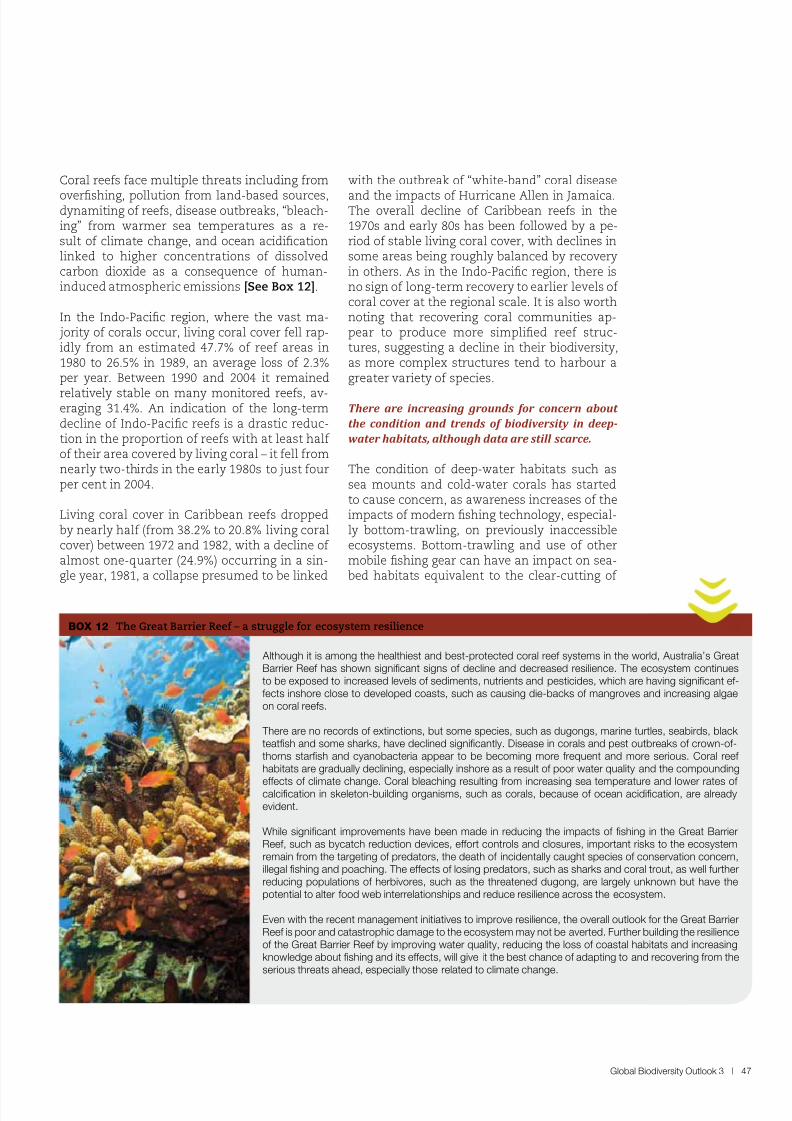
8/8/2019 United Nations - Global Biodiversity Outlook 3 (2010)
http://slidepdf.com/reader/full/united-nations-global-biodiversity-outlook-3-2010 47/96
Global Biodiversity Outlook 3 | 47
Coral rees ace multiple threats including rom
overshing, pollution rom land-based sources,dynamiting o rees, disease outbreaks, “bleach-ing” rom warmer sea temperatures as a re-sult o climate change, and ocean acidicationlinked to higher concentrations o dissolvedcarbon dioxide as a consequence o human-induced atmospheric emissions [See Box 12].
In the Indo-Pacic region, where the vast ma- jority o corals occur, living coral cover ell rap-idly rom an estimated 47.7% o ree areas in1980 to 26.5% in 1989, an average loss o 2.3%per year. Between 1990 and 2004 it remained
relatively stable on many monitored rees, av-eraging 31.4%. An indication o the long-termdecline o Indo-Pacic rees is a drastic reduc-tion in the proportion o rees with at least hal o their area covered by living coral – it ell romnearly two-thirds in the early 1980s to just ourper cent in 2004.
Living coral cover in Caribbean rees droppedby nearly hal (rom 38.2% to 20.8% living coralcover) between 1972 and 1982, with a decline o almost one-quarter (24.9%) occurring in a sin-gle year, 1981, a collapse presumed to be linked
with the outbreak o “white-band” coral disease
and the impacts o Hurricane Allen in Jamaica.The overall decline o Caribbean rees in the1970s and early 80s has been ollowed by a pe-riod o stable living coral cover, with declines insome areas being roughly balanced by recoveryin others. As in the Indo-Pacic region, there isno sign o long-term recovery to earlier levels o coral cover at the regional scale. It is also worthnoting that recovering coral communities ap-pear to produce more simplied ree struc-tures, suggesting a decline in their biodiversity,as more complex structures tend to harbour agreater variety o species.
There are increasing grounds for concern about
the condition and trends of biodiversity in deep-
water habitats, although data are still scarce.
The condition o deep-water habitats such assea mounts and cold-water corals has startedto cause concern, as awareness increases o theimpacts o modern shing technology, especial-ly bottom-trawling, on previously inaccessibleecosystems. Bottom-trawling and use o othermobile shing gear can have an impact on sea-bed habitats equivalent to the clear-cutting o
Although it is among the healthiest and best-protected coral ree systems in the world, Australia’s GreatBarrier Ree has shown signifcant signs o decline and decreased resilience. The ecosystem continuesto be exposed to increased levels o sediments, nutrients and pesticides, which are having signifcant e-ects inshore close to developed coasts, such as causing die-backs o mangroves and increasing algaeon coral rees.
There are no records o extinctions, but some species, such as dugongs, marine turtles, seabirds, blackteatfsh and some sharks, have declined signifcantly. Disease in corals and pest outbreaks o crown-o-thorns starfsh and cyanobacteria appear to be becoming more requent and more serious. Coral ree habitats are gradually declining, especially inshore as a result o poor water quality and the compounding
eects o climate change. Coral bleaching resulting rom increasing sea temperature and lower rates o calcifcation in skeleton-building organisms, such as corals, because o ocean acidifcation, are alreadyevident.
While signifcant improvements have been made in reducing the impacts o fshing in the Great BarrierRee, such as bycatch reduction devices, eort controls and closures, important risks to the ecosystemremain rom the targeting o predators, the death o incidentally caught species o conservation concern,illegal fshing and poaching. The eects o losing predators, such as sharks and coral trout, as well urtherreducing populations o herbivores, such as the threatened dugong, are largely unknown but have thepotential to alter ood web interrelationships and reduce resilience across the ecosystem.
Even with the recent management initiatives to improve resilience, the overall outlook or the Great BarrierRee is poor and catastrophic damage to the ecosystem may not be averted. Further building the resilienceo the Great Barrier Ree by improving water quality, reducing the loss o coastal habitats and increasingknowledge about fshing and its eects, will give it the best chance o adapting to and recovering rom theserious threats ahead, especially those related to climate change.
BOX 12 The Great Barrier Ree – a struggle or ecosystem resilience
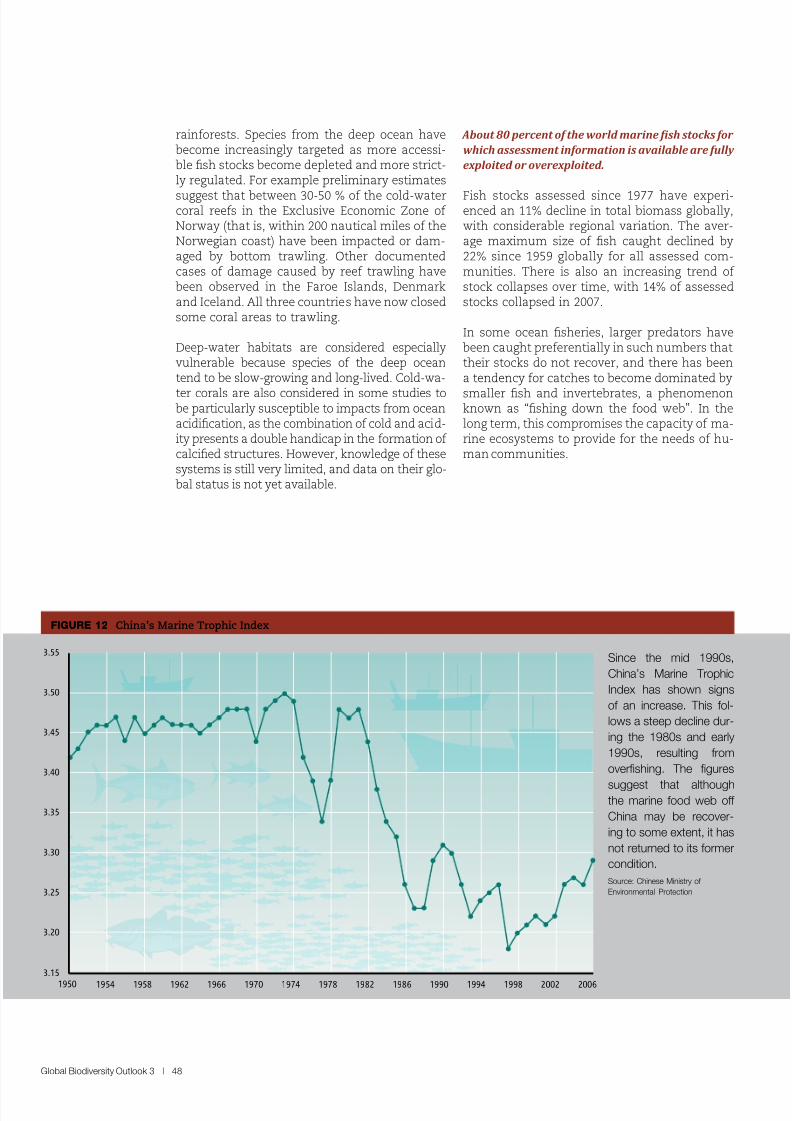
8/8/2019 United Nations - Global Biodiversity Outlook 3 (2010)
http://slidepdf.com/reader/full/united-nations-global-biodiversity-outlook-3-2010 48/96
Global Biodiversity Outlook 3 | 48
rainorests. Species rom the deep ocean havebecome increasingly targeted as more accessi-ble sh stocks become depleted and more strict-ly regulated. For example preliminary estimates
suggest that between 30-50 % o the cold-watercoral rees in the Exclusive Economic Zone o Norway (that is, within 200 nautical miles o theNorwegian coast) have been impacted or dam-aged by bottom trawling. Other documentedcases o damage caused by ree trawling havebeen observed in the Faroe Islands, Denmarkand Iceland. All three countries have now closedsome coral areas to trawling.
Deep-water habitats are considered especiallyvulnerable because species o the deep oceantend to be slow-growing and long-lived. Cold-wa-
ter corals are also considered in some studies tobe particularly susceptible to impacts rom oceanacidication, as the combination o cold and acid-ity presents a double handicap in the ormation o calcied structures. However, knowledge o thesesystems is still very limited, and data on their glo-bal status is not yet available.
About 80 percent of the world marine ish stocks for
which assessment information is available are fully
exploited or overexploited.
Fish stocks assessed since 1977 have experi-enced an 11% decline in total biomass globally,with considerable regional variation. The aver-age maximum size o sh caught declined by22% since 1959 globally or all assessed com-munities. There is also an increasing trend o stock collapses over time, with 14% o assessedstocks collapsed in 2007.
In some ocean sheries, larger predators havebeen caught preerentially in such numbers thattheir stocks do not recover, and there has beena tendency or catches to become dominated by
smaller sh and invertebrates, a phenomenonknown as “shing down the ood web”. In thelong term, this compromises the capacity o ma-rine ecosystems to provide or the needs o hu-man communities.
1950 1954 1958 1962 1966 1970 1974 1978 1982 1986 1990 1994 1998 2002 2006
3.15
3.20
3.25
3.30
3.35
3.40
3.45
3.50
3.55Since the mid 1990s,
China’s Marine Trophic
Index has shown signs
o an increase. This ol-
lows a steep decline dur-
ing the 1980s and early
1990s, resulting rom
overfshing. The fgures
suggest that althoughthe marine ood web o
China may be recover-
ing to some extent, it has
not returned to its ormer
condition.
Source: Chinese Ministry o
Environmental Protection
FIGURe 12 China’s Marine Trophic Index
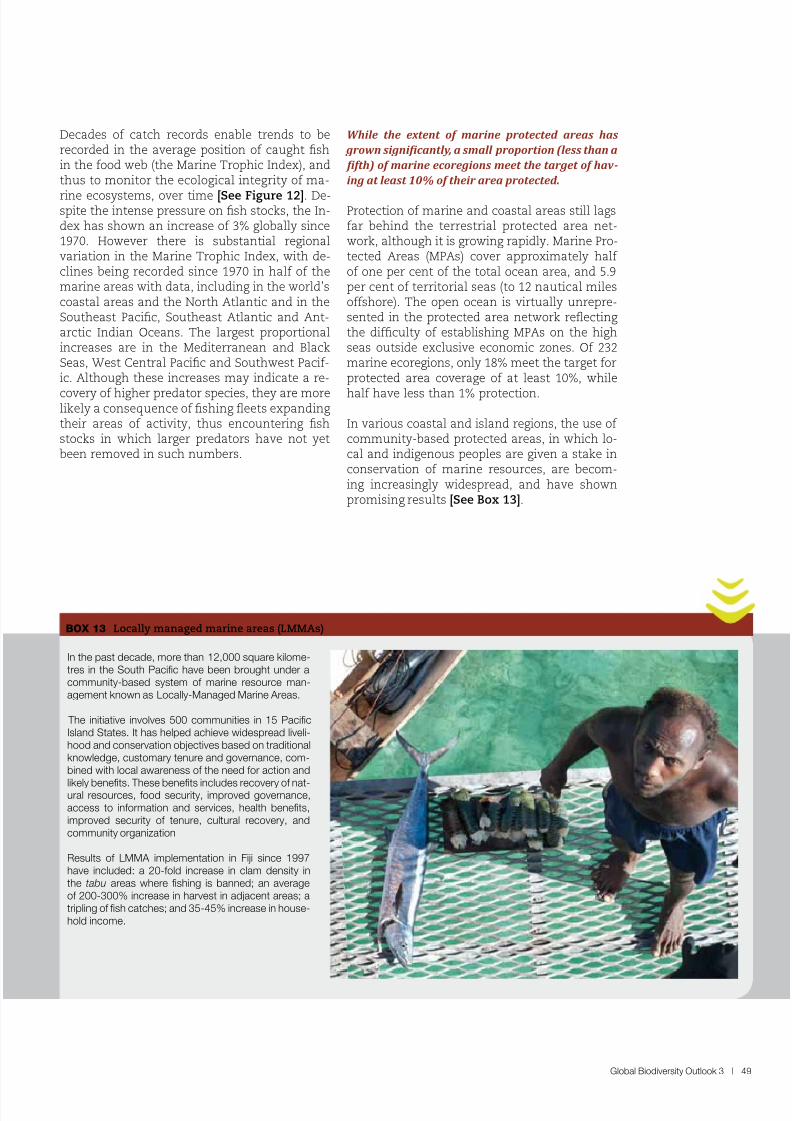
8/8/2019 United Nations - Global Biodiversity Outlook 3 (2010)
http://slidepdf.com/reader/full/united-nations-global-biodiversity-outlook-3-2010 49/96
Global Biodiversity Outlook 3 | 49
Decades o catch records enable trends to berecorded in the average position o caught shin the ood web (the Marine Trophic Index), andthus to monitor the ecological integrity o ma-
rine ecosystems, over time [See Figure 12]. De-spite the intense pressure on sh stocks, the In-dex has shown an increase o 3% globally since1970. However there is substantial regionalvariation in the Marine Trophic Index, with de-clines being recorded since 1970 in hal o themarine areas with data, including in the world’scoastal areas and the North Atlantic and in theSoutheast Pacic, Southeast Atlantic and Ant-arctic Indian Oceans. The largest proportionalincreases are in the Mediterranean and BlackSeas, West Central Pacic and Southwest Paci-ic. Although these increases may indicate a re-
covery o higher predator species, they are morelikely a consequence o shing feets expandingtheir areas o activity, thus encountering shstocks in which larger predators have not yetbeen removed in such numbers.
While the extent of marine protected areas has
grown signiicantly, a small proportion (less than a
ifth) of marine ecoregions meet the target of hav -
ing at least 10% of their area protected.
Protection o marine and coastal areas still lagsar behind the terrestrial protected area net-work, although it is growing rapidly. Marine Pro-tected Areas (MPAs) cover approximately hal o one per cent o the total ocean area, and 5.9per cent o territorial seas (to 12 nautical milesoshore). The open ocean is virtually unrepre-sented in the protected area network refectingthe diculty o establishing MPAs on the highseas outside exclusive economic zones. O 232marine ecoregions, only 18% meet the target orprotected area coverage o at least 10%, while
hal have less than 1% protection.
In various coastal and island regions, the use o community-based protected areas, in which lo-cal and indigenous peoples are given a stake inconservation o marine resources, are becom-ing increasingly widespread, and have shownpromising results [See Box 13].
In the past decade, more than 12,000 square kilome-tres in the South Pacifc have been brought under acommunity-based system o marine resource man-agement known as Locally-Managed Marine Areas.
The initiative involves 500 communities in 15 PacifcIsland States. It has helped achieve widespread liveli-hood and conservation objectives based on traditionalknowledge, customary tenure and governance, com-bined with local awareness o the need or action and
likely benefts. These benefts includes recovery o nat-ural resources, ood security, improved governance,access to inormation and services, health benefts,improved security o tenure, cultural recovery, andcommunity organization
Results o LMMA implementation in Fiji since 1997have included: a 20-old increase in clam density inthe tabu areas where fshing is banned; an averageo 200-300% increase in harvest in adjacent areas; atripling o fsh catches; and 35-45% increase in house-hold income.
BOX 13 Locally managed marine areas (LMMAs)
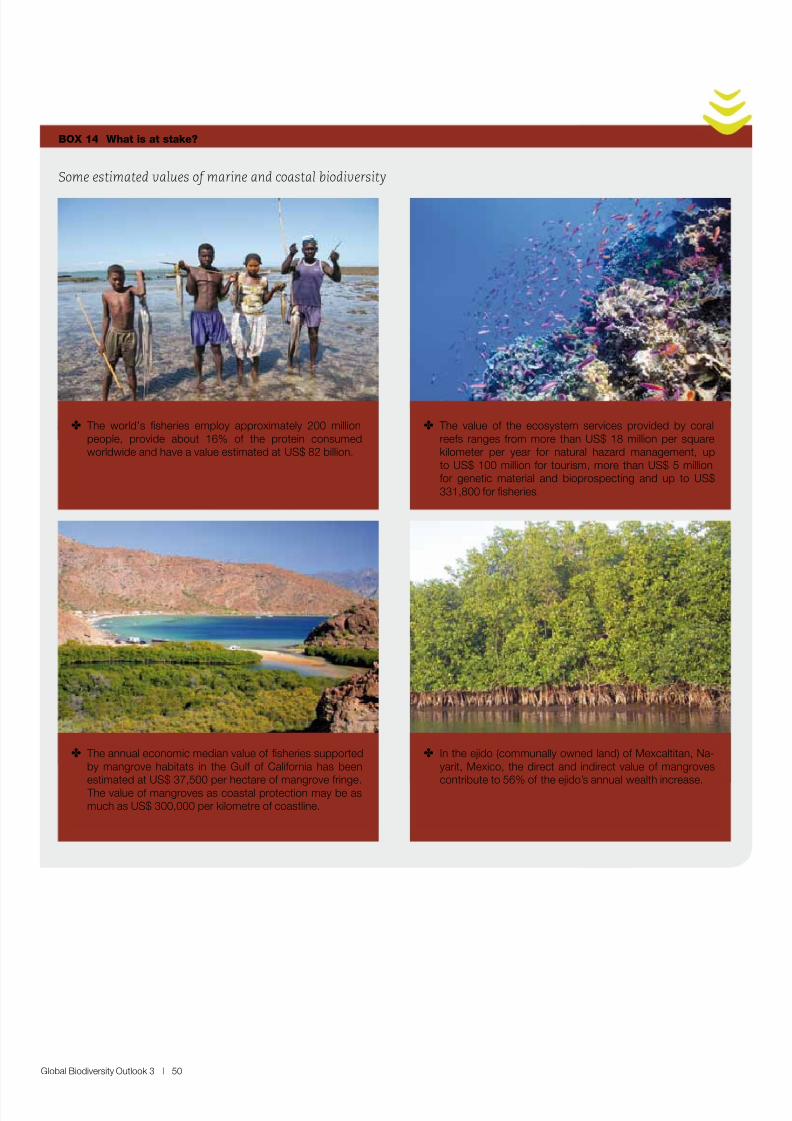
8/8/2019 United Nations - Global Biodiversity Outlook 3 (2010)
http://slidepdf.com/reader/full/united-nations-global-biodiversity-outlook-3-2010 50/96
Global Biodiversity Outlook 3 | 50
Some estimated values o marine and coastal biodiversity
BOX 14 Wht is t stk?
✤ The world’s fsheries employ approximately 200 millionpeople, provide about 16% o the protein consumedworldwide and have a value estimated at US$ 82 billion.
✤ The annual economic median value o fsheries supportedby mangrove habitats in the Gul o Caliornia has beenestimated at US$ 37,500 per hectare o mangrove ringe.
The value o mangroves as coastal protection may be asmuch as US$ 300,000 per kilometre o coastline.
✤ The value o the ecosystem services provided by coralrees ranges rom more than US$ 18 million per squarekilometer per year or natural hazard management, upto US$ 100 million or tourism, more than US$ 5 millionor genetic material and bioprospecting and up to US$331,800 or fsheries.
✤ In the ejido (communally owned land) o Mexcaltitan, Na-yarit, Mexico, the direct and indirect value o mangrovescontribute to 56% o the ejido’s annual wealth increase.
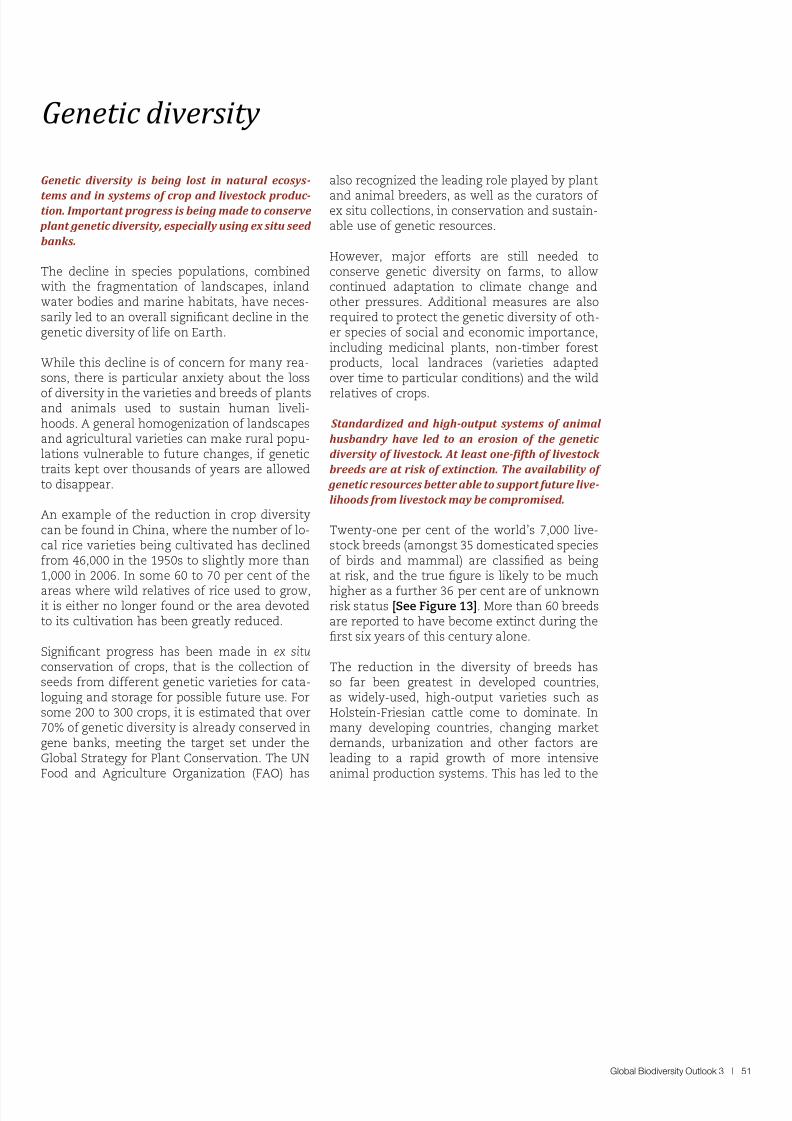
8/8/2019 United Nations - Global Biodiversity Outlook 3 (2010)
http://slidepdf.com/reader/full/united-nations-global-biodiversity-outlook-3-2010 51/96
Global Biodiversity Outlook 3 | 51
Genetic diversity is being lost in natural ecosys-
tems and in systems of crop and livestock produc -tion. Important progress is being made to conserve
plant genetic diversity, especially using ex situ seed
banks.
The decline in species populations, combinedwith the ragmentation o landscapes, inlandwater bodies and marine habitats, have neces-sarily led to an overall signicant decline in thegenetic diversity o lie on Earth.
While this decline is o concern or many rea-sons, there is particular anxiety about the loss
o diversity in the varieties and breeds o plantsand animals used to sustain human liveli-hoods. A general homogenization o landscapesand agricultural varieties can make rural popu-lations vulnerable to uture changes, i genetictraits kept over thousands o years are allowedto disappear.
An example o the reduction in crop diversitycan be ound in China, where the number o lo-cal rice varieties being cultivated has declinedrom 46,000 in the 1950s to slightly more than1,000 in 2006. In some 60 to 70 per cent o the
areas where wild relatives o rice used to grow,it is either no longer ound or the area devotedto its cultivation has been greatly reduced.
Signicant progress has been made in ex situ conservation o crops, that is the collection o seeds rom dierent genetic varieties or cata-loguing and storage or possible uture use. Forsome 200 to 300 crops, it is estimated that over70% o genetic diversity is already conserved ingene banks, meeting the target set under theGlobal Strategy or Plant Conservation. The UNFood and Agriculture Organization (FAO) has
also recognized the leading role played by plant
and animal breeders, as well as the curators o ex situ collections, in conservation and sustain-able use o genetic resources.
However, major eorts are still needed toconserve genetic diversity on arms, to allowcontinued adaptation to climate change andother pressures. Additional measures are alsorequired to protect the genetic diversity o oth-er species o social and economic importance,including medicinal plants, non-timber orestproducts, local landraces (varieties adaptedover time to particular conditions) and the wild
relatives o crops.
Standardized and high-output systems of animal
husbandry have led to an erosion of the genetic
diversity of livestock. At least one-ifth of livestock
breeds are at risk of extinction. The availability of
genetic resources better able to support future live-
lihoods from livestock may be compromised.
Twenty-one per cent o the world’s 7,000 live-stock breeds (amongst 35 domesticated specieso birds and mammal) are classied as beingat risk, and the true gure is likely to be much
higher as a urther 36 per cent are o unknownrisk status [See Figure 13]. More than 60 breedsare reported to have become extinct during therst six years o this century alone.
The reduction in the diversity o breeds hasso ar been greatest in developed countries,as widely-used, high-output varieties such asHolstein-Friesian cattle come to dominate. Inmany developing countries, changing marketdemands, urbanization and other actors areleading to a rapid growth o more intensiveanimal production systems. This has led to the
Genetic diversity
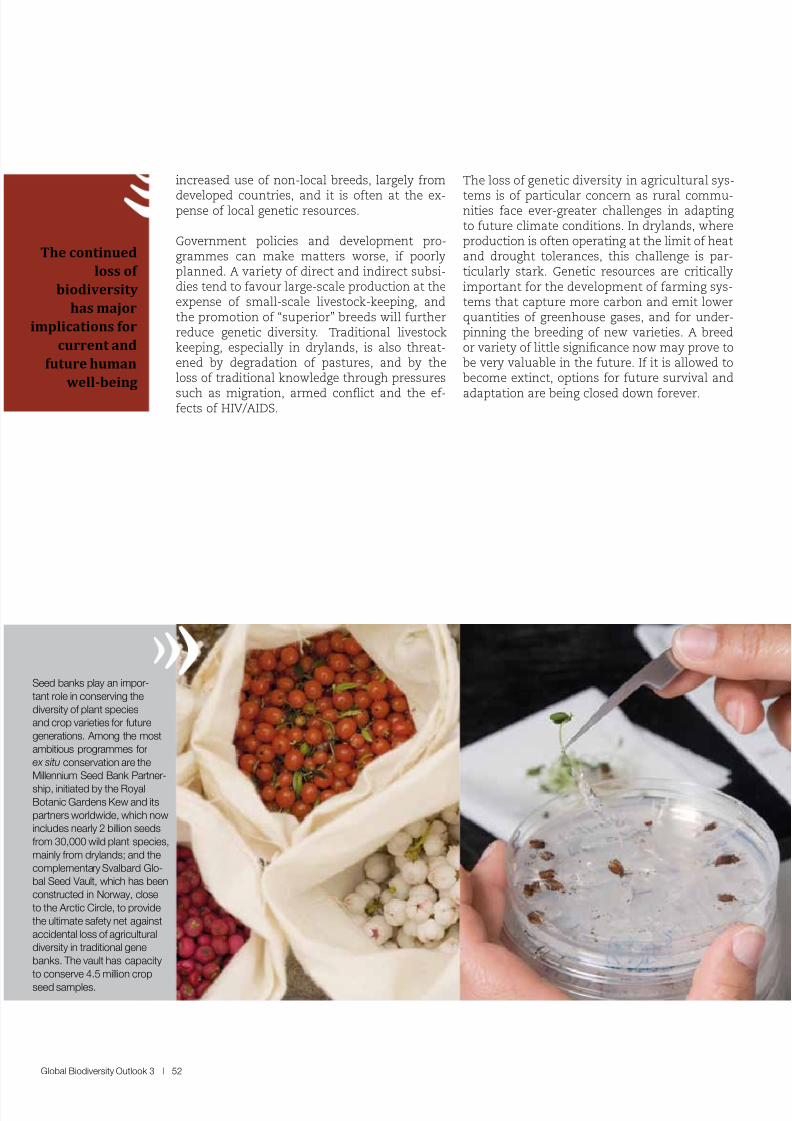
8/8/2019 United Nations - Global Biodiversity Outlook 3 (2010)
http://slidepdf.com/reader/full/united-nations-global-biodiversity-outlook-3-2010 52/96
Global Biodiversity Outlook 3 | 52
The continued
loss of
biodiversity
has major
mplications for
current and
future human
well-being
Seed banks play an impor-ant role in conserving thediversity o plant speciesand crop varieties or uturegenerations. Among the mostambitious programmes orex situ conservation are theMillennium Seed Bank Partner-
ship, initiated by the RoyalBotanic Gardens Kew and itspartners worldwide, which nowncludes nearly 2 billion seedsrom 30,000 wild plant species,mainly rom drylands; and thecomplementary Svalbard Glo-bal Seed Vault, which has beenconstructed in Norway, closeo the Arctic Circle, to providehe ultimate saety net againstaccidental loss o agriculturaldiversity in traditional genebanks. The vault has capacityo conserve 4.5 million cropseed samples.
increased use o non-local breeds, largely rom
developed countries, and it is oten at the ex-pense o local genetic resources.
Government policies and development pro-grammes can make matters worse, i poorlyplanned. A variety o direct and indirect subsi-dies tend to avour large-scale production at theexpense o small-scale livestock-keeping, andthe promotion o “superior” breeds will urtherreduce genetic diversity. Traditional livestockkeeping, especially in drylands, is also threat-ened by degradation o pastures, and by theloss o traditional knowledge through pressures
such as migration, armed confict and the e-ects o HIV/AIDS.
The loss o genetic diversity in agricultural sys-
tems is o particular concern as rural commu-nities ace ever-greater challenges in adaptingto uture climate conditions. In drylands, whereproduction is oten operating at the limit o heatand drought tolerances, this challenge is par-ticularly stark. Genetic resources are criticallyimportant or the development o arming sys-tems that capture more carbon and emit lowerquantities o greenhouse gases, and or under-pinning the breeding o new varieties. A breedor variety o little signicance now may prove tobe very valuable in the uture. I it is allowed tobecome extinct, options or uture survival and
adaptation are being closed down orever.
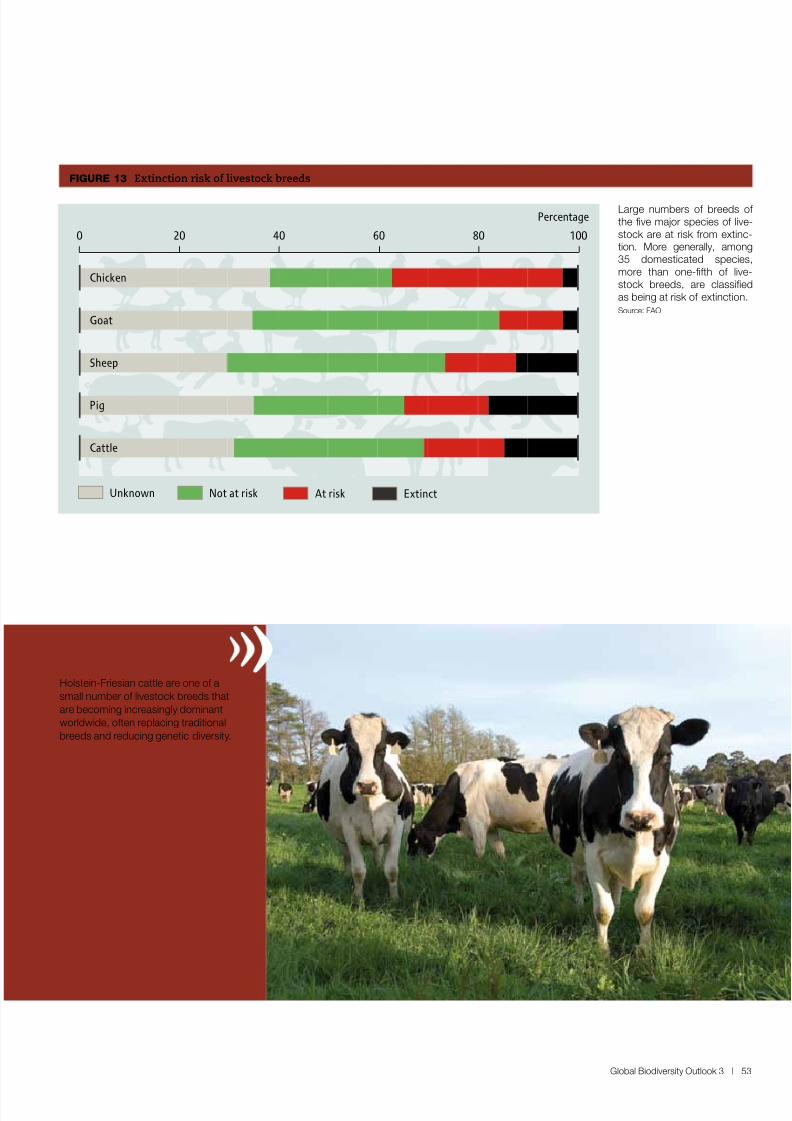
8/8/2019 United Nations - Global Biodiversity Outlook 3 (2010)
http://slidepdf.com/reader/full/united-nations-global-biodiversity-outlook-3-2010 53/96
Global Biodiversity Outlook 3 | 53
Holstein-Friesian cattle are one o asmall number o livestock breeds thatare becoming increasingly dominantworldwide, oten replacing traditionalbreeds and reducing genetic diversity.
FIGURe 13 Extinction risk o livestock breeds
Large numbers o breeds o the fve major species o live-stock are at risk rom extinc-tion. More generally, among35 domesticated species,more than one-fth o live-stock breeds, are classifedas being at risk o extinction.Source: FAO
0 20 40 60 80 100
Chicken
Pig
Cattle
Sheep
Goat
At riskUnknown Not at risk Extinct
Percentage
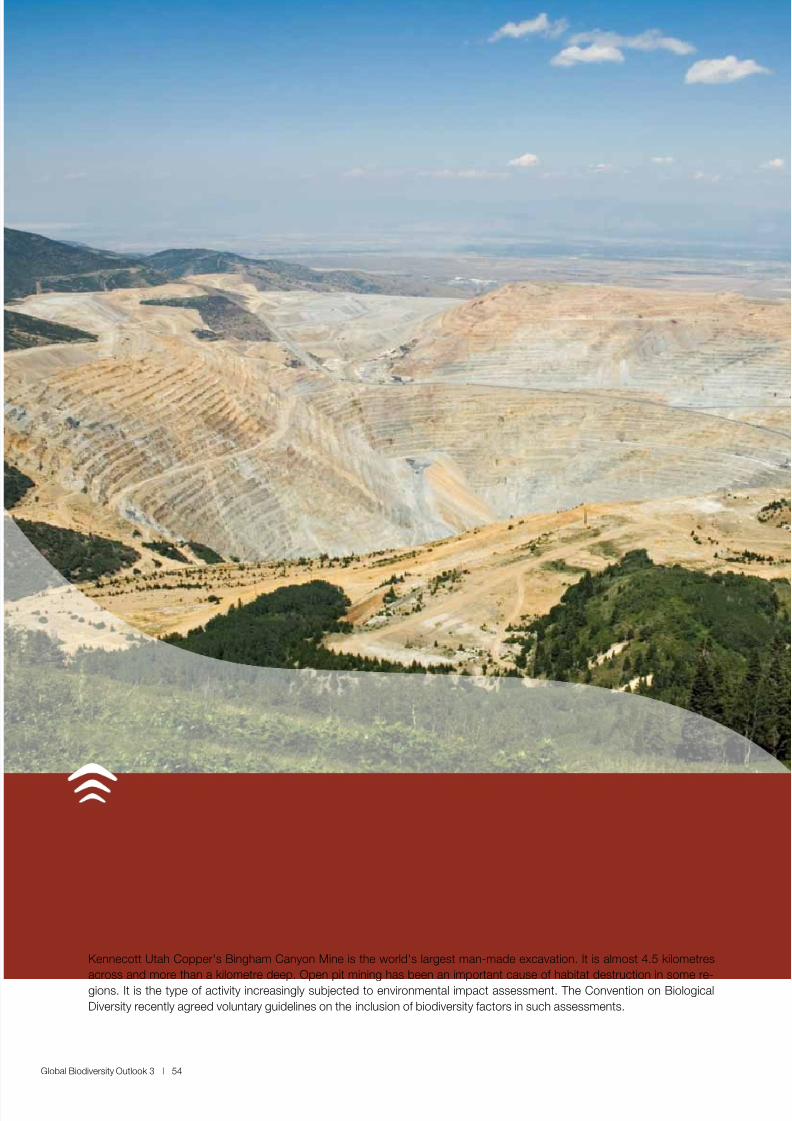
8/8/2019 United Nations - Global Biodiversity Outlook 3 (2010)
http://slidepdf.com/reader/full/united-nations-global-biodiversity-outlook-3-2010 54/96
Global Biodiversity Outlook 3 | 54
Kennecott Utah Copper's Bingham Canyon Mine is the world's largest man-made excavation. It is almost 4.5 kilometres
across and more than a kilometre deep. Open pit mining has been an important cause o habitat destruction in some re-
gions. It is the type o activity increasingly subjected to environmental impact assessment. The Convention on Biological
Diversity recently agreed voluntary guidelines on the inclusion o biodiversity actors in such assessments.
8/8/2019 United Nations - Global Biodiversity Outlook 3 (2010)
http://slidepdf.com/reader/full/united-nations-global-biodiversity-outlook-3-2010 55/96
Global Biodiversity Outlook 3 | 55
Current pressures on biodiversity nd responses
Hbitt loss nd degrdtion
Habitat loss and degradation create the biggest
single source of pressure on biodiversity world -
wide. For terrestrial ecosystems, habitat loss is
largely accounted for by conversion of wild lands
to agriculture, which now accounts for some 30%
of land globally. In some areas, it has recently been
partly driven by the demand for biofuels.
The IUCN Red List assessments show habitatloss driven by agriculture and unsustainable or-est management to be the greatest cause o spe-cies moving closer towards extinction. The sharp
decline o tropical species populations shown inthe Living Planet Index mirrors widespread losso habitat in those regions. For example, in onerecent study the conversion o orest to oil palmplantations was shown to lead to the loss o 73-83% o the bird and butterfy species o the eco-system. As noted above, birds ace an especiallyhigh risk o extinction in South-east Asia, the re-gion that has seen the most extensive develop-ment o oil palm plantations, driven in part bythe growing demand or biouel.
Inrastructure developments, such as housing,
industrial developments, mines and transportnetworks, are also an important contributor toconversion o terrestrial habitats, as is aoresta-tion o non-orested lands. With more than hal o the world’s population now living in urbanareas, urban sprawl has also led to the disap-pearance o many habitats, although the higherpopulation density o cities can also reduce thenegative impacts on biodiversity by requiring thedirect conversion o less land or human habita-tion than more dispersed settlements.
Even though there are no signs at the global levelthat habitat loss is declining signicantly as adriver o biodiversity loss, some countries haveshown that, with determined action, historicallypersistent negative trends can be reversed. Anexample o global signicance is the recent re-duction in the rate o deorestation in the Brazil-ian Amazon, mentioned above.
For inland water ecosystems, habitat loss and deg-
radation is largely accounted for by unsustainable
water use and drainage for conversion to other land
uses, such as agriculture and settlements.
The major pressure on water availability is ab-straction o water or irrigated agriculture, whichuses approximately 70 per cent o the world’swithdrawals o resh water, but water demandsor cities, energy and industry are rapidly grow-ing. The construction o dams and food leveeson rivers also causes habitat loss and ragmen-tation, by converting ree-fowing rivers to res-ervoirs, reducing connectivity between dierentparts o river basins, and cutting o rivers romtheir foodplains.
In coastal ecosystems, habitat loss is driven by a
range of factors including some forms of maricul -
ture, especially shrimp farms in the tropics where
they have often replaced mangroves.
Coastal developments, or housing, recreation,industry and transportation have had importantimpacts on marine ecosystems, through dredg-ing, landlling and disruption o currents, sedi-ment fow and discharge through constructiono jetties and other physical barriers. As notedabove, use o bottom-trawling shing gear can
cause signicant loss o seabed habitat.
They are:✤ Habitat loss and degradation
✤ Climate change
✤ Excessive nutrient load and other forms
of pollution
✤ Over-exploitation and unsustainable use
✤ Invasive alien species
The persistence and in some cases intensiication of the ive principal pressures on biodiversity provide
more evidence that the rate of biodiversity loss is
not being signiicantly reduced. The overwhelming
majority of governments reporting to the CBD
cite these pressures or direct drivers as affecting
biodiversity in their countries.
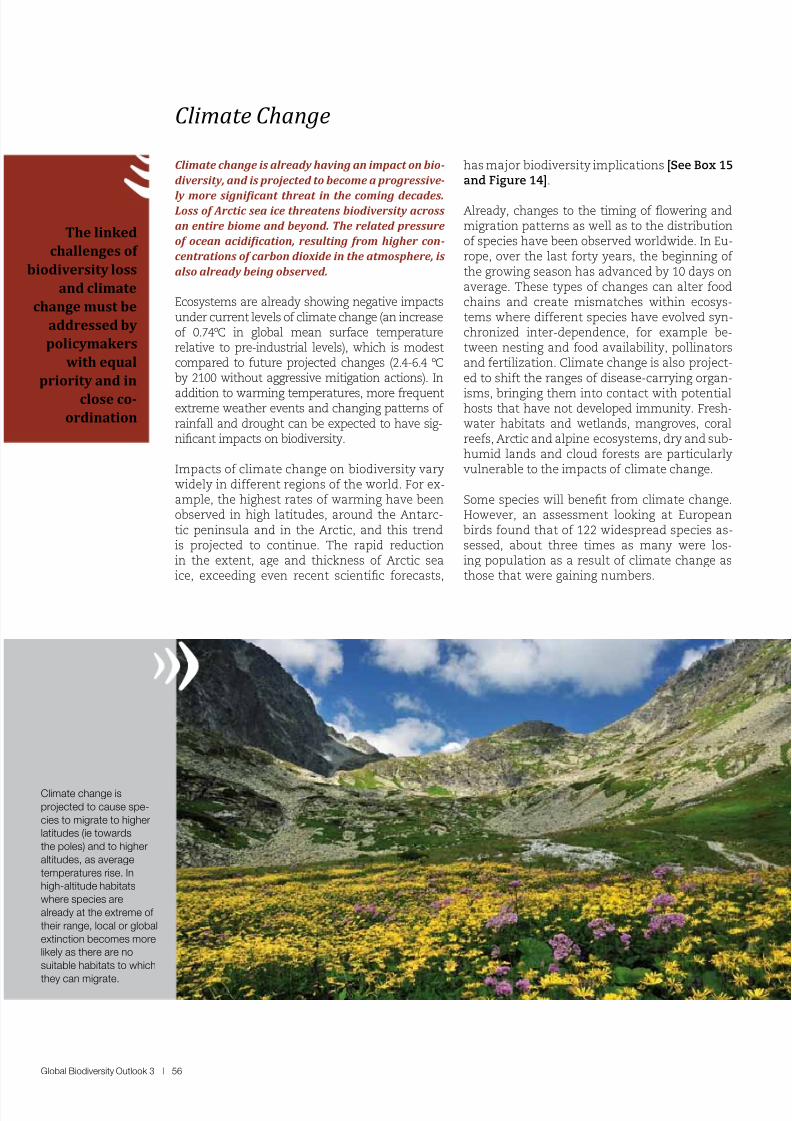
8/8/2019 United Nations - Global Biodiversity Outlook 3 (2010)
http://slidepdf.com/reader/full/united-nations-global-biodiversity-outlook-3-2010 56/96
Global Biodiversity Outlook 3 | 56
Climate change is already having an impact on bio-
diversity, and is projected to become a progressive-
ly more signiicant threat in the coming decades.Loss of Arctic sea ice threatens biodiversity across
an entire biome and beyond. The related pressure
of ocean acidiication, resulting from higher con-
centrations of carbon dioxide in the atmosphere, is
also already being observed.
Ecosystems are already showing negative impactsunder current levels o climate change (an increaseo 0.74ºC in global mean surace temperaturerelative to pre-industrial levels), which is modestcompared to uture projected changes (2.4-6.4 ºCby 2100 without aggressive mitigation actions). In
addition to warming temperatures, more requentextreme weather events and changing patterns o rainall and drought can be expected to have sig-nicant impacts on biodiversity.
Impacts o climate change on biodiversity varywidely in dierent regions o the world. For ex-ample, the highest rates o warming have beenobserved in high latitudes, around the Antarc-tic peninsula and in the Arctic, and this trendis projected to continue. The rapid reductionin the extent, age and thickness o Arctic seaice, exceeding even recent scientic orecasts,
has major biodiversity implications [See Box 15and Figure 14].
Already, changes to the timing o fowering andmigration patterns as well as to the distributiono species have been observed worldwide. In Eu-rope, over the last orty years, the beginning o the growing season has advanced by 10 days onaverage. These types o changes can alter oodchains and create mismatches within ecosys-tems where dierent species have evolved syn-chronized inter-dependence, or example be-tween nesting and ood availability, pollinatorsand ertilization. Climate change is also project-ed to shit the ranges o disease-carrying organ-
isms, bringing them into contact with potentialhosts that have not developed immunity. Fresh-water habitats and wetlands, mangroves, coralrees, Arctic and alpine ecosystems, dry and sub-humid lands and cloud orests are particularlyvulnerable to the impacts o climate change.
Some species will benet rom climate change.However, an assessment looking at Europeanbirds ound that o 122 widespread species as-sessed, about three times as many were los-ing population as a result o climate change asthose that were gaining numbers.
Climte Chnge
Climate change isprojected to cause spe-cies to migrate to higherlatitudes (ie towardsthe poles) and to higheraltitudes, as averagetemperatures rise. Inhigh-altitude habitatswhere species arealready at the extreme o their range, local or globalextinction becomes morelikely as there are nosuitable habitats to which
they can migrate.
The linked
challenges of
iodiversity loss
and climate
change must be
addressed by
policymakers
with equal
priority and in
close co-
ordination
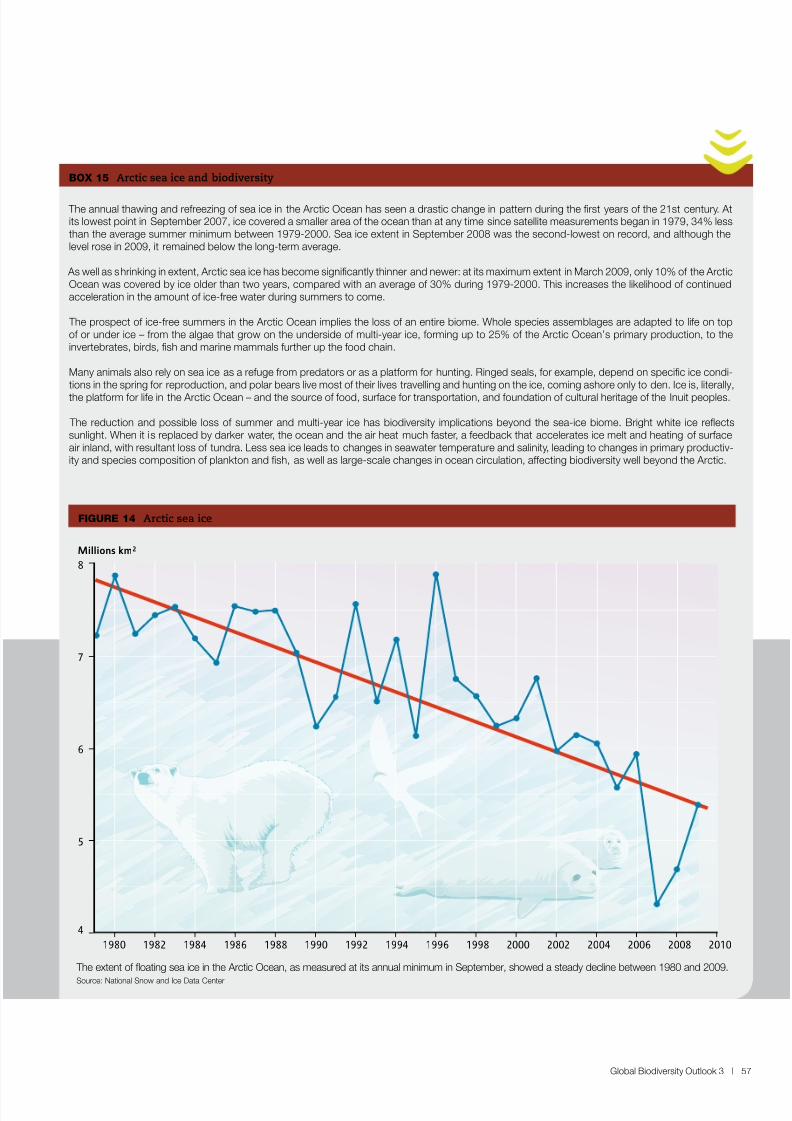
8/8/2019 United Nations - Global Biodiversity Outlook 3 (2010)
http://slidepdf.com/reader/full/united-nations-global-biodiversity-outlook-3-2010 57/96
Global Biodiversity Outlook 3 | 57
The annual thawing and rereezing o sea ice in the Arctic Ocean has seen a drastic change in pattern during the frst years o the 21st century. Atits lowest point in September 2007, ice covered a smaller area o the ocean than at any time since satellite measurements began in 1979, 34% lessthan the average summer minimum between 1979-2000. Sea ice extent in September 2008 was the second-lowest on record, and although thelevel rose in 2009, it remained below the long-term average.
As well as shrinking in extent, Arctic sea ice has become signifcantly thinner and newer: at its maximum extent in March 2009, only 10% o the ArcticOcean was covered by ice older than two years, compared with an average o 30% during 1979-2000. This increases the likelihood o continuedacceleration in the amount o ice-ree water during summers to come.
The prospect o ice-ree summers in the Arctic Ocean implies the loss o an entire biome. Whole species assemblages are adapted to lie on topo or under ice – rom the algae that grow on the underside o multi-year ice, orming up to 25% o the Arctic Ocean’s primary production, to theinvertebrates, birds, fsh and marine mammals urther up the ood chain.
Many animals also rely on sea ice as a reuge rom predators or as a platorm or hunting. Ringed seals, or example, depend on specifc ice condi-tions in the spring or reproduction, and polar bears live most o their lives travelling and hunting on the ice, coming ashore only to den. Ice is, literally,the platorm or lie in the Arctic Ocean – and the source o ood, surace or transportation, and oundation o cultural heritage o the Inuit peoples.
The reduction and possible loss o summer and multi-year ice has biodiversity implications beyond the sea-ice biome. Bright white ice reectssunlight. When it is replaced by darker water, the ocean and the air heat much aster, a eedback that accelerates ice melt and heating o suraceair inland, with resultant loss o tundra. Less sea ice leads to changes in seawater temperature and salinity, leading to changes in primary productiv-ity and species composition o plankton and fsh, as well as large-scale changes in ocean circulation, aecting biodiversity well beyond the Arctic.
BOX 15 Arctic sea ice and biodiversity
1980 1982 1984 1986 1988 1990 1992 1994 1996 1998 2000 2002 2004 2006 2008 2010
4
5
6
7
8
Millions km2
The extent o oating sea ice in the Arctic Ocean, as measured at its annual minimum in September, showed a steady decline between 1980 and 2009.
Source: National Snow and Ice Data Center
FIGURe 14 Arctic sea ice
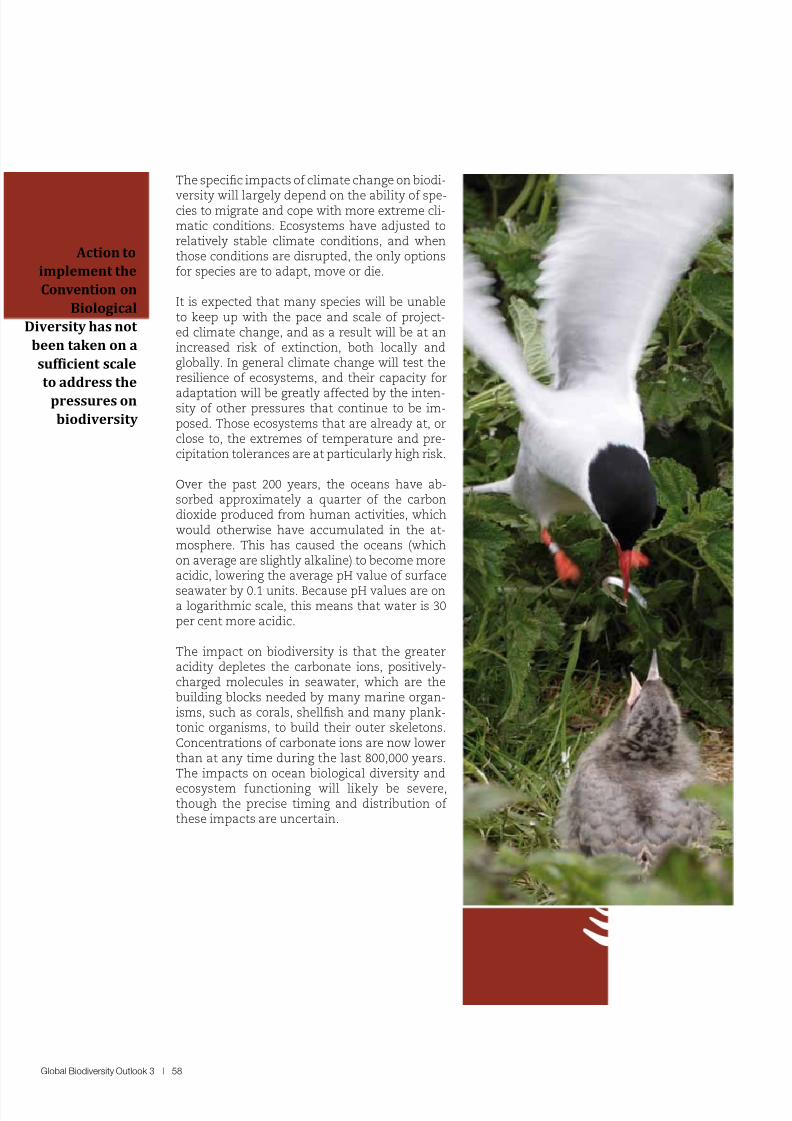
8/8/2019 United Nations - Global Biodiversity Outlook 3 (2010)
http://slidepdf.com/reader/full/united-nations-global-biodiversity-outlook-3-2010 58/96
Global Biodiversity Outlook 3 | 58
The specic impacts o climate change on biodi-
versity will largely depend on the ability o spe-cies to migrate and cope with more extreme cli-matic conditions. Ecosystems have adjusted torelatively stable climate conditions, and whenthose conditions are disrupted, the only optionsor species are to adapt, move or die.
It is expected that many species will be unableto keep up with the pace and scale o project-ed climate change, and as a result will be at anincreased risk o extinction, both locally andglobally. In general climate change will test theresilience o ecosystems, and their capacity or
adaptation will be greatly aected by the inten-sity o other pressures that continue to be im-posed. Those ecosystems that are already at, orclose to, the extremes o temperature and pre-cipitation tolerances are at particularly high risk.
Over the past 200 years, the oceans have ab-sorbed approximately a quarter o the carbondioxide produced rom human activities, whichwould otherwise have accumulated in the at-mosphere. This has caused the oceans (whichon average are slightly alkaline) to become moreacidic, lowering the average pH value o surace
seawater by 0.1 units. Because pH values are ona logarithmic scale, this means that water is 30per cent more acidic.
The impact on biodiversity is that the greateracidity depletes the carbonate ions, positively-charged molecules in seawater, which are thebuilding blocks needed by many marine organ-isms, such as corals, shellsh and many plank-tonic organisms, to build their outer skeletons.Concentrations o carbonate ions are now lowerthan at any time during the last 800,000 years.The impacts on ocean biological diversity and
ecosystem unctioning will likely be severe,though the precise timing and distribution o these impacts are uncertain.
Action to
implement the
Convention on
Biological
iversity has not
been taken on a
suficient scale
to address the
pressures on
biodiversity
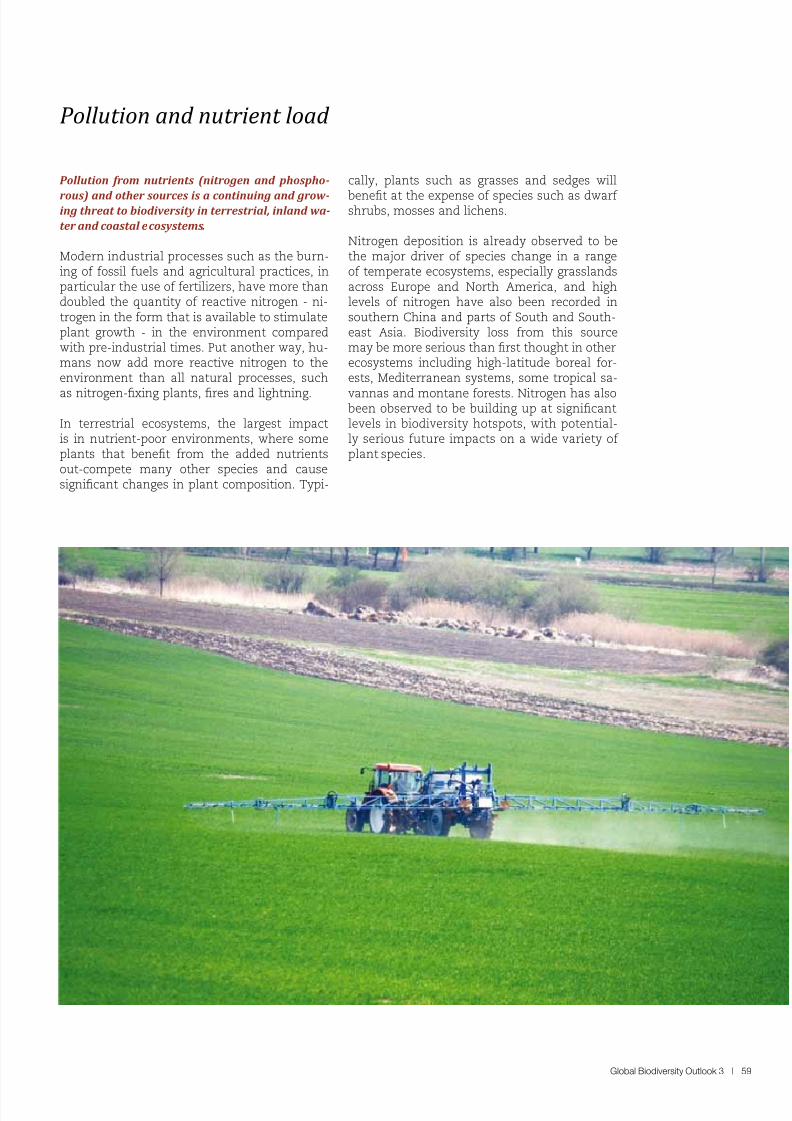
8/8/2019 United Nations - Global Biodiversity Outlook 3 (2010)
http://slidepdf.com/reader/full/united-nations-global-biodiversity-outlook-3-2010 59/96
Global Biodiversity Outlook 3 | 59
Pollution nd nutrient lod
Pollution from nutrients (nitrogen and phospho-
rous) and other sources is a continuing and grow -ing threat to biodiversity in terrestrial, inland wa-
ter and coastal ecosystems.
Modern industrial processes such as the burn-ing o ossil uels and agricultural practices, inparticular the use o ertilizers, have more thandoubled the quantity o reactive nitrogen - ni-trogen in the orm that is available to stimulateplant growth - in the environment comparedwith pre-industrial times. Put another way, hu-mans now add more reactive nitrogen to theenvironment than all natural processes, such
as nitrogen-xing plants, res and lightning.
In terrestrial ecosystems, the largest impactis in nutrient-poor environments, where someplants that benet rom the added nutrientsout-compete many other species and causesignicant changes in plant composition. Typi-
cally, plants such as grasses and sedges will
benet at the expense o species such as dwar shrubs, mosses and lichens.
Nitrogen deposition is already observed to bethe major driver o species change in a rangeo temperate ecosystems, especially grasslandsacross Europe and North America, and highlevels o nitrogen have also been recorded insouthern China and parts o South and South-east Asia. Biodiversity loss rom this sourcemay be more serious than rst thought in otherecosystems including high-latitude boreal or-ests, Mediterranean systems, some tropical sa-
vannas and montane orests. Nitrogen has alsobeen observed to be building up at signicantlevels in biodiversity hotspots, with potential-ly serious uture impacts on a wide variety o plant species.
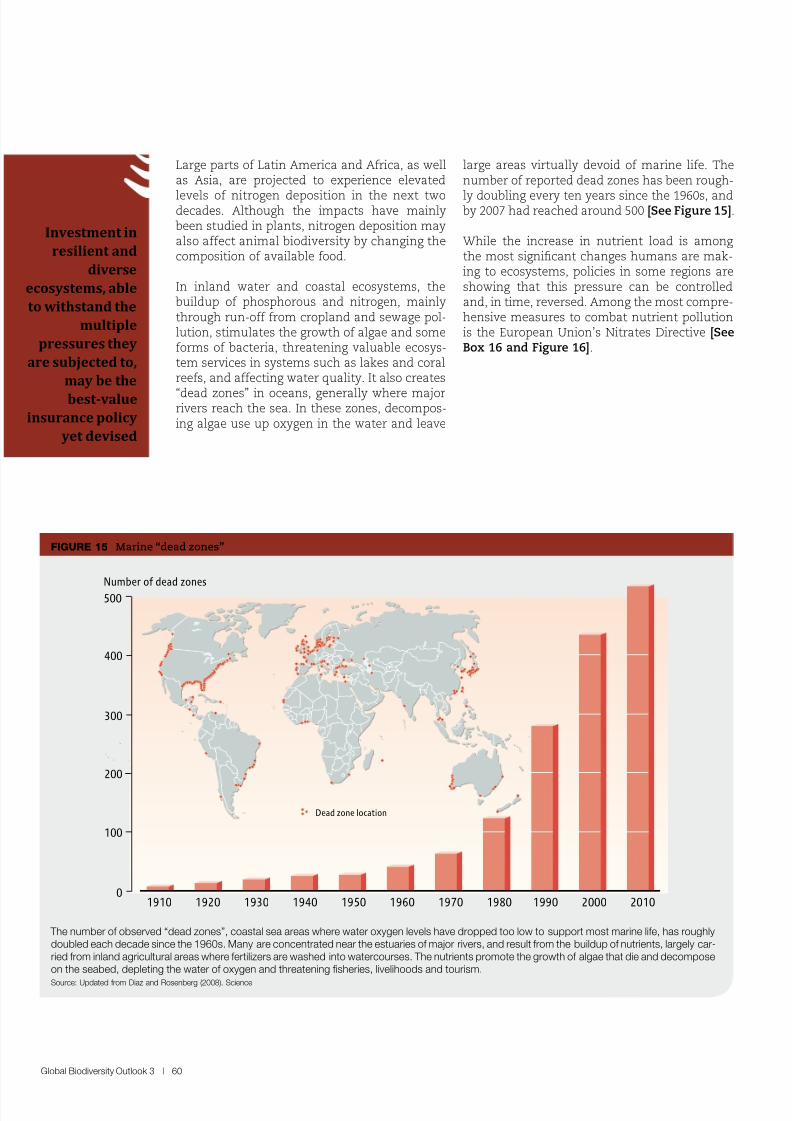
8/8/2019 United Nations - Global Biodiversity Outlook 3 (2010)
http://slidepdf.com/reader/full/united-nations-global-biodiversity-outlook-3-2010 60/96
Global Biodiversity Outlook 3 | 60
Investment in
resilient and
diverse
cosystems, able
o withstand the
multiple
pressures they
re subjected to,
may be the
best-value
nsurance policy
yet devised
Large parts o Latin America and Arica, as wellas Asia, are projected to experience elevated
levels o nitrogen deposition in the next twodecades. Although the impacts have mainlybeen studied in plants, nitrogen deposition mayalso aect animal biodiversity by changing thecomposition o available ood.
In inland water and coastal ecosystems, thebuildup o phosphorous and nitrogen, mainlythrough run-o rom cropland and sewage pol-lution, stimulates the growth o algae and someorms o bacteria, threatening valuable ecosys-tem services in systems such as lakes and coralrees, and aecting water quality. It also creates
“dead zones” in oceans, generally where majorrivers reach the sea. In these zones, decompos-ing algae use up oxygen in the water and leave
large areas virtually devoid o marine lie. Thenumber o reported dead zones has been rough-
ly doubling every ten years since the 1960s, andby 2007 had reached around 500 [See Figure 15].
While the increase in nutrient load is amongthe most signicant changes humans are mak-ing to ecosystems, policies in some regions areshowing that this pressure can be controlledand, in time, reversed. Among the most compre-hensive measures to combat nutrient pollutionis the European Union’s Nitrates Directive [SeeBox 16 and Figure 16].
1990 2000 2010
200
1910 1920 1930 1940 1950 1960 1970 1980
Number of dead zones
0
300
500
100
400
Dead zone location
FIGURe 15 Marine “dead zones”
The number o observed “dead zones”, coastal sea areas where water oxygen levels have dropped too low to support most marine lie, has roughlydoubled each decade since the 1960s. Many are concentrated near the estuaries o major rivers, and result rom the buildup o nutrients, largely car-ried rom inland agricultural areas where ertilizers are washed into watercourses. The nutrients promote the growth o algae that die and decomposeon the seabed, depleting the water o oxygen and threatening fsheries, livelihoods and tourism.
Source: Updated rom Diaz and Rosenberg (2008). Science
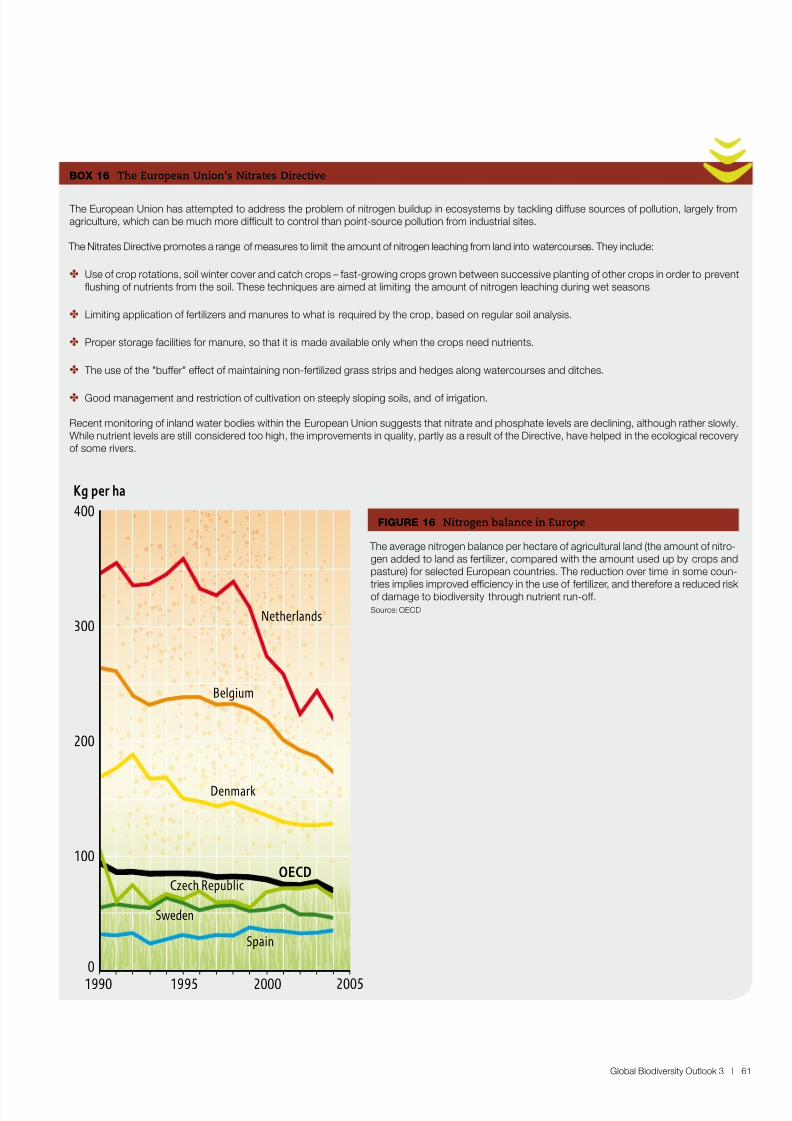
8/8/2019 United Nations - Global Biodiversity Outlook 3 (2010)
http://slidepdf.com/reader/full/united-nations-global-biodiversity-outlook-3-2010 61/96
Global Biodiversity Outlook 3 | 61
The European Union has attempted to address the problem o nitrogen buildup in ecosystems by tackling diuse sources o pollution, largely romagriculture, which can be much more difcult to control than point-source pollution rom industrial sites.
The Nitrates Directive promotes a range o measures to limit the amount o nitrogen leaching rom land into watercourses. They include:
✤ Use o crop rotations, soil winter cover and catch crops – ast-growing crops grown between successive planting o other crops in order to preventushing o nutrients rom the soil. These techniques are aimed at limiting the amount o nitrogen leaching during wet seasons.
✤ Limiting application o ertilizers and manures to what is required by the crop, based on regular soil analysis.
✤ Proper storage acilities or manure, so that it is made available only when the crops need nutrients.
✤ The use o the "buer" eect o maintaining non-ertilized grass strips and hedges along watercourses and ditches.
✤ Good management and restriction o cultivation on steeply sloping soils, and o irrigation.
Recent monitoring o inland water bodies within the European Union suggests that nitrate and phosphate levels are declining, although rather slowly.While nutrient levels are still considered too high, the improvements in quality, partly as a result o the Directive, have helped in the ecological recoveryo some rivers.
BOX 16 The European Union’s Nitrates Directive
Netherlands
Kg per ha
1990 1995 2000 2005
0
100
200
300
400
Belgium
Denmark
OECDCzech Republic
Sweden
Spain
The average nitrogen balance per hectare o agricultural land (the amount o nitro-gen added to land as ertilizer, compared with the amount used up by crops andpasture) or selected European countries. The reduction over time in some coun-
tries implies improved efciency in the use o ertilizer, and thereore a reduced risko damage to biodiversity through nutrient run-o.Source: OECD
FIGURe 16 Nitrogen balance in Europe
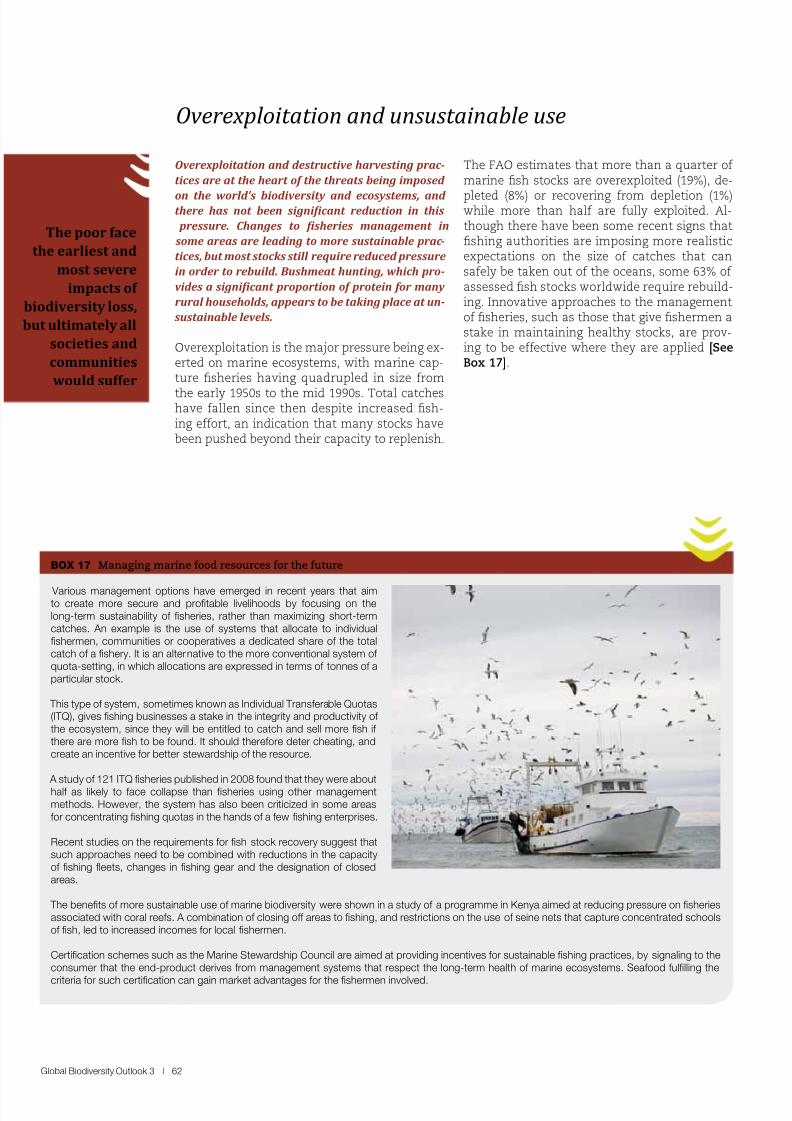
8/8/2019 United Nations - Global Biodiversity Outlook 3 (2010)
http://slidepdf.com/reader/full/united-nations-global-biodiversity-outlook-3-2010 62/96
Global Biodiversity Outlook 3 | 62
Overexploittion nd unsustinble use
Various management options have emerged in recent years that aimto create more secure and proftable livelihoods by ocusing on thelong-term sustainability o fsheries, rather than maximizing short-termcatches. An example is the use o systems that allocate to individualfshermen, communities or cooperatives a dedicated share o the totalcatch o a fshery. It is an alternative to the more conventional system o quota-setting, in which allocations are expressed in terms o tonnes o aparticular stock.
This type o system, sometimes known as Individual Transerable Quotas(ITQ), gives fshing businesses a stake in the integrity and productivity o the ecosystem, since they will be entitled to catch and sell more fsh i there are more fsh to be ound. It should thereore deter cheating, andcreate an incentive or better stewardship o the resource.
A study o 121 ITQ fsheries published in 2008 ound that they were abouthal as likely to ace collapse than fsheries using other managementmethods. However, the system has also been criticized in some areasor concentrating fshing quotas in the hands o a ew fshing enterprises.
Recent studies on the requirements or fsh stock recovery suggest thatsuch approaches need to be combined with reductions in the capacityo fshing eets, changes in fshing gear and the designation o closedareas.
The benefts o more sustainable use o marine biodiversity were shown in a study o a programme in Kenya aimed at reducing pressure on fsheriesassociated with coral rees. A combination o closing o areas to fshing, and restrictions on the use o seine nets that capture concentrated schoolso fsh, led to increased incomes or local fshermen.
Certifcation schemes such as the Marine Stewardship Council are aimed at providing incentives or sustainable fshing practices, by signaling to theconsumer that the end-product derives rom management systems that respect the long-term health o marine ecosystems. Seaood ulflling the
criteria or such certifcation can gain market advantages or the fshermen involved.
BOX 17 Managing marine ood resources or the uture
Overexploitation and destructive harvesting prac -
tices are at the heart of the threats being imposed
on the world’s biodiversity and ecosystems, and there has not been signiicant reduction in this
pressure. Changes to isheries management in
some areas are leading to more sustainable prac -
tices, but most stocks still require reduced pressure
in order to rebuild. Bushmeat hunting, which pro-
vides a signiicant proportion of protein for many
rural households, appears to be taking place at un-
sustainable levels.
Overexploitation is the major pressure being ex-erted on marine ecosystems, with marine cap-ture sheries having quadrupled in size rom
the early 1950s to the mid 1990s. Total catcheshave allen since then despite increased sh-ing eort, an indication that many stocks havebeen pushed beyond their capacity to replenish.
The FAO estimates that more than a quarter o marine sh stocks are overexploited (19%), de-
pleted (8%) or recovering rom depletion (1%)while more than hal are ully exploited. Al-though there have been some recent signs thatshing authorities are imposing more realisticexpectations on the size o catches that cansaely be taken out o the oceans, some 63% o assessed sh stocks worldwide require rebuild-ing. Innovative approaches to the managemento sheries, such as those that give shermen astake in maintaining healthy stocks, are prov-ing to be eective where they are applied [SeeBox 17].
The poor face
the earliest and
most severe
impacts of
iodiversity loss,
ut ultimately all
societies and
communities
would suffer
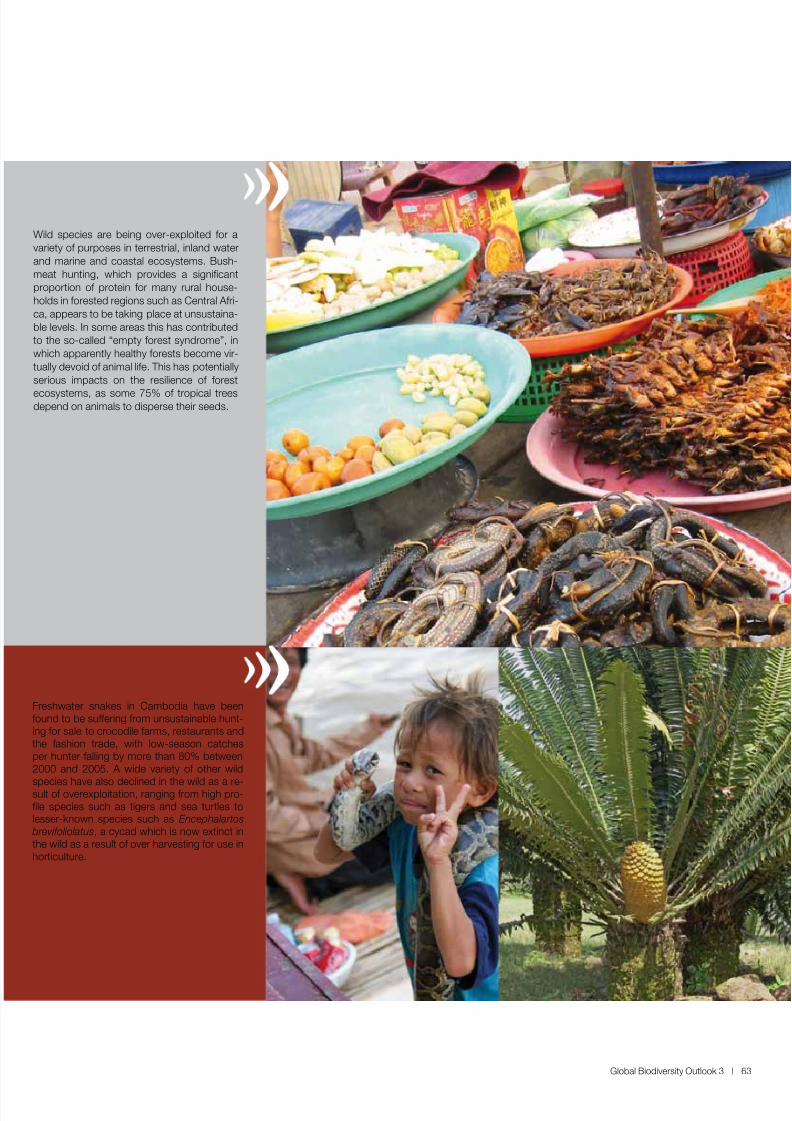
8/8/2019 United Nations - Global Biodiversity Outlook 3 (2010)
http://slidepdf.com/reader/full/united-nations-global-biodiversity-outlook-3-2010 63/96
Global Biodiversity Outlook 3 | 63
Freshwater snakes in Cambodia have beenound to be suering rom unsustainable hunt-ng or sale to crocodile arms, restaurants andhe ashion trade, with low-season catches
per hunter alling by more than 80% between2000 and 2005. A wide variety o other wild
species have also declined in the wild as a re-sult o overexploitation, ranging rom high pro-fle species such as tigers and sea turtles toesser-known species such as Encephalartos
brevioliolatus, a cycad which is now extinct inhe wild as a result o over harvesting or use in
horticulture.
Wild species are being over-exploited or avariety o purposes in terrestrial, inland waterand marine and coastal ecosystems. Bush-meat hunting, which provides a signifcantproportion o protein or many rural house-holds in orested regions such as Central Ari-ca, appears to be taking place at unsustaina-ble levels. In some areas this has contributedto the so-called “empty orest syndrome”, inwhich apparently healthy orests become vir-tually devoid o animal lie. This has potentiallyserious impacts on the resilience o orest
ecosystems, as some 75% o tropical treesdepend on animals to disperse their seeds.
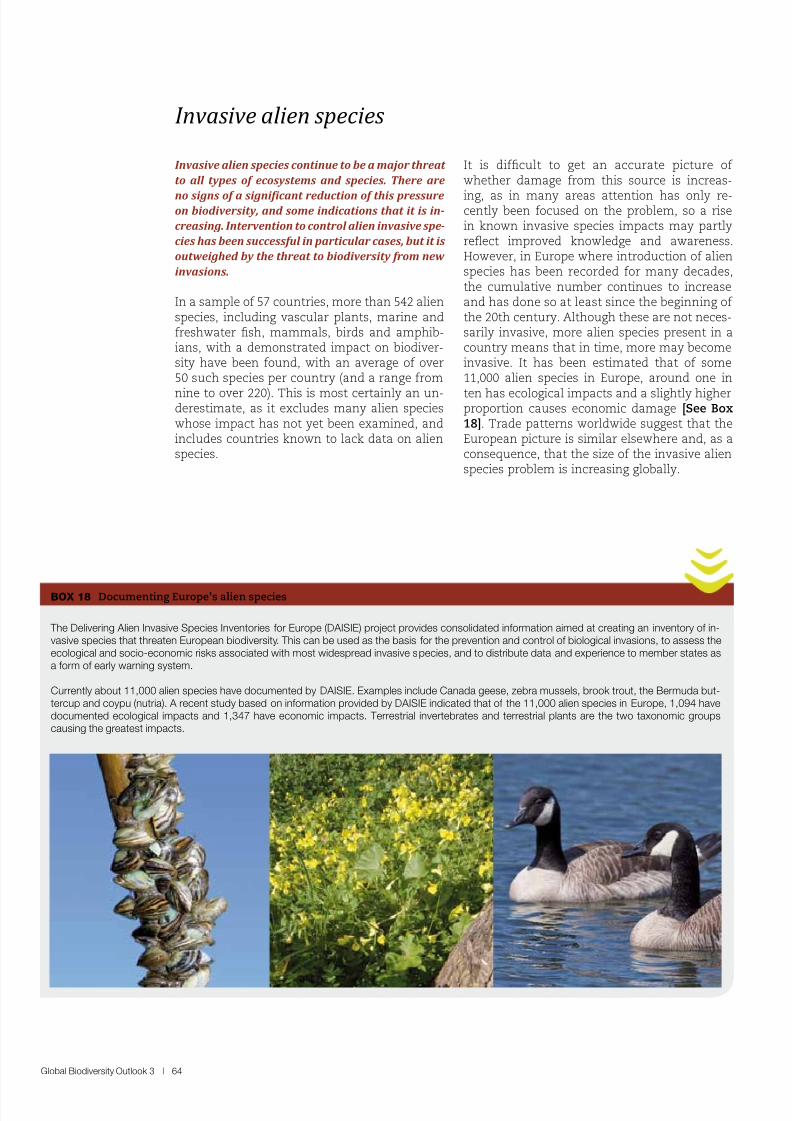
8/8/2019 United Nations - Global Biodiversity Outlook 3 (2010)
http://slidepdf.com/reader/full/united-nations-global-biodiversity-outlook-3-2010 64/96
Global Biodiversity Outlook 3 | 64
Invsive lien species
Invasive alien species continue to be a major threat
to all types of ecosystems and species. There are
no signs of a signiicant reduction of this pressureon biodiversity, and some indications that it is in-
creasing. Intervention to control alien invasive spe-
cies has been successful in particular cases, but it is
outweighed by the threat to biodiversity from new
invasions.
In a sample o 57 countries, more than 542 alienspecies, including vascular plants, marine andreshwater sh, mammals, birds and amphib-ians, with a demonstrated impact on biodiver-sity have been ound, with an average o over50 such species per country (and a range rom
nine to over 220). This is most certainly an un-derestimate, as it excludes many alien specieswhose impact has not yet been examined, andincludes countries known to lack data on alienspecies.
It is dicult to get an accurate picture o whether damage rom this source is increas-
ing, as in many areas attention has only re-cently been ocused on the problem, so a risein known invasive species impacts may partlyrefect improved knowledge and awareness.However, in Europe where introduction o alienspecies has been recorded or many decades,the cumulative number continues to increaseand has done so at least since the beginning o the 20th century. Although these are not neces-sarily invasive, more alien species present in acountry means that in time, more may becomeinvasive. It has been estimated that o some11,000 alien species in Europe, around one in
ten has ecological impacts and a slightly higherproportion causes economic damage [See Box18]. Trade patterns worldwide suggest that theEuropean picture is similar elsewhere and, as aconsequence, that the size o the invasive alienspecies problem is increasing globally.
The Delivering Alien Invasive Species Inventories or Europe (DAISIE) project provides consolidated inormation aimed at creating an inventory o in-vasive species that threaten European biodiversity. This can be used as the basis or the prevention and control o biological invasions, to assess theecological and socio-economic risks associated with most widespread invasive species, and to distribute data and experience to member states asa orm o early warning system.
Currently about 11,000 alien species have documented by DAISIE. Examples include Canada geese, zebra mussels, brook trout, the Bermuda but-tercup and coypu (nutria). A recent study based on inormation provided by DAISIE indicated that o the 11,000 alien species in Europe, 1,094 havedocumented ecological impacts and 1,347 have economic impacts. Terrestrial invertebrates and terrestrial plants are the two taxonomic groupscausing the greatest impacts.
BOX 18 Documenting Europe’s alien species
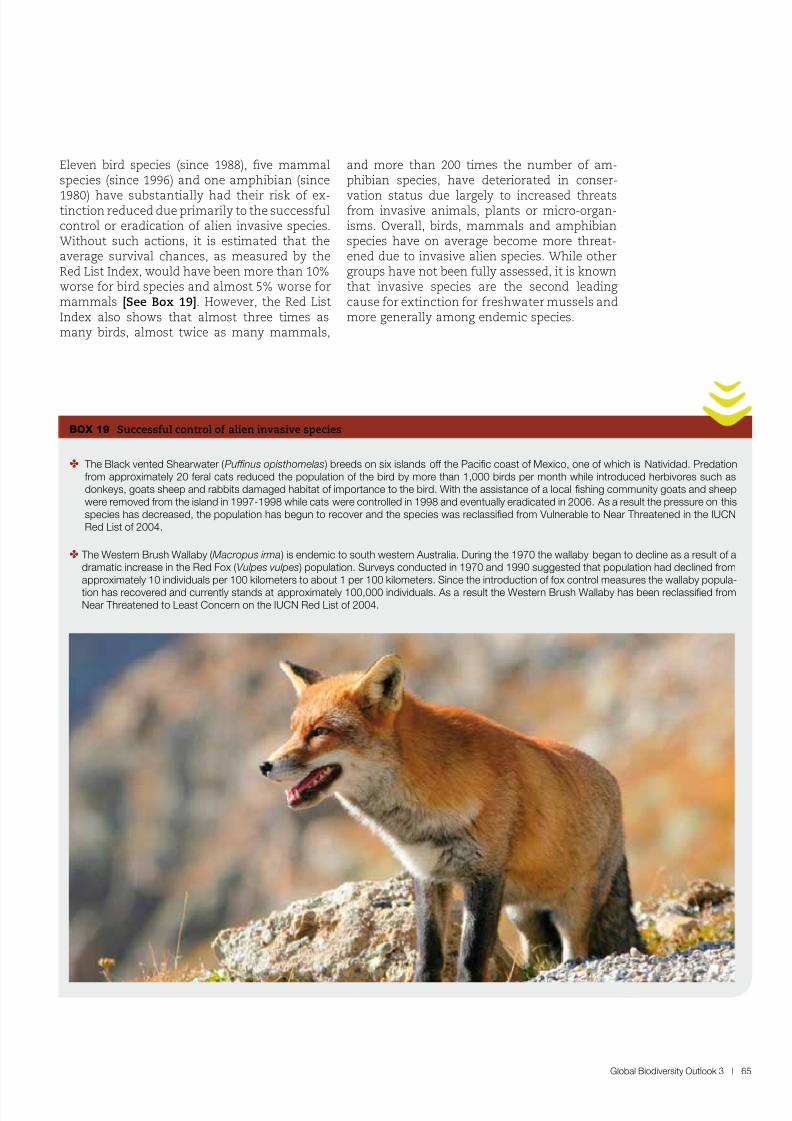
8/8/2019 United Nations - Global Biodiversity Outlook 3 (2010)
http://slidepdf.com/reader/full/united-nations-global-biodiversity-outlook-3-2010 65/96
Global Biodiversity Outlook 3 | 65
✤ The Black vented Shearwater (Pufnus opisthomelas) breeds on six islands o the Pacifc coast o Mexico, one o which is Natividad. Predationrom approximately 20 eral cats reduced the population o the bird by more than 1,000 birds per month while introduced herbivores such asdonkeys, goats sheep and rabbits damaged habitat o importance to the bird. With the assistance o a local fshing community goats and sheepwere removed rom the island in 1997-1998 while cats were controlled in 1998 and eventually eradicated in 2006. As a result the pressure on thisspecies has decreased, the population has begun to recover and the species was reclassifed rom Vulnerable to Near Threatened in the IUCNRed List o 2004.
✤ The Western Brush Wallaby (Macropus irma) is endemic to south western Australia. During the 1970 the wallaby began to decline as a result o adramatic increase in the Red Fox (Vulpes vulpes) population. Surveys conducted in 1970 and 1990 suggested that population had declined romapproximately 10 individuals per 100 kilometers to about 1 per 100 kilometers. Since the introduction o ox control measures the wallaby popula-
tion has recovered and currently stands at approximately 100,000 individuals. As a result the Western Brush Wallaby has been reclassifed romNear Threatened to Least Concern on the IUCN Red List o 2004.
BOX 19 Successul control o alien invasive species
Eleven bird species (since 1988), ve mammalspecies (since 1996) and one amphibian (since
1980) have substantially had their risk o ex-tinction reduced due primarily to the successulcontrol or eradication o alien invasive species.Without such actions, it is estimated that theaverage survival chances, as measured by theRed List Index, would have been more than 10%worse or bird species and almost 5% worse ormammals [See Box 19]. However, the Red ListIndex also shows that almost three times asmany birds, almost twice as many mammals,
and more than 200 times the number o am-phibian species, have deteriorated in conser-
vation status due largely to increased threatsrom invasive animals, plants or micro-organ-isms. Overall, birds, mammals and amphibianspecies have on average become more threat-ened due to invasive alien species. While othergroups have not been ully assessed, it is knownthat invasive species are the second leadingcause or extinction or reshwater mussels andmore generally among endemic species.
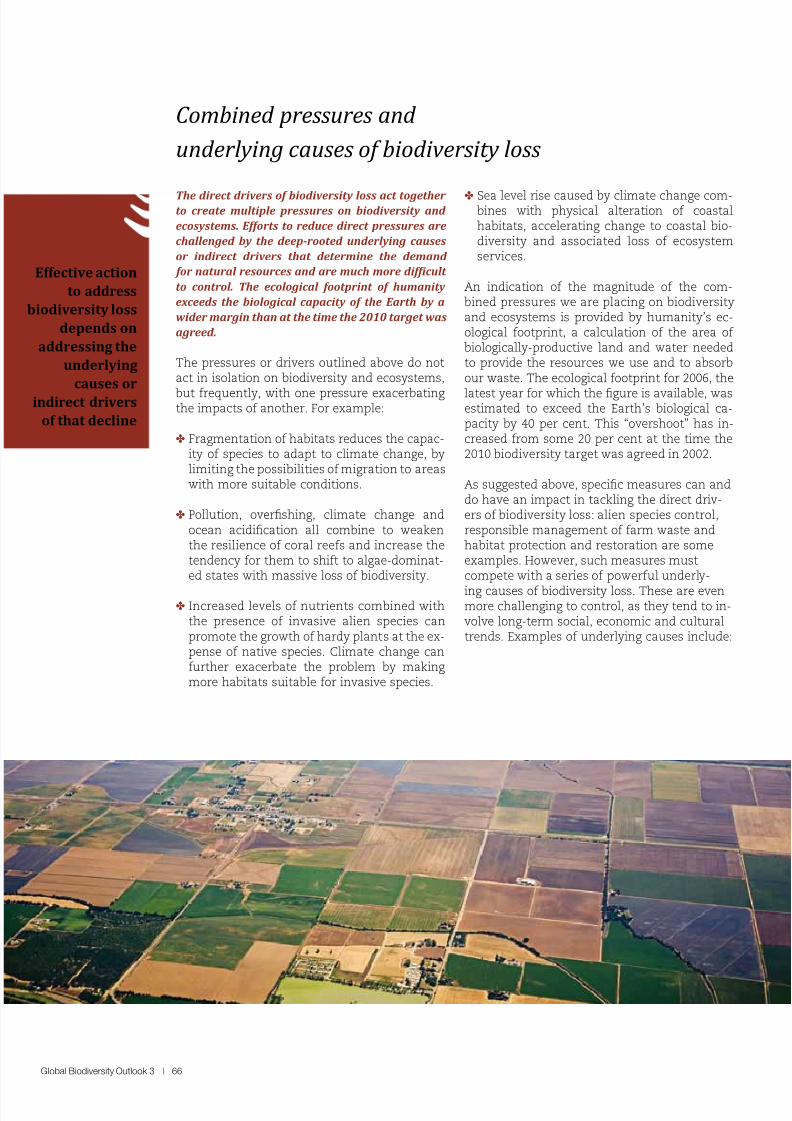
8/8/2019 United Nations - Global Biodiversity Outlook 3 (2010)
http://slidepdf.com/reader/full/united-nations-global-biodiversity-outlook-3-2010 66/96
Global Biodiversity Outlook 3 | 66
Combined pressures nd
underlying cuses of biodiversity loss
The direct drivers of biodiversity loss act together to create multiple pressures on biodiversity and
ecosystems. Efforts to reduce direct pressures are
challenged by the deep-rooted underlying causes
or indirect drivers that determine the demand
for natural resources and are much more dificult
to control. The ecological footprint of humanity
exceeds the biological capacity of the Earth by a
wider margin than at the time the 2010 target was
agreed.
The pressures or drivers outlined above do notact in isolation on biodiversity and ecosystems,
but requently, with one pressure exacerbatingthe impacts o another. For example:
✤ Fragmentation o habitats reduces the capac-ity o species to adapt to climate change, bylimiting the possibilities o migration to areaswith more suitable conditions.
✤ Pollution, overshing, climate change andocean acidication all combine to weakenthe resilience o coral rees and increase thetendency or them to shit to algae-dominat-ed states with massive loss o biodiversity.
✤ Increased levels o nutrients combined withthe presence o invasive alien species canpromote the growth o hardy plants at the ex-pense o native species. Climate change canurther exacerbate the problem by makingmore habitats suitable or invasive species.
✤ Sea level rise caused by climate change com-bines with physical alteration o coastalhabitats, accelerating change to coastal bio-diversity and associated loss o ecosystemservices.
An indication o the magnitude o the com-bined pressures we are placing on biodiversityand ecosystems is provided by humanity’s ec-ological ootprint, a calculation o the area o biologically-productive land and water neededto provide the resources we use and to absorbour waste. The ecological ootprint or 2006, the
latest year or which the gure is available, wasestimated to exceed the Earth’s biological ca-pacity by 40 per cent. This “overshoot” has in-creased rom some 20 per cent at the time the2010 biodiversity target was agreed in 2002.
As suggested above, specic measures can anddo have an impact in tackling the direct driv-ers o biodiversity loss: alien species control,responsible management o arm waste andhabitat protection and restoration are someexamples. However, such measures mustcompete with a series o powerul underly-
ing causes o biodiversity loss. These are evenmore challenging to control, as they tend to in-volve long-term social, economic and culturaltrends. Examples o underlying causes include:
Effective action
to address
iodiversity loss
depends on
addressing the
underlying
causes or
indirect drivers
of that decline
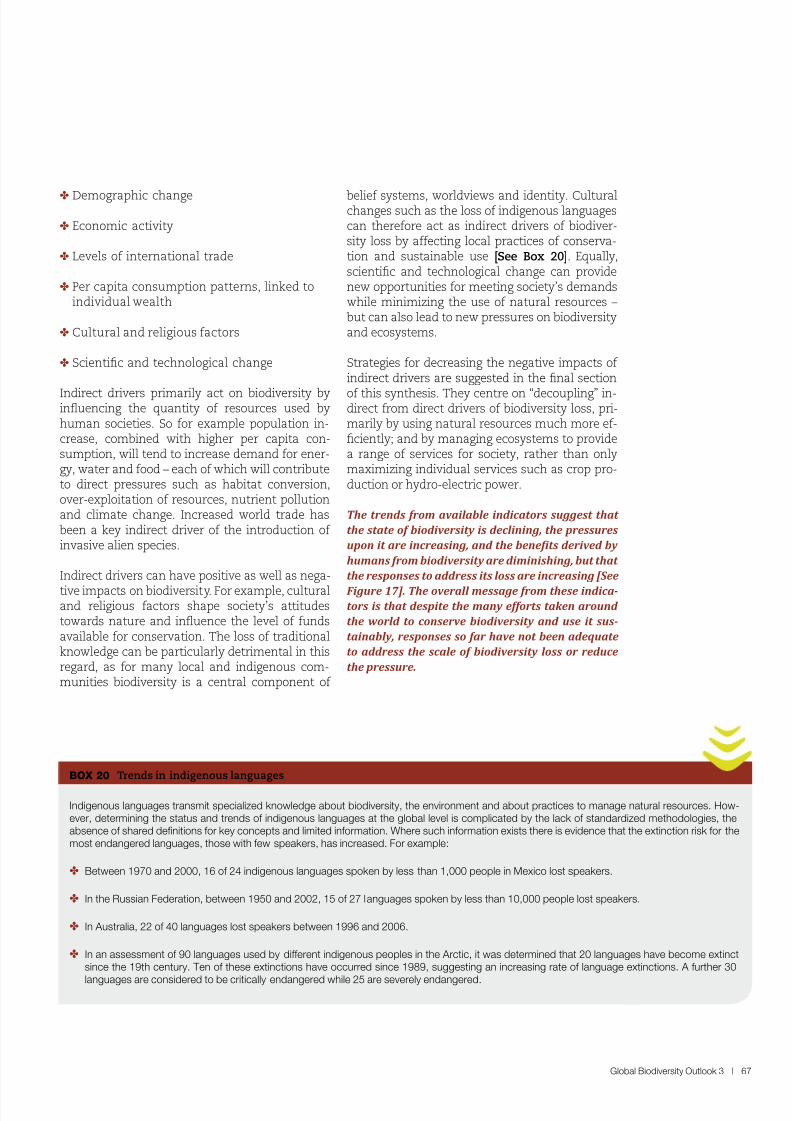
8/8/2019 United Nations - Global Biodiversity Outlook 3 (2010)
http://slidepdf.com/reader/full/united-nations-global-biodiversity-outlook-3-2010 67/96
Global Biodiversity Outlook 3 | 67
✤ Demographic change
✤ Economic activity
✤ Levels o international trade
✤ Per capita consumption patterns, linked toindividual wealth
✤ Cultural and religious actors
✤ Scientic and technological change
Indirect drivers primarily act on biodiversity byinfuencing the quantity o resources used byhuman societies. So or example population in-crease, combined with higher per capita con-sumption, will tend to increase demand or ener-gy, water and ood – each o which will contributeto direct pressures such as habitat conversion,over-exploitation o resources, nutrient pollutionand climate change. Increased world trade hasbeen a key indirect driver o the introduction o invasive alien species.
Indirect drivers can have positive as well as nega-
tive impacts on biodiversity. For example, culturaland religious actors shape society’s attitudestowards nature and infuence the level o undsavailable or conservation. The loss o traditionalknowledge can be particularly detrimental in thisregard, as or many local and indigenous com-munities biodiversity is a central component o
belie systems, worldviews and identity. Culturalchanges such as the loss o indigenous languagescan thereore act as indirect drivers o biodiver-sity loss by aecting local practices o conserva-tion and sustainable use [See Box 20]. Equally,scientic and technological change can providenew opportunities or meeting society’s demandswhile minimizing the use o natural resources –but can also lead to new pressures on biodiversityand ecosystems.
Strategies or decreasing the negative impacts o indirect drivers are suggested in the nal section
o this synthesis. They centre on “decoupling” in-direct rom direct drivers o biodiversity loss, pri-marily by using natural resources much more e-ciently; and by managing ecosystems to providea range o services or society, rather than onlymaximizing individual services such as crop pro-duction or hydro-electric power.
The trends from available indicators suggest that
the state of biodiversity is declining, the pressures
upon it are increasing, and the beneits derived by
humans from biodiversity are diminishing, but that
the responses to address its loss are increasing [See
Figure 17]. The overall message from these indica-tors is that despite the many efforts taken around
the world to conserve biodiversity and use it sus-
tainably, responses so far have not been adequate
to address the scale of biodiversity loss or reduce
the pressure.
Indigenous languages transmit specialized knowledge about biodiversity, the environment and about practices to manage natural resources. How-ever, determining the status and trends o indigenous languages at the global level is complicated by the lack o standardized methodologies, theabsence o shared defnitions or key concepts and limited inormation. Where such inormation exists there is evidence that the extinction risk or themost endangered languages, those with ew speakers, has increased. For example:
✤ Between 1970 and 2000, 16 o 24 indigenous languages spoken by less than 1,000 people in Mexico lost speakers.
✤ In the Russian Federation, between 1950 and 2002, 15 o 27 languages spoken by less than 10,000 people lost speakers.
✤ In Australia, 22 o 40 languages lost speakers between 1996 and 2006.
✤ In an assessment o 90 languages used by dierent indigenous peoples in the Arctic, it was determined that 20 languages have become extinctsince the 19th century. Ten o these extinctions have occurred since 1989, suggesting an increasing rate o language extinctions. A urther 30
languages are considered to be critically endangered while 25 are severely endangered.
BOX 20 Trends in indigenous languages
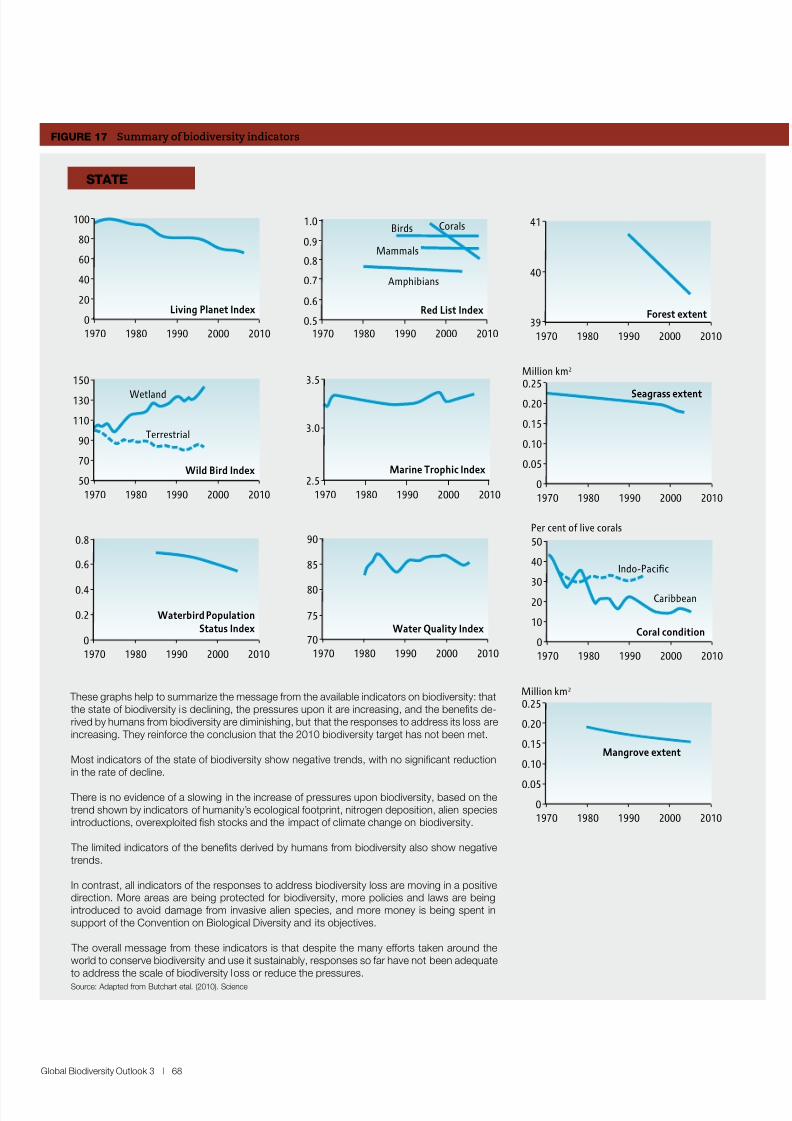
8/8/2019 United Nations - Global Biodiversity Outlook 3 (2010)
http://slidepdf.com/reader/full/united-nations-global-biodiversity-outlook-3-2010 68/96
Global Biodiversity Outlook 3 | 68
FIGURe 17 Summary o biodiversity indicators
These graphs help to summarize the message rom the available indicators on biodiversity: thatthe state o biodiversity is declining, the pressures upon it are increasing, and the benefts de-rived by humans rom biodiversity are diminishing, but that the responses to address its loss areincreasing. They reinorce the conclusion that the 2010 biodiversity target has not been met.
Most indicators o the state o biodiversity show negative trends, with no signifcant reductionin the rate o decline.
There is no evidence o a slowing in the increase o pressures upon biodiversity, based on thetrend shown by indicators o humanity’s ecological ootprint, nitrogen deposition, alien speciesintroductions, overexploited fsh stocks and the impact o climate change on biodiversity.
The limited indicators o the benefts derived by humans rom biodiversity also show negativetrends.
In contrast, all indicators o the responses to address biodiversity loss are moving in a positivedirection. More areas are being protected or biodiversity, more policies and laws are beingintroduced to avoid damage rom invasive alien species, and more money is being spent insupport o the Convention on Biological Diversity and its objectives.
The overall message rom these indicators is that despite the many eorts taken around theworld to conserve biodiversity and use it sustainably, responses so ar have not been adequateto address the scale o biodiversity loss or reduce the pressures.Source: Adapted rom Butchart etal. (2010). Science
STaTe
1970 1980 1990 2000 20100
20
40
60
80
100
Living Planet Index
Water Quality Index
1970 1980 1990 2000 201070
75
80
85
90
1970 1980 1990 2000 2010
50
70
90
110
130
150
Wild Bird Index
Wetland
Terrestrial
Forest extent
1970 1980 1990 2000 201039
40
41
1970 1980 1990 2000 20100
0.2
0.4
0.6
0.8
Waterbird Population
Status Index
Seagrass extent
Million km2
1970 1980 1990 2000 2010
0
0.05
0.10
0.15
0.20
0.25
1970 1980 1990 2000 20100.5
0.6
0.7
0.8
1.0
0.9Birds
Mammals
Corals
Amphibians
Red List Index
Coral condition
Caribbean
Indo-Pacific
Per cent of live corals
1970 1980 1990 2000 20100
10
20
30
40
50
Marine Trophic Index
1970 1980 1990 2000 2010
2.5
3.0
3.5
Million km2
1970 1980 1990 2000 20100
0.05
0.10
0.15
0.20
0.25
Mangrove extent
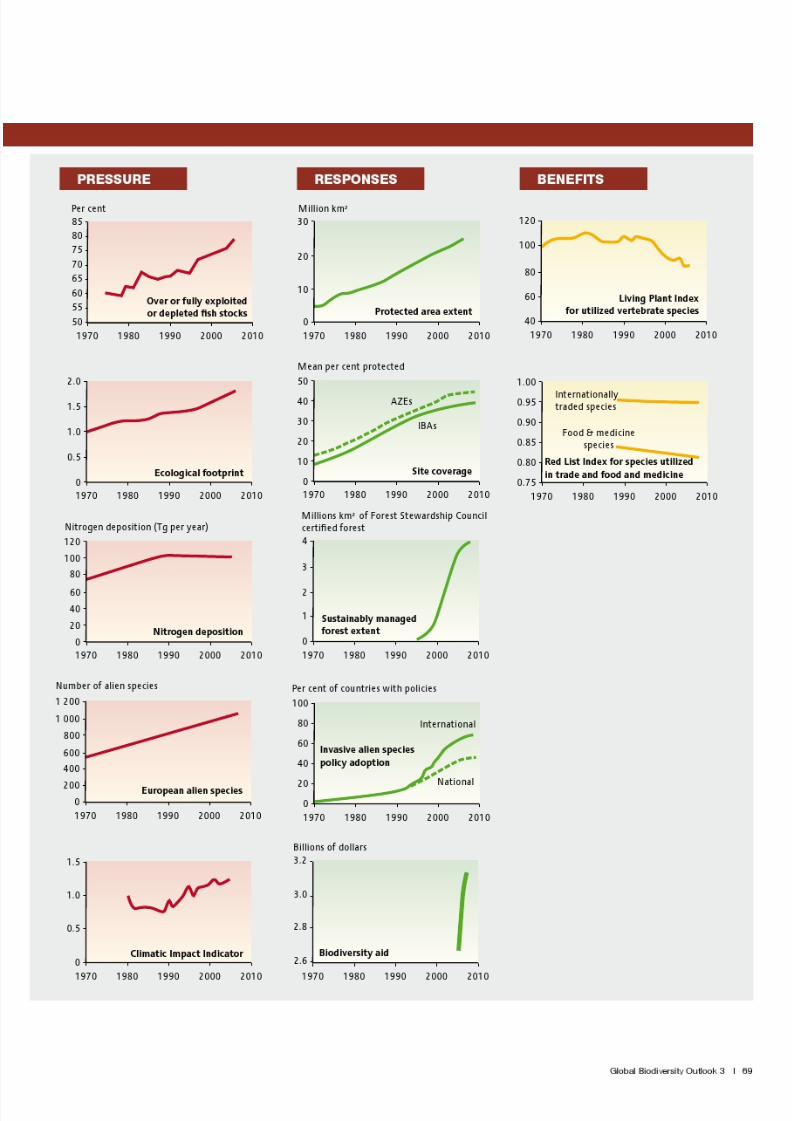
8/8/2019 United Nations - Global Biodiversity Outlook 3 (2010)
http://slidepdf.com/reader/full/united-nations-global-biodiversity-outlook-3-2010 69/96
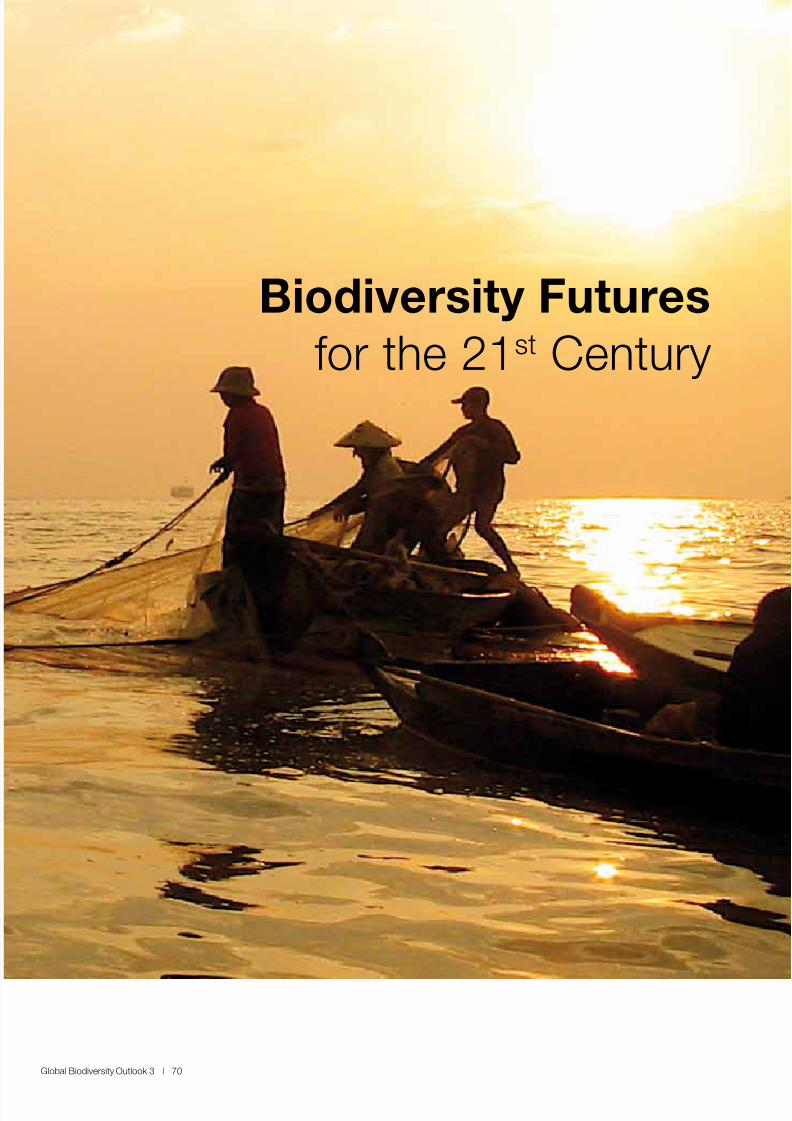
8/8/2019 United Nations - Global Biodiversity Outlook 3 (2010)
http://slidepdf.com/reader/full/united-nations-global-biodiversity-outlook-3-2010 70/96
Global Biodiversity Outlook 3 | 70
Biodiversity Futures
or the 21st Century
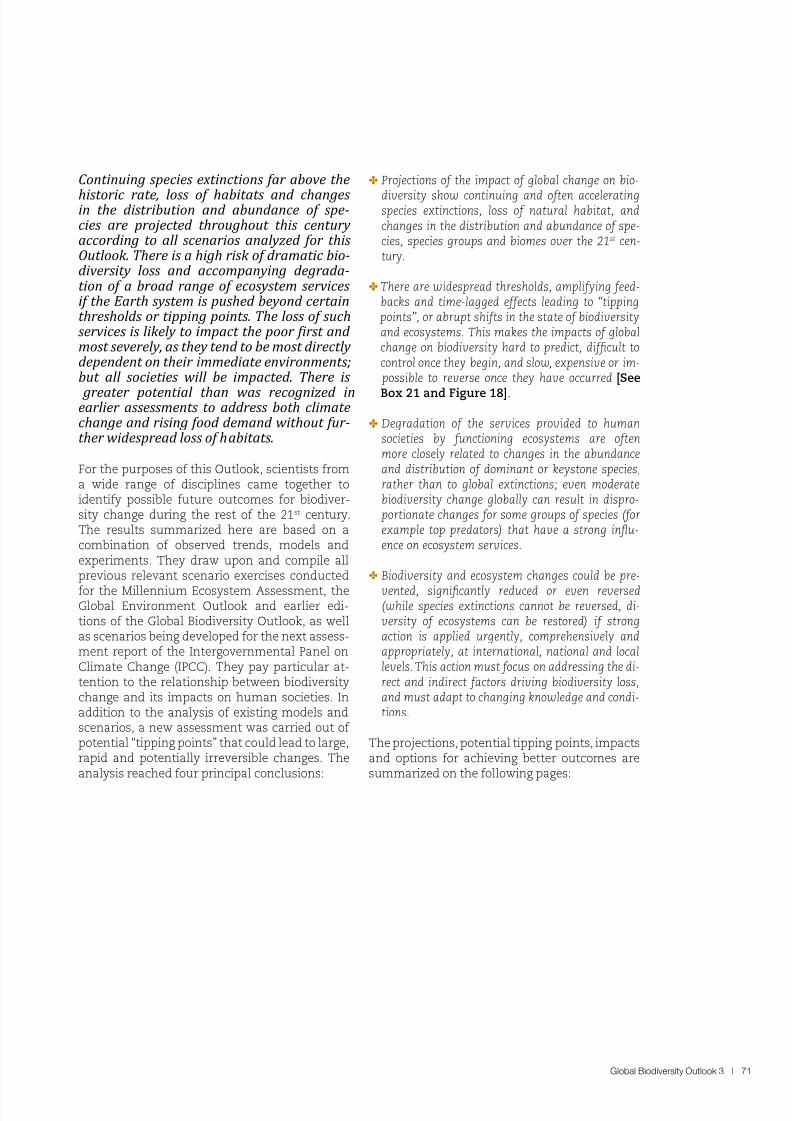
8/8/2019 United Nations - Global Biodiversity Outlook 3 (2010)
http://slidepdf.com/reader/full/united-nations-global-biodiversity-outlook-3-2010 71/96
Global Biodiversity Outlook 3 | 71
Continuing species extinctions fr bove the
historic rte, loss of hbitts nd chngesin the distribution nd bundnce of spe-cies re projected throughout this century ccording to ll scenrios nlyzed for thisOutlook. There is high risk of drmtic bio-diversity loss nd ccompnying degrd-tion of brod rnge of ecosystem servicesif the Erth system is pushed beyond certinthresholds or tipping points. The loss of suchservices is likely to impact the poor irst and most severely, s they tend to be most directly dependent on their immedite environments;but ll societies will be impcted. There is
greter potentil thn ws recognized inerlier ssessments to ddress both climtechnge nd rising food demnd without fur-ther widespred loss of hbitts.
For the purposes o this Outlook, scientists roma wide range o disciplines came together toidentiy possible uture outcomes or biodiver-sity change during the rest o the 21st century.The results summarized here are based on acombination o observed trends, models andexperiments. They draw upon and compile allprevious relevant scenario exercises conducted
or the Millennium Ecosystem Assessment, theGlobal Environment Outlook and earlier edi-tions o the Global Biodiversity Outlook, as wellas scenarios being developed or the next assess-ment report o the Intergovernmental Panel onClimate Change (IPCC). They pay particular at-tention to the relationship between biodiversitychange and its impacts on human societies. Inaddition to the analysis o existing models andscenarios, a new assessment was carried out o potential “tipping points” that could lead to large,rapid and potentially irreversible changes. Theanalysis reached our principal conclusions:
✤ Projections o the impact o global change on bio-
diversity show continuing and oten acceleratingspecies extinctions, loss o natural habitat, andchanges in the distribution and abundance o spe-cies, species groups and biomes over the 21st cen-tury.
✤ There are widespread thresholds, ampliying eed-backs and time-lagged eects leading to “tipping
points”, or abrupt shits in the state o biodiversityand ecosystems. This makes the impacts o globalchange on biodiversity hard to predict, dicult tocontrol once they begin, and slow, expensive or im-
possible to reverse once they have occurred [See
Box 21 and Figure 18].
✤ Degradation o the services provided to humansocieties by unctioning ecosystems are otenmore closely related to changes in the abundanceand distribution o dominant or keystone species,rather than to global extinctions; even moderatebiodiversity change globally can result in dispro-
portionate changes or some groups o species (orexample top predators) that have a strong infu-ence on ecosystem services.
✤ Biodiversity and ecosystem changes could be pre-
vented, signicantly reduced or even reversed(while species extinctions cannot be reversed, di-versity o ecosystems can be restored) i strongaction is applied urgently, comprehensively andappropriately, at international, national and locallevels. This action must ocus on addressing the di-rect and indirect actors driving biodiversity loss,and must adapt to changing knowledge and condi-tions.
The projections, potential tipping points, impactsand options or achieving better outcomes aresummarized on the ollowing pages:
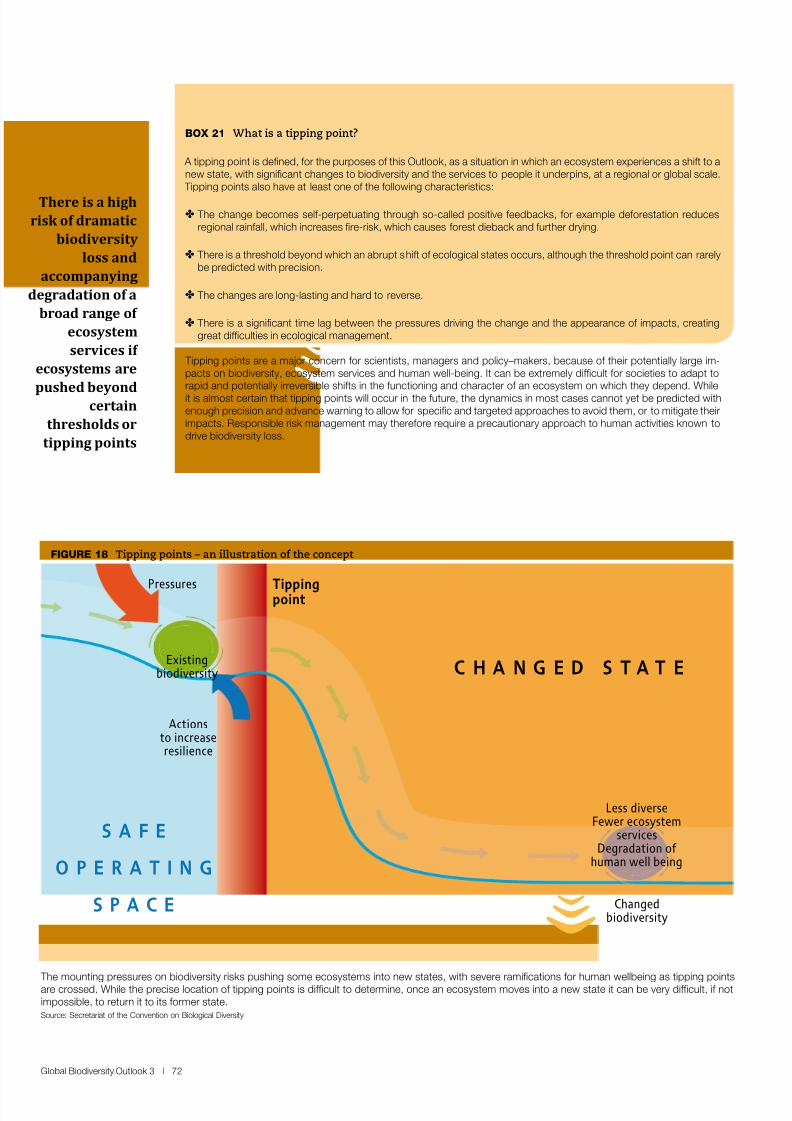
8/8/2019 United Nations - Global Biodiversity Outlook 3 (2010)
http://slidepdf.com/reader/full/united-nations-global-biodiversity-outlook-3-2010 72/96
Global Biodiversity Outlook 3 | 72
A tipping point is defned, or the purposes o this Outlook, as a situation in which an ecosystem experiences a shit to anew state, with signifcant changes to biodiversity and the services to people it underpins, at a regional or global scale. Tipping points also have at least one o the ollowing characteristics:
✤ The change becomes sel-perpetuating through so-called positive eedbacks, or example deorestation reducesregional rainall, which increases fre-risk, which causes orest dieback and urther drying.
✤ There is a threshold beyond which an abrupt shit o ecological states occurs, although the threshold point can rarelybe predicted with precision.
✤ The changes are long-lasting and hard to reverse.
✤ There is a signifcant time lag between the pressures driving the change and the appearance o impacts, creatinggreat difculties in ecological management.
Tipping points are a major concern or scientists, managers and policy–makers, because o their potentially large im-pacts on biodiversity, ecosystem services and human well-being. It can be extremely difcult or societies to adapt torapid and potentially irreversible shits in the unctioning and character o an ecosystem on which they depend. Whileit is almost certain that tipping points will occur in the uture, the dynamics in most cases cannot yet be predicted withenough precision and advance warning to allow or specifc and targeted approaches to avoid them, or to mitigate theirimpacts. Responsible risk management may thereore require a precautionary approach to human activities known todrive biodiversity loss.
BOX 21 What is a tipping point?
FIGURe 18 Tipping points – an illustration o the concept
Actionsto increaseresilience
Existingbiodiversity
Changedbiodiversity
Less diverseFewer ecosystem
servicesDegradation of
human well being
Tippingpoint
S A F E
O P E R A T I N G
S P A C E
C H A N G E D S T A T E
Pressures
The mounting pressures on biodiversity risks pushing some ecosystems into new states, with severe ramifcations or human wellbeing as tipping pointsare crossed. While the precise location o tipping points is difcult to determine, once an ecosystem moves into a new state it can be very difcult, i notimpossible, to return it to its ormer state.Source: Secretariat o the Convention on Biological Diversity
There is a high
risk of dramatic
biodiversity
loss and
accompanying
degradation of a
broad range of
ecosystem
services if
ecosystems are
pushed beyondcertain
thresholds or
tipping points
8/8/2019 United Nations - Global Biodiversity Outlook 3 (2010)
http://slidepdf.com/reader/full/united-nations-global-biodiversity-outlook-3-2010 73/96
Global Biodiversity Outlook 3 | 73
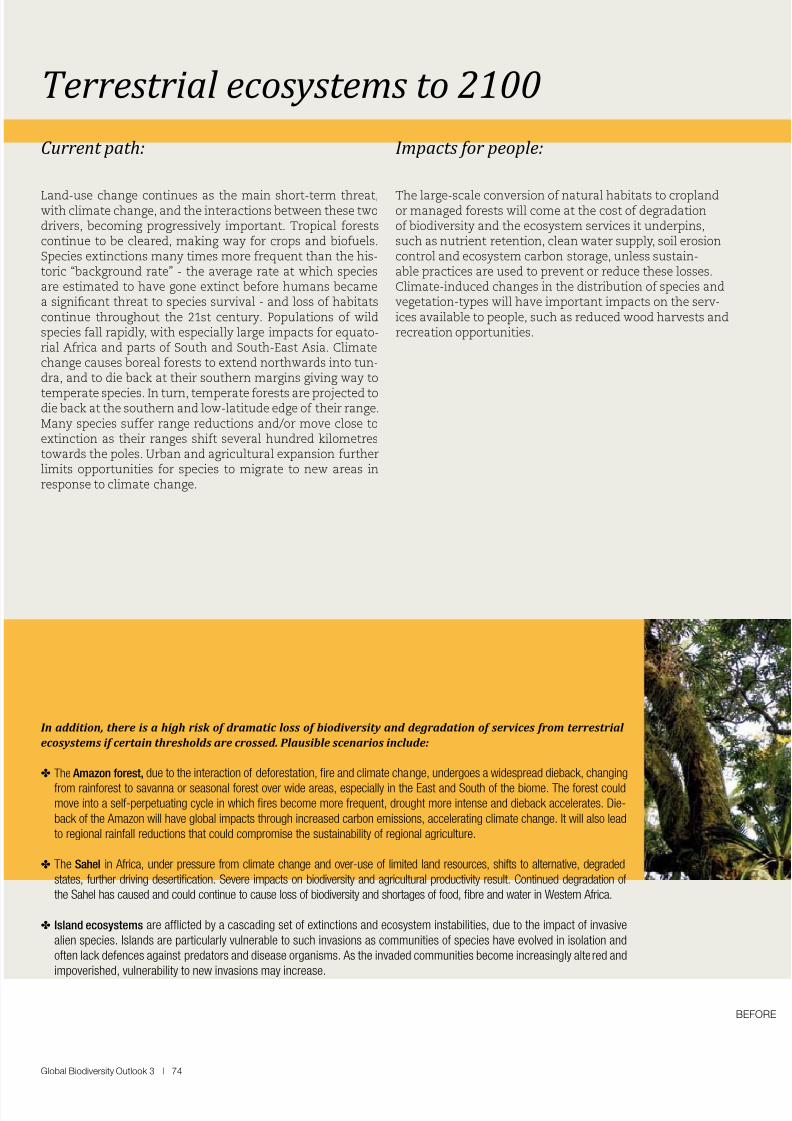
8/8/2019 United Nations - Global Biodiversity Outlook 3 (2010)
http://slidepdf.com/reader/full/united-nations-global-biodiversity-outlook-3-2010 74/96
Global Biodiversity Outlook 3 | 74
Terrestril ecosystems to 2100
Current pth:
Land-use change continues as the main short-term threat,with climate change, and the interactions between these twodrivers, becoming progressively important. Tropical orestscontinue to be cleared, making way or crops and biouels.Species extinctions many times more requent than the his-toric “background rate” - the average rate at which speciesare estimated to have gone extinct beore humans becamea signicant threat to species survival - and loss o habitatscontinue throughout the 21st century. Populations o wildspecies all rapidly, with especially large impacts or equato-rial Arica and parts o South and South-East Asia. Climatechange causes boreal orests to extend northwards into tun-dra, and to die back at their southern margins giving way to
temperate species. In turn, temperate orests are projected todie back at the southern and low-latitude edge o their range.Many species suer range reductions and/or move close toextinction as their ranges shit several hundred kilometrestowards the poles. Urban and agricultural expansion urtherlimits opportunities or species to migrate to new areas inresponse to climate change.
Impcts for people:
The large-scale conversion o natural habitats to croplandor managed orests will come at the cost o degradationo biodiversity and the ecosystem services it underpins,such as nutrient retention, clean water supply, soil erosioncontrol and ecosystem carbon storage, unless sustain-able practices are used to prevent or reduce these losses.Climate-induced changes in the distribution o species andvegetation-types will have important impacts on the serv-ices available to people, such as reduced wood harvests andrecreation opportunities.
In addition, there is a high risk of dramatic loss of biodiversity and degradation of services from terrestrial
ecosystems if certain thresholds are crossed. Plausible scenarios include:
✤ The Amazon orest, due to the interaction o deorestation, re and climate change, undergoes a widespread dieback, changing
rom rainorest to savanna or seasonal orest over wide areas, especially in the East and South o the biome. The orest couldmove into a sel-perpetuating cycle in which res become more requent, drought more intense and dieback accelerates. Die-
back o the Amazon will have global impacts through increased carbon emissions, accelerating climate change. It will also lead
to regional rainall reductions that could compromise the sustainability o regional agriculture.
✤ The Sahel in Arica, under pressure rom climate change and over-use o limited land resources, shits to alternative, degraded
states, urther driving desertication. Severe impacts on biodiversity and agricultural productivity result. Continued degradation o
the Sahel has caused and could continue to cause loss o biodiversity and shortages o ood, bre and water in Western Arica.
✤ Island ecosystems are aficted by a cascading set o extinctions and ecosystem instabilities, due to the impact o invasive
alien species. Islands are particularly vulnerable to such invasions as communities o species have evolved in isolation and
oten lack deences against predators and disease organisms. As the invaded communities become increasingly altered and
impoverished, vulnerability to new invasions may increase.
BEFORE
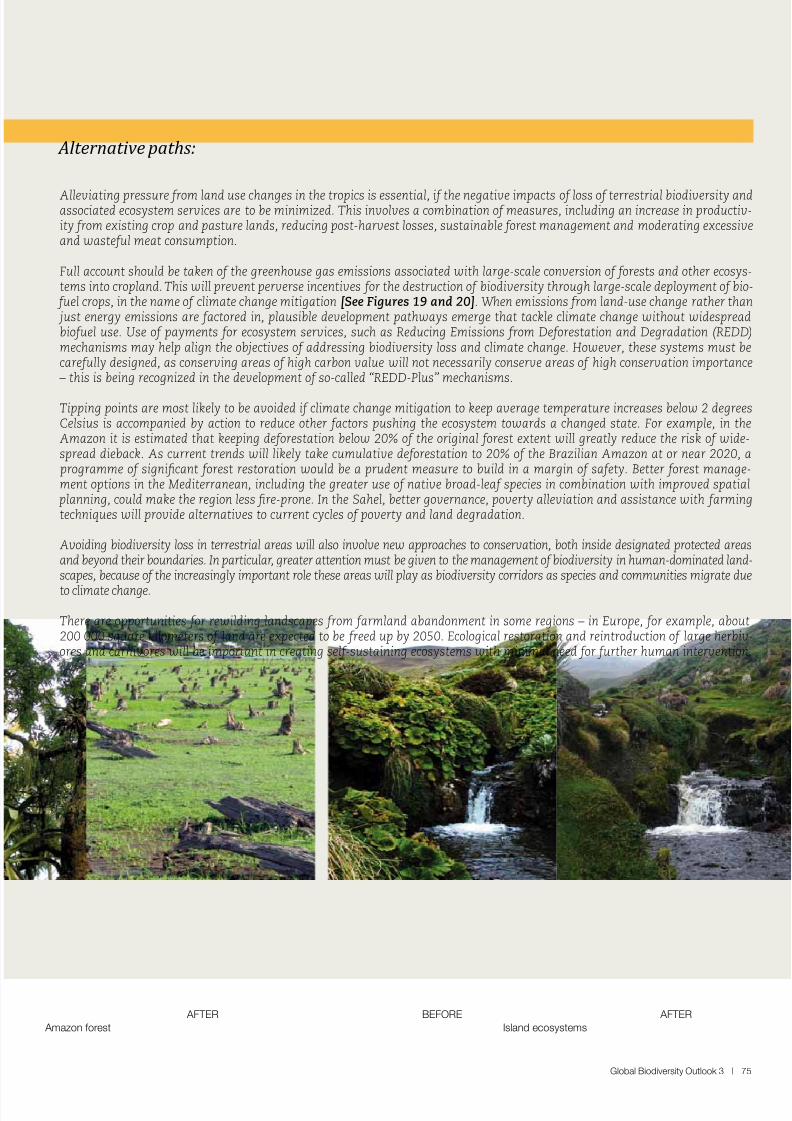
8/8/2019 United Nations - Global Biodiversity Outlook 3 (2010)
http://slidepdf.com/reader/full/united-nations-global-biodiversity-outlook-3-2010 75/96
Amazon orest Island ecosystems
Global Biodiversity Outlook 3 | 75
alterntive pths:
Alleviating pressure rom land use changes in the tropics is essential, i the negative impacts o loss o terrestrial biodiversity andassociated ecosystem services are to be minimized. This involves a combination o measures, including an increase in productiv-ity rom existing crop and pasture lands, reducing post-harvest losses, sustainable orest management and moderating excessiveand wasteul meat consumption.
Full account should be taken o the greenhouse gas emissions associated with large-scale conversion o orests and other ecosys-tems into cropland. This will prevent perverse incentives or the destruction o biodiversity through large-scale deployment o bio- uel crops, in the name o climate change mitigation [See Figures 19 and 20]. When emissions rom land-use change rather than just energy emissions are actored in, plausible development pathways emerge that tackle climate change without widespreadbiouel use. Use o payments or ecosystem services, such as Reducing Emissions rom Deorestation and Degradation (REDD)mechanisms may help align the objectives o addressing biodiversity loss and climate change. However, these systems must becareully designed, as conserving areas o high carbon value will not necessarily conserve areas o high conservation importance – this is being recognized in the development o so-called “REDD-Plus” mechanisms.
Tipping points are most likely to be avoided i climate change mitigation to keep average temperature increases below 2 degreesCelsius is accompanied by action to reduce other actors pushing the ecosystem towards a changed state. For example, in theAmazon it is estimated that keeping deorestation below 20% o the original orest extent will greatly reduce the risk o wide-spread dieback. As current trends will likely take cumulative deorestation to 20% o the Brazilian Amazon at or near 2020, a programme o signicant orest restoration would be a prudent measure to build in a margin o saety. Better orest manage-ment options in the Mediterranean, including the greater use o native broad-lea species in combination with improved spatial planning, could make the region less re-prone. In the Sahel, better governance, poverty alleviation and assistance with armingtechniques will provide alternatives to current cycles o poverty and land degradation.
Avoiding biodiversity loss in terrestrial areas will also involve new approaches to conservation, both inside designated protected areasand beyond their boundaries. In particular, greater attention must be given to the management o biodiversity in human-dominated land-scapes, because o the increasingly important role these areas will play as biodiversity corridors as species and communities migrate due
to climate change.
There are opportunities or rewilding landscapes rom armland abandonment in some regions – in Europe, or example, about200 000 square kilometers o land are expected to be reed up by 2050. Ecological restoration and reintroduction o large herbiv-ores and carnivores will be important in creating sel-sustaining ecosystems with minimal need or urther human intervention.
BEFORE AFTER AFTER
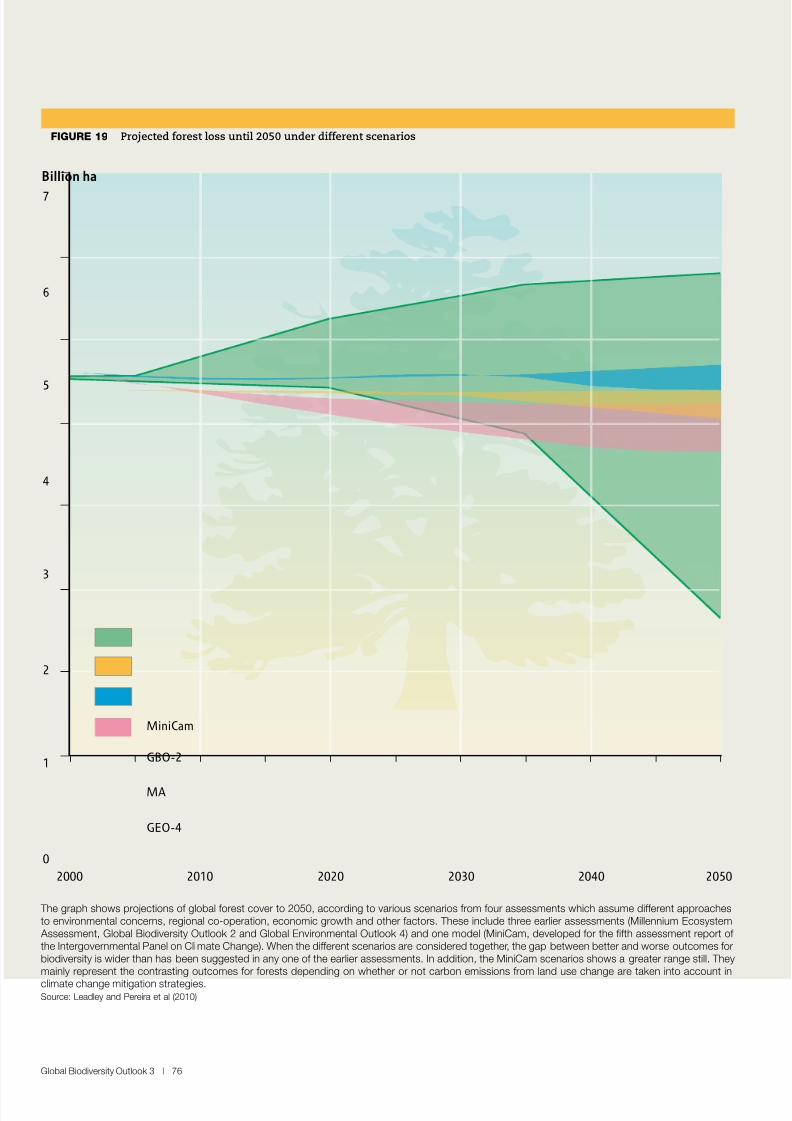
8/8/2019 United Nations - Global Biodiversity Outlook 3 (2010)
http://slidepdf.com/reader/full/united-nations-global-biodiversity-outlook-3-2010 76/96
Global Biodiversity Outlook 3 | 76
0
1
2
3
4
5
6
7
2000 2010 2020 2030 2040 2050
Billion ha
MiniCam
MA
GEO-4
GBO-2
The graph shows projections o global orest cover to 2050, according to various scenarios rom our assessments which assume dierent approachesto environmental concerns, regional co-operation, economic growth and other actors. These include three earlier assessments (Millennium Ecosystem Assessment, Global Biodiversity Outlook 2 and Global Environmental Outlook 4) and one model (MiniCam, developed or the fth assessment report o the Intergovernmental Panel on Climate Change). When the dierent scenarios are considered together, the gap between better and worse outcomes orbiodiversity is wider than has been suggested in any one o the earlier assessments. In addition, the MiniCam scenarios shows a greater range still. Theymainly represent the contrasting outcomes or orests depending on whether or not carbon emissions rom land use change are taken into account in
climate change mitigation strategies.Source: Leadley and Pereira et al (2010)
FIGURe 19 Projected orest loss until 2050 under dierent scenarios
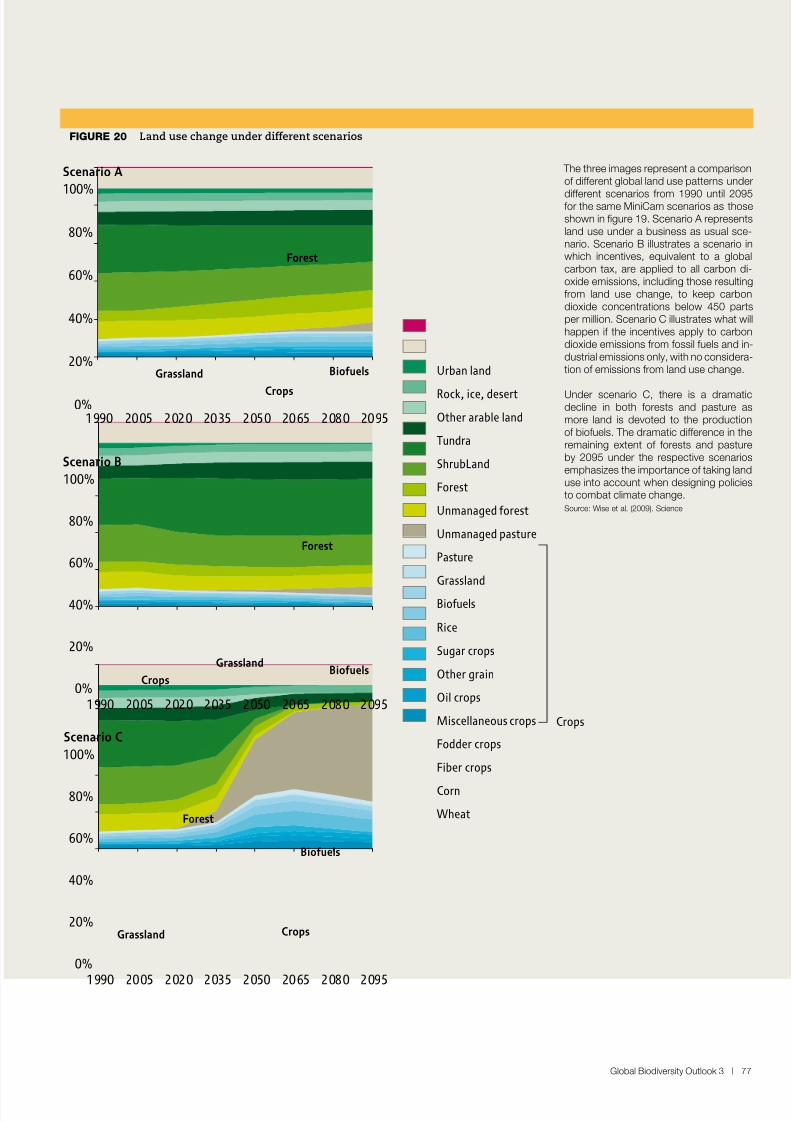
8/8/2019 United Nations - Global Biodiversity Outlook 3 (2010)
http://slidepdf.com/reader/full/united-nations-global-biodiversity-outlook-3-2010 77/96
Global Biodiversity Outlook 3 | 77
The three images represent a comparisono dierent global land use patterns under
dierent scenarios rom 1990 until 2095or the same MiniCam scenarios as thoseshown in fgure 19. Scenario A representsland use under a business as usual sce-nario. Scenario B illustrates a scenario inwhich incentives, equivalent to a globalcarbon tax, are applied to all carbon di-oxide emissions, including those resultingrom land use change, to keep carbondioxide concentrations below 450 partsper million. Scenario C illustrates what willhappen i the incentives apply to carbondioxide emissions rom ossil uels and in-dustrial emissions only, with no considera-tion o emissions rom land use change.
Under scenario C, there is a dramaticdecline in both orests and pasture asmore land is devoted to the productiono biouels. The dramatic dierence in theremaining extent o orests and pastureby 2095 under the respective scenariosemphasizes the importance o taking landuse into account when designing policiesto combat climate change.Source: Wise et al. (2009). Science
FIGURe 20 Land use change under dierent scenarios
0%
20%
40%
60%
80%
100%
1990 2005 2020 2035 2050 2065 2080 2095
0%
20%
40%
60%
80%
100%
1990 2005 2020 2035 2050 2065 2080 2095
0%
20%
40%
60%
80%
100%
1990 2005 2020 2035 2050 2065 2080 2095
Scenario A
Scenario C
Scenario B
Biofuels
Crops
Crops
Crops
Biofuels
Biofuels
Grassland
Forest
Grassland
Grassland
Forest
Forest
Urban land
Rock, ice, desert
Other arable land
Tundra
ShrubLand
Forest
Unmanaged forest
Unmanaged pasture
Pasture
Grassland
Biofuels
Rice
Sugar crops
Other grain
Oil crops
Miscellaneous crops
Fodder crops
Fiber crops
Corn
Wheat
Crops
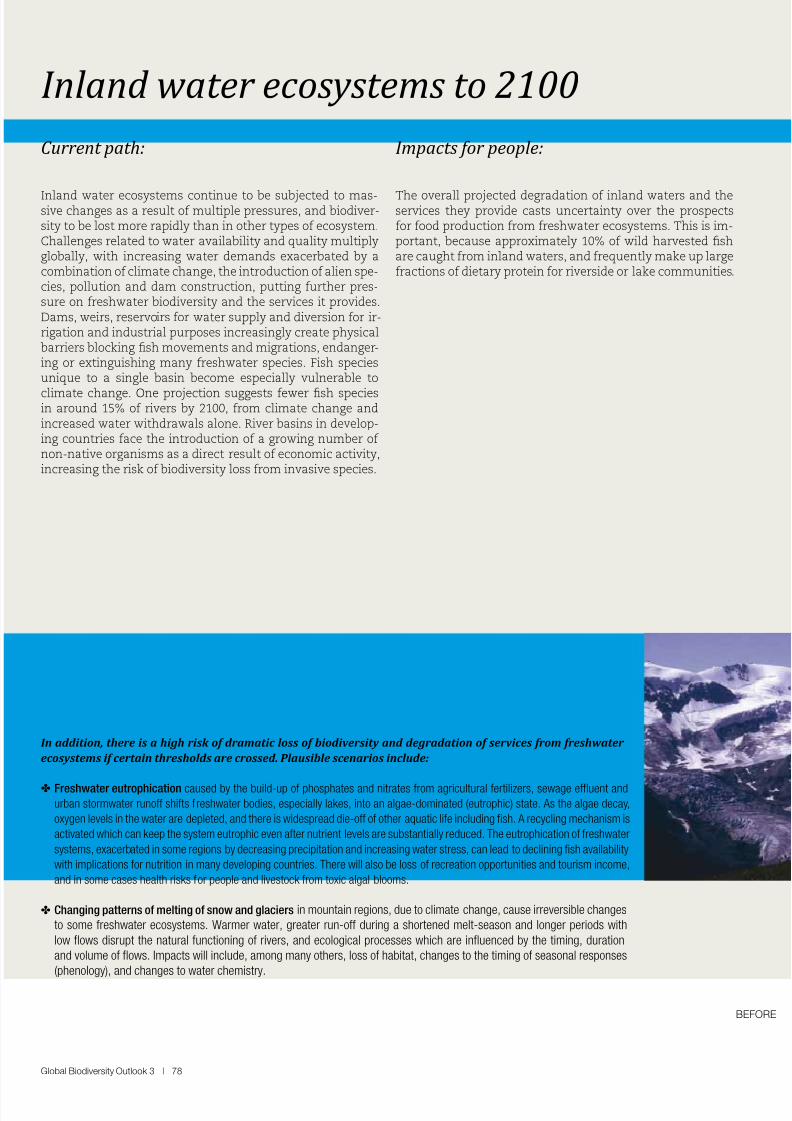
8/8/2019 United Nations - Global Biodiversity Outlook 3 (2010)
http://slidepdf.com/reader/full/united-nations-global-biodiversity-outlook-3-2010 78/96
Global Biodiversity Outlook 3 | 78
Current pth:
Inland water ecosystems continue to be subjected to mas-sive changes as a result o multiple pressures, and biodiver-sity to be lost more rapidly than in other types o ecosystem.Challenges related to water availability and quality multiplyglobally, with increasing water demands exacerbated by acombination o climate change, the introduction o alien spe-cies, pollution and dam construction, putting urther pres-sure on reshwater biodiversity and the services it provides.Dams, weirs, reservoirs or water supply and diversion or ir-rigation and industrial purposes increasingly create physicalbarriers blocking sh movements and migrations, endanger-ing or extinguishing many reshwater species. Fish speciesunique to a single basin become especially vulnerable to
climate change. One projection suggests ewer sh speciesin around 15% o rivers by 2100, rom climate change andincreased water withdrawals alone. River basins in develop-ing countries ace the introduction o a growing number o non-native organisms as a direct result o economic activity,increasing the risk o biodiversity loss rom invasive species.
Impcts for people:
The overall projected degradation o inland waters and theservices they provide casts uncertainty over the prospectsor ood production rom reshwater ecosystems. This is im-portant, because approximately 10% o wild harvested share caught rom inland waters, and requently make up largeractions o dietary protein or riverside or lake communities.
In addition, there is a high risk of dramatic loss of biodiversity and degradation of services from freshwater
ecosystems if certain thresholds are crossed. Plausible scenarios include:
✤ Freshwater eutrophication caused by the build-up o phosphates and nitrates rom agricultural ertilizers, sewage efuent andurban stormwater runo shits reshwater bodies, especially lakes, into an algae-dominated (eutrophic) state. As the algae decay,
oxygen levels in the water are depleted, and there is widespread die-o o other aquatic lie including sh. A recycling mechanism is
activated which can keep the system eutrophic even ater nutrient levels are substantially reduced. The eutrophication o reshwater
systems, exacerbated in some regions by decreasing precipitation and increasing water stress, can lead to declining sh availability
with implications or nutrition in many developing countries. There will also be loss o recreation opportunities and tourism income,
and in some cases health risks or people and livestock rom toxic algal blooms.
✤ Changing patterns o melting o snow and glaciers in mountain regions, due to climate change, cause irreversible changes
to some reshwater ecosystems. Warmer water, greater run-o during a shortened melt-season and longer periods with
low fows disrupt the natural unctioning o rivers, and ecological processes which are infuenced by the timing, duration
and volume o fows. Impacts will include, among many others, loss o habitat, changes to the timing o seasonal responses
(phenology), and changes to water chemistry.
Inlnd wter ecosystems to 2100
BEFORE
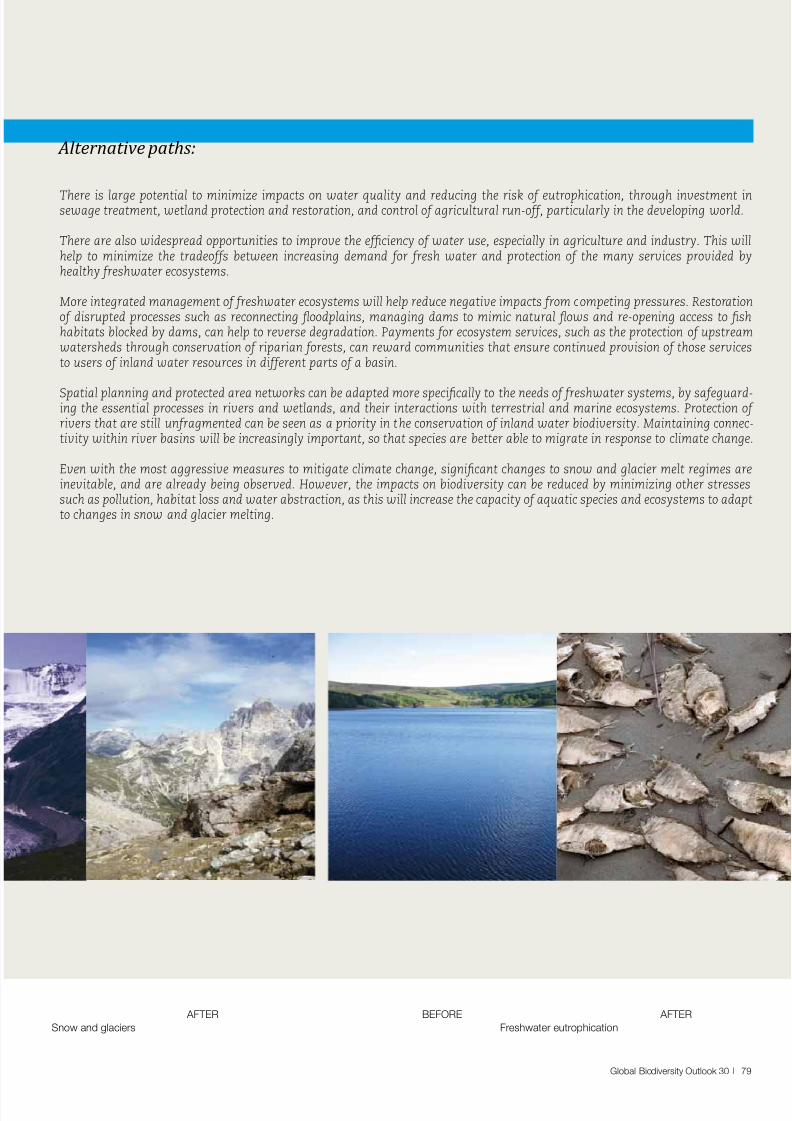
8/8/2019 United Nations - Global Biodiversity Outlook 3 (2010)
http://slidepdf.com/reader/full/united-nations-global-biodiversity-outlook-3-2010 79/96
Global Biodiversity Outlook 30 | 79
alterntive pths:
There is large potential to minimize impacts on water quality and reducing the risk o eutrophication, through investment insewage treatment, wetland protection and restoration, and control o agricultural run-o, particularly in the developing world.
There are also widespread opportunities to improve the eciency o water use, especially in agriculture and industry. This willhelp to minimize the tradeos between increasing demand or resh water and protection o the many services provided byhealthy reshwater ecosystems.
More integrated management o reshwater ecosystems will help reduce negative impacts rom competing pressures. Restorationo disrupted processes such as reconnecting foodplains, managing dams to mimic natural fows and re-opening access to shhabitats blocked by dams, can help to reverse degradation. Payments or ecosystem services, such as the protection o upstreamwatersheds through conservation o riparian orests, can reward communities that ensure continued provision o those servicesto users o inland water resources in dierent parts o a basin.
Spatial planning and protected area networks can be adapted more specically to the needs o reshwater systems, by saeguard-ing the essential processes in rivers and wetlands, and their interactions with terrestrial and marine ecosystems. Protection o rivers that are still unragmented can be seen as a priority in the conservation o inland water biodiversity. Maintaining connec-tivity within river basins will be increasingly important, so that species are better able to migrate in response to climate change.
Even with the most aggressive measures to mitigate climate change, signicant changes to snow and glacier melt regimes areinevitable, and are already being observed. However, the impacts on biodiversity can be reduced by minimizing other stressessuch as pollution, habitat loss and water abstraction, as this will increase the capacity o aquatic species and ecosystems to adaptto changes in snow and glacier melting.
Snow and glaciers Freshwater eutrophicationBEFORE AFTER AFTER
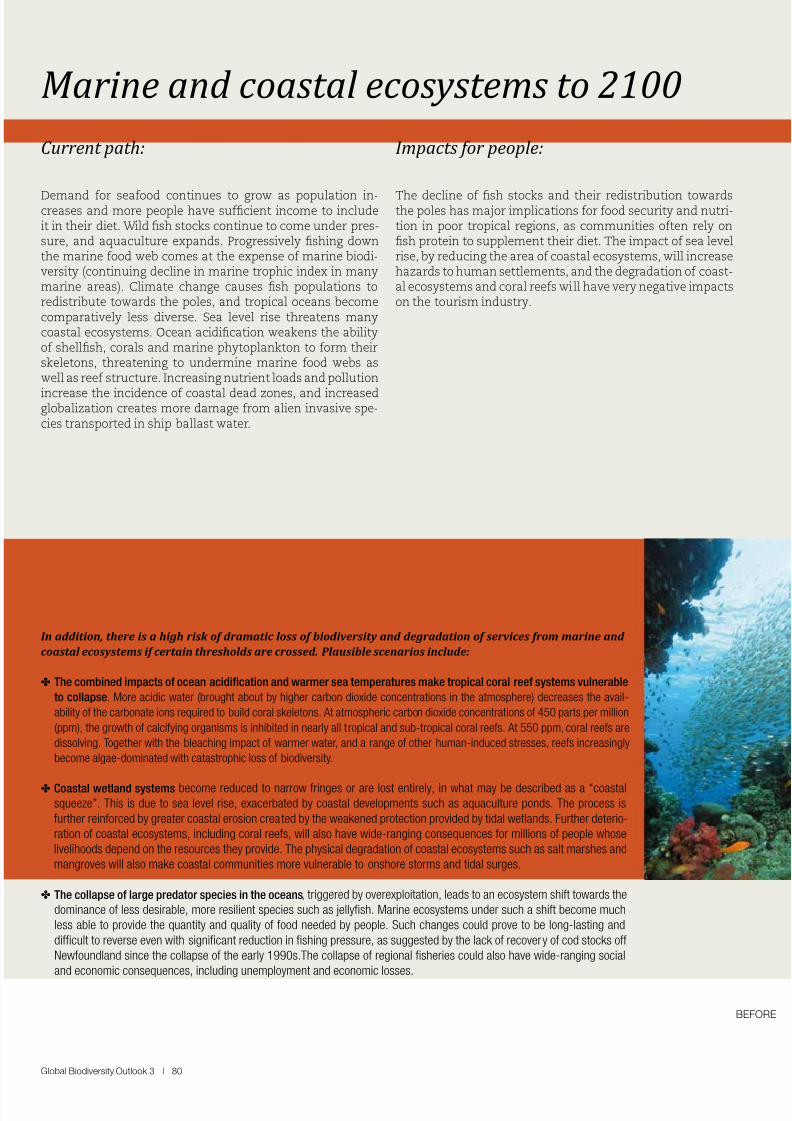
8/8/2019 United Nations - Global Biodiversity Outlook 3 (2010)
http://slidepdf.com/reader/full/united-nations-global-biodiversity-outlook-3-2010 80/96
Global Biodiversity Outlook 3 | 80
Mrine nd costl ecosystems to 2100
Current pth:
Demand or seaood continues to grow as population in-creases and more people have sucient income to includeit in their diet. Wild sh stocks continue to come under pres-sure, and aquaculture expands. Progressively shing downthe marine ood web comes at the expense o marine biodi-versity (continuing decline in marine trophic index in manymarine areas). Climate change causes sh populations toredistribute towards the poles, and tropical oceans becomecomparatively less diverse. Sea level rise threatens manycoastal ecosystems. Ocean acidication weakens the abilityo shellsh, corals and marine phytoplankton to orm theirskeletons, threatening to undermine marine ood webs aswell as ree structure. Increasing nutrient loads and pollution
increase the incidence o coastal dead zones, and increasedglobalization creates more damage rom alien invasive spe-cies transported in ship ballast water.
Impcts for people:
The decline o sh stocks and their redistribution towardsthe poles has major implications or ood security and nutri-tion in poor tropical regions, as communities oten rely onsh protein to supplement their diet. The impact o sea levelrise, by reducing the area o coastal ecosystems, will increasehazards to human settlements, and the degradation o coast-al ecosystems and coral rees will have very negative impactson the tourism industry.
In addition, there is a high risk of dramatic loss of biodiversity and degradation of services from marine and
coastal ecosystems if certain thresholds are crossed. Plausible scenarios include:
✤ The combined impacts o ocean acidifcation and warmer sea temperatures make tropical coral ree systems vulnerable
to collapse. More acidic water (brought about by higher carbon dioxide concentrations in the atmosphere) decreases the avail-
ability o the carbonate ions required to build coral skeletons. At atmospheric carbon dioxide concentrations o 450 parts per million
(ppm), the growth o calciying organisms is inhibited in nearly all tropical and sub-tropical coral rees. At 550 ppm, coral rees are
dissolving. Together with the bleaching impact o warmer water, and a range o other human-induced stresses, rees increasingly
become algae-dominated with catastrophic loss o biodiversity.
✤ Coastal wetland systems become reduced to narrow ringes or are lost entirely, in what may be described as a “coastalsqueeze”. This is due to sea level rise, exacerbated by coastal developments such as aquaculture ponds. The process is
urther reinorced by greater coastal erosion created by the weakened protection provided by tidal wetlands. Further deterio-
ration o coastal ecosystems, including coral rees, will also have wide-ranging consequences or millions o people whose
livelihoods depend on the resources they provide. The physical degradation o coastal ecosystems such as salt marshes and
mangroves will also make coastal communities more vulnerable to onshore storms and tidal surges.
✤ The collapse o large predator species in the oceans, triggered by overexploitation, leads to an ecosystem shit towards the
dominance o less desirable, more resilient species such as jellysh. Marine ecosystems under such a shit become much
less able to provide the quantity and quality o ood needed by people. Such changes could prove to be long-lasting and
dicult to reverse even with signicant reduction in shing pressure, as suggested by the lack o recovery o cod stocks o
Newoundland since the collapse o the early 1990s.The collapse o regional sheries could also have wide-ranging social
and economic consequences, including unemployment and economic losses.
BEFORE
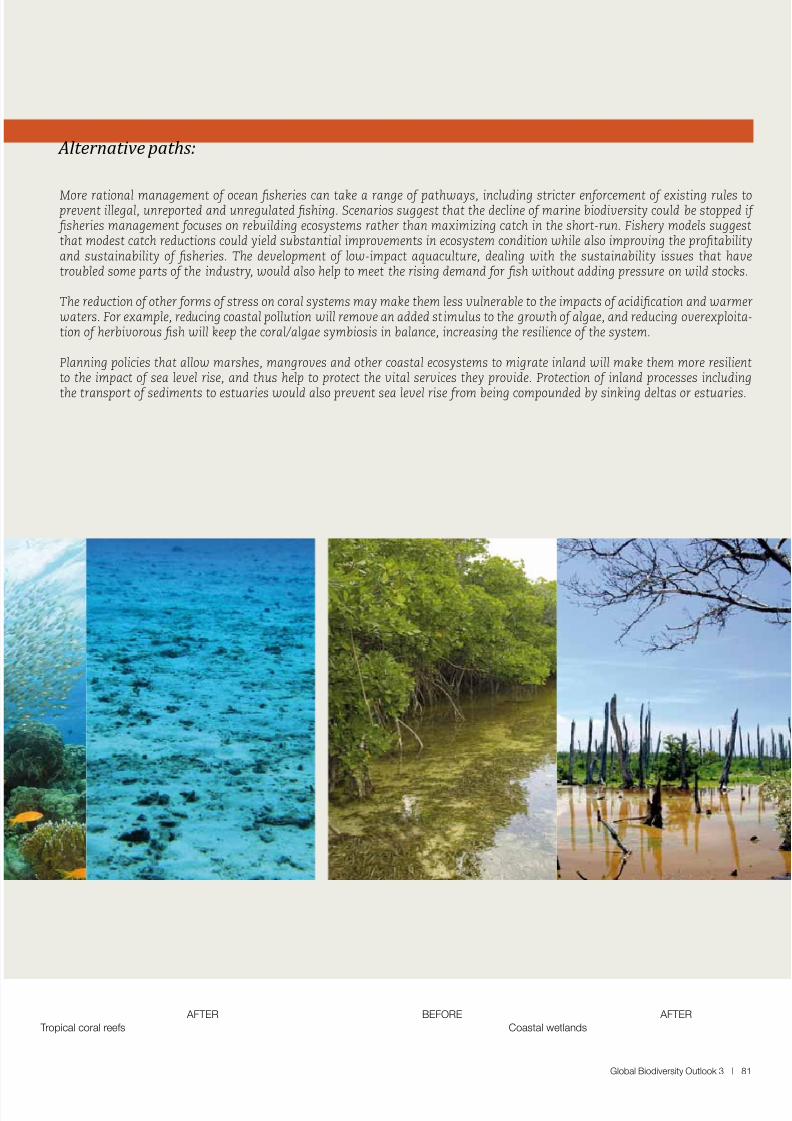
8/8/2019 United Nations - Global Biodiversity Outlook 3 (2010)
http://slidepdf.com/reader/full/united-nations-global-biodiversity-outlook-3-2010 81/96
Global Biodiversity Outlook 3 | 81
alterntive pths:
More rational management o ocean sheries can take a range o pathways, including stricter enorcement o existing rules to prevent illegal, unreported and unregulated shing. Scenarios suggest that the decline o marine biodiversity could be stopped i sheries management ocuses on rebuilding ecosystems rather than maximizing catch in the short-run. Fishery models suggestthat modest catch reductions could yield substantial improvements in ecosystem condition while also improving the protabilityand sustainability o sheries. The development o low-impact aquaculture, dealing with the sustainability issues that havetroubled some parts o the industry, would also help to meet the rising demand or sh without adding pressure on wild stocks.
The reduction o other orms o stress on coral systems may make them less vulnerable to the impacts o acidication and warmerwaters. For example, reducing coastal pollution will remove an added stimulus to the growth o algae, and reducing overexploita-tion o herbivorous sh will keep the coral/algae symbiosis in balance, increasing the resilience o the system.
Planning policies that allow marshes, mangroves and other coastal ecosystems to migrate inland will make them more resilientto the impact o sea level rise, and thus help to protect the vital services they provide. Protection o inland processes including
the transport o sediments to estuaries would also prevent sea level rise rom being compounded by sinking deltas or estuaries.
Tropical coral rees Coastal wetlandsBEFORE AFTER AFTER
8/8/2019 United Nations - Global Biodiversity Outlook 3 (2010)
http://slidepdf.com/reader/full/united-nations-global-biodiversity-outlook-3-2010 82/96
Global Biodiversity Outlook 3 | 82
Towards a Strategyor ReducingBiodiversity Loss
8/8/2019 United Nations - Global Biodiversity Outlook 3 (2010)
http://slidepdf.com/reader/full/united-nations-global-biodiversity-outlook-3-2010 83/96
Global Biodiversity Outlook 3 | 83
Well-trgeted policies focusing on criticl r-
es, species nd ecosystem services cn helpto void the most dngerous impcts on peo- ple nd societies from biodiversity loss in thener-term future, which it will be extremely chllenging to void. In the longer term,biodiversity loss my be hlted nd then re-versed, if urgent, concerted nd effective c-tion is pplied in support of n greed long-term vision. The 2010 review of the strtegic pln for the Convention on Biologicl Diversi-ty provides an opportunity to deine such a vi-sion nd set time-bound trgets to stimultethe ction required to chieve it.
A key lesson from the failure to meet the 2010 bio-
diversity target is that the urgency of a change of
direction must be conveyed to decision-makers
beyond the constituency so far involved in the bio-
diversity convention. The CBD has very nearlyuniversal participation rom the world’s govern-ments, yet those involved in its implementationrarely have the infuence to promote action atthe level required to eect real change.
Thus, while the activities o environmental de-partments and agencies in tackling specic
threats to species, and expanding protected ar-eas, has been and continues to be extremely im-portant, they are easily undermined by decisionsrom other ministries that ail to apply strategicthinking on policies and actions that impact onecosystems and other components o biodiversity.
Mainstreaming thereore needs to be seen asthe genuine understanding by governmentmachinery as a whole that the uture well-be-ing o society depends on deending the natu-ral inrastructure on which we all depend. Tosome extent, this approach is already working
its way through some government systems onthe question o climate change, with “climate-proong” o policies becoming a more commonpractice. Some trade-os between conservationand development are inevitable, and it is im-portant that decisions are inormed by the bestavailable inormation and that the tradeos areclearly recognized up-ront.
Systematic prooing of policies for their impact on
biodiversity and ecosystem services would ensurenot only that biodiversity was better protected, but
that climate change itself was more effectively ad -
dressed. Conservation of biodiversity, and, where
necessary restoration of ecosystems, can be cost-
effective interventions for both mitigation of and
adaptation to climate change, often with substan-
tial co-beneits.
It is clear rom the scenarios outlined above thataddressing the multiple drivers o biodiversityloss is a vital orm o climate change adaptation.Looked at in a positive way, this understanding
gives us more options. We do not need to resignourselves to the act that due to the time lagsbuilt into climate change, we are powerless toprotect coastal communities against sea levelrise, dry regions against re and drought, or riv-er-valley dwellers against foods and landslides.
Although it will not address all climate impacts,targeting ecosystem pressures over which wehave more immediate control will help to en-sure that ecosystems continue to be resilientand to prevent some dangerous tipping pointsrom being reached.
I accompanied by determined action to reduceemissions – with the conservation o orests andother carbon-storing ecosystems given due pri-ority in mitigation strategies – then biodiversityprotection can help buy time, while the climatesystem responds to a stabilizing o greenhousegas concentrations.
Important incentives for the conservation of biodi -
versity can emerge from systems that ensure fair
and equitable sharing of the beneits arising out
of the use of genetic resources, the third objec-
tive o the Convention on Biological Diversity. Inpractice, this means drawing up rules and agree-ments that strike a air balance between acili-tating access to companies or researchers seek-ing to use genetic material, and ensuring that theentitlements o governments and local commu-nities are respected, including the granting o in-ormed consent prior to access taking place, andthe air and equitable sharing o benets arisingrom the use o genetic resources and associatedtraditional knowledge.
The real
beneits of
biodiversity,
and the costs
of its loss,
need to be
relected
within
economic
systems and
markets
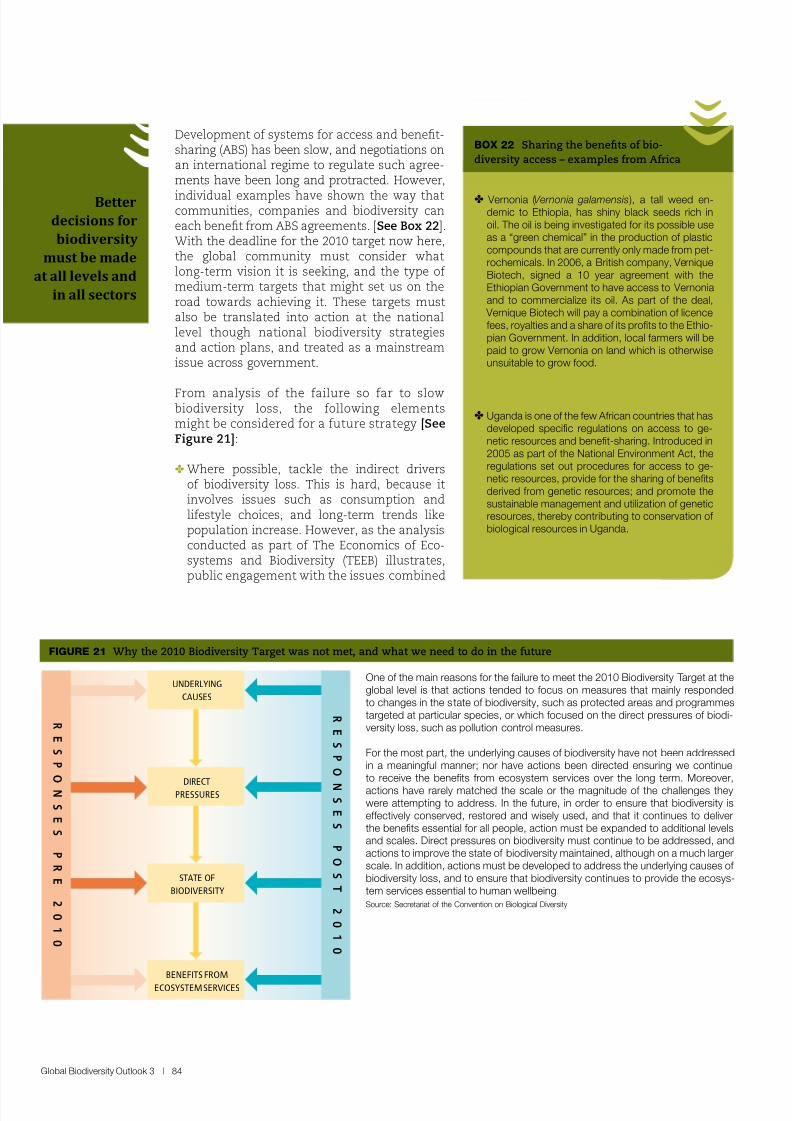
8/8/2019 United Nations - Global Biodiversity Outlook 3 (2010)
http://slidepdf.com/reader/full/united-nations-global-biodiversity-outlook-3-2010 84/96
Development o systems or access and benet-sharing (ABS) has been slow, and negotiations onan international regime to regulate such agree-ments have been long and protracted. However,
individual examples have shown the way thatcommunities, companies and biodiversity caneach benet rom ABS agreements. [See Box 22].With the deadline or the 2010 target now here,the global community must consider whatlong-term vision it is seeking, and the type o medium-term targets that might set us on theroad towards achieving it. These targets mustalso be translated into action at the nationallevel though national biodiversity strategiesand action plans, and treated as a mainstreamissue across government.
From analysis o the ailure so ar to slowbiodiversity loss, the ollowing elementsmight be considered or a uture strategy [SeeFigure 21]:
✤ Where possible, tackle the indirect driverso biodiversity loss. This is hard, because itinvolves issues such as consumption andliestyle choices, and long-term trends likepopulation increase. However, as the analysisconducted as part o The Economics o Eco-systems and Biodiversity (TEEB) illustrates,public engagement with the issues combined
Better
decisions for
biodiversity
must be made
at all levels and
in all sectors
Global Biodiversity Outlook 3 | 84
R
E
S
P
O
N
S
E
S
P
O
S
T
2
0
1
0
R
E
S
P
O
N
S
E
S
P
R
E
2
0
1
0
UNDERLYING
CAUSES
DIRECT
PRESSURES
STATE OF
BIODIVERSITY
BENEFITS FROM
ECOSYSTEM SERVICES
FIGURe 21 Why the 2010 Biodiversity Target was not met, and what we need to do in the uture
One o the main reasons or the ailure to meet the 2010 Biodiversity Target at theglobal level is that actions tended to ocus on measures that mainly respondedto changes in the state o biodiversity, such as protected areas and programmestargeted at particular species, or which ocused on the direct pressures o biodi-versity loss, such as pollution control measures.
For the most part, the underlying causes o biodiversity have not been addressedin a meaningul manner; nor have actions been directed ensuring we continueto receive the benefts rom ecosystem services over the long term. Moreover,actions have rarely matched the scale or the magnitude o the challenges theywere attempting to address. In the uture, in order to ensure that biodiversity iseectively conserved, restored and wisely used, and that it continues to deliverthe benefts essential or all people, action must be expanded to additional levelsand scales. Direct pressures on biodiversity must continue to be addressed, andactions to improve the state o biodiversity maintained, although on a much largerscale. In addition, actions must be developed to address the underlying causes o biodiversity loss, and to ensure that biodiversity continues to provide the ecosys-tem services essential to human wellbeing.Source: Secretariat o the Convention on Biological Diversity
✤ Vernonia (Vernonia galamensis), a tall weed en-demic to Ethiopia, has shiny black seeds rich inoil. The oil is being investigated or its possible useas a “green chemical” in the production o plasticcompounds that are currently only made rom pet-rochemicals. In 2006, a British company, VerniqueBiotech, signed a 10 year agreement with theEthiopian Government to have access to Vernoniaand to commercialize its oil. As part o the deal, Vernique Biotech will pay a combination o licenceees, royalties and a share o its profts to the Ethio-pian Government. In addition, local armers will bepaid to grow Vernonia on land which is otherwiseunsuitable to grow ood.
✤ Uganda is one o the ew Arican countries that hasdeveloped specifc regulations on access to ge-netic resources and beneft-sharing. Introduced in2005 as part o the National Environment Act, theregulations set out procedures or access to ge-netic resources, provide or the sharing o beneftsderived rom genetic resources; and promote thesustainable management and utilization o geneticresources, thereby contributing to conservation o biological resources in Uganda.
BOX 22 Sharing the benets o bio-
diversity access – examples rom Arica
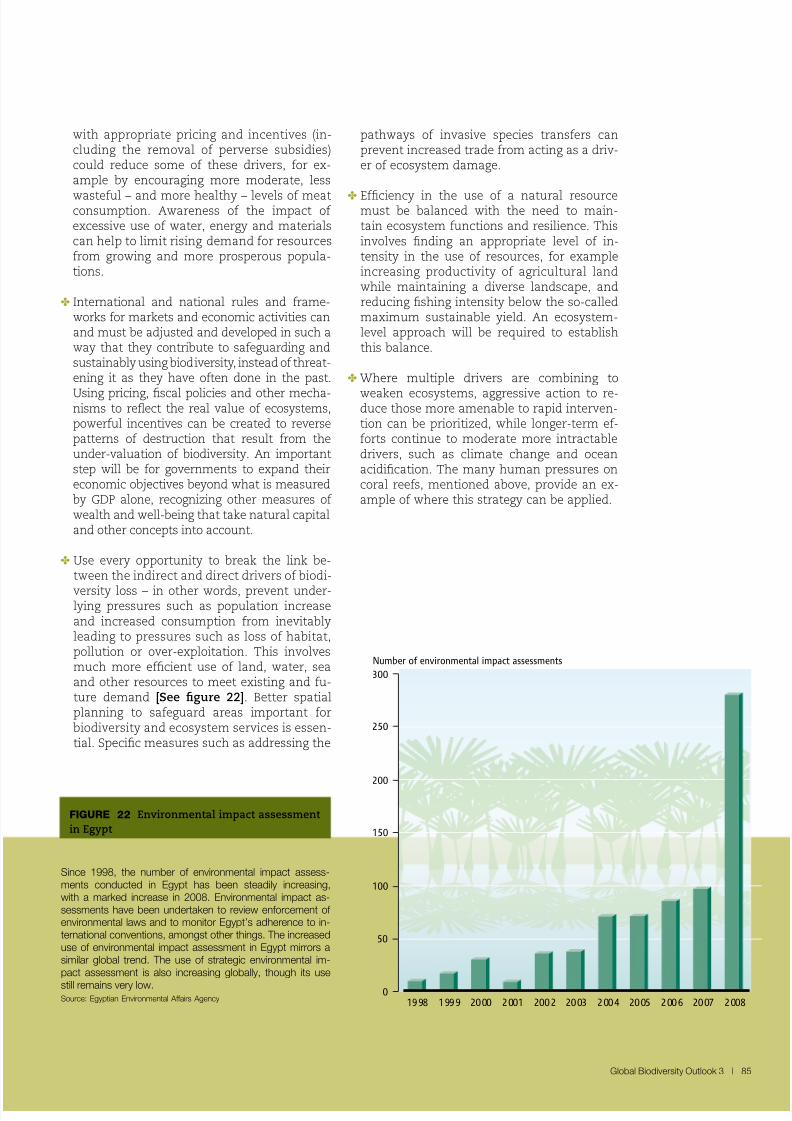
8/8/2019 United Nations - Global Biodiversity Outlook 3 (2010)
http://slidepdf.com/reader/full/united-nations-global-biodiversity-outlook-3-2010 85/96
with appropriate pricing and incentives (in-cluding the removal o perverse subsidies)could reduce some o these drivers, or ex-ample by encouraging more moderate, less
wasteul – and more healthy – levels o meatconsumption. Awareness o the impact o excessive use o water, energy and materialscan help to limit rising demand or resourcesrom growing and more prosperous popula-tions.
✤ International and national rules and rame-works or markets and economic activities canand must be adjusted and developed in such away that they contribute to saeguarding andsustainably using biodiversity, instead o threat-ening it as they have oten done in the past.
Using pricing, scal policies and other mecha-nisms to refect the real value o ecosystems,powerul incentives can be created to reversepatterns o destruction that result rom theunder-valuation o biodiversity. An importantstep will be or governments to expand theireconomic objectives beyond what is measuredby GDP alone, recognizing other measures o wealth and well-being that take natural capitaland other concepts into account.
✤ Use every opportunity to break the link be-tween the indirect and direct drivers o biodi-
versity loss – in other words, prevent under-lying pressures such as population increaseand increased consumption rom inevitablyleading to pressures such as loss o habitat,pollution or over-exploitation. This involvesmuch more ecient use o land, water, seaand other resources to meet existing and u-ture demand [See gure 22]. Better spatialplanning to saeguard areas important orbiodiversity and ecosystem services is essen-tial. Specic measures such as addressing the
pathways o invasive species transers canprevent increased trade rom acting as a driv-er o ecosystem damage.
✤ Eciency in the use o a natural resourcemust be balanced with the need to main-tain ecosystem unctions and resilience. Thisinvolves nding an appropriate level o in-tensity in the use o resources, or exampleincreasing productivity o agricultural landwhile maintaining a diverse landscape, andreducing shing intensity below the so-calledmaximum sustainable yield. An ecosystem-level approach will be required to establishthis balance.
✤ Where multiple drivers are combining to
weaken ecosystems, aggressive action to re-duce those more amenable to rapid interven-tion can be prioritized, while longer-term e-orts continue to moderate more intractabledrivers, such as climate change and oceanacidication. The many human pressures oncoral rees, mentioned above, provide an ex-ample o where this strategy can be applied.
Global Biodiversity Outlook 3 | 85
FIGURe 22 Environmental impact assessment
in Egypt
Since 1998, the number o environmental impact assess-ments conducted in Egypt has been steadily increasing,with a marked increase in 2008. Environmental impact as-sessments have been undertaken to review enorcement o environmental laws and to monitor Egypt’s adherence to in-ternational conventions, amongst other things. The increaseduse o environmental impact assessment in Egypt mirrors asimilar global trend. The use o strategic environmental im-pact assessment is also increasing globally, though its use
still remains very low.Source: Egyptian Environmental Aairs Agency
0
100
200
300
Number of environmental impact assessments
1998 1999 2000 2001 2002 2003 2004 2005 2006 2007 2008
50
150
250
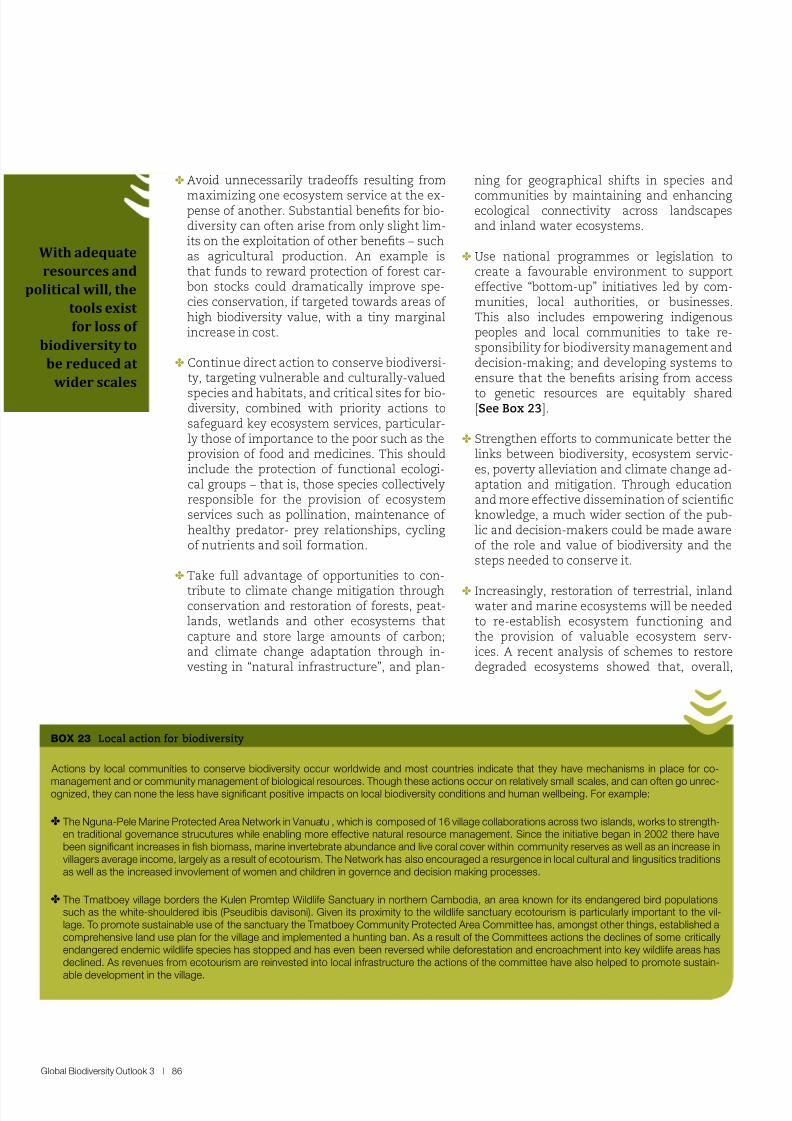
8/8/2019 United Nations - Global Biodiversity Outlook 3 (2010)
http://slidepdf.com/reader/full/united-nations-global-biodiversity-outlook-3-2010 86/96
Global Biodiversity Outlook 3 | 86
✤ Avoid unnecessarily tradeos resulting rom
maximizing one ecosystem service at the ex-pense o another. Substantial benets or bio-diversity can oten arise rom only slight lim-its on the exploitation o other benets – suchas agricultural production. An example isthat unds to reward protection o orest car-bon stocks could dramatically improve spe-cies conservation, i targeted towards areas o high biodiversity value, with a tiny marginalincrease in cost.
✤ Continue direct action to conserve biodiversi-ty, targeting vulnerable and culturally-valued
species and habitats, and critical sites or bio-diversity, combined with priority actions tosaeguard key ecosystem services, particular-ly those o importance to the poor such as theprovision o ood and medicines. This shouldinclude the protection o unctional ecologi-cal groups – that is, those species collectivelyresponsible or the provision o ecosystemservices such as pollination, maintenance o healthy predator- prey relationships, cyclingo nutrients and soil ormation.
✤ Take ull advantage o opportunities to con-
tribute to climate change mitigation throughconservation and restoration o orests, peat-lands, wetlands and other ecosystems thatcapture and store large amounts o carbon;and climate change adaptation through in-vesting in “natural inrastructure”, and plan-
ning or geographical shits in species and
communities by maintaining and enhancingecological connectivity across landscapesand inland water ecosystems.
✤ Use national programmes or legislation tocreate a avourable environment to supporteective “bottom-up” initiatives led by com-munities, local authorities, or businesses.This also includes empowering indigenouspeoples and local communities to take re-sponsibility or biodiversity management anddecision-making; and developing systems toensure that the benets arising rom access
to genetic resources are equitably shared[See Box 23].
✤ Strengthen eorts to communicate better thelinks between biodiversity, ecosystem servic-es, poverty alleviation and climate change ad-aptation and mitigation. Through educationand more eective dissemination o scienticknowledge, a much wider section o the pub-lic and decision-makers could be made awareo the role and value o biodiversity and thesteps needed to conserve it.
✤ Increasingly, restoration o terrestrial, inlandwater and marine ecosystems will be neededto re-establish ecosystem unctioning andthe provision o valuable ecosystem serv-ices. A recent analysis o schemes to restoredegraded ecosystems showed that, overall,
Actions by local communities to conserve biodiversity occur worldwide and most countries indicate that they have mechanisms in place or co-
management and or community management o biological resources. Though these actions occur on relatively small scales, and can oten go unrec-ognized, they can none the less have signifcant positive impacts on local biodiversity conditions and human wellbeing. For example:
✤ The Nguna-Pele Marine Protected Area Network in Vanuatu , which is composed o 16 village collaborations across two islands, works to strength-en traditional governance strucutures while enabling more eective natural resource management. Since the initiative began in 2002 there havebeen signifcant increases in fsh biomass, marine invertebrate abundance and live coral cover within community reserves as well as an increase invillagers average income, largely as a result o ecotourism. The Network has also encouraged a resurgence in local cultural and lingusitics traditionsas well as the increased invovlement o women and children in governce and decision making processes.
✤ The Tmatboey village borders the Kulen Promtep Wildlie Sanctuary in northern Cambodia, an area known or its endangered bird populationssuch as the white-shouldered ibis (Pseudibis davisoni). Given its proximity to the wildlie sanctuary ecotourism is particularly important to the vil-lage. To promote sustainable use o the sanctuary the Tmatboey Community Protected Area Committee has, amongst other things, established acomprehensive land use plan or the village and implemented a hunting ban. As a result o the Committees actions the declines o some criticallyendangered endemic wildlie species has stopped and has even been reversed while deorestation and encroachment into key wildlie areas hasdeclined. As revenues rom ecotourism are reinvested into local inrastructure the actions o the committee have also helped to promote sustain-able development in the village.
BOX 23 Local action or biodiversity
With adequate
resources and
olitical will, the
tools exist
for loss of
biodiversity to
be reduced at
wider scales
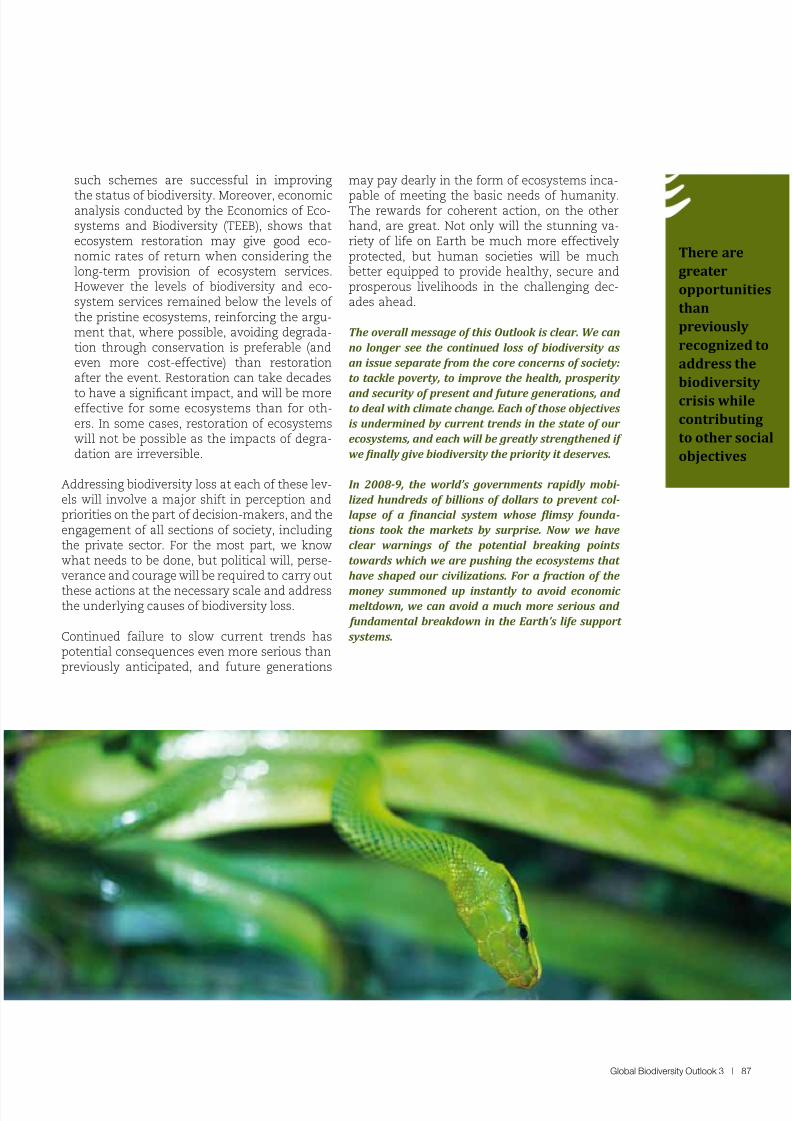
8/8/2019 United Nations - Global Biodiversity Outlook 3 (2010)
http://slidepdf.com/reader/full/united-nations-global-biodiversity-outlook-3-2010 87/96
Global Biodiversity Outlook 3 | 87
such schemes are successul in improving
the status o biodiversity. Moreover, economicanalysis conducted by the Economics o Eco-systems and Biodiversity (TEEB), shows thatecosystem restoration may give good eco-nomic rates o return when considering thelong-term provision o ecosystem services.However the levels o biodiversity and eco-system services remained below the levels o the pristine ecosystems, reinorcing the argu-ment that, where possible, avoiding degrada-tion through conservation is preerable (andeven more cost-eective) than restorationater the event. Restoration can take decades
to have a signicant impact, and will be moreeective or some ecosystems than or oth-ers. In some cases, restoration o ecosystemswill not be possible as the impacts o degra-dation are irreversible.
Addressing biodiversity loss at each o these lev-els will involve a major shit in perception andpriorities on the part o decision-makers, and theengagement o all sections o society, includingthe private sector. For the most part, we knowwhat needs to be done, but political will, perse-verance and courage will be required to carry out
these actions at the necessary scale and addressthe underlying causes o biodiversity loss.
Continued ailure to slow current trends haspotential consequences even more serious thanpreviously anticipated, and uture generations
may pay dearly in the orm o ecosystems inca-
pable o meeting the basic needs o humanity.The rewards or coherent action, on the otherhand, are great. Not only will the stunning va-riety o lie on Earth be much more eectivelyprotected, but human societies will be muchbetter equipped to provide healthy, secure andprosperous livelihoods in the challenging dec-ades ahead.
The overall message of this Outlook is clear. We can
no longer see the continued loss of biodiversity as
an issue separate from the core concerns of society:
to tackle poverty, to improve the health, prosperity
and security of present and future generations, and to deal with climate change. Each of those objectives
is undermined by current trends in the state of our
ecosystems, and each will be greatly strengthened if
we inally give biodiversity the priority it deserves.
In 2008-9, the world’s governments rapidly mobi -
lized hundreds of billions of dollars to prevent col -
lapse of a inancial system whose limsy founda-
tions took the markets by surprise. Now we have
clear warnings of the potential breaking points
towards which we are pushing the ecosystems that
have shaped our civilizations. For a fraction of the
money summoned up instantly to avoid economic meltdown, we can avoid a much more serious and
fundamental breakdown in the Earth’s life support
systems.
There are
greater
opportunities
than
previously
recognized to
address the
biodiversity
crisis while
contributing
to other social
objectives
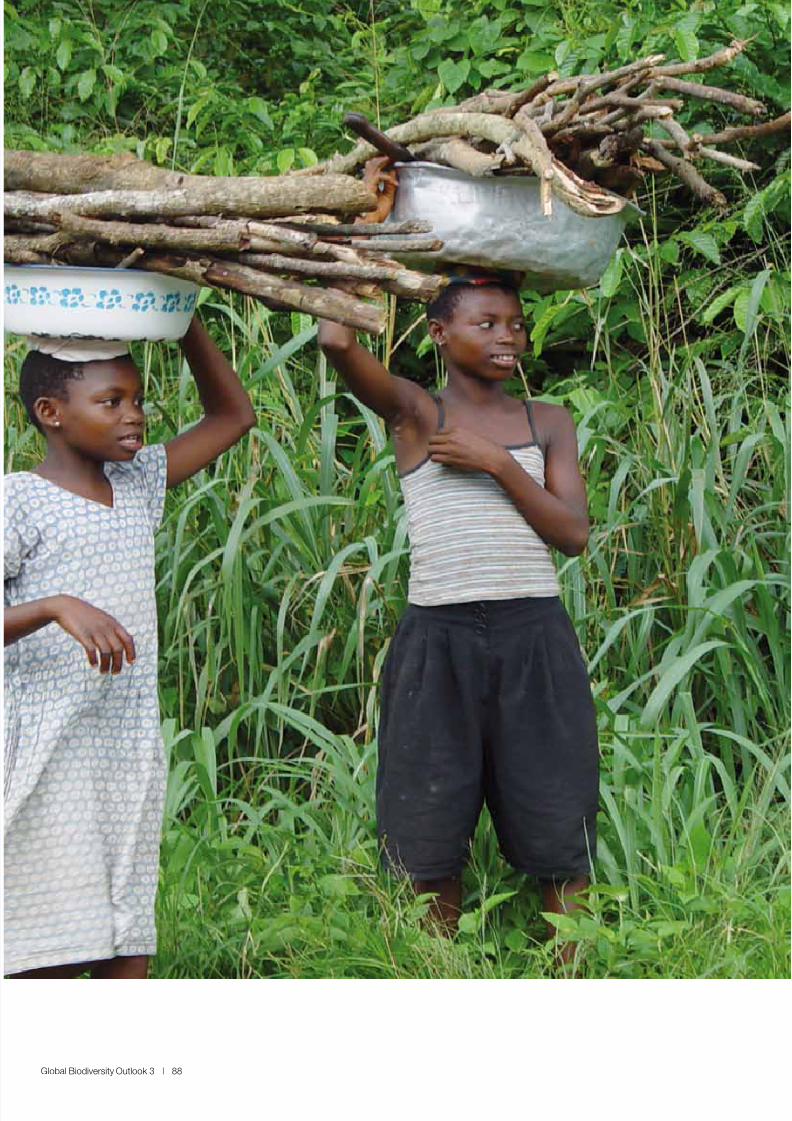
8/8/2019 United Nations - Global Biodiversity Outlook 3 (2010)
http://slidepdf.com/reader/full/united-nations-global-biodiversity-outlook-3-2010 88/96
Global Biodiversity Outlook 3 | 88
Acknowledgements
8/8/2019 United Nations - Global Biodiversity Outlook 3 (2010)
http://slidepdf.com/reader/full/united-nations-global-biodiversity-outlook-3-2010 89/96
Global Biodiversity Outlook 3 | 89
The preparation o the third edition o Global Bio-
diversity Outlook (GBO-3) began in 2006 ollowingthe eighth meeting o the Conerence o the Par-ties to the Convention on Biological Diversity.GBO-3, like its previous two editions, is an out-put o the processes under the Convention. Par-ties to the Convention, other Governments, andobserver organizations have helped to shapethe Outlook through their contributions duringvarious meetings as well as through their com-ments and inputs to earlier drats o GBO-3.
GBO-3 has been prepared by the Secretariat o the Convention on Biological Diversity, in close
collaboration with the World ConservationMonitoring Centre o the United Nations Envi-ronment Programme (UNEP-WCMC). Numer-ous partner organizations and individuals romGovernments, non-governmental organizationsand scientic networks have generously con-tributed their time, energy and expertise to thepreparation o GBO-3, which really is a producto the collective eorts o this community. Thesheer number o organizations and people in-volved in GBO-3 makes it dicult to thank allcontributors by name and doing so runs therisk that some may be overlooked. We sincerely
apologize to anyone who may have been unin-tentionally omitted.
The third and ourth national reports submit-ted by the Parties to the Convention have beenkey sources o inormation in the preparationo GBO-3. These reports, which detail the statusand trends o biodiversity at the national levelas well the successes and challenges in imple-menting the Convention, have infuenced theentire report and have in particular guided thepreparation o the chapter on uture strategicactions, alongside the process to update the
Convention’s Strategic Plan beyond 2010. TheSecretariat would like to thank the more than110 Parties who had submitted their ourth na-tional reports by the time GBO-3 was nalized.
One o the main purposes o GBO-3 is to re-port on the progress which has been made bythe world community towards the 2010 Biodi-versity Target. This assessment, presented inthe rst section o the report, is based on dataand analyses provided by the 2010 BiodiversityIndicators Partnership, a network o organiza-tions which have come together to provide the
most up-to-date biodiversity inormation pos-
sible in order to judge progress towards the
target. The Partnership is coordinated by UNEP-WCMC, with the Secretariat supported by AnnaChenery, Philip Bubb, Damon Stanwell-Smithand Tristan Tyrrell. Indicator partners includeBirdLie International, the Convention on Inter-national Trade in Endangered Species, the Foodand Agriculture Organization o the United Na-tions, the Global Footprint Network, the GlobalInvasive Species Programme, the InternationalNitrogen Initiative, IUCN, the Organisation orEconomic Co-operation and Development, theRoyal Society or the Protection o Birds, The Na-ture Conservancy, the University o Queensland,
TRAFFIC International, the United Nations Edu-cational, Scientic and Cultural Organization,the United Nations Environment ProgrammeGEMS/Water Programme, the UNEP-WCMC, theUniversity o British Columbia Fisheries Centre,WWF, and the Zoological Society o London aswell as a number o Associate Indicator Part-ners. Global Environment Facility ull-sizedproject unding provided substantial nancialsupport or the activities o the Partnership, in-cluding development o many o the global indi-cators used in monitoring progress towards the2010 target. Financial support was also provided
by the European Commission.
In preparing GBO-3 some 500 scholarly articleswere examined and multiple assessments rominternational organizations were drawn upon.This collection o scientic inormation, experi-ences and perspectives was undamental to theconclusions presented in GBO-3, and essentialin reinorcing the inormation contained in theourth national reports and that provided bythe 2010 Biodiversity Indicators Partnership. Inaddition, case study material was provided bya large number o partners amongst which the
Equator Initiative, the Small Grants Program o the Global Environment Facility and the ForestPeoples Network have been particularly active.
The section o GBO-3 on biodiversity scenariosand tipping points is based on a larger studyprepared by DIVERSITAS and UNEP-WCMC. TheSecretariat would like to thank the lead authorso this report Paul Leadley, Henrique MiguelPereira, Rob Alkemade, Vânia Proença, Jörn P.W.Scharlemann, and Matt Walpole, as well as thecontributing authors John Agard, Miguel Araújo,Andrew Balmord, Patricia Balvanera, Oonsie
Biggs, Laurent Bopp, William Cheung,
8/8/2019 United Nations - Global Biodiversity Outlook 3 (2010)
http://slidepdf.com/reader/full/united-nations-global-biodiversity-outlook-3-2010 90/96
Global Biodiversity Outlook 3 | 90
Philippe Ciais, David Cooper, Joanna C. Ellison,
Juan Fernandez-Manjarrés, Joana Figueiredo,Eric Gilman, Sylvie Guenette, Bernard Hugueny,George Hurtt, Henry P. Huntington, Michael Jen-nings, Fabien Leprieur, Corinne Le Quéré, Geor-gina Mace, Cheikh Mbow, Kieran Mooney, AudeNeuville, Carlos Nobres, Thierry Oberdor, Car-men Revenga, James C. Robertson, Patricia Ro-drigues, Juan Carlos Rocha Gordo, Hisashi Sato,Bob Scholes, Mark Staord-Smith, Ussi RashidSumaila, and Pablo A. Tedescco.
In order to ensure that the ndings o GBO-3were o the highest possible quality, two drats
were made available or peer review betweenAugust and December 2009. During this timeresponses were received rom almost 90 review-ers who provided more than 1,500 individualcomments. The Outlook was greatly enhancedby these comments. The preparation o GBO-3has been overseen by an Advisory Group anda Scientic Advisory Panel. The Secretariat isgrateul or the guidance and support provid-ed by the members: Thomas M. Brooks, StuartButchart, Joji Carino, Nick Davidson, BraulioDias, Asghar Fazel, Tony Gross, Peter Herken-rath, Kazuaki Hoshino, John Hough, Jon Hutton,
Tom Lovejoy, Kathy MacKinnon, Tohru Nakashi-zuka, Carsten Neßhöver, Alred Oteng-Yeboah,Axel Paulsch, Balakrishna Pisupati, Jan Plesnik,Christian Prip, Peter Schei, James Seyani, JaneSmart, Oudara Souvannavong, Spencer Tho-mas, Matt Walpole, Dayuan Xue, and Abdul Ha-mid Zakri.
GBO-3 consists o a range o products. This mainreport was prepared to provide a short and con-cise overview o current and projected biodiver-sity trends, and policy options to address bio-diversity loss and negative impacts or human
well-being. Comments and additional inorma-tion received through the peer review processas well as case study examples that could notbe incorporated in the main report have mostlybeen included in an extended technical docu-ment and will be made available online throughthe GBO-3 web portal accessible rom www.cbd.int/gbo3. For reasons o readability, this versiono the report does not include scientic reer-ences. However, these can be consulted in anannotated version also available on the GBO-3web portal.
GBO-3 was written by Tim Hirsch with Kieran
Mooney, Robert Höt and David Cooper. AhmedDjoghla and Jo Kalemani Mulongoy providedguidance. Its production was managed by Rob-ert Höt, Kieran Mooney and David Ainsworth.In addition many Secretariat colleagues pro-vided input and eedback on GBO-3 includ-ing Ahmed Abdullah, Véronique Allain, ClaireBaert, Mateusz Banski, Caroline Belair, LiseBoutin, Lijie Cai, Monique Chiasson, Tim Chris-tophersen, David Coates, Olivier de Munck,Charles Gbedemah, Linda Ghanimé, ChristineGibb, Sarat Babu Gidda, Susanne Heitmuller,Michael Hermann, Oliver Hillel, Christopher
Hogan, Lisa Janishevski, Claudia Kis Madrid,Steano La Tella, Jihyun Lee, Markus Lehmann,Sandra Meehan, Djessy Monnier, Noriko Mori-wake, Valerie Normand, Neil Pratt, NadineSaad, John Scott, Ravi Sharma, Junko Shimura,Stella Simiyu, Gweneth Thirlwell, Alberto Vega,Danush Viswanathan, Frédéric Vogel, JaimeWebb, Anne-Marie Wilson, Kati Wenzel, andYibin Xiang.
Graphs were designed by In-olio. The layoutwas prepared by Phoenix Design Aid. CamelliaIbrahim assisted with photo selection.
Editing and proo-reading o the language ver-sions was done by Abdelwahab Aee, Anasta-sia Beliaeva, Lise Boutin, Lijie Cai, ClementinaEquihua Zamora, Moustaa Fouda, Thérèse Ka-rim, Diane Klaimi, Nadine Saad, Jérôme Spag-giari and Tatiana Zavarzina.
The production o GBO-3 was enabled by nan-cial contributions rom Canada, the EuropeanUnion, Germany, Japan, Spain and the UnitedKingdom, as well as UNEP.
While the Secretariat has taken great care toensure that all statements made in GBO-3 arebacked up by credible scientic evidence, it as-sumes ull responsibility or any errors or omis-sion in this work.
8/8/2019 United Nations - Global Biodiversity Outlook 3 (2010)
http://slidepdf.com/reader/full/united-nations-global-biodiversity-outlook-3-2010 91/96
Global Biodiversity Outlook 3 | 91
Photo Credits
Cover: (The Earth in a drop) = © Shevs | Dreamstime.com
(Coral ree) = © Carlcphoto | Dreamstime.com
(Cattle with people) = © Claude Hamel
(Mountain and eagle) = © Urosmm | Dreamstime.com
Page 2: © Kay Muldoon Ibrahim
Page 4: © I-rishka | Dreamstime.com
Page 8: © Jethemon... | Dreamstime.com
Page 10: © David Coates
Page 12: © Johnanders... | Dreamstime.com
Page 14: © Taust | Dreamstime.com
Page 16: © Christian Carroll | istockphoto.com
Page 17: © Parks Canada / Heiko Wittenborn
Page 21: © 0tvalo | Dreamstime.com
Page 23: © Dejan750 | Dreamstime.com
© Ryszard | Dreamstime.com
© Ferdericb | Dreamstime.com
© Chester | Dreamstime.com
Page 25: © Cathy Keier | istockphoto.com
Page 26: © William Davies | istockphoto.com
Page 28: © Johnanders... | Dreamstime.com
© Deborahr | Dreamstime.com
Page 29: © Rudis | Dreamstime.com
© Weknow | Dreamstime.com
Page 31: © Ajay Rastogi
© Ajay Rastogi
Page 32: © Charles Besançon
Page 33: © luoman | istockphoto.com
Page 34: © Nmedia | Dreamstime.com
© Jan Rihak | istockphoto.com
© Hoshino Village, Fukuoka, Japan
Page 37: © Jmjm | Dreamstime.com
Page 40: © Robert Höt
Page 41: © Tupungato | Dreamstime.com
Page 42: © Ellah | Dreamstime.com
Page 44: © Jan Kood Winther
Page 45: © Peter Malsbury | istockphoto.com
Page 47: © Pniesen | Dreamstime.com
Page 49: © Desislava Nikolova | istockphoto.com
Page 50: © Francisco Ramananjatovo
© Carl Chapman | istockphoto.com
© Jerl71 | Dreamstime.com
© Jerry Oldenettel | fickr.com
Page 52: © Royal Botanic Gardens, Kew
© Royal Botanic Gardens, Kew
Page 53: © Phillipmin... | Dreamstime.com
Page 54: © Oranhall | Dreamstime.com
Page 56: © Ricardo278 | Dreamstime.com
Page 58: © Gail A Johnson | istockphoto.com
Page 60: © Kodym | Dreamstime.com
Page 62: © Lightcatch... | Dreamstime.com
Page 63: © Simon Gurney | istockphoto.com
© Charles Taylor | Shutter Stock.com
© Joe McDaniel | istockphoto.com
Page 64: © Photawa | Dreamstime.com
© Davecurrey | Dreamstime.com
© Billwarcho... | Dreamstime.com
Page 65: © Lucaplacid... | Dreamstime.com
Page 66: © Slobo Mitic | istockphoto.com
Page 70: © Marjo Vierros
Page 73: © Claude Hamel
Page 74-75: © 3000ad | Dreamstime.com
© Tony1 | Dreamstime.com
© Kate Kieer, Australian Antarctic Division
© Kate Kieer, Australian Antarctic Division
Page 78-79: © Robert Höt
© Robert Höt
© Brighthori... | Dreamstime.com
© Barsik | Dreamstime.com
Page 80-81: © Ilanbt | Dreamstime.com
© Alexedmond... | Dreamstime.com
© Erikgauger | Dreamstime.com
© Spanishale... | Dreamstime.com
Page 82: © Leightonph... | Dreamstime.com
Page 87: © Invisiblev... | Dreamstime.com
Page 88: © Claude Hamel
Back cover: (Boat on a river) = © David Cooper
(Trees with person) = © Luis Alonso Argüelles
(Woman with beans) = © Louise Sperling
(Shark) = © Lenta | Dreamstime.com
(Gorilla) = © Warwick Lister-Kaye | istockphoto.com
(Frog) = © Geckophoto | Dreamstime.com
(Field) = © Alexsol | Dreamstime.com
(Forest) = © Lagustin | Dreamstime.com
(Lea background) = © Cobalt88 | Dreamstime.com
8/8/2019 United Nations - Global Biodiversity Outlook 3 (2010)
http://slidepdf.com/reader/full/united-nations-global-biodiversity-outlook-3-2010 92/96
Global Biodiversity Outlook 3 | 92
Boxes
Box 1: Biodiversity, the CBD and the 2010 TargetBox 2: National action on biodiversityBox 3: Why biodiversity mattersBox 4: How extinction risk is assessedBox 5: The Brazilian Amazon – a slowing o deorestationBox 6: Traditionally managed landscapes and biodiversityBox 7: Terrestrial protected areasBox 8: Protecting the Noah’s arks o biodiversityBox 9: Cultural and biological diversityBox 10: What is at stake?Box 11: What is at stake?Box 12: The Great Barrier Ree – a struggle or ecosystem resilienceBox 13: Locally managed marine areas (LMMAs)Box 14: What is at stake?Box 15: Arctic sea ice and biodiversity
Box 16: The European Union’s Nitrates DirectiveBox 17: Managing marine ood resources or the utureBox 18: Documenting Europe’s alien speciesBox 19: Successul control o alien invasive speciesBox 20: Trends in indigenous languagesBox 21: What is a tipping point?Box 22: Sharing the benets o biodiversity access – examples rom AricaBox 23: Local action or biodiversity
Tables
Table 1: Status o agreed subsidiary targets to 2010 biodiversity targetTable 2: Trends shown by agreed indicators o progress towards the 2010 biodiversity target
Figures
Figure 1: Parties to the Convention on Biological Diversity(Source - Secretariat o the Convention on Biological Diversity)
Figure 2: Living Planet Index(Source - Adapted rom WWF/ Zoological Society o London)
Figure 3: Proportion o species in dierent threat categories(Source - Adapted rom J.-C. Vié, C. Hilton-Taylor and S. N. Stuart (eds). The 2008 review o the IUCNRed List o Threatened Species. Gland, Switzerland: IUCN)
Figure 4: Threat status o species in comprehensively assessed taxonomic groups(Source - Adapted rom Hilton-Taylor, C., Pollock, C., Chanson, J., Butchart, S. H. M., Oldeld, T. andKatariya, V. (2008) Status o the world's species. Pp 15-42 in: J.-C. Vié, C. Hilton-Taylor and S. N.Stuart (eds). The 2008 review o the IUCN Red List o Threatened Species. Gland, Switzerland: IUCN)
Figure 5: Red List Index(Source - Adapted rom Hilton-Taylor, C., Pollock, C., Chanson, J., Butchart, S. H. M., Oldeld, T. andKatariya, V. (2008) Status o the world’s species. Pp 15–42 in: J.-C. Vié, C. Hilton-Taylor and S. N.Stuart (eds). The 2008 review o the IUCN Red List o Threatened Species. Gland, Switzerland: IUCN)
Figure 6: Conservation status o medicinal plant species in dierent geographic regions(Source - Adapted rom J.-C. Vié, C. Hilton-Taylor and S. N. Stuart (eds). The 2008 review o the IUCNRed List o Threatened Species. Gland, Switzerland: IUCN)
Figure 7: Annual and cumulative deorestation o the Brazilian Amazon(Source - Adapted rom Brazilian National Space Research Institute (INPE) and the BrazilianMinistry o Environment (MMA))
List of Boxes, Tbles nd Figures
8/8/2019 United Nations - Global Biodiversity Outlook 3 (2010)
http://slidepdf.com/reader/full/united-nations-global-biodiversity-outlook-3-2010 93/96
Global Biodiversity Outlook 3 | 93
Figure 8: Extent o national designated protected areas(Source - Adapted rom UNEP World Conservation Monitoring Centre (2009) World Database on
Protected Areas (WDPA))
Figure 9: Protection o critical biodiversity sites(Source - Adapted rom Stuart Butchart/Alliance or Zero Extinction)
Figure 10: Coverage o terrestrial protected areas by ecoregions(Source – Bastian Bomhard, adapted rom Coad, L., Burgess, et.al. (2009). The ecological repre-sentativeness o the global protected areas estate in 2009: progress towards the CBD 2010 target.UNEP-WCMC, WWF-US and the Environmental Change Institute at the University o Oxord.
Figure 11: Malaysia river basin quality(Source - Adapted rom Government o Malaysia - Ministry o Natural Resources andEnvironment (2009). Fourth National Report to the Convention on Biological Diversity andMalaysia Department o Environment (2009). Malaysia Environment Quality Report 2008.Department o Environment.
Figure 12: China’s Marine Trophic Index(Source - Adapted rom Chinese Ministry o Environmental Protection (2008). China’s FourthNational Report on Implementation o the Convention on Biological Diversity and Xu, H., Tang,X., Liu, J., Ding, H., Wu, J., Zhang, M., Yang, Q., et al. (2009). China's Progress toward the SignicantReduction o the Rate o Biodiversity Loss. BioScience, 59(10), 843-852)
Figure 13: Extinction risk o livestock breeds(Source - Adapted rom FAO. (2007). The State o the World’s Animal Genetic Resources or Foodand Agriculture, edited by Barbara Rischkowsky & Daydd Pilling. Rome)
Figure 14: Arctic sea ice(Source - Adapted rom NSIDC (2009) Sea Ice Index. Boulder, Colorado USA: National Snow andIce Data Center)
Figure 15: Marine “dead zones”(Source - Updated and adapted rom Diaz, R. J., & Rosenberg, R. (2008). Spreading Dead Zonesand Consequences or Marine Ecosystems. Science, 321(5891)
Figure 16: Nitrogen balance in Europe(Source - Adapted rom OECD (2008) Environmental Perormance o Agriculture in OECDcountries)
Figure 17: Summary o biodiversity indicators(Source - Adapted rom Butchart, S. H. M., Walpole, M., et.al. (2010) Global biodiversity: indicatorso recent declines. Science (in press)
Figure 18: Tipping points – an illustration o the concept(Source - Secretariat o the Convention on Biological Diversity)
Figure 19: Projected orest loss until 2050 under dierent scenarios(Source - Adapted rom Leadley, P., Pereira, H.M., et.al. (2010) Biodiversity Scenarios: Projections o 21st century change in biodiversity and associated ecosystem services. Secretariat o the Conven-tion on Biological Diversity, Montreal. Technical Series no. 50)
Figure 20: Land use change under dierent scenarios(Source -Adapted rom Wise, M., Calvin, K., Thomson, A., Clarke, L., Bond-Lamberty, B., Sands, R.,Smith, S. J., et al. (2009). Implications o Limiting CO2 Concentrations or Land Use and Energy. Sci-ence, 324(5931), 1183-1186)
Figure 21: Why the 2010 biodiversity target was not and we need to do in the uture(Source - Secretariat o the Convention on Biological Diversity)
Figure 22: Environmental impact assessment in Egypt(Source - Adapted rom Arab Republic o Egypt (2009). Egypt State o Environment Report 2008.Ministry o State or Environmental Aairs Egyptian Environmental Aairs Agency)

8/8/2019 United Nations - Global Biodiversity Outlook 3 (2010)
http://slidepdf.com/reader/full/united-nations-global-biodiversity-outlook-3-2010 94/96
Global Biodiversity Outlook 3 | 94
8/8/2019 United Nations - Global Biodiversity Outlook 3 (2010)
http://slidepdf.com/reader/full/united-nations-global-biodiversity-outlook-3-2010 95/96
8/8/2019 United Nations - Global Biodiversity Outlook 3 (2010)
http://slidepdf.com/reader/full/united-nations-global-biodiversity-outlook-3-2010 96/96
Gl o b al B i o d i v er si t y O u t l o ok
3