Embed Size (px)
Citation preview

Removing Barriers to Energy Efficiency in Cape Verdean built environment and for appliances Page 1
United Nations Development Program Country: Cabo Verde PROJECT DOCUMENT1
Project Title: Cabo Verde Appliances & Building Energy-Efficiency Project (CABEEP)
COUNTRY PROGRAMME / UNDAF Outcome(s) #4: Institutions reinforce environmental governance and integrate principles of environmental sustainability, climate change and disaster relief reduction; public and private institutions adopt a holistic approach to conservation and protection of critical habitats and biodiversity.
Outcome Indicator: a) % of public resources allocated to environment b) number of key sector strategies integrating environmental dimension.
UNDP Strategic Plan Environment and Sustainable Development Primary Outcome: Energy and environment for sustainable development and green growth
UNDP Strategic Plan Secondary Outcome: Area of development work: sustainable development pathways
Expected CP Outcome(s):Growth and development are inclusive and sustainable, incorporating productive capacities that create employment and livelihoods for the poor and excluded
Expected CPAP Output (s): Integration of climate change and disaster risk reduction into territorial plans; national institutions and CSO strained and strengthened in environmental management.
Executing Entity/Implementing Partner: Directorate General of Energy (DGE) under Ministry of Tourism, Industry and Energy and Directorate General for Environment (DGA) under Ministry of Environment, Housing and Land Use.
Responsible Partners: Directorate General of Energy(DGE)
1For UNDP supported GEF funded projects as this includes GEF-specific requirements


Table of Contents
SECTION I: SITUATION ANALYSIS .............................................................................................................. 10
1.1 Country situation .................................................................................................................................. 10
1.2 Energy situation ....................................................................................................................................... 11
Overview .......................................................................................................................................................... 11
Electricity Sector............................................................................................................................................... 13
Greenhouse Gas emissions in Cabo Verde ..................................................................................................... 14
1.3 Barrier analysis........................................................................................................................................... 15
Legal and Regulatory Barriers ......................................................................................................................... 16
Institutional Barriers.......................................................................................................................................... 17
Policy Barriers .................................................................................................................................................. 18
Financial Barriers ............................................................................................................................................. 19
Awareness and Knowledge Barriers ................................................................................................................ 20
Inadequate data on building energy use .......................................................................................................... 20
1.4 Stakeholder Analysis ............................................................................................................................... 22
1.5 Baseline analysis ..................................................................................................................................... 28
Domestic Appliances: Baseline ........................................................................................................................ 28
Baseline Energy use ........................................................................................................................................ 30
Appliances: Business as Usual (BAU) Scenario vs. Alternative Scenario ....................................................... 35
Alternative Scenario ......................................................................................................................................... 36
Buildings Sector: Baseline ............................................................................................................................... 39
Buildings: BAU v/s Alternative Scenario .......................................................................................................... 41
GEF CO2 Calculation Methodology .................................................................................................................. 43
Indirect Emissions Reductions ......................................................................................................................... 43
Water Usage: Baseline .................................................................................................................................... 43
Water Usage: Alternative Scenario .................................................................................................................. 45
SECTION II: PROJECT INTERVENTION STRATEGY .................................................................................. 46
2.1 Project Rationale and Policy Conformity .............................................................................................. 46
2.2 Project Goal, Objective, Outcomes and Outputs/Activities ................................................................. 46
2.3 Project Outcomes, Output and Activities .............................................................................................. 46
2.4 PROJECT Indicators, Risks and Assumptions ..................................................................................... 63
Project Indicators.............................................................................................................................................. 63
Risks ............................................................................................................................................................... 63
Assumptions ..................................................................................................................................................... 65
2. 5 INCREMENTAL REASONING: EXPECTED Global, National and Local Benefits .............................. 66
2.6 Cost‐effectiveness ................................................................................................................................... 67
2.7 Sustainability and Replicability .............................................................................................................. 67

Replicability: ..................................................................................................................................................... 68
Sustainability .................................................................................................................................................... 68
SECTION III: STRATEGIC RESULTS FRAMEWORK AND GEF INCREMENT ........................................... 69
SECTION IV: TOTAL BUDGET AND WORK PLAN ...................................................................................... 76
SECTION V: MANAGEMENT ARRANGEMENTS ......................................................................................... 82
5.1 Project Organization Structure ............................................................................................................... 82
SECTION VI: MONITORING FRAMEWORK AND EVALUATION ................................................................ 84
SECTION VII: LEGAL CONTEXT ................................................................................................................... 88
ANNEXURES ................................................................................................................................................... 89
Annex A: List of stakeholders consulted .......................................................................................................... 89
Annex B: Terms of Reference for Key Project Personnel ................................................................................ 90
Request for Proposal (RFP) – Buildings .......................................................................................................... 92
Request for Proposal (RFP) – Appliances ....................................................................................................... 96
Annex C: Emission reduction calculations ....................................................................................................... 99
Annex D: Identified Potential Demonstration Project ..................................................................................... 108
Annex E: AGREEMENTS .............................................................................................................................. 112
119
ANNEX F: Communications and visibility requirements: ............................................................................... 120
ANNEX G: Direct Project Costs for projects financed from GEF-managed vertical funds and the Adaptation
Fund ..................................................................................................................................................... 121
DESCRIPTION OF UNDP COUNTRY OFFICE SUPPORT SERVICES ...................................................... 123
Annex H: UNDP-GEF Environmental and Social Screening Procedure (ESSP) ........................................ 124

List of Tables and Figures
Figure 1 : Installed generation capacity by technology (2010) ............................................................................ 11
Figure 2: Sectoral Shares of Total Energy Consumed (2010) ............................................................................. 12
Figure 3 : Diesel Oil Imports (2003-12) ................................................................................................................ 12
Figure 4: CO2 Emissions in 2000(Fraction of total) ............................................................................................. 15
Figure 5 : Typical Residential Energy Use(kWh/yr) ............................................................................................. 29
Figure 6: Appliances Imports by Country of Origin(2008-12) .............................................................................. 29
Figure 7: Air Conditioner (Baseline): Import Volume, Energy Use and tCO2 Emissions ..................................... 31
Figure 8: Refrigerators and Freezers (Baseline) - Import Volume, Energy Use, and tC2 Emissions .................. 31
Figure 9: Electric Water Heaters (Baseline) - Import Volume, Energy Use, and tCO2 emissions ....................... 32
Figure 10: Televisions (Baseline): Import Volume, Energy Use and tCO2 emissions ......................................... 33
Figure 11: Bulbs (Baseline): Import Volume, Energy Use and tCO2 emissions ................................................... 33
Figure 12: Cumulative Energy Consumption by Appliances (2004-13) ............................................................... 34
Figure 13: Annual Energy Consumption (MWh) – Cumulative ............................................................................ 35
Figure 14: Business as Usual – Total Energy Consumption By Appliances ....................................................... 36
Figure 15: Air Conditioners – BAUv/s MEPS scenario ........................................................................................ 37
Figure 16: Refrigerators and Freezers: BAU v/s MEPS Scenario ....................................................................... 37
Figure 17: Electric Water Heaters: BAU v/s MEPS Scenario .............................................................................. 38
Figure 18: Televisions: BAU v/s MEPS Scenario ................................................................................................ 38
Figure 19: Bulbs - BAU v/s MEPS scenario ......................................................................................................... 38
Figure 20: GHG Abatement Potential tCO2e by Appliance Category .................................................................. 39
Figure 21: Electricity Sales by sector (2012) ....................................................................................................... 40
Figure 22: Energy Consumption (MWh) - Buildings Sector (2005-12) ................................................................ 41
Figure 23: Business as Usual (energy consumption -MWh) ................................................................................ 41
Figure 24: BAU v/s Alternative Scenario for EEBC Implementation .................................................................... 41
Figure 25: Water Production and Sales (2008-12) .............................................................................................. 44

Figure 26: EEBC Code Development Approach .................................................................................................. 48
Figure 27: Stakeholder Engagement for EEBC Code Development ................................................................... 48
FIGURE 28: Project Organizational Structure ..................................................................................................... 83

Table 1: Energy Growth Rate (2001-10) ……………………………………………………………………………………13
Table 2: Fossil Fuel Growth Rate for Electricity Generation (2001-10) ............................................................... 13
Table 3: CO2 Emissions in Cabo Verde ............................................................................................................... 15
Table 4: Energy Consumption per appliance estimate ........................................................................................ 30
Table 5: Cumulative Energy Consumptions and by Appliance Category (2004-13) ........................................... 34
Table 6: Total Cumulative Energy Consumption in each year (2004-13) ............................................................ 34
Table 7: Scenario 1: MEPS Labels – Energy Savings (MWh), GHG Abatement Potential (ktCO2e) ................... 36
Table 8: Alternative Scenario 2: Labelling Programme........................................................................................ 39
Table 10: Cumulative Energy Savings and GHG Savings ................................................................................... 41
Table 11: Summary of energy savings and CO2emissions savings .................................................................... 42
Table 13: Indirect Emissions Reductions: Buildings And Appliances .................................................................. 43
Table 14: Water usage data ................................................................................................................................. 44
Table 15: Water Desalination and Water Pumping (Energy Use (MWh), GHG Emissions) ................................ 44
Table 16 : GHG Emissions Savings from Water Efficiency ................................................................................. 45
Table 17: Project Indicators ................................................................................................................................. 63
Table 19 : Global Environment Benefits .............................................................................................................. 66
Table 21 : Summary of Funds .............................................................................................................................. 79
Table 22 : Work Plan ............................................................................................................................................ 79
TABLE 23 : M& E work plan and budget ............................................................................................................. 87
Table 24 : Key Evaluation Criteria........................................................................................................................ 94
Table 25 : Key Evaluation Criteria........................................................................................................................ 97
Table 27 : Business as Usual Scenario for Appliances ..................................................................................... 100
Table 28: Survey Data for Appliances (Collected During the PPG Phase) ....................................................... 102
Table 30 : Co2 Emissions (Appliances) ............................................................................................................. 104
Table 31 : Annual Sales - Electra (2005-12) ...................................................................................................... 105
Table 32 : Energy Savings and Emissions Abatement (2016-28) ..................................................................... 106
Table 33: Buildings Baseline and Alternative Scenario ..................................................................................... 107

List of Acronyms
ADF African development fund
AEB Águas e Energia de Boavista
ANMCV National Municipality Association
APN Águas de Porto Novo
ARE Economic Regulatory Agency
AWP Annual Work Progress
BAU Business as-Usual
CCISS Chamber of Commerce Industries and Services Sotavento
DGC General Directorate Customs
DGE Directorate General for Energy
DGIC General Directorate for Industry and Commerce
DGOTDU Directorate General of Land-use planning and urbanization
DGT General Directorate for Tourism
DSM Demand Side Management
ECM Energy Conservation Measures
ECOWAS Economic Community Of West African States
ECREEE ECOWAS Centre for Renewable Energy and Energy Efficiency
EEB Energy Efficient Buildings
EEEP ECOWAS energy efficiency Policy
ELECTRA National Electricity and Water Company
EREP ECOWAS Renewable Energy Policy
EOP End of Project
EU European Union
GEF Global Environment Facility
GHG Greenhouse Gases
GDP Gross Domestic Product
HDI Human Development Index
INE National Statistics Institute- Cabo Verde

INGT National Institute of Land Management
INPSS National Social Insurance Fund
INMG Institute of Meteorology and Geophysics
IPCC Intergovernmental Panel on Climate Change
IPP Independent Power Producers
IFH Housing Development Institute
IGQ Instituto de Gestão de Qualidade/ Quality Management Institute
JICA Japan International Corporation Agency
kWh Kilowatt hour
LEC Civil Engineering Laboratory Cabo Verde
LLC Limited Liability Company
LUXDEV Luxembourg Development Agency
MAHOT Ministry of the Environment Housing and Land Use Planning
MEPS Minimum Energy Performance Standards
MTIE Ministry of Tourism, Industry, and Energy
M&V Monitoring and Verification
MW Megawatts
NAMA Nationally Appropriate Mitigation Actions
NPD National Project Director
NPM National Project Manager
OAC Order of Architects of Cabo Verde
PANA II National Action Plan for the Environment
PMU Project Management Unit
PSC Project Steering Committee
SE4All Sustainable Energy for All
S&L Standards and Labeling
UNFCCC United Nations Framework Convention on Climate Change
WE Water Efficiency
SECTION I: SITUATION ANALYSIS 1.1 Country situation
Cabo Verde is a small island country located in the Atlantic Ocean, approximately 570 kilometres off the
coast of West Africa. The country is a horseshoe-shaped cluster of ten (10) islands2 (nine inhabited) and
thirteen islets constituting an area3 of 4,033 km². As per the latest estimates, the country has a population of
531,046(July 2013 estimates)4. The population has grown in the last 30 years at a different pace in the inter-
census periods. The population growth rate, depending on migration flows in 1999-2000 (last census data)
was approximately 2.4 % and dropped to 1.41% in 2012. Latest estimates states that the country’s 62.6% of
population lives in urban areas with 2.12% of annual rate of urbanization5.
In climate terms, the country lies in the Sub-Saharan African climatic zone. It has a dry tropical climate with
two distinct seasons: a dry season and a rainy season. The islands are under the influence of the Azores
subtropical anticyclone, the low equatorial pressures, cold current from the Canaries and thermal depression
over the African continent during summer. The country experiences an average rainfall of 225 mm/year,
approximately 20% of the water from the rainfall is lost through surface runoff, 13% infiltrates, recharging
aquifers, and 67% evaporates6. Only ten percent of the land is arable because rainfall accumulation is
minimal and irregular, the terrain is rough with high wind erosion. The annual average temperature is around
25º C for coastal areas, reaching19º C in areas above 1,000 meters of altitude.
The country has poor natural resource including poor soil for agriculture. Share of food production is low,
nearly 82% of food in imported. The country is living in water scarcity, with less than 500m³/year of fresh
water per capita to meet the country´s needs in terms of human consumption, agriculture, industry, energy
and environment. Cabo Verde experiences long periods of droughts, with underground and surface sources
are insufficient to meet the demand. Currently, major cities of Praia and Mindelo as well as tourist
destinations Sal, Maio and Boa Vista are using desalinated water for human consumption, which is already a
rather controversial7 and expensive measure to increase water availability. Forecasts for water demand
show a steep increase in the upcoming years.
The country is presently facing several climate change issues including extreme weather events, such as
torrential rains and tropical storms, prolonged droughts, increased temperature and out-of-season
precipitations. Impacts of these events further aggravate other environmental challenges experienced by the
country such as soil erosion, desertification, salt intrusion in underground aquifers and low-lying land; and
coastal erosion. Additional anthropogenic pressures on the environment, such as: deforestation due to
demand for wood used as fuel; overfishing and illegal capture of protected species; landscapes and water
pollution due to unsustainable waste treatment, industrial, husbandry and agriculture practices or transport
sector’s operations; and predation of endangered species. These activities threaten several world-protected
species of birds and reptiles, and endanger valuable ecosystems and the services they provide. In general,
over exploitation of natural resources – such as illegal inert extraction (beach and catchment-area sand and
gravel extraction for construction purposes) or uncontrolled water-pumping, as well as the above mentioned
2The main islands are: Barlovento (windward northern island group)—Santo Antão, Sao Vicente, Santa Luzia, Sao Nicolau, Sal, Boa Vista, and Sotavento (leeward southern island group)—- Maio, Santiago, Fogo, Brava. 3Portal of the National Institute of Statistics, Cabo Verde 4Portal of the National Institute of Statistics, Cabo Verde 5Portal of the National Institute of Statistics, Cabo Verde 6UNFCC-Cape Verde 7From an environmental point of view, given that water desalination consumes fossil fuels in large quantities and changes the water temperature on location.

processes, reinforce negative climate change impacts experienced in the country and/or projected for small
island states and contribute to world’s GHG’s emissions at the origin of climate change.
In recent years there has been a positive economic growth in the country, with GDP per capita grew
significantly from $ 2,080 (USD) in 2000 to $ 4,200 (USD) in 2012, according to the data from the World
Development Indicators Database (2012). The country’s Human Development Index (HDI) is 0.586, which is
higher than the average Sub-Saharan African countries (HDI 0.475)8.It is a stable democracy with levels of
literacy and education significantly higher than all other countries in West Africa. The economy is service-
oriented with about three –fourths of GDP accounting from commerce, transport, tourism, and public
services. Tourism has been the fastest growing sector in recent years, with 26% increase (19,247 million
Escudos) between 2002 and 2006. In 2007, tourism contribution to GDP was 19.2%, reflecting some
dependence of the economy on this sector9.
1.2 Energy situation Overview
Cabo Verde’s energy sector is strongly characterized by consumption of fossil fuels (derived oil–primarily
imported oil), biomass (wood) and use of renewable energy particularly wind and solar power. The country's
high dependence on petroleum products is increasing with the demand for electricity, which is growing by
8.1% per year.10This represents a heavy burden on the national economy. The installed capacity increased
from 82.3 MW in 2010 to 155.8 MW in 2013. The country’s total energy matrix as of 2013 (figure 1) includes
the installed capacity by technology as 76% by diesel (imported), 19 % by wind, 5% by solar11.
Figure 1: Installed generation capacity by technology (2010)
Figure 2 shows the total energy consumed by various sectors in 2010 with residential sector contributing to
29% of the total energy demand. Electricity production comes majorly from imported diesel oil with a share of
renewable energy (wind farms) connected to the grid. Increased import dependency as shown in figure 3 and
increased demand prices make the country highly vulnerable to future fuel price shocks and demand risk.
8UNDP, Human Development Report (2013) 92nd National Communication on Climate Change of Cape Verde- October 2010 10 Cape Verde: Country Strategy paper (2014-19) 11IRENA Project Navigator Workshop- The current situation of RE- status and challenges – ELECTRA – Cabo Verde

Figure 2: Sectoral Shares of Total Energy Consumed (2010)
Figure 3: Diesel Oil Imports (2003-12)
The country has high renewable energy potential including solar energy, wind and biomass. The share of
renewable in the energy mix has increased to 21% in 2012. The Government’s National Energy Policy
(2008) sets target to achieve 50% of its electricity through renewable sources by 2020. The country is now
looking at an ambitious target of reaching 100% of its electricity from renewable 12. Similarly under the
Barbados Declaration, 2012 the Government of Cabo Verde has also established a target to increase energy
efficiency by 30% by 2020.
12 Cabo Verde: Country strategy paper 2014-18

Electricity Sector
The electricity consumption in the country has doubled in the last 10 years. In future, the installed power to
produce electricity will increase from155.8 MW in 2013 to 300 MW by 202013. In 2012, energy consumption
was reported 647 kWh per capita per annum and power prices at over $0.40 per kWh, which are the highest
in Africa, majorly due to high import fuel costs and high-energy thefts. Given that, Cabo Verde GDP is
estimated to be $3,900 per year by the World Bank at, which at $ 330 per month, suggests that on an
average, approximately 15-20% of an individual’s income spent on energy costs, which is very high14 . The
cost of electricity is nearly 70% higher than that in the European Union. This implies that many inhabitants in
Cabo Verde face fuel poverty situation. Growth rates from 2001-2010, shown in the table 115, affirm that
electricity production has increased by 94% with growth in demand escalating to 114% in the last decade.
Table 1: Energy Growth Rate (2001-10)16
As an archipelago, each island of Cabo
Verde has its own local power station
running on petroleum products and its
own electrical grid. Table 2 17shows the
multiple fold increase in fossil fuel consumption for electricity generation.
Table 2: Fossil Fuel Growth Rate for Electricity Generation (2001-10)
The electricity power system has reported high growth in the past, achieving coverage of 90 % of the country
in 2010. Since early 90s, an important Rural Electrification Programme was implemented extending the
electrical grid to the most remote rural areas. The coverage of the urban areas is almost 100%18.The
National Electricity and Water Company (ELECTRA) 19held by the government (85%) and municipalities
(15%) is responsible for supplying electricity and desalinated water in the most parts of the country. In Boa
Vista Island there is Aguas e Energia de Boa Vista (AEB) providing electricity and desalinated water to final
consumers under a subcontractor agreement with ELECTRA.
Additionally, APP provides electricity to some resorts in Sal Island. APP/APN supply desalinated water in Sal
and Santo Antão by the municipalities in Maio and Sao Nicolao and by ELECTRA in other islands. In
addition, few companies like Cabo Eolica and Electric produce electricity from renewable energy (RE) (wind
farms) and sell it to ELECTRA under a power purchase agreement (PPA). The electricity sales have
registered an average annual increase of 3.6% during the last five years, having registered in the last two
years an annual increase of about 4.9%. 20 This is the result of rural electrification programs and grid
13CaboVerde: country strategy paper 2014-2018 14Energy Policy of Cape Verde -2008 15 IRENA Renewable and Islands Global Summit - Malta 2013 Eng. José Brito 16 IRENA Renewable and Islands Global Summit - Malta 2013 Eng. José Brito 17 IRENA Renewable and Islands Global Summit - Malta 2013 Eng. José Brito 18Cabo Verde: energy analysis and recommendation undertaken by UNIDO and ECREEE 19 Cabo Verde electricity transmission network development project: African Development Fund 20ELECTRA
Indicator Growth rate
Electricity Production +94%
Installed Capacity +78%
Demand +114%
GDP +70%
Products Growth rate
Diesel +180%
Fuel +500%
Price Increase Diesel (+122%)
Fuel (+85%)

extension projects in urban areas. This is the result of rural electrification programs and grid extension
projects in urban areas.
Greenhouse Gas emissions in Cabo Verde
Cabo Verde makes the energy sector to account for 92.9% of CO2 emissions by fossil fuel consumption,
which is the main source of GHG emissions. In 2000, the transport sub-sector accounted for 44.5% of CO2
emissions in the energy sector, remainder being divided between other sub-sectors of energy industries
(31.4%) general industries (6.8%), other uses (10.2%) and land change use and forestry sector
(7.1%)21.According to the world development indicators, CO2 emissions in the country are 356 thousand
metric tons in 2010 with nearly 300% rise between 1990-201022. Emissions from consumption of fossil fuels
212nd Cabo Verde National communications to the UNFCCC 222013: World development Indicators: Trends in Greenhouse gas emissions
BOX 2: REINFORCEMENT OF ELECTRICITY PRODUCTION ON FOUR ISLANDS PROJECT
Santo Antão, Fogo, São Nicolau and Boavista
The project is financed by the Government of the Kingdom of the Netherlands and the Government of the
Republic of Cabo Verde. It consists of construction of new power plant on Santo Antão, Fogo and Sao
Nicolau islands; and installation of power production equipment on all three islands in addition to Boavista;
creating one integrated network on each island with a uniform distribution voltage of 20kV
The project focuses on predominantly rural islands and pursues the following objectives:
Improve efficiency and security of electricity supply
Facilitate the access network connection to rural families
Decommissioning of the existing power plant which are within residential areas causing noise and
environmental pollution
Decommissioning of micro-power plants still operating in these island and reduce the cost of production
BOX 1: THE NATIONAL ELECTRICITY COMPANY (ELECTRA)
The National Electricity Company (ELECTRA) is a limited liability company (LLC) that holds monopoly over
electricity transmission and distribution in Cabo Verde. It is also responsible for the production and
distribution of drinking water in some municipalities. The state owns 77.74% of ELECTRA’s share capital,
the National Social Insurance Fund (INPSS) 16.59% and municipalities the remaining 5.67%.
The Electricity Transmission and Distribution Network Development Project:
The project financed by the African Development Fund (ADF), the Japan International Cooperation Agency
(JICA) and the Government of Cabo Verde helped to upgrade power distribution networks to improve access
to electricity, service efficiency and quality in Cape Verde. The project contributes to achieving the electricity
sector development strategy, which seeks to raise power utility quality in Cabo Verde to international
standards (network loss rate of between 5% and 10%, power outages of less than 100 min /year etc.). It
contributes to improving the technical, commercial and financial performance of the National Electricity
Company (ELECTRA).
The project concerns 492,000 inhabitants (or 94% of the total population) of Cabo Verde living on six of its
islands. It contributes to increasing the overall rate of access to electricity from 88% in 2010 to 98% by 2018,
and facilitates the electrification of some fifty localities in rural areas.

has increased from 0.174 million metric tons of CO2 in 2000 to 0.43 million metric tons in 2011 (with annual
growth rate of 12.75 %)23.
Table 3: CO2 Emissions in Cabo Verde
Figure 4: CO2 Emissions in 2000(Fraction of total)
The country's energy plan for the next 10 years aims at mitigating GHG emissions, by achieving a renewable
energy penetration rate of 25% by 2011, 50% by 2020 and 100% by 2030 and having at least one of the
islands using 100% renewable sources of energy24. At the same time promoting energy conservation and
efficiency in the energy sector; expanding electricity production capacity; single power plants; increasing
efficiency production and distribution, improving storage capacity and grid improvement programs.
1.3 Barrier analysis
23U.S. Energy Information Administration 24ECOWAS Initiative on energy efficiency in buildings –concept note (Draft), October 2013
Sector 1995 2000 Fraction of
Total
(in 2000)
Change
(1995-2000)
kTon %
Energy 217.52 284.95 92.9 31.0
Energy industries 62.10 96.22 31.4 54.9
Industries in general 21.12 20.80 6.8 -1.5
Transport 106.90 136.66 44.5 27.8
Other uses 27.40 31.27 10.2 14.1
Land change and forestry 57.08 21.84 7.1 -61.7
Total 522.12 591.74 100 11.7
Source: 2nd Communications –UNFCCC

Energy efficiency has been identified by the Government of Cabo Verde as a key area in which important
cost savings can be made, GHG emissions can be reduced, and also bring down the high cost of electricity.
The National Action Plan for the Environment (PANAII) updated in 2010 25 mentions energy efficiency and
renewable energy as important tools to promote sustainable development. There are a number of challenges
to promote energy efficiency in buildings and appliances in the country. One of the key barriers is the lack of
awareness among users, so they do not pull the market towards energy savings. This follows the dearth of
information on potential savings with correct measures to achieve the same. Architects and builders have
limited knowledge of bioclimatic building practices and materials in the country. The various ministries and
institutions responsible for buildings have limited experience and capacity to implement appropriate
framework. These barriers compounds through minimal public policies, institutional and regulatory
mechanisms to promote energy efficiency in buildings and appliances. The proposed project aims to address
legal and regulatory frameworks legislation and nationally coordinated policies in Cabo Verde to address the
issue for energy efficiency in both buildings and appliances. Energy efficiency is economically very attractive,
however it has seen a slow uptake due to a number of legal, regulatory, institutional, policy, financial, and
awareness barriers. The project implementation will address following barriers in Cabo Verdean built
environment.
Legal and Regulatory Barriers
Cabo Verde- National Energy Policy, 2008 sets out objectives to decrease the over dependence of fossil
fuel based energy sector. The policy aims for energy conservation, energy efficiency and strengthening of
legal framework within the energy sector. The government has acknowledged the importance of reducing the
dependence on imported fossil fuels. The country has recently made positive steps towards a supportive
framework for renewable energy and has implemented support mechanisms such as allowing the private
sector to operate through Independent Power Producers (IPPs), a licensing regime, a regulatory body (ARE)
and clear responsibilities within the energy sector for policy, regulation and provision of energy. It has
recently enacted the Decree-Law on the promotion and incentives for the use of renewable energy
(DLn.1/2011, of 3rd of January) 26 that supports renewable energy development and incentivizes the
development of this market in Cabo Verde. This decree-law establishes a conductive regulatory framework
that will stimulate investment by both local and international investors into medium to large-scale renewable
energy projects.
Currently, similar robust legal framework for energy efficiency buildings and appliances is limited; the
proposed project implementation will support the development of an effective legislation, regulatory
framework and implementation to strengthen the market for energy efficiency. Thus, the government of Cabo
Verde needs to develop the enabling legal and regulatory framework for energy efficiency projects in the built
environment.
Existing building code and building legislation: For buildings, there is a building code as a legal regime
for buildings (2011), there is also a technical code of buildings (2012),which contains few provisions on
energy efficiency 27 . Respective municipalities control the local building regulations including
construction permits, energy and efficiency of buildings etc.
Minimum Energy Performance Standard (MEPS): There are no MEPS for buildings and no legally
binding target. The proposed project will develop a new building code focused on energy savings and
25Cabo Verde government elaborated the Second National Environmental Action Plan (PANA II), which has a 10-year horizon (2004-2014). The Plan’s general objective is to provide the country with a strategy that promotes a rational use of natural resources and a sustainable management of economic activit ies. 26UNDP – Project Document Cape Verde: SPWA-CC Promoting market based development o/small to medium scale renewable energy systems in Cape Verde. 27ECOWAS Initiative on energy efficiency in Buildings Concept note- (Draft)

develop minimum energy performance standards. The project will support the development of new
regulations for construction permits including robust enforcement mechanism.
ECOWAS Centre for renewable energy and energy efficiency (ECREEE Program), in Praia, Cabo
Verde: Under the ECOWAS program, an initiative has been taken for energy efficiency in buildings
which aim at promoting reliable and affordable energy services, both in urban and in rural areas. The
program builds upon various national activities and adds value to the challenges related to energy
efficiency in buildings. The Governments of the ECOWAS region propose to address the challenges
and barriers for market penetration of technologies through five thematic programmes: tailored policy
frameworks and quality standards, facilitate capacity building, advocacy, awareness raising,
knowledge management and networking, implementation of renewable energy programs, and
implementation of energy efficiency programs.
Standard and labelling of appliances: For efficient household appliances, any legislation or regulatory
framework is non-existential, customs department checks the imports of specific items, and comply
with tax structure, which is usually the same for most appliances. World Trade Organizations (WTO)
regulations with requirements for inspection and testing of import items exists but have limited
implementation due to lack of availability of framework and procedures.
A new law or a regulatory decree for building sector and S&L program for imported appliances will be a
stepping-stone towards a long-term commitment towards sustainability in the built environment. Cabo Verde
has committed to the EU normative convergence process as part of the special partnership agreements and
ECOWAS programs to support the promotion of energy efficiency in buildings.
Institutional Barriers
The recently enacted decrees related to renewable energy are resulting in a robust package for legislation
and incentives (for large independent produces) for developing renewable energy projects in the country.
However, there is limited effort to coordinate and develop energy efficiency sector in conjunction with the
renewable energy sector, as such, interventions would be appropriate and cost effective. The institutional
capacity and competencies within the energy sector are limited, especially in relation to the formulation and
implementation of policies as well as in regulations.
In Cabo Verde, the Government is making efforts to develop or establish an agency or institution to deal with
energy efficiency in buildings and appliances along with new DSM programs. Currently, respective
BOX 3: EXISTING LEGISLATION AND REGULATIONS IN CABO VERDE – (RELATED TO ENERGY SECTOR)
Decree-law nº14/2006, and Decree-Law nº54/99, which establishes the bases for the electricity system in
Cabo Verde and aims to promote national economic and social development; environmental preservation;
ensuring a safe and reliable supply at a reasonable price (fair and not discriminatory); encourages the use of
renewable resources. It promotes efficiency and technological innovation in generation, transmission,
distribution and use of electricity in the country. Similarly Decree-law nº41/2006 was established to deal with
electric energy crisis, the law also identifies the authorities in charge for managing energy crises.
An Economic Regulatory Agency (ARE) was created under the Decree-Law nº 26/2003 is an independent
administrative authority that regulates energy, water and wastewater, urban collective transports. ARE’s main
goal is to promote economic efficiency and maintain the financing balance within the sectors for which it is
responsible for (energy, electricity and fuels, water and wastewater, urban collective transports and maritime
collective transports).
ECOWAS Treaty: Cabo Verde is part of the ECOWAS Treaty - The Economic Community of West African
States (ECOWAS) Treaty entered in 1975. ECOWAS Department of Energy is responsible within the
ECOWAS Commission for providing the technical expertise in energy and for design and implementation of
technical projects for the region decided by the ECOWAS President. The ECOWAS members are fifteen (15)
West African countries including Cabo Verde. ECREEE leads the initiative as the institutional structure,
under the political umbrella of ECOWAS.

municipalities are responsible as regulatory bodies to oversee the construction activity in the country. Key
institutions that will play a significant role in project implementation are:
General Directorate of Energy (DGE): The DGE will be responsible for promoting and implementing
measures for energy savings and for developing new policies and legislation. The DGE currently
assists Cabo Verde with meeting its obligations under the United Nations Framework Convention on
Climate Change (UNFCCC) and the Kyoto Protocol by promoting renewable energy policies and
reporting on the sector GHG’s emissions through the inventory system to support National
Communications preparation.
ECOWAS Regional Centre for Renewable Energy and Energy Efficiency (ECREEE) is a specialized
agency, which acts as an independent body within the legal, administrative and financial framework of
ECOWAS rules and regulations. The objective is to create framework conditions and an enabling
environment for renewable energy markets by supporting activities directed to mitigate and reduce
existing barriers.
Economic Regulatory Agency (ARE): The agency regulates energy, electricity and fuels, water and
wastewater, urban collective transports and maritime collective transports, it provides economic
efficiency and the financial balance of the regulated sectors to offer services of public interest and
benefits for the society.
Municipalities - Technical Cabinets: technical cabinets on each of the 22 municipalities of the country
are currently responsible for land use planning, zoning enforcement and building permitting process on
the land under their jurisdiction. They receive construction permit requests and their team reviews
projects and evaluate against existing building regulations. However, not all municipalities currently
have a structured technical cabinet, nor all of them have the financial resources to engage or maintain
skilled and certified technical staff.
Development of a new law and regulatory decrees on energy efficiency in buildings will define the
institutional responsibilities necessary to promote energy savings and nationally coordinated efforts for
buildings and appliances through the project implementation.
Policy Barriers
There is a need for a strong integrated energy efficiency policy or strategy by the government of Cabo Verde
to guide activities, raise awareness and motivate investments specific to energy efficiency measures.
Currently, there are only a few policies for the energy sector, which could also provide a framework for
specific building and appliances related policies.
The government is in the process of developing a new policy strategy on energy demand-side to address the
absence of a consistent legal and regulatory framework on energy efficiency for buildings and appliance.
This strategy will establish the policy guidelines for implementation, especially in regards to electric
installations certification, efficiency in all sectors of final energy consumptions, labeling of appliances and
energy production in the consumption points (electricity micro-generation and solar thermal). The strategy
proposed within this project will be developed in alignment with the main policy orientations already
identified. This project encompasses the development of two priority axis identified within the new policy
document being drafted.
Thus project implementation will support the development of policies conducive to market development, and
will gain further support from the following existing policies and programs:

Cabo Verde National Energy Policy, 200828: The Council of Ministries approved Cabo Verde National
Energy Policy in June 2008. The policy sets out the objectives for the energy sector and for the
renewable energy sub-sector. The policy aims to promote energy conservation and energy efficiency
within the energy sector, strengthen institutional capacity and regulatory framework providing a base
to develop energy efficiency frameworks.
Second National Communications of Cabo Verde to the UNFCCC: UNFCCC’s second national
communication provides information on GHG’s emissions and capacity to mitigate them, vulnerability
to climate change etc. The communications provide a framework for mitigation measures and
programs, strategic adaptation actions, transfer of clean technologies at sector level.
ECOWAS Energy Efficiency Building (EEB): Regional framework document for energy efficiency in
buildings (ECOWAS- EEB-guideline) is developed. This provides relevant basic requirements for
energy efficiency in buildings under the building permits procedure, including criteria of tropical
architecture and the link to urban planning, well arranged in one document, serving as a template for
country-specific customization during the process of developing energy efficiency building code.
ECOWAS standards and labelling initiative (S&L): The ECOWAS S&L initiative will support department
of energy efficiency policies, tools e.g. MEPS; design of an ECOWAS energy efficiency label; long
term monitoring and verification of the effects of standards, and labels. The ECOWAS initiative
requires a strong political commitment from the Government, and develops a holistic long-term
approach along with broad stakeholder participation. The UNDP –GEF project could develop
synergies with the proposed S&L initiatives.
Financial Barriers
So far, Cabo Verde Government gives little attention towards developing funding opportunities and financial
mechanism for energy efficiency in building. There is a lack of financial incentive for construction companies,
individual households or public institutions to invest in energy efficiency. Developers and builders have little
incentive to construct efficient buildings as the benefits largely accrue to the occupants, thus split incentives
lead to low uptake by the developer community. In order to incentivise to build energy efficient buildings,
developers could be granted an extra Floor-Area Ratio (FAR) or Floor Space Index (FSI)29 allowance at no
additional cost, increasing the value of their property. Revision of regulatory framework is necessary
regarding duty relaxation, incentives and tax benefits. In addition, energy efficiency financing is not too
lucrative for financial institutions due to uncertainty about returns. There is a lack of awareness among the
financial stakeholders return on investments from project financing. There is a need for innovative financing
schemes to promote energy efficiency in buildings.
For buildings, increased capital cost for adopting energy efficiency measures is a major deterrent with lack of
financial incentives for building construction. For appliances high upfront cost of efficient appliances, lack of
information on life cycle cost analysis and other financial barriers result in no demand for energy efficient
appliances. Proposed GEF project implementation will explore financial incentives to encourage state sector
organizations and intervention to raise awareness of financial institutions to invest in energy efficiency.
A state-owned company, IFH, builds social housing in the country. The largest social housing program ever
undertook in the country, “Kasa para todos, currently under implementation; it has been financed through a
foreign concessional loan. The conditions under which the credit line was negotiated and the arrangements
for the construction of the housing units (procurement restricted to donor country (Portugal) companies in
28Cape Verde: energy analysis and recommendation - Undertaken by UNIDO and ECREEE
29 The FAR is a measure of the built-up floor area relative to the size of the plot it is built on.

consortia with Cabo Verdian firms and evaluated by technical and financial proposal (price by square meter
for projects delivered as “turn-key” by the construction companies). This did not provide many incentives for
developers to propose innovative energy efficiency measures neither the financial conditions negotiated with
Portugal creditors. The affordability concerns for potential buyers (low income families) of the housing units
did not positioned well the contracting authority (IFH) to include much specifications on energy efficiency
standards in tenders or award criteria. While Solar thermal, PV-powered public lighting, sustainable
construction practices – such as structural masonry and stucco to reduce sand utilization , water saving
appliances, grey water treatment and reutilization were introduced in a small scale in some of the
developments, limited attention was given to bioclimatic architecture considerations or other energy efficient
measures.
The large dependency of the state budget on custom taxes revenue hampers the implementation of some
fiscal incentives through custom tax exemptions since decision-makers frequently perceive abatements as a
risk to the state revenue.
Awareness and Knowledge Barriers
There is a general lack of awareness among decision makers about the importance and economic benefits
of implementing energy efficiency in buildings. There is no easily accessible information on energy efficiency
like real life case studies; technology demonstrations and information, index of professional services and
suppliers, financing information, information on professional experts to guide and support e.g. building
owners or developers. There is lack of easily available sufficiently detailed statistics and energy performance
information on buildings for comparison and benchmarking. Currently, there is a lack of incentive to integrate
different building functions (planning, engineering, architecture, energy systems, use patterns and so on),
even though the greatest efficiency gains require such integration.
There are few cultural and social barriers to awareness, e.g. the prevalent practice of self-construction (with
no technical study or architectural project) that could be also illegal (not submitted to formal approval
process, whether developed on legally owned land or not, this is the case especially in rural areas or slum
areas). Potential of energy efficiency measures on housing and commercial projects is not communicated
among general public and property owners. Moreover, consumers lack reliable information on energy
performance of potential measures, technologies and appliances, cost of the different measures and
equipment, as well as their potential savings.
Additionally, property management companies and public facilities managers lack awareness on the
behaviour and management practices that increase energy waste. Building practitioners, especially
architects and engineers have in many cases been trained abroad and are not familiar with architectural
design and building construction practices and materials adapted to the climatic conditions prevailing in the
country. Vocational training and university degrees taught in country currently does not support the
introduction of energy efficiency measures since bioclimatic architecture, energy management and
sustainable construction practices are not generally part of the taught curriculum.
The project implementation will launch government supported public awareness campaigns to outline the
benefits of energy efficiency. This will require a comprehensive set of building solutions and incentives for
innovation, awareness raising measures, proper standards and rating systems, and various forms of market
suasion, such as energy pricing and tax incentives for relevant investments. These campaigns should also
target raising awareness of potential savings with more energy efficiency appliances or currently incurred
costs due to the use of inefficient appliances.
Inadequate data on building energy use
There is limited information on the advantages and benefits of implementing energy savings measures in a
cost effective manner. There is an absence of formal structured system like an energy management system
(EMS) to collect and analyze baseline data. Efforts should be make to transfer and emulate best practices on
EMS, such as the Croatian EMS model developed by UNDP that could be transferred and customized to

Cabo Verde needs. Additionally, public institutions rarely monitor regular energy consumption on their
building neither they use any specific guidelines for procurement of efficient appliances for their facilities.
DGE makes efforts in conducting sessions to train the technicians in energy auditing techniques and
awareness raising methods. Launch of sensitization campaigns- like households’ awareness on energy
efficiency or inefficient bulbs’ replacement program in partnership with professional association, non-profit
organization and schools. The DGE in collaboration with a non-profit association have conducted energy
audits in government-owned buildings at the request of the corresponding institutions. The ECOWAS-
ECREEE program organized training programs to build capacity among professionals (architects, engineers,
tradesmen, students etc.) of the sector.
The technical capacity and experience of local professional with required skills and expertise to carry out
energy efficient architectural projects is limited. There is a strong need to conduct train the trainers programs
and introduce training courses on energy efficiency in buildings at the national universities (University of
Cabo Verde, Uni Piaget) and vocational training schools to build capacity for civil engineering and electricity
installations.
BOX 4: ON-GOING INITIATIVES: (ECOWAS – CONCEPT NOTE – ENERGY EFFICIENCY IN BUILDINGS)
The DGE has been taking initiatives to increase the awareness and train technicians, decision
makers and private sector partners for greater energy efficiency knowledge. Inefficient
incandescent bulbs replacement campaign was undertaken between 2008 and 2009 with an
output of 300,000 bulbs replaced across the archipelago. DGE developed some awareness and
education materials (flyers and TV spots) and conducted door-by-door sensitization on energy
installation security, appliances efficiency and energy saving behaviors.
UNESCO and the Business School of New Technologies in Praia together launch environmental
education and awareness campaign “Poupa” using comic strips, cartoons and theater pieces
was launched with some pilot schools
Between 2012 and 2013, DGE partnered with the local association for social service and
community intervention (ASSIC) to conduct awareness campaigns on safe energy use and
efficient behaviors. Those campaigns have reached over 5,000 families.
Since 2012, DGE has conducted energy audits in some public buildings as a means to raise
public officials’ awareness on the relevance and need to invest in energy efficient measures and
renewable energies. Additionally, some technicians were trained on auditing techniques as a
first step on promoting the development of a private auditing market.
Seminars on energy efficiency in buildings have been organized by various entities to sensitize
population. Additionally, the DGE participation on FIC (International Fair on Construction and
Housing) since 2009 has provided a platform to discuss on bioclimatic issues with building
sector stakeholders.
The Jean Piaget University began to promote energy efficiency and renewable energy through
an annual conference (on the World Energy day)

1.4 Stakeholder Analysis
The following paragraphs sets out an analysis of stakeholder roles and attitudes towards increasing energy
efficiency in buildings and appliances. There are a number of key stakeholders including government
agencies, regional institutions, and private sector entities to ensure the success of the project.
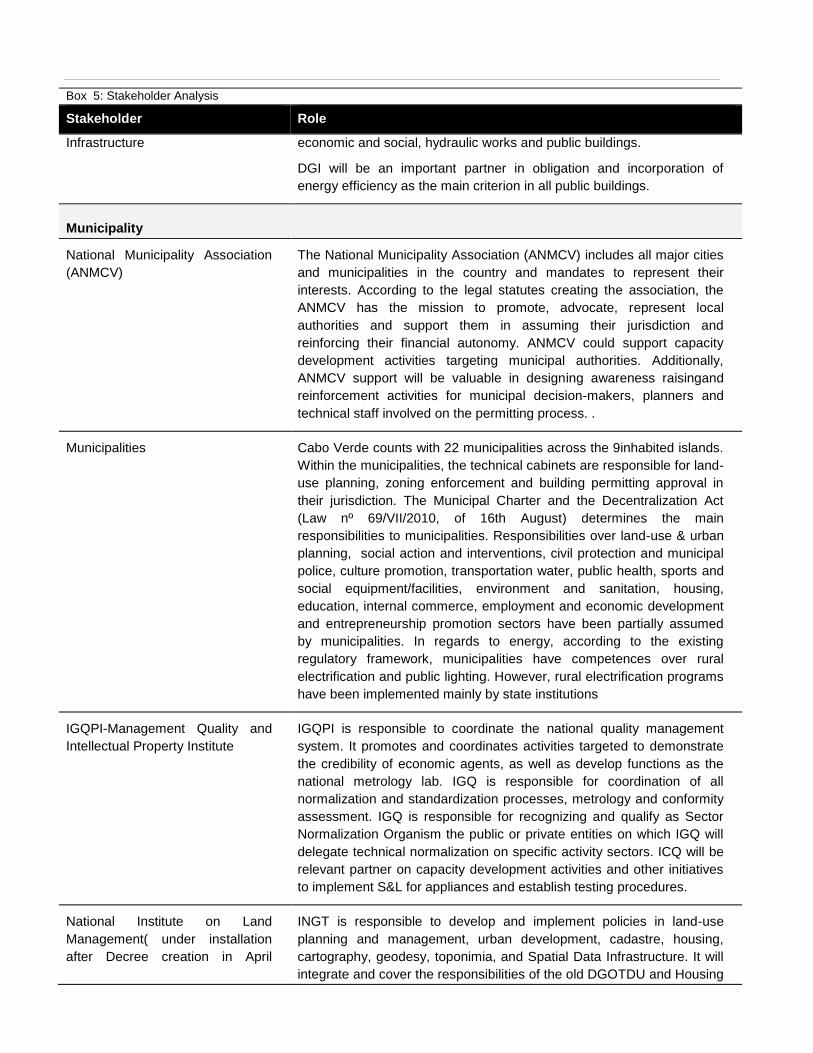
Box 5: Stakeholder Analysis
Stakeholder Role
Government
Directorate General for Energy
(DGE)-(National Implementing
Partner)
The DGE is the government agency responsible to elaborate and
implement government policies in the field of industry, energy, mines,
and geology. The DGE will act as the executing agency for this project
and takes key responsibilities for monitoring, reporting, and verification
of energy efficiency in buildings and for appliances. The Project
Management Unit (PMU) will be located in the DGE. DGE will align this
project strategy with broader Energy Demand Side Management
policies proposed in the country. Role of DGE is to ensure timely
implementation and delivery of project outputs. DGE is key body to
undertake the baseline data analysis and advance the adoption,
implementation and enforcement of the national regulatory framework
for energy efficiency in main productive sectors.
Ministry of Tourism, Industry, and
Energy (MTIE)
The MTIE is responsible for the development of government policies
related to tourism, industry, and energy. The MTIE will play a key role in
undertaking the baseline data analysis for the public buildings and for
coordinating the work with ELECTRA, the national utility. MTIE will
ensure that the project implementation logic contributes is aligned with
the policy orientations of the Energy Sector Demand Side Management
that is been drafted.
UNDP, Uni-CV (public university) and OAC (Order of Architects in Cape Verde) is planning to
organize an event focusing on bio-climatic architecture and on the presentation of existing
examples in Cabo Verde.
The Cabo Verdean Government created a Quality Management and Intellectual Property
Institute (IGQPI) to promote competitiveness, as one of the construction sector’s quality initiative
with focus on energy efficiency
OAC and the Mindelo International School of Arts, M-EIA participated on a “sustainable
architecture” European project (SURE- Africa: Sustainable Urban Renewal- energy efficient
building for African countries) and contributed for a publication on Sustainable Architecture
inCabo Verde: good practices manual. Additionally, OAC has launched their first magazine on
architecture in Cabo Verde (Arq & Urb–Cadernos OAC), with a special focus on sustainable
construction and energy efficiency and through the National Architecture Award has been
identifying and recognizing sustainable architecture examples throughout the country.

Box 5: Stakeholder Analysis
Stakeholder Role
The General Directorate for
Industry and Commerce (DGIC)
Under the DGIC liberalization of trade ECOWAS treaty region was
developed. It provides coordination and harmonization of policies
targeted to environmental protection. DGIC promotes the establishment
of joint production enterprises within the ECOWAS member states. The
ministry fosters local industry and is responsible to promote sector
policies and regulations. DGIC will be a partner to promote new import
regulations for appliances.
The General Directorate of
Tourism (DGT)
The DGT is responsible for recognizing the tourism sector and develop
strategies for the economic development of Cape Verde. The DGT has
developed a public private partnership (PPP) model strategy for
sustainable tourism in Cabo Verde (2010-2015). The DGT is
responsible for the growth of new hotels and resorts in the country.
DGT’s role is to support audits for tourism buildings and develop
baseline for existing buildings. The DGT will help in pilot project
identification and will support dissemination of lessons learned and best
practices demonstrated within this project among tourist sector
operators and investors.
Directorate General of
Environment (DGA)
DGA is responsible for coordination with other agencies with respect to
all matters pertaining to environment and for managing EIA.DGA is
responsible for the national environmental education program and the
environmental information system (SIA).It will collaborate in project
implementation, especially on the design of outreach campaigns with
environmental education programs. It will be a partner as well on
integrating energy efficiency considerations on the construction project
EIA (environmental impact assessment) and will be responsible for
integrating the project in a broader low emission and climate resilient
national strategy.
Institute of Meteorology and
Geophysics (INMG)
The INMG is a National Institute under the Ministry of the Environment
Housing and Land Use Planning (MAHOT), responsible for promoting
coordination and implementation of government policy measures and
actions in the fields of Meteorology and Geophysics. As the designated
authority and focal point of Cabo Verde for the UNFCCC, INMG will
collaborate on the implementation of all MRV measures to quantify GHG
emissions offsets and to implement energy information system related
initiatives.
DG Customs- Ministry of Finance
and Planning
Customs control the import and inspection of all goods coming into the
country and will have a key role to play in enforcing the energy
efficiency standards and labelling program for appliances. They will
collaborate on the design and implementation of appliances import
regulations and standards. In general, they will facilitate implementation
of component 2 of the project.
DGI – General Directorate of DGI is the central agency responsible for the execution of civil
construction and public works policy, including industrial infrastructure,
Box 5: Stakeholder Analysis
Stakeholder Role
Infrastructure economic and social, hydraulic works and public buildings.
DGI will be an important partner in obligation and incorporation of
energy efficiency as the main criterion in all public buildings.
Municipality
National Municipality Association
(ANMCV)
The National Municipality Association (ANMCV) includes all major cities
and municipalities in the country and mandates to represent their
interests. According to the legal statutes creating the association, the
ANMCV has the mission to promote, advocate, represent local
authorities and support them in assuming their jurisdiction and
reinforcing their financial autonomy. ANMCV could support capacity
development activities targeting municipal authorities. Additionally,
ANMCV support will be valuable in designing awareness raisingand
reinforcement activities for municipal decision-makers, planners and
technical staff involved on the permitting process. .
Municipalities Cabo Verde counts with 22 municipalities across the 9inhabited islands.
Within the municipalities, the technical cabinets are responsible for land-
use planning, zoning enforcement and building permitting approval in
their jurisdiction. The Municipal Charter and the Decentralization Act
(Law nº 69/VII/2010, of 16th August) determines the main
responsibilities to municipalities. Responsibilities over land-use & urban
planning, social action and interventions, civil protection and municipal
police, culture promotion, transportation water, public health, sports and
social equipment/facilities, environment and sanitation, housing,
education, internal commerce, employment and economic development
and entrepreneurship promotion sectors have been partially assumed
by municipalities. In regards to energy, according to the existing
regulatory framework, municipalities have competences over rural
electrification and public lighting. However, rural electrification programs
have been implemented mainly by state institutions
IGQPI-Management Quality and
Intellectual Property Institute
IGQPI is responsible to coordinate the national quality management
system. It promotes and coordinates activities targeted to demonstrate
the credibility of economic agents, as well as develop functions as the
national metrology lab. IGQ is responsible for coordination of all
normalization and standardization processes, metrology and conformity
assessment. IGQ is responsible for recognizing and qualify as Sector
Normalization Organism the public or private entities on which IGQ will
delegate technical normalization on specific activity sectors. ICQ will be
relevant partner on capacity development activities and other initiatives
to implement S&L for appliances and establish testing procedures.
National Institute on Land
Management( under installation
after Decree creation in April
INGT is responsible to develop and implement policies in land-use
planning and management, urban development, cadastre, housing,
cartography, geodesy, toponimia, and Spatial Data Infrastructure. It will
integrate and cover the responsibilities of the old DGOTDU and Housing

Box 5: Stakeholder Analysis
Stakeholder Role
2014) , The INGT policies cabinet.
Cabinet on support of housing
policies & Directorate General of
Land-use planning and
urbanization (DGOTDU) –
Ministry of Environment, Housing
and Land-use planning
DGOTDU is the government unit responsible for land-use planning
policies. The Directorate assumes the responsibilities over study,
promotion, coordination and execution on land management policies
and urbanism. Promotion of land-use guidelines, support, review and
clearance of island-wide and municipal level land-use plans are under
its responsibility.
In collaboration with municipalities, and IFH, the cabinet on housing
policies support and is responsible for the promotion of requalification,
rehabilitation of housing units and promotion of urban renewal initiatives.
DGOTDU and Housing policies cabinet will support detail identification
and selection of demonstration projects on social housing programs.
They are also expected to support initiatives of sustainable urban
planning and promotion of energy efficiency considerations on zoning
and neighbourhood detail planning
Electricity Sector Bodies
ELECTRA
Electra is a limited company that produces and distributes electricity
across the territory of Cabo Verde, with a current rate of 75%
coverage, as well as the production and distribution of drinking water in
S. Vicente, Sal and in Praia on Santiago with a coverage rate of 50%,
and the collection, treatment and reuse of wastewater in
Praia.ELECTRA, as the major utility collaborates on the design of
inefficient appliances replacement and its financial mechanisms.
Additionally, it will support awareness raising activities.
AEB - Aguas e Energia de Boavista AEB, under a subcontractor agreement with ELECTRA is responsible
as a utility running water and electricity production and distribution
services in Boavista island. It will collaborate on the design of
inefficient appliances replacement and its financial mechanisms. In
addition, it will also support awareness raising activities.
APP/APN Aguas de Ponta Preta/ Aguas de Porto-Novo are the partner
companies responsible for water production in Sal and Santo Antão
Island. Additionally, they produce and sell electricity to some resorts in
Sal islands and they have partnered with the Porto-Novo Municipality (
in Santo Antão island) for a RE-based small grid in a remote rural
community (Tarrafal de Monte Trigo)
Economic Regulatory Agency
(ARE)
An Economic Regulatory Agency (ARE) was created under the
Decree-Law nº 26/2003, is an independent administrative authority that
regulates the water, energy, transport sectors. Multi-sectoral agency
sets regulations for energy and water sector, transportation. ARE gives
technical support and advisory to the government and its collaboration
will be essential to device incentives schemas and awareness raising

Box 5: Stakeholder Analysis
Stakeholder Role
campaigns.
Other Organizations
Regional Centre for Renewable
Energy and EE (ECREEE)
Provide relevant guidance on ECOWAS rules and regulation to ensure
that regulatory framework and policies are in line with regional and
international guidelines.
Synergies with ECREEE will be promoted for demonstration projects
selection and implementation, awareness raising. Collaboration with
ECREEE is essential to ensure S&L and testing procedures proposed
are in line with ECOWAS-region orientation and regulations.
Additionally, synergies will be developed with the regional initiative for
Energy efficiency in buildings, as well as in regards to the solar-thermal
regional project which implementation is planned to start in 2015
OAC- Architects Order
A professional association, the Chamber of Architects represents the
sector practitioner’s interest and is responsible for licensing the
professional to work in the country. They will be a key partner on all
technical discussion to propose a new energy efficient building code and
building permitting process review, which are appropriate to the country
climate and reality. They are expected to partner as well on all capacity
development initiatives, dissemination of best practices and sector
practitioners awareness raising.
OEC (Engineers Order) A professional association, the Chamber of Engineers represents the
sector practitioner’s interest. Thermal, industrial and civil engineers are
member of this order. They should participate on the process to prepare
new building codes and the definition of compliance mechanism. They
will be associated with all the activities related to curriculum
development and capacity building.
Universities and vocational training
schools/IEFP
The different public (UniCv) and private universities across the country
have established (1) Architecture and several Engineering schools to
locally train professional on this areas. National Employment and
vocational training Institute (IEFP) is responsible for management of a
national system of vocational training schools. Some professional
families, linked to electricity and construction sector have been
developed through professional training programs. Universities and
training centres are expected to participate on curriculum revision
initiatives and to collaborate for delivering new training and raising
awareness among practitioners.
Luxembourg Development Agency
-(LUXDEV)
LUXDEV oversees the bilateral development programs in the country
and ensures the overall operational coordination. Currently, the agency
is supporting the implementation of the project -“Support to the national
employment and vocational training programme”; moreover, the project
supported capacity building to enhance the needed skills for the day-to-

Box 5: Stakeholder Analysis
Stakeholder Role
day management of the institutions and the drafting of new curricula for
new courses.
The European Union (EU) - The European Union has created SE4All Technical Assistance Facility
to support Cabo Verde and other developing countries, which are
committed to reach the SE4All objectives through appropriate sector
reforms and scaling up of investment in the energy sector. Examples of
areas of support include national energy sector policies and reforms,
capacity building particularly in the policy and regulatory areas, technical
support in preparation of investment projects, mobilization of funds and
facilitation of partnerships, industrial and technology cooperation, and
project demonstrations.
IFH (Housing Development
Institute)
IFH is a public real estate and housing corporation established in 1999.
A social and public housing real estate developer, IFH address the
Cabo Verde housing deficit as well as upgrading existing housing stock.
IFH is responsible for affordable housing development and social
housing management, public land urbanization and servicing projects. It
estimates that housing deficit in the country is at around 42,000
dwellings in 2010. In 2009, the government launched a new housing
policy: a national social housing system, which was established as the
new legal framework to attract investments in public housing by
minimizing housing and infrastructure cost and promote housing
developments and public housing programs management efficiency.
IFH is responsible for the implementation of the public housing program
“Kasa Para todos. This program contemplated the delivery of the
construction of three classes of accommodation: economic, social and
controlled costs, in addition to the rehabilitation of social housing in
several municipalities in the country to citizens as housing units to buy,
to rent or resoluble rent and sale contracts. With about 1,460 buildings
constructed (economic, cost controlled and social housing), 1,450
rehabilitated housing and management of state assets of about 390
properties, the IFH has assumed responsibility with its function of
promoting and structuring of urban space in the country
Chamber of Commerce Industries
and Services Sotavento (CCISS)
and the Chamber Commerce,
Industry and Services Barlovento (
CCIsB)
The Chambers of Commerce Industries and Services (CCISS) are
organizations of private law public utility. CCISS was established in
1995, to influence the public policies of promotion and corporate
citizenship through corporate social responsibility. Chambers of
commerce have been delegated the authority to manage commerce,
import and export licensing system. The Chamber of commerce will
support awareness rising among importers and retailers to achieve
market transformation.
Civil Engineering Laboratory Cabo
Verde (LEC) - Ministry of
Infrastructure and Maritime
The LEC aims to undertake, promote and coordinate scientific research,
technological development, and activities necessary for the progress
and good practice of civil engineering. The relevant duties of the LEC
include conducting studies in the field of standards and technical

Box 5: Stakeholder Analysis
Stakeholder Role
Economy
regulations, testing thermal properties of construction materials and
providing quality certification of materials, components and other
construction products
Private Sector Partner/(s)
Various Private sector partners will play a key role in the co-financing of
project activities and replicating best practices This includes commercial
and industrial associations, industrial/commercial enterprises/business
groups, construction companies, oil companies/gas
companies/production and distribution companies of conventional and
renewable energy. Private sector partners may include participation and
contribution in increasing energy efficiency in the building sector. They
will contribute to technology transfer related to low emission climate
resilient development strategy; participate in the evaluation of GHG
emissions in industry and GHG mitigation.
Civil society, consumer
associations (ADECO) ,
association for social service and
community intervention (ASSIC);
and community organizations
Some local associations, such as the above mentioned ASSIC has been
involved in community awareness campaigns on energy use safety and
energy efficiency. Other environmental NGOs, such as ADAD have
advocated for other environmental causes, such as plastic bags
banning. Consumer association ADECO, and all relevant associations
and NGOs would be partners to develop and implement awareness
raising campaigns. ADECO will be an important partner in developing a
national S&L system for appliances.
Media (Community radios,
National TV and private radios and
press)
Media sector is large and diverse in Cabo Verde. Public TVs,
community and state radios, private newspapers and radios have most
of them developed some type of scientific and educational programs or
special editions, journalist to participate in trainings and awareness
raising campaign. Their insights on public opinion in the country will be
relevant to target well the messages on the communications and
educational materials and to ensure dissemination of best practices and
results achieved through this project
1.5 Baseline analysis Domestic Appliances: Baseline
International experience suggests that 30% of savings in energy consumption in the domestic sector with
market transformation of energy efficient electrical appliances. S&L programme could pave the way to
Minimum Energy Performance Standards (MEPS) for domestic appliances sector and contribute to a
significant reduction in the electricity consumption and corresponding GHG emissions.
Cabo Verde’s energy demand is growing at a faster rate (114%) than its production capacity (94%) in the last
decade. This will continue with increasing population and expanding economy. This will stimulate demand
growth for electrical domestic appliances as well. The application of S&L in Cabo Verde will support in
reduction of energy demand and deal with high growth rate of energy consumption. Figure 5, below
elaborates the typical energy use in residential sector through appliances. Energy efficiency programmes

such as S&L for the domestic sector have a long and proven history, with the generation of substantial
energy savings in many countries.
Figure 5: Typical Residential Energy Use (kWh/yr)
Data collected by the General Directorate of Energy local team form the basis for developing the baseline
and represents the current end use of appliances in a typical middle-income household. The data obtained
from the Directorate General Customs (DGC) shows the gross import values, weights, and the country of
origin of appliances imported. With handful of local manufactures, most appliances in the country are
imported. Figure below represents imports from the country of origin. Most of products are imported from
European countries with major share from Portugal, followed by the Netherlands and Spain.
Figure 6: Appliances Imports by Country of Origin (2008-12)

Baseline Energy use
From the list of imported products, five appliances are selected for the initial standards and labelling
program: air conditioners, refrigerators and freezers, electric water heaters, televisions and bulbs. The
selection was based on the annual energy saving potential of the equipment, based on their hours of usage
per year, annual energy consumption, and projected growth in future demand as the basis.
Table 4: Energy Consumption per appliance estimate
The baseline situation for each of the selected product is summarized in the following sections, including
information about the sales volume and usage of appliances. Some statistical information used for the
projection is based on a survey conducted by national team and information provided by the DG Customs.
Currently, there are no energy performance standards for appliances and no law to mandate import of
energy efficiency appliances. The proposed project will focus on introducing a national framework and new
legislation for standards and labels for appliances. Specifically, the project will focus on introducing a system
for labelling of appliances sold in Cabo Verde. This will be combined with adopting regulations for MEPS for
the selected appliances as well as developing national certification procedures for them.
a. Air Conditioners
Data collected for air conditioners shows a gradual growth trend in the import volume over the last decade30.
The volume of import almost doubled from 3,734 units to 6081 units between 2004 -13, with an average air
conditioner unitary energy consumption of 3,228 kWh/yr (table 4). Baseline projections assume same unitary
energy consumption without this project implementation for next decade with same annual growth of 6.3%
per annum. In 2010, as per the national institutes of statistics, nearly 2.4% of households are in the
ownership of air conditioners. Figure 7, depicts the import volume of air conditioners from 2004-13, its
corresponding energy consumption and CO2 emissions with respect to the import in that year. OLG, Norm,
Fairline, Orima and WestPoint are few of the popular brands imported in the country.
30Assumed that the total sales volume is equal to the total import volume of the respective year
Product Average Energy Use
(Watts/hr)
Daily Usage
(Hours/Day)
Annual Usage
(Days/yr)
Usage by single unit per
annum (kWh/yr)
Air Conditioners 3,000 4 269 3,228
Refrigerators
&Freezers
200 24 365 1,752
Electric Water
Heaters
1,500 1 365 548
Televisions 120 6 365 263
Light Bulbs 60 4 365 88
Source: Survey Data: Manufacturers and Importers

Figure 7: Air Conditioner (Baseline): Import Volume, Energy Use and tCO2 Emissions
b. Refrigerators and Freezers
As per the National Institute of Statistics (INE), 2010 nearly 59% of households own refrigerators and 10.4%
own freezers. Import volume of refrigerators is increasing with an annual growth rate of nearly 4%31. The
baseline projection assumes no improvement in efficiency of the product in the absence of this project.
Figure 8, elaborates the import volume with corresponding energy use and CO2 emissions in that year.
Tropicool and OLG are the highest selling brands in the country followed by Samsung, West point, Radiso,
whirlpool, and others.
Figure 8: Refrigerators and Freezers (Baseline) - Import Volume, Energy Use, and tCO2 Emissions
31 Analysis from DG Customs data of import volume of refrigerators (2002-2012), Annexure C

c. Electric Water Heaters
Import volume of electric water heaters increased at the rate of 5.5% per annum over the last ten years32.
The import units have increase from 6,216 to 9,640 units in the country from 2004 to 2013. The unitary
energy consumption of water heaters is 547.5 kWh/yr (table 4)33. Figure five, shows the import units with
energy use and corresponding CO2 emissions.
Figure 9: Electric Water Heaters (Baseline) - Import Volume, Energy Use, and tCO2emissions
d. Televisions
Nearly 74% of the country’s households own televisions34. Most of the televisions are imported, however due
to increase in domestic manufacturing of the televisions; there is a gradual decline in the import volume over
the years. The average annual energy consumption of a typical TV is about 262 kWh/yr (table 4) 35 .
Samsung, OLG are the highest selling televisions brands in the country followed by Crown, Sharp, and
Grundig36.
32Analysis from DG Customs data of import volume of refrigerators (2002-2012), Annexure C 33 Analysis from DG Customs data of import volume of refrigerators (2002-2012), Annexure C 34 National Institute of statistics (2010) 35 Analysis from DG Customs data of import volume of refrigerators (2002-2012), Annexure C 36 Data collected from survey

Figure 10: Televisions (Baseline): Import Volume, Energy Use and tCO2 emissions
e. Light Bulbs
Light bulbs are imported in huge quantity in the country with an annual growth rate of 1.1% per annum37.
Total units imported into the country increased from 164,500 units to 384,613 units between 2004 and 2013.
Average energy consumption for each light bulb is approximately to be 87 kWh/yr(table 4).
Figure 11: Bulbs (Baseline): Import Volume, Energy Use and tCO2 emissions
The selected appliances (refrigerators & freezers, air-conditioners, televisions, bulbs, electric water heaters)
have contributed significantly to the energy consumption of the country in the past decade. The growth in the
import volume of these appliances clearly shows the increasing demand of these appliances. Figure 12
elaborates the cumulative energy consumption 38 of the appliances by each category from 2004-13.
Refrigerators and freezer, and bulbs have significantly contributed to the energy consumption and GHG
emissions as compared to other appliances. The combination of growing population, and a stable economy,
and improving affordability will increase the demand for appliances such as air conditioners, water heaters
etc. Average energy consumption of a single unit of a typical appliances imported in the country is shown in
Table 439.
37 Analysis from DG Customs data of import volume of refrigerators (2002-2012), Annexure C 38For cumulative energy consumption it is assumed that 20% of the appliances are replaced from the previous year stock. 39 Data provided by Directorate General of Customs and standards from CLASP

Figure 12: Cumulative Energy Consumption by Appliances (2004-13)
Table 5: Cumulative Energy Consumptions and by Appliance Category (2004-13)
Based on the import volume of each appliance in a given year, total energy consumption and CO2 emissions
were calculated (emission factor: 0.00049 tCO2/ kWh). Cumulative energy consumption was calculated while
assuming that 20% of the appliances from the previous year are replaced or not contributing to the energy
consumption. Table 5 and Figure 12, depicts annual cumulative energy consumption from all the appliances
put together. Figure 13 shows the cumulative energy consumption growth of all the appliances and
elaborates an exponential growth both in energy consumption and in CO2emissions.
Table 6: Total Cumulative Energy Consumption in each year (2004-13)
Appliances Energy Consumption (MWh) -
Cumulative
CO2 Emissions (tons) - Cumulative
Air Conditioners 566,763 277,886
Refrigerators and Freezers 1,347,133 660,504
Electric Water Heaters 204,231 100,135
Televisions 116,068 56,908
Light Bulbs 9,676,610 474,423
Source: Analysis from DG Customs data-2013

Figure 13: Annual Energy Consumption (MWh) – Cumulative
Appliances: Business as Usual (BAU) Scenario vs. Alternative Scenario
Most of the appliances stock in the country is inefficient. The selected appliances have significant energy
efficiency potential that can be harnessed without compromising the quality and performance of the service
they provide. Through the UNDP–GEF project intervention, the government will be able to support the
market transformation by introducing mandatory energy efficiency standards. There are several legal,
institutional, technical, policy, and financial barriers to mainstreaming energy efficiency appliances in the
country. The project implementation will result in development of MEPS as well as a comparative labelling
program. There are no laboratories for testing appliances and there is no mechanism for regulating,
monitoring, labeling, or certification of appliances imported or sold in the country. In the BAU scenario it is
clear that GHG emission and energy consumption of appliances will continue to rise (refer figure 14).
Year Energy Consumption (MWh) CO2 Emissions (tons)
2004 61,843 30,322.11
2005 130,543 64,005.69
2006 199,913 98,018.17
2007 227,113 111,354.43
2008 316,224 155,045.82
2009 361,629 177,308.08
2010 455,347 223,258.58
2011 477,527 234,133.26
2012 483,856 237,236.39
2013 487,811 239,175.54
Source: Analysis based on DG Customs data -2013

Figure 14: Business as Usual – Total Energy Consumption by Appliances
Alternative Scenario
Under the alternative scenario, MEPS will be proposed along with comparative labels as a result of GEF
project intervention and implementation and this is expected to lead to energy savings of nearly 1.6 million
MWh of energy by 2025(table 7). In addition, because of increased marketing and awareness activities
energy efficiency becomes a priority consideration in consumer’s decisions in the purchase of new
equipment. With GEF project implementation, energy efficient refrigerators, air conditioners, and water
heaters, televisions and lighting products will meet the new quality, environmental and energy performance
standards and are diffused widely on the national market. Projections in alternative scenario from 2015-25
resulting in substantial energy savings (table 7).
Table 7: Scenario 1: MEPS Labels – Energy Savings (MWh), GHG Abatement Potential (ktCO2e)
Source: DG Custom’s data and MEPS projections
From Table 7, it is observed that total cumulative savings from implementation of MEPS for appliances will
result in savings of 1.65 million MWh of energy with corresponding GHG abatement potential of 800
ktCO2equivalent (2015-25). Following figures show cumulative energy consumption in BAU and MEPS
scenarios corresponding to the population (%) having access to the each selected appliance. The BAU
projections show the cumulative energy consumption (MWh) with respect to population access or market
penetration of each appliance. The MEPS projection shows the reduction in cumulative energy consumption
Product Base Case
(Watts)
Alternative
Scenario(watts) -
MEPS
Cumulative
stock until
2025
Cumulative
energy
savings
(MWh)
GHG abatement
potential (KtCO2e)
Air Conditioners 2100-3000 1500- 2550 656,365 370,910 200
Refrigerators &Freezers 140-200 90-170 2,208,543 773,824 300
Electric Water Heaters 1050-1500 800-1425 881,364 52,273 100
Televisions 90-120 50-90 539,889 41,380 0.0
Bulbs 40-60 15-40 12,616,297 414,419 200
Total Savings 1,652,806 800 (approx.)

with similar market access as that of BAU scenario (PPAT tool)40. This is the result of minimum energy
performance standards, which is introduced because of the GEF project implementation.
Figure 15: Air Conditioners – BAUv/s MEPS scenario
Source: Analysis based on Product Policy Analysis Tool (PPAT)
Figure 16: Refrigerators and Freezers: BAU v/s MEPS Scenario
40PPAT: Policy Product analysis tool developed to assist policy makers to make informed decisions on energy saving potentials of various products
Source: Analysis based on Product Policy Analysis Tool (PPAT)

Source: Analysis based on Product Policy Analysis Tool (PPAT)
Figure 17: Electric Water Heaters: BAU v/s MEPS Scenario
Source: Analysis based on Product Policy Analysis Tool (PPAT)
Figure 18: Televisions: BAUv/sMEPS Scenario
Source: Analysis based on Product Policy Analysis Tool (PPAT)
Figure 19: Bulbs - BAU v/s MEPS scenario
The comparative labelling program will also produce significant energy savings from the UNDP GEF project
implementation. Following table elaborates cumulative energy savings generated from scenario two- the

comparative labels program. From alternative scenario 2, targeted comparative labelling program will further
result in increased saving of more than 25% than the MEPS label. Figure 20, elaborates on GHG abatement
potential (%) of each selected appliances.
Table 8: Alternative Scenario 2: Labelling Programme
Figure 20: GHG Abatement Potential tCO2e by Appliance Category
Buildings Sector: Baseline
High-energy consumption of buildings, based on the imported model for design and construction in Cabo
Verde has lead to decades of regular building practices contributing more to GHG emissions. Under a BAU
scenario, new buildings will have more or less similar energy consumption to the current building energy
performance. Due to absence of strict policy measures in the country, there will be fewer energy efficient
buildings and the percentage of such buildings in the country’s building stock in the next 10-15 years is likely
to remain constant. In the last two years, annual electricity sales have increased by 4.9 %41. Table 9 shows
the electricity annual sales distribution by sectors of activities during the last few years.
Table 9: Annual sales by sectors of activities
41ELECTRA-2012
Product
Alternative Scenario
(Comparative labels – saving %)
Cumulative energy
savings (MWh)
GHG abatement
potential (ktCO2e)
Air Conditioners 15-50 % 539,655 200
Refrigerators &Freezers 15-65% 856,778 300
Electric Water Heaters 5-45% 74,678 100
Televisions 25-60% 56,736 000
Light Bulbs 33-75% 550,682 200
Total Savings 2,078,529 800(approx.)
Source: Analysis based on Product Policy Analysis Tool (PPAT)/primary data from DG Customs

From ELECTRA sales data in Table 9, the domestic sector is the major consumer of electricity with nearly
50% of demand coming from the household consumption. Public sector includes energy sales from central
government and municipalities which together accounts to 10.5 % of total sales. Under the baseline situation,
electricity consumption and corresponding emissions will continue to grow under the absence of mitigation
measures. To compound the baseline energy use from the building stock, electricity sales from public sector,
domestic sector and institutions and organizations are combined.
Figure 21: Electricity Sales by sector (2012)
Consumers 2005 2006 2007 2008 2009 2010 2011 2012
Public Buildings 16,548 16,677 18245 18548 20,508 22,929 22,893 23,321
Domestic sector 80,977 82,331 81,297 85,234 90,754 95,857 98,761 96,945
Institutions/Social
Organizations
2,779 2,896 3,075 3,255 3,793 4,434 5,110 4,643
Total Buildings 100,304 101,905 102,619 107,037 115,056 122,584 126,765 124,911
Others 61,371 62,868 65,852 69,315 70,052 80,871 79,778 79,770
Total 161,675 164,774 168,471 176,352 185,109 203,456 206,544 204,682
Source: ELECTRA sales data (2012)

Figure 22: Energy Consumption (MWh) - Buildings Sector (2005-12)
Buildings: BAU v/s Alternative Scenario
UNDP–GEF’s project intervention will focus on developing the policy, institutional, and legislative framework
needed to support energy efficiency in Cabo Verde through introduction of a new modern building code for
the country. The proposed code for all building types will be developed; however, the project implementation
will target public buildings through several pilot demonstration projects. As per BAU and alternative scenario
projections, the Energy Efficiency Building Code (EEBC) code as the project outcome will lead to cumulative
energy saving of 38,462 MWh corresponding to GHG abatement potential of 18,864 tCO2
emissions(cumulative till 2025)42.
Figure 23: Business as Usual (energy consumption -MWh)
Figure 24: BAUv/s Alternative Scenario for EEBC Implementation
Table 10: Cumulative Energy Savings and GHG Savings
42Based on the assumption that EEBC code is developed and implemented from 2016 onwards, thus assuming nearly 30% of new buildings, including demonstration projects built thereafter will comply with new energy performance standards. Cumulative energy savings are calculated until 2030.

Table 11: Summary of energy savings and CO2emissions savings
Year Energy savings (MWh) Cumulative Energy Savings (MWh) Cumulative tCO2 emission
savings
2015 0 0 0
2016 211 211 103
2017 434 645 316
2018 1,449 2,095 1,026
2019 2,508 4,602 2,255
2020 3,389 7,992 3,916
2021 4,312 12,304 6,029
2022 5,278 17,582 8,615
2023 6,289 23,871 11,697
2024 6,951 30,822 15,103
2025 7,640 38,462 18,846
TOTAL 38,462 MWh 18.8kt CO2e
Source: Based on ELECTRA sales data and assumptions: Annexure c
Sector Total Energy savings (cumulative 2015-
2025)- MWh
Total Cumulative emission reduction
(ktCO2 e)
Appliances (S&L program) 2,078,529 800
Buildings (EEBC Code) 38,462 18.8
TOTAL (Approx.) 2,116,991 818.8
Source: from table 8 and 10

GEF CO2 Calculation Methodology
The GEF CO2 emissions calculation methodology to estimate the direct and indirect emission reductions
resulting from the project implementation was applied (refer annexure C).
Direct Emissions Reduction
Direct emissions reductions due to project investment from demonstration projects during project
implementation phase are expected. The emissions for appliance and buildings are separately calculated. It
is expected that after year one, energy efficiency building code(EEBC) will be developed and implemented,
similarly S&L programme for appliances will be launched and contributing in direct emissions reductions.
Table 12: Direct Emissions Reductions - Buildings and Appliances
Indirect Emissions Reductions
Indirect emissions because of replication and dissemination resulting from project implementation until 2028
are calculated.
Table 13: Indirect Emissions Reductions: Buildings And Appliances
Water Usage: Baseline
43Based on the assumption that the new building code with minimum energy performance standard will be developed and implemented 2016 onwards. Thus nearly it is assumed that nearly 30% of new buildings including the demonstration projects will contribute to direct emissions reductions 44 [RF] is a replication factor, i.e., how often will the project’s investments be repeated during the 10 years after project implementation,
determined by expert and reflects the degree to which the project emphasizes activities which encourage replication
Buildings Direct Emissions Reductions
Annual electricity saved after all investments 1150 MWh43
Average useful investment life 30 yrs.
Direct emission reductions 16.91ktCO2e
Appliances
Annual electricity saved after all investments 111,184 MWh
Average useful investment life 5 yrs.
Direct emission reductions 272.4 ktCO2e
Total Direct Emissions Reductions 289.3ktCO2 e (approx.)
Source: Based on STAP methodology for emission calculations
Buildings Indirect Emissions Reductions
Bottom up approach
Replication Factor (RF)44 3
Indirect emission reductions 50.72 ktCO2e
Top Down Approach
Causality Factor 100%
Indirect emission reductions 31.33ktCO2e
Appliances
Bottom up approach
Replication Factor (RF) 3
Indirect emission reductions 817.20 ktCO2e
Top Down Approach
Causality Factor 80
Indirect emission reductions 655.70 ktCO2e
Total Indirect Emissions (bottom-up) 867.99 ktCO2e (approx.)
Total Indirect Emissions (top-down) 687.00 ktCO2e (approx.)
Source: Based on STAP methodology for emission calculations

Water is a scarce resource in CaboVerde, with annual dependency on monsoon months of August and
September and presence of no permanent or large rivers in the country. It is difficult to use surface water
resources, which is estimated at 181 million m3, due to their torrential flow, high run-off rates due to steep
relief and lack of adequate storage facilities45. Average coverage for water supply is nearly 89%, however
significant disparities exist between different islands and population spread over nine islands and many of
them are sparsely populated. Marked water scarcity (half the population lacks access to a public water
supply) makes Cabo Verde rely on desalination to meet 85 percent of its human water needs, and made this
energy-intensive process even more prohibitive by the high costs of energy. Water usage is closely
connected to energy use. Table 14, shows the constant increase in water demand and increase in customers
(ELECTRA is responsible for 90% of water supply in the country)
Table 14: Water usage data
Figure 25: Water Production and Sales (2008-12)
As per the baseline water usage, Cabo Verde may expect water shortages in the future, due to increase
energy prices and natural disasters as droughts. Water tariffs at $4.43 per cubic meter are the highest in
Africa; the high prices reflect the scarcity of water resources, which has forced the country to rely on
desalination. Water availability is estimated as 537m3per person per year, which is very low46. Moreover, the
cost of the energy-intensive desalination process is particularly high due to its dependence on power
generation. The power generation high costs are attributed to reliance on small-scale diesel generation and
expensive imported oil. Energy efficiency has great potential therefore to alleviate problems due to water
scarcity.
Table 15: Water Desalination and Water Pumping (Energy Use (MWh), GHG Emissions)
45Cabo Verde Strategy paper (2014-19) 46Cape Verde’s Infrastructure, A continual Perspective – The World Bank, African Region, 2011.
ELECTRA DATA 2008 2,009 2,010 2011 2,012
No. Water Customers 32,172 35,069 37,345 40,160 44,772
Water Production (thousand m3) 4,237 4,539 4,675 4,423 4,384
Water sales (thousand m3) 2,866 2,912 2,970 3,005 2,941
Source: ELECTRA water sales data (2008-12)

Water Usage: Alternative Scenario
The new building code developed because of the GEF project implementation, should include standards for
water efficiency with water conservation as a key priority. It is essential that the building code developed and
implemented in component 1 with new regulations and revised by-laws will take into account the need to
promote responsible water usage and conservation. This could be done by means of water efficient flow
fixtures, flush fixtures – urinals, water closet, measures for rain water harvesting system, use of drip irrigation
for landscape level and other methods to reuse and recycle water. The new law on buildings should include
requirements for reservoir on the roof for water storage and put emphasis on rainwater harvesting systems.
Cabo Verde built environment requires effective regulations and monitoring of water usage to promote the
development of a climate resilient economy to withstand the future negative impacts from climate change.
Energy efficient, water efficient buildings will therefore have significant potential to help Cabo Verde adapt to
the impacts of climate change.
Water conservation will reduce the demand for water by nearly 20% due to project implementation. This shall
result in reducing the burden of utility companies to use energy intensive methods for water desalination.
Thus, water use to energy use is indirectly connected. The energy savings and corresponding GHG
emissions from reduced water desalination demand as compared to business as usual scenario are
calculated in table 16.
Table 16 : GHG Emissions Savings from Water Efficiency
47The new law on buildings with energy efficiency and water efficiency standards should be developed and implemented from
2016 onwards. Thus assuming that nearly 30% of new buildings built from 2016 will comply with new standards for water and energy, including the pilot demonstration projects. Thereafter, the demand for water desalination is expected to reduce from the building sector, thus resulting in energy and GHG emissions savings. 48 The bottom-up approach for calculating indirect GHG reductions generally provides the lower extent in the range of possible indirect
impacts from a project. It starts with the direct effects of the investments under a project, and multiples that number by a factor
representing the number of times the project is likely to be replicated in other places/markets. 49 The underlying assumption of the top-down approach is that removing barriers and/or investing in the promotion of and capacity
building for energy efficiency initiatives may allow successful projects to leverage the whole market for the relevant initiative. If all barriers
to market implementation are removed, market forces should exploit the full economic potential offered by the respective market.
ELECTRA DATA 2012 2011 2010 2009 2008
Electricity Consumption
(MWh) 18,833.32 16,058.34 19,158.30 20,253.50 22,947.20
ktCO2 Emissions 9.22 7.86 9.38 9.92 11.24
Source: Electra, energy sales data (2008-12)
Water Efficiency Direct Emissions Reductions
Annual electricity saved due to reduced water demand 3484 MWh47
Average useful investment life 5 yrs.
Direct emission reductions 8.5 ktCO2e
Indirect Emissions Reductions
Bottom up approach48
Replication Factor 3
Indirect emission reductions 25.61 ktCO2e
Top Down Approach49
Causality Factor 80
Indirect emission reductions 16.8 ktCO2e
Source: Based on STAP methodology for emission calculations

SECTION II: PROJECT INTERVENTION STRATEGY 2.1 Project Rationale and Policy Conformity
Under the Barbados declaration (2012), the Government of CaboVerde has committed itself towards a target
of reducing in greenhouse gases by 35% by 2020, a 30% improvement in energy efficiency and become a
zero emitter country by 203050. In 2013, the Government developed a national action plan to assist with
participation in the UN Secretary General’s Sustainable Energy 4 All Initiative (SE4All). Under the action
plan, energy efficiency as an important priority area for GHG emission reduction is identified51.Similarly, 2nd
National Communication to UNFCCC mentions energy efficiency and technological innovation as key to
reduce dependence on imported energy and use of fossil fuel, in line with one of the strategies mentioned in
National Energy Policy of Cabo Verde.
The proposed GEF project implementation will support the alternative scenario from the baseline situation to
reduce GHG emissions in the Cabo Verdean building sector by implementing mitigation measures from
building and appliances. The UNDP GEF project implementation will pave the way for improved energy
efficiency utilization in buildings and strengthen wide spread use of efficient appliances. The proposed
project will achieve the objectives set out in the following sections.
2.2 Project Goal, Objective, Outcomes and Outputs/Activities
Project Goal and Objectives
The goal of the project is “removing barriers to energy efficiency in Cabo Verdean built environment and for
appliances “. The primary objective is to transform the market for energy efficiency in the country by
introducing a new law on building codes and for domestic appliances by introducing a labelling programme,
new import regulations, testing procedures, and certification leading to significant improvements in energy
efficiency in the country. The proposed project is grouped into four (4) components each consisting of a
number of complementary activities designed to achieve the project goal. Listed below are the major
components.
Component 1: Enabling policy, institutional, and legislative framework for energy efficiency in
buildings
Component 2: Enabling energy efficiency improvements through S&L for appliances
Component 3: Energy efficiency solutions in a selection of public buildings through selected pilot
demonstration projects
Component 4: Replication and dissemination of lessons learnt and best practices
2.3 Project Outcomes, Output and Activities
The increased adoption of energy efficiency in building design, practices and materials will lead to a
reduction in energy consumption of new buildings (as compared to BAU approach). This will also result in
reducing corresponding GHG emissions from the built environment. The project aims to achieve the goal by
strengthening and enforcing new regulatory framework for energy efficiency in building, and introducing S&L
programme for imported appliances, with certification and testing mechanisms in place. Following sections
elaborate coordinated series of activities and expected deliverables for each component resulting in
achieving the main project objective.
50UNDP: PROJECT: Enabling Activities for the Preparation of Cape Verde´s Third National Communication to the UNFCCC 51UNDP: PROJECT: Enabling Activities for the Preparation of Cape Verde´s Third National Communication to the UNFCCC
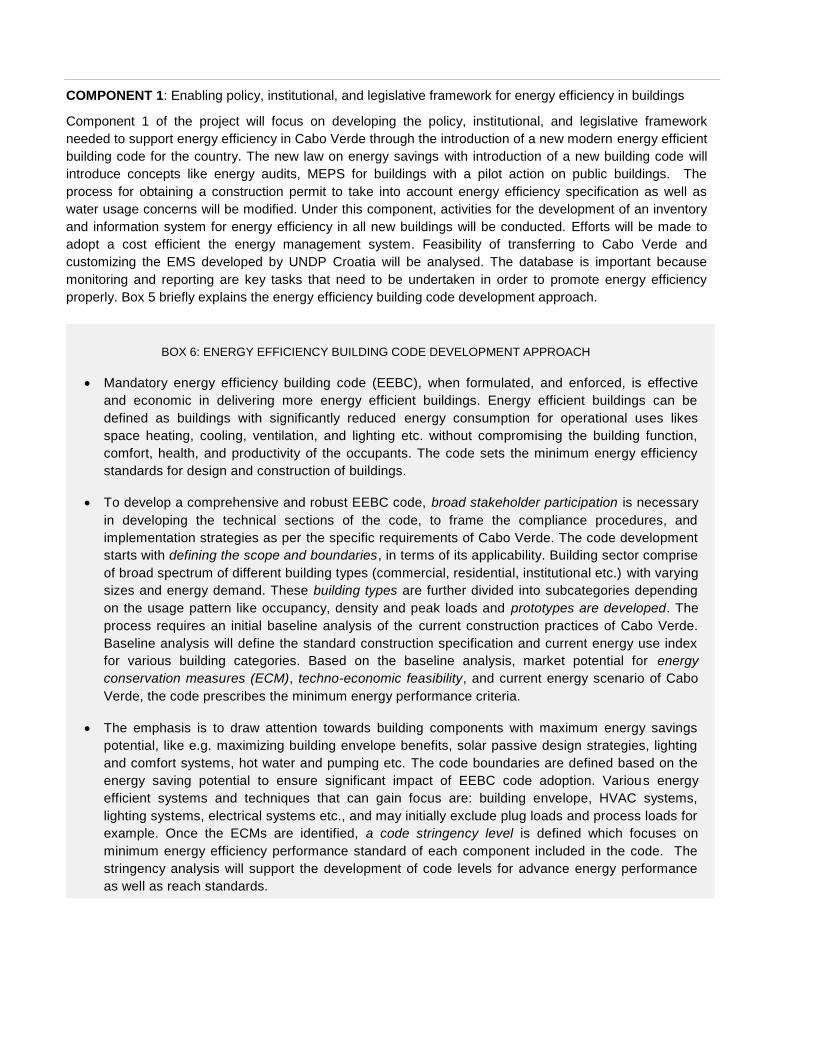
COMPONENT 1: Enabling policy, institutional, and legislative framework for energy efficiency in buildings
Component 1 of the project will focus on developing the policy, institutional, and legislative framework
needed to support energy efficiency in Cabo Verde through the introduction of a new modern energy efficient
building code for the country. The new law on energy savings with introduction of a new building code will
introduce concepts like energy audits, MEPS for buildings with a pilot action on public buildings. The
process for obtaining a construction permit to take into account energy efficiency specification as well as
water usage concerns will be modified. Under this component, activities for the development of an inventory
and information system for energy efficiency in all new buildings will be conducted. Efforts will be made to
adopt a cost efficient the energy management system. Feasibility of transferring to Cabo Verde and
customizing the EMS developed by UNDP Croatia will be analysed. The database is important because
monitoring and reporting are key tasks that need to be undertaken in order to promote energy efficiency
properly. Box 5 briefly explains the energy efficiency building code development approach.
BOX 6: ENERGY EFFICIENCY BUILDING CODE DEVELOPMENT APPROACH
Mandatory energy efficiency building code (EEBC), when formulated, and enforced, is effective
and economic in delivering more energy efficient buildings. Energy efficient buildings can be
defined as buildings with significantly reduced energy consumption for operational uses likes
space heating, cooling, ventilation, and lighting etc. without compromising the building function,
comfort, health, and productivity of the occupants. The code sets the minimum energy efficiency
standards for design and construction of buildings.
To develop a comprehensive and robust EEBC code, broad stakeholder participation is necessary
in developing the technical sections of the code, to frame the compliance procedures, and
implementation strategies as per the specific requirements of Cabo Verde. The code development
starts with defining the scope and boundaries, in terms of its applicability. Building sector comprise
of broad spectrum of different building types (commercial, residential, institutional etc.) with varying
sizes and energy demand. These building types are further divided into subcategories depending
on the usage pattern like occupancy, density and peak loads and prototypes are developed. The
process requires an initial baseline analysis of the current construction practices of Cabo Verde.
Baseline analysis will define the standard construction specification and current energy use index
for various building categories. Based on the baseline analysis, market potential for energy
conservation measures (ECM), techno-economic feasibility, and current energy scenario of Cabo
Verde, the code prescribes the minimum energy performance criteria.
The emphasis is to draw attention towards building components with maximum energy savings
potential, like e.g. maximizing building envelope benefits, solar passive design strategies, lighting
and comfort systems, hot water and pumping etc. The code boundaries are defined based on the
energy saving potential to ensure significant impact of EEBC code adoption. Various energy
efficient systems and techniques that can gain focus are: building envelope, HVAC systems,
lighting systems, electrical systems etc., and may initially exclude plug loads and process loads for
example. Once the ECMs are identified, a code stringency level is defined which focuses on
minimum energy efficiency performance standard of each component included in the code. The
stringency analysis will support the development of code levels for advance energy performance
as well as reach standards.

Figure 26: EEBC Code Development Approach
User Group Private Sector
Government and NGOs Funders
Figure 27: Stakeholder Engagement for EEBC Code Development
Thus define the increased code stringency with projected market growth and energy scenario. To
maintain code flexibility and ease to adopt sustainable building practices, code compliances
mechanism are developed and proposed. The two basic approaches through which code compliance
is achieved are prescriptive or whole building performance approach. A prescriptive approach lays
down mandatory measures to be followed for each building component. It clearly defines the criteria
that applies to the construction, irrespective to the inter relation of one component, within the same
system, on another. A whole building performance approach lays down the baseline of building
components and defines the suitable trade-offs within a system or in between two systems of a
building to optimize the energy performance with the cost.
The code compliance for Cabo Verde could be predominately prescriptive approach with some
performance based criteria. Compliance tools should be developed to effectively calculate the
performance of each building component as a result of complying with the code stringency levels.
Compliance forms and checklist is developed to evaluate the code compliance of buildings. Once the
code is developed and launched, user manuals are published to raise awareness and provide
practitioners with guidelines to adapt to EEBC code. . The code level is well analyzed with active
stakeholder participation and review. Once the stringency level is defined the code is written in a
legal language. The first generation code should prioritize ease of use both in terms of
requirements and language. With subsequent updates, the code can become stringent and
comprehensive.
1. Define Scope applicability
2. Building Types
Definition
3. Define Prototypes
Hotels, offices, high-rise,
hospital
4. Detailed Energy Audit
5. Establish Energy use
baseline – current practices
6. Identify Energy Conservation Measures
7. Techno economic analysis
ECM
8. Code Stringency Level
9. Write the code in legal language
10. Establish Compliance Mechanisms
11. Develop Code Compliance forms/software
12. Develop User Manuals
Building Users
Building Owners Advocacy Groups and
Associations
Financial Institutions
Utilities
Manufacturers/Importers
Architects / Engineers
Builders/Contractors
Standard Setting Bodies Legislative Agencies
Educational Institutions
Funding Agencies Local Businesses /
Financial Institutions

Activity 1.1.1: Data collection for baseline formulation and current situation analysis
Building baseline data is necessary to understand the current situation of energy and water consumption and
analyze the impact of energy efficiency and water use efficiency in buildings. This will result in development
of a comprehensive methodology to collect data for parameters associated with building energy and water
consumption and analyze building categories within a defined framework. The outcome of the activity will
give insight related to average specification of a building component and energy performance index of each
building category (prototypes). The data collection will allow the formulation of benchmarks for different
categories and help develop MEPS and water efficiency standards (e.g. water recycling, rainwater harvesting
etc.). Initiatives on additional assessment and review of traditional building practices and construction
materials in Cabo Verde should be taken. This will support in developing energy efficiency thresholds so that
their performance in terms of energy savings could be well understood.
Activity Output:
Prepare baseline data report: The report will consist of extensive data collected to conduct the
baseline analysis. This will include data collected through energy and water audits. This report will give
energy use intensity of each building category.
Prepare baseline analysis report: Assimilate and analyse the collected data to define the baseline. It
will result in classification of buildings with its sub categories, information on existing building stock,
conventional construction practices; total energy consumption by specific building category, energy
consumption by end use or energy use intensity, and GHG emissions from buildings. The report will
also produce a methodology to develop energy benchmarks for buildings.
Activity 1.1.2: Develop code structure and define the scope
Develop code structure and scope from the defined baseline and analysis from the previous activity. Based
on the outcomes, define the scope of the new building code to target the components with highest energy
and water saving potential e.g. building envelope, HVAC systems, lighting systems, electrical systems etc.
Based on the identified energy conservation measures and techno –economic analysis of each component,
develop the code structure and scope. Evaluate the provision for including scope for refurbishment of
existing buildings.
Activity Output:
Prepare code structure and scope report: Previous activity outcome will support in defining the new
building code boundaries, and parameters to include building system component under the ambit of
the new code. Conduct techno economic feasibility of each building systems for code.
Outcome 1: Energy efficiency policies, legislation and secondary regulations are adopted, put in place and
strengthened regulatory framework results.
Output 1.1: New building code focused on energy savings in Cabo Verde (includes minimum energy
performance standards and energy passports) and which promotes climate resiliency and adaptation’ and
includes water usage (efficiency, recycling and reuse).

Activity 1.1.3: Conduct code stringency analysis
A code stringency level will define the minimum performance of each building component selected for the
code. Analyse the code level with active stakeholder participation and review.
Activity Output:
Prepare stringency analysis report: The proposed activity will result in a stringency analysis report,
which will define the threshold of each energy efficiency component with specified performance level.
Activity 1.1.4: Develop compliance forms and users manuals
The proposed new building code will state the specific requirement in a legally enforceable language; code
enforcement will also require comprehensive technical manuals illustrating the process of design and
approach towards meeting the energy efficiency specifications. The activity will also require the development
of compliance forms to ensure integration of government approvals procedures. The two basic approaches
through which code compliance is achieved are prescriptive or whole building performance approach.
Activity Output:
Prepare code compliance report: The activity will result in defined compliance evaluation procedures
and develop compliance checklist. The report will also feature methodology to prescriptive and whole
building performance approach.
Prepare user manuals: The activity outcome will result in producing technical user manuals with
technical user guides for architects, engineers and other relevant stakeholders.
Prepare Stakeholder Consultation report: A stakeholder consultation will be conducted covering the
agenda of all the previous activities for component output 1.1. The consultation will support in
development of technical sections of the proposed new building code.
Activity 1.2.1: Identification and classification of buildings
Baseline analysis performed in output 1.1 will project the different categories of buildings and develop
prototypes. Based on the baseline analysis and defined scope, inventory and information system will be
designed to monitor the current situation of building categories with maximum energy efficiency and water
efficiency potential. Analysis will highlight building categories with maximum potential of energy efficiency
impact. Develop an information dissemination system through which the data collected will be made
available on a web based public platform.
Activity output:
Same as activity 1.1
Activity 1.2.2: Develop Energy, GHG and water end use mapping for buildings in the country through
preparation of an energy information and management system
Develop Energy management system (EMS) within this output, which will require listings of buildings are per
categories, and sub categories. Consider transferring, customizing and enhancing the EMS that UNDP
developed in Croatia as part of its UNDP GEF Energy Efficiency project in Croatia, which was completed in
Output 1.2: Inventory and information system for national energy balance, detailed consumption statistics
and related GHG emissions in the buildings, by building category and major end-use (air conditioning,
lighting, water heating, water pumping, and appliances)

2012. Integrate the EMS system with energy and water use data along with corresponding GHG emission
data populated from the previous output. This will also provide provision to add latest energy, water
consumption data from new code compliant buildings. Resulting in a reliable baseline for new building
energy use (and related GHG emissions), and water use.
Activity output:
Prepare energy, GHG and water management report: The proposed activity will result in a defined
methodology to develop energy and water management tool such as EMS. This will result in
appropriate mapping of building performance. The report will elaborate on the strategy to transfer and
customize EMS Croatia to EMS Cabo Verde.
Activity 1.2.3: Policy mechanism for periodic update and reporting of data for existing buildings
The proposed development of an inventory and energy management system will support environmental
impact assessment and Strategic Environmental Assessment (SEA), project the impact of energy efficiency
measures, prioritize the policy requirements, and evaluate the impact of code application on existing
buildings. After the successful implementation of the energy efficiency measures, such database will also
help in suggesting future modification to the code as per the prevailing requirements.
Activity output:
Prepare policy mechanism report: The activity will result in database update and reporting
methodology.
Activity 1.3.1: Technical requirements for MRV for each building type
The activity will define the rules and regulations to check the compliance and performance of the adopted
energy efficiency measures after the building becomes operational. The process should be comprehensive
to include all the measurement, reporting, and verification requirements to illustrate the performance in detail
and suggest recommendations, if necessary.
Activity Output:
MRV protocol report: The report will produce rules, regulations, and requirements to conduct MRV,
and post occupancy compliance and performance checklist.
Activity 1.4.1: Incorporation of energy code in the construction approval process
The activity will first analyze the status of the building sector (for new and existing buildings) in terms of
organizations, regulations, implementation structure, public awareness and experience gained from few
energy efficiency measures to understand the gaps. This will also include an in-depth study of the current
building approval process and proposed strategic approach to integrate the energy efficiency code
compliance within the regulatory framework. The activity will also include the development of rules and
regulations for the code compliance as well as roles and responsibilities of various government organizations
involved in the compliance and enforcement mechanism. This will provide a roadmap and recommendations
for the introduction of mandatory new building code.
Output 1.3: MRV protocol to measure energy savings, water usage, and emission reduction in public buildings
Output 1.4: Amendments to construction permit regulations to include mandatory requirementsfor
minimum energy performance standards and including robust enforcement mechanism.

Activity output:
Prepare code implementation roadmap report: The activity will result in developing a code
implementation mechanism and a roadmap to incorporate energy codes in construction approval
process.
Activity 1.4.2: Inspection and reporting mechanism for new building construction
The activity includes the development of a mechanism to inspect new building construction and provide
regular reporting. Doing this through including mandatory energy audits in compliance mechanism
Activity output:
Prepare inspection and reporting mechanism report: The report will provide requirement checklist for
inspection and reporting mechanism for code compliance.
Prepare technical working group report: A consultation will be required to get inputs from technical
experts to develop all the proposed deliverables for outcome 1.
COMPONENT 2: Enabling energy efficiency improvements through S&L for appliances
Component 2 of the project will focus on introducing a national framework for S&L of appliances. This project
will develop regulations for standards of specific appliances (air-conditioners, domestic refrigerators, lighting
products and electric storage water heaters etc.) as well as developing and adopting national certification
procedures for imported appliances. The S&L programme will develop strategies to associate and align with
the normative European Convergence process and ECOWAS orientations. In addition, explore the provision
for a study of a testing lab for imported appliances, in accordance with testing and certification mechanism,
which are to be developed. Training materials will be prepared and training seminars on the new framework
on standards and labels for key decision makers and appliance stakeholders (chamber of commerce,
importer, retailers, and national administration).
BOX 7: STANDARDS AND LABELLING (S&L) PROGRAMME APPROACH
Appliance mapping and energy performance benchmarking will provide policy makers and energy
efficiency program managers with tools to compare test standards and efficiencies of appliances,
and align Cabo Verde appliance market with international efficiency levels. A market assessment is
recommended to determine the baseline performance level and growth rate of the market for each
type of appliance. The assessment will evaluate the energy saving potential for each sub-category
and establish a baseline for relative assessment.
Appliance mapping will give an overview of appliance market in Cabo Verde; this includes
collecting annual sales data (previous 5 years) of appliances selected for first phase of S&L
program (air conditioners, refrigerators and freezers, televisions, electric water heaters and bulbs).
The annual sales data will also give insight into market sector subcategories and technology trends
in the country. The market sector sales will subcategorize sales in residential, commercial and
public sector etc. Technology trend will provide information on type of appliances like e.g. for air
conditioners - windows and portable (ACs) and split and packaged (ACs). The sales data will also
provide growth trends of the appliances in market sector subcategory and with trends in
technology.
Majority of appliances are imported in the country with Portugal, Spain and Netherlands as primary
country of origin for imports. Detailed sales volume by country of origin should be mapped for last 5
years.
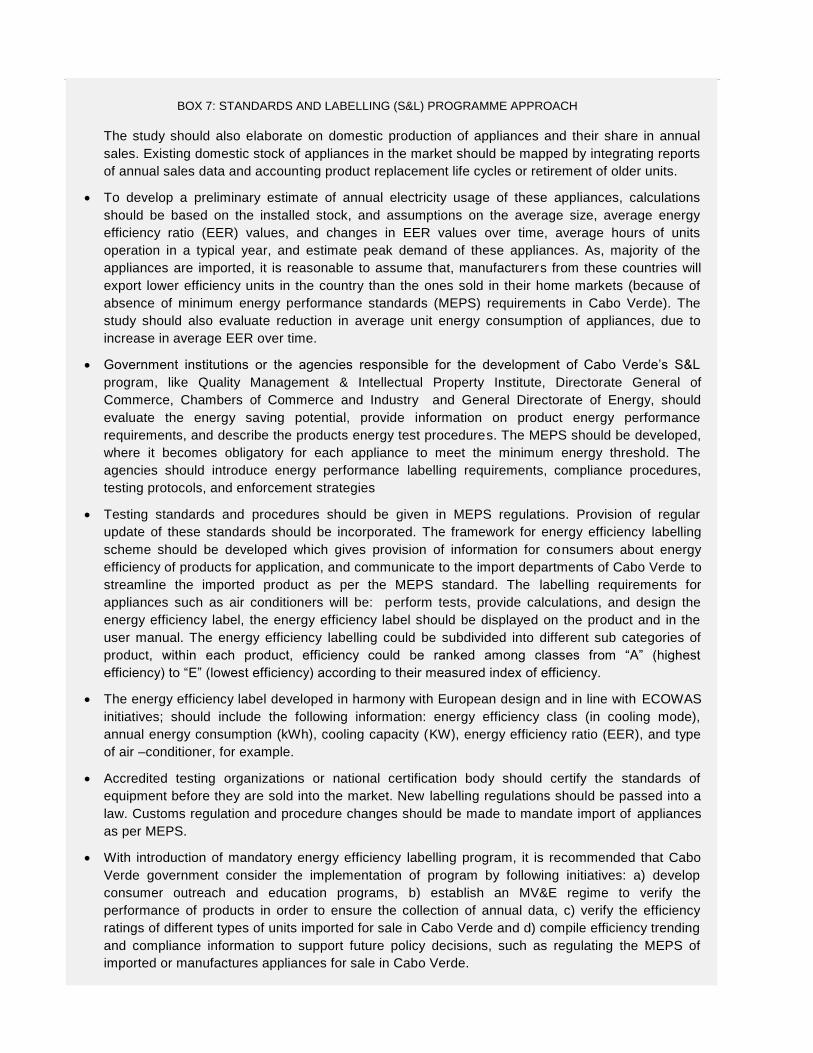
BOX 7: STANDARDS AND LABELLING (S&L) PROGRAMME APPROACH
The study should also elaborate on domestic production of appliances and their share in annual
sales. Existing domestic stock of appliances in the market should be mapped by integrating reports
of annual sales data and accounting product replacement life cycles or retirement of older units.
To develop a preliminary estimate of annual electricity usage of these appliances, calculations
should be based on the installed stock, and assumptions on the average size, average energy
efficiency ratio (EER) values, and changes in EER values over time, average hours of units
operation in a typical year, and estimate peak demand of these appliances. As, majority of the
appliances are imported, it is reasonable to assume that, manufacturers from these countries will
export lower efficiency units in the country than the ones sold in their home markets (because of
absence of minimum energy performance standards (MEPS) requirements in Cabo Verde). The
study should also evaluate reduction in average unit energy consumption of appliances, due to
increase in average EER over time.
Government institutions or the agencies responsible for the development of Cabo Verde’s S&L
program, like Quality Management & Intellectual Property Institute, Directorate General of
Commerce, Chambers of Commerce and Industry and General Directorate of Energy, should
evaluate the energy saving potential, provide information on product energy performance
requirements, and describe the products energy test procedures. The MEPS should be developed,
where it becomes obligatory for each appliance to meet the minimum energy threshold. The
agencies should introduce energy performance labelling requirements, compliance procedures,
testing protocols, and enforcement strategies
Testing standards and procedures should be given in MEPS regulations. Provision of regular
update of these standards should be incorporated. The framework for energy efficiency labelling
scheme should be developed which gives provision of information for consumers about energy
efficiency of products for application, and communicate to the import departments of Cabo Verde to
streamline the imported product as per the MEPS standard. The labelling requirements for
appliances such as air conditioners will be: perform tests, provide calculations, and design the
energy efficiency label, the energy efficiency label should be displayed on the product and in the
user manual. The energy efficiency labelling could be subdivided into different sub categories of
product, within each product, efficiency could be ranked among classes from “A” (highest
efficiency) to “E” (lowest efficiency) according to their measured index of efficiency.
The energy efficiency label developed in harmony with European design and in line with ECOWAS
initiatives; should include the following information: energy efficiency class (in cooling mode),
annual energy consumption (kWh), cooling capacity (KW), energy efficiency ratio (EER), and type
of air –conditioner, for example.
Accredited testing organizations or national certification body should certify the standards of
equipment before they are sold into the market. New labelling regulations should be passed into a
law. Customs regulation and procedure changes should be made to mandate import of appliances
as per MEPS.
With introduction of mandatory energy efficiency labelling program, it is recommended that Cabo
Verde government consider the implementation of program by following initiatives: a) develop
consumer outreach and education programs, b) establish an MV&E regime to verify the
performance of products in order to ensure the collection of annual data, c) verify the efficiency
ratings of different types of units imported for sale in Cabo Verde and d) compile efficiency trending
and compliance information to support future policy decisions, such as regulating the MEPS of
imported or manufactures appliances for sale in Cabo Verde.

Activity 2.1.1: Design of informative labels for appliances
The activity will comprise of the major steps required to develop the labelling programs for the appliances.
The activity will be based on the projected energy efficiency potential in each appliance category, and
technical analysis on the proposed energy efficiency labels. The design of the labels should illustrate all the
important information critical for the consumer to make an informed decision.
Activity 2.1.2: Selection of appropriate testing procedure for each appliance
Verification and enforcement plan is needed to perform energy tests. Almost every appliance requires a
unique energy test setup. For example, a refrigerator requires an environmental chamber and an air
conditioner requires a calorimeter chamber. The activity will include identifying and adopting national test
procedures for the selected appliances (air conditioners, refrigerators, freezers, televisions and lighting
products etc.). The project will provide the necessary technical assistance or support to build an enabling
environment for product testing by accrediting facilities for testing and monitoring compliance (test facilities
must be certified). A legal verification and enforcement system should be developed to follow up with import
of non-compliant appliances.
Activity 2.1.3: Setting labeling threshold and range for each labelled appliance
The activity includes a detailed technical energy efficiency analysis of each category to evaluate the energy
efficiency potential and prescribe an appropriate threshold after considering the optimized results.
Activities Output:
Prepare appliance labeling programme report: The proposed activities will develop a labeling
programme for shortlisted appliances that are imported in the country. The report will provide design of
informative labels, appropriate testing procedures, labeling threshold and programme implementation
methodology. The report will also provide pilot launch of S&L programme.
Activity 2.2.1: Developing an implementation plan for mandatory S&L program
The proposed activity will develop an enforcement plan involving various steps to enforce the S&L program
within the appliance industry. As the majority of the appliances are imported, the S&L program will provide
the guidelines on the selection procedure of the imported appliances and develop new regulations for
imports.
Activity Output:
S&L program report: The activity will result in development of an implementation plan and program
launch methodology to be in line with ECOWAS S&L labeling program.
Outcome 2: Certification, labelling and enforcement mechanism to promote energy efficient end-uses and
national testing, certification, labelling and enforcement mechanisms adopted
Output 2.1: Labelling programme for appliances imported in Cabo Verde in line with ECOWAS labelling
programme
Output 2.2: Regulations including import regulations for energy efficiency standards for a first selection of
appliances

Activity 2.2.2: Incorporating labelling requirements in import and sales regulations
This activity involves the key steps required to integrate the S&L implementation and compliance plan within
the import and sales regulations. This activity will streamline phase out of inefficient appliances, which would
fail to pass the technical criteria on energy efficiency and only allow the market to purchase energy efficient
products to ensure successful compliance.
Activity Output
Prepare customs and sales regulations report: The proposed activity will result in development of
revised customs regulations for import of energy efficient appliances
Activity 2.2.3: Requirement for MRV of sales and actual performance
The activity will define the process to check the compliance and performance of new energy efficiency
appliance. The process should be comprehensive to include all the measurement, reporting, and verification
requirement to illustrate the performance in detail and suggest recommendations, if necessary.
Activity Output:
Prepare MRV methodology report: The proposed activity will result in a comprehensive methodology
for MRV and its requirement checklist.
Activity 2.3.1: Engagement of national and regional test facilities for appliance and frasibility of setting
National test lab in Cabo Verde
The activity will establish a legal verification and enforcement system to follow up on non-compliance with
the new regulations. ECOWAS is planning to set-up regional test facilities, which would leverage the
combined testing requirements of many countries. This approach of regional test facilities will ensure
consistency in compliance and enforcement within each country and harmonize requirements for the region.
These test facilities will verify the data provided by the vendors, and calculate the energy efficiency label for
each product. The product verified with MEPS will be suitable for sale across Cabo Verde. As a part of this
activity, detailed feasibility of setting up a regional lab in Cabo Verde will be done in coordination with
ECOWAS. This activity further includes the identification of regional testing facilities (which are certified)
within the supervision of national and regional governments.
Activity 2.3.2: Periodic testing and reporting of labelled appliances
The activity involves the periodic testing of the labelled appliances to ensure quality check and suggest
recommendations, if needed. Trade inspection for distributors and retailer compliance will be established,
which will help in checking on counterfeits and fraudulent products. Assess the capacities of various
government organizations for checking distributors and retail outlets for product compliance. Conduct training
programs for inspectors for compliance checking at distributors and retail outlets.
Activity output
Prepare appliance-testing reports: Test mechanism of selected appliances MEPS and for appropriate
labels. Develop a methodology to regularly test and report the labelled appliances.
Output 2.4: National certification procedures to promote energy efficiency
Output 2.3: Testing mechanism for selected appliances to be developed and established

Activity 2.4.1: Design of a national certification program for selected appliances
Based on the appliance test results, a national certification program will be launched which will be applicable
across the country. This program will be applicable on the appliances category shortlisted for project
implementation. The activity will include the completion of all the steps critical to ensure successful
implementation of S&L program.
Activity Output:
Prepare certification program report: the activity will result is a comprehensive certification program of
standardized products.
Activity 2.5.1 Design of comprehensive awareness programs for key stakeholders – importers,
retailers, consumers, enforcement agencies etc.
The activity includes the provision of information, about the costs and benefits of energy efficient products,
the test procedures and MEPS as well as an explanation of energy labels and classifications for appliances.
After the successful implementation of the S&L program, major steps will be required to generate public
awareness on the benefits of purchasing energy efficient appliances and associated returns. Develop a
training program based on the understanding and role of importers, retailers, consumers, and enforcement
agency. National awareness campaign activities should be launched about energy efficient appliance
benefits. Develop and promote awareness materials (leaflet, posters, brochures, websites, etc.) to provide
end-users with information about appliance energy efficient principles and related costs– benefit analysis.
Develop training courses for distributors and retailers, focusing on the sales of more efficient products.
Activity Output:
Prepare awareness program reports: The proposed activity will produce awareness raising
programmes and target audience, appropriate training programs and various marketing products.
Activity 2.6.1: Developing an incentive mechanism for phasing out existing inefficient appliances through DSM
program
As the current appliance stock operating in Cabo Verde is inefficient and based on old technologies, it is
important to replace all the existing appliances with new energy efficient appliance to maximize the GHG
abatement potential of S&L program. Demand side management programs should be designed which could
range from information or awareness programs (promoting user benefits and explaining no/low cost actions)
to financial incentive programs to encourage the consumers (individuals and organizations) to discard the
inefficient appliances from their daily usage. Financial incentive program in which all or part of the cost of
energy efficient technology is paid by the utility. Strategic DSM program will facilitate this objective and
ensure maximum impact of S&L program.
Activity 2.6.2: Implementing DSM for selected appliances with the most saving potential
DSM should be first tested on the appliances with most energy efficiency potential and slowly applied to all
the appliance categories in partnership with commerce (importers, retailers) and commercial banks.
Output 2.5: Public awareness programme and diffusion strategy – training seminars etc.
Output 2.6: Demand side management program, run by national utility, built around a “turn in or
exchange” mechanism /modality

Activity output:
Prepare DSM 52 program report: A draft methodology to phase-out inefficient appliances, with
implementation strategies
52 Sustainability energy regulations and policy making for Africa –UNIDO and REEEP
BOX 8: DEMAND SIDE MANAGEMENT PROGRAMS
Demand side management (DSM) programs consist of the planning, implementing, and monitoring activities of
electric and gas utilities designed to encourage consumers to reduce their level and modify their pattern of
electricity (or gas) usage.
DSM programs typically promote the use of high-efficiency technology and facility design among customers. DSM
programs can range from information or training programs that do not provide any actual financial assistance to
end users, to financial incentive programs in which all or part of the cost of the efficient technology or design is
paid for by the utility. The benefits of DSM programs for consumers are reduced energy costs, capital
requirements, and capital expenditures. The benefits to utilities include reductions in capital requirements and
improve operating costs. DSM also has various other beneficial effects, including mitigating electrical system
emergencies, reducing the number of blackouts and increasing system reliability.
The main types of DSM activities may be classified in three categories:
Energy reduction programmes—reducing demand through more efficient processes, buildings or
equipment ( e.g appliance labeling, efficient lighting, building regulations, Energy Management , Hiring
an energy planner, housekeeping and energy auditing)
Load management programmes—changing the load pattern and encouraging less demand at peak
times and peak rates;( e.g load leveling, load control, tariff incentives or penalties)
Load growth and conservation programmes.
DSM programmes and policies can be promoted and implemented at different levels of society, such as:
Government policies and regulations;
Utilities programmes;
Energy consumer participation.
Each of these categories has its own significant role to play. But the optimum results can be obtained by
coordinating all three. Government agencies can make various policies and regulations, and provide subsidies for
these programmes. Utilities can implement these effectively through various programmes, preferably with
customized programmes developed and operated in coordination with the end-users i.e. the energy consumers.

Activity 2.7.1: Develop and implement fiscal incentive programs for import of super efficient appliances and
for large-scale replacement program
High upfront cost due to better technology may prove barrier for wider adoption of energy efficient
appliances. Thus developing a financial mechanism and incentives on the purchase of energy efficient
appliances will be necessary. Fiscal incentives will ensure that cost of energy efficient appliances are within
the purchasing limit of the consumer and are cost effective to buy. The most successful financial schemes
enable the consumers to overcome the higher first-cost of energy efficient appliances while also creating
awareness about the operating cost and lifecycle cost benefits . A possible approach for Cabo Verde could
be to set-up a revolving fund for a rebate program that provides no (or low) interest financial incentives for
consumers to buy energy efficient appliances and allowing them to repay over a defined period of time
through the savings achieved in the operating cost. Another possible incentive would be to reduce the import
duty on the most efficient appliances being imported to the country. Because of this work, energy efficient
refrigerators, air conditioners, and water heaters and bulbs meet the new quality, environmental and energy
performance standards and diffuse widely on the national market.
Activity output:
Prepare energy efficiency financial incentive program report: the proposed activity will provide
feasibility analysis of various financing schemes and the most appropriate implemenitng agency(ies),
in order to accelerate the adoption of selected energy efficient appliances.
Prepare Fiscal incentive program implementation report which clearly explains and defines how the
financial incentive program will be implemented including detailed breakdown of all costs and
resources required, and provide technical support to the implementing agency.
Component 3: Energy efficiency solutions in a selection of public buildings through selected pilot
demonstration projects
Component 3 of the project is focused on the implementation of at least 4 demonstration projects in public
buildings and 2 social housing programmes showcasing best practices related to energy efficiency (thermal
insulation, sun protection, improved lighting, HVAC system, building control management, efficient water
usage etc.) with selected co-financing partners. Each demonstration project will be based on international
best practice and will significantly comply with the technical sections of the new energy efficiency building
code developed under component 1 of the project.
The demonstration projects will start during the second year of the GEF project cycle. This will give sufficient
time to select and /or confirm the most suitable demonstration project (shortlisted according the key selection
criteria’s with maximum energy saving potential provided in the annexure). Meanwhile, this component will
support training of relevant building stakeholders (architects, engineers, designers, developers, financial
institutions) to understand the benefits of energy efficiency building options, energy efficiency of materials,
monitor energy performance and validation of energy savings through an appropriate monitoring and
reporting system (including meters, as required) for each of the demonstration project. Thus component 3,
will start by conducting extensive training programs for design consultants, contractors and craftsmen to
equip them with skills necessary for making demonstration projects a success.
Component 3 is focused on demonstrating and scaling up the potential for new investments in energy
efficiency by displaying low carbon technology solutions. The main outcome of this component will be greater
investment in buildings sector and additional GHG emission reductions, both direct from the demo projects
Output 2.7: The most relevant financial incentive is identified and introduced in a pilot programme for the
scale up of energy efficient appliances

themselves and indirectly from additional projects, which are implemented by the end of the project. The pilot
demonstration projects aims to serve as a platform to raise awareness and drive additional investment in
energy efficiency.
Outcome 3: Energy efficiency solutions in a selection of public buildings through selected pilot
demonstration projects.
Activity 3.1.1: Identification of pilots based on national survey and selection criteria with most energy saving
potential (new and existing buildings/retrofits).
Evaluate potential pilot projects identified during project preparation phase based on pilot selection criteria
(provided in annex) and most suitable project/s will be selected for energy efficiency demonstration. The final
pilot selection could also be based on a bid, which will confirm interest and availability (this will ensure the
confirmation on their funding availability, the co-finance for the project and will also coincide with UNDP
project implementation schedule).
Activity 3.1.2: Implementing energy efficiency measures
Based on the selected pilot programs, implement energy efficiency measures should be implemented on
pilot projects to demonstrate the application and advantages of the energy efficient buildings. The
demonstration projects should be provided with technical assistance from the consultants responsible for the
project component and some of the additional cost that is incurred in integrating energy efficiency measures
will be supported by this project. Both new and existing buildings can be selected for pilot demonstration.
The technical assistance includes advisory on energy efficient building design, decision on appropriate
energy efficient technologies, material specification, energy simulations, life cycle cost analysis etc. The
selected demonstration projects should fulfil the primary objective of imparting technical skill and build
capacity by training the design team and other stakeholders.
Activity output:
Prepare pilot selection criteria and feasibility report: the activity will result in shortlisted pilot projects
with significant demonstration ability. The report will detail out pilot selection criteria and the project
feasibility. The report should define the energy efficiency measures that need to be implemented in the
pilots.
Activity 3.2.1: Developing a training and certification program for energy efficiency design, audit and
skilled tradesmen
This outcome is expected because of addressing the need to develop knowledge and expertise of building
practitioners through training programs and workshops for architects, builders, contractors, building
managers, and energy auditors as well as building material suppliers and testing facilities. The major
activities include a skill set requirement mapping and develop a specific training program targeting different
stakeholders. Conduct awareness workshops focusing on administrators, public and private sector decision
makers and financial institutions. A university or an independent third party agency should provide this and
GEF will provide advisory for developing the program of training the relevant stakeholders.
Output 3.1: Selection of at least 4 public buildings and 2 social housing programmes for pilot
demonstration projects in energy efficiency investment
Output 3.2: Building stakeholders trained to monitor energy performance, water usage at the selected
buildings in accordance with information systems

Activity 3.2.2: Develop and launch certification programs and accredited professional courses
The activity includes development of an accreditation program to certify professionals who are successfully
trained and demonstrate technical understanding of the subject as per the desired outcomes of the training
programs.
Activity Output: Prepare training and certification program report: The proposed activities should
shortlist various training programs to be launched and methodology for accreditation programs.
Activity 3.3.1: Documenting demonstration projects
The activity involves comprehensive documentation of strategic approach, barriers, technical researches,
key learning, and major outcomes from the selected demonstration projects. The documentation will be
published for public awareness and replication as case study or documentary.
Activity 3.3.2: Develop Monitoring and Verification (M&V) plan for demonstration projects
The activity will define the procedures to check the compliance and performance of the adopted energy
efficiency measures after the pilot becomes operational. The process should be comprehensive to include all
the measurement, reporting, and verification requirement to illustrate the performance in detail and suggest
recommendations, if necessary. The outcome of the pilot programs will apply on mass level to maximize the
GHG abatement.
Activity Output:
Prepare pilot project report: The report should consist of pilot documentation checklist with comprehensive
M&V plan
Component 4: Replication and Dissemination
Component 4 focuses on replication and dissemination of the results of the project. Key activities will include
a case study guide, a public awareness campaign, and lessons learned study. Each of these studies will
focus not only on energy efficiency indicators but also on water performance and climate resiliency building
codes. This component will also focus on operation and potential replication of energy management system
developed within UNDP GEF project Croatia and develops a system of tracking labels and monitoring of
energy efficient appliances. In addition, the ongoing annual monitoring requirements required by the new
building codes will need to be effectively continued and carried out beyond the lifetime of the project. The
main outcome of this component will be a sustainable institutional framework to support energy efficiency in
the built environment in Cabo Verde and to broaden the target group, which will benefit from the outputs of
this project and help ensure that there is a greater and wider interest in energy-efficiency in Cabo Verde.
A key activity will be training of key government stakeholders (key decision makers); practitioners (architects
and engineers) of energy efficient buildings in particular the project will introduce energy efficiency technique
and practices in Vocational Training Schools across the country. The project will also target separate training
programs for real estate companies, banks, social housing companies etc. Apart from focusing on building
construction and practices, this component could also focus on building life cycle components especially
occupant’s behaviour and facility management practices through targeted awareness raising programs.
These programs could support facility management companies (like private offices, commercial (hotels) or
public institutions.
In order to ensure that international best practices are followed, it will be important to regularly update the
legislation and reconsider the institutional framework is being put in place under component 4 of this project.
Output 3.3: Monitoring and reporting system of energy performance/water usage for the demonstration
projects

The final activity of this project will be for the Project Manager to prepare a lesson-learned study on multiple
aspects for buildings and S&L for appliances. Develop policy briefings, reviews e.g. a new case study on
analyzing the process of developing, and implementing a new building code and policy implications, lessons
learned study to control import of inefficient appliances and how to apply them for other appliances.
Outcome 4: Additional investment mobilized in energy-efficiency as a result of the dissemination and
replication activities.
Activity 4.1.1: Develop energy efficiency case study guides and best practice user guides
The activity involves the development of user guides and case study guides based on technical research and
learning from the activities listed in the document. The activity will result in producing a best practice
handbook and guidelines on energy efficient building design and technologies, and circulate to building
professionals and upload on a public domain for raising awareness and encourage replication of energy
efficient technologies. Review and assessment of traditional building practices or techniques and
construction materials conducted in Activity 1.1 could result in an assessment report to disseminate
knowledge about use traditional methods and their benefits among design consultants and building
stakeholders.
Activity output:
Prepare case study guides, energy efficiency user guide reports, and assessment report for traditional
building practices and materials.
Activity 4.2.1: Develop awareness-raising campaign for end users, retailers and distributers on S&L program
for imported appliances (websites, media outreach, educational initiatives with schools etc.)
After the successful implementation of the S&L program, major steps will be required to generate public
awareness on the benefits of purchasing energy efficient appliances and associated returns. A training
program and awareness raising workshops will be developed targeted towards the role of importers,
retailers, consumers, and enforcement agency.
Activity output
Prepare awareness raising campaign report
Activity 4.3.1: Conducting training courses and workshops for key building stakeholders for energy efficiency
building design, building life cycle and facility management
The activity involves conducting trainings and workshops across the country and target diverse professions
within the building industry to ensure uniform awareness among all the associated sectors. This should also
Output 4.3 Training of key stakeholders on energy efficiency in buildings
Output 4.1 Elaboration of case study guides and disseminated among relevant audience
Output 4.2 Public awareness raising campaign on standards and labels

include design and implementation of certification schemes for building auditors, code compliance
professionals etc. This activity would also provide targeted training programs or workshops for facilities
management companies to raise awareness about building life cycle aspects and occupancy behaviour.
Activity 4.3.2: Capacity development and support to LEC (Civil Engineering Lab)
This activity will build capacity and enhance technical expertise of LEC for testing the thermal properties of
building materials such as thermal conductivity, specific heat and density. This will result in producing a
complied technical data for buildings materials with their thermal properties. Additional equipment (guarded
hot-box) for testing U-values of wall and roof materials will be added. The activity will also provide technical
support in conducting various types of tests, and training in the use of equipments for conducting these tests.
Thus, support to LEC lab will be conducive in producing a comprehensive data for thermal properties of the
materials, which will guide design consultants, and building professional for procurement of energy efficient
materials.
Activity 4.3.3: Develop vocational training programs and develop energy efficiency best practices modules for
university curriculum
The activity involves the development of a university curriculum and degree courses to educate the young
generation with the concept of energy efficiency and bioclimatic architecture and promote further researchh
in Cabo Verde universities.
Activity 4.4.1: A monitoring plan to assess the demonstration projects and system for tracking and monitoring
of labels for EE appliances
The activity will define the procedures to check the compliance and performance of the adopted energy
efficiency measures after the pilot becomes operational. The process should be comprehensive to include all
the measurement, reporting, and verification requirement to illustrate the performance in detail and suggest
recommendations, if necessary. The outcome of the pilot programs will apply on mass level to maximize the
GHG abatement. The project activity should focus on developing a tracking system for labelled appliances
and monitor the impact and performance of S&L program.
Activity 4.5.1: Developed standards to increase the stringency level for energy efficient appliances and for
buildings (REACH standard)
The activity involves development of a reach standard projecting the growth in future and expected energy
efficiency potential with future technological advancement. The reach standard factors such parameters and
prescribes stringent energy efficiency levels in future to be set for new baseline in the future.
Output 4.4: A thorough monitoring of the impacts of the new energy efficiency requirement is performed
Output 4.5: Regular update of the legislation in order to tighten energy efficiency is introduced to
transform further the appliance market and building practices
Output 4.6: Lessons Learned study prepared and disseminated

Activity 4.6.1: Develop and publish energy efficiency best practice user manuals
The activity could review existing good practices of the country in terms of bioclimatic architecture to
showcase the best practice measures and scope for improvements, A study or a review on existing financial
mechanism or policy implications on energy efficiency in buildings could also be conducted etc.
2.4 PROJECT Indicators, Risks and Assumptions Project Indicators
Key indicators of the project success (impact indicators) include:
Introduce new law with energy efficiency building code and corresponding amendments to policies,
regulatory and institutional framework is established. The project resulting in % improvement of
building energy intensity in the buildings by EOP (EE building code of practice)
Mandatory S&L program launched for appliances.
Direct impacts of demonstration buildings, in terms of area of new public buildings, amount of energy
savings (as compared with conventional buildings) and corresponding reduced CO 2emission. The
project results framework outlined in section III provides a detailed list of project progress indicators for
the various outcomes and outputs of the project.
Table 17: Project Indicators
Risks
To ensure the effective design and implementation of the project activities, address some risks to ensure
project success. Efforts should be made to mitigate existing risks that might prevent the project objectives
from being achieved. To address these risks, the project needs to establish effective means to monitor and
mitigate these risks. Mitigation measures include active and continuous involvement in project activities and
decisions of the groups of people that might pose a risk to the project implementation and sustainability. The
project can be considered to face two categories of risks: external (policy-related) and internal (risks inherent
to project implementation itself).
53 It is expected that a new law on buildings and energy efficiency building code is developed and implemented from 2016 (after
one year of project implementation). Thus direct emissions reduction is calculated for nearly 30% of new buildings built thereafter along with estimated reductions from demonstration projects.
Indicator Time Frame Target
Reduction in energy consumption in buildings sector and
demonstration projects through energy and water efficiency
EOP 4634 MWh53
Increase in EEBC code compliant buildings, % increase EOP 30%
Direct CO2 emissions reductions from all energy efficiency and water
efficiency in buildings and demonstration projects
EOP 25.4ktCO2e
Increase in the sales of S&L imported domestic appliances EOP 60%
Energy saving from energy efficient domestic appliances and resultant
CO2emissions reductions
EOP 111,184MWh
272.4ktCO2e
% Increase in the investment mobilized in energy efficient public sector
buildings as a result of dissemination and replication activities
EOP 15%
% Increase in the investment mobilized in energy efficient private
sector buildings
EOP 15%

The external risks include:
The external risks include:
The greatest risk to the success of the project is a lack of continued political will towards energy
efficiency and a stable economic growth of the country. Possible effects of this could be slow
implementation of the project resulting in delayed outcomes.
Co-financing does not materialize from key partners and for demonstration projects.
Slow or limited market transformation for new buildings related to real estate market stagnation and
economic-financial crisis as a risk in limited new construction or challenges for public institutions to
secure funding for their investment projects
Legislation does not pass in a law on building codes and for appliances or resistance of Ministry of
Finance to adopt some fiscal incentives, or Custom Department to implement some regulations due to
the increased costs
Economic and market risks stems from increased cost of energy efficiency measures for new design
and construction practices. There is a risk that building owners and builders will reject this additional
cost.
The internal project implementation risks are:
Failure to trigger positive response from consumers and stakeholders (architects, design
professionals, building material suppliers, builders, contractors, developers, and building managers) –
possible effects of this could be ineffective capacity building efforts and a resultant s lower rate of
market transformation.
Failure of demonstration projects showing good performance of new energy efficiency technologies,
no achievement of projected energy savings and increased investment or maintenance costs for EE.
Failure to have appropriate coordination within project activities of each component.
Failure to trigger improved financing for energy efficient buildings. This will result in very slow uptake
of energy efficient buildings in the market. This also includes suggestions for mitigat ion measures to
deal with outlined risks to warrant successful implementation of this GEF project.

Table 18 : Project Risks and Adaptation
Assumptions
The assumptions for this project will centre on the continued commitment from both the government and the
private sector. Stakeholders and other participants clearly understand the roadmap and implementation plan
prepared by the Government. Experiences from the demonstration projects are communicated well to raise
awareness about energy efficiency
Key project assumptions:
The government’s commitment, private sector participation to implement new energy efficiency
building code and other energy efficiency programmes in buildings sector and concerned authorities
are willing to cooperate on imported appliance labelling and other import regulations.
The programme implementation is effective and achieves its objectives
It is assumed that mechanism or systems are developed to bridge the gaps available for collecting and
generating data
Risk Level of Risk Mitigating Actions
Lack of political support for energy
efficiency
Medium Involve and commitment of Government of Cabo Verde and
key decision makers in the project implementation from the
beginning
Lack of confirmed co financing from key
partners
Medium Involve key stakeholders in the project implementation from
the project inception stage and find alternative partners
No confirmed co- financing for
demonstration project
Medium Involve key partners for demonstration selection and
implementation. Select alternative demonstration projects if 6
months after the completion of the feasibility studies, co-
financing is not forthcoming.
Legislation does not pass into a law on
energy efficiency buildings and
appliances
Medium Government ministries should be involved from the project
inception stage and should be regularly updated about the
project progress
Lack of positive response from building
industry
Low Targeted capacity building efforts to initiate a positive
response from the industry
Involve all the stakeholders in all stages of the project
Poor energy performance of
demonstrated technologies, non
achievement of projects energy savings
selected demonstration projects
Low Targeted training programs for key professionals involved in
the demonstration projects (other activities leading to
removal of barrier to effective implementation of
demonstration projects)
Lack of coordination within project
components and activities
Medium Project director should be well informed about the project
development and ensure coordination mechanisms’
effectiveness. Project Manager should manage the activities
and coordination between components.
Increased cost of energy efficiency
measures
Medium Financial and fiscal incentives should be introduced as early
as possible to motive investment in energy efficiency
measures
Awareness raising and training should be done from the
beginning of the project, to make informed cost benefit
decisions
Improved energy efficiency financing for
buildings does not happen
High Banking sector should be involved as one of the stakeholder
from the project beginning

Stakeholders are willing to Co-finance for the demonstration project
Building industry is keen on improvements in BAU scenario of building construction industry
Financial institutions show a positive response to energy efficiency measures and are convinced of
expected benefits
EE measures and technologies will be incorporated efficiently and leading to marginal increase in cost
from BAU
Project management unit (PMU) will work efficiently to deliver project successfully
2. 5 INCREMENTAL REASONING: EXPECTED Global, National and Local Benefits
The proposed GEF project is aimed at targeting barriers, which are currently impeding the realization of
significant energy savings in the buildings and domestic appliances sector in Cabo Verde. Through this
project, the GEF will contribute to lifting institutional, policy, regulatory, and other strategic barriers to energy
efficiency in building and appliances.
Global Environment Benefits
The global environment benefits associated with this project are going to be significant. The project will
facilitate and influence actions that will result in the reduction of GHG emissions from the country’s buildings
sector by project end as compared to GHG emissions in a BAU scenario. Initial estimates suggest possible
savings of up to 1,158,180 MWh resulting from improved energy efficiency in Cabo Verde over a 10-year
period averaging out to approximately 115,818 MWh per year. With a grid factor of 0.492tCO2/MWh, this
suggests potential CO2 savings of some 703.9 ktCO2eover a 10-year lifetime or approximately 70.3ktCO2 per
year (top down approach).
Table 19 : Global Environment Benefits54
National and Local Benefits:
Among the key national benefits that the project will bring are:
Legislative and regulatory frameworks will be improved to promote energy efficiency in buildings
Significant savings in electricity in buildings sector, and corresponding CO2 emissions reduction in the
long term.
54 Refer annexure C for more detailed explanations on GHG calculations.
Global Benefits
Energy Savings
2015-2019 (Project) 463,272 MWh
2019 – 2025(Post-Project) 694,908 MWh
CO2 Emission Reductions
2015- 2019 (Project) 297.8ktCO2e
2015 – 2019 (Post-Project) 29,7 ktCO2e
2019 – 2025 (Post Project) 703.9ktCO2e

Access to comprehensive information on national energy balance, detailed consumption statistics and
related GHG’s emissions in building by major end-use (through inventory and well established DBMS)
Monitoring of energy efficiency in buildings sector will enable better evaluation and development of
new policies and strategies by the government
Significant capacity will be built and will increase pool of professionals to design energy efficient
buildings on a large scale
The improved access to financing for energy efficiency in buildings
Significant awareness will be generated amongst professionals, decision makers, and the general
public,
A number of design tools will be developed, including guidebooks, user manual and software tools
A large number of demonstration buildings will be constructed demonstrating energy efficiency best
practices
Households increase their purchasing capacity through reduced burden of electricity bills
Control demand growth and therefore limited government investment, fiscal deficit, and public debt
(considering most of the investment in power plants has been completed through credit and public
endowment).
New jobs and business opportunities on energy audits, trainers, design profess ionals, testing officials
etc.
2.6 Cost‐effectiveness
The project would contribute to both global environmental benefits and to national benefits, as synthesized
below. The direct project reduction of CO2 emissions targeted by the efficient energy use in buildings and
appliances is about297.80 ktCO2e. Considering the US$ 1,991,000 from the GEF ($72,600 + $ 1,918,400
Grant) as support for this project and the direct CO2 emission reductions from the actual energy efficiency
building demonstrations that will be implemented, the unit abatement cost is about US$ 6.4 per ton of CO2
reduced. On the other hand, the cost-effectiveness would be around US$ 2.7/ton CO2 if the conservatively
estimated indirect CO2 emission reductions were also considered. After all, most of the CO2 emission
reductions will actually be realized indirectly with the compliance to the energy efficiency building code and
energy efficient appliance S&L program. The project will help develop, approve, and enforce as well as
influence that the project would generate among the building sector stakeholders in incorporating energy
efficiency measures in the buildings that they design, construct, operate and manage/administer.
2.7 Sustainability and Replicability
The innovativeness of this project is that it will be targeting a sector, which has not been targeted before by
other donor-supported programs in Cabo Verde in any significant manner: Energy efficiency in buildings and
standards and labels for household appliances. Much of the attention related to reducing greenhouse gas
emissions in Cabo Verde has focused on renewable energy and in particular wind energy and solar PV.
In the lack of Demand Side Management policies and policy development in the area of energy efficiency,
large investments to satisfy the demand will be required. Investments in renewable energies needs to be
coupled with a clear energy efficiency policy to ensure the country will achieve its ambitious 100% renewable
target in a cost-efficient manner.

Replicability:
The proposed GEF project is designed to have a balanced mix of capacity building and dissemination
enabling environment activities made to country’s specific conditions, markets and regulatory environment.
Such balanced mix of activities is expected to promote the application of building energy efficiency
technologies. Replication is an integral component of the project design as the expected energy savings from
the application of energy efficiency technologies in Cabo Verde buildings (and the corresponding GHG
emissions reduction from the reduced electricity demand) rely on the replication of the relevant project
activities. This is an important part of the project strategy and is a reason for the emphasis put on information
and capacity building related activities.
Sustainability
Ensure sustainability of the project through the different outputs of the project components, e.g. the new laws
and regulations related to energy efficiency and a new national standards and labels program for energy
efficient appliances will transform the market by both encouraging and requiring greater levels of investment
and attention to energy efficiency measures. Both buildings sector and appliances sector in Cabo Verde are
expected to be transformed by the results of this project. The combination of new laws and regulations, a
national S&L programme, and several targeted demonstration projects should help in catalyzing new and
additional investment in more energy savings projects. By the end of the project implementation, it will create
a significant impact to the energy performance of the Cabo Verdean buildings sector.

Removing Barriers to Energy Efficiency in Cape Verdean built environment and for appliances Page 69
SECTION III: STRATEGIC RESULTS FRAMEWORK AND GEF INCREMENT
This project will contribute to achieving the following Country Programme Outcome as defined in CPAP or CPD: Institutions reinforce environmental governance and integrate principles of environmental sustainability, climate change and disaster relief reduction; public and private institutions adopt a holistic approach to conservation and protection of critical habitats and biodiversity.
Country Programme Outcome Indicators: % of public resources allocated to environment; Number of key sector strategies integrating environmental dimension.
Primary applicable Key Environment and Sustainable Development Key Result Area (same as that on the cover page, circle one): 1. Mainstreaming environment and energy OR 2. Catalyzing environmental finance OR 3. Promote climate change adaptation OR 4. Expanding access to environmental and energy services for the poor.
Applicable GEF Strategic Objective and Program: Climate Change Mitigation Objective 2: Promote market transformation for energy efficiency in industry and the building sector
Applicable GEF Expected Outcomes:
Appropriate policy, legal and regulatory frameworks adopted and enforced
Sustainable financing and delivery mechanisms established and operational
GHG emissions avoided
Applicable GEF Outcome Indicators:
Extent to which EE policies and regulations are adopted and enforced (score of 0 to 4)
Volume of investment mobilized
Tonnes of CO2 equivalent
Objective/Outcome or Output Indicator Baseline Targets
End of Project Source of verification Risks and Assumptions
Project Objective
The objective of the project is to
reduce energy consumption and
related GHG emissions in buildings
and household appliances in Cabo
Verde through introducing a range
of legislative and regulatory
measures and resulting in an
estimated indirect CO2 savings of
some 703.99 ktCO2over the 10-
year project lifetime.
Cumulative GHG
emissions reduced from
building sector and through
domestic appliances by
end-of project (EOP),
ktCO2e
0 297.8 M&E reports of the pilot/model
projects.
Reports and documents available
on code compliance,.
GHG national inventory (energy
sector) and national Energy
balance.
Risk:
Energy performance reports may
not be made available unless
mandated and they may not be
accurate Assumptions:
Government of Cabo Verde
commitment to energy efficiency
remains firm
All energy performance reports are
made available
Annual Reduction of
energy consumption in the
buildings and appliances,
MWh
0 115,818 Project implementation reports
Building sector energy database
GHG national inventory (energy
sector) and national Energy
balance and utilities report to
DGE.
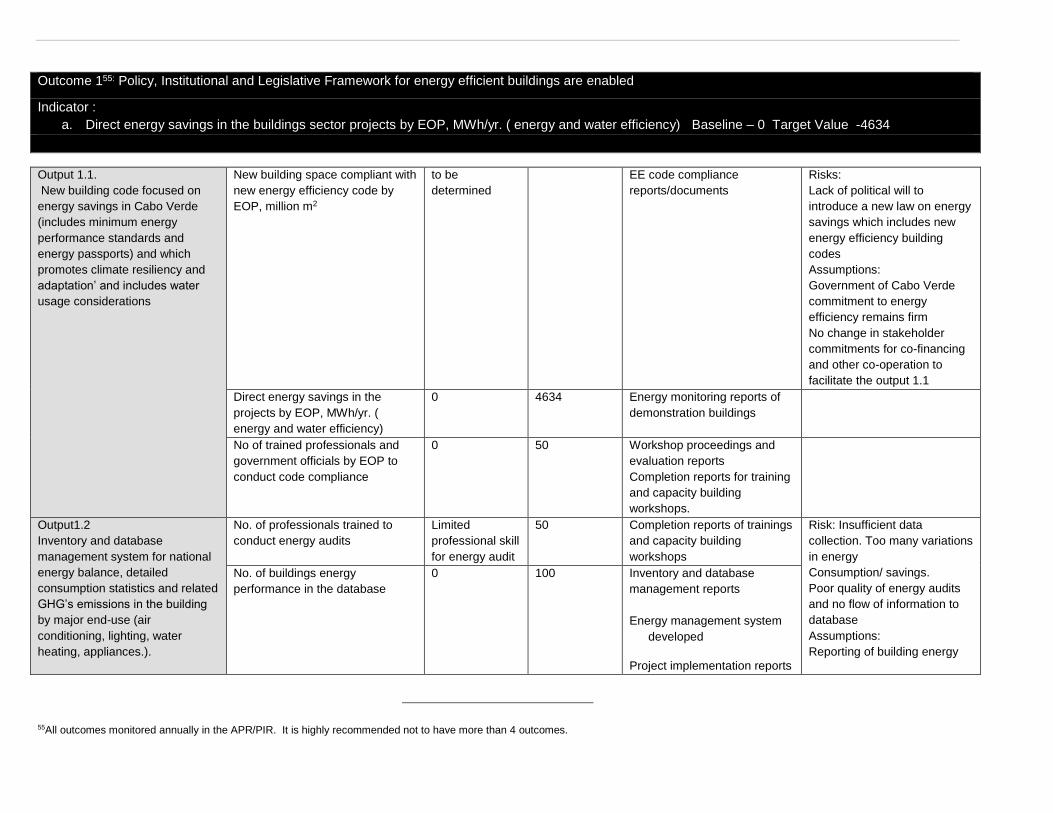
Output 1.1.
New building code focused on
energy savings in Cabo Verde
(includes minimum energy
performance standards and
energy passports) and which
promotes climate resiliency and
adaptation’ and includes water
usage considerations
New building space compliant with
new energy efficiency code by
EOP, million m2
to be
determined
EE code compliance
reports/documents
Risks:
Lack of political will to
introduce a new law on energy
savings which includes new
energy efficiency building
codes
Assumptions:
Government of Cabo Verde
commitment to energy
efficiency remains firm
No change in stakeholder
commitments for co-financing
and other co-operation to
facilitate the output 1.1
Direct energy savings in the
projects by EOP, MWh/yr. (
energy and water efficiency)
0 4634 Energy monitoring reports of
demonstration buildings
No of trained professionals and
government officials by EOP to
conduct code compliance
0 50 Workshop proceedings and
evaluation reports
Completion reports for training
and capacity building
workshops.
Output1.2
Inventory and database
management system for national
energy balance, detailed
consumption statistics and related
GHG’s emissions in the building
by major end-use (air
conditioning, lighting, water
heating, appliances.).
No. of professionals trained to
conduct energy audits
Limited
professional skill
for energy audit
50 Completion reports of trainings
and capacity building
workshops
Risk: Insufficient data
collection. Too many variations
in energy
Consumption/ savings.
Poor quality of energy audits
and no flow of information to
database
Assumptions:
Reporting of building energy
No. of buildings energy
performance in the database
0 100 Inventory and database
management reports
Energy management system
developed
Project implementation reports
55All outcomes monitored annually in the APR/PIR. It is highly recommended not to have more than 4 outcomes.
Outcome 155: Policy, Institutional and Legislative Framework for energy efficient buildings are enabled
Indicator :
a. Direct energy savings in the buildings sector projects by EOP, MWh/yr. ( energy and water efficiency) Baseline – 0 Target Value -4634

No. of energy audits carried out
annually
Limited energy
audit reports
15 Reports generated from
database
performance is consistent and
well understood by key
stakeholders
Output 1. 3 MRV Protocol to
measure energy savings, water
usage, and emission reductions in
public bildings
No. of professionals trained in the
building sector for MRV
0 25 Documentation on the training
courses; training reports
MRV approach report
Risk:
Limited qualified professionals
to develop MRV protocol
No. of buildings adopted MRV
protocol
0 30 Building MRV reports
Output 1.4 Amendments to
construction permit regulations to
include mandatory requirements
for minimum energy performance
standards and including robust
enforcement mechanism
No. of municipalities carrying out
mandatory enforcement of the
new energy efficiency code
compliance
No. of building permits approvals
processed according to new
EE code compliance
mechanism
Municipalities
are currently
responsible to
oversee the new
construction
Lack of
inspecting and
monitoring
mechanisms of
new
construction
5 Official notifications issued by
municipal bodies
Risk: Lack of continued
commitment of the key public
authorities and government
entities to develop and
implement effective energy
efficiency building policies and
practices
Non availability of qualified
staff to promote the new
energy efficiency code and
energy efficiency programs
Assumption: Key public
authorities are aware of the
need to learn on energy
efficiency code compliance
need. A continued support to
promote energy efficiency
code and other programs.
No of professionals and govt. staff
trained to conduct energy
efficiency code compliance
Limited capacity
for compliance
enforcement
60 Capacity building program
reports
No. of verified energy efficiency
code compliant buildings each
year project implementation EOP
Technical code
of buildings
(2012) and
contains few
provisions on
energy
efficiency
25 Documentation of revised
building permits
No. of accredited local authorities
(at municipal level) to validate and
verify mandatory energy efficiency
code compliance by EOP
0 5 Accredited local authorities list
available with DGE

Outcome 2: Energy-Efficiency improvements through Standards & Labelling for appliances
Indicator a) Direct energy savings in the appliances stock by EOP MWh/yr baseline – 0 , target value - 111,184 b) % Increase in sales of energy efficient appliances as a result of energy efficiency finance baseline – 0 , target value - 20%
Output 2.1 Labelling programme
for appliances imported into Cabo
Verde in line with ECOWAS
labelling programme
No. of verification and
enforcement procedures
developed in line with ECOWAS
labelling program
ECOWAS concept note
on S&L programs
available. No energy
efficiency policy for
refrigerators/freezers,
Air-conditioners etc.
1 New energy efficiency policy
draft for appliances
Risk: No motivation from
the market for energy
efficient appliances
Assumption:
Manufacturers are willing
to commit staff time for
appliance S&L training and
financial resources to
improve their products.
No of manufacturers, retailers and
consumers attend educational
workshop on energy efficiency
labels on appliances
No awareness on
energy efficiency label-
ling of appliances
Some awareness cam-
paigns implemented on
incandescent bulbs
targeting households
50 Education workshops reports
% Increase in sales of energy
efficient appliances with labelling
and certification
0 30% Sales data analysis report
Output 2.2 Regulations including
import regulations for energy-
efficiency standards for a first
selection of appliances
% Increase in import of energy
efficient appliances due to
developed new law and regulatory
changes
0 60% Import data from customs Risk: Lack of collaboration
on Customs officials to
implement new regulations.
Lack of continued Ministry
of Finance commitment to
introduce fiscal and
financial incentives.
No of trained energy efficiency
standard compliance and
enforcement officials
0 60 Workshop reports and
outcomes
Output 2.3Testing mechanism for
selected appliances to be
developed and established
% Increase in testing of
appliances as per new testing
mechanism developed
0 60% Appliance testing reports Risk: Limited capacity to
establish a national testing
mechanism for new
appliances and a
framework for labelling and
certification of appliances
No. of officials trained to conduct
and adopt periodic testing and re-
porting of selected appliances (as
per international testing
procedures)
0 25 Project implementation reports
Documentation on the training
courses; training reports

Output 2.4 National certification
procedures to promote energy
efficiency
% Increase in energy efficient
appliance sales through
certification procedures.
0 50% Annual sales report Risk: : Limited consumer
trust on the certification
procedure and label
system. Assumption:
appliances sales will
continue to increase
Output 2.5
Public awareness programme
and diffusion strategy, which
includes training seminars on the
new regulations for importers,
appliances distributor’s retail
chains, and the general public.
No of officials (manufactures,
retailers, customs officials) trained
to comply with new energy
efficient appliance law/regulation
Absence of awareness
raising campaign for
energy efficient
appliances
25 Training program reports
Documentation on the training
courses
Risk: Limited adherence of
importers and commerce to
the awareness raising
initiatives
Assumption: % Increase in consumers and
retailers understanding of trade-off
between higher purchase cost and
lower running cost of energy
efficient appliances
Limited awareness of
energy efficient
appliances benefits
40% Surveys reports of consumes
and retailer understanding and
perceptions of energy efficient
appliance. INE thematic
surveys or ADECO reports.
% Increase in local retailers and
distributors to market more
efficient appliances
Market for energy
efficient appliances is
non existential
40% Customs reports on volume of
energy efficient appliances
import
Output 2.5 Demand Side
Management program, run by the
national utility, built around a
“turn-in or exchange”
mechanism/modality
No. of professionals and state
officials trained on DSM programs
by EOP
Lack of information on
DSM programs
25 Risk: Limited adherence of
utilities, financing
institutions and retailers to
the program
Assumption: Retailers
and/or importers are
interested in turn-in
mechanism to increase their
sales
No. of energy audits carried out
annually
Few energy audit
reports available
15
No of pilot DSM programs
launched
No mechanism for
phasing out of
inefficient appliance
with some initiatives to
replace incandescent
2 Pilot program case study
documentation
No. of satisfied users of building
DSM program
0 25
Output 2.6
The most relevant financial
incentive is identified &introduced
in a pilot programme for the scale
up of energy efficient
refrigerators, air conditioners and
water heater.
No. of applicable project financing
schemes on energy efficient
appliances identified, designed
and launched during project
implementation
No data available on
energy efficiency
finance. No energy
efficient appliance
finance scheme
2 Documentation of the
designed financing scheme,
including implementation
mechanisms, and rules and
regulations EE finance
scheme launched
Risk: Limited awareness
and sensibility of financial
institutions and commerce
sector on the advantages
of supporting this type of
schemes.
Assumptions:
Banks/FIs are willing to
finance building energy
efficiency projects
% Increase in sales of energy
efficient appliances as a result of
energy efficiency finance
Absence of energy
efficiency finance
schemes
20% Sales data reports
Facility/mechanism
management agency report

Outcome 4: Additional investment mobilized in energy-efficiency as a result of the dissemination and replication activities.
Indicator :
a) % Increase in sales of energy efficient appliances during the project implementation baseline- 0 , target value 30%
b) % increase in number of energy efficiency buildings during and after project implementation baseline – 0 , target value 30%
Output 4.1 Elaboration of case
study guides and disseminated
among relevant audience
No of published comprehensive energy
efficiency buildings user manuals and
case study guides
No. of set of guidelines prepared on
energy efficient buildings for developed
and investors by EOP
User manual available
on sustainable
architecture
5
5
Project implementation
reports
User manual reports
Published guidelines for
energy efficient buildings
Risk: Failure to trigger
positive response from key
stakeholders and certified
practitioners
Assumption: Experts to
deliver trainings are
available and willingness of
the targeted stakeholders
to benefit from the training.
Accredited authorities
willing to cooperate on
energy efficiency in
buildings
Output4.2
Public awareness raising
campaign on standards and
labels
No of awareness raising
campaigns(websites, newsletters,
media outreach activities)
0 15 Consumer awareness
campaign reports
% Increase in sales of energy efficient
appliances during the project
implementation
0 30% Sales data reports
Output 4.3
Training of Key Building
Stakeholders (senior policy
makers, introduction of energy
efficiency technique and practices
in Vocational Training Schools
across the country) on energy
efficient buildings
No. of training courses conducted for
key stakeholders each year
Limited trainings for
energy efficiency
techniques
4 Documentation on the
training courses; training
reports
No. of vocational training /vocational
training schools or
courses/units/modules within university
programs
0 5 Vocational training
modules
Outcome 3 Energy efficiency solutions in a selection of public buildings through selected pilot demonstration projects
Indicator : Demonstration projects completed and energy efficiency best practices disseminated baseline – 0 , target value - 5
Output 3.1 Selection of at least 4
public buildings and2social
housing programmes for pilot
demonstration projects in energy
efficiency investment
No. of finalized and approved
demonstration project designs
(engineering and construction)
0 5 Documentation of
demonstration projects
No. of demo projects implemented
each year
0 2

Output 4.4
A thorough monitoring of the
impacts of the new energy
efficient requirement is
performed.
% Reduction in energy consumption
due to new energy efficiency
requirements
0 30% Documented monitoring
plan and audit reports
Output 4.6
Lessons learned study prepared
and disseminated
No. of sets of knowledge sharing
products developed by EOP
0 4 Launched knowledge
products

SECTION IV: TOTAL BUDGET AND WORK PLAN Award ID: 75997 Project ID(s): 87601
Award Title: Energy Efficiency
Business Unit: CPV10
Project Title: Removing Barriers to energy efficiency in the Cabo Verdean built environment and for appliances
PIMS no. PIMS 4996
Implementing Partner (Executing Agency) Directorate General for Environment (DGA), Directorate General of Energy
GEF Outcome/Atlas Activity
Responsible Party/Implementing Agent
Fund ID
Donor Name
Atlas Budgetary Account Code
ATLAS Budget Description
Annual Expenses (USD)
TOTAL(USD)
Notes
Year 1 Year 2 Year 3 Year 4
OUTCOME 1:
DGE 62000 GEF
71200 International Consultants 75,000 75,000 30,000 20,000 200,000 1
Policy , Institutional and Legislative Framework for energy efficient buildings are enabled
71300 Local Consultants 25,000 25,000 25,000 25,000 100,000 2
72100 Contractual services 30,000 30,000 20,000 20,000 100,000 3
72200 Equipments & Furniture 12,500 12,500 5000 5000 35,000 4
74200 Audio Visual & Printing Prod 12,500 12,500 2000 2000 29,000 5
71600 Travel 6,000 6,000 2,000 2,000 16,000 6
72500 Supplies 2,500 2,500 2,500 2,500 10,000
74500 Miscellaneous 2,500 2,500 2,500 2,500 10,000 7
Sub-total GEF 166,000 166,000 89,000 79,000 500,000
OUTCOME 2:
DGE 62000 GEF
71200 International Consultants 30,000 30,000 30,000 30,000 120,000 8
Energy-Efficiency improvements through Standards and Labelling for appliances are enabled
71300 Local Consultants 20,000 20,000 20,000 20,000 80,000 9
72100 Contractual services 30,000 30,000 20,000 25,000 100,000 10
71600 Travel 2,000 2,000 2,000 2,000 8,000 11
72200 Equipments & Furniture 13,000 13,000 3,000 3,000 32,000 12
74200 Audio Visual & Printing Prod 12,500 12,500 7.500 7.500 40,000 13
72500 Supplies 3,000 3,000 3,000 3,000 12,000
74500 Miscellaneous 2,000 2,000 2,000 2,000 8,000 7
Sub -Total GEF 112,500 112,500 87,500 87,500 400,000
OUTCOME 3
DGE 62000 GEF
71200 International Consultants 0 20,000 20,000 20,000 60,000 1
EE solutions in a selection of public buildings through selected pilot demonstration projects
71300 Local Consultants 0 13,333 13,333 13,334 40,000 2
72100 Contractual services 100,000 100,000 75,000 75,000 350,000 14
71600 Travel 0 5,000 5,000 5,000 15,000 15
72200 Equipments & Furniture 50,00 10,000 15,000 15,000 45,000 12
74200 Audio Visual & Printing Prod 5,000 15,000 25,000 30,000 75,000 16
72500 Supplies 0 5000 0 0 5,000 74500 Miscellaneous 0 0 5,000 5,000 10,000 7
Sub- Total GEF 110,000 168,333 158,333 163,334 600,000

OUTCOME 4:
DGE 62000 GEF
71200 International Consultants 25,000 25,000 25,000 25,000 1,00,000 1
Additional investment mobilized in energy-efficiency as a result of the dissemination and replication activities.
71300 Local Consultants 12,500 12,500 12,500 12,500 50,000 2
72100 Contractual services 15,000 15,000 15,000 15,000 60,000 3
71600 Travel 5,000 5,000 2,500 2,500 15,000 17
72200 Equipments & Furniture 5,000 5,000 10,000 10,000 30,000 18
74200 Audio Visual & Printing Prod 15,000 20,000 20,000 20,000 75,000 19
72500 Supplies 1,000 1,000 1,500 1,500 5,000 74500 Miscellaneous 0 0 2,500 2,500 5,000 7
Sub- Total GEF 80,000 85,000 87,500 87,500 340,000 Project
management unit
DGE
62000 GEF
71300 Local Consultants 13,600 13,600 13,600 13,600 54,400 2
71600 Travel 5,000 5,000 5,000 5,000 20,000 15
72200 Equipment & Furniture 1,000 1,000 1,000 1,000 4,000 4
Sub-Total GEF 19,600 19,600 19,600 19,600 78,400
4000 UNDP
71300 Local Consultants 20,000 20,000 20,000 20,000 80,000 2
71600 Travel 5,000 5,000 5,000 5,000 20,000 15
72200 Equipments & Furniture 10,000 10,000 9,080 10,000 39,080 4
74200 Audio Visual & Printing Prod ( communications) 10,000 10,000 15,000 10,000 45,000 19
72500 Supplies 1,000 1,000 1,920 2,000 5,920
74500 Miscellaneous
2,500 2,500 5,000 7
Sub- Total UNDP CO 50,000 50,000 50,000 45,000 195,000
MTIE
71300 Local Consultants 50,000 50,000 50,000 50,000 200,000 2
71600 Travel 15,000 10,000 10,000 6604 41,604 15
72500 Supplies 5,000 5,000 5,000 0 15,000
74500 Miscellaneous 0 10,000 5,000 0 15,000 7
Sub – Total MTIE 75,000 70,000 70,000 56,604 271,604
Total Project Management 144,600 139,600 138,680 121,204 544,084
TOTAL GEF 488,100 551,443 441,933 436,934 1,918,400
TOTAL UNDP( Co-finance , In Cash) 50,000 50,000 50,000 45,000 195,000
Total M & E Budget ( UNDP Co-finance, In Cash) 36,000
30,000 39,000 105, 000
TOTAL MTIE( Co-finance -In –Kind) 75,000 70,000 70,000 56,604 271,604
PROJECT TOTAL 649,100 671,433 591,933 577,538 2,490,0044

Removing Barriers to Energy Efficiency in Cape Verdean built environment and for appliances Page 78
Budget Notes 2490004
1. Hire consulting agency (joint venture/consortium) with building energy efficiency experts. The team of consultants will support the outcome of the proposed components 1, 3, and 4 as per the criteria’s met in the RFP (annex B). (International Consultants are budgeted for $ 2000/week)
2. The association should have local experts as part of the consortium and to work full time for project outcome. (National consultants are budgeted for $ 1000/week)
3. Local firms will be hired to perform contractual services(additional assessment and review of traditional building practices and materials)
4. Equipment includes testing equipment, computer hardware and software for certification and enforcement, auditing equipments, metering and monitoring equipments, office machinery, furniture etc.
5. Printing and reproduction of legal and technical documentation, communications and other equipment necessary to establish the building code, publications, promotional material etc.
6. The travel costs include the DSA and in‐country travels of the project staff and experts, travels of international and
local consultants. Travel and DSA related to sponsor participation of stakeholders from other islands to meetings and workshop is covered as well.
7. Miscellaneous ( insurance, warranty expense, bank charges, storage, staff welfare etc) 8. Hire consulting agency (joint venture/consortium) with expertise in standards and labelling program for appliances as
consultants. The team of consultants will support the outcome of the proposed components 2 and 4 as per the criteria’s met in the RFP (annex B).
9. Local consultants will be hired to support the development of standards and labeling program (budgeted at $ 1000/wk) 10. Contractual services to provide support in regional and national test facilities and implementation of DSM program 11. The travel costs include the DSA and travels of international and local consultants and budget for workshops and
training programs ( no. of workshops is given in results framework) 12. Equipment includes computer hardware and software, stationery, premises , testing materials 13. Communication and audio‐visual equipment, used during the training, workshop and other dissemination activities of
this outcome 14. Contractual services to incorporate EE measures in buildings ( design consultants, EE material procurements, Efficient
lighting and HVAC systems, building commissioning , M& V ), to develop and launch accreditation program, 15. The travel costs include the DSA and travels of international and local consultants 16. Communication and audio‐visual equipment, used during the training, workshop and other dissemination activities of
this outcome 17. The travel costs include the DSA and travels of international and local consultants 18. Testing equipment for LEC labs etc.
19. Communication and audio‐visual equipment, used during the training ( capacity building for LEC), workshop and other
dissemination activities of this outcome, launch of study guides, best practice guidelines , budget for websites, user manuals, posters, documentation and videos, implementation of EMS system.

Removing Barriers to Energy Efficiency in Cape Verdean built environment and for appliances Page 79
Table 20: Budget per Component
Table 21 : Summary of Funds
Category USD Components
1 2 3 4 5 ( GEF+UNDP+MTIE+ M&E)
International Experts 480,000 200,000 120,000 60,000 100,000 -
National consultants 604,400 100,000 80,000 40,000 50,000 334,400
Contractual Services 610,000 100,000 100,000 350,000 60,000 -
Travel 135,604 16,000 8,000 15,000 15,000 81,604
Equipments & Furniture 185,080 35,000 32,000 45,000 30,000 43,080
Audio Visual & Printing Prod (communications) 264, 000 29, 000 40,000 75,000 75,000 45,000
Supplies 52,920 10,000 12,000 5,000 5,000 20,920
Miscellaneous 53, 000 10,000 8,000 10,000 5,000 20, 000
M& E 105,000 36,000
30,000 39,000
Total 2,490,004 500,000 400,000 600,000 340,000 544,084
Project Component GEF UNDP MTIE ECREEE APP UNICV Total (USD)
Component 1: Enabling policy, institutional, and legislative
framework for energy efficiency in buildings 500,000
2,000,000.04 1,000,000 50,000
3,550,000.04
Component 2: Enabling energy efficiency improvements
through S&L for appliances 400,000
530,865.1 1,050,000 450,000
2,430,865.1
Component 3: Energy efficiency solutions in a selection of
public buildings through selected pilot demonstration projects 600,000
191,737.2 1,400,000 62,316 313,346 2,567,399.2
Component 4: Replication and Dissemination 340,000
1,917,130 450,000 50,000 2,757,130
Project Management
78,400 (includes
DPC of $24,
276)
195, 000 271,604
544,084
M & E Budget
105,000
105,920
TOTAL 1,918,400 300,000 4,911,336.30 3,900,000 612,316 313,346 11,955,398.3

Table 22 : Work Plan
Expected Outputs Activities I II III IV I II III IV I II III IV I II III IV
Data collection for baseline formulation
Code Structure and scope
Code Stringency
Compliance forms and users manuals
Identification and classification of buildings
Energy , GHG and water end use mapping for buildings in the country
Policy mechanism for periodic update and reporting of data for existing buildings
Incorporation of energy code in the construction plan approval process
Expected Outputs Activities I II III IV I II III IV I II III IV I II III IV
Design of informative labels for appliances
Selection of appropriate testing procedure for each appliance
Setting labeling threshold and range for each labeled appliance
Developing an implementation plan for mandatory S& L Program
Incorporating labeling requirements in import and sales regulations
Requirement for MRV of sales and actual performance
Engagement of national and regional test facilities for testing labeled appliances
Periodic testing and reporting of labeled appliances
2.4 National certification procedures to promote
energy efficiency
Design of a national certification program for selected appliances
2.5 Public awareness programme & diffusion
strategy, which includes training seminars on the
new regulations for importers, appliances
distributors retail chains, and the general public.
Design of comprehensive awareness program for key stakeholders - importers , retailers,
consumers, enforcement agencies
Developing an incentive mechanism for exiting inefficient appliances through DSM
program phasing out
Implementing DSM for selected appliances with the most saving potential
2.7 The most relevant financial incentive is
identified &introduced in a pilot programme for
the scale up of EE refrigerators, air conditioners
& water heater.
Fiscal incentive program for import of super-efficient appliances and for large scale
replacement program
Year 2 Year 3 Year 4
2.2 regulations including import regulations for
energy-efficiency standards for a first selection
of appliances
1.2 Inventory & database management
system for national energy balance, detailed
consumption statistics & related GHG’s
emissions in the building by major end-use (air
conditioning, lighting, water heating,
appliances.).
1.3 MRV Protocol to measure energy savings,
water usage, and emission reductions in public
buildings
Technical requirements for MRV for each building type
1.4 Amendments to construction permit
regulations to include mandatory requirements
for minimum energy performance standards and Inspection and reporting mechanism for new building construction
Component 2: Energy-Efficiency improvements through Standards & Labeling for appliances Year 1 Year 2 Year 3 Year 4
2.1 Labeling programme for appliances imported
into Cape Verde in line with ECOWAS labeling
programme
1.1 New building code focused on energy
savings in Cape Verde ( includes minimum
energy performance standards and energy
passports) and which promotes climate
resiliency and adaptation’ and includes water
usage considerations
Component 1: Enable Policy , Institutional and Legislative Framework for EE builidngs Year 1
2.3 Testing mechanism for selected appliances to
be developed and established
2.6 Demand Side Management program, run by
the national utility, built around a “turn-in or
exchange” mechanism/modality

Expected Outputs Activities I II III IV I II III IV I II III IV I II III IV
Identification of pilots based on national survey and inventory , through a competitive
selection process ( New and Existing buildings)
Implementing EE measures
3.2 Building Stakeholders (architects,
engineers, designers, developers, financial
institutions)trained to monitor energy
performance / water usage at the selected
buildings in accordance with database
management system
Developing a training and certification program for EE design , Audit and skilled
tradesmen
Documenting demo programs - published case study , documentary etc.
Annual reporting of results and accessible on public domain
Expected Outputs Activities I II III IV I II III IV I II III IV I II III IV
4.1 Elaboration of case study guides and
disseminated among relevant audience.
Develop EE case study guides and EE best practice user guides
4.2 Public awareness raising campaign on standards
and labels
Develop awareness raising campaign for end users , retailers and distributers on S& L program for
imported appliances ( websites, media outreach etc)
Conducting training courses and workshops for key building stakeholders for EE building design
Develop vocational training programs and develop EE best practices modules for university
curriculum
4.4 A thorough monitoring of the impacts of the new
energy efficiency requirement is performed.
Develop a monitoring plan to assess the demonstration projects and evaluate the pilot
performances
4.5 Regular update of the legislation in order to
tighten energy efficiency is introduced to transform
further the appliance market & building practices.
Develop standards to increase the stringency level for EE appliances and for buildings (REACH
standard)
4.6 Lessons Learned study prepared and disseminated Develop and publish EE best practice user manuals
Componenet 3 : Energy efficiency solutions in a selection of public buildings through selected pilot demonstration projectsYear 1 Year 2 Year 4
3.1, Selection of at least 4 public buildings & 2
social housing programmes for pilot
demonstration projects in EE investment
3.3 Monitoring and Reporting System of energy
performance / water usage for the demonstration
projects
Component 4: Replication & Dissemination
Year 1 Year 2 Year 3 Year 4
Year 3
4.3 Training of Key Building Stakeholders (senior
policy makers, introduction of EE technique &
practices in Vocational Training Schools across the
country) on EE buildings

SECTION V: MANAGEMENT ARRANGEMENTS 5.1 Project Organization Structure
The project will be nationally implemented (according to the UNDP NIM implementation modality) by the DGE
and will be responsible for the achievement of the project results as the implementing partner (national
implementing partner). Both UNDP and DGE will together form a project management board which will meet
once a year to oversee the project implementation, and approve the annual budget. Other stakeholders who will
participate on the Project Management Board will include (OAC, National Land Management Institute(INGT),
Ministry of Finance and Planning, DG Customs, DG Environment, OE (Ordem dos Engenheiros), Chambers of
Commerce, DG Industry and Commerce, Quality Management & Intellectual Property Institute( ; National
Municipality Association ( ANMCV), Association of the Building sector companies; ECREEE; LEC). UNDP
national team and regional technical advisors will provide overall management and guidance from its Cabo
Verde country office and will be responsible for monitoring and evaluation of the project as per GEF and UNDP
requirements.
Establish a project management unit (PMU) to implement the project, which will be housed under the DGE. The
structure of the PMU is provided in Figure 27.The PMU will report to a senior government official as the national
project director (NPD), designated by the DGE. The NPD will be responsible for overall strategic guidance to
the project management, including approval to the annual work plan and achievement of planned results as
outlined in the ProDoc, use of UNDP transferred funds through effective management and well established
project review and oversight mechanisms. The NPD will also ensure coordination with various ministries and
agencies provide guidance to the project team to coordinate with UNDP, and to look after the administrative
arrangements required under the Cabo Verde government and the UNDP.
The project will appoint a full time national project manager (NPM) to coordinate all the activities undertaken by
the project management unit, and coordinate the timely implementation of the project components. The NPM
will primarily be responsible for the day-to-day management of the project operations covering the
administrative, financial and operational aspects of the project component implementation. A full-time Project
Assistant will support the national project manager (NPM). Service provider agencies (firm, joint venture or
consortium) each for building and appliances will be selected for providing technical assistance in activities that
will be carried out in all relevant project components. The consulting agency will comprise of international and
national experts and will implement the project area component. Efforts shall be made to mobilize NPM and the
consulting agency for the full project tenure as GEF –funded full- time employment to ensure availability until
the end of the project. As needed, adequate numbers of contractual services in different disciplines will be
associated on long-term or short-term time basis depending on the requirements. The job description and ToRs
for the PMU positions are enclosed in Annex C.
Two project technical committees –i) Energy efficiency building codes and for ii) energy efficient appliances
shall be constituted, and will meet once every three months to consider the quarterly work plans. These
technical committees will be responsible for making management decisions for the project component in
particular when guidance is required by the project manager. The Project Steering Committee (PSC) will play a
critical role in project monitoring and evaluation by quality assurance, using evaluations for performance
improvement, accountability and learning, and ensuring that required resources are committed and providing
overall direction to the project team. The PSCs will consider and approve the quarterly plans and any deviations
from the original plan. The PSCs will consist of heads of relevant stakeholders. The team members will include
distinguished stakeholders who will advise the project team on technical issues, and issues related to each
component output. The project steering committee will be established and chaired by the DGE to provide
support and advice to the PMU and other committees as and when needed. The committee members will
include heads of all other relevant government departments.

FIGURE 28: Project Organizational Structure
Project Management Board
GEF Executing Agency - UNDP Implementing Partner –DGE
PROJECT MANAGEMENT UNIT (PMU)
DG (Energy) /National Project Director
National Steering Committee
Chaired by: DGE and the
National Project Director
Members: Heads, All other
Govt. departments
(DGCI; CCIS; ELECTRA; AEB;
IGT; IGQ, INMG; National
Municipality Association
(ANMCV); UNI-CV; DGA;
ECREEE; LEC)
UNDP COUNTRY OFFICE
Consulting Firm (EE
Buildings) - International
and national experts
Full time National Project Manager
Technical Committee(s) (EE Appliance)
Members: Heads of relevant Organizations
DGCI; CCIS, CCIAB;
Technical Committee (EE Buildings)
Members: Heads of relevant Organizations
DG Infrastructures; DG Patrimonio do Estado; DGA;
LEC
Working Group (s)
Members: All Relevant
Stakeholders
Working Group(s)
Members: All Relevant
Stakeholders
Consulting Firm (EE
Appliances) -
International and
national experts
Contractual services
Full time National Project Assistant

SECTION VI: MONITORING FRAMEWORK AND EVALUATION
The project will follow all standard UNDP activities for monitoring and reporting including project inception
workshop, annual PIR report, mid-term evaluation, and final evaluation..
Project start:
A Project inception workshop will be held within the first 2 months, and after the hiring of the national project
manager and with those with assigned roles in the project organization structure, UNDP country office and
where appropriate/feasible regional technical policy and programme advisors as well as other stakeholders.
The inception workshop is crucial to building ownership for the project results, review and confirm the SMART
of the indicators chosen and to plan the first year annual work plan. The inception workshop should address a
number of key issues including:
Assist all partners to fully understand and take ownership of the project. Detail the roles, support services and
complementary responsibilities of project team and UNDP CO. Discuss the roles, functions, and responsibilities
within the project's decision-making structures, including reporting and communication lines, and conflict
resolution mechanisms. The terms of reference (TOR) for project staff will be discussed again as needed.
Based on the project results framework and the relevant GEF climate change tracking tool if appropriate,
finalize the first annual work plan. Review and agree on the indicators, targets and their means of verification,
and recheck assumptions and risks. Provide a detailed overview of reporting, monitoring and evaluation (M&E)
requirements. The M &E work plan and budget should be agreed and scheduled. Discuss financial reporting
procedures and obligations, and arrangements for annual audit.
Plan and schedule project board meetings. Roles and responsibilities of all project organization structures
should be clarified and meetings planned. The first project board meeting should be held within the first 12
months following the inception workshop.
An inception workshop report is a key reference document and must be prepared and shared with participants
to formalize various agreements and plans decided during the meeting.
Quarterly Review:
Progress made shall be monitored in the UNDP enhanced results based management platform. Based on the
initial risk analysis submitted, the risk log shall be regularly updated in ATLAS. Risks become critical when the
impact and probability are high. Note that for UNDP GEF projects, all financial risks associated with financial
instruments such as revolving funds, microfinance schemes, s are automatically classified as critical on the
basis of their innovative nature (high impact and uncertainty due to no previous experience justifies
classification as critical).
Project Manager is responsible to report on progress on UNDP’s country office progress report. This information
will be recorded on the Atlas platform. Based on the information recorded in Atlas, a Project Progress Reports
(PPR) can be generated in the executive snapshot. Other ATLAS logs can be used to monitor issues, lessons
learned etc. The use of these functions is a key indicator in the UNDP executive balanced scorecard.
Annual Review:
Project Implementation Reports (APR/PIR): This key report is prepared to monitor progress made since project
start and in particular for the previous reporting period (30 June to 1 July). The APR/PIR combines both UNDP
and GEF reporting requirements. The APR/PIR includes, but is not limited to, reporting on the following:

Progress made toward project objective and project outcomes - each with indicators, baseline data and
end-of-project targets (cumulative)
Project outputs delivered per project outcome (annual).
Lesson learned/good practice.
AWP and other expenditure reports
Risk and adaptive management
ATLAS QPR
Rating and comments on progress (Development objectives) and Implementation Progress by Project
Manager, UNDP CO, UNDP Regional Technical Advisor , GEF Operation Focal Point, National
Implementing agency lead and Key partner.
Portfolio level indicators (i.e. GEF focal area tracking tools) are used by most focal areas on an annual
basis as well.
Periodic monitoring through site visits:
UNDP CO jointly with Project Management Unit and the UNDP Regional Coordinating Unit (RCU) will conduct
visits to project sites based on the agreed schedule in the project's inception report/AWP to assess first hand
project progress. Other members of the Project Board may also join these visits. A Field Visit Report/BTOR
will be prepared by the CO and UNDPRCU and will be circulated no less than one month after the visit to the
project team and Project Board members.
Mid-term of project cycle:
The project will undergo an independent mid-term evaluation at the mid-point of project implementation, which
means approximately two years after the project has started. The mid-term review will determine progress
being made toward the achievement of outcomes and will identify adaptive management, as required. It will
focus on the effectiveness, efficiency and timeliness of project implementation; will highlight issues requiring
decisions and actions; and will present initial lessons learned about project design, implementation and
management. Incorporate findings of this review as recommendations for enhanced implementation during the
final half of the project’s term. The organization, terms of reference and timing of the mid-term evaluation will
be decided after consultation between the parties to the project document. The Terms of Reference for this
Mid-term evaluation will be prepared by the UNDP CO based on guidance from the RCU and UNDP-GEF. The
management response and the evaluation will be uploaded to UNDP corporate systems, in particular the UNDP
Evaluation Office Evaluation Resource Centre (ERC). The relevant GEF Focal Area Tracking Tools will also be
completed during the mid-term evaluation cycle.
End of Project:
An independent final evaluation will take place three months prior to the end of the project and will be
undertaken in accordance with UNDP and GEF guidance. The final evaluation will focus on the delivery of the
project’s results as initially planned (and as corrected after the mid-term evaluation, if any such correction took
place). The final evaluation will look at impact and sustainability of results, including the contribution to capacity
development and the achievement of global environmental benefits/goals. The TOR for this evaluation will be
prepared by the UNDP CO based on guidance from the RCU and UNDP-GEF.
The final evaluation should also provide recommendations for follow-up activities and requires a management
response, which should be uploaded to PIMS and to the UNDP ERC. The relevant GEF Focal Area Tracking
Tools will also be completed during the final evaluation.

During the last three months, the project team will prepare the Project Terminal Report. This comprehensive
report will summarize the results achieved (objectives, outcomes, outputs), lessons learned, problems met and
areas where results may not have been achieved. It will also make recommendations for any further steps that
may need to be taken to ensure sustainability and Replicability of the project’s results.
Learning and knowledge sharing:
Results from the project will be disseminated within and beyond the project intervention zone through existing
information sharing networks, communities of practice and forums.
The project will identify and participate, as relevant and appropriate, in scientific, policy-based and/or any other
networks, which may be of benefit to project implementation though lessons learned. The project will identify,
analyze, and share lessons learned that might be beneficial in the design and implementation of similar future
projects. Finally, there will be a two-way flow of information between this project and other projects of a similar
focus.

Table 23 : M& E work plan and budget
Type of M&E activity Responsible Parties
Budget US$
Excluding project team staff
time
Time frame
Inception Workshop
and Report
Project Manager
Project Assistant
UNDP CO, UNDPGEF
Indicative cost: $10,000 Within first two months
of hiring of national
project manager
Measurement of
Means and Verification
of project results.
UNDPGEFRTA/Project Manager will
oversee the hiring of specific studies and
institutions, and delegate responsibilities
to relevant team members.
Indicative cost: $ 20,000
(To be finalized in Inception
Phase and Workshop)
Start, mid and end of
project (during
evaluation cycle) and
annually when
required.
Measurement of
Means of Verification
for Project Progress on
output and
implementation
Oversight by Project Manager
Project team
Indicative cost: $6,000
(To be determined as part of
the Annual Work Plan's
preparation)
Annually prior to
ARR/PIR and to the
definition of annual
work plans
ARR/PIR Project manager and team
UNDPCO
UNDPRTA
UNDP EEG
Already included in the
PMU cost
Annually
Periodic status/
progress reports
Project manager and team Already included in the
PMU cost
Quarterly
Mid-term Review Project manager and team
UNDP CO
UNDPRCU
External Consultants (i.e. evaluation
team)
Indicative cost: $30,000 At the mid-point of
project implementation.
Final Evaluation Project manager and team,
UNDP CO
UNDPRCU
External Consultants (i.e. evaluation
team)
Indicative cost: $36,000 At least three months
before the end of
project implementation
Project Terminal
Report
Project manager and team
UNDP CO
Local consultant
None
At least three months
before the end of the
project
Audit UNDP CO
Project manager and team Indicative cost: $ 3,000
Yearly
Visits to field sites UNDP CO
UNDPRCU (as appropriate)
Government representatives
For GEF supported projects,
paid from IA fees and
operational budget
Yearly
TOTAL indicative COST
Excluding project team staff time and UNDP staff and travel
expenses (comes from UNDP contribution)
US$ 105,000
(+/- 5% of total budget)

SECTION VII: LEGAL CONTEXT
This document together with the CPAP signed by the Government and UNDP, which is incorporated by
reference, constitute together a Project Document as referred to in the SBAA [or other appropriate governing
agreement] and all CPAP provisions apply to this document.
Consistent with the Article III of the Standard Basic Assistance Agreement, the responsibility for the safety and
security of the implementing partner and its personnel and property, and of UNDP’s property in the
implementing partner’s custody, rests with the implementing partner.
The implementing partner shall:
put in place an appropriate security plan and maintain the security plan, taking into account the security
situation in the country where the project is being carried;
Assume all risks and liabilities related to the implementing partner’s security, and the full implementation
of the security plan.
UNDP reserves the right to verify whether such a plan is in place, and to suggest modifications to the plan when
necessary. Failure to maintain and implement an appropriate security plan as required hereunder shall be
deemed a breach of this agreement.
The implementing partner agrees to undertake all reasonable efforts to ensure that none of the UNDP funds
received pursuant to the Project Document are used to provide support to individuals or entities associated with
terrorism. The recipients of any amounts provided by UNDP hereunder do not appear on the list maintained by
the Security Council Committee established pursuant to resolution 1267 (1999). The list can be accessed via
http://www.un.org/Docs/sc/committees/1267/1267ListEng.htm. This provision must be included in all sub-
contracts or sub-agreements entered into under this Project Document.

ANNEXURES Annex A: List of stakeholders consulted
Directorate General for Energy (DGE)
Ministry of Tourism, Industry, and Energy (MTIE)
The General Directorate for Industry and Commerce (DGIC)
The General Directorate of Tourism (DGT)
General Directorate of Environment (DGA)
Ministry of Environment, Housing and Land Management
Institute of Meteorology and Geophysics (INMG)
DG Customs- Ministry of Finance
National Municipality Association (ANMCV)
ELECTRA
Economic Regulatory Agency (ARE)
Regional Centre for Renewable Energy and EE (ECREEE)
Directorate General of Infrastructure & General Inspection
(DGI). Ministry of Infrastructure and Maritime Economy
National Land Management Institute (INGT)
OAC- Chamber of Architects
OECV- Chamber of Engineers
National Institute of Quality Management and Intellectual property
Uni-Cv: Public University
Luxembourg Development Agency -(LUXDEV)
The European Union (EU) –
IFH (Housing Development Institute)
Chamber of Commerce Industries and Services Sotavento (CCISS)
Engineering Laboratory Cabo Verde (LEC)
Private Sector Partner/(s)

Annex B: Terms of Reference for Key Project Personnel
Terms of Reference: National Project Director
A national project director (NPD) will appoint the DGE to oversee the project implementation and progress. The
person will be a government’s representative and is holding a senior position in the government’s hierarchy.
Duties and Responsibilities
The National Project Director shall be tasked for:
To provide overall guidance to the national project manager (NPM) and the Project Management Unit (PMU)
Mobilizing national institutional mechanisms for smooth progress of the project
Providing direction and guidance on project-related issues and providing guidance to the project team
Ensuring result-oriented planning and implementation
Review project budget revisions, annual progress reports, quarterly progress reports, annual work plan,
facilitate audit and other administrative arrangements as required by DGE and UNDP
Facilitate, mid-term review and, terminal evaluation facilitate implementation of recommendations, , support
dissemination of lessons learned and capture policy implications
Ensure timely progress of activities and project implementation as per the project document
Reporting the project progress to the national steering committee and seek approval for any
modifications/revisions to the project document as recommended
Managing the project finances in line with GEF -UNDP guidelines and approve expenditure as provided for in
the project budget and according to national procedures ( Treasury and Finance; and Ministry level
Directorate General of Budget, management and planning ( DGPOG)
Approving annual project reports and knowledge products for submission to NSC and UNDP
Approving payments according to the agreed deliverables
Being responsible for the preparation and submission of the Annual Progress Report (based on AWP);
Project Implementation Report (PIR), Quarterly Operational Reports for submission to the Executing Agency
and UNDP
Terms of Reference: National Project Manager
Under the direct supervision of the UNDP country office and established project management unit, national
project manager (NPM) will be responsible for the day-to-day management and implementation of the UNDP-
GEF project, including all project administrative matters. The manager’s work will be carried out in line with the
country program action plan and in full compliance with the UNDP rules and regulations. The management and
coordination process will be pursued through undertaking appropriate actions in program formulation,
implementation and evaluation.
Scope of work
Manage the project implementation in accordance with objectives, schedule and planned budget.
Manage all project activities, staff, consultants etc., for timely implementation of requirements on monitoring
and evaluation.

Review and approve Terms of reference for technical assistances call for tenders, request for proposals and
procurement process
Ensure transparent and effective procurement process and proposals reviews
Ensure timely preparation of annual project reports, working plans and other relevant project documents.
Coordinate and manage inception workshop and preparation of inception report. Technically prepare steering
and technical committees meetings and secretariat the meetings’ chair..
Oversee day-to-day planning, implementation and monitoring of project activities.
Disbursement of funds, maintenance of accounts as per requirements of UNDP and provide inputs to internal
and external audits.
Liaise with counterparts and main stakeholders for ensuring their roles are appropriately integrated in the
project as envisaged.
Provide team leadership and guidance to the energy efficiency building code development/ S&L appliances
consulting firms.
Liaise with institutions at central, state and municipal level to ensure proper dissemination of the new project
outcomes.
Coordinate the project component activities and manage project deliverables.
Coordinate demonstration project component and ensure effective implementation.
Prepare and approve terms of reference for subcontracts and for equipment procurement
Qualifications
Advanced university degree /advances management degree (MBA)and at least 7 years of professional
experience in energy management/ environmental policy and/or energy efficiency, including extensive
knowledge of the international context.
Experience in managing projects of similar complexity and nature, including demonstrated capacity to actively
explore new, innovative implementation and financing mechanisms to achieve the project objective.
Extensive experience in project management with adequate exposure to buildings and appliances.
Demonstrated experience and success in the engagement of, and working with private sector and NGOs,
creating partnerships and leveraging financing for activities of common interest.
Strong analytical and problem-solving skills and experience with adaptive management with prompt action on
the conclusion and recommendations coming out from the project’s regular monitoring and self-assessment
activities as well as from periodical external evaluations.
Ability and demonstrated success to work in a team, to effectively organize work, motivate members and
other project counterparts to effectively work towards the project’s objective and expected outcomes.
Good communication skills and competences in handling the project’s external relations at all levels.
Good knowledge and fluency of English and Portuguese languages.
Strong information technology skills and experience with using Microsoft Office is essential.
Terms of Reference: National Project Assistant
Scope of work
Provide assistance to project manager in accordance with objectives, schedule and planned budget
Coordinate and assist inception workshop and preparation of inception report
Provide all administrative support to the project manager.
Coordinate the project component activities and manage project deliverables.
Coordinate and assist the project manager in demonstration project component.

Terms of Reference: National Technical Committee
One project board and two-project working group committee each for buildings and appliances will be
constituted during the project implementation. The Project working group committee will be responsible for
making – by consensus – technical decisions for the project when guidance is required by the NPM, including
recommendation for UNDP/Implementing Partner approval of project plans and revisions. In order to ensure
UNDP’s ultimate accountability, project working group decisions should be made in accordance with standards
that ensure management for development results, best value for money, fairness, integrity, transparency and
effective international competition.. In addition, the project-working group plays a critical role in UNDP-
commissioned project evaluations by quality assuring the evaluation process and products, and using
evaluations for performance improvement, accountability and learning.
Project reviews by the working group committee are made at designated decision points during the running of
the project, or as necessary when raised by the PMU. This group is consulted by the PMU for decisions when
PMU's tolerances (normally in terms of time and budget) have been exceeded (flexibility). Based on the
approved annual work plan, the working group may review and approve project quarterly plans when required
and authorizes any major deviation from these agreed quarterly plans. It is the authority that signs off the
completion of each quarterly plan as well as authorizes the start of the next quarterly plan. It ensures that
required resources are committed and arbitrates on any conflicts within the project or negotiates a solution to
any problems between the projects and external bodies. In addition, it approves the appointment and
responsibilities of the PMU and any delegation of its project assurance responsibilities.
Request for Proposal (RFP) – Buildings
Appointment of an agency for removing barriers for energy efficiency in Cabo Verde building sector
Detailed Scope of Work
Energy efficiency policies, legislation and secondary regulations are adopted and are put in place and
strengthened regulatory framework results
Develop a new building code focused on energy savings in Cabo Verde (including minimum energy
performance standards and energy passports), promoting climate resiliency and adaptation’ and including
water usage standards (efficiency, recycling and reuse).
Develop inventory and information system for national energy balance, detailed consumption statistics
and related GHG emissions by building category and major end-use (air conditioning, lighting, water
heating, water pumping, and lighting appliances).
Propose MRV protocol to measure energy savings, water usage, and emission reduction in public
buildings.
Develop implementation strategy for amendments to construction permit regulations; include mandatory
requirements for minimum energy and water performance standards and develop robust enforcement
mechanism.
Energy efficiency solutions in selection of public buildings through selected pilot demonstration projects
Provide assistance in selection of demonstration projects for energy efficiency investment
Develop training and certification programs for building stakeholders
Provide training to monitor energy performance, water usage at the selected buildings in accordance with
information systems

Develop monitoring and reporting system of energy performance/water usage for the demonstration
projects
Replication and Dissemination
Prepare case study guides and strategies to disseminate among relevant audience
Conduct training programs for key stakeholders on energy efficient buildings
Perform monitoring of the impacts of the new energy efficiency requirement
Develop framework to regularly update the legislation in order to tighten energy efficiency to transform
further the building practices.
Deliverables
Energy efficiency building code: Baseline data collection, baseline analysis report, code structure and
scope, code stringency analysis, code compliance mechanism, user manuals and training programs,
stakeholder consultations, draft code for energy efficiency in buildings
Technical Assistance Pilot demonstration projects: Pilot selection criteria and feasibility, training and
certification program, pilot project demonstration on energy efficiency measures
Replication and dissemination: Case study guides and energy efficiency user guide, awareness raising
programs, develop and publish energy efficiency best practice user manuals
Eligibility Criteria
The service provider should have completed assignments of minimum cumulative total of USD five
hundred thousand ($ 170,000 in energy efficiency/ conservation/Audits/Project management
services/training programs in total over last three financial years)
The service provider should have minimum 7 years of experience in energy efficiency programs, projects
or policy level and/or technical assistance for energy efficiency in buildings, energy conservation/
audits/project management services
Familiarity with energy efficiency issues ,policy measures in small islands developing states (SIDS) ,
and/or Africa and in particular West Africa
Significant experience in developing and conducting training programs for energy efficiency measures,
energy auditing, MRV etc.
Key experts should have post graduate qualification in relevant field e.g. Energy management /energy
policy/ environmental policy/ or equivalent qualifications, with minimum 7 year post qualification
experience in energy efficiency
Other team members should be engineering graduate and/or post graduate in energy related field with 3
years of experience in energy efficiency buildings
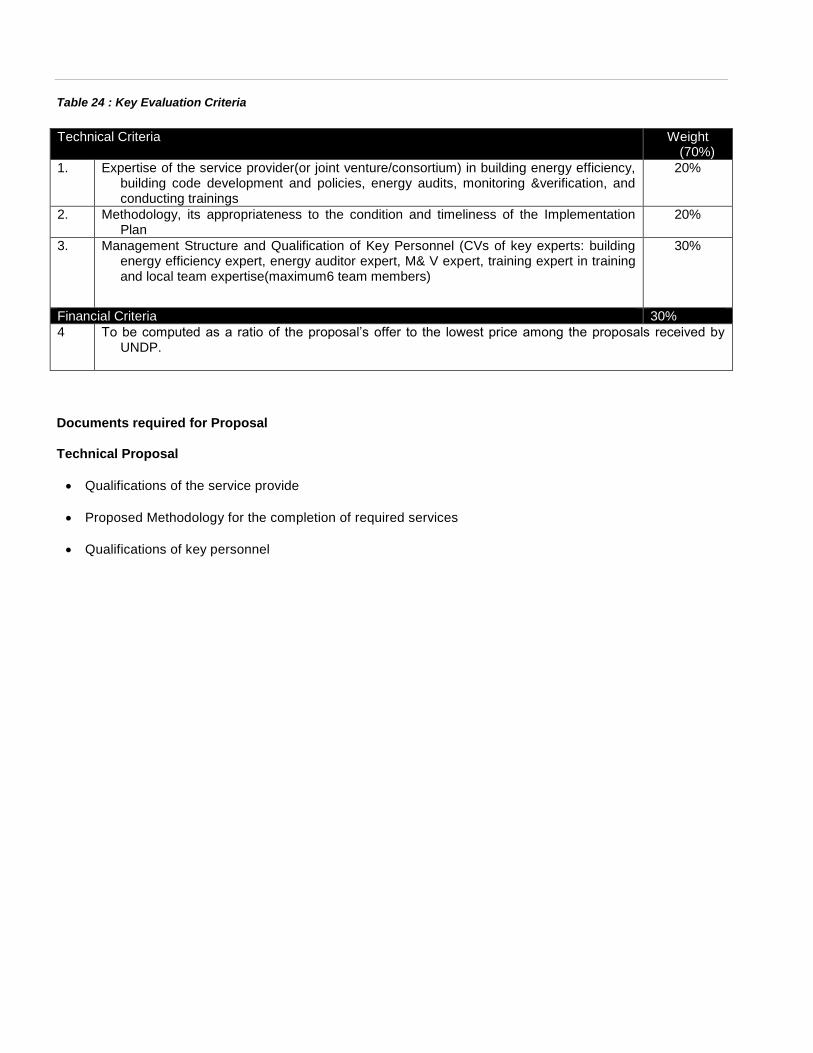
Table 24 : Key Evaluation Criteria
Technical Criteria Weight (70%)
1. Expertise of the service provider(or joint venture/consortium) in building energy efficiency, building code development and policies, energy audits, monitoring &verification, and conducting trainings
20%
2. Methodology, its appropriateness to the condition and timeliness of the Implementation Plan
20%
3. Management Structure and Qualification of Key Personnel (CVs of key experts: building energy efficiency expert, energy auditor expert, M& V expert, training expert in training and local team expertise(maximum6 team members)
30%
Financial Criteria 30%
4 To be computed as a ratio of the proposal’s offer to the lowest price among the proposals received by UNDP.
Documents required for Proposal
Technical Proposal
Qualifications of the service provide
Proposed Methodology for the completion of required services
Qualifications of key personnel

Financial Proposal
Cost breakdown per deliverables
Cost breakdown per cost component
Qualification of the service provider
The Service provider must describe and explain how and why they are the best entity that can deliver the requirements of
UNDP by indicating the following:
a) Profile – describing the nature of business, field of expertise, licenses, certifications, accreditations;
b) Business Licenses – Registration Papers, Tax Payment Certification, etc.
c) Latest Audited Financial Statement – income statement and balance sheet to indicate its financial stability, liquidity,
credit standing, and market reputation, etc. ;
d) Track Record – list of clients for similar services, indicating description of contract scope, contract duration, contract
value, contact references;
e) Certificates and Accreditation – including Quality Certificates, Patent Registrations, Environmental Sustainability
Certificates, etc.
f) Written Self-Declaration that the company (or joint venture) is not in the UN Security Council 1267/1989 List, UN
Procurement Division List or Other UN Ineligibility List.
Proposed Methodology for the Completion of Services
The Service Provider must describe how it will address/deliver the demands of the RFP; providing a detailed description of
the essential performance characteristics, reporting conditions and quality assurance mechanisms that will be put in
place, while demonstrating that the proposed methodology will be appropriate to the local conditions and context of the
work .
Qualifications of Key Personnel
The Service Provider must provide:
a) Names and qualifications of the key personnel that will perform the services indicating who is Team Leader, who are
supporting, etc.;
b) CVs demonstrating qualifications must be submitted and
c) Written confirmation from each personnel that they are available for the entire duration of the contract

Request for Proposal (RFP) – Appliances
Appointment of an agency for removing barriers for energy efficiency in Cabo Verde domestic appliances sector
Detailed Scope of Work
Certification, labelling and enforcement mechanism to promote energy efficient end-uses and national testing,
certification, labelling and enforcement mechanisms adopted for appliances
Develop labelling programme for appliances imported in Cabo Verde in line with ECOWAS labelling
programme
Develop regulatory framework including import regulations for energy efficiency standards for a first
selection of appliances
Develop a testing mechanism for selected appliances to be developed and established
Develop national certification procedures to promote energy efficient appliances
Develop and launch demand side management program, run by national utility, built around a “turn in or
exchange” mechanism /modality
Develop and propose financial incentive and is introduced in a pilot programme for the scale up of energy
efficient appliances
Replication and dissemination
Develop awareness-raising campaign for end users, retailers and distributers on S&L program for
imported appliances (websites, media outreach etc.)
Conduct public awareness programme and diffusion strategy – training seminars etc.
Deliverables:
Standards and Labelling for appliances: appliance labelling programme, design of informative labels,
appropriate testing procedures, labelling threshold and programme implementation methodology, pilot
launch of S&L programme, customs and sales regulations framework, MRV methodology
Appliance testing mechanism: methodology for testing and labelling of appliances.
National Certification program: comprehensive certification program of standardized products
Training and awareness program: The proposed activity will produce awareness raising programmes and
target audience, appropriate training programs and various marketing products
DSM program report: Implementation strategy to phase out inefficient appliances
EE financing report: the proposed activity will provide feasibility analysis of various financing schemes
which could facilitate the market for selected energy efficient products
Developed standards: to increase the stringency level for energy efficient appliances and buildings
(REACH standard)

Eligibility Criteria
The service provider (joint venture / consortium) consulting firm should have minimum 7 years of
experience in energy efficiency programs, standards and labelling of appliances, projects or policy level
and/or technical assistance for energy efficiency measures, training and outreach
Significant experience in the field of standards and labelling of appliance, policies and programs for
energy efficiency in awareness
Significant experience in developing and conducting training programs for energy efficient appliances
Proposed team leader should have post graduate degree in energy management /energy policy/
environmental policy/ or equivalent qualifications
Project team leader should have minimum 7 years of energy efficiency /policy related assignments
Team members should have engineering graduate and/or post graduate in energy related field with 3
years of experience in energy efficiency
Presence of a strong in-house team of trainers (minimum 3) and outreach campaigns experts
Table 25 : Key Evaluation Criteria
Technical Criteria Weight (70%)
1. Expertise of the service provider (or joint venture/consortium) in building energy efficiency,
standards and labelling of appliances, energy efficiency finance, demand side management,
training and certification
20%
2. Methodology, its appropriateness to the condition and timeliness of the Implementation Plan 20%
3 Management Structure and Qualification of Key Personnel (CVs of key experts: international
energy efficiency expert (S&L appliances), M&V expert, training expert in training and local
team expertise (maximum 7 team members
30%
Financial Criteria 30%
4 To be computed as a ratio of the proposal’s offer to the lowest price among the proposals received by UNDP.

Documents required for Proposal
Technical Proposal
Qualifications of the service provide (max. 15 pages)
Proposed Methodology for the completion of required services
Qualifications of key personnel
Financial Proposal
Cost breakdown per deliverables
Cost breakdown per cost component
Qualification of the service provider
The Service provider must describe and explain how and why they are the best entity that can deliver the requirements of UNDP by indicating the following:
a) Profile – describing the nature of business, field of expertise, licenses, certifications, accreditations; b) Business Licenses – Registration Papers, Tax Payment Certification, etc. c) Latest Audited Financial Statement – income statement and balance sheet to indicate its financial stability,
liquidity, credit standing, and market reputation, etc. ; d) Track Record – list of clients for similar services, indicating description of contract scope, contract duration,
contract value, contact references; e) Certificates and Accreditation – including Quality Certificates, Patent Registrations, Environmental Sustainability
Certificates, etc. f) Written Self-Declaration that the company (or joint venture) is not in the UN Security Council 1267/1989 List, UN
Procurement Division List or Other UN Ineligibility List.
Proposed Methodology for the Completion of Services
The Service Provider must describe how it will address/deliver the demands of the RFP; providing a detailed description of the essential performance characteristics, reporting conditions and quality assurance mechanisms that will be put in place, while demonstrating that the proposed methodology will be appropriate to the local conditions and context of the work .
Qualifications of Key Personnel
The Service Provider must provide: a) Names and qualifications of the key personnel that will perform the services indicating who is Team Leader, who are
supporting, etc.; b) CVs demonstrating qualifications must be submitted and c) Written confirmation from each personnel that they are available for the entire duration of the contract

Annex C: Emission reduction calculations
Using the best available data, expert opinion from the consultant team and nation team, as well as reasonable
hypothesis, it was possible to build an energy efficiency buildings scenario and energy efficient appliances
scenario, resulting from the project. Estimates for impact on GHG emissions reduction and subsequent energy
savings resulting from project implementation were calculated. The principal sources of statistical data on
energy consumption and GHG emissions from appliances and buildings used were:
Appliances Data:
DG customs provided extensive list of the products imported into the country in terms of value of imports
and the total weight for last decade(2003- 2013).
National team provided details of key information needed to calculate energy consumption of the
shortlisted appliances (refrigerators, air conditioners, televisions, water heaters and bulbs) - unit weight,
no of units imported, average power consumption of each appliance, annual usage, and popular brand of
import. This data was compiled and extracted from DG Energy sources ( Utilities annual report submitted
to DG Energy) , National Statistics Institute ( INE) Energy sector and household survey and 2010 census
data, as well as from survey to major importers and retailers on appliances at major urban centres in the
country ( distributed by e-mail and/or applied in-situ).
The statistical data was developed and used for calculating energy consumption of appliance in last
decade with corresponding GHG emission.
Table 26: Appliances: Energy Consumptions and GHG Emissions (2004-13)
Refrigerators and
freezers
CVE (DG
Customs)
Weight (Kgs) -
DG Customs
No of freezer
units imported(
avg weight
35kg/unit) *
Avg
Power
consumpt
ion
(watts)*
Usage
per day
(in
hours)
Days of
usage
per
year
Usage by
single unit
per annum
(KWh)
Usage of
freezers
imported
(kwh)
Usage of
freezers
imported
(Mwh)
Grid Emission
Factor
tCO2e / kWh t co2
2013 313353427 798307 22,809 200 24 365 1752 39960968 39,961 0.000490 19593
2012 349385343 793234 22,664 200 24 365 1752 39707028 39,707 0.000490 19469
2011 375089941 927435 26,498 200 24 365 1752 46424746 46,425 0.000490 22762
2010 444714318 1917967 54,799 200 24 365 1752 96007948 96,008 0.000490 47073
2009 396078395 823238 23,521 200 24 365 1752 41208942 41,209 0.000490 20205
2008 470736548 1272065 36,345 200 24 365 1752 63675939 63,676 0.000490 31221
2007 9082115 20288 580 200 24 365 1752 1015559 1,016 0.000490 498
2006 344433449 773747 22,107 200 24 365 1752 38731564 38,732 0.000490 18990
2005 303785265 793508 22,672 200 24 365 1752 39720743 39,721 0.000490 19475
2004 224449790 574872 16,425 200 24 365 1752 28776450 28,776 0.000490 14109
Televisions
CVE (DG
Customs)
Weight (Kgs) -
DG Customs
No. of TV
imported ( 30Kg
/unit)
Avg
Power
consumpt
ion
(watts)
Usage
per day
(in
hours)
Days of
usage
per
year
Usage by
single unit
per annum
(KWh)
Usage of
televisions
imported
(kwh)
Usage of
televisions
imported
(Mwh)
Grid Emission
Factor
tCO2e / kWh t co2
2013 240624825 247229 8,241 120 6 365 262.8 2165726.04 2165.7 0.000490 1062
2012 240161582 270975 9,033 120 6 365 262.8 2373741 2373.7 0.000490 1164
2011 315772039 452794 15,093 120 6 365 262.8 3966475.44 3966.5 0.000490 1945
2010 319690328 419119 13,971 120 6 365 262.8 3671482.44 3671.5 0.000490 1800
2009 216647118 430368 14,346 120 6 365 262.8 3770023.68 3770.0 0.000490 1848
2008 248758347 448889 14,963 120 6 365 262.8 3932267.64 3932.3 0.000490 1928
2007 230557163 415975 13,866 120 6 365 262.8 3643941 3643.9 0.000490 1787
2006 392551595 511440 17,048 120 6 365 262.8 4480214.4 4480.2 0.000490 2197
2005 201729737 385144 12,838 120 6 365 262.8 3373861.44 3373.9 0.000490 1654
2004 231671989 365405 12,180 120 6 365 262.8 3200947.8 3200.9 0.000490 1569
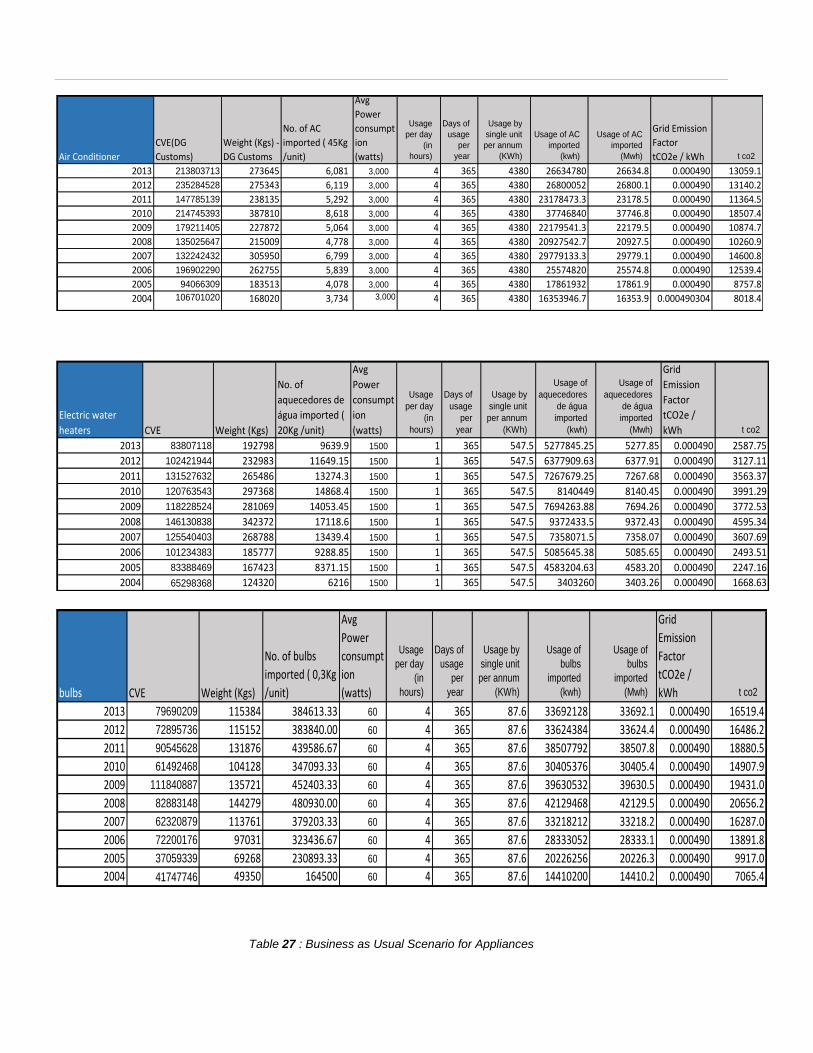
Air Conditioner
CVE(DG
Customs)
Weight (Kgs) -
DG Customs
No. of AC
imported ( 45Kg
/unit)
Avg
Power
consumpt
ion
(watts)
Usage
per day
(in
hours)
Days of
usage
per
year
Usage by
single unit
per annum
(KWh)
Usage of AC
imported
(kwh)
Usage of AC
imported
(Mwh)
Grid Emission
Factor
tCO2e / kWh t co2
2013 213803713 273645 6,081 3,000 4 365 4380 26634780 26634.8 0.000490 13059.1
2012 235284528 275343 6,119 3,000 4 365 4380 26800052 26800.1 0.000490 13140.2
2011 147785139 238135 5,292 3,000 4 365 4380 23178473.3 23178.5 0.000490 11364.5
2010 214745393 387810 8,618 3,000 4 365 4380 37746840 37746.8 0.000490 18507.4
2009 179211405 227872 5,064 3,000 4 365 4380 22179541.3 22179.5 0.000490 10874.7
2008 135025647 215009 4,778 3,000 4 365 4380 20927542.7 20927.5 0.000490 10260.9
2007 132242432 305950 6,799 3,000 4 365 4380 29779133.3 29779.1 0.000490 14600.8
2006 196902290 262755 5,839 3,000 4 365 4380 25574820 25574.8 0.000490 12539.4
2005 94066309 183513 4,078 3,000 4 365 4380 17861932 17861.9 0.000490 8757.8
2004 106701020 168020 3,734 3,000 4 365 4380 16353946.7 16353.9 0.000490304 8018.4
Electric water
heaters CVE Weight (Kgs)
No. of
aquecedores de
água imported (
20Kg /unit)
Avg
Power
consumpt
ion
(watts)
Usage
per day
(in
hours)
Days of
usage
per
year
Usage by
single unit
per annum
(KWh)
Usage of
aquecedores
de água
imported
(kwh)
Usage of
aquecedores
de água
imported
(Mwh)
Grid
Emission
Factor
tCO2e /
kWh t co2
2013 83807118 192798 9639.9 1500 1 365 547.5 5277845.25 5277.85 0.000490 2587.75
2012 102421944 232983 11649.15 1500 1 365 547.5 6377909.63 6377.91 0.000490 3127.11
2011 131527632 265486 13274.3 1500 1 365 547.5 7267679.25 7267.68 0.000490 3563.37
2010 120763543 297368 14868.4 1500 1 365 547.5 8140449 8140.45 0.000490 3991.29
2009 118228524 281069 14053.45 1500 1 365 547.5 7694263.88 7694.26 0.000490 3772.53
2008 146130838 342372 17118.6 1500 1 365 547.5 9372433.5 9372.43 0.000490 4595.34
2007 125540403 268788 13439.4 1500 1 365 547.5 7358071.5 7358.07 0.000490 3607.69
2006 101234383 185777 9288.85 1500 1 365 547.5 5085645.38 5085.65 0.000490 2493.51
2005 83388469 167423 8371.15 1500 1 365 547.5 4583204.63 4583.20 0.000490 2247.16
2004 65298368 124320 6216 1500 1 365 547.5 3403260 3403.26 0.000490 1668.63
bulbs CVE Weight (Kgs)
No. of bulbs
imported ( 0,3Kg
/unit)
Avg
Power
consumpt
ion
(watts)
Usage
per day
(in
hours)
Days of
usage
per
year
Usage by
single unit
per annum
(KWh)
Usage of
bulbs
imported
(kwh)
Usage of
bulbs
imported
(Mwh)
Grid
Emission
Factor
tCO2e /
kWh t co2
2013 79690209 115384 384613.33 60 4 365 87.6 33692128 33692.1 0.000490 16519.4
2012 72895736 115152 383840.00 60 4 365 87.6 33624384 33624.4 0.000490 16486.2
2011 90545628 131876 439586.67 60 4 365 87.6 38507792 38507.8 0.000490 18880.5
2010 61492468 104128 347093.33 60 4 365 87.6 30405376 30405.4 0.000490 14907.9
2009 111840887 135721 452403.33 60 4 365 87.6 39630532 39630.5 0.000490 19431.0
2008 82883148 144279 480930.00 60 4 365 87.6 42129468 42129.5 0.000490 20656.2
2007 62320879 113761 379203.33 60 4 365 87.6 33218212 33218.2 0.000490 16287.0
2006 72200176 97031 323436.67 60 4 365 87.6 28333052 28333.1 0.000490 13891.8
2005 37059339 69268 230893.33 60 4 365 87.6 20226256 20226.3 0.000490 9917.0
2004 41747746 49350 164500 60 4 365 87.6 14410200 14410.2 0.000490 7065.4
Table 27 : Business as Usual Scenario for Appliances

2014 2015 2016 2017 2018 2019 2020 2021 2022 2023 2024 2025 2026 2027 2028
BAU BAU BAU BAU BAU BAU BAU BAU BAU BAU
Air conditioners 20866 22181 23578 25063 26642 28321 30105 32002 34018 36161 38439 40861 43435 46172 49080
Cumulative energy consumption(MWh) 89,576 93842 98652 103985 109830 116185 123053 130444 138374 146860 155927 165603 175917 186905 198605
Refrigerators & Freezers 41519 43139 44821 46569 48385 50272 52233 54270 56387 58586 60871 63244 65711 68274 70936
Cumulative(MWh) 207323 208997 210679 215113 216929 223815 225776 234891 237007 248192 259424 261798 275149 288393 291056
Electric water heaters 5568 5874 6197 6538 6898 7277 7678 8100 8545 9015 9511 10034 10586 11168 11783
Cumulative (MWh) 29283 29301 29624 30237 30597 31755 32155 33824 34269 36431 38656 39179 41929 44712 45326
Televisions 2220 2275 2332 2391 2450 2512 2574 2639 2705 2772 2842 2913 2985 3060 3137
Cumulative(MWh) 13585 13143 13200 12951 13010 12920 12983 13025 13091 13245 13438 13509 13792 14094 14171
Bulbs 34130 34574 35023 35479 35940 36407 36880 37360 37845 38337 38836 39341 39852 40370 40895
Cumulative(MWh) 154785 158402 158852 162560 163021 166824 167297 171198 171683 175683.97 176182 180287 180798 185008.57 185533
Total Appliance (Energy consumption) 1,04,304 1,08,043 1,11,952 1,16,040 1,20,316 1,24,789 1,29,470 1,34,370 1,39,500 1,44,872 1,50,498 1,56,393 1,62,570 1,69,044 1,75,831
Cumulative (energy consumption) 4,94,552 503684.7 5,11,006 524845.1 5,33,387 551499.2 5,61,264 583381.7 5,94,424 620411.3 6,43,627 660374 6,87,586 719112.8 7,34,690
Energy Consumed (MwH) Business as Usual
2014 2015 2016 2017 2018 2019 2020 2021 2022 2023 2024 2025 2026 2027 2028
AS AS AS AS AS AS AS AS AS AS AS AS AS AS AS
Air conditioners 17736.20581 18853.5868 20041.36274 21303.969 22646.11862 24072.82409 25589.41201 27201.54497 28915.2423 30736.90256 32673.32743 34731.74705 36919.8471 39245.79749 41718.28273
Cumulative energy consumption(MWh) 86446.48699 88010.7764 90449.98384 93663.956 97577.28316 102134.6506 107297.1325 113039.251 119346.6431 126214.217 133644.701 141647.5079 150237.853 159436.0802 169267.1469
Refrigerators & Freezers 35291.52849 36667.8981 38097.94612 39583.766 41127.5329 42731.50668 44398.03544 46129.55882 47928.61162 49797.82747 51739.94274 53757.80051 55854.3547 58032.67456 60295.94887
Cumulative(MWh) 201094.8696 197543.794 196132.9811 196490.15 198319.6536 201387.2296 205507.8191 210535.8141 216357.2629 222883.6378 230046.853 237795.2829 246090.581 254905.1394 264220.0604
Electric water heaters 5289.720402 5580.65502 5887.59105 6211.4086 6553.036029 6913.45301 7293.692926 7694.846037 8118.062569 8564.55601 9035.606591 9532.564953 10056.856 10609.98311 11193.53218
Cumulative (MWh) 29004.32076 28784.1116 28914.88036 29343.313 30027.6863 30935.60205 32042.17457 33328.58569 34780.93112 36389.30091 38147.04732 40050.20281 42097.0183 44287.59772 46623.61036
Televisions 1664.901893 1706.52444 1749.187552 1792.9172 1837.740171 1883.683676 1930.775768 1979.045162 2028.521291 2079.234323 2131.215181 2184.495561 2239.10795 2295.085648 2352.46279
Cumulative(MWh) 13029.90956 12130.4521 11453.54922 10955.757 10602.34547 10365.56005 10223.22381 10157.62421 10154.62066 10202.93085 10293.55986 10419.34345 10574.5827 10754.75182 10956.26424
Bulbs 8532.531416 8643.45432 8755.819231 8869.6449 8984.950264 9101.754618 9220.077428 9339.938434 9461.357634 9584.355283 9708.951902 9835.168276 9963.02546 10092.54479 10223.74788
Cumulative(MWh) 129187.858 111993.741 98350.81178 87550.294 79025.18571 72321.90318 67077.59997 63002.01841 59862.97236 57474.73317 55688.73844 54386.15903 53471.9527 52870.10694 52519.83343
Total Appliance (Energy consumption) 68514.88801 71452.1187 74531.9067 77761.705 81149.37798 84703.22207 88431.99357 92344.93342 96451.79541 100762.8756 105289.0438 110041.7764 115033.191 120276.0856 125783.9744
Cumulative (energy consumption) 458763.4449 438462.875 425302.2063 418003.47 415552.1543 417144.9455 422147.95 430063.2934 440502.4301 453164.8197 467820.8996 484298.4961 502471.988 522253.6761 543586.9153
ALTERNATIVE SCENARIOEnergy Consumed (MwH)
Assumptions:
Growth rate of appliances from 2014-28 is assumed to be same as growth rate from 2004-13.
It is assumed that all the appliances imported into the country are sold in the market thus sales volume
and import volume are considered same both in base case and projected scenarios
Each appliance unit weight, energy usage, and average power consumption is considered same in base
case and projected scenarios.
It is assumed that 20% of appliances are replaced every year from the stock
Product policy analysis tool (PPAT) (analytical tool developed to support policy decisions for energy
efficiency potential in appliances) was used to develop scenarios with minimum energy performance
standards (MEPS) and labels for BAU and alternative scenario analysis
Assumed that the S&L program will be lunched after one year of the launch of the project

Table 28: Survey Data for Appliances (Collected During the PPG Phase)

Appliances
Total Impor(2009-
2013) Volume
Wiegth
(Kg)Total(2009-
2013) Wigth Unt(Kg)
Total Impor(2009-
2013) Quantity
Annual sales volume
(2009-13) -quantity
Posse de bens por
agregados
familiares(2010)
Expected Annual sales
growth rate(%)/ (2015-
20)
Average power
consumption per unit
(watts)
Average daily usage
(in hours)
No. of days used
each year (avg)
Brands of imported
appliance
Average Capacity /
size
Westpoint
OLG
Norm
Fairline
Orima
Tropicool
Ariston
Tsunami
DELL
electric ovens 57049061 51129 20 2556 2556 20.4 2000 2 365
Electrothermal hair dryers 20568945 33810 2 16905 16905 1000 6 365
Clatronic
Elekom
Jiulin
Kinderbo
Bomann
Flama
Sinbo
Tanras
Tristar
Nikai
Clatronic
EST-europa style
Utilidad
Rowenta
CROWN
FLAMA
Leidy
Amrtica
Tarrington
Ttouse
Nova
Promax
Westpoint
Tropicool
OLG
Luso
Holtpoint
Indesit
whilpool
Radiso
Jocel
Samsung
Sonic
Xper
Fairline
Bomann
DAKO
CROWN
Tensai
OLG
Wilson
Tropicool
Westpoint
Orima
Apell
Induit
CROWN
Radiso
CROWN
Samsung
OLG
Sharp
Grundig
*Agregados familiares: 117.289
Televisions
990830178
556748761
1402805Air conditioners
water heaters
computers
electrothermal toaters
electric iron
Refrigerators and freezers
lamps
washing machines
support sound and picture reord
6
14677351 35351
8 kG
34 polegadas
12.000 BTU
20 L
2 sanduiches
290 L
1900 W
4 269
1269704 20 63485 63485.2 7 12-14w/L 1 365
45 31173 31173 2.4
20 43172 43172
5260181
697186818 249969
15-20w/m2
2503927506490 863437
1878621424 150290.8857 58.3
365
42882644 86239 2 43119.5 43119.5 1900 0.5 365
2 17675.5 17675.5 930 0.5
150290.8857
955034962 485184 30 16172.8 16172.8 16 2000 0.5 365
416464928 602261 0.3 2007537 2007537 500 4 365
Note: as marcas assinaladas com cor verde são as que mais vendem
365
200 2 365
1332895892 1820485 30 60683 60683 73.9 120 6 365
5 49993.849993.8
51.8
200 24 36535

Direct emissions reductions
Based on the tables above, direct emissions reduction will result from the most relevant financial incentive and
introduced in a pilot programme for the scale up of energy efficient refrigerators, air conditioners and water
heater. This results in energy savings of 111,184 MWh (average energy savings from year 2016 -19, during the
project implementation period). Direct emission reductions, thus calculated from GEF methodology is 272.4
ktCO2 of emission savings. Out of this, approximately 10% (27,200 ktCO2 ) is estimated to be post project direct
GHG emission reduction from the financial mechanisms which will be put in place by the end of the project. This
estimate will need to be refined once more details are known about the financial mechanism.
TABLE 29: APPLIANCES ENERGY SAVINGS (2015- 28)
Energy
savings(MWh) tCO2
2014
-
2015 - -
2016 85,704 41,995
2017 106,842 52,352
2018 117,835 57,739
2019 134,354 65,834
2020 139,116 68,167
2021 153,318 75,126
2022 153,922 75,422
2023 167,246 81,951
2024 175,806 86,145
2025 176,076 86,277
2026 185,114 90,706
2027 196,859 96,461
2028 191,103 93,641
Total 1,672,916 819,729
Indirect Emissions reductions
It is assumed that the project implementation and development of S&L program will lead to indirect energy
savings and emission reductions from the project. With replication factor of 3, thus replicating the direct emissions
reduction three times for indirect bottom up emissions resulting in 817.2 ktCO2emissions reductions.
Indirect top down emissions with causality factor of 80% will result in indirect emission savings of 655.7 Kt CO2
from appliances alone (for 10 years).
Table 30 : Co2 Emissions (Appliances)
Appliances (Standards and labelling programme)
Direct Emissions Reductions 272.4ktCO2
Indirect Bottom up Reductions 817.2ktCO2
Indirect Top down reductions 655.7 ktCO2

Buildings Data
The objective of the project is development of a new modern energy efficient building code for the country. The
new law on energy savings is expected to introduce concepts such as energy audits; MEPS for buildings, the
project will support pilot action on public buildings and mobilize additional investments for energy efficiency.
Baseline data
It was difficult to gather baseline data of energy use in buildings sector, UNDP national team conducted
extensive surveys and interviews to formulate baseline.
Simulations on energy consumption on buildings using sample energy audit to public and/or office building
data & compilation of electricity consumption and space use data from public buildings’ managers were
conducted.
ELECTRA is responsible for 90% of electricity supply in the country, thus it was assumed that electricity
sales and production data from the ELECTRA annual reports could be considered reasonable to form
baseline of energy consumption for public sector, residential and institutions etc.
Table 31 : Annual Sales - Electra (2005-12)
Growth rate for both public and residential sector buildings is considered same from base case year
2005-12, using the similar growth rates for 2013- 2028. No studies on real estate sector projections and
construction growth rates for the next year have been conducted or are commissioned to be completed
by any public agency, private corporation or research centre.
In BAU projections for buildings it is assumed that in absence of the project, market penetration of energy
efficient buildings will be relatively low. A baseline shift is developed with assumption of only 10%
building to be energy efficient without the project implementation until 2019.
In alternate scenario, it is assumed that new energy efficiency building code will be developed and
implemented after year one of the project start, thus assuming 30% of building stock wi ll be built as per
energy efficiency building standards till 2019.
Therefore, direct emission reduction will not only result from demonstration projects but also from newly
developed code compliant buildings.
Assuming that after the project implementation, from 2019 all buildings will be built as per the new energy
efficiency code.
Consumers 2005 2006 2007 2008 2009 2010 2011 2012
Public Buildings 16,548 16,677 18245 18548 20,508 22,929 22,893 23,321
Domestic sector 80,977 82,331 81,297 85,234 90,754 95,857 98,761 96,945
Institutions/Social
Organizations
2,779 2,896 3,075 3,255 3,793 4,434 5,110 4,643
Total Buildings 100,304 101,905 102,619 107,037 115,056 122,584 126,765 124,911
Others 61,371 62,868 65,852 69,315 70,052 80,871 79,778 79,770
Total 161,675 164,774 168,471 176,352 185,109 203,456 206,544 204,682
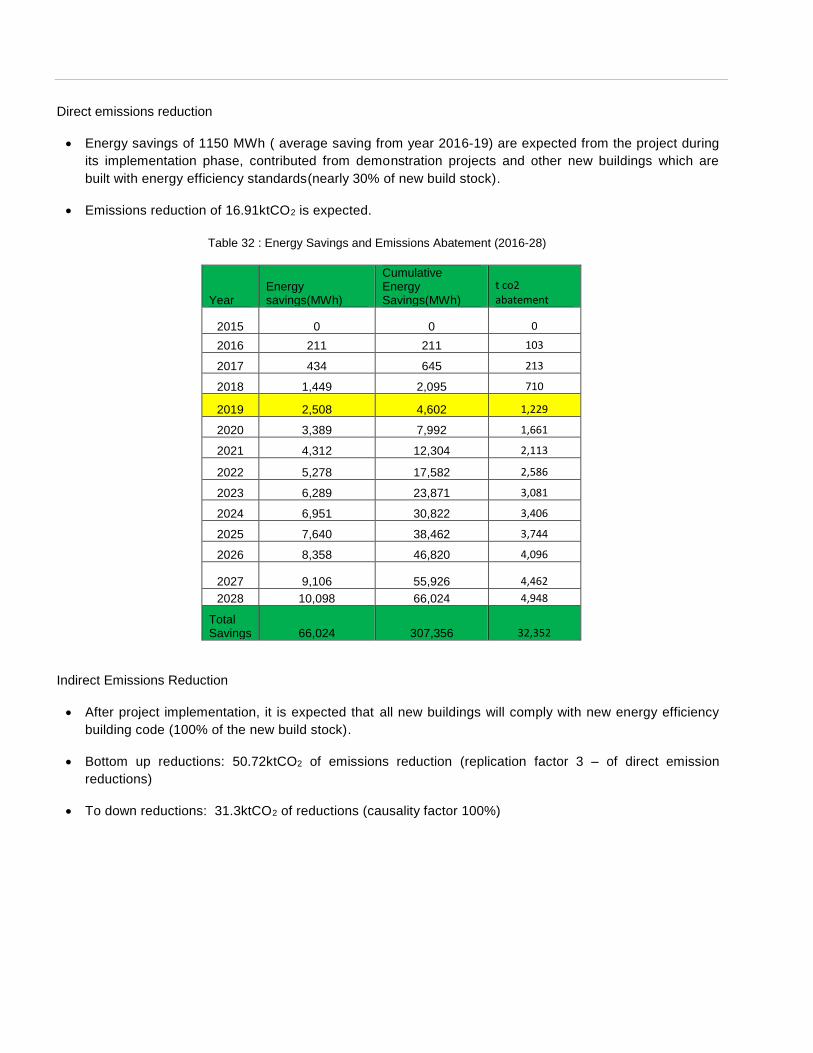
Direct emissions reduction
Energy savings of 1150 MWh ( average saving from year 2016-19) are expected from the project during
its implementation phase, contributed from demonstration projects and other new buildings which are
built with energy efficiency standards(nearly 30% of new build stock).
Emissions reduction of 16.91ktCO2 is expected.
Table 32 : Energy Savings and Emissions Abatement (2016-28)
Year Energy savings(MWh)
Cumulative Energy Savings(MWh)
t co2 abatement
2015 0 0 0
2016 211 211 103
2017 434 645 213
2018 1,449 2,095 710
2019 2,508 4,602 1,229
2020 3,389 7,992 1,661
2021 4,312 12,304 2,113
2022 5,278 17,582 2,586
2023 6,289 23,871 3,081
2024 6,951 30,822 3,406
2025 7,640 38,462 3,744
2026 8,358 46,820 4,096
2027 9,106 55,926 4,462
2028 10,098 66,024 4,948
Total Savings 66,024 307,356 32,352
Indirect Emissions Reduction
After project implementation, it is expected that all new buildings will comply with new energy efficiency
building code (100% of the new build stock).
Bottom up reductions: 50.72ktCO2 of emissions reduction (replication factor 3 – of direct emission
reductions)
To down reductions: 31.3ktCO2 of reductions (causality factor 100%)

Table 33: Buildings Baseline and Alternative Scenario
2013 2014 2015 2016 2017 2018 2019 2020 2021 2022 2023 2024 2025 2026 2027 2028 2029 2030
Yr 0 1 2 3 4 5 6 7 8 9 10 11 12 13 14 15
0 0.1 0.1 0.1 0.1 0.3 0.3 0.3 0.3 0.6 0.6 0.6 0.6 0.8 0.8 0.8
Public Sector 24162.0 25031.9 25933.00706 26852.6 27804.8 28790.7 29811.7 30836.6 31896.7 32993.4 34127.7 35245.7 36400.3 37592.8 38824.4 40054.3 41323.2 42632.4
Residential 99659.9 102450.4 105318.9682 108179.4 111117.6 114135.5 117235.5 120222.6 123285.9 126427.2 129648.6 132625.3 135670.4 138785.4 141971.9 144993.1 148078.5 151561.3
Institutons/ Social 4829.5 5022.6 5223.553454 5429.361 5643.278 5865.623 6089.690 6322.316 6563.829 6814.567 7074.884 7332.409 7599.309 7875.924 8162.608 8449.931 8747.369 9055.276
Total Energy consumption (MWh) 128651.3774 132504.8658 136475.5287 140461.3843 144565.647 148791.9038 153136.8116 157381.522 161746.469 166235.1419 170851.1355 175203.4151 179670.04 184254.1231 188958.86 193497.3012 198149.1116 203248.9456
Consumers
BASELINE ( assumptions)
EE Uptake Stock
2013 2014 2015 2016 2017 2018 2019 2020 2021 2022 2023 2024 2025 2026 2027 2028 2029 2030
Yr 0 30% 30% 100% 100% 100%
Public Sector 24162 25032 25933 26825 27747 28596 29471 30373 31302 32260 33247 34264 35313 36394 37507 38655 39838 41057
Residential 99660 102450 105319 108002 110754 112925 115139 117395 119696 122042 124434 126873 129360 131895 134480 137116 139804 142544
Institutons/ Social 4829 5023 5224 5423 5630 5822 6020 6224 6436 6655 6881 7115 7357 7607 7866 8133 8410 8696
Total Energy consumption (MWh) 128651 132505 136476 140250 144131 147343 150629 153992 157434 160957 164562 168253 172030 175896 179853 183904 188051 192296
ConsumersALTERATIVE Scenario
EE UPTAKE

Annex D: Identified Potential Demonstration Project
The pilot demonstration projects will aim to support UNDP GEF in removing barriers to energy efficiency in Cabo Verdean built environment and for appliances. Demonstration projects are visible as vehicles to highlight the concept of energy efficiency building design measures through applicable, cost effective technologies and design strategies. Summarized are the objectives;
Demonstration and promotion of energy efficiency technologies, design strategies, materials, construction
and operational practices that can be instrumental in developing best practices energy efficiency measures
Creation of public awareness about energy efficient buildings and their benefits and encourage
stakeholders to design and build buildings in compliance with EEBC code developed during the project
implementation
Identification of market and policy barriers in achieving energy efficient buildings
Identification and development of technical tools, practices and skills that would accelerate the growth
energy efficient buildings
Building stakeholders (architects, engineers, designers, developers, financial institutions) tr ained to monitor
energy performance/water usage
Develop a monitoring and reporting system of energy performance / water usage of pilot projects
Key selection Criteria
a) Energy Saving Potential: The key criteria for project selection will be based on the significant energy saving and water saving potential. Large energy savings can best validate the higher capital cost and additional technical inputs required for energy efficient pilot project and make the most convincing case for promoting energy efficiency and water efficiency in buildings.
b) Potential for market transition: Results and lessons from the pilot studies should be applicable across a broad spectrum of buildings thereby increasing the chance to make a major impact in reducing energy consumption in the building sector.
Selected projects should cover diversity of building type to demonstrate the link between technological
interventions with different usage, activities and related energy usage.
Project size should be representative of a diverse range of scales in terms of physical footprint that will
better establish the applicability of energy efficient buildings concept irrespective of their size. This will
enable understanding of the integration of technologies inside the building, between multiple buildings and
between building and site.
Economic, social, and technical feasibility of the site location and topology should be for energy efficient
building development should be primary.
c) Technology Diffusion and replication
UNDP GEF pilot demonstration project should encourage the integration of energy efficient technologies and
concepts in buildings for enhanced building performance.. To support this objective, the selected projects should be
able to display easily replicable energy efficiency technology, product or measure for other projects to emulate its
example. Alternatively, availability of traditional skill set to design and manufacture efficient versions of established
technology can also qualify for this criterion.

Financial Resources and Funding
Energy efficiency projects may require larger capital investment due to high first cost of energy efficient
technologies and products, trial & testing of nascent technologies, specialized consultants etc. To achieve this it is
imperative that the project owner/developer has access to the required funding (through GEF or other co-financing)
to make the extra capital investment during the construction, and operation stage. Additional budget required for
M&V of the pilots and the incremental cost incurred should not exceed 30% of the total cost. The selection of pilot
should be based on the best value of money.
d) Implementation Timeline
Launch of the selected project(s) should be ready and preferably complete within the expected period of UNDP
project timeline. Selected pilot projects would require inputs and advise from the national and international
consultants appointed for component 1 and 3. Technical expertise can thus be ensured from conception to
completion, and the continuity of the intent and methods with which the projects are initiated.
e) Replication and dissemination potential
Pilot project program is being initiated to share and transfer the information, knowledge, and expertise gained from
the project. The project should desirably have mass awareness potential so the advantages of energy efficient
building are highlighted to the largest possible audience. This would facilitate capacity building in terms of technical
expertise and skills. It is essential that the project owner/team is enthusiastic to make the project serve as a vehicle
for Measurement and Verification (M&V) studies and energy efficiency education and outreach activities/ program.
Project owner/ management should be willing to share data and their experiences from the project. Public buildings
open to visitors; housing institutions/clients that are engaged in promoting sustainability as a primary business
activity, educational institutions imparting education on sustainable development have large awareness potential.
List of Potential demonstration project during UNDP –GEF project implementation
1. New Headquarter building of ECREEE:
ECREEE is co- financing the UNDP GEF project and contributing in removing barriers for energy efficiency.
ECREEE is in the preparatory phase for building a Green Office Building in Praia incorporating energy efficiency
measures and renewable energy technologies. The new building will be used as a demonstration project for
regional initiative on energy efficiency for buildings.
The proposed project is a potential demonstration pilot for UNDP GEF project and will be further evaluated on
the key selection criteria.
2. New Buildings for General Directorate of Environment (DGA) and Science Museum facilities
A new public building is proposed for DG Environment in Praia, Santiago Island. The total built up area of
building is 73,576m2. The six storey public building will house natural history museum, environmental
laboratory, offices of different departments of the institution. The proposed project with energy efficiency building
design measures and efficient appliances will reduce overall demand of the building by nearly 30%. Thus the
project will meet the key selection criteria for the pilot demonstration under the UNDP –GEF project and will
showcase measures for replication.
3. Social Housing Program: Kasa para todos & Reabilitar
The Cabo Verde and Portuguese Government has signed a Line of Credit of EUR 200 million for the
development of Housing Social interest, to be executed in five years (2010-14). Under the terms defined in the
agreement, companies of Cape Verdean and Portuguese consortium (Joint venture) perform financing the

projects of government initiative with close coordination of municipalities. The Fund for Social Housing (FHIS)
aims to centralize and manage resources for structured programs under the National Housing System Social
Interest (SNHIS) intended to implement housing policies directed to households in disadvantaged economic and
/ or populations with specific support needs (e.g. Youths Lower Middle Class, women-headed mono-parental
households). The social housing fund is agreed to use materials and construction techniques, which are
environmentally friendly or locally available materials; the social housing program aims to build 8250 units of
housing with existing quantitative deficit of 42,334.
The Kasa Para Todos social housing program phases not implemented yet could be evaluated in the light of
pilot selection criteria and assess the demonstration potential of few housing units. The current status and scope
of the project should be evaluated to include under UNDP GEF project implementation.
4. Potential demonstration of new eco-lodges, youth-hostels or resorts ( Ministry of Tourism, Industry
and Energy; Ministry of Youth and Employment )
As tourism sector is growing at a fast rate, for new hotels and resorts are being planned. Efforts could be made
to identify a pilot project and evaluated as per the key selection criteria. A feasible pilot in tourism industry will be
able to display energy efficiency measures leading to wider awareness in the society with high potential for
replication of new technologies in other existing hotels and resorts.
5. Uni-CV Campus Palmajero (Public University)
The Campus University of Cape Verde (UNI-CV) of Palmajero is located in the greater island of Cabo Verde,
Santiago. The University plans to install photovoltaic solar energy system and generate solar power from the
rooftop. The design of photovoltaic solar energy system consists of series of photovoltaic modules,
environmental monitoring devices, direct current combiner box, inverter network, data storage systems and
other components. The monthly electricity consumption at the University of Cabo Verde (CV-UNI) is 15,017
KWh; average daily electricity consumption is about 500 KWh. Thus the university has a huge potential to
reduce the energy demand from the building by first incorporating energy efficiency measures and then off-
setting the remaining demand through solar energy, therefore reducing the dependence on the grid. The
university could be highlighted as the zero energy grids connect building in Cabo Verde.
Thus, public university could be evaluated as per the key selection criteria to showcase and implement energy
conservation measures and reduce the overall energy demand of the building. The pilot demonstration project
will display energy efficiency measures in existing buildings unlike other new buildings for pilot demonstration.
The Uni-CV being a platform for generating ideas and for the dissemination of general education, the new
energy efficiency measures will have positive effects on school students and will lead to widespread
dissemination of knowledge of the new concepts.
6. New Campus of Uni -CV(public University )
The Pubic University of Cabo Verde, Uni-Cv in accordance with Decree-Law No. 53/2006, is conceived as an
institution of higher education whose mission is to empower the Cabo Verdean nation, in order to overcome the
great challenges of modernization and development of the country. The construction of the new campus
university aims to integrate concepts of sustainable building design, which aims to meet requirements for energy
efficiency and environmental impacts with emphasis on natural lighting, ventilation, air cooling with minimum
power consumption and water efficiency in toilets. Uptake of surface water and wastewater treatment.

The new campus must be evaluated for pilot potential to display energy efficiency measures in new building for
further replication in institutions.
7. ANAS (National Water and Sanitation Agency) HQ and laboratories
The recently created National Agency on water and sanitation will establish its new headquarters. Office space
and water labs are planned on the new Head Quarters that will be installed on an abandon structure that will be
rehabilitated.
This building will be further evaluated as a demonstration project with the potential to showcase EE measures
that can be incorporated on rehabilitation programs.
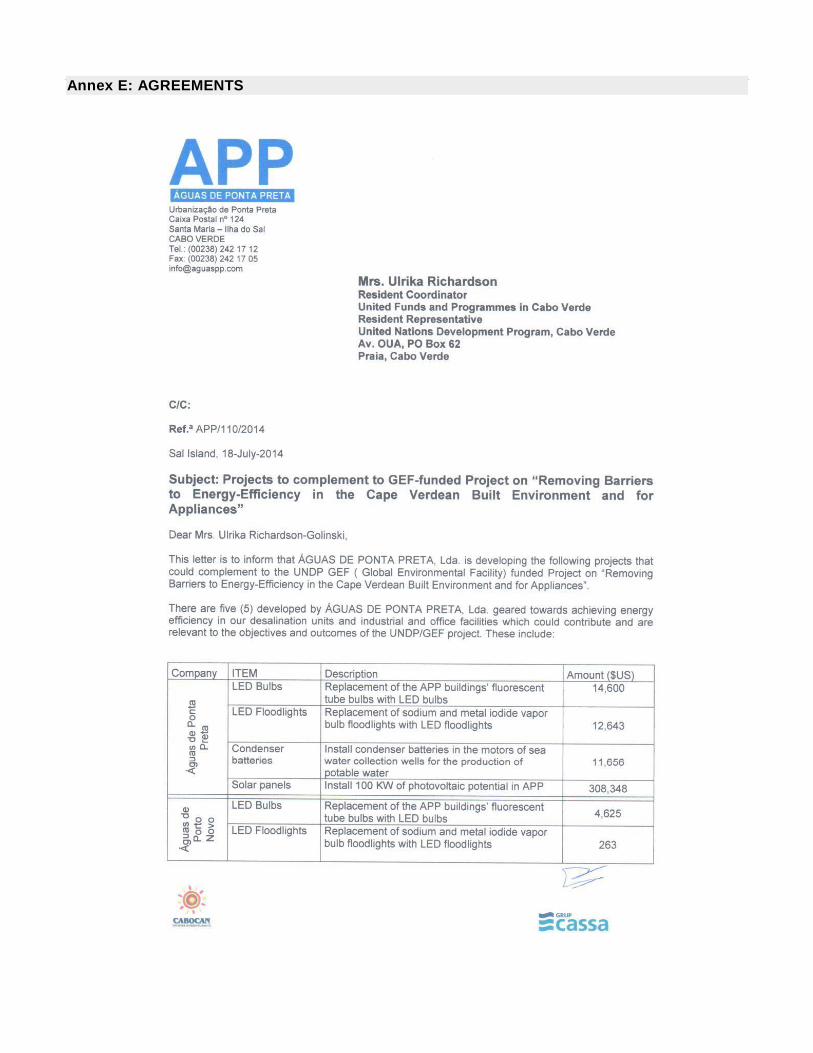
Annex E: AGREEMENTS
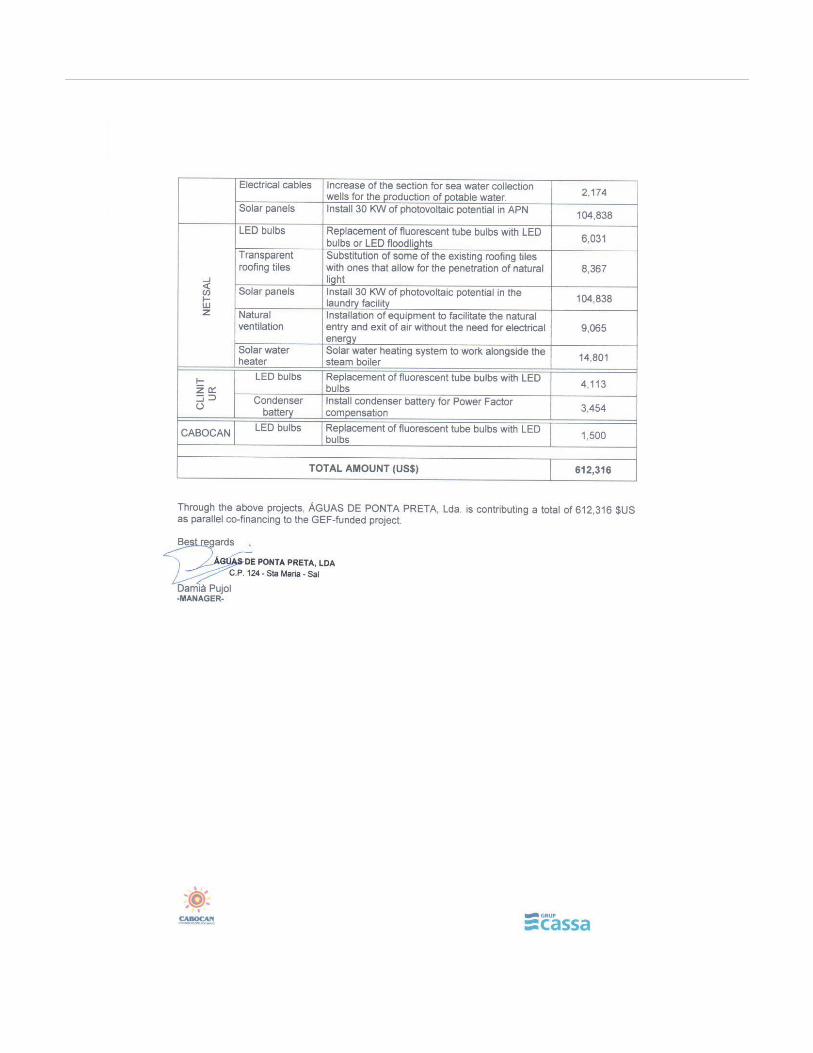


ANNEX F: Communications and visibility requirements:
Full compliance is required with UNDP’s Branding guidelines. These can be accessed at
http://intra.undp.org/coa/branding.shtml, and specific guidelines on UNDP logo use can be accessed at:
http://intra.undp.org/branding/useOfLogo.html. Amongst other things, these guidelines describe when and how
the UNDP logo needs to be used, as well as how the logos of donors to UNDP projects needs to be used. For
the avoidance of any doubt, when logo use is required, the UNDP logo needs to be used alongside the GEF
logo. The GEF logo can be accessed at: http://www.thegef.org/gef/GEF_logo. The UNDP logo can be
accessed at http://intra.undp.org/coa/branding.shtml.
Full compliance is also required with the GEF’s Communication and Visibility Guidelines (the “GEF
Guidelines”). The GEF Guidelines can be accessed at:
http://www.thegef.org/gef/sites/thegef.org/files/documents/C.40.08_Branding_the_GEF%20final_0.pdf.
Amongst other things, the GEF Guidelines describe when and how the GEF logo needs to be used in project
publications, vehicles, supplies and other project equipment. The GEF Guidelines also describe other GEF
promotional requirements regarding press releases, press conferences, press visits, visits by Government
officials, productions and other promotional items.
Where other agencies and project partners have provided support through co-financing, their branding policies
and requirements should be similarly applied.

ANNEX G: Direct Project Costs for projects financed from GEF-managed vertical funds and the Adaptation Fund
Dear Mr. Antonio Baptista
1. Reference is made to consultations between officials of the Government of Cabo Verde (hereinafter referred to as “the
Government”) and officials of UNDP with respect to the provision of support services by the UNDP country office for the project
“Removing barriers to energy efficiency in the Cabo Verdean built environment and for appliances” implemented by General
Directorate of Energy of Cabo Verde. UNDP and the Government hereby agree that the UNDP country office may provide such
support services at the request of the Directorate General detailed in the respective project document, as described below.
2. The UNDP country office may provide support services for assistance with reporting requirements and direct payment. In
providing such support services, the UNDP country office shall ensure that the capacity of the Directorate General is strengthened
to enable it to carry out such activities directly. The costs incurred by the UNDP country office in providing such support services
shall be recovered from the project budget in accordance with UN Universal Price List.
3. The UNDP country office may provide, at the request of the designated institution, the following support services for the
activities of the project, details are specified in the Attachment:
(a) Payments, disbursements and other financial transactions; (b) Recruitment of consultants; (c) Procurement of services and goods (d) Organization of training activities, conferences and workshops (e) Travel authorization, visa requests, ticketing, and travel arrangements;
4. The procurement of goods and services and by the UNDP country office shall be in accordance with the UNDP
regulations, rules, policies and procedures. Support services described in paragraph 3 above shall be detailed in an annex to the
project document, in the form provided in the Attachment hereto. If the requirements for support services by the country office
change during the life of the project, the annex to the programme support document or project document is revised with the mutual
agreement of the UNDP resident representative and the Ministry.
5. The relevant provisions of the UNDP Standard Basic Assistance Agreement with the Government of Cabo Verde (the
“SBAA”), including the provisions on liability and privileges and immunities, shall apply to the provision of such support services.
The Ministry shall retain overall responsibility for the nationally managed project. The responsibility of the UNDP country office for
the provision of the support services described herein shall be limited to the provision of such support services detailed in the annex
to the project document.
6. Any claim or dispute arising under or in connection with the provision of support services by the UNDP country office in
accordance with this letter shall be handled pursuant to the relevant provisions of the SBAA.
7. The manner and method of cost-recovery by the UNDP country office in providing the support services described in
paragraph 3 above shall be specified in the annex to the project document.
8. The UNDP country office shall submit progress reports on the support services provided and shall report on the costs
reimbursed in providing such services, as may be required.
9. Any modification of the present arrangements shall be effected by mutual written agreement of the parties hereto.
10. If you are in agreement with the provisions set forth above, please sign and return to this office two signed copies of this
letter. Upon your signature, this letter shall constitute an agreement between your Government and UNDP on the terms and
conditions for the provision of support services by the UNDP country office for the project.
Yours sincerely,
________________________
Signed on behalf of UNDP
Ulrika Richardson
Resident Representative
_____________________
For the Government of Cabo Verde
Antonio Baptista
Directorate General of Energy
Date:
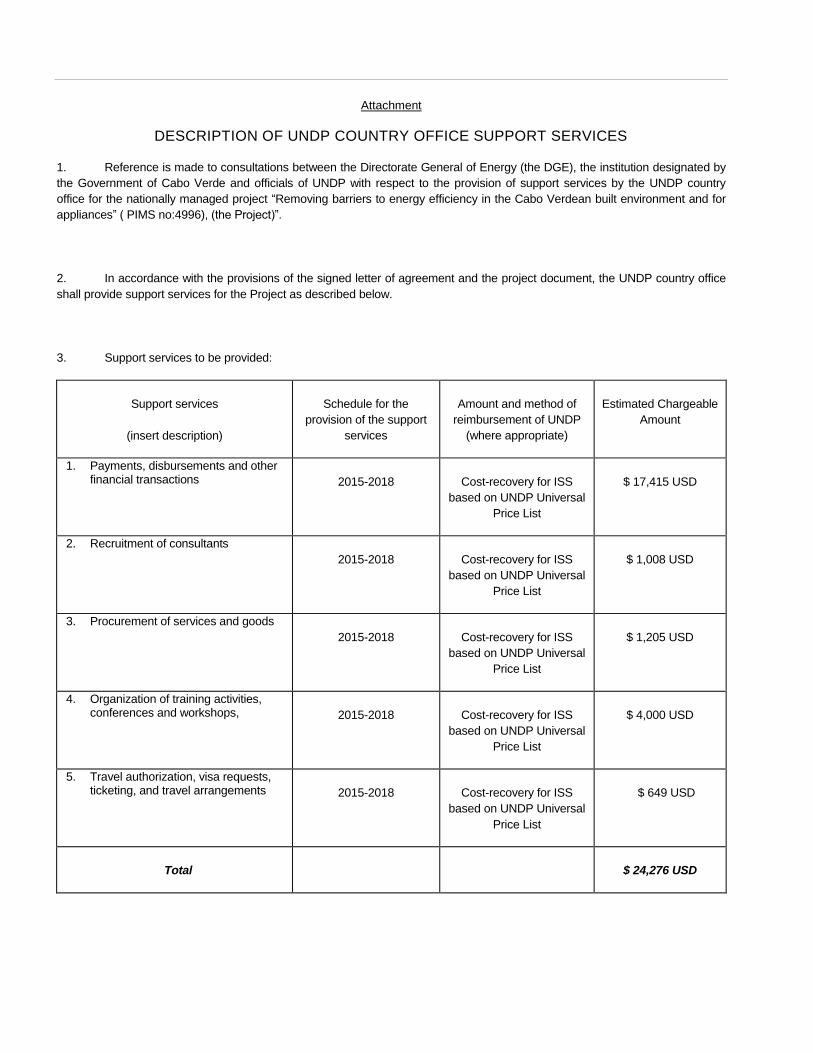
Attachment
DESCRIPTION OF UNDP COUNTRY OFFICE SUPPORT SERVICES
1. Reference is made to consultations between the Directorate General of Energy (the DGE), the institution designated by
the Government of Cabo Verde and officials of UNDP with respect to the provision of support services by the UNDP country
office for the nationally managed project “Removing barriers to energy efficiency in the Cabo Verdean built environment and for
appliances” ( PIMS no:4996), (the Project)”.
2. In accordance with the provisions of the signed letter of agreement and the project document, the UNDP country office
shall provide support services for the Project as described below.
3. Support services to be provided:
Support services
(insert description)
Schedule for the
provision of the support
services
Amount and method of
reimbursement of UNDP
(where appropriate)
Estimated Chargeable
Amount
1. Payments, disbursements and other financial transactions 2015-2018 Cost-recovery for ISS
based on UNDP Universal
Price List
$ 17,415 USD
2. Recruitment of consultants
2015-2018 Cost-recovery for ISS
based on UNDP Universal
Price List
$ 1,008 USD
3. Procurement of services and goods
2015-2018 Cost-recovery for ISS
based on UNDP Universal
Price List
$ 1,205 USD
4. Organization of training activities, conferences and workshops, 2015-2018 Cost-recovery for ISS
based on UNDP Universal
Price List
$ 4,000 USD
5. Travel authorization, visa requests, ticketing, and travel arrangements 2015-2018 Cost-recovery for ISS
based on UNDP Universal
Price List
$ 649 USD
Total $ 24,276 USD

4. Description of functions and responsibilities of the parties involved:
UNDP will provide support services to the DGE as described in the paragraph 3 above in accordance with UNDP rules
and procedures; it retains ultimate accountability for the effective implementation of the project;
The UNDP will provide support to the National Project Director (appointed by Minister of Tourism, Industry and Energy)
in order to maximize the programme’s impact as well as the quality of its products. It will be responsible for
administering resources in accordance with the specific objectives defined in the Project Document, and in keeping
with the key principles of transparency, competitiveness, efficiency and economy. The financial management and
accountability for the resources allocated, as well as other activities related to the execution of programme activities will
be undertaken under the direct supervision of the UNDP Country Office.
The DGE through its National Project Director (NPD) designated from its staff or through duly authorized person, will
approve annual work plans, authorize direct payment requests and submit them to UNDP country office in a timely
manner;
The DGE through its NPD or other duly authorized person will monitor and assure that the project funds are spent in
accordance with Annual Work Plan (AWP) by authorizing and signing direct payment requests and Combined Delivery
Reports (CDRs).
Annex H: UNDP-GEF Environmental and Social Screening Procedure (ESSP)
QUESTION 1:
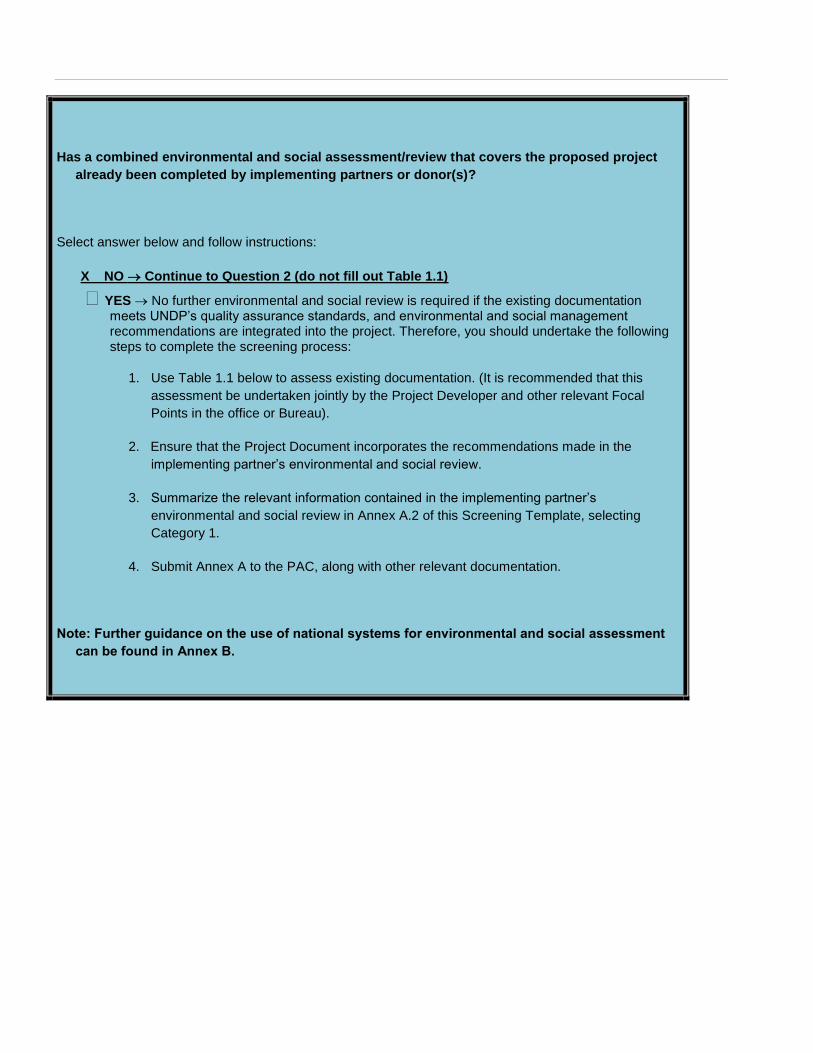
Has a combined environmental and social assessment/review that covers the proposed project
already been completed by implementing partners or donor(s)?
Select answer below and follow instructions:
X NO Continue to Question 2 (do not fill out Table 1.1)
YES No further environmental and social review is required if the existing documentation meets UNDP’s quality assurance standards, and environmental and social management recommendations are integrated into the project. Therefore, you should undertake the following steps to complete the screening process:
1. Use Table 1.1 below to assess existing documentation. (It is recommended that this
assessment be undertaken jointly by the Project Developer and other relevant Focal
Points in the office or Bureau).
2. Ensure that the Project Document incorporates the recommendations made in the
implementing partner’s environmental and social review.
3. Summarize the relevant information contained in the implementing partner’s
environmental and social review in Annex A.2 of this Screening Template, selecting
Category 1.
4. Submit Annex A to the PAC, along with other relevant documentation.
Note: Further guidance on the use of national systems for environmental and social assessment
can be found in Annex B.

TABLE 1.1: CHECKLIST FOR APPRAISING QUALITY ASSURANCE OF EXISTING
ENVIRONMENTAL AND SOCIAL ASSESSMENT Yes/No
1. Does the assessment/review meet its terms of reference, both procedurally and
substantively?
n/a
2. Does the assessment/review provide a satisfactory assessment of the proposed project? n/a
3. Does the assessment/review contain the information required for decision-making? n/a
4. Does the assessment/review describe specific environmental and social management
measures (e.g. mitigation, monitoring, advocacy, and capacity development measures)?
n/a
5. Does the assessment/review identify capacity needs of the institutions responsible for
implementing environmental and social management issues?
n/a
6. Was the assessment/review developed through a consultative process with strong
stakeholder engagement, including the view of men and women?
n/a
7. Does the assessment/review assess the adequacy of the cost of and financing
arrangements for environmental and social management issues?
n/a
Table 1.1 (continued) For any “no” answers, describe below how the issue has been or will be
resolved (e.g. amendments made or supplemental review conducted).
n/a
QUESTION 2:
Do all outputs and activities described in the Project Document fall within the following
categories?
Procurement (in which case UNDP’s Procurement Ethics and Environmental Procurement Guide need to be complied with)
Report preparation
Training
Event/workshop/meeting/conference (refer to Green Meeting Guide)
Communication and dissemination of results
Select answer below and follow instructions:
NO Continue to Question 3
X YES No further environmental and social review required. Complete Annex VII-2, selecting Category
1, and submit the completed template (Annex A) to the PAC.

QUESTION 3:
Does the proposed project include activities and outputs that support upstream planning
processes that potentially pose environmental and social impacts or are vulnerable to
environmental and social change (refer to Table 3.1 for examples)? (Note that upstream
planning processes can occur at global, regional, national, local and sectoral levels)
Select the appropriate answer and follow instructions:
NO Continue to Question 4.
X YES Conduct the following steps to complete the screening process:
1. Adjust the project design as needed to incorporate UNDP support to the country(ies), to
ensure that environmental and social issues are appropriately considered during the
upstream planning process. Refer to Section 7 of this Guidance for elaboration of
environmental and social mainstreaming services, tools, guidance and approaches that
may be used.
2. Summarize environmental and social mainstreaming support in Annex A.2, Section C of
the Screening Template and select ”Category 2”.
3. If the proposed project ONLY includes upstream planning processes then screening is
complete, and you should submit the completed Environmental and Social Screening
Template (Annex A) to the PAC. If downstream implementation activities are also
included in the project then continue to Question 4.

TABLE 3. 1 EXAMPLES OF UPSTREAM PLANNING PROCESSES WITH
POTENTIAL DOWNSTREAM ENVIRONMENTAL AND SOCIAL
IMPACTS
Answer
Yes/No/N.A
1. Support for the elaboration or revision of global- level strategies, policies, plans, and programmes.
For example, capacity development and support related to international negotiations and agreements. Other examples might include a global water governance project or a global MDG project.
No
2. Support for the elaboration or revision of regional-level strategies, policies and plans, and programmes.
For example, capacity development and support related to trans boundary programmes and planning (river basin management, migration, international waters, energy development and access, climate change adaptation etc.).
Yes
3. Support for the elaboration or revision of national-level strategies, policies,
plans and programmes.
For example, capacity development and support related to national development policies, plans, strategies and budgets, MDG-based plans and strategies (e.g. PRS/PRSPs, NAMAs), sector plans.
Yes
4. Support for the elaboration or revision of sub-national/local-level strategies,
polices, plans and programmes.
For example, capacity development and support for district and local level
development plans and regulatory frameworks, urban plans, land use
development plans, sector plans, provincial development plans provision of
services, investment funds, technical guidelines and methods, stakeholder
engagement.
Yes

QUESTION 4:
Does the proposed project include the implementation of downstream activities that potentially
pose environmental and social impacts or are vulnerable to environmental and social change?
To answer this question, you should first complete Table 4.1 by selecting appropriate answers. If you
answer “No” or “Not Applicable” to all questions in Table 4.1 then the answer to Question 4 is “NO.” If
you answer “Yes” to any questions in Table 4.1 (even one “Yes” can indicated a significant issue that
needs to be addressed through further review and management) then the answer to Question 4 is
“YES”:
NO No further environmental and social review and management required for downstream activities. Complete Annex VII-B by selecting “Category 1”, and submit the Environmental and Social Screening Template to the PAC
X YES Conduct the following steps to complete the screening process:
1. Consult Section 8 of this Guidance, to determine the extent of further environmental and
social review and management that might be required for the project.
2. Revise the Project Document to incorporate environmental and social management
measures. Where further environmental and social review and management activity
cannot be undertaken prior to the PAC, a plan for undertaking such review and
management activity within an acceptable period of time, post-PAC approval (e.g. as the
first phase of the project) should be outlined in Annex A.2.
3. Select “Category 3” in Annex A.2, and submit the completed Environmental and Social
Screening Template (Annex A) and relevant documentation to the PAC.

TABLE 4.1: ADDITIONAL SCREENING QUESTIONS TO DETERMINE THE NEED AND POSSIBLE
EXTENT OF FURTHER ENVIRONMENTAL AND SOCIAL REVIEW AND MANAGEMENT
1. Biodiversity and Natural Resources Answer
(Yes/No/
Not Applicable)
1.1 Would the proposed project result in the conversion or degradation of
modified habitat, natural habitat or critical habitat? No
1.2 Are any development activities proposed within a legally protected area
(e.g. natural reserve, national park) for the protection or conservation of
biodiversity? No
1.3 Would the proposed project pose a risk of introducing invasive alien
species? No
1.4 Does the project involve natural forest harvesting or plantation
development without an independent forest certification system for
sustainable forest management (e.g. PEFC, the Forest Stewardship
Council certification systems, or processes established or accepted by the
relevant National Environmental Authority)?
No
1.5 Does the project involve the production and harvesting of fish populations
or other aquatic species without an accepted system of independent
certification to ensure sustainability (e.g. the Marine Stewardship Council
certification system, or certifications, standards, or processes established
or accepted by the relevant National Environmental Authority)?
No
1.6 Does the project involve significant extraction, diversion or containment of
surface or ground water?
For example, construction of dams, reservoirs, river basin developments,
groundwater extraction.
No
1.7 Does the project pose a risk of degrading soils? No
2. Pollution
2.1 Would the proposed project result in the release of pollutants to the
environment due to routine or non-routine circumstances with the
potential for adverse local, regional, and trans boundary impacts? No
2.2 Would the proposed project result in the generation of waste that cannot
be recovered, reused, or disposed of in an environmentally and socially
sound manner? No

TABLE 4.1: ADDITIONAL SCREENING QUESTIONS TO DETERMINE THE NEED AND POSSIBLE
EXTENT OF FURTHER ENVIRONMENTAL AND SOCIAL REVIEW AND MANAGEMENT
2.3 Will the propose project involve the manufacture, trade, release, and/or
use of chemicals and hazardous materials subject to international action
bans or phase-outs?
For example, DDT, PCBs and other chemicals listed in international
conventions such as the Stockholm Convention on Persistent Organic
Pollutants, or the Montreal Protocol.
No
2.4 Is there a potential for the release, in the environment, of hazardous
materials resulting from their production, transportation, handling, storage
and use for project activities? No
2.5 Will the proposed project involve the application of pesticides that have a
known negative effect on the environment or human health? No
3. Climate Change
3.1 Will the proposed project result in significant56greenhouse gas emissions?
Annex E provides additional guidance for answering this question.
No
3.2 Is the proposed project likely to directly or indirectly increase
environmental and social vulnerability to climate change now or in the
future (also known as maladaptive practices)? You can refer to the
additional guidance in Annex C to help you answer this question.
For example, a project that would involve indirectly removing mangroves
from coastal zones or encouraging land use plans that would suggest
building houses on floodplains could increase the surrounding
population’s vulnerability to climate change, specifically flooding.
No
4. Social Equity and Equality
4.1 Would the proposed project have environmental and social impacts that
could affect indigenous people or other vulnerable groups? No
4.2 Is the project likely to significantly impact gender equality and women’s
empowerment57? No
56 Significant corresponds to CO2 emissions greater than 100,000 tons per year (from both direct and indirect sources). Annex
E provides additional guidance on calculating potential amounts of CO2 emissions.
57Women are often more vulnerable than men to environmental degradation and resource scarcity. They typically have weaker
and insecure rights to the resources they manage (especially land), and spend longer hours on collection of water,
firewood, etc. (OECD, 2006). Women are also more often excluded from other social, economic, and political
development processes.

TABLE 4.1: ADDITIONAL SCREENING QUESTIONS TO DETERMINE THE NEED AND POSSIBLE
EXTENT OF FURTHER ENVIRONMENTAL AND SOCIAL REVIEW AND MANAGEMENT
4.3 Is the proposed project likely to directly or indirectly increase social
inequalities now or in the future? No
4.4 Will the proposed project have variable impacts on women and men,
different ethnic groups, social classes? No
4.5 Have there been challenges in engaging women and other certain key
groups of stakeholders in the project design process? No
4.6 Will the project have specific human rights implications for vulnerable
groups? No
5. Demographics
5.1 Is the project likely to result in a substantial influx of people into the
affected community(ies)? Yes
5.2 Would the proposed project result in substantial voluntary or involuntary
resettlement of populations?
For example, projects with environmental and social benefits (e.g.
protected areas, climate change adaptation) that impact human
settlements, and certain disadvantaged groups within these settlements in
particular.
No
5.3 Would the proposed project lead to significant population density increase
which could affect the environmental and social sustainability of the
project?
For example, a project aiming at financing tourism infrastructure in a
specific area (e.g. coastal zone, mountain) could lead to significant
population density increase which could have serious environmental and
social impacts (e.g. destruction of the area’s ecology, noise pollution,
waste management problems, greater work burden on women).
No
6. Culture
6.1 Is the project likely to significantly affect the cultural traditions of affected
communities, including gender-based roles? No
6.2 Will the proposed project result in physical interventions (during
construction or implementation) that would affect areas that have known
physical or cultural significance to indigenous groups and other
communities with settled recognized cultural claims?
No
6.3 Would the proposed project produce a physical “splintering” of a
community?
For example, through the construction of a road, power line, or dam that
No

TABLE 4.1: ADDITIONAL SCREENING QUESTIONS TO DETERMINE THE NEED AND POSSIBLE
EXTENT OF FURTHER ENVIRONMENTAL AND SOCIAL REVIEW AND MANAGEMENT
divides a community.
7. Health and Safety
7.1 Would the proposed project be susceptible to or lead to increased
vulnerability to earthquakes, subsidence, landslides, and erosion, flooding
or extreme climatic conditions?
For example, development projects located within a floodplain or landslide
prone area.
No
7.2 Will the project result in increased health risks as a result of a change in
living and working conditions?In particular, will it have the potential to lead
to an increase in HIV/AIDS infection? No
7.3 Will the proposed project require additional health services including
testing? No
8. Socio-Economics
8.1 Is the proposed project likely to have impacts that could affect women’s
and men’s ability to use, develop and protect natural resources and other
natural capital assets?
For example, activities that could lead to natural resources degradation or
depletion in communities who depend on these resources for their
development, livelihoods, and well-being?
No
8.2 Is the proposed project likely to significantly affect land tenure
arrangements and/or traditional cultural ownership patterns? No
8.3 Is the proposed project likely to negatively affect the income levels or
employment opportunities of vulnerable groups? No
9. Cumulative and/or Secondary Impacts
9.1 Is the proposed project location subject to currently approved land use
plans (e.g. roads, settlements) which could affect the environmental and
social sustainability of the project?
For example, future plans for urban growth, industrial development,
transportation infrastructure, etc.
No
9.2 Would the proposed project result in secondary or consequential
development which could lead to environmental and social effects, or
would it have potential to generate cumulative impacts with other known
existing or planned activities in the area?
For example, a new road through forested land will generate direct
No

TABLE 4.1: ADDITIONAL SCREENING QUESTIONS TO DETERMINE THE NEED AND POSSIBLE
EXTENT OF FURTHER ENVIRONMENTAL AND SOCIAL REVIEW AND MANAGEMENT
environmental and social impacts through the cutting of forest and
earthworks associated with construction and potential relocation of
inhabitants. These are direct impacts. In addition, however, the new road
would likely also bring new commercial and domestic development
(houses, shops, businesses). In turn, these will generate indirect impacts.
(Sometimes these are termed “secondary” or “consequential” impacts). Or
if there are similar developments planned in the same forested area then
cumulative impacts need to be considered.

ANNEX VII-B: ENVIRONMENTAL AND SOCIAL SCREENING SUMMARY
(To be filled in after Annex VII-A has been completed)
Name of Proposed Project: “Removing barriers to energy efficiency in Cabo Verdian built environment and for
appliances”
A. Environmental and Social Screening Outcome
Select from the following:
Category 1. No further action is needed
Category 2. Further review and management is needed. There are possible environmental and social
benefits, impacts, and/or risks associated with the project (or specific project component), but these are predominantly indirect or very long-term and so extremely difficult or impossible to directly identify and assess.
Category 3. Further review and management is needed, and it is possible to identify these with a reasonable
degree of certainty. If Category 3, select one or more of the following sub-categories:
Category 3a: Impacts and risks are limited in scale and can be identified with a reasonable degree of certainty and can often be handled through application of standard best practice, but require some minimal or targeted further review and assessment to identify and evaluate whether there is a need for a full environmental and social assessment (in which case the project would move to Category 3b).
Category 3b: Impacts and risks may well be significant, and so full environmental and social assessment is required. In these cases, a scoping exercise will need to be conducted to identify the level and approach of assessment that is most appropriate.
B. Environmental and Social Issues (for projects requiring further environmental and social review and management)
Environmental Issues: While there are few adverse environmental impacts resulting from Project activities, there are a
number of positive environmental impacts expected from the Project including: a) a reduction in
energy demand from the buildings sector and from appliances; b) significant reduction in carbon
emission resulting from reduced demand of energy from buildings and appliances c) The project
results in reduce demand for water use from the buildings due to new water efficiency standards .
C. Next Steps(for projects requiring further environmental and social review and management):
D. Sign Off
Project Manager Date
PAC Date
Programme Manager Date:
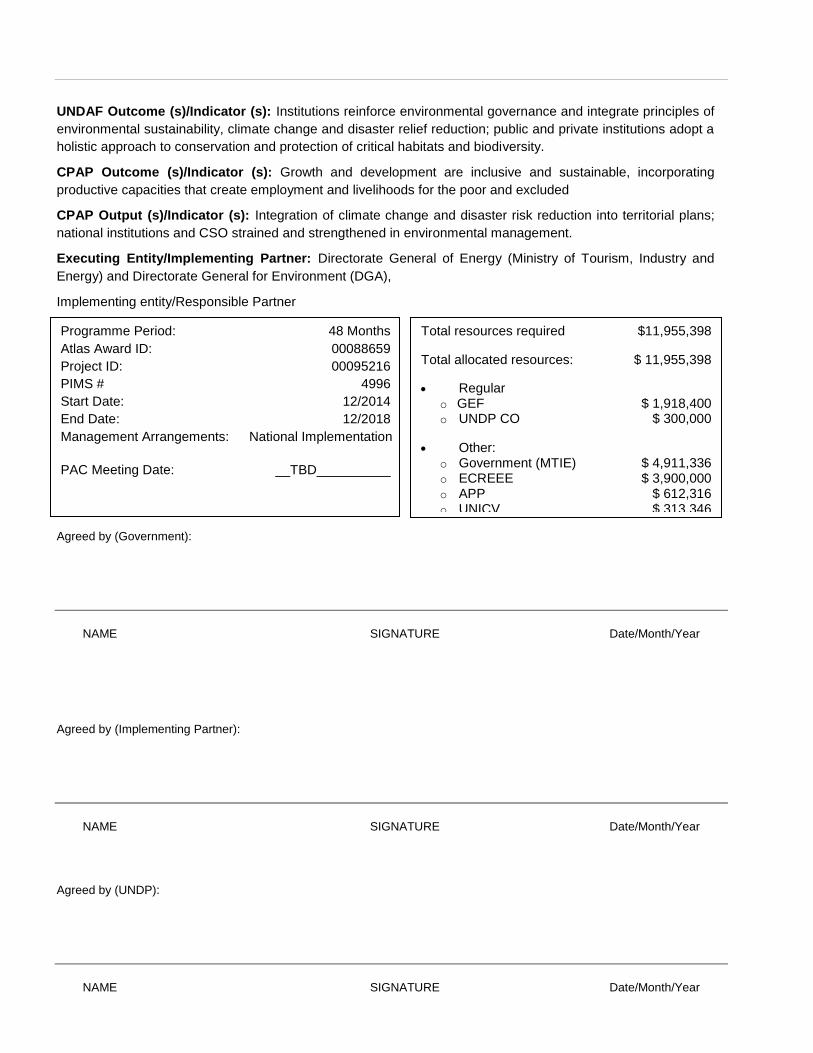
Programme Period: 48 Months
Atlas Award ID: 00088659
Project ID: 00095216
PIMS # 4996
Start Date: 12/2014
End Date: 12/2018
Management Arrangements: National Implementation
PAC Meeting Date: __TBD__________
UNDAF Outcome (s)/Indicator (s): Institutions reinforce environmental governance and integrate principles of
environmental sustainability, climate change and disaster relief reduction; public and private institutions adopt a
holistic approach to conservation and protection of critical habitats and biodiversity.
CPAP Outcome (s)/Indicator (s): Growth and development are inclusive and sustainable, incorporating
productive capacities that create employment and livelihoods for the poor and excluded
CPAP Output (s)/Indicator (s): Integration of climate change and disaster risk reduction into territorial plans;
national institutions and CSO strained and strengthened in environmental management.
Executing Entity/Implementing Partner: Directorate General of Energy (Ministry of Tourism, Industry and
Energy) and Directorate General for Environment (DGA),
Implementing entity/Responsible Partner
Agreed by (Government):
NAME SIGNATURE Date/Month/Year
Agreed by (Implementing Partner):
NAME SIGNATURE Date/Month/Year
Agreed by (UNDP):
NAME SIGNATURE Date/Month/Year
Total resources required $11,955,398
Total allocated resources: $ 11,955,398
Regular o GEF $ 1,918,400 o UNDP CO $ 300,000
Other: o Government (MTIE) $ 4,911,336 o ECREEE $ 3,900,000 o APP $ 612,316 o UNICV $ 313,346