Embed Size (px)
Citation preview
UNITED NATIONSDEVELOPMENTPROGRAMME
GOVERNING COUNCILTwenty-ninth session
June 1982, GenevaAgenda item 6 (a)
Distr.GENERAL
DP/1982/22/Add. 126 April 1982
ORIGINAL: ENGLISH
I S UPPORT I
L ,
UNITED NATIONS TECHNICAL CO-OPERATION ACTIVITIES
STATISTICAL INFORMATION FOR 1981
Report of the Secretary-General
CONTENTS
Page
Explanatory Note ............... ¯ ¯ ¯ ¯ ¯ ¯ ¯ ¯ ¯ ¯ ¯ ¯ 3
Tables
i. Project Expenditures by Organizational Entities of the United Nations . . 4
2. United Nations Regular Programme of Technical Co-operation,
Expenditures .......................
3. Project Expenditures by Source o£ Funds .................. 5
¯ Contributions Received for Financing Extrabudgetary
Technical Co-operation Activities ....... ¯ ¯ , ¯ ¯ 6
5. DTCD:
6. DTCD:
Project Expenditures by Field of Activity .......... 7
Project Expenditures by Regxon ................. 7
Number of Experts Serving in the Field .
A. Summary by nationality
B. Summary by country or area of assignment
9
¯ Number of Fellowships Awarded .........
A. Summary by country or area receiving assistance
B. Summary by host country or area of study
9¯ DTCD: Number of Experts Serving in the Field, by Nationalityof Expert ....................... i0
82ooi1500
DP/1982/22/Add, 1English
Page 2
i0. DTCD: Number of Experts Serving in the Field, by country or
Region of Assignment ........................
11. DTCD: Number of Fellowships Awarded, by Country or Area
Receiving Assistance .......................
12. DTCD: Number of Fellowships Awarded, by Host Country orArea of Study .............................
13. DTCDz Project Reports Processed at Headquarters ..........
14. DTCD: Publications Issued in 1981 ...................
15. Investments Related to DTCD Projects, by Sector and Years .......
16. Investments Related to DTCD Projects, by Region .............
17. Investments Related to DTCD Projects, by Investors ...........
18. Investments Related to DTCD Projects, by Selected Bilateral Investors . .
Figures
Io
2.
3.
4.
Trend in DTCD Total Project Expenditures ................
Trend in DTCD Project Expenditures, by Source of Funds .........
Trend in DTCD Project Expenditures, by General Field of Activity . . .
Trend in DTCD Project Expenditures, by Geographic Branch "~ . ......
11
12
13
14
15
16
16
16
16
8
8
8
8
DP/1982/22/Add. 1English
Page 3
Explanatory Note
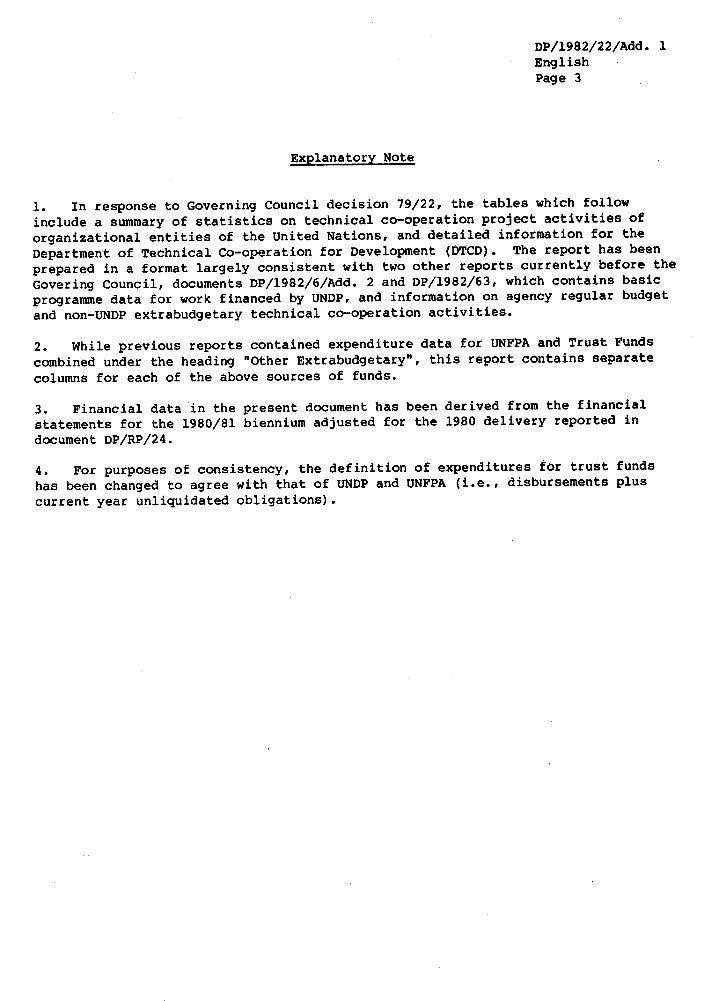
1. In response to Governing Council decision 79/22, the tables which followinclude a summary of statistics on technical co-operatlon project activities of
organizational entities of the United Nations, and detailed information for the
Department of Technical Co-operation for Development (DTCD). The report has been
prepared in a format largely consistent with two other reports currently before theGovering Council, documents DP/1982/6/Add. 2 and DP/1982/63, which contains basic
programme data for work financed by UNDP, and information on agency regular budgetand non-UNDP extrabudgetary technical co-operation activities.
2. While previous reports contained expenditure data for UNFPA and Trust Funds
combined under the heading "Other Extrabudgetary", this report contains separate
columns for each of the above sources of funds.
3. Financial data in the present document has been derived from the financialstatements for the 1980/81 biennium adjusted for the 1980 delivery reported in
document DP/RP/24.
4. For purposes of consistency, the definition of expenditures for trust funds
has been changed to agree with that of UNDP and UNFPA (i.e., disbursements plus
current year unliquidated obligations).
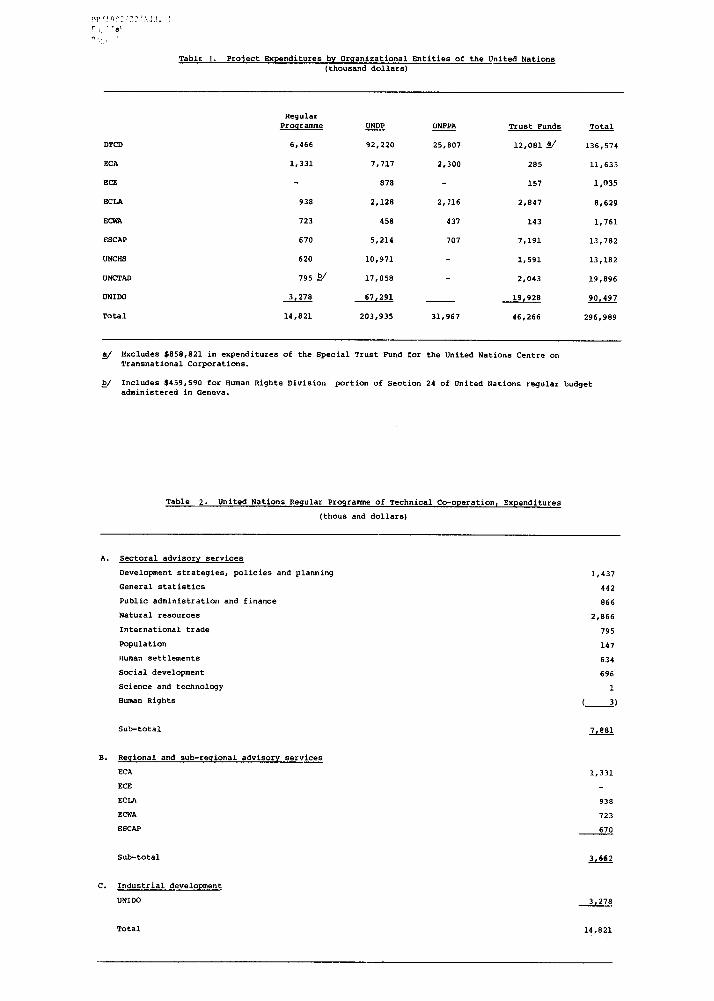
Table i. Project Expenditures by Or@anizational Entities of the United Nations(thousand dollars)
DTCD
ECA
ECE
ECLA
ECWA
ESCAP
UNCHS
UNCTAD
UNIDO
Total
RegularProgramme UND.__~P UNFPA Trust Funds Total
6,466 92,220 25,807 12,081~/ 136,574
1,331 7,717 2,300 285 11,633
878 157 1,035
938 2,128 2,716 2,847 8,629
723 458 437 143 1,761
670 5,214 707 7,191 13,782
620 10,971 1,591 13,182
795 ~/ 17,058 - 2,043 19,896
14,821 203,935 31,967 46,266 296,989
b_/
Excludes $858,821 in expenditures of the Special Trust Fund for the United Nations Centre on
Transnational Corporations.
Includes $459,590 for Human Rights Division portion of Section 24 of United Nations r~gular budgetadministered in Geneva.
Table 2. United Nations Regular Programme of Technical Co-operation~ Expenditures
(thous and dollars)
A.
B.
Sectoral advisory services
Development strategies, policies and planning
General statistics
Public administration and finance
Natural resources
International trade
Population
Human settlements
Social development
Science and technology
Human Rights
Sub-total
Regional and sub-regional advisory services
ECA
ECE
ECLA
ECWA
ESCAP
Sub-total
C. Industrial development
UNIDO
Total
1,437
442
866
2,866
795
147
634
696
1
(. 3)
1,331
938
723
670
3,278
14,821
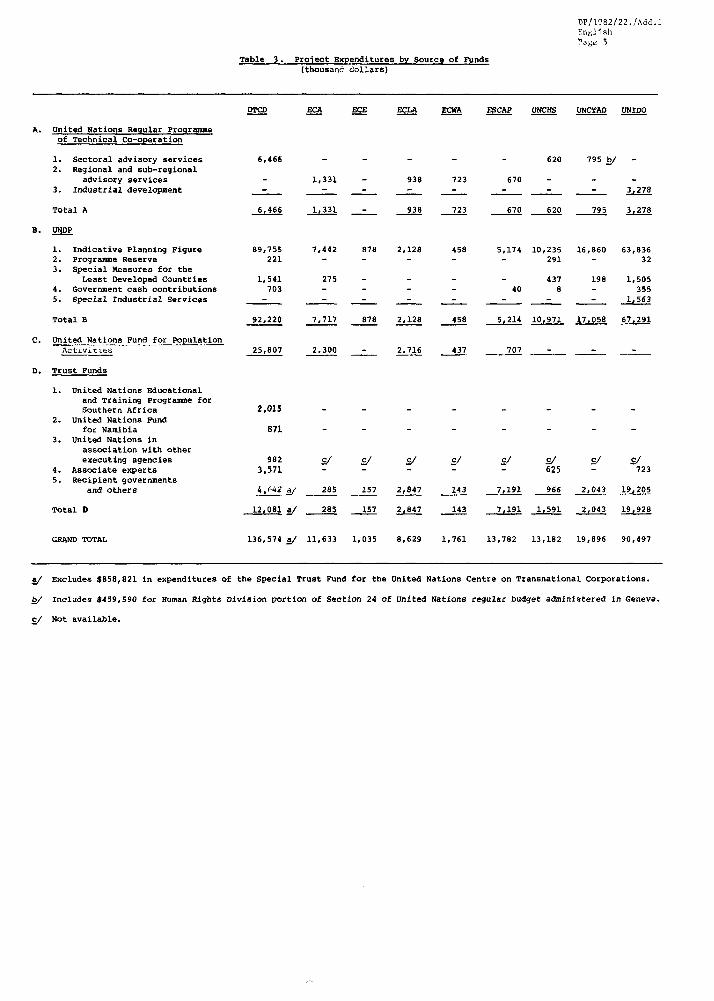
Table 3. Project Expenditures by Source of Funds(thousand dollars)
bPl1982/22.1Add.;English
Pag~ 5
DTCD EC__~A EC__~E ECLA ECWA ESCAP UNCHS UNCTAD UNIDO
Total D
A. United Nations Regular Pro~ra~ue
of Technical Co-operation
1. Sectoral advisory services 6,466 -
2. Regional and sub-regional
advisory services - 1,3313. Industrial development - -
TotaZ A 6,466
S. ~D___EP
I. Indicative Planning Figure 89,755 7,442 878
2. PrOgramme Reserve 221
3. special Measures for the
Least Developed Countries 1,541 2754. Government cash contributions 703
5. Special Industrial Services - -
Total B 92,220 7,717 878
C. United Nations Fund for ~_~_~ulationActivities 25,807 2,300
D. Trust Funds
i. United Nations Educationaland Training PrOgramme for
Southern Africa 2,015 -
2. united Nations Fund
for Namibia 8713. united Nations in
association with otherexecuting agencies 982 c/ c/
4. Associate experts 3,571 -5. Recipient governments
and others 4,6~2 a/ 285 157
a_/ 285 is7
GRAND TOTAL 136,574 a_/ 11,633 1,035
- - 620 795b_/ -
938 723 670 -
938 723 670 620 795 3_L~_278
2,128 458 5,174 10,235 16,860 63,836- - 291 32
- - 437 198 1,505- 40 8 355
- - - ~e563
2,12__~s 45__~s~ ~ ~
2.716 437 707
- - 625 -
2,847 143 7,191 966 2,043
143 ~ ~
8,629 1,761 13,782 13,182 19,896
723
90,497
a/ Excludes $858,821 in expenditures of the Speclal Trust Fund for the United Nations Centre on Transnational Corporations.
b/ Includes $459,590 for Human Rights Division portion of Section 24 of United Nations regular budget administered In Geneva.
S/ Not available.
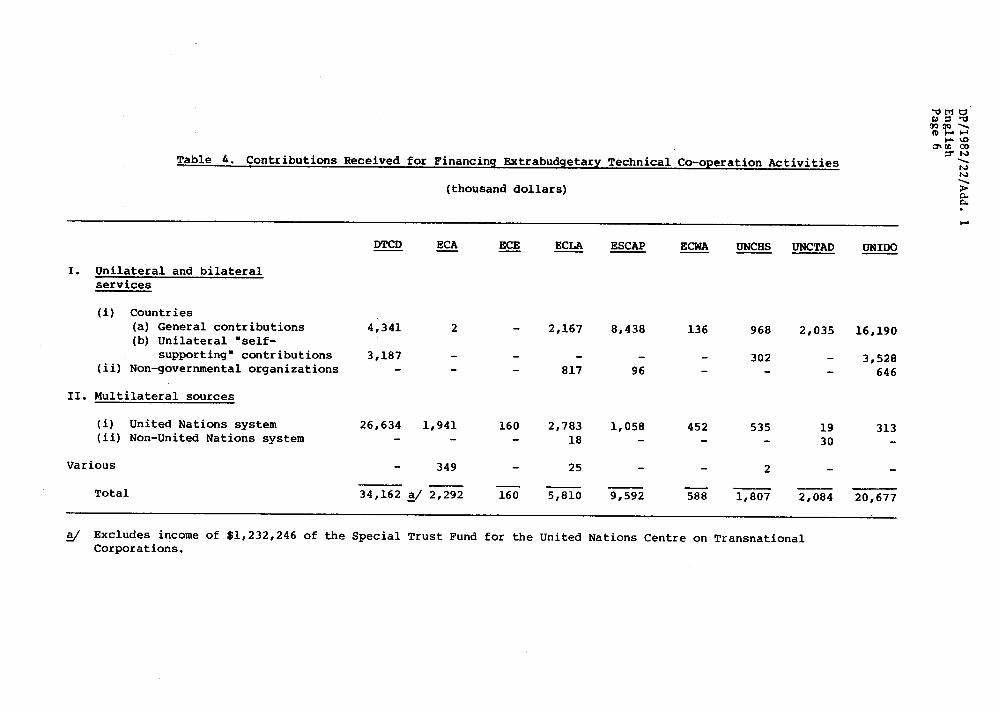
Table 4. Contributions Received for Financinq Extrabud~etar~ Technical Co-operation Activities
(thousand dollars)
I. Unilateral and bilateralservices
(i) Countries
(a) General contributions(b) Unilateral "self-
supporting" contributions(ii) Non-governmental organizations
II. Multilateral sources
(i) United Nations system
(ii) Non-United Nations system
Various
Total
DTCD EC___AA ECE ECLA ESCAP ECWA UNCHS UNCTAD UNIDO
4,341 2 - 2,167 8,438 136 968 2,035 16,190
3,187 ..... 302 - 3,528- - - 817 96 - - - 646
26,634 1,941 160 2,783 1,058 452 535 19 313- - - 18 - - - 30 -
- 349 - 25 - - 2 - -
34,162 a/ 2,292 160 5,810 9,592 588 1,807 2,084 20,677
a/ Excludes income of $1,232,246 of the Special Trust Fund for the United Nations Centre on TransnationalCorporations.
DP/1982/22/Add. IEnglishPage 7
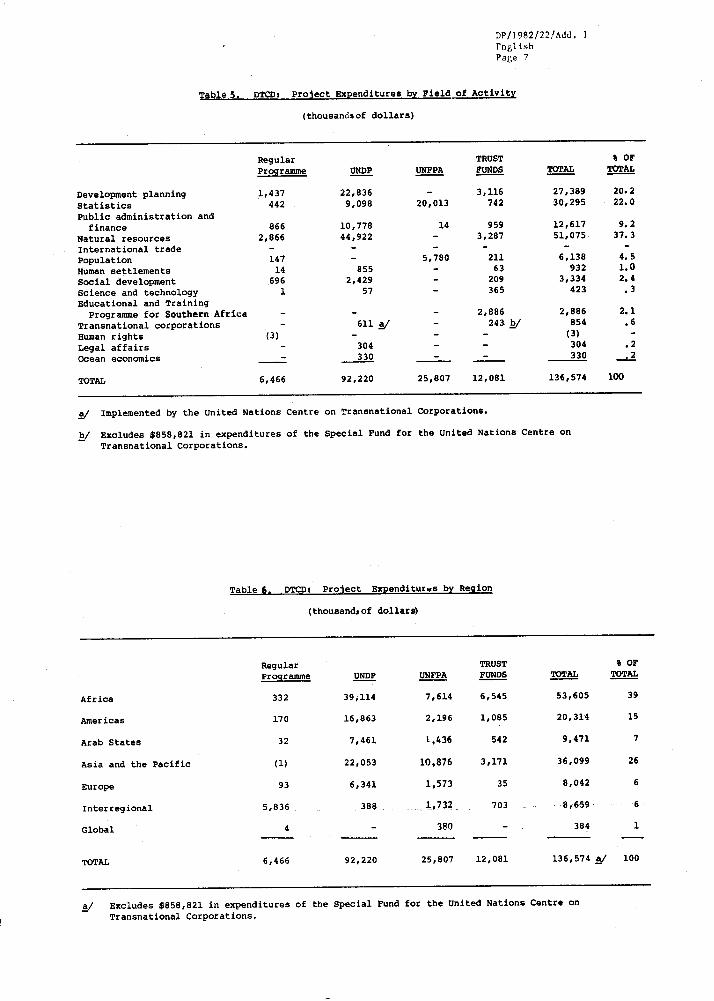
TableS. DTCDs Pro~ect Expenditures by Field of Activity
(thousandsof dollars)
Regular TRUST % OF
Programme UND___.~P UNFPA FUND.___~S TOTAL TOTAL
Development planning 1,437 22,836 - 3,116 27,389 20.2
Statistics 442 9,098 20,013 742 30,295 22.0
Public administration andfinance 866 10,778 14 959 12,617 9.2
Natural resources 2,866 44,922 - 3,287 51,075 37.3
International trade .....Population 147 - 5,780 211 6,138 4.5
Human settlements 14 855 - 63 932 1.0
Social development 696 2,429 - 209 3,334 2°4
Science and technology 1 57 - 365 423 .3
Educational and TrainingProgramme for Southern Africa 2,886 2,886 2.1
Transnatlonal corporations 611 a_/ 243 b_/ 854 .6
Human rights (3) - (3)
Legal affairs 304 - 304 .2
Ocean economics 330 - 330 .2
TOTAL 6,466 92,220 25,807 12,081 136,574 I00
a/ Implemented by the united Nations Centre on Transnatlonal Corporations.
b/ Excludes $858,821 in expenditures of the Special Fund for the United Nations Centre onTransnatlonal Corporations.
Table 6. DTCD: Pro~ect Expendltuz~s by Region
(thousand~of dollar~
Regular TRUSTProgramme UNDP UNFPA FUNDS
Africa 332 39,114 7,614 6,545
Americas 170 16,863 2,196 1,085
Arab States 32 7,461 It436 542
Asia and the Pacific (1) 22,053 10t876 3,171
Europe 93 6,341 1,573 35
Interregional 5,836 388 ........ 1,732 ..... 703 ....
Global 4 - 380 -
TOTAL 6,466 92,220 25,807 12,081
% OFTOTAL TOTAL
53,605 39
20,314 15
9,471 7
36,099 26
8,042 6
-8~6-59 ...... 6
384 1
136,574 ~/ 100
a_/ Excludes $858,821 in expenditures of the Special Fund for the United Nations Centre onTransnatlonal Corporations.
DPl1982122!Add. 1FngltshPage 8
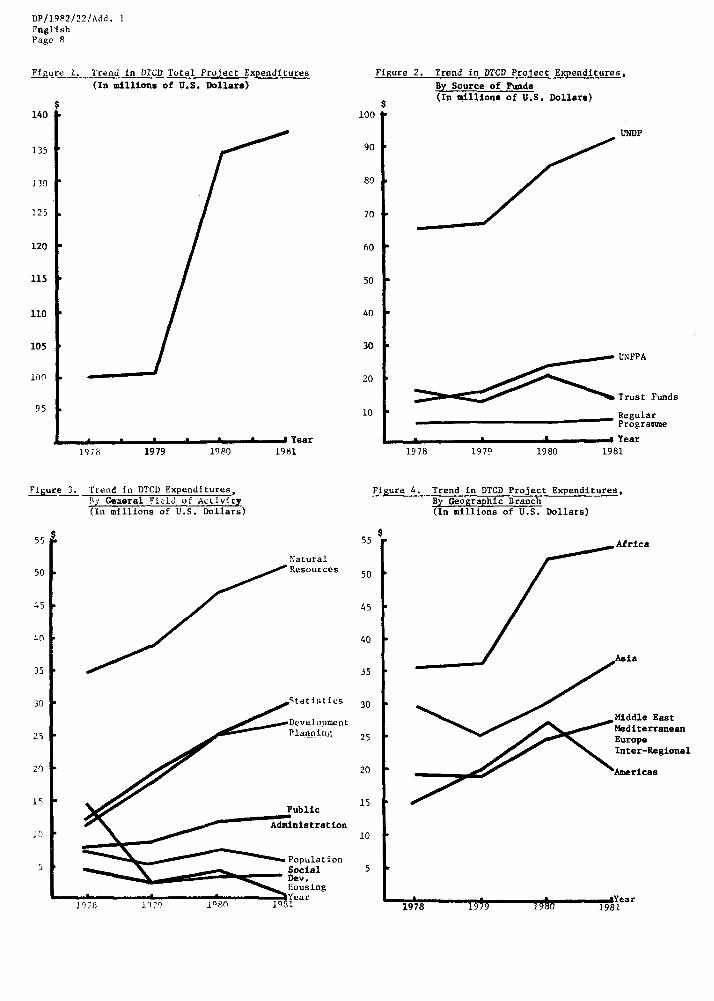
Figure 1.
140
135
130
125
120
115
110
105
1oo
95
Tread in DTCD Total Project Expenditures(In millions of U.S. Dollars)
I I I " ¯ ¯ ¯ Year
1978 1979 1980 1981
Figure 2.
$lO0
9O
80
70
6O
5O
4O
30
20
i0
Trend in DTCD Pro~ect Expenditures,By Source of Funds(In mi111ons of U.S. Dollars)
UNDP
~UNFPA
Trust Funds
__ RegularProgramme
I I I I Year1978 1979 1980 1981
Figure 3.
5~
5C
45
40
33
30
25
20
15
io
Trend in DTCD Expenditures,By General Field of AcLivlc7(In millions of U.S. Dollars)
55
Figure 4. Trend in DTCD Project Expenditures,By Geo~raphlc Branch(In millions of U.S. Dollars)
Natural
~Resources 50
45
40
35
,~tatlstics 30
Development
Planni*~ 25
20
1978 iq79 1°80
PublicAdministration
PopulationSocialDev.t{ousingYear
J
15
i0
5
A Africa
~Asla
/ Middle East
19~8a
1979 19~0IYear
1981
D."!1982129.lAdd. 1Engl t shPage 0
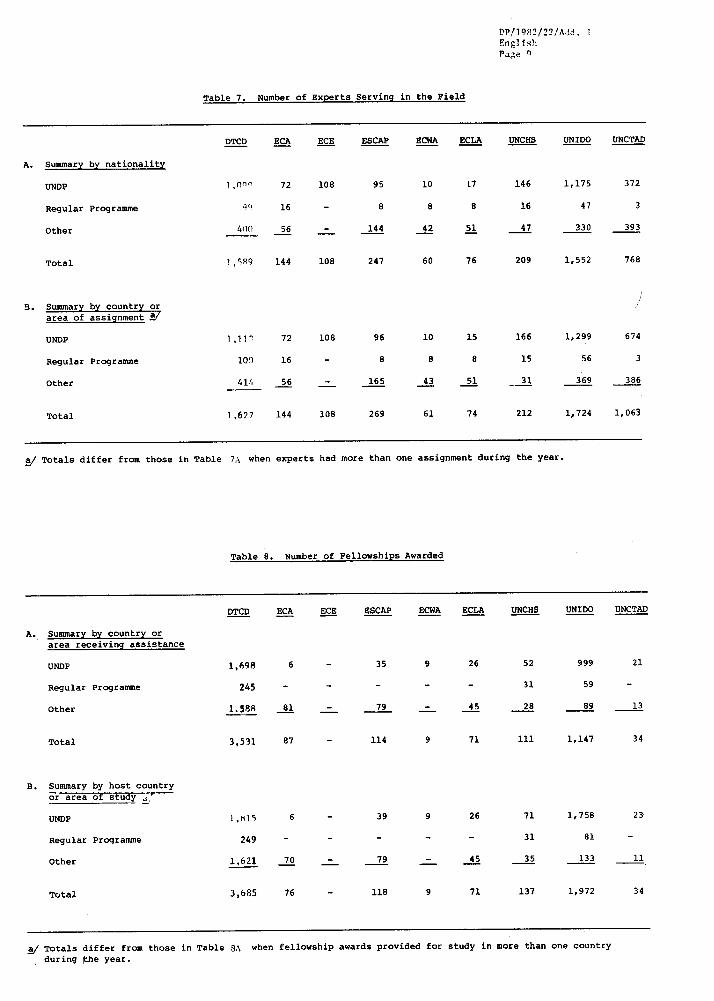
Table 7. Number of Experts Serving in the Field
DTCD ECA EC___EE ESCAP ECWA ECLA _UNCHS UNIDO UNCTAD
A. Summary by nationality
UNDP 1,Onn 72 108 95 i0 t7 146 1,175 372
Regular Programme ~ 16 8 8 8 16 47 3
Other &00 56 ~ 14___~4 4__~2 5__!i 4____/7 330 393
Total 1,SRg 144 108 247 60 76 209 1,552 768
/B. Summary by country or /
area of assignment a/
UNDP 1,I~ 72 108 96 10 15 166 1,299 674
Regular Programme I0¢) 16 - 8 8 8 15 56 3
Other 414 5._~6 __7__- 16____~5 4_~3 5___~i _ 3__!i 369 386
Total 1,627 144 108 269 61 74 212 1,724 1,063
a_/ Totals differ from those in Table 7A when experts had more than one assignment during the year.
Table 8. Number of Fellowships Awarded
Ao
DTCD EC__~A EC__EE ESCAP EC~A ECL____AA UNCH_____~S UNIDO
Summary by country orarea receiving assistance
UNDP 1,698 6
Regular Programme 245 -
Other 1.588 8___!I
Total 3,531 87
-2---
UNCTAD
35 9 26 52 999 21
- - - 31 59 -
79 __- 4__~5 2._._88 89 13
114 9 71 Iii 1,147 34
Bo Summary by host countryor area of study ~’
UNDP I,~15 6
Regular Programme 249
Other 1,621 7__~0
Total 3,685 76
- 39 9 26 71 1,758 23
- - - 31 81
- 79 ___- 4__% 3__._~s 133 1.___~1
- I18 9 71 137 1,972 34
a/ Totals differ from those in Table 8A when fellowship awards provided for study in more than one countryduring ~he year.
DP/1982/22/Add. IEnglishPage 10
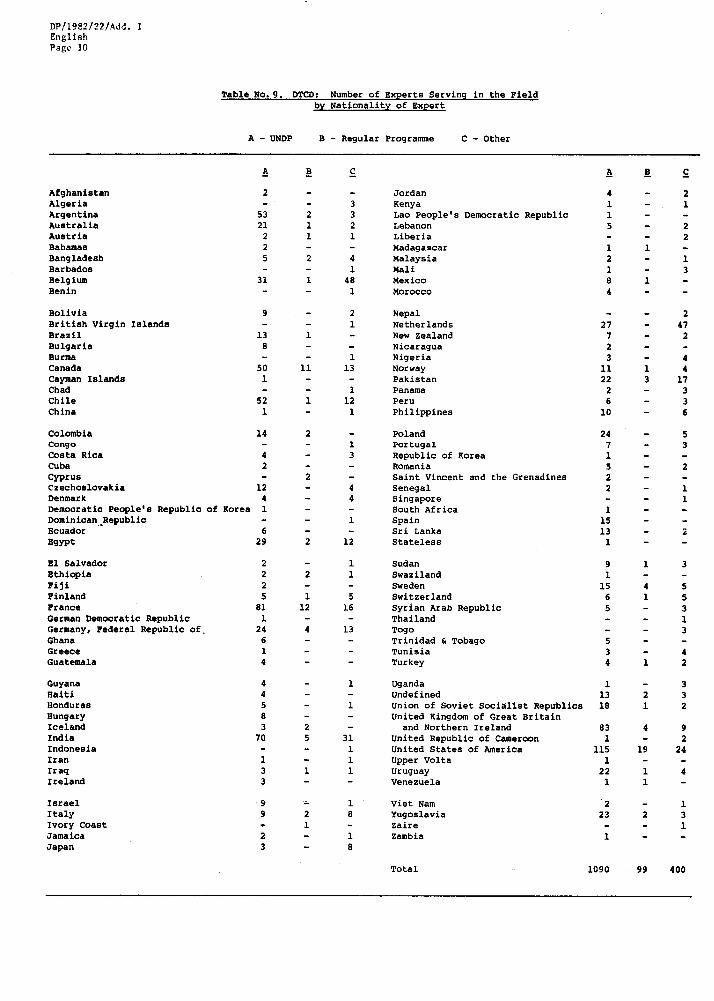
Table No. 9. DTCD: Number of Experts Servinq in the Fieldby Nationallt~ of Expert
A - UNDP B - Regular Programme C - Other
AfghanistanAlgeriaArgentinaAuatrallaAustriaBahamasBangladeshBarbadosBelgiumBenin
Bolivla 9British Virgin IslandsBrazil 13Bulgaria 8BurmaCanada 50Cayman Islands 1ChadChile 52China 1
Colombia 14CongoCosta Rica 4Cuba 2Cyprusczechoslovakia 12Denmark 4
2
53 221 1
2 125 2
31 1
Democratic People’s Republic of Korea 1DominicanRepublicEcuador 6Egypt 29
1
11
1
41
481
113
112
1
13
44
1
12
E1 Salvador 2 - iEthiopia 2 2 1FiJl 2 - -Finland 5 1 5France 8] 12 16German Democratic Republic 1 - -Germany, Federal Republic of. 24 4 13Ghana 6 - -Greece 1 - -Guatemala 4 - -
Guyana 4 - 1Haiti 4 - -Honduras 5 - 1Hungary 8 - -Iceland 3 2 -India 70 5 31Indonesia - - 1Iran 1 - 1Iraq 3 1 1Ireland 3 - -
Israel 9Italy 9Ivory CoastJamaica 2Japan 3
Jordan 4 - 2Kenya 1 - 1Leo People’s Democratic Republlc 1 - -Lebanon 5 - 2Liberia - - 2Madagascar 1 1 -Malaysia 2 - 1Mall 1 - 3Mexico 8 1 -Morocco 4 - -
Nepal - - 2Netherlands 27 - 47New Zealand 7 - 2Nicaragua 2 - -Nigeria 3 - 4Norway 11 1 4Pakistan 22 3 17Panama 2 - 3Peru 6 - 3Philippines I0 - 6
Poland 24 - 5Portugal 7 - 3Republic of Korea 1 - -Romania 5 - 2Saint Vincent and the Grenadines 2 - -Senegal 2 - 1Singapore - - 1South Africa 1 - -Spain 15 - -Sri Lanka 13 - 2Stateless 1 - -
Sudan 9 1 3Swaziland 1 - -Sweden 15 4 5Switzerland 6 1 5Syrian Arab Republic 5 3Thailand - - 1Togo - - 3Trinidad & Tobago 5 - -Tunisia 3 - 4Turkey 4 1 2
Uganda I 3Undefined 13 2 3Union of Soviet Sociallst Republics 18 1 2United Kingdom of Great Britain
and Northern Ireland 83 4 9United Republic of Cameroon 1 2United States of America 115 19 24Upper Volta 1Uruguay 22 1 4Venezuela 1 1 -
Viet Nam 2 - 1Yugoslavia 23 2 3Zaire - 1Zambia 1 - -
Total 1090 99 400
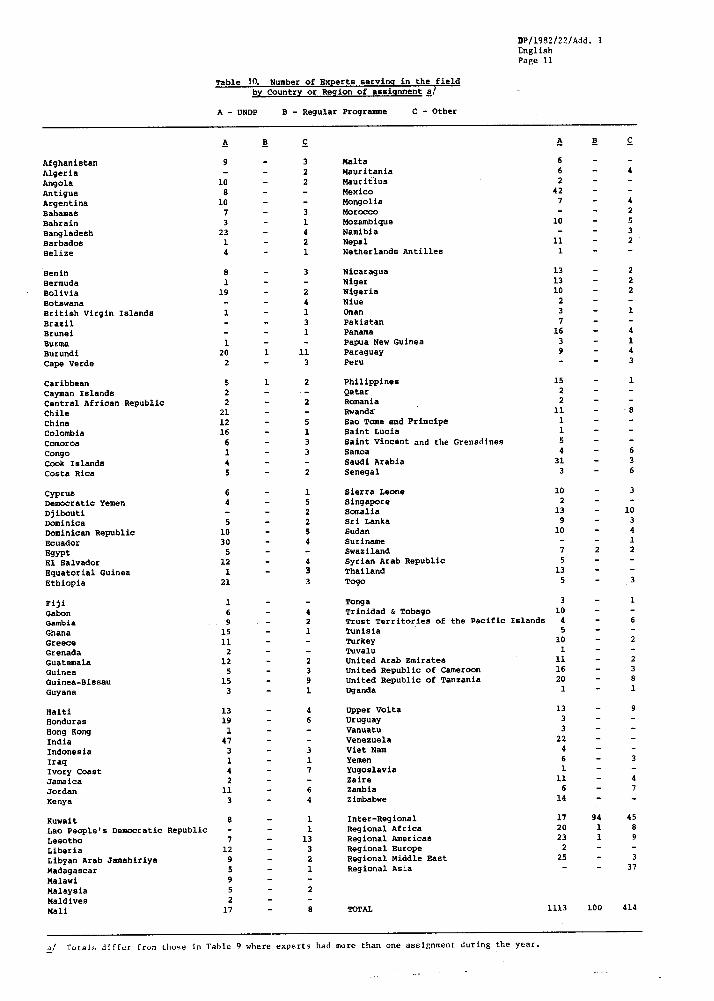
Table I~ Number of Experts serving in the fieldby Country or Region of assignment a/
A - UNDP B - Regular Programme C - Other
OP/1982/22/Add. 1English
Page II
Afghanistan 9
AlgeriaAngola 10
Antigua 8
Argentina i0
Bahamas 7
Bahrain 3
Bangladesh 23
Barbados 1
Belize 4
Benin 8
Bermuda 1
Bolivia 19
BotswanaBritish Virgin Islands 1
Brazil
BrunelBurma 1
Burundl 20
Cape Verde 2
Caribbean 5Cayman Islands 2
Central African Republic 2
Chile 21
China 12Colombia 16
Comoros 6
Congo 1
Cook Islands 4
Costa Rica 5
Cyprus 6
DemOcratic Yemen 4Djibouti
Dominlca 5
Dominican Republic l0
Ecuador 30Egypt 5
E1 Salvador 12
Equatorial Guinea 1
Ethiopia 21
Fiji 1
Gabon 6
Gambia 9
Ghana 15
GEeece Ii
Grenada 2
Guatemala 12
Guinea 5
Gulnea-Bissau 15
Guyana 3
Haiti 13
Honduras 19
Hong Kong 1
India 47
Indonesia 3
Iraq 1
Ivory Coast 4
Jamaica 2
Jordan Ii
Kenya 3
Kuwait 8
Lao People’s Democratic Republic
Lesotho 7
Liberia 12
Libyan Arab Jamahirlya 9
Madagascar 5
Malawi 9
Malaysia 5
Maldives 2
Mall 17
B
1
1
C
32
2
3
14
21
3
2
41
3
1
113
2
2
51
3
3
2
15
22
54
433
421
23
91
46
3
17
64
11
133
21
2
8
Malta 6
Mauritania 6 4
Mauritius 2
Mexico 42
Mongolia 7 - 4
Morocco - - 2
Mozambique i0 - 5
Namibia - - 3
Nepal Ii - 2
Netherlands Antilles 1 -
Nicaragua 13 - 2
Niger 13 - 2
Nigeria I0 - 2
Niue 2 -
Oman 3 - 1
Pakistan 7 - -
Panama 16 - 4
Papua New Guinea 3 - 1
Paraguay 9 - 4
Peru - 3
Phillppines 15 - 1
Qatar 2 - -
Romania 2 - -
Rwand~ " Ii - 8
Sao Tome and Prlnclpe 1 -
Saint Lucia 1 - -
Saint Vincent and the Grenadines 5 -
Samoa 4 6
Saudi Arabia 31 3
Senegal 3 6
Sierra Leone 10 3
Singapore 2 -
Somalia 13 I0
Sri Lanka 9 3
Sudan 10 4
Suriname - 1
Swaziland 7 2 2
Syrian Arab Republic 5
Thailand 13
To@o 5 3
Tonga 3 1
Trinidad & Tobago i0
Trust Territories of the Pacific Islands 4 - 6
Tunisia 5 -Turkey i0 - 2
Tuvalu 1 -
United Arab Emlrates 11 - 2
united Republic of Cameroon 16 - 3
United Republic of Tanzania 20 - 8
Uganda 1 - 1
Upper Volta 13 - 9
Uruguay 3 - -
Vanuatu 3 - -
Venezuela 22 - -
Viet Nam 4 - -
Yemen 6 - 3
Yugoslavia 1 - -
Zaire 11 - 4
Zambia 6 - 7
Zimbabwe 14 - -
Inter-Regional 17 94 45
Regional Africa 20 1 8
Regional Americas 23 1 9
Regional Europe 2 -
Regional Middle East 25 3
Regional Asia - 37
TOTAL 1113 i00 414
_a/ Total.’; differ from those in Table g where experts had more than one assignment durlng the year.
DP/1982/22/Add. lEnglishPage 12
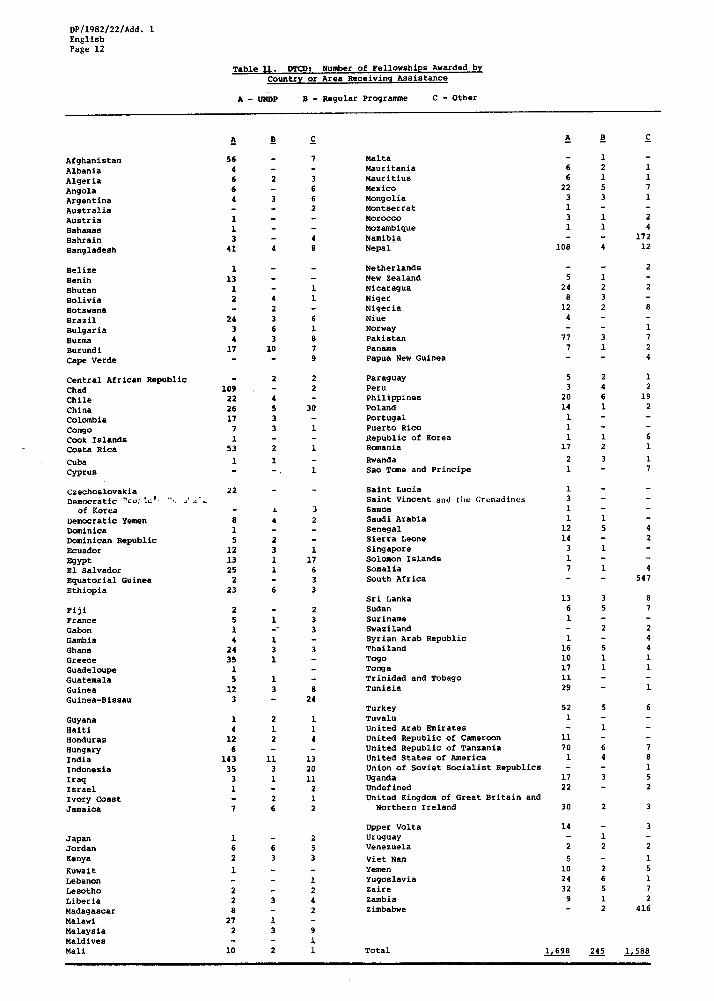
Table ~. DTCDz Number of Fellowships Awarded by
Country or Area Receiving Assistance
A - UNDP B - Regular Programme C - Other
Afghanistan 56
Albania 4
Algeria 6
Angola 6
Argentina 4
AustraliaAustria 1
Bahamas 1
Bahrain 3
Bangladesh 41
Belize I
Benin 13
Bhutan 1
Bolivia 2
BotswanaBrazil 24
Bulgaria 3
Burma 4
Burundl 17
Cape Verde
Central African Republic
Chad 109Chile 22China 26
Colombia 17
Congo 7
Cook Islands 1
Costa Riea 53
Cuba 1
Cyprus
Czechoslovakia 22
DemOcratic ~U~]~ °’" ~’ ~’ ~of Korea
Democratic Yemen 8
Dominica 1
Dominican Republic 5
Ecuador 12
Egypt 13
E1 Salvador 25
Equatorial Guinea 2
Ethiopia 23
Fiji 2
France 5
Gabon 1Gambla 4
Ghana 24
Greece 35Guadeloupe 1
Guatemala 5
Guinea 12
Gulnea-Bissau 3
Guyana 1
Haiti 4
Honduras 12
Hungary 6
India 143Indonesia 35
Iraq 3Israel 1
Ivory CoastJamaica 7
Japan 1
Jordan 6
Kenya 2
Kuwait 1
Lebanon
Lesotho 2Liberia 2Madagascar 8
Malawi 27
Malaysia 2MaldlvesMall I0
7 MaltaMauritania 6
2 3 Mauritius 6
6 Mexico 22
3 6 Mongolia 3
2 Montserrat 1
Morocco 3
- Mozambique 1
- 4 Namibia4 8 Nepal 108
Netherlands
- New Zealand 5
- 1 Nicaragua 24
4 1 Niger 8
2 Nigeria 12
3 6 Niue 4
6 1 Norway
3 8 Pakistan 77
i0 7 Panama 7
- 9 Papua New Guinea
2 2 Paraguay 5
- 2 Peru 3
4 Philippines 20
5 30 Poland 14
3 Portugal 1
3 1 Puerto Rico 1
- Republic of Korea 1
2 1 Romania 17
1 Rwanda 2
-. 1 Sac Tome and Prlneipe 1
- Saint Lucia 1
Saint Vincent and the Grenadines 3
* 3 Samoa 1
4 2 Saudi Arabia 1- Senegal 12
2 Sierra Leone 14
3 1 Singapore 3
1 17 Solomon Islands 1
1 6 Somalia 7
- 3 South Africa
6 3Sri Lanka 13
- 2 Sudan 6
I 3 Suriname 1
-- 3 Swaziland
1 Syrian Arab Republic 1
3 3 Thailand 16
i Togo I0
Tonga 17
1 Trinidad and Tobago Ii
3 8 Tunisia 29
- 24Turkey 52
2 1 Tuvalu 1
1 1 United Arab Emirates
2 4 United Republic of Cameroon ii
United Republic of Tanzania 70
ll 13 United States of America 1
3 20 Union of Soviet Socialist Republics
1 II Uganda 17
2 Undefined 22
2 I United Kingdom of Great Britain and
6 2 Northern Ireland 30
Upper Volta 14
2 Uruguay
6 5 Venezuela 2
3 3 Viet Nam 5
Yemen i0
1 Yugoslavia 24
2 Zalre 32
3 4 Zambia 9
2 Zimbabwe
1
3 91
2 1 Total 1,698
B_ _C
I2 I
1 15 7
3 I
1 21 4
- 1724 12
- 2
1
2 2
3
2 8
- 13 7
1 2- 4
2 14 2
6 19
1 2
1 62 1
3 1- 7
15 4- 2
1
I 4- 547
3 8
5 7
2 2- 4
5 41 1
1 1
- 1
5 6
1
6 74 8- 1
3 5- 2
2 3
- 3
12 2
- 1
2 56 1
5 7
1 2
2 416
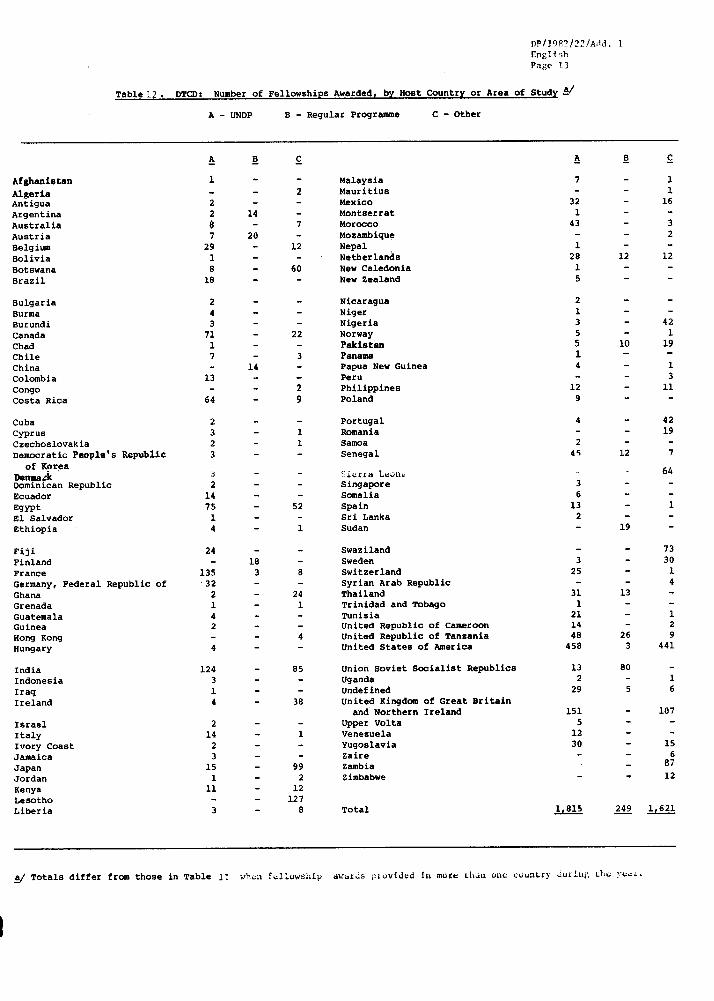
Table !2.
Page ]3
DTCD= Number of Fellowships Awarded~ by Host Country or Area of Study a_/
A - UNDP B - Regular Programme C - Other
Afshanlstan I - - Malaysia 7 - 1
AIEerla - 2 Mauritius - - 1
Antigua 2 - Mexico 32 - 16
Argentina 2 14 - Montserrat 1 - -Australia 8 7 Morocco 43 - 3
Austria 7 20 - Mozambique - - 2
Belgium 29 12 Nepal 1 - -
Bolivia 1 - - Netherlands 28 12 12
Botswana 8 - 60 New Caledonia 1 - -
Brazil 18 - - New Zealand 5 - -
Bulgaria 2 - - Nicaragua 2 - -
Burma 4 - - Niger 1 - -
Burundi 3 - - Nigeria 3 - 42
Canada 71 - 22 Norway 5 - 1
Chad 1 - - Pakistan 5 I0 19
Chile 7 - 3 Panama 1 - -
China 14 - Papua New Guinea 4 - 1
Colombia 13 - - Peru - - 3
Congo - - 2 Philippines 12 - ii
Costa Rica 64 - 9 Poland 9 -
Cuba 2 - - Portugal 4 - 42
Cyprus 3 - 1 Romania - 19
Czechoslovakia 2 - 1 Samoa 2
Democratic People’s Republic 3 - - Senegal 4~ 12 7
of KoreaDellmaEk 3 - - ~icr~a Leon= 64
Dominican Republic 2 - - Singapore 3
Ecuador 14 - - Somalia 6Egypt 75 - 52 Spain 13 1
E1 Salvador 1 - - Sri Lanka 2Ethiopia 4 - 1 Sudan - 19 -
Fiji 24 - - Swaziland - 73
Finland - 18 - Sweden 3 30
France 135 3 8 Switzerland 25 1
Germany, Federal Republic of 32 - - Syrian Arab Republic - 4
Ghana 2 - 24 Thailand 31 13 -
Grenada 1 - 1 Trinidad and Tobago 1 -
Guatemala 4 - - Tunisia 21 1Guinea 2 - - United Republlc of Cameroon 14 - 2
Hong Kong - - 4 United Republic of Tanzania 48 26 9
Hungary 4 - - United States of America 458 3 441
India 124 - 85 Union Soviet Socialist Republics 13 80 -
Indonesia 3 - Uganda 2 - 1
Iraq 1 - - Undefined 29 5 6
Ireland 4 - 38 United Kingdom of Great Britainand Northern Ireland 151 - 107
Israel 2 Upper Volta 5 - -
Italy 14 1 Venezuela 12 - -
Ivory Coast 2 Yugoslavia 30 - 15
Jamaica 3 Zalre - - 6
Japan 15 - 99 Zambia _ 87
Jordan 1 2 Zimbabwe - - 12
Kenya ii 12Lesotho - 127Liberia 3 8 Total 1,815 249 1,621
a_/ Totals differ from those in Table 11 when f~llowshlp awazds ;:~ovld~d In more than one cuunt[y &uLiug Lhc yca~.
DP/1982/22/Add. iEnglishPage 14
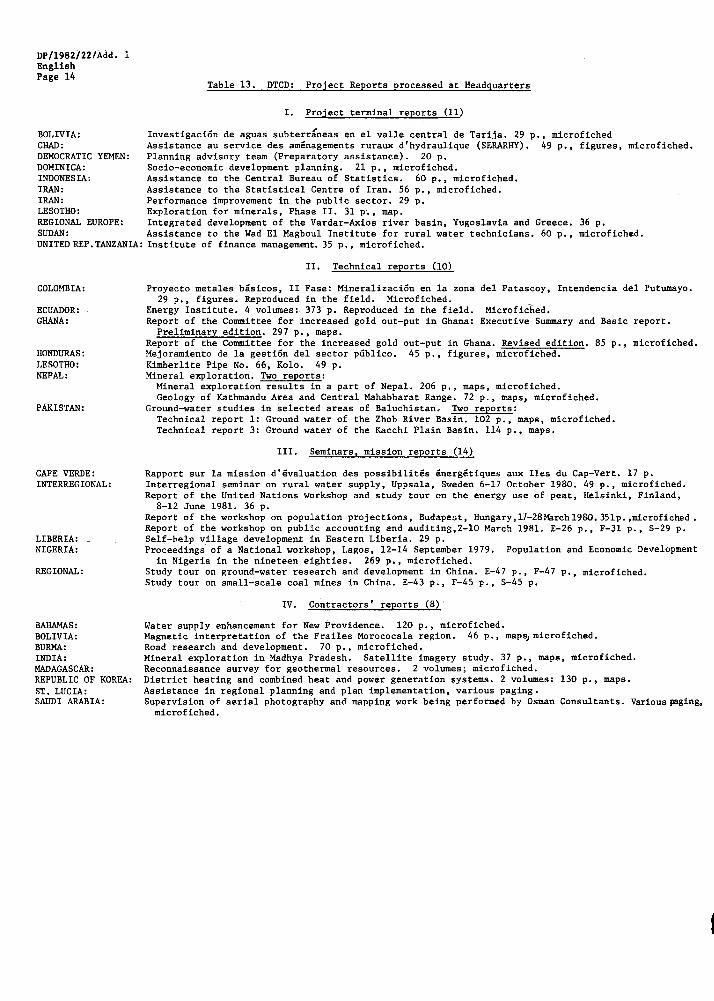
Table 13. DTCD: Project Reports processed at Headquarters
BOLIVIA:CHAD:DEMOCRATIC YEMEN:DOMINICA:INDONESIA:IRAN:IRAN:LE SOTHO:REGIONAL EUROPE:SUDAN:
I. Project terminal reports (ii)
JInvestlgaci6n de aguas subterraneas en el valle central de TarlJa. 29 p., microflchedAssistance au service des am~nagements ruraux d’hydraullque (SERARHY). 49 p., figures, mlcrofiched.Planning advisory team (Preparatory assistance). 20 Soclo-economlc development planning. 21 p., mlcroflched.Assistance to the Central Bureau of Statistics. 60 p., microfiched.Assistance to the Statistical Centre of Iran. 56 p., microfiched.Performance improvement in the public sector. 29 p.Exploration for minerals, Phase II. 31 p., map.Integrated development of the Vardar-Axlos river basin, Yugoslavia and Greece. 36 p.Assistance to the Wad E1 Magboul Institute for rural water technicians. 60 p., microflched.
UNITED REP.TANZANIA: Institute of finance management. 35 p., microfiched.
COLOMBIA:
ECUADOR:GHANA:
HONDURAS:LESOTHO:NEPAL:
PAKISTAN:
CAPE VERDE:INTERREGIONAL:
LIBERIA: _NIGERIA:
REGIONAL:
BAHAMAS:BOLIVIA:BURMA:INDIA:MADAGASCAR:REPUBLIC OF KOREA:ST. LUCIA:SAUDI ARABIA:
II. Technical reports (iO)
Proyecto metales b~slcos, II Fase: Mineralizaci6n en la zona del Patascoy, Intendencia del Putumayo.29 p., figures. Reproduced in the field. Microflched.
Energy Institute. 4 volumes: 373 p. Reproduced in the field. Microflc~hed.Report of the Committee for increased gold out-put in Ghana: Executive Summary and Basic report.
Preliminary edition. 297 p., maps.Report of the Committee for the increased gold out-put in Ghana. Revised edition. 85 p., mlcroflched.MeJoramiento de la gesti6n del sector p~hllco. 45 p., figures, mlcroflched.Kimberlite Pipe No. 66, Kolo. 49 p.Mineral exploration. Two reports:
Mineral exploration results in a part of Nepal. 206 p., maps, mlcroflched.Geology of Kathmandu Area and Central Mahabharat Range. 72 p., mapss mlcrofiched.
Ground-water studies in selected areas of Baluehistan~ Two reports:Technical report i: Ground water of the Zhob River Basin. 102 p., maps, mlcroflched.Technical report 3: Ground water of the Kacchl Plain Basin. 114 p., maps.
III. Seminars~ mission reports (14)
Rapport sur la mission d’~valuatlon des possibillt~s ~nerg~tiques aux lles du Cap-Vert. 17 p.Interreglonal seminar on rural water supply, Uppsala, Sweden 6-17 October 1980. 49 p., microflched.Report of the United Nations Workshop and study tour on the energy use of peat, Helsinki, Finland,
8-12 June 1981. 36 p.Report of the workshop on population projections, Budapest, Hungary,ll-28March1980.351p.,mlcroflched .Report of the workshop on public accounting and auditlng,2-1O March 1981. E-26 p., F-31 p., S-29 p.Self-help village development in Eastern Liberia. 29 p.Proceedings of a National workshop, Lagos, 12-14 September 1979. Population and Economic Development
in Nigeria in the nineteen eighties. 269 p., mlcroflched.Study tour on ground-water research and development in China. E-47 p., F-47 p., microfiched.Study tour on small-scale coal mines in China. E-43 p., F-45 p., S-45 p.
IV. Contractors’ reports (8)
Water supply enhancement for New Providence. 120 p., microflched.Magnetic interpretation of the Frailes Morococala region. 46 p., map%mlcrofiched.Road research and development. 70 p., microflched.Mineral exploration in Madhya Pradesh. Satellite imagery study. 37 p., maps, mlcroflched.Reconnaissance survey for geothermal resources. 2 volumes; microfiched.District heating and combined heat and power generation systems. 2 volumes: 130 p., maps.Assistance in regional planning and plan implementation~ various paging.Supervision of aerial photography and mapping work being performed by Osman Consultants. Varlouspaging,
mlcrofiched.
DP11982122/Add. 1EnglishPage ]5
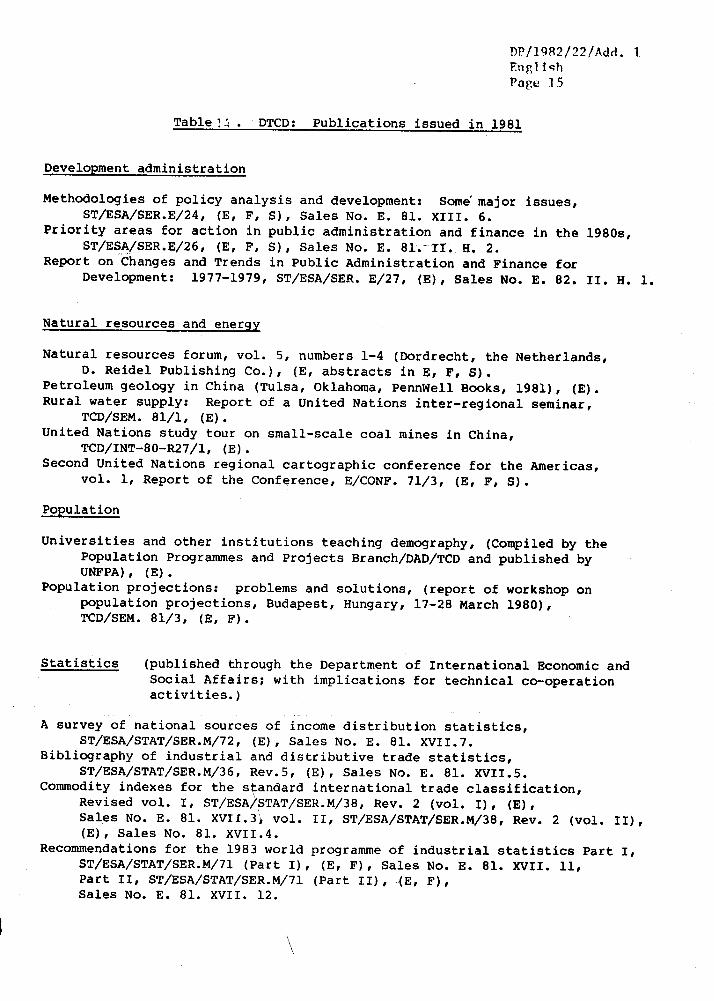
Table~4 . DTCD: Publications issued in 1981
Development administration
Methodologies of policy analysis and development: Some major issues,
ST/ESA/SER.E/24, (E, F, S), Sales No. E. 81. XXXX. Priority areas for action in public administration and finance in the 1980s,
ST/ESA/SER.E/26, (E, F, S), Sales No. E. 81. If, H. 2.Report on Changes and Trends in Public Administration and Finance for
Development: 1977-1979, ST/ESA/SER. E/27, (E), Sales No. E. 82. IX. H.
Natural resources and energy
Natural resources forum, vol. 5, numbers 1-4 (Dordrecht, the Netherlands,D. Reidel Publishing Co.), (E, abstracts in E, F, S).
Petroleum geology in China (Tulsa, Oklahoma, PennWell Books, 1981), (E).
Rural water supply: Report of a United Nations inter-regional seminar,
TCD/SEM. 81/1, (E).United Nations study tour on small-scale coal mines in China,
TCD/INT-80-R27/I, (E).Second United Nations regional cartographic conference for the Americas,
vol. I, Report of the Conference, E/CONF. 71/3, (E, F, S).
Population
Universities and other institutions teaching demography, (Compiled by the
Population Programmes and Projects Branch/DAD/TCD and published by
UNFPA), (E).Population projections: problems and solutions, (report of workshop on
population projections, Budapest, Hungary, 17-28 March 1980),
TCD/SEM. 81/3, (E, F).
Statistics (published through the Department of International Economic and
Social Affairs; with implications for technical co-operation
activities.)
A survey of national sources of income distribution statistics,
ST/ESA/STAT/SER.M/72, (E), Sales No. E. 81. XVIX.7.Bibliography of industrial and distributive trade statistics,
ST/ESA/STAT/SER.M/36, Rev.5, (E), Sales No. E. 81. XVII.5.Commodity indexes for the standard international trade classification,
Revised vol. I, ST/ESA/STAT/SER.M/38 , Rev. 2 (vol. I), (E),
Sales No. E. 81. XVXI.3~ vol. XI, ST/ESA/STAT/SER.M/38, Rev. 2 (vol. IX),(E), Sales No. 81. XVII.4.
Recommendations for the 1983 world programme of industrial statistics Part I,
ST/ESA/STAT/SER.M/71 (Part X), (E, F), Sales No. E. 81. XVIX. Part II, ST/ESA/STAT/SER.M/71 (Part II), (E, Sales No. E. 81. XVII. 12.
\
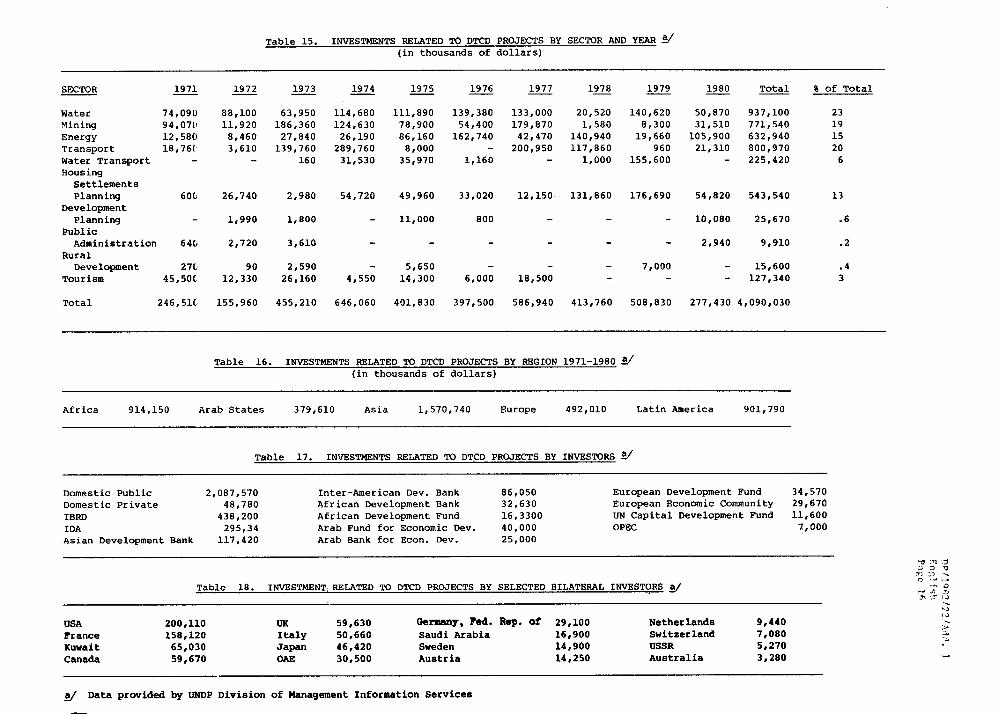
Table 15. INVESTMENTS RELATED TO DTCD PROJECTS BY SECTOR AND YEAR a_/(in thousands of dollars)
SECTOR 1971 1972 1973 1974 1975 1976 1977 1978 1979 1980 Total
Water 74,090 88,100 63,950 114,680 111,890 139,380 133,000 20,520 140,620 50,870 937,100Mining 94,07(~ 11,920 186,360 124,630 78,900 54,400 179,870 1,580 8,300 31,510 771,540Energy 12,580 8,460 27,840 26,190 86,160 162,740 42,470 140,940 19,660 105,900 632,940Transport 18,76( 3,610 139,760 289,760 8,000 - 200,950 117,860 960 21,310 800,970Water Transport - - 160 31,530 35,970 1,160 - 1,000 155,600 225,420Housing
SettlementsPlanning 606 26,740 2,980 54,720 49,960 33,020 12,150 131,860 176,690 54,820 543,540
DevelopmentPlanning - 1,990 1,800 11,000 800 - - - 10,080 25,670
PublicAdministration 64~ 2,720 3,610 ..... 2,940 9,910
RuralDevelopment 27{i 90 2,590 5,650 - - - 7,000 - 15,600
Tourism 45,50C 12,330 26,160 4,550 14,300 6,000 18,500 - - - 127,340
Total 246,516 155,960 455,210 646,060 401,830 397,500 586,940 413,760 508,830 277,430 4,090,030
% of Total
231915
206
13
.6
.2
.43
Table 16. INVESTMENTS RELATED TO DTCD PROJECTS BY REGION 1971-1980 a_/(in thousands of dollars)
Africa 914,150 Arab States 379,610 Asia 1,570,740 Europe 492,010 Latin America 901,790
Table 17. INVESTMENTS RELATED TO DTCD PROJECTS BY INVESTORS ~/
Domestic Public 2,087,570Domestic Private 48,780IBRD 438,200IDA 295,34Asian Development Bank 117,420
~nter-American Dev. Bank 86,050African Development Bank 32,630African Development Fund 16,3300Arab Fund for Economic Dev. 40,000Arab Bank for Econ. Dev. 25,000
European Development Fund 34,570European Economic Community 29,670UN Capital Development Fund 11,600OPEC 7,000
Table 18. INVESTMENTIRELATED TO DTCD PROJECTS BY SELECTED BILATERAL INVESTORS a_/
USA 200,110 UK 59,630 Germany, Fed. Rep. of 29,100
France 158,120 Italy 50,660 Saudi Arabia 16,900
Kuwait 65,030 Japan 46,420 Sweden 14,900
Canada 59,670 OAE 30,500 Austria 14,250
NetherlandsSwitzerlandUSSRAustralia
9,4407,0805,2703,280
a_/ Data provided by UNDP Division of Management Information Services