Embed Size (px)
Citation preview
UNITED NATIONS CONFERENCE ON TRADE AND DEVELOPMENT
THE DIGITAL DIVIDE REPORT:
ICT DIFFUSION INDEX 2005
United NationsNew York and Geneva, 2005
NOTE
UNCTAD serves as the lead entity within the United Nations Secretariat for matters related to science and technology. UNCTAD's work is carried out through intergovernmental deliberations, research and analysis, technical assistance activities, seminars, workshops and conferences.
The term "country" as used in this publication refers, as appropriate, to territories or areas. The designations employed and the presentation of the material do not imply the expression of any opinion whatsoever on the part of the United Nations concerning the legal status of any country, territory, city or area, or of authorities, or concerning the delimitation of its frontiers or boundaries. In addition, the designations of country groups are intended solely for statistical or analytical convenience and do not necessarily express a judgement about the stage of development reached by a particular or area in the development process. Reference to a company, public or private centres and national programmes and their activities should not be construed as an endorsement by UNCTAD of those institutions or their activities.
2

ACKNOWLEDGEMENTS
The Digital Divide Report 2005 was prepared by Larry Press and Marie-Elise Dumans under the direction and supervision of Mongi Hamdi, Chief of the Science and Technology Section of UNCTAD's Division on Investment, Technology and Enterprise Development. Contribution and comments on the report were received from Michael Minges, Peter Wolcott, Phillippa Biggs, Tim Kelly and Bruno Lanvin. Comments on the methodology and other aspects of the indices were received during the various stages of preparation of the first issue of the report in 2003 from Sanjaya Lall, Calestous Juma, Jean Camp, Alan Porter and Larry Press, as well as from members of the Commission on Science and Technology for Development.
Laila Sede provided administrative support. Diego Oyarzun-Reyes designed the cover.
We wish to thank the International Telecommunication Union for providing us with the telecommunication data needed to estimate the indices.
ii
PREFACE
Regardless of how we measure it, there is an immense information and communication technology (ICT) gap, a “digital divide,” between developed and developing nations. A person in a high income nation is over 22 times more likely to be an Internet user than someone in a low income nation. Secure Internet servers, a rough indicator of electronic commerce, are over 100 times more common in high income nations than low. In high income countries, mobile phones are 29 times more prevalent and mainline penetration is 21 times that of low income countries. Relative to income, Internet access cost in a low income nation is 150 times that of a high income nation. There are similar divides within nations. ICT is often non-existent in poor and rural areas of developing nations.
The Internet is a unique form of ICT. It is efficient and general purpose, designed to carry any type of data and support any application. This efficiency and generality is achieved by a design, which keeps the network simple while allowing the users at the “edge” of the network to invent applications and provide content and services. In addition to innovation, the bulk of the investment takes place at the edge of the network.
Since its inception, we have hypothesized that, while not a cure-all, the Internet could raise the quality of life in the developing world. This has led us to conduct hundreds of national "e–readiness" studies, train technicians and policy makers, run pilot studies, develop and deploy applications, and convene hundreds of conferences including the recent World Summit on the Information Society (WSIS). We have demonstrated viable applications in health and veterinary care, education, agricultural markets, advice, and transportation, entertainment and games, news, personal communication (text, voice, video), and e-government. Yet, after all of this activity, Internet connectivity is nearly non–existent in rural areas of developing nations and, when it is available in urban areas; it is decidedly inferior to the service in developed nations.
We have hoped that national ICT policies of private sector participation, competition and effective regulation (PCR) would close the digital divide. While they have helped to reduce it slightly in certain areas, the digital divide persists, particularly among the least developed nations. Anticipated returns are insufficient to attract capital to build networks in low income nations. While valid, PCR has limits. Pure competition does not exist in telecommunication. Duopoly is common and services are often either not available or have only a single provider in many areas within both developed and developing nations. By 1998, 89 nations had signed the WTO telecommunication accord calling for a PCR policy, but those nations have just slightly outperformed non-signatories since that time.
If we are to close the digital divide, we must go beyond PCR policy by coupling it with proactive government planning, investment and procurement. After updating UNCTAD's Information and Communication Technology Diffusion Index for 2005 and documenting the digital divide, this report presents case studies in which proactive governments have gone beyond PCR to create successful ICT policy. This leads us to discussion of proposals to construct public Internet backbones which would provide neutral connection points for competing service providers – the type of eclectic strategy seen in our successful case studies. There are roughly one billion people in about 800,000 villages in developing countries without any kind of connection. Providing each village with a high
iii
speed Internet connection would be a daunting task, a "Grand Challenge", but we believe that this goal could be achieved within a decade or so by following this approach.
In line with the commitments taken in the Tunis Agenda for the Information Society, UNCTAD will continue to work with other stakeholders, including ITU, to measure progress in bridging the digital divide.
Dr. Supachai PanitchpakdiSecretary-General of UNCTAD
iv
CONTENTS
PREFACE............................................................................................................................iiiCONTENTS..........................................................................................................................vABBREVIATIONS AND ACRONYMS............................................................................viOVERVIEW..........................................................................................................................1
1. Benchmarking ICT development...................................................................................31.1 2004 ICT diffusion index: main results.....................................................................31.2 Income analysis and regional performance: overall trends 1997-2004.....................51.3 Gainers and decliners, 1997-2004.............................................................................7
2. The digital divide.............................................................................................................92.1 ICT diffusion by income group.................................................................................92.2 ICT affordability by income group.........................................................................102.3 Lorenz Curves and Gini Coefficients......................................................................112.4 Internet backbone capacity .....................................................................................13
3. Case studies....................................................................................................................163.1 China: an eclectic ownership and competitive strategy.........................................163.2 Chile: competition with government planning and applications.............................183.3 Botswana: an effective, independent regulator.......................................................243.4 Singapore: government planning and participation pays dividends........................253.5 India: government led reform leads to growth and telecentre innovation..............283.6 United States: the first Internet backbone..............................................................32
4. Promoting the telecommunication sector: liberalization and beyond.....................354.1 PCR: privatization, competition and independent regulation................................354.2 PCR policy limits....................................................................................................364.3 Beyond PCR............................................................................................................39
5. Methodology appendix .................................................................................................47Appendix 1. Index methodology......................................................................................47Appendix 2. Definition of components..............................................................................52Appendix 3. Data sources...................................................................................................56
6. Annex tables...................................................................................................................57Annex table 1: 2004 Index of ICT diffusion by rank..........................................................57Annex table 2: ICT diffusion rankings 1997-2004.............................................................61
7. References......................................................................................................................65SELECTED UNCTAD PUBLICATIONS ON SCIENCE AND TECHNOLOGY...........72C. Technology for Development Series...........................................................................74
Do Environmental Imperatives Present Novel Problems and Opportunities for the.....74QUESTIONNAIRE.............................................................................................................76
v
Digital Divide Report: ICT Diffusion Index 2005
ABBREVIATIONS AND ACRONYMS
ADSL Asymmetric Digital Subscriber LineBJP Bharatiya Janata Party (India)BTA Botswana Telecommunication AuthorityBTC Botswana Telecommunications Corporation CEE & CIS Central and Eastern Europe and the CISCIS Commonwealth of Independent StatesCSTD Commission on Science and Technology for DevelopmentEASSy Eastern African Submarine Cable SystemERI E-Government Readiness Index (UN)ERNET Education and Research Network (India)GDP Gross Domestic ProductGIT Georgia Institute of TechnologyHDI Human Development Index (UNDP)ICT(s) Information and Communication Technolog(ies)ICTDI Information and Communication Technology Diffusion Index IDA Infocomm Development Authority (Singapore)IP Internet ProtocolISP Internet Services ProviderIT Information TechnologyITU International Telecommunication UnionIXs Internet exchange pointsLAC Latin America and the CaribbeanMbps Megabytes per secondMII Ministry of Information Industry (China)MPT Ministry of Posts and Telecommunications (China)MR Metropolitan RegionMSSRF M.S. Swaminathan Research FoundationNSF National Science Foundation (USA)NTP National Telecom Policy (India)OECD Organisation for Economic Cooperation and DevelopmentPAP People's Action Party (Singapore)PC Personal ComputerPCR Privatization, Competition and Independent RegulationPCO Public Call OfficesPOP Point of presencePPP Purchasing Power ParitySSA Sub-Saharan AfricanSUBTEL Sub-secretary of telecommunication (Chile)UN United NationsUNCTAD United Nations Conference on Trade and DevelopmentUNDP United Nations Development ProgrammeUNIDO United Nations Industrial Development OrganizationUSA United States of AmericaVoIP Voice over Internet ProtocolWSIS World Summit on the Information SocietyWTO World Trade Organization3G Third generation (mobile)
vi

Digital Divide Report: ICT Diffusion Index 2005
OVERVIEW
The first section presents our information and communication technology diffusion index (ICTDI) for 2004. As expected we see a strong correlation between a nation's ICTDI and its income and level of human development as measured by the United Nations Development Programme Human Development Index. The top ranks are dominated by industrial nations from North America, Western Europe, and the Asian "tigers," while many of the lower ranking nations are from Africa. Since the ICTDI is measuring the outcome of a complex socio-technical system, the ranks are relatively stable over time; however, we do observe more volatility in low-ranking nations than high.
In Section two we consider the digital divide. We see that regardless of the measure used, the digital divide exists and national rankings are quite consistent. The digital divide is also wide.1 For example, in spite of the fact that there are many Internet cafes and other telecentres in low income nations, a person in a high income nation is over 22 times more likely to be an Internet user than one in a low income nation, and 37% of the world population lives in low income nations. This is not surprising since the cost of slow, unreliable Internet service in a low income nation is greater than the cost of fast, reliable service in a high-income nation. When we consider income differences, Internet affordability is over 150 times greater in a high income nation than a low income nation. The only somewhat bright spot in this picture is that analysis of Lorenz curves and Gini coefficients indicates that ICT diffusion is slowly becoming more equal.
Section three presents case studies from China, Chile, Botswana, Singapore, India, and the United States. These nations were selected because they have combined ICT liberalization – privatization, competition and independent regulation – with responsible government planning, investment and procurement. We briefly outline the broad political and economic context in which telecommunication policy is formed in each nation, describe that policy, and examine some of the results.
The latter part of the twentieth century witnessed a global trend away from protected, controlled economies toward open, market economies. Telecommunication was included in this movement, and the dominant telecommunication policy has favoured privatization, competition and independent regulation (PCR). Section four reviews this history and its success, but also examines some of its limitations, observing, for example, that the ICTDI ranks of the 89 nations which had signed the WTO accord agreeing to open their telecommunication services have improved by an average of only 2.1 places since that time while non-signatories have dropped by an average of 2 places. This marginal difference and the persistence of the digital divide suggest that
1 See also UNCTAD's Information Economy Report (2005): "[Unless] the vigorous efforts being undertaken by many developing countries to catch up with their more developed partners in the dissemination and use of ICT, (...) the gaps are still far too wide and the catching-up far too uneven for the promise of a truly global information society, with its attendant benefits for sustainable social and economic development, to materialize without the sustained engagement of national Governments, the business sector and civil society, and the tangible solidarity of the international community."
1
Digital Divide Report: ICT Diffusion Index 2005
while historically beneficial, PCR may have reached a point of diminishing returns in many nations – we need to look beyond PCR.
Application-neutral Internet technology is able to deliver all telecommunication services, and during more than a decade of application development and pilot studies, we have demonstrated its efficacy in improving the quality of life in developing nations through applications in healthcare, education, entertainment, government service, business, personal and political communication, agriculture and veterinary medicine, etc. As such, we conclude the section by considering proposals to construct public Internet backbones which would provide neutral connection points for competing service providers – the type of eclectic strategy we have seen in our case studies.
The report concludes with appendices on the methodology used in computing the ICTDI and annexes showing the national ICTDI values for 2004 and the ranks for 1997-2004.
2
Digital Divide Report: ICT Diffusion Index 2005
1. Benchmarking ICT development
This section discusses our ICT diffusion index (ICTDI), which is tabulated in section 6, Annex Tables. Annex table 1 shows the 2004 ICTDI values for 180 nations, sorted by rank; Annex table 2 is an alphabetized table showing the ICTDI ranking from 1997 to 2004. Broadly speaking, the Index is a function of connectivity in a nation and the people’s ability to access and utilize it. The index and our methodology are defined in the appendices.
Section 1.1 analyzes the overall 2004 rankings; section 1.2 analyses the data by income and regional groupings since 1997; section 1.3 gives the major "gainers" and "decliners" during the 1997-2004 period.
1.1 2004 ICT diffusion index: main results
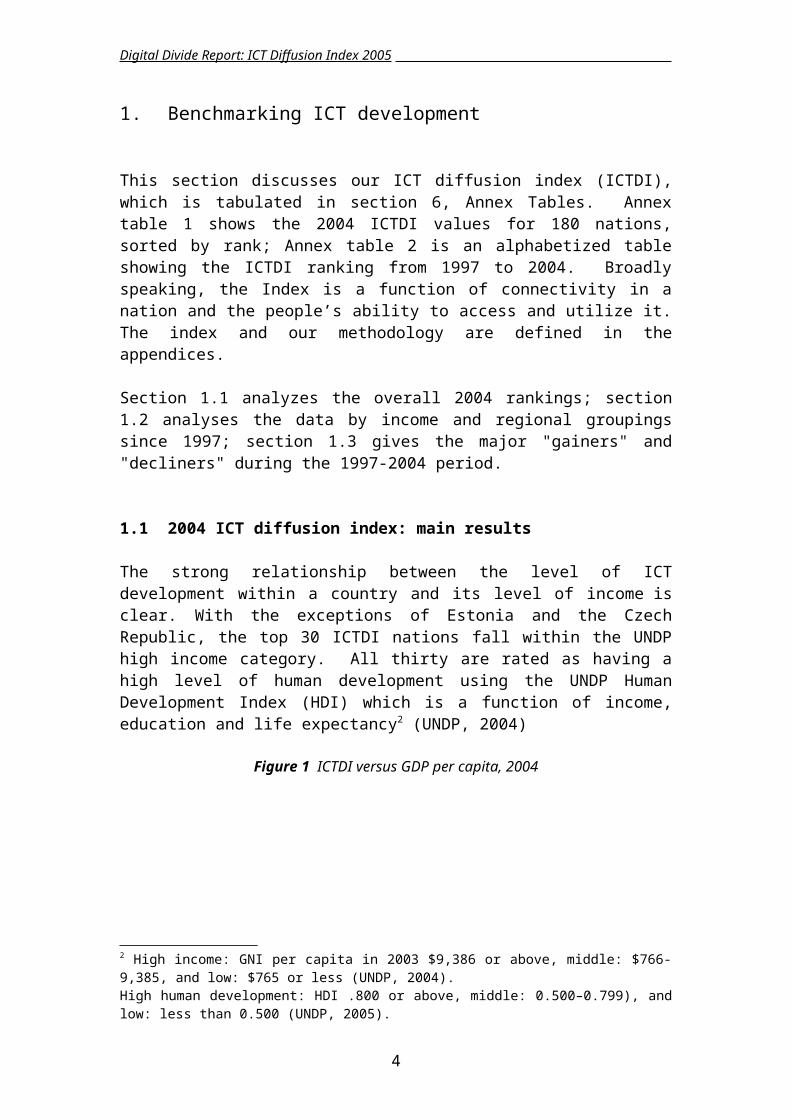
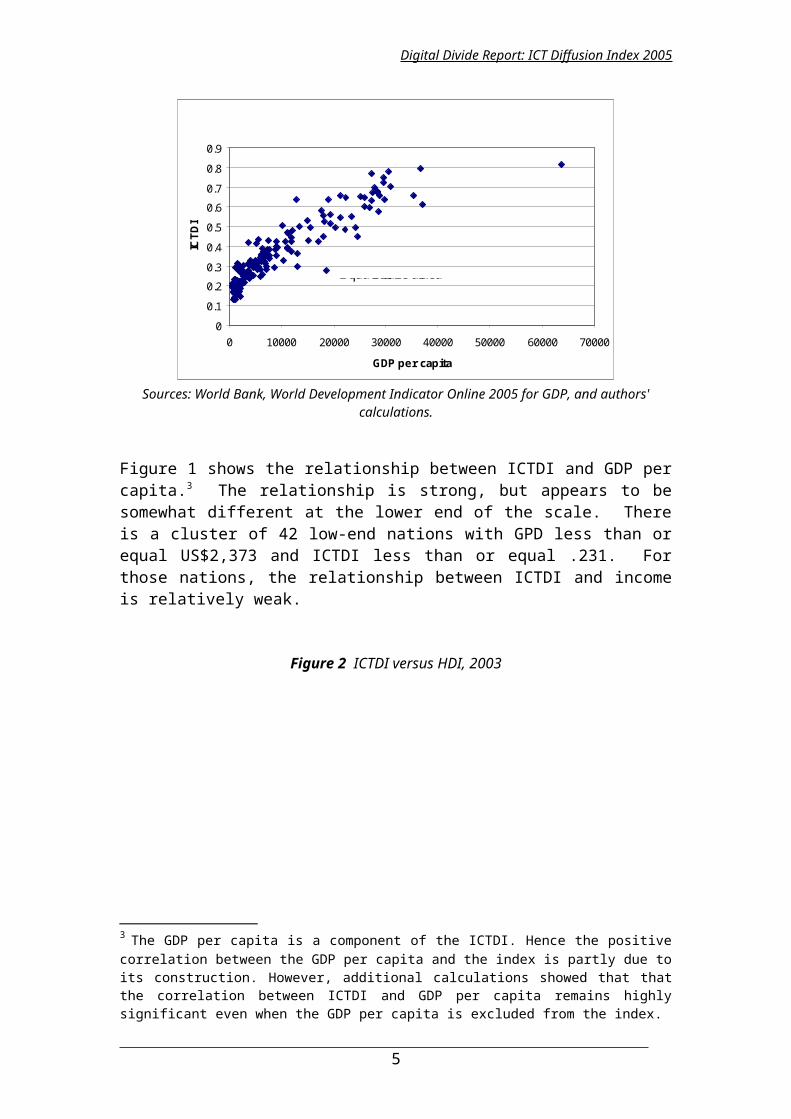
The strong relationship between the level of ICT development within a country and its level of income is clear. With the exceptions of Estonia and the Czech Republic, the top 30 ICTDI nations fall within the UNDP high income category. All thirty are rated as having a high level of human development using the UNDP Human Development Index (HDI) which is a function of income, education and life expectancy2 (UNDP, 2004)
Figure 1 ICTDI versus GDP per capita, 2004
0
0.1
0.2
0.3
0.4
0.5
0.6
0.7
0.8
0.9
0 10000 20000 30000 40000 50000 60000 70000
GDP per capita
ICTD
I
Equatorial Guinea
Estonia
Luxembourg
French Polynesia
IrelandCzech Rep.
Sources: World Bank, World Development Indicator Online 2005 for GDP, and authors' calculations.
2 High income: GNI per capita in 2003 $9,386 or above, middle: $766-9,385, and low: $765 or less (UNDP, 2004). High human development: HDI .800 or above, middle: 0.500–0.799), and low: less than 0.500 (UNDP, 2005).
3
Digital Divide Report: ICT Diffusion Index 2005
Figure 1 shows the relationship between ICTDI and GDP per capita.3 The relationship is strong, but appears to be somewhat different at the lower end of the scale. There is a cluster of 42 low-end nations with GPD less than or equal US$2,373 and ICTDI less than or equal .231. For those nations, the relationship between ICTDI and income is relatively weak.
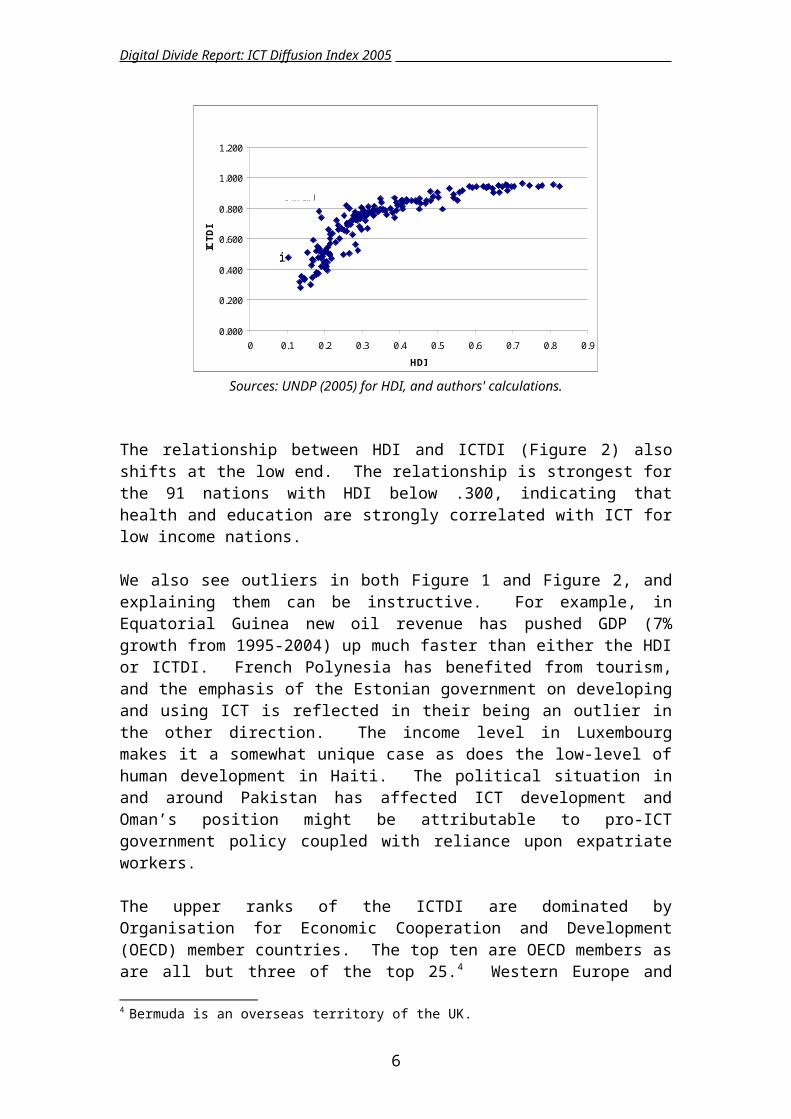
Figure 2 ICTDI versus HDI, 2003
0.000
0.200
0.400
0.600
0.800
1.000
1.200
0 0.1 0.2 0.3 0.4 0.5 0.6 0.7 0.8 0.9
HDI
ICTD
I
Oman
Haiti Pakistan
Sources: UNDP (2005) for HDI, and authors' calculations.
The relationship between HDI and ICTDI (Figure 2) also shifts at the low end. The relationship is strongest for the 91 nations with HDI below .300, indicating that health and education are strongly correlated with ICT for low income nations.
We also see outliers in both Figure 1 and Figure 2, and explaining them can be instructive. For example, in Equatorial Guinea new oil revenue has pushed GDP (7% growth from 1995-2004) up much faster than either the HDI or ICTDI. French Polynesia has benefited from tourism, and the emphasis of the Estonian government on developing and using ICT is reflected in their being an outlier in the other direction. The income level in Luxembourg makes it a somewhat unique case as does the low-level of human development in Haiti. The political situation in and around Pakistan has affected ICT development and Oman’s position might be attributable to pro-ICT government policy coupled with reliance upon expatriate workers.
The upper ranks of the ICTDI are dominated by Organisation for Economic Cooperation and Development (OECD) member countries. The top ten are OECD members as are all but three of the top 25.4 Western Europe and North America dominate the top 25 spots. Twentieth-ranked Estonia leads the ex Soviet-block
3 The GDP per capita is a component of the ICTDI. Hence the positive correlation between the GDP per capita and the index is partly due to its construction. However, additional calculations showed that that the correlation between ICTDI and GDP per capita remains highly significant even when the GDP per capita is excluded from the index.4 Bermuda is an overseas territory of the UK.
4
Digital Divide Report: ICT Diffusion Index 2005
nations and Slovenia and the Czech Republic are 29th and 30 th. Israel and the Asian “tigers” round out the top 30.
Other European nations, the Caribbean tourist destinations and relatively wealthy middle-eastern nations tend to lead the next group. The highest ranked nation in South America is number 56, Chile, followed by her “south cone” neighbours Argentina and Uruguay, and Costa Rica leads in Central America. The Andean and other South and Central American nations are behind them. Brazil, ranked 76 th, and China, ranked 90th, are important because of their size and growth.
Thirty four of the lowest ranking 45 nations are in Sub-Saharan Africa. India and its neighbours Nepal, Bhutan and Pakistan also fall into this group. The other low ranking nations tend to be scattered, for example Haiti, Cambodia, the Laotian Peoples Democratic Republic, the Solomon Islands, PapuaNewGuinea, and Yemen.
1.2 Income analysis and regional performance: overall trends 1997-2004.
This section provides an overall analysis from 1997 to 2004 by income and regional groupings.
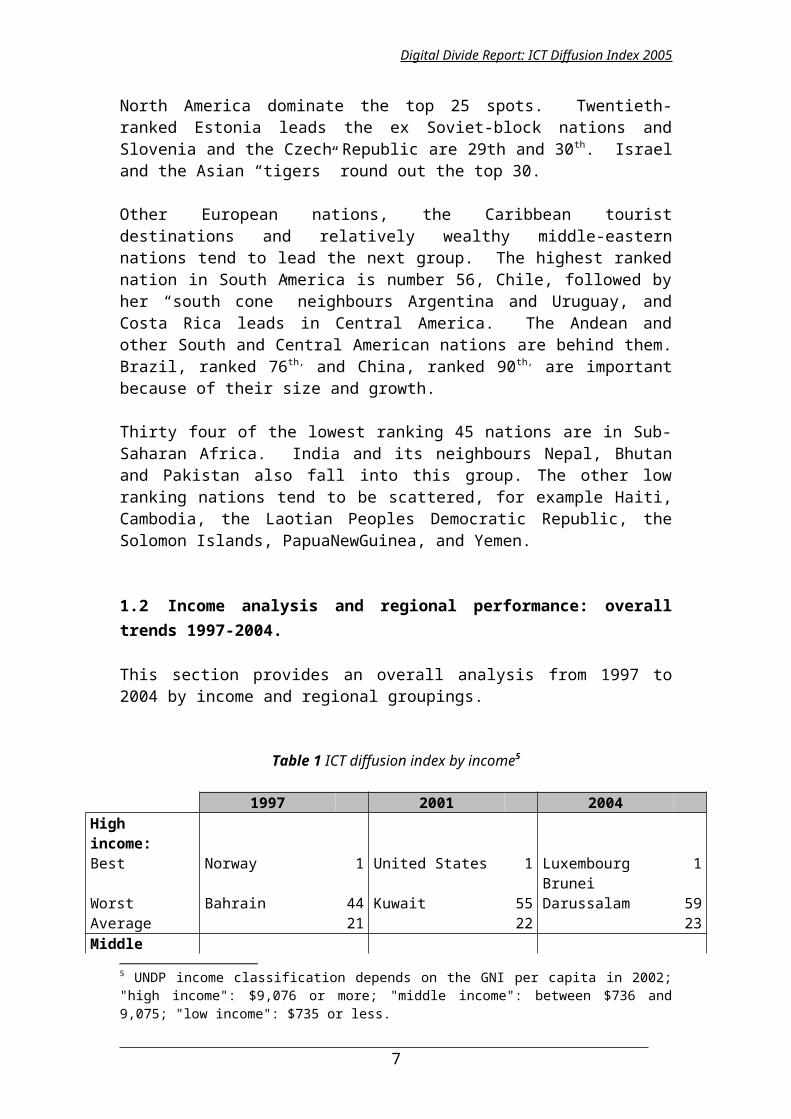
Table 1 ICT diffusion index by income5
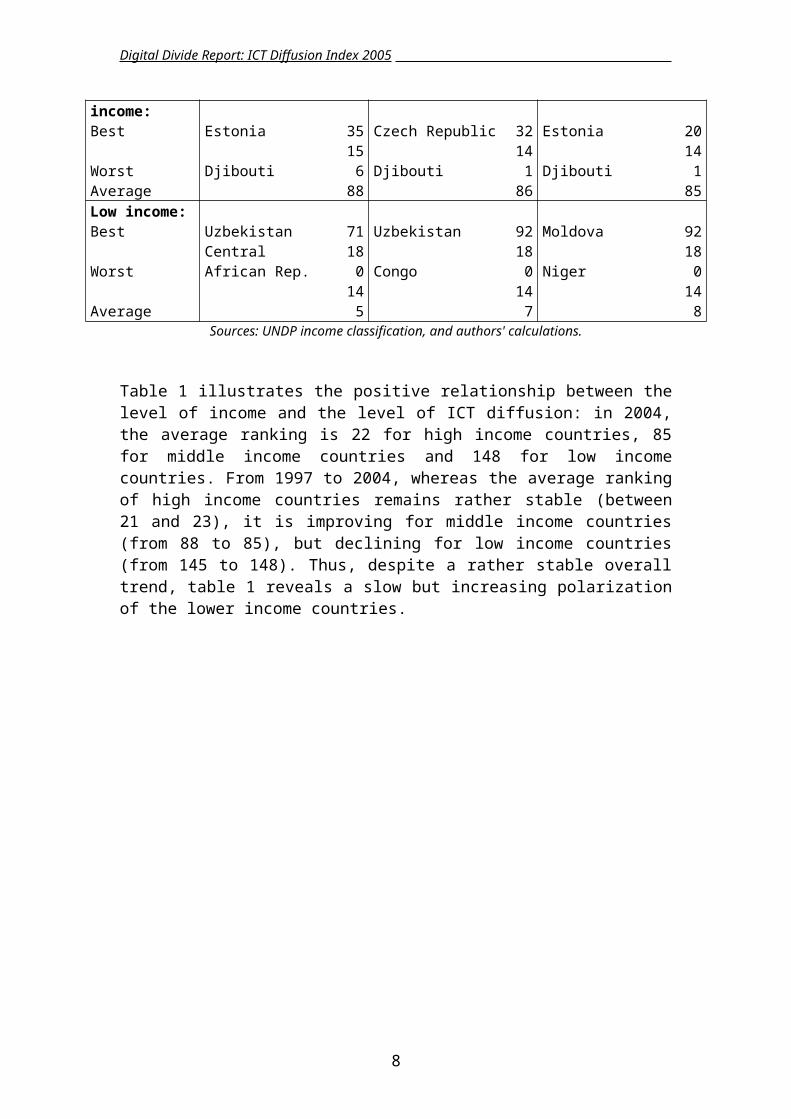
1997 2001 2004 High income: Best Norway 1 United States 1 Luxembourg 1Worst Bahrain 44 Kuwait 55 Brunei Darussalam 59Average 21 22 23Middle income: Best Estonia 35 Czech Republic 32 Estonia 20Worst Djibouti 156 Djibouti 141 Djibouti 141Average 88 86 85Low income: Best Uzbekistan 71 Uzbekistan 92 Moldova 92Worst Central African Rep. 180 Congo 180 Niger 180Average 145 147 148
Sources: UNDP income classification, and authors' calculations.
Table 1 illustrates the positive relationship between the level of income and the level of ICT diffusion: in 2004, the average ranking is 22 for high income countries, 85 for middle income countries and 148 for low income countries. From 1997 to 2004, whereas the average ranking of high income countries remains rather stable (between 21 and 23), it is improving for middle income countries (from 88 to 85), but declining for low income countries (from 145 to 148). Thus, despite a rather stable overall trend, table 1 reveals a slow but increasing polarization of the lower income countries.
5 UNDP income classification depends on the GNI per capita in 2002; "high income": $9,076 or more; "middle income": between $736 and 9,075; "low income": $735 or less.
5
Digital Divide Report: ICT Diffusion Index 2005
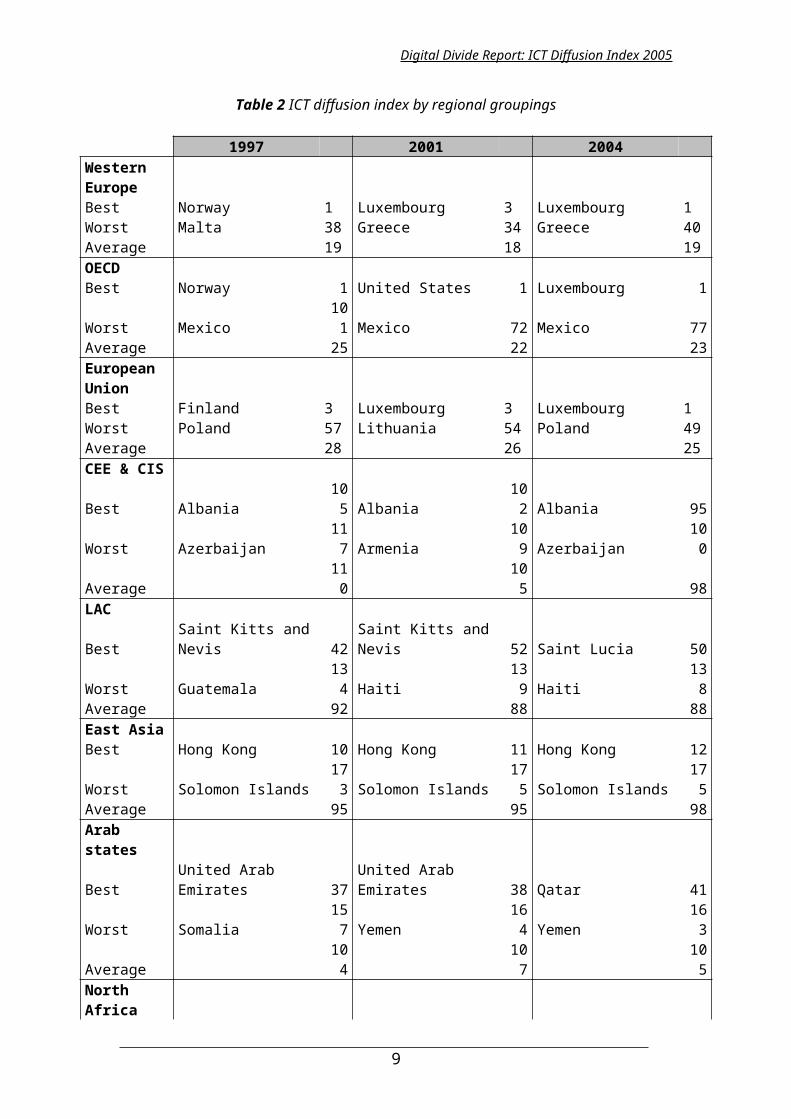
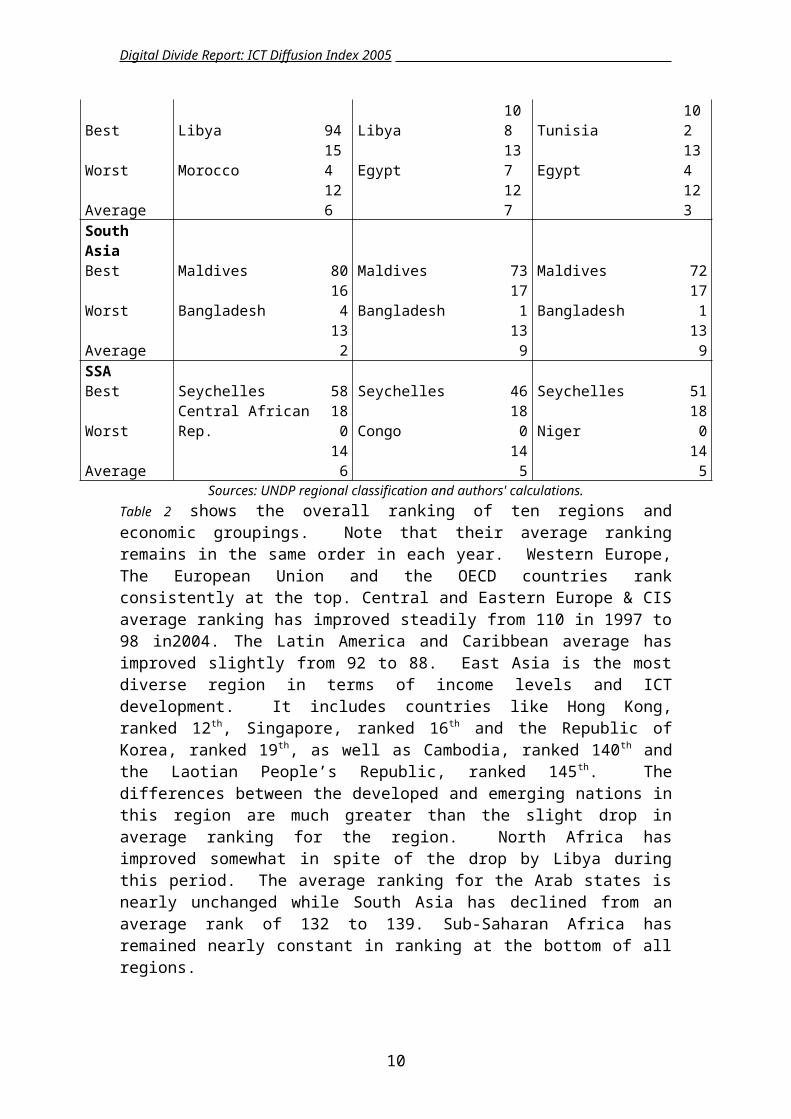
Table 2 ICT diffusion index by regional groupings
1997 2001 2004 Western EuropeBest Norway 1 Luxembourg 3 Luxembourg 1Worst Malta 38 Greece 34 Greece 40Average 19 18 19OECD Best Norway 1 United States 1 Luxembourg 1Worst Mexico 101 Mexico 72 Mexico 77Average 25 22 23European UnionBest Finland 3 Luxembourg 3 Luxembourg 1Worst Poland 57 Lithuania 54 Poland 49Average 28 26 25CEE & CIS Best Albania 105 Albania 102 Albania 95Worst Azerbaijan 117 Armenia 109 Azerbaijan 100Average 110 105 98LAC Best Saint Kitts and Nevis 42 Saint Kitts and Nevis 52 Saint Lucia 50Worst Guatemala 134 Haiti 139 Haiti 138Average 92 88 88East Asia Best Hong Kong 10 Hong Kong 11 Hong Kong 12Worst Solomon Islands 173 Solomon Islands 175 Solomon Islands 175Average 95 95 98Arab states Best United Arab Emirates 37 United Arab Emirates 38 Qatar 41Worst Somalia 157 Yemen 164 Yemen 163Average 104 107 105North AfricaBest Libya 94 Libya 108 Tunisia 102Worst Morocco 154 Egypt 137 Egypt 134Average 126 127 123South Asia Best Maldives 80 Maldives 73 Maldives 72Worst Bangladesh 164 Bangladesh 171 Bangladesh 171Average 132 139 139SSA Best Seychelles 58 Seychelles 46 Seychelles 51Worst Central African Rep. 180 Congo 180 Niger 180Average 146 145 145
Sources: UNDP regional classification and authors' calculations.Table 2 shows the overall ranking of ten regions and economic groupings. Note that their average ranking remains in the same order in each year. Western Europe, The European Union and the OECD countries rank consistently at the top. Central and Eastern Europe & CIS average ranking has improved steadily from 110 in 1997 to 98 in2004. The Latin America and Caribbean average has improved slightly from 92 to 88. East Asia is the most diverse region in terms of income levels and ICT development. It includes countries like Hong Kong, ranked 12 th, Singapore, ranked
6
Digital Divide Report: ICT Diffusion Index 2005
16th and the Republic of Korea, ranked 19th, as well as Cambodia, ranked 140th and the Laotian People’s Republic, ranked 145th. The differences between the developed and emerging nations in this region are much greater than the slight drop in average ranking for the region. North Africa has improved somewhat in spite of the drop by Libya during this period. The average ranking for the Arab states is nearly unchanged while South Asia has declined from an average rank of 132 to 139. Sub-Saharan Africa has remained nearly constant in ranking at the bottom of all regions.
1.3 Gainers and decliners, 1997-2004
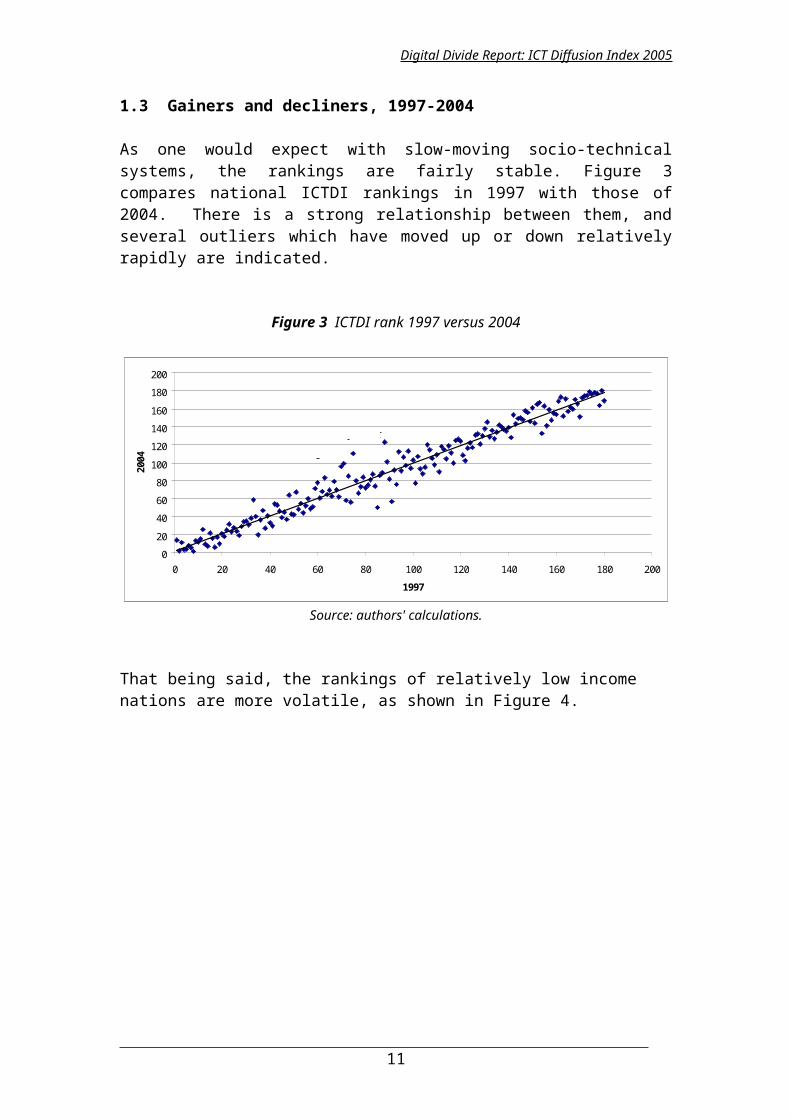
As one would expect with slow-moving socio-technical systems, the rankings are fairly stable. Figure 3 compares national ICTDI rankings in 1997 with those of 2004. There is a strong relationship between them, and several outliers which have moved up or down relatively rapidly are indicated.
Figure 3 ICTDI rank 1997 versus 2004
0
20
40
60
80
100
120
140
160
180
200
0 20 40 60 80 100 120 140 160 180 200
1997
2004
Tajikistan
Myanmar
Saint Lucia
Jamaica
Brunei Darussalam
Estonia
Morocco
Source: authors' calculations.
That being said, the rankings of relatively low income nations are more volatile, as shown in Figure 4.
7
Digital Divide Report: ICT Diffusion Index 2005
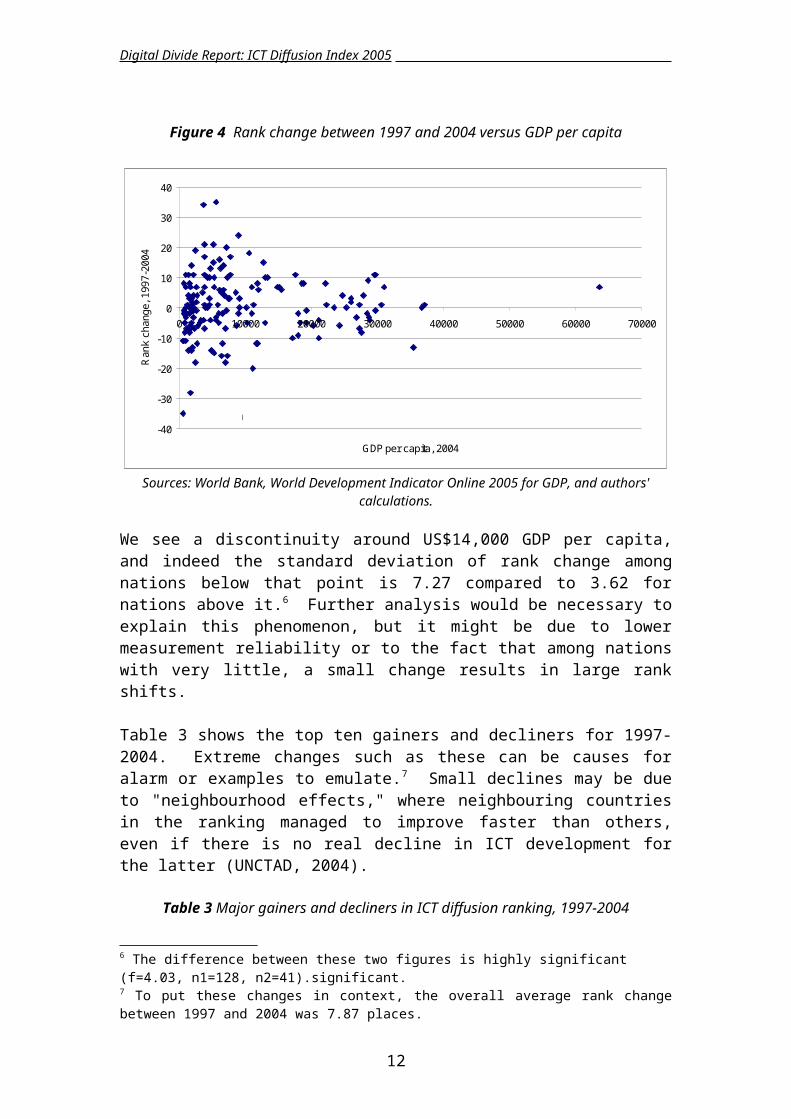
Figure 4 Rank change between 1997 and 2004 versus GDP per capita
-40
-30
-20
-10
0
10
20
30
40
0 10000 20000 30000 40000 50000 60000 70000
GDP per capita, 2004
Ran
k ch
ange
, 199
7-20
04
St. Lucia
Tajikistan
Uzbekistan
JamaicaMexico
Lebanon
Sources: World Bank, World Development Indicator Online 2005 for GDP, and authors' calculations.
We see a discontinuity around US$14,000 GDP per capita, and indeed the standard deviation of rank change among nations below that point is 7.27 compared to 3.62 for nations above it.6 Further analysis would be necessary to explain this phenomenon, but it might be due to lower measurement reliability or to the fact that among nations with very little, a small change results in large rank shifts.
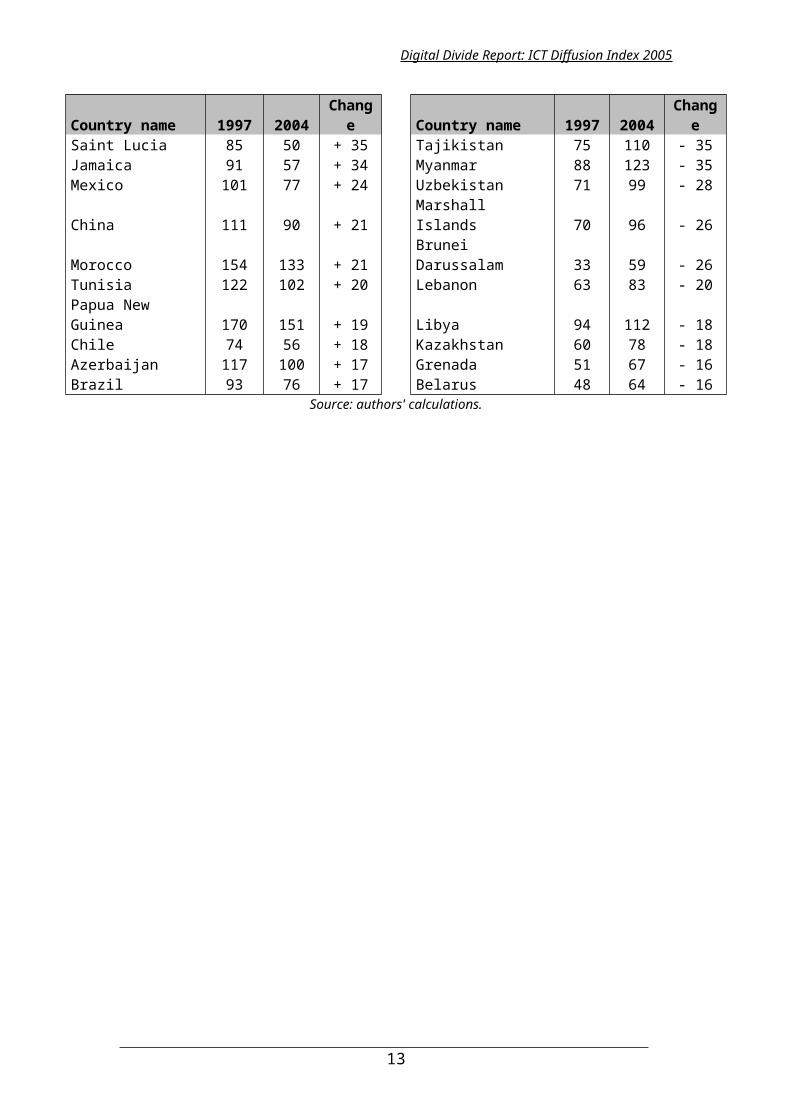
Table 3 shows the top ten gainers and decliners for 1997-2004. Extreme changes such as these can be causes for alarm or examples to emulate.7 Small declines may be due to "neighbourhood effects," where neighbouring countries in the ranking managed to improve faster than others, even if there is no real decline in ICT development for the latter (UNCTAD, 2004).
Table 3 Major gainers and decliners in ICT diffusion ranking, 1997-2004
Country name 1997 2004 Change Country name 1997 2004 ChangeSaint Lucia 85 50 + 35 Tajikistan 75 110 - 35Jamaica 91 57 + 34 Myanmar 88 123 - 35Mexico 101 77 + 24 Uzbekistan 71 99 - 28China 111 90 + 21 Marshall Islands 70 96 - 26Morocco 154 133 + 21 Brunei Darussalam 33 59 - 26Tunisia 122 102 + 20 Lebanon 63 83 - 20Papua New Guinea 170 151 + 19 Libya 94 112 - 18Chile 74 56 + 18 Kazakhstan 60 78 - 18Azerbaijan 117 100 + 17 Grenada 51 67 - 16Brazil 93 76 + 17 Belarus 48 64 - 16
Source: authors' calculations.
6 The difference between these two figures is highly significant (f=4.03, n1=128, n2=41).significant.7 To put these changes in context, the overall average rank change between 1997 and 2004 was 7.87 places.
8
Digital Divide Report: ICT Diffusion Index 2005
2. The digital divide
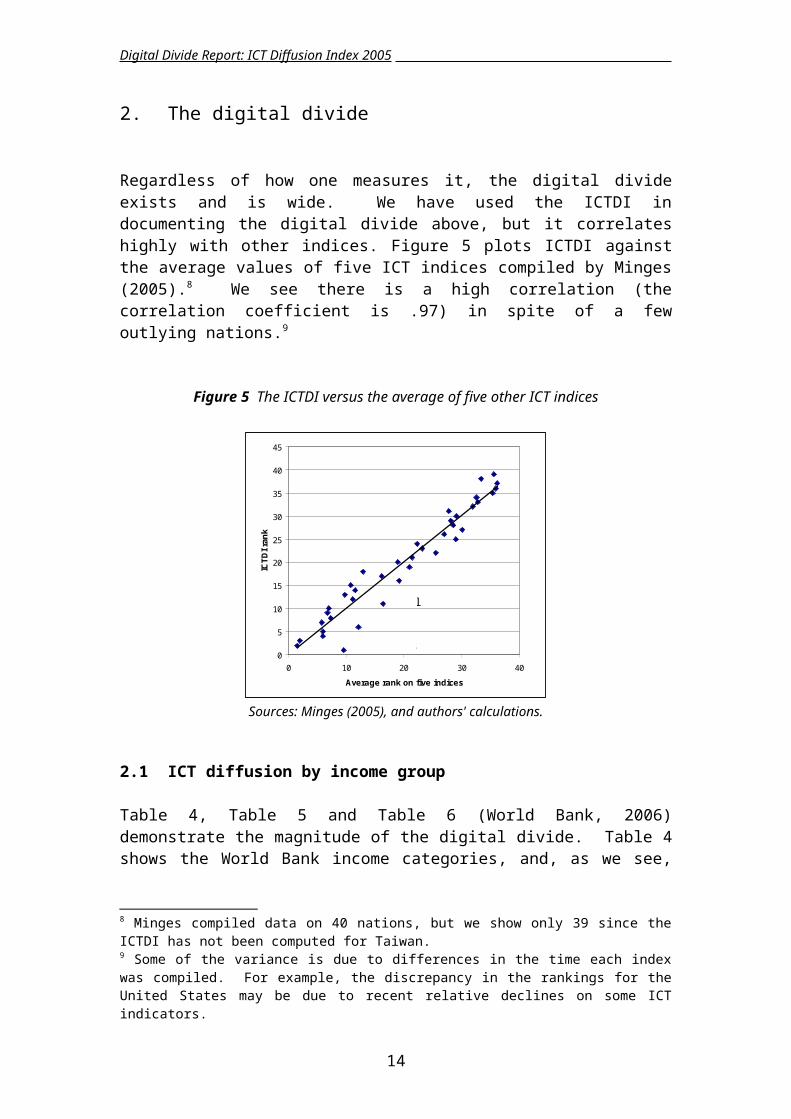
Regardless of how one measures it, the digital divide exists and is wide. We have used the ICTDI in documenting the digital divide above, but it correlates highly with other indices. Figure 5 plots ICTDI against the average values of five ICT indices compiled by Minges (2005).8 We see there is a high correlation (the correlation coefficient is .97) in spite of a few outlying nations.9
Figure 5 The ICTDI versus the average of five other ICT indices
0
5
10
15
20
25
30
35
40
45
0 10 20 30 40
Average rank on five indices
ICTD
I ran
k
United States
Israel
Australia
Sources: Minges (2005), and authors' calculations.
2.1 ICT diffusion by income group
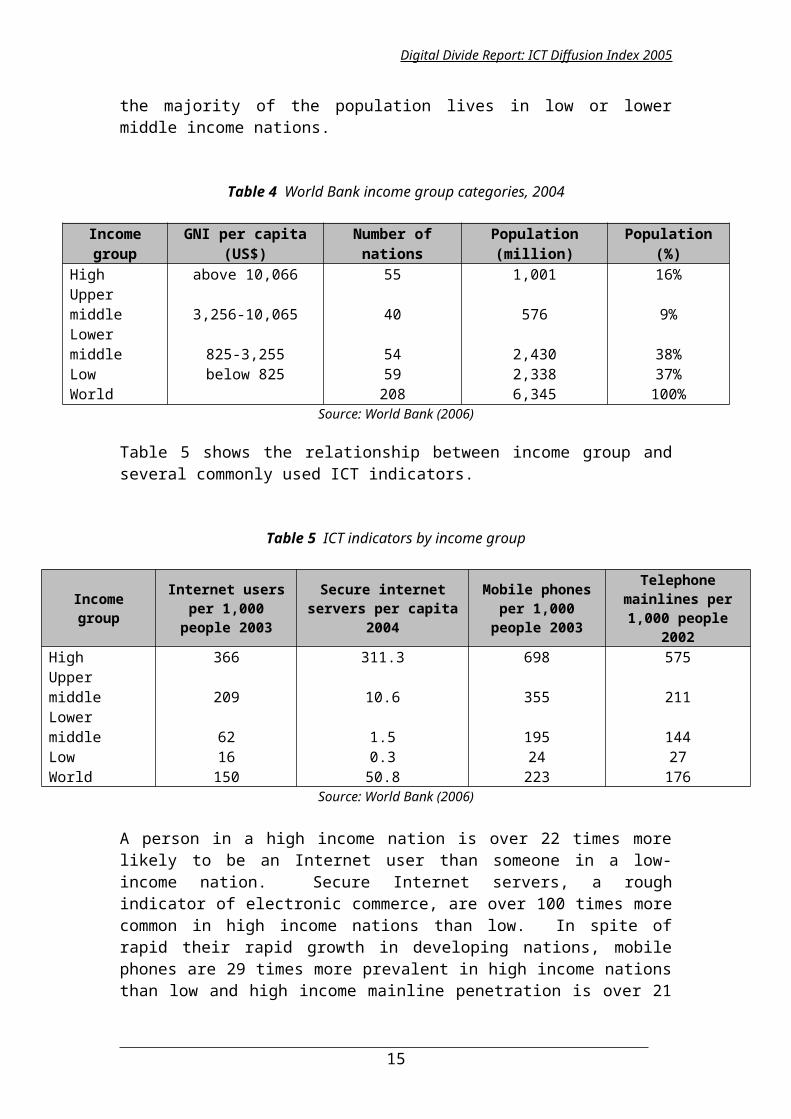
Table 4, Table 5 and Table 6 (World Bank, 2006) demonstrate the magnitude of the digital divide. Table 4 shows the World Bank income categories, and, as we see, the majority of the population lives in low or lower middle income nations.
Table 4 World Bank income group categories, 2004
Income group GNI per capita (US$) Number of nations Population (million) Population (%)High above 10,066 55 1,001 16%Upper middle 3,256-10,065 40 576 9%Lower middle 825-3,255 54 2,430 38%Low below 825 59 2,338 37%World 208 6,345 100%
Source: World Bank (2006)
8 Minges compiled data on 40 nations, but we show only 39 since the ICTDI has not been computed for Taiwan.9 Some of the variance is due to differences in the time each index was compiled. For example, the discrepancy in the rankings for the United States may be due to recent relative declines on some ICT indicators.
9
Digital Divide Report: ICT Diffusion Index 2005
Table 5 shows the relationship between income group and several commonly used ICT indicators.
Table 5 ICT indicators by income group
Income group Internet users per 1,000 people 2003
Secure internet servers per capita 2004
Mobile phones per 1,000 people 2003
Telephone mainlines per 1,000 people 2002
High 366 311.3 698 575Upper middle 209 10.6 355 211Lower middle 62 1.5 195 144Low 16 0.3 24 27World 150 50.8 223 176
Source: World Bank (2006)
A person in a high income nation is over 22 times more likely to be an Internet user than someone in a low-income nation. Secure Internet servers, a rough indicator of electronic commerce, are over 100 times more common in high income nations than low. In spite of rapid their rapid growth in developing nations, mobile phones are 29 times more prevalent in high income nations than low and high income mainline penetration is over 21 times that of low income nations. It is somewhat encouraging that the divide between high and lower-middle income nations is notably smaller; however, it is still very large, and 2.3 billion people live in low-income nations.
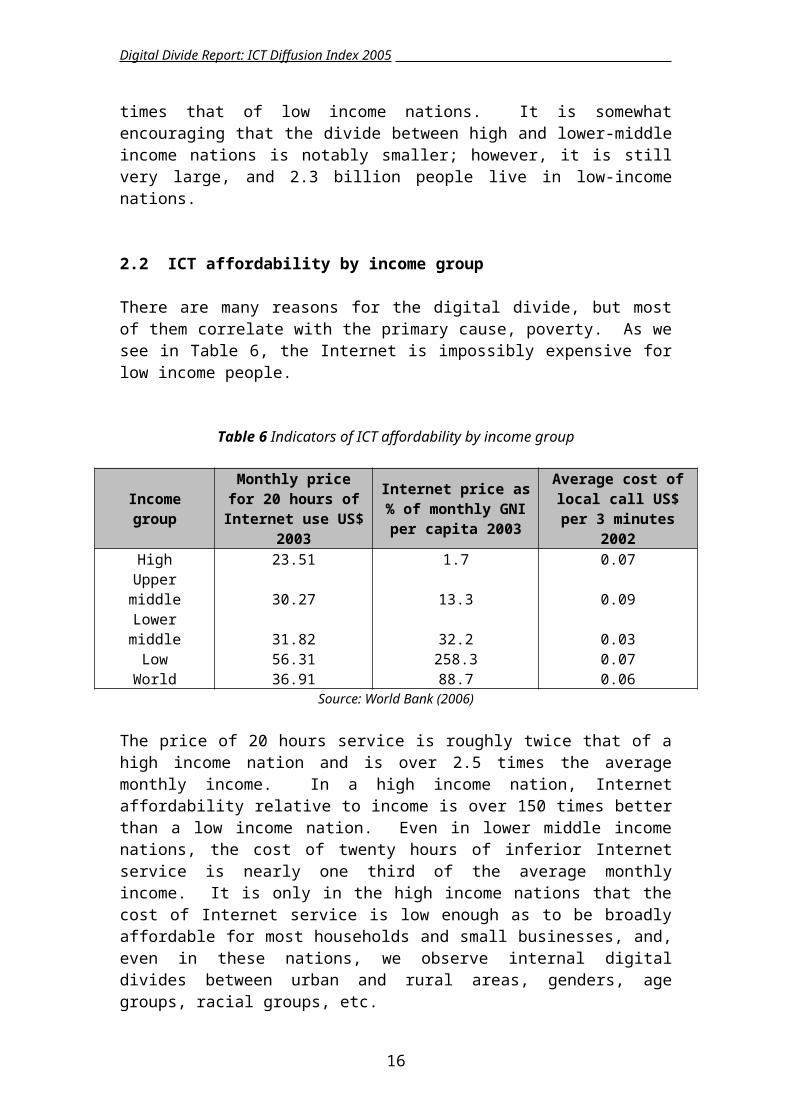
2.2 ICT affordability by income group
There are many reasons for the digital divide, but most of them correlate with the primary cause, poverty. As we see in Table 6, the Internet is impossibly expensive for low income people.
Table 6 Indicators of ICT affordability by income group
Income groupMonthly price for 20 hours of Internet use
US$ 2003
Internet price as % of monthly GNI per capita
2003
Average cost of local call US$ per 3 minutes
2002High 23.51 1.7 0.07
Upper middle 30.27 13.3 0.09Lower middle 31.82 32.2 0.03
Low 56.31 258.3 0.07World 36.91 88.7 0.06
Source: World Bank (2006)
The price of 20 hours service is roughly twice that of a high income nation and is over 2.5 times the average monthly income. In a high income nation, Internet affordability relative to income is over 150 times better than a low income nation. Even in lower middle income nations, the cost of twenty hours of inferior Internet service is nearly one third of the average monthly income. It is only in the high income nations that the cost of Internet service is low enough as to be broadly affordable for most
10
Digital Divide Report: ICT Diffusion Index 2005
households and small businesses, and, even in these nations, we observe internal digital divides between urban and rural areas, genders, age groups, racial groups, etc.
As grim as these figures are, they are misleadingly optimistic. On the average, Internet service in a low income nation is far inferior to that in a high income nation. Broadband connectivity is rare, and poor infrastructure often results in sub-standard dial up speeds and low reliability. Backbone networks are congested as are international links. As a result, the applications which are available on these networks are limited and they are more difficult to use. An Internet user on a slow, unreliable dial-up connection in a low income nation may be limited to character-oriented applications. Even simple Web browsing may be impossible. The Internet experience is qualitatively different than in a developed nation.
The cost and performance drawbacks are mitigated somewhat by the fact that many people use the Internet in shared facilities; however, even then the performance and reliability is not comparable to the mediocre broadband service in the United States not to mention the high-speed service available in several European and Asian nations.
The poverty in the low and lower-middle income nations also cuts ICT diffusion indirectly by lowering levels of health care, education, and the viability of effective, transparent legal and government institutions. The direct and indirect impediments to diffusion result in a situation where anticipated returns are insufficient to attract capital to build networks in these nations.
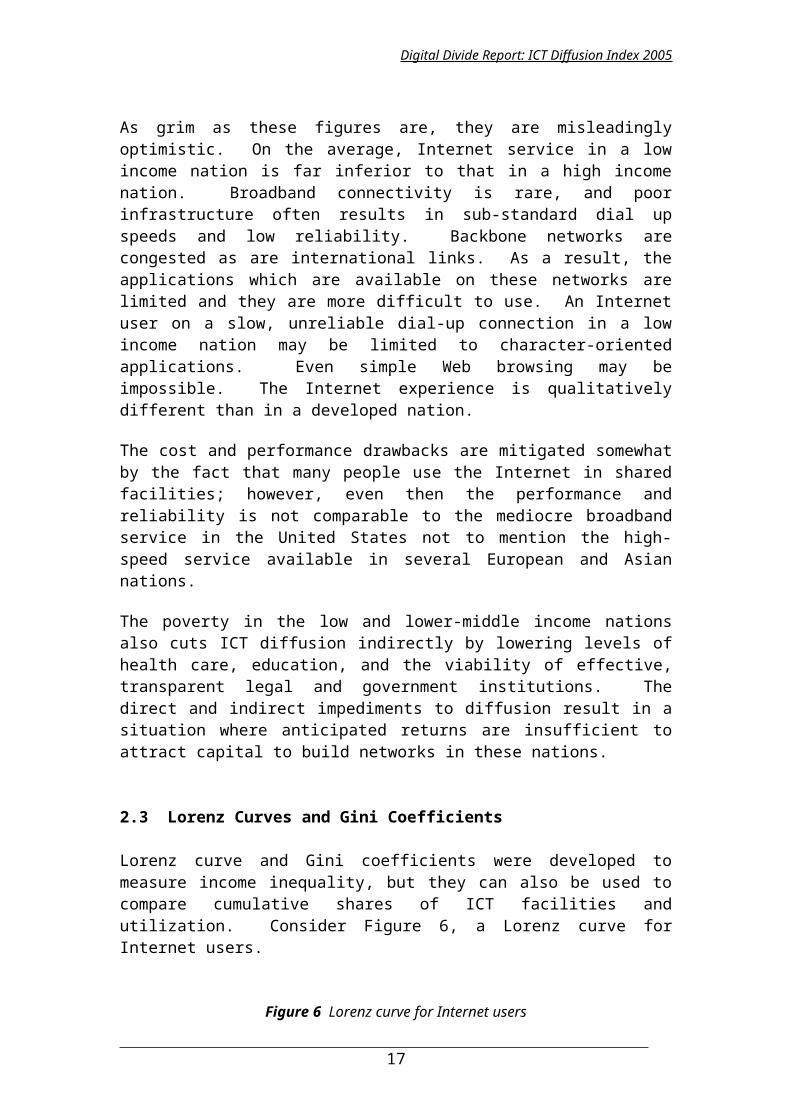
2.3 Lorenz Curves and Gini Coefficients
Lorenz curve and Gini coefficients were developed to measure income inequality, but they can also be used to compare cumulative shares of ICT facilities and utilization. Consider Figure 6, a Lorenz curve for Internet users.
Figure 6 Lorenz curve for Internet users
0
20
40
60
80
100
0 20 40 60 80 100
% cumulative share population
% c
umul
ativ
e sh
are
Inte
net u
sers
199720012004
Source: authors' calculations
11
Digital Divide Report: ICT Diffusion Index 2005
We see that in 1997, the lower 80 percent of the population only accounted for around 5 percent of Internet users.10 The Lorenz curves for 2001 and 2004 are above that of 1997, indicating increasing equality with time. If the rate of Internet use were the same in every nation, the Lorenz curve would reach the black 45 degree diagonal line. The Gini coefficient summarizes the Lorenz curve in a single number, the ratio of the area between the Lorenz curve and the diagonal to the total area under the diagonal. As such, perfect equality would result in a Gini coefficient of zero and perfect inequality, a Gini coefficient of 1.
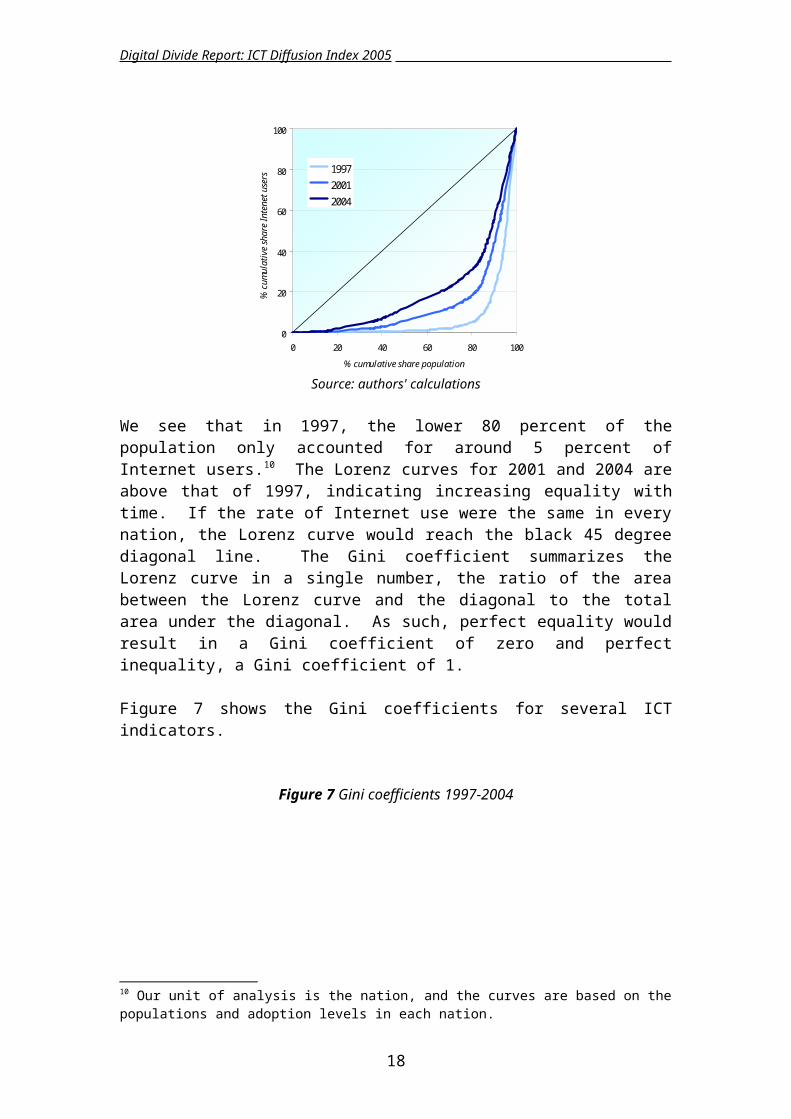
Figure 7 shows the Gini coefficients for several ICT indicators.
Figure 7 Gini coefficients 1997-2004
Main lines
Main lines
Mobiles
Mobiles
Internet users
PCs
PCs
Internet hosts Internet hosts
0.5
0.6
0.7
0.8
0.9
1.0
1997 2004
Source: authors' calculations
We notice that with the exception of Internet Hosts, Gini coefficients have declined during this period, indicating increasing equality. It is interesting that the Gini coefficient for Internet users is dropping faster than for PCs. The PC predates Internet access, which was just taking off with the general public in 1997 even in developed nations. The cost of a new Internet account is also less than that of a PC, and many people in developing nations use the Internet in shared facilities.
The mobile phone Gini coefficient is also dropping more rapidly than that of mainlines. Again, the cost of a mobile phone is less than having a mainline installed. Mobile phone diffusion in developing nations has been spurred by the availability of pre-paid calling plans and by the practice of billing the calling party. Mainline installations often have a significant waiting time in developing nations and the customer must be credit worthy. Although mobiles may be shared, for example in micro enterprises in rural villages, mainline telephones are more likely to be shared as in Indian public call offices.
10 Our unit of analysis is the nation, and the curves are based on the populations and adoption levels in each nation.
12
Digital Divide Report: ICT Diffusion Index 2005
Internet hosts is the only indicator for which the Gini coefficient is not falling. Part of the explanation is that hosts are commonly registered in generic top-level domains like com, org, net or edu rather than country domains like cl or us, and the statistics are based on these top level domain names. Furthermore, people in low income nations who wish to reach a global audience have an incentive to place content on servers in high income nations with fast, reliable connectivity and relatively low prices. Doing so may even improve domestic access. These factors inflate the disparity between low and high income nations on this indicator. On the other hand, it ignores the many million computers that share a single external address inside the firewalls of homes and organizations in high income nations.
While declining Gini coefficients for all but hosts indicate increased equality, we should bear in mind that the disparities are greater than they appear because Internet users, PCs, mainlines and mobiles are not the same in high income and low income nations. Internet use is more likely to be in a shared facility in a low income nation, and, as we have noted, less reliable and slower. A PC is likely to be older and less powerful in a low income nation and more likely to be shared at work or school. Mainlines in high income nations are more reliable on the average than in low income nations, and they are typically installed without delay. Although mobile phones are diffusing rapidly, fast, data-capable third generation mobile networks are less common in low income nations.
2.4 Internet backbone capacity 11
In early 2000, International bandwidth devoted to Internet traffic surpassed that devoted to voice and private line networks. By 2005, it exceeded the others by a factor of more than six to one. Therefore, we can get a fairly complete picture of the digital divide by observing international Internet bandwidth capacity alone.
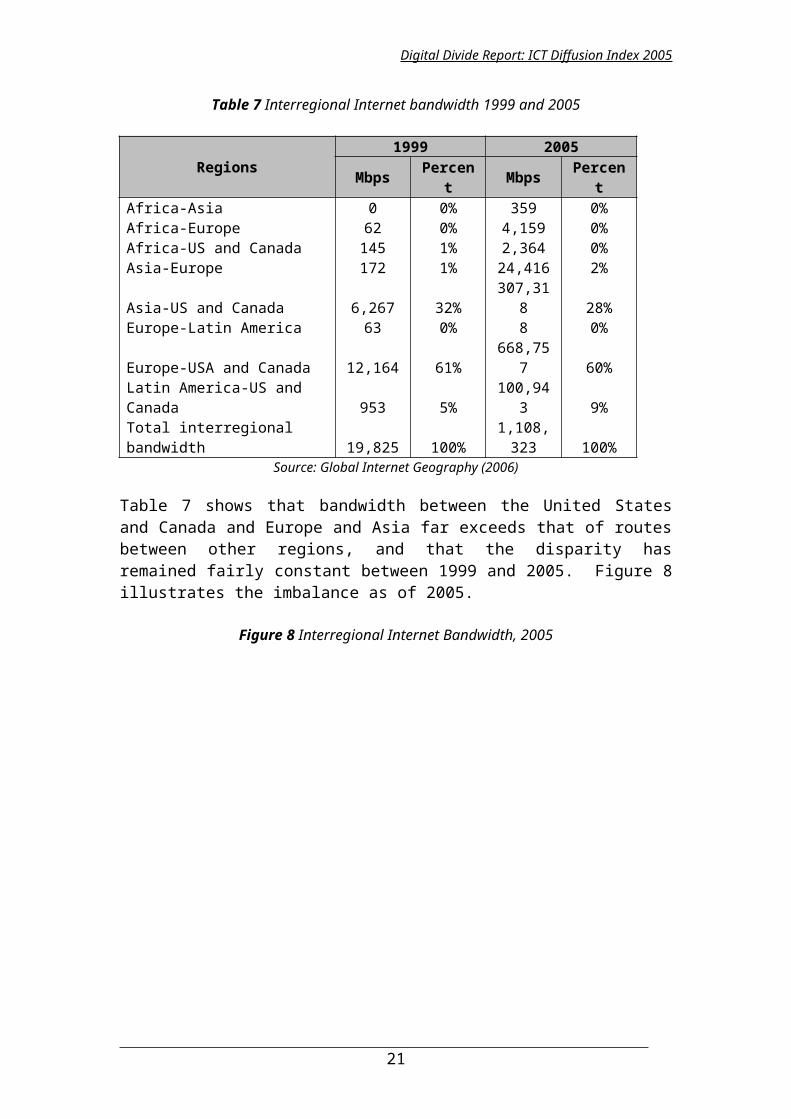
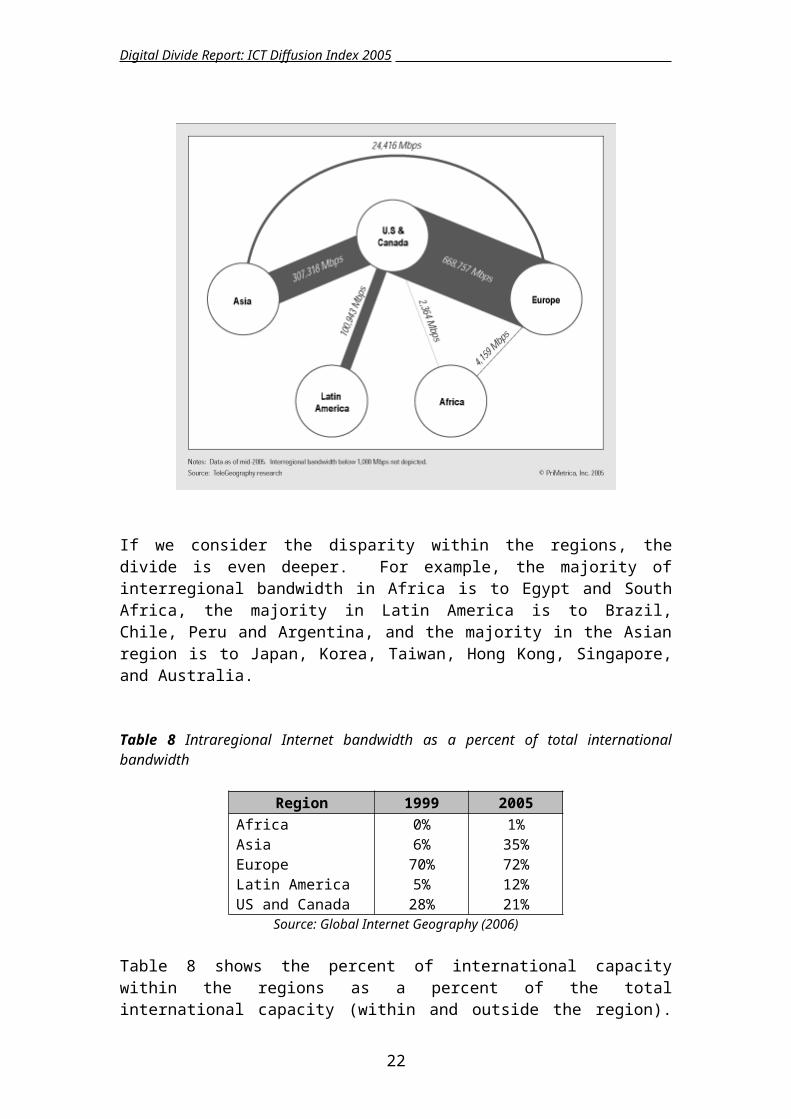
Table 7 Interregional Internet bandwidth 1999 and 2005
Regions 1999 2005Mbps Percent Mbps Percent
Africa-Asia 0 0% 359 0%Africa-Europe 62 0% 4,159 0%Africa-US and Canada 145 1% 2,364 0%Asia-Europe 172 1% 24,416 2%Asia-US and Canada 6,267 32% 307,318 28%Europe-Latin America 63 0% 8 0%Europe-USA and Canada 12,164 61% 668,757 60%Latin America-US and Canada 953 5% 100,943 9%Total interregional bandwidth 19,825 100% 1,108,323 100%
Source: Global Internet Geography (2006)
Table 7 shows that bandwidth between the United States and Canada and Europe and Asia far exceeds that of routes between other regions, and that the disparity has remained fairly constant between 1999 and 2005. Figure 8 illustrates the imbalance as of 2005. 11 The data presented in this section was derived from Global Internet Geography (2006).
13
Digital Divide Report: ICT Diffusion Index 2005
Figure 8 Interregional Internet Bandwidth, 2005
If we consider the disparity within the regions, the divide is even deeper. For example, the majority of interregional bandwidth in Africa is to Egypt and South Africa, the majority in Latin America is to Brazil, Chile, Peru and Argentina, and the majority in the Asian region is to Japan, Korea, Taiwan, Hong Kong, Singapore, and Australia.
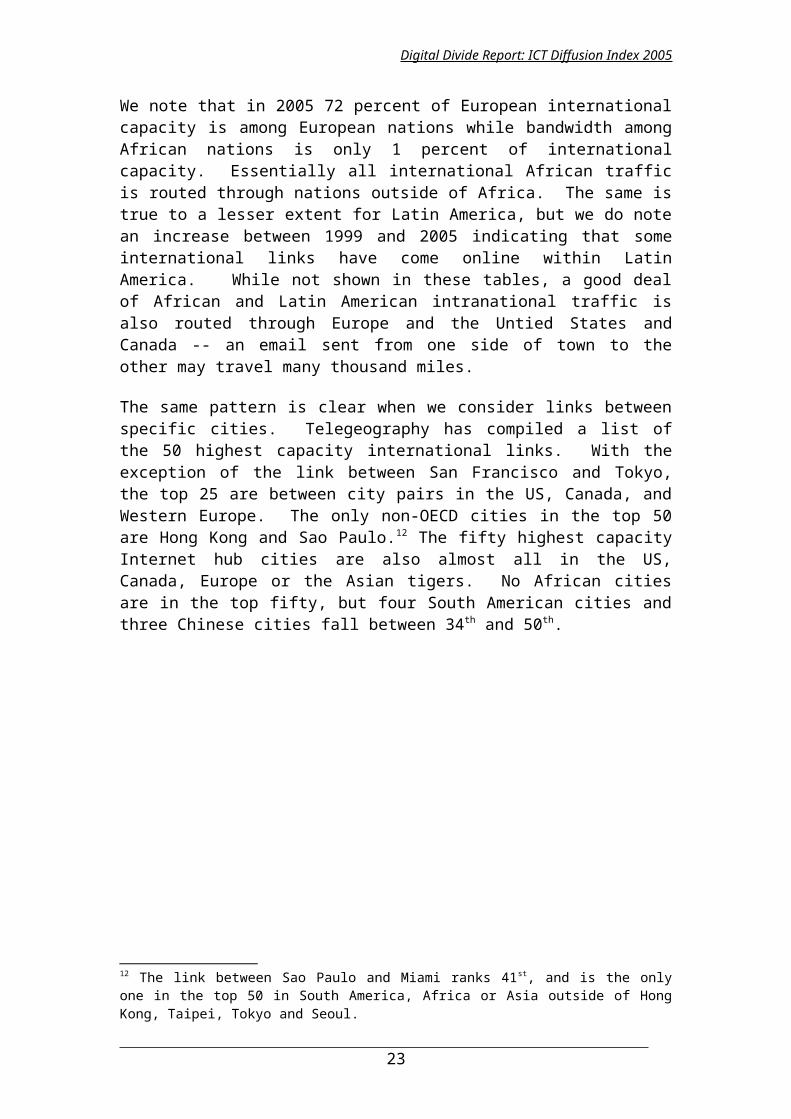
Table 8 Intraregional Internet bandwidth as a percent of total international bandwidth
Region 1999 2005Africa 0% 1%Asia 6% 35%Europe 70% 72%Latin America 5% 12%US and Canada 28% 21%
Source: Global Internet Geography (2006)
Table 8 shows the percent of international capacity within the regions as a percent of the total international capacity (within and outside the region). We note that in 2005 72 percent of European international capacity is among European nations while bandwidth among African nations is only 1 percent of international capacity. Essentially all international African traffic is routed through nations outside of Africa. The same is true to a lesser extent for Latin America, but we do note an increase between 1999 and 2005 indicating that some international links have come online
14
Digital Divide Report: ICT Diffusion Index 2005
within Latin America. While not shown in these tables, a good deal of African and Latin American intranational traffic is also routed through Europe and the Untied States and Canada -- an email sent from one side of town to the other may travel many thousand miles.
The same pattern is clear when we consider links between specific cities. Telegeography has compiled a list of the 50 highest capacity international links. With the exception of the link between San Francisco and Tokyo, the top 25 are between city pairs in the US, Canada, and Western Europe. The only non-OECD cities in the top 50 are Hong Kong and Sao Paulo.12 The fifty highest capacity Internet hub cities are also almost all in the US, Canada, Europe or the Asian tigers. No African cities are in the top fifty, but four South American cities and three Chinese cities fall between 34th and 50th.
12 The link between Sao Paulo and Miami ranks 41st, and is the only one in the top 50 in South America, Africa or Asia outside of Hong Kong, Taipei, Tokyo and Seoul.
15
Digital Divide Report: ICT Diffusion Index 2005
3. Case studies
This section presents case studies of China, Chile, Botswana, Singapore, India, and the United States. These nations were selected because they have had success blending ICT liberalization – privatization, competition and independent regulation – with responsible government planning, investment and procurement. We do not hold these nations out as total “success stories” to be mechanically emulated – any such attempt would require oversimplification – we mean to highlight instances in which government will has led to improvement. We briefly outline the broad political and economic context in which telecommunication policy has been formed in each nation, describe that policy, and examine some of the results.
3.1 China: an eclectic ownership and competitive strategy
In 1990, the Chinese and Indian telephone systems were comparable. They had essentially equal teledensities of .6 per hundred capita, ranking them 159 th and 160th
among nations. China has progressed faster than India since that time. A decade later, Chinese teledensity was 17.8 and Indian 3.6 and their ranks had improved to 95th
and 145th (ITU, 2002). By 2003, Chinese teledensity stood at 22.1. No simple explanation can be found for Chinese progress, but three factors contributed: a general opening of the Chinese economy, government emphasis on telecommunication as strategic infrastructure and the introduction of varying degrees of competition at different levels (Press, et al, 2003).13
Before the 1990s, the Chinese economy was insular and tied to the Communist block, but in the late 1980s, China reoriented its economy, moving toward open markets and eclectic policy. The results have been dramatic. GDP per capita rose from US$1,596 in 1990 to US$5,085 in 2004, and Barboza and Altman (2005) report that these figures are conservative.14 Imports, exports and foreign direct investment had increased by over 9.9, 16.8 and 12.4 times respectively.15
During the 1990s, China's industrial policy focused on infrastructure and high technology (Pangestu, 2002). By 2003, Chinese ICT expenditure per capita was 2.75 times that of India (World Bank, 2006). The Chinese government is able to carry out decisions once made. For example, in 1996, the Chinese State Council made the decision to allow the Internet and to connect all provincial capitals, and within a year, there were competing ISPs in every capital.
China has followed a strategy of allocating resources to competing state-owned enterprises. In an effort to spur growth and efficiency, China established Unicom as a competitor to the incumbent, China Telecom, in 1994. However, China Telecom maintained a political advantage since they were a part of the Ministry of Posts and Telecommunications (MPT). The dual role of MPT as both a competitor and
13 This is not to imply that India has not made progress during this period, but they have not kept pace with the Chinese.14 Constant 2000 international dollars, World Bank (2006).15 The figure for foreign direct investment is for 2003, the others for 2004, World Bank (2006).
16
Digital Divide Report: ICT Diffusion Index 2005
regulator led to a conflict of interest, and China Unicom shareholders pressed for separation.
The need for a new regulation system and a coherent strategy for network investments led the creation of the Ministry of Information Industry (MII) in 1998 by merging the MPT and the Ministry of Electronic Industry. The MII is in charge of the development strategy and regulating telecommunications, broadcasting, satellites and the Internet. The MII is also charged with the establishment of a nationwide multimedia network to prevent duplication of investments.
In 1999, the MII split the former China Telecom into four independent groups (China Telecom, China Mobile, China Satellite and Guo Xin Paging Company for radio paging), easing regulation so that they would compete with other operators in the future. They separated China Telecom operations from MII’s regulatory activity and divided them into northern and southern companies in 2001 (People’s Daily, 2001).16
Incentive contracts based on objectives and results (quality, traffic, revenue, etc.) were implemented for the Directors of the provincial Posts and Telecommunications Administrations, and the Chinese Government started to decentralize administrative power. As we noted, this strategy has worked well. Its efficacy has also been noted by the ITU:
The main form of competition has been between ministries of the government … although it is unlikely that this form of competition between state-owned enterprises would feature in many economics textbooks, it has proved remarkably effective. The key underlying factor is the will of the state to invest in, and prioritize, telecommunication development (ITU, 2002).17
Chinese universities came to the Internet in 199418 which was relatively late. After a delay to weigh the economic opportunity afforded by the Internet against the cultural and political risks of open access, the Chinese made the Internet a priority.19 20 By that 16 People's Daily, State Council Approves China Telecom's North-South Split Plan, December 12, 2001, http://english.peopledaily.com.cn/200112/11/eng20011211_86402.shtml17 ITU, World Telecommunication Development Report, 2002.18 For dates of the first IP connectivity of nations, see http://www.nsrc.org/oclb/msg00048.html.19 Other nations have also faced this “dictator’s dilemma” and made similar decisions. See, for example, Press, Larry, The Internet in Singapore 1997: a Benchmark Report, Mosaic Group, 2000, http://mosaic.unomaha.edu/SINGAPORE_2000.pdf, ITU, Vietnam Internet Case Study, 2002, http://www.itu.int/ITU-D/ict/cs/vietnam/index.html and Press, Larry, Cuban Computer Networks and their Determinants, DRR-1814-OSD (49 pages), RAND Corporation, Santa Monica, CA, February 1998.20 While encouraging the Internet, Chinese authories have acted to control it. An Open Net Initiative (2005) case study found that "China’s Internet filtering regime is the most sophisticated effort of its kind in the world ... carried out at various control points. They characterised it as dynamic, making it difficult to avoid, and "buttressed by an equally complex series of laws and regulations that control the access to and publication of material online". Qiang and Beach (2002) noted that:
Since 1995, more than 60 laws have been enacted governing Internet activities in China. More than 30,000 state security employees are currently conducting surveillance of Web sites, chat rooms and private e-mail messages - including those sent from home computers. Thousands of Internet cafes have been closed in recent months, and those remaining have been forced to install "Internet Police 110" software, which filters out more than 500,000 banned sites with pornographic or so-called subversive content. Dozens of people have been arrested for their online activities; in 2001, eight people were arrested on subversion charges for publishing or distributing information online.
17
Digital Divide Report: ICT Diffusion Index 2005
time, economic openness and earlier investment in infrastructure paved the way for rapid Internet penetration.
The Chinese employed a mixed ownership strategy with regard to the ISP industry. Backbone networks were operated by state owned enterprises, but not local access. By the end of 1999, there were over 500 local ISPs and they behaved like free market organizations, with many going out of business and attendant layoffs. China has also pursued a mixed ownership strategy with respect to Internet exchange points (IXs). Early Internet traffic was routed through the National Science Foundation backbone in the United States, but the Chinese government encouraged the formation of IXs to handle domestic traffic. By 2002 IXs and domestic bilateral exchange points had the capacity to handle 84 percent of Chinese traffic, indicating that China has weaned itself from the US and other foreign backbones.21
Voice over Internet Protocol (VOIP) is a critical technology for developing nations with low teledensity and income and large expatriate populations;22 however, it is often resisted by powerful incumbent telephone companies which fear revenue loss. The Chinese government concluded that the benefit of low cost telephony would offset revenue cuts, and encouraged VOIP. By 2002 at least four major networks, China Telecom, China Netcom, China Unicom, and China Mobile offered VOIP (ITU, 2002). Embracing VOIP has paid off by cutting communication cost for businesses and individuals and by strengthening the competitors to China Telecom which tends to level the playing field.
Another area in which the Chinese government has acted decisively is in encouraging the adoption of Internet Protocol version 6. This will stand them in good stead as mobile devices and sensors proliferate on the Internet.
China has made remarkable progress with rapid telephone, mobile and Internet growth. That being said, we must bear in mind that they remain on the wrong side of the global digital divide and, like all developing nations, they face domestic digital divides, for example between eastern and western regions and rural and urban areas.
3.2 Chile: competition with government planning and applications
Expropriation of mines and land reform had already begun in Chile by the time of the 1970 election of a Socialist-Communist coalition government headed by Salvador Allende. Allende increased expropriation of business and land and began instituting a controlled economy. He was hampered by disagreement within his coalition, foreign intervention and civil unrest, and his policies led to capital flight, inflation and economic decline, paving the way for a coup led by General Augusto Pinochet in 1973.
Pinochet outlawed political parties and many "domestic enemies" "disappeared." Economic problems continued, leading him to turn to Milton Friedman and the "Chicago boys," young economists from Chile’s Catholic University who had studied
21 CNNIC, http://www.cnnic.net.cn/mapinfo/english/cnnic-english.html.22 IP Telephony to Have a Dramatic Impact on Asian Voice, Data Communications Markets, Madanmohan Rao, OnTheInternet, http://www.isoc.org/oti/articles/0601/rao3.html.
18
Digital Divide Report: ICT Diffusion Index 2005
at the University of Chicago (Becker 1997). They anticipated a global trend by advocating free-markets, removing price controls, cutting government service, privatizing business, and liberalizing trade. The change caused domestic pain, but the economy turned around. Per capita GDP dropped 12.76 percent to $1,336.62 in 1975, but had grown to $11,486.95 by 2004, a 7.7 percent compound annual growth rate (World Bank, 2006), and the Chilean Human Development Index (HDI) value is second only to that of Argentina in Latin America (UNDP 2005).23
Chile has remained economically open, with bilateral and multilateral trade agreements and ongoing tariff reductions. Gwartney et al (2005) find Chile 9 th among all nations in trade openness and 20th in overall economic freedom, making them the South American leader. Given this context, it is not surprising that Chile was the first Latin American nation to privatize and liberalize telecommunication. In 1988, the Chilean telephone company was sold to Spanish and Italian companies for $478 million or $1,400 per line (Reed, 2005), and full competition was achieved by 2000 (Wellenius, 2001).
The results have been striking. In 1990, Chilean teledensity was 6.7 per 100 people, ranking them 93rd in the world. By 2000 it had increased to 44.4, 61st in the world. Only seven nations improved more rapidly than Chile during this period (ITU 2002). Table 9 shows improvements in teledensity and efficiency after privatization and liberalization.
Table 9 Chilean teledensity and efficiency after privatization and liberalization
1988 privatization 1994 full competition 2000
Main lines, Per 100 inhabitants .6 1.6 3.2Mobile customers, million 0 .1 2.8Total connections, million .6 1.7 6Per 100 inhabitants 5 11 39Outstanding applications, years 7 .7 <.1Telephone digitalization, % lines 38 100 100Main lines per employee 74 208 223Households with telephone % 16 40 74
Source: Wellenius (2001)
In spite of this progress, Chile’s rural and poor urban areas lacked service. In 1994, most rural inhabitants still lived in areas without even a pay phone. In striving for universal service, governments often require operators to cover rural areas as a licensing condition or charge a universal service fee to subsidize poor areas. The Chilean government used a market mechanism for universal service, implementing a successful program in which providers bid for the subsidy they would require to cover a remote area (Wellenius, 1997).
Today, Chile ranks first or second among South American nations in nearly all per-capita telecommunication indicators, including fixed and mobile subscribers, Internet
23 The HDI is a function of life expectancy, educational attainment and real GDP/capita.
19
Digital Divide Report: ICT Diffusion Index 2005
users, personal computers, and cost of calls and Internet access (World Bank 2006). Chile’s ICT Diffusion Index is the highest in Latin America, and Minges (2005) shows that Chile leads Latin America on five other e-indices.
Chile has set ambitious goals for the Internet. In 2004, they published a national plan, a "Digital Agenda," which reached public-private consensus on the following goals by the Chilean bicentennial in 2010 (Grupo de Acción Digital, 2004):
a reliable, secure wide-band infrastructure throughout the nation with access for every Chilean from their homes, work places, schools or info-centres and cyber-cafes
a digitally literate population and work force an online state, providing e-government information and service at the national,
regional and municipal levels digital business development with intensified use of the Internet in business and e-
commerce a critical mass of internationally competitive information and communication
technology businesses a legal framework that assures freedom of expression, democracy, transparency,
and access to knowledge and culture while protecting the rights of creators and innovators
The Digital Agenda also defined an action plan with 34 initiatives to work toward these goals during 2004-6. Chile already has achieved considerable success. Let us consider examples in e-government, education and community access.
E-government
The e-government emphasis evidenced by the Digital Agenda has paid off. The UN has surveyed e-government readiness, and compiled an E-Government Readiness Index (ERI), which is a composite measurement of the capacity and willingness of countries to use e-government for ICT-led development (United Nations, 2004). The ERI is intended as a measure of governmental success in using ICT for the economic, social and cultural empowerment of its people. It combines an assessment of government website development with access characteristics like infrastructure and educational levels.
The Chilean ERI of 0.684 is 22nd of 191 nations and is the highest in Latin America. The next three in the region are Mexico (0.596), Argentina (0.587) and Brazil (0.568), and the regional average is 0.4558. When only the website development is considered, leaving access and infrastructure out, Chile is the sixth ranked nation in the world. The report also singles out 23 e-government best practices, and three of them are Chilean.
Chile is credited with leading an emerging trend in Latin America to provide both useful content and online service via an effective user interface at a government portal:24
24 Spanish, http://www.gobiernodechile.cl, and English, http://www.chileangovernment.cl/, versions are available.
20
Digital Divide Report: ICT Diffusion Index 2005
Simplicity summarizes Chile’s approach to e-government. The country homepage provides citizens with direct access to a variety of online services and information, including a National Online Employment Database and an Interactive Consumer Affairs Centre. In addition to direct links to these services, Chile’s homepage provides user-friendly information on the President’s daily agenda, one-click access to current legislation and important documents, easy access to regional governments and national ministry sites, and the list of services goes on and on. While many country websites provide this information, Chile has tailored the national homepage so that all online services and critical information are citizen friendly and one click away (United Nations, 2004).
Education
In 1992, Pedro Hepp and his colleagues at the Catholic University began a project to develop and evaluate an elementary school network called Enlaces (links). They began with only 12 schools, but their goals were to enhance efficiency, quality and equity in education and to "integrate the children into the culture." By 1995, with assistance from the World Bank, they had networked 144 schools each of which had a local Ethernet with between 3 and 10 computers and were providing a variety of services including student and teacher newsletters, educational software, curriculum notes, computer conferences, email, and database access (Press, 1996-a). Table 10 shows that today there are over 9,000 Enlaces primary schools (Delgado, 2005).25
These statistics do not tell the entire story. Enlaces has built an effective organizational structure with universities responsible for schools in their regions. They are organized in a two-tier geographic structure Directors from six universities and Unit Heads below them. Most of the Unit Heads are also from universities. They emphasize teacher training, content development and the integration of IT into the curriculum. Enlaces facilities are also opened to the general community after school hours (see below). They are also committed to geographic dispersion. Chile is divided into 13 geographic regions, ranging from the world’s driest desert region in the north to near the Antarctic Circle in the south. Enlaces covers over 90% of the students in all but three regions, the northernmost (88.5 %), the southernmost (84.3 %) and the Metropolitan Region (MR) which contains Santiago, the capital city (89.5 %).
25 1,499 secondary schools (85%) also participate.
21

Digital Divide Report: ICT Diffusion Index 2005
Table 10 Enlaces primary school statistics, 2005
SchoolsRural 4,726Urban 3,183Total 7,909ChildrenUrban 2,345,307Rural 127,742Total 2,473,049Trained teachers 101,081Total number of PCs 75,711Internet connectivityAnalog modem 2,578Broadband 3,151Total 5,729Investment 1995-2005 (1,000 Pesos)26
Total 117,799,680Average annual investment 10,709,062
Source: Delgado, 2005
Finally, as with e-government, Chile has a comprehensive education Web portal with information, tools and services for students, teachers, administrators, researchers and the family.27
Community Access
Both a 2001 presidential directive and the Digital Agenda committed Chile to universal access to and broad application of ICT. To this end, the sub-secretary of telecommunication (SUBTEL) has established an office for the coordination of all Infocentres (SUBTEL, 2004, SUBTEL, 2005).28 As of May 2005, there were 767 infocentres run by 12 government and private organizations including Enlaces schools (after school hours) and public libraries. Since they are run by different organizations and are in different locales, the staff, facilities and equipment vary, but together they provide 2,808 Internet-connected PCs, and have been used by 460,853 users.
SUBTEL also coordinates the work of 18 application and content providing organizations. These are diverse groups of educators, government agencies, and those working with youth, women and the poor. For example, Enlaces, the libraries and others offer digital literacy classes. Over 500,000 people have completed these 18-hour classes which are typically offered on weekends and evenings.
The Digital Agenda calls for gender and age equity, and 70% percent of the after-hours users at Enlaces schools are women, and 50% are housewives who were 26 The investment is shown in Pesos, and the conversion rate varies, but the total for the 11 years has been around $US 200 million and the annual investment has been around $US 20 million during recent years.27 http://www.educarchile.cl/home/.28 The infocentres are heterogeneous since they are operated by different organizations, but all provide shared Internet access.
22
Digital Divide Report: ICT Diffusion Index 2005
probably introduced to ICT by their children who were students in Enlaces schools. Fifty four percent of the users are between 30 and 59 years old. The majority of library infocentre users are also women.
The Digital Agenda also calls for geographic equity. Table 11 (Statoids 2006, SUBTEL 2005) shows that sparsely populated rural regions have more infocentres and PCs per capita than the Metropolitan Region (MR) which includes Santiago, the capital city, or regions with other large cities (Statoids database, 2005).29
Table 11 Infocentre distribution from north to south
Region Population (2002)
Population/ square km
Centres (2005) PCs (2005) Centres/ 100,000
inhabitantsPCs/ 100,000 inhabitants
I 428,594 7.38 25 104 5.8 24.3II 493,984 3.94 24 120 4.9 24.3III 254,336 3.25 22 97 8.6 38.1IV 603,210 15.21 33 171 5.5 28.3V 1,539,852 94.02 57 259 3.7 16.8VI 780,627 48.94 46 169 5.9 21.6VII 908,097 29.76 70 294 7.7 32.4VIII 1,861,562 51.70 104 422 5.6 22.7IX 869,535 26.78 86 372 9.9 42.8X 1,073,135 15.54 53 234 4.9 21.8XI 91,492 0.85 14 54 15.3 59.0XII 150,826 1.34 20 98 13.3 65.0MR* 6,061,185 384.06 118 486 1.9 8.0National 15,116,435 20.51 672 2880 4.4 19.1
* MR, the Metropolitan Region, is in the centre of the nation and contains the capital, Santiago.Source: SUBTEL and Statoids (population)
In addition to working with provider organizations, SUBTEL holds monthly meetings for infocentre operators, maintains a Web site30 with information on the program and an infocentre database, and publishes semi-annual progress reports.
Chile's newly elected president Michelle Bachelet promises to continue ICT progress. Immediately after her election, she established a Digital Agenda blog with the slogan "four years to digitize Chile" and arguing the benefits of such things as open source software, the use of Creative Commons licensing,31 developing E-government, and improving Internet access.32 Chile is beginning to sound like a "Web 2.0" nation.
29 This may partially reflect higher incomes and therefore greater household PC penetration rates in the urban areas.30 http://www.infocentros.gob.cl/red/inf_index.htm31 Chile's determination to take a lead with respect to intellectual property is reflected in the Chilean WTO Commission's WIPO proposal on the importance of public domain information and its role in development on January 9, 2006, http://www.wipo.int/edocs/mdocs/mdocs/en/pcda_1/pcda_1_2.pdf.32 http://www.bacheletdigital.cl/.
23
Digital Divide Report: ICT Diffusion Index 2005
3.3 Botswana: an effective, independent regulator
As in Chile, broad political and economic factors created an environment suitable for telecommunication growth in Botswana. At the time of their independence, Botswana was a landlocked nation roughly the size of Texas with only 12 kilometres of paved roads and 22 university and 100 secondary school graduates. Between 1965 and 1998, GDP grew at 7.7% per year, and was $8,716 in 2003 making it the third highest in Sub-Saharan Africa which averages only $1,856 per year.33 Botswana achieved this rapid development by following orthodox economic policies (Acemoglu et al, 2001). Gwartney et al (2005) rank Botswana’s economic freedom 30th among all nations, making them the African leader (Gwartney ad al., 2005).
From 1980 to November 1995, Cable and Wireless was the sole provider of telecommunication service in Botswana. When that contract expired, the Botswana Telecommunication Authority (BTA) was established as an independent regulator with a mandate to restructure and introduce competition in the telecommunications industry. In 1998, they broke the telephony monopoly of the Botswana Telecommunications Corporation (BTC) by licensing two mobile operators. By 2004, BTC still had a fixed line monopoly, but the mobile operators had 80% of the total telephony market. In addition to these, there were 35 licensed providers of Internet and data services and private telecommunications networks.34
In 2001, the ITU selected Botswana as for a case study in effective regulation, stating that:
Botswana has won a well deserved reputation as one of the first countries in the African region to establish an independent and effective regulatory body. In fact, its level of independence and effectiveness may develop as a world model. BTA is one of the few regulatory bodies that enjoy complete freedom in licensing operators and in establishing and financing its operational budget (ITU, 2001-a).
The ITU (2002) characterizes the BTA as:
Completely free in licensing operators and establishing its own budget Consultative and open with public meetings in all major cities Independent, for example, refusing a mobile license to government-owned BTC Consistently investing in human resource development and gender equality35
(Gillwald, 2005)
There is some concern that the BTA may not be able to maintain its independent role since the Telecommunications Amendment Act passed in December 2004 transferred
33 It must be noted that GDP growth has outpaced human development. Botswana’s GDP per capita ranks 61st among nations and its UNDP Human Development Index ranks 131 st. No other nation has such a great gap. 34 BTC was not granted a mobile license, which weakened it significantly and has hindered privatization. We do not know how many of the 35 non-telephony licensees are operating. These are smaller, but generally more competitive markets than telephony.35 Twenty eight BTA employees have postgraduate qualifications, and 16 of those were acquired through BTA’s sponsorship (Gillwald, 2005).
24
Digital Divide Report: ICT Diffusion Index 2005
some of their authority to the Ministry of Communications, Science and Technology (Gillwald, 2005). On the other hand, BTC is due to be privatised this year.
Table 12 Botswana teledensity per 1,000 inhabitants
1900 1995 2000 2003Mobile phones 0 0 121.73 297.07Telephone mainlines 20.58 40.9 82.71 74.87Total 20.58 40.9 204.44 371.94
Source: World Bank (2006)
Table 12 compares pre and post-BTA teledensity. The sum of mobiles plus mainlines increased by just under 100% between 1990 and 1995 and by just under 400% between 1995 and 2000. Between 1995 and 2002 Botswana’s Digital Diffusion Index ranking improved from 97th to 80th among nations. Only 12 nations improved by more. The Botswana E-Government Readiness Index and digital diffusion index were fourth in Sub-Saharan Africa behind Mauritius, South Africa, and Seychelles (0.426) (United Nations, 2004).
Table 13 Telecommunication indictors per 1,000 people (World Bank 2006).
Botswana 1996 2003Mobile phones 0 297.07Telephone mainlines 48.32 74.87Internet users (2002) 1.67 34.88Sub-Saharan AfricaMobile phones 1.81 51.27Telephone mainlines 11.75 10.67Internet users (2002) .57 16.96
Source: World Bank (2006)
Table 13 shows that Botswana has consistently outperformed Sub-Saharan Africa during the tenure of the BTA.
3.4 Singapore: government planning and participation pays dividends
In 1965 when Singapore separated from Malaya (later "Malaysia"), it was an impoverished developing nation with a strong leader, Cambridge-educated Lee Kuan Yew of the People's Action Party (PAP). Lee stepped down as prime minister in 1990, but the PAP remains in power. The PAP has successfully blended government control with a market economy, leading Singapore to a 2003 GDP per capita of $24,481 (21st in the world) and an HDI of .907 (25th in the world).
Since its formation, the government focused attention on key industries, and, by the mid 1970s, Singapore was a leading oil refining, financial and shipping nation. In the 1980s, the government turned its attention to IT, beginning with the 1981 Civil
25
Digital Divide Report: ICT Diffusion Index 2005
Service Computerisation Programme. In 1986, a Committee on National Computerisation was formed to create a National IT plan. In 1992, they published their IT2000 which has been continuously updated in a series of Infocomm Technology Roadmaps.36
The IT2000 plan called for the construction of a broadband networking infrastructure, common networking services (like directories, security, authentication, and billing), experiments with applications (national IT application projects), forging international strategic alliances with industry leaders in Japan, the EC and the US, and establishing a policy and legal framework on issues like data protection, privacy, copyright and intellectual property rights, and the admissibility of computer-imaged documents in court. This led to the construction of Singapore ONE, the national backbone, and the Singapore Internet Exchange, which provides peered connections for major networks within and outside of Singapore, and sells connectivity to smaller, downstream ISPs in the region. Singapore’s infrastructure planning was complemented by government programs designed to attract investment in applications to run over Singapore ONE and the Ministry of Education Master Plan for integrating networked computers into all levels of the school curriculum.
The Singapore government is not only a passive planner, but is active in procurement and as an investor. For example, the major ISPs invested in Singapore ONE in response to government commitments to income-generating online services. Furthermore, the government owned equity in those ISPs. As Figure 9 shows, the government owned significant shares of the major ISPs Singapore Telecom, Pacific Internet and Star Hub at the time Singapore ONE became operational (Minges, et al, 2001). We also see that the government held equity in television (Singapore CableVision), telephony (Singapore Telecom) and mobile phone (M1) companies.
36http://www.ida.gov.sg/idaweb/techdev/infopage.jsp? infopagecategory=articles:techdev&versionid=1&infopageid=I3344. Singapore is currently embarking on plans for a “next generation national infocomm infrastructure” as part of their national plan for the year 2015, http://www.ida.gov.sg/idaweb/marketing/infopage.jsp?infopagecategory=&infopageid=I3762&versionid=4.
26
Digital Divide Report: ICT Diffusion Index 2005
Figure 9 Percent of government ownership in key ICT companies in 2001
Source: Minges, et al (2001)
While the government was actively involved in planning and investing in ICT, telecommunication markets were liberalized. IDA (2006) lists 45 "key liberalisation moves since 1989," leading up to the announcement of full competition in the telecommunications sector in January 2000 (IDA, 2006). Competitive pressure resulted taking that step two years before originally planned.
This combination of expert government planning and investment combined with free market competition has served the Singapore well. They are ranked 16 th on the Internet Diffusion Index, and rank even higher on each of the indices tabulated in Minges (2005): Digital Opportunity Index, "DOI" (rank 7); World Economic Forum Networked Readiness Index37 "NRI" (rank 1); IDC Information Society Index38 "ISI" (rank 12); ITU Digital Access Index39 "DAI" (rank 14); and Orbicom Monitoring the Digital Divide40 (rank 13). Their average national rank on all of these indices is 10.5. Singapore ranks 5th in broadband penetration, reaching 60% of the households (Point Topic, 2005-b), and some surveys report that up to 99% of the population is covered by broadband networks. The number of broadband service vendors in Singapore rose from 200 as on 30 June 2003 to 300 as on 31 Dec 2003 (Point Topic, 2005-a).
The IDA has issued a request for proposals on implementation of their Next Generation National Infocomm Infrastructure plan. This will be a public-private partnership providing ubiquitous 1Gbps connectivity over fibre and a complementary
37 http://www.weforum.org/site/homepublic.nsf/Content/Global+Competitiveness+Programme%5CGlobal+Information+Technology+Report38 http://www.idc.com/groups/isi/main.html39 http://www.itu.int/ITU-D/ict/dai/index.html40 http://www.orbicom.uqam.ca/projects/ddi2002/ddi2002.pdf
27
Digital Divide Report: ICT Diffusion Index 2005
high-speed wireless network. The IDA considers this necessary to remain competitive in Asia, and anticipates completion of the project by 2012.41
3.5 India: government led reform leads to growth and telecentre innovation
Like many developing nations, India has a protectionist past. Mahatma Gandhi’s call for self-sufficiency was one of the hallmarks of the Indian independence movement.42
A 1976 law limited foreign ownership of a business to 40%, and IBM left India interrupting the deployment of mainframe computers. Rajiv Gandhi assumed leadership after the assassination of his mother in 1984 and identified telecommunications and information technology as a "core sector" along with traditional industries like power, steel, oil, and automobiles, but telecommunication remained a government monopoly until the National Telecom Policy 1994 (NTP 94) allowed the entry of private companies.
Progress remained slow. Two mobile operators were licensed in each of 23 service areas, fragmenting the country so that by 1998 there were still only 1.217 mobiles and 21.985 mainlines per 1,000 people (World Bank, 2006), and wire line service continued to be dominated by the incumbents, as it is almost everywhere.
The election of the Bharatiya Janata Party (BJP) in 1997 signalled renewed interest in ICT. BJP listed ICT as one of the government's five top priorities. Mobile license fees were dropped in lieu of 15 percent profit sharing with NTP 99. This combined with falling capital and handset costs, prepaid calling, calling-party pays, increased competition from newcomers and wireline operators led to rapid mobile growth. By 2003 there were 24.747 mobiles per 1,000 people (World Bank, 2006). The wireline market has been slower to change with 46.284 per 1,000 people by 2003 (World Bank, 2006), but only 5.5% were from private operators, and the growth has been largely in urban areas (Jhunjhunwala, et al, 2005).
The Internet history is similar to that of telephony. India’s education and research network (ERNET) connected to the Internet in 1988, but, in spite of this early start, ERNET had to rely on United Nations Development Programme funding, and the Indian Internet languished. The government used the authority granted in the Indian Telegraph Act of 1885 (!) to stop private ISPs from operating, so only government agencies were able to become ISPs serving limited constituencies, and the Ministry of Communication kept a monopoly over commercial ISP service.
Change began with the establishment by BJP of a National Taskforce on IT and Software Development in May 1998 to formulate IT policy.43 The Task Force acted quickly, releasing a 108-step IT Action Plan in July 1998, an IT Action Plan on the Development, Manufacture and Export of IT Hardware in October 1998, and a Long Term National IT Policy in April 1999. By 2002, Class A (all India) ISP licenses had been issued to 79 organizations, 357 licenses had been issued for access in limited 41http://www.ida.gov.sg/idaweb/marketing/infopage.jsp? infopagecategory=&infopageid=I3762&versionid=4, http://www.ida.gov.sg/idaweb/doc/download/I3762/factsheet_NGNII030306.doc42 This background is based on Press, et al (1999) and Press, et al (2004).43 For the description of the Taskforce and its history and reports, see http://it-taskforce.nic.in/vsit-taskforce/.
28
Digital Divide Report: ICT Diffusion Index 2005
regions or local areas, and 20 companies had permission to operate 45 international gateways in 16 cities. Not all of these succeeded or even became operational, but the degree of interest was impressive (Mahanta, 2001). The Indian Internet has grown rapidly since that time. The number of Internet subscribers grew from 25,000 in 1997 to 6.674 million in 2005, a compound annual growth rate of 86% (Nascom, 2005). India’s success in supporting the outsourcing of call centres, software development, accounting, radiology analysis, etc., is widely documented.44 However, nearly all of this growth and application has been in urban areas.45
India’s Internet pilot studies and applications in rural areas are potentially more important for closing the digital divide than is their general telecommunication progress. Both the federal and state governments have called for universal rural connectivity, and India has been a hotbed of telecentre development. Jhunjhunwala, et al (2005) surveys ten telecentre projects (Table 14), and three of them, the MS Swaminathan Research Foundation (MSSRF) village knowledge centres, E-chaupal and n-logue are noteworthy.
Table 14 Rural Internet projects in India
Project URL
Non Profit
Bhoomi land record computerization www.revdept-01.kar.nic.in
Warana wired village projectwww.mah.nic.in/warana
Gyandoot Taken over by n-logue
MSSRF village knowledge centreswww.mssrf.org
Akshaya IT dissemination project www.akshaya.netProject Rural eSeva (e Services) www.westgodavari.org
For Profit
Drishteewww.drishtee.com
TARAhaat www.tarahaat.com
e-Choupal www.echoupal.comn-Logue www.n-logue.co.in
Source: Jhunjhunwala, et al (2005)
44 Indian outsourcing began with software development in which they were an early mover, dating back to the work of Tata Consultancy beginning in 1974 (Press, 1993). This early start, combined with other factors including strong university and trade education, English language skill, and an entrepreneurial culture, led to success in software export and later to other forms of outsourcing.45 Internet service was available in over 400 cities by 2003 (Wolcott, 2005), but rural areas remain largely without service.
29
Digital Divide Report: ICT Diffusion Index 2005
M. S. Swaminathan is founder of the MS Swaminathan Research Foundation (MSSRF) which is internationally known for research on sustainable development. Swaminathan feels that if technological and information empowerment is to reach the unreached, then policy makers must focus their attention to the poorest person (Swaminathan, 2001). To that end he began the Information Village Research Project to study the information uses and needs in villages (Press, 1999). This led to the establishment of MSSRF Knowledge Centres in rural Pondicherry. Their positive experience has led them to take the lead in Mission 2007, a consortium with the goal of “taking the knowledge revolution to all the more than 637,000 villages of India by 15 august 2007" in conjunction with the 60th anniversary of India’s independence.46
The coalition includes over 150 businesses and non-governmental organizations, and the Indian government has committed US$23 million support for 2005–2006.
The MSSRF Knowledge Centres are non-profit, but two of the for-profit projects, e-chaupal and n-logue, are growing rapidly and have been independently evaluated and found to be sustainable (e-Chaupal: Annamalai and Rao, 2003, Rajashekhar, 2005, n-logue: Paul, 2004). They employ different business models.
Figure 10 Personal home page, e-chaupal47
The E-Chaupal48 (electronic town square) business model is that of a single corporate owner operating Internet centres (Figure 10). ICT, an Indian conglomerate with holdings in hotels, agriculture and IT has established remote centres at agricultural hub locations, and is using the network for agricultural information and best practices, weather reports, supply chain support for farm inputs, direct marketing for farm products, and information on government programs. ICT’s investment is recouped in between 8 months and 2 years by savings in logistics and payments to agricultural middle men (Annamalai and Rao, 2003).
46 http://www.mission2007.org/47 http://www.itcportal.com/sets/echoupal_frameset.htm48 http://www.itcportal.com/sets/echoupal_frameset.htm.
30
Digital Divide Report: ICT Diffusion Index 2005
Figure 11 N-logue eye examination using a low cost Web camera and chat softwar49e
N-Logues rural information centres illustrate a second business model, franchising (Figure 11).50 N-Logue provides connectivity, hardware, and training to the local operator of a village centre and the centre offers computer training, local-language office productivity applications (word processing, spread sheet, database, email client, Web browser and a drawing package),51 digital photography, desktop publishing, email/voice and video mail, telephony, and access to government, medical, veterinary, and agricultural experts and information. The centre operator invests approximately US$1,000 for a PC with a Web camera, printer, power backup, local-language software, and communication equipment. An Indian village averages roughly 1,000 people and the breakeven revenue for a kiosk is approximately $75 per month. In a case study, Paul (2004) concludes that “n-Logue has developed a viable and scaleable model for delivering information-based services to rural areas.” (Rajashekhar, 2005)
Figure 12 Television distribution in rural India52
49 http://www.n-logue.com50 http://www.n-logue.com/.51 Chennail Kavigal, get link xxx52 MSSRF M.S. Swaminathan Research Foundation, and published earlier by Press (2003)
31
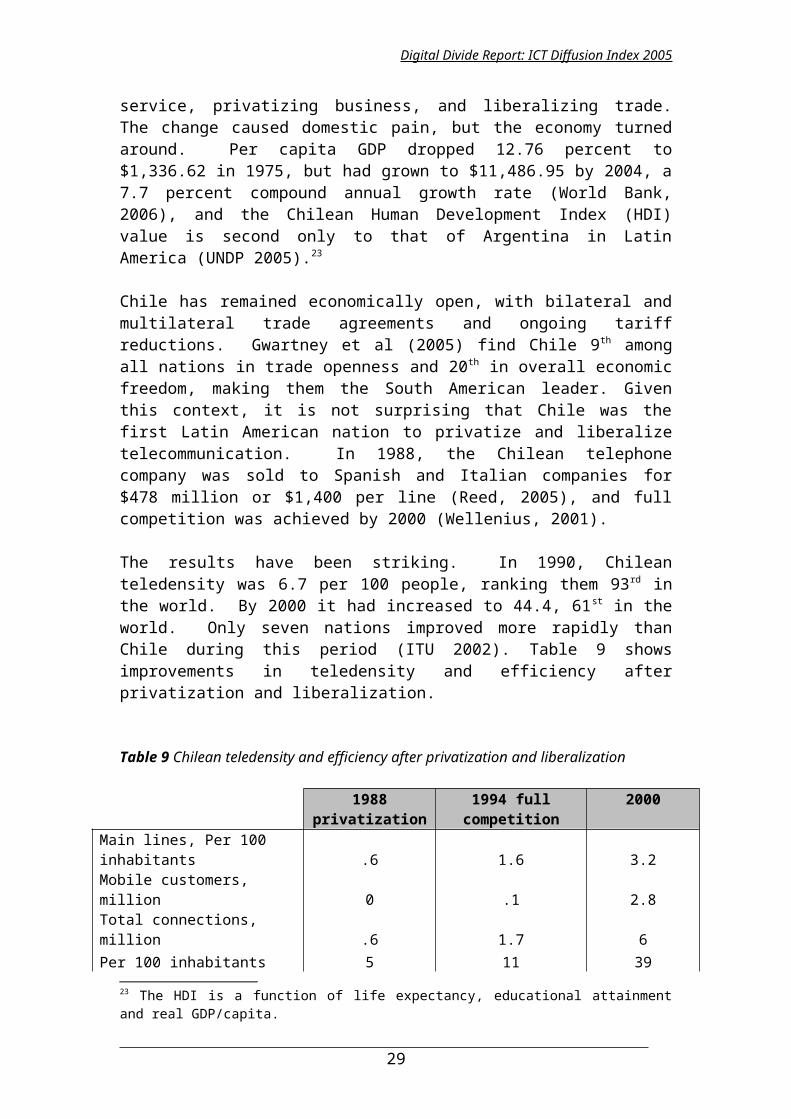
Digital Divide Report: ICT Diffusion Index 2005
Precedent, inspiration and experience for n-logue’s approach may be India’s ubiquitous Public Call Offices (PCOs) and village television distribution. The estimated 900,000 PCOs are typically operated by entrepreneurs who keep their storefront kiosks open 18 hours a day, 365 days of the year.53 Television is also often down linked and distributed by a local operator within a village (Figure 12).54
3.6 United States: the first Internet backbone
Including the United States, ranked second in the world on the ICTDI, as a case study in a report on the digital divide may seem strange, but the state of the Internet in the United States in 1989 was similar to that in developing nations today.55 There was no national backbone network, residential connectivity, or commercial application. Only a few universities were connected to the Internet, and it was slow, with file transfer and character-oriented email and network news being the primary interactive applications. The federal government played a key role in the research preceding the Internet and the construction of the first US (and later global) Internet backbone (Press, 1996-b).
Previous experience with store and forward networks, the ARPANet and CSNET convinced the US National Science Foundation (NSF) of the feasibility and value of computer networks. They realized that a network connecting research and education institutions would increase their productivity, hence furthering the NSF mission. As such, they set out to build national Internet backbone and provided a high-speed communication link from that backbone to a point of presence (POP) which they provided to any United States University.56
In 1988, the NSF established NSFNet, a 13-node backbone connecting large NSF-funded research computer centres (Figure 13). The initial links were only 50 kbps, but the speed was soon increased to 1.4 Mbps and later to 45 Mbps. The network was procured by NSF, but constructed and operated by contractors chosen through competitive bidding.
53 Adite Chatterjee, email, March 29 2005.54 M. S. Swaminathan emphasized the importance of entertainment in driving rural telecommunication in a 1998 interview.55 We are not arguing that the United States has always followed advantageous telecommunication and Internet policy. In fact, one can argue that poor policy decisions have resulted in the United States losing its early leadership and falling behind a number of nations on various telecommunication dimensions.56 The POP was generally a Cisco router connecting the campus local area network to the communication link to the backbone network.
32
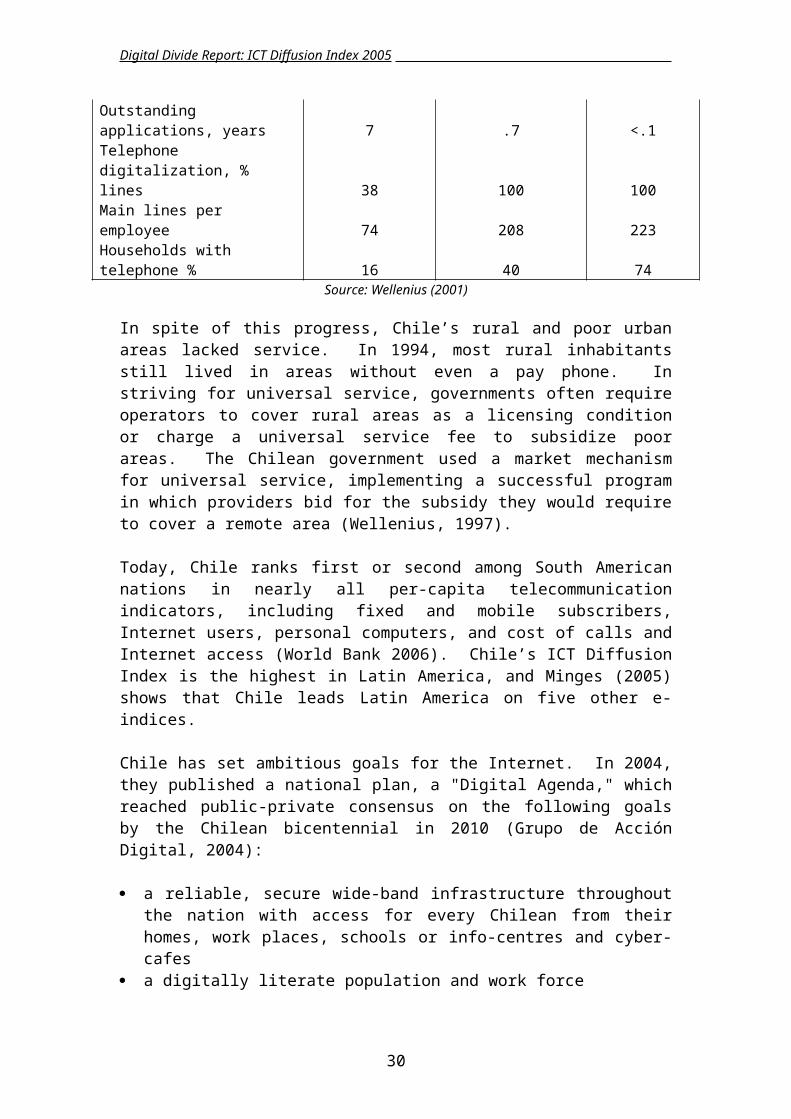
Digital Divide Report: ICT Diffusion Index 2005
Figure 13 The NSFNet backbone in 1991 after it was upgraded from to 1.4 mbps
Source: Merit57 Network, Inc.
In addition to building the network, NSF assisted universities and research institutes with connecting to it. Any university with a local area network could connect to one of the backbone nodes without charge. The NSF also paid for the communication link to the backbone node and a router on the campus, establishing an Internet point of presence (POP). They later encouraged foreign research networks to connect to the backbone. In addition to providing connectivity without cost, they negotiated special communication link prices on behalf of developing nations via competitive bid. Eventually, they assisted 28 foreign research and education networks with connectivity, making NSFNet the first global Internet backbone.
Three NSF policies contributed to the success of the network.
3.6.1. The network was highly leveraged.
NSF built the backbone and provided each university a $US 20,000 grant for a router and connection assistance. The total cost of this program was under US$100 million, but all it did was establish a network POP on the campus. It was up to the universities to equip staff and support their local area networks. The aggregate cost of building and operating those networks far exceeded the cost of the NSF backbone and their connection assistance program.
57 Merit is a non-profit governed by the public universities of Michigan and was the NSFNet operator.
33
Digital Divide Report: ICT Diffusion Index 2005
Table 15 The cost of US government funded network infrastructure projects.
Project Cost(US$ million)
Morse telegraph .03ARPANet 25CSNet 5NSFNet backbone 57.9NSF US higher education connections 30NSF international connections 6
Source: Press (1996-b)
3.6.2. NSFNet and the networks that preceded it were regarded as research projects, conceived and designed by highly qualified researchers.
Although ARPANet, CSNet and NSFnet eventually went into production, they were applied research projects. At the time they were being designed, active debates on packet-switching versus circuit-switching, OSI versus TCP/IP, the separation of the network and transport layers, etc. were taking place. Routing algorithms and the domain-name system had to be invented.
Highly qualified researchers from leading universities and research labs were brought in to design and oversee the implementation of these networks. The work was not done by career government employees, but by top scientists on temporary assignment. These scientists funded research and development with grants and oversaw network deployment once contracts were awarded by competitive bidding.
3.6.3. NSFNet was a "dumb," end-to-end network. 58
As we have seen, the NSF funded only the Internet backbone, and left the bulk of the funding to universities who built networks to connect to it. More important, application development was also left to the users. The network itself was designed to be simple and fast. Routing algorithms were only to move data packets from one computer to another, making a best effort to get them closer to their destination, nothing else. The network was "dumb," since it ignored the content of those packets. They were treated the same if they contained music or pictures, email messages or images from Mars, messages from children or messages from distinguished professors.
The data was interpreted and acted upon by application programs running on the computers connected to the network. Even error checking was left to the computers at the edges of the network. Applications and application protocols from email to the Web to file-sharing, blogs and wikis were invented by users at the network edge, not by the operators of the network. Every user was a potential application inventor and developer. Every user was a content provider.
58 This philosophy was an integral part of the design of the Internet routing protocol, see Saltzer, et al, (1984) and Isenberg (1998).
34
Digital Divide Report: ICT Diffusion Index 2005
4. Promoting the telecommunication sector: liberalization and beyond
The latter part of the twentieth century witnessed a global trend away from protected, controlled economies toward open, market economies.59 Telecommunication was included in this movement. We have seen a steady trend toward privatization of state-owned companies, openness to competition and foreign investment, and liberalization of regulation. The dominant telecommunication policy has favoured privatization, competition and independent regulation (PCR).
4.1 PCR: privatization, competition and independent regulation
PCR has been encouraged by the World Trade Organization (WTO). In February 1997, 69 WTO member nations agreed to open their telecommunication services markets. The agreement was signed by a mix of industrialized and emerging nations, which, according to the International Telecommunications Union (ITU), accounted for over 91% of global telecommunication revenues and 82% of the world's telephone main lines in 1995. The agreement was lauded by observers ranging from US FCC Chairman Reed Hundt to Bernard J. Ebbers, president and CEO of WorldCom who predicted lower prices, accelerated infrastructure rollout and economic growth. (Press, 1997). By December 1998, there were 90 signatories, and the WTO reported that
Under the stimulus of competition and changing technologies new services are constantly being developed … demand for and issues of licenses have increased dramatically. Competitors are prompting sharp reductions in prices of international and national long distance services … The clear prospect of competition has also further accelerated the pace of innovation, leading to new services that may have been difficult to foresee less than two years ago when the WTO negotiations concluded (WTO, 1998).
As of July 1998, over 1,000 facilities-based international carriers were operational worldwide, compared with less than 500 just two years earlier. The ITU reported that by 2002 56% of nations had had fully or partly privatized their incumbent telecommunication operator and those countries accounted for 85 per cent world telecommunication revenue (ITU, 2002). Competition was also increasingly allowed. By 2001, 37% of countries allowed competition on long-distance calls, 38% on international calls, and 43% on local calls. Seventy eight percent of the nations allowed mobile competition and 86% allowed Internet competition. There were fewer than 200 mobile operators around the world in 1992 and by the end of 2001, there were over 600. Telecommunication had also become global with many companies in developed nations have holdings in other nations. The ITU summed the situation up as follows:
59 In South America, the pendulum may be swinging back with the elections of left-leaning governments in Brazil, Uruguay, Venezuela, Bolivia and most recently, Chile.
35

Digital Divide Report: ICT Diffusion Index 2005
Four words sum up today’s telecommunication market: private, competitive, mobile and global. The pace at which these have occurred is remarkable, that calls for liberalization of the industry are increasingly overtaken by reality.
The ITU stated what has become conventional policy wisdom, and they singled out our three PCR components, private sector participation, market competition and independent regulation. They advised that all three must be present, even if practical politics keeps them from occurring in the ideal sequence. Omitting one step completely was worse than doing it in the wrong order. For example, Botswana established an independent regulator in 1996 and began allowing competition in 1998, but is planning to privatize BTC this year. Along these lines, (ITU 2000) suggests that:
• Privatization without competition is good, but privatization with competition is better• Introducing private sector players is good, but allowing them the freedom to compete is better• Creating regulators is good, but giving them adequate powers and independence is better• Creating a duopoly is good, but allowing open competition is better• Introducing competition is good, but introducing it at an early stage is better.
To varying degrees, nearly all nations have moved toward telecommunication PCR during the last twenty five years, and we have witnessed dramatic improvement in service everywhere. Still, there are limits to the efficacy of PCR policies.
4.2 PCR policy limits
Each nation is different in many ways, and a progressive telecommunication policy can be trumped by factors like ineffective government agencies, recalcitrant incumbent operators and corruption. For example, in the United States, the incumbent operators have successfully thwarted the intention of the 1996 Telecommunication Act to create viable competitive local carriers, and in many states they are lobbying for laws prohibiting municipal governments from providing Internet service. William Kennard, who, as chairman of the United States Federal Communication from 1967-2001 was charged with implementing the Telecommunications Act, stated near the end of his term that “all too often companies work to change the regulations, instead of working to change the market,” and spoke of “regulatory capitalism” in which “companies invest in lawyers, lobbyists and politicians, instead of plant, people and customer service” (Kennard, 2000). He went on to remark that regulation is “too often used as a shield, to protect the status quo from new competition - often in the form of smaller, hungrier competitors -- and too infrequently as a sword -- to cut a pathway for new competitors to compete by creating new networks and services.”
In addition to stifling competition, companies in a regulatory capitalism market attempt to increase rates and subsidies while minimizing cost and investment. For example, Kushnick (2006) reports that:
36
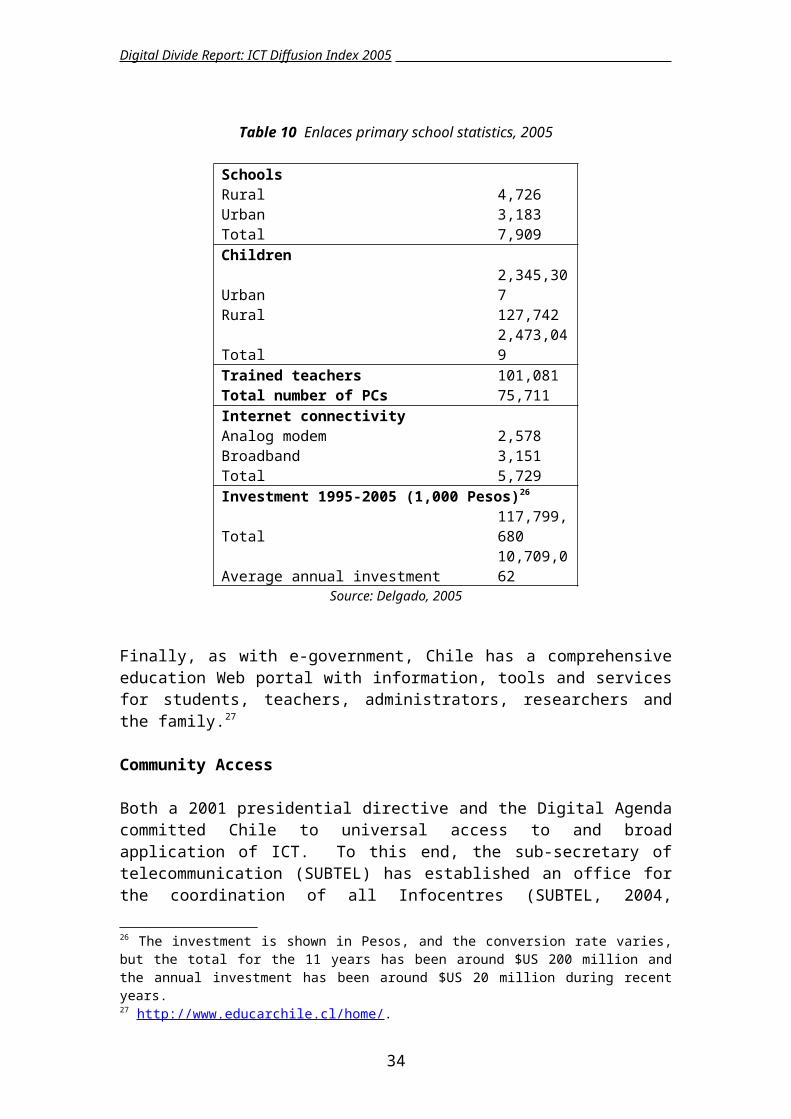
Digital Divide Report: ICT Diffusion Index 2005
. . . in the early 1990's . . . every Bell company . . . made commitments to rewire America, state by state. Fiber optic wires would replace the 100-year old copper wiring. The push caused techno-frenzy of major proportions. By 2006, 86 million households should have had a service capable of 45 Mbps in both directions . . . In order to pay for these upgrades, in state after state, the public service commissions and state legislatures acquiesced to the Bells' promises by removing the constraints on the Bells' profits as well as gave other financial perks . . . The phone companies collected over $200 billion in higher phone rates and tax perks, about $2000 per household. (Kendrick, 2006)
Despite the intention of the 1996 Telecommunication Act, the United States has fallen to 19th in household broadband penetration rate (Bandwidth Report, 2006), prices are higher and connection speeds are lower than in many other nations, service is often asymmetric, thereby discouraging customers from serving information, and terms of service may further restrict them. No one who has observed the incumbent telephone companies in the United States or watched the battle they and the cable companies have waged against municipal government networks and competitors attempting to enter the market would describe the United States market as “competitive.” It is at best an oligopoly in which powerful incumbents use the courts and political power at all levels to maximize revenue and stifle competition.60
Although many nations allow telecommunication competition, market structures vary. For example, there might be competition in mobile and Internet service, but a single long distance carrier. For example, in the United States some areas have no broadband Internet service; many have only one choice of provider, and others two.
Market freedom may also be constrained by vertical integration, with, for example, one company offering connectivity, Internet service and content or one ISP controlling a nation’s international gateway. While competition may reduce prices, it may not be feasible due to high cost for duplication of infrastructure and reducing economies of scale and scope.61
Privatization does not mean government has no role. We have seen the importance of a strong, independent regulator in the case of Botswana. The regulator must have the resources to audit providers and create and enforce regulations that mitigate inequity stemming from integration and imperfect competition.
In addition to regulation, the government often plays a key role in planning and procurement, as illustrated in our case studies:
Chile was first with PCR in South America, but the government has also taken a leadership position in developing a comprehensive ICT plan, developing e-government services, a comprehensive school network and curriculum program, and coordinating telecentres.
60 See, for instance, Schatz (2006) and Hundt (2005). For more on municipal networks see http://muniwireless.com and http://www.baller.com/comm_broadband.html.61 Economies of scope refer to efficiencies associated with firm’s diversification into several products. Economies of scope are conceptually similar to economies of scale, which apply to efficiencies associated with increasing the scale of production.
37
Digital Divide Report: ICT Diffusion Index 2005
The Indian government convened task forces which led planning and reform, and both national and state governments have encouraged investment in infrastructure and efforts to bring telephony and Internet connectivity to rural villages.
The Singapore government has played a major role in ICT planning and both made direct investments and encouraged deployment by developing and offering e-government services.
In addition to planning ICT development, the Chinese government has allowed government-owned companies to compete with each other and has allowed competition among companies connecting to state-owned backbones.
The United States NSF seeded the Internet by constructing a backbone network and paying for the connection of university and research networks to it.
There is a long history of government funded communication infrastructure including mechanical networks in 19th century Europe and the first large scale electro-magnetic telegraph deployment in the United States (Figure 14).
Figure 14 United States Congressional Record of funding for the initial Morse Telegraph
Source: The Library of Congress, American Memory62
We have witnessed strong growth in telecommunication under PCR policies, but it is difficult to determine what portion of that improvement is due to telecommunication policy and what part is due to broader economic policy and performance and technological improvement.63 Comparing rank changes tends to isolate policy since nations that move up in rank are improving relative to nations with relatively similar economic situations and access to current technology Table 16 compares the change in ICTDI ranks of nations which had signed the WTO telecommunication services accord by December 1998 to those which had not (WTO, 1998).
62 http://memory.loc.gov/ammem/index.html63 See Lipsey (2000) for an economic-theoretic critique of policy which ignores the effects of endogenous technical change. the accompanying uncertainty (as opposed to quantifiable risk), and the complexities of production-facilitating structure (human capital, financial institutions, etc.) and existing public institutions and policies.
38
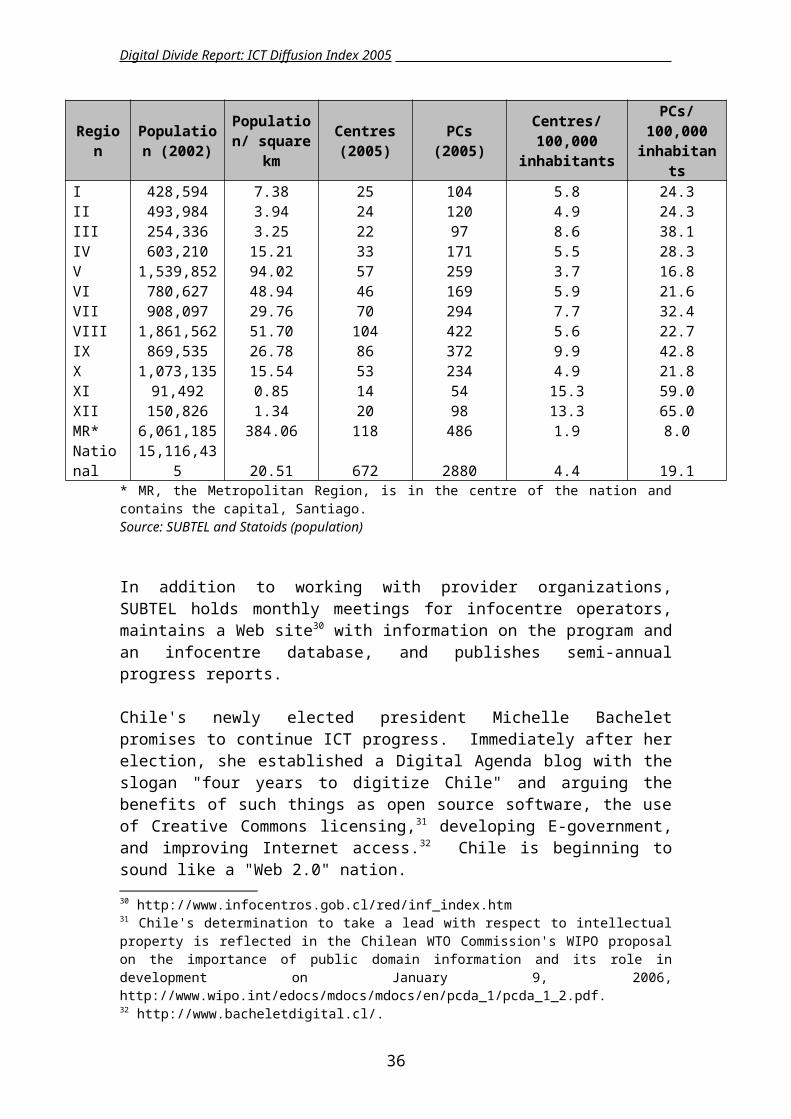
Digital Divide Report: ICT Diffusion Index 2005
Table 16 Changes in ICTDI rank between 1997-2004 for WTO signatories and non-signatories.
Average St. Dev. nAll nationsWTO signatories -2.1 9.8 88Not signatories 2.0 11.0 92Low incomeWTO signatories 0.1 9.3 17Not signatories 4.3 10.8 37Sub-Saharan AfricaWTO signatories -0.8 8.4 11Not signatories -0.7 6.8 30High incomeWTO signatories 0.9 7.2 29Not signatories 5.1 8.4 7
Source: WTO (1998) for the WTO signatories and authors' calculations
As we see, nations which had signed on to the WTO accord improved only slightly in rank and those which had not signed rose slightly.64 There was virtually no difference in Sub Saharan Africa, and the largest change was in high income nations. The two groups are sufficiently close that we might wonder whether those policies had reached the point of diminishing returns.
PCR policies have had an overall positive impact, and there is still room for policies encouraging competition through open access to oligopoly-controlled infrastructure, but the digital divide persists. While foreign investment has been very important in some nations, Chile for example, it has not generally been sufficient to close the digital divide.65 The situation does not appear to be improving. For example, the United Kingdom Department for International Development (Balancing Act, 2004) has estimated bandwidth demand based on a medium-growth scenario for sub-Saharan Africa and concluded that “Under current conditions, there is almost certainly a shortfall in financing these projects.” This conclusion is reached by extrapolating demand for today’s low bit-rate applications. There is little hope for the more valuable but resource-demanding applications of tomorrow. If PCR is not sufficient to close the digital divide, we should consider complementary policies.
4.3 Beyond PCR
This section considers proposals to construct public Internet backbones which would provide neutral connection points for competing service providers – the sort of eclectic strategy we have seen in our successful case studies. We would expect the 64 A nation may commit to up to 17 telecommunication services. If we drop nations which had not committed to either voice telephone or terrestrial mobile service, signatories do slightly better.65 The bulk of foreign investment has gone to large companies for privatization and mobile networks, encouraging oligopoly. As we have seen in the case of the attempted reform of United States telecommunication in 1996, large companies in oligopoly markets resist pro-competitive policies. Domestic investment may be more likely to go to small, competing service providers.
39
Digital Divide Report: ICT Diffusion Index 2005
same sort of investment, innovation, and skill development by the connecting service providers and users as occurred in the case of the NSF backbone described above.
We focus upon the Internet because of its generality. As we saw above, the Internet communication protocols are intentionally simple, therefore allowing the transport any type of data for any type application. We also have over a decade of experience with the Internet in developing nations. Since its inception, researchers have hypothesized that the Internet could improve the quality of life in developing nations and that the impact might be greatest in rural areas, which have poor telecommunication and transportation infrastructure.66 This hypothesis has inspired a great deal of work over the last 10-15 years, and it has been confirmed.
During this time, we have trained thousands of networking leaders and technicians from developing nations, conducted many national studies of policy and technical “e-readiness,” and put the Internet and its role in development on the “radar screen” of every government. Most important, pilot projects have demonstrated valuable applications in health and veterinary care, education, agricultural markets, advice, and transportation, entertainment and games, news, personal communication (text, voice, video), and e-government.67
Sprigman and Lurie (2004) suggest that Internet backbones should be nationalized in developing nations. They feel publicly owned backbones would level the playing field and increase competition among retail providers, leading to innovative services at lower prices. They are aware of the dismal track record of governments running telephone networks, but point out that a telephone network is complex while an Internet backbone is relatively simple. As we saw in our discussion of the United States NSFNet, Internet complexity is found at the edges of the network, not the backbone.68 They advocate creation of a level playing field in which the government operates the backbone and provides equal access to competitive retail service providers and application developers.
Press (2004a, 2004b) considers this possibility in more detail, and advocates the goal of building, at public expense, an Internet backbone in every developing nation and region, and providing a high-speed connection from the backbone to a POP with a power supply69 in every rural village.70 Where possible, fibre would follow roads, pipelines, railroad lines, etc. to villages. A terrestrial wireless mesh would reach the others (Press, 2003).
66 This hypothesis has been stated frequently, in many forms, by many people, for example, Sadowsky (1993) and Press (1995 and 1996). 67 For descriptions of successful applications in developing nations, see:
International Development Research Centre, http://www.idrc.ca/ Digital Dividend Project, http://www.digitaldividend.org Information for Development Program, Infodev, http://www.infodev.org/ Development Gateway, http://www.developmentgateway.org/ Sustainable Development Networking Program, http://www.sdnp.undp.org/
68 A circuit-switched telephone network is the opposite. The network is designed to optimize a single application, telephony, and a complex network connects simple devices at the edges, telephones. 69 Power is included in the definition of “point of presence.” As such, power engineering is one of the expertise areas listed below. MIT, IIT, Virginia Tech and others are sources of expertise, and a variety of solutions would have to be developed. This is a difficult challenge, but neither unprecedented nor insurmountable.70 Much of what follows in this section is based upon these two articles.
40
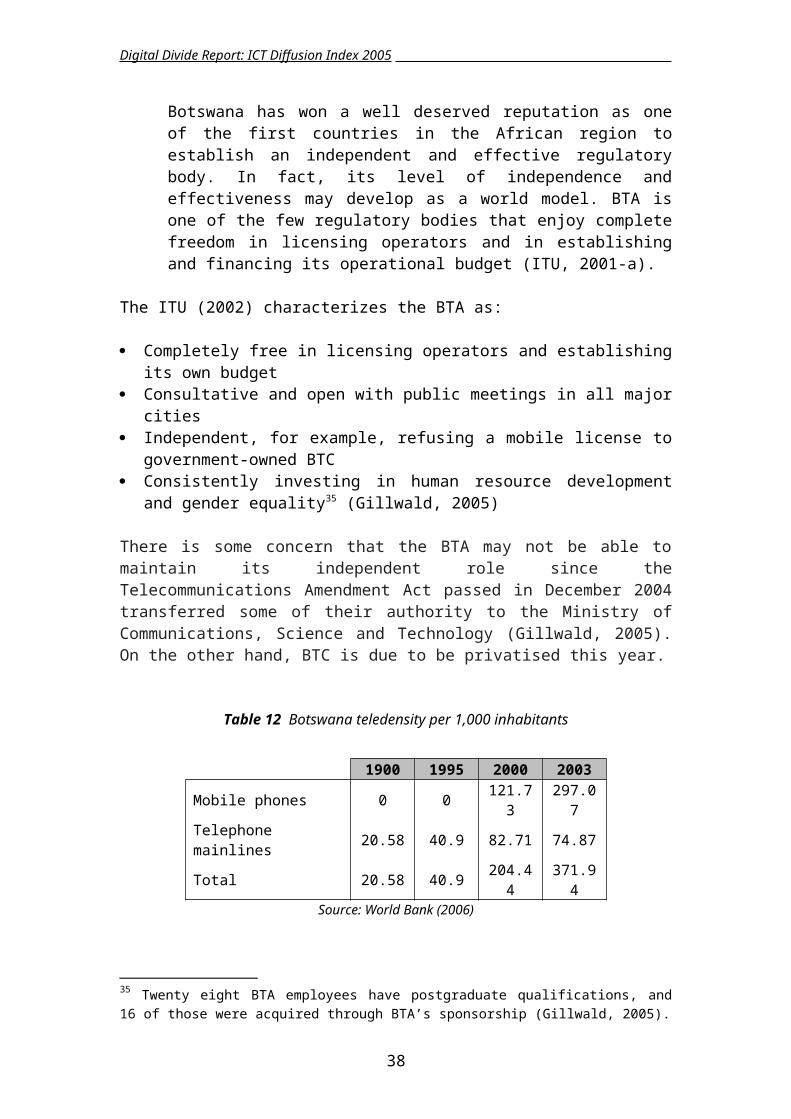
Digital Divide Report: ICT Diffusion Index 2005
It should be noted that a high-speed network would encourage and enable applications that are not feasible today in developing nations. For example, downloading movies and other forms of entertainment would be practical. The medical diagnosis session illustrated in Figure 11 uses only low-resolution video and text chat. A high-speed network would support high–resolution video, hi–fidelity sound from a stethoscope, EKG data, and other diagnostic input like the low-cost endoscope developed by a rural physician in the Mekong Delta (Le, 2005). There would also be capacity for many simultaneous voice-over-IP telephone calls. The Indian and Chilean telecentres described above could evolve into village theatres, clinics and phone companies.
Necessity is the mother of invention, and rural people in developing nations would develop applications to solve their own problems using their resources and knowledge of those problems. Once completed, the network would serve as a platform for deploying and testing these applications. Of course the benefit of those applications, for example low-cost medical instruments like the endoscope mentioned above, would accrue in both the developed and developing nations.71
Going beyond a single nation, Tongia (2005) has created a preliminary design for an African backbone. His high-level design calls for a 70,000 Km fibre core (Figure 15) with 30,000 Km of fibre spurs with terrestrial wireless technology linking the remaining villages to this fibre backbone.
Figure 15 Core fibre backbone for Africa72
Source: Tongia (2005)
National planning and investment must take place in the context of regional planning. For example while the west coast of Africa has several fibre landing points, the east coast does not; however, the Eastern African Submarine Cable System (EASSy) is planned for East Africa.73 EASSy, shown in red in Figure 16 is a proposed 8,000 Km 71 We are reminded of the story of the young mathematician Srinivasa Ramanujan who rose to fame and after writing Professor G.H. Hardy at Cambridge from his village in Southern India, http://s cienceworld.wolfram.com/biography/Ramanujan.html.72 The fibre core is shown in yellow; the spurs are not shown.73 http://eassy.org/.
41
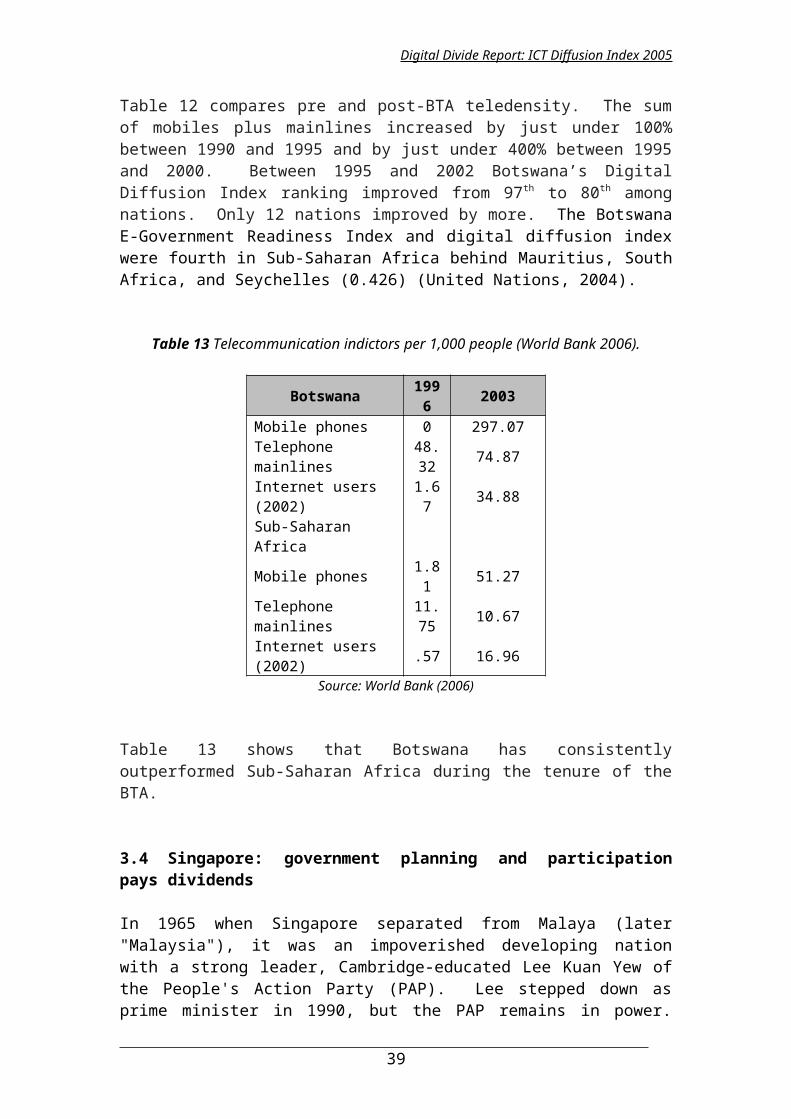
Digital Divide Report: ICT Diffusion Index 2005
cable that will connect East Africa to Asia. EASSy is scheduled to begin operation by the end of 2007, and, if successful, it will provide landing points for a network like that proposed by Tongia. Tongia’s network would in turn provide connectivity for national backbones.
Figure 16 Proposed (red) and existing submarine cable serving Africa
Source: http://eassy.org
The initial investment anticipated by EASSy is US$200 million. To put that in context, Tongia estimates his network would put an Internet POP within walking or bicycling distance of 400 million people at an estimated cost of one billion US dollars. Let us assume his cost estimate is off by a 100% and village POP and power equipment would double the cost. What if the project were to cost four billion dollars? While a daunting figure, it is not unprecedented for an infrastructure project, as we see in Table 17.
42
Digital Divide Report: ICT Diffusion Index 2005
Table 17 Comparative project costs in then-current dollars74
Project Cost (US$ billion)
Manhattan Project (atomic bomb) 1.889
US Interstate Highway system 128.9
Apollo program 25.4
Global positioning system 8.3 through 1995, 21.8 to complete
Washington Nationals baseball stadium .581
B2 bomber 2.2
US and European pet food 17 per year
2005 G8 African pledge 25 per year new aid
At four billion, Tongia’s network would be easily affordable within the US$25 billion in new annual African aid pledged by the G8 in 2005 (G8, 2005).
Connecting the 3 billion people residing in the World’s 3 million villages would require significant subsidy and management, but there is ample precedent in project like those listed above. Following the lead of NSFNet, a team of experts from many fields would have to be involved: Geographic Information Systems with data on current and planned fiber, the rail,
pipeline, power distribution and road systems, village coordinates and populations, topography, vegetation and climate
Terrestrial wireless radio design and tuning Mesh networking and routing algorithms Fiber optic network design and installation Design and operation of network operation centres for monitoring and maintaining
a large, unreliable network Network design -- both practical and using mathematical modeling and
optimization Antenna design and modeling Mechanical design for radio towers Design of solar and other power systems Satellite communication research and practice High altitude platform research and practice Design of village POP configuration
74 Manhattan project: http://www.brook.edu/FP/PROJECTS/NUCWCOST/MANHATTN.HTMInterstate highway system: http://www.fhwa.dot.gov/programadmin/interstate.htmlApollo program: http://www.biography.ms/Apollo_program.htmlGPS: http://www.rand.org/publications/MR/MR614/MR614.appb.pdfBaseball stadium: http://www.washingtonpost.com/wp-dyn/articles/A13495-2005Mar30.htmlB2 bomber: http://www.fas.org/nuke/guide/usa/bomber/b-2.htmPet food: http://www.worldwatch.org/press/news/2004/01/06/G8 pledge: http://www.g8.gov.uk/servlet/Front?pagename=OpenMarket/Xcelerate/ShowPage&c=Page&cid=1119518698846
43
Digital Divide Report: ICT Diffusion Index 2005
Training for POP operation Experience with village telecommunication centre operations and applications Spectrum politics and policy Local government and university relations
The first step would be a feasibility study and preliminary design for a pilot nation. The project team would engage in independent research, field experimentation, and periodic meetings to design standards-based network and POP equipment as shown in Table 18:
Table 18 Backbone and POP elements that would be designed
Item Comment
POP equipment and installation Router, server, peripherals, and software
POP power Various power sources would be used
POP building Best left to local people
POP radio, tower and antenna Should radios be homogenous?
Backbone radio, tower, antenna Should radios be homogenous?
Backbone maintenance and security Private firm?
Optical backbone upgrade After assessment
Network operation centre Key to maintenance
Source: Press (2004-b)
The initial research team would retain responsibility for contracting for and evaluation of this trial. Once that network was operational, planning for other nations could begin.
Planning for deployment in other nations could proceed in parallel with deployment in the pilot nation. Selection of the pilot nation and the deployment ordering of the other nations would be based on criteria, such as:
a. Strong government support of telecommunication in general and this project in
particular
b. Open, competitive telecommunication market
c. Open, competitive business practices and laws
44
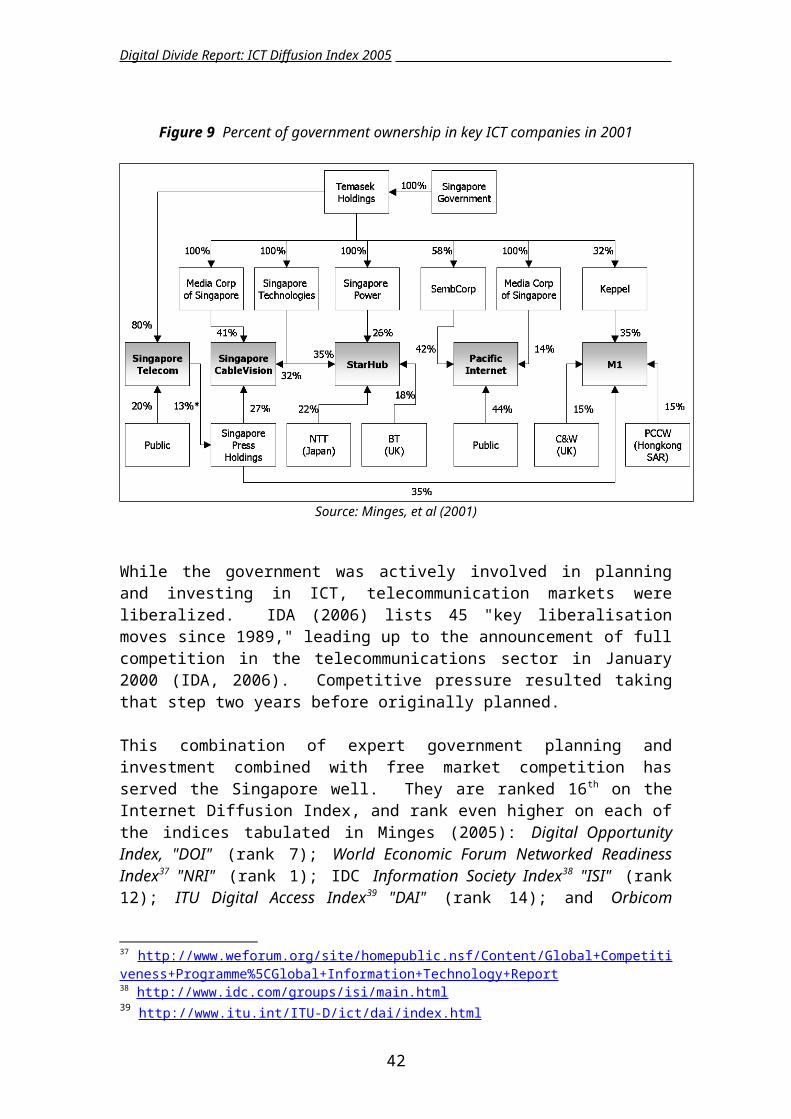
Digital Divide Report: ICT Diffusion Index 2005
d. High level of poverty
e. High level of literacy
f. Dense population relative to current fiber, roads, pipelines, etc.
g. High-speed international fiber links
h. Strong university programs in computer science, geography, GIS, etc.
i. Varied climate and topography
As is always the case in engineering, these criteria involve tradeoffs. While we would like to begin with a large, deeply impoverished nation with varied climate and topography in order to reach many people and learn from broad experience, we would also like to succeed at as low a cost as possible. Let us consider two of our case study nations, Chile and India. In both nations, there is a strong government commitment to ICT diffusion and application – our most important criteria. However, Chile is much smaller, more affluent and modern, making success more likely and reducing the cost of the first effort. On the other hand, a network that met our goal for India would bring ICT service to many more, poorer people. Table 19 summarizes the positions of Chile and India with respect to the above criteria. Regardless of which nation we begin with, if we have the will, all can be reached within a decade.
45
Digital Divide Report: ICT Diffusion Index 2005
Table 19 Pilot study criteria for Chile and India
Criteria Chile India
A
The government has a strong record of PCR policy combined with active participation in network-based education, e-government, infocentres, etc. The Digital Agenda plan attests to this being an ongoing commitment.
India has had a high-level commitment to ICT for many years and is an outsourcing leader. The federal and state governments support a fibre backbone to the “county” level and infocentres in every rural village.
BChile was first in South America to privatize and liberalize telecommunication markets.
All telecommunication sectors are open to competition.
CChile leads South America and was 20th among nations in economic freedom in 2003.
India ranked 66th in 2003, but has improved from 81st in 1990.
D
Chile is relatively affluent with a 2004 GDP per capita of US$11,487. The GINI coefficient is 57.1 indicating an uneven income distribution (118th in the world).
India is relatively poor with a GDP per capita of US$2882.56. The GINI coefficient is 32.46, ranking them 31st globally.
EChile had a literacy rate of 95.7 in 2002 and the population is nearly 100% Spanish speaking.
India has hundreds of languages and the overall literacy rate was 61% in 2001.
F
Chile has a well developed fibre infrastructure and is a narrow nation which facilitates connectivity, but roads do not reach all parts of the nation.
India plans to reach each taluk with fibre by the year 2007.
G
Chile is served by undersea cable and has a 14,907 Mbps international Internet bandwidth capacity. Average traffic during 2005 was 5,117.8 Mbps and peak was 7,4821 Mbps (50.2%).
India is served by undersea cable and has 8,178 Mbps international Internet bandwidth capacity. Average traffic during 2005 was 3,048.5 Mbps and peak was 4,856.3 Mbps (59.4%).
H
Chile has good universities with a gross enrolment rate of 42% of the university age group. Nearly all computer science faculty members at top universities have PhD degrees from abroad.
The Indian Institutes of Technology are among the best in the world, and there are good, widespread technology trade schools in India.
I
Chile is varied with dry desert in the north, temperate valleys, and a cold wet climate in the south. Topology ranges from a long coast to the Andes mountains. The nation is long and narrow, placing the population relatively near fibre.
Indian climate varies from desert to monsoon and topology ranges from sea cost and plains to the Himalayas in north.
46
Digital Divide Report: ICT Diffusion Index 2005
5. Methodology appendix 75
The Index of ICT Diffusion is designed to evaluate ICT development using indicators of ICT diffusion across countries. It measures the average achievements in a country in two dimensions:
Connectivity, as measured by Internet hosts per capita, number of PCs per capita, the number of telephone mainlines per capita and the number of mobile subscribers per capita. As such, it gives a measure of the infrastructure development.
Access, as measured by the number of estimated Internet users, the adult literacy rate, the cost of a local call and GDP per capita (PPP US$). This component aims at describing the opportunity to take advantage of being connected.
An index score is calculated for each of these indicators by applying the following formula: Value achieved / Maximum reference value. Connectivity and Access indices are then calculated as an average of index scores of their respective components and Index of ICT Diffusion is itself an average of these two dimensions.
Appendix 1. Index methodology
Edgeworth (1925) defines an index number as "a number [that] shows by its variations the changes in a magnitude which is not susceptible either [to] accurate measurement itself or [to] direct valuation in practice". Press (1999) observes that "in tracking diffusion of the Internet, one must choose a balance between breadth and depth" and concludes that “an index may be more robust than a [single] indicator in measuring a qualitative concept”. This view of a cluster of technologies is consistent with that of the Mosaic Group, which suggests that individual technologies need to be evaluated, since countries seldom exhibit uniform capabilities across the broad spectrum of ICTs. Measures of breadth and depth are needed — a dilemma which the Mosaic Group resolves by the use of Kiviat or “wheel and spoke” diagrams (Press, 1999) to reflect technology as a “multi-faceted concept”. UNCTAD has reflected this balance between breadth and depth through use of an aggregate index with component sub-indices.
However, there are dangers inherent in the use of a disaggregated index. The Mosaic Group observes in its “Framework Analysis” paper (1996) that “while it is tempting to derive a single index to reflect a country's IT capability, such an approach is unlikely to provide the depth of understanding needed for policy decision-making”. Press (1997) explicitly warns against the dangers of averaging, or "reducing a [multi-faceted] capability diagram down to a single number" (i.e. area), since capability diagrams with the same total area may have very different shapes, that is countries exhibit different profiles across the spectrum of ICT technological capabilities. Press (1999) notes further challenges for Internet indices: "should be orthogonal, each measuring an independent aspect of the state of the Internet in a nation, but it is 75 UNCTAD (2003)
47
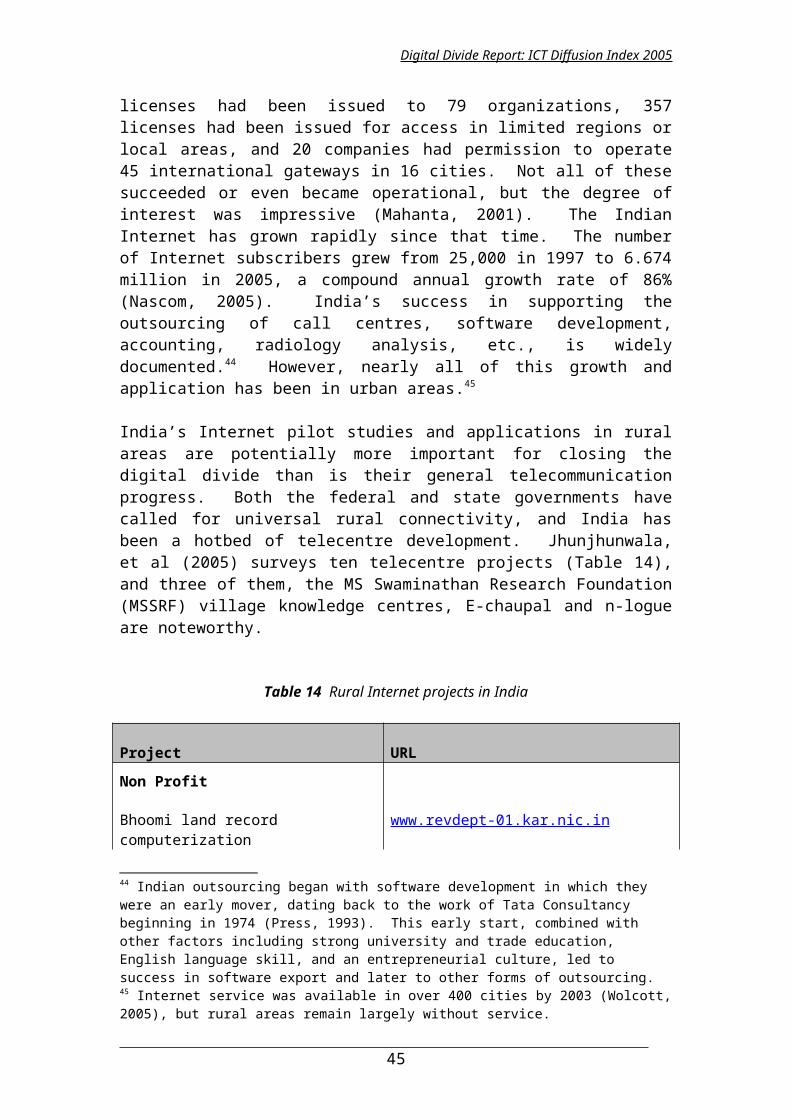
Digital Divide Report: ICT Diffusion Index 2005
difficult to define indices that are both comprehensive and uncorrelated". Simple averaging of indicators in an index implicitly assumes equal weighting of indicators and the possibility of offset of one indicator by another (i.e. connectivity is assumed to be equivalent to access). GIT (2000) notes that an "additive model implies that strength on any one of these dimensions could compensate for weakness on another".
Whether inputs into the process of technology development are considered sequential, as with UNDP (2001), or synergistic, as in the “cluster” approach of McConnell International (2001), determines the form of index adopted. A sequential concept of technological inputs implies an additive model in which factors with implied equivalence may offset each other. In other words, strength on one aspect can compensate for weakness on another, as above. This is also the perspective within which the idea of “leapfrogging” fits. For instance, Cambodia's lack of fixed mainlines may not matter, as its high mobile penetration rate is likely to offset this, implying “leapfrogging” by “skipping a step” in the sequence. In fact, determinants do not have the same or equivalent influence over IT capability.
Conversely, a synergistic view of a critical mass of associated technologies essential for a country's advancement in technology implies a multiplicative model in which weakness in any one input may hinder and impede effective development on the basis of non-equivalent inputs. This is the view put forward by McConnell International (2001) in the context of the Internet, stating that a multitude of factors must be in place in order to take full advantage of the economic potential of the Internet, and that weakness in one area can seriously obstruct the realization of potential benefits. GIT (2000) also describes a synergistic view of technological development by highlighting the fact that all four dimensions in its model, namely national orientation, socio-economic infrastructure, technological infrastructure and productive capacity, have to be strengthened for a nation to enhance its technology-based export competitiveness.
Despite these two differing views and methodologies, indices have usually followed simple additive averaging models. UNCTAD also opts for such a model mainly for two reasons. First, our review of work to date indicated that results calculated using both methodologies do not differ significantly from each other. Second, the additive model is more widely used because of its relative simplicity. UNCTAD uses the aggregated index approach, with component indices (similar to UNDP's Human Development Index). Countries' overall scores may be disaggregated into component indices of interest, permitting finer discernment between nations with different profiles across the spectrum of ICT capabilities. Attention should not focus on final index scores, but on scores across country profiles.
Relative or absolute indices
The ITU notes in its 2002 World Telecommunications Development Report that “over the last few decades, virtually every country has succeeded in improving its telecommunications sector. Thus, every country can show that its particular blend of policies has been successful”. In absolute scores, therefore, nearly all countries will show increases in telecommunications connectivity. The ITU concludes “it is only by making international comparisons that it is possible to show which policies have been more successful than others…For this reason, an approach based on comparative rankings may be more meaningful than one that uses absolute growth rates” [italics
48
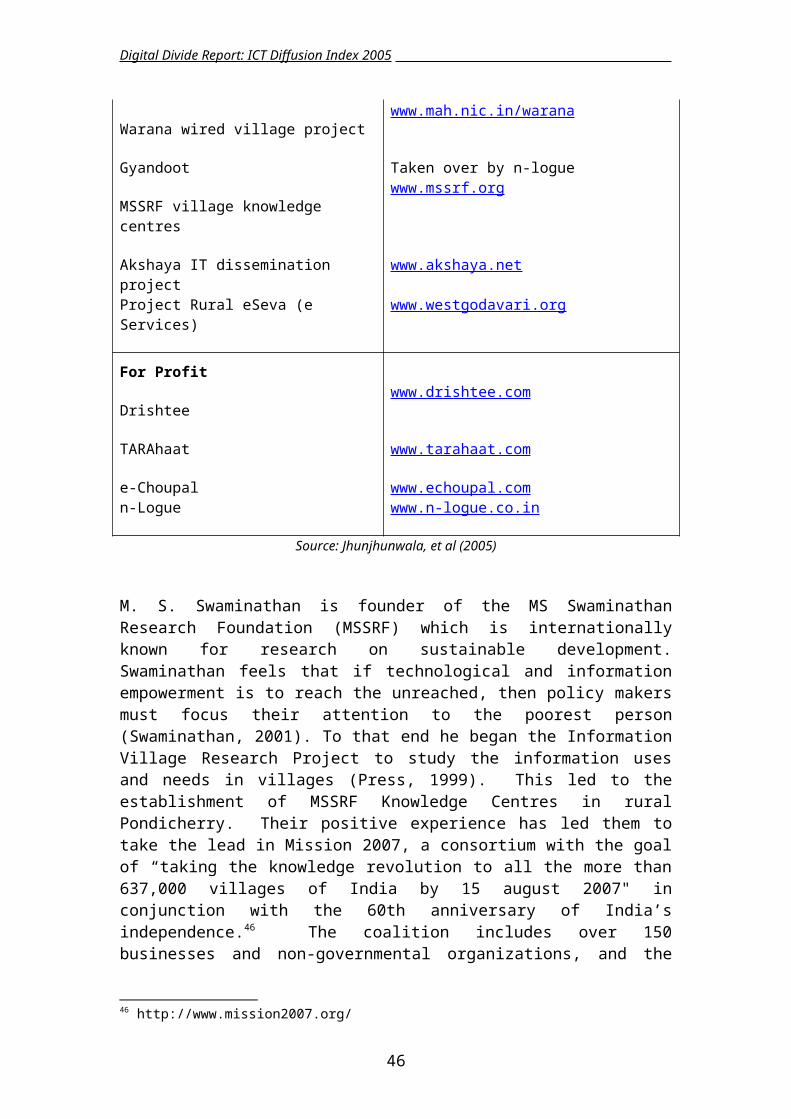
Digital Divide Report: ICT Diffusion Index 2005
added]. The ITU argues that relative growth rates are more insightful for policy analysis than absolute growth rates. UNCTAD therefore uses a methodology based on relative rankings, rather than absolute scores. Using relative rankings, countries' index scores are calculated as a proportion of the maximum score achieved by any country in any one year. This method has the advantage that reference points derive from real-world achievements realized by any country. However, it has the drawback that reference countries change year on year, thus reducing inter-year comparability. Only country rankings can be compared between years, consistent with the ITU's recommendations, rather than direct comparisons of countries’ scores (since the reference points are changing). In this report, UNCTAD adopts a comparative approach based on comparisons of relative country rankings between years to identify countries that are making progress in ICT uptake, and those that are being left behind in the digital divide.
Evidence from other studies illustrates some issues that may arise using relative indices. GIT (2000) notes that relative indexing “is a relative scaling so that an apparent ‘decline’ over time or low score is only relative to other countries”. GIT's HTI “are relative indicators. Hence, a 'decline' on an indicator does not imply an actual drop, just that competing countries have advanced faster”. Thus, “Germany is considerably closer to other leading nations than to the U.S. and Japan…this distancing is not due to any decline in Germany, but rather to the remarkable gains by the U.S" (GIT 2000). UNIDO (2002) also notes that “movements in rankings are relative, not absolute. Many [countries] like Kenya are not particularly technology-intensive exporters – they move up the scale because their exports are more complex than their other measures relative to other countries in their vicinity”.
These observations support the idea that, in general, it is more meaningful to talk about countries’ rankings than about a country's index score. Countries tend to group or “bunch” together (particularly around the centre of the index distribution), where a score interval of 0.1 may be equivalent to several places in the rankings. Conversely, countries that stand out in the lead or fall behind in the tails of the distribution may have relatively large gaps between country scores, such that a significant improvement in index score is necessary in order to catch up leaders, or for those behind to catch other countries up. In general, it will thus be more meaningful to talk about countries’ rankings than about their absolute index scores.
Reference points
The question of approach in using relative versus absolute indices is closely connected with the issue of reference points. Indices with absolute scores are calculated as a proportion of fixed reference points. This has the advantage of permitting direct year-on-year comparability of scores (although, for the reasons cited above, the significance of a country's score depends upon its place in the index distribution), but it is unclear what these reference points should be for ICT achievements. With some indicators, maximum achievements are relatively straightforward: for example, 100 per cent literacy rate, 100 per cent Internet user rate. For other indicators, maximum achievements are less obvious. Mobile penetration may reach over 100 per cent (e.g. for subscribers with more than one phone, or two Subscriber Identification Module cards per phone). There are no established a priori ceiling limits for Internet host penetration.
49
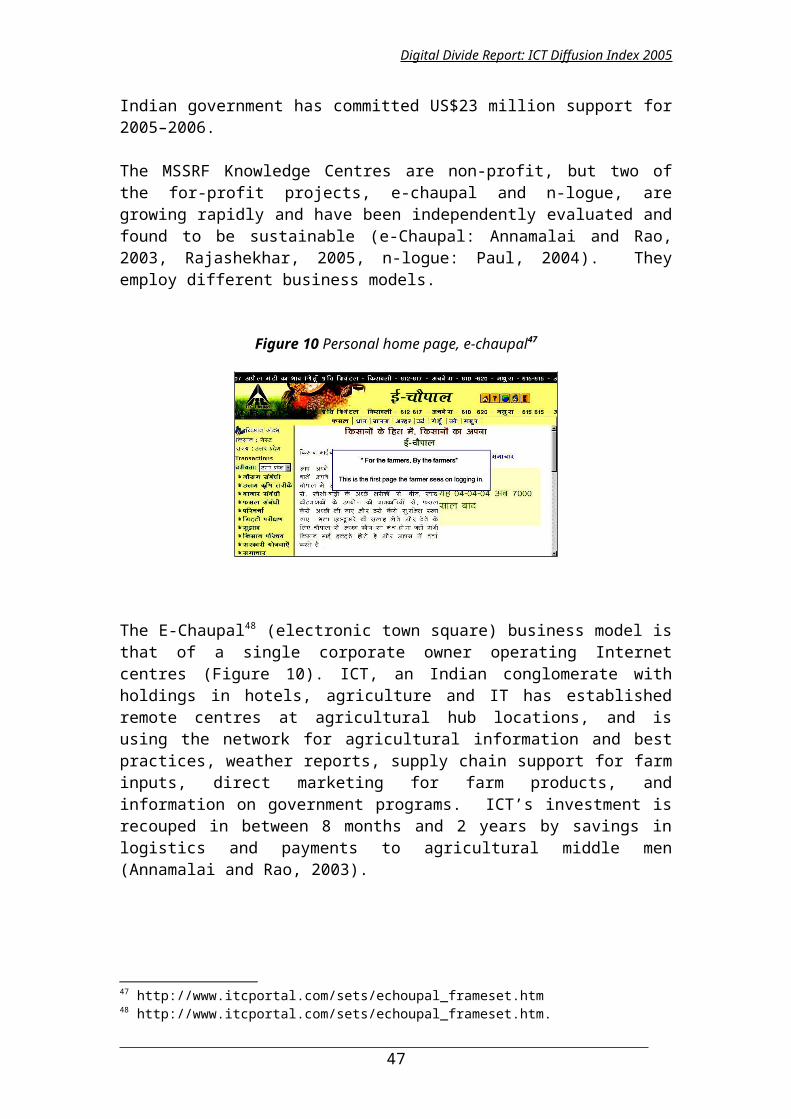
Digital Divide Report: ICT Diffusion Index 2005
The problem of an outlying “star performer” is also illustrated in GIT's work, where the country with the maximum reference value forges ahead. “The U.S. increased [its electronics production] by $71billion from 1996 to 1999. The U.S. position is so strong that even China’s remarkable doubling of electronics production from $33billion to $65billion increases its score only from 12 to 19” (out of 100).
Indicator scores methodology
Scores are derived as an index relative to the maximum and minimum achieved by countries in any indicator:
Index score = (Value – Minimum)/(Maximum – Minimum)
Annex table 1 presents the Index of ICT Diffusion calculated on the basis of the Connectivity and Access Indices for 2004.
Additive model and averaging
There is no a priori logic for weighting indicators in their aggregation into the index. Simple averaging of indicators in an index implicitly assumes equal weighting of indicators and the possibility of offset of one indicator by another (i.e. mobiles are assumed to have equal importance to telephones, PCs and Internet hosts; connectivity is assumed to be equivalent to access). GIT (2000) notes that an “additive model implies that strength on any one of these dimensions could compensate for weakness on another”. This is consistent with a sequential view of ICTs, rather than a synergistic one (where any weakness in the cluster reduces overall technological capabilities, i.e. a multiplicative model as discussed previously).Furthermore, use of simple averages across scores results in averaging effects. GIT (2000) recognizes that “a given indicator combines several scores [so] typically no country will score 100 on the resulting indicators”. In general, distributions are averaged into the centre of the scoring range. Averaging effects are noted by UNIDO (2002), which recognizes the possibility of “offset…at least for some countries [where] use of two benchmarks together biases the results against them in that their average capabilities appear lower”.
Unit of analysis
Our units of analysis are nation States, countries or territories defined by national boundaries. Technological hubs, or “centres of excellence” with extensive hinterlands (Telegeography, quoted in UNDP's HDR, 2001) are aggregated into national-level statistics and it is important to be aware of the significant averaging effect this has on our results. Adoption of nations and territories as our unit of analysis gives added pre-eminence to Singapore, as both a nation state and a “large city” (ITU, 2001), compared with, for example, a lower ranking for India, comprising Bangalore as a technological hub. Were New York or Bangalore to be separated out from their hinterlands, very different results would emerge. New York has more Internet hosts available to it than the whole of sub-Saharan Africa, which means that a city ranking, or ranking of nations by cities, would yield different results. The survey by Telegeography (2000) gives some indication of what a ranking by cities looks like.
50
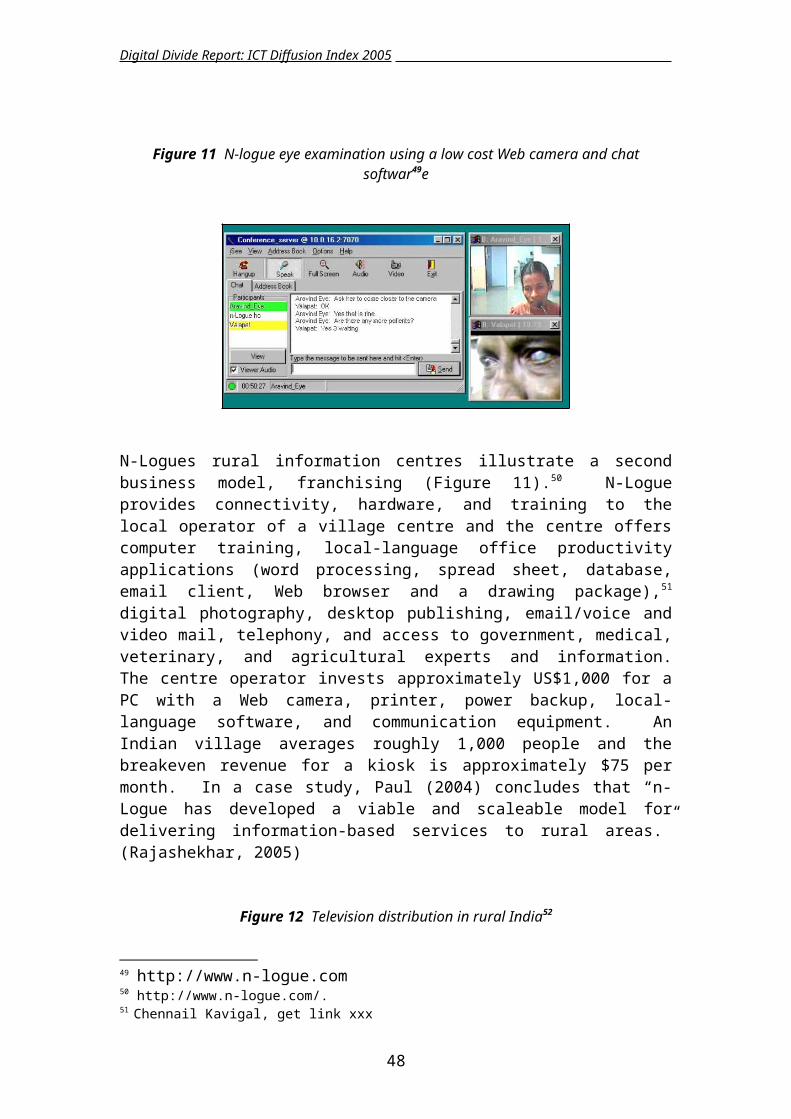
Digital Divide Report: ICT Diffusion Index 2005
Bridges.org (2001) observes that international digital divides have been assessed by comparisons of connectivity hardware between countries (PCs, hosts, servers, telephones), whereas domestic digital divides are assessed by measures of access by different groups (ethnicity, gender, age, income). The concept of disparities in access to ICTs is the same in both cases, but the unit of analysis as the nation state determines the choice of variables and method. The Mosaic Group (1996) measured the 'indigenization' of IT capability, or “involvement by nationals…in installation, use, operation, maintenance, management and adaptation of technology…performed by indigenous personnel”. Its later (1998) theoretical framework assesses absorption of ICT technologies as independent, stand-alone technologies. The national origin of technology is not considered. Analysis of technology along national lines measures "national differences" in the adoption and absorption of IT. However, whether such differences are national or cultural may be indeterminate (boundaries of nation States and culture may coincide, but this is not always the case). Expatriate communities are often important in promoting technological adoption in their homelands (e.g. communication needs of overseas Vietnamese, the accumulated human capital of Indian software specialists in United States).
National size effects
GIT (2000) notes that the Innovation Index of Porter and Stern (1999) “is normalized (per capita measures), whereas [GIT's] is not (most of the statistical components reflect national totals). HTI address national technological competitiveness without particular concern for an economy's size”. However, it does not explore the consequences of this for its results. In fact, this may introduce bias into results. UNIDO (2002) notes that "the use of a population deflator works against large countries, but remains a good way to adjust for country size". This may be particularly true for infrastructure, where a certain minimum threshold infrastructure in the network may be required, irrespective of the size of the country. Further expansion of the network may result in economies of scale in larger countries, resulting in proportionately reduced levels of infrastructure per capita. Population dispersion and geographical dispersion of the network are intimately related to country size. It is unlikely that these effects can be corrected for; however, it is important to remain aware of their existence and the fact that averaging measures across per capita population may implicitly work against larger countries, lowering their relative rankings.
In fact, the most important consequences of using normalized per capita measures in our indices arise for developing countries. Where countries have high rates of population growth, indices based on per capita indicators of telecommunications development mean that any growth in telecommunications infrastructure must outstrip population growth to result in an improved indicator value and index score.
Data omission effects76
The treatment of data omissions is central in determining the results of an index. When a figure is missing for one or several years (but not all), it is replaced by the former year(s) figure. This choice appears more appropriate than simply adjusting the 76 The data omission policy was slightly different in UNCTAD (2003) and UNCTAD (2004).
51
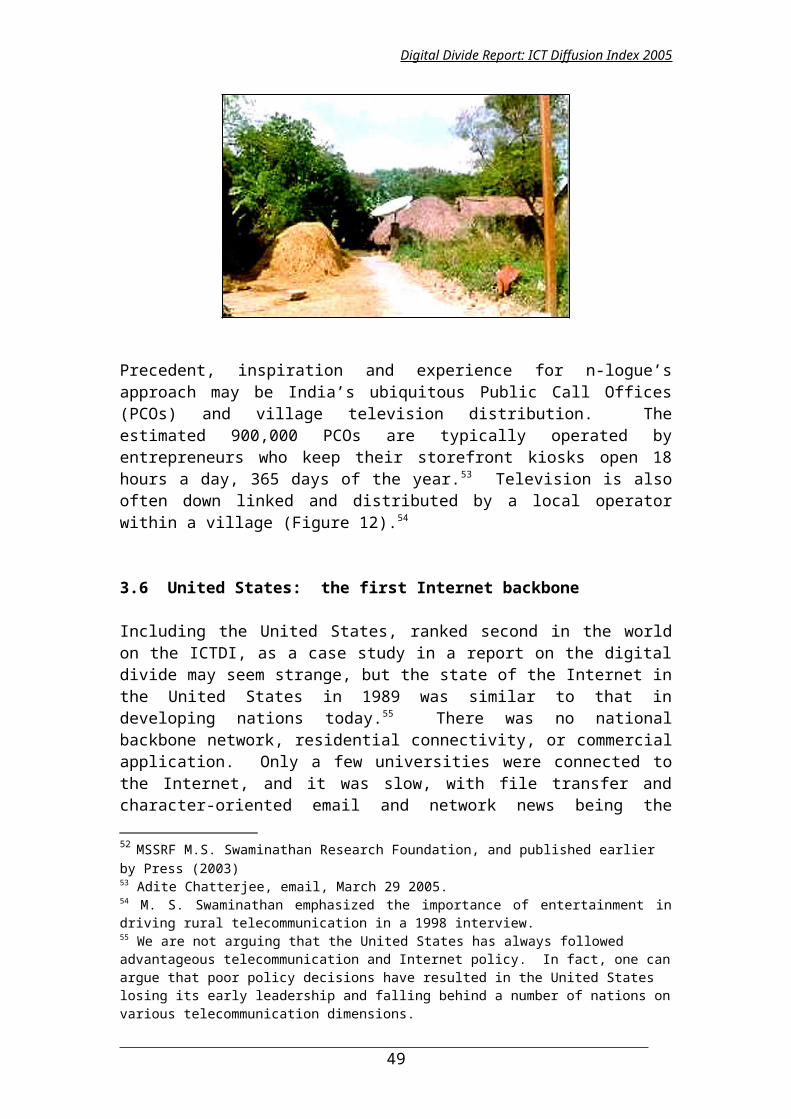
Digital Divide Report: ICT Diffusion Index 2005
final score for the number of data observations: doing so would amount to replace, for a single year, the missing score by the average of the other variables scores, which would induce some greater inconsistency from one year to another than the selected method.
When a figure is missing for all the years, final scores are adjusted for the number of data observations. However, data omissions are more likely for poorer countries. This poses a problem for our results, the extent of which is unclear. Rodriguez and Wilson (2000) note that their "results almost surely err on the side of optimism, as countries with poor or no available data are most likely to be the same countries that are being left behind by the information revolution". This caution also applies to our study.
Selection of the countries
The countries that have missing data (all years) for more than two out of the eight components of the ICT diffusion index are rejected of the rankings. Hence, 180 countries appear in the rankings.
Appendix 2. Definition of components
Connectivity
Connectivity is narrowly defined as the physical infrastructure available to a country, as distinct from broader factors determining access (e.g. literacy, cost). It represents the basic “limiting factor” regarding access to ‘and use of’ ICTs – without the essential physical hardware, ICT use is not possible. UNCTAD defined narrow “connectivity” as the minimum set of measures necessary for ICT access, comprising Internet hosts per capita, PCs per capita, telephone mainlines per capita, and mobile subscribers per capita. This excludes supporting infrastructure (such as electricity supply and transport), affordability and broadband access (which may be currently more relevant to developed countries, but is expected to become increasingly important to all countries in the future). McConnell International notes that "a multitude of factors must be in place…a weakness in any one can degrade a country's ability to take advantage of the economic potential of the Internet". This view sees connectivity as a cluster of technologies with synergies, rather than precedence, between different types of infrastructure. This is in contrast to UNDP's sequential logic of “old” (telephony and electricity) as opposed to “new” innovations (hosts, PCs) and “leapfrogging” between stages with an underlying sequential order.
Internet hosts per capita
The number of Internet hosts has been adopted as a measure of the Internet penetration of a country and the degree of national “connectivity”. As mentioned by ITU77, "Internet hosts refer to the number of computers directly connected to the worldwide Internet network. Note that Internet host computers are identified by a two-digit country code or a three-digit code generally reflecting the nature of the organization using the Internet computer. The number of hosts is assigned to 77 http://www.itu.int/ITU-D/ict/statistics/WTI_2003.pdf
52
Digital Divide Report: ICT Diffusion Index 2005
economies based on the country code although this does not necessarily indicate that the host is actually physically located in the economy. In addition, all other hosts for which there is no country code identification are assigned to the United States. Therefore the number of Internet hosts shown for each country can only be considered an approximation. Data on Internet host computers are from Internet Software Consortium and RIPE (Réseaux IP Européens)". An increasing number of Internet hosts implies increased ability to handle, service and store large amounts of data.
Cross-country regression work has mainly used this variable as the most representative variable of Internet diffusion, for example Hargittai (1999), Kiiski and Pohjola (2001), and Robinson and Crenshaw (1999).
PCs per capita
Telephone lines and personal computers are key components for Internet access before 3G and WAP mobile access become widely available, with significant implications for ICT adoption. Current access methods include dial-up access, using a telephone line, PC and modem. PCs therefore represent an upper limit for Internet access. Caselli and Coleman (2001) use the number of computer imports as a measure of “computer technology adoption”.
PC estimates are available for developed countries, but measurement may be unreliable. Most ITU data are estimates of PC stocks from sales or import data. This is inaccurate for developing countries, where shipment data are scarce and significant channels for PC imports are omitted (e.g. smuggling, grey market, local assembly). Increased PC penetration rates should increase ICT connectivity. This is purely a numerical count and gives no indication of the power or quality of PCs, the use made of them or by which access method (e.g. shared Internet access, with multiple users for single PC).
Telephone mainlines per capita
This is a relatively reliable, basic “limiting factor” of connectivity and representative of potential, if not actual, levels of “dial-up” access. ITU statistics include telephone subscribers plus the number of payphones (data from telecom authorities or operators). Increased availability of telephone mainlines should increase Internet connectivity, assuming that dial-up access is available. However, this does not give an indication of the speed, reliability or cost of the connection, which are important considerations.
It is also important to be aware of the proxy variables that may be implicit in this measure. Telephone networks typically require large investments, and so average national income and the public resources available play a significant role in determining connectivity on a national basis. Population distribution, urban/rural dispersion and underlying geographical factors are important determinants of the extent of telephone networks; for example, Nepal and Cambodia have geographically limited mainline networks, while Turkey's is widely distributed.
53
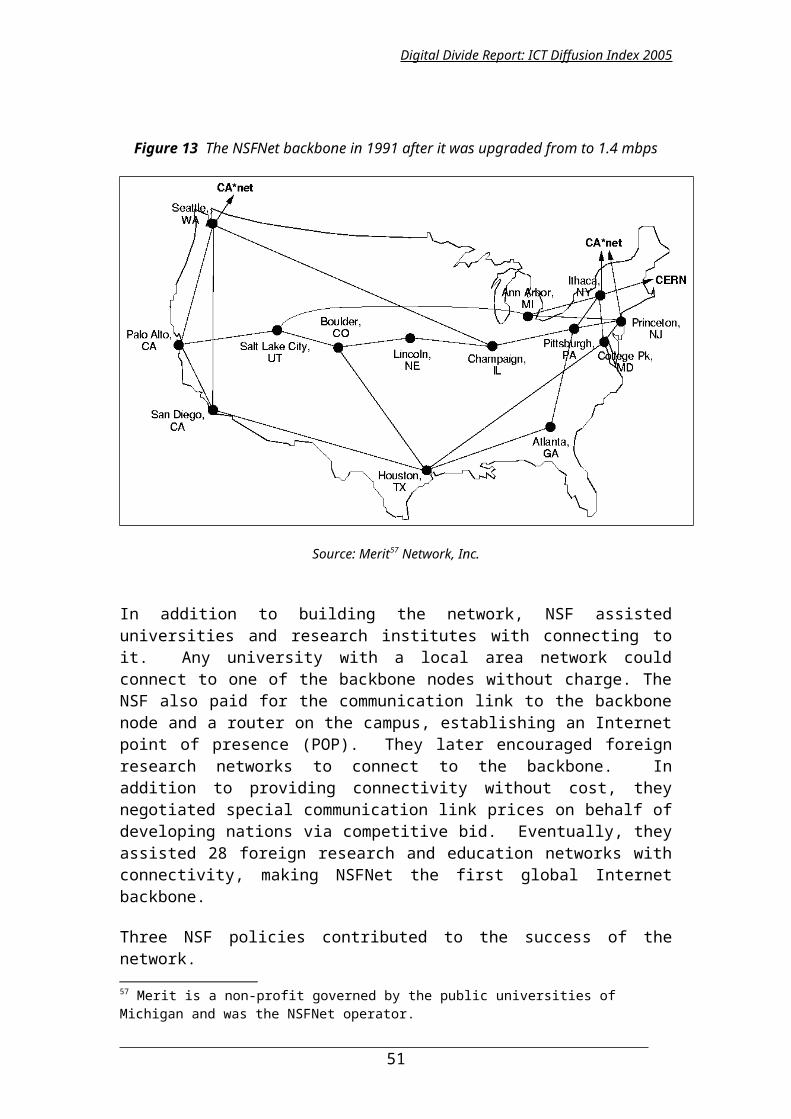
Digital Divide Report: ICT Diffusion Index 2005
Mobile subscribers per capita
Mobile connectivity and this measure will become increasingly important in the future. Current methods of Internet access emphasize PC-based applications, with 3G and WAP less widely adopted. Inclusion of mobiles allows leapfrogging in, for example, Cambodia (ITU case study, 2002) to be counted. However, the ITU notes that the Cambodian Government has neglected fixed lines, which are "more important for Internet access at this time". Inclusion of both fixed and mobile telephones reflects forms of ICT access that are important now and will remain so in the future.
Access
Jensen (2000) considers Internet connectivity from a more technical telecommunications perspective, noting that it “requires more than simply installing phone cables…the Internet is dependent on the telephone network ([comprising] cost of the line and cost of local and long-distance charges), availability and affordability of access equipment…and pervasiveness of telematics (mix of hard/software with human/organizational skills and knowledge transfer)”. This introduces a broader definition of access and the factors determining use of ICTs, beyond narrowly defined connectivity.
Number of Internet users
This is an ex-post measure of the level of Internet use achieved by a nation in realized access to the Internet. However, Nua surveys and ITU (2001) point out different survey methods and definitions of Internet 'users':
Inhabitants > awareness > ICT access > users > subscribers
The number of subscribers paying for Internet access is more precise than the number of users and implies a certain degree of usage in terms of realized actual users. It is also more measurable, but may not reflect full usage as it omits free or shared access. For developing countries, subscribers may constitute “elite” consumers and fail to include common types of usage (e.g. shared access and cybercafes).
Nua collects its data from national surveys that do not use consistent methodology, thus reducing their comparability. For consistency, UNCTAD used ITU estimates of Internet users, weighted by population to yield Internet users per capita. The estimates in ITU surveys are consistently lower than those in SangoNet surveys (Nua). However, to test how representative ITU estimates are, countries were ranked and compared using Nua and ITU user estimates. Comparison of rankings revealed similar country profiles across both sources so, irrespective of actual indicator values, we can have confidence in the country rankings.
Literacy
In the absence of widely available voice protocols, text-based protocols remain the most widely used Internet applications. Language barriers and illiteracy have been identified as common obstacles to Internet access. Language has been modelled using dummy variables for English-speaking former colonies (Robinson and Crenshaw,
54
Digital Divide Report: ICT Diffusion Index 2005
1999). However, the rapid growth of other languages on the Internet means that the importance of this obstacle to access is diminishing all the time. According to GlobalReach, 43 per cent of on-line users and 68.4 per cent Web content use English, down from 80 per cent of Web-pages in English in the late 1990s. Literacy remains a pervasive barrier to access, particularly for developing countries. Basic literacy represents an important ex-ante capability for Internet access, of which only a small subset may be realized as the proportion of Internet users. “Depth” measures of human capital, such as tertiary education, are considered less relevant for basic Internet access. We therefore included basic literacy in our index as an important determinant of access.
Cost of a local call
Prices are an important measure and determinant of access, since people will not use the Internet if they cannot afford it. In Europe, the practice of per minute billing has been considered a major obstacle to Internet adoption (Center for Democracy and Technology, 2002). Some countries may have high Internet connectivity (e.g. high telephone and PC penetration) but relatively low user levels. The most widely used Internet access method is dial-up (U.S. Internet Council, 2000), with the following main charges:
1. Telephone charges (line rental and/or call charges paid to the PTO);
2. Internet access charges (paid to the ISP).
Internet pricing comparisons are complex (depending upon method of access, time and frequency of use), change rapidly and are often available only for developed countries.
Given data constraints for developing countries, we adopted the cost of a local call as the most representative indicator of cost of access. However, telephone charges issues include the following:
Local call charges: some telephone operators do not charge directly for local calls (including operators in North America and New Zealand). This has been considered an integral factor key to the expansion of ICTs in North America (Information Society, quoted in Center for Democracy and Technology, 2002);
Operators may include a proportion of "free" local calls in subscription charges;
Charges may be fixed regardless of call duration;
Local call charges may differ depending on the time of day or the day of week, or whether the call is for Internet access; and
Operators may provide discounted calls to user-specified numbers.
The reduced cost of calls should facilitate the expansion of access to ICTs.
55
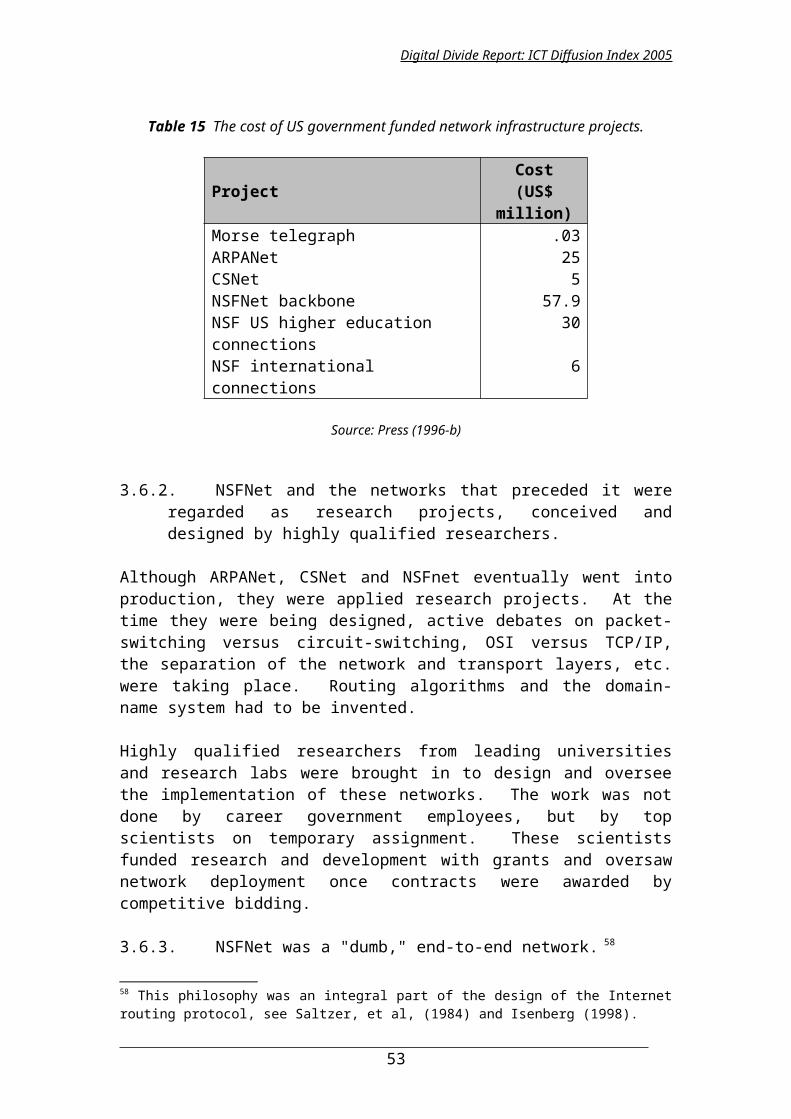
Digital Divide Report: ICT Diffusion Index 2005
GDP per capita
Income is another key determinant of access and people's ability to afford hardware investment and ongoing call costs (that are often a significant proportion of the cost in accessing the Internet). $1 an hour charged by a cybercafe is unaffordable for people whose average income is $2 per day. Average national income is also a proxy variable for a country's level of development, often implicitly related to a country's level of investment and thus its connectivity and infrastructure. Kedzie (1997) notes that "economic development is a leading candidate for a compounding factor that affects both democracy and electronic communication networks simultaneously". However, in his study of democracy and interconnectivity based on simultaneous equations analysis growth in Internet nodes, "statistical test results do not support…economic development as a confounding third variable… neither democracy nor GDP proves to influence interconnectivity strongly".
Appendix 3. Data sources
Internet hosts, Personal computers, Cellular mobile telephone subscribers, Main telephone lines in operation, number of estimated Users, Cost of local calls: International Telecommunication Union, 2006.
Gross Domestic Product and Population: World Bank, World Development Indicator Online 2006.
Adult Literacy rate: United Nations Educational, Scientific and Cultural Organization, Institute for Statistics.
56
Digital Divide Report: ICT Diffusion Index 2005
6. Annex tables
Annex table 1: 2004 Index of ICT diffusion by rank
Rank Country access index connectivity index ICT diffusion index1 Luxembourg 0.928 0.703 0.8152 United States 0.833 0.754 0.7943 Iceland 0.854 0.706 0.7804 Sweden 0.836 0.700 0.7685 Denmark 0.828 0.667 0.7486 Netherlands 0.803 0.642 0.7237 Switzerland 0.764 0.645 0.7058 Bermuda 0.777 0.625 0.7019 Australia 0.807 0.589 0.69810 United Kingdom 0.804 0.557 0.68011 Finland 0.799 0.546 0.67212 Hong Kong 0.741 0.602 0.67213 Canada 0.804 0.514 0.65914 Norway 0.758 0.558 0.65815 New Zealand 0.832 0.478 0.65516 Singapore 0.748 0.560 0.65417 Israel 0.719 0.577 0.64818 Germany 0.753 0.538 0.64619 Korea (Rep. of) 0.773 0.506 0.63920 Estonia 0.704 0.567 0.63521 Austria 0.760 0.510 0.63522 Japan 0.785 0.478 0.63223 Ireland 0.727 0.496 0.61124 Italy 0.753 0.452 0.60225 France 0.730 0.464 0.59726 San Marino 0.544 0.609 0.58127 Malta 0.764 0.394 0.57928 Belgium 0.735 0.421 0.57829 Slovenia 0.719 0.406 0.56230 Czech Republic 0.712 0.397 0.55531 Spain 0.697 0.402 0.54932 Cyprus 0.685 0.407 0.54633 Barbados 0.725 0.334 0.52934 Portugal 0.659 0.393 0.52635 Macau 0.647 0.380 0.51436 Antigua and Barbuda 0.585 0.400 0.50637 Slovak Republic 0.678 0.321 0.49938 Puerto Rico 0.644 0.302 0.49839 Hungary 0.640 0.349 0.49440 Greece 0.607 0.380 0.49341 Qatar 0.733 0.312 0.49242 New Caledonia 0.666 0.241 0.48443 Lithuania 0.630 0.329 0.47944 Latvia 0.649 0.289 0.46945 Croatia 0.627 0.299 0.46346 Bahrain 0.597 0.305 0.45147 United Arab Emirates 0.609 0.291 0.45048 French Polynesia 0.664 0.232 0.448
57
Digital Divide Report: ICT Diffusion Index 2005
Rank Country access index connectivity index ICT diffusion index49 Poland 0.616 0.272 0.44450 Saint Lucia 0.603 0.265 0.43451 Seychelles 0.609 0.252 0.43052 Bulgaria 0.607 0.248 0.42853 Kuwait 0.587 0.266 0.42754 Saint Kitts and Nevis 0.601 0.250 0.42655 Malaysia 0.622 0.229 0.42556 Chile 0.612 0.233 0.42357 Jamaica 0.598 0.243 0.42158 Dominica 0.580 0.246 0.41359 Brunei Darussalam 0.701 0.187 0.40760 Yugoslavia 0.699 0.182 0.40361 Costa Rica 0.593 0.205 0.39962 Mauritius 0.541 0.246 0.39363 Russia 0.566 0.219 0.39264 Belarus 0.571 0.152 0.39165 Trinidad and Tobago 0.574 0.206 0.39066 Romania 0.582 0.184 0.38367 Grenada 0.544 0.221 0.38368 Uruguay 0.589 0.174 0.38269 Suriname 0.648 0.167 0.37370 Bosnia and Herzegovina 0.525 0.172 0.37371 Argentina 0.576 0.168 0.37272 Maldives 0.679 0.133 0.36773 Turkey 0.535 0.193 0.36474 Saudi Arabia 0.509 0.219 0.364
75St. Vincent and the Grenadines 0.530 0.184 0.357
76 Brazil 0.532 0.180 0.35677 Mexico 0.546 0.161 0.35378 Kazakhstan 0.531 0.113 0.35279 T.F.Y.R. Macedonia 0.534 0.169 0.35280 Dominican Rep. 0.517 0.125 0.34981 Ukraine 0.543 0.141 0.34282 Thailand 0.541 0.142 0.34183 Lebanon 0.532 0.128 0.33084 South Africa 0.512 0.145 0.32885 Colombia 0.531 0.124 0.32886 Guyana 0.567 0.087 0.32787 Venezuela 0.526 0.127 0.32688 Belize 0.496 0.156 0.32689 Tonga 0.530 0.123 0.32690 China 0.513 0.133 0.32391 Panama 0.530 0.103 0.31692 Moldova 0.522 0.105 0.31493 Jordan 0.518 0.106 0.31294 Ecuador 0.500 0.122 0.31195 Albania 0.519 0.101 0.31096 Marshall Islands 0.657 0.048 0.30997 Philippines 0.509 0.107 0.30898 Armenia 0.526 0.087 0.30699 Uzbekistan 0.512 0.031 0.306
100 Azerbaijan 0.524 0.082 0.303
58
Digital Divide Report: ICT Diffusion Index 2005
Rank Country access index connectivity index ICT diffusion index101 Georgia 0.516 0.085 0.301102 Tunisia 0.477 0.122 0.300103 Fiji 0.521 0.078 0.299104 Peru 0.518 0.080 0.299105 Mongolia 0.522 0.076 0.299106 Cuba 0.660 0.027 0.298107 Oman 0.501 0.093 0.297108 El Salvador 0.485 0.109 0.297109 Paraguay 0.499 0.092 0.295110 Tajikistan 0.501 0.016 0.293111 Botswana 0.481 0.100 0.291112 Libya 0.611 0.050 0.290113 Samoa 0.525 0.056 0.290114 Iran (Islamic Rep. of) 0.462 0.106 0.284115 Namibia 0.490 0.077 0.283116 Cape Verde 0.465 0.101 0.283117 Equatorial Guinea 0.529 0.031 0.280118 Kyrgyzstan 0.516 0.039 0.278119 Syria 0.476 0.078 0.277120 Lesotho 0.460 0.032 0.277121 Viet Nam 0.501 0.051 0.276122 Bolivia 0.480 0.068 0.274123 Myanmar 0.627 0.004 0.271124 Indonesia 0.496 0.044 0.270125 Sri Lanka 0.489 0.046 0.267126 Zimbabwe 0.497 0.034 0.265127 Guatemala 0.442 0.083 0.263128 Gabon 0.425 0.091 0.258129 Swaziland 0.466 0.043 0.255130 Honduras 0.460 0.040 0.250131 Nicaragua 0.450 0.048 0.249132 Algeria 0.443 0.053 0.248133 Morocco 0.407 0.083 0.245134 Egypt 0.402 0.070 0.236135 Vanuatu 0.444 0.023 0.233136 Kenya 0.440 0.022 0.231137 Rwanda 0.400 0.005 0.231138 Haiti 0.384 0.019 0.227139 Cameroon 0.416 0.023 0.220140 Cambodia 0.431 0.008 0.220141 Djibouti 0.417 0.019 0.218142 India 0.407 0.023 0.215143 Angola 0.414 0.016 0.215144 Nigeria 0.410 0.018 0.214145 Lao P.D.R. 0.416 0.011 0.214146 Tanzania 0.415 0.012 0.213147 Uganda 0.416 0.010 0.213148 Zambia 0.415 0.010 0.213149 Madagascar 0.418 0.006 0.212150 Sudan 0.397 0.019 0.208151 Papua New Guinea 0.393 0.021 0.207152 Mauritania 0.367 0.044 0.205153 Malawi 0.398 0.006 0.202
59
Digital Divide Report: ICT Diffusion Index 2005
Rank Country access index connectivity index ICT diffusion index154 Togo 0.382 0.021 0.202155 Ghana 0.380 0.021 0.201156 Bhutan 0.449 0.008 0.197157 Guinea-Bissau 0.341 0.003 0.196158 Eritrea 0.386 0.004 0.195159 Somalia 0.435 0.014 0.195160 Comoros 0.381 0.007 0.194161 Burundi 0.383 0.003 0.193162 Cote d'Ivoire 0.359 0.027 0.193163 Yemen 0.357 0.025 0.191164 Gambia 0.343 0.037 0.190165 Pakistan 0.362 0.016 0.189166 Senegal 0.344 0.033 0.188167 Nepal 0.358 0.006 0.182168 Mozambique 0.350 0.010 0.180169 Central African Rep. 0.354 0.004 0.179170 Sierra Leone 0.299 0.007 0.174171 Bangladesh 0.336 0.010 0.173172 Guinea 0.339 0.005 0.172173 Ethiopia 0.333 0.002 0.168174 Benin 0.315 0.010 0.163175 Solomon Islands 0.341 0.016 0.155176 Chad 0.294 0.003 0.149177 Mali 0.270 0.010 0.140178 Burkina Faso 0.253 0.008 0.130179 Congo 0.273 0.022 0.130180 Niger 0.255 0.002 0.129
60
Digital Divide Report: ICT Diffusion Index 2005
Annex table 2: ICT diffusion rankings 1997-2004
Country name 1997 1998 1999 2000 2001 2002 2003 2004Albania 105 106 106 108 102 95 92 95Algeria 127 129 127 127 134 133 132 132Angola 143 151 144 148 147 148 148 143Antigua and Barbuda 36 38 36 36 40 38 38 36Argentina 59 61 62 62 59 67 70 71Armenia 109 111 113 119 109 110 109 98Australia 13 12 15 16 10 9 8 9Austria 20 18 17 17 14 17 18 21Azerbaijan 117 142 140 139 103 104 104 100Bahrain 44 44 42 44 44 43 47 46Bangladesh 164 164 164 163 171 171 171 171Barbados 40 41 40 41 47 44 36 33Belarus 48 50 50 54 61 60 59 64Belgium 25 26 26 25 23 25 25 28Belize 104 104 99 94 87 89 94 88Benin 172 172 172 171 174 174 174 174Bermuda 6 8 12 19 12 10 7 8Bhutan 148 146 143 142 153 152 152 156Bolivia 124 123 124 125 120 120 119 122Bosnia and Herzegovina 68 69 68 65 66 65 69 70Botswana 116 115 104 99 101 102 111 111Brazil 93 87 75 72 75 77 79 76Brunei Darussalam 33 36 37 39 43 50 55 59Bulgaria 55 59 60 60 58 57 56 52Burkina Faso 176 176 177 177 179 178 178 178Burundi 150 149 148 144 158 160 160 161Cambodia 137 136 131 131 138 138 139 140Cameroon 140 140 138 137 140 141 141 139Canada 9 9 10 11 13 15 15 13Cape Verde 123 122 118 113 114 112 116 116Central African Rep. 180 180 180 180 167 168 169 169Chad 175 175 176 175 176 176 176 176Chile 74 65 61 53 48 53 52 56China 111 108 103 98 99 94 90 90Colombia 73 75 80 83 89 88 89 85Comoros 167 168 167 166 157 159 158 160Congo 174 174 174 173 180 180 180 179Costa Rica 61 60 59 61 62 56 57 61Cote d'Ivoire 166 159 158 155 161 161 161 162Croatia 46 46 48 45 42 41 42 45Cuba 96 94 101 106 94 97 99 106Cyprus 23 25 27 28 30 28 29 32Czech Republic 41 39 41 38 32 31 31 30Denmark 7 6 7 8 6 5 5 5Djibouti 156 157 162 165 141 140 140 141Dominica 72 71 79 75 67 66 63 58Dominican Rep. 76 77 74 74 69 75 78 80Ecuador 99 101 97 107 110 107 105 94
61

Digital Divide Report: ICT Diffusion Index 2005
Country name 1997 1998 1999 2000 2001 2002 2003 2004Egypt 135 134 135 132 137 135 134 134El Salvador 121 120 115 115 117 116 113 108Equatorial Guinea 125 124 119 116 111 113 117 117Eritrea 147 147 145 143 156 157 159 158Estonia 35 32 33 31 33 33 28 20Ethiopia 162 165 163 162 172 172 172 173Fiji 100 98 98 97 96 96 97 103Finland 3 4 6 10 8 7 10 11France 22 23 24 26 25 24 23 25French Polynesia 52 54 57 58 41 42 46 48Gabon 141 143 149 157 131 130 131 128Gambia 178 177 179 179 165 165 164 164Georgia 89 92 90 100 104 103 98 101Germany 21 21 21 18 20 18 17 18Ghana 159 156 156 150 159 158 156 155Greece 34 34 32 32 34 35 39 40Grenada 51 52 52 51 65 64 58 67Guatemala 134 131 132 130 129 128 128 127Guinea 171 170 170 170 173 173 173 172Guinea-Bissau 165 167 168 168 155 156 157 157Guyana 86 89 88 80 85 86 87 86Haiti 130 130 129 129 139 139 138 138Honduras 129 128 128 128 128 129 129 130Hongkong 10 13 11 12 11 12 11 12Hungary 45 43 44 42 39 39 37 39Iceland 4 3 2 3 2 3 3 3India 136 135 136 136 148 146 146 142Indonesia 120 117 120 121 123 125 125 124Iran (Islamic Rep. of) 107 110 111 109 115 111 103 114Ireland 24 22 23 23 21 21 19 23Israel 18 20 22 22 24 26 26 17Italy 26 24 25 24 26 23 24 24Jamaica 91 88 89 84 83 62 60 57Japan 15 17 19 21 22 22 20 22Jordan 103 100 100 96 93 92 95 93Kazakhstan 60 63 64 66 76 79 81 78Kenya 133 133 134 135 135 137 136 136Korea (Rep. of) 27 27 18 15 17 16 16 19Kuwait 43 45 45 49 55 55 53 53Kyrgyzstan 112 113 114 117 116 117 118 118Lao P.D.R. 131 132 133 133 143 142 142 145Latvia 54 49 55 56 51 51 41 44Lebanon 63 67 66 71 78 80 82 83Lesotho 106 107 107 110 119 119 121 120Libya 94 91 92 95 108 106 110 112Lithuania 49 48 53 55 54 52 49 43Luxembourg 8 7 8 5 3 2 2 1Macau 30 29 31 34 35 34 34 35Madagascar 144 144 141 147 142 143 143 149Malawi 142 138 155 151 151 153 154 153Malaysia 53 51 46 46 50 54 54 55Maldives 80 80 82 77 73 72 72 72Mali 177 178 175 174 177 177 177 177
62
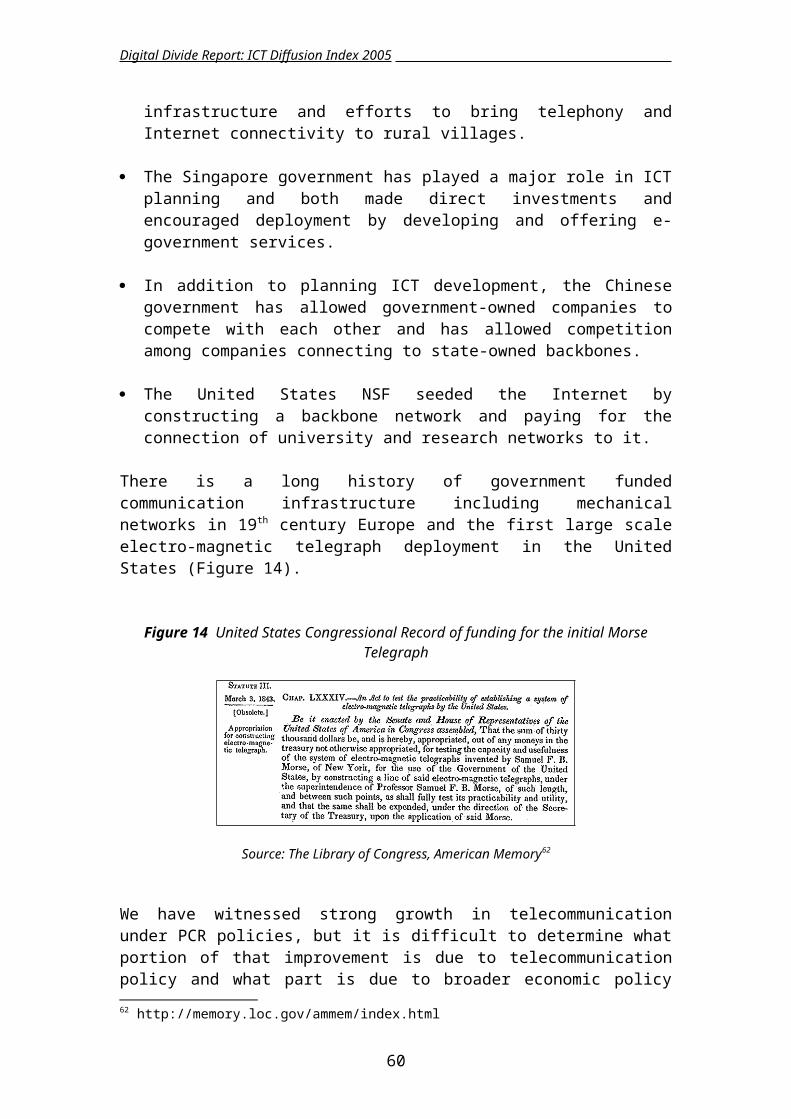
Digital Divide Report: ICT Diffusion Index 2005
Country name 1997 1998 1999 2000 2001 2002 2003 2004Malta 38 37 38 35 29 29 30 27Marshall Islands 70 72 70 73 88 91 93 96Mauritania 163 162 160 160 160 155 155 152Mauritius 69 64 65 63 64 63 67 62Mexico 101 97 95 92 72 73 77 77Moldova 92 90 93 90 100 98 91 92Mongolia 108 109 108 102 112 114 106 105Morocco 154 153 154 149 136 136 137 133Mozambique 161 166 166 167 169 169 168 168Myanmar 88 93 94 101 118 118 120 123Namibia 113 114 116 111 113 115 114 115Nepal 153 154 150 152 166 166 166 167Netherlands 17 11 9 7 7 8 9 6New Caledonia 50 55 56 57 37 37 40 42New Zealand 11 15 14 14 19 19 21 15Nicaragua 126 127 130 134 130 131 130 131Niger 179 179 178 178 178 179 179 180Nigeria 151 150 152 156 150 149 149 144Norway 1 2 4 6 9 13 14 14Oman 102 103 110 112 98 100 100 107Pakistan 152 152 153 154 163 163 165 165Panama 95 95 91 91 84 87 88 91Papua New Guinea 170 173 173 176 149 150 150 151Paraguay 110 105 109 105 97 99 102 109Peru 114 112 112 114 107 108 108 104Philippines 97 99 96 93 106 105 101 97Poland 57 53 51 52 53 48 48 49Portugal 29 28 28 30 31 32 33 34Puerto Rico 32 33 35 37 36 36 35 38Qatar 39 40 39 40 49 49 44 41Romania 77 84 87 89 77 70 68 66Russia 66 70 69 69 79 76 71 63Rwanda 138 137 139 138 133 134 135 137Saint Kitts and Nevis 42 42 43 43 52 47 50 54Saint Lucia 85 86 86 78 71 68 64 50Samoa 98 102 105 103 105 109 112 113San Marino 12 10 3 2 18 20 22 26Saudi Arabia 84 85 85 88 86 82 76 74Senegal 169 169 169 169 168 167 167 166Seychelles 58 57 49 48 46 46 51 51Sierra Leone 168 163 161 161 170 170 170 170Singapore 16 16 16 13 16 11 13 16Slovak Republic 47 47 47 47 45 45 45 37Slovenia 28 30 29 27 27 27 27 29Solomon Islands 173 171 171 172 175 175 175 175Somalia 157 161 165 164 162 162 162 159South Africa 79 76 76 85 82 83 84 84Spain 31 31 30 29 28 30 32 31Sri Lanka 118 118 122 122 122 124 124 125St. Vincent and the Grenadines 81 82 84 86 74 81 62 75Sudan 145 145 142 141 154 154 151 150Suriname 65 66 72 67 70 74 73 69
63
Digital Divide Report: ICT Diffusion Index 2005
Country name 1997 1998 1999 2000 2001 2002 2003 2004Swaziland 132 125 125 126 127 127 127 129Sweden 5 5 5 4 4 4 4 4Switzerland 14 14 13 9 5 6 6 7Syria 115 116 117 118 124 123 122 119T.F.Y.R. Macedonia 67 68 67 68 80 78 74 79Tajikistan 75 78 83 82 95 101 107 110Tanzania 149 148 147 146 145 144 145 146Thailand 90 96 102 104 91 84 80 82Togo 160 160 159 159 152 151 153 154Tonga 87 81 78 81 63 69 83 89Trinidad and Tobago 64 62 63 59 60 61 65 65Tunisia 122 121 121 120 121 121 115 102Turkey 78 74 71 70 68 71 75 73Uganda 158 158 157 158 144 145 144 147Ukraine 82 83 81 79 90 90 85 81United Arab Emirates 37 35 34 33 38 40 43 47United Kingdom 19 19 20 20 15 14 12 10United States 2 1 1 1 1 1 1 2Uruguay 62 56 58 64 56 59 66 68Uzbekistan 71 73 73 76 92 93 96 99Vanuatu 139 139 146 145 132 132 133 135Venezuela 83 79 77 87 81 85 86 87Viet Nam 128 126 126 123 125 126 126 121Yemen 155 155 151 153 164 164 163 163Yugoslavia 56 58 54 50 57 58 61 60Zambia 146 141 137 140 146 147 147 148Zimbabwe 119 119 123 124 126 122 123 126
64
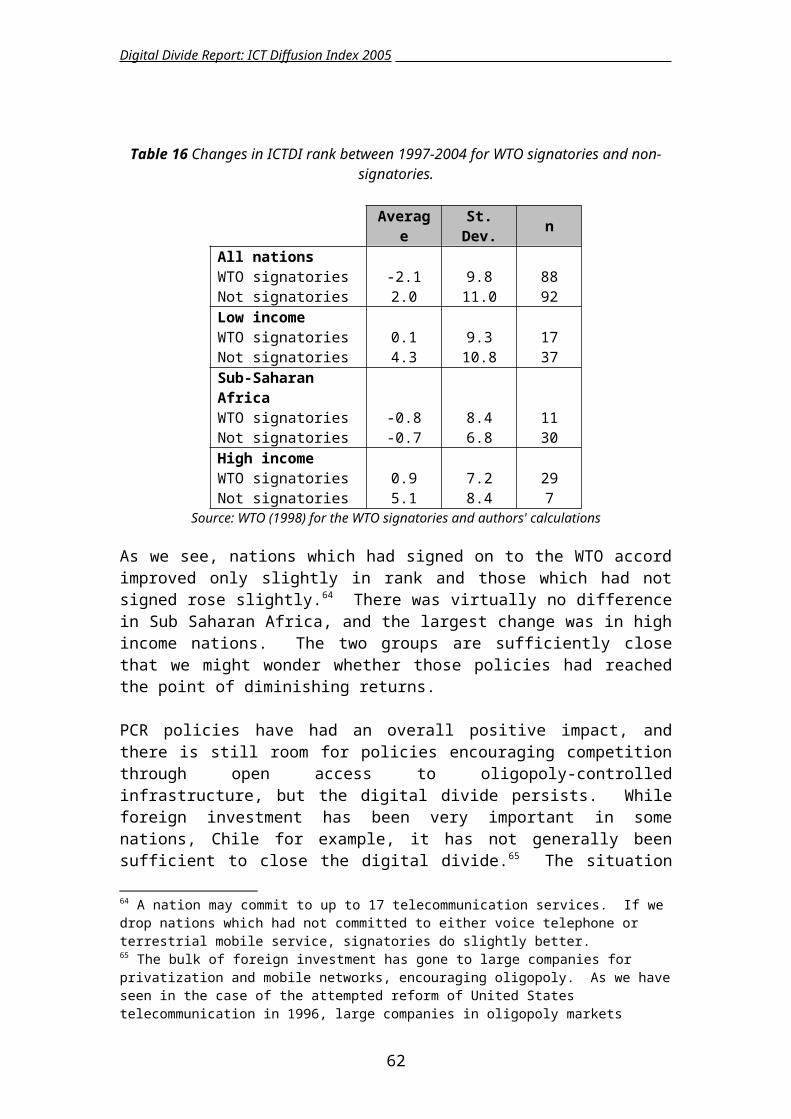
Digital Divide Report: ICT Diffusion Index 2005
7. References
Publications
Acemoglu, D., Johnson, S., and Robinson, J. (2001), "An African Success Story: Botswana", working paper, July, available at http://econ-www.mit.edu/faculty/download_pdf.php?id=610
Acemoglu, D., Johnson, S., and Robinson, J. (2003), "An African Success Story: Botswana", published in In Search of Prosperity: Analytic Narratives on Economic Growth, Dani Rodrik ed., Princeton University Press, pp. 80-122, April 14.
Annamalai, K., and Rao, S. (2003), "ICT's E-choupal and Profitable Rural Transformation", World Resources Institute, August, available athttp://www.digitaldividend.org/pdf/echoupal_case.pdf.
Barboza, D., and Altman, D. (2005), "That Blur? It's China, Moving Up in the Pack", The New York Times, December 21, available athttp://select.nytimes.com/gst/abstract.html?res=F50B1EFC3F540C728EDDAB0994DD404482
Becker, G. (1997), "Latin America Owes a Lot to Its Chicago Boys", Business Week, June 9, reprinted in Hoover Digest No. 4, Hoover Institution, 1997, available at http://home.uchicago.edu/~gbecker/Businessweek/BW/1997/06_09_1997.pdf.
Bridges.org (2001), "Comparison of E-Readiness Assessment Models" available at http://www.bridges.org/ereadiness/report.html.
Caselli, F. and W.J. Coleman (2001), "Cross-country technology diffusion: the case of computers", NBER Working Paper No. 8130, Cambridge, MA: NBER, available athttp://papers.nber.org/papers/w8130.pdf
Edgeworth, F.Y. (1925), "The Plurality of Index Numbers", Economic Journal.
Fisher (1922), “The Making of Index Numbers” quoted in R.G.D. Allen, Statistics for Economists, 8th edition, 1957 Hutchinson & Co.
G8 (2005), Chair's Summary, Gleneagles Summit, 6-8 July 2005, available at http://www.g8.gov.uk/servlet/Front?pagename=OpenMarket/Xcelerate/ShowPage&c=Page&cid=1119518698846.
GIT (2000) High Tech Indicators and associated articles, Georgia Institute of Technology, available from http://www.gatech.edu
Gillwald, A. (2005), "Towards an African e-Index", The LINK Centre, Wits University School of Public and Development Management, Johannesburg, available at http://link.wits.ac.za/research/e-index.html
65
Digital Divide Report: ICT Diffusion Index 2005
Hargittai, E. (1999), "Weaving the Western Web: Explaining Differences in InternetConnectivity Among OECD Countries", Telecommunications Policy, 23, 701–718, available athttp://www.elsevier.com/wps/find/journaldescription.cws_home/30471/description#description
Hundt, R. (2005), "Limits on wireless leave U.S. at risk", San Jose Mercury News, Oct. 16, available at http://www.mercurynews.com/mld/mercurynews/news/opinion/12917284.htm.
Isenberg, D. (1998), "The Dawn of the Stupid Network", netWorker (2.1), February/March, pp. 24-31; available at http://www.isen.com/papers/Dawnstupid.html
Jensen, M. (2000), "The Internet in Africa", 2000 Conference of the International Federation for Information Processing WG9.4 mimeo, "Social Implications of Computers in Developing Countries".
Jhunjhunwala, A., Narasimhan, S. and Ramachandran, A. (2005), "Case Study: India, Enabling Rural India with Information and Communication Technology Initiatives, Building Digital Bridges", 365-419, International Telecommunication Union, Geneva, Publication 378-05, ISBN 92-61-11321-4, November 2005, available at http://www.itu.int/dms_pub/itu-s/opb/pol/S-PN-378-05-PDF-E.pdf.
Kedzie, C. (1997), "Communication and Democracy: Coincident Revolutions and the Emergent Dictator's Dilemma", RGSD-127, RAND Corporation, Santa Monica CA.
Kendrick, B. (2006), "The $200 Billion Broadband Scandal, Teletruth," available at http://www.newnetworks.com/broadbandscandals.htm.
Kennard, W. (2000), "Internet Telephony: America Is Waiting", Voice Over Net Conference, September 12, 2000, available at http://www.fcc.gov/Speeches/Kennard/2000/spwek019.html.
Kiiski, S. and Pohjola, M. (2001), "Cross-country diffusion of the Internet", available at http://www.wider.unu.edu/publications/dps/DP2001-11.pdf.
Kushnick, B. (2006), "The $200 Billion Broadband Scandal", Teletruth, available athttp://www.newnetworks.com/broadbandscandals.htm
Le, H. (2005), "Vietnam medic makes DIY endoscope, BBC Go Digital", http://news.bbc.co.uk/1/hi/technology/4145984.stm.
Mahanta, V. (2001). "How To Survive the ISP Shakeout," Business Today, 23 December 2001, available at http://www.hclinfinet.com/pr.html.
McConnell International (2000), "Risk E-Business: Seizing the Opportunity of Global E-Readiness", subsequently updated: "Ready? Net. Go! Partnerships Leading the Global Economy" (2001), available from http://www.mcconnellinternational.com.
66
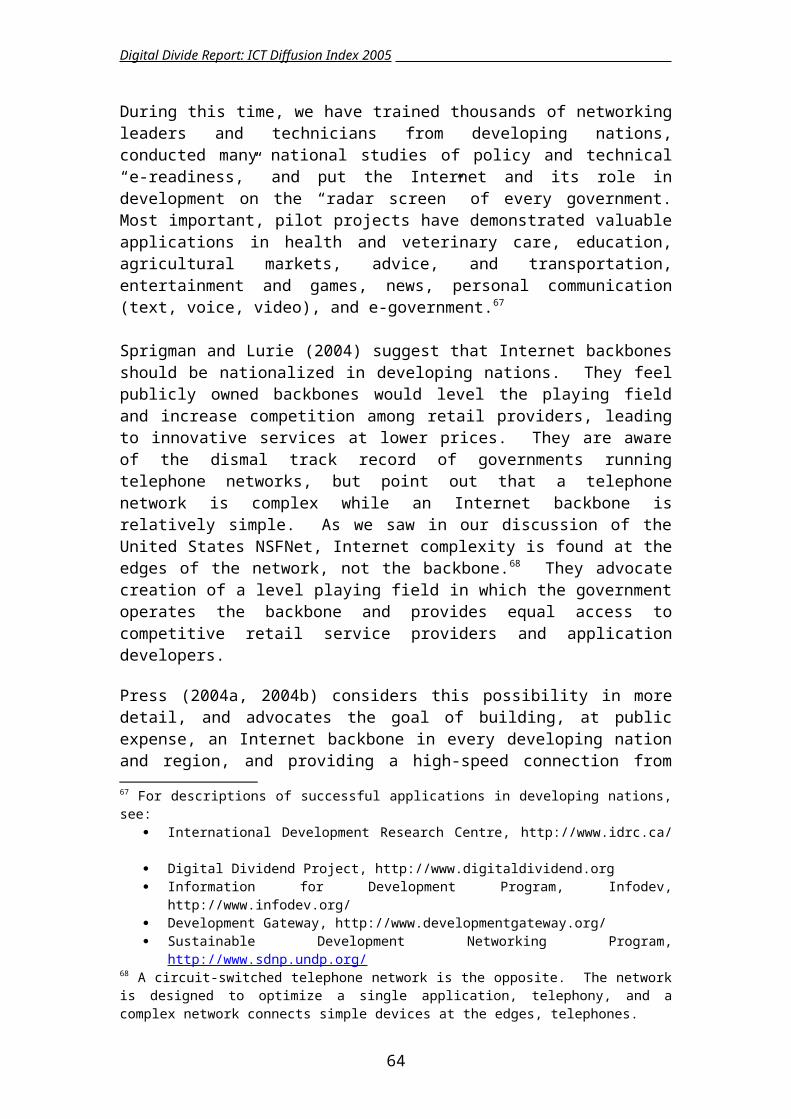
Digital Divide Report: ICT Diffusion Index 2005
Minges, M., Ismael, M. and Press, L. (2001), "The e-City, Singapore Internet Case Study", International Telecommunication Union, Geneva, August 2001, available at http://www.itu.int/ITU-D/ict/cs/singapore/singapore.html.
Minges, M. (2005) "Measuring Digital Opportunity", ITU Workshop on WSIS Thematic Meeting on Multi-Stakeholder Partnerships for Bridging the Digital Divide, Seoul (Rep. of Korea), 23-24 June 2005, Document BDB WSIS/06, ITU. available at http://www.itu.int/osg/spu/statistics/DOI/linkeddocs/Measuring_Digital_Opp_Revisd_23_Nov_2005%20(2).pdf
Mosaic Group (1998), "An Internet Diffusion Framework", Communications of the ACM, October, 41(10), 21-26, available athttp://som.csudh.edu/fac/lpress/articles/acmfwk/acmfrwk.htm
Mosaic Group (1996), "The Information Technology Capability of Nations: A Framework for Analysis", available at http://mosaic.unomaha.edu/gdi.htm.
Nua Internet Surveys (2001), "How Many Online?" available at http://www.nua.ie/surveys
Nua Internet Surveys (2000), "Methodology", available at http://www.nua.ie/surveys
Pangestu, M. (2002), "Industrial Policy and Developing Countries, in Development, Trade and the WTO, A Handbook", World Bank, 2002.
Paul, J. (2004), "n-Logue's Rural Connectivity Model", World Resources Institute, December 2004, available at http://www.digitaldividend.org/pdf/nlogue.pdf.
Porter, M. E. and Stern, S. (1999), "The New Challenge to America's Prosperity: Findings from the Innovation Index", Washington, DC: Council on Competitiveness, available at http://www.compete.org/pdf/index.pdf.
Press, L. (1995), "Developing Networks in Less Industrialized Nations", IEEE Computer, 28(6), June, 66-71.
Press, L. (1996-a), "The Role of Computers Networks in Developing Nations", Communications of the ACM, 39(2), February, 23-29.
Press, L. (1996-b), "Seeding Networks: the Federal Role", Communications of the ACM, 39(10), October, 11-18, available athttp://som.csudh.edu/fac/lpress/articles/govt.htm.
Press, L. (1997), "What May the WTO Telecommunication Agreement Mean for Emerging Nations?" OnTheInternet, 3(3), May/June, 36-38, available athttp://som.csudh.edu/fac/lpress/articles/wto.htm.
Press, L. (1999), "A Client-Centered Networking Project in Rural India", OnTheInternet, January/February, 36-38 available at http://som.csudh.edu/fac/lpress/devnat/nations/india/pondyoti.htm.
67
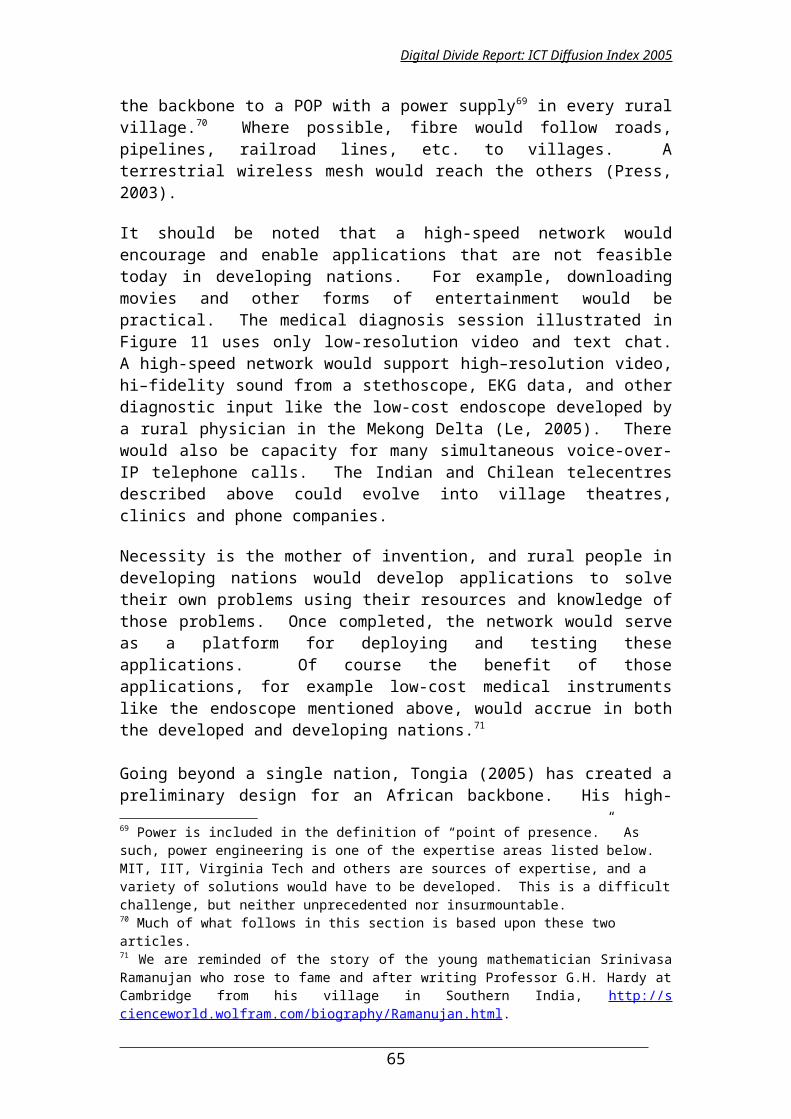
Digital Divide Report: ICT Diffusion Index 2005
Press, L., Burkhart, G., Foster, W., and Goodman, S. (1999), "The Internet in India and China", INET '99, San Jose, CA, June, available at http://www.isoc.org/isoc/conferences/inet/99/proceedings/3a/3a_3.htm
Press, L., Foster, W., Wolcott, P. and McHenry, W. (2003), "The Internet in India and China," The Journal of Information Technologies and International Development, MIT Press, 1(1), Fall 2003, 41-60, available athttp://mitpress.mit.edu/journals/pdf/itid_1_1_41_0.pdf
Press, L. (2003), "Wireless Internet Connectivity for Developing Nations", First Monday, 8(9), September, available athttp://www.firstmonday.org/issues/issue8_9/press/index.html.
Press, L. (2004-a), "The Internet in Developing Nations: Grand Challenges", First Monday, 9(4), April, available at http://www.firstmonday.org/issues/issue9_4/press/.
Press, L. (2004-b), "Refuting Objections to a Global Rural Network (GRNet) for Developing Nations", First Monday, 9(8), August, available athttp://www.firstmonday.org/issues/issue9_8/press/.
Qiang, X., and Beach, S. (2002) "The Great Firewall of China," Los Angeles Times 25 August, available at http://www.cpj.org/news/2002/China_Firewall25aug02.html .
Rajashekhar, V.V. (2005), "e-Chaupal", Proceedings of the Asia-Pacific Telecommunity Seminar on Leveraging Private Investment for Rural ICT Development, 5-7, July, Chiang Rai (Thailand), available at http://www.aptsec.org/meetings/2005/ICT-WB/docs/PROCEEDINGS.doc
Reed, S. (2005), "Privatization of Latin American Telecommunications Firms", Fabian Ponce O & Asociados C Ltda., Quito (Ecuador), available athttp://www.lectlaw.com/filesh/il-2.htm.
Robinson, K.K., and Crenshaw, E.M. (1999), "Cyber-Space and Post-Industrial Transformations: A Cross-National Analysis of Internet Development", Working Paper, Department of Sociology, Ohio State University, December.
Rodriguez F. and Wilson, E. (2000), "Are Poor Countries Losing the Information Revolution?", infoDev Working Paper, Washington DC: World Bank, available at http://wbln0018.worldbank.org/ict/resources.nsf/a693f575e01ba5f385256b500062af05/45a738b8c7305beb85256da400504c12/$FILE/Wilson&Rodriguez.doc
Sadowsky, G. (1993), "Network Connectivity for Developing Countries", Communications of the ACM, August, 36, available athttp://portal.acm.org/citation.cfm?id=163388&jmp=references&dl=GUIDE&dl=ACM .
Saltzer, J. H., Reed, D.P. and Clark, D.D. (1984), "End-to-end Arguments in System Design", Second International Conference on Distributed Computing Systems (April 1981) pages 509-512. Published with minor changes in ACM Transactions in Computer Systems 2, 4, November 1984, 277-288, available at
68
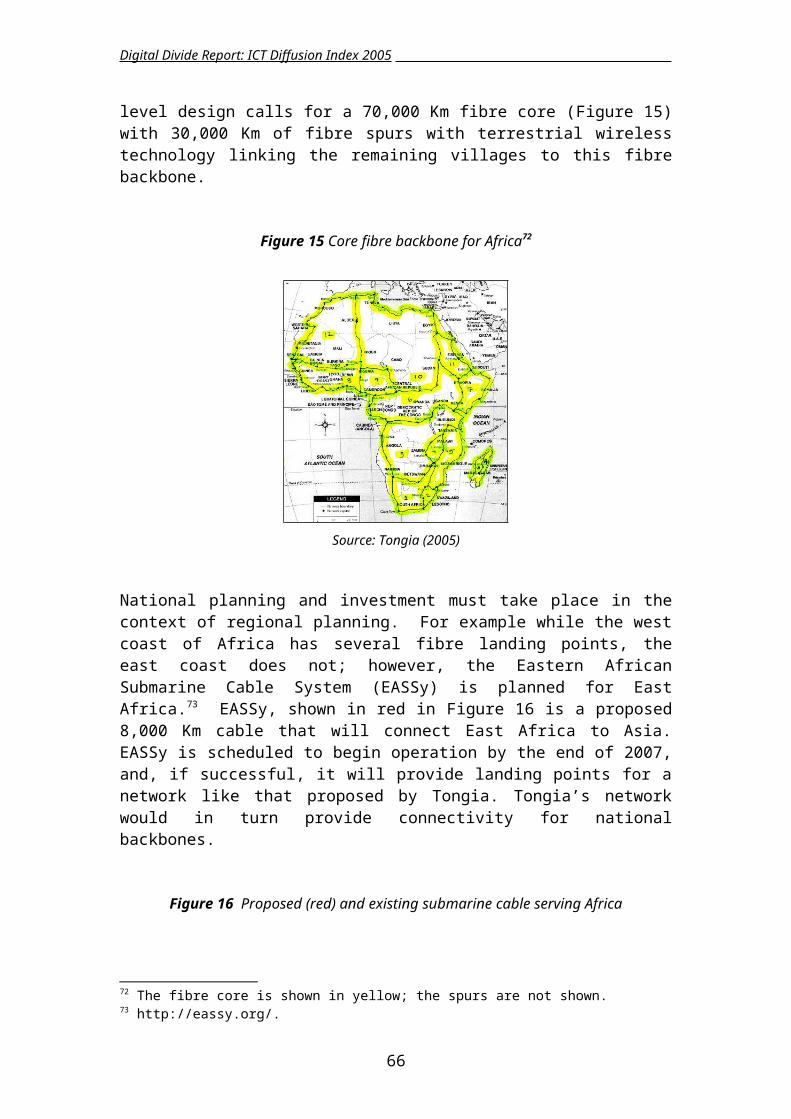
Digital Divide Report: ICT Diffusion Index 2005
http://web.mit.edu/Saltzer/www/publications/endtoend/endtoend.pdf
Schatz, A. (2006), "Net Firms Raise Capitol Hill Profile", Wall Street Journal, January 28, Page A4, available athttp://online.wsj.com/article/SB113841720059659024-email.html.
Sprigman, C. and Lurie, P. (2004), "Broadband Marxism, Foreign Policy, March/April, available athttp://www.networkideas.org/news/apr2004/news21_Broadband_Marxism.htm.
Swaminathan, M. S. (2001). "Antyodaya Pathway of Bridging the Digital Divide", Lecture delivered before the Tilak Smarak Trust, Pune (India), August 1st, available at http://www.worldbank.org/wbi/B-SPAN/docs/antyoday.pdf.
Tongia, R. (2005), "Reducing One Aspect of the Digital Divide – Connectivity (Introducing the FiberAfrica Proposal – a Leapfrog Open Access Network)", School of Computer Science (ISRI) Deptartment of Engineering & Public Policy, Carnegie Mellon University, May 13, available at http://www.contrib.andrew.cmu.edu/~tongia/FiberAfrica--ending_a_digital_divide.pdf
Wellenius, B. (1997), "Extending Telecommunications Service to Rural Areas, The Chilean Experience", Note 105, February, World Bank, available athttp://www1.worldbank.org/viewpoint/HTMLNotes/105/105welle.pdf
Wellenius, B. (2001), "Closing the Rural Communication Access Gap: Chile 1995-2002", 24 June, World Bank, available athttp://rru.worldbank.org/Documents/PapersLinks/1222.pdf
WTO (1998), "Telecommunication Services", Background Note by the Secretariat, December 8, available at http://www.wto.org/english/tratop_e/serv_e/w74.doc
Reports
Balancing Act (2004), African ICT Infrastructure Investment Options, Balancing Act for UK's Department for International Development (DFID), available athttp://www.afridigital.net/downloads/DFIDinfrastructurerep.pdf.
Bandwidth Report (2006), January 23, available athttp://www.websiteoptimization.com/bw/0601/.
Center for Democracy and Technology (2002), Bridging the Digital Divide, available at http://www.cdt.org/international/ceeaccess.
Delgado, A. (2005), Estadísticas 2005, Minister of Education of Chile, May.
Grupo de Acción Digital (2004), Agenda Digital, available athttp://hasp.axesnet.com/contenido/documentos/Agenda%20Digital%20-%20Chile%202004%20-%202006.pdf.
69
Digital Divide Report: ICT Diffusion Index 2005
Gwartney, J., Lawson, R. and Gartzke, E. (2005), Economic Freedomof the World: 2005 Annual Report, The Fraser Institute, Vancouver Canada, available at http://www.freetheworld.com.
Infocomm Development Authority of Singapore (2006), Full Competition in Telecommunications Sector, Singapore IDA, available athttp://www.ida.gov.sg/idaweb/pnr/infopage.jsp?infopagecategory=&infopageid=I489,
ITU (2001-a), Effective Regulation Case Study: Botswana 2001, International Telecommunication Union, Geneva, available athttp://www.itu.int/itudoc/gs/promo/bdt/cast_reg/79121.html
ITU (2001-b), Counting the Net: Internet Access Indicators, available at http://www.isoc.org/isoc/conferences/inet/00/cdproceedings/8e/8e_1.htm.
ITU (2002), World Telecommunication Development Report 2002, International Telecommunication Union, available athttp://www.itu.int/ITU-D/ict/publications/wtdr_02/index.html .
ITU (2003), World Telecommunication Development Report 2002, International Telecommunication Union, available athttp://www.itu.int/ITU-D/ict/statistics/WTI_2003.pdf
Nascom (2005), Internet Users and Subscribers: 1998-2005, available athttp://www.nasscom.org/images/internetecommerce-01.pdf
Open Net Initiative (2005), Internet Filtering in China in 2004-2005: A Country Study, available athttp://www.opennetinitiative.net/studies/china/ONI_China_Country_Study.pdf.
Point Topic (2005), Singapore Broadband Overview, 30 August, available athttp://www.point-topic.com/content/operatorSource/profiles/Singapore.htm&comp_id=775&g=1.
Point Topic (2005), World Broadband Statistics: Q3 2005, December, available athttp://www.point-topic.com/contentDownload/dslanalysis/world%20broadband%20statistics%20q3%202005.pdf.
Statoids database (2005), (queried January 2006), available athttp://www.statoids.com/ucl.html
SUBTEL (2004), Informe Final Monitoreo, December, available athttp://www.infocentros.gob.cl/Descargables/INFORME_MONITOREO_04.pdf.
SUBTEL (2005), Informe Semestral Monitoreo, June, available at http://www.infocentros.gob.cl/Descargables/INFORME_MONITOREO_05.pdf.
70

Digital Divide Report: ICT Diffusion Index 2005
TeleGeography (2000), Hubs and Spokes, A TeleGeography Internet Reader, Washington, DC: TeleGeography, Inc, book review available at http://www.vanbest.org/janpascal/publications/2000/ReviewHubsAndSpokes.htm
UNCTAD (2005), Information Economy Report 2005, available athttp://www.unctad.org/Templates/WebFlyer.asp?intItemID=3591&lang=1
UNCTAD (2004), The Digital Divide: ICT Development Indices 2004, available at http://stdev.unctad.org
UNCTAD (2003), Information and Communication Technology Development Indices, available at http://stdev.unctad.org
United Nations (2004), UN Global E-Government Readiness Report 2004: Towards Access for Opportunity, United Nations Online Network in Public Administration and Finance, UNPAN/2004/11, Department of Economic and Social Affairs, New York, available athttp://unpan1.un.org/intradoc/groups/public/documents/un/unpan019207.pdf
UNDP (2001), Human Development Report, 2001: Making New Technologies Work for Human Development, UNDP, New York, available athttp://hdr.undp.org/reports/global/2001/en/
UNDP (2004), Note on statistics in the Human Development Report, available at http://hdr.undp.org/reports/global/2004/pdf/hdr04_backmatter_2.pdf
UNDP (2005), Human Development Report, 2005, UNDP, New York, available at http://hdr.undp.org/reports/global/2005/
UNIDO (2002), Industrial Development Report, UNIDO, Vienna, June/July, available at http://www.unido.org/doc/24397
U.S. Internet Council (2000), “State of the Internet Report 2000”, available athttp:// www.usinternetcouncil.org .
World Bank (2006), World Development Indicators Database, queried January 2006.
71
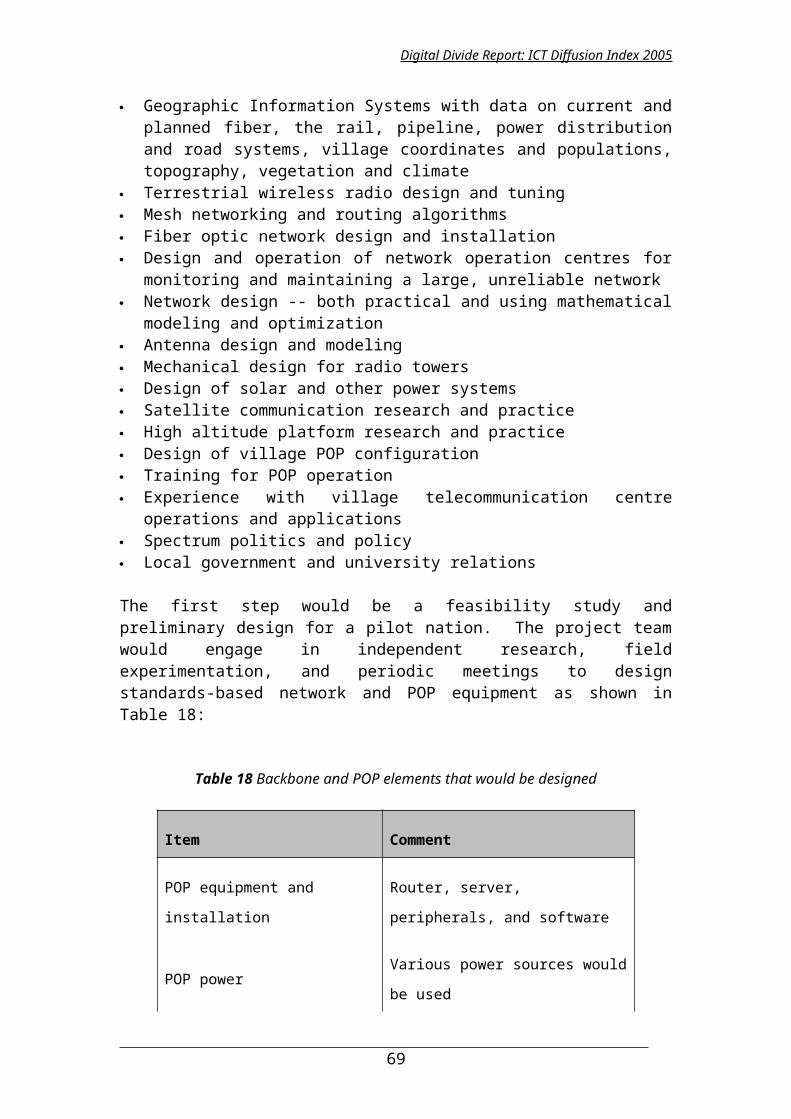
Digital Divide Report: ICT Diffusion Index 2005
SELECTED UNCTAD PUBLICATIONS ON SCIENCE AND TECHNOLOGY
(For more information, please visit www.unctad.org/stdev on the web)
A. Individual Studies
Science, Technology and Innovation Policy Review. The Islamic Republic of Iran. 116p. UNCTAD/ITE/IPC/2005/7. Free-of-Charge.
The Digital Divide: ICT Development Indices 2004. 67p.UNCTAD/ITE/IPC/2005/4. Free-of-Charge.
The Biotechnology Promise: Capacity-Building for Participation of Developing Countries in the Bioeconomy. 127p. UNCTAD/ITE/IPC/2004/2. Free-of-Charge.
Africa’s Technology Gap: Case Studies on Kenya, Ghana, Tanzania and Uganda. 123 p. UNCTAD/ITE/IPC/Misc.13. Free-of-Charge.
Information and Communication Technology Development Indices. 96 p. Sales No. E.03.II.D.14. $15.
Science and Technology Diplomacy: Concepts and Elements of a Work Programme. 33 p. UNCTAD/ITE/TEB/Misc.5. Free-of-charge.
Transfer of Technology for Successful Integration into the Global Economy: A case Study of Embraer in Brazil. 61 p. UNCTAD/ITE/IPC/Misc.20. Free-of-charge.
Transfer of Technology for Successful Integration into the Global Economy: A Case Study of the South African Automotive Industry. 34 p. UNCTAD/ITE/IPC/Misc.21. Free-of-charge.
Transfer of Technology for the Successful Integration into the Global Economy: A Case Study of the Pharmaceutical Industry in India. 52 p. UNCTAD/ITE/IPC/Misc.22. Free-of-charge.
Coalition of Resources for Information and Communication Technologies. 92 p. UNCTAD/ITE/TEB/13. Free-of-charge.
Key Issues in Biotechnology. 20 p. UNCTAD/ITE/TEB/10. Free-of-charge.
An Assault on Poverty: Basic Human Needs, Science and Technology. 327 p. ISBN 0-88936-800-7. (Joint publication with IDRC).
Compendium of International Arrangements on Transfer of Technology: Selected Instruments. Sales No. E.01.II.D.28. $45.
Foreign Direct Investment and Transfer of Technology in India. 150 p. Sales No. E.92.II.A.3. $20.
72

Digital Divide Report: ICT Diffusion Index 2005
Information Technology and International Competitiveness: The Case of the Construction Services Industry. Sales No. E.93.II.D.6. $25.
Investment and Innovation Policy Review of Ethiopia. 115 p. Sales No. E.01.II.D.35. $25.
Knowledge Societies: Information Technology for Sustainable Development. 323 p. Sales No. GV.E.98.0.11. $19.
Making North-South Research Networks Work. 48 p. UNCTAD/ITE/EDS/7.
Missing Links: Gender Equity in Science and Technology for Development. 371 p. ISBN 0-88936-765-5. (Joint publication with IDRC).
On Solid Ground: Science, Technology and Integrated Land Management. 66 p. ISBN 0-88936-820-1. (Joint publication with IDRC).
Technological Capacity-Building and Technology Partnership: Field Findings, Country Experiences and Programmes. Sales No. 95.II.D.6. $22.
The Science, Technology and Innovation Policy Review: Colombia. 161 p. Sales No. E.99.II.D.13. $42.
The Science, Technology and Innovation Policy Review: Jamaica. 156 p.Sales No. E.98.II.D.7. $23.
Transfer and Development of Technology in Developing Countries: A Compendium of Policy Issues. Sales No. E.89.1l.D.17. $19.
Report of the Workshop on the Transfer and Development of Environmentally Sound Technologies (ESTs). Sales No. E.94.1l.D. 1. $10.(Joint publication with the Government of Norway. Oslo, Norway.)
B. ATAS Issue Paper Series
ATAS Issue 12: The Role of Publicly Funded Research and Publicly Owned Technologies in the Transfer and Diffusion of Environmentally Sound Technologies. 405 p. Sales No. E.00.II.D.37. $45.
ATAS Issue 11: New Approaches to Science and Technology Cooperation and Capacity Building. 417 p. Sales No. E.99.II.D.4. $40.
ATAS Issue 10: Information Technology for Development. 558 p. Sales No. E.95.1l.D.20. $75.
73
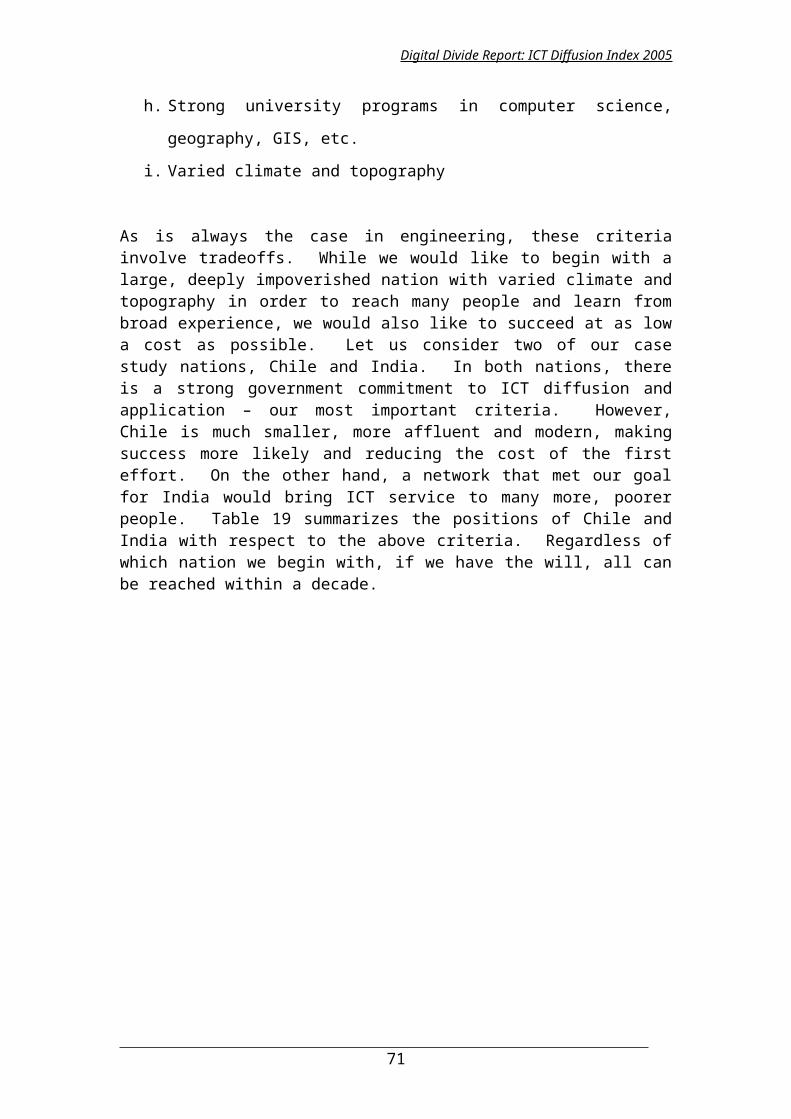
Digital Divide Report: ICT Diffusion Index 2005
C. Technology for Development Series
Investment and Technology Policies for Competitiveness: Review of Successful Country Experiences. 81p. UNCTAD/ITE/IPC/2003/2
Electronic Commerce and Music Business Development in Jamaica: A Portal to the New Economy? 45p. Sales No. E.02.II.D.17. $10.
Changing Dynamics of Global Computer Software and Services Industry: Implications for Developing Countries. 51 p. Sales No. E.02.II.D.3. $15.
Partnerships and Networking in Science and Technology for Development. 46 p. Sales No. E.02.II.D.5. $15.
Do Environmental Imperatives Present Novel Problems and Opportunities for theInternational Transfer of Technology? 21 p. Sales No. E.95.II.D.11. $10.
Emerging Forms of Technological Cooperation: The Case for Technology Partnership. Sales No. E.96.II.D.1. $19.
New Technologies and Technological Capability-Building at the Enterprise Level: Some Policy Implications. 39 p. Sales No.E.95.II.D.24. $10.
Promoting the Transfer and Use of Environmentally Sound Technology: A review of Policies. 53 p. UNCTAD/DST/12. $19.
Science and Technology in the New Global Environment: Implications for Developing Countries. 56 p. Sales No. E. 95.II.D.14. $19.
74
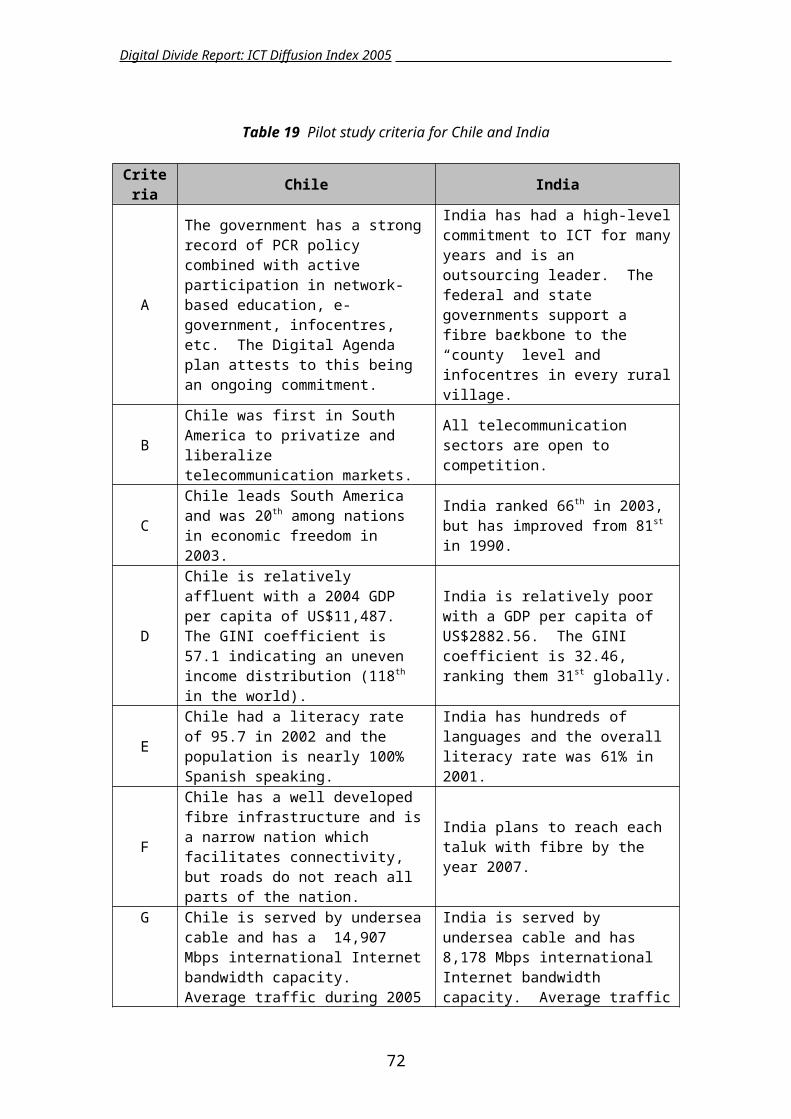
Digital Divide Report: ICT Diffusion Index 2005
United Nations publications may be obtained from bookstores and distributors throughout the world. Please consult your bookstore or write to:
United Nations Publications
Sales SectionUnited Nations Office at Geneva
Palais des NationsCH-1211 Geneva 10
SwitzerlandTel: (41-22) 917-2614Fax: (41-22) 917-0027
E-mail: [email protected]
OR
Sales SectionRoom DC2-0853
United Nations SecretariatNew York, NY 10017
U.S.A.Tel: (1-212) 963-8302 or (800) 253-9646
Fax: (1-212) 963-3489E-mail: [email protected]
All prices are quoted in United States dollars.
For further information on the work of the Division on Investment, Technology and Enterprise Development, UNCTAD, please address inquiries to:
United Nations Conference on Trade and DevelopmentDivision on Investment, Technology and Enterprise Development
Palais des Nations, Room E-10054CH-1211 Geneva 10, Switzerland
Telephone: (41-22) 907-5651Telefax: (41-22) 907-0194
E-mail: [email protected]
75
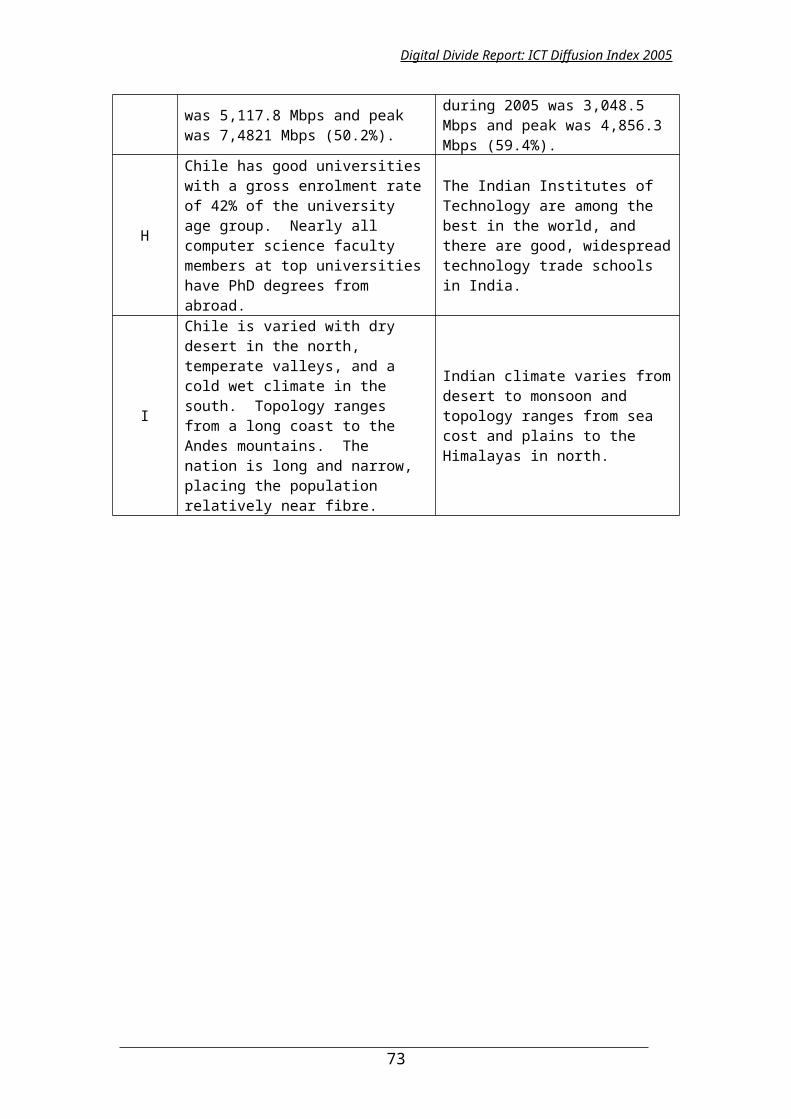
Digital Divide Report: ICT Diffusion Index 2005
QUESTIONNAIRE
Digital Divide: ICT Development Indices 2005
In order to improve the quality and relevance of the work of the UNCTAD Division on Investment, Technology and Enterprise Development, it would be useful to receive the views of readers on this and similar publications. It would therefore be greatly appreciated if you could complete the following questionnaire and return it to:
Readership SurveyUNCTAD Division on Investment, Technology and Enterprise Development
United Nations Office at GenevaPalais des Nations
Room E-10054CH-1211, Geneva 10
Switzerland
1. Name and address of respondent (optional):___________________________________________________________________________________________________________________________________________________________________________________________________________________________________________________________________________________________________________________________________________________________________
2. Which of the following best describes your area of work?
Government ٱ Public enterprise ٱPrivate enterprise institution ٱ Academic or research ٱInternational organization ٱ Media ٱNot-for-profit organization ٱ Other (specify) ____________________
3. In which country do you work? ________________________________________
4. What is your assessment of the contents of this publication?
Excellent ٱ Adequate ٱGood ٱ Poor ٱ
5. How useful is this publication to your work?
Very useful ٱ Of some use ٱIrrelevant ٱ
6. Please indicate the three things you liked best about this publication:
76
Digital Divide Report: ICT Diffusion Index 2005
____________________________________________________________________________________________________________________________________________________________________________________________________________________________________________________________________________________________
7. Please indicate the three things you liked least about this publication:____________________________________________________________________________________________________________________________________________________________________________________________________________________________________________________________________________________________
8. If you have read more than the present publication of the UNCTAD Division on Investment, Enterprise Development and Technology, what is your overall assessment of them?
Consistently good ٱ Usually good, but with some exceptions ٱGenerally mediocre ٱ Poor ٱ
9. On average, how useful are these publications to you in your work?
Very useful ٱ Of some use ٱIrrelevant ٱ
77