Embed Size (px)
Citation preview


U N I T E D N AT I O N S C O N F E R E N C E O N T R A D E A N D D E V E L O P M E N T
WORLD INVESTMENT
REPORT2015
New York and Geneva, 2015
REFORMING INTERNATIONAL INVESTMENT GOVERNANCE

World Investment Report 2015: Reforming International Investment Governanceii
UNITED NATIONS PUBLICATIONSales No. E.15.II.D.5
ISBN 978-92-1-112891-8eISBN 978-92-1-057403-7
Copyright © United Nations, 2015All rights reserved
Printed at United Nations, Geneva
NOTE
The Division on Investment and Enterprise of UNCTAD is a global centre of excellence, dealing with issues related to investment and enterprise development in the United Nations System. It builds on four decades of experience and international expertise in research and policy analysis, fosters intergovernmental consensus-building, and provides technical assistance to over 150 countries.
The terms country/economy as used in this Report also refer, as appropriate, to territories or areas; the designations employed and the presentation of the material do not imply the expression of any opinion whatsoever on the part of the Secretariat of the United Nations concerning the legal status of any country, territory, city or area or of its authorities, or concerning the delimitation of its frontiers or boundaries. In addition, the designations of country groups are intended solely for statistical or analytical convenience and do not necessarily express a judgment about the stage of development reached by a particular country or area in the development process. The major country groupings used in this Report follow the classification of the United Nations Statistical Office:
• Developed countries: the member countries of the OECD (other than Chile, Mexico, the Republic of Korea and Turkey), plus the new European Union member countries which are not OECD members (Bulgaria, Croatia, Cyprus, Latvia, Lithuania, Malta and Romania), plus Andorra, Bermuda, Liechtenstein, Monaco and San Marino.
• Transition economies: South-East Europe, the Commonwealth of Independent States and Georgia.
• Developing economies: in general, all economies not specified above. For statistical purposes, the data for China do not include those for Hong Kong Special Administrative Region (Hong Kong SAR), Macao Special Administrative Region (Macao SAR) and Taiwan Province of China.
Reference to companies and their activities should not be construed as an endorsement by UNCTAD of those companies or their activities.
The boundaries and names shown and designations used on the maps presented in this publication do not imply official endorsement or acceptance by the United Nations.
The following symbols have been used in the tables:
• Two dots (..) indicate that data are not available or are not separately reported. Rows in tables have been omitted in those cases where no data are available for any of the elements in the row.
• A dash (–) indicates that the item is equal to zero or its value is negligible.
• A blank in a table indicates that the item is not applicable, unless otherwise indicated.
• A slash (/) between dates representing years, e.g., 2010/11, indicates a financial year.
• Use of a dash (–) between dates representing years, e.g., 2010–2011, signifies the full period involved, including the beginning and end years.
• Reference to “dollars” ($) means United States dollars, unless otherwise indicated.
• Annual rates of growth or change, unless otherwise stated, refer to annual compound rates.
Details and percentages in tables do not necessarily add to totals because of rounding.
The material contained in this study may be freely quoted with appropriate acknowledgement.

iii
BAN Ki-moon Secretary-General of the United Nations
PREFACE
This year’s World Investment Report, the 25th in the series, aims to inform global debates on the future of the international policy environment for cross-border investment.
Following recent lackluster growth in the global economy, this year’s Report shows that Foreign Direct Investment (FDI) inflows in 2014 declined 16 per cent to $1.2 trillion. However, recovery is in sight in 2015 and beyond. FDI flows today account for more than 40 per cent of external development finance to developing and transition economies.
This Report is particularly timely in light of the Third International Conference on Financing for Development in Addis Ababa – and the many vital discussions underscoring the importance of FDI, international investment policy making and fiscal regimes to the implementation of the new development agenda and progress towards the future sustainable development goals.
The World Investment Report tackles the key challenges in international investment protection and promotion, including the right to regulate, investor-state dispute settlement, and investor responsibility. Furthermore, it examines the fiscal treatment of international investment, including contributions of multinational corporations in developing countries, fiscal leakage through tax avoidance, and the role of offshore investment links.
The Report offers a menu of options for the reform of the international investment treaties regime, together with a roadmap to guide policymakers at the national, bilateral, regional and multilateral levels. It also proposes a set of principles and guidelines to ensure coherence between international tax and investment policies.
I commend this publication as an important tool for the international investment community in this crucial year for sustainable development.

World Investment Report 2015: Reforming International Investment Governanceiv
ACKNOWLEDGEMENTS
The World Investment Report 2015 (WIR15) was prepared by a team led by James X. Zhan. The team members included Richard Bolwijn, Kwangouck Byun, Bruno Casella, Joseph Clements, Hamed El Kady, Kumi Endo, Masataka Fujita, Noelia Garcia Nebra, Axèle Giroud, Joachim Karl, Ventzislav Kotetzov, Guoyong Liang, Hafiz Mirza, Shin Ohinata, Sergey Ripinsky, Diana Rosert, William Speller, Astrit Sulstarova, Claudia Trentini, Elisabeth Tuerk, Joerg Weber and Kee Hwee Wee.
WIR15 benefited from the advice of Jeffrey Owens, Senior Tax Advisor.
Research and statistical assistance was provided by Bradley Boicourt, Mohamed Chiraz Baly and Lizanne Martinez. Contributions were also made by Bekele Amare, Ana Conover Blancas, Hasinah Essop, Charalampos Giannakopoulos, Thomas van Giffen, Natalia Guerra, Rhea Hoffmann, Mathabo Le Roux, Kendra Magraw, Abraham Negash, Chloe Reis, Davide Rigo, Julia Salasky, John Sasuya, Carmen Saugar Koster, Catharine Titi, as well as interns Anna Mouw and Elizabeth Zorrilla.
The manuscript was copy-edited with the assistance of Lise Lingo, and typeset by Laurence Duchemin and Teresita Ventura.
Sophie Combette and Nadege Hadjemian designed the cover, and Pablo Cortizo designed the figures and maps.
Production and dissemination of WIR15 was supported by Elisabeth Anodeau-Mareschal, Anne Bouchet, Nathalie Eulaerts, Rosalina Goyena, Tadelle Taye and Katia Vieu.
At various stages of preparation, in particular during the experts meetings organized to discuss drafts of WIR15, the team benefited from comments and inputs received from external experts: Wolfgang Alschner, Carlo Altomonte, Douglas van den Berghe, Nathalie Bernasconi, Yvonne Bol, David Bradbury, Irene Burgers, Jansen Calamita, Krit Carlier, Manjiao Chi, Steve Clark, Alex Cobham, Aaron Cosbey, Lorrain Eden, Maikel Evers, Uche Ewelukwa, Michael Ewing-Chow, Alessio Farcomeni, Michael Hanni, Martin Hearson, Steffen Hindelang, Lise Johnson, Michael Keen, Eric Kemmeren, Jan Kleinheisterkamp, Victor van Kommer, Markus Krajewski, Federico Lavopa, Michael Lennard, Jan Loeprick, Ricardo Martner, Makane Mbengue, Nara Monkam, Hans Mooij, Ruud de Mooij, Peter Muchlinski, Alexandre Munoz, Thomas Neubig, Andrew Packman, Joost Pauwelyn, Facundo Perez Aznar, Raffaella Piccarreta, Andrea Saldarriaga, Mavluda Sattorova, Ilan Strauss, Lauge Skovgaard Poulsen, Christian Tietje, Jan van den Tooren, Gerben Weistra and Paul Wessendorp. MEED provided assistance in obtaining data for the West Asia region.
Also acknowledged are comments received from other UNCTAD divisions, including from the Division for Africa, Least Developed Countries and Special Programmes, the Division on Globalization and Development Strategies, and the Division on Technology and Logistics, as part of the internal peer review process, as well as comments from the Office of the Secretary-General as part of the review and clearance process. The United Nations Cartographic Section provided advice for the regional maps.
Numerous officials of central banks, government agencies, international organizations and non-governmental organizations also contributed to WIR15. The financial support of the Governments of Finland, Norway, Sweden and Switzerland is gratefully acknowledged.

v
TABLE OF CONTENTS
PREFACE . . . . . . . . . . . . . . . . . . . . . . . . . . . . . . . . . . . . . . . . . . . . . . . . . . . . . . . . . . . . . . . . . . iii
ACKNOWLEDGEMENTS . . . . . . . . . . . . . . . . . . . . . . . . . . . . . . . . . . . . . . . . . . . . . . . . . . . . . . . . iv
ABBREVIATIONS . . . . . . . . . . . . . . . . . . . . . . . . . . . . . . . . . . . . . . . . . . . . . . . . . . . . . . . . . . . viii
KEY MESSAGES . . . . . . . . . . . . . . . . . . . . . . . . . . . . . . . . . . . . . . . . . . . . . . . . . . . . . . . . . . . . . ix
CHAPTER I . GLOBAL INVESTMENT TRENDS . . . . . . . . . . . . . . . . . . . . . . . . . . . . . . . . . . . . . . . . 1
A . CURRENT TRENDS . . . . . . . . . . . . . . . . . . . . . . . . . . . . . . . . . . . . . . . . . . . . . . . . . . . . . . . . . 2
1. FDI by geography . . . . . . . . . . . . . . . . . . . . . . . . . . . . . . . . . . . . . . . . . . . . . . . . . . . . . . . . .2
2. FDI by mode of entry . . . . . . . . . . . . . . . . . . . . . . . . . . . . . . . . . . . . . . . . . . . . . . . . . . . . . . .8
3. FDI by sector and industry . . . . . . . . . . . . . . . . . . . . . . . . . . . . . . . . . . . . . . . . . . . . . . . . . .12
4. FDI by selected types of investors . . . . . . . . . . . . . . . . . . . . . . . . . . . . . . . . . . . . . . . . . . . .14
B . INTERNATIONAL PRODUCTION . . . . . . . . . . . . . . . . . . . . . . . . . . . . . . . . . . . . . . . . . . . . . . 18
C . PROSPECTS . . . . . . . . . . . . . . . . . . . . . . . . . . . . . . . . . . . . . . . . . . . . . . . . . . . . . . . . . . . . 21
1. UNCTAD’s econometric forecasting model . . . . . . . . . . . . . . . . . . . . . . . . . . . . . . . . . . . . . . .21
2. UNCTAD business survey …….. . . . . . . . . . . . . . . . . . . . . . . . . . . . . . . . . . . . . . . . . . . . . . .22
CHAPTER II . REGIONAL INVESTMENT TRENDS . . . . . . . . . . . . . . . . . . . . . . . . . . . . . . . . . . . . . 29
INTRODUCTION . . . . . . . . . . . . . . . . . . . . . . . . . . . . . . . . . . . . . . . . . . . . . . . . . . . . . . . . . . . . 30
A . REGIONAL TRENDS . . . . . . . . . . . . . . . . . . . . . . . . . . . . . . . . . . . . . . . . . . . . . . . . . . . . . . . 32
1. Africa . . . . . . . . . . . . . . . . . . . . . . . . . . . . . . . . . . . . . . . . . . . . . . . . . . . . . . . . . . . . . . . .32
2. East and South-East Asia . . . . . . . . . . . . . . . . . . . . . . . . . . . . . . . . . . . . . . . . . . . . . . . . . .39
3. South Asia …………….. . . . . . . . . . . . . . . . . . . . . . . . . . . . . . . . . . . . . . . . . . . . . . . . . . . .46
4. West Asia ……… . . . . . . . . . . . . . . . . . . . . . . . . . . . . . . . . . . . . . . . . . . . . . . . . . . . . . . . .52
5. Latin America and the Caribbean . . . . . . . . . . . . . . . . . . . . . . . . . . . . . . . . . . . . . . . . . . . . .58
6. Transition economies . . . . . . . . . . . . . . . . . . . . . . . . . . . . . . . . . . . . . . . . . . . . . . . . . . . . . .65
7. Developed countries . . . . . . . . . . . . . . . . . . . . . . . . . . . . . . . . . . . . . . . . . . . . . . . . . . . . . .71
B . TRENDS IN STRUCTURALLY WEAK, VULNERABLE AND SMALL ECONOMIES . . . . . . . . . . . . . . . 78
1. Least developed countries . . . . . . . . . . . . . . . . . . . . . . . . . . . . . . . . . . . . . . . . . . . . . . . . . .78
2. Landlocked developing countries . . . . . . . . . . . . . . . . . . . . . . . . . . . . . . . . . . . . . . . . . . . . . .85
3. Small island developing States . . . . . . . . . . . . . . . . . . . . . . . . . . . . . . . . . . . . . . . . . . . . . . .91

World Investment Report 2015: Reforming International Investment Governancevi
CHAPTER III . RECENT POLICY DEVELOPMENTS AND KEY ISSUES . . . . . . . . . . . . . . . . . . . . . . . . 101
A . NATIONAL INVESTMENT POLICIES . . . . . . . . . . . . . . . . . . . . . . . . . . . . . . . . . . . . . . . . . . 102
B . INTERNATIONAL INVESTMENT POLICIES . . . . . . . . . . . . . . . . . . . . . . . . . . . . . . . . . . . . . . 106
1. Trends in the conclusion of IIAs . . . . . . . . . . . . . . . . . . . . . . . . . . . . . . . . . . . . . . . . . . . . .106
2. Content of new IIAs . . . . . . . . . . . . . . . . . . . . . . . . . . . . . . . . . . . . . . . . . . . . . . . . . . . . . .110
3. Investment dispute settlement . . . . . . . . . . . . . . . . . . . . . . . . . . . . . . . . . . . . . . . . . . . . . .112
CHAPTER IV . REFORMING THE INTERNATIONAL INVESTMENT REGIME: AN ACTION MENU . . . . . . . . . . . . . . . . . . . . . . . . . . . . . . . . . . . . . . . . . . . . . . . . . . . . . . . . 119
INTRODUCTION . . . . . . . . . . . . . . . . . . . . . . . . . . . . . . . . . . . . . . . . . . . . . . . . . . . . . . . . . . . 120
A . SIX DECADES OF IIA RULE MAKING AND LESSONS LEARNED . . . . . . . . . . . . . . . . . . . . . . . . 121
1. Six decades of IIA rule making . . . . . . . . . . . . . . . . . . . . . . . . . . . . . . . . . . . . . . . . . . . . . . .121
2. Lessons learned . . . . . . . . . . . . . . . . . . . . . . . . . . . . . . . . . . . . . . . . . . . . . . . . . . . . . . . .125
B . STRATEGIC APPROACH AND POLICY OPTIONS . . . . . . . . . . . . . . . . . . . . . . . . . . . . . . . . . . . 127
1. Reform needs and objectives . . . . . . . . . . . . . . . . . . . . . . . . . . . . . . . . . . . . . . . . . . . . . . .127
2. Designing a future IIA regime . . . . . . . . . . . . . . . . . . . . . . . . . . . . . . . . . . . . . . . . . . . . . . .128
3. Policy options for reform . . . . . . . . . . . . . . . . . . . . . . . . . . . . . . . . . . . . . . . . . . . . . . . . . .135
C . IIA REFORM: GUIDELINES AND ACTIONS . . . . . . . . . . . . . . . . . . . . . . . . . . . . . . . . . . . . . . . . . . . . . 164
1. Guidelines for IIA reform . . . . . . . . . . . . . . . . . . . . . . . . . . . . . . . . . . . . . . . . . . . . . . . . . . .164
2. IIA reform: actions and outcomes . . . . . . . . . . . . . . . . . . . . . . . . . . . . . . . . . . . . . . . . . . . .164
Conclusion . . . . . . . . . . . . . . . . . . . . . . . . . . . . . . . . . . . . . . . . . . . . . . . . . . . . . . . . . . . . . . 171
CHAPTER V . INTERNATIONAL TAX AND INVESTMENT POLICY COHERENCE . . . . . . . . . . . . . . . . . 175
INTRODUCTION: THE TAX AND INVESTMENT POLICY IMPERATIVE . . . . . . . . . . . . . . . . . . . . . . . 176
A . MNEs AS A SOURCE OF GOVERNMENT REVENUES FOR DEVELOPMENT . . . . . . . . . . . . . . . . . 179
1. Government revenues and revenue collection in developing countries . . . . . . . . . . . . . . . . . . . .179
2. The contribution of MNEs to government revenues . . . . . . . . . . . . . . . . . . . . . . . . . . . . . . . .184
B . AN INVESTMENT PERSPECTIVE ON INTERNATIONAL TAXATION . . . . . . . . . . . . . . . . . . . . . . 188
1. The importance of offshore investment hubs and transit FDI . . . . . . . . . . . . . . . . . . . . . . . . . .188
2. The root causes of the outsized role of offshore hubs in global investments . . . . . . . . . . . . . . .190
C . MNE TAX AVOIDANCE AND DEVELOPING COUNTRIES . . . . . . . . . . . . . . . . . . . . . . . . . . . . . . 198
1. Exposure of developing economies to corporate investments from offshore hubs . . . . . . . . . . .198
2. Tax revenue losses for developing economies from hub-based tax avoidance schemes . . . . . . . .200

vii
D . TAX AND INVESTMENT POLICYMAKING: A PROPOSAL FOR GREATER COHERENCE . . . . . . . . . . . . . . . . . . . . . . . . . . . . . . . . . . . . . . . . . . . . . . . . . 203
1. The tax-investment policy link and the need for a synergistic approach . . . . . . . . . . . . . . . . . . .204
2. Towards guidelines for Coherent International Tax and Investment Policies ….. . . . . . . . . . . . . .206
EPILOGUE . . . . . . . . . . . . . . . . . . . . . . . . . . . . . . . . . . . . . . . . . . . . . . . . . . . . . . . . . . . . . . . 213
ANNEX TABLES . . . . . . . . . . . . . . . . . . . . . . . . . . . . . . . . . . . . . . . . . . . . . . . . . . . . . . . . . . . . A1
SUPPORTING ANNEXES AVAILABLE ONLINE(http://www.unctad.org/wir)
Chapters I and II • Detailed FDI, M&A, greenfield projects data tables
Chapter III• List of IIAs as of end 2014 (see also UNCTAD’s Investment
Policy Hub)
Chapter V • Annex I. Establishing the baseline: estimating the fiscal contribution
of multinational enterprises
• Annex II. An FDI-driven approach to measuring the scale and economic impact of BEPS
• Annex III. Policy action against tax avoidance by multinational enterprises: existing measures and ongoing discussions
World Investment Report 2015: Reforming International Investment Governanceviii
ABBREVIATIONS
ADR alternative dispute resolutionAGOA African Growth and Opportunity ActAPEC Asia-Pacific Economic CooperationASEAN Association of Southeast Asian NationsBEPS base erosion and profit shiftingBIT bilateral investment treatyBOT build, operate, transferBRICS Brazil, Russian Federation, India, China, South AfricaCETA Comprehensive Economic and Trade AgreementCFIA Cooperative and Facilitation Investment AgreementCIL customary international lawCIS Commonwealth of Independent StatesCLMV Cambodia, Laos People’s Democratic Republic, Myanmar, Viet NamCOMESA Common Market for Eastern and Southern AfricaCSR corporate social responsibilityDTT double-taxation treatyEPZ export processing zoneETR effective tax rateFDI foreign direct investmentFET fair and equitable treatmentFTA free trade agreementGATS General Agreement on Trade in ServicesGCC Gulf Cooperation CouncilGFCF gross fixed capital formationGVC global value chainIIA international investment agreementIPA investment promotion agencyIPFSD Investment Policy Framework for Sustainable DevelopmentISDS investor–State dispute settlementLDC least developed countriesLLDC landlocked developing countriesM&As mergers and acquisitonsMFN most favoured nationMNE multinational enterpriseNAFTA North American Free Trade AgreementNEM non-equity modeODA official development assistancePPP public-private partnershipRCEP Regional Comprehensive Economic Partnership SEZ special economic zoneSDT special and differential treatmentSIDS small island developing StatesSME small and medium-sized enterpriseSOE State-owned enterpriseSPE special purpose entitySWF sovereign wealth fundTPO trade promotion organizationTPP Trans-Pacific Partnership AgreementTRIMs Trade-Related Investment MeasuresTTIP Transatlantic Trade and Investment PartnershipUNCITRAL United Nations Commission on International Trade LawWIPS World Investment Prospects SurveyWTO World Trade Organization

KEY MESSAGES ix
KEY MESSAGES
GLOBAL INVESTMENT TRENDS
Global FDI inflows declined in 2014. Global foreign direct investment (FDI) inflows fell by 16 per cent to $1.23
trillion in 2014, mostly because of the fragility of the global economy, policy uncertainty for investors and elevated
geopolitical risks. New investments were also offset by some large divestments.
Inward FDI flows to developing economies reached their highest level at $681 billion with a 2 per cent rise.
Developing economies thus extended their lead in global inflows. China became the world’s largest recipient of
FDI. Among the top 10 FDI recipients in the world, 5 are developing economies.
The low level of flows to developed countries persisted in 2014. Despite a revival in cross-border mergers and
acquisitions (M&As), overall FDI flows to this group of economies declined by 28 per cent to $499 billion. They
were significantly affected by a single large-scale divestment from the United States.
Investments by developing-country multinational enterprises (MNEs) also reached a record level: developing Asia now
invests abroad more than any other region. Nine of the 20 largest investor countries were from developing or transition
economies. These MNEs continued to acquire developed-country foreign affiliates in the developing world.
Most regional groupings and initiatives experienced a fall in inflows in 2014. The groups of countries negotiating
the Transatlantic Trade and Investment Partnership (TTIP) and Trans-Pacific Partnership (TPP) saw their combined
share of global FDI inflows decline. ASEAN (up 5 per cent to $133 billion) and the RCEP (up 4 per cent to $363
billion) bucked the trend.
By sector, the shift towards services FDI has continued over the past 10 years in response to increasing
liberalization in the sector, the increasing tradability of services and the growth of global value chains in which
services play an important role. In 2012, services accounted for 63 per cent of global FDI stock, more than twice
the share of manufacturing. The primary sector represented less than 10 per cent of the total.
Cross-border M&As in 2014 rebounded strongly to $399 billion. The number of MNE deals with values larger than
$1 billion increased to 223 – the highest number since 2008 – from 168 in 2013. At the same time, MNEs made
divestments equivalent to half of the value of acquisitions.
Announced greenfield investment declined by 2 per cent to $696 billion. Developing countries continued to
attract two thirds of announced greenfield investment. Greenfield investment by both developed- and developing-
country MNEs remained unchanged.
FDI by special investors varied. The significance of private equity funds in the global M&A market, with $200 billion
in acquisitions in 2014, was reflected mainly in transactions involving large companies. Sovereign wealth funds,
which invested $16 billion in FDI in 2014, are increasingly targeting infrastructure internationally. State-owned MNEs’
international expansion has decelerated; in particular, their cross-border M&As declined by 39 per cent to $69 billion.
International production by MNEs is expanding. International production rose in 2014, generating value added
of approximately $7.9 trillion. The sales and assets of MNEs’ foreign affiliates grew faster than their domestic
counterparts. Foreign affiliates of MNEs employed about 75 million people.
FDI recovery is in sight. Global FDI inflows are projected to grow by 11 per cent to $1.4 trillion in 2015. Expectations
are for further rises to $1.5 trillion in 2016 and to $1.7 trillion in 2017. Both UNCTAD’s FDI forecast model and
its business survey of large MNEs signal a rise of FDI flows in the coming years. The share of MNEs intending
to increase FDI expenditures over the next three years (2015–2017) rose from 24 to 32 per cent. Trends in
cross-border M&As also point to a return to growth in 2015. However, a number of economic and political risks,
including ongoing uncertainties in the Eurozone, potential spillovers from conflicts, and persistent vulnerabilities
in emerging economies, may disrupt the projected recovery.

World Investment Report 2015: Reforming International Investment Governancex
REGIONAL INVESTMENT TRENDS
FDI inflows to Africa remained flat at $54 billion. Although the services share in Africa FDI is still lower than the global and the developing-country averages, in 2012, services accounted for 48 per cent of the total FDI stock in the region, more than twice the share of manufacturing (21 per cent). FDI stock in the primary sector was 31 per cent of the total.
Developing Asia (up 9 per cent) saw FDI inflows grow to historically high levels. They reached nearly half a trillion dollars in 2014, further consolidating the region’s position as the largest recipient in the world. FDI inflows to East and South-East Asia increased by 10 per cent to $381 billion. In recent years, MNEs have become a major force in enhancing regional connectivity in the subregion, through cross-border investment in infrastructure. The security situation in West Asia has led to a six-year continuous decline of FDI flows (down 4 per cent to $43 billion in 2014); weakening private investment in parts of the region is compensated by increased public investment. In South Asia (up 16 per cent to $41 billion), FDI has increased in manufacturing, including in the automotive industry.
FDI flows to Latin America and the Caribbean (down 14 per cent) decreased to $159 billion in 2014, after four
years of consecutive increases. This is mainly due to a decline in cross-border M&As in Central America and the Caribbean and to lower commodity prices, which dampened FDI to South America. The FDI slowdown, after a period of strong inflows driven by high commodity prices, may be an opportunity for Latin American countries to re-evaluate FDI strategies for the post-2015 development agenda. FDI in transition economies decreased by 52
per cent to $48 billion in 2014. Regional conflict coupled with falling oil prices and international sanctions have damaged economic growth prospects and shrunk investor interest in the region.
FDI inflows to developed countries fell by 28 per cent to $499 billion. Divestment and large swings in intracompany loans reduced inflows to the lowest level since 2004. Outflows held steady at $823 billion. Cross-border M&A activities gathered momentum in 2014. Burgeoning FDI income is providing a counterbalance to trade deficits, particularly in the United States and more recently in Japan.
FDI flows to structurally weak, vulnerable and small economies varied. FDI to the least developed countries (LDCs) increased by 4 per cent. Landlocked developing countries (LLDCs) experienced a fall of 3 per cent in FDI inflows, mostly in those in Asia and Latin America. By contrast, FDI inflows to small island developing States (SIDS) increased by 22 per cent, due to a rise in cross-border M&A sales. The relative importance of FDI, its greater stability and its more diverse development impact compared with other sources of finance means that it remains an important component of external development finance to these economies. Over the past decade (2004–2014), FDI stock tripled in LDCs and SIDS, and quadrupled in LLDCs. With a concerted effort by the international investment-development community, it would be possible to have FDI stock in structurally weak economies quadruple again by 2030. More important, further efforts are needed to harness financing for economic diversification to foster greater resilience and sustainability in these countries.

KEY MESSAGES xi
INVESTMENT POLICY TRENDS
Countries’ investment policy measures continue to be geared predominantly towards investment liberalization,
promotion and facilitation. In 2014, more than 80 per cent of investment policy measures aimed to improve
entry conditions and reduce restrictions. A focus was investment facilitation and sector-specific liberalization
(e.g. in infrastructure and services). New investment restrictions related mostly to national security concerns and
strategic industries (such as transport, energy and defence).
Measures geared towards investment in sectors important for sustainable development are still relatively few.
Only 8 per cent of measures between 2010 and 2014 were specifically targeted at private sector participation
in key sustainable development sectors (infrastructure, health, education, climate-change mitigation). In light
of the SDG investment gap (WIR14), greater focus on channeling investment into key sectors for sustainable
development would be warranted.
Countries and regions continue their search for reform of the international investment agreements (IIAs) regime.
Thirty-one new IIAs were concluded in 2014, most with provisions related to sustainable development. Canada
was the most active country (with seven new treaties). The IIA universe grew to 3,271 treaties. At the same time,
countries and regions considered new approaches to investment policymaking. Reacting to the growing unease
with the current functioning of the global IIA regime, together with today’s sustainable development imperative
and the evolution of the investment landscape, at least 50 countries and regions were engaged in reviewing and
revising their IIA models. Brazil, India, Norway and the European Union (EU) published novel approaches. South
Africa and Indonesia continued their treaty terminations, while formulating new IIA strategies.
Pre-establishment commitments are included in a relatively small but growing number of IIAs. Some 228 treaties
now provide national treatment for the “acquisition” or “establishment” of investments. Most involve the United
States, Canada, Finland, Japan, and the EU, but a few developing countries (Chile, Costa Rica, the Republic of
Korea, Peru and Singapore) also follow this path.
There were 42 new investor-State dispute settlement (ISDS) cases in 2014, bringing the total number of known
treaty-based claims to 608. Developing countries continue to bear the brunt of these claims, but the share of
developed countries is on the rise. Most claimants come from developed countries. Forty-three decisions were
rendered in 2014, bringing the overall number of concluded cases to 405. Of these, States won 36 per cent,
investors 27 per cent. The remainder was either settled or discontinued.
REFORMING THE INTERNATIONAL INVESTMENT REGIME: AN ACTION MENU
There is a pressing need for systematic reform of the global IIA regime. As is evident from the heated public
debate and parliamentary hearing processes in many countries and regions, a shared view is emerging on the
need for reform of the IIA regime to ensure that it works for all stakeholders. The question is not about whether
or not to reform, but about the what, how and extent of such reform. This report offers an action menu for such
reform.
IIA reform can build on lessons learned from 60 years of IIA rule making: (i) IIAs “bite” and may have unforeseen risks,
and safeguards need to be put in place; (ii) IIAs have limitations as an investment promotion tool, but also underused
potential; and (iii) IIAs have wider implications for policy and systemic coherence, as well as capacity-building.
IIA reform should address five main challenges. IIA reform should aim at (i) safeguarding the right to regulate
in the public interest so as to ensure that IIAs’ limits on the sovereignty of States do not unduly constrain
public policymaking; (ii) reforming investment dispute settlement to address the legitimacy crisis of the current

World Investment Report 2015: Reforming International Investment Governancexii
system; (iii) promoting and facilitating investment by effectively expanding this dimension in IIAs; (iv) ensuring
responsible investment to maximize the positive impact of foreign investment and minimize its potential negative effects; and (v) enhancing the systemic consistency of the IIA regime so as to overcome the gaps, overlaps and inconsistencies of the current system and establish coherence in investment relationships.
UNCTAD presents policy options for meeting these challenges. This report sets out options for addressing the standard elements found in an IIA. Some of these reform options can be combined and tailored to meet several reform objectives:
• Safeguarding the right to regulate: Options include clarifying or circumscribing provisions such as most-favoured-nation (MFN) treatment, fair and equitable treatment (FET), and indirect expropriation, as well as including exceptions, e.g. for public policies or national security.
• Reforming investment dispute settlement: Options include (i) reforming the existing mechanism of ad hoc arbitration for ISDS while keeping its basic structure and (ii) replacing existing ISDS arbitration systems. The former can be done by fixing the existing mechanism (e.g. improving the arbitral process, limiting investors’ access, using filters, introducing local litigation requirements) and by adding new elements (e.g. building in effective alternative dispute resolution or introducing an appeals facility). Should countries wish to replace the current ISDS system, they can do so by creating a standing international investment court, or by relying on State-State and/or domestic dispute resolution.
• Promoting and facilitating investment: Options include adding inward and outward investment promotion provisions (i.e. host- and home-country measures), and joint and regional investment promotion provisions, including an ombudsperson for investment facilitation.
• Ensuring responsible investment: Options include adding not lowering of standards clauses and establishing provisions on investor responsibilities, such as clauses on compliance with domestic laws and on corporate social responsibility.
• Enhancing systemic consistency of the IIA regime: Options include improving the coherence of the IIA regime, consolidating and streamlining the IIA network, managing the interaction between IIAs and other bodies of international law, and linking IIA reform to the domestic policy agenda.
When implementing IIA reform, policymakers have to determine the most effective means to safeguard the right to regulate while providing for the protection and facilitation of investment. In so doing, they need to consider the compound effect of options. Some combinations of reform options may “overshoot” and result in a treaty that is largely deprived of its traditional investment protection rationale.
In terms of process, IIA reform actions should be synchronized at the national, bilateral, regional and multilateral
levels. In each case, the reform process includes (i) taking stock and identifying the problems, (ii) developing a strategic approach and an action plan for reform, and (iii) implementing actions and achieving the outcomes.
All of this should be guided by the goal of harnessing IIAs for sustainable and inclusive development, focusing on the key reform areas and following a multilevel, systematic and inclusive approach. In the absence of a multilateral system, given the huge number of existing IIAs, the best way to make the IIA regime work for sustainable development is to collectively reform the regime with a global support structure. Such a structure can provide the necessary backstopping for IIA reform, through policy analysis, coordination among various processes at different levels and dimensions, management of the interaction with other bodies of law, technical assistance and consensus-building. UNCTAD plays a key role in this regard. Only a common approach will deliver an IIA regime in which stability, clarity and predictability help achieve the objectives of all stakeholders: effectively harnessing international investment relations for the pursuit of sustainable development.

KEY MESSAGES xiii
INTERNATIONAL TAX AND INVESTMENT POLICY COHERENCE
Intense debate and concrete policy work is ongoing in the international community on the fiscal contribution of MNEs. The focus is predominantly on tax avoidance – notably in the G20 project on base erosion and profit shifting (BEPS). At the same time, sustained investment is needed in global economic growth and development, especially in light of financing needs for the Sustainable Development Goals (SDGs). The policy imperative is to
take action against tax avoidance to support domestic resource mobilization and continue to facilitate productive
investment for sustainable development.
UNCTAD estimates the contribution of MNE foreign affiliates to government budgets in developing countries at
approximately $730 billion annually. This represents, on average, some 23 per cent of total corporate contributions and 10 per cent of total government revenues. The relative size (and composition) of this contribution varies by country and region. It is higher in developing countries than in developed countries, underlining the exposure and dependence of developing countries on corporate contributions. (On average, the government budgets of African countries depend on foreign corporate payments for 14 per cent of their funding.)
Furthermore, the lower a country is on the development ladder, the greater is its dependence on non-tax revenue streams contributed by firms. In developing countries, foreign affiliates, on average, contribute more than
twice as much to government revenues through royalties on natural resources, tariffs, payroll taxes and social
contributions, and other types of taxes and levies, than through corporate income taxes.
MNEs build their corporate structures through cross-border investment. They do so in the most tax-efficient manner possible, within the constraints of their business and operational needs. The size and direction of FDI
flows are thus often influenced by MNE tax considerations, because the structure and modality of investments
enable opportunities to avoid tax on subsequent investment income.
An investment perspective on tax avoidance puts the spotlight on the role of offshore investment hubs (tax havens and special purpose entities in other countries) as major players in global investment. Some 30 per cent
of cross-border corporate investment stocks have been routed through offshore hubs before reaching their
destination as productive assets. (UNCTAD’s FDI database removes the associated double-counting effect.)
The outsized role of offshore hubs in global corporate investments is largely due to tax planning, although other
factors can play a supporting role. MNEs employ a range of tax avoidance levers, enabled by tax rate differentials between jurisdictions, legislative mismatches, and tax treaties. MNE tax planning involves complex multilayered corporate structures. Two archetypal categories stand out: (i) intangibles-based transfer pricing schemes and (ii) financing schemes. Both schemes, which are representative of a relevant part of tax avoidance practices, make use of investment structures involving entities in offshore investment hubs – financing schemes especially rely on direct investment links through hubs.
Tax avoidance practices by MNEs are a global issue relevant to all countries: the exposure to investments from
offshore hubs is broadly similar for developing and developed countries. However, profit shifting out of developing countries can have a significant negative impact on their prospects for sustainable development. Developing countries are often less equipped to deal with highly complex tax avoidance practices because of resource constraints or lack of technical expertise.
Tax avoidance practices are responsible for a significant leakage of development financing resources. An
estimated $100 billion of annual tax revenue losses for developing countries is related to inward investment
stocks directly linked to offshore hubs. There is a clear relationship between the share of offshore-hub investment in host countries’ inward FDI stock and the reported (taxable) rate of return on FDI. The more investment is routed through offshore hubs, the less taxable profits accrue. On average, across developing economies, every 10 percentage points of offshore investment is associated with a 1 percentage point lower rate of return. These averages disguise country-specific impacts.
World Investment Report 2015: Reforming International Investment Governancexiv
Tax avoidance practices by MNEs lead to a substantial loss of government revenue in developing countries. The basic issues of fairness in the distribution of tax revenues between jurisdictions that this implies must be addressed. At a particular disadvantage are countries with limited tax collection capabilities, greater reliance on
tax revenues from corporate investors, and growing exposure to offshore investments.
Therefore, action must be taken to tackle tax avoidance, carefully considering the effects on international
investment. Currently, offshore investment hubs play a systemic role in international investment flows: they are part of the global FDI financing infrastructure. Any measures at the international level that might affect the investment facilitation function of these hubs, or key investment facilitation levers (such as tax treaties), must include an investment policy perspective.
Ongoing anti-avoidance discussions in the international community pay limited attention to investment policy. The role of investment in building the corporate structures that enable tax avoidance is fundamental. Therefore, investment policy should form an integral part of any solution to tax avoidance.
A set of guidelines for coherent international tax and investment policies may help realize the synergies between investment policy and initiatives to counter tax avoidance. Key objectives include removing aggressive tax planning opportunities as investment promotion levers; considering the potential impact on investment of anti-avoidance measures; taking a partnership approach in recognition of shared responsibilities between host, home and conduit countries; managing the interaction between international investment and tax agreements; and strengthening the role of both investment and fiscal revenues in sustainable development as well as the capabilities of developing countries to address tax avoidance issues.
WIR14 showed the massive worldwide financing needs for sustainable development and the important role that FDI can play in bridging the investment gap, especially in developing countries. In this light, strengthening the global investment policy environment, including both the IIA and the international tax regimes, must be a priority. The two regimes, each made up of a “spaghetti bowl” of over 3,000 bilateral agreements, are interrelated, and they face similar challenges. And both are the object of reform efforts. Even though each regime has its own specific reform priorities, there is merit in considering a joint agenda. This could aim for more inclusiveness, better governance and greater coherence to manage the interaction between international tax and investment policies, not only avoiding conflict between the regimes but also making them mutually supportive. The international investment and development community should, and can, eventually build a common framework for global investment cooperation for the benefit of all.

GlobalInvestment TrendsC H A P T E R I

World Investment Report 2015: Reforming International Investment Governance2
A. CURRENT TRENDS
Global foreign direct investment (FDI) inflows fell by 16 per cent in 2014 to $1.23 trillion, down from $1.47 trillion in 2013.1 The decline in FDI flows was influenced mainly by the fragility of the global economy, policy uncertainty for investors and elevated geopolitical risks. New investments were also offset by some large divestments. The decline in FDI flows was in contrast to growth in GDP, trade, gross fixed capital formation and employment (table I.1).
UNCTAD forecasts an upturn in FDI flows to $1.4 trillion in 2015 and beyond ($1.5 trillion in 2016 and $1.7 trillion in 2017) due to growth prospects in the United States, the demand-stimulating effects of lower oil prices and accommodating monetary policy, and continued investment liberalization and promotion measures. Forecasts for macroeconomic fundamentals and continued high levels of profitability and cash reserves among multinational enterprises (MNEs) support the expectation of higher FDI flows. However, a number of economic and political risks, including ongoing uncertainties in the Eurozone, potential spillovers from geopolitical tensions, and persistent vulnerabilities in emerging economies, may disrupt the projected recovery.
1. FDI by geography
a. FDI inflows
The global FDI decline masks regional variations. While developed countries and economies in transition saw a significant decrease, inflows to developing economies remained at historically high levels.
Variable 2008 2009 2010 2011 2012 2013 2014 2015a 2016a
GDP 1.5 -2.0 4.1 2.9 2.4 2.5 2.6 2.8 3.1Trade 3.0 -10.6 12.6 6.8 2.8 3.5 3.4 3.7 4.7GFCF 3.0 -3.5 5.7 5.5 3.9 3.2 2.9 3.0 4.7Employment 1.2 1.1 1.2 1.4 1.4 1.4 1.3 1.3 1.2FDI -20.4 -20.4 11.9 17.7 -10.3 4.6 -16.3 11.4 8.4
MemorandumFDI value (in $ trillions) 1.49 1.19 1.33 1.56 1.40 1.47 1.23 1.37 1.48
Source: UNCTAD, FDI/MNE database for FDI in 2008–2014; United Nations (2015) for GDP; IMF (2015) for GFCF and trade; ILO for employment; and UNCTAD estimates for FDI in 2015–2016.
a Projections.Note: FDI excludes Caribbean offshore financial centres. GFCF = gross fixed capital formation.
Table I.1. Growth rates of global GDP, GFCF, trade, employment and FDI, 2008–2016 (Per cent)
FDI flows to the latter now account for 55 per cent of the global total (figure I.1). Developing Asia drove the increase while flows to Latin America declined and those to Africa remained flat.
FDI flows to developed countries dropped by 28 per cent to $499 billion. Inflows to the United States fell to $92 billion (40 per cent of their 2013 level), mainly due to Vodafone’s divestment of Verizon, without which flows into the United States would have remained stable. FDI flows to Europe also fell by 11 per cent to $289 billion. Among European economies, inflows decreased in Ireland, Belgium, France and Spain while they increased in the United Kingdom, Switzerland and Finland.
Source: UNCTAD, FDI/MNE database (www.unctad.org/fdistatistics).
Figure I.1.FDI in�ows, global and by group of economies, 1995−2014 (Billions of dollars)
55%
0
500
1 000
1 500
2 000
1995 2000 2005 2010 2014
Developing economies
Transition economies
Developed economies
World total

CHAPTER I Global Investment Trends 3
In 2014, many countries adopted new guidelines for the compilation of FDI data, on the basis of the sixth edition of the International Monetary Fund’s Balance of Payments and International Investment Position Manual (BPM6) and the fourth edition of the Organization for Economic Cooperation and Development’s Benchmark Definition of Foreign Direct Investment (BD4). Two important aspects should be kept in mind in interpreting FDI statistics in this Report.
1. FDI statistics on an asset/liability basis vs the directional basis. On an asset/liability basis, direct investment statistics are organized according to whether the investment relates to an asset or a liability for the reporting country. On a directional basis, the direct investment flows and positions are organized according to the direction of the investment for the reporting economy − either inward or outward. The two presentations differ in their treatment of reverse investment (e.g. when an affiliate provides a loan to its parent).
Although presentation on an asset/liability basis is appropriate for macroeconomic analysis (i.e. the impact on the balance of payments), the directional basis is more useful in formulating investment policies because they capture the source or destination countries of direct investment and access to specific markets by direct investors. UNCTAD will continue to report FDI data on the basis of the directional principle.
2. Indirect or transit investment flows. BD4 recommends that countries compile FDI statistics in two ways, both including and excluding resident SPEs.2 This recommendation provides a more meaningful measure of the FDI of an economy by removing FDI that involves funds passing through an SPE on their way to another destination (outward FDI) and those coming to the country through another economy’s SPE (inward FDI). To avoid double counting, UNCTAD removes SPE flows from its statistics where possible. For similar reasons, FDI flows through offshore financial centres are excluded from analyses where possible.
Source: UNCTAD.Note: Full details on methodological changes in UNCTAD’s FDI data series are available online.
Methodological changes in FDI data compilation
Inflows to transition economies declined by 52 per cent to $48 billion, as regional conflict and sanctions deterred new foreign investors. FDI flows to the Russian Federation fell by 70 per cent to $21 billion, in part an adjustment from the level reached in 2013 as a result of the Rosneft-BP mega-transaction (see WIR14).
FDI flows to developing economies increased by 2 per cent to a historically high level in 2014, reaching $681 billion. Developing Asia drove the increase while flows to Latin America and the Caribbean declined and those to Africa remained flat (figure I.2). FDI flows to Asia grew by 9 per cent to $465 billion in 2014. East Asia, South-East Asia and South Asia all saw increased inflows. FDI in China amounted to $129 billion, up 4 per cent from 2013, mainly because of an increase in FDI in the services sector. FDI inflows also rose in Hong Kong (China) and Singapore. India experienced a significant increase of 22 per cent to $34 billion. However, FDI flows to West Asia continued their downward trend in 2014 for the sixth consecutive year, decreasing by 4 per cent to $43 billion, owing to the security situation in the region.
FDI flows to Latin America and the Caribbean – excluding the Caribbean offshore financial centres –
decreased by 14 per cent to $159 billion in 2014, after
four years of consecutive increases. This decrease
was mainly the consequence of a 72 per cent decline
in cross-border mergers and acquisitions (M&As)
in Central America and the Caribbean, and of lower
commodity prices, which reduced investment in the
extractive industries in South America. While FDI
flows to Mexico, the Bolivarian Republic of Venezuela,
Argentina, Colombia and Peru declined, flows to Chile
increased, owing to high levels of cross-border M&A
sales. In Brazil, the sharp fall of FDI in the primary
sector was compensated by an increase in FDI in
manufacturing and services, keeping total flows similar
to 2013 levels.
Inflows to Africa remained stable at $54 billion. North
Africa saw its FDI flows decline by 15 per cent to $12
billion, while flows to Sub-Saharan Africa increase by 5
per cent to $42 billion. In Sub-Saharan Africa, FDI flows
to West Africa declined by 10 per cent to $13 billion,
as Ebola, regional conflicts and falling commodity
prices negatively affected several countries. Flows to
Southern Africa also fell by 2 per cent to $11 billion. By
contrast, Central Africa and East Africa saw their FDI
flows increase by 33 per cent and 11 per cent, to $12
billion and $7 billion, respectively.

World Investment Report 2015: Reforming International Investment Governance4
Structurally weak, vulnerable and small economies
witnessed divergent trends in FDI flows in 2014. FDI
to least developed countries (LDCs) increased by 4
per cent to $23 billion, led by greenfield investment
projects. Landlocked developing countries (LLDCs)
experienced a fall of 3 per cent in FDI inflows to $29
billion, mainly in Asia and Latin America. FDI inflows
to small island developing States (SIDS) increased by
22 per cent to $7 billion, boosted by a strong rise in
cross-border M&As sales.
Overall, China became the largest FDI recipient in
the world in 2014 (figure I.3), while the United States
dropped to the third largest host country, primarily
because of the large Verizon divestment by Vodafone
(United Kingdom). Of the top 10 FDI recipients in the
world, five are developing economies.
Most major regional groupings and groups of
economies engaged in regional integration
initiatives experienced a fall in inflows in 2014.
The global and regional declines in FDI inflows in 2014
affected the performance of FDI to regional groupings
and initiatives. The groups of countries discussing
the Transatlantic Trade and Investment Partnership
(TTIP) and the Trans-Pacific Partnership (TPP), saw
their combined share in global FDI flows decline. Two
Asian groups bucked the trend – the Association of
Southeast Asian Nations (ASEAN), with a 5 per cent
increase in inflows, and the Regional Comprehensive
Economic Partnership (RCEP), with a 4 per cent
increase (figure I.4).
Source: UNCTAD, FDI/MNE database (www.unctad.org/fdistatistics).
FDI trends in regional groups were largely determined
by wider global trends, economic performance
and geopolitical factors. Longer-term cooperation
efforts will, for the most part, lead to increased FDI
in regional groups, by opening sectors to investment
and aligning policies for the treatment of investors.
Intraregional FDI may increase as a result of fewer
investment restrictions (e.g. liberalizing investment
in particular industries) or reduced transaction costs
and converging policy regimes. Extraregional FDI
(i.e. inflows by investors from outside a region) may
increase as a result of enlarged market size (especially
important for regional groups of smaller economies).
Investment from outside a region may also increase
as a result of coordinated efforts to promote regional
investment.
The impact of regional integration on intraregional
and extraregional FDI varies considerably by region.
The share of intraregional FDI among some regional
groupings of developing economies in total inward
FDI is still very low.3 In contrast, regional integration
in Asia, e.g. through ASEAN, has had a significant
impact on FDI. FDI inflows into the APEC economies
reached $652 billion in 2014, accounting for more
than half of global FDI flows. Intra-APEC FDI flows and
stocks are significant, at about 40 per cent of inward
stock in 2009–2011.
b. FDI outflows
Investment by MNEs from developing and transition economies continued to grow.
Figure I.2. FDI in�ows, by region, 2012–2014 (Billions of dollars)
2012 2013 2014
Transition economies
401 401
178209
8556
428
326
186
301
100
54
465
289
159 146
48 54
Developing Asia Europe Latin America andthe Caribbean
North America Africa

CHAPTER I Global Investment Trends 5
FDI in�ows: top 20 host economies, 2013 and 2014(Billions of dollars)
Figure I.3.
Developed economies
Developing and transition economies
2013 2014
2013 2014
(x) = 2013 ranking
Poland (148)
France (11)
Colombia (22)
Finland (185)
Russian Federation (5)
Switzerland (187)
Indonesia (19)
Mexico (10)
Spain (12)
Chile (21)
Netherlands (14)
India (15)
Australia (8)
Canada (4)
Brazil (7)
Singapore (6)
United Kingdom (9)
United States (1)
Hong Kong, China (3)
China (2)
65
0
43
16
-5
69
-23
19
45
42
17
32
28
54
71
64
48
74
124
14
15
16
19
21
22
23
23
23
23
30
34
52
54
62
68
72
92231
103
129
Source: UNCTAD, FDI/MNE database (www.unctad.org/fdistatistics).Note: Excludes Caribbean offshore financial centres.
Developing Asia became the world’s largest investor region. In 2014, MNEs from developing economies alone invested $468 billion abroad, a 23 per cent increase from the previous year. Their share in global FDI reached a record 35 per cent, up from 13 per cent in 2007 (figure I.5).
Developing-country MNEs have expanded foreign
operations through greenfield investments as well as
cross-border M&As.
More than half of FDI outflows by developing-economy
MNEs were in equity, while developed-country MNEs
continued to rely on reinvested earnings, the share
of which increased to a record 81 per cent of their
FDI outflows (figure I.6). Equity-financed flows are
more likely to result in new investments and capital
expenditures than are reinvested earnings, which may
translate into further accumulation of cash reserves in
foreign affiliates.
Among developing economies, MNEs from Asia
increased their investment abroad, while outflows
from Latin America and the Caribbean, and Africa fell.
For the first time, MNEs from developing Asia became
the world’s largest investing group, accounting for
almost one third of the total (figure I.7). Nine of the 20
largest home economies were developing or transition
economies, namely Hong Kong (China), China, the
Russian Federation, Singapore, the Republic of Korea,
Malaysia, Kuwait, Chile and Taiwan Province of China
(figure I.8).
Outward investments by MNEs based in developing
Asia increased by 29 per cent to $432 billion in
2014. The growth was widespread, including all the
major Asian economies and subregions. In East Asia,
investment by MNEs from Hong Kong (China) jumped
to a historic high of $143 billion, making the economy
the second largest investor after the United States. The
remarkable growth was mainly due to booming cross-
border M&A activity. Investment by Chinese MNEs
grew faster than inflows into the country, reaching
a new high of $116 billion. In South-East Asia, the
increase was principally the result of growing outflows
from Singapore, to $41 billion in 2014. In South Asia,
FDI outflows from India reversed the slide of 2013,
increasing fivefold to $10 billion in 2014, as large
Indian MNEs resumed their international expansion.
Investments by West Asian MNEs declined by 6 per
cent in 2014, owing to decreased flows from Kuwait,
the region’s largest overseas investor, with flows of $13
billion. Investments by Turkish MNEs almost doubled
to $7 billion.
MNEs from Latin America and the Caribbean,
excluding offshore financial centres, decreased their
investment in 2014 by 18 per cent to $23 billion.

World Investment Report 2015: Reforming International Investment Governance6
53
52
30
28
28
21
14
11
673
133
169
252
345
350
363
635
65257
61
24
38
35
20
24
9
683
126
346
294
517
564
349
894
837
Figure I.4. FDI in�ows to selected regional and interregional groups, 2013 and 2014(Billions of dollars and per cent)
Share in world (%)Regional/
interregional groups
2013
FDI in�ows (Billions of dollars) Share in world (%)
2014
FDI in�ows (Billions of dollars)
APEC
G20
RCEP
TTIP
TPP
BRICS
NAFTA
ASEAN
MERCOSUR
Source: UNCTAD, FDI/MNE database (www.unctad.org/fdistatistics).Note: Ranked in descending order of 2014 FDI flows. G20 = only the 19 member countries of the G20 (excludes the European Union); APEC = Asia-Pacific
Economic Cooperation; TTIP = Transatlantic Trade and Investment Partnership; TPP = Trans-Pacific Partnership; RCEP = Regional Comprehensive Economic Partnership; BRICS = Brazil, Russian Federation, India, China and South Africa; NAFTA = North American Free Trade Agreement; ASEAN = Association of Southeast Asian Nations; MERCOSUR = Common Market of the South.
Figure I.5.
Developing economies: FDI out�ows and their share in total world out�ows, 2000−2014 (Billions of dollars and per cent)
5
10
15
20
25
30
35
40
0
100
200
300
400
500
600
2000 2002 2004 2006 2008 2010 2012 2014
ShareValue Developing economies
Share in world FDI out�ows
Source: UNCTAD, FDI/MNE database (www.unctad.org/fdistatistics).Note: Excludes Caribbean offshore financial centres.
Outward flows from Mexican and Colombian MNEs fell
by almost half to $5 billion and $4 billion, respectively.
In contrast, investment by Chilean MNEs − the region’s
main direct investors abroad for the year − increased by
71 per cent to $13 billion, boosted by a strong increase
in intracompany loans. Brazilian MNEs continued to
receive repayments of loans or to borrow from their
foreign affiliates, resulting in negative FDI outflows from
that country for the fourth consecutive year.
Outward investments by MNEs in Africa decreased by
18 per cent in 2014 to $13 billion. South African MNEs
invested in telecommunications, mining and retail,
while those from Nigeria focused largely on financial
services. These two largest investors from Africa
increased their investments abroad in 2014. Intra-
African investments rose significantly during the year.
MNEs from transition economies decreased their
investments abroad by 31 per cent to $63 billion.
Natural-resource-based MNEs, mainly from the
Russian Federation, reduced investments in response
to constraints in international financial markets, low
commodity prices and the depreciation of the rouble.
Investments from MNEs based in developed economies
were almost steady at $823 billion at the aggregate level,
but this figure hides a large number of new investments
and divestments that cancelled each other out.
Outflows from European MNEs remained flat. A robust
rise in investments by German and French MNEs

CHAPTER I Global Investment Trends 7
Equity out�ows Reinvested earnings Other capital (intracompany loans)
Figure I.6. FDI out�ows by component, by group of economies, 2007−2014(Per cent)
Developed-economya MNEs Developing-economyb MNEs
54
27
20
50
31
20
66
40
-6
54
45
2 46
45
49
40
44
16
47
49
55
35
10
53 51 45 41 40 3417 10
3423
50 59 51 6274 81
1227
5 1 8 410 10
0
25
50
75
100
2007 2008 2009 2010 2011 2012 2013 20140
25
50
75
100
2007 2008 2009 2010 2011 2012 2013 2014
Source: UNCTAD, FDI/MNE database (www.unctad.org/fdistatistics). a Economies included are Australia, Belgium, Bulgaria, Canada, Croatia, Cyprus, the Czech Republic, Denmark, Estonia, Finland, Germany, Greece, Hungary, Iceland,
Ireland, Israel, Latvia, Lithuania, Luxembourg, Malta, the Netherlands, Norway, Portugal, Slovakia, Slovenia, Spain, Sweden, Switzerland, the United Kingdom and the United States.
b Economies included are Algeria, Anguilla, Antigua and Barbuda, Aruba, the Bahamas, Bahrain, Bangladesh, Barbados, Belize, the Plurinational State of Bolivia, Botswana, Brazil, Cambodia, Cabo Verde, Chile, Costa Rica, Curaçao, Dominica, El Salvador, Fiji, Grenada, Guatemala, Honduras, Hong Kong (China), India, Indonesia, the Republic of Korea, Kuwait, Lesotho, Malawi, Mexico, Mongolia, Montserrat, Morocco, Namibia, Nicaragua, Nigeria, Pakistan, Panama, the Philippines, Saint Kitts and Nevis, Saint Lucia, Saint Vincent and the Grenadines, Samoa, Sao Tome and Principe, Seychelles, Singapore, Sint Maarten, South Africa, Sri Lanka, the State of Palestine, Suriname, Swaziland, Taiwan Province of China, Thailand, Trinidad and Tobago, Turkey, Uganda, Uruguay, the Bolivarian Republic of Venezuela and Viet Nam.
Source: UNCTAD, FDI/MNE database (www.unctad.org/fdistatistics).Note: Excludes Caribbean offshore financial centres.
Figure I.7. FDI out�ows, by group of economies and region, 2012–2014(Billions of dollars)
2012 2013 2014
299
365 376
131
54 4412
335379
317
13891
28 16
432390
316
117
6323 13
Developing Asia North America Europe Other developedcountries
Transitioneconomies
Latin America andthe Caribbean
Africa
was offset by the negative flows from MNEs in the
United Kingdom and Luxembourg. Germany became
the largest investing country in Europe. Vodafone’s
divestment of its stake in Verizon Wireless heavily
dented outflows from the United Kingdom (down $45
billion to −$60 billion). Outflows from Luxembourg fell
sharply (down from $35 billion to −$4 billion), primarily
due to changes in intracompany loans.
In North America, active acquisitions of assets by
Canadian MNEs increased Canada’s outflows by 4 per
cent to $53 billion. FDI from the United States rose by 3
per cent to $337 billion. Investment in and divestment
from equity, and the withdrawal of intracompany
loans cancelled each other out, so that United States
outward investment in 2014 effectively consisted only
of reinvested earnings. FDI from Japan declined by
16 per cent, ending a three-year expansion. Although
Japanese MNEs’ investments into North America
remained stable, they declined sharply in major
recipient economies in Asia and Europe.

World Investment Report 2015: Reforming International Investment Governance8
c. Intensity index and South–South FDI
South–South FDI flows, including intraregional flows, have intensified in recent years. FDI from
developing economies has grown significantly over the
last decade and now constitutes over a third of global
flows. The largest outward investing economies include
Brazil, China, Hong Kong (China), India, the Republic
of Korea, Malaysia, Mexico, Singapore, South Africa
and Taiwan Province of China. FDI outward stock from
Source: UNCTAD, FDI/MNE database (www.unctad.org/fdistatistics).Note: Excludes Caribbean offshore financial centres.
14
8
17
14
10
21
31
28
26
24
29
57
25
51
87
30
136
101
81
13
13
13
16
17
19
23
31
31
32
41
41
43
53
56
112
114
116
143
FDI out�ows: top 20 home economies, 2013 and 2014 (Billions of dollars)
Figure I.8.
(x) = 2013 ranking
Developed economies
Developing and transition economies
2013 2014
2013 2014 Taiwan Province
of China (21)
Chile (29)
Kuwait (19)
Malaysia (22)
Switzerland (25)
Norway (17)
Italy (9)
Korea, Republic of (13)
Spain (14)
Ireland (16)
Singapore (12)
Netherlands (6)
France (15)
Canada (7)
Russian Federation (4)
Germany (10)
Japan (2)
China (3)
Hong Kong, China (5)
United States (1) 337328
developing economies to other developing economies,
excluding Caribbean offshore financial centres, grew by
two-thirds from $1.7 trillion in 2009 to $2.9 trillion in
2013. East Asia and South-East Asia were the largest
recipient developing regions by FDI stock in 2013
(figure I.9). The share of the poorest developing regions
in South-South FDI is still low, but it is growing.
Most developing-economy investment tends to occur
within each economy’s immediate geographic region.
Familiarity eases a company’s early internationalization
drive, and regional markets and value chains are a key
driver. The strong regional links of South African FDI are
a particular case in point, as shown by the country’s
high bilateral FDI intensities with neighbouring countries
(table I.2).
Beyond the familiarity of immediate regions, factors
determining the specific patterns of South-South FDI
include MNE investment motives, home government
policies and historical connections (WIR06). In terms of
motives, for example, MNEs from the Republic of Korea
investing for efficiency-seeking reasons especially target
East and South East Asia, whereas South Asia is also
a destination for those looking for markets. In a similar
vein, the geography of natural resources determines
FDI in extractive industries to a high degree; hence,
for instance, the high bilateral FDI intensities between
China and a number of African countries.
Home government policies can also strongly influence
patterns of FDI internationalization. The narrow
geographic dispersal of Singapore MNEs has been
influenced by the country’s strategic policy encouraging
enterprise internationalization into nearby Asian countries.
Finally historical connections, such as diaspora, also
affect the location of investments, which partly explains
the high FDI intensity between India and countries such
as Kenya, Gabon and the United Arab Emirates.
2. FDI by mode of entry
Significant momentum for cross-border M&As,
decline in greenfield FDI projects.4 After two
consecutive years of decline, M&A activity resumed
growth in 2014 (figure I.10). In net terms,5 the value
of cross-border M&As increased by 28 per cent
over 2013, reaching almost $400 billion. MNEs have
gradually regained the confidence to go back on the
acquisition trail.

CHAPTER I Global Investment Trends 9
Tabl
e I.
2.Re
lati
ve b
ilate
ral F
DI in
tens
ity
of s
elec
ted
maj
or d
evel
opin
g ho
me
econ
omie
s, 2
012
Hom
e ec
onom
y
Ch
ina
Repu
blic
of K
orea
Mal
aysi
aM
exic
o
Stro
ngre
latio
nshi
p
Bur
undi
43.
4M
adag
asca
r 2
3.6
Indo
nesi
a 1
3.4
Hon
dura
s 2
5.5
Lao
Peop
le’s
Dem
ocra
tic R
epub
lic 3
4.8
Cam
bodi
a 2
1.9
Cam
bodi
a 1
0.9
Gua
tem
ala
20.
4
Ango
la 2
8.8
Yem
en 1
6.5
Viet
Nam
7.3
El S
alva
dor
20.
2
Zim
babw
e 1
5.1
Mya
nmar
12.
7Si
ngap
ore
5.3
Ecua
dor
18.
6
Afgh
anis
tan
13.
8Vi
et N
am 1
1.2
Thai
land
4.7
Cos
ta R
ica
9.8
Tajik
ista
n 1
3.7
Phili
ppin
es 8
.7Ph
ilipp
ines
3.4
Nic
arag
ua 9
.7
Gui
nea-
Bis
sau
13.
1C
hina
6.9
Aust
ralia
2.3
Dom
inic
an R
epub
lic 7
.4
Cam
bodi
a 1
3.0
Solo
mon
Isla
nds
5.8
Taiw
an P
rovi
nce
of C
hina
2.1
Bra
zil
5.3
Con
go, D
emoc
ratic
Rep
ublic
of
12.
3La
o Pe
ople
’s D
emoc
ratic
Rep
ublic
5.7
Col
ombi
a 4
.9
Mya
nmar
11.
7
Hom
e ec
onom
y
Braz
ilIn
dia
Sing
apor
eSo
uth
Afric
a
Stro
ng
rela
tions
hip
Ango
la 5
1.5
Nep
al 1
77.6
Mal
aysi
a 1
0.1
Swaz
iland
101
.0
Aust
ria
29.
9Ti
mor
-Les
te 3
2.5
Indo
nesi
a 7
.1Zi
mba
bwe
71.
6
Uru
guay
15.
6B
huta
n 3
2.3
Phili
ppin
es 7
.0B
otsw
ana
64.
7
Luxe
mbo
urg
10.
2B
ahra
in 2
2.2
Taiw
an P
rovi
nce
of C
hina
4.6
Nam
ibia
64.
0
Para
guay
9.9
Sri L
anka
14.
7C
hina
4.2
Mal
awi
49.
2
Arge
ntin
a 5
.8U
nite
d Ar
ab E
mir
ates
7.9
Thai
land
4.0
Moz
ambi
que
32.
0
Peru
4.1
Sing
apor
e 5
.3La
o Pe
ople
’s D
emoc
ratic
Rep
ublic
3.1
Leso
tho
27.
8
Net
herl
ands
4.0
Gab
on 3
.5Au
stra
lia 2
.4G
hana
24.
1
Hun
gary
3.2
Ban
glad
esh
2.9
Indi
a 1
.8Ke
nya
22.
1
Vene
zuel
a, B
oliv
aria
n R
epub
lic o
f 2
.5Ke
nya
1.2
Viet
Nam
1.8
Luxe
mbo
urg
16.
0
Sour
ce:
UNC
TAD
, FD
I/MN
E da
taba
se (
ww
w.u
ncta
d.or
g/fd
ista
tistic
s).
Not
e:
Rank
ing
is b
ased
on
the
rela
tive
bila
tera
l FD
I int
ensi
ty r
atio
s fo
r 20
12. R
elat
ive
bila
tera
l FD
I int
ensi
ty is
the
sha
re o
f th
e ho
st e
cono
my
in t
he o
utw
ard
FDI s
tock
of
a gi
ven
inve
stor
cou
ntry
, div
ided
by
the
shar
e of
the
hos
t ec
onom
y in
w
orld
inw
ard
FDI s
tock
, i.e
. the
rel
ativ
e im
port
ance
of
the
host
eco
nom
y in
the
out
war
d st
ock
of t
he in
vest
or c
ount
ry c
ompa
red
to t
he im
port
ance
of
the
host
eco
nom
y in
glo
bal F
DI.
Host
eco
nom
ies
Host economiesHost economies

World Investment Report 2015: Reforming International Investment Governance10
43
4 45
13
14
9
7
Figure I.9. FDI stock by developing economies: major source economies and destination regions, 2013 (Per cent)
Major developing-economy sources of FDI Developing-economy FDI by major destination regions
Europe
North America
Latin Americaand the Caribbean
East Asia South-East Asia
Others
South Asia
West Asia (1)
Africa
28
15
14
13
7
6
53
333
Taiwan Province of China
Mexico
MalaysiaIndia
South Africa
Rep. of KoreaHong Kong,China
China
Singapore
Brazil
Others
Source: UNCTAD, FDI/MNE database (www.unctad.org/fdistatistics).
The value of cross-border M&As in developed economies
increased by 16 per cent and those in developing and
transition economies by 66 per cent.
Investors’ appetite for new greenfield investment
projects is less buoyant. After a first rebound in 2013, the
total value of announced greenfield investment declined
slightly by 2 per cent, remaining close to the $700 billion
level of 2013. In particular, in 2014 the value of greenfield
projects in developed and developing economies
was substantially unchanged compared with 2013
(annual growth rates of −1 per cent in both groupings),
while transition economies saw a considerable fall
(−13 per cent).
MNEs back on the acquisition trail. The gross value
of cross-border M&A deals increased in 2014 by 34 per
cent, hitting $900 billion, considerably above the recent
annual average ($775 billion during the period 2010–
2014). The acquisition wave involved both manufacturing
(up 77 per cent in the gross value of cross-border M&As)
and services (up 36 per cent). Although growth occurred
across all industries in the two sectors, the chemicals and
pharmaceutical industries and the telecommunications
industry were particularly active, as evidenced by some
large deals.
The return of large deals. The re-emergence of large
deals was one key factor in the increased cross-border
deal activity. The largest MNEs were more willing to use
their significant cash reserves to engage in large cross-
border operations. In 2014, the number of M&A deals
with values larger than $1 billion expanded, from 168
to 223 – the highest number since 2008. The average
value of these deals was almost $3.4 billion, compared
with $2.9 billion in 2013. Of the 223 largest deals, 173
took place in developed economies, with a value of $598
billion or some 77 per cent of the total value of large deals
($762 billion).
United States companies represented an attractive
target, absorbing more than one third of the largest
M&A acquisitions globally. European MNEs targeted the
United States market, in particular pharmaceutical firms
but also other industries. For example, Germany-based
Bayer purchased the consumer care business of Merck
for $14.2 billion, and Swiss Roche Holding acquired
Intermune for $8.3 billion. In January 2014, Italian
automaker Fiat completed its acquisition of Chrysler for
$3.65 billion, gaining full ownership.
Large M&A deals in Europe occurred predominantly
in the telecommunications industry. Of the five
largest acquisitions in Europe, three were in
telecommunications, and all were led by other
European MNEs. The largest deal was the acquisition
of SFR SA (France) by Altice SA (Luxembourg) for
$23 billion.
Divestments: the other side of MNEs’ cross-border M&A activity. MNEs resorted to strategic
transactions not only to expand but also to downsize
their international assets. The value of sales of MNEs’
stakes in foreign entities (divestments,6 including sales to
domestic firms or to other MNEs) reached a record high
in 2014, at $511 billion, a 56 per cent increase over 2013

CHAPTER I Global Investment Trends 11
(figure I.11) and the highest value since 2008. This value
was split almost equally in transactions between sales
to other MNEs (52 per cent) and transfers from MNEs to
domestic companies (48 per cent).
The wave of divestments reflects an increase in overall
cross-border M&A activity, rather than signalling ongoing
“de-internationalization” through M&As. In fact, the ratios
in figure I.11 show that the share of divestments (divested
deals) relative to acquisitions (gross M&A deals) is on par
with the recent historical average, after removing the
impact of the Vodafone divestment in Verizon.
Developing-economy MNEs continued “shopping” for developed-country MNE assets in developing economies. MNEs from developing and transition
economies are consolidating their role as investors in
cross-border M&A operations. The share of these MNEs
in the total (net) value of cross-border M&As rose from
about 10 per cent in 2003 to almost 40 per cent in 2012
and has remained stable since then.
The bulk of acquisitions by MNEs from developing
economies (about 70 per cent) are in other developing
economies (including intraregional transactions). A
sizable share (about 50 per cent) of their M&A activity
in developing economies represents the acquisition of
assets from developed-economy MNEs (WIR14). In
2014, MNEs continued to acquire firms and other assets
owned by developed-country MNEs in host developing
economies. For example, MMG South America
Management Co Ltd (Hong Kong, China) acquired Xstrata
Peru − a foreign affiliate of Glencore/Xstrata (Switzerland)
Figure I.10. Value of cross-border M&As and announced green�eld projects, 2003−2014 (Billions of dollars)
707 696
313399
28%
-2%
0
200
400
600
800
1 000
1 200
1 400
2003 2004 2005 2006 2007 2008 2009 2010 2011 2012 2013 2014
Value of announced FDI green�eld projects
Net value of cross-border M&As
Source: UNCTAD, cross-border M&A database for M&As (www.unctad.org/fdistatistics); Financial Times Ltd, fDi Markets (www.fDimarkets.com) for greenfield projects.
− for $7 billion, and Emirates Telecommunications Corp
(United Arab Emirates) bought a 53 per cent stake of
Itissalat Al Maghrib SA − a foreign affiliate of Vivendi
(France) – for $5.7 billion.
MNEs from developing economies are becoming more
active directly in developed economies as well. In 2014,
some 32 per cent of M&A acquisitions by these MNEs
targeted developed economies, more than in 2013 (at 28
per cent); in the first three months of 2015, acquisitions
by these MNEs in developed economies rose to 47 per
cent of their total M&A purchases. A number of sizable
deals involved MNEs from China, Hong Kong (China)
and Singapore, targeting companies in the United States
and the United Kingdom in particular. For example GIC,
Singapore’s sovereign wealth fund, acquired IndCor
Properties (United States) for $8.1 billion.
In greenfield projects, developing economies dominate. At the global level, announced greenfield FDI
projects declined slightly in 2014. This decline is similar in
both developed and developing economies (figure I.12).
Greenfield projects in developing economies increased
in 2013 and remained high in 2014, while the trend in
developed economies remained stable.
A similar trend is observable on the investor side. Over
the last 10 years, the announced value of greenfield
projects from developed-economy MNEs has been
essentially flat, with a compound annual growth
rate (CAGR) of −1 per cent, while the same value
for developing economies has increased steadily
despite the financial crisis (at a CAGR of 5 per cent).

World Investment Report 2015: Reforming International Investment Governance12
As a consequence, developing economies have gained 10 percentage points in the global value of announced greenfield FDI projects, from 20 per cent in 2005 to 30 per cent in 2014.
3. FDI by sector and industry
FDI stock data by sector highlight the prominent role of services in global FDI. In 2012, the latest year for which sectoral data are available, services
accounted for 63 per cent of global FDI stock, more than twice the share of manufacturing, at 26 per cent. The primary sector contributed less than 10 per cent to global FDI stock (figure I.13).
The importance of services in the international invest-ment landscape is the result of a long-term structural trend. In the period 2001−2012, the share of services in global FDI increased by 5 per cent (to 63 per cent), offset by a comparable decrease in the share of manufacturing. Overall, since 1990, the share of services in world FDI stock has gained 14 percentage points (from 49 per cent to 63 per cent) with a corresponding decrease in manufacturing (from 41 per cent to 26 per cent), while the share of the primary sector has been stable (at about 7 per cent). The ongoing shift in the sectoral composition of FDI from manufacturing to services
Figure I.11. Divested M&A deals, value, 2005−2014 (Billions of dollars)
(381)
2005
276
2006
359
2007
519
2008
539
2009
245
2010
307
2011
403
2012
351
2013
324
2014
511
0.34 0.36 0.33 0.46 0.46 0.47 0.42 0.51 0.48 0.56 (0.42)
(x) w/o Vodafone divestment
Value of divested deals / value of acquisitions
Sales to domestic �rmsSales to other MNEs
Source: UNCTAD, cross-border M&A database (www.unctad.org/fdistatistics).
Figure I.12.
Value of announced green�eld FDI projects, by sector and economic grouping, 2012−2014 (Billions of dollars)
2012
237
2013
226
2014
222
Developed economies
Primary
Manufacturing
Services
Developing economies
-1%
-1%
2012
356
2013
452
2014
448
Source: UNCTAD, information from the Financial Times Ltd, fDi Markets (www.fDimarkets.com).

CHAPTER I Global Investment Trends 13
reflects an analogous trend in the distribution of global GDP, but it is also the result of increasing liberalization in the sector, enabling large FDI inflows, particularly in industries traditionally closed to foreign investment such as finance and telecommunications. This shift has occurred in both developed and developing economies. Among developing regions, Asia and Oceania has been the growth engine for services FDI, with services stock in the region increasing from about $800 billion in 2001 to $3.5 trillion in 2012, corresponding to roughly 80 per cent of the total growth of services FDI in the developing economies. This sector is also the largest in Africa (chapter II.A.1). Between developing regions, pronounced differences emerge in terms of industry distribution.
Recent trends in FDI by sector and industry. The most recent data on announced greenfield FDI projects and cross-border M&As reveal various sectoral trends (figure I.14). Globally in 2014, the primary sector recorded high growth in the value of greenfield projects (up 42 per cent from 2013), in the face of a decrease in the value of cross-border M&As (−2 per cent). The pattern ran the other way in the services sector, with a decrease in the value of greenfield projects (−15 per cent) and a strong increase in cross-border M&As (37 per cent). In manufacturing, the picture is consistent across the two modes of entry, with an increase of 14 per cent in greenfield projects and 25 per cent in cross-border M&As.
FDI in the primary sector is driven mostly by the extractive industry in developing economies. In 2014,
the value of greenfield FDI projects in mining, quarrying
and petroleum in developing economies increased 60 per cent, from $25 billion to $40 billion. The bulk of the growth took place in Africa, where the total value of greenfield projects increased almost six-fold (from $4 billion to $22 billion). The increase in cross-border M&As in the extractive industry in developing economies, in contrast, was moderate, from −$2 billion in 2013 to $3 billion in 2014.
Manufacturing greenfield FDI projects rose from $275 billion in 2013 to $312 billion in 2014 (14 per cent). The fastest-growing industries were coke, petroleum products and nuclear fuels (60 per cent), machinery and equipment (29 per cent), and motor vehicles and other transports (32 per cent).
Unlike in developing economies (18 per cent), the value of greenfield FDI projects in developed economies was stable, levelling off for a third consecutive year between $90 billion and $100 billion, with no major trends discernible in individual manufacturing industries.
Source: UNCTAD FDI/MNE database (www.unctad.org/fdistatistics).
41 40116
146155
213
30 42
275312
403341
Figure I.14. FDI projects, by sector, 2013−2014 (Billions of dollars)
-2%
2013 2014
Value of FDI announced green�eld projects, 2013−2014
Value of cross-border M&A, 2013−2014
Primary
Manufacturing
Services
28%
2013 2014
Source: UNCTAD, cross-border M&A database for M&As and information from the Financial Times Ltd, fDi Markets (www.fDimarkets.com) for greenfield projects.
Figure I.13.Global inward FDI stock, by sector, 2012 (Per cent of total value)
7
2663
4
Primary
Manufacturing
Services
Unspeci�ed

World Investment Report 2015: Reforming International Investment Governance14
Developed and developing economies display opposite trends in M&A activity in manufacturing. In 2014, there was a considerable increase in M&As in developed economies, with the total net value of deals rising from $85 billion to $152 billion (79 per cent). The growth was most marked in electrical and electronic equipment (125 per cent) and in food, beverages and tobacco (55 per cent). There was a sharp decrease in M&As in developing economies (from $45 billion to $16 billion); the decline occurred across most industries, particularly in food, beverages and tobacco, where the value of cross-border M&As plummeted to $4 billion after peaking in 2013 at a historically high $32 billion.
Services saw contrasting trends in greenfield FDI projects and cross-border M&As. While the total value of greenfield projects decreased (−15 per cent compared with 2013), the value of cross-border M&As registered a significant increase, from $155 billion to $213 billion (37 per cent).
The value of greenfield projects in developing economies decreased (from $259 billion in 2013 to $211 billion in 2014), but with differentiated dynamics at the industry level. Construction jumped from $22 billion to $42 billion and became the second largest service industry in developing economies, overtaking industries that traditionally receive large amounts of FDI, such as finance and business services. By contrast, both business services and electricity, gas and water – after strong expansion in 2013 (at $76 billion and $63 billion) – fell by 52 per cent and 27 per cent, respectively. Contraction in business services was particularly critical in Latin America and the Caribbean (−88 per cent), while electricity, gas and water declined in both Latin America and the Caribbean (−22 per cent) and West Asia (−77 per cent).
In developing economies, the growth engine of cross-border M&As in services was the increase in finance (from $18 billion to $61 billion), in particular in East and South-East Asia. For developed economies, the picture is multifaceted. While the traditionally largest FDI industries, business services and finance, saw a considerable increase, from $36 billion to $66 billion and from $9 billion to $30 billion respectively, the value of information and communication took a sharp downturn to a negative value (−$73 billion against $29 billion in 2013) because of the Vodafone divestment.
4. FDI by selected types of special investors
a. Private equity firms
Cross-border M&As by private equity funds rose. The total value of cross-border M&As undertaken by private equity funds rose to $200 billion in 2014 (table I.3), accounting for about 17 per cent of the global total. This share declined by 6 percentage points from 2013 and was 13 percentage points lower than in 2007 and 2008. In 2014 alone, global private equity funds cashed in about $115 billion from previous overseas M&A deals, bringing the value of net cross-border M&As to $85 billion. As the amount of cash and commitments from investors is at a very high level (estimated at about $360 billion) and interest rates in developed countries remain low, prospects for private equity funds’ leveraged international transactions are promising. Furthermore, more active global financial markets are expected to generate more cross-border investment opportunities.
The largest funds have played an increasingly important role in the global private equity market. In terms of fund raising, nine mega-funds attracted more than $5 billion each, amounting to nearly half of the total capital raised by private equity funds in 2013. This contributed to an overall 21 per cent increase in global fund raising.7 As these mega-funds tend to invest in megadeals, the significance of private equity funds in the global picture of cross-border M&As is reflected in transactions involving large companies from large host-country economies. For example, 3G Capital (Brazil and the United States) was behind the merger of Tim Hortons (Canada) and Burger King Worldwide (United States) in 2014 which, at $12.5 billion, was the largest international buyout of the year.
North America and Europe continued to be the major regions targeted for cross-border M&As by private equity funds in 2014. In Canada, for example, Blackstone (United States) acquired Gates Corporation – a manufacturer of power transmission belts and fluid power products – for $5.4 billion, and TPG Capital Management LP (United States) bought Warranty Group – a provider of extended warranty contracts from the local Onex Corp for $1.5 billion. These two large private equity funds have been important players in M&A markets not only in North America, but also

CHAPTER I Global Investment Trends 15
in other developed regions and in developing ones. With $67 billion under management, for instance, TPG Capital has established significant operations in Asia and Europe since the mid-1990s.
Asia has become increasingly attractive. In 2014, both the amount of transactions and their share in total private equity deals reached historically high levels (figure I.15). In East Asia, both China and the Republic of Korea experienced more deal making activities. In China, a number of megadeals were implemented, including pre-IPO deals related to Alibaba and JD.com, the country’s leading e-commerce companies. In the Republic of Korea, Carlyle Group undertook a $2 billion carve-out of the Korean unit of ADT, owned by Tyco (Switzerland). In South-East Asia, strong inflows of foreign private equity funds drove up the value of transactions but also led to fierce competition between funds.
b. SWFs
FDI by SWFs more than doubled in 2014. There are more than 100 sovereign wealth funds (SWFs), managing more than $7 trillion of assets in 2014 and
accounting for about one tenth of the world’s total
assets under management. These funds are in a
strong position to influence global financial and capital
markets, but are much less active in FDI. The value of
their FDI has been marginal compared with the value
of assets under management. During the period 2011–
2013, the value of their FDI dropped continuously,
but the downward trend has reversed (figure I.16).
In 2014, the amount of FDI by SWFs more than doubled
to reach $16 billion, the highest level in five years.
It was driven by large cross-border M&As undertaken
by SWFs of a limited number of countries, in particular
Singapore. There, Temasek Holdings acquired a 25 per
cent stake in AS Watson Holdings (Hong Kong, China)
for $5.7 billion, while GIC Pte bought an 11 per cent
stake in Emperador Inc. (Philippines) for $390 million.
Many SWFs whose sources of finance rely on oil
revenues (approximately 60 per cent of all SWFs)
have had to face lower oil prices since mid-2014.
This may affect their sources of funds in the near future,
as well as their scale of investment. For a number of
Asian SWFs, decelerated export growth may have
similar effects.
Number of deals Gross M&As Net M&As
Year Number Share in total (%) Value ($ billion) Share in total (%) Value ($ billion) Share in total (%)1996 970 16 43 16 18 12 1997 1 057 15 58 15 18 10 1998 1 228 15 62 9 28 8 1999 1 451 15 80 9 27 5 2000 1 457 14 82 6 30 3 2001 1 435 17 82 11 34 8 2002 1 281 19 71 14 13 5 2003 1 555 23 91 23 31 19 2004 1 675 22 134 25 62 31 2005 1 842 20 202 22 103 19 2006 1 859 18 259 23 115 18 2007 2 046 17 528 30 279 27 2008 1 946 18 437 31 103 17 2009 2 083 24 105 17 62 22 2010 2 195 22 144 19 66 19 2011 1 953 19 155 15 66 12 2012 2 209 23 188 23 63 19 2013 1 964 23 169 23 82 26 2014 2 358 24 200 17 85 21
Source: UNCTAD, cross-border M&A database (www.unctad.org/fdistatistics).Note: Value on a net basis takes into account divestments by private equity funds. Thus it is calculated as follows: Purchases of companies abroad by private
equity funds (-) Sales of foreign affiliates owned by private equity funds. The table includes M&As by hedge and other funds (but not sovereign wealth funds). Private equity firms and hedge funds refer to acquirers as “investors not elsewhere classified”. This classification is based on the Thomson Finance database on M&As.
Table I.3. Cross-border M&As by private equity firms, 1996–2014 (Number of deals and value)

World Investment Report 2015: Reforming International Investment Governance16
0
5
10
15
20
25
30
35
40
1995 1996 1997 1998 1999 2000 2001 2002 2003 2004 2005 2006 2007 2008 2009 2010 2011 2012 2013 2014
Figure I.15. FDI by private equity funds, by major host region, 1995−2014(Billions of dollars and per cent)
United States
Europe
Latin America and the Caribbean
Asia
Rest of the world
Share of developing countries in total (%)
0
100
200
300
400
500
600
ShareValue
Source: UNCTAD, cross-border M&A database (www.unctad.org/fdistatistics).Note: Data refer to gross values of M&As by private equity firms; they are not adjusted to exclude FDI by SWFs.
Some SWFs have engaged in long-term investments; they are increasingly involved in FDI projects, including through cross-border corporate acquisitions and overseas real estate purchases. For example, the Norwegian SWF, the world’s largest in terms of assets under management, will increase the number of companies in which it can own more than 5 per cent equity to 100; its long-term investment in venture capital, private equity funds and real estate assets is on the rise.
As an increasingly important asset class, infrastructure offers SWFs some specific advantages for their portfolio management, including, for instance large-scale investment opportunities, and relatively stable returns. Consequently, more than half of SWFs have already started to invest in infrastructure. For example, GIC of Singapore has been an important investor in the sector in both developed countries and emerging markets, aiming at operating infrastructure assets.8 CIC (China) has included infrastructure projects in its investment strategy under the overall category of long-term assets, which account for 28 per cent of its total assets. In late 2014, GIC planned to participate in a $1.6 billion co-investment in three airports in the United Kingdom. The company already owns a part of Heathrow Airport Holdings, together with other SWFs, including CIC, Qatar Holding and Caisse de Dépôt et Placement du Québec.
Source: UNCTAD, cross-border M&A database for M&As (www.unctad.org/fdistatistics) and information from the Financial Times Ltd, fDi Markets (www.fDimarkets.com) for greenfield projects.
Note: Data should be considered approximate, as they include the value of flows for both cross-border M&As and announced greenfield FDI projects (for limitations of announced greenfield projects data, see the note in the section on modes of entry) and only investments in which SWFs are the sole and immediate investors. Data do not include investments made by entities established by SWFs or those made jointly with other investors. In 2003–2014, cross-border M&As accounted for about 60 per cent of the total.
Figure I.16.Annual and cumulative value of FDI by SWFs, 2000−2014(Billions of dollars)
0
20
40
60
80
100
120
140
160
180
0
5
10
15
20
25
30
2000 2002 2004 2006 2008 2010 2012 2014
Annual �ows (left scale) Cumulative �ows (right scale)
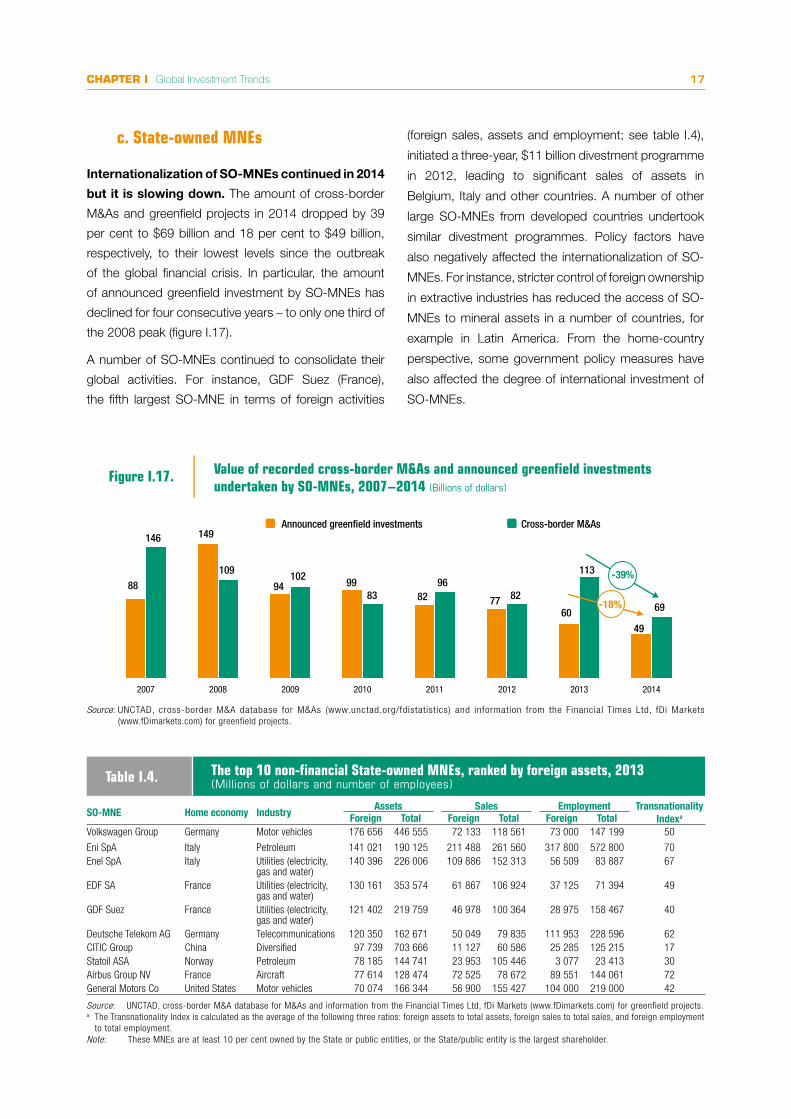
CHAPTER I Global Investment Trends 17
c. State-owned MNEs
Internationalization of SO-MNEs continued in 2014
but it is slowing down. The amount of cross-border
M&As and greenfield projects in 2014 dropped by 39
per cent to $69 billion and 18 per cent to $49 billion,
respectively, to their lowest levels since the outbreak
of the global financial crisis. In particular, the amount
of announced greenfield investment by SO-MNEs has
declined for four consecutive years – to only one third of
the 2008 peak (figure I.17).
A number of SO-MNEs continued to consolidate their
global activities. For instance, GDF Suez (France),
the fifth largest SO-MNE in terms of foreign activities
Table I.4. The top 10 non-financial State-owned MNEs, ranked by foreign assets, 2013 (Millions of dollars and number of employees)
SO-MNE Home economy Industry Assets Sales Employment Transnationality
IndexaForeign Total Foreign Total Foreign TotalVolkswagen Group Germany Motor vehicles 176 656 446 555 72 133 118 561 73 000 147 199 50
Eni SpA Italy Petroleum 141 021 190 125 211 488 261 560 317 800 572 800 70Enel SpA Italy Utilities (electricity,
gas and water) 140 396 226 006 109 886 152 313 56 509 83 887 67
EDF SA France Utilities (electricity, gas and water)
130 161 353 574 61 867 106 924 37 125 71 394 49
GDF Suez France Utilities (electricity, gas and water)
121 402 219 759 46 978 100 364 28 975 158 467 40
Deutsche Telekom AG Germany Telecommunications 120 350 162 671 50 049 79 835 111 953 228 596 62CITIC Group China Diversified 97 739 703 666 11 127 60 586 25 285 125 215 17Statoil ASA Norway Petroleum 78 185 144 741 23 953 105 446 3 077 23 413 30Airbus Group NV France Aircraft 77 614 128 474 72 525 78 672 89 551 144 061 72General Motors Co United States Motor vehicles 70 074 166 344 56 900 155 427 104 000 219 000 42
Source: UNCTAD, cross-border M&A database for M&As and information from the Financial Times Ltd, fDi Markets (www.fDimarkets.com) for greenfield projects.a The Transnationality Index is calculated as the average of the following three ratios: foreign assets to total assets, foreign sales to total sales, and foreign employment
to total employment.Note: These MNEs are at least 10 per cent owned by the State or public entities, or the State/public entity is the largest shareholder.
(foreign sales, assets and employment; see table I.4),
initiated a three-year, $11 billion divestment programme
in 2012, leading to significant sales of assets in
Belgium, Italy and other countries. A number of other
large SO-MNEs from developed countries undertook
similar divestment programmes. Policy factors have
also negatively affected the internationalization of SO-
MNEs. For instance, stricter control of foreign ownership
in extractive industries has reduced the access of SO-
MNEs to mineral assets in a number of countries, for
example in Latin America. From the home-country
perspective, some government policy measures have
also affected the degree of international investment of
SO-MNEs.
Figure I.17. Value of recorded cross-border M&As and announced green�eld investments undertaken by SO-MNEs, 2007−2014 (Billions of dollars)
Announced green�eld investments Cross-border M&As
2007 2008 2009 2010 2011 2012 2013 2014
88
149
94 99 82 77
60
49
-18%
146
109 102
83 96
82
113
69
-39%
Source: UNCTAD, cross-border M&A database for M&As (www.unctad.org/fdistatistics) and information from the Financial Times Ltd, fDi Markets (www.fDimarkets.com) for greenfield projects.

World Investment Report 2015: Reforming International Investment Governance18
Despite the uncertainty of global economic recovery, international production continued to strengthen in 2014, with all indicators of foreign affiliate activity rising. Indicators of international production – production of MNE foreign affiliates (table I.5) – show a rise in sales by 7.6 per cent, while employment of foreign affiliates reached 75 million. Exports of foreign affiliates remained relatively stable, registering a 1.5 per cent rise. Value added increased by 4.2 per cent. Assets of foreign affiliates rose by 7.2 per cent over the previous year. The financial performance of foreign affiliates in host economies improved, with the rate of return on inward FDI rising from 6.1 per cent in 2013 to 6.4 per cent in 2014. However, this level is still lower than that in the pre-crisis average (2005-2007).
In 2014, the top 100 MNEs again increased their
degree of internationalization (table I.6) after some
years of decline. A series of big deals and mergers that
were concluded during the year contributed to growth
in foreign assets, while sales of domestic non-core
assets led to decreases in total assets (e.g. Deutsche
Telekom’s sale of the German e-commerce company
24Scout for roughly $2 billion). A similar pattern is
found for sales and employment, confirming MNEs’
expansion of operations abroad. For developing- and
transition-economy MNEs, growth rates of assets,
sales and employment, both domestic and foreign,
are higher than for their developed-country
counterparts.
Item
Value at current prices (Billions of dollars)
19902005–2007
(pre-crisis average)2012 2013 2014
FDI inflows 205 1 397 1 403 1 467 1 228FDI outflows 244 1 423 1 284 1 306 1 354FDI inward stock 2 198 13 894 22 073 26 035 26 039FDI outward stock 2 254 14 883 22 527 25 975 25 875Income on inward FDIa 82 1 024 1 467 1 517 1 575
Rate of return on inward FDIb 4.4 7.6 7.0 6.1 6.4Income on outward FDIa 128 1 105 1 445 1 453 1 486
Rate of return on outward FDIb 5.9 7.6 6.6 5.8 5.9Cross-border M&As 98 729 328 313 399
Sales of foreign affiliates 4 723 21 469 31 687 33 775c 36 356c
Value-added (product) of foreign affiliates 881 4 878 7 105 7 562c 7 882c
Total assets of foreign affiliates 3 893 42 179 88 536 95 230c 102 040c
Exports of foreign affiliates 1 444 4 976 7 469 7 688d 7 803d
Employment by foreign affiliates (thousands) 20 625 53 306 69 359 71 297c 75 075c
MemorandumGDPe 22 327 51 799 73 457 75 453 77 283Gross fixed capital formatione 5 592 12 219 17 650 18 279 18 784Royalties and licence fee receipts 31 172 277 298 310Exports of goods and servicese 4 332 14 927 22 407 23 063 23 409Source: UNCTAD.a Based on data from 174 countries for income on inward FDI and 143 countries for income on outward FDI in 2014, in both cases representing more than 90 per
cent of global inward and outward stocks.b Calculated only for countries with both FDI income and stock data.c Data for 2013 and 2014 are estimated based on a fixed effects panel regression of each variable against outward stock and a lagged dependent variable for the
period 1980–2012.d For 1998–2014, the share of exports of foreign affiliates in world exports in 1998 (33.3%) was applied to obtain values. Data for 1995–1997 are based on a linear
regression of exports of foreign affiliates against inward FDI stock for the period 1982–1994.e Data from IMF (2015).Note: Not included in this table are the value of worldwide sales by foreign affiliates associated with their parent firms through non-equity relationships and
of the sales of the parent firms themselves. Worldwide sales, gross product, total assets, exports and employment of foreign affiliates are estimated by extrapolating the worldwide data of foreign affiliates of MNEs from Australia, Austria, Belgium, Canada, the Czech Republic, Finland, France, Germany, Greece, Israel, Italy, Japan, Latvia, Lithuania, Luxembourg, Portugal, Slovenia, Sweden, and the United States for sales; those from the Czech Republic, France, Israel, Japan, Portugal, Slovenia, Sweden, and the United States for value added (product); those from Austria, Germany, Japan and the United States for assets; those from the Czech Republic, Japan, Portugal, Slovenia, Sweden, and the United States for exports; and those from Australia, Austria, Belgium, Canada, the Czech Republic, Finland, France, Germany, Italy, Japan, Latvia, Lithuania, Luxembourg, Macao (China), Portugal, Slovenia, Sweden, Switzerland, and the United States for employment, on the basis of three years average shares of those countries in worldwide outward FDI stock.
Table I.5. Selected indicators of FDI and international production, 2014 and selected years
B. INTERNATIONAL PRODUCTION

CHAPTER I Global Investment Trends 19
The largest MNEs maintained high cash balances. The 100 largest MNEs registered a marginal decrease in the value of their cash balances in 2014, as these companies started to spend on new investments, especially through M&As, buy-backs of their own shares and dividend payments (figure I.18). For example, Ford Motors (United States) reduced its cash reserves by about 25 per cent to finance an increase in capital expenditures (13 per cent), and to finance significant share buy-backs and increased dividend payments. However, cash holdings of the top 100 remained exceptionally high as a share of their total assets as MNEs also undertook restructurings, including shedding non-core assets.
Looking at a far larger sample of 5,000 MNEs, the cash reserve picture is consistent. At the end of 2014, these MNEs had an estimated $4.4 trillion of cash holdings, nearly double the level before the global financial crisis. These holdings have been accumulated in an effort to lessen their reliance on debt and to secure refinancing while interest rates are low, creating a buffer against financial turmoil.
However, in the last two years, MNEs in some industries have started to use their cash holdings for
ShareValue
Figure I.18.
Cash holdings of the largest 100 MNEs and their share of total assets, 2006−2014(Billions of dollars and per cent)
200
0
400
600
800
1 000
1 200
1 400
2006 2007 2008 2009 2010 2011 2012 2013 2014
6
7
8
9
10
11
12
13
Cash holdings Share of total assets ShareValue
200
0
400
600
800
1 000
1 200
1 400
2006 2007 2008 2009 2010 2011 2012 2013 20146
7
8
9
10
11
12
13
Cash holdings Share of total assets
Source: UNCTAD, based on data from Thomson ONE.
Variable100 largest MNEs worldwide
100 largest MNEs from developing and transition economies
2012 2013a 2012–2013 % change
2014b 2013–2014 % change
2012 2013 % change
AssetsForeign 7 942 8 249 3.9 8 266 0.2 1 506 1 632 8.4Domestic 5 421 5 759 6.2 5 581 -3.1 4 025 4 403 9.4Total 13 363 14 008 4.8 13 847 -1.1 5 531 6 034 9.1
Foreign as % of total 59 59 -0.5c 60 0.8c 27 27 -0.2c
SalesForeign 5 885 6 053 2.9 6 132 1.3 1 690 1 806 6.8Domestic 3 072 3 263 6.2 3 101 -5.0 2 172 2 415 11.1Total 8 957 9 316 4.0 9 233 -0.9 3 863 4 221 9.3
Foreign as % of total 66 65 -0.7c 66 1.4c 44 43 -1.0c
EmploymentForeign 9 831 9 562 -2.7 9 599 0.4 4 103 4 226 3.0Domestic 7 106 7 135 0.4 7 211 1.1 6 493 6 688 3.0Total 16 937 16 697 -1.4 16 810 0.7 10 596 10 914 3.0
Foreign as % of total 58 57 -0.8c 57 -0.2c 39 39 0.0c
Source: UNCTAD.a Revised results.b Preliminary results.c In percentage points.Note: Data refer to fiscal year results reported between 1 April of the base year to 31 March of the following year. Complete 2014 data for the 100 largest MNEs
from developing and transition economies are not yet available.
Table I.6.Internationalization statistics of the 100 largest non-financial MNEs worldwide and from developing and transition economies (Billions of dollars, thousands of employees and per cent)

World Investment Report 2015: Reforming International Investment Governance20
capital expenditures and acquisitions. Taking average annual expenditures between 2008 and 2012 as a benchmark, for example, the oil and gas industry and the utilities industry more than doubled their capital expenditure, reaching $582 billion and $138 billion, respectively, in 2014 (figure I.19) (although capital expenditures in the oil and gas industry are expected to be cut back again in response to lower oil prices). Important increases in expenditure also took place in the telecommunications industry, where operators invested heavily in their networks, and in the food production and transport equipment industries.
The lower levels of cash holdings do not necessarily mean higher levels of capital expenditure, as cash holdings can be used for buying back a company’s own shares and paying dividends to shareholders. Furthermore, the observed increases in capital expenditures are limited to a selected group of MNEs and changes in behaviour are not as yet broad-based. However, as the UNCTAD business survey shows, companies are more optimistic about capital spending in 2015 and beyond (see next section).
Firm-level factors support prospects for growing capital expenditures. Annual MNE profits in 2014 remained
at a high level (figure I.20), adding to existing cash reserves at about the same rate as increased capital expenditures, implying further room for expansion.
Figure I.19. Cash holdings and capital expenditures of the top 5,000 MNEs, by sector, 2008–2012 average and 2014 (Billions of dollars)
Capital expenditures
Consumer Goods
Consumer Services
Industrials
Utilities
Oil and Gas
Technology
Basic Materials
Health Care
Telecommunications
Cash holdings
Average 2008–2012 2014
619
326
911
185
306
521
353
249
102
803
394
1185
165
381
711
371
317
129
232
203
516
49
223
139
308
52
80
315
179
311
138
582
127
285
54
111
Source: UNCTAD, based on data from Thomson ONE.
ShareValue
Figure I.20.Pro�tability and pro�t levels of MNEs, 2004–2014(Billions of dollars and per cent)
Pro�ts Pro�tability
0
1
2
3
4
5
6
7
8
9
0
200
400
600
800
1000
1200
1400
2004 2005 2006 2007 2008 2009 2010 2011 2012 2013 2014
Source: UNCTAD, based on data from Thomson ONE.

CHAPTER I Global Investment Trends 21
Global FDI flows are expected to reach $1.4 trillion in 2015 − an 11 per cent rise. Flows are expected to increase further to $1.5 trillion and $1.7 trillion in 2016 and 2017, respectively. These expectations
are based on current forecasts for a number of macro-
economic indicators, the findings of an UNCTAD
business survey carried out jointly with McKinsey &
Company, UNCTAD’s econometric forecasting model for
FDI inflows, and data for the first four months of 2015 for
cross-border M&As and greenfield investment projects.
Macroeconomic factors and firm-level factors are
expected to influence flows positively. Indeed, the gradual
improvement of macroeconomic conditions, especially
in North America, and accommodating monetary policy,
coupled with increased investment liberalization and
promotion measures, are likely to improve the investment
appetite of MNEs in 2015 and beyond. Global economic
growth and gross fixed capital formation are expected
to grow faster in 2015 and 2016 than in 2014 (table I.7).
However, the FDI growth scenario could be upended
by a multitude of economic and political risks, including
ongoing uncertainties in the Eurozone, potential
spillovers from geopolitical tensions, and persistent
vulnerabilities in emerging economies.
1. UNCTAD’s econometric forecasting model
UNCTAD’s econometric model projects that FDI flows
will increase by 11 per cent in 2015 (table I.8). Developed
countries should see a large increase in flows in 2015 (up
by more than 20 per cent), reflecting stronger economic
activity.
C. PROSPECTS
Table I.7. Real growth rates of GDP and gross fixed capital formation (GFCF), 2014–2016 (Per cent)
Variable Region 2014 2015 2016World 2.6 2.8 3.1
GDP growth rateDeveloped economies 1.6 2.2 2.2Developing economies 4.4 4.9 4.8Transition economies 0.7 -2.0 0.9
World 2.9 3.0 4.7
GFCF growth rate Advanced economiesa 2.7 3.3 3.9 Emerging and developing economiesa 3.2 2.9 5.3
Source: UNCTAD, based on United Nations (2015) for GDP and IMF (2015) for GFCF.a IMF’s classifications of advanced, emerging and developing economies are not the same as the United Nations’ classifications of developed and developing
economies.
Averages Projections2005–2007 2009–2011 2013 2014 2015 2016 2017
Global FDI flows 1 397 1 359 1 467 1 228 1 368 1 484 1 724 Developed economies 917 718 697 499 634 722 843 Developing economies 421 561 671 681 707 734 850 Transition economies 60 81 100 48 45 47 53
MemorandumAverage growth rates Growth rates Growth rate projections
2005–2007 2009–2011 2013 2014 2015 2016 2017Global FDI flows 40.1 3.1 4.6 -16.3 11.4 8.4 16.2
Developed economies 48.2 3.0 2.7 -28.4 23.8 13.9 16.7Developing economies 26.1 4.8 5.0 1.6 3.3 3.9 15.8Transition economies 48.0 -1.1 17.0 -51.7 -2.3 5.3 12.3
Source: UNCTAD.Note: Excludes Caribbean offshore financial centres.
Table I.8. Projections of FDI flows, by group of economies (Billions of dollars and per cent)

World Investment Report 2015: Reforming International Investment Governance22
FDI inflows to developing countries will continue to
be high, rising by an average of 3 per cent over the
next two years. They will, however, remain the major
host group for FDI flows. Negative GDP growth rates
in transition economies, due to continued economic
recession, sanctions and low oil prices, imply that flows
to those economies could decline further in 2015.
A jump in cross-border M&A activity in the
beginning of 2015. An increase in FDI inflows and the
rise of developed countries as FDI hosts are reflected in
the value of cross-border M&As in early 2015. Between
January and April 2015, (net) cross-border M&As
increased almost four times compared with those in
2014, to reach their highest level since 2007 (figure
I.21). MNEs from developing and transition economies
continued to acquire assets in developed economies,
consolidating their position as investors in cross-border
M&As.
2. UNCTAD business survey
Global FDI activity outlook. According to UNCTAD’s
survey, carried out in collaboration with McKinsey &
Company, of over 1,000 top managers in companies
based in 89 countries, most executives expect an
increase in global FDI activity in the coming years. This
positive outlook is explained by relatively good economic
prospects in North America, the BRICS and other
emerging economies, as well as regional integration
processes and driven by corporate factors such as the
expected continued offshoring of manufacturing and
services functions.
Risk factors to the overall positive outlook listed
by respondents include the risks of sovereign debt
defaults, austerity policies and the state of the EU
economy (figure I.22). They also include countertrends
to the offshoring factors driving increased FDI, in the
form of expected increases in the reshoring of business
functions.
CEO investment sentiments vary by region.
Executives from Africa and the Middle East9 are the
most optimistic about FDI prospects: 67 per cent expect
global FDI activity to increase in the next few years
(figure I.23); they are closely followed by respondents
based in developing Asia.
Among developed economies, European MNEs are
the most upbeat about global FDI prospects (see figure
I.24), despite continuing concern about the EU regional
economy. These expectations arise from factors such
as the quantitative easing programme launched by
the European Central Bank; the considerable cash
holdings accumulated by major MNEs in the region;
the attractiveness for foreign investors of firms, in
particular SMEs, based in weaker EU economies;10 and
MNEs’ consolidation strategies in industries such as
pharmaceuticals and telecommunications. In contrast,
executives from Latin America, North America and other
developed economies (Australia, Japan, New Zealand,
etc.) are less optimistic about global FDI prospects.
FDI spending intentions. MNEs’ overall positive
expectations of high global FDI translate only partly into
their organizations’ investment plans. About a quarter
of executives plan to increase FDI expenditures in 2015;
this share is set to grow to almost a third by 2017 (figure
I.24). By corollary, the share of executives expecting to
hold budgets constant or decrease them over the years
from 2015 to 2017 shrank from 49 per cent to 34 per
cent and from 10 per cent to 6 per cent, respectively.
By sector, firms in the financial and business services
industries report the highest prospects for FDI expan-
sion in 2015 (figure I.25), while a higher share of cor-
porations active in the high-tech, telecommunications,
pharmaceuticals and other manufacturing industries
expect FDI to increase for 2016 and 2017.
Figure I.21.Cross-border M&As, January–April of each year, 2005–2015 (Billions of dollars)
0
50
100
150
200
250
300
350
2005 2006 2007 2008 2009 2010 2011 2012 2013 2014 2015
Source: UNCTAD, cross-border M&A database (www.unctad.org/fdistatistics).
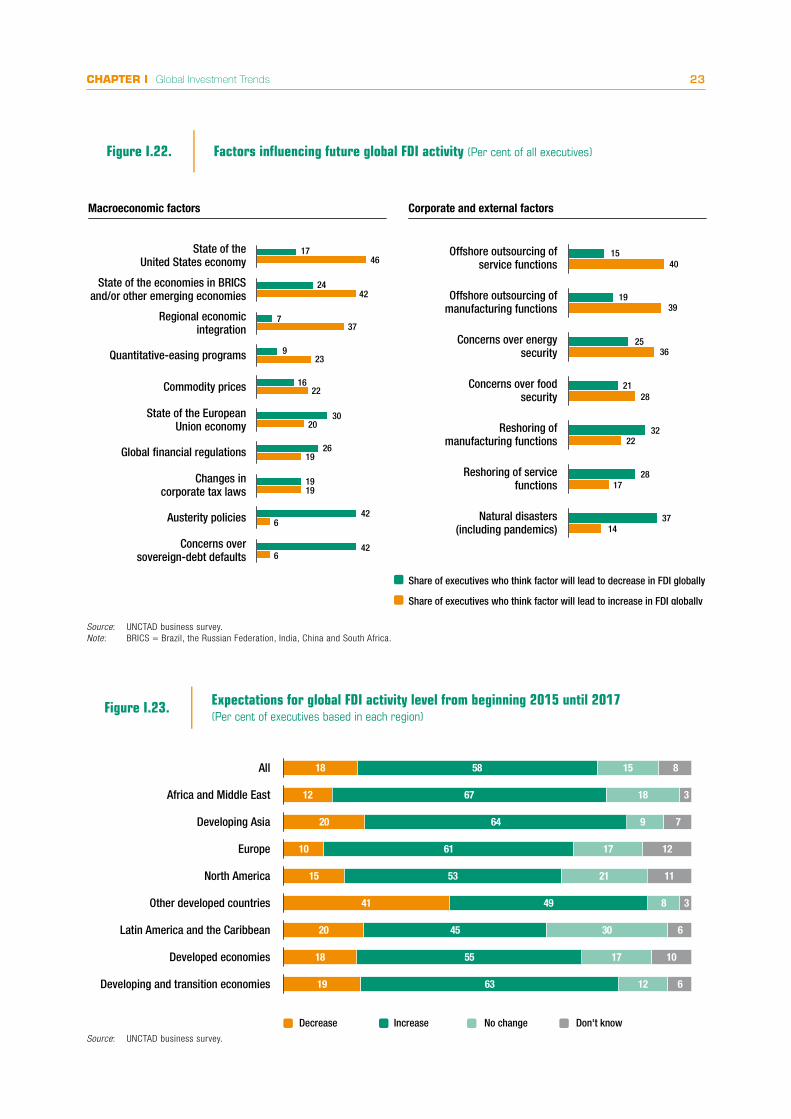
CHAPTER I Global Investment Trends 23
Figure I.22. Factors in�uencing future global FDI activity (Per cent of all executives)
Share of executives who think factor will lead to decrease in FDI globally
Share of executives who think factor will lead to increase in FDI globally
Macroeconomic factors Corporate and external factors
17
2442
737
923
1622
3020
2619
1919
42
426
6
46
3919Offshore outsourcing of
manufacturing functions
3625Concerns over energy
security
2821Concerns over food
security
2232Reshoring of
manufacturing functions
1728Reshoring of service
functions
3714
Natural disasters(including pandemics)
4015Offshore outsourcing of
service functionsState of the
United States economy
State of the economies in BRICSand/or other emerging economies
Regional economicintegration
Quantitative-easing programs
Commodity prices
State of the EuropeanUnion economy
Global �nancial regulations
Changes incorporate tax laws
Austerity policies
Concerns oversovereign-debt defaults
Source: UNCTAD business survey.Note: BRICS = Brazil, the Russian Federation, India, China and South Africa.
Figure I.23. Expectations for global FDI activity level from beginning 2015 until 2017(Per cent of executives based in each region)
Don't knowDecrease No changeIncrease
619 1263Developing and transition economies
1018 1755Developed economies
620 3045Latin America and the Caribbean
341 849Other developed countries
1115 2153North America
1210 1761Europe
720 964Developing Asia
312 1867Africa and Middle East
818 1558All
Source: UNCTAD business survey.

World Investment Report 2015: Reforming International Investment Governance24
25
17
18
22
24
24
41
24
36
36
29
26
31
33
28
40
31
25
33
42
50
23
32
No change
14
14
21
20
16
10
16
18 43
32 37
5 56
6 52
14 47
5 61
49
10 49
4 6
27
30
29
29
31
17
25
28
4
3
3
1
7 26
35
43
36
7 21
31
19 33
6 34
18
18
23
24
20
15
25
22
4
20 52
11 36
16 37
46
41
10 37
5 44
8 42
3
3
Figure I.24. Global FDI spending intentions with respect to 2014 levels, by headquarters region, 2015−2017 (Per cent of executives based in each region)
Don't knowDecrease Increase
All
Other developedcountries
Africa and theMiddle East
Developing Asia
Europe
North America
Latin America andthe Caribbean
Developing andtransition
2015 20172016
Source: UNCTAD business survey.
19 5023
5323
5 4625
6 5027
6 4831
10 4924
9
21
25
17
15
16
3
20
32
39
35
28
28
3
1
4
3
2651
3532
1839
14 3021
4524
6 3432
14
25
29
31
16
22
4
3
7 4633
3636
8 2341
14 3520
5625
8 4228
Figure I.25. FDI spending intentions with respect to 2014 levels, by selected industries, 2015−2017(Per cent of all executives)
Don't knowDecrease No changeIncrease
2015 2016 2017
All
Financial
Business services
Telecommunication
Pharmaceuticals
Other manufacturing
Source: UNCTAD business survey.
Large MNEs (those with more than $1 billion of
revenues) and those already well internationalized
(with more than 21 company locations and/or with
more than 50 per cent of revenue from outside the
company’s home market) have the most positive
spending plans: about 45 per cent of them indicate intentions to increase FDI spending in 2017.
UNCTAD’s survey of investment promotion agencies (IPAs)11 indicates which industries are more likely to witness an increase in FDI activity. IPAs in developed

CHAPTER I Global Investment Trends 25
countries expect foreign inflows to target business
services, machinery, transport and telecommunications,
hotels and restaurants, and other services. Agencies
in developing and transition economies consider the
best targets in their countries to be in the agricultural
and agribusiness industry, along with the transport
and telecommunications, hotels and restaurants,
construction and extractive industries (figure I.26).
Prospective top investing countries. Results from
this year’s IPAs survey point to developed countries
as top global investing countries; of developing
economies, only China, India, the United Arab
Emirates, and the Republic of Korea appear in the
top 12 positions (figure I.27). Domestic economic
woes probably influenced expectations about some
emerging economies, such as Brazil (ranked 10th in
2013) and the Russian Federation (ranked 13th) that do
not figure in the results this year. The United Kingdom
matched China in the rankings (2nd), and Italy and Spain
gained several positions.
Prospective top destinations. Global corporate
executives view China and the United States as the
best investment locations worldwide: 28 per cent
chose China and 24 per cent chose the United States
(figure I.28). India, Brazil and Singapore make up the
remainder of the top 5 destinations; interestingly,
developing-country economies constitute 6 of the top
10. Only the United Kingdom, Germany and Australia
feature in this group, apart from the United States.
The rankings are influenced by the views of executives
in various industries. For example, businesses linked
to the information technology industry are more likely
to have investment plans favouring the United States
or India. Similarly, the United States maintains its
leadership in rankings on the basis of their strength in
the high-tech and telecommunication industries.
The overall global FDI trend in 2014 was negative. Cross-
border investment flows remain significantly (about one
third) below their 2007 peak. However, regional trends
varied, with the developing-country group showing
marginal positive growth. Inaddition, prospects for
global FDI flows to 2017 are somewhat more positive.
Nevertheless, in light of the important role that FDI is
expected to play in financing for development – the
subject of discussion during the third International
Conference on Financing for Development in Addis
Ababa mid-July 2015 – the current subdued trend is of
concern. Policymakers may wish to consider concerted
action to push increased productive investment for
sustainable development.
Source: UNCTAD IPA survey.
Figure I.26. IPAs’ selection of most promising industries for attracting FDI in their own country (Per cent of all IPA respondents)
Business services
Machinery andequipment
Hotels and restaurants
Other services
Transport, storage andcommunications
Agriculture, hunting,forestry and �shing
Food, beverages andtobacco
Construction
Hotels and restaurants
Mining, quarrying andpetroleum
Transport, storage andcommunications
60
47
40
40
40
52
45
32
32
32
32
Developed countries Developing and transition economies

World Investment Report 2015: Reforming International Investment Governance26
Figure I.27.
IPAs’ selection of the most promising investor home economies for FDI in 2014−2016(Per cent of IPA respondents selecting economy as a top source of FDI)
United States (1)
China (2)
United Kingdom (3)
Germany (5)
Japan (3)
France (7)
India (6)
United Arab Emirates (10)
Spain (15)
Italy (16)
Republic of Korea (8)
Netherlands (12)
60
50
50
44
30
22
20
18
14
10
10
10Developing and transition economies
Developed countries
(x) = 2013 ranking
Source: UNCTAD IPA survey.
MNEs top prospective host economies for 2015−2017 (Per cent)
Figure I.28.
Republic of Korea (-)
Russian Federation (10)
Malaysia (15)
Indonesia (3)
Japan (15)
France (12)
Canada (-)
Australia (10)
Mexico (13)
Hong Kong, China (-)
Germany (6)
United Kingdom (7)
Singapore (17)
Brazil (5)
India (4)
United States (2)
China (1)
3
3
3
3
4
4
4
4
6
6
8
10
10
10
14
24
28
(x) = 2013 ranking
Developing and transition economies
Developed countries
Source: UNCTAD business survey. Note: Previous survey ranking appears in parentheses. The absence of a
number in parentheses means the economy was not in the top 20.

CHAPTER I Global Investment Trends 27
Notes
1 There are some differences in value between global FDI inflows and global FDI outflows, and these flows do not necessarily move in parallel. This is mainly because home and host countries may use different methods to collect data and different times for recording FDI transactions. This year is one of transition from directional-based FDI data to asset/liability-based FDI data. Although UNCTAD made efforts to use the data based on the directional principle, as explained in the methodological box in section A.1.a, many large countries already report data on the basis of the asset/liability principle. This is not the first year in which inflows and outflows did not move in parallel. The most recent years in which this data mismatch occurred were 2003 and 2005.
2 SPEs are legal entities that have little or no employment or operations or physical presence in the jurisdiction in which they are created by their parent enterprises, which are typically located in other jurisdictions (in other economies). SPEs are often used as vehicles to raise capital or to hold assets and liabilities, and usually do not undertake significant production (BD4).
3 UNCTAD, “Regional integration and FDI in developing and transition economies”, Multi-Year Expert Meeting on Investment, Innovation and Entrepreneurship for Productive Capacity-building and Sustainable Development, Geneva, 28– 30 January 2013.
4 Greenfield investment projects data refer to announced projects. The value of such a project indicates the capital expenditure planned by the investor at the time of the announcement. Data can differ substantially from the official FDI data as companies can raise capital locally and phase their investments over time, and a project may be cancelled or may not start in the year when it is announced.
5 The net value of cross-border M&As is computed as the difference between M&A gross sales (all MNE cross-border acquisitions) and divestment of sales (sales from MNEs to domestic entities or to other MNEs). It reflects the M&A component of FDI flows.
6 In this context, the term “divestment” refers to the sale of MNEs to domestic companies or to other MNEs. It does not include liquidation and capital impairment.
7 Data from Bain Capital. 8 GIC Annual Report 2013/2014.9 Because of low numbers of responses from Africa and the
Middle East, the two regions are combined to enhance statistical credibility. This action hides subregional differences within Africa and regional differences between Africa and West Asia.
10 For example, see “Chinese go on spending spree and double investment in Europe”, Financial Times, 10 February 2015.
11 This survey obtained responses from 54 IPAs in 51 countries.
REFERENCES
IMF (2015). World Economic Outlook April 2015: Uneven Growth: Short- and Long-Term Factors. Washington, D.C.: International Monetary Fund.
United Nations (2015). World Economic Situation and Prospects 2015. Update as of mid-2015. New York: United Nations.
WIR06. World Investment Report 2006: FDI from Developing and Transition Economies: Implications for
Development. New York and Geneva: United Nations.
WIR14. World Investment Report 2014: Investing in the SDGs: An Action Plan. New York and Geneva: United Nations.


RegionalInvestment TrendsC H A P T E R I I

World Investment Report 2015: Reforming International Investment Governance30
Global foreign direct investment (FDI) inflows fell by 16 per cent overall in 2014 to $1.23 trillion, down from $1.47 trillion in 2013, but with considerable variance between country groups and regions.
FDI flows to developing economies increased by 2 per cent to reach their highest level at $681 billion in 2014, accounting for 55 per cent of global FDI inflows (table II.1). Five of the top 10 host economies now are developing ones. However, the increase in developing-country inflows is, overall, primarily a developing Asia story. FDI inflows to that region grew by 9 per cent to $465 billion, constituting the lion’s share of total FDI in developing economies. Africa’s overall inflows remained flat at $54 billion, while those to Latin America and the Caribbean saw a 14 per cent decline to $159
billion, after four years of consecutive increases. FDI to transition economies dropped by more than half to $48 billion. Inflows to developed economies as a whole fell by 28 per cent to $499 billion, decreasing both in Europe and North America. Flows to Europe fell by 11 per cent to $289 billion, one third of their 2007 peak, while in North America FDI dropped 51 per cent to $146 billion.
Outward FDI from developing economies increased by 23 per cent in 2014, to $468 billion. In contrast, net investment by developed countries was flat, primarily because a large expansion in cross-border mergers and acquisitions (M&As) by some developed-country multinational enterprises (MNEs) was offset by large divestments by others. FDI outflows from
INTRODUCTION
Region FDI inflows FDI outflows2012 2013 2014 2012 2013 2014
World 1 403 1 467 1 228 1 284 1 306 1 354Developed economies 679 697 499 873 834 823
Europe 401 326 289 376 317 316North America 209 301 146 365 379 390
Developing economies 639 671 681 357 381 468Africa 56 54 54 12 16 13Asia 401 428 465 299 335 432
East and South-East Asia 321 348 381 266 292 383South Asia 32 36 41 10 2 11West Asia 48 45 43 23 41 38
Latin America and the Caribbean 178 186 159 44 28 23Oceania 4 3 3 2 1 0
Transition economies 85 100 48 54 91 63Structurally weak, vulnerable and small economiesa 58 51 52 10 13 10
LDCs 24 22 23 5 7 3LLDCs 34 30 29 2 4 6SIDS 7 6 7 2 1 1
Memorandum: percentage share in world FDI flowsDeveloped economies 48.4 47.5 40.6 68.0 63.8 60.8
Europe 28.6 22.2 23.5 29.3 24.3 23.3North America 14.9 20.5 11.9 28.5 29.0 28.8
Developing economies 45.6 45.7 55.5 27.8 29.2 34.6Africa 4.0 3.7 4.4 1.0 1.2 1.0Asia 28.6 29.2 37.9 23.3 25.7 31.9
East and South-East Asia 22.9 23.7 31.0 20.7 22.4 28.3South Asia 2.3 2.4 3.4 0.8 0.2 0.8West Asia 3.4 3.0 3.5 1.8 3.1 2.8
Latin America and the Caribbean 12.7 12.7 13.0 3.4 2.2 1.7Oceania 0.3 0.2 0.2 0.1 0.1 0.0
Transition economies 6.1 6.8 3.9 4.2 7.0 4.7Structurally weak, vulnerable and small economiesa 4.1 3.5 4.3 0.7 1.0 0.8
LDCs 1.7 1.5 1.9 0.4 0.6 0.2LLDCs 2.5 2.0 2.4 0.2 0.3 0.4SIDS 0.5 0.4 0.6 0.2 0.1 0.1
Source: UNCTAD, FDI/MNE database (www.unctad.org/fdistatistics).a Without double counting countries that are part of multiple groups.Note: LDCs = least developed countries, LLDCs = landlocked developing countries, SIDS = small island developing States.
Table II.1. FDI flows, by region, 2012–2014 (Billions of dollars and per cent)

CHAPTER II Regional Investment Trends 31
transition economies fell by 31 per cent to $63 billion as natural-resources-based MNEs, mainly from the Russian Federation, reduced their investment abroad. Developing economies now account for more than one third of global FDI outflows, up from about just one tenth in 2000.
FDI flows to structurally weak, vulnerable and small
economies increased by 3 per cent to $52 billion, but with divergent trends: flows to least developed countries (LDCs) and small island developing States (SIDS) rose by 4.1 per cent and 22 per cent, respectively; landlocked developing countries (LLDCs) saw a decrease of 2.8 per cent.
The outcome of the first Conference on Financing for Development, the Monterrey Consensus of 2002, was a pledge by participants to mobilize financial assistance for developing economies in six principal areas, which include mobilizing international financial resources, such as FDI.1 Both then and since, particular concern has focused on mobilizing financing and investment for the structurally weak, vulnerable and
small economies, in order to ensure robust, resilient
growth and sustainable development. Over the past
decade (2004–2014), FDI stock tripled in LDCs and
SIDS, and quadrupled in LLDCs. With a concerted
effort by the international investment-development
community, it would be possible to have FDI stock
in these structurally weak economies quadruple
by 2030 from today’s level. And more important,
further efforts are needed to harness financing for
economic diversification to foster greater resilience
and sustainability in these countries.
At the third Conference on Financing for Development
on 13–16 July 2015 in Addis Ababa, and at the
global summit on the Sustainable Development Goals
in New York on 25–27 September 2015, external
financing for development will come again under the
spotlight, as will the performance of FDI in developing
economies since the Monterrey conference. In light of
this background, section B of this chapter includes a
stocktaking of FDI trends in LDCs, LLDCs and SIDS
since 2002, in addition to analysis of last year’s trends.

Inward FDI stock by sector (Percentage of the total inward FDI stock in subregion)
South Africa
Angola
Nigeria
Togo
Libya
+4.3%$6.9
$2.1
$1.6
$0.9
$0.5
-65%
+30%
+422%
..
Out�ows: top 5 home economies (Billions of dollars, and 2014 growth)
Above $3.0 bn
$2.0 to $2.9 bn
$1.0 to $1.9 bn
$0.5 to $0.9 bn
Below $0.5 bn
Top 5 host economies
Economy$ Value of in�ows2014 % Change
FDI in�ows, top 5 host economies, 2014(Value and change)
AFRICA -0.1%2014 Decrease
54 bn2014 In�ows
4.4%Share in world
48
31
21
1
Unspeci�edx
Manufacturing
Services
Primary
Flows, by range
A. REGIONAL TRENDS
Congo$5.5 bn+88.8%
Nigeria$4.7 bn-16.3%
South Africa $5.7 bn-31.2%
Mozambique$4.9 bn-20.6%
Egypt$4.8 bn+14.1%
Source: UNCTAD.Note: The boundaries and names shown and the designations used on this map do not imply official endorsement or acceptance by the United Nations.
Final boundary between the Republic of Sudan and the Republic of South Sudan has not yet been determined. Final status of the Abyei area is not yet determined.

HIGHLIGHTS
2008 2009 2010 2011 2012 2013 2014 2008 2009 2010 2011 2012 2013 20140
15
30
45
60
75
-4
-2
0
2
4
6
8
10
12
14
16
North Africa East Africa West Africa Southern Africa Central Africa
Share in world total
3.9 4.6 3.3 3.1 4.0 3.7 4.4 0.6 0.6 0.7 0.4 1.0 1.2 1.0
2008 2009 2010 2011 2012 2013 2014
East Asia South-East Asia
2008 2009 2010 2011 2012 2013 20140
100
200
300
400
0
100
200
300
400
2008 2009 2010 2011 2012 2013 2014 2008 2009 2010 2011 2012 2013 20140
10
20
30
40
50
60
0
5
10
15
20
25
Share in world total
3.8 3.6 2.6 2.8 2.3 2.4 3.4 1.3 1.5 1.2 0.8 0.8 0.2 0.8
2008 2009 2010 2011 2012 2013 2014 2008 2009 2010 2011 2012 2013 20140
20
40
60
80
100
0
10
20
30
40
50
TurkeyOther West Asia Gulf Cooperation Council (GCC)
Share in world total
6.3 6.0 4.5 3.4 3.4 3.0 3.5 2.2 1.6 1.3 2.0 1.8 3.1 2.8
Share in world total
15.9 17.7 23.1 20.9 22.9 23.7 31.0 9.8 16.4 18.3 16.9 20.7 22.4 28.3
2008 2009 2010 2011 2012 2013 2014
Caribbean, excluding �nancial centers Central America South America
Georgia Commonwealth of Independent States
2008 2009 2010 2011 2012 2013 2014
2008 2009 2010 2011 2012 2013 2014 2008 2009 2010 2011 2012 2013 2014
South-East Europe
2008 2009 2010 2011 2012 2013 2014 2008 2009 2010 2011 2012 2013 2014
Africa Latin America and the Caribbean Asia Oceania
2008 2009 2010 2011 2012 2013 2014 2008 2009 2010 2011 2012 2013 2014
2008 2009 2010 2011 2012 2013 2014 2008 2009 2010 2011 2012 2013 2014
0
50
100
150
200
250
0
50
100
0
25
50
75
100
125
0
20
40
60
80
100
0
5
10
15
20
25
30
0
1
2
3
4
5
6
7
8
0
5
10
15
20
25
30
35
40
0
2
4
6
8
10
0
1
2
3
4
5
6
7
8
9
10
0
0.5
1
1.5
2
2.5
Share in world total
9.2 7 9.9 10.5 12.7 12.7 13 2.3 1.2 3.4 2.3 3.4 2.2 1.7
Share in world total
7.8 5.9 5.6 6.2 6.1 6.8 3.9 3.5 4.3 4.5 4.6 4.2 7.0 4.7
Share in world total
1.2 1.4 1.8 1.4 1.7 1.5 1.9 0.2 0.1 0.2 0.3 0.4 0.6 0.2
Share in world total
1.7 2.2 2.0 2.3 2.5 2.0 2.4 0.1 0.4 0.7 0.4 0.2 0.3 0.4
Share in world total
0.6 0.4 0.3 0.4 0.5 0.4 0.6 0.1 0.0 0.0 0.1 0.2 0.1 0.1
North America Other developed Europe European Union
2008 2009 2010 2011 2012 2013 2014 2008 2009 2010 2011 2012 2013 2014
Other developed countries
0
400
800
1 200
1 600
0
400
800
1 200
1 600
Share in world total
52.9 55.0 50.7 52.9 48.4 47.5 40.6 80.3 74.4 70.5 72.8 68.0 63.8 60.8
Transition economies Asia and Oceania Latin America and the Caribbean Africa
Oceania Asia Latin America and the Caribbean Africa
Sector/industryAfrica
as destinationAfrica
as investors2013 2014 2013 2014
Total 55 124 88 295 17 402 13 386 Primary 6 114 21 974 7 48
Mining, quarrying and petroleum 3 750 21 974 7 48 Manufacturing 14 722 28 787 8 013 3 848
Food, beverages and tobacco 1 437 2 099 535 1 214 Textiles, clothing and leather 1 744 2 091 126 23 Non-metallic mineral products 3 921 2 213 2 805 1 918 Motor vehicles and other transport equipment 1 642 1 585 98 15
Services 34 287 37 534 9 382 9 490 Electricity, gas and water 11 537 10 648 - 125 Construction 3 536 9 229 1 005 462 Transport, storage and communications 7 774 5 909 2 919 2 305
Business services 7 099 6 323 2 656 4 949
Table A. Announced greenfield FDI projects by industry, 2013–2014 (Millions of dollars)
Sector/industrySales Purchases
2013 2014 2013 2014Total 3 829 5 058 3 019 5 446
Primary 135 2 566 289 1 595 Mining, quarrying and petroleum 135 2 556 289 1 595
Manufacturing 3 326 326 1 632 209 Food, beverages and tobacco 1 023 22 244 35 Paper and paper products -5 -101 - -101 Pharmaceuticals, medicinal chemicals and botanical products 567 51 1 310 -51
Basic metal and metal products - 301 - - Services 368 2 166 1 098 3 642
Electricity, gas, water and waste management 250 58 - 1 176
Transportation and storage 27 425 27 74 Financial and insurance activities 222 1 419 653 228 Business activities 104 12 135 129
Table C. Cross-border M&As by industry, 2013–2014 (Millions of dollars)
Partner region/economyAfrica
as destinationAfrica
as investors2013 2014 2013 2014
World 55 124 88 295 17 402 13 386 Developed economies 28 010 63 024 2 742 1 112
European Union 16 939 46 957 1 575 939
France 2 070 18 931 297 127
United States 2 559 8 014 1 121 39
Developing economies 27 013 25 180 14 587 12 274
Africa 13 082 10 209 13 082 10 209
Nigeria 2 260 545 2 784 1 321
South Africa 5 379 4 789 343 176
Asia 13 735 14 886 1 421 1 769
China 289 6 132 454 92
India 5 311 1 122 83 107
Transition economies 101 90 74 -
Table B. Announced greenfield FDI projects by region/country, 2013–2014 (Millions of dollars)
Region/countrySales Purchases
2013 2014 2013 2014World 3 829 5 058 3 019 5 446
Developed economies -8 953 -8 317 2 288 1 670 European Union -4 831 -6 886 1 641 154
France -2 310 -5 648 147 246 United States -4 751 -1 801 -15 21
Developing economies 12 769 13 331 731 3 783 Africa 130 2 424 130 2 424 Latin America and the Caribbean -430 400 - 1 094
Asia 13 069 10 507 596 265 India 419 2 730 233 137 Qatar 2 529 729 - - United Arab Emirates 538 5 677 29 -
Transition economies - - - -6
Table D. Cross-border M&As by region/country, 2013–2014 (Millions of dollars)
Figure A. FDI in�ows, 2008−2014 (Billions of dollars)
Figure B. FDI out�ows, 2008−2014(Billions of dollars)
• Increasing investment by developing-economy MNEs • Services: largest sector in Africa’s stock of FDI• FDI in services concentrated in a few countries

World Investment Report 2015: Reforming International Investment Governance34
FDI inflows to Africa remained flat at $54 billion,
decreasing in North Africa and rising in Sub-Saharan
Africa.
North Africa saw its FDI flows decline by 15 per cent to $11.5 billion, while flows to Sub-Saharan Africa rose by 5 per cent to $42.4 billion. As a percentage of global FDI flows, though, Africa’s share increased to 4.4 per cent, from 3.7 per cent in 2013. Slow global economic growth may make the faster-growing African economies relatively more attractive, especially to emerging-market investors; at the same time, future growth prospects in key markets such as Nigeria and Zambia are weakening, as commodity prices fall. Important drivers that shape FDI trends to Africa include rising intra-African FDI; expansion by emerging-market firms (increasingly from West Asia) and non-traditional actors (private equity); and growing consumer markets, with the food and beverages industry having another standout year.
In North Africa, the decline in flows to Algeria, Libya, the Sudan, South Sudan and Tunisia was larger than the rise of flows in Egypt and Morocco. FDI flows to Egypt grew by 14 per cent to $4.8 billion, driven by investments in oil and construction projects. Morocco also saw increased FDI flows, growing 8.6 per cent to $3.6 billion. In 2014, Algeria saw its FDI flows almost halved from the level in the previous year, due to a 87 per cent fall in announced greenfield investment. The continuing unrest in Libya negatively influenced investors’ perception of the region’s potential as an FDI host.
FDI flows to West Africa declined by 10 per cent to $12.8 billion, as Ebola, regional conflicts and falling commodity prices affected several countries. In those affected by Ebola, several companies either closed or suspended their expansion; e.g. in Sierra Leone, Africa Minerals (25 per cent Chinese owned) closed its flagship mine Tonkolili, and in Liberia, ArcelorMittal (Luxembourg) suspended an iron ore expansion project after contractors moved staff out of the country. Nigeria − the largest host country in the continent − saw its FDI flows fall by 16 per cent, as it moves away from overdependence on oil and diversifies into non-oil sectors.
East Africa saw its FDI flows increasing by 11 per cent, to $6.8 billion. The gas sector in the United Republic of Tanzania, which has enormous potential, drew FDI despite political wrangling over its future. In Ethiopia,
the expanding textiles sector continued to attract FDI with its low wages and cheap power.2
Central Africa received $12.1 billion, up 33 per cent from 2013. FDI flows in the Republic of the Congo almost doubled to $5.5 billion as foreign investors continued investing in the oil refinery, despite falling commodity prices (for example Berven Group International Development (United States) signed an agreement with the government to build the country’s second oil refinery for $1.6 billion). The Democratic Republic of the Congo continued to attract notable flows, despite falling copper prices. Glencore significantly upgraded the Democratic Republic of the Congo’s main hydroelectric plant as mining companies looked to overcome bottlenecks in power supplies.
Flows to Southern Africa fell by 2 per cent to $10.8 billion. Mozambique saw its flows decline by 21 per cent to $4.9 billion, despite a significant rise in cross-border M&As in the oil and gas industry (for example, ONGC Videsh Ltd (India) acquired a 10 per cent stake in Rovuma Offshore Area 1 for $2.6 billion). South Africa − the largest host country in the subregion − received $5.7 billion, down 31 per cent from 2013.
MNEs from developing economies continue to invest in Africa, targeting assets relinquished by developed-country MNEs. Although developed countries continue to account for the largest share of FDI stock, the investment of developing-country MNEs is increasing, as reflected in cross-border M&As and announced greenfield FDI projects. MNEs from developed economies (in particular, France and the United Kingdom) continued to divest from Africa. Demand from developing-economy investors for these divested assets was significant; for instance, Emirates Telecommunications Corp (United Arab Emirates) bought a 53 per cent stake in Itissalat Al Maghrib SA − a foreign affiliate of Vivendi (France) – for $5.7 billion.
Chinese and Indian firms continue to be notable investors in Africa, with Tata investing in Algeria in 2014 and Chinese firms investing in South Africa’s solar panel industry. The rise of non-traditional investors, especially from the United Arab Emirates, particularly Dubai, has been a new factor underpinning FDI flows into Africa in recent years. The country accounted for 6 per cent of total capital expenditure related to greenfield FDI projects into Africa in 2014, targeting consumer industries, infrastructure and services.3 Other major deals from this region include one by

CHAPTER II Regional Investment Trends 35
Qatar National Bank, the Gulf’s largest lender, which paid $500 million to become the largest stakeholder in pan-African lender Ecobank.
Private equity drove many of the largest investments into Africa in 2014. Private equity group KKR (United States) made its first direct investment in Africa in 2014, investing $200 million in Ethiopian rose producer Afriflora. Carlyle secured nearly $700 million for its first Sub-Saharan African fund in early 2014, which it began to use by investing in TiAuto, a vehicle retailer in South Africa, as well as taking an 18 per cent stake ($50 million) in Nigerian lender Diamond Bank. Private equity firm Blackstone entered into a partnership with Nigerian businessman Aliko Dangote to invest across the region, and Edmond de Rothschild opened its first private equity fund focused on Africa.
Sectoral investment trends in 2014 reflect the continued importance of services and manufacturing investments. Some 38 per cent of announced greenfield FDI projects and 33 per cent of related capital expenditure were in manufacturing in 2014. The services sector recorded 60 per cent of projects and 43 per cent of capital expenditures. Unusually high planned capital expenditures in services FDI were due to a notable pickup in announced construction projects. Noteworthy investments took place in manufacturing in Africa, mainly in electronic equipment, motor vehicles and food. In Nigeria, Nissan, Peugeot and Hyundai all began auto assembly in 2014. Nigeria’s Automotive Industry Plan (introduced in 2012) has been important in the industry’s expansion, positioning itself within the emerging automotive regional value chains. Food and beverages FDI is another beneficiary of growing consumer markets in Africa, with several large deals in 2014; e.g. Danone (France) bought a 40 per cent stake in Brookside Dairy, East Africa’s largest milk processor, based in Kenya.
FDI outflows from Africa decreased by 18 per cent, from $16 billion in 2013 to $13 billion in 2014. Services continued to be the focus of African firms’ outward FDI. In cross-border M&As, South Africa’s Woolworths announced plans to acquire David Jones, the Australian department store, in a deal valued at $2.14 billion.
Intra-African FDI remained preponderant in 2014. The share of intraregional greenfield investments by African firms in total announced greenfield investments
in Africa remained similar to the 2013 figures, at 76 per cent in terms of value and 68 per cent in the number of projects. Intra-African M&As accounted for 45 per cent of total cross-border M&A purchases by African firms, with Nigeria accounting for a large portion of sales and purchases. South African firms remained important investors: Nedbank agreed to purchase a 20 per cent stake in Togo’s Ecobank for $0.5 billion, while Shoprite will open 30 new stores on the continent by June 2015.
The potential of FDI into Africa’s services sector
Services is the largest sector in Africa’s stock of FDI. Available data show that Africa’s services FDI stock increased four-fold between 2001 and 2012. The share of services FDI stock in the continent is still lower than the corresponding global and developing-country shares. In 2012 (the latest year for which data are available), although concentrated in a few countries, services FDI nonetheless accounted for 48 per cent of Africa’s total stock of FDI, more than twice the share of manufacturing (21 per cent) and significantly more than the primary sector (31 per cent) (figure II.1).
Confirmation of the importance of FDI in services can be seen in announced greenfield investment data:4 the sector accounted for the majority of greenfield FDI projects into Africa and the largest single portion of related planned capital expenditure in 2014. For the 2003–2014 period, including the period when the commodity boom was in full swing, 38 per cent of planned capital expenditure (and 55 per cent of projects) related to announced greenfield FDI projects were in the services sector, more than in either the manufacturing sector or the primary sector.
The stock of services FDI in Africa is concentrated. In North Africa, where the services sector accounts for more than 60 per cent of the subregion’s total FDI stock, Morocco has grown as a services hub in the subregion, through its efforts to position itself as a gateway to the continent. The array of incentives offered by Casablanca’s “Finance City” have helped attract major MNEs such as BNP Paribas, AIG, Boston Consulting Group, Microsoft and Ford to move their regional headquarters there. Factors such as substantial investment in infrastructure (especially in information and communication technology (ICT)), a strong skills base, political stability and proximity to Europe make Morocco well placed to attract services FDI.

World Investment Report 2015: Reforming International Investment Governance36
Services FDI, at 61 per cent of Morocco’s inward FDI stock ($45 billion), is the largest component of the country’s FDI and has been consistently so over the past decade. In 2012, some 29 per cent of Morocco’s stock of services FDI was held in transport, storage and communications (with more than half in telecommunications), followed by real estate (27 per cent) and finance (15 per cent).
In Sub-Saharan Africa, South Africa predominates in the services sector. Over the past decade, South Africa’s stock of manufacturing FDI has shrunk relative to services FDI. By 2012 finance and business services alone accounted for the major portion of its inward FDI stock at 36 per cent. When other industries are included, such as transport and retail, the services
sector accounted for 51 per cent, the primary sector (mining) for 31 per cent, and manufacturing for 18 per cent of the country’s inward FDI stock. Two financial industry investments that considerably increased South Africa’s – and Africa’s – services FDI stock were the purchase by Barclays Bank of over 50 per cent of Absa Bank for R33 billion in 2005 ($2.7 billion in current prices); and the purchase by China’s largest bank, the Industrial and Commercial Bank of China (ICBC), of a 20 per cent stake in Standard Bank for R36.7 billion in 2007 ($3 billion).5
Growth in the rest of Africa has been a primary reason why South Africa’s services sector has received strong inflows, as companies look to use that country as a base from which to expand regionally. Notable non-financial examples are MNEs setting up Africa-oriented information technology services and call centres in the country (e.g. Wipro of India’s establishment of a software company in 2014) and investments in hospitality (e.g. Marriott’s acquisition of the 116-hotel Protea Hotel Group, completed in 2014).
In contrast to South Africa, Nigeria’s services sector has attracted FDI oriented mostly to the local market. At $30 billion, services FDI accounted for 39 per cent of Nigeria’s inward stock in 2012. Finance accounted for the largest portion, at 63 per cent (indicating the importance of foreign – and especially African – banks in advancing into Nigeria’s retail banking market), followed by transport, storage and communications (26 per cent), and construction (9 per cent).
Finance accounts for the major portion of Africa’s stock of services FDI. By 2012 more than half of Africa’s services FDI stock was held in finance (56 per cent), followed by transport, storage and communications (21 per cent) and business activities (9 per cent) (figure II.2). FDI in tourism, though significant, is spread across a number of service industries. FDI in service industries is demonstrating. For instance, financial FDI inflows amounted to 11 per cent of total FDI inflows into Africa in 2010–2012. In absolute terms, inflows in this industry expanded from 30 per cent ($0.9 billion) to 35 per cent ($3.4 billion) of services FDI between 2001–2003 and 2010–2012.
Infrastructure and other services, including telecommunications, are becoming increasingly salient. The stock of FDI into the transport, storage and communications industry grew more than four-fold between 2001 and 2012, from $8 billion to
Figure II.1
Africa's inward FDI stock by sector and by subregion, 2012(Percentage of total inward FDI stock in region and subregion)
Africa as a whole
North Africa
4 7
2761
48
31
21
1
Sub-Saharan Africa
Unspeci�edManufacturing ServicesPrimary
20
35
45
Source: UNCTAD, FDI/MNE database (www.unctad.org/fdistatistics).Note: Where 2012 numbers are unavailable, 2011 data are used. Data used
here account for 20 per cent and 68 per cent, respectively, of total stock in North Africa and Sub-Saharan Africa.
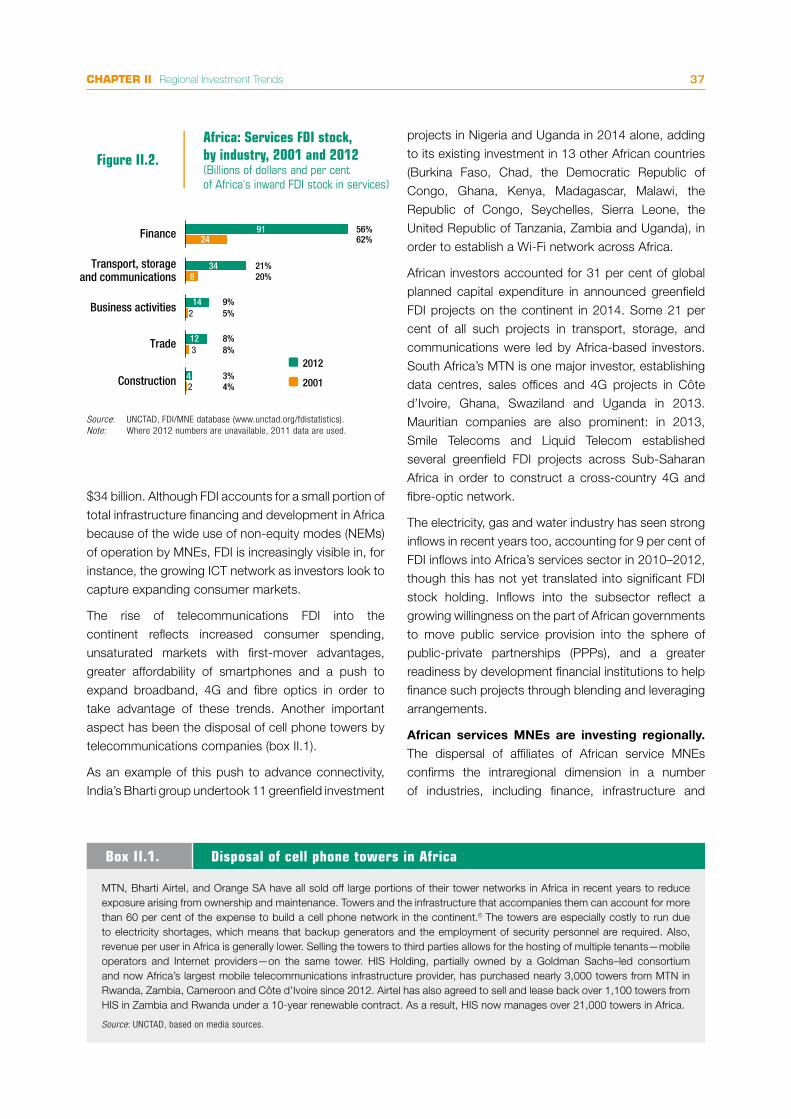
CHAPTER II Regional Investment Trends 37
$34 billion. Although FDI accounts for a small portion of total infrastructure financing and development in Africa because of the wide use of non-equity modes (NEMs) of operation by MNEs, FDI is increasingly visible in, for instance, the growing ICT network as investors look to capture expanding consumer markets.
The rise of telecommunications FDI into the continent reflects increased consumer spending, unsaturated markets with first-mover advantages, greater affordability of smartphones and a push to expand broadband, 4G and fibre optics in order to take advantage of these trends. Another important aspect has been the disposal of cell phone towers by telecommunications companies (box II.1).
As an example of this push to advance connectivity, India’s Bharti group undertook 11 greenfield investment
projects in Nigeria and Uganda in 2014 alone, adding to its existing investment in 13 other African countries (Burkina Faso, Chad, the Democratic Republic of Congo, Ghana, Kenya, Madagascar, Malawi, the Republic of Congo, Seychelles, Sierra Leone, the United Republic of Tanzania, Zambia and Uganda), in order to establish a Wi-Fi network across Africa.
African investors accounted for 31 per cent of global planned capital expenditure in announced greenfield FDI projects on the continent in 2014. Some 21 per cent of all such projects in transport, storage, and communications were led by Africa-based investors. South Africa’s MTN is one major investor, establishing data centres, sales offices and 4G projects in Côte d’Ivoire, Ghana, Swaziland and Uganda in 2013. Mauritian companies are also prominent: in 2013, Smile Telecoms and Liquid Telecom established several greenfield FDI projects across Sub-Saharan Africa in order to construct a cross-country 4G and fibre-optic network.
The electricity, gas and water industry has seen strong inflows in recent years too, accounting for 9 per cent of FDI inflows into Africa’s services sector in 2010–2012, though this has not yet translated into significant FDI stock holding. Inflows into the subsector reflect a growing willingness on the part of African governments to move public service provision into the sphere of public-private partnerships (PPPs), and a greater readiness by development financial institutions to help finance such projects through blending and leveraging arrangements.
African services MNEs are investing regionally. The dispersal of affiliates of African service MNEs confirms the intraregional dimension in a number of industries, including finance, infrastructure and
Source: UNCTAD, FDI/MNE database (www.unctad.org/fdistatistics).Note: Where 2012 numbers are unavailable, 2011 data are used.
2001
2012
Construction
Trade
Business activities
Transport, storageand communications
Finance 56%9124
348
142
123
42
62%
9%5%
21%20%
3%4%
8%8%
Figure II.2.
Africa: Services FDI stock, by industry, 2001 and 2012(Billions of dollars and per cent of Africa's inward FDI stock in services)
MTN, Bharti Airtel, and Orange SA have all sold off large portions of their tower networks in Africa in recent years to reduce exposure arising from ownership and maintenance. Towers and the infrastructure that accompanies them can account for more than 60 per cent of the expense to build a cell phone network in the continent.6 The towers are especially costly to run due to electricity shortages, which means that backup generators and the employment of security personnel are required. Also, revenue per user in Africa is generally lower. Selling the towers to third parties allows for the hosting of multiple tenants—mobile operators and Internet providers—on the same tower. HIS Holding, partially owned by a Goldman Sachs–led consortium and now Africa’s largest mobile telecommunications infrastructure provider, has purchased nearly 3,000 towers from MTN in Rwanda, Zambia, Cameroon and Côte d’Ivoire since 2012. Airtel has also agreed to sell and lease back over 1,100 towers from HIS in Zambia and Rwanda under a 10-year renewable contract. As a result, HIS now manages over 21,000 towers in Africa.
Source: UNCTAD, based on media sources.
Box II.1. Disposal of cell phone towers in Africa
World Investment Report 2015: Reforming International Investment Governance38
trade. UNCTAD7 identified more than 500 African service MNEs, with some 2,700 overseas affiliates, half of them in other African countries. In industries other than finance, more than 60 African MNEs in both infrastructure and trade have expanded abroad, reflecting demand for these services. In trade, three quarters of 265 foreign affiliates are located within Africa, while in infrastructure two fifths are intraregional. Similarly, MNEs in the financial services sector have both a domestic and regional focus. Africa’s growing consumer markets, financial deregulation and the regional orientation of financial firms are factors in intra-African investment flows (box II.2).
The potential for services FDI to develop Africa’s economy is significant. FDI in services is important in supporting the participation of African economies in global value chains, as an increasing part of value added in trade consists of services. It is also important in the context of financing progress towards the sustainable development goals. As shown in WIR14, the principal investment gaps are in infrastructure industries and vital public services. Increasing attractiveness for services FDI therefore constitutes an opportunity for policymakers. At the same time, it is important to ensure continued affordability and accessibility of services provision for all.
Intra-African FDI has played a vital role in driving Africa’s burgeoning financial industry, especially in retail banking services (Krüger and Strauss, 2015). Financial services accounted for about 50 per cent of intra-Africa greenfield investment projects between 2003 and the start of 2014, with about 38 per cent of these projects in retail banking, and 5 per cent in insurance.
Intra-African FDI into the financial industry has been led by banks from Kenya (Kenya Commercial Bank and Guaranty Trust Bank/Fina Bank), Nigeria (United Bank for Africa) and South Africa (FirstRand and Standard Bank). The geographical spread of these services has been impressive: South Africa’s Standard Bank operates in 20 countries in Africa; Ecobank, a Togo-based pan-African bank in 36; and Nigeria’s United Bank for Africa in 19. There has also been strong regional expansion by banks from North Africa – especially Banque Marocaine du Commerce Extérieur and Libya Foreign Arab Bank. Much of this expansion has occurred since the 2008 financial crisis. For example, in response to the crisis, South Africa’s Standard Bank sold off its global operations and focused on becoming an African bank.
UNCTAD’s database on foreign affiliates, which is based on data from Bureau van Dijk’s Orbis database, reports 114 financial companies headquartered in Africa that have established 465 affiliates in other countries, three quarters of them located in the continent.
Source: UNCTAD, based on various sources.
Box II.2. The contribution of intra-African services FDI to development of Africa’s financial industry

FDI in�ows, top 5 host economies, 2014(Value and change)
EAST & SOUTH-EAST ASIA+9.6%
2014 Increase
381 bn2014 In�ows
31%Share in world
+76.7%
+14.9%
+41.1%
Hong Kong,China
China
Singapore
Malaysia
Rep. of Korea
$142.7
$116
$40.7
$30.6
$16.4
+7.8%
+16.6%
Flows, by range
Above $50 bn
$10 to $49 bn
$1.0 to $9.9 bn
$0.1 to $0.9 bn
Below $0.1 bn
Out�ows: top 5 home economies (Billions of dollars, and 2014 growth)
Top 5 host economies
Economy$ Value of in�ows2014 % Change
East and South-East Asia: Cross-border M&As and announced green�eld investments in infrastructure industries, 2012–2014 (Billions of dollars)
2012 2013 2014
715
6
29
17 19
Value of cross-border M&As Value of announced green�eld projects
Hong Kong, China$103.3 bn
+39%
Singapore$67.5 bn+4.2%
Thailand$12.6 bn-10.3%
Indonesia$22.6 bn
+20%
China$128.5 bn
+3.7%
Source: UNCTAD. Note: The boundaries and names shown and the designations used on this map do not imply official endorsement or acceptance by the United Nations.

Table C. Cross-border M&As by industry, 2013–2014 (Millions of dollars)
Table D. Cross-border M&As by region/country, 2013–2014 (Millions of dollars)
Partner region/economy Sales Purchases2013 2014 2013 2014
World 33 344 80 653 91 009 125 250 Developed economies 6 065 8 720 50 834 44 887
European Union -5 814 9 682 8 927 18 063 United Kingdom 721 1 767 3 033 5 673
United States 5 038 -3 269 11 279 12 597 Australia -270 -1 065 6 861 7 737 Japan 9 005 4 894 1 676 2 801
Developing economies 24 836 70 869 38 015 79 225 Africa 334 119 9 456 1 358 Asia and Oceania 23 723 70 750 25 713 72 855
China 2 330 10 148 19 018 49 601 Latin America and the Caribbean 779 - 2 846 5 012
Transition economies 597 447 2 160 1 138
Sector/industry Sales Purchases2013 2014 2013 2014
Total 33 344 80 653 91 009 125 250 Primary -3 489 496 10 902 7 361
Mining, quarrying and petroleum -3 492 172 10 845 7 657 Manufacturing 11 679 7 497 6 427 47 954
Food, beverages and tobacco 6 070 1 969 5 701 -1 879 Chemicals and chemical products 637 1 843 892 1 057 Basic metal and metal products 919 480 -2 339 42 161 Computer, electronic, optical products and electrical equipment 1 269 1 323 1 696 4 021
Services 25 154 72 660 73 680 69 935 Electricity, gas, water and waste management 1 216 899 4 873 5 955
Trade -4 630 6 213 792 2 373 Financial and insurance activities 15 010 53 781 59 246 54 103 Business activities 10 149 7 453 3 714 5 418
Sector/industry
East and South-East Asia as destination
East and South-East Asia
as investors2013 2014 2013 2014
Total 158 851 192 612 117 002 145 108 Primary 1 045 4 056 2 180 5 513
Mining, quarrying and petroleum 823 4 056 2 180 5 491 Manufacturing 81 779 106 402 24 241 69 877
Textiles, clothing and leather 5 591 6 519 1 367 4 276 Chemicals and chemical products 13 903 13 097 3 719 5 209
Electrical and electronic equipment 9 132 20 158 6 612 17 654
Motor vehicles and other transport equipment 18 155 28 896 3 157 19 098
Services 76 028 82 154 90 581 69 718 Electricity, gas and water 17 946 10 521 8 375 14 289 Construction 11 317 24 593 13 569 26 231 Finance 11 466 11 149 6 322 5 418 Business services 10 148 15 494 42 912 9 462
Partner region/economy
East and South-East Asia as destination
East and South-East Asia
as investors2013 2014 2013 2014
World 158 851 192 612 117 002 145 108 Developed economies 107 844 114 729 17 999 28 369
European Union 42 975 41 227 9 150 9 938 Germany 13 340 14 982 398 388 United Kingdom 8 668 6 286 4 503 5 503
United States 25 142 30 794 5 133 12 024 Japan 29 540 29 201 1 785 2 553
Developing economies 50 457 77 093 97 361 107 058 Africa 483 111 2 411 7 587 Asia and Oceania 49 107 76 530 43 651 88 413
China 3 724 14 073 20 541 28 499 Latin America and the Caribbean 867 451 51 299 11 058
Transition economies 550 789 1 643 9 681
HIGHLIGHTS
2008 2009 2010 2011 2012 2013 2014 2008 2009 2010 2011 2012 2013 20140
15
30
45
60
75
-4
-2
0
2
4
6
8
10
12
14
16
North Africa East Africa West Africa Southern Africa Central Africa
Share in world total
3.9 4.6 3.3 3.1 4.0 3.7 4.4 0.6 0.6 0.7 0.4 1.0 1.2 1.0
2008 2009 2010 2011 2012 2013 2014
East Asia South-East Asia
2008 2009 2010 2011 2012 2013 20140
100
200
300
400
0
100
200
300
400
2008 2009 2010 2011 2012 2013 2014 2008 2009 2010 2011 2012 2013 20140
10
20
30
40
50
60
0
5
10
15
20
25
Share in world total
3.8 3.6 2.6 2.8 2.3 2.4 3.4 1.3 1.5 1.2 0.8 0.8 0.2 0.8
2008 2009 2010 2011 2012 2013 2014 2008 2009 2010 2011 2012 2013 20140
20
40
60
80
100
0
10
20
30
40
50
TurkeyOther West Asia Gulf Cooperation Council (GCC)
Share in world total
6.3 6.0 4.5 3.4 3.4 3.0 3.5 2.2 1.6 1.3 2.0 1.8 3.1 2.8
Share in world total
15.9 17.7 23.1 20.9 22.9 23.7 31.0 9.8 16.4 18.3 16.9 20.7 22.4 28.3
2008 2009 2010 2011 2012 2013 2014
Caribbean, excluding �nancial centers Central America South America
Georgia Commonwealth of Independent States
2008 2009 2010 2011 2012 2013 2014
2008 2009 2010 2011 2012 2013 2014 2008 2009 2010 2011 2012 2013 2014
South-East Europe
2008 2009 2010 2011 2012 2013 2014 2008 2009 2010 2011 2012 2013 2014
Africa Latin America and the Caribbean Asia Oceania
2008 2009 2010 2011 2012 2013 2014 2008 2009 2010 2011 2012 2013 2014
2008 2009 2010 2011 2012 2013 2014 2008 2009 2010 2011 2012 2013 2014
0
50
100
150
200
250
0
50
100
0
25
50
75
100
125
0
20
40
60
80
100
0
5
10
15
20
25
30
0
1
2
3
4
5
6
7
8
0
5
10
15
20
25
30
35
40
0
2
4
6
8
10
0
1
2
3
4
5
6
7
8
9
10
0
0.5
1
1.5
2
2.5
Share in world total
9.2 7 9.9 10.5 12.7 12.7 13 2.3 1.2 3.4 2.3 3.4 2.2 1.7
Share in world total
7.8 5.9 5.6 6.2 6.1 6.8 3.9 3.5 4.3 4.5 4.6 4.2 7.0 4.7
Share in world total
1.2 1.4 1.8 1.4 1.7 1.5 1.9 0.2 0.1 0.2 0.3 0.4 0.6 0.2
Share in world total
1.7 2.2 2.0 2.3 2.5 2.0 2.4 0.1 0.4 0.7 0.4 0.2 0.3 0.4
Share in world total
0.6 0.4 0.3 0.4 0.5 0.4 0.6 0.1 0.0 0.0 0.1 0.2 0.1 0.1
North America Other developed Europe European Union
2008 2009 2010 2011 2012 2013 2014 2008 2009 2010 2011 2012 2013 2014
Other developed countries
0
400
800
1 200
1 600
0
400
800
1 200
1 600
Share in world total
52.9 55.0 50.7 52.9 48.4 47.5 40.6 80.3 74.4 70.5 72.8 68.0 63.8 60.8
Transition economies Asia and Oceania Latin America and the Caribbean Africa
Oceania Asia Latin America and the Caribbean Africa
Figure A. FDI in�ows, 2008−2014 (Billions of dollars)
Figure B. FDI out�ows, 2008−2014(Billions of dollars)
• East and South-East Asia: largest recipient subregions• China: largest FDI recipient • Infrastructural connectivity intensifies
Table A. Announced greenfield FDI projects by industry, 2013–2014 (Millions of dollars)
Table B. Announced greenfield FDI projects by region/country, 2013–2014 (Millions of dollars)

CHAPTER II Regional Investment Trends 41
Despite the slowdown in economic growth in East and
South-East Asia, FDI inflows to the region remained
resilient. Combined inflows grew by 10 per cent to
a historical high of $381 billion in 2014. As a result,
East and South-East Asia together continues to be the
largest recipient region in the world. Both subregions
saw growth: inflows to East Asia rose by 12 per cent
to $248 billion, while those to South-East Asia rose
5 per cent, to $133 billion. Infrastructural connectivity
is intensifying, with MNEs providing much of the
investment; in particular, their contributions through
NEMs are significant.
China has surpassed the United States to become the largest FDI recipient in the world. FDI inflows to China reached $129 billion in 2014, an increase of about 4 per cent. This was driven mainly by an increase in FDI to the services sector, particularly in retail, transport and finance, while FDI fell in manufacturing, especially in industries that are sensitive to rising labour costs. FDI inflows in services surpassed the share of manufacturing for the first time in 2011. In 2014, the share of services climbed to 55 per cent, while that of manufacturing dropped to 33 per cent. Among major investing countries, the Republic of Korea’s investment in China rose by nearly 30 per cent in 2014, and the European Union (EU) experienced a slight increase. By contrast, FDI flows from Japan and the United States declined by 39 per cent and 21 per cent, respectively.
FDI outflows from China reached $116 billion. They continued to grow faster than inflows. FDI outflows from China grew by 15 per cent to a record-high $116 billion; increasing faster than inflows into the country. Overseas acquisitions have become an increasingly important means of international expansion by some Chinese financial institutions. For instance, through six cross-border M&As during a short period between October 2014 and February 2015, China’s Anbang Insurance Group took over Waldorf Astoria Hotel in New York in the United States at $1.95 billion, FIDEA Assurances (cost undisclosed) and Delta Lloyd Bank (€219 million) in Belgium, Vivant Verzekeringen in the Netherlands at $171 million, Tong Yang Life in the Republic of Korea at $1 billion, and a 26-story office tower in New York from Blackstone Group. The rapid growth of Chinese outward FDI is likely to continue, particularly in services, as well as in infrastructure-related industries, as the country’s “One Belt, One Road” strategy (referring to the Silk Road Economic Belt and the 21st Century Maritime Silk Road) starts to be implemented.
Inflows to Hong Kong (China) and Singapore rose at different paces. Inflows to Hong Kong
(China) rose by 39 per cent to $103 billion. This strong
growth was driven by a surge in equity investment
associated with some large cross-border M&As, such
as the purchase of a 25 per cent stake in A.S. Watson
Co. by Singapore’s Temasek Holdings at $5.7 billion,
and the $4.8 billion acquisition of Wing Hang Bank
by OCBC Bank (also from Singapore). Investors from
mainland China contributed considerably to growth as
well. Companies from the mainland were important
players in the M&A market in Hong Kong (China) in
2014. For example, COFCO Corporation acquired a
51 per cent stake in Noble Agri Limited, paying $4
billion to its parent Novel Group, a global supply chain
manager of agricultural and mineral products based
in Hong Kong (China). In terms of greenfield projects,
Chinese companies accounted for about one fifth of
all projects recorded by InvestHK in 2014.8 FDI inflows
to Singapore, another financial centre in the region,
by contrast, rose by only 4 per cent to $68 billion.
Performance of South-East Asian economies differed significantly. Singapore remained the
dominant recipient of FDI in South-East Asia. FDI
growth also increased in other South-East Asian
economies. Inflows to Indonesia rose by 20 per cent
to about $23 billion. The increase was driven by a
significant increase in equity investment, particularly
in the third quarter of the year. According to recent
data from the Indonesia Investment Coordinating
Board, the most important targeted industries were
mining; food; transportation and telecommunications;
metal, machinery and electronics; and chemical and
pharmaceutical. The largest investing countries were
Singapore, Japan, Malaysia, the Netherlands and the
United Kingdom, in that order.
Viet Nam saw its inflows increase 3 per cent in
2014. In November, the government decided to raise
the minimum wage by about 15 per cent in 2015.
Compared with 15 years ago, the nominal minimum
wage at the national level had already increased 17-
fold. Viet Nam still enjoys a labour cost advantage
over China, but rapidly rising wages have reduced the
difference, which may affect relatively small investors
in labour-intensive industries.9
Neighbouring low-income countries in South-East Asia
have significant labour cost advantages over Viet Nam.
As a result, efficiency-seeking FDI in manufacturing to
HIGHLIGHTS

World Investment Report 2015: Reforming International Investment Governance42
those countries increased, including for large projects. In November 2014, for instance, the Taekwang and Huchems Group (Republic of Korea) announced an investment of $600 million for producing chemical and related products in the Thilawa Special Economic Zone in Myanmar. However, labour costs are clearly not the only factor driving FDI, as witnessed by the FDI inflows per capita in the Lao People’s Democratic Republic and Myanmar, which are still considerably lower than in Viet Nam (figure II.3).
Enhancing regional connectivity in East and South-East Asia through international investment
Connectivity between countries and economies of East and South-East Asia is intensifying across infrastructure, business connections and institutions. This has contributed to reduced transaction costs and easier movement of goods, services, information and people, both within and outside the region. There are strong links between international investment and the intensification of regional connectivity in East and South-East Asia.
Infrastructural connectivity intensifies, but more investment is needed. This trend is being driven by
policy efforts to deepen regional integration, and by
business and economic imperatives in pursuit of more
interlinked regional value chains. Investment in infra-
structure industries has helped improve the investment
climate and enhanced the region’s attractiveness for
efficiency-seeking manufacturing FDI, in particular.
Regional cooperation has helped improve
infrastructural connectivity within the region and
especially that between East Asia and South-East
Asia. For example, the Greater Mekong Subregion
initiative has brought together Cambodia, the Lao
People’s Democratic Republic, Myanmar, Thailand
and Viet Nam, together with Yunnan Province in China.
The initiative also has contributed to infrastructure
connectivity between the CLMV (Cambodia, the
Lao People’s Democratic Republic, Myanmar and
Viet Nam) countries and other parts of the region.
Driven by regional integration initiatives, cross-border
infrastructure projects are further strengthening
regional connectivity in the electricity, highway and
railway industries. For example, regional cooperation
has led to the transmission of electricity supply from
the CLMV countries to China, and to the development
of the Singapore-Kunming railway link.
Cooperation on various growth triangles, corridors or
areas in ASEAN (e.g. Indonesia-Malaysia and Thailand
Growth Triangle) has also contributed to strengthening
connectivity among contiguous areas. A number
of new initiatives introduced recently at the national
(e.g. China’s “One Belt, One Road” initiative, Korea’s
Eurasia initiative), regional and international (e.g. Asian
Infrastructure Investment Bank, AIIB) levels will further
boost regional integration and connectivity. Japan
pledged $110 billion over the next five years to top
up investment fund for infrastructure development
in the Asian Development Bank. The planned AIIB is
expected to have initial capital of about $100 billion,
to be contributed by more than 50 participating
countries. The AIIB has the specific objective of
boosting infrastructure investment and connectivity
across Asia.
Nevertheless, uneven development in infrastructural
connectivity between countries, subregions and
sectors persists. In transport, for example, the quality
of the intraregional road network remains much lower
than in the industrialized economies, and the region
as a whole has a much lower road density than the
OECD average (World Bank, 2014). One reason is that
Figure II.3.
CLMV countries: Minimum monthly wages, 2014, and annual FDI in�ows per capita, 2012–2014 (Dollars)
Viet Nama Cambodia Lao People’sDemocratic
Republic
Myanmar
Minimum wages
Average annual FDI in�ows per capita
129
96
79
55
95
120
71
12
Source: UNCTAD, based on information from the government of Viet Nam and Asia Briefing Ltd.
a Viet Nam refers to only suburban areas. Note: CLMV = Cambodia, the Lao People’s Democratic Replublic, Myanmar
and Viet Nam.

CHAPTER II Regional Investment Trends 43
among countries within the region, there are significant
gaps in the level of infrastructural development. For
instance, in terms of infrastructure quality, a number
of South-East Asian countries rank high globally
– Singapore is second – but others rank low: Viet
Nam and the Philippines, for instance, rank 82nd and
96th, respectively (WEF, 2013). For some low-income
countries in the region, poor infrastructural connectivity
has long been a major obstacle to attracting efficiency-
seeking FDI and linking to global value chains.
In consequence, there are very large investment needs
for infrastructure development in the region. According
to estimates by the Asian Development Bank, total
investment in infrastructure in Asia as a whole (including
for connectivity) is expected to exceed $8 trillion
between 2010 and 2020 (ADB and ADBI, 2009). Lacking
the necessary capital or capacity to meet these needs,
both countries and the region need to mobilize sources
of funding, in which private investors, both domestic
and foreign, can play an important role (WIR14).
International investment in infrastructure by MNEs has been on the rise. For example, Metro
Pacific Investments Corporation, an affiliate of First
Pacific (listed in Hong Kong, China), is one of the
leading infrastructure investment firms in the Philippines.
With businesses in electricity, rail, road and water, its
total assets amounted to $4.5 billion in 2013. In the
electricity industry in Thailand, Glow Energy – an affiliate
of GDF Suez (France) – is an important player, with
total assets and sales at $3.8 billion and $2.1 billion,
respectively. In mobile telecommunications, subsidiaries
of international operators from within and outside of the
region account for significant market shares in South-
East Asian countries such as Indonesia and Thailand.
Asian companies, such as China Mobile and Singapore
Telecommunications Ltd., have become important
regional players in the industry.
In East Asia, FDI stock in transport, storage and
telecommunications had reached $33 billion in Hong
Kong (China) by 2012. In South-East Asia, FDI stock in
the same sectors stood at $37 billion in Singapore and
$15 billion in Thailand, in the same year. More recently,
FDI inflows to some infrastructure industries have been
rising rapidly. In ASEAN, FDI inflows in electricity and gas
utilities had reached $1.2 billion in 2013, a five-fold rise
over the year before. In China, inflows in transport, storage
and postal services rose from $3.4 billion in 2012 to $4.2
billion in 2013, and this growth has been continuing.
In 2014, the value of cross-border M&As in infrastructure industries nearly tripled to $17 billion, but that of announced greenfield projects declined by 37 per cent to $19 billion (figure II.4).
Major cross-border M&As included the purchase of companies in China, Hong Kong (China) and the Republic of Korea in East Asia, as well as in Indonesia, the Philippines, Singapore and Thailand in South-East Asia. In the latter subregion, electricity generation and mobile telecommunications have become important objects of cross-border M&As. In the Philippines, for example, Angat Hydropower Corporation, a subsidiary of Korea Water Resources Corp., took over a hydroelectric plant in Bulacan for $440 million in October 2014. In June, China Mobile, the world’s largest mobile operator by subscribers, bought an 18 per cent stake in True Corp., the third largest mobile operator in Thailand, for $880 million.
MNEs also invested in infrastructure industries in South-East Asia by implementing new projects. In electricity, Japanese MNEs have been particularly active in the subregion: after investing in large power
Source: UNCTAD cross-border M&A database for M&As and information from the Financial Times Ltd, fDi Markets (www.fDimarkets.com) for greenfield investment projects.
Figure II.4.
East and South-East Asia: Cross-border M&As and announced green�eld investments in infrastructureindustries, 2012–2014(Billions of dollars)
2012 2013 2014
Value of cross-border M&As
7
15
6
29
17 19
Value of announced green�eld projects

World Investment Report 2015: Reforming International Investment Governance44
generation projects in Myanmar and Viet Nam in 2013, they announced big investment plans in Malaysia, the Philippines and Thailand in 2014. For instance, Mitsui & Co. Ltd. (Japan), in cooperation with Gulf Energy Development Company Limited (United Arab Emirates), plans to invest approximately $2.4 billion in a series of cogeneration plants in Thailand. The project aims to build, own and operate 12 gas-fired power plants with a total capacity of 1,470 MW in several industrial estates.
Intraregional FDI is a major driving force for infrastructure investment. A growing part of investment in infrastructure originates from within the region, with Hong Kong (China), China, Japan, Malaysia and Singapore among the most important sources of both investment and operations. There are, however, considerable differences in industry focus by country.
Outward investment in infrastructure industries from East and South-East Asia through cross-border M&As jumped by about 200 per cent to $20.1 billion while the value of overseas greenfield investment announcements increased slightly in 2014 (figure II.5). The growth in M&As was mainly a result of an increase
in large deals in energy, telecommunications, transport
and water. Major acquirers from China, Hong Kong
(China) and Singapore were responsible for the largest
10 deals in 2014.
An estimated 45 per cent of outward investment by
Asian MNEs in infrastructure industries targeted the
region. Intraregional projects accounted for a much
higher share in cross-border M&As than in greenfield
projects (figure II.5). Traditionally, MNEs from Hong
Kong (China) and Singapore have been the important
investors in infrastructure industries. During the past
few years, Chinese companies have also invested
heavily in transport and energy (including electricity
generation and transmission, pipelines, and so on) in
countries such as Indonesia, Myanmar, the Philippines
and Viet Nam. In transport, Chinese investment is
expected to increase in railways, including in the Lao
People’s Democratic Republic and Myanmar. China
and Thailand recently signed an agreement for the
development of a high-speed rail line in Thailand
with an estimated investment of $23 billion – part of
a planned regional network of high-speed railways
linking Kunming, China and Singapore. A major part of
the region’s largest cross-border M&As in infrastructure
Source: UNCTAD cross-border M&A database for M&As and information from the Financial Times Ltd, fDi Markets (www.fDimarkets.com) for greenfield investment projects.Note: Figures in percentages refer to the share of intraregional projects in the total.
Figure II.5.International investment projects in infrastructure by investors from East and South-East Asia, value of projects and share of intraregional projects, 2012–2014 (Billions of dollars and per cent)
Intraregional projects Other projects
Announced green�eld investment projectsCross-border M&As
2012 2013 2014
58%
59%
80%
4
6 4
3
4
16
2012 2013 2014
22%
35% 26%
13
4
12
7
15
5

CHAPTER II Regional Investment Trends 45
in 2014 were intraregional, including the largest deal, the acquisition of electric utility company Castle Peak Power (Hong Kong (China)) by China Southern Power Grid and CLP Power Hong Kong from ExxonMobil Energy for $3 billion.
For low-income countries in the region, intraregional flows account for a major share of FDI inflows, contributing to the build-up of infrastructure and productive capacities. For instance, with improving transport and energy infrastructure, Myanmar is emerging as an investment location for labour-intensive industries, including textiles, garments and footwear.
MNE participation through non-equity and mixed modalities increased as well. MNE contributions in the region through NEMs and mixed forms such as build, operate and transfer (BOT) are significant. In many cases, a PPP is developed, with governments providing subsidies while the private sector builds, finances and operates projects. Data from the World Bank’s PPI database show that accumulated investment in infrastructure industries in East and South-East Asia through concessions and through management and lease contracts amounts to about $50 billion. Among major infrastructure industries, water and transport are the most targeted for non-equity and mixed mode participation by MNEs. The two industries accounted for 46 per cent and 31 per cent of the total amount of such activities.
Some projects with BOT and other concession structures have leveraged significant foreign capital and contributed to infrastructure build-up in industries such as electricity and transport. For example, AES Corp (United States) partnered with POSCO Power Corp (Republic of Korea) and China Investment Corporation (a major Chinese sovereign wealth fund)
in developing the Mong Duong II power plant in Viet Nam. Through a BOT-type agreement with the government, the project will involve a total investment of $1.4 billion and is likely to set an example for PPP-based power projects in the country.
In transport, a number of large projects have been signed or are being planned on a PPP/concession basis. Indonesia, for instance, has recorded a number of such projects in transport infrastructure with a total investment greater than $1 billion. Examples are the West Coast Expressway concession and the Soekarno-Hatta Railway Project.10
Prospects for regional infrastructure and connectivity – and beyond. Further infrastructure expansion is necessary to boost regional connectivity in support of value chain development, trade facilitation and the development prospects of distant or isolated areas and communities. New and existing initiatives at national, regional and international levels are increasing the prospects for expansion of infrastructure investment and connectivity across the region – and beyond. In addition to initiatives by the Asian Development Bank, which has a long history of providing infrastructure loans to the region, a number of regional initiatives underpin regional integration development and connectivity.
A number of ASEAN member states have begun to open some transport industries to foreign participation, which may lead to more intraregional FDI. For example, Indonesia has recently allowed foreign investment in service industries such as port management as part of government efforts to enable Indonesia to become a strong maritime country. As more countries in South-East Asia announce ambitious long-term plans, total investment in infrastructure in this subregion is expected to grow further.
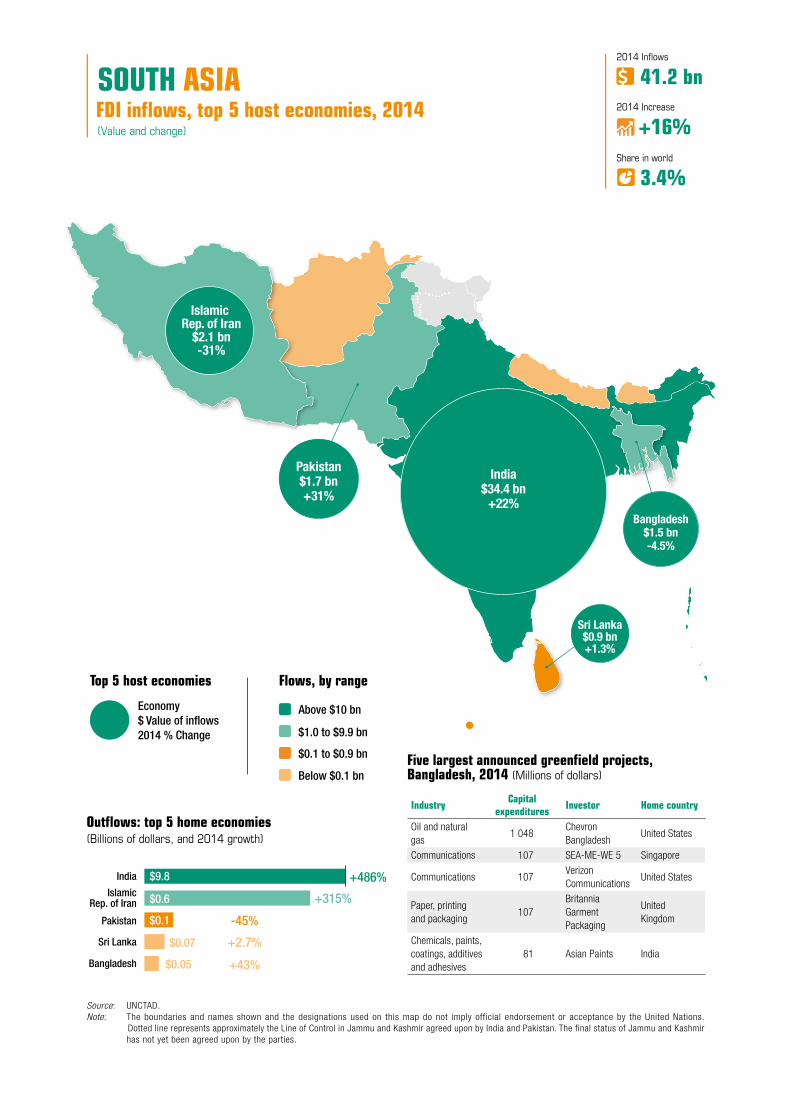
FDI in�ows, top 5 host economies, 2014(Value and change) +16%
2014 Increase
41.2 bn2014 In�ows
3.4%Share in world
India
IslamicRep. of Iran
Bangladesh
Sri Lanka
Pakistan
+486%$9.8
$0.6
$0.1
$0.07
$0.05
+315%
-45%
+2.7%
+43%
Flows, by range
Above $10 bn
$1.0 to $9.9 bn
$0.1 to $0.9 bn
Below $0.1 bn
Out�ows: top 5 home economies (Billions of dollars, and 2014 growth)
Top 5 host economies
Economy$ Value of in�ows2014 % Change
SOUTH ASIA
India$34.4 bn
+22%
Islamic Rep. of Iran
$2.1 bn-31%
Pakistan$1.7 bn+31%
Sri Lanka$0.9 bn+1.3%
Bangladesh$1.5 bn-4.5%
Source: UNCTAD. Note: The boundaries and names shown and the designations used on this map do not imply official endorsement or acceptance by the United Nations.
Dotted line represents approximately the Line of Control in Jammu and Kashmir agreed upon by India and Pakistan. The final status of Jammu and Kashmir has not yet been agreed upon by the parties.
Industry Capital expenditures Investor Home country
Oil and natural gas
1 048Chevron Bangladesh
United States
Communications 107 SEA-ME-WE 5 Singapore
Communications 107Verizon Communications
United States
Paper, printing and packaging
107Britannia Garment Packaging
United Kingdom
Chemicals, paints, coatings, additives and adhesives
81 Asian Paints India
Five largest announced greenfield projects, Bangladesh, 2014 (Millions of dollars)

Table D. Cross-border M&As by region/country, 2013–2014 (Millions of dollars)
Region/countrySales Purchases
2013 2014 2013 2014World 4 784 5 955 1 621 1 105
Developed economies 3 367 5 361 1 883 -880 European Union 1 518 3 324 1 734 -551
United Kingdom 1 110 3 346 510 -657 United States 1 368 1 591 387 -422 Japan 382 250 - -
Developing economies 1 212 556 -262 1 900 Africa 233 147 419 2 730 Asia and Oceania 979 409 -1 240 -771
India - 24 - 32 Singapore 540 265 -771 -808
Latin America and the Caribbean - - 559 -59
Transition economies - - - 85
Table C. Cross-border M&As by industry, 2013–2014 (Millions of dollars)
Sector/industrySales Purchases
2013 2014 2013 2014Total 4 784 5 955 1 621 1 105
Primary 28 -40 1 482 2 934 Mining, quarrying and petroleum 2 -40 1 482 2 924
Manufacturing 4 608 4 170 920 -3 670 Food, beverages and tobacco 1 173 2 026 -34 -727 Chemicals and chemical products 3 620 28 246 19 Pharmaceuticals, medicinal chemicals and botanical products 3 148 1 757 551 55
Basic metal and metal products -4 068 -1 65 -586 Services 148 1 824 -781 1 841
Trade 42 240 -80 - Information and communication -209 546 85 49 Financial and insurance activities -298 89 -691 2 469 Business activities 621 314 350 -533
Sector/industrySouth Asia
as destinationSouth Asia
as investors2013 2014 2013 2014
Total 26 368 38 957 15 955 14 220 Primary 22 311 43 11
Mining, quarrying and petroleum 22 311 43 11 Manufacturing 10 919 14 223 7 085 6 879
Textiles, clothing and leather 397 431 104 1 037 Coke, petroleum products and nuclear fuel 44 1 057 81 2 645
Metals and metal products 589 1 364 885 369 Motor vehicles and other transport equipment 1 971 4 270 2 791 933
Services 15 427 24 423 8 827 7 331 Electricity, gas and water 2 044 6 701 2 756 250 Transport, storage and communications 3 644 5 936 2 185 784
Finance 3 378 5 216 861 793 Business services 2 710 3 389 2 079 1 179
Partner region/economySouth Asia
as destinationSouth Asia
as investors2013 2014 2013 2014
World 26 368 38 957 15 955 14 220 Developed economies 19 282 23 129 4 134 2 856
European Union 7 384 7 358 2 587 1 503 Germany 2 061 2 074 491 31 United Kingdom 2 470 1 146 1 718 530
United States 5 405 8 489 1 314 744 Japan 2 997 3 129 45 13
Developing economies 7 011 15 724 10 952 11 079 Africa 637 107 5 482 1 366 Asia and Oceania 6 355 15 586 4 755 9 202
China 884 6 079 506 137 Latin America and the Caribbean 20 30 715 510
Transition economies 74 104 870 285
HIGHLIGHTS
2008 2009 2010 2011 2012 2013 2014 2008 2009 2010 2011 2012 2013 20140
15
30
45
60
75
-4
-2
0
2
4
6
8
10
12
14
16
North Africa East Africa West Africa Southern Africa Central Africa
Share in world total
3.9 4.6 3.3 3.1 4.0 3.7 4.4 0.6 0.6 0.7 0.4 1.0 1.2 1.0
2008 2009 2010 2011 2012 2013 2014
East Asia South-East Asia
2008 2009 2010 2011 2012 2013 20140
100
200
300
400
0
100
200
300
400
2008 2009 2010 2011 2012 2013 2014 2008 2009 2010 2011 2012 2013 20140
10
20
30
40
50
60
0
5
10
15
20
25
Share in world total
3.8 3.6 2.6 2.8 2.3 2.4 3.4 1.3 1.5 1.2 0.8 0.8 0.2 0.8
2008 2009 2010 2011 2012 2013 2014 2008 2009 2010 2011 2012 2013 20140
20
40
60
80
100
0
10
20
30
40
50
TurkeyOther West Asia Gulf Cooperation Council (GCC)
Share in world total
6.3 6.0 4.5 3.4 3.4 3.0 3.5 2.2 1.6 1.3 2.0 1.8 3.1 2.8
Share in world total
15.9 17.7 23.1 20.9 22.9 23.7 31.0 9.8 16.4 18.3 16.9 20.7 22.4 28.3
2008 2009 2010 2011 2012 2013 2014
Caribbean, excluding �nancial centers Central America South America
Georgia Commonwealth of Independent States
2008 2009 2010 2011 2012 2013 2014
2008 2009 2010 2011 2012 2013 2014 2008 2009 2010 2011 2012 2013 2014
South-East Europe
2008 2009 2010 2011 2012 2013 2014 2008 2009 2010 2011 2012 2013 2014
Africa Latin America and the Caribbean Asia Oceania
2008 2009 2010 2011 2012 2013 2014 2008 2009 2010 2011 2012 2013 2014
2008 2009 2010 2011 2012 2013 2014 2008 2009 2010 2011 2012 2013 2014
0
50
100
150
200
250
0
50
100
0
25
50
75
100
125
0
20
40
60
80
100
0
5
10
15
20
25
30
0
1
2
3
4
5
6
7
8
0
5
10
15
20
25
30
35
40
0
2
4
6
8
10
0
1
2
3
4
5
6
7
8
9
10
0
0.5
1
1.5
2
2.5
Share in world total
9.2 7 9.9 10.5 12.7 12.7 13 2.3 1.2 3.4 2.3 3.4 2.2 1.7
Share in world total
7.8 5.9 5.6 6.2 6.1 6.8 3.9 3.5 4.3 4.5 4.6 4.2 7.0 4.7
Share in world total
1.2 1.4 1.8 1.4 1.7 1.5 1.9 0.2 0.1 0.2 0.3 0.4 0.6 0.2
Share in world total
1.7 2.2 2.0 2.3 2.5 2.0 2.4 0.1 0.4 0.7 0.4 0.2 0.3 0.4
Share in world total
0.6 0.4 0.3 0.4 0.5 0.4 0.6 0.1 0.0 0.0 0.1 0.2 0.1 0.1
North America Other developed Europe European Union
2008 2009 2010 2011 2012 2013 2014 2008 2009 2010 2011 2012 2013 2014
Other developed countries
0
400
800
1 200
1 600
0
400
800
1 200
1 600
Share in world total
52.9 55.0 50.7 52.9 48.4 47.5 40.6 80.3 74.4 70.5 72.8 68.0 63.8 60.8
Transition economies Asia and Oceania Latin America and the Caribbean Africa
Oceania Asia Latin America and the Caribbean Africa
Figure A. FDI in�ows, 2008−2014 (Billions of dollars)
Figure B. FDI out�ows, 2008−2014(Billions of dollars)
• FDI inflows to India gained strength • More FDI from China to the region • FDI boosts automotive industry, particularly in India
Table A. Announced greenfield FDI projects by industry, 2013–2014 (Millions of dollars)
Table B. Announced greenfield FDI projects by region/country, 2013–2014 (Millions of dollars)

World Investment Report 2015: Reforming International Investment Governance48
Inflows to South Asia rose to $41 billion in 2014,
primarily owing to growth in India, the dominant FDI
recipient in the region. Both announced greenfield
investments and cross-border M&As increased across
the region: the value of the former jumped by 48 per
cent to $39 billion, while that of the latter rose by
about one quarter to $6 billion. At the regional level,
FDI in manufacturing has risen, as illustrated by the
automotive industry. In the recently launched “Make
in India” initiative, the country’s government has
identified automotive as a key industry in which India
has the potential to become a world leader.
Inflows to India increased by 22 per cent to $34 billion. As an expected economic recovery gains ground, FDI inflows are likely to maintain an upward trend in 2015. In terms of sectoral composition, manufacturing is gaining strength, as policy efforts to revitalize the sector are sustained, including for instance the launch of the “Make in India” Initiative in mid-2014.
FDI outflows from South Asia originate mainly from India. In 2014, Indian outflows saw a five-fold jump to $10 billion, recovering from a sharp decline in 2013. As the performance of the Indian economy has improved, large Indian MNEs have stopped large-scale divestments and some have resumed international expansion, including announcements of some intraregional investments in manufacturing (such as in the automotive and chemical products industries) in neighbouring countries.
A number of South Asian countries saw rising FDI from China. FDI inflows to Pakistan increased by 31 per cent to $1.7 billion as a result of rising Chinese FDI flows in services, in particular a large investment made by China Mobile in telecommunications. In addition, Pakistan will benefit significantly from the China-Pakistan Industrial Corridor (WIR14, box II.3) and the associated Chinese investment in infrastructure and manufacturing in the overall context of implementing China’s “One Belt, One Road” strategy. According to agreements signed between the two governments in April 2015, Chinese companies will invest about $45.6 billion in Pakistan over the next few years, including $33.8 billion in electricity and $11.8 billion in transport infrastructure.
In Sri Lanka, FDI flows from China rose as well. China has become the largest source of FDI to Sri Lanka in recent years.11 For instance, a joint venture between two local companies and China Merchants Holdings (International) Company has invested $500 million in Colombo International Container Terminals, the country’s largest foreign investment project. After two years of construction, the port started operation in August 2014. A China–Sri Lanka FTA will be signed in June 2015. If the implementation of the 21st Century “Maritime Silk Road” gains ground, an increasing amount of Chinese investment will flow to Sri Lanka, particularly in large infrastructure projects, including another port planned in Hambantota, as well as highways and an airport. Large projects with
Table II.2. Ten largest announced greenfield projects in Bangladesh, 2014
Industry Estimated capital expenditures
(Millions of dollars)
Investor Home country
Oil and natural gas 1 048 Chevron Bangladesh United StatesCommunications 107 SEA-ME-WE 5 SingaporeCommunications 107 Verizon Communications United StatesPaper, printing and packaging, converted paper products
107 Britannia Garment Packaging United Kingdom
Chemicals, paints, coatings, additives and adhesives
81 Asian Paints India
Transportation, freight/distribution services 70 Pacific International Lines SingaporeTransportation, air transportation 70 Emirates SkyCargo United Arab EmiratesBuilding and construction materials 64 Holcim SwitzerlandMedical devices 63 Telstar JapanTransportation, freight/distribution services 61 TNT Express Netherlands
Source: UNCTAD, based on information from the Financial Times Ltd, fDi Markets (www.fDimarkets.com)

CHAPTER II Regional Investment Trends 49
investment from India and United States were also
recorded in Sri Lanka in 2014.12
Greenfield investment to Bangladesh increased.
FDI inflows to Bangladesh remained relatively high at
$1.5 billion, thanks to large greenfield investments in
a range of industries (table II.2). As one of the most
important foreign investors and the largest producer
of natural gas in Bangladesh, Chevron (United States)
invested $500 million in the Bibiyana Expansion
Project and prepared to invest another $650 million
to Petrobangla, the local State-owned oil company.
Fully operational in 2015, the project in Bibiyana is
the largest foreign investment project in the country
in value. Other significant projects announced in 2014
were in manufacturing industries such as chemicals,
construction materials and medical devices, as well as
services industries such as telecommunications and
transportation. In April, for example, a joint venture
subsidiary of Azbil Telstar (Japan) in Dhaka was
inaugurated with a local partner, SAKA International,
aiming to serve the fast-growing pharmaceutical
industry in the host country.
Nepal began to attract attention from MNEs. The
country started to attract some FDI in manufacturing,
services and infrastructure industries. For instance,
Global Auto Tech (Republic of Korea) reached an
agreement with a local company to invest in a truck
production plant in Nepal. The announced investment
is worth about $200 million, twice the value of current
annual FDI inflows. There is some expectation that
Chinese and Indian investments may help boost
foreign investment to Nepal in the coming years. In recent years, hydropower has been the main attraction in Nepal, bringing in investors from electricity-hungry neighbouring countries.13 However, the earthquake in April 2015 has raised a major challenge to the economy and to foreign investment.
FDI helped develop the automotive industry in South Asia
Facing constraints such as weak productive capacities and poor infrastructure, South Asian countries have generally lagged behind East and South-East Asian countries in attracting FDI in manufacturing. However, some success stories have emerged at country, industry and local levels, partly because of higher growth rates in recent years and efforts to improve infrastructure and communication. The automotive industry shows how FDI inflows can reshape the trajectory of industrial progress.
India is the dominant recipient of FDI in the auto-motive industry in South Asia. The country accounted for the preponderance of greenfield investment projects announced by global automakers and first-tier part suppliers in South Asia during 2013–2014, including 12 projects larger than $100 million (table II.3).
The automotive industry accounts for about 20 per cent of India’s manufacturing value added. With annual production of 18 million vehicles, India is the seventh largest automotive producer and, with its large population and growing economy, is likely to ascend in the global ranking.14
Table II.3. India: Announced greenfield investments in automotive industry greater than $100 million, 2013
Industry Estimated capital expenditures (Millions of dollars)
Investor Home country
Automobiles 456 Fiat ItalyAutomobiles 320 Renault-Nissan Motor JapanAutomobiles 249 Volkswagen GermanyHeavy-duty trucks 235 Scania GermanyHeavy-duty trucks 235 VE Commercial Vehicles SwedenAutomobiles 233 Renault-Nissan Motor JapanHeavy-duty trucks 233 Wrightbus United KingdomAutomotive component 220 Bosch GermanyAutomobiles 207 Ford India United StatesAutomobiles 206 Fiat-Tata ItalyAutomobiles 164 Honda Cars India JapanAutomobiles 127 Mercedes-Benz Germany
Source: UNCTAD, based on information from the Financial Times Ltd, fDi Markets (www.fDimarkets.com).

World Investment Report 2015: Reforming International Investment Governance50
In the “Make in India” initiative, the government identified 25 industries in which India has the potential to become a world leader, including the automotive, chemicals, pharmaceuticals and textiles industries. The government has also prioritized environmentally friendly vehicles and launched a new scheme to provide financial incentives for hybrid and electric cars.
The development of the Indian automotive industry has been built on domestic efforts, supplemented and supported by foreign investors and technology. Since the formal opening of the industry to foreign investment in the early 1990s, FDI has flowed in and delivered impacts across different industries, products and value chain segments – from original equipment manufacturing to components and services.15 According to data from the country’s Department of Industrial Policy and Promotion, accumulated FDI inflows to the automotive industry from April 2000 to November 2014 amounted to $11.4 billion. As MNEs have entered the Indian market, domestic companies (e.g. Tata Motors, Mahindra and Mahindra) have also started collaborations with MNEs to upgrade their own product offerings.16
The major sources of FDI in the automotive industry are Japan, United States and the Republic of Korea. MNEs from these countries entered the Indian market through either joint ventures or wholly owned subsidiaries. For example, Suzuki (Japan) was one of the earliest foreign investors in the Indian automotive industry through a joint venture with Maruti, a local company; the investment was aimed at the local market and has so far enjoyed an enduring first-mover advantage. In the early 2010s, Maruti Suzuki still
accounted for nearly 40 per cent of India’s passenger
vehicle market. Other major global automakers,
including Hyundai (Republic of Korea) and GM (United
States), are also investing significantly in India.
An examination of the geographical distribution
of automotive production within India shows that
inward FDI has led to the emergence of a number of
industrial clusters in the country, including those in the
National Capital Region (Delhi–Gurgaon–Faridabad),
Maharashtra (Mumbai–Nasik–Aurangabad), and
Tamil Nadu (Chennai–Bangalore–Hosur) (figure II.6).
Though considerable differences exist in the patterns
of formation of these clusters,17 it is clear that FDI can
play an important catalytic role. For example, the early
entry of Suzuki has contributed to the development
of an industrial cluster in the National Capital Region.
The presence of six foreign companies, two domestic
companies and more than 100 local suppliers has
produced a strong automotive cluster in Tamil Nadu
(Bapat et al., 2012).
Spillover effects may appear in other South Asian
countries. During 2013–2014, Bangladesh, Nepal,
Pakistan and Sri Lanka each recorded one greenfield
investment project by foreign companies (table II.4).
These projects are relatively large investments with
a significant number of jobs created. In 2013, for
instance, Mahindra & Mahindra (India) invested more
than $200 million in a plant to produce light trucks
and utility vehicles in Bangladesh. Investment from
the growing automotive industry in India shows the
potential of a positive spillover effect to productive
capacity-building in South Asia as a whole.
Table II.4. South Asian countries other than India: Announced greenfield investments in automotive industry, 2013–2014
Host country Industry Estimated capital expenditures
(Millions of dollars)
Investor Home country Year
BangladeshLight trucks and utility vehicles
227 Mahindra & Mahindra India 2013
Nepal Heavy-duty trucks 200 Global Autotech Korea, Republic of 2014Pakistan Automobiles 200 Honda Atlas Cars Pakistan Japan 2013Sri Lanka Automobiles 3 Toyota Lanka Japan 2013
Source: UNCTAD, based on information from the Financial Times Ltd, fDi Markets (www.fDimarkets.com).

CHAPTER II Regional Investment Trends 51
Figure II.6. India: Major industrial clusters in the automotive industry
HimachalPradesh
HaryanaNew Delhi
Madhya PradeshGujarat
Maharashtra
Mumbai
Karnataka
Bengaluru
Tamil Nadu
Chennai
AndhraPradesh
West Bengal
Kolkata
North
EicherEscortsHero Motor CorpHonda MotorcycleHonda SIEL Cars
ICML*JCBMaruti Suzuki**New HollandMahindra*
Suzuki MotorcyclesSwaraj Mazda**Tata Motors*Yamaha
West
Bajaj Auto*FiatForce Motors*GMJohn DeereMahindra*Man ForceMercedes BenzPSASkodaTata Hitachi**Tata Motors*VolkswagenVolvo Eicher
South
Ashok Leyland*BMWCaterpillarDaimlerFordHindustan Motors*HyundaiNissan
RenaultRoyal En�eldSame DeutzTAFETata Motors*Toyota Kirloskar**TVS*Volvo Buses
East
Hindustan Motors*Tata Motors*
Source: UNCTAD, based on the Automotive Component Manufacturers Association of India.Note: Companies listed in the boxes are major manufacturers in each cluster; companies marked with an asterisk are Indian domestic companies; companies marked
with two asterisks are joint ventures between Indian and foreign companies. The boundaries and names shown and the designations used on this map do not imply official endorsement or acceptance by the United Nations.
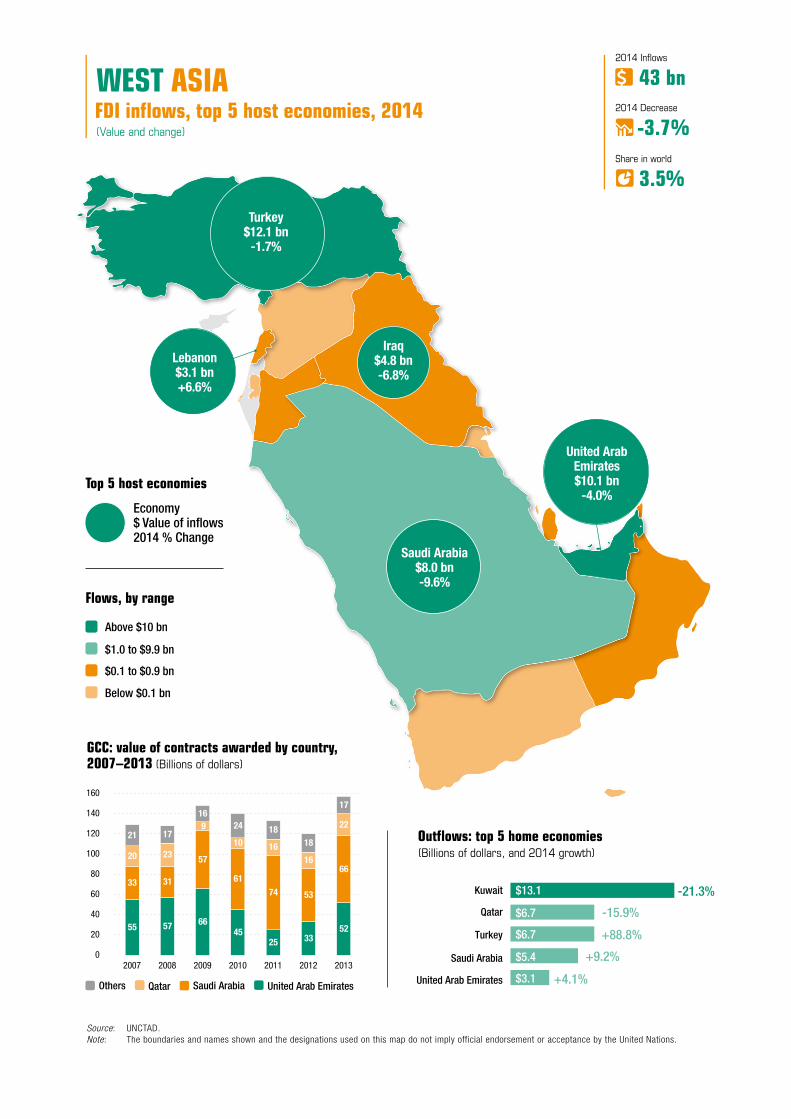
Flows, by range
Above $10 bn
$1.0 to $9.9 bn
$0.1 to $0.9 bn
Below $0.1 bn
Kuwait
Qatar
Turkey
United Arab Emirates
Saudi Arabia
-21.3%$13.1
$6.7
$6.7
$5.4
$3.1
-15.9%
+88.8%
+9.2%
+4.1%
Out�ows: top 5 home economies (Billions of dollars, and 2014 growth)
Top 5 host economies
Economy$ Value of in�ows2014 % Change
Others
GCC: value of contracts awarded by country, 2007–2013 (Billions of dollars)
55 57 6645
25 3352
33 31
57
6174 53
6620 23
9
10 1616
2221 17
1624 18
18
17
0
20
40
60
80
100
120
140
160
2007 2008 2009 2010 2011 2012 2013
Qatar Saudi Arabia United Arab Emirates
-3.7%2014 Decrease
43 bn2014 In�ows
3.5%Share in world
FDI in�ows, top 5 host economies, 2014(Value and change)
WEST ASIA
Turkey$12.1 bn
-1.7%
United ArabEmirates$10.1 bn
-4.0%
Iraq$4.8 bn-6.8%
Lebanon$3.1 bn+6.6%
Saudi Arabia$8.0 bn-9.6%
Source: UNCTAD. Note: The boundaries and names shown and the designations used on this map do not imply official endorsement or acceptance by the United Nations.

Region/countrySales Purchases
2013 2014 2013 2014World 2 055 2 729 8 077 10 705
Developed economies 181 1 738 2 739 3 944 European Union 714 783 1 312 1 609 North America -573 530 69 2 335
Developing economies 1 375 377 4 913 6 614 Africa 29 - 3 194 6 420
North Africa - - 3 150 5 708 Egypt - - 3 150 29 Morocco - - - 5 659
Latin America and the Caribbean 54 160 266 1 000
Asia and Oceania 1 293 217 1 454 -806 West Asia 1 039 -321 1 039 -321
Transition economies 3 -191 425 146
Sector/industry Sales Purchases2013 2014 2013 2014
Total 2 055 2 729 8 077 10 705 Primary 357 -283 476 3 455
Mining, quarrying and petroleum 344 -286 466 3 455 Extraction of crude petroleum and natural gas 344 -311 - 3 305
Manufacturing 451 988 61 130 Computer, electronic, optical products and electrical equipment 46 283 - -
Non-metallic mineral products 14 624 - - Services 1 248 2 024 7 540 7 120
Electricity, gas, water and waste management 140 226 1 908 -
Accommodation and food service activities - 75 -99 -1 429
Information and communication 21 27 1 137 4 794 Financial and insurance activities 456 201 3 972 3 020 Business activities 371 533 184 -7
Sector/industryWest Asia
as destinationWest Asia
as investors2013 2014 2013 2014
Total 56 047 37 316 38 638 26 929 Primary 5 989 2 620 1 677 322 Manufacturing 18 976 14 739 18 067 8 062
Coke, petroleum products and nuclear fuel 3 754 5 277 9 655 2 088
Chemicals and chemical products 4 503 1 623 209 1 660
Machinery and equipment 756 634 254 18 Motor vehicles and other transport equipment 5 770 3 790 97 145
Services 31 082 19 957 18 895 18 545 Electricity, gas and water 13 759 3 210 1 725 1 020 Construction 2 239 5 215 3 281 7 150 Hotels and restaurants 3 605 2 871 3 246 1 631 Finance 1 791 1 871 2 499 4 751 Business services 6 131 4 770 3 961 1 230
Partner region/economyWest Asia
as destinationWest Asia
as investors2013 2014 2013 2014
World 56 047 37 316 38 638 26 929 Developed economies 27 560 14 907 4 539 5 567
Europe 15 903 8 366 2 392 4 782 United States 9 894 2 683 1 954 381
Developing economies 15 671 21 329 30 397 20 490 Africa 301 1 551 5 842 5 932
Egypt 86 1 307 1 588 4 048 Asia and Oceania 15 326 19 778 24 318 14 336
India 1 209 7 899 2 088 4 407 West Asia 11 701 5 323 11 701 5 323
United Arab Emirates 9 178 4 035 833 655 Transition economies 12 816 1 081 3 703 872
Russian Federation 12 748 974 1 345 289
Table C. Cross-border M&As by industry, 2013–2014 (Millions of dollars)
Table D. Cross-border M&As by region/country, 2013–2014 (Millions of dollars)
HIGHLIGHTS
2008 2009 2010 2011 2012 2013 2014 2008 2009 2010 2011 2012 2013 20140
15
30
45
60
75
-4
-2
0
2
4
6
8
10
12
14
16
North Africa East Africa West Africa Southern Africa Central Africa
Share in world total
3.9 4.6 3.3 3.1 4.0 3.7 4.4 0.6 0.6 0.7 0.4 1.0 1.2 1.0
2008 2009 2010 2011 2012 2013 2014
East Asia South-East Asia
2008 2009 2010 2011 2012 2013 20140
100
200
300
400
0
100
200
300
400
2008 2009 2010 2011 2012 2013 2014 2008 2009 2010 2011 2012 2013 20140
10
20
30
40
50
60
0
5
10
15
20
25
Share in world total
3.8 3.6 2.6 2.8 2.3 2.4 3.4 1.3 1.5 1.2 0.8 0.8 0.2 0.8
2008 2009 2010 2011 2012 2013 2014 2008 2009 2010 2011 2012 2013 20140
20
40
60
80
100
0
10
20
30
40
50
TurkeyOther West Asia Gulf Cooperation Council (GCC)
Share in world total
6.3 6.0 4.5 3.4 3.4 3.0 3.5 2.2 1.6 1.3 2.0 1.8 3.1 2.8
Share in world total
15.9 17.7 23.1 20.9 22.9 23.7 31.0 9.8 16.4 18.3 16.9 20.7 22.4 28.3
2008 2009 2010 2011 2012 2013 2014
Caribbean, excluding �nancial centers Central America South America
Georgia Commonwealth of Independent States
2008 2009 2010 2011 2012 2013 2014
2008 2009 2010 2011 2012 2013 2014 2008 2009 2010 2011 2012 2013 2014
South-East Europe
2008 2009 2010 2011 2012 2013 2014 2008 2009 2010 2011 2012 2013 2014
Africa Latin America and the Caribbean Asia Oceania
2008 2009 2010 2011 2012 2013 2014 2008 2009 2010 2011 2012 2013 2014
2008 2009 2010 2011 2012 2013 2014 2008 2009 2010 2011 2012 2013 2014
0
50
100
150
200
250
0
50
100
0
25
50
75
100
125
0
20
40
60
80
100
0
5
10
15
20
25
30
0
1
2
3
4
5
6
7
8
0
5
10
15
20
25
30
35
40
0
2
4
6
8
10
0
1
2
3
4
5
6
7
8
9
10
0
0.5
1
1.5
2
2.5
Share in world total
9.2 7 9.9 10.5 12.7 12.7 13 2.3 1.2 3.4 2.3 3.4 2.2 1.7
Share in world total
7.8 5.9 5.6 6.2 6.1 6.8 3.9 3.5 4.3 4.5 4.6 4.2 7.0 4.7
Share in world total
1.2 1.4 1.8 1.4 1.7 1.5 1.9 0.2 0.1 0.2 0.3 0.4 0.6 0.2
Share in world total
1.7 2.2 2.0 2.3 2.5 2.0 2.4 0.1 0.4 0.7 0.4 0.2 0.3 0.4
Share in world total
0.6 0.4 0.3 0.4 0.5 0.4 0.6 0.1 0.0 0.0 0.1 0.2 0.1 0.1
North America Other developed Europe European Union
2008 2009 2010 2011 2012 2013 2014 2008 2009 2010 2011 2012 2013 2014
Other developed countries
0
400
800
1 200
1 600
0
400
800
1 200
1 600
Share in world total
52.9 55.0 50.7 52.9 48.4 47.5 40.6 80.3 74.4 70.5 72.8 68.0 63.8 60.8
Transition economies Asia and Oceania Latin America and the Caribbean Africa
Oceania Asia Latin America and the Caribbean Africa
Figure A. FDI in�ows, 2008−2014 (Billions of dollars)
Figure B. FDI out�ows, 2008−2014(Billions of dollars)
• Regional conflict, political tensions still deter FDI• Falling private investment, rising public investment• Rise in non-equity modes of MNE operations in the GCC
Table A. Announced greenfield FDI projects by industry, 2013–2014 (Millions of dollars)
Table B. Announced greenfield FDI projects by region/country, 2013–2014 (Millions of dollars)
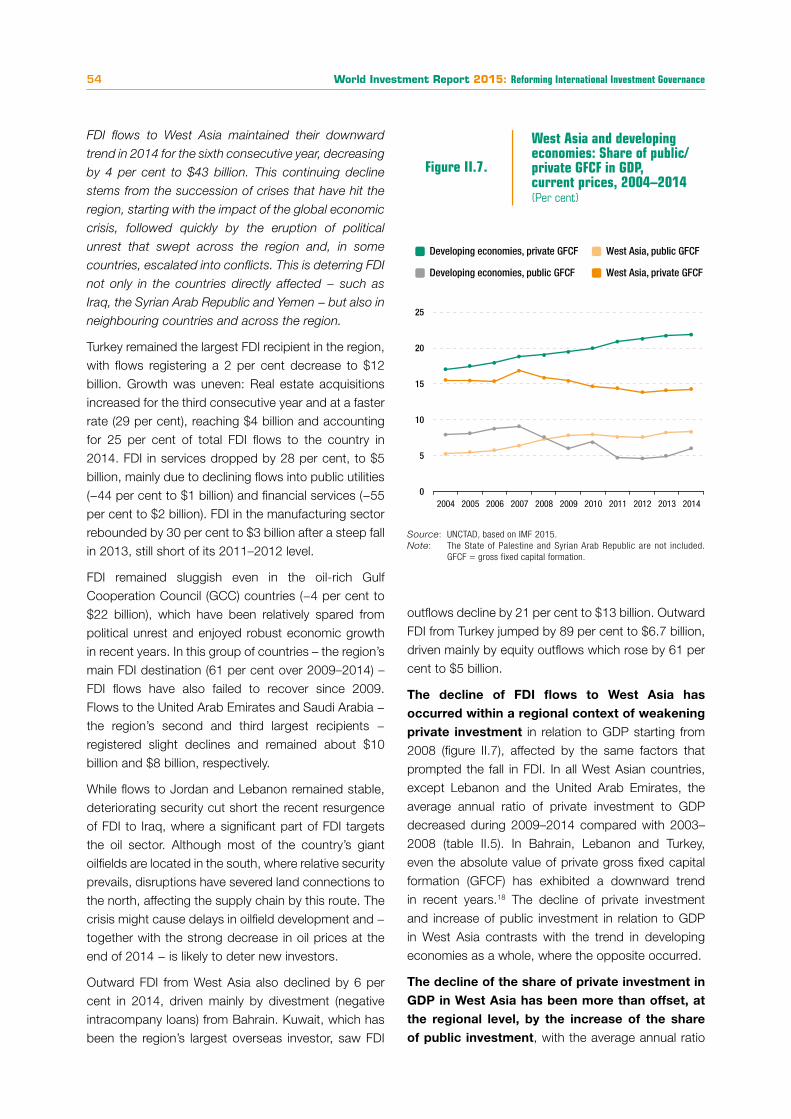
World Investment Report 2015: Reforming International Investment Governance54
FDI flows to West Asia maintained their downward
trend in 2014 for the sixth consecutive year, decreasing
by 4 per cent to $43 billion. This continuing decline
stems from the succession of crises that have hit the
region, starting with the impact of the global economic
crisis, followed quickly by the eruption of political
unrest that swept across the region and, in some
countries, escalated into conflicts. This is deterring FDI
not only in the countries directly affected − such as
Iraq, the Syrian Arab Republic and Yemen − but also in
neighbouring countries and across the region.
Turkey remained the largest FDI recipient in the region, with flows registering a 2 per cent decrease to $12 billion. Growth was uneven: Real estate acquisitions increased for the third consecutive year and at a faster rate (29 per cent), reaching $4 billion and accounting for 25 per cent of total FDI flows to the country in 2014. FDI in services dropped by 28 per cent, to $5 billion, mainly due to declining flows into public utilities (−44 per cent to $1 billion) and financial services (−55 per cent to $2 billion). FDI in the manufacturing sector rebounded by 30 per cent to $3 billion after a steep fall in 2013, still short of its 2011–2012 level.
FDI remained sluggish even in the oil-rich Gulf Cooperation Council (GCC) countries (−4 per cent to $22 billion), which have been relatively spared from political unrest and enjoyed robust economic growth in recent years. In this group of countries – the region’s main FDI destination (61 per cent over 2009–2014) – FDI flows have also failed to recover since 2009. Flows to the United Arab Emirates and Saudi Arabia − the region’s second and third largest recipients − registered slight declines and remained about $10 billion and $8 billion, respectively.
While flows to Jordan and Lebanon remained stable, deteriorating security cut short the recent resurgence of FDI to Iraq, where a significant part of FDI targets the oil sector. Although most of the country’s giant oilfields are located in the south, where relative security prevails, disruptions have severed land connections to the north, affecting the supply chain by this route. The crisis might cause delays in oilfield development and − together with the strong decrease in oil prices at the end of 2014 − is likely to deter new investors.
Outward FDI from West Asia also declined by 6 per cent in 2014, driven mainly by divestment (negative intracompany loans) from Bahrain. Kuwait, which has been the region’s largest overseas investor, saw FDI
outflows decline by 21 per cent to $13 billion. Outward FDI from Turkey jumped by 89 per cent to $6.7 billion, driven mainly by equity outflows which rose by 61 per cent to $5 billion.
The decline of FDI flows to West Asia has occurred within a regional context of weakening private investment in relation to GDP starting from 2008 (figure II.7), affected by the same factors that prompted the fall in FDI. In all West Asian countries, except Lebanon and the United Arab Emirates, the average annual ratio of private investment to GDP decreased during 2009–2014 compared with 2003–2008 (table II.5). In Bahrain, Lebanon and Turkey, even the absolute value of private gross fixed capital formation (GFCF) has exhibited a downward trend in recent years.18 The decline of private investment and increase of public investment in relation to GDP in West Asia contrasts with the trend in developing economies as a whole, where the opposite occurred.
The decline of the share of private investment in GDP in West Asia has been more than offset, at the regional level, by the increase of the share of public investment, with the average annual ratio
Source: UNCTAD, based on IMF 2015.Note: The State of Palestine and Syrian Arab Republic are not included.
GFCF = gross fixed capital formation.
Figure II.7.
West Asia and developing economies: Share of public/private GFCF in GDP, current prices, 2004–2014 (Per cent)
200620052004 2007 2008 2009 2010 2011 2012 2013 20140
5
10
15
20
25
Developing economies, private GFCF
West Asia, private GFCF
West Asia, public GFCF
Developing economies, public GFCF

CHAPTER II Regional Investment Trends 55
of total GFCF to GDP rising from 21.9 per cent in 2003–2008 to 22.3 per cent in 2009–2014. However, the situation varies by country and subregion, as the increase in public investment took place mainly in the GCC countries – financed by their income from oil revenues – and most strongly in Saudi Arabia and Kuwait (table II.5).
The increasing weight of public investment was most evident in GCC economies and has translated into State-led construction growth that focuses on infrastructure and oil and gas development. Capital spending was higher as a share of GDP in all GCC countries between 2009 and 2014, and the public share of total investment increased significantly – in all except the United Arab Emirates – reaching almost 40 per cent (table II.5). This has translated into a construction boom different from the one that took place in the early part of the preceding decade, Saudi Arabia’s being the largest in the region (figure II.8). The residential and commercial megaprojects that defined that boom – most dynamic in the United Arab Emirates – have been replaced by government-led projects in infrastructure, especially in Qatar and Saudi Arabia, and in oil and gas. Ambitious plans for infrastructure upgrading and development were implemented, with a growing emphasis on rail projects. For example, in 2013 more than $30 billion worth of contracts were awarded for the Riyadh and Doha metro projects alone. In contrast,
the residential and commercial buildings segment,
largely privately owned, was hit hard by the crisis
and was unable to recover until 2013 (figure II.9). Oil
and gas projects benefited from the oil price spike in
2008 that − together with the collapse in the price of
building materials and in engineering, procurement,
and construction services after the onset of the global
financial crisis − enabled national oil companies such
as Saudi Aramco, Abu Dhabi National Oil Company
and Qatar Gas to proceed with project plans.
This State-led construction growth has an
impact on the mode of foreign involvement. The
segments of the construction industry19 that most
benefited from expanded State-led investment − oil
and gas, and transport − are those with a significant
presence of foreign contractors, in contrast to the
residential and commercial buildings segment, where
local contractors dominate. This shift within the
construction sector has opened further opportunities
for foreign contractors to engage in new projects
through NEMs. From the perspective of a foreign
investor, NEMs reduce exposure to risks associated
with the region’s evolving instability.
Local contracting companies predominate
in terms of contracts awarded, but foreign
contractors are preponderant in terms of projects
under execution. Local contracting companies
picked up 62 per cent of the $88 billion worth of
Table II.5. Share of public/private GFCF in GDP and in total GFCF, current prices, 2003–2008 and 2009–2014 (Per cent)
Region/economy Share of private GFCF in GDP Share of public GFCF in GDP Share of public sector in GFCF2003–2008 2009–2014 2003–2008 2009–2014 2003–2008 2009–2014
World 17.8 17.7 5.0 5.8 21.6 24.5Developing economies 18.0 21.0 8.9 9.7 32.8 31.4
West Asiaa 15.7 14.4 6.2 7.9 28.1 35.6Iraqb 8.4 7.5 14.4 14.7 63.1 66.2Jordan 20.3 17.2 7.1 5.1 26.0 22.9Lebanon 20.7 22.3 2.4 1.8 10.2 7.5Syrian Arab Republicc 11.0 9.9 9.5 9.5 46.3 49.2Turkey 17.1 15.9 3.4 3.9 16.7 19.8Yemen 10.2 5.7 7.4 3.5 41.8 38.3GCC 15.2 14.4 7.4 9.5 32.6 39.7Bahrain 23.7 13.9 5.8 6.0 19.6 30.0Kuwait 13.3 11.3 3.8 5.9 22.3 34.1Oman 14.4 11.0 14.1 14.8 49.5 57.3Qatar 31.6 22.1 8.3 8.5 20.9 27.7Saudi Arabia 13.8 12.6 7.6 11.4 35.4 47.4
United Arab Emirates 13.3 16.3 7.3 7.5 35.5 31.5
Source: UNCTAD, based on IMF 2015.a The State of Palestine is not included for lack of available data. b Data for 2003 are not available.c Data since 2011 are not available.

World Investment Report 2015: Reforming International Investment Governance56
contracts awarded in 2013 (the latest available data)
to the largest contractors of each country and across
all industries.20 However, foreign contractors hold
sway in work under way. For instance, in Saudi Arabia
– the GCC’s largest market – the share of foreign
companies in the value of contracts awarded to the
10 largest contractors was 48 per cent in 2013, but
foreign contractors held 53 per cent of the value of the
10 largest projects under execution as of June in that
year. The difference is even bigger in the United Arab
Emirates, the GCC’s second largest market, where
foreign companies won only 31 per cent of the value
of contracts awarded to the 10 largest contractors
in 2013, but held 88 per cent of the value of the 10
largest projects under execution as of May in that
year.21 This difference could arise from a number of
factors such as delays or cancellations of contracts
awarded to local private companies, which may face
greater funding challenges.
Data for Saudi Arabia and the United Arab Emirates
show that in both countries foreign firms, especially
from the Republic of Korea (table II.6, box II.3), make
up most of the 10 largest contractors with work under
execution. However, local firms are also significant in Saudi Arabia: three are among the four largest contractors (table II.6), with Saudi Binladin by far the country’s leading contractor, accounting for more than a quarter of the $80 billion worth of work carried out by the largest contractors.
However, data on contracts awarded and on work under execution may underestimate the importance of foreign involvement, as they do not capture the subcontract market that has grown around GCC construction projects. This is especially the case with multibillion-dollar projects involving complex civil works, electromechanical systems and other vital infrastructure (Singapore Human Resources Institute, 2012).
The sharp fall in oil prices since mid-2014, particularly following the OPEC meeting in November, is likely to have a significant direct and indirect impact on the construction market in the GCC, particularly in planned oil and gas projects. Already in January 2015 two projects had been adversely affected by cheap oil prices: Qatar Petroleum and Royal Dutch Shell announced the
Source: UNCTAD, based on MEED Insight, “GCC Construction Projects Market 2015”, August 2014.
Source: UNCTAD, based on MEED Insight, “GCC construction projects market 2015”, August 2014.
Figure II.8.GCC: Value of contracts awarded by country, 2007–2013 (Billions of dollars)
55 5766
45
2533
52
33 31
57
61
74 53
66
20 23
9
1016
16
22
21 17
16
2418
18
17
0
20
40
60
80
100
120
140
160
2007 2008 2009 2010 2011 2012 2013
Others
Qatar
Saudi Arabia
United Arab Emirates
Figure II.9.GCC: Value of contracts awarded by segment, 2007–2013 (Billions of dollars)
Water and power
Transport
Oil and gas
Buildings
Others
4765
4253
43 42
65
10
10 49 25
18 15
1917
15
21
23
2824
48
27
30
31
26
23
20
17
286
5
13
21
19
8
0
20
40
60
80
100
120
140
160
2007 2008 2009 2010 2011 2012 2013
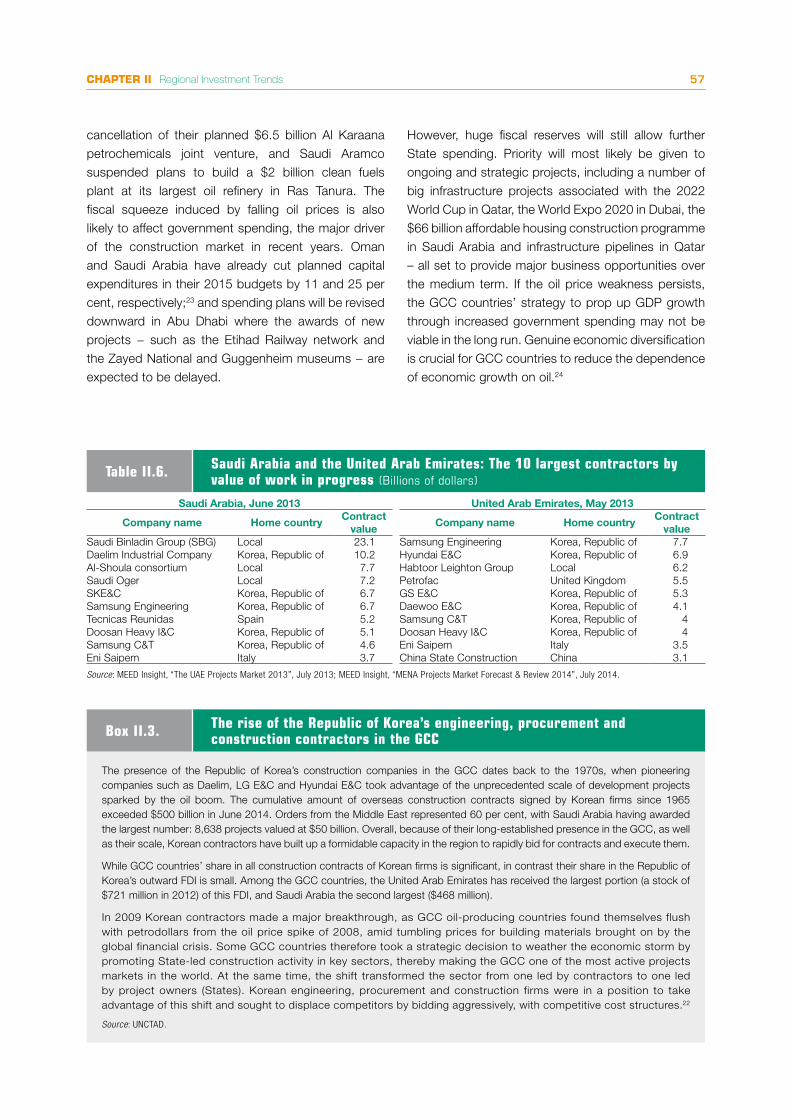
CHAPTER II Regional Investment Trends 57
cancellation of their planned $6.5 billion Al Karaana petrochemicals joint venture, and Saudi Aramco suspended plans to build a $2 billion clean fuels plant at its largest oil refinery in Ras Tanura. The fiscal squeeze induced by falling oil prices is also likely to affect government spending, the major driver of the construction market in recent years. Oman and Saudi Arabia have already cut planned capital expenditures in their 2015 budgets by 11 and 25 per cent, respectively;23 and spending plans will be revised downward in Abu Dhabi where the awards of new projects − such as the Etihad Railway network and the Zayed National and Guggenheim museums − are expected to be delayed.
However, huge fiscal reserves will still allow further State spending. Priority will most likely be given to ongoing and strategic projects, including a number of big infrastructure projects associated with the 2022 World Cup in Qatar, the World Expo 2020 in Dubai, the $66 billion affordable housing construction programme in Saudi Arabia and infrastructure pipelines in Qatar – all set to provide major business opportunities over the medium term. If the oil price weakness persists, the GCC countries’ strategy to prop up GDP growth through increased government spending may not be viable in the long run. Genuine economic diversification is crucial for GCC countries to reduce the dependence of economic growth on oil.24
The presence of the Republic of Korea’s construction companies in the GCC dates back to the 1970s, when pioneering companies such as Daelim, LG E&C and Hyundai E&C took advantage of the unprecedented scale of development projects sparked by the oil boom. The cumulative amount of overseas construction contracts signed by Korean firms since 1965 exceeded $500 billion in June 2014. Orders from the Middle East represented 60 per cent, with Saudi Arabia having awarded the largest number: 8,638 projects valued at $50 billion. Overall, because of their long-established presence in the GCC, as well as their scale, Korean contractors have built up a formidable capacity in the region to rapidly bid for contracts and execute them.
While GCC countries’ share in all construction contracts of Korean firms is significant, in contrast their share in the Republic of Korea’s outward FDI is small. Among the GCC countries, the United Arab Emirates has received the largest portion (a stock of $721 million in 2012) of this FDI, and Saudi Arabia the second largest ($468 million).
In 2009 Korean contractors made a major breakthrough, as GCC oil-producing countries found themselves flush with petrodollars from the oil price spike of 2008, amid tumbling prices for building materials brought on by the global financial crisis. Some GCC countries therefore took a strategic decision to weather the economic storm by promoting State-led construction activity in key sectors, thereby making the GCC one of the most active projects markets in the world. At the same time, the shift transformed the sector from one led by contractors to one led by project owners (States). Korean engineering, procurement and construction firms were in a position to take advantage of this shift and sought to displace competitors by bidding aggressively, with competitive cost structures.22
Source: UNCTAD.
Box II.3. The rise of the Republic of Korea’s engineering, procurement and construction contractors in the GCC
Table II.6. Saudi Arabia and the United Arab Emirates: The 10 largest contractors by value of work in progress (Billions of dollars)
Saudi Arabia, June 2013 United Arab Emirates, May 2013
Company name Home countryContract
value Company name Home country
Contract value
Saudi Binladin Group (SBG) Local 23.1 Samsung Engineering Korea, Republic of 7.7Daelim Industrial Company Korea, Republic of 10.2 Hyundai E&C Korea, Republic of 6.9Al-Shoula consortium Local 7.7 Habtoor Leighton Group Local 6.2Saudi Oger Local 7.2 Petrofac United Kingdom 5.5SKE&C Korea, Republic of 6.7 GS E&C Korea, Republic of 5.3Samsung Engineering Korea, Republic of 6.7 Daewoo E&C Korea, Republic of 4.1Tecnicas Reunidas Spain 5.2 Samsung C&T Korea, Republic of 4Doosan Heavy I&C Korea, Republic of 5.1 Doosan Heavy I&C Korea, Republic of 4Samsung C&T Korea, Republic of 4.6 Eni Saipem Italy 3.5Eni Saipem Italy 3.7 China State Construction China 3.1
Source: MEED Insight, “The UAE Projects Market 2013”, July 2013; MEED Insight, “MENA Projects Market Forecast & Review 2014”, July 2014.

Chile
Mexico
Colombia
Bolivarian Republic of Venezuela
Argentina
+71%$13
$5.2
$3.9
$2.1
$1.0
-60%
-49%
+93%
+36%
Flows, by range
Above $10 bn
$5.0 to $9.9 bn
$1 to $4.9 bn
$0.1 to $0.9 bn
Below $0.1 bn
Out�ows: top 5 home economies (Billions of dollars, and 2014 growth)
Top 5 host economies
Economy$ Value of in�ows2014 % Change
FDI in�ows, top 5 host economies, 2014(Value and change)
LATIN AMERICA & THE CARIBBEAN -14.4%
2014 Decrease
159.4 bn2014 In�ows
13%Share in world
FDI �ows to Latin America and the Caribbeanin total and by main subregions, 1991−2014 (Billions of dollars)
1992 1994 1996 1998 2000 2002 2004 2006 2008 2010 2012 20140
20
40
60
80
100
120
140
160
180
200
Total South America Central America and the Caribbean
Brazil$62.5 bn
-2.3%
Mexico$22.8 bn-48.9%
Chile$22.9 bn+38.4%
Colombia$16.1 bn
-0.9%
Peru$7.6 bn-18.2%
Source: UNCTAD. Note: The boundaries and names shown and the designations used on this map do not imply official endorsement or acceptance by the United Nations.

Region/country Sales Purchases2013 2014 2013 2014
World 34 797 25 457 16 239 8 440 Developed economies 19 678 17 949 5 118 8 131
Europe 11 870 -1 269 2 913 4 214 North America 6 792 10 899 2 092 3 916 Other developed countries 1 016 8 319 113 -
Developing economies 14 401 6 797 11 134 309 Africa - 1 094 -430 400 Latin America and the Caribbean 10 731 -251 10 731 -251
South America 7 928 248 6 177 -1 091 Central America 2 803 -499 3 927 840
Asia and Oceania 3 670 5 954 833 160 South, East and South-East Asia 3 404 4 954 779 -
Transition economies - 596 -13 -
Sector/industry Sales Purchases2013 2014 2013 2014
Total 34 797 25 457 16 239 8 440 Primary 1 287 391 288 -2 759
Extraction of crude petroleum and natural gas 345 184 207 -2 600
Mining of metal ores 928 -1 74 26 Manufacturing 25 138 2 929 7 117 3 830
Food, beverages and tobacco 23 848 -42 4 644 1 953 Coke and refined petroleum products - -5 317 - -
Chemicals and chemical products -116 3 796 156 923 Pharmaceuticals, medicinal chemicals and botanical products 317 3 603 25 11
Services 8 372 22 137 8 834 7 369 Electricity, gas, water and waste management 3 720 4 805 85 840
Transportation and storage 1 488 5 510 628 400 Financial and insurance activities 2 371 5 994 7 953 5 071
Sector/industryLAC
as destinationLAC
as investors2013 2014 2013 2014
Total 153 023 89 446 20 499 8 689 Primary 12 568 11 097 4 000 22 Manufacturing 38 427 32 127 6 937 3 652
Food, beverages and tobacco 3 956 2 726 1 741 1 579 Metals and metal products 4 197 2 638 89 207 Electrical and electronic equipment 2 687 3 029 406 86
Motor vehicles and other transport equipment 13 517 16 229 128 263
Services 102 028 46 222 9 562 5 015 Electricity, gas and water 17 067 13 363 809 453 Trade 3 652 2 446 1 255 1 012 Transport, storage and communications 19 380 18 018 4 403 2 215
Finance 5 090 4 135 805 994 Business services 49 701 6 152 1 493 186
Partner region/economyLAC
as destinationLAC
as investors2013 2014 2013 2014
World 153 023 89 446 20 499 8 689Developed economies 81 987 71 167 1 539 1 760
Europe 39 167 30 526 684 551Canada 4 553 10 358 10 -United States 26 304 26 190 805 1 151
Developing economies 70 071 18 170 18 864 6 651Asia and Oceania 52 250 11 790 931 481
China 3 258 8 154 377 282Hong Kong, China 44 424 175 143 29
Latin America and the Caribbean 17 737 6 084 17 737 6 084
South America 12 341 3 229 14 447 4 201Central America 5 152 2 576 2 477 1 120
Transition economies 965 109 96 278
Table C. Cross-border M&As by industry, 2013–2014 (Millions of dollars)
Table D. Cross-border M&As by region/country, 2013–2014 (Millions of dollars)
HIGHLIGHTS
2008 2009 2010 2011 2012 2013 2014 2008 2009 2010 2011 2012 2013 20140
15
30
45
60
75
-4
-2
0
2
4
6
8
10
12
14
16
North Africa East Africa West Africa Southern Africa Central Africa
Share in world total
3.9 4.6 3.3 3.1 4.0 3.7 4.4 0.6 0.6 0.7 0.4 1.0 1.2 1.0
2008 2009 2010 2011 2012 2013 2014
East Asia South-East Asia
2008 2009 2010 2011 2012 2013 20140
100
200
300
400
0
100
200
300
400
2008 2009 2010 2011 2012 2013 2014 2008 2009 2010 2011 2012 2013 20140
10
20
30
40
50
60
0
5
10
15
20
25
Share in world total
3.8 3.6 2.6 2.8 2.3 2.4 3.4 1.3 1.5 1.2 0.8 0.8 0.2 0.8
2008 2009 2010 2011 2012 2013 2014 2008 2009 2010 2011 2012 2013 20140
20
40
60
80
100
0
10
20
30
40
50
TurkeyOther West Asia Gulf Cooperation Council (GCC)
Share in world total
6.3 6.0 4.5 3.4 3.4 3.0 3.5 2.2 1.6 1.3 2.0 1.8 3.1 2.8
Share in world total
15.9 17.7 23.1 20.9 22.9 23.7 31.0 9.8 16.4 18.3 16.9 20.7 22.4 28.3
2008 2009 2010 2011 2012 2013 2014
Caribbean, excluding �nancial centers Central America South America
Georgia Commonwealth of Independent States
2008 2009 2010 2011 2012 2013 2014
2008 2009 2010 2011 2012 2013 2014 2008 2009 2010 2011 2012 2013 2014
South-East Europe
2008 2009 2010 2011 2012 2013 2014 2008 2009 2010 2011 2012 2013 2014
Africa Latin America and the Caribbean Asia Oceania
2008 2009 2010 2011 2012 2013 2014 2008 2009 2010 2011 2012 2013 2014
2008 2009 2010 2011 2012 2013 2014 2008 2009 2010 2011 2012 2013 2014
0
50
100
150
200
250
0
50
100
0
25
50
75
100
125
0
20
40
60
80
100
0
5
10
15
20
25
30
0
1
2
3
4
5
6
7
8
0
5
10
15
20
25
30
35
40
0
2
4
6
8
10
0
1
2
3
4
5
6
7
8
9
10
0
0.5
1
1.5
2
2.5
Share in world total
9.2 7 9.9 10.5 12.7 12.7 13 2.3 1.2 3.4 2.3 3.4 2.2 1.7
Share in world total
7.8 5.9 5.6 6.2 6.1 6.8 3.9 3.5 4.3 4.5 4.6 4.2 7.0 4.7
Share in world total
1.2 1.4 1.8 1.4 1.7 1.5 1.9 0.2 0.1 0.2 0.3 0.4 0.6 0.2
Share in world total
1.7 2.2 2.0 2.3 2.5 2.0 2.4 0.1 0.4 0.7 0.4 0.2 0.3 0.4
Share in world total
0.6 0.4 0.3 0.4 0.5 0.4 0.6 0.1 0.0 0.0 0.1 0.2 0.1 0.1
North America Other developed Europe European Union
2008 2009 2010 2011 2012 2013 2014 2008 2009 2010 2011 2012 2013 2014
Other developed countries
0
400
800
1 200
1 600
0
400
800
1 200
1 600
Share in world total
52.9 55.0 50.7 52.9 48.4 47.5 40.6 80.3 74.4 70.5 72.8 68.0 63.8 60.8
Transition economies Asia and Oceania Latin America and the Caribbean Africa
Oceania Asia Latin America and the Caribbean Africa
Figure A. FDI in�ows, 2008−2014 (Billions of dollars)
Figure B. FDI out�ows, 2008−2014(Billions of dollars)
• Inflows fall with commodity prices and cross-border M&As • European, Asian and regional investors gain ground• FDI being re-evaluated for post-2015 development agenda
Table A. Announced greenfield FDI projects by industry, 2013–2014 (Millions of dollars)
Table B. Announced greenfield FDI projects by region/country, 2013–2014 (Millions of dollars)

World Investment Report 2015: Reforming International Investment Governance60
FDI flows to Latin America and the Caribbean –
excluding the Caribbean offshore financial centres –
decreased by 14 per cent to $159 billion in 2014, after
four years of consecutive increases.
This fall was mainly the consequence of a 72 per
cent decline in cross-border M&As in Central America
and the Caribbean and of lower commodity prices,
which reduced investment in the extractive industries
in South America. The decline took place in both
subregions but was stronger in Central America and
the Caribbean (down 36 per cent to $39 billion),
where inflows returned to their normal values after
the unusually high levels reached in 2013, which were
due to a cross-border megadeal in Mexico. Flows to
South America continued declining for the second
consecutive year, down 4 per cent to $121 billion,
with all the main recipient countries, except Chile,
registering negative FDI growth.
Brazil remained the region´s leading FDI target with
flows amounting to $62 billion, down 2 per cent
despite a significant increase in cross-border M&A
sales (by 42 per cent to $14 billion). The FDI decline
was driven by a fall in the primary sector (−58 per
cent to $7 billion), while flows to manufacturing and
services increased by 5 and 18 per cent to $22 billion
and $33 billion, respectively. FDI to the motor vehicles
industry registered the strongest increase in absolute
value ($1.4 billion) and reached a total amount of $4
billion, placing this industry among the four largest FDI
recipient sectors in 2014 after commerce ($6.8 billion),
telecommunications ($4.2 billion), and oil and gas
extraction ($4.1 billion).
Chile recovered its place as the region’s second largest
target for FDI flows. Inflows to the country rose by 38
per cent to $23 billion, boosted by exceptionally high
levels of cross-border M&A sales, which increased
more than three-fold to $9 billion. Mexico registered
the strongest decline in absolute value, with inflows
dropping by almost half ($23 billion) and bringing the
country back to the third position in the ranks of FDI
recipients. This resulted from a drop of cross-border
sales after the exceptional levels reached in 2013 with
the $18 billion sale of the Modelo brewery (WIR14),
intensified by the $5 billion divestment by AT&T (United
States) in 2014 of its stake in América Móvil. Bucking
the general declining trend, the automobile industry
continued to attract increasing amounts of FDI, which
reached $4.3 billion, up 21 per cent, representing
19 per cent of total inflows to the country and the
highest amount received by all industries in 2014.
Declining investments in the extractive industry
affected flows to Argentina (−41 per cent), Colombia
(−1 per cent), Peru (−18 per cent) and the Bolivarian
Republic of Venezuela (−88 per cent). In Argentina,
the negative trend was accentuated by the $5.3 billion
compensation received by the Spanish oil company
Repsol for the 2012 nationalization of 51 per cent of
YPF, part of which is recorded in FDI flows through
income (which affects reinvested earnings). In
Colombia, the strong decline of FDI in the extractive
industries (21 per cent to $6.4 billion) was offset mainly
by the rises registered in finance (54 per cent to $2.5
billion), transport and communications (39 per cent
to $1.9 billion), and manufacturing (13 per cent to
$2.9 billion). In the Bolivarian Republic of Venezuela,
a strong increase in reverse intracompany loans (the
repayment of loans to the parent company) also
contributed to the FDI decline.
In Panama − after strong growth registered in 2013
(up by 56 per cent) – flows increased only slightly (1.4
per cent) and remained close to $5 billion as the peak
in large-scale foreign investment related to the canal
expansion continues to pass. In Costa Rica, flows
decreased by 21 per cent to $2.1 billion, affected by
the closure of Intel’s factory25 and Bank of America’s
restructuring. Intel moved its operations (except R&D
facilities) to Malaysia, Viet Nam and China, cutting 1,500
jobs in Costa Rica, while Bank of America laid off 1,400
workers as part of a global restructuring programme.
Flows to Trinidad and Tobago increased by 21 per
cent as the result of the $1.2 billion acquisition of the
remaining 57 per cent stake in Methanol Holdings
Trinidad Limited by Consolidated Energy Company
(Mauritius). In the Dominican Republic, FDI registered
an 11 per cent rise to $2.2 billion, partly explained by
increased investment in free zones.26
Outward FDI from Latin America and the Caribbean,
excluding offshore financial centres, decreased by
18 per cent in 2014, to $23 billion. Owing to the
high incidence of intracompany loans and significant
investment in offshore financial centres, outward FDI
data may not accurately reflect reality. Brazil ranked
last as the region’s outward direct investor, registering
negative flows (−$3.5 billion) for the fourth consecutive
year, but it remained the region’s largest outward direct
investor in terms of equity capital outward flows, which

CHAPTER II Regional Investment Trends 61
increased by 32 per cent to $20 billion in 2014 (half
of which was directed to offshore financial centres).
This is explained by the high amounts of loans from
foreign affiliates to parent companies in Brazil, which
surpassed by $23 billion the loans granted by Brazilian
parents to their affiliates abroad. Chile and Mexico are
other examples of the effect of the high incidence of
intracompany loans on total outward FDI flows. Chile
was the region’s main direct investor abroad in 2014,
with flows increasing by 71 per cent to $13 billion,
despite a 26 per cent decline in equity capital outflows.
Mexico − the region’s second largest outward investor
after Chile − saw a 60 per cent decline in outward
FDI flows, to $5.2 billion, driven mainly by a decline in
intracompany loans.
Part of MNEs’ activities abroad can be captured by
their cross-border acquisitions. For Latin American
MNEs, such acquisitions decreased by half in 2014,
to $8.4 billion, with Brazil registering the strongest
decline (from $3 billion in 2013 to −$2.4 billion in
2014). The decrease was due to the small value of
new cross-border purchases and the large divestment
by Petrobras of its Peruvian oil and gas assets to
PetroChina for $2.6 billion. There has also been a
strong decrease in cross-border purchases by MNEs
from Chile (−73 per cent to $750 million) and Colombia
(−75 per cent to $1.6 billion). Mexican MNEs raised
the value of their acquisitions abroad by 40 per cent.
The most important deals included Grupo Bimbo’s
acquisition of Canada Bread for $1.7 billion and
América Móvil’s purchase of a 34.7 per cent stake in
Telekom Austria for $1.5 billion.
FDI to Latin America and the Caribbean: the current slowdown in a historical perspective
Historically, FDI in Latin America has been concentrated
in manufacturing activities to supply highly protected
domestic markets. A radical shift in economic policy
orientation took place region-wide in the 1990s,
opening up a new era for FDI flows into the region. This
led to two main waves of FDI in succeeding decades
(figure II.10).
The first wave began in the mid-1990s as a
result of liberalization and privatization policies that
encouraged FDI into sectors such as services and
extractive industries, which had previously been closed
to private and/or foreign capital. Significant flows of
market-seeking FDI went towards non-tradable service
activities − such as telecommunications, electricity
generation and distribution, transportation and
banking − mainly through cross-border acquisitions.27
Simultaneously, large-scale resource-seeking FDI
flows targeted the extractive industries mainly in
South America, as Mexico kept its oil and gas sector
Figure II.10. FDI �ows to Latin America and the Caribbean in total and by main subregions, 1991−2014 (Billions of dollars)
1992 1994 1996 1998 2000 2002 2004 2006 2008 2010 2012 20140
20
40
60
80
100
120
140
160
180
200
Total South America Central America and the Caribbean
Source: UNCTAD, FDI/MNE database (www.unctad.org/fdistatistics).Note: Excludes Caribbean offshore financial centres.
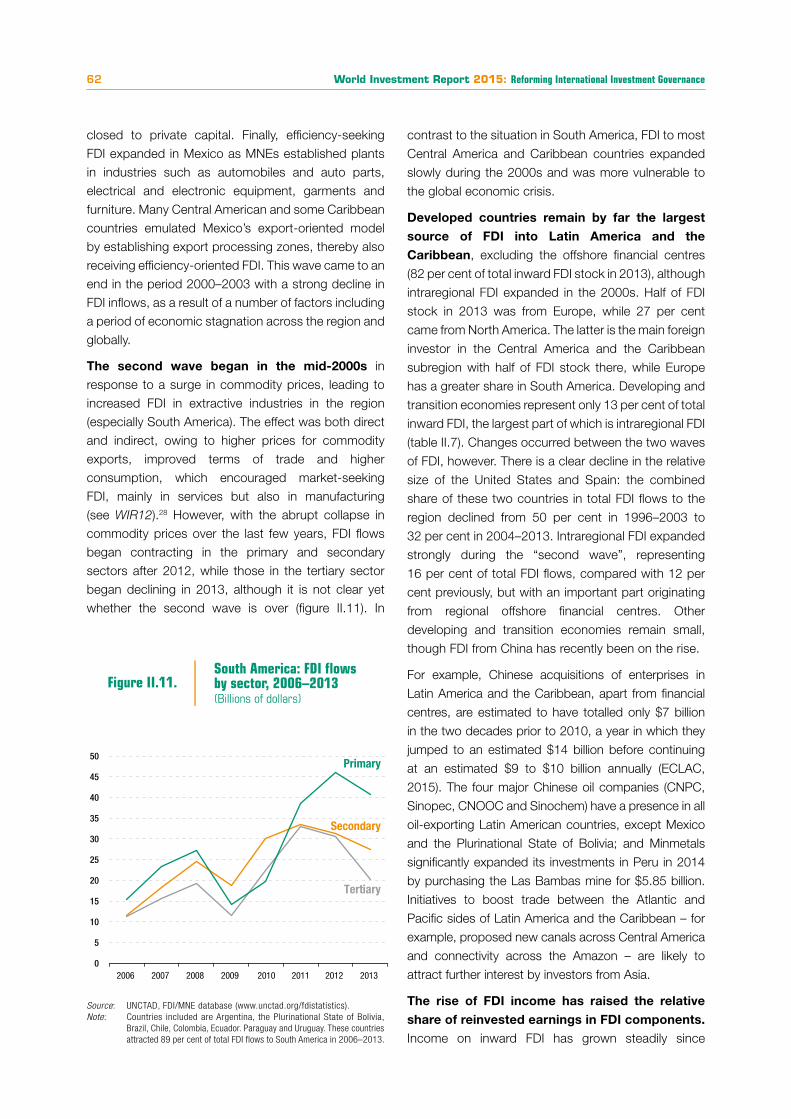
World Investment Report 2015: Reforming International Investment Governance62
closed to private capital. Finally, efficiency-seeking FDI expanded in Mexico as MNEs established plants in industries such as automobiles and auto parts, electrical and electronic equipment, garments and furniture. Many Central American and some Caribbean countries emulated Mexico’s export-oriented model by establishing export processing zones, thereby also receiving efficiency-oriented FDI. This wave came to an end in the period 2000–2003 with a strong decline in FDI inflows, as a result of a number of factors including a period of economic stagnation across the region and globally.
The second wave began in the mid-2000s in response to a surge in commodity prices, leading to increased FDI in extractive industries in the region (especially South America). The effect was both direct and indirect, owing to higher prices for commodity exports, improved terms of trade and higher consumption, which encouraged market-seeking FDI, mainly in services but also in manufacturing (see WIR12).28 However, with the abrupt collapse in commodity prices over the last few years, FDI flows began contracting in the primary and secondary sectors after 2012, while those in the tertiary sector began declining in 2013, although it is not clear yet whether the second wave is over (figure II.11). In
contrast to the situation in South America, FDI to most
Central America and Caribbean countries expanded
slowly during the 2000s and was more vulnerable to
the global economic crisis.
Developed countries remain by far the largest source of FDI into Latin America and the Caribbean, excluding the offshore financial centres
(82 per cent of total inward FDI stock in 2013), although
intraregional FDI expanded in the 2000s. Half of FDI
stock in 2013 was from Europe, while 27 per cent
came from North America. The latter is the main foreign
investor in the Central America and the Caribbean
subregion with half of FDI stock there, while Europe
has a greater share in South America. Developing and
transition economies represent only 13 per cent of total
inward FDI, the largest part of which is intraregional FDI
(table II.7). Changes occurred between the two waves
of FDI, however. There is a clear decline in the relative
size of the United States and Spain: the combined
share of these two countries in total FDI flows to the
region declined from 50 per cent in 1996–2003 to
32 per cent in 2004–2013. Intraregional FDI expanded
strongly during the “second wave”, representing
16 per cent of total FDI flows, compared with 12 per
cent previously, but with an important part originating
from regional offshore financial centres. Other
developing and transition economies remain small,
though FDI from China has recently been on the rise.
For example, Chinese acquisitions of enterprises in
Latin America and the Caribbean, apart from financial
centres, are estimated to have totalled only $7 billion
in the two decades prior to 2010, a year in which they
jumped to an estimated $14 billion before continuing
at an estimated $9 to $10 billion annually (ECLAC,
2015). The four major Chinese oil companies (CNPC,
Sinopec, CNOOC and Sinochem) have a presence in all
oil-exporting Latin American countries, except Mexico
and the Plurinational State of Bolivia; and Minmetals
significantly expanded its investments in Peru in 2014
by purchasing the Las Bambas mine for $5.85 billion.
Initiatives to boost trade between the Atlantic and
Pacific sides of Latin America and the Caribbean – for
example, proposed new canals across Central America
and connectivity across the Amazon – are likely to
attract further interest by investors from Asia.
The rise of FDI income has raised the relative share of reinvested earnings in FDI components. Income on inward FDI has grown steadily since
Figure II.11.South America: FDI �ows by sector, 2006–2013 (Billions of dollars)
0
5
10
15
20
25
30
35
40
45
50
2006 2007 2008 2009 2010 2011 2012 2013
Primary
Secondary
Tertiary
Source: UNCTAD, FDI/MNE database (www.unctad.org/fdistatistics).Note: Countries included are Argentina, the Plurinational State of Bolivia,
Brazil, Chile, Colombia, Ecuador. Paraguay and Uruguay. These countries attracted 89 per cent of total FDI flows to South America in 2006–2013.

CHAPTER II Regional Investment Trends 63
Latin America and the Caribbean South America Central America and the Caribbean
Home economy/regionFlows
1996–2003Flows
2004–2013Stocks 2013
Flows 1996–2003
Flows 2004–2013
Stocks 2013
Flows 1996–2003
Flows 2004–2013
Stocks 2013
United States 33.3 23.9 23.8 19.2 14.8 15.2 59.9 40.7 44.9
Netherlands 8.2 13.9 16.7 8.5 14.6 19.8 7.6 12.6 9.0
Spain 17.1 8.5 10.6 20.7 7.3 10.7 10.5 10.7 10.2
Belgium/Luxembourg 1.4 7.3 6.9 1.9 7.8 6.3 0.5 6.2 8.3
Canada 2.1 5.1 3.6 1.4 2.9 2.8 3.4 9.0 5.3
United Kingdom 3.3 4.2 3.7 2.8 5.0 3.3 4.2 2.8 4.5
Switzerland 1.3 3.7 2.4 0.8 4.9 2.4 2.2 1.6 2.5
France 4.1 3.2 3.1 6.3 4.4 4.0 -0.1 0.9 1.0
Japan 1.5 3.0 2.8 1.4 3.7 3.2 1.8 1.7 1.9
Mexico 0.2 3.0 2.0 0.1 3.9 2.4 0.3 1.3 1.1
Chile 0.6 2.6 1.4 0.9 3.9 1.8 0.2 0.2 0.2
Developed economies 81.2 80.6 81.8 74.3 75.2 77.4 94.3 90.5 92.4Europe 42.8 46.4 49.8 50.2 50.6 53.9 29.0 38.7 39.9
North America 35.7 28.9 27.4 21.2 17.7 18.0 63.2 49.7 50.2
Developing economies 12.5 17.8 12.6 16.7 22.8 14.9 4.6 8.5 7.1Latin America and the Caribbean 11.8 15.9 10.7 16.3 20.5 13.0 3.4 7.3 5.3
Financial centres 7.4 6.4 3.3 10.4 8.6 4.2 1.7 2.5 1.2
South America 2.4 5.8 4.8 3.3 7.8 6.0 0.6 2.0 1.9
Central America and the Caribbean 2.1 3.7 2.4 2.6 4.1 2.5 1.1 2.8 2.2
Asia and Oceania 0.7 1.9 1.8 0.4 2.3 1.7 1.2 1.2 1.8
South-East Europe and CIS 0.0 0.1 0.1 0.0 0.2 0.1 0.0 0.0 0.0Unspecified 6.3 1.5 5.5 9.0 1.8 7.6 1.1 1.0 0.5
Source: UNCTAD, FDI/MNE database (www.unctad.org/fdistatistics).Note: Host countries in South America: Argentina, the Plurinational State of Bolivia, Brazil, Chile (only stocks), Colombia (only flows), Ecuador (only flows), Paraguay, Peru,
Uruguay (only stocks, 2012 ) and the Bolivarian Republic of Venezuela (flows data cover only 1996–2012). In Central America and the Caribbean: Costa Rica, the Dominican Republic (only flows), El Salvador (flows data cover only 1998–2012), Honduras, Mexico, and Trinidad and Tobago (flows data cover only 1996–2012; stocks data are 2012).
Table II.7. FDI to Latin America and the Caribbean by main home countries, group of economies and regions (Percentage shares in regional totals)
Figure II.12. FDI �ows and income on FDI in Latin America and the Caribbean, 1991–2013 (Billions of dollars)
0
50
100
150
200
Inward FDI
Income on inward FDI
1991 1993 1995 1997 1999 2001 2003 2005 2007 2009 2011 2013
Source: UNCTAD, FDI/MNE database (www.unctad.org/fdistatistics).Note: Excludes offshore financial centres. Host countries in South America: Argentina, the Plurinational State of Bolivia, Brazil, Chile, Colombia, Ecuador, Guyana, Paraguay,
Peru, Suriname, Uruguay and the Bolivarian Republic of Venezuela. In Central America: Belize, Costa Rica, El Salvador, Guatemala, Honduras, Mexico, Nicaragua and Panama. In the Caribbean: the Dominican Republic, Jamaica, and Trinidad and Tobago.

World Investment Report 2015: Reforming International Investment Governance64
2003–2004 (mainly because of the high prices and profits enjoyed in the extractive industry until recently), approaching the scale of inflows in the latter part of the 2000s (figure II.12). As a result, reinvested (or retained) earnings became the main component of FDI inflows in the 2000s, in contrast to the 1990s when this FDI component was marginal and equity capital predominant (figure II.13).
The current slowdown in FDI flows to the region is an occasion for a reflection on the experience of the two FDI waves across the region. In the context of the post-2015 development agenda, policymakers may consider potential policy options on the role of FDI for the region’s development path. Lessons from the past include the following:
• The commodity “bonanza” in part distracted policymakers from carefully designed development strategies in which FDI can play a role in supporting Latin American and Caribbean economies’ entry into, and growth within, global value chains (WIR13). A re-evaluation of development policies is needed, based on a careful assessment of spillovers from
FDI, the capacities needed by domestic firms to benefit from them, and options to establish effective linkages between MNEs and local enterprises.
• The impact of FDI entry on the balance of payments is broader than a mere assessment of flows and income generated. The consequences depend, among others, on FDI motivations − i.e. resource-seeking, market-seeking, efficiency-seeking, or just “parking” assets. In light of MNEs’ high retained investment income across the region, it is essential for policymakers to encourage the use of such income for productive reinvestments and longer-term benefits.
• Across the region, MNEs are hampered by the slowdown in commodity prices, lower economic growth and flat domestic demand. Policymakers may consider the broader role of FDI in local development pathways. Prospects for reduced relative importance of commodities-related FDI may provide opportunities for diversification of FDI flows, including into sectors key for sustainable development.
Figure II.13. Latin America and the Caribbean: FDI in�ows, total and by components, 1994–2013(Billions of dollars)
Total in�ows Equity in�ows Reinvested earnings in�ows Other capital in�ows
1995 1997 1999 2001 2003 2005 2007 2009 2011 20130
20
40
60
80
100
120
140
Source: UNCTAD, FDI/MNE database (www.unctad.org/fdistatistics).Note: Excludes offshore financial centres. Brazil is not included because data on reinvested earnings are not available. Countries included in South America: Argentina,
Bolivia, Chile Colombia, Ecuador, Guyana, Paraguay, Peru, Surinam, Uruguay and the Bolivarian Republic of Venezuela. In Central America and the Caribbean: Costa Rica, El Salvador, Guatemala, Honduras, Mexico, the Dominican Republic, and Trinidad and Tobago.

Russian Fed.
Kazakhstan
Azerbaijan
Georgia
Serbia
-35%$56.4
$3.6
$2.2
$0.4
$0.2
+59%
+48%
+8.2%
+68%
Flows, by range
Above $5.0 bn
$1.0 to $4.9 bn
$0.5 to $0.9 bn
Below $0.5 bn
Out�ows: top 5 home economies (Billions of dollars, and 2014 growth)
Top 5 host economies
Economy$ Value of in�ows2014 % Change
FDI in�ows, top 5 host economies, 2014(Value and change)
TRANSITION ECONOMIES-51.7%
2014 Decrease
48.1 bn2014 In�ows
3.9%Share in world
Russian Federation$21 bn-69.7%
Kazakhstan$9.6 bn-6.4%Azerbaijan
$4.4 bn+68.3%
Serbia$2.0 bn-2.7%
Turkmenistan$3.2 bn+2.8%
Source: UNCTAD.Note: The boundaries and names shown and the designations used on this map do not imply official endorsement or acceptance by the United Nations.
Name of investing company
Source country Destination Value
China Triumph International
EngineeringChina Russian Federation 3 000
Hawtai Motor Group China Russian Federation 1 100
TERNA Italy Montenegro 1 000
Hareon Solar Technology ChinaBosnia and
Herzegovina636
Great Wall Motors (GWM) China Russian Federation 520
The five largest greenfield FDI projects announced in the transition economies, 2014 (Millions of dollars)

Region/countrySales Purchases
2013 2014 2013 2014World -3 820 4 220 3 054 1 831
Developed economies -7 191 1 536 1 682 -251 European Union -3 987 200 243 2 184
Cyprus -234 5 085 - 20 Italy -1 905 -2 803 357 1 588 United Kingdom -487 -1 013 5 -
United States -3 580 487 30 -2 414 Developing economies 2 572 1 363 600 852
Asia 2 585 1 369 600 256 South, East and South-East Asia 2 160 1 223 597 447
China 2 000 1 642 - - Transition economies 771 1 231 771 1 231
Russian Federation 607 1 374 817 -173
Sector/industry Sales Purchases2013 2014 2013 2014
Total -3 820 4 220 3 054 1 831 Primary -3 726 3 011 1 771 2 526
Mining, quarrying and petroleum -3 726 3 011 1 771 2 526 Manufacturing 2 813 1 309 -24 -2 491
Chemicals and chemical products 2 000 - 30 - Pharmaceuticals, medicinal chemicals and botanical products -34 379 - -
Basic metal and metal products 425 24 -59 -2 406 Motor vehicles and other transport equipment 60 750 - -
Services -2 907 -100 1 307 1 797 Electricity, gas, water and waste management 857 -1 267 597 -
Telecommunications -2 326 5 - - Financial and insurance activities -164 -305 -17 1 757 Business activities -73 1 361 72 -
Sector/industry
Transition economies
as destination
Transition economies
as investors2013 2014 2013 2014
Total 29 345 25 650 18 818 5 801 Primary 551 391 3 135 931
Mining, quarrying and petroleum 551 391 3 135 931 Manufacturing 10 920 15 682 2 559 1 701
Food, beverages and tobacco 890 1 938 248 376 Non-metallic mineral products 834 1 194 - 402 Machinery and equipment 655 3 373 174 87 Motor vehicles and other transport equipment 2 065 4 278 696 319
Services 17 874 9 578 13 123 3 169 Electricity, gas and water 5 468 3 172 10 335 355 Construction 3 045 1 458 - 97 Transport, storage and communications 2 727 1 335 734 989
Finance 2 490 1 798 1 434 1 042
Partner region/economy
Transition economies
as destination
Transition economies
as investors2013 2014 2013 2014
World 29 345 25 650 18 818 5 801 Developed economies 20 914 12 537 2 266 1 630
European Union 15 679 9 842 2 126 1 465 Germany 2 773 1 942 158 116 Italy 972 1 900 - -
United States 2 775 1 747 40 34 Developing economies 6 385 11 116 14 506 2 173
Africa 74 - 101 90 East and South-East Asia 1 643 9 681 550 789
China 757 8 332 89 665 West Asia 3 703 872 12 816 1 081 Latin America and the Caribbean 96 278 965 109
Transition economies 2 046 1 998 2 046 1 998
Table C. Cross-border M&As by industry, 2013–2014 (Millions of dollars)
Table D. Cross-border M&As by region/country, 2013–2014 (Millions of dollars)
HIGHLIGHTS
2008 2009 2010 2011 2012 2013 2014 2008 2009 2010 2011 2012 2013 20140
15
30
45
60
75
-4
-2
0
2
4
6
8
10
12
14
16
North Africa East Africa West Africa Southern Africa Central Africa
Share in world total
3.9 4.6 3.3 3.1 4.0 3.7 4.4 0.6 0.6 0.7 0.4 1.0 1.2 1.0
2008 2009 2010 2011 2012 2013 2014
East Asia South-East Asia
2008 2009 2010 2011 2012 2013 20140
100
200
300
400
0
100
200
300
400
2008 2009 2010 2011 2012 2013 2014 2008 2009 2010 2011 2012 2013 20140
10
20
30
40
50
60
0
5
10
15
20
25
Share in world total
3.8 3.6 2.6 2.8 2.3 2.4 3.4 1.3 1.5 1.2 0.8 0.8 0.2 0.8
2008 2009 2010 2011 2012 2013 2014 2008 2009 2010 2011 2012 2013 20140
20
40
60
80
100
0
10
20
30
40
50
TurkeyOther West Asia Gulf Cooperation Council (GCC)
Share in world total
6.3 6.0 4.5 3.4 3.4 3.0 3.5 2.2 1.6 1.3 2.0 1.8 3.1 2.8
Share in world total
15.9 17.7 23.1 20.9 22.9 23.7 31.0 9.8 16.4 18.3 16.9 20.7 22.4 28.3
2008 2009 2010 2011 2012 2013 2014
Caribbean, excluding �nancial centers Central America South America
Georgia Commonwealth of Independent States
2008 2009 2010 2011 2012 2013 2014
2008 2009 2010 2011 2012 2013 2014 2008 2009 2010 2011 2012 2013 2014
South-East Europe
2008 2009 2010 2011 2012 2013 2014 2008 2009 2010 2011 2012 2013 2014
Africa Latin America and the Caribbean Asia Oceania
2008 2009 2010 2011 2012 2013 2014 2008 2009 2010 2011 2012 2013 2014
2008 2009 2010 2011 2012 2013 2014 2008 2009 2010 2011 2012 2013 2014
0
50
100
150
200
250
0
50
100
0
25
50
75
100
125
0
20
40
60
80
100
0
5
10
15
20
25
30
0
1
2
3
4
5
6
7
8
0
5
10
15
20
25
30
35
40
0
2
4
6
8
10
0
1
2
3
4
5
6
7
8
9
10
0
0.5
1
1.5
2
2.5
Share in world total
9.2 7 9.9 10.5 12.7 12.7 13 2.3 1.2 3.4 2.3 3.4 2.2 1.7
Share in world total
7.8 5.9 5.6 6.2 6.1 6.8 3.9 3.5 4.3 4.5 4.6 4.2 7.0 4.7
Share in world total
1.2 1.4 1.8 1.4 1.7 1.5 1.9 0.2 0.1 0.2 0.3 0.4 0.6 0.2
Share in world total
1.7 2.2 2.0 2.3 2.5 2.0 2.4 0.1 0.4 0.7 0.4 0.2 0.3 0.4
Share in world total
0.6 0.4 0.3 0.4 0.5 0.4 0.6 0.1 0.0 0.0 0.1 0.2 0.1 0.1
North America Other developed Europe European Union
2008 2009 2010 2011 2012 2013 2014 2008 2009 2010 2011 2012 2013 2014
Other developed countries
0
400
800
1 200
1 600
0
400
800
1 200
1 600
Share in world total
52.9 55.0 50.7 52.9 48.4 47.5 40.6 80.3 74.4 70.5 72.8 68.0 63.8 60.8
Transition economies Asia and Oceania Latin America and the Caribbean Africa
Oceania Asia Latin America and the Caribbean Africa
Figure A. FDI in�ows, 2008−2014 (Billions of dollars)
Figure B. FDI out�ows, 2008−2014(Billions of dollars)
• Geopolitical risk, regional conflict weighed down flows to the CIS • Developing-economy MNEs becoming large investors • FDI to decline in 2015 with continued recession and low oil prices
Table A. Announced greenfield FDI projects by industry, 2013–2014 (Millions of dollars)
Table B. Announced greenfield FDI projects by region/country, 2013–2014 (Millions of dollars)

CHAPTER II Regional Investment Trends 67
FDI inflows of the transition economies of South-East
Europe, the Commonwealth of Independent States
(CIS) and Georgia fell by more than half in 2014
compared with the previous year, to $48 billion − a
value last seen in 2005. In the CIS, regional conflict
coupled with falling oil prices and international
sanctions reduced foreign investors’ confidence in the
strength of local economies. In South-East Europe,
FDI flows remained flat at $4.7 billion.
In South-East Europe, foreign investors mostly
targeted manufacturing. In contrast to previous
years, when the largest share of FDI flows was directed
to the financial, construction and real estate industries,
in 2014 foreign investors targeted manufacturing,
buoyed on the back of competitive production costs
and access to EU markets. Serbia and Albania,
both EU accession candidates, remained the largest
recipients of FDI flows in the subregion at $2 billion
and $1 billion, respectively.
Geopolitical risk and regional conflict weighed
heavily on FDI flows to the transition economies
of the CIS. FDI flows to Ukraine fell by 91 per cent
to $410 million − the lowest level in 15 years − mainly
due to the withdrawal of capital by Russian investors,
and investors based in Cyprus (partly linked to round-
tripping from the Russian Federation and Ukraine).
The Russian Federation − the region’s largest host
country − saw its flows fall by 70 per cent to $21 billion because of the country’s negative growth prospects as an well as an adjustment after the exceptional level reached in 2013 (due to the large-scale Rosneft−BP transaction (WIR14)). FDI flows to Kazakhstan fell by 6 per cent in 2014, as a rise in equity investments was offset by a decline in intracompany loans. Geological exploration activities by foreign investors continued, accounting for more than half of FDI stock in the country. Other transition economies in the CIS saw their FDI flows rise in 2014. Flows to Azerbaijan almost doubled to $4.4 billion, with investments in the oil and gas industry accounting for three quarters of the total (primarily BP exploration in Shahdeniz).
In 2014, developing and transition economies became the largest investors in the region in terms of value of announced greenfield investment projects. China, with projects worth more than $8 billion, is by far the largest greenfield investor in the region. Among the top 10 greenfield projects announced, seven were by Chinese investors (table II.8). In 2014, China became the fifth largest FDI investor in the Russian Federation, up 13 positions since 2007. In the oil and gas industry, for instance, the State-owned China National Petroleum Corp acquired a 20 per cent stake in OAO Yamal SPG, for $1.1 billion. In the automotive industry, Great Wall Motor (China) started to build an automotive plant in
Table II.8. The 10 largest greenfield FDI projects announced in the transition economies, 2014
RankName of investing
companySource country
Destination SectorKey
Business Function
Estimated capital expenditures
(Millions of dollars)
Jobs created
1China Triumph International Engineering
China Russian FederationIndustrial Machinery, Equipment & Tools, All other industrial machinery
Manufacturing 3 000 3 000
2 Hawtai Motor Group China Russian Federation Automotive OEM, Automobiles Manufacturing 1 100 3 000
3 TERNA Italy MontenegroCoal, Oil and Natural Gas, Other electric power generation
Electricity 1 000 292
4 Hareon Solar Technology ChinaBosnia and Herzegovina
Alternative/Renewable energy, Solar electric power
Electricity 636 306
5 Great Wall Motors (GWM) China Russian Federation Automotive OEM, Automobiles Manufacturing 520 2 5006 New Hope Group (NHG) China Russian Federation Food & Tobacco, Animal food Manufacturing 500 1 2676 Dongfeng Motor China Russian Federation Automotive OEM, Automobiles Manufacturing 500 2 931
7 Weibo China The former Yugoslav Republic of Macedonia
Textiles, Textiles & Textile Mills Manufacturing 400 4 500
8 IKEA Sweden SerbiaConsumer Products, Furniture, homeware & related products
Retail 373 2 789
9 EVN Austria Russian Federation Chemicals, Basic chemicals Manufacturing 343 785
10 Valorem France UkraineAlternative/Renewable energy, Wind electric power
Electricity 335 161
Source: UNCTAD, based on information from the Financial Times Ltd, fDi Markets (www.fdimarkets.com).
HIGHLIGHTS

World Investment Report 2015: Reforming International Investment Governance68
the Tula region with an estimated value of $500 million.
Although the presence of Indian investors is still small,
it might strengthen. For example, in 2014, the Russia
Direct Investment Fund and IDFC Ltd., India’s leading
financial services company, agreed to jointly invest in
infrastructure projects worth $1 billion.
Developed-country MNEs continued their divestments in 2014, selling their assets to either domestic or foreign investors. For example, ENI
Spa (Italy) sold 60 per cent of Artic Russia BV – an
oil and gas exploration and production company – to
OOO Yamal Razvitiye (Russia Federation), for $3 billion;
while AO Samruk-Energo, a wholly owned subsidiary
of Kazakhstan’s State-owned AO Fond Natsionalnogo
Blagosostoyaniya Samruk-Kazyna, acquired the
remaining 50 per cent in TOO Ekibastuzskaya GRES-
1, an electric utility company, from Kazakhmys PLC
(United Kingdom), for $1.25 billion.
FDI outflows fell by 31 per cent to $63 billion. Natural-resources-based MNEs, mainly from the
Russian Federation, reduced their investment abroad
in the face of constraints in international financial
markets (see below), low commodity prices and strong
depreciation of the rouble. Almost 60 per cent of
outflows from the Russian Federation went to Cyprus,
Switzerland, the Netherlands and Bermuda.
FDI to and from transition economies is expected to decline further in 2015 owing to the continued economic recession and low oil prices. The GDP
of the Russian Federation is expected to experience
negative growth in 2015 – a 3 per cent contraction,
according to latest estimates (United Nations, 2015).
The impact of sanctions on FDI in transition economies of the CIS
Since March 2014, a number of countries have
implemented a series of sanctions against the Russian
Federation. Coupled with the strong depreciation of
the rouble and other macroeconomic factors, these
sanctions began affecting inward and outward FDI in
the second half of 2014, an effect that is expected to
continue in 2015.
Direct impact on FDI inflows. In the last 10 years,
annual FDI inflows to the Russian Federation grew
almost five-fold, from $15 billion in 2004 to $69 billion
in 2013, before they fell dramatically in 2014. Driven by
high expected rates of return, foreign MNEs increased
their investments in energy and natural-resources-
related projects. Foreign investors have entered the
Russian energy market mainly through two channels:
asset swaps and technology provision deals. Oil and
gas firms of the Russian Federation were allowed to
enter downstream markets in developed countries in
exchange for allowing MNEs from those countries to
take minority participations in those firms’ domestic
exploration and extraction projects. For example,
Wintershall (Germany) acquired a stake in the Yuzhno-
Russkoye gas field in Siberia, and Eni (Italy) gained
access to exploration and production facilities in the
Russian Federation. In return, Gazprom (Russian
Federation) acquired parts of those companies’
European assets in hydrocarbons transportation,
storage and distribution. In some oil and gas projects
that require high technology, such as the development
of the Shtokman field, the involvement of developed-
country MNEs such as StatoilHydro (Norway) and Total
(France) was necessary because of their expertise.
After a period of growth, FDI in natural-resources-
related industries has come to a standstill. Sanctions
have had an impact on both channels. For example,
in November 2014, BASF (Germany) and Gazprom
(Russian Federation) agreed to scrap a $14.7 billion
asset swap that would have given Gazprom full control
of a jointly operated European gas trading and storage
business, including the biggest underground gas
storage facility in Europe. In return, BASF’s Wintershall
affiliate was set to gain stakes in two west Siberian gas
fields.29 The oil industry was also affected by a ban on
the exports of a wide range of goods, services and
technology to Russian oil projects, in particular those
in Arctic, deep-water and shale areas. The enormous
Siberian oilfields developed in Soviet times are ageing,
and without the development of new resources − from
the Arctic to Siberia − Russian oil production could
fall. Some foreign affiliates have already begun to hold
back in some projects in the Arctic. For example,
ExxonMobil (United States) had to freeze all 10 of its
joint ventures with Rosneft in this region, including the
Kara Sea project. Similarly, a Shell (United States) joint
project with Gazprom Neft for the development of the
Bazhenov field had to be suspended, as did the Total
(France) project with Lukoil.
Indirect impact on FDI inflows. The Russian
economy has suffered from the sanctions in three
ways: (i) massive capital outflows, which have made

CHAPTER II Regional Investment Trends 69
the foreign exchange market more volatile and caused
a significant depreciation of the rouble; (ii) restricted
access to international financial markets for some
Russian banks and firms, making external borrowing
very expensive for others; and (iii) the low confidence of
domestic businesses and consumers in future growth
prospects reducing consumption and investment
(World Bank, 2015).
In the last 10 years, foreign investors in the Russian
Federation responded positively to the country’s fast-
growing consumer market and the liberalization of
selected industries. Rising market opportunities and
improvements in the business environment resulted in
a sharp increase in cross-border M&A sales of firms
in the country’s manufacturing industries. Although
the presence of foreign affiliates does not dominate
the Russian economy, those in several key industries,
such as the automotive, beverages and tobacco, and
power generation industries, have become important
in recent years.30
In the automotive industry in recent years, leading
international car manufacturers such as Renault,
Volkswagen, Toyota and General Motors have
established production facilities in the Russian
Federation, prompted also by the country’s industrial
assembly policy, which allows for zero customs duties
on a long list of auto parts. However, as consumer
confidence declined and the falling value of the rouble
raised the prices of imports and components in the
first eight months of 2014, there was a significant drop
in automotive sales in the Russian Federation.
As a result, some foreign automotive companies are
cutting their production in the country (e.g. Volkswagen
will reduce its production in Kaluga), while others will
divest. General Motors announced its withdrawal
from the Russian Federation by December 2015, with
production in St. Petersburg ceasing in the middle of
the year. The contract for manufacturing Chevrolet
vehicles held by Russian car manufacturer GAZ will
also end. Some other companies continue to maintain
confidence in the country despite declines in sales.
Ford Motor (United States), for example, took control
of its Russian joint venture, Ford-Sollers, providing it
with additional financial support.31
Foreign firms are reassessing their position in the
market. In the beverages and tobacco industry,
large soft-drink MNEs PepsiCo (United States) and
Coca-Cola Hellenic (Greece), which control a large
share of the juice market in the Russian Federation,
have announced plans to halt production at key
plants. PepsiCo will close a fruit juice plant in the
Ramenskoye; Coca-Cola Hellenic has already closed
its plant in Nizhny Novgorod.32 Carlsberg (Denmark),
the world’s fourth-largest brewer, will close 2 of its 10
breweries in the country. 33 As examples of slumps
in other market-seeking industries, German retailer
Metro has postponed a listing of its Russian unit on the
London stock exchange, while in December 2014 the
blue-chip health care company Fresenius (Germany)
cancelled a planned pharmaceutical joint venture with
a Russian partner.
Impact on FDI outflows. Russian State-owned
and privately owned firms participated in outward
investment, ensuring their control over the value chains
of their products in natural resources (metals, oil and
gas) and services (telecommunications, banking).
The most important destinations for this outward FDI
are Europe – accounting for over one quarter of the
total (WIR14) – and the United States. The interests
of Russian MNEs may be affected, e.g. through the
reviewing of cross-border M&As.
In addition, as the amounts involved in large
international transactions require the active
participation of banks and other financial institutions,
the sanctions are intensifying difficulties already faced
by Russian companies following the onset of the
financial crisis. Sanctions against State-controlled
banks such as VTB, Sberbank, Gazprombank and
Vnesheeconobank, as well as other big financiers of
Russian MNEs investing abroad, represent one of
the biggest threats to Russian investment abroad.
The sanctions make it harder for those banks to raise
equity and to borrow in developed countries.
In other transition economies of the former Soviet
countries in Central Asia, the current sanctions also
had an impact on FDI as Russian investors − among
the largest investors in the region − began to reduce
their presence (figure II.14). For example, in Kyrgyzstan,
Russian energy giant Inter RAO is having difficulties
financing the Kambarata-1 hydro project, while State
oil company Rosneft could not take over the Manas
International Airport and its affiliates. As the transition
economies of Central Asia are economically closely
linked to the Russian Federation, the sanctions will
affect their economies as well. Tajikistan may face the

World Investment Report 2015: Reforming International Investment Governance70
most severe and direct consequences of a Russian economic slowdown, as 47 per cent of its GDP come from remittances by migrant workers in the Russian Federation. Such a slowdown may affect FDI inflows negatively in an indirect way.
Source: UNCTAD, FDI/MNE database (www.unctad.org/fdistatistics).Note: Data for 2014 are estimated on the basis of the first three quaters of
2014.
Figure II.14.
FDI out�ows from Russian Federation to CIS countries, 2007−2014(Billions of dollars)
2007 2008 2009 2010 2011 2012 2013 2014
1.0
3.4
2.4
3.7
1.4
4.5
2.4 2.2

United States
Japan
Germany
France
Canada
$336.9
$113.6
$112.2
$52.6
$42.9
-16.3%
+272.7%
+4.1%
+71.5%
Out�ows: top 5 home economies (Billions of dollars, and 2014 growth)
Top 5 host economies
Economy$ Value of in�ows2014 % Change
FDI in�ows, top 5 host economies, 2014 2014 Decrease
2014 In�ows
Share in world
-28.4%
498.8 bn
40.6%
(Value and change)
DEVELOPED COUNTRIES
Flows, by range
Above $100 bn
$50 to $99 bn
$10 to $ 49 bn
$1 to $9 bn
Below $1 bn
+2.6%
United States$92.4 bn
-60%
Canada$53.9 bn-23.7%
Netherlands$30.3 bn
-5.6%
United Kingdom $72.2 bn+51.5%
Australia$51.9 bn
-4.4%
Source: UNCTAD.Note: The boundaries and names shown and the designations used on this map do not imply official endorsement or acceptance by the United Nations.
Current account itemsUnited States Japan2006 2013 2006 2013
Balance on goods -837 -702 95 -90
Balance on services 76 231 -32 -36
Balance on primary income 43 200 122 176
Primary income receipts 693 780 172 233
Investment income on FDI 333 467 41 79
Primary income payments 650 580 50 57
Investment income on FDI 159 176 11 17
Balance on current account -807 -400 175 40
United States and Japan: Current account balance, 2006 and 2013 (Billions of dollars)

Region/countrySales Purchases
2013 2014 2013 2014World 237 516 274 549 178 870 228 389
Developed economies 165 726 201 150 165 726 201 150 Europe 35 455 24 853 112 622 169 943 North America 84 976 125 234 40 618 13 485 Other developed countries 45 296 51 063 12 487 17 722
Japan 44 872 37 906 2 576 3 947 Developing economies 62 869 58 789 20 335 25 703
Africa 2 288 1 670 -8 953 -8 317 Asia and Oceania 55 463 48 988 9 609 16 072
China 37 405 24 353 6 201 2 385 India 1 883 -880 3 346 5 327
Latin America and the Caribbean 5 118 8 131 19 678 17 949
Transition economies 1 682 -251 -7 191 1 536
Sector/industrySales Purchases
2013 2014 2013 2014Total 237 516 274 549 178 870 228 389
Primary 39 337 27 842 -14 302 -920 Mining, quarrying and petroleum 37 897 25 975 -14 553 -1 178
Manufacturing 84 807 152 185 80 051 128 229 Food, beverages and tobacco 19 708 30 534 25 278 34 340 Chemicals and chemical products 19 232 23 611 4 822 25 172 Pharmaceuticals, medicinal chemicals and botanical products 742 44 058 20 443 45 165
Computer, electronic, optical products and electrical equipment 10 753 24 247 11 808 14 877
Services 113 373 94 522 113 121 101 081 Trade 7 406 28 483 -2 067 23 551 Information and communication 29 273 -73 170 22 476 -87 172 Financial and insurance activities 9 077 29 728 64 197 100 908 Business services 35 799 65 929 22 220 28 260
Sector/industry
Developed countries as destination
Developed countries as
investors2013 2014 2013 2014
Total 225 555 222 378 479 064 481 443 Primary 1 700 1 920 18 848 35 543
Mining, quarrying and petroleum 1 696 1 920 16 258 35 543 Manufacturing 98 034 100 445 207 972 218 396
Textiles, clothing and leather 13 785 17 402 18 835 22 057 Coke, petroleum products and nuclear fuel 2 115 5 311 6 538 25 767
Chemicals and chemical products 16 346 14 818 33 632 32 207
Motor vehicles and other transport equipment 18 319 21 871 54 474 60 145
Services 125 820 120 013 252 245 227 505 Electricity, gas and water 25 817 16 660 69 638 48 563 Construction 13 120 20 225 20 167 25 233 Transport, storage and communications 19 039 17 706 42 703 44 710
Business services 35 489 35 801 58 921 55 159
Partner region/economy
Developed countries as destination
Developed countries as
investors2013 2014 2013 2014
World 225 555 222 378 479 064 481 443 Developed economies 192 338 181 085 192 338 181 085
Europe 116 954 106 572 110 253 100 049 North America 57 182 54 654 60 107 61 161 Other developed countries 18 201 19 859 21 978 19 875
Japan 11 472 12 732 8 296 5 995 Developing economies 30 952 39 664 265 812 287 822
Africa 2 742 1 112 28 010 63 024 Asia and Oceania 26 671 36 792 155 815 153 631
China 10 919 19 655 53 469 47 051 India 3 557 2 728 14 511 17 919
Latin America and the Caribbean 1 539 1 760 81 987 71 167
Transition economies 2 266 1 630 20 914 12 537
Table C. Cross-border M&As by industry, 2013–2014 (Millions of dollars)
Table D. Cross-border M&As by region/country, 2013–2014 (Millions of dollars)
HIGHLIGHTS
2008 2009 2010 2011 2012 2013 2014 2008 2009 2010 2011 2012 2013 20140
15
30
45
60
75
-4
-2
0
2
4
6
8
10
12
14
16
North Africa East Africa West Africa Southern Africa Central Africa
Share in world total
3.9 4.6 3.3 3.1 4.0 3.7 4.4 0.6 0.6 0.7 0.4 1.0 1.2 1.0
2008 2009 2010 2011 2012 2013 2014
East Asia South-East Asia
2008 2009 2010 2011 2012 2013 20140
100
200
300
400
0
100
200
300
400
2008 2009 2010 2011 2012 2013 2014 2008 2009 2010 2011 2012 2013 20140
10
20
30
40
50
60
0
5
10
15
20
25
Share in world total
3.8 3.6 2.6 2.8 2.3 2.4 3.4 1.3 1.5 1.2 0.8 0.8 0.2 0.8
2008 2009 2010 2011 2012 2013 2014 2008 2009 2010 2011 2012 2013 20140
20
40
60
80
100
0
10
20
30
40
50
TurkeyOther West Asia Gulf Cooperation Council (GCC)
Share in world total
6.3 6.0 4.5 3.4 3.4 3.0 3.5 2.2 1.6 1.3 2.0 1.8 3.1 2.8
Share in world total
15.9 17.7 23.1 20.9 22.9 23.7 31.0 9.8 16.4 18.3 16.9 20.7 22.4 28.3
2008 2009 2010 2011 2012 2013 2014
Caribbean, excluding �nancial centers Central America South America
Georgia Commonwealth of Independent States
2008 2009 2010 2011 2012 2013 2014
2008 2009 2010 2011 2012 2013 2014 2008 2009 2010 2011 2012 2013 2014
South-East Europe
2008 2009 2010 2011 2012 2013 2014 2008 2009 2010 2011 2012 2013 2014
Africa Latin America and the Caribbean Asia Oceania
2008 2009 2010 2011 2012 2013 2014 2008 2009 2010 2011 2012 2013 2014
2008 2009 2010 2011 2012 2013 2014 2008 2009 2010 2011 2012 2013 2014
0
50
100
150
200
250
0
50
100
0
25
50
75
100
125
0
20
40
60
80
100
0
5
10
15
20
25
30
0
1
2
3
4
5
6
7
8
0
5
10
15
20
25
30
35
40
0
2
4
6
8
10
0
1
2
3
4
5
6
7
8
9
10
0
0.5
1
1.5
2
2.5
Share in world total
9.2 7 9.9 10.5 12.7 12.7 13 2.3 1.2 3.4 2.3 3.4 2.2 1.7
Share in world total
7.8 5.9 5.6 6.2 6.1 6.8 3.9 3.5 4.3 4.5 4.6 4.2 7.0 4.7
Share in world total
1.2 1.4 1.8 1.4 1.7 1.5 1.9 0.2 0.1 0.2 0.3 0.4 0.6 0.2
Share in world total
1.7 2.2 2.0 2.3 2.5 2.0 2.4 0.1 0.4 0.7 0.4 0.2 0.3 0.4
Share in world total
0.6 0.4 0.3 0.4 0.5 0.4 0.6 0.1 0.0 0.0 0.1 0.2 0.1 0.1
North America Other developed Europe European Union
2008 2009 2010 2011 2012 2013 2014 2008 2009 2010 2011 2012 2013 2014
Other developed countries
0
400
800
1 200
1 600
0
400
800
1 200
1 600
Share in world total
52.9 55.0 50.7 52.9 48.4 47.5 40.6 80.3 74.4 70.5 72.8 68.0 63.8 60.8
Transition economies Asia and Oceania Latin America and the Caribbean Africa
Oceania Asia Latin America and the Caribbean Africa
Figure A. FDI in�ows, 2008−2014 (Billions of dollars)
Figure B. FDI out�ows, 2008−2014(Billions of dollars)
• Inflows fell for third year, outflows held steady• Key factors: an exceptional divestment, rapid changes in intracompany loans• MNE operations: growing impact on balance of payments
Table A. Announced greenfield FDI projects by industry, 2013–2014 (Millions of dollars)
Table B. Announced greenfield FDI projects by region/country, 2013–2014 (Millions of dollars)

CHAPTER II Regional Investment Trends 73
FDI inflows to developed countries contracted for the
third successive year, falling by 28 per cent to $499
billion, the lowest level since 2004. Inflows declined
in 24 of the 39 developed economies. Outflows from
developed economies held steady at $823 billion.
Across individual economies, FDI flows fluctuated
widely from year to year as MNEs actively engaged in
M&As, acquiring as well as disposing of assets. Against
the backdrop of a global savings glut – including
saving by MNEs – intracompany loans continued to
have major impacts, adding to volatility.
Europe was host to inflows worth $289 billion (down
11 per cent from 2013) accounting for 24 per cent
of the world total in 2014. Inflows fell in 18 European
economies, including major recipients in 2013 such
as Belgium, France and Ireland. In contrast, some of
the European countries that made the largest gains in
2014 were those that had received negative inflows
in 2013, such as Finland and Switzerland. FDI to the
United Kingdom jumped to $72 billion, leaving it in its
position as the largest recipient country in Europe.
Inflows to North America halved to $146 billion, mostly
due to an exceptional M&A divestment. The share
of North America in global FDI flows was reduced to
12 per cent (compared with 21 per cent in 2013).
Inflows to the United States decreased to $92.4
billion, mainly due to one large divestment (Vodafone-
Verizon). However, the United States remained the
largest host developed country. In Asia-Pacific, FDI
flows to Australia and Japan contracted, while those
to New Zealand rebounded.
Outflows from European countries were virtually
unchanged at $316 billion, or 23 per cent of the global
total. Reflecting the highly volatile trends at the level
of individual economies, Germany almost trebled its
outflows, becoming the largest direct investor country
in Europe in 2014. France also increased its outflows
sharply, to $43 billion. In contrast, FDI from other major
investor countries in Europe plummeted; FDI from the
Netherlands (the largest European investor country in
2013) lost 28 per cent, and flows from Luxembourg
(the second largest in 2013) fell to a negative value.
United Kingdom outflows fell to −$60 billion (largely
owing to the mirror effect of the Vodafone-Verizon
divestment). In North America, both Canada and the
United States increased their outflows modestly. FDI
from Japan declined by 16 per cent, ending a three-
year run of expansion.
Upturn in M&A activities, including divestments. Cross‐border M&As reflected a general upturn in global M&As, rising to a gross value of $1.2 trillion, of which $911 billion was targeted at assets in developed countries. Health care industries (e.g. pharmaceutical, chemical) and the telecommunications industry were particularly active, with the former contributing to the large increase in M&A purchases by German firms. The latter raised M&A sales in France.
However, increased cross-border M&A activity was partially offset by significant divestments. The Vodafone-Verizon deal pushed divestments in the United States by foreign MNEs to $176 billion in 2014, more than double the average during 2011–2013 of $68 billion.
Effects of volatile intracompany loans. Some of the largest swings in FDI flows in 2014 were caused by rapid changes in the volume or even direction of intracompany loans. A reversal in intracompany loans from $8 billion to −$28 billion accounts for the large decline of inflows to Germany (table II.9). A similar reversal in intracompany loans to Ireland reduced total inflows to just $7.7 billion (compared with $37 billion in 2013). By contrast, a large increase in intracompany loans boosted inflows to the United Kingdom.
Changes in intracompany loans also played a major role in the huge increase in outflows from Germany. Over the period 2011–2013, intracompany loans from affiliates of German MNEs abroad back to their parent companies averaged $31 billion, in effect suppressing German outward FDI. Loans back to parent companies diminished to $3.8 billion in 2014. Although loans from German parent companies to their affiliates also decreased (from $22 billion in
Table II.9.
Intracompany loans, selected European countries, 2013 and 2014 (Billions of dollars)
2013 2014Inward
Germany 8.2 -28.1 Ireland 4.3 -24.9 United Kingdom -3.9 32.6
OutwardGermany -15.3 19.0 Luxembourg 47.0 0.2 United Kingdom 1.9 44.4
Source: UNCTAD, FDI/MNE database (www.unctad.org/fdistatistics).
HIGHLIGHTS

World Investment Report 2015: Reforming International Investment Governance74
2013 to $15 billion), the combined effect led to a rise
intracompany loans to $19 billion (table II.9). Changes
of similar magnitudes were observed in Luxembourg
and the United Kingdom.
Resilience of natural-resource-related FDI. Although weaker commodity markets have had some
influence on FDI to resource-rich countries, natural
resources MNEs have generally maintained their
investment plans. For instance, inflows to Australia
declined for the third successive year to $52 billion.
However, foreign MNEs remain extensively involved in
oil and gas projects, including 12 of the 13 oil and gas
projects at the “committed stage”, with a combined
value of $177 billion (A$197 billion).34 In Canada,
flows into the energy and mining sector in 2014 were
worth $13 billion, down from $21 billion in 2013 but
still substantial, considering that the average for
2010–2012 was $11 billion. Canadian outward FDI in
this sector bounced back from −$2.5 billion in 2013
to $6.5 billion. Acquisitions of assets by Canadian
MNEs contributed to the rise; an example is Encana’s
bid for the United States oil and gas production and
exploration company Athlon Energy for $6.8 billion.
Mixed picture in flows from developed to developing economies.35 FDI from the United States
to developing regions increased by 8 per cent to $110
billion. If those economies are excluded, United States
FDI to developing regions was $52 billion, up 5 per cent
from the year before. United States FDI to Africa almost
doubled, to $5.4 billion, the highest level since 2010.
FDI to developing economies in Asia and the Pacific
(excluding Singapore) increased by 32 per cent to $25
billion. In contrast, Japanese FDI to developing regions
(excluding offshore financial centres) declined by
15 per cent to $39 billion.36 FDI from Japan to
developing Asia also lost ground, declining by 24 per
cent to $28 billion. In contrast, Japanese FDI to Africa
rose to $4.5 billion, a record high.
FDI data from the United States and Japan appear
to contradict trends in M&As, which show that
developed-country MNEs continued to divest assets
in Africa (from −$3.8 billion in 2013 to −$8.3 billion in
2014). However, M&A data for Africa are often skewed
by a few large deals. The large value of divestment
in 2014 was accounted for mostly by just three M&A
transactions: Vivendi’s sale of its majority stake in
the telecommunications services provider Itissalat
(Morocco) for $5.7 billion; the sale of Nigerian assets
by ConocoPhillips for $1.79 billion; and the sale of a stake in Tanzanian gas fields by Ophir Energy (United Kingdom) for $1.3 billion. These divestments do not signal diminishing interest in Africa among MNEs. Announcement-based data suggest that greenfield projects by developed-country MNEs in Africa are on the rise, with the total value of such projects announced in 2014 rising to $63 billion, the highest level since 2008.
The growing impact of MNE operations on the balance of payments of the United States and Japan
Global FDI and international production by MNEs has generally grown faster than GDP or international trade. Consequently, the impact of MNE operations on the balance of payments has increased, not only through FDI flows (on the financial account), but also through trade and investment income (on the current account). Data for the United States and Japan show that outward FDI creates avenues for exports of knowledge-intensive services. Growing investment income from outward FDI also has the effect of counterbalancing trade deficits (table II.10).
United States
In the early 2000s, the current account deficit of the United States began to grow, driven by trade in goods. By 2006, it had reached 5.8 per cent of GDP, raising concerns over its sustainability. Since then, the growing surplus in services trade and primary income37 has helped narrow the current account deficit; in 2014, it was down to 2.4 per cent of GDP.
Table II.10.
United States and Japan: Current account balance, 2006 and 2013 (Billions of dollars)
Current account itemsUnited States Japan2006 2013 2006 2013
Balance on goods -837 -702 95 -90Balance on services 76 231 -32 -36Balance on primary income 43 200 122 176
Primary income receipts 693 780 172 233Investment income on FDI 333 467 41 79
Primary income payments 650 580 50 57Investment income on FDI 159 176 11 17
Balance on current account -807 -400 175 40
Source: UNCTAD, based on data from the United States Department of Commerce, Bureau of Economic Analysis, and Japan’s Ministry of Finance.
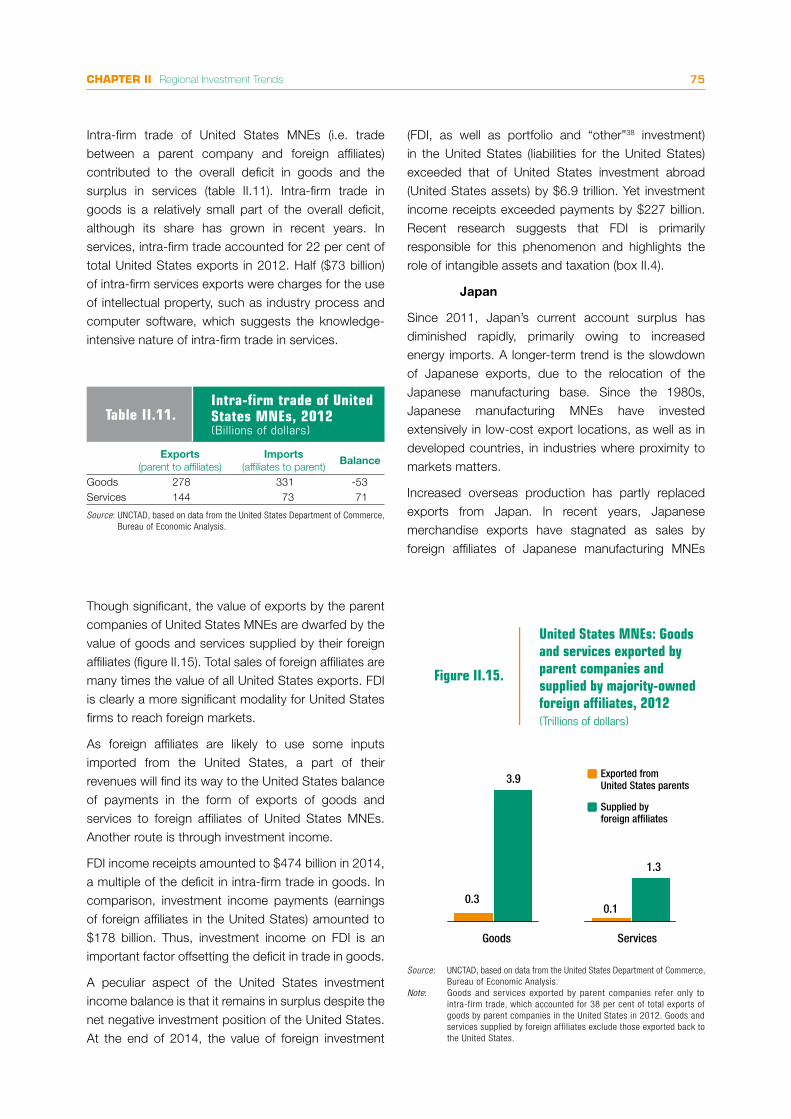
CHAPTER II Regional Investment Trends 75
Intra-firm trade of United States MNEs (i.e. trade between a parent company and foreign affiliates) contributed to the overall deficit in goods and the surplus in services (table II.11). Intra-firm trade in goods is a relatively small part of the overall deficit, although its share has grown in recent years. In services, intra-firm trade accounted for 22 per cent of total United States exports in 2012. Half ($73 billion) of intra-firm services exports were charges for the use of intellectual property, such as industry process and computer software, which suggests the knowledge-intensive nature of intra-firm trade in services.
(FDI, as well as portfolio and “other”38 investment) in the United States (liabilities for the United States) exceeded that of United States investment abroad (United States assets) by $6.9 trillion. Yet investment income receipts exceeded payments by $227 billion. Recent research suggests that FDI is primarily responsible for this phenomenon and highlights the role of intangible assets and taxation (box II.4).
Japan
Since 2011, Japan’s current account surplus has diminished rapidly, primarily owing to increased energy imports. A longer-term trend is the slowdown of Japanese exports, due to the relocation of the Japanese manufacturing base. Since the 1980s, Japanese manufacturing MNEs have invested extensively in low-cost export locations, as well as in developed countries, in industries where proximity to markets matters.
Increased overseas production has partly replaced exports from Japan. In recent years, Japanese merchandise exports have stagnated as sales by foreign affiliates of Japanese manufacturing MNEs
Table II.11.Intra-firm trade of United States MNEs, 2012 (Billions of dollars)
Exports
(parent to affiliates)Imports
(affiliates to parent)Balance
Goods 278 331 -53Services 144 73 71
Source: UNCTAD, based on data from the United States Department of Commerce, Bureau of Economic Analysis.
Figure II.15.
United States MNEs: Goods and services exported by parent companies and supplied by majority-owned foreign af�liates, 2012(Trillions of dollars)
Goods Services
Exported from United States parents
Supplied by foreign af�liates
0.30.1
3.9
1.3
Source: UNCTAD, based on data from the United States Department of Commerce, Bureau of Economic Analysis.
Note: Goods and services exported by parent companies refer only to intra-firm trade, which accounted for 38 per cent of total exports of goods by parent companies in the United States in 2012. Goods and services supplied by foreign affiliates exclude those exported back to the United States.
Though significant, the value of exports by the parent companies of United States MNEs are dwarfed by the value of goods and services supplied by their foreign affiliates (figure II.15). Total sales of foreign affiliates are many times the value of all United States exports. FDI is clearly a more significant modality for United States firms to reach foreign markets.
As foreign affiliates are likely to use some inputs imported from the United States, a part of their revenues will find its way to the United States balance of payments in the form of exports of goods and services to foreign affiliates of United States MNEs. Another route is through investment income.
FDI income receipts amounted to $474 billion in 2014, a multiple of the deficit in intra-firm trade in goods. In comparison, investment income payments (earnings of foreign affiliates in the United States) amounted to $178 billion. Thus, investment income on FDI is an important factor offsetting the deficit in trade in goods.
A peculiar aspect of the United States investment income balance is that it remains in surplus despite the net negative investment position of the United States. At the end of 2014, the value of foreign investment

World Investment Report 2015: Reforming International Investment Governance76
Box II.4. Why is United States outward FDI so profitable?
Despite maintaining a negative net international investment position since 1989, investment income that the United States receives from abroad has been consistently higher than the income foreign investors receive from their investment in the United States. The rates of return on United States assets abroad are higher (3.8 per cent on average over 1999–2014) than those earned by foreign investors in the United States (2.7 per cent).
Recent studies find that this difference in returns is due to income on FDI. The returns on other types of assets were similar for United States assets abroad and foreign-owned assets in the United States; if anything, returns on foreign-owned assets were slightly higher. In contrast, returns for FDI were, on average, 7.0 per cent for United States outward FDI and 3.1 per cent for inward FDI.
Common explanations for this phenomenon include the higher risks associated with investing outside the United States, and the age of investments. Recent studies suggest that intangible assets and the treatment of taxes on the balance of payments can explain large parts of the return differentials (Curcuru et al., 2013; Bridgman, 2014).
Investment in intangible assets (e.g. R&D activities) can be a source of the returns gap by, first, depressing the profitability of inward FDI in the United States and, second, understating the value of United States outward FDI.
The United States is a prime location for R&D because of its infrastructure, its networks of scientists and its accounting rules, which allow investments in R&D to be deducted as expenses. This causes R&D activities to reduce the apparent profitability of foreign affiliates in the United States. In fact, R&D expenditures of foreign affiliates in the United States are high relative to sales
(box table II.4.1).
Furthermore, for parent companies of United States MNEs, the share of R&D expenditures in total fixed investment for 2009–2012 was 30 per cent.39 The operations of United States MNEs abroad are likely to benefit from intangible assets created at home. Thus, the outward FDI stock of the United States could underestimate the true extent of its assets, resulting in artificially higher rates of returns for United States businesses abroad.
Another factor explaining the rate differentials is the tax system. The United States applies a worldwide taxation system in which the parent company in the United States is also liable for taxes on the income of its affiliates abroad. Taxes paid abroad by affiliates are deducted from the total tax liabilities. Since the United States corporate income tax rate is higher than in many other countries, the parent company in the United States needs to pay the difference when the profits abroad are repatriated. This repatriation tax does not appear on the balance of payments. Investment income on United States direct investment abroad reported in the balance of payments is net of foreign taxes, but the United States taxes that the parent company would have to pay are not deducted. In contrast, the United States taxes are already deducted from the earnings of foreign affiliates in the United States. Effectively, investment income on United States direct investment abroad is pre-tax (or partially taxed) income, whereas investment income on FDI in the United States is after-tax income, giving rise to the seemingly higher earnings of outward FDI of the United States.
Curcuru et al. (2013) argue that the effects of such tax issues add up to 1.8 per cent to annual returns on United States outward FDI. Bridgeman (2014) concludes that taking into account intangible assets and repatriation taxes reduces the difference in returns on FDI from 4.2 per cent to 1.7 per cent for the period 1994–2010.
Source: UNCTAD, based on various sources.
Box table II.4.1. United States MNEs: R&D expenditures, sales and net income of foreign affiliates, average over 2009–2012 (Billions of dollars)
Foreign affiliates in the
United StatesAffiliates of
United States MNEs abroadR&D expenditures 49 42Sales 3 665 6 396Net income 113 1 098
Source: UNCTAD, based on data from the United States Department of Commerce, Bureau of Economic Analysis.

CHAPTER II Regional Investment Trends 77
grew substantially (figure II.16). In 2014, Japanese auto manufacturers’ overseas production increased by 4.3 per cent over 2013 while their exports from Japan declined by 4.5 per cent.40 Furthermore, Japanese manufacturers’ overseas production bases are also serving the Japanese market, as seen from the gradual increase in their exports to Japan (figure II.17). Thus, the internationalization of Japanese MNEs’ production system has, to an extent, negatively affected Japan’s trade balance.
However, the internationalization of Japanese MNEs is also positively contributing to the current account. First, foreign production does not always substitute domestic production but may also complement it. The proliferation of global value chains means that increased foreign production often requires more inputs from the home country. According to Japanese survey data, almost 60 per cent of exports by Japanese parent companies are destined for their foreign affiliates (figure II.17). Foreign affiliates of Japanese MNEs are importing more from Japan than they export to the country, although the share of locally procured inputs has been rising gradually in recent years. Second, despite the trade deficit, the current account remained in surplus due to growing investment income. In gross terms, investment income receipts in 2013 amounted to $233 billion, 34 per cent of which were returns on FDI. The share of FDI is relatively small but has been rising in recent years. Finally, royalty payments on intellectual property are adding to the positive current account balance. The balance of “charges for the use of intellectual property” up to 2003 was negative, but since then it has been in surplus, rising to $14 billion in 2013. Of gross receipts worth $32 billion, over 40 per cent come from royalties from foreign affiliates.
From the viewpoint of the current account balance, outward FDI can make positive contributions in the long run, as seen from the experience of the United States and Japan. Thus, short-term impacts, such as loss of export capacity, must be seen in the overall context of a longer time horizon.
Figure II.16.
Merchandise exports of Japan and sales of foreign af�liates in manufacturing, 2001–2013(Billions of dollars)
Sales of af�liates abroad
Merchandise exports
0
200
400
600
800
1 000
1 200
1 400
2001 2003 2005 2007 2009 2011 2013
Source: UNCTAD, based on data from the Bank of Japan and Ministry of Economy, Trade and Industry.
Source: UNCTAD, based on data from the Ministry of Economy, Trade and Industry.
Figure II.17.Japanese MNEs: Trade with Japan by foreign af�liates, 2001–2013 (Billions of dollars)
0
100
200
300
400
500
600
700
2001 2003 2005 2007 2009 2011 2013
Exports Imports
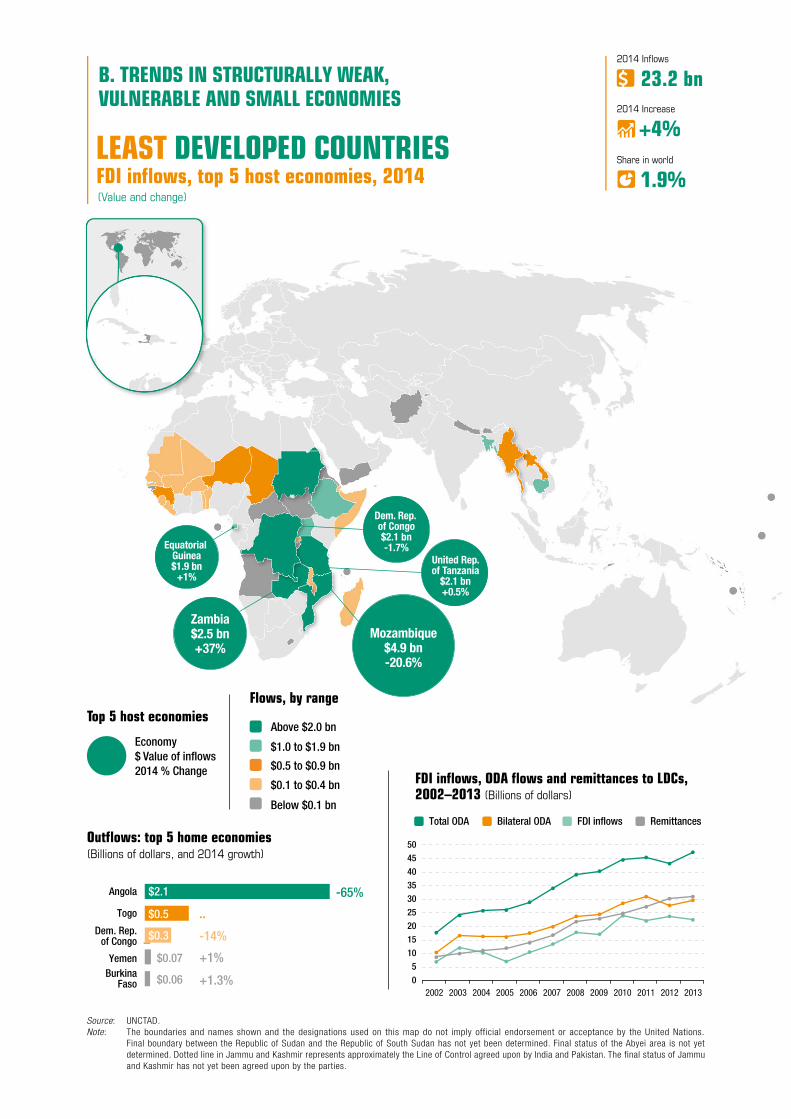
Angola
Togo
Dem. Rep.of Congo
BurkinaFaso
Yemen
-65%$2.1
$0.5
$0.3
$0.07
$0.06
..
-14%
+1%
+1.3%
Flows, by range
Above $2.0 bn
$1.0 to $1.9 bn
$0.5 to $0.9 bn
$0.1 to $0.4 bn
Below $0.1 bn
Out�ows: top 5 home economies (Billions of dollars, and 2014 growth)
Top 5 host economies
Economy$ Value of in�ows2014 % Change FDI in�ows, ODA �ows and remittances to LDCs,
2002–2013 (Billions of dollars)
Total ODA Bilateral ODA FDI in�ows Remittances
FDI in�ows, top 5 host economies, 2014(Value and change)
B. TRENDS IN STRUCTURALLY WEAK,VULNERABLE AND SMALL ECONOMIES
+4%2014 Increase
23.2 bn2014 In�ows
1.9%Share in worldLEAST DEVELOPED COUNTRIES
2002 2003 2004 2005 2006 2007 2008 2009 2010 2011 2012 20130
5 10 15 20 25 30 35 40 45 50
United Rep.of Tanzania
$2.1 bn+0.5%
Zambia$2.5 bn+37%
Dem. Rep. of Congo$2.1 bn-1.7%Equatorial
Guinea$1.9 bn
+1%
Mozambique$4.9 bn-20.6%
Source: UNCTAD. Note: The boundaries and names shown and the designations used on this map do not imply official endorsement or acceptance by the United Nations.
Final boundary between the Republic of Sudan and the Republic of South Sudan has not yet been determined. Final status of the Abyei area is not yet determined. Dotted line in Jammu and Kashmir represents approximately the Line of Control agreed upon by India and Pakistan. The final status of Jammu and Kashmir has not yet been agreed upon by the parties.

Angola
Togo
Dem. Rep.of Congo
BurkinaFaso
Yemen
-65%$2.1
$0.5
$0.3
$0.07
$0.06
..
-14%
+1%
+1.3%
Flows, by range
Above $2.0 bn
$1.0 to $1.9 bn
$0.5 to $0.9 bn
$0.1 to $0.4 bn
Below $0.1 bn
Out�ows: top 5 home economies (Billions of dollars, and 2014 growth)
Top 5 host economies
Economy$ Value of in�ows2014 % Change FDI in�ows, ODA �ows and remittances to LDCs,
2002–2013 (Billions of dollars)
Total ODA Bilateral ODA FDI in�ows Remittances
FDI in�ows, top 5 host economies, 2014(Value and change)
B. TRENDS IN STRUCTURALLY WEAK,VULNERABLE AND SMALL ECONOMIES
+4%2014 Increase
23.2 bn2014 In�ows
1.9%Share in worldLEAST DEVELOPED COUNTRIES
2002 2003 2004 2005 2006 2007 2008 2009 2010 2011 2012 20130
5 10 15 20 25 30 35 40 45 50
United Rep.of Tanzania
$2.1 bn+0.5%
Zambia$2.5 bn+37%
Dem. Rep. of Congo$2.1 bn-1.7%Equatorial
Guinea$1.9 bn
+1%
Mozambique$4.9 bn-20.6%
Region/countrySales Purchases
2013 2014 2013 2014World 26 3 734 2 23
Developed economies -4 020 -1 201 2 25 European Union -4 409 -1 361 2 25 North America -338 10 - - Other developed countries -33 114 - -
Developing economies 4 046 4 869 - -2 Africa 5 -18 - 2 Latin America and the Caribbean -430 400 - -
South, East and South-East Asia 4 427 3 975 - -4
India 15 2 702 - - Singapore 9 1 333 - -
West Asia 44 512 - - Transition economies - - - -
Sector/industrySales Purchases
2013 2014 2013 2014Total 26 3 734 2 23
Primary 16 2 661 2 2 Mining, quarrying and petroleum 16 2 661 2 2
Manufacturing 37 120 - - Food, beverages and tobacco 20 12 - - Textiles, clothing and leather 2 2 - - Pharmaceuticals, medicinal chemicals and botanical products 1 15 51 - -
Non-metallic mineral products - 56 - - Services -27 952 - 20
Electricity, gas, water and waste management - -86 - -
Transportation and storage - 400 - - Information and communication 3 112 - - Financial and insurance activities -42 516 - 25
Partner region/economyLDCs
as destinationLDCs
as investors2013 2014 2013 2014
World 40 279 47 680 1 624 1 604 Developed economies 25 448 32 429 123 76
European Union 7 000 24 435 82 66 Switzerland 411 1 701 - - United States 1 205 4 507 - 10 Japan 11 484 1 269 - -
Developing economies 14 831 15 251 1 464 1 508 Africa 6 073 6 477 1 049 1 045
South Africa 2 791 3 564 - 11 Latin America and the Caribbean 170 69 9 281
South, East and South-East Asia 8 020 8 162 354 168
West Asia 568 544 52 14 Transition economies - - 37 21
Table C. Cross-border M&As by industry, 2013–2014 (Millions of dollars)
Table D. Cross-border M&As by region/country, 2013–2014 (Millions of dollars)
Sector/industryLDCs
as destinationLDCs
as investors2013 2014 2013 2014
Total 40 279 47 680 1 624 1 604 Primary 3 884 17 165 7 -
Mining, quarrying and petroleum 1 519 17 165 7 - Manufacturing 8 407 9 578 395 294
Textiles, clothing and leather 519 2 019 - 38 Coke, petroleum products and nuclear fuel 1 764 1 246 - -
Non-metallic mineral products 3 234 1 952 262 - Services 27 988 20 937 1 222 1 311
Construction 590 6 802 - - Trade 833 2 138 - 4 Transport, storage and communications 5 092 3 500 92 15
Finance 2 086 2 198 691 639 Business services 1 213 4 814 37 624
HIGHLIGHTS
2008 2009 2010 2011 2012 2013 2014 2008 2009 2010 2011 2012 2013 20140
15
30
45
60
75
-4
-2
0
2
4
6
8
10
12
14
16
North Africa East Africa West Africa Southern Africa Central Africa
Share in world total
3.9 4.6 3.3 3.1 4.0 3.7 4.4 0.6 0.6 0.7 0.4 1.0 1.2 1.0
2008 2009 2010 2011 2012 2013 2014
East Asia South-East Asia
2008 2009 2010 2011 2012 2013 20140
100
200
300
400
0
100
200
300
400
2008 2009 2010 2011 2012 2013 2014 2008 2009 2010 2011 2012 2013 20140
10
20
30
40
50
60
0
5
10
15
20
25
Share in world total
3.8 3.6 2.6 2.8 2.3 2.4 3.4 1.3 1.5 1.2 0.8 0.8 0.2 0.8
2008 2009 2010 2011 2012 2013 2014 2008 2009 2010 2011 2012 2013 20140
20
40
60
80
100
0
10
20
30
40
50
TurkeyOther West Asia Gulf Cooperation Council (GCC)
Share in world total
6.3 6.0 4.5 3.4 3.4 3.0 3.5 2.2 1.6 1.3 2.0 1.8 3.1 2.8
Share in world total
15.9 17.7 23.1 20.9 22.9 23.7 31.0 9.8 16.4 18.3 16.9 20.7 22.4 28.3
2008 2009 2010 2011 2012 2013 2014
Caribbean, excluding �nancial centers Central America South America
Georgia Commonwealth of Independent States
2008 2009 2010 2011 2012 2013 2014
2008 2009 2010 2011 2012 2013 2014 2008 2009 2010 2011 2012 2013 2014
South-East Europe
2008 2009 2010 2011 2012 2013 2014 2008 2009 2010 2011 2012 2013 2014
Africa Latin America and the Caribbean Asia Oceania
2008 2009 2010 2011 2012 2013 2014 2008 2009 2010 2011 2012 2013 2014
2008 2009 2010 2011 2012 2013 2014 2008 2009 2010 2011 2012 2013 2014
0
50
100
150
200
250
0
50
100
0
25
50
75
100
125
0
20
40
60
80
100
0
5
10
15
20
25
30
0
1
2
3
4
5
6
7
8
0
5
10
15
20
25
30
35
40
0
2
4
6
8
10
0
1
2
3
4
5
6
7
8
9
10
0
0.5
1
1.5
2
2.5
Share in world total
9.2 7 9.9 10.5 12.7 12.7 13 2.3 1.2 3.4 2.3 3.4 2.2 1.7
Share in world total
7.8 5.9 5.6 6.2 6.1 6.8 3.9 3.5 4.3 4.5 4.6 4.2 7.0 4.7
Share in world total
1.2 1.4 1.8 1.4 1.7 1.5 1.9 0.2 0.1 0.2 0.3 0.4 0.6 0.2
Share in world total
1.7 2.2 2.0 2.3 2.5 2.0 2.4 0.1 0.4 0.7 0.4 0.2 0.3 0.4
Share in world total
0.6 0.4 0.3 0.4 0.5 0.4 0.6 0.1 0.0 0.0 0.1 0.2 0.1 0.1
North America Other developed Europe European Union
2008 2009 2010 2011 2012 2013 2014 2008 2009 2010 2011 2012 2013 2014
Other developed countries
0
400
800
1 200
1 600
0
400
800
1 200
1 600
Share in world total
52.9 55.0 50.7 52.9 48.4 47.5 40.6 80.3 74.4 70.5 72.8 68.0 63.8 60.8
Transition economies Asia and Oceania Latin America and the Caribbean Africa
Oceania Asia Latin America and the Caribbean Africa
Figure A. FDI in�ows, 2008−2014 (Billions of dollars)
Figure B. FDI out�ows, 2008−2014(Billions of dollars)
• FDI stock tripled during 2004–2014 • FDI flows are just 2 per cent of global inflows, smaller than ODA and remittances• FDI in manufacturing, services gravitates to larger, mineral-rich LDCs
Table A. Announced greenfield FDI projects by industry, 2013–2014 (Millions of dollars)
Table B. Announced greenfield FDI projects by region/country, 2013–2014 (Millions of dollars)
World Investment Report 2015: Reforming International Investment Governance80
FDI flows to LDCs rose by 4 per cent to $23 billion in
2014, representing 2 per cent of global inflows. Both
cross-border M&A sales and greenfield FDI projects
were driven by large-scale projects in extractive
industries. FDI flows in LDCs remain smaller than official
development assistance (ODA) and remittances,
but FDI stock has increased three-fold over the past
10 years. FDI can play a catalytic role in economic
development, enhancing productive capacity and
creating jobs and expertise. An integrated policy
approach to investment promotion, coupled with
international community support for greater inward
investment, would help quadruple FDI stock in LDCs
by 2030, including into the SDG sectors.
FDI inflows to LDCs rebounded in 2014. The top
five recipients were Mozambique ($4.9 billion, down
21 per cent), Zambia ($2.5 billion, up 37 per cent),
the United Republic of Tanzania ($2.1 billion, up by 1
per cent), the Democratic Republic of the Congo ($2.1
billion, down by 2 per cent) and Equatorial Guinea
($1.9 billion, a gain of 1 per cent). These five countries
accounted for 58 per cent of total FDI inflows to LDCs.
The share of LDCs in global inflows remained virtually
unchanged from 2013 at 1.9 per cent. Among
developing economies, the change in LDCs’ share
stayed close to its 2013 level at 3.4 per cent.
African LDCs registered a 6 per cent rise in FDI inflows
from 2013 to 2014, owing to a substantial reduction in
divestment in Angola. FDI inflows to a dozen recipients
contracted, and robust gains were recorded in only
two LDCs: Ethiopia (an increase of 26 per cent to
$1.2 billion) and Zambia (up 37 per cent to $2.5 billion).
The outbreak of Ebola may have had some impact
on investment in West Africa (see the Africa section),
where FDI inflows to LDCs shrank by 15 per cent.
However, in two Ebola-affected countries, Guinea and
Sierra Leone, FDI inflows more than tripled.
Asian LDCs saw a 2 per cent drop in FDI inflows, a
negative growth for the first time in four years. This
was mainly owing to declines in seven Asian LDCs,
including Bangladesh ($1.5 billion, a decrease of 5 per
cent), Cambodia ($1.7 billion, an 8 per cent fall), and
Yemen ($1 billion of divestment), despite strong FDI
growth in the Lao People’s Democratic Republic (69
per cent) and Myanmar (62 per cent). FDI inflows to
Haiti faced a 50 per cent reduction. In Oceania,41 FDI
inflows were down for the fourth consecutive year to
below $3 million, a decline of 92 per cent. Continued divestment in Vanuatu further dampened already weakened FDI flows to this region.
Record (net) sales in cross-border M&As. The net value of cross-border M&A sales in LDCs jumped to $3.7 billion in 2014, on the back of acquisitions by Asian investors in African LDCs. The value of assets in LDCs sold by developed-country MNEs to other foreign investors continued to rise, exceeding the value of their purchases in LDCs. Cross-border M&A sales in LDCs to investors from developing economies were driven by two oil and gas deals in Africa involving Asian State-owned MNEs. The largest, a $2.6 billion deal in which India’s State-owned Oil and Natural Gas Corporation Limited acquired a 10 per cent stake in an oil and gas exploration block in Mozambique, represented more than 70 per cent of net sales in all LDCs.
In financial services, Qatar National Bank, aspiring to become the largest bank in Africa and West Asia by 2017,42 acquired a 23.5 per cent stake in Ecobank Transnational (Togo), a deal that helped the industry register a record-high net sales value of $0.5 billion in LDCs. Acquisitions initiated by developing-economy investors more than doubled the number of deals in financial and insurance activities (from 6 in 2013 to 13 in 2014).43 A net sales value of $0.4 billion in the transportation and storage industry was attributable to a single deal in Liberia, in which a Bahamas-based company acquired a 30 per cent stake in a provider of deep-sea freight transportation services.
Announced greenfield investment hit a six-year high. A $16 billion oil and gas project in Angola (table II.12)44 alone contributed more than a third of total greenfield investment announced for all LDCs in 2014 ($48 billion, more than twice as much as total reported FDI inflows). The second largest project, announced by a Belgian investor (table II.12) pushed the value of LDCs’ greenfield investment in construction to new heights. The third largest real estate project by a South African MNE (table II.12) helped South Africa rank as the largest source of greenfield investment in LDCs in 2014. Although the share of announced services sector investment tumbled from 69 per cent of the total in 201345 to 44 per cent in 2014, the value of services sector greenfield investment was the second highest on record.
In manufacturing, two industries saw a jump in announced greenfield investments. In textiles,

CHAPTER II Regional Investment Trends 81
clothing and leather, 20 announced projects, with a combined value of over $2 billion, propelled activity in this industry to a new high in 2014. Over $1.8 billion of the investment (in 11 projects) went to Ethiopia, one of the beneficiary countries under the African Growth and Opportunity Act (AGOA), which confers preferential treatment on apparel exports to the United States. MNEs from Asia, in particular, are increasing their presence in Ethiopia. In 2014, two major projects targeted the country: an Indian company announced a $550 million investment to construct Africa’s largest plant to produce cotton yarn for export,46 and a Chinese MNE announced another project to build a $500 million textile plant by creating more than 20,000 jobs.47 In non-metallic and mineral products, almost $2 billion worth of greenfield FDI was recorded in 13 projects for the manufacture of cement and concrete products and targeted at a dozen LDCs. The largest of these projects ($370 million with 1,500 new jobs to be created) will be built in the Lao People’s Democratic Republic by Thai investors.
The value of FDI in LDCs remains concentrated in a small number of mineral-rich economies. Despite weaker prices of key primary commodity exports, extractive industries in LDCs continue attracting foreign investors. Judging from announced FDI greenfield projects in 2014, the skewed distribution of FDI inflows among LDCs will continue for some time. Investment in extractive industries is reinforced by FDI in the manufacturing and services sectors (including infrastructure), which also tends to be drawn to larger, mineral-rich LDCs. The expected extension of AGOA for another 15 years may support more diversified FDI flows to LDCs, but it is unlikely to affect patterns of
FDI to nearly 30 eligible LDCs in Africa in the short
run, considering the weight of crude oil exports to
the United States under AGOA since 2000 (USITC,
2014).48
Among Asian LDCs, Myanmar is expected to see
further growth in FDI, with the implementation of
announced projects commencing in various sectors
and industries. In association with the development of
the country’s first special economic zone (SEZ), led by
a Myanmar-Japanese joint venture,49 8 of 41 registered
companies, of which 21 are Japanese MNEs, will start
operations in 2015.50 Greenfield activity from Japan
to Myanmar suggests an increase in projects in the
services sector, supporting Japanese manufacturers
that are set to operate in the SEZ. Two other ASEAN
LDCs (namely, Cambodia and the Lao People’s
Democratic Republic) will also benefit from enhanced
infrastructural connectivity (see the East and South-
East Asia section) and may be in a better position than
other LDCs to attract export-oriented FDI and donor-
funded large-scale infrastructure projects.51
The acceleration of existing regional integration efforts
in Africa may also lead to more FDI and external
funding for infrastructure development. Trends in
announced greenfield investment suggest that some
LDCs rich in natural resources (e.g. Mozambique,
which is expected to become a major exporter of
liquefied natural gas in the coming years) have started
attracting market-seeking FDI projects in the services
sector, alongside large-scale projects in the extractive
industries and auxiliary infrastructure development
(such as electricity, petroleum bulk stations and
terminals).
Host economy (destination)
Industry segment Investing companyHome
economy
Estimated capital expenditures
(Millions of dollars)Angola Oil and gas extraction Total France 16 000a
Mozambique Commercial and institutional building construction Pylos Belgium 5 189b
Mozambique Real estateAtterbury Property Developments
South Africa 2 595c
ZambiaBuilding material, garden equipment and supplies dealers
Enviro Board United States 2 078
Bangladesh Natural, liquefied and compressed gas Chevron Corporation United States 1 048
Source: UNCTAD, based on information from the Financial Times Ltd, fDi Markets (www.fDimarkets.com).a Most likely product-sharing contract.b Sum of six projects for the same amount.c Sum of three projects for the same amount.
Table II.12. LDCs: Five largest greenfield investment projects announced in 2014

World Investment Report 2015: Reforming International Investment Governance82
FDI trends in LDCs since the Monterrey Conference
FDI flows are an important external source of finance for LDCs. While ODA remains by far the largest external financial flow to LDCs, FDI has been on an upward trajectory since 2002 and is larger than other private flows (figures II.18 and II.19). Remittances also remain an important private external flow for this group of countries.
FDI flows to LDCs have outpaced portfolio investment for the entire period of 2002–2014; they also have been less volatile than “other investment” (mainly bank lending) (figure II.19).
FDI stock in LDCs tripled in the last decade (2004–2014). FDI inflows grew at an annual average rate of 11 per cent since the Monterrey Consensus (figure II.20). This rate of growth was similar to that for developing economies as a whole and well above the rate for the world (table II.13). At the subregional level, the bulk of FDI went to African LDCs, followed by Asian LDCs. Although FDI stock as a percentage of GDP is smaller for LDCs than for both developing countries and the world, FDI inflows represent a potentially greater contribution to GFCF.
The number of LDCs hosting inward stock of more than $10 billion increased from one (Angola) in 2002 to seven
in 2014. The five largest recipients – Mozambique ($26 billion), Sudan ($23 billion), Myanmar ($18 billion), and Equatorial Guinea and the United Republic of Tanzania ($17 billion each) – hold 45 per cent of total inward FDI stock in all LDCs. This concentration of FDI in a small number of LDCs appears to be reinforced by the export specialization of these LDCs.52 Robust gains in FDI inflows have been seen in mineral-exporting LDCs since 2002. Mixed exporters have started attracting more FDI since 2010, again largely due to just two mineral-rich LDCs (Myanmar and the United Republic of Tanzania). Flows to fuel-exporting LDCs have dipped in recent years (especially in Angola and Yemen, which recorded negative inflows).
Some policy implications. An integrated policy approach is essential to ensure that FDI and other sources of finance – domestic and external – are deployed effectively to help LDCs advance their development objectives and goals. FDI, for instance, can complement domestic investment but will not replace it as the main driver of sustainable development and structural transformation (UNCTAD, 2014). Thus, to take advantage of FDI or links with MNEs and participate in global value chains, LDCs must build indigenous productive capacities through capital accumulation, skills development and innovation (UNCTAD, 2011).
To enhance productive capacities through FDI, UNCTAD produced a Plan of Action for Investment in LDCs for the fourth UN conference on the LDCs in Turkey in 2011. The plan called for an integrated policy approach to investment, capacity-building and enterprise development in the following five areas:
Figure II.18.FDI in�ows, ODA �ows and remittances to LDCs, 2002–2013 (Billions of dollars)
Total ODA Bilateral ODA FDI in�ows Remittances
2002 2003 2004 2005 2006 2007 2008 2009 2010 2011 2012 20130
5
10
15
20
25
30
35
40
45
50
Source: UNCTAD, FDI/MNE database (www.unctad.org/fdistatistics) (for FDI inflows), OECD (for ODA flows) and World Bank (for remittances).
Table II.13. Selected FDI indicators, 2002–2014 (Per cent)
Indicator LDCsDeveloping economies
World
FDI inflows, annual growth 11 12 6
Inward FDI stock as % of GDP, 13-year average
22 26 27
FDI inflows as % of GFCF, 13-year average
13 10 9
Source: UNCTAD, FDI/MNE database (www.unctad.org/fdistatistics); World Bank for GDP and GFCF data.
Note: Annual growth computed as compound annual growth rate over the period considered. LDCs = least developed countries.

CHAPTER II Regional Investment Trends 83
• Strengthening public-private infrastructure development efforts. Poor physical infrastruc-ture constrains domestic and foreign investment and LDCs’ integration into the global economy. A new partnership for infrastructure development in LDCs is called for to address the problem.
• Boosting international development assis-tance for productive capacity. A shortfall in “soft” infrastructure also presents a hurdle to attract foreign investors and develop productive capacities in LDCs. A partnership to build skills commensurate with productive capacity needs is critical.
• Enabling firms of all sizes to capture untapped business opportunities. Large MNEs often bypass investment opportunities in LDCs, where markets are typically small and operating conditions are more challenging than in other countries. Efforts need to be stepped up to encourage small- and medium-scale international investors to tap into underexploited business opportunities and to promote the types of FDI that offer a good match with LDCs’ needs.
• Fostering local business and easing access to finance. Foreign investors are typically attracted by countries where the local business sector is thriving, and they need a minimum level of local services and suppliers to operate. New initiatives
to support local business and the development of linkages with MNEs are essential.
• Implementing a new wave of regulatory and institutional reforms. While significant reforms of regulatory frameworks for investment have been carried out, much remains to be done in most
Figure II.20.
LDCs: FDI in�ows and share in world and developing country in�ows, 2002–2014 (Billions of dollars and per cent)
ShareValue FDI in�ows Share in world totalShare in developing total
0
1
2
3
4
5
6
7
0
5
10
15
20
25
30
2002 2004 2006 2008 2010 2012 2014
Source: UNCTAD, FDI/MNE database (www.unctad.org/fdistatistics).
Figure II.19. LDCs: Private capital in�ows by type, 2002–2014 (Billions of dollars)
- 30
- 20
- 10
0
10
20
30
40
50
60
2002 2003 2004 2005 2006 2007 2008 2009 2010 2011 2012 2013 2014
Other Investment Porfolio investment FDI in�ows
Source: UNCTAD, FDI/MNE database (www.unctad.org/fdistatistics) (for FDI inflows) and IMF (for portfolio and other investments).

World Investment Report 2015: Reforming International Investment Governance84
LDCs. A new wave of reforms should attempt to co-opt business as partners for development and emphasize aspects of regulations that could shape FDI impact and strengthen State institutions and public services (such as taxation and governance).
These efforts need support by the international community, including a viable programme to boost inward investment. To be effective, the programme would require elements such as multi-agency
technical assistance consortia, and partnerships
between IPAs promoting inward investment in
LDCs and IPAs of major investment home countries
promoting outward investment (WIR14). The principal
aims of the programme would be to deepen and
spread investment within LDCs and across the group,
especially in sectors pertinent to the sustainable
development goals (SDGs). An overall target in pursuit
of these aims would be to quadruple the stock of FDI
in LDCs over the next 15 years.

Azerbaijan$4.4 bn+68.3%
Zambia$2.5 bn+37%
Ethiopia$1.2 bn+26%
Kazakhstan$9.6 bn-6.4%
Turkmenistan$3.2 bn+2.8%
Kazakhstan
Azerbaijan
Mongolia
Burkina Faso
Zimbawe
$3.6
$2.2
$0.1
$0.07
$0.06
+48%
+147%
+167%
+1.3%
Flows, by range
Above $1 bn
$0.5 to $0.9 bn
$0.1 to $0.5 bn
$10 to $99 mn
Below $10 mn
Out�ows: top 5 home economies (Billions of dollars, and 2014 growth)
Top 5 host economies
Economy$ Value of in�ows2014 % Change
FDI in�ows, top 5 host economies, 2014(Value and change)
LANDLOCKED DEVELOPING COUNTRIES -2.8%
2014 Decrease
29.2 bn2014 In�ows
2.4%Share in world
+59%
FDI in�ows, ODA �ows and remittances to LLDCs, 2002–2013 (Billions of dollars)
Total ODA Bilateral ODA FDI in�ows Remittances
2003 2005 2007 2009 2011 20130
5
10
15
20
25
30
35
40
Source: UNCTAD.Note: The boundaries and names shown and the designations used on this map do not imply official endorsement or acceptance by the United Nations. Final boundary
between the Republic of Sudan and the Republic of South Sudan has not yet been determined. Final status of the Abyei area is not yet determined. Dotted line in Jammu and Kashmir represents approximately the Line of Control agreed upon by India and Pakistan. The final status of Jammu and Kashmir has not yet been agreed upon by the parties.

Region/countrySales Purchases
2013 2014 2013 2014World 258 -1 062 6 270
Developed economies 99 -2 456 2 14
Luxembourg 20 -277 - -
Netherlands 359 -1 374 - -
United Kingdom -448 -1 152 2 -
Switzerland 331 319 - -
Developing economies 160 216 3 257
South Africa - -125 - -
Peru - 307 - -
China 56 526 - -
Hong Kong, China -77 -507 - -
Transition economies - 1 177 - -1
Russian Federation - 1 147 - -1
Sector/industrySales Purchases
2013 2014 2013 2014Total 258 -1 062 6 270
Primary -22 44 2 -250 Mining, quarrying and petroleum -22 34 2 -250
Manufacturing 257 285 - 57 Food, beverages and tobacco 177 12 - - Paper and paper products - -101 - - Pharmaceuticals, medicinal chemicals and botanical products 15 51 - -
Non-metallic mineral products - 314 - -1 Services 23 -1 391 3 463
Electricity, gas, water and waste management - -1 279 - -
Transportation and storage - 30 - 4 Information and communication 20 1 - - Financial and insurance activities 3 -158 3 459
Partner region/economyLLDCs
as destinationLLDCs
as investors2013 2014 2013 2014
World 17 712 16 398 1 047 1 220 Developed economies 9 943 6 127 186 56
France 912 543 - -
Iceland 4 000 - - -
United States 513 2 770 3 -
Australia 560 - 35 -
Developing economies 6 575 8 723 525 1 076
South Africa 931 864 42 15
China 380 1 893 - 395
Korea, Republic of 130 529 35 -
India 742 810 52 -
Transition economies 1 194 1 548 335 89
Russian Federation 729 1 414 34 -
Table C. Cross-border M&As by industry, 2013–2014 (Millions of dollars)
Table D. Cross-border M&As by region/country, 2013–2014 (Millions of dollars)
Sector/industryLLDCs
as destinationLLDCs
as investors2013 2014 2013 2014
Total 17 712 16 398 1 047 1 220 Primary 1 201 402 - -
Mining, quarrying and petroleum 1 201 402 - - Manufacturing 5 410 8 661 404 654
Textiles, clothing and leather 308 2 446 39 - Non-metallic mineral products 1 634 2 488 75 - Metals and metal products 279 738 69 - Motor vehicles and other transport equipment 613 773 - -
Services 11 102 7 335 643 566 Electricity, gas and water 5 213 982 - - Trade 524 2 023 132 11 Transport, storage and communications 2 427 1 238 138 399
Finance 1 535 1 481 354 149
HIGHLIGHTS
2008 2009 2010 2011 2012 2013 2014 2008 2009 2010 2011 2012 2013 20140
15
30
45
60
75
-4
-2
0
2
4
6
8
10
12
14
16
North Africa East Africa West Africa Southern Africa Central Africa
Share in world total
3.9 4.6 3.3 3.1 4.0 3.7 4.4 0.6 0.6 0.7 0.4 1.0 1.2 1.0
2008 2009 2010 2011 2012 2013 2014
East Asia South-East Asia
2008 2009 2010 2011 2012 2013 20140
100
200
300
400
0
100
200
300
400
2008 2009 2010 2011 2012 2013 2014 2008 2009 2010 2011 2012 2013 20140
10
20
30
40
50
60
0
5
10
15
20
25
Share in world total
3.8 3.6 2.6 2.8 2.3 2.4 3.4 1.3 1.5 1.2 0.8 0.8 0.2 0.8
2008 2009 2010 2011 2012 2013 2014 2008 2009 2010 2011 2012 2013 20140
20
40
60
80
100
0
10
20
30
40
50
TurkeyOther West Asia Gulf Cooperation Council (GCC)
Share in world total
6.3 6.0 4.5 3.4 3.4 3.0 3.5 2.2 1.6 1.3 2.0 1.8 3.1 2.8
Share in world total
15.9 17.7 23.1 20.9 22.9 23.7 31.0 9.8 16.4 18.3 16.9 20.7 22.4 28.3
2008 2009 2010 2011 2012 2013 2014
Caribbean, excluding �nancial centers Central America South America
Georgia Commonwealth of Independent States
2008 2009 2010 2011 2012 2013 2014
2008 2009 2010 2011 2012 2013 2014 2008 2009 2010 2011 2012 2013 2014
South-East Europe
2008 2009 2010 2011 2012 2013 2014 2008 2009 2010 2011 2012 2013 2014
Africa Latin America and the Caribbean Asia Oceania
2008 2009 2010 2011 2012 2013 2014 2008 2009 2010 2011 2012 2013 2014
2008 2009 2010 2011 2012 2013 2014 2008 2009 2010 2011 2012 2013 2014
0
50
100
150
200
250
0
50
100
0
25
50
75
100
125
0
20
40
60
80
100
0
5
10
15
20
25
30
0
1
2
3
4
5
6
7
8
0
5
10
15
20
25
30
35
40
0
2
4
6
8
10
0
1
2
3
4
5
6
7
8
9
10
0
0.5
1
1.5
2
2.5
Share in world total
9.2 7 9.9 10.5 12.7 12.7 13 2.3 1.2 3.4 2.3 3.4 2.2 1.7
Share in world total
7.8 5.9 5.6 6.2 6.1 6.8 3.9 3.5 4.3 4.5 4.6 4.2 7.0 4.7
Share in world total
1.2 1.4 1.8 1.4 1.7 1.5 1.9 0.2 0.1 0.2 0.3 0.4 0.6 0.2
Share in world total
1.7 2.2 2.0 2.3 2.5 2.0 2.4 0.1 0.4 0.7 0.4 0.2 0.3 0.4
Share in world total
0.6 0.4 0.3 0.4 0.5 0.4 0.6 0.1 0.0 0.0 0.1 0.2 0.1 0.1
North America Other developed Europe European Union
2008 2009 2010 2011 2012 2013 2014 2008 2009 2010 2011 2012 2013 2014
Other developed countries
0
400
800
1 200
1 600
0
400
800
1 200
1 600
Share in world total
52.9 55.0 50.7 52.9 48.4 47.5 40.6 80.3 74.4 70.5 72.8 68.0 63.8 60.8
Transition economies Asia and Oceania Latin America and the Caribbean Africa
Oceania Asia Latin America and the Caribbean Africa
Figure A. FDI in�ows, 2008−2014 (Billions of dollars)
Figure B. FDI out�ows, 2008−2014(Billions of dollars)
• FDI flows: largest external capital flow to LLDCs• Top five economies receive 71 per cent of flows• Developed countries: largest holders of FDI stock in LLDCs
Table A. Announced greenfield FDI projects by industry, 2013–2014 (Millions of dollars)
Table B. Announced greenfield FDI projects by region/country, 2013–2014 (Millions of dollars)

CHAPTER II Regional Investment Trends 87
FDI flows to the landlocked developing countries
(LLDCs) fell by 3 per cent to $29 billion in 2014, the third
consecutive yearly decline for this group of economies.
Investment in the group became more concentrated in
the top five economies, which increased their share
from 62 per cent to 71 per cent of total flows. Ethiopia
entered the top five for the first time, in terms of value
of inflows, while Mongolia dropped out of the top
five owing to a precipitous 76 per cent fall in flows.
The largest investors in LLDCs last year came from
developing countries, which increased their share of
flows in the grouping from 44 per cent to 63 per cent.
Over the past decade, FDI stock in LLDCs quadrupled.
As a group, the LLDCs accounted for 2.4 per cent of total global FDI inflows, up slightly from 2013 despite the fall in their value. The Asian group of LLDCs (5 countries) saw FDI to the subregion fall again, due to the continuing decline in flows to Mongolia, which dropped from $2.1 billion to $508 million. In the transition economy group (9 countries), flows rose by more than $1 billion, despite a 6 per cent decrease in FDI to Kazakhstan, the largest economy in the subregion. Transition economies increased their share in the group to 66 per cent. Flows to the African group (16 countries) went up by over 6 per cent to $7.6 billion, owing to large increases in FDI to Zambia and Ethiopia. FDI to the Latin America group (2 countries) fell by more than half as a result of a big drop in flows to the Plurilateral State of Bolivia, following four years of steady increases.
Outward investment by the LLDCs, although they represent only 0.4 per cent of total global outflows, increased by almost 50 per cent to $5.8 billion. This was mostly accounted for by investors from Kazakhstan and Azerbaijan.
Announced greenfield investments to the LLDCs fell in 2014. Announced greenfield investment in the LLDCs has been erratic since its peak in 2008, which it still has not passed in terms of the number or value of deals. In 2014, the number of greenfield deals declined by 5 per cent to 315, representing just 2 per cent of the world total.
The number of deals in the primary sector has been declining in recent years, and their value accounted for just 2 per cent of total announced greenfield investment in LLDCs, at $402 million, despite the prevalence of extractive industries in several LLDC economies. Greenfield investments in manufacturing
remain strong, in particular in the textiles industry, where their value jumped from $308 million in 2013 to $2.45 billion in 2014.53 The non-metallic minerals industry also registered strong performance, with the value of announced investments rising from $1.63 billion to $2.45 billion in 2014. A large share of this was accounted for by cement manufacturing firms, investing particularly in African LLDCs.
In the services sector, the number of deals in nearly all industries fell in 2014. Announced greenfield investment projects in the electricity, gas and water industries fell sharply, from $5.2 billion to $982 million, although these industries had experienced exceptional growth in 2013. In the transport, storage and communications industries, the value of announced greenfield projects halved in 2014 to $1.2 billion. One bright spot was trade, as greenfield investments grew from $524 million to $2 billion.
Investors from developing and transition economies accounted for 63 per cent of all greenfield investment in the LLDCs, up from 44 per cent in 2013, although this large change in share is partly explained by a single investment made by Reykjavik Geothermal (Iceland) in Ethiopia in 2013. The United States was the single largest greenfield investor in the LLDCs in 2014, followed by China and the Russian Federation.
M&A activity negative in 2014. Investors’ purchases were −$1 billion, meaning that the value of divested assets was greater than the value of acquired assets. Investors from the United Kingdom made the largest divestment, roughly $1.2 billion, principally in Kazakhstan, where AO Samruk-Energo, a subsidiary of a Kazakh State-owned sovereign wealth fund, bought the remaining 50 per cent stake in the electric utility company, TOO Ekibastuzskaya GRES-1. Sappi Ltd (South Africa) also made a sizable $100 million divestment of Usutu Forests Products Co Ltd in Swaziland to local investors. The largest M&A investment was made by Polymetal International PLC (Russian Federation), which acquired the entire share capital of Altynalmas Gold Ltd (Kazakhstan), for over $1.1 billion. In terms of sectoral trends, the services sector suffered the most and in particular the electricity, gas and water industries.
Developed countries remain the largest holders of FDI stock in LLDCs, but China is now a stronger presence, and the Republic of Korea is also an emerging force. Data on bilateral FDI stock for
HIGHLIGHTS

World Investment Report 2015: Reforming International Investment Governance88
25 of the 32 LLDCs reveal that, as of 2012, developed economies accounted for 67 per cent of FDI stock in this group of economies.
Among developing- and transition-economy investors, China and the Russian Federation, as well as Turkey, the United Arab Emirates and the Republic of Korea, have become the most important investors in the Central Asian region (table II.14). In Azerbaijan, Turkish investors hold the largest FDI stock; they are the third largest group of developing-country investors in Central Asia as a whole. Indeed, among developing-country investors, there is growing competition for investments in the region, which is also reflected in FDI stock held by investors from the United Arab Emirates, the Republic of Korea and the Islamic Republic of Iran.
The Republic of Korea was the largest investor in LLDCs in 2012, according to greenfield data, and has been promoting growing investment ties with Central Asian LLDCs. Its 2013 the “Eurasia Initiative” aims to boost connectivity and economic ties between the Korean peninsula and Europe (see section A.2). The country has strong trade ties with the region, particularly Uzbekistan, and is one of the largest foreign investors there, together with the Russian Federation, China and Kazakhstan.54 Businesses from the Republic of Korea are also heavily invested in Turkmenistan, with over $5 billion worth of projects. During the visit by that country’s president to Uzbekistan in 2014, a further $5 billion worth of FDI in the natural gas and chemicals sectors was announced.55
FDI inflows to Mongolia showed a decline for the fourth successive year. Political and policy instability coupled with an economic slowdown (GDP growth fell from 12 to 6 per cent in 2014) has led to reduced investor interest. One potential area for FDI growth concerns the construction of a gas pipeline between the Russian
Federation and China that could pass through Mongolia,
as the Russian Federation explores increasing trade
and investment cooperation with China. For the time
being, though, growth in FDI to the country is weak.
FDI trends in the LLDCs since the Monterrey Conference
FDI developments in the LLDCs during the 13 years
since the Monterrey Conference fall in two periods:
relatively modest flows prior to 2007, followed by
increasing flows with slightly more diverse regional
distribution after 2008 (figure II.21). However, flows to
the LLDCs remain dominated by few countries: just
five economies account for over 70 per cent of total
FDI in the group.
The growth of FDI flows to the LLDCs since 2002 has
been faster than the global rate of FDI growth but the
same as that for developing economies as a whole
(table II.16). As reported in WIR14, FDI has been an
important source of finance for the LLDCs in terms
of both the value of FDI stock as a percentage of
GDP and the contribution of FDI to capital formation
(GFCF). For both these indicators, FDI has been of
greater significance in the LLDCs than it has been for
developing economies in general and for the world
since 2002 (figure II.22).
At the subregional level, FDI growth in the LLDCs has
been strongest among the Asian and transition group
of LLDCs, although this growth is mainly accounted for
by the rapid inflows to Mongolia in the mining sector,
and to Kazakhstan. In the two Latin American LLDCs,
FDI growth has been positive but much weaker than in
other regions (table II.16).
The Monterrey Consensus intended to mobilize interna-
tional capital flows, which includes private capital flows
Table II.14. Central Asian LLDCs: Inward FDI stock held by selected developing and transition economies, 2012 (Millions of dollars)
Home country Armenia Azerbaijan Kazakhstan Kyrgyzstan Mongolia TajikistanTotal
in regionChina 4 170 4 512 334 3 727 476 9 224Russian Federation 2 450 478 1 933 132 296 - 5 289Turkey - 1 933 549 68 7 2 2 559United Arab Emirates 1 413 1 203 9 1 - 1 627Korea, Republic of - 76 1 068 71 365 - 1 580Iran, Islamic Republic of 17 910 40 4 1 - 972
Source: UNCTAD, FDI/MNE database (www.unctad.org/fdistatistics).Note: The position of the Russian Federation may be understated due to indirectly held FDI stock.

CHAPTER II Regional Investment Trends 89
Figure II.21.
LLDCs: FDI in�ows and their share in world and developing-country in�ows, 2002–2014 (Billions of dollars and per cent)
ShareValue FDI in�ows Share in world totalShare in developing total
2002 2004 2006 2008 2010 2012 2014 0
1
2
3
4
5
6
0
5
10
15
20
25
30
35
40
Source: UNCTAD, FDI/MNE database (www.unctad.org/fdistatistics).
Table II.15. Selected FDI indicators, 2002–2014 (Per cent)
Indicator LLDCsDeveloping economies
World
FDI inflows, annual growth 12 12 6 Inward FDI stock as % of GDP, 13-year average 33 26 27 FDI inflows as % of GFCF, 13-year average 19 10 9
Source: UNCTAD, FDI/MNE database (www.unctad.org/fdistatistics).Note: Annual growth computed as compound annual growth rate over the period. LLDCs = landlocked developing countries.
Table II.16.LLDCs: FDI inflows, by subregion, 2002–2014 (Millions of dollars and per cent)
2002 2014Growth
(%)Landlocked countries (LLDCs)
7 872 29 151 12
LLDCs-Africa 2 501 7 631 10 LLDCs-Latin America and the Caribbean
682 884 2
LLDCs-Asia and Oceania 129 1 317 21 LLDCs-Transition economies 4 559 19 319 13
Source: UNCTAD, FDI/MNE database (www.unctad.org/fdistatistics).Note: Growth computed as compound annual growth rate over the period
2004–2013. LLDCs = landlocked developing countries.
Figure II.22.
LLDCs: FDI stock as a percentage of GDP compared with developing countries and world, 2002–2013 (Per cent)
22
24
26
28
30
32
34
36
38
40
2002 2003 2004 2005 2006 2007 2008 2009 2010 2011 2012 2013
World
Developing economies
Landlocked developing countries
Source: UNCTAD, FDI/MNE database (www.unctad.org/fdistatistics).
such as FDI, portfolio investments and “other” investment (mainly bank lending). In the LLDCs, FDI has provided the bulk of private capital flows, with portfolio investment less significant and more volatile56 (figure II.23).
With regard to increasing international assistance, which was also highlighted by the Monterrey Consensus, a comparison of FDI inflows to aid flows (ODA) shows that FDI flows were mostly higher than bilateral aid flows during the period; they overtook total ODA in 2008 and now represent the largest external capital flow to the LLDCs (figure II.24). However, it is important to note variations among the LLDCs: the bulk of FDI flows to the LLDCs has been concentrated in a few countries only, mainly resource-rich, mineral-exporting economies; ODA has been more widely distributed among LLDCs, and its role in government budget support is often critical for the provision of essential services and infrastructure. Migrant remittances have also been an important source of external capital flows for several LLDCs, notably Tajikistan and Kyrgyzstan, where they accounted for 47 per cent and 31 per cent of GDP, respectively, in 2012. Nevertheless, FDI to the LLDCs plays a catalytic role in building productive and export capacities in the region, as well as transferring technology, skills and management practices that can

World Investment Report 2015: Reforming International Investment Governance90
further enhance the competitiveness of this group of economies.
Policy implications. Although FDI has become the most important external capital flow to the LLDCs and will remain essential for the development financing strategies of this group of countries, it should be seen as part of an overall financing strategy that involves domestic as well as foreign sources, and public as well as private ones (WIR14). Moreover, beyond their shared geographic characteristic, the LLDCs should not be considered a homogenous group. There are clear regional and country differences, which policymakers and the international community should consider when setting policies so as to spread the benefits of foreign investment beyond a relatively small group of economies and sectors.
The Vienna Programme of Action (POA), the outcome document of the Second United Nations Conference on Landlocked Developing Countries held in November 2014, highlighted a number of areas for action to address infrastructure and connectivity in the LLDCs. The document called for travel times for the transport of cargo to be reduced, which will require significant investment in transport infrastructure as well as attention to trade facilitation, including customs harmonization and streamlined inspections and certification. The growth of regional economic
agreements could also help create efficiencies in time and cost by reducing the number of border stops and associated costs (as well as create larger regional markets, which would be attractive to market-seeking FDI).
Source: UNCTAD, FDI/MNE database (www.unctad.org/fdistatistics) (for FDI inflows) and IMF (for portfolio and other investments).
North Africa East Africa West Africa Southern Africa Central Africa
Figure II.23. LLDCs: Private capital in�ows by type, 2002–2014 (Billions of dollars)
- 10
0
10
20
30
40
50
60
2002 2003 2004 2005 2006 2007 2008 2009 2010 2011 2012 2013 2014
Other Investment Porfolio investment FDI in�ows
Figure II.24.LLDCs: FDI in�ows, ODA �ows and remittances, 2002–2013 (Billions of dollars)
2002 2003 2004 2005 2006 2007 2008 2009 2010 2011 2012 2013
Total ODA Bilateral ODA FDI in�ows Remittances
0
5
10
15
20
25
30
35
40
Source: UNCTAD, FDI/MNE database (www.unctad.org/fdistatistics) (for FDI inflows), OECD (for ODA flows) and World Bank (for remittances).

Flows, by range
Above $1 bn
$500 to $999 mn
$100 to $499 mn
$50 to $99 mn
Below $50 mn
Out�ows: top 5 home economies (Millions of dollars, and 2014 growth)
Top 5 host economies
Economy$ Value of in�ows2014 % Change
FDI in�ows, ODA �ows and remittances to SIDS, 2002–2013 (Billions of dollars)
Total ODA Bilateral ODA FDI in�ows Remittances
2003 2005 2007 2009 2011 20130
1 2 3 4 5 6 7 8 9
10
FDI in�ows, top 5 host economies, 2014(Value and change)
SMALL ISLAND DEVELOPING STATES
+21.8%2014 Increase
6.9 bn2014 In�ows
0.6%Share in world
Trinidad andTobago
Bahamas
Barbados
MarshallIslands
Mauritius
-11.9%$726
$398
$93
$91
$24
+43.5%
-12.8%
-32.5%
+29.1%
Trinidad and Tobago
$2.42 bn+21.5%
Bahamas$1.6 bn+43.7% Mauritius
$0.42 bn+61.8%
Jamaica$0.55 bn
-7.1%
Maldives$0.36 bn+0.7%
Source: UNCTAD. Note: The boundaries and names shown and the designations used on this map do not imply official endorsement or acceptance by the United Nations.
Final boundary between the Republic of Sudan and the Republic of South Sudan has not yet been determined. Final status of the Abyei area is not yet determined. Dotted line in Jammu and Kashmir represents approximately the Line of Control agreed upon by India and Pakistan. The final status of Jammu and Kashmir
has not yet been agreed upon by the parties.

Region/countrySales Purchases
2013 2014 2013 2014World -596 1 503 -294 2 065
Developed economies -604 74 -333 1 149 European Union 280 3 307 -367 -328 United States -600 -142 2 194 Australia - -2 857 20 1 098
Developing economies 3 1 428 39 916 Africa 5 1 175 - 12
Mauritius 5 1 175 - - Zimbabwe - - - 12
Latin America and the Caribbean - - - 895
Trinidad and Tobago - - - 1 175 Asia and Oceania -2 253 39 9
Singapore 60 -1 9 -
Sector/industry Sales Purchases2013 2014 2013 2014
Total -596 1 503 -294 2 065 Primary -600 5 -14 -
Extraction of crude petroleum and natural gas -600 -7 - -
Mining of metal ores - 12 -14 - Manufacturing -5 1 175 - -
Chemicals and chemical products - 1 175 - - Services 9 323 -280 2 065
Electricity, gas, water and waste management - -2 - 1 175
Transportation and storage - 258 - -81 Information and communication 4 - 7 - Financial and insurance activities - 68 -286 -183 Business activities 5 - - 12 Public administration and defence; compulsory social security - - - 1 116
Partner region/economySIDS
as destinationSIDS
as investors2013 2014 2013 2014
World 6 504 4 841 3 605 2 021 Developed economies 2 812 1 964 3 81
Europe 253 1 707 3 2 United States 1 380 211 - 7 Australia 316 45 - 35 Japan 863 - - -
Developing economies 3 692 2 877 3 602 1 941 Africa 56 59 3 192 1 720
Kenya - - 461 86 Nigeria - - 2 296 1 148
Asia and Oceania 3 624 2 773 177 - China 3 250 2 429 162 -
Latin America and the Caribbean 13 45 233 221
Table C. Cross-border M&As by industry, 2013–2014 (Millions of dollars)
Table D. Cross-border M&As by region/country, 2013–2014 (Millions of dollars)
Sector/industrySIDS
as destinationSIDS
as investors2013 2014 2013 2014
Total 6 504 4 841 3 605 2 021 Primary 2 532 22 - - Manufacturing 1 984 223 - 262
Coke, petroleum products and nuclear fuel 1 048 - - -
Chemicals and chemical products 850 - - -
Metals and metal products - 160 - - Services 1 989 4 596 3 605 1 760
Electricity, gas and water - 1 298 - 125 Construction 1 350 2 000 - - Hotels and restaurants 65 234 - - Transport, storage and communications 477 588 1 648 1 369
Finance 22 186 210 67 Business services 47 190 1 748 161
HIGHLIGHTS
2008 2009 2010 2011 2012 2013 2014 2008 2009 2010 2011 2012 2013 20140
15
30
45
60
75
-4
-2
0
2
4
6
8
10
12
14
16
North Africa East Africa West Africa Southern Africa Central Africa
Share in world total
3.9 4.6 3.3 3.1 4.0 3.7 4.4 0.6 0.6 0.7 0.4 1.0 1.2 1.0
2008 2009 2010 2011 2012 2013 2014
East Asia South-East Asia
2008 2009 2010 2011 2012 2013 20140
100
200
300
400
0
100
200
300
400
2008 2009 2010 2011 2012 2013 2014 2008 2009 2010 2011 2012 2013 20140
10
20
30
40
50
60
0
5
10
15
20
25
Share in world total
3.8 3.6 2.6 2.8 2.3 2.4 3.4 1.3 1.5 1.2 0.8 0.8 0.2 0.8
2008 2009 2010 2011 2012 2013 2014 2008 2009 2010 2011 2012 2013 20140
20
40
60
80
100
0
10
20
30
40
50
TurkeyOther West Asia Gulf Cooperation Council (GCC)
Share in world total
6.3 6.0 4.5 3.4 3.4 3.0 3.5 2.2 1.6 1.3 2.0 1.8 3.1 2.8
Share in world total
15.9 17.7 23.1 20.9 22.9 23.7 31.0 9.8 16.4 18.3 16.9 20.7 22.4 28.3
2008 2009 2010 2011 2012 2013 2014
Caribbean, excluding �nancial centers Central America South America
Georgia Commonwealth of Independent States
2008 2009 2010 2011 2012 2013 2014
2008 2009 2010 2011 2012 2013 2014 2008 2009 2010 2011 2012 2013 2014
South-East Europe
2008 2009 2010 2011 2012 2013 2014 2008 2009 2010 2011 2012 2013 2014
Africa Latin America and the Caribbean Asia Oceania
2008 2009 2010 2011 2012 2013 2014 2008 2009 2010 2011 2012 2013 2014
2008 2009 2010 2011 2012 2013 2014 2008 2009 2010 2011 2012 2013 2014
0
50
100
150
200
250
0
50
100
0
25
50
75
100
125
0
20
40
60
80
100
0
5
10
15
20
25
30
0
1
2
3
4
5
6
7
8
0
5
10
15
20
25
30
35
40
0
2
4
6
8
10
0
1
2
3
4
5
6
7
8
9
10
0
0.5
1
1.5
2
2.5
Share in world total
9.2 7 9.9 10.5 12.7 12.7 13 2.3 1.2 3.4 2.3 3.4 2.2 1.7
Share in world total
7.8 5.9 5.6 6.2 6.1 6.8 3.9 3.5 4.3 4.5 4.6 4.2 7.0 4.7
Share in world total
1.2 1.4 1.8 1.4 1.7 1.5 1.9 0.2 0.1 0.2 0.3 0.4 0.6 0.2
Share in world total
1.7 2.2 2.0 2.3 2.5 2.0 2.4 0.1 0.4 0.7 0.4 0.2 0.3 0.4
Share in world total
0.6 0.4 0.3 0.4 0.5 0.4 0.6 0.1 0.0 0.0 0.1 0.2 0.1 0.1
North America Other developed Europe European Union
2008 2009 2010 2011 2012 2013 2014 2008 2009 2010 2011 2012 2013 2014
Other developed countries
0
400
800
1 200
1 600
0
400
800
1 200
1 600
Share in world total
52.9 55.0 50.7 52.9 48.4 47.5 40.6 80.3 74.4 70.5 72.8 68.0 63.8 60.8
Transition economies Asia and Oceania Latin America and the Caribbean Africa
Oceania Asia Latin America and the Caribbean Africa
Figure A. FDI in�ows, 2008−2014 (Billions of dollars)
Figure B. FDI out�ows, 2008−2014(Billions of dollars)
• FDI remains largest external source of financing• ODA has role to play, especially in Africa and Oceania• International community can coordinate sustainable investment
Table A. Announced greenfield FDI projects by industry, 2013–2014 (Millions of dollars)
Table B. Announced greenfield FDI projects by region/country, 2013–2014 (Millions of dollars)

CHAPTER II Regional Investment Trends 93
FDI flows to small island developing States (SIDS)
increased by 22 per cent to $6.9 billion, mostly due
to a strong rise in cross-border M&A sales. Between
2004 and 2014, FDI stock in the SIDS tripled. The third
International Conference on SIDS (in September 2014,
in Samoa) highlighted the need for further efforts to
harness financing for economic diversification to foster
greater resilience and sustainability in these countries.
Caribbean SIDS received the bulk of FDI flows (78 per cent of the total), followed by African SIDS (11 per cent), Asian SIDS (6 per cent) and Pacific SIDS (5 per cent). Cross-border M&As turned from negative values (because of divestment) in 2013 (−$600 million) to $1.5 billion in 2014.
Trinidad and Tobago, the Bahamas, Jamaica and Mauritius were the largest destinations for FDI flows to SIDS in 2014, accounting for 72 per cent of the total. Flows to Trinidad and Tobago − 35 per cent of the total − increased by 21 per cent to $2.4 billion as a result of the $1.2 billion acquisition of the remaining 57 per cent stake in Methanol Holdings Trinidad Limited by Consolidated Energy Company (Mauritius). Mauritius also registered strong growth of FDI flows, which reached $418 million (up 62 per cent), boosted by the $68 million acquisition of CIEL Investment Limited − a provider of investment services − by an investor group of mostly French companies. Total cross-border acquisitions in Mauritius − including deals that involved changes of ownership between non-residents − have renewed their growth since 2012 and reached $574 million in 2014. On the other hand, flows to Jamaica – the group’s second largest recipient − decreased by 7 per cent to $551 million, despite new equity inflows in infrastructure and tourism projects.
Although Papua New Guinea and Timor-Leste have hosted a number of big projects in the extractive industry, they continued to register modest FDI flows, partly due to non-equity investment (e.g. production sharing), and partly due to incomplete coverage of
data. Foreign investors’ involvement in Papua New Guinea’s oil and gas industry is reflected by the number of cross-border M&As megadeals that took place in 2014, totalling $4 billion, and all involving the sale by Interoil Corp (Singapore) of its upstream and downstream business to Total (France), Oil Search (Australia) and Puma Energy Singapore (Netherlands).
FDI trends in the SIDS since the Monterrey Conference
FDI flows to the SIDS have grown more slowly than to developing economies as a whole, and they took a particular hit after the onset of the financial crisis. The annual growth of FDI inflows to SIDS over 2002–2014, while sizeable and keeping pace with the world average, was much slower than to developing countries as a whole (table II.17). In addition, FDI to SIDS fell considerably after the onset of the financial crisis and have not yet recovered (figure II.25).
Figure II.25.
SIDS: FDI in�ows and their share in world and developing-country in�ows, 2002–2014 (Billions of dollars and per cent)
0
0.2
0.4
0.6
0.8
1.0
1.2
1.4
1.6
1.8
0
2
4
6
8
10
2002 2004 2006 2008 2010 2012 2014
ShareValue FDI in�ows Share in world totalShare in developing total
Source: UNCTAD, FDI/MNE database (www.unctad.org/fdistatistics).
Table II.17. Selected FDI indicators, 2002–2014 (Per cent)
Indicator SIDSDeveloping countries
World
FDI inflows, annual growth 10 12 6 Inward FDI stock as % of GDP, 13-year average 70 26 27 FDI inflows as % of GFCF, 13-year average 32 10 9
Source: UNCTAD, FDI/MNE database (www.unctad.org/fdistatistics). Note: Annual growth computed as compound annual growth rate over the period considered.
HIGHLIGHTS

World Investment Report 2015: Reforming International Investment Governance94
Nevertheless, FDI stock in SIDS as a group tripled during the past decade (2004–2014).
FDI to the 29 SIDS is very small in absolute value but relatively high in relation to the size of their economies. Annual average flows amounted to only $6 billion (0.4 per cent of the world’s total) and average annual stocks to $62 billion (0.36 per cent) over the past decade. However, these flows are relatively high when comparing the size of SIDS economies with the world and developing-economy averages (table II.17). This is partly due to the sizeable fiscal advantages offered to foreign investors in a number of SIDS, and some very large investments in natural resources. The ratio of FDI stock to GDP during 2002–2014 and FDI inflows as a percentage of GFCF were each almost three times as high as the world and developing-economy average over the same period.
The bulk of FDI into the SIDS is concentrated in a few regions and economies. The Caribbean SIDS received the lion’s share of FDI flows to the group, at 77 per cent of total flows during 2002–2014, followed by Africa (especially in recent years) and Oceania. Trinidad and Tobago alone accounted for 27 per cent of total FDI stocks in SIDS in 2014, owing to the presence of large oil and gas resources, coupled with proximity to North America. The Bahamas, which enjoys the highest GDP per capita among SIDS, accounted for 19 per cent. Jamaica, which has metal mineral deposits and is the second most populated of the SIDS after Papua New Guinea, received 14 per cent. Among the 10 largest host countries of FDI stock to the SIDS, three are rich in mineral deposits (Papua New Guinea, Trinidad and Tobago, and Jamaica), four are home to the bulk of the SIDS population (Papua New Guinea, Jamaica, Trinidad and Tobago, and Mauritius), and some offer fiscal advantages (e.g. the Bahamas, Barbados, Mauritius and Seychelles, among others).
At the bottom of the ranking, eight countries57 for which data are available account for less than 2 per cent of total FDI stock in the group: $2.1 billion or just $264 million per country. Of these countries, three are LDCs, all but three have fewer than 200,000 inhabitants, none (except Timor-Leste) has significant mineral resources, and six are Pacific SIDS, which are among the smallest and most remote.
Across the SIDS group as a whole, there has been a shift in the relative share of different sources of
external finance. FDI, despite a dip after the financial crisis, remains the largest external source of financing to the group. Since 2002, ODA has declined in relative importance but remains a stable source of external finance (figure II.26). Comparing FDI with other private sector sources of financing and investment shows that “other” investment (mostly bank loans) has become an increasingly important source of external finance for SIDS. However, it is much less stable than FDI (figure II.27).58
Among SIDS, there are major country and subgroup differences in the composition of flows, and these need to be taken into account by policymakers in their diversification strategies. Caribbean SIDS attracted more than three quarters of FDI flows in 2002–2013 (figure II.28). Oceania SIDS absorbed 57 per cent of ODA and only 9 per cent of FDI. More than half of the overall amount of ODA aimed at SIDS in 2002–2013 went to four countries, the largest recipient being Papua New Guinea, followed by Timor-Leste and the Solomon Islands – two LDCs – and Cape Verde. ODA is vital for many SIDS, being equivalent to more than 10 per cent of GDP for 13 of them, and more than 50 per cent for countries such as Tuvalu (70 per cent) and the Marshall Islands (54 per cent).
Policy implications. For the most part, small market size, a narrow resource base, remote locations, and
Figure II.26.SIDS: FDI in�ows, ODA �ows and remittances, 2002–2013 (Billions of dollars)
Total ODA Bilateral ODA FDI in�ows Remittances
2002 2003 2004 2005 2006 2007 2008 2009 2010 2011 2012 20130
1
2
3
4
5
6
7
8
9
10
Source: UNCTAD, FDI/MNE database (www.unctad.org/fdistatistics) (for FDI flows), IMF (for portfolio investment), OECD (for ODA) and World Bank (for remittances).

CHAPTER II Regional Investment Trends 95
high vulnerability to natural disasters affect the nature and the scope of economic activities that can be developed in SIDS.
Nevertheless, in pursuing diversification and sustainable development, SIDS have to mobilize and effectively channel a range of domestic and external sources of development finance, such as ODA, FDI, portfolio investment, bank lending and remittances for
economic development and long-term sustainability. Efforts on three fronts are required:
• A tailored, long-term industrial strategic plan, focusing on investment in sustainable investment.
• A rigorous assessment of current and potential sources of financing realistically available to them, recognizing that the composition of flows varies by country.
• A careful matching of the characteristics of available flows to specific development goals and objectives, including building relevant capabilities, to ensure that the most suitable sources of financing and investment are utilized in any project, scheme or sector. In many cases, for instance for investment related to climate change mitigation and adaptation, this will entail PPPs relying on multiple sources of financing, both domestic and foreign.
Coordinated efforts by the international community are needed to support SIDS in working towards these goals, including in helping smooth the systemic challenges and constraints they face. Quadrupling the FDI stock in the next decade and a half and ensuring its positive contribution to the SDG sectors is a challenging but achievable goal.
Figure II.27. SIDS: Private capital in�ows by type, 2002–2014 (Billions of dollars)
- 50
- 40
- 30
- 20
- 10
0
10
20
30
40
50
2002 2003 2004 2005 2006 2007 2008 2009 2010 2011 2012 2013 2014
Other Investment Porfolio investment FDI in�ows
Figure II.28.SIDS: FDI �ows and ODA �ows by region, 2002–2013(Millions of dollars)
FDI ODA
SIDS LAC SIDS Africa SIDS Asia SIDS Oceania
47
6 2
6 2
5 3
14
Source: UNCTAD, FDI/MNE database (www.unctad.org/fdistatistics) (for FDI inflows) and IMF (for portfolio and other investment).
Source: UNCTAD, FDI/MNE database (www.unctad.org/fdistatistics) (for FDI flows) and OECD (for ODA flows).

World Investment Report 2015: Reforming International Investment Governance96
Notes1 The other five are mobilizing domestic financial resources,
harnessing trade as an engine for development, increasing international financial assistance (ODA) and technical cooperation, providing debt relief, and addressing systemic issues and coherence between the international monetary, financial and trading systems.
2 See http://apparel.edgl.com/news/The-New-Kid-on-the-Block--Africa-Is-Vying-for-a-Larger-Share-of-the-Global-Textile-and-Apparel-Pie96802.
3 They include several by Dubai-based private equity firm Abraaj Group into consumer sectors and by Dubai’s DP World, which currently operates 12 terminals in six African countries, with projects under way in Egypt and Senegal. The Investment Corporation of Dubai (the country’s sovereign wealth fund) invested $300 million in Dangote Cement (Nigeria) in 2014. The Emirates Investment Authority (United Arab Emirates) acquired 53 per cent of the Morocco-based telecommunications company, Itissalat (France). See also http://web.dpworld.com/wp-content/uploads/2014/05/22294_DP_World_RA14_Web_v2.pdf.
4 A simple categorization of FDI by firm type rather than project type can be misleading. For example, SRK Consulting, a prominent mining consulting service firm, has invested in several African countries over recent years to support mineral extraction. Although in UNCTAD’s greenfield investment database, the firm’s investments are counted as being in “business services”, i.e. in the services sector, they constitute a mining investment in terms of FDI data as the firm’s activity is incidental to mining.
5 The ICBC deal was also the largest investment outside of China by a Chinese bank at the time. This meant that by 2012, some 10.5 per cent of South Africa’s inward FDI stock was in the banking industry.
6 See http://mg.co.za/article/2014-03-25-mtn-said-to-start-selling-mobile-tower-networks.
7 Information comes from UNCTAD’s database on foreign affiliates, which is based on Bureau van Dijk’s Orbis.
8 “HK Foreign Direct Investment”, InvestHK Newsletter, January 2015.
9 “Foreign investors worried Vietnamese minimum wages jump 17-fold over 15 years”, NIKKEI Asian Review, 18 November 2014.
10 InfraPPP (www.infrapppworld.com) and Indonesia Investments (www.indonesia-investments.com). See e.g. “Soekarno-Hatta Railway Project Indonesia: Tendered to Private Sector” (www.indonesia-investments.com/business/business-columns/soekarno-hatta-railway-project-fully-tendered-to-private-sector/item2718).
11 Jack Goodman, “Sri Lanka’s Growing Links with China: Trade, investment and a strategic Indian Ocean location bring the two countries closer together”, The Diplomat, 6 March 2014.
12 For example, in 2014, Asian Paints (India) started to build a plant with an investment of $81 million, and r-pac
International Corporation (United States) announced plans to invest $107 million in a production facility in Sri Lanka.
13 Large Chinese companies, such as China International Water & Electric Corp. and Three Gorges International Corp., are investing in hydroelectricity plans in Nepal. In 2014, agreements were signed with two Indian companies in the same sector, each investing about $1 billion.
14 Automobile Industry in India, India Brand Equity Foundation (IBEF), January 2015.
15 See, e.g. Bhasker (2013).
16 These Indian automakers started operating in the passenger car market first with multi-utility vehicles and, later, with small cars (see e.g. Kumaraswamy et al., 2012).
17 See, e.g. Okada and Siddharthan (2007).
18 Starting in 2009 in Bahrain, 2012 in Lebanon and Turkey, and 2013 in Iraq.
19 The segments of the construction industry include residential and commercial buildings, water and energy, transport, oil and gas, among others. In the absence of official statistics, data on contract awards and on work under execution are the main bases for gauging the trends shaping the GCC construction market since 2008–2009, and assessing the importance of foreign contractors in this market.
20 The $88 billion awarded to the largest contractors represented 56 per cent of the value of total contracts awarded in the GCC in 2013 (see MEED Insight, “GCC Construction Projects Market 2015”, August 2014; and “Local firms dominate GCC construction”, MEED (Middle East Economic Digest), 58(3), 17 January 2014).
21 See “Local firms dominate GCC construction”, MEED, 58(3), 17 January 2014; MEED Insight, “MENA projects market and review 2014”, July 2014; MEED Insight, “The UAE projects market 2013, A comprehensive forecast and review of opportunities in the United Arab Emirates’ projects market”, www.meedinsight.com.
22 Korean firms have won the vast majority of their projects by using lump-sum turnkey contracts to submit aggressive prices and to employ stringent project management (aimed at finishing the scheme ahead of schedule wherever possible), and by using highly effective procurement strategies to ensure that they bring the project in on time and on budget.
23 Economist Intelligence Unit, “GCC companies face challenging 2015”, 22 January 2015.
24 Although significant efforts have been made since the early 2000s to diversify GCC economies, progress toward genuine diversification has been modest. Growth in non-oil output averaged 6.8 per cent during 2001–13, and the share of the non-oil sector in total real GDP rose by 12 percentage points to 70 per cent, driven mainly by Saudi Arabia and the United Arab Emirates (Callen et al., 2014). However, “non-oil growth is in most cases concentrated in service industries that rely on demand generated by oil revenues; moreover, in many cases, productivity in the non-oil economy has been declining” (IMF, 2014: 25).

CHAPTER II Regional Investment Trends 97
25 Intel’s operations in Costa Rica are worth about $2 billion a year, making up about 20 per cent of the country’s exports. The firm accounted for 11 per cent of net FDI over 2000–12. (“Business in Costa Rica, Intel outside”, The Economist, 19 April 2014).
26 “Dominican Rep. Investment in Free Zones Up 6%”, CentralAmericaData.com, 21 April 2015.
27 During 1996–2000, roughly half of FDI flows were related to M&As in connection with the privatization of State-owned utilities and domestic banks (Elson, 2006).
28 Brazil attracted 69 per cent of FDI flows to South America’s secondary sector in 2006–2013, and Argentina 18 per cent.
29 “BASF, Gazprom Fall Victim to Sanctions as Asset Swap Ends”, Bloomberg Business, 19 December 2014.
30 Within manufacturing, basic metals and metal products were the largest industries in terms of FDI stock in 2013. However, these investments often represent round-tripping FDI undertaken by Russian investors. For example, the second largest Russian steel company, Evraz, is owned by offshore companies in which Russian investors have key interests (Kuznetsov, 2012).
31 “Ford bullish on Russia as it takes control of local JV”, http://europe.autonews.com/article/20150410/ANE/150419998/ford-bull ish-on-russia-as-it-takes-control-of-local-jv.
32 “PepsiCo and Coca-Cola close plants in Russia”, http://rbth.com/news/2015/03/04/pepsico_and_coca-cola_close_plants_in_russia_44207.html.
33 “Carlsberg Forced to Close 2 Russian Breweries”, The Moscow Times, 29 January 2015.
34 Australia, Bureau of Resources and Energy Economics. www.industry.gov.au. Projects at the “Committed Stage” have completed all commercial, engineering and environmental studies; received all required regulatory approvals; and finalized the financing for the project.
35 At the time of writing, apart from the United States and Japan, few other major investor countries had made available geographical breakdowns of 2014 FDI data.
36 For estimating geographical breakdowns of Japanese FDI, directional principle (BPM5) data are used for 2013 while the asset/liabilities principle data (BPM6) are used for 2014. For developing regions excluding offshore financial centres, the two methodologies should produce more or less the same data.
37 Primary income refers to investment income and compensation of employees earned abroad (receipts) or owed to foreign entities (payments). For the United States, investment income accounted for 99 per cent of primary income receipts and 97 per cent of primary income payments in 2014.
38 The category “other investment” includes currency and deposits, loans, trade credits, etc.
39 Total fixed investment is estimated by adding capital expenditures and R&D expenditures of United States parent companies.
40 Measured by number of vehicles. Data are from the Japan Automobile Manufacturers Association (www.jama.or.jp).
41 Due to the unavailability of FDI data for Tuvalu, this group is represented by three LDCs: Kiribati, Solomon Islands and Vanuatu.
42 “Qatar National Bank increases stake in African lender Ecobank”, 15 September 2014, Financial Times.
43 The transaction value was not available for the majority of these deals; thus, the total value of cross-border M&A sales in LDCs is likely to be higher.
44 An ultra-deep offshore oil development project, in which France’s Total (30 per cent) formed a joint venture with two local companies (50 per cent), ExxonMobil (15 per cent) from the United States and Galp Energia (5 per cent) from Portugal (“Angola: Total launches the development of Kaombo, an ultra-deep offshore project”, 14 April 2014, press release, www.total.com/en/media/news/press-releases/angola-total-launches-development-kaombo-ultra-deep-offshore-project?%FFbw=kludge1%FF). This is most likely a product-sharing contract; thus, no impact is expected on FDI inflows to Angola.
45 In 2013, announced greenfield investment in electricity and gas amounted to $18 billion, while primary sector investment was at $4 billion.
46 “Ethiopia: Indian firm to plant Africa’s largest cotton mill here”, 3 May 2014, allafrica.com.
47 “Ethiopia: Chinese textile giant eyes U.S. $500 million plant”, 6 September 2014, allafrica.com.
48 Throughout the period 2000–2013, crude petroleum accounted for almost 90 per cent of AGOA exports to the United States. Refined petroleum products contributed to the major part of growth in non-crude oil exports from AGOA to the United States in this period (USITC, 2014).
49 It comprises private and public entities from Myanmar (51 per cent); Japanese MNEs, including general trading companies Mitsui, Marubeni and Sumitomo (about 40 per cent); and the Japan International Cooperation Agency (about 10 per cent). Upon the completion of the first phase of development in 2016, this special economic zone is expected to create 50,000 jobs by hosting some 100 companies.
50 “After decades of decay, Myanmar bets on Thilawa to lead industrial boom”, 7 May 2015, www.reuters.com; “Eight companies set to begin operations in Thilawa SEZ”, 29 April 2015, The Myanmar Times.
51 For example, China has pledged $11 billion to develop the Trans-Asian Railway to connect the Greater Mekong Subregion, consisting of Cambodia, China, the Lao People’s Democratic Republic, Myanmar, Thailand and Viet Nam (“High-quality trains to speed up GMS connectivity”, 21 December 2014, news.xinhuanet.com). It has pledged an additional $1 billion for infrastructure development to improve inter-connectivity within the subregion (“Cambodia welcomes Chinese premier’s pledge of over 3 bln USD aid to GMS countries”, 20 December 2014, news.xinhuanet.com).
52 Based on exports accounting for 45 per cent of a country’s total exports of goods and services during

World Investment Report 2015: Reforming International Investment Governance98
2010–2012, LDCs are classified into six categories of export specialization: food and agricultural exporters, fuel exporters, manufactures exporters, mineral exporters, mixed exporters and services exporters (UNCTAD, 2014, p. xiii).
53 Investments by Jiangsu Lianfa Textile (China) in Ethiopia, and Weibo (China) in the former Yugoslav Republic of Macedonia, as well as Shrivallabh Pittie Group (India) in Ethiopia, were among the six largest projects by value, totalling $1.4 billion. Ethiopia also attracted other large greenfield investments in the textiles industry from India, Turkey, Pakistan and the Republic of Korea (see LDCs section).
54 Uzbekistan is not included in table II.15 because of a lack of reported bilateral FDI data; the analysis is based on announced greenfield and M&A deals only.
55 www. j ames town .o rg / s i ng l e / ? t x_ t t news%5Bt t _news%5D=42623&no_cache=1#.VWMhPE-qpBc.
56 Other investments have been more significant than portfolio investment but similarly erratic, increasing in value and share in recent years but recording a decline in 2014.
57 Vanuatu, Sao Tome and Principe, Samoa, Timor-Leste, Tonga, the Comoros, Palau, Kiribati.
58 In addition, there are “other” investment flows, which are even more volatile, especially for Caribbean SIDS.
REFERENCES
ADB and ADBI (2009). Infrastructure for a Seamless Asia. Tokyo: Asian Development Bank Institute.
Callen, T., R. Cherif, F. Hasanov, A. Hegazy and P. Khandelwal (2014). “Economic Diversification in the GCC: Past, Present, and Future”, IMF Staff Discussion Note, Institute for Capacity Development and Middle East and Central Asia Department, December. www.imf.org/external/pubs/ft/sdn/2014/sdn1412.pdf.
ECLAC (2015). First Forum of China and the Community of Latin American and Caribbean States (CELAC):
Exploring opportunities for cooperation on trade and investment, January. Santiago de Chile: United Nations.
Bapat, S., A. Chaturvedi, W. Drewery, F. Fei and E. Hepfer (2012). “Tamil Nadu Automotive Cluster”, Microeconomics of Competitiveness course, Harvard Business School, Spring. www.isc.hbs.edu/resources/courses/moc-course-at-harvard/Documents/pdf/student-projects/MOC%20Tamil%20Nadu%20Auto%20Cluster%20Final.pdf.
Bhasker, V. V. (2013). “Foreign Direct Investment (FDI) in Indian Automobile Industry: Impact on Employment Generation”, Research Journal of Management Sciences, 2(2): 14–22.
Bridgman, B. (2014). “Do intangible assets explain high U.S. foreign direct investment returns?”, Journal of
Macroeconomics, 40: 159–171, June.
Curcuru, S. E., C. P. Thomas and F. E. Warnock (2013). “On returns differentials”, Journal of International Money
and Finance, 36: 1–25, September.
Elson, A. (2006). “What Happened?”, Finance and Development, 43(2):37–40, June.
IMF (2014). Regional Economic Outlook: Middle East and Central Asia. Washington, D.C.: International Monetary Fund.
Krüger, R., and I. Strauss (2015). “Africa rising out of itself: the growth of intra-African FDI”, Columbia FDI Perspectives, 139(19), January. http://ccsi.columbia.edu/files/2013/10/No-139.Kr%C3%BCger-and-Strauss-FINAL.pdf
Kumaraswamy A., R. Mudambi, H. Saranga and A. Tripathy (2012). “Catch-up strategies in the Indian auto components industry: Domestic firms’ responses to market liberalization”, Journal of International Business
Studies, 43(4): 368–395.

CHAPTER II Regional Investment Trends 99
Kuznetsov (2012). “Inward FDI in Russia and its policy context, 2012”, Columbia FDI Profiles, Vale Columbia Center on Sustainable International Investment, July. http://ccsi.columbia.edu/files/2014/03/Profile-_Russia_IFDI_5_August_2012_-_FINAL.pdf.
Okada, A., and N.S. Siddharthan (2007). “Industrial Clusters in India: Evidence from Automobile Clusters in Chennai and the National Capital Region”, IDE-JETRO Discussion Papers, No. 103, April.
Singapore Human Resources Institute (2012). GCC Construction Sector Report, March.
UNCTAD (2011). Foreign Direct Investment in LDCs: Lessons Learned from the Decade 2001-2010 and the Way
Forward. New York and Geneva: United Nations.
UNCTAD (2014). The Least Developed Countries Report 2014 - Growth with Structural Transformation:
A Post-2015 Development Agenda. New York and Geneva: United Nations.
United Nations (2015). World Economic Situation and Prospects 2015. Update as of mid-2015. New York: United
Nations.
USITC (2014). “AGOA: Trade and Investment Performance Overview”, April. Washington D.C.: United States International Trade Commission. www.usitc.gov/publications/332/pub4461.pdf.
WEF (2013). Global Competitiveness Report 2013–2014. Geneva: World Economic Forum.
WIR12. World Investment Report 2012: Towards a New Generation of Investment Policies. New York and Geneva: United Nations
WIR13. World Investment Report 2013: Global Value Chains: Investment and Trade for Development. New York and Geneva: United Nations.
WIR14. World Investment Report 2014: Investing in the SDGs: An Action Plan. New York and Geneva: United Nations.
World Bank (2014). World Development Indicators, Washington, D.C.: World Bank.
World Bank (2015). “The Dawn of a New Economic Era?”, Russia Economic Report, No. 33, April. Washington, D.C.: World Bank.


Recent PolicyDevelopments
and Key IssuesC H A P T E R I I I

World Investment Report 2015: Reforming International Investment Governance102
1. Overall trends
Countries’ investment policy measures continue
to be predominantly directed towards investment
liberalization, promotion and facilitation. Measures
geared towards investment in sectors important for
sustainable development are still relatively few.
In 2014, according to UNCTAD’s count, 37 countries and economies adopted 63 policy measures affecting foreign investment. Of these measures, 47 related to liberalization, promotion and facilitation of investment, while 9 introduced new restrictions or regulations on investment (table III.1). The share of liberalization and promotion increased significantly, from 73 per cent in 2013 to 84 per cent in 2014 (figure III.1).1
a. Investment promotion and facilitation predominant – focus on legal and institutional improvement
A number of countries introduced or amended their investment laws or guidelines to grant new investment incentives or to facilitate investment procedures. Algeria reorganized the institutional framework for the mining sector. Argentina improved investment conditions for the hydrocarbon industry by amending the Federal Hydrocarbons Law. The Plurinational State of Bolivia introduced an investment promotion law (Ley de Promoción de Inversiones) which, inter alia, provides that the State may offer general and specific incentives. China introduced new rules on the administration of China’s Outward Direct Investment. Henceforth, only
outward direct investment in countries or regions and industries identified as “sensitive” require the approval of the Ministry of Commerce (MOFCOM). Outward direct investment in all other countries or regions and industries only need to be registered with MOFCOM. Cuba approved a new law on foreign investment offering guarantees and incentives to investors and simplifying investment approval procedures. Ethiopia established an Investment Board and Investment Commission. Kazakhstan introduced “Rules of Granting Investment Subsidies”, describing the procedures in detail. South Africa approved guidelines for the new Medium and Heavy Commercial
A. NATIONAL INVESTMENT POLICIES
Item 2000 2001 2002 2003 2004 2005 2006 2007 2008 2009 2010 2011 2012 2013 2014Number of countries that introduced changes
46 52 44 60 80 78 71 50 41 47 55 49 54 59 37
Number of regulatory changes 81 97 94 125 164 144 126 79 68 88 121 80 86 87 63
Liberalization/Promotion 75 85 79 113 142 118 104 58 51 61 80 59 61 61 47
Restriction/Regulation 5 2 12 12 20 25 22 19 15 23 37 20 20 23 9
Neutral/Indeterminatea 1 10 3 - 2 1 - 2 2 4 4 1 5 3 7
Source: UNCTAD, Investment Policy Monitor database.a In some cases, the expected impact of the policy measures on the investment is undetermined.
Table III.1. Changes in national investment policies, 2000–2014 (Number of measures)
Source: UNCTAD, Investment Policy Monitor.
0
25
50
75
100
2000 2002 2004 2006 2008 2010 2012 2014
6
94 84
16
Liberalization/Promotion Restriction/Regulation
Figure III.1.Changes in national investment policies,2000−2014 (Per cent)

CHAPTER III Recent policy developments and key issues 103
Vehicles Automotive Investment Scheme, providing
a non-taxable cash grant of various degrees to
qualifying investments in productive assets. The United
Arab Emirates established the Dubai Investment
Development Agency, providing a strategic plan and
incentives for the attraction of investment. Uzbekistan
signed a law amending foreign investment regulations.
Changes include the introduction of a one-stop shop for
foreign businesses, the easing of migration regulations
for foreign investors, a guarantee of investors’ rights to
repatriate funds and a pledge of stable tax legislation
and customs tariffs for foreign investors for a decade
after a firm is registered. Viet Nam revised the Law on
Investment which defines in detail the terms “foreign
investor” and “foreign invested enterprise”, streamlines
registration procedures, reduces the mergers and
acquisitions (M&A) transaction period and decreases
the number of prohibited and conditional business
lines. Viet Nam also revised the Law on Enterprises
which, inter alia, simplifies the procedures for business
registration, shortens the time frame to issue an
Enterprise Registration Certification, and limits the
time frame for capital contribution to 90 days.
Some countries introduced special economic zones
(SEZs) or revised polices related to existing SEZs.
Ethiopia extended various kinds of incentives for
investment in industrial development zones and in
manufacturing and agriculture. The Republic of Korea
halved the minimum “foreign investment amount”
and “factory construction area ratio” applied to
foreign investors in “complex-type foreign investment
areas”. Mozambique approved the Mocuba Special
Economic Zone in the Lugela District, which will be
used for establishing agro-processing-driven industries
in particular. South Africa introduced a “Special
Economic Zone Act” providing for the designation,
promotion, development, operation and management
of SEZs.
As regards the general business environment, several
countries reformed their tax systems. For instance, the
Russian Federation amended its tax code, providing
more favourable tax treatment in priority territories for
social and economic development, and Saudi Arabia
revised its income tax law, repealing joint tax liabilities
of companies on capital gains. In terms of corporate
income tax levels, a survey of 32 countries shows
that 6 countries announced decreases in headline
corporate income tax rates for 2014.
b. FDI liberalization ongoing – most active in Asian emerging economies
Several countries liberalized entry and establishment
conditions for foreign investors. In most cases, they
relaxed restrictions on foreign ownership limitations or
opened up new business activities to foreign investment.
As in previous years, countries in Asia were most active,
in particular China, India and Indonesia – the three largest
emerging economies in Asia. India liberalized foreign
investment in railway infrastructure that was hitherto
closed to FDI and raised the FDI cap in the defence sector
from 26 per cent to 49 per cent. Indonesia increased the
foreign investment cap in several industries, including
for pharmaceuticals to 85 per cent from 75 per cent, for
venture capital operations to 85 per cent from 80 per
cent and for power plant projects carried out as public-
private partnerships to 100 per cent from 95 per cent.
Kuwait approved new rules permitting foreign banks to
open multiple bank branches in the country. Myanmar
removed 11 items from the prohibited list for foreign
investors. These items are related to jade and gemstone
prospecting, exploration and production; small- and
medium-scale mineral production; and distribution of
newspapers, magazines and journals in Burmese and
other national ethnic languages.
Australia eased some foreign ownership restrictions on
the Australian flag carrier Qantas. Ethiopia opened the
electricity generation and distribution sector to private
investors. Mexico established the regulatory framework
for the participation of FDI up to 100 per cent in
telecommunications and satellite communications, and
up to 49 per cent in the broadcasting sector, subject
to reciprocity from the country of the ultimate investor.
In 2015, Canada amended the Investment Canada
Regulations. The amendments change how the value
of an acquisition of a Canadian enterprise is assessed
for acquisitions or sale by private investors from
WTO countries; they gradually raise the threshold
that triggers a review under the Investment Canada
Act for acquisitions by foreign private investors.
China revised its “Catalogue for the Guidance of Foreign
Investment Industries”. It stipulates in which industry
sectors foreign investment is “encouraged”, “restricted”
or “prohibited”. Compared with its predecessor, the
revised catalogue lifts restrictions on foreign inward
investment by reclassifying individual sectors, in
particular in the manufacturing sector. India raised the

World Investment Report 2015: Reforming International Investment Governance104
ceiling for foreign investment in insurance from 26 per
cent to 49 per cent and authorised foreign investment
in pension funds up to an ownership ceiling of 49 per
cent. FDI up to 26 per cent is allowed in pension
funds under the automatic route. Also, FDI in medical
devices is now exempt from the rules applicable to
the pharmaceutical industry, and 100 per cent FDI is
permitted under the automatic route.
In addition to liberalizing investment, numerous
countries improved business licensing conditions.
For instance, China amended the Company Law. It
applies to Chinese joint ventures with foreign investors.
It removes the requirement that the contribution
in cash by all shareholders be not less than 30 per
cent of the registered capital of the company. Côte
d’Ivoire adopted a new mining code which extends
the permit holding period from 7 years to 10 years,
with the possibility of prolonging the period by a
further two years. Mozambique amended a law that
allows the government to issue new gas and oil
exploration licenses. Myanmar finalized the granting
of telecommunications licenses to Telenor Myanmar
and Ooredoo. Rwanda amended a law providing for a
broader variety in the duration of mining licenses. Viet
Nam permitted wholly foreign-invested enterprises to
provide almost all types of logistical services in the
country, subject to proper licensing.
Another important feature of investment liberalization
in 2014 was privatization. Cyprus passed a new
law on the privatization of semi-governmental
organizations. Serbia adopted a Law on Privatization,
setting the formal and institutional conditions for the
continuation and completion of the restructuring and
privatization process. Turkmenistan signed into law
a bill titled “Denationalization and Privatization of
State Property” which outlines the basic principles
of denationalization (i.e. the transformation of State
firms into joint-stock companies in which the State is
a partner) and privatization (i.e. the transfer to private
individuals of property rights in State assets in return
for payment).
c. Some new investment restrictions or regulations – mainly on national security grounds and for strategic sectors
Some countries introduced new investment restric-
tions or regulations. They related mainly to national
security considerations, strategic sectors and land
ownership.
France extended the coverage of the review
mechanism for inward foreign investment to six
additional activities: (i) energy supply (electricity, gas,
hydrocarbons or other sources of energy), (ii) water
supply, (iii) transport networks and services, (iv)
electronic communications networks and services, (v)
operations of buildings and installations for defence
reasons and (vi) protection of public health. It applies
to safeguarding national interests in public order,
public security and national defence. Italy established
procedures for the exercise of special powers by the
government in connection with investments in the
defence and national security sector, as part of a
security-related investment review mechanism created
in 2012. Indonesia reduced the foreign ownership
ceiling in several industries. For example, onshore
oil production facilities which foreign investors could
own up to 95 per cent are no longer open to foreign
investment and the foreign ownership ceiling for data
communications system services was reduced from
95 per cent to 49 per cent. The Russian Federation
extended coverage of its review mechanism to the
transport sector and related services. The review
mechanism applies to investments in business
entities of strategic importance for national defence
and state security. The country also amended the
Federal Law on Foreign Investment in Commercial
Entities with Strategic Importance for National
Defence and National Security; it now covers
acquisitions of property classified as fixed production
assets in “strategic companies” if the value of these
assets exceeds 25 per cent of the total value of the
company’s assets.
In 2015, Canada amended its National Security
Review of Investment Regulations to provide the
government with the flexibility to extend time periods
for the review of investments that could be injurious to
national security.
Fiji amended the Land Sales Act to prevent any land
within town boundaries from being sold to foreigners
for residential purposes. It also requires foreigners who
already own undeveloped land to build a house within
two years. Seychelles discontinued the sale of state
land to non-Seychellois.

CHAPTER III Recent policy developments and key issues 105
d. Developments regarding investment for sustainable development
More private investor involvement in sectors and industries related to sustainable development is crucial to achieve the Sustainable Development Goals (SDGs) (WIR14). Private investment can play an important role in infrastructure development, health, education and climate change mitigation activities. This section provides a brief overview of recent investment policy developments in these areas, covering the period from 2010 to 2014.
Thirty-two countries undertook 45 investment policy measures in one or several of the above-mentioned sectors or activities between 2010 and 2014. The share of such policy measures among all reported investment policy measures during this period is small – only approximately 8 per cent. Liberalization or promotion measures accounted for about three quarters, i.e. in their majority countries aimed to attract more private investment into SDG sectors.
By region, investment policy measures related to SDG sectors were reported mainly for countries in Asia, followed by countries in Latin America (figure III.2). Interestingly, all reported measures from Asian countries aim at improving entry conditions and facilitating foreign investment. For instance, India permitted foreign investment in diverse industries including railways, health and medical services. Another example is Indonesia, which liberalized the construction sector, health services and electricity generation.
By sector, investment policy measures related to infrastructure development (including roads, ports, airports, energy generation and distribution, water supply and sanitation) dominated (53 per cent). For example, numerous countries liberalized or facilitated private investment in energy generation and distribution as well as water supply. As shown in figure III.3, investment policies related to education came next (17 per cent). Investment measures related to health services were less prominent. For example, China allowed foreign investors to own hospitals in several regions as part of a pilot test, and the Russian Federation exempted education and health care services from the corporate profit tax.
Overall, countries appear to have paid little attention so far to the importance of channelling investment into sectors that are particularly important for sustainable development, and more pro-active policy measures are needed to increase investment flows into these sectors. At the same time, it is important to keep in mind that liberalization and promotion policies related to investment in sectors related to sustainable development do not in themselves guarantee a positive development impact of the investment. It is equally important that host countries have in place a sound regulatory framework that seeks to maximize positive development impacts of investment and to minimize associated risks by safeguarding public interests in these politically sensitive sectors. This implies, in particular, balancing the need for attractive risk-return rates for investors with the need for accessible and affordable services (see WIR14).
Europe Latin America
and Caribbean
Other
AfricaAsia
25
4
2029
22
Figure III.2.SDG-related investment policy measures by region, 2010–2014 (Per cent)
Infrastructure
Education
Health
Climatechange
Other
53
512
13
17
Figure III.3.SDG-related investment policy measures by sector, 2010–2014 (Per cent)
Source: UNCTAD, Investment Policy Monitor. Source: UNCTAD, Investment Policy Monitor.

World Investment Report 2015: Reforming International Investment Governance106
B. INTERNATIONAL INVESTMENT POLICIES
1. Trends in the conclusion of IIAs
The expansion of the IIA universe continues, with
intensified efforts at the regional level.
a. Overall trends
The conclusion in 2014 of 31 international investment agreements (IIAs) – 18 bilateral investment treaties (BITs) and 13 “other IIAs”2 - brought the total number of IIAs to 3,271 (2,926 BITs and 345 “other IIAs”) by year-end (figure III.4). Between January and April 2015, five more treaties (of which three were BITs) were added. Most active in concluding IIAs in 2014 were Canada with seven and Colombia, Côte d’Ivoire and the European Union (EU) with three each. Overall, the annual number of “other IIAs” has remained stable over the past few years, while the annual number of BITs continues to decline (see annex).
“Other IIAs” signed between January 2014 and April 2015 can be grouped into the three broad categories identified in WIR12:
• Eight agreements with BIT-equivalent provisions. The Australia–Japan EPA, the Australia–Republic of Korea FTA, the Canada–Republic of Korea FTA, the Japan–Mongolia EPA, the Mexico-Panama FTA, the Additional Protocol to the Framework Agreement of the Pacific Alliance (between Chile, Colombia, Mexico and Peru), the Treaty on the Eurasian Economic Union (between Armenia, Belarus, Kazakhstan and the Russian Federation) and the Agreement on Investment under the Framework Agreement on Comprehensive Economic Cooperation between ASEAN and India fall in the category of IIAs that contain obligations commonly found in BITs, including substantive standards of investment protection and investor-State dispute settlement (ISDS). It should be noted that the Australia–Japan EPA does not provide for ISDS.
• Five agreements with limited investment provisions. The EU–Georgia Association Agreement, the EU–Moldova Association Agreement and the
Figure III.4. Trends in IIAs signed, 1980−2014
Annual “other IIAs” All IIAs cumulativeAnnual BITs
0
500
1000
1500
2000
2500
3000
3500
0
50
100
150
200
250
300
350
1980 1982 1984 1986 1988 1990 1992 1994 1996 1998 2000 2002 2004 2006 2008 2010 2012 2014
Cumulative number of IIAs
Annual number of IIAs
Source: UNCTAD, IIA database.

CHAPTER III Recent policy developments and key issues 107
EU–Ukraine Association Agreement fall in the
category of agreements that provide limited
investment-related provisions (e.g. national
treatment with respect to commercial presence
or free movement of capital relating to direct
investments). Also, the Cooperation and
Facilitation Investment Agreements (CFIAs) signed
by Brazil with Angola and Mozambique in 2015
(based on Brazil’s new model – see below) belong
to this category, as they emphasize investment
promotion and facilitation while containing also
a number of investment protection provisions –
although no ISDS clause.
• Two agreements with investment cooperation
provisions and/or a future negotiating mandate.
The ECOWAS–United States Trade and
Investment Framework Agreement (TIFA), and the
Malaysia–Turkey FTA contain general provisions
on cooperation in investment matters and/or a
mandate for future negotiations on investment.
In 2014, 84 double taxation treaties (DTTs) were
concluded. These treaties govern the fiscal treatment
of cross-border investment operations between host
and home States. The network of DTTs and BITs grew
together, and there are now over 3,000 DTTs in force
worldwide.3 In fact, two thirds of BIT relationships are
also covered by a DTT (and half of DTT relationships
are also covered by a BIT). Where two countries have
both BITs and DTTs, in a quarter of cases they were
signed in the same year, and in more than a third
of cases within two years. DTTs have a separate
settlement mechanism for disputes between investors
and both home and host States (the mutual agreement
procedure or MAP), which is generally considered
weaker than the dispute settlement system for BITs. In
some tax-related disputes, investors have resorted to
BITs (e.g. Vodafone v. India).
b. IIA-related developments in 2014–2015
Several other developments beyond treaty-making left
their mark on the IIA universe:
• Negotiations on megaregional agreements
continued, involving close to 90 countries
(WIR14). The ninth negotiating round of the
TTIP took place in New York (20–24 April 2015).
For the TPP negotiations, a series of meetings
of chief negotiators and trade ministers took
place pursuant to the 19th round of negotiations
that was held in Brunei (22–30 August 2013).
The most recent TPP officials’ meeting took place
in Maryland, United States, from 23 to 26 April
2015. With regard to RCEP, the seventh round of
negotiations took place in Thailand in February
2015, with investment discussions focusing on
the approach to the scheduling of commitments.
Concerning PACER, Fiji accepted the May 2014
Pacific Islands Forum Leaders’ invitation to
participate in the PACER Plus negotiations. The
tenth inter-sessional negotiating meeting took place
in Port Vila, Vanuatu (5–7 May 2015); parties intend
to conclude the negotiations by July 2016. The third
meeting of the COMESA–EAC–SADC Tripartite
Technical Committee on movement of business
persons was held in Mauritius (3–6 November 2014).
The second phase of the Tripartite negotiations,
scheduled for the second half of 2015, will focus on
investment, trade in services, intellectual property
rights, competition policy and consumer protection.
The trilateral FTA is expected to be launched during the
Third Tripartite Summit to be held in Egypt in
June 2015.
• In January 2015, Italy gave official notice to the
Energy Charter Treaty of its intent to withdraw from
the treaty (the withdrawal will take effect in January
2016, but the treaty will apply for another 20
years to investments made before or at the day of
withdrawal).
• In October 2014, African independent legal experts
met in Djibouti to discuss and review the draft Pan
African Investment Code (PAIC). This follows the
2008 African Union (AU) Commission mandate
to “develop a comprehensive investment code
for Africa with a view to promoting private sector
participation”.
• At the 26th session of the UN Human Rights
Council, held in Geneva 9–27 June 2014, a
resolution drafted by Ecuador and South Africa
and signed by Bolivia, Cuba and the Bolivarian
Republic of Venezuela – and supported by 20
countries4 – called for the Council “to establish
an open-ended intergovernmental working group
with the mandate to elaborate an international
legally binding instrument on Transnational
Corporations and Other Business Enterprises
with respect to human rights”. The Human Rights

World Investment Report 2015: Reforming International Investment Governance108
Council adopted the resolution (by majority) on 26 June 2014 and decided that the working group should hold its first session in 2015.
• In May 2014, Ecuador, the Dominican Republic and the Bolivarian Republic of Venezuela presented a proposal to establish a Southern Observatory for investment assistance. The observatory’s envisaged activities include to report periodically on the state of international investment disputes; identify procedures to monitor the action of international arbitration tribunals in investment; analyse and propose mechanisms to reform such arbitration proceedings; and promote the creation of mechanisms for coordination and mutual consultation between the judicial systems of Latin American countries to ensure the validity of national decisions on disputes between States and MNEs.
c. Countries and regions search for IIA reform
An increasing number of countries are reviewing their model IIAs in line with recent developments in international investment law. At least 50 countries or regions are currently revising or have recently revised their model IIAs. This trend is not limited to a specific group of countries or regions but includes at least 12 African countries, 10 countries from Europe and North America, 8 Latin American countries, 7 Asian countries and 6 economies in transition. In addition, at least 4 regional organizations have reviewed or are reviewing their models. Three new approaches (by Brazil, India and Indonesia) were revealed at the UNCTAD expert meeting on the Transformation of the IIA Regime, held in February 2015.5 In May 2015, the European Commission published a concept paper on “Investment in TTIP and beyond – the path for reform”, the German Federal Ministry for Economic Affairs and Energy published a suggestion for a model investment protection treaty for developed countries, and Norway put forward a new draft model BIT for public consultation.
• Brazil’s model CFIA has been developed on the basis of extensive domestic consultations, including with the private sector, and the experience of other countries and international organizations.6 The model’s objectives of
promoting cooperation between the parties and
facilitating and encouraging mutual investments
are pursued through three main features: (i)
the improvement of institutional governance,
with the establishment of Focal Points and
of a Joint Committee; (ii) the identification of
ongoing agendas for investment cooperation and
facilitation; and (iii) the creation of mechanisms
for risk mitigation and dispute prevention. Focal
Points (ombudsmen) act as intermediaries
between investors and host States in order to
solve problems related to investments and suggest
improvements in the business environment.
As such, they also act to prevent disputes and
facilitate their resolution. The Joint Committee,
made up of government representatives from
both parties, shares information on investment
opportunities in the two contracting parties,
monitors the implementation of the agreement
and solves possible disagreements in an amicable
manner. The private sector can participate in
Joint Committee hearings and ad hoc working
groups. The CFIA also focuses on specific
thematic agendas as a way of encouraging and
promoting a business-friendly environment.
This includes cooperation on business visas,
corporate social responsibility (CSR), transfer of
funds and transparency of procedures. In addition
to these new features, the model includes
substantive provisions dealing with expropriation,
national treatment (subject to the applicable law)
and most-favoured-nation (MFN) treatment,
compensation for losses, and transparency. The
model also includes a compulsory mechanism
for dispute prevention prior to the establishment
of a State-State arbitration procedure.
• The European Commission proposed new
approaches to key IIA provisions related
to the right to regulate and ISDS in its
concept paper on “Investment in TTIP and
beyond – the path for reform”, launched in
May 2015 (European Commission, 2015).
The paper recognizes the achievements of
the concluded negotiations with Canada and
Singapore and addresses issues that could be
further explored, as a result of the TTIP public
consultations. Four areas are identified for such
further improvement: (i) the protection of the right
to regulate, (ii) the establishment and functioning of

CHAPTER III Recent policy developments and key issues 109
arbitral tribunals, (iii) the review of ISDS decisions
by an appellate body, and (iv) the relationship
between domestic judicial systems and ISDS.
Concretely, some of the notable suggestions
concern the host State’s right to regulate in the
public interest; the paper suggests the inclusion
of a treaty article expressly recognizing the right
of States to take measures in pursuance of
legitimate public policy objectives according to
the level of protection they deem appropriate.
For ISDS, the Commission’s paper elaborates
on arbitrator selection and qualifications, third-
party submissions, and the establishment of a
permanent bilateral appeals mechanism. The
latter would review awards with respect to errors
of law and manifest errors in the assessment of
facts. The concept paper advances the idea that
it could be modelled in good part on the basis
of the WTO Appellate Body’s institutional set-
up. Finally, the proposal envisions the eventual
creation of a permanent court and its possible
multilateralization (European Commission, 2015).
• The German Federal Ministry for Economic
Affairs and Energy made public in May 2015
a memorandum (“Gutachten”) on a model BIT
for developed countries with a functioning legal
system (BMWi, 2015). The model agreement
addresses reform issues that arose during the
TTIP consultation process. It intends to safeguard
the State’s right to regulate through public policy
exceptions and provide options for conferring
on foreign investors rights no greater than those
enjoyed by domestic investors. For this reason, the
model agreement circumscribes and clarifies the
content of the fair and equitable treatment (FET)
and of the expropriation standard with greater
precision than the CETA draft. Notably, the model
suggests the introduction of a new investment
protection mechanism: a bilateral tribunal or court
would be created for each specific treaty (e.g. EU-
US Permanent Investment Tribunal) with judges
pre-selected by the parties to the agreement and
individual cases being assigned to the judges by
abstract rules. The parties to the dispute would
not have any influence on the composition of the
panel of judges. This first instance would have
exclusive jurisdiction to hear investment disputes
arising under the agreement.
The proposed tribunal mechanism is complimented by a standing appellate body. This appellate body would as a second instance “undertake comprehensive scrutiny of the law and restricted scrutiny of the facts” in respect of the awards rendered by the first instance. Submission of a claim by an investor is subject to the exhaustion of domestic remedies, unless such remedies are unavailable or manifestly ineffective. An alternative suggestion conditions initiation of proceedings to the investor’s waiver of any rights to start proceedings under national courts or tribunals.
• India made available its new draft model BIT for public comments, although the review process is not yet complete.7 The new model includes several innovative provisions: a detailed clarification of what is meant by “real and substantial business operations” under the definition of the term “enterprise”; a careful definition of the scope of the treaty; a national treatment provision applicable to investments in “like circumstances”; a new approach to the equitable treatment that lists State obligations, including a prohibition on the denial of justice, the duty to afford due process and the requirement to refrain from manifestly abusive treatment involving continuous, unjustified and outrageous coercion or harassment (without explicitly including a FET clause); a test for determining whether indirect expropriation occurred; and a free transfer of funds clause, subject to a detailed list of exceptions. It does not include an MFN clause. The model also includes provisions on investor obligations. It further contains a detailed investor-State dispute mechanism that provides for, among other matters, strict time frames for the submission of a dispute to arbitration, the selection of arbitrators and the prevention of conflict of interest. The model stipulates that investors must first submit their claim before the relevant domestic courts or administrative bodies for the purpose of pursuing domestic remedies, where available. If after exhausting all judicial and administrative remedies no resolution has been satisfactory to the investor within three years, the investor may commence a proceeding under the ISDS article by transmitting a notice of dispute to the respondent party.
• Indonesia has embarked on reforming its IIA policy on several fronts. The country has

World Investment Report 2015: Reforming International Investment Governance110
initiated the termination of its BITs, while
developing a new model BIT for (re)negotiation.
The new model BIT will consider the exclusion
of portfolio investment from the definition of
investment and will add a contribution to economic
development requirement in its definition clauses.
National treatment will be subject to exceptions
related to special treatment in favour of domestic
small and medium enterprises and investments
and measures affecting natural resources.
The new model will also clarify in greater detail the
scope of the FET standard and will provide a list
of State obligations including a prohibition against
denial of justice in criminal, civil or administrative
proceedings and assurance of police protection
from any physical harm. Finally, investor-State
arbitration will be subject to host country consent.
An investor may submit a case to international
arbitration if the host country provides a specific
consent letter.
• Norway developed a new draft model BIT and
opened a public consultation in May 2015.8 The
draft model circumscribes indirect expropriation,
which may be found “[i]n rare circumstances”, by
offering a list of elements that need to be taken into
account in order to determine whether such an
expropriation has taken place, e.g. the economic
impact and duration of the measure and whether
it interferes with “reasonable, investment-backed
expectations” of investors. It contains exceptions
relating to essential security interests, cultural
policy, prudential regulation and taxation. The draft
model BIT also establishes a joint committee that
is tasked, among other things, with supervising
the implementation of the agreement, attempting
to resolve disputes regarding the interpretation
of the agreement, working to remove barriers
to investment, amending the agreement when
necessary, and potentially adopting codes of
conduct for arbitrators.
These new approaches converge in their attempt to
modernize IIAs and further improve their sustainable
development dimension. UNCTAD’s Investment Policy
Framework, which represents a new generation of
investment policies, has been widely used as a main
reference in the above processes.
At the same time, countries continued to terminate
their BITs. South Africa terminated its BITs with
Austria, Denmark and Germany, and discussions are
ongoing with regard to new impending terminations
of BITs. Indonesia discontinued 18 of its 64 BITs.9
Both countries are in the process of formulating a
new strategy for international investment policies.
Botswana and Namibia are currently reconsidering
their approaches to BITs.
2. Content of new IIAs
A small but growing number of IIAs include pre-
establishment commitments; new treaties include
provisions safeguarding the right to regulate for
sustainable development objectives.
a. Pre-establishment IIAs are on the rise
In recent years, an increasing number of IIAs
has included pre-establishment commitments,
extending national treatment and MFN obligations
to the “establishment, acquisition and expansion” of
investments. By the end of 2014, pre-establishment
IIAs totalled 228 (125 “other IIAs” and 103 BITs) (figure
III.5), most of which involved developed economies, in
particular the United States, Canada, Finland, Japan,
and the EU (figure III.6). Taken together, these economies
are party to 70 per cent of all pre-establishment IIAs
signed worldwide. Also, a few developing countries
in Asia and Latin America have also been actively
concluding pre-establishment IIAs; they include Chile,
Costa Rica, the Republic of Korea, Peru and Singapore.
Pre-establishment commitments in these IIAs use
either a positive or a negative list approach. In addition,
some treaties include a “market access” clause which
prohibits certain non-discriminatory practices that
can inhibit the right of establishment. The positive list
approach offers selective liberalization by drawing
up a list of industries in which investors enjoy pre-
establishment rights, i.e. listing the industries or sectors
where liberalization commitments are undertaken.
The negative list approach offers liberalization across
the board with the exception of those industries and
sectors that are specifically listed, i.e. for which no
liberalization commitments are made. In treaty practice
to date, the negative list approach has been prevalent
under both approaches, treaty obligations that are
given a pre-establishment dimension (i.e. that apply
to “establishment, acquisition and expansion” of
investments) usually include national treatment, MFN
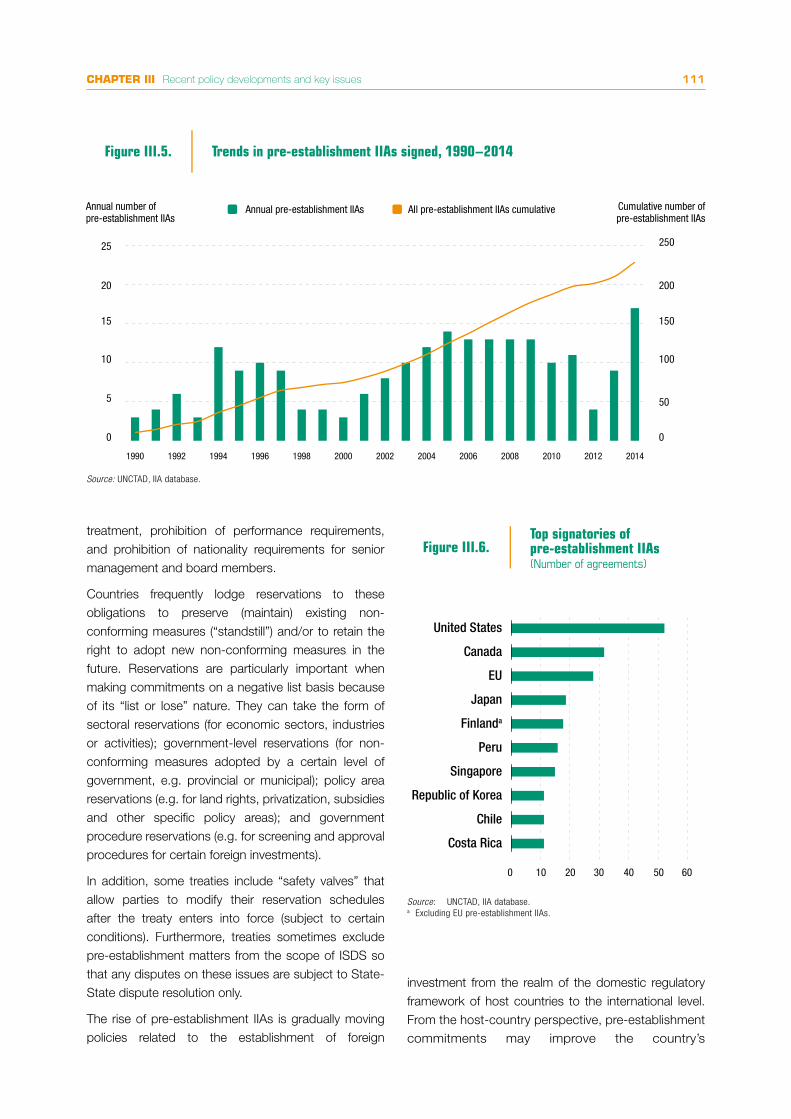
CHAPTER III Recent policy developments and key issues 111
treatment, prohibition of performance requirements, and prohibition of nationality requirements for senior management and board members.
Countries frequently lodge reservations to these obligations to preserve (maintain) existing non-conforming measures (“standstill”) and/or to retain the right to adopt new non-conforming measures in the future. Reservations are particularly important when making commitments on a negative list basis because of its “list or lose” nature. They can take the form of sectoral reservations (for economic sectors, industries or activities); government-level reservations (for non-conforming measures adopted by a certain level of government, e.g. provincial or municipal); policy area reservations (e.g. for land rights, privatization, subsidies and other specific policy areas); and government procedure reservations (e.g. for screening and approval procedures for certain foreign investments).
In addition, some treaties include “safety valves” that allow parties to modify their reservation schedules after the treaty enters into force (subject to certain conditions). Furthermore, treaties sometimes exclude pre-establishment matters from the scope of ISDS so that any disputes on these issues are subject to State-State dispute resolution only.
The rise of pre-establishment IIAs is gradually moving policies related to the establishment of foreign
investment from the realm of the domestic regulatory framework of host countries to the international level. From the host-country perspective, pre-establishment commitments may improve the country’s
0
50
100
150
200
250
0
5
10
15
20
25
1990 1992 1994 1996 1998 2000 2002 2004 2006 2008 2010 2012 2014
Cumulative number ofpre-establishment IIAs
Annual number of pre-establishment IIAs
Annual pre-establishment IIAs All pre-establishment IIAs cumulative
Figure III.5. Trends in pre-establishment IIAs signed, 1990−2014
Source: UNCTAD, IIA database.
Figure III.6.Top signatories of pre-establishment IIAs(Number of agreements)
Costa Rica
Chile
Republic of Korea
Singapore
Peru
Finlanda
Japan
EU
Canada
United States
0 10 20 30 40 50 60
Source: UNCTAD, IIA database.a Excluding EU pre-establishment IIAs.

World Investment Report 2015: Reforming International Investment Governance112
attractiveness as an investment destination, while
from the home-country perspective, they help to “lock
in” the existing level of openness, make the regulatory
environment more transparent and, in some instances,
open new investment opportunities. At the same time,
making pre-establishment commitments requires a
sophisticated domestic regulatory regime as well as
sufficient institutional capacity to conduct a thorough
audit of existing domestic policies and to consider
possible future regulatory needs.
b. Provisions safeguarding the right to regulate for sustainable development objectives continue to be included
A review of 18 IIAs concluded in 2014 for which texts
are available (11 BITs and 7 “other IIAs”) shows that
most of the treaties include provisions safeguarding the
right to regulate for sustainable development objectives,
such as those identified in UNCTAD’s Investment Policy
Framework for Sustainable Development (IPFSD)
(table III.2). Of these agreements, 14 have general
exceptions – for example, for the protection of human,
animal or plant life or health, or the conservation of
exhaustible natural resources. Another 14 treaties
contain a clause that explicitly recognizes that the
parties should not relax health, safety or environmental
standards in order to attract investment. Twelve treaties
refer to the protection of health and safety, labour rights,
the environment or sustainable development in their
preambles.
These sustainable development features are
supplemented by treaty elements that aim more broadly
at preserving regulatory space for public policies of host
countries and/or at minimizing exposure to investment
arbitration. These elements include clauses that (i) limit
treaty scope (for example, by excluding certain types
of assets from the definition of investment); (ii) clarify
obligations (for example, by including more detailed
clauses on FET and/or indirect expropriation); (iii) contain
exceptions to transfer-of-funds obligations or carveouts
for prudential measures; and (iv) carefully regulate
ISDS (for example, by limiting treaty provisions that are
subject to ISDS, excluding certain policy areas from
ISDS, setting out a special mechanism for taxation and
prudential measures, and/or restricting the allotted time
period within which claims can be submitted). Notably,
all but one of the treaties concluded in 2014 that were
reviewed omit the so-called umbrella clause.
The inclusion of provisions safeguarding the right
to regulate for sustainable development objectives
does not translate to a reduced level of investment
protection. Most of the IIAs signed in 2014 also
included high investment protection standards.
3. Investment dispute settlement
There were fewer new ISDS cases, with a continued
high share of cases against developed States.
a. Latest trends in ISDS
In 2014, investors initiated 42 known ISDS cases
pursuant to IIAs (UNCTAD, 2015). This is lower than the
record high numbers of new claims in 2013 (59 cases)
and 2012 (54 cases) and closer to the annual averages
observed in the period between 2003 and 2011. As
most IIAs allow for fully confidential arbitration, the actual
number is likely to be higher.
Last year’s developments brought the overall number
of known ISDS claims to 608 (figure III.7). Ninety-nine
governments around the world have been respondents
to one or more known ISDS claims.
• Respondent States. The relative share of cases
against developed States is on the rise. In 2014,
40 per cent of all cases were brought against
developed countries. In total, 32 countries faced
new claims last year. The most frequent respondent
was Spain (5 cases), followed by Costa Rica, the
Czech Republic, India, Romania, Ukraine and the
Bolivarian Republic of Venezuela (2 cases each).
Three countries – Italy, Mozambique and Sudan –
faced their first (known) ISDS claims in history.
Overall, Argentina, the Bolivarian Republic of
Venezuela and the Czech Republic have faced the
most cases to date (figure III.8).
• Home country of investor. Of the 42 known new
cases in 2014, 35 were brought by investors
from developed countries and 5 were brought
by investors from developing countries. In
two cases the nationality of the claimants is
unknown. The most frequent home States were
the Netherlands (with 7 cases brought by Dutch
investors), followed by the United Kingdom
and the United States (5 each), France (4),
Canada (3) and Belgium, Cyprus and Spain (2 each).
This corresponds to the historical trend in

CHAPTER III Recent policy developments and key issues 113
Policy Objectives
Selected aspects of IIAs
Sustainable development enhancing features
Focus on investments conducive to developm
ent
Preserve the right to regulate in the public interest
Avoid overexposure to litigation
Stimulate responsible business practices
Mexico–Panam
a FTA
Israel–Myanm
ar BIT
Treaty on Eurasian Economic Union
Japan–Kazakhstan BIT
Egypt–Mauritius BIT
Colombia–Turkey BIT
Colombia–France BIT
Canada–Serbia BIT
Canada–Senegal BIT
Canada–Nigeria BIT
Canada–Mali BIT
Canada–Republic of Korea FTA
Canada–Côte d’Ivoire BIT
Canada–Cameroon BIT
Australia–Republic of Korea FTA
Australia–Japan EPA
ASEAN–India Investment Agreem
ent
Additional Protocol to the Framew
ork Agreement of the Pacific Alliance
References to the protection of health and safety, labour rights, environment or sustainable development in the treaty preamble
X X X X X X X X X X X X X X X X
Refined definition of investment (reference to characteristics of investment; exclusion of portfolio investment, sovereign debt obligations or claims of money arising solely from commercial contracts)
X X X X X X X X X X X X X X X X X X
A carve-out for prudential measures in the financial services sector X X X X X X X X X X X X X X X X X
Fair and equitable treatment equated to the minimum standard of treatment of aliens under customary international law
X X X X X X X X X X X X X X X X
Clarification of what does and does not constitute an indirect expropriation X X X X X X X X X X X X X X X X
Detailed exceptions from the free-transfer-of-funds obligation, including balance-of-payments difficulties and/or enforcement of national laws
X X X X X X X X X X X X X X X X X X X X
Omission of the so-called “umbrella” clause X X X X X X X X X X X X X X X X X X
General exceptions, e.g. for the protection of human, animal or plant life or health; or the conservation of exhaustible natural resources
X X X X X X X X X X X X X X X X X
Explicit recognition that parties should not relax health, safety or environmental standards to attract investment
X X X X X X X X X X X X X X X X X
Promotion of Corporate and Social Responsibility standards by incorporating a separate provision into the IIA or as a general reference in the treaty preamble
X X X X X X X X X X
Limiting access to ISDS (e.g. limiting treaty provisions subject to ISDS, excluding policy areas from ISDS, limiting time period to submit claims, no ISDS mechanism)
X X X X X X X X X X X X X X X X X X
Source: UNCTAD.Note: Based on IIAs concluded in 2014 for which the text was available; does not include “framework agreements”, which do not include substantive investment provisions.
Table III.2. Selected aspects of IIAs signed in 2014

World Investment Report 2015: Reforming International Investment Governance114
which developed-country investors – in particular, those from the United States, Canada and a few EU countries – have been the main ISDS users, responsible for over 80 per cent of all claims (figure III.9).
• Intra-EU disputes. A quarter of all known new disputes (11) are intra-EU cases, which is lower than the year before (in 2013, 42 per cent of all new claims were intra-EU cases). Half of them were brought pursuant to the Energy Charter Treaty, and the rest on the basis of intra-EU BITs. The year’s developments brought the overall number of intra-EU investment arbitrations to 99, i.e. approximately 16 per cent of all cases globally.
• Arbitral forums and rules. Of the 42 new known disputes, 33 were filed with the International Centre for Settlement of Investment Disputes (ICSID) (three of them under the ICSID Additional Facility Rules), 6 under the arbitration rules of UNCITRAL,
2 under the arbitration rules of the Stockholm Chamber of Commerce (SCC) and 1 under those of the International Chamber of Commerce. These numbers are roughly in line with overall historical statistics.
Figure III.7. Known ISDS cases, annual and cumulative, 1987−2014
0
100
200
300
400
500
600
700
0
10
20
30
40
50
60
70
1987 1993 1994 1995 1996 1997 1998 1999 2000 2001 2002 2003 2004 2005 2006 2007 2008 2009 2010 2011 2012 2013 2014
Cumulativenumber of cases
Annual number of cases
ICSID Non-ICSID All cases cumulative
Source: UNCTAD, ISDS database.Note: Information about 2014 claims has been compiled on the basis of public sources, including specialized reporting services. This part does not cover cases that
are based exclusively on investment contracts (State contracts) or national investment laws, or cases in which a party has signaled its intention to submit a claim to ISDS but has not commenced the arbitration. Annual and cumulative case numbers are continuously adjusted as a result of verification and may not exactly match case numbers reported in previous years.
• Applicable investment treaties. The majority of new cases (30) were brought under BITs. Ten cases were filed pursuant to the provisions of the Energy Charter Treaty (twice in conjunction with a BIT), two cases under the Central America–Dominican Republic–United States Free Trade Agreement (CAFTA), one case under the North American Free Trade Agreement (NAFTA) and one case under the Canada-Peru FTA. Looking at historical statistics, the Energy Charter Treaty has now surpassed the NAFTA as the IIA invoked most frequently (60 and 53 cases, respectively). Among BITs, the Argentina–United States BIT remains the agreement most frequently used (20 disputes).
• Economic sectors involved. About 61 per cent of cases filed in 2014 relate to the services sector. Primary industries account for 28 per cent of new cases, while the remaining 11 per cent arose out of investments in manufacturing.
• Affected sustainable development sectors. A number of ISDS claims concerned key sustainable development sectors such as infrastructure and climate-change mitigation, including, in particular,

CHAPTER III Recent policy developments and key issues 115
the supply of electricity, gas and water, port
modernization, and the regulation of renewable
energy producers. A number of cases involved
measures taken by governments on environmental
grounds.
• Measures challenged. The two types of State
conduct most frequently challenged by investors
in 2014 were (i) cancellations or alleged violations
of contracts or concessions (at least nine cases),
and (ii) revocation or denial of licenses or permits
(at least six cases). Other challenged measures
included legislative reforms in the renewable energy
sector, alleged discrimination against foreign
investors relative to domestic ones, alleged direct
expropriations of investments, alleged failure on the
part of the host State to enforce its own legislation
and alleged failure to protect investments, as well
as measures related to taxation, regulation of
exports, bankruptcy proceedings and water tariff
regulation. Information about a number of cases
is lacking. Some of the new cases concern public
policies, including environmental issues, anti–
money laundering and taxation.
• Amounts claimed. Information regarding the
amounts sought by investors is scant. For cases
where this information has been reported, the
amount claimed ranges from $8 million to about
$2.5 billion.
b. ISDS outcomes
In 2014, ISDS tribunals rendered at least 43
decisions in investor-State disputes, 34 of which
are in the public domain (at the time of writing). Of
these public decisions, 11 principally addressed
jurisdictional issues, with 6 decisions upholding the
tribunal’s jurisdiction (at least in part) and 5 decisions
rejecting jurisdiction. Fifteen decisions on the merits
were rendered in 2014, with 10 accepting – at least
in part – the claims of the investors, and 5 dismissing
all of the claims. The other 8 public decisions relate to
annulments and preliminary objections.
Of the 10 decisions finding the State liable, 6 found
a violation of the FET provision and 7 a violation of
the expropriation provision. At least 8 decisions
rendered in 2014 awarded compensation to the
investor, including a combined award of approximately
$50 billion in 3 closely related cases, the highest known
Source: UNCTAD, ISDS database.
Figure III.8.Most frequent respondentStates, total as of end 2014(Number of known cases)
Poland 15
15
Ukraine 16
United States
India 16
Ecuador 21
Mexico 21
Canada 23
Egypt 24
Czech Republic 29
Bolivarian Republicof Venezuela 36
Argentina 56
Source: UNCTAD, ISDS database.
Figure III.9.Most frequent home States ofclaimants, total as of end 2014(Number of known cases)
Turkey 17
13
12
Switzerland 17
Belgium
Austria
Spain 27
Italy 28
Canada 33
France 36
Germany 42
United Kingdom 51
Netherlands 67
United States 129
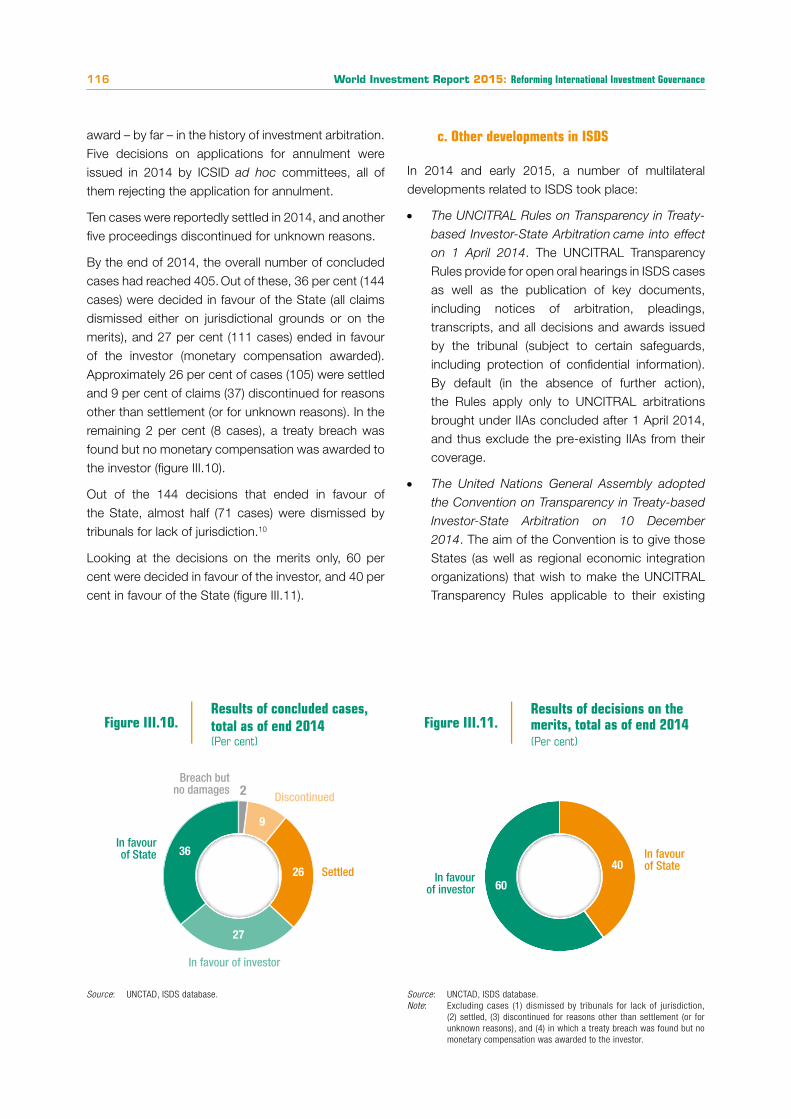
World Investment Report 2015: Reforming International Investment Governance116
award – by far – in the history of investment arbitration.
Five decisions on applications for annulment were
issued in 2014 by ICSID ad hoc committees, all of
them rejecting the application for annulment.
Ten cases were reportedly settled in 2014, and another
five proceedings discontinued for unknown reasons.
By the end of 2014, the overall number of concluded
cases had reached 405. Out of these, 36 per cent (144
cases) were decided in favour of the State (all claims
dismissed either on jurisdictional grounds or on the
merits), and 27 per cent (111 cases) ended in favour
of the investor (monetary compensation awarded).
Approximately 26 per cent of cases (105) were settled
and 9 per cent of claims (37) discontinued for reasons
other than settlement (or for unknown reasons). In the
remaining 2 per cent (8 cases), a treaty breach was
found but no monetary compensation was awarded to
the investor (figure III.10).
Out of the 144 decisions that ended in favour of
the State, almost half (71 cases) were dismissed by
tribunals for lack of jurisdiction.10
Looking at the decisions on the merits only, 60 per
cent were decided in favour of the investor, and 40 per
cent in favour of the State (figure III.11).
Figure III.10.Results of concluded cases, total as of end 2014(Per cent)
In favourof State
In favour of investor
Settled
Discontinued
Breach butno damages
9
2
26
27
36
Source: UNCTAD, ISDS database.
Figure III.11.Results of decisions on themerits, total as of end 2014(Per cent)
In favourof investor
In favourof State
60
40
Source: UNCTAD, ISDS database. Note: Excluding cases (1) dismissed by tribunals for lack of jurisdiction,
(2) settled, (3) discontinued for reasons other than settlement (or for unknown reasons), and (4) in which a treaty breach was found but no monetary compensation was awarded to the investor.
c. Other developments in ISDS
In 2014 and early 2015, a number of multilateral developments related to ISDS took place:
• The UNCITRAL Rules on Transparency in Treaty-
based Investor-State Arbitration came into effect
on 1 April 2014. The UNCITRAL Transparency Rules provide for open oral hearings in ISDS cases as well as the publication of key documents, including notices of arbitration, pleadings, transcripts, and all decisions and awards issued by the tribunal (subject to certain safeguards, including protection of confidential information).
By default (in the absence of further action), the Rules apply only to UNCITRAL arbitrations brought under IIAs concluded after 1 April 2014, and thus exclude the pre-existing IIAs from their coverage.
• The United Nations General Assembly adopted
the Convention on Transparency in Treaty-based
Investor-State Arbitration on 10 December
2014. The aim of the Convention is to give those States (as well as regional economic integration organizations) that wish to make the UNCITRAL Transparency Rules applicable to their existing

CHAPTER III Recent policy developments and key issues 117
IIAs a mechanism to do so. Specifically, and in the absence of reservations by the signatories, the Transparency Rules will apply to disputes where (i) both the respondent State and the home State of the claimant investor are parties to the Convention; and (ii) only the respondent State is party to the Convention but the claimant investor agrees to the application of the Rules. A signing ceremony was held on 17 March 2015 in Port Louis, Mauritius, opening the convention for signature, and by mid-May 2014, 11 countries had signed.11
• On April 18, 2015, the Republic of San Marino
deposited its Instrument of Ratification of the ICSID
Convention with the World Bank. San Marino signed the ICSID Convention on 11 April 2014. The ratification marks the last step in the membership process for San Marino to become an ICSID Contracting State.
Notes1 For more information about these investment policy measures,
please visit UNCTAD’s Investment Policy Hub at http://investmentpolicyhub.unctad.org. Percentage figures exclude “neutral” measures.
2 “Other IIAs” refers to economic agreements other than BITs that include investment-related provisions, e.g. investment chapters in economic partnership agreements (EPAs) and free trade agreements (FTAs), regional economic integration agreements and framework agreements on economic cooperation.
3 Based on International Bureau of Fiscal Documentation (IBFD) database. www.ibfd.org.
4 Algeria, Benin, Burkina Faso, China, the Congo, Côte d’Ivoire, Cuba, Ethiopia, India, Indonesia, Kazakhstan, Kenya, Morocco, Namibia, Pakistan, the Philippines, the Russian Federation, South Africa, the Bolivarian Republic of Venezuela and Viet Nam.
5 http://unctad-worldinvestmentforum.org/followup-events/media-center/.
6 Brazil signed 14 BITs in the 1990s; however none of these treaties entered into force.
7 The new draft Indian model BIT is available at https://mygov.in/group-issue/draft-indian-model-bilateral-investment-treaty-text/.
8 See https://www.regjeringen.no/nb/dokumenter/horing---modell-for-investeringsavtaler/id2411615/.
9 Between January 2014 and May 2015, Indonesia sent notices of termination to Bulgaria, Cambodia, China, Egypt, France, Hungary, India, Italy, Kyrgyzstan, the Lao People’s Democratic Republic, Malaysia, the Netherlands, Romania, Singapore, Slovakia, Spain, Turkey and Viet Nam.
10 These are cases in which a tribunal found, for example, that the asset/transaction did not constitute a “covered investment”, that the claimant was not a “covered investor”, that the dispute arose before the treaty entered into force or fell outside the scope of the ISDS clause, that the investor had failed to comply with certain IIA-imposed conditions (e.g. the mandatory local litigation requirement) or other reasons for dismissal.
11 Canada, Finland, France, Germany, Italy, Mauritius, Sweden, Switzerland, the Syrian Arab Republic, the United Kingdom and the United States.

World Investment Report 2015: Reforming International Investment Governance118
REFERENCES
Bundesministerium für Wirtschaft und Energie (BMWi) (2015). “Modell-Investitionsschutzvertrag mit Investor-Staat Schiedsverfahren für Industriestaaten unter Berücksichtigung der USA”. www.bmwi.de/BMWi/Redaktion/PDF/M-O/modell-investitionsschutzvertrag-mit-investor-staat-schiedsverfahren-gutachten,property=pdf,bereich=bmwi2012,sprache=de,rwb=true.pdf
European Commission (2015). “Investment in TTIP and beyond – the path for reform”, Concept Paper, May. http://trade.ec.europa.eu/doclib/docs/2015/may/tradoc_153408.PDF
UNCTAD (2015). “Investor-State Dispute Settlement: Review of Developments in 2014”, IIA Issues Note, No. 2. New York and Geneva: United Nations. http://investmentpolicyhub.unctad.org/Publications
WIR12. World Investment Report 2012: Towards a New Generation of Investment Policies. New York and Geneva: United Nations.
WIR14. World Investment Report 2014: Investing in the SDGs: An Action Plan. New York and Geneva: United Nations.

Reforming the International
Investment Regime: An Action Menu
C H A P T E R I V

World Investment Report 2015: Reforming International Investment Governance120
Growing unease with the current functioning of the
global international investment agreement (IIA) regime,
together with today’s sustainable development
imperative, the greater role of governments in
the economy and the evolution of the investment
landscape, have triggered a move towards reforming
international investment rule making to make it better
suited for today’s policy challenges. As a result, the IIA
regime is going through a period of reflection, review
and revision.
As evident from UNCTAD’s October 2014 World
Investment Forum (WIF), from the heated public
debate taking place in many countries, and from
various parliamentary hearing processes, including
at the regional level, a shared view is emerging on
the need for reform of the IIA regime to ensure that it
works for all stakeholders. The question is not about
whether to reform or not, but about the what, how and
extent of such reform.
WIR15 responds to this call by offering an action
menu for IIA reform. It builds on UNCTAD’s earlier
work in this area, including UNCTAD’s Investment
Policy Framework (WIR12), UNCTAD’s reform paths
for investment dispute settlement (WIR13), and its
reform paths for IIA reform (WIR14), as well as on
contributions by others.
The chapter addresses five main reform challenges
(safeguarding the right to regulate for pursuing
sustainable development objectives, reforming
investment dispute settlement, promoting and facilitating
investment, ensuring responsible investment, and
enhancing systemic consistency). It offers policy options
for key areas of IIA reform (i.e. substantive IIA clauses,
investment dispute settlement, and systemic issues)
and for different levels of reform-oriented policymaking
(national, bilateral, regional and multilateral).
The policy options provide reform-oriented formulations
for standard IIA elements. They include mainstream IIA
provisions as well as more idiosyncratic options that
have so far been used by fewer countries or are only
found in model agreements.
This WIR takes a holistic approach. It covers, in
a single chapter, all the key aspects of IIA reform
(i.e. substantive, procedural and systemic). It identifies
reform objectives, areas and solutions in the form of
an action menu, outlining a common road map for the
reform process and inviting countries to use the action
menu and to define their own, individual road maps for
IIA reform.
This WIR takes an approach that focuses on policy
coherence. It proposes that reform be guided by the
need to harness IIAs for sustainable and inclusive
growth. It suggests that the investment promotion
and facilitation function of IIAs should go hand in hand
with their function of protecting investment. And, it
emphasizes that IIAs must be coherently embedded in
countries’ overall sustainable development strategies.
Finally, this WIR stresses the importance of a
multilateral approach towards IIA reform. Given the
large number of existing IIAs, the only way to make
the IIA regime work for all is to collectively reform
its components. In today’s dynamic environment,
where one change reverberates throughout the whole
system, it is important to work towards a common
vision and common rules of engagement. Only a
common approach can ensure that reform does not
lead to further fragmentation and incoherence, but is
for the benefit of all, without leaving anyone behind.
And only a common approach will deliver an IIA
regime in which stability, clarity and predictability help
achieve the objectives of all stakeholders, effectively
harnessing international investment relations for the
pursuit of sustainable development.
The chapter first takes stock of 60 years of international
investment rule making, draws lessons learned and
identifies today’s reform needs and objectives. It then
develops the design criteria and strategic choices,
pinpoints the reform areas and tools, and advances
detailed policy options for reform in the five identified
reform objectives. The chapter closes with Guidelines
for IIA Reform and suggested possible actions and
outcomes at the national, bilateral, regional, and
multilateral levels.
INTRODUCTION

CHAPTER IV Reforming the International Investment Regime: An Action Menu 121
A. SIX DECADES OF IIA RULE MAKING AND LESSONS LEARNED
a. Era of infancy (end of World War II until mid-1960s)
The BIT is born as a new type of instrument concluded
between developed and developing countries,
although with relatively few investment protections
and without ISDS. The ICSID Convention is signed,
later to become the main piece of ISDS infrastructure.
In the first half of the 20th century, customary inter-national law (CIL) was the primary source of interna-tional legal rules governing foreign investment. The emergence of a number of major investment disputes
1. Six decades of IIA rule makingInternational investment agreements (IIAs) – like most
other treaties – are a product of the time when they
are negotiated.
IIAs are concluded in a specific historic, economic and social context and respond to the then-existing needs and challenges. As more than half a century has passed since the first bilateral investment treaty (BIT) was concluded, it is no surprise that IIAs have gone through a significant evolutionary process during this period. Four main phases can be identified (figure IV.1).
1950s–1964Era of Infancy
New IIAs: 37Total IIAs: 37
New ISDS cases: 0Total ISDS cases: 0
Emergence of IIAs (weak protection, no ISDS)
New IIAs: 367Total IIAs: 404
New ISDS cases: 1Total ISDS cases: 1
New IIAs: 2663Total IIAs: 3067
New ISDS cases: 291Total ISDS cases: 292
New IIAs: 410Total IIAs: 3271
New ISDS cases: 316Total ISDS cases: 608
1965–1989Era of Dichotomy
1990–2007Era of Proliferation
2008–todayEra of Re-orientation
Figure IV.1. Evolution of the IIA regime
Enhanced protection and ISDS in IIAsCodes of conduct for investors
Proliferation of IIAsLiberalization componentsExpansion of ISDS
Shift from BITs to regional IIAsDecline in annual IIAsExit and revision
Independence movements New International Economic Order (NIEO)
Economic liberalization and globalization
Development paradigmshift
Underlying forces
GATT (1947)Draft Havana Charter (1948)Treaty establishing the European Economic Community (1957)New York Convention (1958)First BIT between Germany and Pakistan (1959)OECD Liberalization Codes (1961)UN Resolution on Permanent Sovereignty over Natural Resources (1962)
ICSID (1965)UNCITRAL (1966)First BIT with ISDS between Netherlands and Indonesia (1968)Draft UN Code of Conduct on TNCs (1973−1993)UN Declaration on the Establishment of a NIEO (1974)Draft UN Code of Conduct on Transfer of Technology (1974−1985)OECD Guidelines for MNEs (1976)MIGA Convention (1985)
World Bank Guidelines for treatment of FDI (1992)NAFTA (1992)APEC Investment Principles (1994)Energy Charter Treaty (1994)Draft OECD MAI (1995−1998)WTO (GATS, TRIMs, TRIPS) (1994)WTO Working Group on Trade and Investment (1996−2003)
EU Lisbon Treaty (2007)UN Guiding Principles on Business and Human Rights (2011)UNCTAD Investment Policy Framework (2012)UN Transparency Convention (2014)
Source: UNCTAD.Note: Years in parentheses relate to the adoption and/or signature of the instrument in question.

World Investment Report 2015: Reforming International Investment Governance122
between foreign investors and their host countries after
19451 showed the significant limitations of protection
afforded under CIL and through the system of home-
State diplomatic protection, and triggered a move
towards international investment treaty making.
A first attempt at multilateral investment rules was made
in 1948 within the framework of the proposed Havana
Charter, designed to establish an International Trade
Organization. With respect to investment negotiations,
developed, developing and socialist countries
could not agree on the interpretation of customary
international law and the content of an international
minimum standard of treatment for foreign investors.
The Charter never entered into force despite the fact
that it was intended to supplement the other building
stones of the post-war international economic order
consisting of the Bretton Woods Institutions (1944)
and the United Nations (1945) (UNCTAD, 2008). This
earlier era of IIAs reflected the split between market
economies (where private property was recognized)
and countries under communist rule (where private
property was not recognized).
Somewhat greater success was achieved through
regional or plurilateral instruments that dealt with the
establishment and treatment of foreign investment.
The 1957 Treaty establishing the European Economic
Community included the freedom of establishment
and the free movement of capital as core pillars of
European integration. Other early examples include
the OECD Code of Liberalization of Capital Movements
and Code on Current Invisible Operations of 1961.
In 1959, the first bilateral investment treaty (BIT),
between Germany and Pakistan, was signed, following
the example of existing bilateral treaties of “friendship,
commerce and navigation” concluded by a number of
countries in the inter-war years and following World War
II. From that time on, BITs became the main instrument
to govern investment relationships among countries of
different levels of economic development. In terms of
content, the BITs (or IIAs) had a focus on protection
against expropriation and nationalization, as investors
from developed countries perceived expropriation
and nationalization as the main political risks when
investing in developing countries. To a considerable
extent, these first-generation BITs resembled the 1959
Abs-Shawcross Draft Convention on Investments
Abroad, a private initiative, and the 1962 OECD Draft
Convention on the Protection of Foreign Property
(revised and adopted in 1967 but never opened for
signature) (Vandevelde, 2010).2
Another landmark development was the establishment
of the International Centre for Settlement of Investment
Disputes (ICSID) in 1965, providing a specialized
facility for the resolution of investment disputes
between investors and host States. In 1958, the
New York Convention on the Recognition and
Enforcement of Foreign Arbitral Awards was
concluded, facilitating the enforcement of international
arbitral awards.
b. Era of dichotomy (mid-1960s until late 1980s)
Investment protections in BITs are enhanced,
including by adding ISDS provisions. At the same time,
multilateral attempts to establish rules on investor
responsibilities fail.
On the one hand, from the mid-1960s to the late 1980s,
IIAs expanded in number and substance, although at
a relatively slow pace and with the participation of a
limited number of countries. The main signatories of
IIAs during this period were developed countries from
Europe and those developing countries – including in
Africa, Asia and Latin America – that considered FDI an
important contribution to their economic development
strategies. Many countries, however – among them
the Soviet Union, countries in Central and Eastern
Europe, China, India and Brazil – stayed out of the
IIA regime altogether or joined only at a relatively late
stage. At the end of the 1980s, the global IIA regime
consisted of fewer than 400 BITs.
In terms of substance, the main development in IIAs
was the increasing inclusion of ISDS provisions. The
earliest known example of ISDS is the BIT between
Indonesia and the Netherlands of 1968. Several other
countries followed in the 1970s and 1980s, until ISDS
became a standard provision in BITs from the 1990s
onward. Investment protection was also strengthened
in other substantive provisions.
On the other hand, during this period, there were
multilateral attempts towards strengthening States’
sovereign powers and towards emphasizing investor
responsibilities. These policies were backed by two
UN Resolutions, one on “Permanent Sovereignty over
Natural Resources” in 1962 and one on “Establishment
of a New Economic Order” in 1974.

CHAPTER IV Reforming the International Investment Regime: An Action Menu 123
In addition, in the early 1970s, a second attempt to establish multilateral investment rules was launched when the UN initiated negotiations on a Code of Conduct on Transnational Corporations and a Code of Conduct on the Transfer of Technology. However, no solution could be found for how to reconcile the interests of developed countries in establishing strong and unambiguous protection for international investment, and the interests of developing and socialist countries in preserving a maximum of their sovereign right to treat multinational enterprises (MNEs) according to their own laws and regulations. Although these negotiations proved unsuccessful, the “Set of Multilaterally Agreed Equitable Principles and Rules for the Control of Restrictive Business Practices” was adopted by the General Assembly in 1980.
c. Era of proliferation (1990s until 2007)
The global IIA regime expands at great speed. BITs
signed are broadly similar, although some countries
add the investment liberalization component. In
the late 1990s, investors “discover” ISDS; the fast-
growing number of claims reveal the true “power” of
IIAs as well as some of their inherent problems.
IIA rule making – and international economic cooperation in general – substantially gained momentum in the 1990s. The fall of the Berlin Wall in 1989 and the dissolution of the Soviet Union caused a tectonic shift in geopolitics, in which political confrontation and economic separation gave way to political cooperation and economic integration. The transformation of former communist States brought about their recognition of private property. A few years earlier, China had adopted its “Open Door” policy with the explicit aim of attracting foreign investment for its economic development. These events significantly contributed to economic globalization, with a large and growing number of developing countries opening up to and actively competing for foreign investment, and more and more investors from developed countries seeking production locations abroad to reduce costs and gain market access.
The universe of BITs expanded rapidly, with almost three new agreements signed per week on average. Although only 381 BITs existed at the end of the 1980s, their number multiplied by five throughout the next decade to reach 2,067 by end of 2000. Most countries, both developed and developing, considered participation in
the IIA regime as a “must” in the global competition for
foreign investment, so that by the mid-2000s hardly any
country did not have at least a few BITs. Countries such
as China and India, with enormous potential as both
recipients and source of FDI, rapidly expanded their
treaty networks. Brazil signed several IIAs but never
ratified them.
In parallel, regional and plurilateral IIA rule making
increased substantially. A landmark event was the
establishment of the WTO in 1994, with several WTO
agreements containing rules applicable to foreign
investment (GATS, TRIMs, TRIPS). In the same year,
the Energy Charter Treaty was concluded; today it
comprises more than 50 contracting parties from
Europe, Asia and Oceania, and contains detailed
investment provisions as one of its pillars. At the
regional level, countries concluded the North American
Free Trade Agreement (NAFTA) (1992) and adopted
the APEC Non-Binding Investment Principles
(1994). Within the OECD, negotiations took place
on the Multilateral Agreement on Investment
(MAI) from 1995 to 1998. However, unexpected
differences emerged on core principles of investment
protection (e.g. investment definition, degree of
investment liberalization, indirect expropriation, ISDS,
cultural exception, labour and environmental issues)
which resulted in the ultimate demise of the undertaking.
At the multilateral level, the Convention Establishing the
Multilateral Investment Guarantee Agency (MIGA), as a
member of the World Bank Group, was concluded in
1985 and the World Bank Guidelines on the Treatment
of Foreign Direct Investment were launched in 1992
(UNCTAD, 2004). Within the WTO, the 1996 Singapore
Ministerial Conference initiated a work programme
on the relationship between international trade and
investment; due to diverging interests in investment
negotiations and in other policy areas the programme
was abandoned after the Fifth Ministerial Conference
(held in 2003 in Cancún, Mexico).
While the vast majority of BITs concluded in this
period covered only the post-establishment phase
of investment, many free trade agreements (FTAs)
went one step further and included in their investment
(and/or services) chapters commitments on non-
discriminatory treatment of establishment by foreign
investors as a means to facilitate market access. The
1990s also witnessed the start of a move towards
renegotiating first-generation BITs with the objective of

World Investment Report 2015: Reforming International Investment Governance124
further enhancing investment protection by including protection elements hitherto missing. In 1990, the first award in a treaty-based case was issued.3 This was followed by a number of new cases during the 1990s and a rapid increase in the 2000s (chapter III).
d. Era of re-orientation (2008 until today)
The “IIA rush” of the 1990s gradually slows down.
Many countries refine treaty content. States’ increased
exposure to ISDS cases, the global financial crisis, a
paradigm shift towards “sustainable development”
and important changes at regional levels mark the
beginnings of a concerted move towards IIA reform.
By April 2015, the IIA regime had grown to close to 3,300 treaties. Several developments in the second half of the 2000s lead to a new era of IIA rule making, which can be characterized as a period of reorientation.
The experience of Canada and the United States as respondents in NAFTA investment arbitrations, prompted them to create, already in 2004, new Model BITs aimed at clarifying the scope and meaning of investment obligations, including the minimum standard of treatment and indirect expropriation. In addition, these new models included specific language aimed at making it clear that the investment protection and liberalization objectives of IIAs must not be pursued at the expense of the protection of health, safety, the environment and the promotion of internationally recognized labour rights. Canada and the United States also incorporated important innovations related to ISDS proceedings such as open hearings, publication of related legal documents and the possibility for non-disputing parties to submit amicus curiae briefs to arbitral tribunals. Also included, following on from NAFTA, were special regimes of substantive protection and dispute resolution for investments in the financial services industry, as well as specialized mechanisms for disputes by investors based on host-country tax measures. The United States Model BIT was slightly revised in 2012.
The global financial and economic crisis that broke out in September 2008 – following the Asian and Argentine financial crises a number of years before – emphasized the importance of solid regulatory frameworks for the economy, including for investment. Growing dissatisfaction with the existing IIA regime and its impact on contracting parties’ regulatory powers to pursue public interests and to enhance sustainable
development led countries to reflect on, review and
reconsider their policies relative to IIAs.
The rise in ISDS cases, from 326 in 2008 to 608
known cases at the end of 2014, involving both
developed and developing countries as defendants,
contributed to this development (UNCTAD, 2015). In
addition, investment disputes became more complex,
raising difficult legal questions about the borderline
between permitted regulatory activities of the State
and illegal interference with investor rights for which
compensation has to be paid. At the same time, as
the number of ISDS cases began to rise sharply, so
did the amount of compensation sought by investors
in their claims and awarded by arbitral tribunals in a
number of high-profile cases.
Accordingly, governments have entered into a phase of
evaluating the costs and benefits of IIAs and reflecting
on their future objectives and strategies as regards
these treaties. Mounting criticism from civil society
plays a role as well. As a result, several countries have
embarked on a path of IIA reform by revising their BIT
models with a view to concluding “new generation” IIAs
and renegotiating their existing BITs. This move is based
in part on UNCTAD’s Investment Policy Framework
for Sustainable Development (IPFSD), which was
developed to provide guidance to the reform of
investment policies at the national and international
levels and which is increasingly being used by
developing and developed countries (box IV.1 and
chapter III). Countries have started to clarify and
“tighten” the meaning of individual IIA provisions and
to improve ISDS procedures, with the objective of
making the process more elaborated, predictable
and transparent and of giving contracting parties a
stronger role therein. Improved transparency is also the
outcome of the recently adopted UNCITRAL Rules on
Transparency in Treaty-based Investor-State Arbitration
and the UN Transparency Convention (see chapter III).
Other countries, by far a smaller group, have
announced a moratorium on future IIA negotiations,
while still others have chosen a more radical approach
by starting to terminate existing IIAs. A few countries
have also renounced their membership in ICSID
(UNCTAD, 2010a).
Although bilateral treaty making lost much of its
dynamism, regional IIA making accelerated (see chapter
III). This is partially a reaction to the failure to establish

CHAPTER IV Reforming the International Investment Regime: An Action Menu 125
multilateral investment rules, leaving regional approaches as a “second best solution”. In addition, the entry into force of the Treaty of Lisbon in December 2009 triggered a trend towards intensifying and upscaling regional IIA treaty making. By transferring competence in FDI from the EU member States to the EU, with potential implications for almost half of the IIA universe, the Treaty of Lisbon enables the EU to negotiate IIAs with post-establishment provisions (earlier, EU treaties only covered pre-establishment). Examples are the Canada–EU Comprehensive Economic and Trade Agreement (CETA, draft 2014), the EU–Singapore Free Trade Agreement, and negotiations for the EU–United States Transatlantic Trade and Investment Partnership (TTIP). Outside the EU, megaregional negotiations are ongoing for the Trans-Pacific Partnership (TPP), the Regional Comprehensive Economic Partnership Agreement (RCEP), and negotiations for the COMESA-EAC-SADC Tripartite Agreement (chapter III). For IIA treaty making, regionals and, even more so, megaregionals offer opportunities to consolidate today’s multifaceted and multilayered treaty network. However, without careful drafting, they can also create new inconsistencies resulting from overlaps with existing agreements (WIR14).
2. Lessons learned
IIA reform can build on lessons learned from 60 years
of IIA rule making.
Sixty years of IIA rule making reveal a number of lessons on how IIAs work in practice and what can be learned for future IIA rule making.
The expected key function of IIAs is to contribute to predictability, stability and transparency in investment relations, and to help to move investment disputes
from the realm of State-to-State diplomatic action
into the realm of law-based dispute settlement and
adjudication. IIAs can help improve countries’ regulatory
and institutional frameworks, including by adding an
international dimension to them and, by promoting the
rule of law and enhancing good governance. IIAs can
reduce risks for foreign investors (i.e. act as an insurance
policy) and, more generally, contribute to improving
the investment climate. Through all of this, IIAs can
help facilitate cross-border investment and become
part of broader economic integration agendas, which,
if managed properly, can help achieve sustainable
development objectives. At the same time, experience
has shown that IIAs “bite” (i.e. their protection provisions
can and have been enforced by arbitral tribunals at
sometimes huge costs to the State), and that – like any
other international treaty – they limit the regulatory space
of the contracting parties. As a result, concerns have
been raised that these limits on regulatory space go too
far, were not properly understood at the point of entry
into IIAs or are inadequately balanced by safeguards for
governments or by obligations on MNEs.
Lesson 1: IIAs bite and may have unforeseen
risks – take safeguards
IIAs are legally binding instruments and not “harmless”
political declarations. As shown by the surge in ISDS
cases during the last 15 years, they “bite”. Broad
and vague formulation of IIA provisions has allowed
investors to challenge core domestic policy decisions,
for instance in the area of environmental, energy and
health policies. Whereas in the past, it was mostly
developing countries that were exposed to investor
claims, there are nowadays also more and more
developed countries as defendants (chapter III).
Box IV.1 UNCTAD’s Investment Policy Framework for Sustainable Development (IPFSD)
UNCTAD’s Investment Policy Framework for Sustainable Development (IPFSD) (UNCTAD, 2012a), the special theme of WIR12, responds to the recognition that at a time of persistent crises and pressing social and environmental challenges, mobilizing investment and ensuring that it contributes to sustainable development objectives is a priority for all countries. In so doing, the UNCTAD Framework built on the emerging new generation of investment policies.
The Framework first details the drivers of change in the investment policy environment and the challenges that need to be addressed; it then proposes a set of Core Principles for investment policymaking which serve as “design criteria” for national and international investment policies. On this basis it presents guidelines for national investment policies and policy options for the formulation and negotiation of IIAs. UNCTAD’s IPFSD has since served as a reference point for policymakers in formulating national investment policies and negotiating IIAs, as a basis for building capacity on investment policies, and as a point of convergence for international cooperation on investment issues.
Source: UNCTAD.

World Investment Report 2015: Reforming International Investment Governance126
The language used in IIAs has generated unanticipated (and at times inconsistent) interpretations by arbitral tribunals, and has resulted in a lack of predictability as to what IIAs actually require from States. As a result, there is today a broadly shared view that treaty provisions need to be clear and detailed, and drafted on the basis of a thorough legal analysis of their actual and potential implications.
Anticipating IIAs’ effect on regulatory space is not straightforward. Although ISDS cases expose the constraints that IIAs can place on regulatory powers, there is no clear methodology for conducting regulatory impact assessments and for managing attendant risks. The IIA impact will depend on the actual drafting and design of the IIA and the capacity of national and subnational entities to effectively implement the treaty.
Lesson 2: IIAs have limitations as an investment promotion and facilitation tool, but also underused potential
IIA rule making needs to be informed by a proper cost-benefit analysis. However, determining the impact of IIAs on FDI flows is not a straightforward exercise. IIAs can help encourage cross-border investment flows by reducing political risks for foreign investors, liberalizing investment flows (depending upon the treaty’s provisions) and, more generally, signalling a better investment climate to international investors, especially in countries with weak domestic investment frameworks and enforcement. However, IIAs are only one of many determinants of FDI decision-making, and their importance is contingent on other variables. IIAs cannot substitute for sound domestic policies and regulatory and institutional frameworks. IIAs alone cannot turn a weak domestic investment climate into a strong one, like other treaties, they cannot guarantee market outcomes in the form of inflows of foreign investment (UNCTAD, 2014a).
Yet, IIAs have underused potential as an instrument for sustainable development objectives. First, they can do more to promote and facilitate investment and channel it to sustainable development. Today, increasing the quantity of investment is not enough. What matters is its quality, i.e. the extent to which investment delivers concrete sustainable development benefits. In light of the financing gap for meeting the Sustainable Development Goals (SDGs) (developing countries face an annual gap of $2.5 trillion), investment needs to be channelled to specific SDG sectors (WIR14).
Second, IIAs can do more to enhance responsible
investment. Although (foreign) investment can create
positive conditions for improving peoples’ lives, it can
also carry the risk of negatively impacting on the
environment, peoples’ health and the enjoyment of
their human rights. These effects can be aggravated
due to domestic regulatory lacunae. It is important,
therefore, that while IIAs continue to provide a firm
basis for investment protection, they should also begin
to address more directly investor responsibilities.
Lesson 3: IIAs have wider implications for policy and systemic coherence, and capacity-building
IIA negotiations are not only about investment policies
per se, but also have implications for numerous
other policy areas at all levels of policymaking within
countries (national, subnational, municipal). Given
their broad scope of application and the wide range
of foreign investment operations, IIA disciplines
interact with policies on trade, labour and social
issues, taxation, intellectual property, land rights,
sector-specific policies, national security issues,
cultural policies, health and environmental protection,
and many others. The far-reaching scope of these
agreements and the obligations they create calls
for broad internal policy coordination – both at and
within the national and subnational levels – when
developing a country’s IIA negotiation strategy and
in the negotiation process itself. Care needs to be
taken to ensure coherence between IIA obligations
and domestic policies, and to achieve consistency
between IIAs and other international obligations of the
IIA contracting parties.
Ensuring this degree of coordination can be a daunting
challenge. The complexity of IIA negotiations and
their likely impact on domestic policies calls for more
capacity-building in developing countries, in particular
least developed countries (LDCs). Without an in-
depth knowledge of international investment law and
pertinent arbitral decisions, countries risk concluding
IIAs that do not properly reflect their interests and
objectives. Moreover, without such coordination,
countries risk entering into commitments that they
cannot implement at either the national or subnational
levels or that inadvertently (and unnecessarily) limit
the pursuit of government policies. In addition, lack
of capacity and negotiation skills also negatively affect
countries’ bargaining power.
CHAPTER IV Reforming the International Investment Regime: An Action Menu 127
B. STRATEGIC APPROACH AND POLICY OPTIONS
and Human Rights, the revised OECD Guidelines
on Multinational Enterprises, and the FAO/World
Bank/UNCTAD/IFID Principles on Responsible
Agricultural Investment (PRAI). In addition to
standards developed by international organizations,
investors are expected to develop their own corporate
social responsibility (CSR) codes and to report on
the actions they have taken in order to comply
with them (WIR11).
A new investor landscape
Developing countries and economies in transition
nowadays attract more than half of global FDI flows,
and their importance as FDI recipients continues to
increase. Emerging economies have not only become
important hosts of FDI; they are increasingly large
sources of investment themselves, with their share
in world outflows exceeding one third. While these
countries previously looked at IIAs mainly from a host-
country perspective, they now also consider their
interests as home countries to investment abroad.
The greater role of governments in the economy
Following the global financial crisis in 2008,
governments have become less reticent about
regulating and steering their economies. While private
sector capital remains the chief engine of global
economic growth and innovation, more and more
governments are moving away from the deregulation
approach to economic growth and development that
has predominated since the 1990s. Industrial policies
and industrial development strategies are proliferating
in developing and developed countries alike (WIR11).
These strategies often contain elements of targeted
investment promotion or restriction, increasing the
importance of integrated and coherent development
and investment policies.
Similarly, a stronger role for State regulation manifests
itself with regard to sustainable development. As the
goals and requirements of sustainable development
have come to be widely accepted, new social and
environmental regulations are being introduced and
existing rules reinforced – all of which have implications
for investment policy. The trend for policymakers
to intervene more in the economy, and to steer
1. Reform needs and objectives
IIA reform responds to a new context for investment
policymaking and should address five main challenges.
As recognized in UNCTAD’s Investment Policy
Framework for Sustainable Development (IPFSD)
(WIR12), the reorientation in IIA rule making responds
to a new context for investment policymaking,
nationally and internationally.
A new sustainable development paradigm
The conservation of natural resources, environmental
protection and social well-being did not feature
prominently on the international policy agenda some
50 years ago. Today, however, these objectives have
become universally recognized guiding principles for all
policymaking in developed and developing countries,
including in investment policymaking (Hindelang et
al., 2015). Accordingly, investment policies (and IIAs)
can no longer be designed in isolation, but need to
be harmonized with, and made conducive to, the
broader goal of sustainable development. This is
even more so, given the importance of international
investment for achieving the SDGs as part of the post-
2015 development agenda, and for living up to the
commitments of the forthcoming third “Financing for
Development” Conference in Addis Ababa.
As the global community’s views on development
have evolved, societies’ expectations about the role
of foreign investment have become more demanding.
Today, it is no longer enough that investment creates
jobs, contributes to economic growth or generates
foreign exchange. Countries increasingly look for
investment that is not harmful for the environment,
which brings social benefits, promotes gender
equality, and which helps them to move up the global
value chain.
Moreover, concerns about the strength and conduct
of individual foreign investors have brought foreign
investment in general under closer domestic and
international scrutiny. Investors are increasingly
expected to do more than the minimum required by
law. Increasingly, investment behaviour is assessed
on whether it complies with international standards,
such as the UN Guiding Principles on Business

World Investment Report 2015: Reforming International Investment Governance128
investment activity, is visible in the overall increasing
share of regulatory and restrictive policies in total
investment policy measures over the last decade (see
chapter III). This trend reflects, in part, a new realism
about the economic and social costs of unregulated
market forces but it has also given rise to concerns
about investment protectionism.
When placing these lessons learned into the new
context of today’s investment for today’s development
paradigm, a number of concrete reform needs and
objectives emerge.
(i) Safeguarding the right to regulate
While IIAs contribute to a favourable investment climate,
they inevitably place limits on contracting parties’
sovereignty in domestic policymaking. Given the
rising concerns that such limits go too far, especially if
combined with effective enforcement, IIA reform needs
to ensure that countries retain their right to regulate for
pursuing public policy interests, including sustainable
development objectives (e.g. for the protection of
the environment, the furtherance of public health or
other social objectives) (WIR12). Safeguarding the
right to regulate may also be needed for implementing
economic or financial policies (WIR11). At the same
time, however, policymakers must be vigilant that
providing the necessary policy space for governments
to pursue bona fide public goods does not inadvertently
provide legal cover for investment protectionism or
unjustified discrimination.
(ii) Reforming investment dispute settlement
Originally modelled on the system of ad hoc confidential
commercial arbitration between private parties, today,
the ISDS system suffers from a legitimacy crisis. There
are concerns that the current mechanism exposes
host States to additional legal and financial risks,
often unforeseen at point of entering into the IIA and
in circumstances beyond clear-cut infringements on
private property, without necessarily bringing any
benefits in terms of additional FDI flows; that it grants
foreign investors more rights as regards dispute
settlement than domestic investors; that it can create
the risk of a “regulatory chill” on legitimate government
policymaking; that it results in inconsistent arbitral
awards; and that it is insufficient in terms of ensuring
transparency, selecting independent arbitrators,
and guaranteeing due process. IIA reform needs to
address these concerns.
(iii) Promoting and facilitating investment
As said above, promoting and facilitating investment
is crucial for the post-2015 development agenda, with
developing countries facing an annual SDG-financing
gap of $2.5 trillion (WIR14). Thus far, however, the
majority of existing IIAs do not include efficient
investment promotion and facilitation provisions, and
reserve this issue for domestic policymaking. A third
reform objective, therefore, is to expand the investment
promotion and facilitation dimension of IIAs together
with domestic policy tools, and to target them towards
foreign investment capable of promoting sustainable
development.
(iv) Ensuring responsible investment
Foreign investment can make positive contributions
for development, but it can also negatively impact
the environment, health, labour rights, human rights
or other public interests (WIR14). Typically, IIAs set
out few, if any, responsibilities on the part of investors
in return for the protection that they receive. One
objective of IIA reform therefore is ensuring responsible
investor behaviour. This includes two dimensions:
maximizing the positive contribution that investors can
bring to societies (“doing good”) and avoiding negative
impacts (“doing no harm”).
(v) Enhancing systemic consistency
In the absence of multilateral rules for investment,
the atomised, multifaceted and multilayered nature
of the IIA regime gives rise to gaps, overlaps and
inconsistencies, between IIAs, between IIAs and other
international law instruments, and between IIAs and
domestic policies. IIA reform therefore should seek
coherence in these various relationships.
2. Designing a future IIA regime
IIA reform needs to be guided by design criteria and
strategic choices that will inform the areas, tools and
best possible policy options for implementing reform.
When designing a future IIA regime that meets the
above-mentioned five reform challenges, countries
can be guided by a number of design criteria for
investment policymaking. They also need to make a
number of strategic choices, with a view to identifying
reform areas, reform tools and best possible policy
options for implementing reform.

CHAPTER IV Reforming the International Investment Regime: An Action Menu 129
a. Design criteria and strategic choices
UNCTAD’s Investment Policy Framework sets out 11
Core Principles for investment policymaking, which
aim to guide policymaking at both the national and
international levels. To this end, they translate the
challenges of investment policymaking into a set of
“design criteria” for investment policies (table IV.1).
As such, the Framework’s principles are also a useful
guide for IIA reform.
Before embarking on IIA reform, countries need to
make a number of strategic choices:
(1) Whether or not to have IIAs
The first strategic choice is about whether “to have
or not to have” an IIA. This requires a careful assessment
of the pros and cons of such agreements (summarized
in table IV.2). Countries may come to different
conclusions, depending on their individual development
strategies, their domestic investment policies, their role
as a home or host country of investment, their prior
experience with IIAs/ISDS and the way they conduct
their international investment relations.
(2) Whether to disengage from IIAs
Since most countries are – to various degrees – already
members of the global IIA regime, the question of
having or not having IIAs is not only about concluding
new treaties, but also about whether to maintain or
terminate existing agreements. For some States,
disengaging from existing IIAs may be appealing
where IIA-related concerns feature particularly high in
the domestic policy debate and where policymakers
no longer consider IIAs to be an important element of
their investment promotion strategies, both inward and
outward. Also, this option becomes more and more
available since many BITs have reached an “age” where
contracting parties have the right to denounce them.
Countries considering this path need to keep in
mind that treaty termination through denunciation is
Area Core Principles
1. Investment for sustainable development
• The overarching objective of investment policymaking is to promote investment for inclusive growth and sustainable development.
2. Policy coherence• Investment policies should be grounded in a country’s overall development strategy.
All policies that impact on investment should be coherent and synergetic at both the national and international levels.
3. Public governance and institutions
• Investment policies should be developed involving all stakeholders and embedded in an institutional framework based on the rule of law that adheres to high standards of public governance and ensures predictable, efficient and transparent procedures for investors.
4. Dynamic policymaking • Investment policies should be regularly reviewed for effectiveness and relevance and
adapted to changing development dynamics.
5. Balanced rights and obligations• Investment policies should be balanced in setting out rights and obligations of States
and investors in the interest of development for all.
6. Right to regulate• Each country has the sovereign right to establish entry and operational conditions for
foreign investment, subject to international commitments, in the interest of the public good and to minimize potential negative effects.
7. Openness to investment• In line with each country’s development strategy, investment policy should establish
open, stable and predictable entry conditions for investment.
8. Investment protection and treatment
• Investment policies should provide adequate protection to established investors. The treatment of established investors should be non-discriminatory in nature.
9. Investment promotion and facilitation
• Policies for investment promotion and facilitation should be aligned with sustainable development goals and designed to minimize the risk of harmful competition for investment.
10. Corporate governance and responsibility
• Investment policies should promote and facilitate the adoption of and compliance with best international practices of corporate social responsibility and good corporate governance.
11. International cooperation • The international community should cooperate to address shared investment-for-
development policy challenges, particularly in least developed countries. Collective efforts should also be made to avoid investment protectionism.
Source: UNCTAD.
Table IV.1. Core Principles for investment policymaking for sustainable development

World Investment Report 2015: Reforming International Investment Governance130
not permitted before the IIA has reached a certain “age”, set by the duration provision of the treaty. In addition, denunciation does not immediately liberate contracting parties from their treaty obligations, since IIAs usually contain a “survival clause”, protecting existing investment in the host country for a certain additional period, typically between 10 and 20 years. Finally, treaty denunciation done without consulting the other contracting party risks negatively affecting foreign relations.
(3) Whether to engage in IIA reform
The next strategic choice is whether or not to engage in IIA reform. Refraining from substantive changes to international investment policymaking sends an image of continuity and investor friendliness. It may be particularly attractive for countries with a strong outward investment perspective and with no – or little – ISDS experiences. Not engaging in reform, however, comes with serious drawbacks in that it does not address any of the challenges arising from today’s global IIA regime and keeps the country exposed to risks created by IIAs in their traditional form. Moreover, mounting pressure for reform from existing treaty partners and other constituencies in many countries will make it increasingly difficult to maintain the status quo.
(4) How to reform IIAs
Should a country decide to embark on IIA reform, further strategic considerations come into play, relating to both substantive and procedural aspects.
What extent and depth should the reform agenda have? Pursuing IIA reform requires decisions on
the sequencing of individual reform steps. Gradual,
incremental reform steps may be easier to realize
than a holistic approach. It may be advantageous
to prioritize those areas for reform (e.g. certain IIA
clauses or ISDS reform elements) where consensus
among the respective actors is most likely to emerge.
Limited, i.e. selective, adjustments that address specific
concerns may be particularly attractive for those
countries that wish to respond to the challenges posed
by IIAs but, at the same time, wish to demonstrate their
continued engagement with the investment regime.
Selective modifications, while leaving the treaty core
untouched, permit countries to address both changes
which seem most readily achievable (i.e. “low-hanging
fruit”) and addressing concerns that appear most
relevant and pressing. It also allows the tailoring of the
modification to a particular negotiating counterpart so
as to suit a particular economic relationship. Indeed,
introducing selective adjustments may appear as
an appealing option for reducing the mounting
pressure on IIAs.
At the same time, however, selective adjustments
cannot comprehensively address the challenges
posed by the existing stock of treaties. It cannot fully
deal with the interaction of treaties with each other,
unless the selective adjustments address the most-
favoured-nation (MFN) clause. Without addressing
MFN application, selective adjustments may lead to
Main arguments made in favour of IIAs Main arguments made against IIAs
IIAs: • Contribute to a favourable investment climate. • Contribute to fostering and expanding economic and
political cooperation between contracting parties. • Contribute to the stability and predictability of the policy
framework, foster good governance and the rule of law.• Provide protection rights that are independent from host
countries’ domestic legislation (superiority of international law over national law).
• Compared with customary international law, improve legal certainty as protection rights are specified by treaty.
• Reduce political risks of investing abroad.• May facilitate the granting of investment guarantees by
the home country. • Help to avoid politicization of investment disputes.
IIAs: • Do not guarantee additional investment inflows.• May negatively affect host countries’ sovereign right to
regulate in the public interest.• Expose host States to ISDS and associated financial risks.• Privilege foreign investors over domestic investors.• Only provide for investor rights, not obligations.• Reflect a negotiated outcome that is influenced by the
bargaining power of the negotiating parties. • May result in overlapping and inconsistent IIA obligations of
contracting parties. • Are difficult to amend in case of changing circumstances.
Source: UNCTAD.
Table IV.2. Summary of arguments put forward in favour and against IIAs

CHAPTER IV Reforming the International Investment Regime: An Action Menu 131
“treaty shopping” and “cherry-picking” and thereby undermine improved formulations of treaty provisions. And, throughout all of this, selective adjustments may lay the groundwork for further change, thus creating uncertainty instead of stability.
By contrast, pursuing systematic and comprehensive reform means overhauling international commitments in a way that ensures the promotion of sustainable development. It implies addressing the key challenges to the IIA regime in all dimensions, with regard to substantive and procedural issues, treaty network issues and ISDS, as well as resolving incoherence, filling systemic gaps, and eliminating loopholes. Taking reform steps in respect of all five reform objectives and addressing future and existing treaties is the most comprehensive approach to reforming the current IIA regime.
Systematic and comprehensive reform presents a number of challenges. It may be time- and resource-intensive. Its result may be perceived as reducing the protective value of the agreements and offering a less attractive investment climate. It requires dealing with the stock of existing IIAs. And amendments or renegotiation may require the cooperation of a potentially large number of treaty counterparts. At the same time, however, this course of action is the only one that can bring about comprehensive and coherent IIA reform. It is also the one best suited for fostering a common response from the international community to today’s shared challenge of promoting investment for the SDGs.
How to balance investment protection and the need to safeguard the right to regulate? IIA reform steps can be moderate or far-reaching. Care needs to be taken that individual reform steps or the cumulative effects of a whole reform package do not deprive the IIA of its investment protection function, but rather achieve a balance between the foreign investors’ adequate protection and the host countries’ need to preserve sufficient regulatory space. How to strike this balance is a strategic choice and depends on individual country preferences and policies.
In addition, there is a risk that individual reform steps only create an illusion of retaining regulatory space (e.g. emphasising the right to regulate while noting that any measure must be otherwise consistent with the IIA). Accordingly, the pursuit of comprehensive reform requires a careful choice of options, bearing in mind the interaction between them.
How to reflect home and host countries’ strategic interests? The strategic position of countries towards
IIA reform will depend on whether they approach
reform from the perspective of a host or also as a home
country of foreign investment. While as host countries,
they may wish to focus on ensuring regulatory space
and reducing exposure to ISDS, as home countries
they will be interested in providing adequate protection
for their own investors abroad. They may also be
interested in establishing entry rights for foreign
investors in IIAs. As more and more countries become
both host and home bases of foreign investment, they
need to reconcile these strategic interests in the IIA
reform debate.
How to synchronize IIA reform with domestic
investment policies? IIA reform needs to take into
account the interaction and “division of labour” between
IIAs and domestic investment policies (noting a key
difference between the two, namely that domestic law
can be unilaterally amended, while this is not possible
for IIAs). One strategic choice therefore is how much
protection to grant under domestic law and how much
under IIAs. Similar considerations apply with regard to
the issue of whether to reform at the domestic or the
international level, or both. In an optimal architecture,
both policy levels will complement each other (e.g.
with regard to investment protection, promotion and
investor responsibility). In other areas (in particular
dispute settlement), decisions may need to be made
about whether domestic and international dispute
settlement procedures should be complementary or
mutually exclusive.
Whether to consolidate the IIA network instead
of continuing fragmentation? As countries reform
and replace individual IIAs, there will be more cases
where “old” and “new” IIAs coexist. IIA reform
therefore risks bringing about – at least initially – a
further fragmentation of the IIA regime. At the same
time, IIA reform offers an opportunity for consolidating
the IIA network, provided that a sufficient number
of countries participate in the process. Regional IIA
reform efforts – both at the intraregional and at the
interregional level – offer particular opportunities for
treaty consolidation. Such regional IIAs can replace
existing BITs between the participating States, unless
the latter wish that the “old” agreements continue
to exist. Allowing old bilateral agreements to coexist
with new regional agreements heightens the risk of

World Investment Report 2015: Reforming International Investment Governance132
fragmentation and systemic incoherence and this may
be further exacerbated where MFN clauses remain
unreformed.
Overall, the response to these strategic considerations
will depend on country-specific circumstances and
preferences. Relevant factors include the kind of
treaties that make up a country’s IIA network, its
individual experience with ISDS, the role it allocates to
IIAs as part of its overall development strategy and the
extent of IIA reform desired, including by its domestic
stakeholders.
b. Reform areas
The starting point for IIA reform is the lessons learned
from the past, which translate into the five reform
objectives identified above. These reform objectives
can be pursued by addressing a number of “reform
areas”, which largely correspond to key IIA clauses.
For each of these, there are a number of sustainable-
development-oriented policy options. Together, the
reform objectives, the corresponding reform areas and
the policy options for pursuing them offer an action
menu for IIA reform.
Approach to designing reform elements By and large, the policy options address the standard
elements included in an IIA. The options discussed
below include both mainstream IIA provisions (e.g.
clarification of indirect expropriation) as well as more
idiosyncratic options that have so far been used
by fewer countries or that are found only in model
agreements or policy statements and concept notes
(e.g. an international investment court). Many of
the options had already been set out in UNCTAD’s
Investment Policy Framework in 2012.
Another possibility would be to develop new
approaches to international investment law and
policymaking from “scratch”. Such an exercise
could be based on a review of existing standards of
protection (and respective gaps) in domestic laws
and policies, and analysis of their pros and cons and
suitability for use at the international level. Similarly, new
IIA elements could be designed based on inputs from
outward investors regarding the type of protections
and support initiatives they would consider beneficial
for them. Such an approach was partly undertaken by
Brazil, when devising its Cooperation and Facilitation Investment Agreements (CFIAs) (chapter III).
Approach to choosing a combination of reform elements Today’s efforts towards comprehensive IIA reform face the specific challenge of properly harnessing IIAs, including their investment protection elements, for promoting sustainable and inclusive development. Finding the right balance between investor protection, on the one hand, and safeguarding the right to regulate, on the other, is of particular importance. Some combinations of policy options may result in a treaty that is largely deprived of its basic investment protection raison d’être, wherein the cumulative compound effect of all modifications renders the treaty’s commitments meaningless. Ultimately, it is the blend of policy options that determine where on this spectrum a particular IIA is located. Accordingly, the pursuit of comprehensive reform requires a careful choice of options, bearing in mind the interactions between them.
This need for balance is already reflected in the UNCTAD Policy Framework’s principles, which include the principles of openness to investment, investment protection and treatment, as well as principles such as the right to regulate and balanced rights and obligations.
There are many ways to pursue the five reform objectives identified. Table IV.3 offers a menu for doing so. Countries can use this menu with a view to identifying the most suitable combination of reform objectives and reform areas for them.
c. Reform tools
When pursuing IIA reform and designing new-generation agreements, countries have a number of reform tools at hand. Table IV.4 provides an overview of these tools and the various entry points to which they can be applied. These tools can be grouped into eight partially overlapping categories of actions. Several tools can be used jointly with respect to one particular IIA entry point or clause.
• Adding new provisions. The impact of this tool on the pursuit of reform objectives varies, depending on the content of the new provision. For example, adding a clause can help safeguard the right to regulate (e.g. if it is a “safety valve” such as a general or national security exception).

CHAPTER IV Reforming the International Investment Regime: An Action Menu 133
Adding a clause can promote responsible investor behaviour (e.g. if it is a not lowering of standards or CSR clause) or foster investment promotion (e.g. if the addition relates to home-country measures or a joint committee charged with pursuing promotion-related activities).
• Omitting existing provisions. Again, the impact of this tool depends on the content of the respective clause. For example, refraining from including certain types of clauses that have proven controversial or that are susceptible to receiving contradictory interpretations by arbitral tribunals can increase legal certainty (e.g. omitting the umbrella clause), help safeguard the right to regulate and improve investment dispute settlement.
• Reformulating existing provisions. Reformula-tions usually clarify or circumscribe the scope of provisions. Clarifying clauses supports both inves-tors and host countries, as ultimately both benefit from enhanced legal clarity and predictability.
• Carving out aspects. Carve-outs can circumscribe the treaty’s scope of application (e.g. limiting the scope of protected investments) or the reach of specific clauses (e.g. limiting the situations to which ISDS applies). Carve-outs can also relate to specific sectors, industries or policies. Generally, carve-outs can help safeguard the right to regulate.
• Linking provisions. Linking provisions usually results in a situation where protections offered are conditioned on certain circumstances. An example would be to make IIA protections or ISDS subject to investor compliance with domestic laws or to require tribunals to take into account States’ different level of development when interpreting protection standards (e.g. fair and equitable treatment). Conditioning protections usually weakens the protective dimension of an IIA. At the same time, linking can also strengthen the treaty’s impact in inducing responsible investor behaviour.
Reform objectives Reform areas
1. Safeguarding the right to regulate
Circumscribed (clearly defined) IIA standards of protection• Fair and equitable treatment• Indirect expropriation• MFN“Safety valves”; e.g. exceptions for• Public policies• National security• Balance-of-payments crises
2. Reforming investment dispute settlement
Clauses that • Fix the existing ISDS mechanism by improving transparency, limiting investors’
access, enhancing the contracting parties’ control and introducing local litigation requirements
• Add new elements to the existing ISDS mechanism (e.g. building in effective alternative methods of dispute resolution, introducing an appeals facility)
• Replace the existing ISDS mechanism (e.g. by creating a standing international investment court, reliance on State-State dispute settlement and/or reliance on domestic dispute resolution)
3. Promoting and facilitating investment
Clauses that• Strengthen promotion measures (inward and outward)• Target promotion measures to sustainable development• Foster cooperation in this regard
4. Ensuring responsible investment
Clauses that• Prevent the lowering of environmental or social standards• Ensure compliance with domestic laws• Strengthen corporate social responsibility (CSR) and foster cooperation in this regard
5. Enhancing systemic consistency
Clauses and mechanisms that manage interaction between• IIAs and other bodies of international law• IIAs and domestic investment and other policies • Different IIAs within a country’s network
Source: UNCTAD.
Table IV.3. Objectives and areas for IIA reform
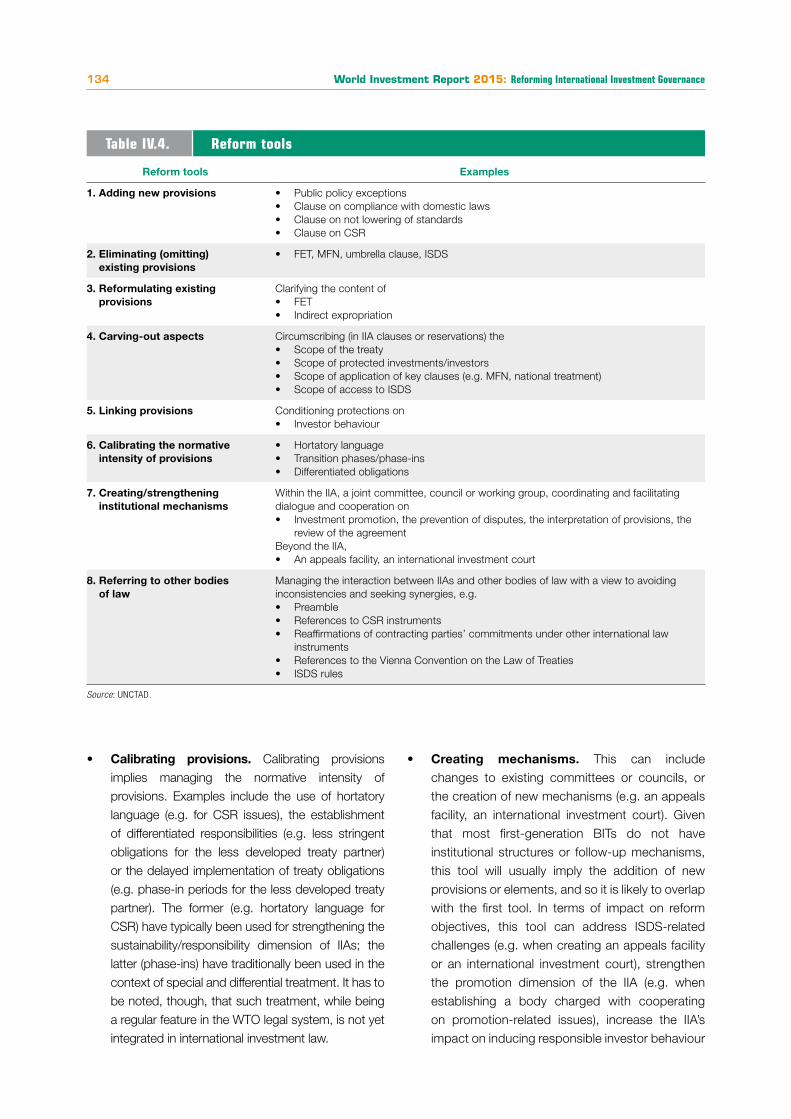
World Investment Report 2015: Reforming International Investment Governance134
• Calibrating provisions. Calibrating provisions implies managing the normative intensity of provisions. Examples include the use of hortatory language (e.g. for CSR issues), the establishment of differentiated responsibilities (e.g. less stringent obligations for the less developed treaty partner) or the delayed implementation of treaty obligations (e.g. phase-in periods for the less developed treaty partner). The former (e.g. hortatory language for CSR) have typically been used for strengthening the sustainability/responsibility dimension of IIAs; the latter (phase-ins) have traditionally been used in the context of special and differential treatment. It has to be noted, though, that such treatment, while being a regular feature in the WTO legal system, is not yet integrated in international investment law.
• Creating mechanisms. This can include changes to existing committees or councils, or the creation of new mechanisms (e.g. an appeals facility, an international investment court). Given that most first-generation BITs do not have institutional structures or follow-up mechanisms, this tool will usually imply the addition of new provisions or elements, and so it is likely to overlap with the first tool. In terms of impact on reform objectives, this tool can address ISDS-related challenges (e.g. when creating an appeals facility or an international investment court), strengthen the promotion dimension of the IIA (e.g. when establishing a body charged with cooperating on promotion-related issues), increase the IIA’s impact on inducing responsible investor behaviour
Table IV.4. Reform tools
Reform tools Examples
1. Adding new provisions • Public policy exceptions• Clause on compliance with domestic laws• Clause on not lowering of standards • Clause on CSR
2. Eliminating (omitting) existing provisions
• FET, MFN, umbrella clause, ISDS
3. Reformulating existing provisions
Clarifying the content of• FET• Indirect expropriation
4. Carving-out aspects Circumscribing (in IIA clauses or reservations) the • Scope of the treaty• Scope of protected investments/investors• Scope of application of key clauses (e.g. MFN, national treatment)• Scope of access to ISDS
5. Linking provisions Conditioning protections on• Investor behaviour
6. Calibrating the normative intensity of provisions
• Hortatory language• Transition phases/phase-ins• Differentiated obligations
7. Creating/strengthening institutional mechanisms
Within the IIA, a joint committee, council or working group, coordinating and facilitating dialogue and cooperation on• Investment promotion, the prevention of disputes, the interpretation of provisions, the
review of the agreementBeyond the IIA,• An appeals facility, an international investment court
8. Referring to other bodies of law
Managing the interaction between IIAs and other bodies of law with a view to avoiding inconsistencies and seeking synergies, e.g. • Preamble • References to CSR instruments • Reaffirmations of contracting parties’ commitments under other international law
instruments • References to the Vienna Convention on the Law of Treaties • ISDS rules
Source: UNCTAD.

CHAPTER IV Reforming the International Investment Regime: An Action Menu 135
(e.g. when establishing a mechanism charged with
reviewing CSR-related issues) and strengthen the
role of countries as masters of their treaties (e.g.
when establishing a body charged with reviewing
the IIA or with submitting interpretative guidance
to arbitral tribunals).
• Referring to other bodies of law. This can
include references to other bodies of law, with
a view to fostering coherence between IIAs and
such other bodies of law (e.g. human rights,
environment, public health); to CSR rules, as part
of an effort to foster responsible investor behaviour;
to the Vienna Convention on the Law of Treaties,
with a view to ensuring consistent interpretation
(in case of conflict); or to international conventions
or rules regarding investment dispute settlement.
The tools discussed above not only differ in their nature
and impact, but also in the ease with which they can
be used. Additions, particularly when they concern
“enforceable” provisions, can raise questions about
their potential implications and their unanticipated side
effects. When additions also include new concepts,
such as investor obligations, they can give rise to the
argument that such novel concepts do not belong
in an IIA (particularly, when the IIA is considered as
an agreement aimed in essence at protecting
investors). Omissions, particularly when they concern
key protection standards, may raise concerns that
they weaken the IIA and its potential investment-
promotion effect.
Additions and omissions are the tools that go furthest
in terms of departing from the model of a “typical IIA”.
They come closest to an approach of conceptualizing
IIA reform, as overhauling instead of improving the
current system. All of these considerations will impact
policymakers’ selection of elements for their country’s
individual road map for IIA reform.
3. Policy options for reform
UNCTAD presents policy options for meeting the five
IIA reform challenges.
This section offers numerous policy options for the
key IIA clauses and entry points. It discusses how the
options contribute to reaching the reform objectives
outlined above and their respective pros and cons.
The discussion of reform options in this section is
further supported by tables (available online, at http://
investmentpolicyhub.org) listing the particular reform
option, offering selected treaty examples and providing
information on the prevalence of the reform option
in current State practice. Actual drafting language,
as found in as actual treaties, can be found in the
APEC-UNCTAD Handbook for IIA Negotiators (APEC
and UNCTAD, 2012).
To a large extent, the reform options reflect the
respective policy options for IIAs contained in
UNCTAD’s Investment Policy Framework (IPFSD).
This Report takes a different approach and includes
only those options that contribute to IIA reform by
addressing the above-mentioned five challenges. It
focuses on the most pressing issues (e.g. MFN, FET,
indirect expropriation, ISDS) in more detail.
Some of the options for individual IIA clauses are
alternatives, others can be used together.
a. Safeguarding the right to regulate
Options include clarifying or circumscribing provisions
such as most-favoured-nation (MFN) treatment, fair and
equitable treatment (FET) and indirect expropriation, as
well as including exceptions, e.g. for public policies or
national security.
The right to regulate in the public interest is addressed
in IIAs mainly through provisions related to the standard
of treatment that the treaty affords to foreign investors.
Among the provisions particularly implicated in delineating
the balance between investment protection and the right
to regulation in the public interest are MFN clauses, the
FET standard, expropriation provisions, and provisions
on safeguards and exceptions, which may be either
built into particular substantive standards of protection
or drafted as generally applicable clauses. These issues
are at the heart of the IIA reform debate and will be
dealt with in detail in this section. Other IIA provisions
(ranging from the preamble, to the scope and definition
clauses, national treatment, the umbrella clause, and
provisions related to remedies and compensation) also
have a bearing on the right to regulate; they are equally
important for States to consider, but they figure less
prominently in the reform discussion. They are therefore
covered in a more abbreviated manner in the second part
of this section. A number of other IIA provisions that can
have an impact on the right to regulate (e.g. performance
requirements or pre-establishment treatment) are not
covered in this report.

World Investment Report 2015: Reforming International Investment Governance136
Standards of treatment
• MFN
The MFN clause is a crucial provision for IIA reform. Failure to take appropriate action with respect to the MFN clause can undermine improved formulations of treaty provisions.
MFN clauses, routinely included in traditional IIAs, aim to prevent less favourable treatment of investors from the signatory State vis-à-vis comparable investors from any third country (i.e. nationality-based discrimination). The MFN principle thereby aims to ensure a level playing field between investors of different foreign nationalities (UNCTAD, 2010b).
In actual ISDS practice, investors have relatively infrequently alleged that they have been discriminated against by virtue of the host States’ more favourable application of domestic measures to investors of third states. Instead, investors have most often invoked the MFN clause to access more “investor-friendly” provisions in IIAs concluded by the host State with third countries.
In particular, investors have relied on the MFN clause to avoid dispute resolution requirements imposed by the applicable IIA (e.g. a set period of time for which they must pursue local remedies before turning to international arbitration). Several tribunals have deemed this circumvention possible in cases involving broadly drafted MFN clauses in which the claimant has been able to point to an IIA signed by the host State in which such pre-arbitration requirements were absent. In other cases, investors have invoked the MFN clause to benefit from higher protection standards
than the ones found in the base treaty (“base treaty” is the treaty pursuant to which the claim is brought). For example, in situations in which an IIA with a third country has contained additional investor protections or more favourable formulations, as compared to the base treaty, a number of tribunals have decided that it is possible for the investor to take advantage of these more favourable provisions to “replace” or “add to” the provisions in the base treaty.
Application of MFN clauses in this way can result in investors “cherry picking” the most advantageous clauses from different treaties concluded by the host State, thereby potentially undermining individual treaty bargains and sidelining the base treaty. For example, treaty commitments may clash, or hard-won concessions in a negotiation (e.g. on flexibility in performance requirements) may be undone through the application of a broadly worded MFN clause, as interpreted by arbitral tribunals. This concern is particularly heightened given countries’ current efforts to reform their IIA regimes, which implies a refinement and rebalancing of treaty standards. Clearly, States will need and want to be careful that the desired effects of newly crafted treaty provisions are not obviated by the application of a broadly worded MFN clause.
There are a number of options to address these challenges (figure IV.2).
A first option is to specify that the MFN clause does not allow for the importation of substantive or ISDS-related elements contained in older treaties. This option ensures that a country’s IIA reform efforts are not compromised by provisions contained in its stock of older treaties.
Figure IV.2. Options for IIA reform: MFN
MFN
Do not apply to
earlier IIAs
Do not apply toother treaties’ ISDS
provisions
Do not apply to other treaties’ substantive
obligations
Allow for carve-outs or country-speci�c
reservations
Omit MFN clause
Apply only toinvestors/
investments in “likecircumstances”
Source: UNCTAD.

CHAPTER IV Reforming the International Investment Regime: An Action Menu 137
A second option is to specify that MFN treatment
does not apply to ISDS provisions found in other IIAs,
existing or future.
A third option is to specify that the MFN clause does
not apply to substantive obligations undertaken in
(existing or future) IIAs. Similarly, a treaty can clarify
that substantive obligations in other IIAs do not in
themselves constitute “treatment”, absent measures
adopted by a State pursuant to such obligations (e.g.
see Canada–EU CETA, draft 2014).
All of these approaches support IIA reform and avoid
the undoing of modernization efforts – however
they can raise concerns as to the diminution of the
protective value of the agreement.
A fourth option is carving out from the MFN obligation
certain sectors or industries or certain policy measures
through a general carve-out (applicable to both parties)
or through country-specific reservations. This option is
particularly relevant for IIAs with a pre-establishment
dimension.
A fifth option, frequently undertaken in recent
agreements, clarifies that the MFN obligation requires
comparison of investors/investments that are “in like
circumstances”. Such a provision can go some way in
safeguarding the right to regulate, but it can also raise
questions about the specific criteria for comparison.
Some recent treaties and models attempted to set out
criteria for determining whether investors/investments
are in “like circumstances” (Azerbaijan–Croatia BIT
(2007)) (see also national treatment).
A final option, followed by some countries, is to omit the
MFN clause altogether. The FTA between the EU and
Singapore (2014), the FTA between India and Malaysia
(2011), the ASEAN–Australia–New Zealand FTA (2009),
the Japan–Singapore FTA (2002) and the SADC Model
BIT (2012) are examples in point. Such an approach
preserves a maximum of flexibility and can facilitate IIA
reform. At the same time, omitting a standard that many
consider to be one of the cornerstones of international
economic law may raise concerns. In response, some
have argued that in an IIA, the investment-enhancing
effect of the MFN clause is less important as compared
with other clauses and as compared with its presence
in other international economic agreements (e.g.
preferential trade agreements).
• FET
The FET standard is one of the IIA clauses that is at the
core of today’s debate on IIA reform. The standard is
designed to protect foreign investors from government
misconduct not captured by other standards of
protection. It is also sometimes said that the FET
standard may serve to foster good governance in host
States. In actual practice, owing to its open-ended and
largely undefined nature, the FET standard, especially as
it has been drafted in traditional IIAs, has turned into an
all-encompassing provision that investors have used
to challenge any type of governmental conduct that
they deem unfair. In fact, almost all ISDS cases to date
have included an allegation of a FET breach.
There is a great deal of uncertainty concerning the
precise meaning of the concept of FET, because
the notions of “fairness” and “equity” do not
connote a clear set of legal prescriptions and are
open to subjective interpretations. Moreover, the
relationship between FET and principles of customary
international law, such as the international minimum
standard of treatment, has raised significant issues of
interpretation, especially where the IIA text contains no
express link between FET and customary international
law. As a result, the task of determining the meaning
of the FET standard has been effectively left to ad hoc
arbitral tribunals (UNCTAD, 2012b).
A particularly challenging issue that has arisen through
arbitral practice relates to the use of the FET standard
to protect investors’ “legitimate expectations”. Given
the potentially far-reaching application of the concept
of “legitimate expectations”, there is a concern that
the FET clause can restrict countries’ ability to change
investment-related policies or introduce new policies
– including those for the public good – if they have a
negative impact on individual foreign investors.
Traditional first-generation IIAs typically included an
unqualified FET standard, which has given rise to some
of the problems identified above. New-generation IIAs
contain a number of more precise drafting options to
choose from (see figure IV.3 on the next page).
A first option is to qualify the FET standard by reference
to the minimum standard of treatment of aliens under
customary international law (MST/CIL). Depending
on a particular tribunal’s reading of MST/CIL, this
approach may raise the threshold of State liability

World Investment Report 2015: Reforming International Investment Governance138
(e.g. the challenged conduct will need to be found to
amount to egregious or outrageous mistreatment of
foreign investors) and help to preserve States’ ability
to adapt their policies in light of changing objectives.
However, the contours of MST/CIL are far from clear,
and a reference to this concept could engender a new,
significant uncertainty, for both States and investors.
Moreover, in light of the arguments about the nature
and development of CIL, not all countries may feel
comfortable in referring to this concept.
A second option is to clarify the FET standard
with an open-ended list of State obligations. The
formulation may be “positive”, specifying what the
standard includes (e.g. the obligation not to deny
justice in criminal, civil or administrative adjudicatory
proceedings), or “negative”, explaining what the
standard does not include (e.g. establishing that
the FET standard does not include a stabilization
obligation that would prevent the host State from
changing its legislation), or a combination thereof. This
option has the advantage of clarifying the meaning of
FET by indicating examples of what it covers and what
it does not cover. One of its disadvantages is that the
open-ended, indicative list of obligations, by its nature,
leaves open the potential for expansion of the meaning
of FET through subsequent arbitral interpretation.
A third option is to clarify or replace the general FET
clause with an exhaustive, i.e. “closed” list of more
specific obligations (e.g. a prohibition to deny justice
or flagrantly violate due process, engage in manifestly
abusive or arbitrary treatment). Although agreeing
on such a list may be a challenging endeavour, its
exhaustive nature would help minimize unanticipated
and far-reaching interpretations by tribunals. As a
further option, the contracting parties may wish to
include a requirement for a periodic review of the list
or the content of the FET obligation.
A final option that some countries have implemented in
some of their IIAs is omitting the FET clause altogether
(e.g. Bangladesh–Uzbekistan BIT (2000), Australia–
Singapore FTA (2003)) or reducing it to a softer
commitment; for example, by referring to FET in the
preamble but not in the main treaty text (e.g. Turkey–
United Arab Emirates BIT (2005) or Azerbaijan–Estonia
BIT (2010)).4 This approach reduces States’ exposure
to investor claims, but also reduces the protective
value of the agreement.
• Indirect expropriation
The expropriation provision is a key IIA element
that mitigates an important risk faced by investors.
Expropriation clauses do not take away States’ right
to expropriate property, but make the exercise of
this right subject to certain conditions (UNCTAD,
2011a).5 Expropriation provisions usually cover both
“direct” and “indirect” forms of expropriation. “Indirect
expropriation” covers acts, or series of acts, whose
effects are “tantamount to” or “equivalent to” a direct,
formal taking. These are acts that generally involve
total or near-total deprivation of an investment or
destruction of its value but without a formal transfer of
title to the State or outright seizure.
Investors have used provisions on indirect
expropriation to challenge general non-discriminatory
FET
Add reference to MST/CIL
Clarify through an open-ended list of FET
obligations
Clarify through an exhaustive list of FET
obligationsOmit FET clause
Figure IV.3. Options for IIA reform: FET
Source: UNCTAD.

CHAPTER IV Reforming the International Investment Regime: An Action Menu 139
regulations that have had a negative effect on their investments (e.g. a ban or the imposition of restrictions on a certain economic activity on environmental or public health grounds). This raises the question of the proper borderline between expropriation (for which compensation must be paid) and legitimate public policymaking (for which no compensation is due).
Historically, IIAs have not contained any criteria for distinguishing between State action amounting to an indirect expropriation and State action of a general regulatory nature for which no compensation is due. More recent IIAs, however, typically set out a number of criteria and a few recent agreements go so far as to omit an explicit reference to indirect expropriation (e.g. Serbia–Morocco BIT (2013)). While the omission of a reference to indirect expropriation may serve to limit (or even eliminate) State exposure to liability for non-direct takings, it may also increase investors’ perception of country risk and susceptibility to opportunistic regulatory behaviour.
There are a number of policy options in this regard (figure IV.4).
A first option is to limit the protection in case of indirect expropriation by establishing criteria that need to be met in order for an indirect expropriation to be found. This can include reference to (i) the economic impact of the government action; (ii) the extent of government interference with distinct, reasonable investment backed expectations; or (iii) the character of the government action (e.g. whether it is discriminatory or disproportionate to the purpose of the measure under challenge). Another possible criterion is
whether the measure(s) alleged to constitute an
expropriation have produced a direct economic
benefit for the State.
A second option is to define, in general terms, which
measures do not constitute indirect expropriation.
For example, it can be specified that “normal
regulatory activities” (e.g. non-discriminatory, good
faith regulations relating to public policy objectives)
do not constitute indirect expropriation. Similarly, it
can be clarified that a measure’s adverse effect on
the economic value of the investment is not enough
to establish an indirect expropriation. A variant of this
option is to clarify that certain specific measures (e.g.
compulsory licensing in accordance with WTO rules)
do not constitute indirect expropriation.
A third option is to omit a reference to indirect
expropriation from the IIA or even explicitly exclude it
from the treaty coverage. Depending upon drafting,
the simple omission of a specific reference to “indirect”
expropriation may not eliminate the possibility of
liability for indirect expropriations: a bare reference
to “expropriation” in an IIA may be interpreted as
subsuming both direct and indirect expropriation in
subsequent arbitral proceedings. In contrast, expressly
excluding indirect expropriation from the coverage of
an IIA may be perceived as considerably reducing the
protective value of the IIA as it would leave investors
unprotected from the types of indirect expropriation
that are unrelated to States’ regulatory conduct, such
as “creeping” (through a series of damaging measures)
or disguised (under a guise of lawful measures,
e.g. tax enforcement) expropriation.
Figure IV.4. Options for IIA reform: Indirect expropriation
Indirect expropriation
Limit by establishing criteria for indirect
expropriation
De�ne what does not constitute indirect
expropriation
Omit or explicitly exclude indirect
expropriation
Source: UNCTAD.

World Investment Report 2015: Reforming International Investment Governance140
All of the above variations give guidance to arbitral tribunals that is presently lacking in most IIAs. None of these options exclude the risk of liability altogether (except perhaps for the express exclusion of protection for indirect expropriations), but rather allow for a better and clearer balancing of investor and State interests. In so doing, these options can help safeguard the right to regulate non-discriminatorily in the general public interest, while simultaneously providing greater legal certainty to investors with respect to the scope of IIA rights. Although explicit exclusion of protection for indirect expropriation is also an option that States can consider, such an option must be viewed as a rarity in contemporary State practice and may be perceived by investors as significantly lowering the protective value of the IIA. From the investors’ perspective, such protection is particularly desirable in governance-weak economies where protection from measures of this nature under the domestic laws of the relevant host State may not be seen as reliable. In the absence of IIA protection for indirect expropriation, investors may seek investment insurance from private or public providers.
Safeguards
For the IIA elements below, the policy options are structured around a number of aspects, each requiring a choice between different options.
• Public policy exceptions
Investors may bring claims against public interest measures that have a negative effect on an investment’s profitability. Whereas traditional IIAs typically do not contain express public policy exceptions, an increasing number of new treaties do include them. The formulation of such exceptions is often similar to the language found in the WTO’s GATT Article XX and GATS Article XIV. These provisions aim at balancing investment protection with other public policy objectives and at reducing States’ exposure to investor challenges of such measures. Public policy exceptions can also have an important signalling effect towards the general public, indicating an agreement’s compatibility with sustainable development and public policy considerations.
At the same time, the absence of express public policy exceptions does not mean that States cannot take public policy measures at all. Instead, such measures either may not be in conflict with IIA obligations in the
first place or may be justified based on other principles of international law that inform the interpretation of IIA obligations. Nevertheless, including public policy exceptions expressly in an IIA increases legal certainty for host States: public policy exceptions explicitly allow for measures – which might otherwise be challengeable under the agreement – to be taken under specified circumstances. In so doing, they can have an important effect of increasing certainty and predictability about the scope of the IIA’s obligations.
It should be noted that adding exceptions provisions raises questions about their relationship with some traditional investor protections, e.g. the provision on direct expropriation (if a direct expropriation corresponds to one of the objectives included in the exception clause, does this relieve the State of the duty to pay compensation?) or the FET standard (e.g. does the State’s creation of protected legitimate expectations foreclose its later reliance on an exceptions clause?). Hence the relationship between an exceptions clause and each IIA obligation needs to be considered carefully. The Energy Charter Treaty’s Article 24 on “Exceptions” for example, does not apply to the article on expropriation.
Assuming countries wish to include such exceptions into IIAs, they have a number of options at hand (figure IV.5), all with their pros and cons.
The first set of options relates to the type of situations that are covered. Countries can specifically list the public policy objectives to which they want the exception to apply (e.g. the protection of public health, public order and morals, the preservation of the environment). This list can be inspired from the relevant WTO (GATT and GATS) clauses but can also include other objectives, such as the provision of essential social services (e.g. health, education, water supply); the prevention of tax evasion; the protection of national treasures of artistic, historic or archaeological value (or “cultural heritage”); cultural diversity; and media diversity, or allow for the pursuit of broader objectives, such as the host countries’ trade, financial and developmental needs. The exact content of such a list would depend on the negotiating partners’ policy preferences.6
A second set of options relates to defining the required relationship (i.e. the “nexus”) between a measure and the policy objective it pursues. This determines how easy or difficult it is for a State to use an exception. For example, the IIA can provide that the measure

CHAPTER IV Reforming the International Investment Regime: An Action Menu 141
must be “necessary” to achieve the policy objective (strict test) or that it must simply be “related to” (“aimed at”, “directed to” or “designed to achieve”) the policy objective (less strict test): the stricter the relationship, the stronger the protective character of the agreement.
A third set of options aims at preventing potential abuse of exceptions. For example, an IIA can clarify that “exceptional” measures must be applied in a non-arbitrary manner and not be used as disguised investment protectionism. Again, these options can be inspired by the respective WTO (GATT and GATS) clauses.
A fourth option establishes guidance for tribunals in the interpretation of exceptions clauses. For example, IIAs can establish a mandatory mechanism whereby cases in which a respondent State invokes a public policy exception are referred to a joint committee of the contracting parties. The committee could guide the interpretation or, alternatively, issue a binding determination of whether or not a measure falls within the scope of the public policy exception. This allows States to retain a certain degree of control over the application of an exceptions clause.
• National security exception
A number of policy developments raise concerns about the constraints that IIAs potentially impose on host States’ measures that are designed to protect their national security interests.
In traditional IIAs, national security exceptions were included only sporadically. Their inclusion has been much more frequent in recent treaties (UNCTAD,
2009). At the domestic level, recent years have
witnessed an expansion of the role of domestic
screening and monitoring mechanisms for inward FDI
(WIR13). In some cases, countries justify the imposition
of investment restrictions or regulations on grounds
of national security. Internationally, countries have
invoked national security arguments in ISDS cases (e.g.
in several cases brought against Argentina concerning
measures taken to address the country’s economic
and financial crisis). National security issues figure
prominently in a number of negotiations, particularly
those in which pre-establishment commitments are
under consideration (e.g. States may wish to retain
their right to refuse the admission of foreign investors/
investments where doing so would pose a risk to the
State’s security interests).
A national security exception enables a State to introduce
emergency measures when its essential security interests
are threatened or for the maintenance of international
peace and security, even if these measures contradict
substantive IIA obligations. Such measures may
include the freezing of assets, other types of sanctions,
or discriminatory treatment of investors of certain
nationalities (or of foreign investors in general). In the
pre-establishment context, such measures may include
refusal of access to specific projects or transactions
in industries considered as strategically important
(such as manufacturing of arms, telecommunications,
transportation, energy or water supply).
Assuming countries wish to include a national security
exception into IIAs, they have a number of options at
hand, all with their pros and cons (figure IV.6).
Determine nexus (strict or loose)
Prevent abuse of exception
Provide guidance for interpretation of
exceptions
Figure IV.5. Options for IIA reform: Public policy exceptions
Decide on public policy objectives to
which exception applies
Public policy exceptions
Source: UNCTAD.

World Investment Report 2015: Reforming International Investment Governance142
The first set of options relates to the types of situations that are covered and the degree of specificity that is applied to this policy choice. Countries can use a broadly formulated national security exception, e.g. for measures necessary for the protection of (or, with a looser nexus requirement, “directed to” or “designed to” protect) the State’s “essential security interests”. A related option is to define national security more specifically, e.g., as including measures taken to address a serious economic crisis situation or to maintain international peace and security.
Countries may take other steps to fine-tune, i.e. circumscribe, the coverage of treaty exceptions; for example, by including a reference to actions taken in pursuance of States’ obligations under the UN Charter or by specifying that the exception covers only certain types of measures such as those relating to trafficking in arms or nuclear non-proliferation, applied in times of war or armed conflict, etc. Finally, a national security exception can also refer to “public order” or to the protection of “public security”, with or without a clarification that this applies only to situations in which a genuine and sufficiently serious threat is posed to one of the fundamental interests of society.
Although national security exceptions are sometimes seen as reducing or limiting the protective strength of a treaty, clarifying and fine-tuning exceptions can help to increase predictability in the application of the clause and the circumscription of its application. A reference to the UN Charter can also help foster coherence between different bodies of law.
A second set of options relates to the standard of
review which ISDS tribunals should apply to measures
invoked for national security reasons. Here, the
important parameter of a national security clause
is whether it is formulated as “self-judging”. If this
is the case, the appropriateness of the measure in
given circumstances is judged only by the invoking
State itself (e.g. “measures which it considers to be
in its essential security interests”). A “self-judging”
exception gives host States a wide margin of discretion
in its application and may trigger the perception that
the treaty’s protective value is somewhat reduced.
It should be noted, however, that depending on the
formulation chosen, a tribunal may still be able to
review whether the exception is being relied upon in
good faith and without manifest abuse.
In addition to these provisions, other IIA clauses have
a bearing on safeguarding the right to regulate in the
public interest. Although they figure less prominently
in the reform discussion, they are equally important
for States to consider. These clauses include the
preamble, provisions related to other substantive
standards of treatment and provisions that delineate
the scope and operative definitions of the treaty.
• Preamble
The preamble is a clause with a cross-cutting impact.
It plays a role in interpreting all other IIA obligations
and can help address all of the five reform objectives
identified. Thus, by identifying and clarifying the
treaty objectives in the preamble, contracting parties
provide important guidance for tribunals in investment
disputes.
As regards the specification of treaty objectives,
contracting parties can clarify that the IIA is not only
about investment protection and promotion, but also
is intended to serve other public policy interests, such
as sustainable development, job creation, technology
and know-how transfer. Another option is to state
that the treaty is not intended to override national
development objectives and that the parties preserve
the right to regulate for legitimate policy objectives
(e.g. public health, safety, environment, public morals,
cultural diversity). The preamble can also clarify that
the treaty is meant to be in line with the parties’ other
international obligations (e.g. treaties on human rights,
Figure IV.6. Options for IIA reform: National security exception
National securityexception
Decide on situations to which exception
applies
Decide on whetherexception is
self-judging or not
Source: UNCTAD.

CHAPTER IV Reforming the International Investment Regime: An Action Menu 143
environment, cultural heritage), and that the parties should not derogate from such obligations in order to promote and protect investment.
• Scope of the treaty
Typically, IIAs are broadly formulated, covering all sectors of economic activities and all domestic measures that affect foreign investment. Nevertheless, countries may have an interest in carving out specific sectors or policy areas from the treaty scope (UNCTAD, 2010c).
Sensitive industries may include social sectors (e.g. education, health, the provision of water), cultural industries, or defence. Exclusion can be full (from all treaty obligations) or partial (from some obligations only). As regards the carving out of policy areas, a potential candidate is taxation or issues related to the restructuring of sovereign debt (UNCTAD, 2011b). Again, this can be a full or partial exclusion. For example, taxation measures – while often excluded from the treaty scope – are sometimes kept subject to the expropriation and certain other IIA provisions (Japan–Mozambique BIT (2013)). Broad exclusions can help preserve the right to regulate, but they can also raise concerns that the treaty does not offer sufficient protections.
• Definition of covered investment
A traditional, open-ended definition of investment grants protection to all types of assets. Although such an approach may be aimed at promoting an investment-attraction effect, it can also cover economic transactions not contemplated by the parties or expose States to unexpected liabilities – hence, the importance of clarifying the scope of covered investments (UNCTAD, 2010c).
One possibility is to require investments to fulfil specific characteristics. Treaty practice has converged on a number of such characteristics, notably, the commitment of capital, the expectation of profit and the assumption of risk. Some IIAs include further criteria, e.g. “a certain duration” (Canada–EU CETA (draft, 2014)) or “establishing lasting economic relations” (Nigeria–Turkey BIT (2011)). A policy debate is under way as to whether an investment’s positive contribution to (sustainable) development should constitute an additional criterion, and what indicators to use in this regard (draft Indian model BIT (2015)). Although some tribunals have looked at the investment’s contribution to “economic development”, such an additional criterion may be difficult to apply
in practice and reduce predictability. The practice of some political risk insurers can, however, offer useful insights in this regard (OPIC, 2012).
IIAs could also compile an exhaustive list of covered investments or expressly exclude specific types of assets. Examples of assets that could be considered for exclusion are short-term, speculative or portfolio investments; sovereign debt obligations; claims to money arising from commercial contracts; or intellectual property rights that are not protected under the host State’s law. There is also the possibility of adopting a narrow, enterprise-based definition of investment (e.g. the draft Indian model BIT (2015)). A final option, complementary to any of the above, is to include a legality requirement; i.e. to specify that investment must be made in accordance with the laws and regulations of the host State.
• Definition of covered investors
An IIA’s definition of “investor” determines which investors are protected and able to bring claims against host States. Increasing policy attention has been given to “treaty shopping” (i.e. the channelling of investment through a “mailbox” company established in the territory of a Party in order to obtain treaty protection) and investment “round-tripping” (i.e., when domestic investors expatriate investment capital for reinvestment in their home State through a foreign corporate vehicle in order to take advantage of IIA protections not otherwise available to domestic investors) (UNCTAD, 2010c).
There are several policy options to focus or narrow the range of protected investors. A first option is to include additional criteria in the definition of “investor”. For instance, it could be clarified that the investor (legal entity) must not only be incorporated but also engaged in “real/substantial business activities” in the home country.
A second option is to include a “denial of benefits”
(DoB) clause to allow States to deny treaty benefits
to “mailbox” companies (which are identified using
the criteria of “substantial business activity” and the
nationality of the company’s ultimate controller) as
well as to investors from countries with no diplomatic
relations with the host State and/or investors from
countries under economic embargo. When designing
a DoB clause, attention needs to be given to the time
when the clause can be invoked. Several tribunals have
held that the DoB clause may not be invoked against

World Investment Report 2015: Reforming International Investment Governance144
an investor after it initiates a formal arbitration claim,
severely limiting the effective scope of these clauses.
With respect to natural persons, there may be a need
to decide whether individuals with dual nationality
should be protected under the treaty or not.
• National treatment
The national treatment clause protects covered
investors against nationality-based discrimination and
guarantees them a level playing field with comparable
domestic investors. For a number of reasons, countries
– in particular developing countries – may have an
interest in limiting the scope of the national treatment
principle. For example, States may wish to accord
more favourable treatment to socially or economically
disadvantaged minorities or ethnic groups.
A number of options exist to address these policy
challenges. One option, included in a number of IIAs,
is to clarify that the principle of non-discrimination
applies only to investors “in like circumstances” and
to establish criteria for making this assessment (e.g.
COMESA Investment Agreement (2007, not in force),
draft Indian model BIT (2015)).
A second option is to exclude sensitive policy areas
(e.g. support programs for local start-ups or economic
support for specific ethnic groups) from the national
treatment obligation. A third option, rarely used, would
be to make national treatment “subject to domestic
laws and regulations”. Finally, some IIAs omit the
national treatment clause altogether (e.g. United Arab
Emirates–Viet Nam BIT (2003)).
• Umbrella clause
An “umbrella” clause, frequently included in traditional
IIAs, requires a host State to respect any obligation that
it has assumed with regard to a specific investment
(e.g. obligations undertaken in an investment contract
or concession agreement). The clause thus brings
these contractual obligations under the “umbrella” of
the IIA, meaning that their breach becomes a violation
of the IIA.
Umbrella clauses have proven problematic in
application, both with respect to the scope of the
obligation undertaken and with respect to the potential
for parallel dispute settlement proceedings (e.g. one
proceeding to address the breach of contract claim
and a parallel proceeding to address the alleged
breach of the umbrella clause). Countries wishing to
avoid the potentially far-reaching legal consequences
of an umbrella clause can clarify and reduce its scope.
For instance, States can clarify that the clause covers
only “written obligations” and that the obligations must
be “entered into” with respect to specific investments.
They can also indicate that the umbrella clause
applies only to conduct that constitutes an exercise of
sovereign powers by a government, i.e. not an ordinary
breach of contract by the State. Another option is to
exclude the applicability of the IIA dispute settlement
mechanism to claims arising out of the umbrella
clause. Finally, an increasing number of treaties omit
the umbrella clause (chapter III).
• Remedies and compensation
Traditional IIAs do not specify the type of legal
remedies a tribunal can order against a State.
Furthermore, these IIAs contain no provisions as to
the appropriate measure of compensation in the event
of a breach of the treaty, with the notable exception of
provisions on expropriation which have long included
language regarding compensation. Several concerns
have emerged in this connection. First, some arbitral
tribunals have affirmed their power to grant any
remedy they consider appropriate, including non-
pecuniary remedies (e.g. an order to a State to revoke,
amend or abstain from applying certain legislative,
administrative or judicial acts). There are concerns
that this type of remedy unduly interferes with States’
sovereignty, especially if ordered by an ad hoc tribunal;
others argue that there would be benefits in leaving
the State the freedom to choose between pecuniary
and non-pecuniary remedies. Second, some arbitral
tribunals have granted monetary awards perceived as
exorbitant in light of the State’s public finances and
compared with what the investor could conceivably
obtain under the domestic rules.
There are several policy options – which can be used in
a complementary manner – to deal with these concerns.
A first option is to set express limits on the remedial
powers of tribunals. The growing trend has been to
limit the available remedies to two forms: monetary
damages and restitution of property, excluding the
order to withdraw or amend a measure.
A second option concerns the standard of
compensation for expropriation. The majority of IIAs
set out a standard of prompt, adequate and effective
compensation (the so-called “Hull formula”), rigidly
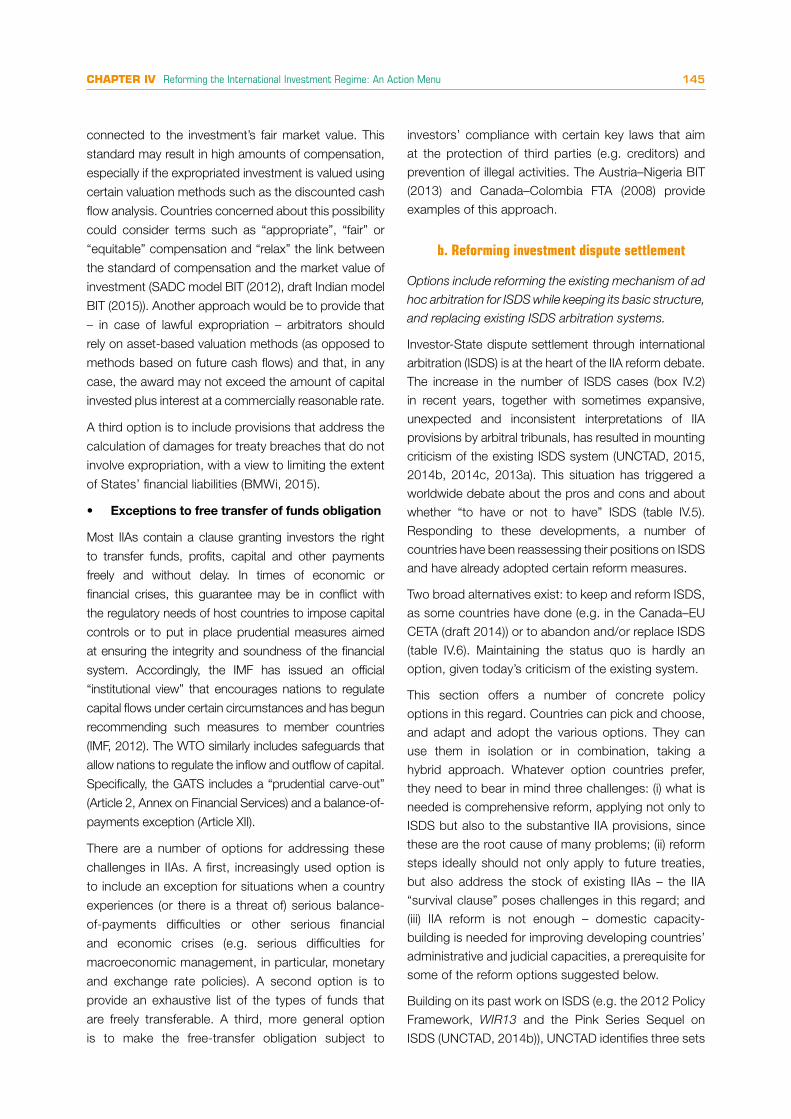
CHAPTER IV Reforming the International Investment Regime: An Action Menu 145
connected to the investment’s fair market value. This
standard may result in high amounts of compensation,
especially if the expropriated investment is valued using
certain valuation methods such as the discounted cash
flow analysis. Countries concerned about this possibility
could consider terms such as “appropriate”, “fair” or
“equitable” compensation and “relax” the link between
the standard of compensation and the market value of
investment (SADC model BIT (2012), draft Indian model
BIT (2015)). Another approach would be to provide that
– in case of lawful expropriation – arbitrators should
rely on asset-based valuation methods (as opposed to
methods based on future cash flows) and that, in any
case, the award may not exceed the amount of capital
invested plus interest at a commercially reasonable rate.
A third option is to include provisions that address the
calculation of damages for treaty breaches that do not
involve expropriation, with a view to limiting the extent
of States’ financial liabilities (BMWi, 2015).
• Exceptions to free transfer of funds obligation
Most IIAs contain a clause granting investors the right
to transfer funds, profits, capital and other payments
freely and without delay. In times of economic or
financial crises, this guarantee may be in conflict with
the regulatory needs of host countries to impose capital
controls or to put in place prudential measures aimed
at ensuring the integrity and soundness of the financial
system. Accordingly, the IMF has issued an official
“institutional view” that encourages nations to regulate
capital flows under certain circumstances and has begun
recommending such measures to member countries
(IMF, 2012). The WTO similarly includes safeguards that
allow nations to regulate the inflow and outflow of capital.
Specifically, the GATS includes a “prudential carve-out”
(Article 2, Annex on Financial Services) and a balance-of-
payments exception (Article XII).
There are a number of options for addressing these
challenges in IIAs. A first, increasingly used option is
to include an exception for situations when a country
experiences (or there is a threat of) serious balance-
of-payments difficulties or other serious financial
and economic crises (e.g. serious difficulties for
macroeconomic management, in particular, monetary
and exchange rate policies). A second option is to
provide an exhaustive list of the types of funds that
are freely transferable. A third, more general option
is to make the free-transfer obligation subject to
investors’ compliance with certain key laws that aim at the protection of third parties (e.g. creditors) and prevention of illegal activities. The Austria–Nigeria BIT (2013) and Canada–Colombia FTA (2008) provide examples of this approach.
b. Reforming investment dispute settlement
Options include reforming the existing mechanism of ad
hoc arbitration for ISDS while keeping its basic structure,
and replacing existing ISDS arbitration systems.
Investor-State dispute settlement through international arbitration (ISDS) is at the heart of the IIA reform debate. The increase in the number of ISDS cases (box IV.2) in recent years, together with sometimes expansive, unexpected and inconsistent interpretations of IIA provisions by arbitral tribunals, has resulted in mounting criticism of the existing ISDS system (UNCTAD, 2015, 2014b, 2014c, 2013a). This situation has triggered a worldwide debate about the pros and cons and about whether “to have or not to have” ISDS (table IV.5). Responding to these developments, a number of countries have been reassessing their positions on ISDS and have already adopted certain reform measures.
Two broad alternatives exist: to keep and reform ISDS, as some countries have done (e.g. in the Canada–EU CETA (draft 2014)) or to abandon and/or replace ISDS (table IV.6). Maintaining the status quo is hardly an option, given today’s criticism of the existing system.
This section offers a number of concrete policy options in this regard. Countries can pick and choose, and adapt and adopt the various options. They can use them in isolation or in combination, taking a hybrid approach. Whatever option countries prefer, they need to bear in mind three challenges: (i) what is needed is comprehensive reform, applying not only to ISDS but also to the substantive IIA provisions, since these are the root cause of many problems; (ii) reform steps ideally should not only apply to future treaties, but also address the stock of existing IIAs – the IIA “survival clause” poses challenges in this regard; and (iii) IIA reform is not enough – domestic capacity-building is needed for improving developing countries’ administrative and judicial capacities, a prerequisite for some of the reform options suggested below.
Building on its past work on ISDS (e.g. the 2012 Policy Framework, WIR13 and the Pink Series Sequel on ISDS (UNCTAD, 2014b)), UNCTAD identifies three sets
World Investment Report 2015: Reforming International Investment Governance146
Box IV.2. Facts and figures (as of end 2014)
The number of cases and countries involved• 608 known treaty-based ISDS cases brought• 99 governments have been respondents • 70 per cent of all known cases brought against developing and transition economies• 80 per cent of all known claims brought by investors from developed countries
Results of 405 concluded ISDS cases (see chapter III) • 36 per cent in favour of the State • 27 per cent in favour of the investor • 26 per cent settled
Amounts claimed and awarded• $1.1 billion in damages claimed in a case, on average (based on 447 cases for which this information is available) • 65 known cases with claims exceeding $1 billion • 37 cases with claims between $500 million and $999 million• $575 million in damages awarded, on average (based on 106 cases for which this information is available; amounts
do not include interest) • $40 billion – largest amount ever awarded by an investment tribunal (UNCTAD, 2015)
State conduct most commonly challenged by investors (preliminary data based on cases where information is available)
• Cancellations or breaches of investment contracts (29 per cent of cases)• Legislative changes (25 per cent)• Direct expropriation or seizure of investment (15 per cent)• Tax-related measures (11 per cent)• Refusal to grant or revocation of licenses (8 per cent)• Abusive treatment or failure to protect investment (7 per cent)
Other challenged measures relate to judicial acts or omissions, withdrawal of incentives, freezing of bank accounts, sovereign debt restructuring, damage from armed conflict, interference with management of an investment, and measures to combat the 2001 financial crisis in Argentina.
The FDI background to ISDS (economic context) • $27 trillion in global FDI stock • 100,000 multinational companies • 890,000 foreign affiliates worldwide
Source: UNCTAD.
Figure box IV.2. ISDS cases by economic sector
19
16
9
8
6
44
3 3
28
Supply of electricty and gas
19
Mining, including oil and gas
16
Financial and insurance services
9
Construction8
Telecommunications6
Real estate activities44
Manufacture of food products
Transportation and storage
3 3
Waste collection, treatment and disposal
Other28
Supply of electricty and gas (19 per cent)
Mining, including oil and gas (16 per cent)
Financial and insurance services (9 per cent)
Construction (8 per cent)
Telecommunications (6 per cent)
Real estate activities (4 per cent)
Manufacture of food products (4 per cent)
Transportation and storage (3 per cent)
Waste collection, treatment and disposal (3 per cent)
Other (28 per cent)
(Per cent)

CHAPTER IV Reforming the International Investment Regime: An Action Menu 147
of options for improving investment dispute settlement
(table IV.6), along the two prongs of actions: reforming
the existing ISDS system or replacing it. Some of these
reform options can be combined and tailored to meet
several reform objectives.
Fixing the existing ISDS mechanisms
This set of reform options aims at reforming existing
ISDS mechanisms while keeping their basic structure,
namely that investors can bring claims against host
States to ad hoc arbitral tribunals. Reform elements
could be the inclusion in IIAs of new provisions
designed to (1) improve the arbitral process;
(2) refine investors’ access to investment arbitration;
(3) establish filters for channelling sensitive cases to
State-State dispute settlement; and (4) introduce local
litigation requirements. These reform options could
be implemented by contracting States in existing and
future individual IIAs and would not require coordinated
actions by a large number of countries.
1. Improving the arbitral process
This option focuses on reforming the way arbitration
proceedings are conducted while preserving the
main features of the ISDS system. The goals of such
Main arguments made in favour of ISDS Main arguments made against ISDSISDS:• Provides an additional avenue of legal redress to covered
foreign investors and enforces the substantive treaty obligations.
• Allows foreign investors to avoid national courts of the host State if they have little trust in their independence, efficiency or competence.
• Avoids recourse to diplomatic protection (investors do not need to convince their home State to bring claims or to exercise diplomatic protection).
• Ensures adjudication of claims by a qualified and neutral tribunal.
• Removes any State immunity obstacles that may complicate domestic legal claims in some States.
• May be faster than domestic court procedures in some countries.
• Allows recognition and enforcement of arbitral awards in many jurisdictions (under the ICSID Convention or the New York Convention).
ISDS:• Grants foreign investors greater rights than those
of domestic investors, creating unequal competitive conditions.
• Exposes host States to legal and financial risks, without bringing any additional benefits, and can lead to “regulatory chill”.
• Lacks sufficient legitimacy (is modelled on private commercial arbitration, lacks transparency, raises concerns about arbitrators’ independence and impartiality).
• Fails to ensure consistency between decisions adopted by different tribunals on identical or similar issues.
• Does not allow for correcting erroneous decisions.• Creates incentives for “nationality planning” by investors
from third countries (or from the host State itself) in order to gain access to ISDS.
• Is very expensive for users.• Holds little additional value in the presence of well-
established and well-functioning domestic legal systems.
Source: UNCTAD.
Table IV.5. Summary of arguments put forward in favour and against ISDS
Reforming existing investor-State arbitration Replacing existing investor-State
arbitrationFixing existing ISDS mechanismsAdding new elements
to existing ISDS mechanisms
1. Improving the arbitral process, e.g. by making it more transparent and streamlined, discouraging submission of unfounded claims, addressing ongoing concerns about arbitrator appointments and potential conflicts.
2. Limiting investors’ access, e.g. by reducing the subject-matter scope, circumscribing the range of arbitrable claims, setting time limits, and preventing abuse by “mailbox” companies
3. Using filters for channelling sensitive cases to State-State dispute settlement
4. Introducing local litigation requirements as a precondition for ISDS
1. Building in effective alternative dispute resolution
2. Introducing an appeals facility (whether bilateral, regional or multilateral)
1. Creating a standing international investment court
2. Replacing ISDS by State-State dispute settlement
3. Replacing ISDS by domestic dispute resolution
Source: UNCTAD.
Table IV.6. Sets of options for reforming investment dispute settlement

World Investment Report 2015: Reforming International Investment Governance148
modifications are to (i) enhance the legitimacy of the
ISDS system, (ii) enhance the contracting parties’
control over the interpretation of their treaties and/or to
(iii) streamline the process and make it more efficient.
Specific reform steps may include the following:
- Providing for more transparency, for example, by
granting public access to arbitration documents
(including settlement agreements) and arbitral
hearings and allowing the participation of interested
non-disputing parties such as civil society
organizations (UNCTAD, 2012c).
- Ensuring that persons adjudicating disputes possess
the requisite skills and are fully independent,
impartial, free from conflicts of interest and
“affordable” to the parties, for example by creating
rules on qualifications, conduct and/or remuneration
of arbitrators (e.g. through a code of conduct).
- “Breaking the link” between the parties to the dispute
and the arbitrators, for example, by establishing a
roster of qualified arbitrators agreed upon by the
contracting parties and determining by lot the
arbitrators who sit on a specific case.
- Enhancing the contracting parties’ role in interpreting
the treaty, for example, by establishing mechanisms
for the provision of binding joint party interpretations
and facilitating interventions by the non-disputing
contracting parties (UNCTAD, 2011c).
- Strengthening the contracting parties’ control over
adjudication of certain sensitive issues, for example,
by requiring tribunals to refer certain matters (e.g.
taxation, financial services (prudential carve-out),
scheduled reservations) for joint determination in the
first instance by the treaty parties, i.e. as a “filter”
mechanism (see also (3) below) (Canada–EU CETA
(draft, 2014), NAFTA (1992)).
- Avoid wasting resources on full-length proceedings in
case of manifestly unmeritorious claims, for example,
by including a mechanism for early discharge of
frivolous claims.24
- Providing for a more equitable distribution of costs
and discouraging submission of unfounded claims,
through appropriate allocation of legal costs (fees
paid by each party to arbitrators, lawyers, experts
and other costs); for example, by expressly adopting
the “loser pays” or the “cost follows the event”
principles.
- Preventing investors from seeking relief for the same
violation in multiple forums, for example, by including a “waiver” (“no-U-turn”) clause (in contrast to the “fork-in-the-road” clause, often included in traditional BITs, “waiver” clauses do not discourage investors from first trying to obtain redress in the domestic courts of the host State).
2. Limiting investors’ access to ISDS
This approach aims to narrow the range of situations in which foreign investors may resort to international arbitration, thereby reducing States’ exposure to legal and financial risks posed by ISDS.
There are several possibilities to achieve this objective:
- Excluding certain types of claims from the scope
of ISDS. This could apply, for instance, to certain sectors considered particularly sensitive (e.g. for claims relating to financial institutions and real estate), specific treaty provisions (e.g. pre-establishment obligations) or sensitive policy areas (e.g. measures adopted on national-security grounds). Exclusions can be party-specific or apply to all contracting States.
- Circumscribing admissible claims to treaty breaches
only. This approach would exclude all non-treaty-based claims (e.g. alleged violations of domestic law, customary international law or investment contracts), but still provide investors with means to enforce the substantive protections found in the IIA. It can be combined with an applicable-law clause that allows application of the treaty and international law only (but not domestic law).
- Prohibiting recourse to ISDS after a certain time period has passed from the events giving rise to the claim (“limitations period”), e.g. three years. This introduces a time factor that fosters certainty and predictability with regard to the assumed treaty obligations. Without it, claims could be filed any time, exposing States to uncertainty. It may be useful to clarify whether the limitation period includes the time that the investor spends pursuing its claims in domestic courts.
- Preventing “abuse” of the treaty by denying ISDS
access to investors who engage in “treaty shopping”
or “nationality planning” through “mailbox” companies that channel investments but do not engage in any real business operations in the home State.
- Providing for State consent to international investment
arbitration on a case-by-case basis.

CHAPTER IV Reforming the International Investment Regime: An Action Menu 149
3. Using filters for channelling sensitive cases
to State-State dispute settlement
This reform option provides for State-State dispute
settlement if a joint committee fails to resolve a case.
While maintaining the overall structure of today’s ISDS
mechanism, this constitutes a “renvoi” of disputes on
sensitive issues to State-State dispute settlement; e.g.
whether a measure is a “prudential” measure aimed at
safeguarding the integrity and stability of the financial
system or whether a taxation measure constitutes an
expropriation. In this case, the ISDS proceeding is
suspended until the State-to-State tribunal renders its
decision. The latter is binding on the ISDS tribunal.
This approach has been adopted in the BIT concluded
between Canada and China in 2012 and in NAFTA (for
investment disputes in financial services). The “filter”
was evoked by the European Commission in its Public
Consultation on the TTIP.
State-State dispute settlement (be it in the form of
arbitration, judicial or other procedures) may be better
suited for sensitive issues of systemic importance, such
as those relating to the integrity and stability of the
financial system, the global system of international tax
relations, or public health. For example, States are likely
to use only those legal arguments with which they would
feel comfortable in cases directed against them.
4. Introducing local litigation requirements as a
precondition for ISDS (including exhaustion
of local remedies)
This reform option aims to promote recourse by foreign
investors to domestic courts while retaining the option
for investor-State arbitration, as a remedy of last resort.
In so doing, it would respond to some of the concerns
arising from the steep rise in ISDS cases over the last
decade. Domestic resolution of investment disputes is
available in virtually every jurisdiction.
Two options could be considered to foster the use of
domestic courts, without foreclosing investors’ resort
to ISDS:
- The IIA could require investors to exhaust local
remedies before accessing international arbitration.
- The IIA could set out a “local litigation requirement”,
i.e. specify that the recourse to international
investment arbitration becomes possible only after a
certain period of time (e.g. 18 months) of litigating the
dispute in domestic courts.
Requiring dispute resolution before the domestic courts of the host country puts foreign investors on an equal footing with domestic investors (as well as with foreign investors from States which do not have an IIA with the host country). It would also help establish a level playing field among foreign investors, as the financial costs associated with international investment arbitration may preclude small and medium-sized enterprises from using it. In addition, national jurisdictions usually also include a right to appeal first-instance decisions and are well-suited to interpret and apply the domestic laws of the host State. Also, the argument has been made that reliance on ISDS is less important in countries with a sound legal systems, good governance and local courts’ expertise. Finally, the argument is gaining ground that rather than focusing exclusively on ISDS, domestic reforms aimed at fostering sound and well-working legal and judicial institutions in host States are important. This may ultimately help remedy some of the host-State institutional deficiencies which IIAs and the ISDS mechanism were designed to address.
At the same time, however, there are concerns that some host States cannot guarantee an efficient and well-functioning domestic court system. Local courts may lack independence and be subject to political control and abuse by the State, including delaying tactics. Also, this approach would be particularly challenging in governance weak counties, where local court decisions could be difficult to enforce. In other jurisdictions, owing to the high workload of local tribunals, the exhaustion of local remedies may span a long period of time and thereby reduce the value of the investment arbitration option. Furthermore, if the investor switches to ISDS after local litigation as an “appeal” to a domestic court ruling, this would potentially increase the legitimacy concerns with ISDS. Finally, local courts may not have the legal competence to apply international law – many jurisdictions do not allow for the direct applicability of IIAs, which would be a prerequisite for local enforcement of treaty obligations. In order for local enforcement to function therefore, such countries would have to transform the treaty into national law.
Adding new elements to the existing ISDS mechanisms
These policy options add new elements to complement
the existing investor-State arbitration mechanism.
World Investment Report 2015: Reforming International Investment Governance150
They can be combined with the above-mentioned
improvements of the mechanism.
• Appeals facility
This option would preserve the structure of the existing
investment arbitration mechanism and add a new layer
to it. An appeals facility could take two main forms:
either a standing or an ad hoc body. It would have
the competence to undertake a substantive review
and correct the arbitral tribunals’ first instance
decisions.
An appellate mechanism would be given review
jurisdiction that goes beyond the scope of review
available under the existing annulment procedures
under the ICSID Convention. The current ICSID
annulment procedure, for example, does not entail a
review of the merits and is limited to review on certain
specified and limited grounds, e.g. irregular constitution
or corruption of the arbitral tribunal, serious departure
from a fundamental rule of procedure, failure to state
reasons for the award or a manifest excess of power.
As a result, an ICSID annulment committee may find
itself unable to annul or correct an award, even after
having identified “manifest errors of law”. An appeals
facility could be given this broader power of review. In
so doing, it could serve to enhance the predictability of
treaty interpretation and improve consistency among
arbitral awards. All this could significantly contribute to
enhancing the political acceptability of ISDS and the
IIA regime as a whole.
A joint committee established under a treaty could be
tasked to hold consultations on the establishment of
an appellate mechanism and identify specific issues for
consideration, including the nature and composition
of an appellate mechanism, and the applicable scope
and standard of review (Canada–EU CETA (draft 2014),
United States model BITs (2004, 2012)).
Should countries decide to opt for establishing such
an appeals mechanism, several sets of issues would
need to be resolved:
- First, issues regarding the establishment of such
a body, notably whether it would have a bilateral,
regional or multilateral nature. Although an appeals
body may be easier to set up in a bilateral context, its
expected function of fostering legal consistency and
predictability would be more pronounced in a pluri-
or multilateral context. In this connection, one would
need to consider how the new mechanism could
be reconciled with, and perhaps integrated into,
the ICSID Convention (e.g. to replace the existing
annulment procedure), the UNCITRAL Arbitration
Rules, the rules of other arbitral forums used in
ISDS and potentially other relevant international
instruments such as the New York Convention on
the Recognition and Enforcement of Foreign Arbitral
Awards. Furthermore, developing an appeals facility
capable of promoting interpretive harmonization
and legal consistency would seem to require
a mechanism under which it has the competence
for reviewing all awards rendered under a particular
treaty.
- Second, issues regarding whether the appeals
facility would be permanent (an appellate body) or ad
hoc. Although ad hoc mechanisms would be easier
to realize and involve lower costs, a permanent
body may be more apt to ensure coherence in
arbitral practice. An appellate body with permanent
judges, appointed by States from a pool of eminent
jurists, would allow the appeals facility to become
an authority capable of delivering consistent – and
balanced – opinions, which would rectify some of the
legitimacy concerns about the current ISDS regime.
Authoritative pronouncements by an appeals facility
on issues of law would guide both the disputing
parties (when assessing the merits of their respective
cases) and arbitrators adjudicating disputes. At the
same time, however, an appellate body with the
authority to issue rulings with the force of precedents
could place new limitations on the sovereignty of
contracting parties through the establishment of an
independent body of jurisprudence.
- Third, issues regarding organization and institutional
set-up of such a body. For example, who would elect
the members of an appeals facility? How would they
be elected? What would be the length of their tenure?
What principles or code of conduct would govern
their activities both with respect to their work within
the facility and without it? What type of secretarial
support would they receive? Who would finance it?
Where would it be located?
- Fourth, issues with regard to the added time and cost
of the proceedings. The introduction of an appellate
stage would add another layer of proceedings to
the arbitration process, and care would need to be
taken to put in place an efficient process, including
timelines (e.g. as for the WTO Appellate Body).

CHAPTER IV Reforming the International Investment Regime: An Action Menu 151
Further, proceedings at an appellate stage would also involve additional costs for both investors and host States.
- Fifth, issues related to the competence of such
a body. These issues include the type of review available, the standard of review to be applied and the type of IIA decisions/awards which the body would be competent to address. For example, would the body be able to review only issues of law or also issues of fact? Would the body be able to remand an erroneous decision for reconsideration only by the tribunal that adopted it, or would it have the power to correct errors directly? Would the appellate facility have review power only over final awards or also over other decisions, e.g. on provisional measures and on jurisdictional issues?
• Building in effective alternative dispute resolution
This approach to ISDS reform promotes the use of alternative dispute resolution (ADR) mechanisms as a step before the commencement of international investment arbitration (UNCTAD, 2010d, UNCTAD 2010e). Although ADR cannot in itself solve key ISDS-related challenges, it can reduce the number of disputes which result in full-scale arbitration. This renders it a complementary, rather than a stand-alone, avenue for ISDS reform.
Whereas arbitration – like adjudication – follows an adversarial procedure leading to a binding decision by a third party, the outcome of ADR mechanisms ultimately requires acceptance by both parties. ADR has value because it can help resolve disputes at an early stage, thereby preventing them from severely and permanently damaging the relationship between the investor and host country. Because of its consensual nature, ADR may be particularly useful in cases of disputes where the parties consider it important to continue their investment cooperation beyond the present dispute. ADR also tends to be more informal and flexible than investor-State arbitration: its purpose is to find a solution that will be acceptable to both parties. If successful, therefore, ADR can help save time and money.
A limitation of ADR is that there is no guarantee that ADR procedures will lead to the resolution of a dispute; unsuccessful ADR can, therefore, increase the costs and time involved. That said, even if unsuccessful, ADR can serve to clarify the issues in dispute between
the parties and help to streamline subsequent arbitral proceedings.
ADR may not always be feasible or acceptable to the host country, depending on the nature of the policy measure challenged by an investor, e.g. where the case relates to legislative measures. Moreover, given the consensual nature of ADR, a mediated outcome of the dispute that has not been endorsed by both parties cannot be enforced. Therefore, if one party does not respect the compromise solution proposed by ADR, binding arbitration may still become unavoidable.
The following policy options suggest actions at different levels of governance: the national and the international level (the IIA). Again, implementation of these options
can be complementary.
At the national level, countries may want to consider
ways in which to strengthen dispute prevention and
management policies by
- Emphasizing dispute prevention mechanisms through
fostering information sharing between State agencies
for the monitoring of sensitive sectors/industries for
early warning signals of potential disputes.
- Establishing interinstitutional arrangements to address
potential and emerging disputes more effectively.
- Empowering a particular agency to act as lead for
the pursuit of amicable settlements (and potential
subsequent arbitration).
- Creating investment ombuds offices or specific
investment agencies to take the lead in resolving
conflicts with investors early on.
At the international level, IIAs can include provisions
on dispute prevention and management and
integrate them into the IIA-based dispute settlement
mechanism. Although a significant number of IIAs
include the possibility of conciliation proceedings,
policymakers may consider the need to strengthen
existing mechanisms or add new ones (e.g. mediation).
This can include
- Adding an ADR provision.
- Strengthening the use of existing ADR as a dispute
prevention mechanism by making it a compulsory
step before the commencement of investment
arbitration, e.g. through establishing “negotiation
periods” (specified time periods during which
consultations and negotiations must be pursued).

World Investment Report 2015: Reforming International Investment Governance152
- Providing for institutional State-State mediation and conciliation efforts prior to investor-State dispute settlement.
- Formulating new provisions for ADR and dispute prevention and management, as e.g. set out by Brazil in its recently concluded CFIAs.
Replacing the existing ISDS system with other dispute resolution mechanisms
The options below would abolish the existing system of ad hoc investor-State arbitration and replace it with other mechanisms for settling investment disputes. Potential replacements include (1) the creation of a standing international investment court, (2) State-State dispute settlement, and/or (3) reliance on domestic judicial systems of the host State.
The replacement options differ in the extent of change they bring. States can focus on one of the options or can pursue them in parallel or in combination. For example, option (3) can be combined with option (2) or option (1), which would preserve the possibility of some sort of international legal proceedings.
The option of replacing the ISDS has been recently pursued in the Australia–Japan Economic Partnership Agreement (EPA) (2014), the Australia–Malaysia FTA 2012, the Australia–New Zealand CEPA (2011), the Japan–Philippines EPA 2006, the Australia–United States FTA 2004, and the recently concluded CFIAs by Brazil with Angola and Mozambique. These treaties leave investment disputes subject to domestic courts but complement this process with the possibility of State-State proceedings under the treaty.
1. Standing international investment court
This option retains investors’ right to bring claims against host States but replaces the system of multiple ad hoc arbitral tribunals with a single institutional structure, a standing international investment court. Such a court would consist of judges appointed or elected by States on a permanent basis; it would be competent for all investment disputes arising from IIAs made subject to its jurisdiction and could also have an appeals chamber.
A standing investment court would be a public institution serving the interests of investors, States and other stakeholders and, more broadly, strengthening
the legitimacy of the investor-State regime. A standing
court could contribute to enhancing consistency
and predictability in the interpretation of international
treaties. It could also strengthen the perceived and
actual independence and impartiality of adjudicators,
by establishing them as judges with security of
tenure and exclusivity of function, i.e. judges, unlike
arbitrators in the present regime, would not be
permitted to continue serving as counsel or expert
witnesses. Moreover, a court could be competent
for all investment disputes under an IIA, i.e. both
investor-State and State-State proceedings. It has
also been suggested, that the competence of the
court be broadened, depending upon the content of
the IIAs made subject to its jurisdiction, in particular
by giving legal standing or procedural rights to other
stakeholders (Bernasconi, 2015).
Clearly, establishing such a court raises a number of
important legal and political challenges, and, in its
very nature, would constitute a long-term project. As
countries move in this direction, they need to consider
a number of key issues (see also appeals facility):
- Issues regarding the establishment of such a court,
such as the need to build consensus among a critical
mass of countries around a convention establishing
such a court.
- Issues regarding organization and institutional set-
up, such as the location, financing and staffing of
the court.
- Issues around the participation of countries in the
court, namely how to transition from a possible
bilateral court established between key trading
blocks, as recently proposed by the European Union
(European Commission, 2015), to a more universal
structure serving the needs of developing and least
developed countries.
- Issues around the competence of the court, such as
the type of IIAs and cases it is competent to address.
Multilateral consensus-building would help respond to
the perception that such a court would work best in
a plurilateral or multilateral context. It could help seek
solutions for making a new court fit the fragmented
global IIA regime, which consists of thousands of
mostly bilateral IIAs. Similarly, multilateral consensus
building would respond to the fact that a standing
investment court may well start at a smaller scale, with
an opt-in mechanism for those States wishing to join.

CHAPTER IV Reforming the International Investment Regime: An Action Menu 153
2. Replacing ISDS with State-State dispute settlement
State-State arbitration is included in virtually all existing IIAs, and it is also the approach taken by the WTO for resolving international trade disputes.
Unlike the fostering of State-State dispute resolution as a complement to ISDS, this option presupposes that State-State proceedings would be the only way of settling investment disputes at the international level. The home State would have discretion on whether to bring a claim. States would need to decide on the court that should hear a case; options include the International Court of Justice, ad hoc tribunals or an international court as envisaged above.
State-State arbitration has a number of pros and cons (table IV.7).
Replacing ISDS with State-State dispute settlement could be one way to reinstate countries’ confidence in the IIA regime, address the legitimacy concerns raised with ISDS – by filtering out frivolous claims and avoiding controversial legal issues related to challenges to public policies; issues that could also be addressed by reforming the ISDS system (see above). More generally, this option would do away with the privileges that ISDS bestows on foreign investors; relying on State-State dispute settlement would be in line with the principle that only States can bring claims under international law. Also, States may be less likely to make certain types of legal arguments that could be used against them in the future.
However, a number of challenges arise with this option.
The main one relates to a possible politicization of
investment disputes, with all that this could entail (e.g.
State discretion to pursue claims, elevating commercial
disputes to the sphere of international relations,
corporate lobbying). State-State dispute settlement
could also be more cumbersome and lengthy for
investors because of bureaucracy in either or both of
the disputing States. It could also place SMEs at a
disadvantage vis-à-vis larger companies as regards
having their case heard. There are also implications
for States’ administrative and institutional resources.
Furthermore, there are questions about how rulings
would be implemented, what kind of remedies would
be appropriate, how these could be enforced, and
who would bear the costs of the proceedings. One
important implication to take into consideration is
that State-State dispute settlement could lead to the
losing party being asked to bring a domestic measure
into compliance with treaty obligations, not merely
compensate for it (as is the case with ISDS), which
implies a far greater intrusion into States’ right to
regulate.
There are also two other considerations to keep in
mind. First, this option requires an identifiable home
State, which in the case of complex multinational
corporations, with affiliates in numerous countries
and multiple ownerships, may be difficult to ascertain.
Second, host States may wish to avoid being
confronted with diplomatic protection by investors’
home States.
Main arguments made in favour of State-State dispute settlement
Main arguments made against State-State dispute settlement
• Could avoid broader legitimacy concerns that have been raised in respect of ISDS.
• Could help to filter out frivolous claims.• Only States can bring claims under international law as they
are the principal subjects of the system.• May help to avoid controversial legal issues related to
challenges to public policies. • States would not make certain types of legal arguments
that could be used against them in the future.• Does away with the privileges that ISDS bestows on foreign
investors.
• Could politicize investment disputes-commercial dispute would become a matter of State-State diplomatic confrontation.
• Investor interests could become a bargaining chip in international relationships.
• May be more cumbersome and lengthy for investors due to bureaucracy in either or both disputing States.
• May disadvantage SMEs vis-à-vis larger companies. • Raises challenges for States in terms of costs of
proceedings and legal remedies. • Has implications for States in terms of administrative and
institutional resources.
Source: UNCTAD.
Table IV.7. Summary of arguments put forward in favour and against State-State arbitration

World Investment Report 2015: Reforming International Investment Governance154
Given that there are so far only four known cases to
date, it is difficult to draw lessons from State-State
arbitration in IIAs.7 Experience with State-State dispute
settlement in the WTO or in the context of regional
agreements (including with respect to the remedies
used, i.e. pecuniary vs. non-pecuniary) can help offer
insights regarding the pros and cons of this option, but
one needs to bear in mind the specific characteristics
of investment disputes.
Overall, although the option of replacing ISDS with
State-State dispute settlement can help to address
some of the concerns with regard to ISDS, it also
raises a number of difficult challenges that would need
to be addressed before taking this route.
3. Exclusive reliance on domestic dispute
resolution
This option abolishes investors’ right to bring claims
against host States in international tribunals and
limits their options for dispute resolution to domestic
courts. Unlike the promotion of domestic resolution as
a step preceding investor claims at the international
level (e.g. exhaustion of local remedies, local litigation
requirement), under this option, domestic judicial
institutions would be the only and final mechanism
for settling investor-State disputes. This option, it
has been noted, has merits mainly in countries where
reliance on ISDS is less important because of their
sound legal systems, good governance and local
courts’ expertise.
As stated above, this option entails a number of pros
and cons.
Arguments made in favour include that it treats foreign
investors equally than domestic investors, and that
it would help establish a level playing field among
foreign investors. It may also support fostering sound
and well-working legal and judicial institutions in host
States through domestic reform, and could therefore
help address some of the host-State institutional
deficiencies which the IIA and the ISDS mechanism
were designed to address. This would also respond
to the increasing argument that rather than focusing
exclusively on ISDS, domestic reforms aimed at
fostering sound and well-working legal and judicial
institutions in host States are important.
Arguments against this option rest on the concerns
with regard to the independence, neutrality, efficiency,
and enforceability of local court rulings, especially in
governance weak countries. In addition, there are
concerns that local courts may take a long time to
settle a dispute (including because of delaying tactics).
In the end, this could render the IIA non-enforceable.
Moreover, local courts may not have the legal
competence to apply international law, since many
jurisdictions do not allow for the direct applicability of
IIAs (see above).
ISDS offers benefits for foreign investors and potential
benefits for home and host States, but in its present
incarnation the system suffers from significant
drawbacks in its substance, procedure and functioning.
There is thus a strong case for a systematic reform of
investment dispute settlement. However, there are no
quick and easy solutions. Reform options have their
pros and cons, and pose their own specific challenges.
Some of the reform options discussed in this section,
such as clarifying the content of individual IIA
provisions or limiting the access of investors to ISDS,
are less difficult to implement than others. Some of the
reform options can be undertaken through unilateral or
bilateral actions, while others require larger, regional,
plurilateral or multilateral efforts. Although multilateral
options would go furthest in systemically addressing
areas of needed reform, they would also face more
difficulties in implementation and require agreement
between larger numbers of States on a series of
important questions (see section C).
In addition, in reforming investment dispute settlement,
attention needs to be given not only to the thousands
of individual investment treaties, but also to the
existing multilateral ISDS-related instruments, such as
the ICSID Convention and the widely used UNCITRAL
Arbitration Rules. In this context, it has to be noted
that terminating membership in one arbitral institution
(e.g. ICSID), depending on the language used in the
treaty, may have the effect that investors bring cases
in other arbitration forums or under other arbitral rules
(UNCTAD, 2010a). Hence, this option would not only
fall short of preventing State liability, but, depending
on the circumstances, could also entail exposing the
State to less favourable procedures.
Finally, ISDS is an enforcement mechanism for the
substantive provisions of IIAs. Hence, ISDS cannot

CHAPTER IV Reforming the International Investment Regime: An Action Menu 155
be looked at in isolation, but only together with the substantive investment protection rules embodied in IIAs. Without a comprehensive package that addresses both the substantive content of IIAs and ISDS, any reform attempt risks achieving only piecemeal change and potentially creating new forms of fragmentation and uncertainty.
c. Promoting and facilitating investment
Options include adding inward and outward investment
promotion provisions, and joint and regional investment
promotion provisions.
States generally conclude IIAs with a view to attracting investment and benefitting from it. However, IIAs rarely include proactive investment promotion or facilitation provisions that effectively encourage outward or inward foreign investment. Instead, IIAs only indirectly promote investment – by protecting it. And IIAs lack the provisions to ensure a certain “quality” of the investment attracted (i.e. investment that delivers concrete and measureable sustainable development benefits to the host country). Given that fostering investment and ensuring its quality is crucial for bridging the financing gap for the SDGs (WIR14), this is an important element of IIA reform.
This WIR offers a number of policy options for countries wishing to pursue this reform objective (figure IV.7). None of the options envisages a binding commitment for any of the contracting parties that would be enforceable through dispute settlement procedures. Most of the
options require a certain financial and institutional capacity to implement them and therefore would need to be complemented with technical assistance (on a non-reciprocal basis) or special and differential treatment, particularly where the agreement involves structurally weak and vulnerable economies. Finally, there is some doubt about the value added of including such provisions in IIAs, given that actual investment promotion and facilitation measures are largely undertaken at the national level. At the same time, regional initiatives have set best practices in this regard.
• Outward-related investment promotion and facilitation provisions (home-country measures)
Usually, IIAs regulate the behaviour of host countries. However, they can also include provisions directed at home countries. These options can, for example, emphasize the importance of specific home-country measures for promoting investment and/or stress home countries’ endeavours to undertake such measures.
A first option is to refer to home-country promotion measures and encourage countries to proactively implement them. Such measures can include granting financial support; e.g. loans, grants (including R&D funding), providing investment guarantees (i.e. to protect investors against certain political risks in the host country) or holding equity participation in investment projects.
A second option is to refer to home-country technical assistance. Such assistance can aim at improving host
Figure IV.7. Promoting and facilitating investment
Promoting and facilitating investment
Outward-related investment promotion and facilitation
provisions (home country measures)
Joint investment promotion provisions
Regional investment promotion provisions
Inward-related investment promotion provisions (host country measures)
Source: UNCTAD.

World Investment Report 2015: Reforming International Investment Governance156
countries’ regulatory regimes and investment facilitation
measures (e.g. help to simplify/streamline admission,
registration or licensing procedures; to set up one-
stop shops for registering an investment or a business;
or to make available information on admission and
establishment requirements, as well as on investment
opportunities). Assistance can also aim at building
institutional structures (e.g. judicial institutions, dispute
prevention capacities, investment promotion agencies),
at strengthening linkages between parties’ research
and academic centres or at facilitating feasibility studies
for large investment projects.
A third option is to foster the sustainable development
dimension of home-country investment promotion
measures. Such provisions can state that the granting
of outward incentives or investment insurance can be
conditioned on the sustainable development impact or
good governance record of the benefitting investment.
The sustainable development impact can be specified,
for example, by reference to specific sustainable
development criteria (including for a specifically targeted
region/community) or by reference to environmental and
social standards (including (international) CSR standards).
The United States’ Overseas Private Investment
Corporation (OPIC) uses about 30 development
indicators to evaluate proposed projects. They include
(i) job creation and human capacity-building (number of
new jobs created, training and employee benefits); (ii)
demonstration effects (e.g. technology and knowledge
transfer, adoption of internationally recognized quality or
performance standards); (iii) host-country impact (local
procurement, and fiscal and foreign exchange impacts);
(iv) environmental and community benefits (improvement
of the environment and benefits to the local community);
and (v) development reach (impact on basic infrastructure
and/or its potential benefits to the poor and other
underserved populations) (OPIC, 2012).
• Inward-related investment promotion provisions (host-country measures)
An IIA can identify actions by host countries. Similar to
the outward-related provisions, such clauses can stress
the importance of these measures and/or aim to link
them to specific sustainable development outcomes.
An option is to condition host-country incentives on
the sustainable development impact of the benefitting
investment and that these incentives are in line with
other policy areas such as industrial development
strategies and regional economic cooperation. A variant
is to condition the granting of investment incentives on
the fulfilment of certain performance requirements, if
this is permitted by the treaty.
Another variant is the establishment of an investment
ombudsperson/facilitator in each contracting party. By
monitoring and addressing investor concerns related to
bureaucratic obstacles to doing business (e.g. business
visas, obstacles to investment generally or to a specific
investment project) an ombudsperson/facilitator can help
ensure a business-friendly environment, and indirectly,
affect a company’s investment prospects and decisions.
The ombudsperson/facilitator can be tasked with a num-
ber of activities, including addressing suggestions or
complaints by investors and their home States; taking
action to prevent, manage and resolve disputes; provid-
ing information on relevant legislative and regulatory is-
sues; or promoting greater awareness and transparency.
Although such an ombudsperson/facilitator would mainly
act at the national level, it can be mandated to report
to and cooperate with the institutional mechanisms set
up under the IIA. Some recent agreements, such as
the CFIAs signed by Brazil and Mozambique and by
Angola and Brazil (2015), have such an ombudsperson/
facilitator as one of their key features. The Foreign
Investment Ombudsman in the Republic of Korea,
which since 1999 has found solutions for grievances
filed by foreign companies can also provide insights into
the functioning of such a service.
• Joint investment promotion provisions
An IIA may also establish mechanisms, institutions
and/or processes by which both home and host
countries cooperate on investment promotion.
A first option is to establish a joint council or committee
on investment promotion. Such a body can be part
of the overall institutional framework between the
contracting parties or be a self-standing specific
element; it can be permanent or ad hoc. Such a body
could meet regularly to oversee the implementation of
the agreement and its investment promotion effect; to
assess investment relations and identify new investment
opportunities; to organize joint seminars, conferences,
workshops or fairs; to monitor the implementation of
specifically listed investment promotion and facilitation
measures (e.g. related to the granting of business
visas); to address specific concerns of investors (e.g.
based on a report by an ombudsperson); or to design,
implement and monitor progress on a thematic work

CHAPTER IV Reforming the International Investment Regime: An Action Menu 157
plan (e.g. on green investment, promotion of linkages,
issues related to small and medium-sized enterprises
(SMEs), global value chains (GVCs)).
A second option relates to linkages. For example,
an IIA can seek to foster linkages and stimulate
joint ventures, in particular with SMEs, by calling for
the sharing of expertise on entrepreneurship and
management, and by encouraging the publication of
documents on SMEs and the exchange of information
and know-how on topics such as taxes, finances and
other conditions necessary for the setting up and
expansion of SMEs.
A third option for joint investment promotion measures
is to foster cooperation between national investment
promotion agencies (IPAs). The IIA can provide a
platform for IPAs to exchange experiences and best
practices in investment promotion, to share information
on concrete investment needs and opportunities (e.g.
a pipeline of SDG-related investment projects), and to
jointly present and prepare large investment projects
identified as bilateral investment priorities. Again, all of
this work can have a thematic focus. A related option
is to expand such cooperation beyond IPAs and also
include trade promotion organizations, including,
for example, joint trade and investment promotion
missions. This would respond to the emergence of
GVCs where ever-intensifying trade and investment
links call for closer coordination between domestic
trade and investment promotion agencies.
Another option is cooperation and partnerships
between outward investment agencies (OIAs) in
home countries and IPAs in host countries, including
for example, for the development and marketing
of pipelines of bankable SDG investment projects
(WIR14). Stimulating such OIA-IPA partnerships can
bring information sharing, technical assistance and
exchanges, the marketing, financing and facilitation of
SDG investment projects as well as joint monitoring
and impact assessment.
• Regional investment promotion provisions
IIAs could also harness the potential of regional
cooperation. Building on the promotion-related
experiences of regional economic cooperation initiatives,
a regional IIA could call for facilitating investment and for
establishing joint investment promotion mechanisms
and institutions for regional infrastructure projects (e.g.
regional development corridors) and regional industrial
zones. This can also take the form of regional SDG
investment compacts (WIR14).
Regional investment promotion initiatives exist around
the globe. The ASEAN Investment Agreement (2009)
refers to the joint promotion of the region as an integrated
investment area, offering special and differential
treatment to new ASEAN members (technical assistance
to strengthen their capacity for investment promotion)
and tasking the AIA Council to provide policy guidance
on investment promotion. Investment promotion is also
included in the ASEAN–India Investment Agreement
(2014) and the ASEAN–China Investment Agreement
(2009). The COMESA Treaty (1993) establishes a
centre for the promotion of industrial development
that works closely and exchanges information with
the investment promotion centres in the member
States. The COMESA Investment Agreement (2007)
obliges member States to strengthen the process of
investment promotion, and the COMESA Coordinating
Committee on Investment includes chief executives
of IPAs. The SADC Investment Protocol (2006) sets
out the activities of IPAs, e.g. to proactively identify
business opportunities for investments, to encourage
the expansion of existing investments, to develop a
favourable investment image of their countries, to make
recommendations for improvements of their countries
as investment destinations, to keep track of all investors
entering and leaving the country for the purpose of
analysis in terms of investment performance, or to
advise investors upon request on the availability, choice
or sustainability of partners in joint venture projects.
Finally, the Central American Common Market (CMA)
Agreement on Investment and Trade Services (2002)
provides for the promotion of investments within the
region. For example, parties are mandated to provide,
upon request, available information on investment
opportunities (e.g. information on prospective
strategic alliances among investors, and information
on investment opportunities in specific economic
sectors of interest to the parties), and to exchange
information concerning foreign investment trends and
available investment opportunities.
d. Ensuring responsible investment
Options include not lowering of standards clauses and
provisions on investor responsibilities, such as clauses
on compliance with domestic laws and on corporate
social responsibility.

World Investment Report 2015: Reforming International Investment Governance158
Ensuring responsible investment has several dimensions. First, this reform objective may refer to maximizing the positive contribution that investors can bring to societies and/or to avoiding investors’ negative impacts (e.g. on the environment, human rights, public health). Second, this reform objective may relate to investors’ obligation to do what is required by law and/or to investors’ response to societies’ expectations that businesses comply with voluntary standards, i.e. that they do more than what is required by the law. The relevance and suitability of the policy options below differ depending on which of these aspects is the prime objective (figure IV.8).
Not lowering of standards clause
There is a concern that international competition for foreign investment may lead some countries to lower their environmental, human rights and other laws and regulations, and that this could result in a “race to the bottom” in terms of regulatory standards.
There are a number of options to address this concern.
A first option is to explicitly reaffirm parties’ commitments under international agreements that they have concluded (e.g. in human rights, core labour rights or the environment). Doing so would not only help address
concerns about a “race to the bottom”, but also help
foster overall coherence and synergy between different
bodies of international law (systemic policy challenge).
A second option is to include a “not lowering of
standards” clause in the IIA. The normative intensity
of the clause may be increased by stating that each
contracting Party “shall ensure” (instead of “shall strive
to ensure”) that it does not waive or derogate from
environmental, labour or other laws (United States
model BIT (2012)). This option has similar benefits
as the explicit reaffirmation option, as it can (partly)
respond to concerns regarding a potential race to the
bottom and help manage the interaction between IIAs
and national policies.
Both of these options move the IIA regime beyond
its traditional role of focusing solely on investment
protection, and towards the goal of establishing and
maintaining a regulatory framework that is conducive
to sustainable development. By helping maintain
– and build – a sound regulatory framework, these
options can help promote responsible behaviour by
investors and better manage the interaction between
IIAs and domestic laws – and, possibly, help tip the
balance in an ISDS case. However, there is a concern
that such clauses, while constituting commitments
of the contracting parties, are not enforceable in the
traditional sense through ISDS and may have little
concrete impact. Moreover, much of their impact
depends on the quality of the host country’s regulatory
framework and its implementation.
A third option is to complement the above with a
follow-up mechanism. This can include a mechanism
for reporting on issues related to the implementation
of the clause (including reporting on improvements of
investment-related social, environmental or other laws
and regulation).
Investor responsibilities
Most IIAs are asymmetrical in that they set out
obligations only for States and not for investors.
To correct this asymmetry, an IIA can also include
provisions on investor responsibilities, as a few recent
IIAs have done.
Although ensuring the responsible conduct of investors
is a key objective of IIA reform, there are different views
on the role of IIAs (in addition to, for example, national
legal frameworks) in ensuring such conduct. Given the
Figure IV.8. Ensuring responsible investment
Ensuring responsibleinvestment
CSR clauses
Not lowering of standards clause
Compliance with domestic laws
Investor responsibilities
Source: UNCTAD.

CHAPTER IV Reforming the International Investment Regime: An Action Menu 159
wide recognition of investors’ responsibility to respect human rights and to conduct business in a responsible manner (e.g. as set out in the UN Guiding Principles on Business and Human Rights), the recognition of a need to rebalance IIAs, including as part of IIA reform, is gaining prominence.8
Noting the evolving views on the capacity of international law to impose obligations on private parties, there are two broad sets of options: raising the obligations to comply with domestic laws to the international level and designing CSR clauses.
• Compliance with domestic laws
Numerous IIAs include a requirement for investors to comply with laws of the host State when making an investment. This general obligation could be further specified in the IIA; for instance, by stipulating that the investment can be held legally responsible for damage caused to human health or the environment. The potential impact of this stipulation would be even more relevant if extended to damages arising in the post-operations stage of an investment; e.g. when foreign investors fail to ensure orderly divestment or environmental clean-up of their activities. This raises the issue under which conditions a parent company could be held responsible for damage caused by its foreign subsidiaries (WIR13).
More broadly, countries can strengthen their domestic regulatory frameworks by incorporating international principles and standards related to social, human rights, health, environmental and other risks associated with investment. Again, sharing of experiences and best practices, technical assistance and capacity-building can facilitate efforts in this regard (WIR11).
• CSR clauses
The last decade has seen the development of
corporate social responsibility (CSR) standards as a
unique dimension of “soft law” that is rapidly evolving.
CSR standards typically focus on the operations of
MNEs and, as such, are increasingly significant for
international investment.
The current landscape of CSR standards is
multilayered, multifaceted, and interconnected. The
standards of the UN, the ILO and the OECD serve
to define and provide guidance on fundamental CSR
issues. In addition, there are dozens of international
multi-stakeholder initiatives, hundreds of industry
association initiatives and thousands of individual
company codes providing standards for the social and
environmental practices of firms at home and abroad
(WIR11).
In the past, the two universes of international rules
affecting investment, CSR standards and IIAs, were
largely disconnected. However, strengthening the
responsibility dimension of IIAs calls for improving
and strengthening the interaction between these two
universes of international rules affecting investment.
There are a number of policy options to do so.
A first option is to encourage investors to comply
with widely accepted international standards (e.g.
the UN Guiding Principles on Business and Human
Rights). This can be done either through a general
reference, without listing the relevant CSR standards;
by giving a list of the relevant standards; or by spelling
out the content of relevant CSR standards. Each of
these approaches has pros and cons. For example,
building on the work done by CSR experts rather than
reinventing the wheel saves time, costs and efforts
and brings together two different bodies of law and
policymaking, fostering coherence and improving
systemic interaction. Referring to widely recognized
and well-regarded instruments can add legitimacy and
secure acceptance by different stakeholders.
A second, related option is to require tribunals
to consider an investor’s compliance with CSR
standards, endorsed by the parties, when deciding
an ISDS case. However, this raises the question of
what legal consequences non-compliance would
have. Furthermore, questions with regard to the
cross-fertilization between different bodies of law;
the need for arbitrators to familiarize themselves with
the relevant, rapidly evolving normative standards;
and the importance of managing interaction and
coordination with CSR-related compliance processes
and institutions arise.
A third option is to include a commitment by the
parties to promote agreed best-practice international
CSR standards. Parties can also commit to fostering
compliance at the national level. Actions can
include building local industries’ capacity to take
up CSR standards, by conditioning the granting of
incentives on the observance of CSR standards, or
introducing certain minimum standards (e.g. relating
to anti-corruption, environmental, health and labour
standards) into domestic laws.

World Investment Report 2015: Reforming International Investment Governance160
A fourth option is to establish cooperation between
the parties on CSR issues. Cooperation can involve
the work of a special committee set up under the
IIA and tasked to discuss CSR-related issues.
Cooperation can also include promoting best-practice
international CSR standards (e.g. by promoting the
observance of applicable CSR standards and helping
to implement them, including through specific industry
support measures, market incentives and regulation),
supporting the development of new voluntary
standards (e.g. by cooperating on the above activities,
and in the exploration and creation of new CSR
standards), or other activities.
A fifth option that is worth considering, and that
a number of countries are starting to pursue, is
home-country efforts to regulate foreign investment
for sustainable development. Whereas past CSR-
related initiatives have largely taken a host-country
perspective, an emerging policy development has
home countries monitor or regulate the foreign
activities of their companies, e.g. through export credit
agencies and investment insurance (see above). Such
an effort can address, among others, issues related to
human rights, the environment or corruption.
All of the above options have their pros and cons. They
can help support the spread of CSR standards, which
are becoming an ever more important feature of the
investment policy landscape. They can improve the
interaction between different bodies of law and policy
(see below), and help strengthen the “responsibility
dimension” of IIAs. Although there are concerns that
the “softer” approaches are unlikely to have a significant
effect, they also carry certain advantages. For example,
the softer the approach, the easier it will be to implement
it and to make CSR part of the IIA. Moreover, soft
approaches can have an important impact by “pushing
the envelope” for conceptual debate and innovation in
international investment policymaking.
e. Enhancing systemic consistency of the IIA regime
Options include improving the coherence of the
IIA regime, consolidating and streamlining the IIA
network, managing the interaction between IIAs and
other bodies of international law and linking IIA reform
to the domestic policy agenda.
In light of the high degree of atomization of the IIA
regime, a key reform challenge is to avoid further
fragmentation of the system, and to enhance, as far
as possible, coherence between individual IIAs, as
well as coherence between the IIA regime and other
international policies. In addition, there is a need to
manage the systemic links between the IIA regime and
domestic policies.
Improving coherence of the IIA regime
• Seeking common IIA reform solutions
With over 3,200 different agreements concluded
over 60 years, reflecting different levels of economic
development, different interests and different treaty
models, the global IIA universe is known for its
systemic complexity, incoherence, gaps in coverage
and overlapping commitments.
In terms of content, the main differences in the global
IIA regime relate to the policy issues of (i) treaty
scope (limited to post-establishment treatment or
including the pre-establishment phase); (ii) coverage
(only FDI or all kinds of investments); (iii) the degree
of investment protection; (iv) the number and degree
of treaty exceptions; (v) the inclusion of sustainable
development considerations; and (vi) the handling of
investment disputes.
In terms of type, one can distinguish between “pure”
investment agreements, such as BITs, on the one
hand, and sectoral, regional and plurilateral treaties,
or economic cooperation treaties, covering both
investment and trade, on the other hand (“other IIAs”).
Differences within the IIA universe can partially be
explained by the different “age” of treaties – first-
generation IIAs look significantly different from more
recent agreements. Variations in content may also
derive from the fact that IIAs have been concluded with
countries at different levels of economic development,
or within the context of regional economic cooperation.
Different experiences of countries with ISDS and their
reflection in IIAs may be an additional factor. The
bargaining power of negotiating parties may play a
role as well – the stronger the bargaining strength of
a country, the fewer difficulties it will have in ensuring
coherent treaty practices.
Working towards more coherence in an IIA regime
consisting of thousands of agreements is a global
challenge that calls for common responses through

CHAPTER IV Reforming the International Investment Regime: An Action Menu 161
a combination of individual, bilateral, regional and multilateral reform steps (see section C). Regional IIA reform, if undertaken properly, can help promote harmonization of investment rules. The backstopping and support function of regional secretariats and international organizations can play a role in this regard.
• Consolidating and streamlining the IIA network at the regional level
Regional investment policymaking has led to increasing overlaps and inconsistencies within the IIA universe. Most of the regional agreements to date have not phased out pre-existing BITs between members of the regional grouping, which leads to a multiplication of treaty layers. The parallel existence of such prior BITs and the subsequent regional agreements poses a number of systemic legal and policy questions, adds to the “spaghetti bowl” of intertwined treaties and complicates countries’ ability to pursue a coherent, focused international engagement on investment policy issues (UNCTAD, 2013b; WIR13).
Although to date parallelism has been the prevalent approach, current regional and megaregional IIA negotiations (e.g. negotiations for the EU–United States Transatlantic Trade and Investment Partnership (TTIP) or for the Trans-Pacific Partnership (TPP)) present an
opportunity to consolidate the existing network of BITs. Eight megaregional agreements concluded or under negotiation in which BIT-type provisions are on the agenda overlap with 140 agreements (45 bilateral and regional “other IIAs” and 95 BITs) (figure IV.9; see also WIR14).
Figure IV.9. Existing IIAs and new bilateral relationships created, for eight regional agreements concluded or under negotiation (Numbers)
Existing BITs Existing other IIAs New bilateral relationships
8
10
7
9
14
68
2
2
26
28
2
1
1
28
21
19
22
5
103
ASEAN-India InvestmentAgreement (2014)
ASEAN-China InvestmentAgreement (2009)
EU-Japan
CETA (EU-Canada)
TTIP (EU-United States)
TPP
RCEP
PACER Plus
Figure IV.10.Cumulative number of BITs that can be terminated or renegotiated at any time
Before2014
2014 2015 2016 2017 2018 By end2018
1,598
1,325 75
57
54
47
40
Source: UNCTAD, IIA database.Note: “New bilateral IIA relationships” refers to the number of new bilateral IIA relationships created between countries upon signature of a megaregional
agreement.
Source: WIR13.

World Investment Report 2015: Reforming International Investment Governance162
If the States that are parties to these forthcoming
agreements opted to replace the pre-existing BITs
between them, it would be a noticeable step towards
streamlining the global IIA regime. A similar approach
could be envisaged for existing regional agreements
or initiatives with an investment dimension, where
the abrogation of the BITs between the respective
treaty partners could help consolidate the global
IIA regime. Should the underlying BIT provide for
desirable features that are absent in the subsequently
negotiated regional agreement, such features could
be included – if necessary over time – in the region’s
legal framework for investment. Current discussions
in the European Union offer valuable insights in this
regard; similar initiatives have also been discussed
in other regions with developing-country members.
Importantly, any such actions would need to cater
to regional specificities. The fact that between 2014
and 2018, more than 1,500 BITs will reach the stage
where they could be terminated by a party at any time
creates a further opportunity for consolidation and
streamlining (figure IV.10). Abrogation could commence
with those treaties, in which the initial duration has
expired or is soon to expire. In order to use treaty
expirations to instigate change in the IIA regime, there
is a need to understand how BIT rules on treaty
termination work, so as to identify when opportunities
arise and what procedural steps are required
(UNCTAD, 2013c; WIR13).
To this can be added more options on how regional
IIA reform can contribute to the streamlining of the IIA
regime. For example, a common regional IIA model
can serve as the basis for future negotiations with
third parties, with the potential to result in treaties
that will be similar to each other; regional sharing of
experiences and consensus-building can generate
common approaches and inform countries’ actions
at the national, bilateral and multilateral levels, thereby
contributing to a more coherent, more harmonious
and possibly also more consolidated IIA regime (see
also section C).
Managing the interaction between IIAs and other bodies of international law
IIA reform needs to take into account the interaction
between investment treaties and other bodies of
international law in order to avoid inconsistencies and
seek synergies (mutual supportiveness).
First, IIAs interact with other areas of international
law, such as international environmental law, labour
law, human rights law or trade law. Owing to the
fragmentation of international law into different
“systems” that pursue their own objectives, past
ISDS cases have revealed tensions between IIAs and
these other parts of international law. Addressing this
relationship in IIA reform can help avoid conflicts and
provide arbitral tribunals with guidance on how to
interpret such interaction.
In practice, reform efforts may reaffirm, in the IIA,
parties’ commitments under other relevant international
law instruments, such as the ones mentioned above.
A variant of this approach is to clarify that the IIA
needs to be read in line with parties’ obligations under
international law in other areas (i.e. States’ duty to
protect, respect and fulfil human rights). Countries may
also include general exceptions in favour of certain
public policies covered by such other international law
obligations.
Second, reform steps in IIAs would also benefit
from parallel reform efforts in other international law
instruments dealing with foreign investment. For
example, future treaties dealing with policy areas that
potentially interact with IIAs could specify that States’
efforts to implement these treaties are not constrained
by any IIAs they have signed.
A third type of interaction arises in areas where IIA
reform efforts and developments in other bodies
of law go hand in hand, as is the case with CSR
standards. IIAs do not need to establish their own CSR
provisions, but instead may refer to other relevant non-
binding instruments, such as the ILO Tripartite MNE
Declaration, the UN Principles on Business and Human
Rights, the FAO/World Bank/UNCTAD/IFID Principles
on Responsible Agricultural Investment, or the OECD
Guidelines on Multinational Enterprises. This approach
avoids lengthy and difficult negotiations on CSR
issues in the IIA, and it also allows any potential future
reinforcements, updates or subsequent developments
of existing CSR principles and guidelines to make their
way into the IIAs referring to them. Interaction could
also extend to the areas of implementation. And,
interaction could extend to encouraging those who
design CSR and business and human rights strategies
to consider IIAs and investment policymaking when
doing so.

CHAPTER IV Reforming the International Investment Regime: An Action Menu 163
A final type of interaction arises with respect to IIA reform in the area of investment dispute settlement. Not only IIAs, but also other international conventions – in particular the ICSID Convention, the UNCITRAL Arbitration Rules and the New York Convention – lay down the rules for investor access to dispute settlement, arbitration procedures, and recognition and enforcement of arbitral awards. To the extent that IIA reform modifies investors’ access to ISDS, changes procedural rules or introduces new mechanisms (e.g. an appeals facility or an international court), this might require reform steps not only in the IIA, but also in these other international conventions.
This last aspect also offers opportunities for synergies, because there is the option to translate reform actions at the multilateral level into a great number of existing IIAs, thereby avoiding the need for many time-consuming renegotiations. The recently adopted UNCITRAL Transparency Rules and the UN Transparency Convention provide an example: together they create an opt-in mechanism for countries that wish to incorporate enhanced transparency standards for ISDS proceedings, including in those ISDS cases that are brought pursuant to pre-existing IIAs concluded by these countries.
Linking IIA reform to the domestic policy agenda
IIA reform does not exist in isolation, but has important linkages to the domestic policy agenda. Investment policies interact with numerous other policy areas, including trade, finance, taxation, industrial policy, intellectual property, environmental protection, social and labour policies, human rights, health and cultural policies. It is critical that different government authorities work together in identifying common IIA reform goals and implementing a joint reform strategy.
In particular, IIA reform needs to take into account the following linkages with the domestic policies of host and home countries.
First, it must be re-emphasized that primary conditions for admission and operations of investors,
the legislative framework within which all investors exist, are created at the national level. This internal environment, which includes the ability of domestic institutions to maintain and enforce applicable laws and regulations, is a crucial factor determining investors’ decisions about the location of their investments. IIAs act as a complement but do not replace the need for a high-quality domestic policy environment and effective institutions. IIA clauses that emphasize the importance of such a well-functioning regulatory environment, including modern environmental, health or labour standards, can help support States in their efforts in this regard.
Second, the domestic policy framework is key for determining how much regulatory freedom a country requires in order to ensure that its current and future regulatory needs are not inhibited by IIA obligations. This has emerged as a particularly important issue in respect of pre-establishment IIAs. It is important therefore, that IIA negotiations are informed by a proper assessment of its existing, and potential future, domestic regulatory environment.
Third, IIA obligations must be aligned with the relevant domestic laws and regulations. Thus, for example, if IIA reform seeks a clarification of the FET standard or of the concept of indirect expropriation, care needs to be taken in how these principles are dealt with under domestic law in order to avoid differences. This is especially important if the country follows the “no greater rights” philosophy in relation to IIAs. In addition, if IIA reform limits investor access to ISDS, it becomes important to ensure that local remedies are adequate.
Finally, in some cases, IIAs may trigger reform steps at the national level. One case in point is IIA-driven investment liberalization, which may necessitate changes in the host countries’ entry policies for foreign investment. Another example is the possible need for modifications in host countries’ domestic investment guarantee schemes if IIAs call for environmental or social impact assessments.

World Investment Report 2015: Reforming International Investment Governance164
Description1. Harness IIAs
for sustainable development
The ultimate objective of IIA reform is to ensure that the IIA regime is better geared towards sustainable development objectives while protecting and promoting investment.
2. Focus on critical reform areas
The key areas for reform are (i) safeguarding the right to regulate for public interest, (ii) reforming investment dispute settlement, (iii) strengthening the investment promotion and facilitation function of IIAs, (iv) ensuring investor responsibility, and (v) enhancing systemic coherence.
3. Act at all levels The reform process should follow a multilevel approach and take place at the national, bilateral, regional, and multilateral levels, with appropriate and mutually supportive action at each level.
4. Sequence properly for concrete solutions
At each level, the reform process should follow a gradual, step-by-step approach, with appropriately sequenced and timed actions based on identifying the facts and problems, formulating a strategic plan, and working towards concrete outcomes that embody the reform effort.
5. Ensure an inclusive and transparent reform process
The reform process should be transparent and inclusive, allowing all stakeholders to voice their opinion and to propose contributions.
6. Strengthen the multilateral supportive structure
The reform process should be supported by universal and inclusive structures that help coordinate reform actions at different levels by offering backstopping, including through policy analysis, technical cooperation, and a platform for exchange of experiences and consensus-building.
Source: UNCTAD.
Table IV.8. Guidelines for IIA Reform
C. IIA REFORM: GUIDELINES AND ACTIONS
1. Guidelines for IIA reform
IIA reform should be guided by the goal of harnessing
IIAs for sustainable development, focusing on key
reform areas, and following a multilevel, systematic
and inclusive approach.
Six Guidelines for IIA Reform guide any reform action, be it undertaken at the national, bilateral, regional or multilateral levels (table IV.8). Inspired by the UNCTAD Investment Policy Framework’s Core Principles, the lessons learned from 60 years of IIA rule making and the specific reform challenges of today, these six guidelines aim at harnessing IIAs for sustainable development.
2. IIA reform: actions and outcomes
IIA reform actions should be synchronized at the
national, bilateral, regional and multilateral levels. In the
absence of a multilateral system, the best way to make
the IIA regime work for sustainable development is to
collectively reform the regime with a global support
structure.
Actions for sustainable-development-oriented IIA reform can be and have to be undertaken at all levels – the national, bilateral, regional and multilateral levels
(table IV.9). At each level, the reform process would broadly follow a sequence of steps that include (1) taking stock and identifying the problems, (2) developing a strategic approach and an action plan for reform, and (3) implementing actions and achieving the desired outcomes.
The actions described below differ in their complexity, ease of implementation and impact. It is therefore important for each country to establish some sort of sequencing of reform actions, identifying actions for the near-, medium- and long-term future.
a. Actions at the national level
In its very nature, national-level reform action is unilateral. Accordingly, its potential to create actual change in terms of a new and more sustainable-development-friendly IIA regime is limited. However, national-level action is crucial for preparing proper IIA reform actions at the other (i.e. bilateral, regional and multilateral) levels, and it constitutes the very first step to harness the potential of IIAs for the sustainable development of a country.
National IIA reform needs to be accompanied by domestic reform efforts geared towards improving the regulatory framework for investment.

CHAPTER IV Reforming the International Investment Regime: An Action Menu 165
In other words, IIA reform needs to be accompanied by action regarding those issues that IIAs are supposed to address by overcoming deficiencies and providing guarantees and “insurance”. This is important not only for avoiding the potential negative effects of IIA reform in terms of creating transaction costs, but also for further fine-tuning the role of IIAs in a country’s development strategy. Indeed, one of the arguments for IIA reform is that the domestic regulatory regime of many countries has evolved to such a degree that classical “protection-focused” IIAs are no longer adequate instruments for harnessing investment for sustainable development.
All national level reform actions would benefit from involving all stakeholders, including through intermin-isterial consultations, parliamentary engagement and inputs from academia, civil society and business.
IIA review
The first step for national level IIA reform is an IIA
review. Such a review takes stock of the country’s
network of IIAs, assesses the impact and risks flowing
from these agreements, and identifies concrete reform
needs (Poulsen et al., 2013; Tietje et al., 2014).
More specifically, this includes analysing a country’s
IIA profile, i.e. reviewing the country’s existing IIAs
in terms of partners, coverage, types and content.
A subsequent impact and risk assessment looks at
the IIAs’ economic and policy impacts. This includes
analysing their impact on investment flows and other
economic indicators (e.g. trade flows, royalties and
license payments flows, tax) and their interrelationship
with other policies (e.g. overlaps, inconsistencies with
national investment and other policies, with other
Level Take stock/identify problem Strategic approach/action plan Options for actions and outcomes
National • National IIA review • Treaty network and
content profiles• Impact and risk
assessment• Reform needs
• National IIA action plan• Design criteria and
guidelines • Reform areas and entry
points • Approaches for IIA reform • Negotiating strategy
• New model treaty • Unilateral termination • Implementation
• Domestic reform • Increased awareness • Improved institutions• Capacity-building
Bilateral • Joint IIA consultations to identify reform needs
• Plan for a joint course of action
• Joint interpretation• Renegotiation/amendment• Consensual termination
Regional • Collective review • Treaty network and
content profiles (regional IIA and BIT network)
• Impact and risk assessment
• Reform needs
• Collective IIA action plan• Design criteria and
guidelines• Reform areas and entry
points • Approaches for IIA reform
and for consolidating and streamlining the IIA network
• Consolidation/rationalization of BIT networks
• Common model• Joint interpretation • Renegotiation/amendment• Implementation/aid facility
Multilateral • Global review of the IIA regime (e.g. WIR15)• Stocktaking/lessons
learned• Identification of systemic
risks and emerging issues
• Multilateral consensus-building on key and emerging issues
• Shared vision on systemic reform
• Multilateral Action Plan• Multilaterally agreed criteria and
guidelines for systemic reform• Developing instruments and/or
institutions for facilitating reform at all levels
• Multilateral backstopping• Research and analysis• Coordination, including “bridging”
function with other bodies of law• Technical assistance• Platform/forum for consensus-building
and exchange of best practices
Source: UNCTAD.
Table IV.9. Road map for IIA reform

World Investment Report 2015: Reforming International Investment Governance166
international obligations). Such an assessment would
also look at the problems the agreements have caused
and the risks they give rise to, for example, through
ISDS cases (whether withdrawn, settled or decided
in favour of the State or the investor). Putting these
findings into the context of the country’s socioeconomic
and political realities (as stipulated in its national
development strategy and by today’s SDG imperative)
enables policymakers to draw lessons learned and
to identify concrete reform needs. Although such a
risk assessment can never be comprehensive, even
if undertaken in a rudimentary manner or in a sector-
specific manner, it can offer important insights.
• National IIA action plan
The next step is the development of a national IIA
action plan. Informed by a number of design criteria
and guidelines (e.g. as outlined in the 2012 UNCTAD
Policy Framework) and the results of the national IIA
review, the country can develop its strategic approach
towards IIA reform. Regarding the extent of reform,
the country decides whether to comprehensively
address all five reform objectives or to single out one
or two, such as safeguarding the right to regulate
and improving investment dispute settlement. This
choice informs the selection of reform areas and
entry points to focus on and the policy options best
suited for doing so. This last step benefits from
comprehensive information about international and/
or regional best practice (and state-of-the-art treaty
practice). The policy options in UNCTAD’s Investment
Policy Framework as well as those in this WIR serve
as examples.
Another key element of the national IIA action plan is the
development of a negotiating strategy. Such a strategy
sets out the concrete action steps for reforming the
different IIA relationships the country maintains. This
includes prioritizing certain relationships and setting
timelines within which they will be addressed. IIA
relationships to be prioritized include those IIAs that
have reached the end of their initial duration, those
with which major problems have occurred and those
that can be rationalized (in the context of regional
endeavours).
Determining the best way of reforming these
relationships is also important. The country needs
to decide whether certain IIA relationships should be
terminated, renegotiated or amended, all of this with
concrete timelines, according to which the country approaches its IIA reform agenda with its preferred treaty partners. Finally, also joint interpretation or the negotiation of new IIAs are options to be considered.
• New IIA model
In terms of concrete outcomes of national-level IIA reform, this includes first and foremost a new IIA model. The new model will be based on the respective strategic choices (e.g. the extent of reform), selection of reform objectives and areas, and respective policy options. A new model IIA can imply either partial amendments or a complete overhaul of the pre-existing model. By now, at least 50 countries and 4 regional integration organizations have embarked on developing a new model IIA (chapter III). A new model can be accompanied by decisions on which of the new model’s elements are priority objectives to be pursued and what fallback options exist if needed.
• Interpretative statements or treaty termination
Another set of concrete outcomes of national-level IIA reform action are unilateral actions, such as issuing interpretative statements for a treaty or terminating it. Regarding the latter, rules for treaty termination are typically set out in the BIT itself. Between 2014 and 2018, more than 1,500 BITs will reach the stage where they can be terminated at any time. Countries wishing to terminate their IIAs need to have a clear understanding of the relevant treaty provisions (especially the survival clause) as well as the broader implications of such actions (UNCTAD, 2013c; WIR11).
• Addressing bottlenecks for domestic IIA implementation and IIA reform
As a third element of the national IIA Action Plan, countries should identify their domestic IIA- implementation and IIA-reform bottlenecks. This could include at least four steps of government action. First, treaty implementation may require administrative actions to fully translate international obligations into national laws and administrative practices. Overall, IIA reform should go hand in hand with domestic regulatory adjustments to ensure coherence and create synergies. Second, the country may wish to create awareness at all levels of government concerning the countries’ international IIA-related obligations (even in the absence of disputes). Information campaigns and active training of local officials directly dealing with

CHAPTER IV Reforming the International Investment Regime: An Action Menu 167
foreign investors are examples in point. Third, there may be a need to build the necessary institutions to deal with IIA-related implementation issues. This step could range from establishing early-warning systems or ombuds-like institutional set-ups that are geared towards dispute prevention, to creating dedicated “defence” teams in the ministry charged with dispute settlement, and/or to follow-through on the direct institutional commitments in IIAs, e.g. the establishment of joint committees. Finally, in all of this work governments could identify their technical assistance and capacity-building needs and take actions on their follow-up, through bilateral, regional or multilateral assistance programmes (such as UNCTAD’s IIA work, its Investment Policy Reviews or e-governance programmes). The latter is particularly important for least developed countries and for other small and vulnerable economies.
b. Actions at the bilateral level
Bilateral reform action largely mirrors and builds on national-level actions. Bilateral action will usually create actual change in the legal instruments covering the pertinent bilateral relationship.
A joint IIA review aims at taking stock of the situation and at assessing the impact and the risks of the bilateral IIA relationship, and at identifying reform needs. This time, the review is undertaken jointly, involving the respective actors from the two countries. Such a review can take the form of consultations, possibly making use of joint review committees, and may be in the context of already existing joint economic committees or through a new, institutional set-up, whether ad hoc or permanent. Stakeholder involvement can help to inform the process.
Based on the review, the two countries would proceed to develop a plan for a joint course of action. Such a plan can include options such as (1) joint interpretative statements (in the form of memoranda of understanding) on an existing treaty (UNCTAD, 2011c), (2) amendments to or renegotiation of an existing treaty; (3) the consensual termination of the treaty either upon treaty expiration or if the treaty is superseded by a regional initiative to which both parties are members. The “survival clause” of the terminated treaty would require attention, as it affects how the termination takes effect. To limit the application of the survival clause, treaty partners could agree to amend
the IIA in question by deleting the clause before they
terminate the treaty.
c. Actions at the regional level
Regional reform action follows similar steps as national
and bilateral actions, but with additional layers of
complexity and greater potential for change.
In terms of greater complexity, regional IIA rule making
implies overlaps and inconsistencies, particularly given
the current practice in which new regional agreements
do not provide for the phasing-out of older agreements
covering the underlying respective bilateral relationships.
At the same time, regional IIA reform provides an
opportunity for more efficient and widespread reform as
it involves more than two countries, and, if undertaken
properly, would harmonize and consolidate existing
investment rules. Moreover, regional endeavours may
be subject to a different kind of dynamism than bilateral
relationships in terms of setting a reform agenda and
pursuing it. Regional integration organizations and their
secretariats offer the platforms on which regional IIA
reform could be pursued.
Again, the first step is an IIA review, this time
undertaken collectively by the members of the regional
organization/agreement and in a multi-dimensional
manner. Similar to the above, such a review would look
into the network and content profiles, assess impacts
and risks, and identify reform needs, including through
stakeholder consultations. In so doing, a collective
regional review would consider the different treaty layers
and relationships that exist in a regional context. This
would be, first and foremost, the regional agreement
in question. Second, this would include the existing
BITs among the partners to the regional undertaking,
internally (i.e. intraregional BITs with the other partners
in the regional undertaking). Third, this would include
IIAs with third parties, be they between a single member
of the regional undertaking and a third, external treaty
partner, or between the regional undertaking as such
and a third, external treaty partner. When identifying
impact and risk, attention would need to be given to the
multilayered character of this IIA network, including the
overlaps, gaps and inconsistencies, and the attendant
risks arising from it.
This special nature of the regional dimension would
inform the collective IIA action plan. For example,
when defining reform objectives, the fifth one –

World Investment Report 2015: Reforming International Investment Governance168
promoting systemic consistency – would deserve
particular attention, not only in terms of substance of
the rules but also in terms of managing the relationship
between them. Collective approaches regarding areas
for IIA reform and for consolidation and streamlining of
IIAs would be particularly important.
Collective approaches will translate into specific, time-
bound actions and outcomes. In terms of actions,
they range from further discussions and consultations
to negotiations, amendments/renegotiations or
interpretation of treaties. When it comes to addressing
existing treaties, underlying BITs that have reached
their expiration dates could be the first to be tackled;
however, also other regional undertakings that have
long not been updated or modernized are candidates
for IIA reform.
In terms of specific results, regional reform efforts
could result in a new, common IIA model or a
negotiating position for future treaties, a joint
interpretation; a renegotiated/amended treaty; the
consolidation/streamlining of underlying BITs. Again,
the renegotiated treaties can be the regional treaty at
issue, or a treaty between the region and third parties.
A renegotiated regional treaty can also result in the
termination of the underlying bilateral treaties. With this
latter outcome, regional IIA reform action can directly
support the broader IIA reform effort of streamlining
and rationalizing the global IIA regime.
Similar to national-level reform action, regional IIA
reform may require regulatory adjustments at the
national level to ensure coherence and create synergies.
This could be aided by creating new – or improving
existing – regional facilities to provide coordination and
technical cooperation. The latter could include legal
aid and/or training for dispute management and/or
prevention, help with translating regional obligations
into national laws and administrative practices, follow-
through on direct treaty commitments for regionally
institutionalized investment promotion and facilitation,
and, more broadly, assistance with the implementation
of IIA reform at the regional and/or national level (e.g.
assistance for conducting a national risk assessment,
or the implementation of identified reform action,
such as the termination or renegotiation of an existing
agreement). Regional technical assistance and
capacity-building bodies could serve as counterparts
to, and benefit from, international organizations
providing such support.
d. Actions at the multilateral level
Reforming an IIA regime consisting of thousands of
agreements is a global challenge that calls for common
responses from all parties involved. Such a global reform
effort, if successful, would be the most efficient way of
addressing the sustainable development challenges,
inconsistencies and overlaps that characterize the
current IIA regime. At the same time, multilateral IIA
reform is the most challenging reform option, particularly
regarding how to pursue it.
Several levels of multilateral IIA reform, with increasing
intensity, depth and character of engagement, can be
identified. They interact with the steps and actions
undertaken at the other levels of IIA reform actions
and, similarly to them, they could benefit from inclusive
and transparent multistakehoder engagement.
• Global IIA review
First, there is a global review of the IIA regime, aimed at
taking stock of experiences and at identifying systemic
risks and emerging issues. Such a review could take
the form of a series of brainstorming sessions or regular
multilateral exchanges of experiences and information
(e.g. in the form of consultations or hearings) and
be supported by backstopping from a multilateral
support structure. Exchanges of experiences would
enable governments and other stakeholders to learn
from each other’s experiences and best practices;
this could generate positive feedback on unilateral,
bilateral or regional reform steps and lead to a greater
harmonization of and coherence in ongoing reform
efforts.
In terms of content, a global IIA review could cover
the entire range of issues related to IIA reform (e.g.
taking stock of all norms contained in IIAs and related
instruments). It could also look at novel approaches
to be considered for unresolved issues or emerging
issues, together with their likely advantages and
disadvantages for the sustainable development
dimension of the IIA regime. Importantly, a review of
the global IIA regime would give attention to issues of
systemic importance.
• Multilateral consensus-building
Second, following the stocktaking, multilateral
consensus-building on areas for improvement could
aim at identifying areas of broad consensus and areas
of disagreement. In terms of content, consensus-

CHAPTER IV Reforming the International Investment Regime: An Action Menu 169
building can aim to develop a common understanding
of the key problems and emerging issues of the IIA
reform agenda or go so far as to involve common
reform objectives or a road map of steps or guidelines
for moving towards such common solutions. Along
these lines, the core of multilateral consensus-building
could be to identify and consolidate consensus where
it already exists, and to explore and seek a more
coordinated approach where it does not.
• Multilateral action plan
Third, a multilateral action plan could be envisioned
that could build on the global IIA review and move
multilateral consensus-building towards providing
concrete reform elements. This could take the form
of multilaterally agreed upon criteria and guidelines for
systemic reform. Such criteria and/or guidelines can
support reform efforts at the national, bilateral and
regional levels. They can also support further multilateral
action. Non-binding principles on the reform process
could take the form of recommendations addressing
member States, international organizations and
other stakeholders. Multilaterally agreed criteria and
guidelines could provide benchmarks against which
certain parameters for IIA reform could be assessed.
They could address systemic risks and emerging
issues, and guide reform actions in this regard.
Guiding principles for the content and implementation
of investment policies and IIAs, as contained in
UNCTAD’s Investment Policy Framework, or for the
process of IIA reform, as contained in this WIR, are
examples in point. Again, an institutional support
structure can facilitate the development of such criteria
and their adoption.
Such a multilateral action plan could result in the
development of a number of multilateral instruments
that can facilitate reform on all levels. A range of
options can be foreseen:
• A checklist for IIA negotiators: A checklist would
identify those policy issues that IIA negotiators
should take into account when negotiating
or rerenegotiating an agreement as part of
sustainable-development-oriented IIA reform.
• Best practices in IIA rule making and/or IIA
reform: A compilation of individual case studies
demonstrating how countries have reformed
the IIA network to bring it in line with sustainable
development considerations, distilling both positive
and negative experiences, can provide lessons for
future reform-oriented IIA (re)negotiations.
• Model provisions (or a model agreement): Model
texts for IIA clauses in line with certain reform
objectives can guide concrete reform actions.
If undertaken in a more comprehensive manner
covering all possible reform objectives, this
could also result in a “new-generation model
agreement”. Model provisions or agreements can
also address issues related to systemic reform.
• Guidance for interpreting IIA provisions:
Guidance for interpreting treaties could improve
the transparency, predictability and stability of
international investment law, and help clarify
the substance of key provisions, including their
sustainable development dimension.
• Multilaterally agreed guidelines for investment
policymaking: Multilaterally agreed guidelines
or principles for investment policymaking such
as UNCTAD’s Policy Framework could ensure a
coherent, holistic and synergetic approach to IIA
reform.
A multilateral action plan could also result in multilateral
institution-building related to IIA reform, as is already
envisioned in the ISDS context – with a possible appeals
mechanism or a potential international investment
court. Although this is currently considered foremost
in the bilateral context (e.g. various United States IIAs
provide for the undertaking of an appeals mechanism in
the future) and at the regional level (e.g. the European
Commission’s suggestions for a permanent investment
court in future IIAs signed by the European Union
(European Commission, 2015)), it could also take on
an international dimension. One example is a possible
appeals facility under the ICSID Convention. Another is
the European Commission’s proposal to “multilateralise
the [permanent investment] court either as a selfstanding
international body or by embedding it into an existing
multilateral organization”.9 It is important in this context
to recall that ISDS is an enforcement mechanism as
regards the substantive provisions of IIAs and cannot
be looked at in isolation. Hence, multilateralizing the
enforcement mechanism would greatly benefit from
multilateralizing the underlying substantive investment
rules as embodied in IIAs.
Multilateral engagement on IIA reform could also
result in creating an instrument that would follow the

World Investment Report 2015: Reforming International Investment Governance170
example of the Convention on Transparency in Treaty-
based Investor–State Arbitration developed under the
auspices of UNCITRAL; i.e. a multilateral consensus
on a clearly defined key IIA reform issue. In this
approach, States could sign on to a general statement
clarifying the concept of a particular IIA provision
and applying it to existing and/or future treaties. This
could take the form of a multilateral instrument that
would co-exist with the existing IIA network. It would
address those provisions (common to most BITs)
where need for sustainable-development-oriented
reform is deemed most important by the parties,
and in the manner agreed upon by the parties. This
could allow countries to reform their entire portfolios
of investment treaties at once; i.e. parties to the
amended multilateral instrument could agree that
the revised provision – transparency in case of the
UNCITRAL Arbitration Rules – shall apply not only in
respect of future IIAs, but also with regard to existing
investment treaties. Although it could prove difficult to
find consensus among all States on the formulation of
controversial substantive provisions (such as FET or
indirect expropriation), agreement that takes the form
of softer instruments could be envisioned as a first
step, thereby progressively moving towards finding
common ground.
• Backstopping
Any multilateral engagement would benefit from
a multilateral support structure that could offer
backstopping functions. This includes collecting and
disseminating comprehensive up-to-date information
about international best practices, state-of-the-
art treaty making and the latest developments in
adjacent fields of law. It also encompasses acting as
repositories of change initiatives, undertaking research
and policy analysis on reform options and their pros
and cons, coordinating among various processes at
different levels and dimensions, and providing the
“bridging” function with other bodies of law (e.g.
human rights or environmental law) that would ensure
two-way coherence and mutually beneficial exchange.
Backstopping also entails the provision of technical
assistance and capacity-building for implementing
IIA reforms, ranging from advisory services and
training to awareness-raising work and information
dissemination.
Such technical assistance backstopping could
take the form of a multilateral aid facility that would
provide legal assistance and/or training for dispute management and/or prevention, along the lines of what the Advisory Centre for WTO Law provides for certain developing-country WTO members. An investment aid facility could build on this by also helping beneficiaries, in particular least developed countries and other small and vulnerable economies, to ensure compliance with international obligations in national laws and administrative practices, provide institutionalized investment promotion and facilitation services on an international level and, more broadly, assist with the implementation of sustainable-development-oriented IIA reform actions.
Finally, backstopping services also include the hosting of a forum for exchange of experiences, lessons learned and discourse on the way forward. Engaging with treaty partners and the broader investment-development community can help ensure a universal, inclusive and transparent discourse and fact-finding and consensus-building. UNCTAD’s World Investment Report, its World Investment Forum and its Expert Meetings are cases in point.
A multilateral support structure could take the form of creating a new international coordination mechanism that would involve several international organizations active in this field of international investment rule making. Built around a core of international organizations that combine expertise in policy analysis, technical assistance and consensus-building on this matter, this could ultimately also include a variety of relevant stakeholder organizations.
IIA reform can take place at various levels of engagement – unilateral, bilateral, regional or multilateral – and countries can select processes and formats in line with their development strategies and needs and their strategic choices about the priority, intensity, depth and character of their engagement in IIA reform. Moreover, the various paths identified are not mutually exclusive. In fact, some options are sequential steps as part of a gradual approach, and most of the actions and options could be pursued in parallel. There is also room for cross-fertilization between different reform paths. However, ultimately collective action is required to ensure that IIA reform is for the benefit of all.

CHAPTER IV Reforming the International Investment Regime: An Action Menu 171
CONCLUSION
The IIA universe is at a crossroads, and many countries and regional groupings are in the process of reviewing, reforming and revising their IIAs and their stances on the issues involved. This chapter takes stock of this ongoing debate, the arguments, the history and lessons learned, and offers an action menu or toolbox for IIA reform. It does not provide a single reform package. Rather, countries are invited to pick and choose which reform option to pursue, at which entry level and with which treaty option, and at what level and intensity of engagement. In other words, countries are invited to formulate their own reform packages.
The chapter advances UNCTAD’s earlier work on this matter, in particular its Investment Policy Framework (WIR12), the reform paths for investment dispute settlement (WIR13) and the reform paths for IIA reform (WIR14). Taking into account contributions from other stakeholders, it develops this work further to provide a holistic, coherent and multilevel blueprint for addressing
the five main reform challenges for harnessing IIAs for sustainable development: safeguarding the right to regulate for pursuing sustainable development objectives, reforming investment dispute settlement, promoting and facilitating investment, ensuring responsible investment, and enhancing systemic consistency of the IIA regime.
The chapter stresses that engagement at all levels – national, bilateral, regional and multilateral – is important to achieve the common objective of IIA reform. However, it also underscores that reform needs to be pursued with a common agenda and vision in mind, since any reform step taken without multilateral coordination will only worsen fragmentation. Only a common approach will deliver an IIA regime in which stability, clarity and predictability help achieve the objectives of all stakeholders: effectively harnessing international investment relations for the pursuit of sustainable development.
Notes1 One of the first cases was the Anglo-Iranian Oil Co. Case (United
Kingdom v. Iran) 1951 I.C.J. Rep. 89, 1952 I.C.J. Rep. 93.
2 One important difference, however, was that both the Abs-Shawcross Convention (Art. VII(2)) and the OECD Draft Convention (Art. 7(b)) provided for investor-State arbitration (conditioned upon separate advance consent of the contracting party concerned), an idea not taken up in investment treaty practice until the Indonesia–Netherlands BIT of 1968.
3 Asian Agricultural Products Ltd. (AAPL) v. Republic of Sri Lanka (ICSID Case No. ARB/87/3, Award, 27 June 1990).
4 Some countries also include a list (as described above) without explicitly including a provision entitled “FET”; the SADC model BIT and the draft Indian model BIT are examples.
5 To this purpose, IIAs usually stipulate the requirements for a lawful expropriation, i.e. for a public purpose, non-discriminatory, in accordance with due process of law and against compensation.
6 Another option is to include a broadly formulated exception for domestic regulatory measures aimed at pursuing legitimate public policy objectives.
7 Mexico v. United States (2000), Peru v. Chile (2003), Italy v. Cuba, ad hoc arbitration (2003), Ecuador v. United States, PCA (2011).
8 In June 2014, the UN Human Rights Council passed a resolution, by majority, that decided to establish an open-ended working group on a legally binding instrument on transnational corporations and other business enterprises with respect to human rights.
9 European Commission, 2015, pp. 11–12.

World Investment Report 2015: Reforming International Investment Governance172
REFERENCES
APEC and UNCTAD (2012). International Investment Agreements Negotiators Handbook: APEC/UNCTAD MODULES (IIA Handbook). Singapore: APEC Secretariat.
Bernasconi, N. (2015). “Rethinking Investment-Related Dispute Settlement”, International Institute for Sustainable Development Investment Treaty News, 6(2), May. www.iisd.org
Bundesministerium für Wirtschaft und Energie (BMWi) (2015). „Modell-Investitionsschutzvertrag mit Investor-Staat Schiedsverfahren für Industriestaaten unter Berücksichtigung der USA“. www.bmwi.de/BMWi/Redaktion/PDF/M-O/modell-investitionsschutzvertrag-mit-investor-staat-schiedsverfahren-gutachten,property=pdf,bereich=bmwi2012,sprache=de,rwb=true.pdf.
European Commission (2015). “Investment in TTIP and beyond - the path for reform”, Concept Paper. http://trade.ec.europa.eu/doclib/docs/2015/may/tradoc_153408.PDF.
Hindelang, S. and M. Krajewski (2015). Shifting Paradigms in International Investment Law - More Balanced, Less Isolated, Increasingly Diversified. Oxford: Oxford University Press.
International Monetary Fund (2012). “The Liberalization and Management of Capital Flows - An Institutional View”. Washington, D.C., International Monetary Fund.
Poulsen, L.N.S., J. Bonnitcha and J.W. Yackee (2013). “Analytical Framework for Assessing Costs and Benefits of Investment Protection Treaties”. Study prepared for the Department for Business Innovation and Skills. LSE Enterprise.
Tietje, C. and F. Baetens (2014). “The Impact of Investor-State-Dispute Settlement (ISDS) in the Transatlantic Trade and Investment Partnership”. Study prepared for the Minister for Foreign Trade and Development Cooperation, Ministry of Foreign Affairs. The Netherlands: Leiden University.
UNCTAD (2004). “International Investment Agreements: Key Issues”. Vol. 1. New York and Geneva: United Nations.
UNCTAD (2008). “International Investment Rule-making: Stocktaking, Challenges and the Way Forward”, UNCTAD Series on International Investment Policies for Development. New York and Geneva: United Nations.
UNCTAD (2009). “The Protection of National Security in IIAs”, UNCTAD Series on International Investment Policies for Development. New York and Geneva: United Nations.
UNCTAD (2010a). “Denunciation of the ICSID Convention and BITs: Impact on Investor-State Claims”, IIA Issues Note, No. 2. New York and Geneva: United Nations.
UNCTAD (2010b). “Most-Favoured-Nation Treatment: A Sequel”, UNCTAD Series on Issues in International Investment Agreements”. New York and Geneva: United Nations.
UNCTAD (2010c). “Scope and Definition: A Sequel”, UNCTAD Series on Issues in International Investment Agreements. New York and Geneva: United Nations.
UNCTAD (2010d). “Investor-State Disputes: Prevention and Alternatives to Arbitration”, Proceedings of the Washington and Lee University and UNCTAD Joint Symposium, International Investment and Alternative Dispute Resolution, Lexington, Virginia, 29 March. New York and Geneva: United Nations.
UNCTAD (2010e). “Investor-State Disputes: Prevention and Alternatives to Arbitration”, UNCTAD Series on International Investment Policies for Development. New York and Geneva: United Nations.
UNCTAD (2011a). “Expropriation: A Sequel”, UNCTAD Series on Issues in International Investment Agreements. New York and Geneva: United Nations.
UNCTAD (2011b). “Sovereign Debt Restructuring and International Investment Agreements”, IIA Issues Note, No. 2. New York and Geneva: United Nations.
UNCTAD (2011c). “Interpretation of IIAs: What States Can Do”, IIA Issues Note, No. 3. New York and Geneva: United Nations.
CHAPTER IV Reforming the International Investment Regime: An Action Menu 173
UNCTAD (2012a). “Investment Policy Framework for Sustainable Development”, New York and Geneva: United Nations. http://unctad.org/en/PublicationsLibrary/diaepcb2012d5_en.pdf.
UNCTAD (2012b). “Fair and Equitable Treatment: A Sequel”, UNCTAD Series on Issues in International Investment Agreements”. New York and Geneva: United Nations.
UNCTAD (2012c). “Transparency in IIAS: A Sequel”, UNCTAD Series on Issues in International Investment Agreements. New York and Geneva: United Nations.
UNCTAD (2013a). “Reform of Investor-State Dispute Settlement: In Search of a Roadmap Special issue for the Multilateral Dialogue on Investment”, IIA Issues Note, No. 2. New York and Geneva: United Nations.
UNCTAD (2013b). “The Rise of Regionalism in International Investment Policymaking: Consolidation or Complexity?”, IIA Issues Note, No.3. New York and Geneva: United Nations.
UNCTAD (2013c). “International Investment Policymaking in Transition: Challenges and Opportunities of Treaty Renewal”, IIA Issues Note, No. 4. New York and Geneva: United Nations.
UNCTAD (2014a). “The Impact of International Investment Agreements on Foreign Direct Investment: An Overview of Empirical Studies 1998-2014”, IIA Issues Note - working draft. New York and Geneva: United Nations.
UNCTAD (2014b). “Investor-State Dispute Settlement: A Sequel”, UNCTAD Series on Issues in International Investment Agreements. New York and Geneva: United Nations.
UNCTAD (2014c). “Investor-State Dispute Settlement: An Information Note on the United States and the European Union”, IIA Issues Note, No. 2. New York and Geneva: United Nations.
UNCTAD (2015). “Investor-State Dispute Settlement: Review of Developments in 2014”, IIA Issues Note, No. 2. New York and Geneva: United Nations.
Vandevelde, K.J. (2010). Bilateral Investment Treaties. History, Policy and Interpretation. Oxford: Oxford University Press.
WIR11. World Investment Report 2011: Non-equity Modes of International Production and Development. New York and Geneva: United Nations.
WIR12. World Investment Report 2012: Towards a New Generation of Investment Policies. New York and Geneva: United Nations.
WIR13. World Investment Report 2013: Global Value Chains: Investment and Trade for
Development. New York and Geneva: United Nations.
WIR14. World Investment Report 2014: Investing in the SDGs: An Action Plan. New York and Geneva: United Nations.


C H A P T E R V
InternationalTax and Investment
Policy Coherence

World Investment Report 2015: Reforming International Investment Governance176
INTRODUCTION: THE TAX AND INVESTMENT POLICY IMPERATIVE
Intense debate and concrete policy work is ongoing in
the international community on the fiscal contribution
of multinational enterprises (MNEs). The focus is
predominantly on tax avoidance – notably in the
base erosion and profit shifting (BEPS) project. At the
same time, sustained investment is needed in global
economic growth and development, especially in light
of financing needs for the Sustainable Development
Goals (SDGs). The policy imperative is, and should
be, to take action against tax avoidance to support
domestic resource mobilization and to continue to
facilitate productive investment.
The fiscal contribution of MNEs, or the avoidance
thereof, has been at the centre of attention for some
time. Numerous instances of well-known firms paying
little or no taxes in some jurisdictions despite obviously
significant business interests have led to public protests,
consumer action and intense regulatory scrutiny. Action
groups and non-governmental organizations (NGOs)
have brought to light cases of abusive fiscal practices
of MNEs in some of the poorest developing countries.
Broad support in the international community for
action against tax avoidance by MNEs has led to a
G20 initiative to counter BEPS, led by the Organization
for Economic Co-operation and Development (OECD),
which is the main (and mainstream) policy action in the
international tax arena at the moment.
The formulation of the post-2015 development
agenda and the financing needs associated with
the SDGs have added to the spotlight on the fiscal
contribution of MNEs as an important source of
revenue for governments and a crucial element of
resource mobilization for sustainable development.
Financing the future development agenda will
inevitably have to address the eroding tax base of all
countries and especially developing countries. MNE
tax avoidance is a real challenge. At the same time,
the SDG formulation process has also highlighted
the need for increased private sector investment.
The World Investment Report 2014 (WIR14) showed
how in developing countries public investment will be
insufficient to cover an estimated $2.5 trillion annual
investment gap in productive capacity, infrastructure,
agriculture, services, renewables and other sectors.
New private investment not only contributes directly
towards progress on the SDGs, but also adds to
economic growth and the future tax base.
The key question is thus: how can policymakers take
action against tax avoidance to ensure that MNEs pay
“the right amount of tax, at the right time, and in the
right place” without resorting to measures that might
have a negative impact on investment? In other words,
how can they maximize immediate tax revenues from
international investment while maintaining a sufficiently
attractive investment climate to protect the existing
and future tax base? If sustainable development
requires both public and private investment, the fiscal
climate for investors must be balanced for local and
foreign companies alike to ensure sufficient revenues
to support public investment and sufficient returns
to promote private investment. This is especially
pertinent for structurally weak economies and the least
developed countries (LDCs), where public investment
needs for basic development purposes are often more
acute.
The links between cross-border investment1 and tax
policy go in both directions:
• Tax has become a key investment determinant
influencing the attractiveness of a location or an
economy for international investors (box V.1).
• Taxation, tax relief and other fiscal incentives have
become a key policy tool to attract investors and
promote investments.
• Investors, once established, add to economic
activity and the tax base of host economies and
make a direct and indirect fiscal contribution.
• International investors and MNEs, by the
nature of their international operations, as well
as their human and financial resources, have
particular opportunities for tax arbitrage between
jurisdictions and tax avoidance.
The focus of this chapter is on the latter two links, on
the fiscal contribution of MNEs and the extent to which
they engage in tax avoidance, as these are at the core
of the debate in the international community today.
However, any policy action aimed at increasing fiscal
contribution and reducing tax avoidance, including the
policy actions resulting from the BEPS project, will also

CHAPTER V International Tax and Investment Policy Coherence 177
Box V.1. Tax as a determinant of FDI: what role does tax play in location decisions?
Conventional wisdom has it that tax does not play a fundamental role in investment location decisions. Multinationals make their decisions to enter a particular market mostly on the basis of economic determinants – e.g. the size and growth of a market, access to resources or strategic assets, and the cost of factors of production. Moreover, a host of non-tax policy determinants are generally considered more relevant for location decisions, such as the stability and predictability of the business climate, the strength of commercial law and contract enforcement, trade restrictions, the intellectual property (IP) regime, and many others.
In this view, tax does not so much drive locational decisions as it drives the modality of the investment and the routing of investment flows. Top managers of MNEs decide to enter a given market largely independent of tax considerations, and their tax advisers then structure the investment in the most tax-efficient manner. The fact that a significant share of global investment is routed to its final destination through special purpose entities (SPEs) and tax havens, discussed later in this chapter, lends credence to this view.
The relevance of tax in investment decisions is generally considered low for resource- and strategic asset-seeking investments and for market-seeking investments, and only one of many determinants driving location decisions for efficiency-seeking investments. However, a number of nuances require consideration.
• Resource-seeking investments can be highly capital intensive and have very long gestation periods. Calculations of expected returns can be extremely sensitive to cost factors, of which tax is an important one. Investments tend to be subject to long and arduous negotiations over precisely how rents are distributed between investors and states, and through what fiscal mechanisms. The fact that negotiators on both sides make trade-offs between different levying mechanisms (e.g. taxes versus royalties) should not be mistaken for a lack of attention to any one of them. Moreover, stability and predictability in the fiscal treatment of these investments are crucial, given their long-term nature and long payback periods.
• Market-seeking investments per se may appear to be less sensitive to tax. But the modus operandi of investors can be strongly influenced by tax. The extent to which MNEs source and produce locally or rely on imported value added, key to the development impact of foreign investments on host economies, is clearly influenced by tax. The common view that market-seeking investments are less sensitive to tax tends to confuse the market-entry decision with actual investment in productive capacity.
• Efficiency-seeking investments, through which MNEs look for low-cost locations for parts of their production process, are highly sensitive to tax. Counter-intuitively, for many of these investments low tax rates do not actually feature high on the list of locational determinants that MNEs consider, because the expected rate is exceedingly low. Due to the nature of these investments, they tend to be located in special economic zones or fall under special regimes. The differentials across locations in labour costs and productivity, availability and cost of land and other factors of production, and trading costs, tend to be far more important than tax rate differentials at such low levels. However, it is the tax base that is really of interest to investors in efficiency-seeking operations, as these are often steps in the global value chains of MNEs, and transfer pricing plays a prominent role. In addition, low taxes on international transactions are obviously a key determinant. Without special regimes, economies are often at a disadvantage for efficiency-seeking investments, confirming the fact that tax can be a key locational determinant.
Thus the importance of tax as a locational determinant risks being generally underestimated. The growth of global value chains, which has increased the relative weight of efficiency-seeking investments in the mix, has served only to make tax an even more important factor in countries’ attractiveness and this trend is likely to continue.
It is not only the level of taxation that matters in investment decisions. It is also the ease with which tax obligations can be fulfilled that is important. Indicators of the ease of doing business – covering a range of administrative procedures relevant to business operations, including paying taxes – generally feature prominently in location comparisons presented to investors. UNCTAD’s Business Facilitation programme, which helps developing countries simplify administrative procedures for investors, prioritizes procedures for paying taxes immediately after procedures for business registration and licensing.
Most important is the stability and predictability of the fiscal environment in host countries. A perceived risk of significant changes in the fiscal regime or in the fiscal treatment of individual investments will tend to be a showstopper. Fiscal authorities that demonstrate the capacity to establish collaborative relationships with investors and provide confidence as to the continuing fiscal treatment of investment operations can help remove a major obstacle to investment.
In summary, tax plays an important role in location decisions, principally in three ways: the fiscal burden, the administrative burden, and long-term stability and predictability.
Source: UNCTAD.

World Investment Report 2015: Reforming International Investment Governance178
have to bear in mind the first and most important link:
that of tax as a determinant of investment.
In addition, in the debate on the public revenue
contributions of MNEs, fiscal incentives for investors
are also often considered a form of “leakage” or
“slippage” of tax revenues for governments, much
like tax avoidance schemes (although they are clearly
different in that they represent a deliberate policy
measure to attract investment). Critical questions have
also arisen as to whether MNEs are making adequate
contributions for the extraction or exploitation of
natural resources. Some of these issues feature in
the BEPS discussion where policy action is relevant,
for example, to avoid allowing incentives to become
part of the tax avoidance toolkit of MNEs, leading
them to shift profits to locations with tax holidays.
Concerns have been raised about the ability of MNEs
to play governments and locations against each other,
inducing a “race to the bottom” in tax levies. Incentives
and tax avoidance have other parallels – tolerance by
authorities of “aggressive” tax minimization schemes
can be seen as a (less transparent) alternative to
explicitly provided incentives. Nevertheless, this
chapter will not attempt to add to the vast body of
existing analysis on fiscal incentives and their relative
ineffectiveness, but rather focus on key knowledge
gaps in the ongoing international debate:
• How much do MNE foreign affiliates contribute
to government revenues, especially in developing
countries? What is the value at stake, or
the baseline, for policy action against tax
avoidance?
• How do patterns of international investment
flows and stocks drive MNE tax contributions as
well as tax avoidance opportunities, and what
is the impact on fiscal revenues for developing
countries?
• On balance, what is the net fiscal contribution
of MNE activity and what are the implications
for the links between tax and investment policy,
especially in the context of anti-avoidance policy
action and BEPS?
As such, the chapter helps lay the foundation for a
discussion on harmful tax competition.
The chapter is structured as follows:
Section A looks at the contribution of MNEs to government revenues, especially in developing countries, taking a broad approach including fiscal contributions through corporate income tax as well as other taxes, social contributions and other revenue sources including, critically, royalties on natural resources.
Section B provides the key analytical results on the magnitude and patterns of international corporate investments through offshore investment hubs. It presents an innovative perspective on indirect or transit investment patterns in the global economy – the Offshore Investment Matrix – and shows the extent to which investment and tax considerations are inextricably intertwined. The section also describes the root causes behind the outsized role of offshore hubs in global investment and reviews the most relevant MNE tax planning schemes. It specifically highlights those schemes that are most dependent on offshore structures and therefore most visible in global investment patterns.
Section C focuses on the development impact of tax avoidance schemes and estimates the related tax revenue losses for developing economies. It provides estimates that can be considered complementary to existing efforts in the international community, but derived from a new approach based on the Offshore
Investment Matrix.
Section D draws policy conclusions from taking an investment perspective on MNE tax planning practices and brings them together in a set of guidelines for Coherent International Tax and Investment Policies.
The annexes to this chapter (available online) provide the detailed methodology and approach for the two key analytical contributions: the fiscal contribution of MNEs and the investment perspective on international tax avoidance (including the Offshore Investment Matrix and the tax revenue loss calculations). The two technical annexes respond to demand in the international community for new ideas and methods to examine the fiscal impact of MNEs – including an explicit call in the G20 BEPS Action Plan. A third non-technical annex provides an overview of existing countermeasures to tackle tax avoidance and an account of the ongoing debate in the international community.

CHAPTER V International Tax and Investment Policy Coherence 179
A. MNEs AS A SOURCE OF GOVERNMENT REVENUES FOR DEVELOPMENT
Policymakers and experts at work on the BEPS project
have so far not arrived at a quantification of the value
at stake for government revenues. Various research
institutes and NGOs have put forward estimates for
the amount of taxes avoided by MNEs in developing
economies. To date, there is no estimate of a baseline
establishing the actual contribution of firms in general
and MNEs in particular.
To measure the value at stake at the intersection between international tax and investment policy, and to set a baseline for any discussion on tax avoidance by MNEs, this section examines the overall contribution of foreign affiliates of MNEs to government revenues.
In order to understand the context within which MNEs pay taxes, social contributions, and other levies and fees, the section first provides a broad picture and breakdown of government revenues overall and looks at differences in revenue collection between economies at various levels of development. This initial examination of overall government revenues is instrumental to the approach to estimating MNE contributions developed in this chapter. The approach zooms in from overall government revenues to overall corporate contributions (domestic and foreign), and finally to foreign affiliate contributions. Such an approach ensures that margins of error in estimations are confined along the way. Nevertheless, as available data on foreign operations and tax payments of MNEs are limited and fragmented, the analytical approach has been heuristic, employing a variety of sources and methods to converge towards a meaningful order of
magnitude for MNE contributions. Annex I describes in detail the data approach and analytical steps.
Looking at the broader backdrop for foreign affiliate contributions to government revenues makes clear that some characteristics of revenue collection in developing economies that might at first glance appear to be a function primarily of the fiscal behaviour of investors are in fact often due largely to structural features of the economy. This is important in the context of the ongoing Financing for Development debate, in which improving domestic resource mobilization is a key pillar under plans to fund progress towards the SDGs. Policy actions focusing on the tax contribution of foreign investors can be an effective way to increase
government revenues but must be seen as part of a
broader programme of action addressing domestic
resource mobilization.
At the same time, UNCTAD’s estimates show that the
fiscal impact of MNE foreign affiliates in developing
countries is sizable and that their contributions
represent an important part of total government
revenues. These findings support the need for a
balanced approach, through appropriate measures
that preserve the financing pool provided by foreign
affiliates while at the same time tackling tax avoidance.
It is important to note that the approach taken here
assesses not only the pure tax contribution of foreign
affiliates (corporate income as well as other taxes)
but also other contributions to government revenues,
including royalties on natural resources, as well as
the corporate share of all other forms of government
revenues, in order to provide a full picture of the value
at stake. In all cases, data are transparent and clearly
distinguish actual tax from other types of contributions.
Finally, the aim in this section is not to arrive at a value
judgement on the fiscal contribution of MNEs (i.e.
whether it is “enough”, which is for each government
to decide), but only at a rough but objective value
measurement, as a baseline for the subsequent
discussion of tax avoidance.
1. Government revenues and revenue collection in developing countries
In the context of the Financing for Development debate,
in which improving domestic resource mobilization
is a key pillar under plans to fund progress towards
the SDGs, it is important to point out that the level of
economic development is generally a more significant
driver of variations in revenue collection than natural
resource endowment or the presence of MNEs. As
a general rule, the lower the level of development of
a country, the higher is the share of corporates in
government revenue generation and the greater the
importance of non-tax revenue streams contributed
by firms, including royalties on natural resources,
tariffs and other levies.
There are large variations in government revenue
collection between countries and regions. Looking at

World Investment Report 2015: Reforming International Investment Governance180
government revenues as a share of GDP, a key driver for such variations is the level of income of economies (figure V.1). High-income countries collect, on average, about 40 per cent of GDP in taxes, social contributions and other revenues, low-income countries less than 20 per cent.
Looking at economic groupings and regions reveals a mixed picture because of large variations between countries within each region. The weighted average ratio of government revenues to GDP of developing countries is still more than 10 percentage points lower than that of developed countries. The 30 per cent of GDP collected in Africa, which compares favourably with the developing-country average of 27 per cent, is skewed by a few upper-middle-income countries with above-average revenues (mostly due to income from natural resources) that make up for much lower collection ratios in a large group of low-income countries. The lowest levels of revenue collection as a share of GDP are found among the LDCs in Asia.
Overall, the level of economic development and related issues of governance and high degrees of informality are generally more significant drivers of variations in total revenue collection than natural resource endowment or the presence of MNEs. Figure V.2, which focuses specifically on Africa, shows that at
given levels of per capita income, especially at lower income levels, the availability of natural resources and the penetration of FDI do not substantially change revenue collection as a share of GDP.
The composition of government revenues (figure V.3) reveals further insights.2
i. At the first level of disaggregation (left-hand chart in figure V.3), splitting total revenues by taxes, social contributions and other revenues (which include, among others, royalties on natural resources and official development assistance or grants), developed countries show a larger proportion of revenues in the form of social contributions, on average. Developing countries unsurprisingly rely to a much greater extent on other revenues – mostly income from natural resources. The poorest countries tend to rely most on such other revenues: they make up almost half of government revenues in LDCs and in the African region as a whole. There is a clear pattern of shifting revenues from (corporate) income taxation to other revenues related to natural resource endowment. In Africa, at a given level of revenue collection (30 per cent of GDP), resource-driven countries (those with commodity exports representing more than 75 per cent of total exports) exhibit a revenue distribution heavily
Figure V.1. Differences in government revenue collectionGovernment revenues as a share of GDP, weighted averages (Per cent)
18%
21%
29%
41%
37%
36%
Low-incomecountries
Lower-middle-income countries
Upper-middle-income countries
High-income,non-OECD countries
OECD
Global
By income level
Latin America andthe Caribbean
Transition economies
Asia
Africa
Developing economies
Developed economies
LDCsMemorandum item:
21%
46%
31%
25%
30%
27%
38%
By region
Source: UNCTAD analysis, based on the ICTD Government Revenue Dataset (release September 2014, reference year 2009).Note: Full details on data sources and methods provided in annex I.

CHAPTER V International Tax and Investment Policy Coherence 181
Average Natural resources endowment FDI penetration
-
21%
24%
39%
Low-income
Lower-middle-income
Upper-middle-income
21%
21%
42%
21%
28%
35%
21%
28%
35%
21%
24%
42%
+ -+
Figure V.2. Relationship between FDI penetration, resource endowments and government revenues Government revenues as a share of GDP, weighted averages, Africa (Per cent)
Source: UNCTAD analysis, based on the ICTD Government Revenue Dataset.Note: For FDI penetration, for each income-level group of countries, “+” is assigned to countries ranking in the top half in terms of the ratio of FDI stock over GDP.
For natural resources, “+” is assigned to countries in which the share of commodities in total exports is greater than 75 per cent.
skewed towards other revenues (at about 60 per
cent of total revenues), while income taxes account
for less than 15 per cent; by contrast, the group
of non-resource-driven countries shows income
taxes at almost 40 per cent of total revenues and
other revenues at 25 per cent. Resource-rich lower-
income countries may be making a trade-off in tax
collection from corporates between royalties (and
export revenues) on the one hand, and corporate
income taxes on the other.
ii. Breaking down the revenue category of taxes
one level further (right-hand chart in figure V.3)
shows that developed countries rely more
heavily on income taxes (50 per cent of taxes)
than developing countries (one third of taxes).
Other tax components are far more important in
developing countries, especially indirect taxes on
goods and services (such as value added tax or
VAT) at nearly half of total taxes.
It is worth noting that taxes on international trade
transactions constitute a sizable component
(one fifth) of tax revenues in LDCs, which may be
important in the context of ongoing and future trade
liberalization processes at regional or multilateral
levels.
iii. Corporate income taxes are relatively more
important in the composition of taxes for
developing countries than for developed
countries: at about 20 per cent of total taxes,
they are nearly twice as important. Conversely,
the share of personal income taxes is much more
limited in developing economies. In developing
countries, corporate taxes yield two thirds of all
income taxes; in developed countries, only one
quarter. Accordingly, as a share of GDP, corporate
income tax amounts to almost 4 per cent of GDP
in developing economies against 2 per cent in
developed economies; by contrast, the share of
personal income taxes falls to 2 per cent of GDP
in developing economies against 8 per cent in
developed economies.
The main patterns, (i), (ii), and (iii), resulting from the
regional comparison are fully confirmed (and possibly
strengthened) when adopting an income-driven
perspective (figure V.4).
It appears that for assessing the relative collection
capabilities of economies in different regions the
revenue category of social contributions and the tax
categories of personal income tax and indirect taxes
represent the most useful proxy indicators. Although
social contributions and personal income taxes are
clearly linked to overall income levels and can thus be
expected to amount to less in low-income countries,
these categories also require the more sophisticated

World Investment Report 2015: Reforming International Investment Governance182
institutional structures and collection capabilities. In contrast, indirect taxes are easier to collect. Lower shares of social contributions and personal income taxes and higher shares of indirect taxes seem to be associated with lower collection capabilities and a greater reliance on corporate income taxes.
Interestingly, corporates are instrumental in collecting all three of these categories. While they do not actually pay personal income taxes and indirect taxes out of their own pockets in theory (leaving aside specific fiscal issues such as non-recoverable VAT) they collect these taxes on behalf of government through their payrolls and from their customers. This role, not explicitly quantified in the assessment of corporate contributions, represents a significant additional
element of fiscal value added – of crucial importance in developing countries with large informal economies.
Looking specifically at the (paid) contribution of corporates (domestic and foreign firms) across all three categories of government revenues – taxes, social contributions and other revenues – confirms the significantly higher relative contribution in developing countries (almost half of government revenues) compared with developed countries (one third) (figure V.5). The difference is caused, as noted before, by higher revenues from corporate taxes (income taxes as well as taxes on international trade and other levies) and from relatively higher corporate contributions to other revenues, especially from natural resources and property. Relative to the size of the economies, the
Figure V.3. Composition of government revenues, by region (Per cent)
Composition of government revenues Share of total government revenues (%)
Composition of tax component only Share of total taxes (%)
Income tax component
Corporate income tax
Personal income tax
Goods and services
Internationaltrade
Others
Taxes Social contributions
Other revenues (e.g. royalties on natural resources, grants)
LDCs
Transition economies
Latin America andthe Caribbean
Asia
Africa
Developing economies
Developed economies
Global
Memorandum item:51
54
61
62
53
60
56
56
0
14
16
7
2
10
25
23
49
32
23
31
45
30
19
21
16*
20
21
20
30
21
11
12
10*
16
4
14
20
12
39
34
41
31
63
46
33
49
35
37
21
27
4
6
10
6
0
2
12
5
7
14
7
12
15
14
Source: UNCTAD analysis, based on the ICTD Government Revenue Dataset. Note: The classification is generally based on the standard IMF Government Finance Statistics classification. However, in the left-hand graph the category “other
revenues” includes grants (these are very small, at 1.5 per cent of total government revenues in developing economies). In the right-hand graph, income taxes (corporate and personal) reflect the IMF category “taxes on income, profit and capital gains” (“payable by corporations and other enterprises” and “payable by individuals”). The residual category “others” includes taxes on payroll and workforce, taxes on property and other taxes. Data with (*) subject to very limited coverage. Full details on data sources and methods provided in annex I.

CHAPTER V International Tax and Investment Policy Coherence 183
Key patterns in the composition of government revenues related to income levels (Per cent)
Figure V.4.
32%
25%
23%
20%
70%
65%
69%
50%
62%
65%
61%
23%
Low-incomecountries
Lower-middle-incomecountries
Upper-middle-incomecountries
High-income-countries
21%
i ii iii
53% 26%
Global average
Share of other revenues (incl. grants) in total revenues
Share of non-income taxesin total taxes
Share of corporate income taxes in total income taxes
For low-income countries, grants alone cover some 20%. For all
other income groups, the share of grants falls to around 1%.
Source: UNCTAD analysis, based on the ICTD Government Revenue Dataset. Note: Full details on data sources and methods provided in annex I.
corporate contribution to government revenues is practically the same across developed and developing economies at 13 per cent of GDP. The higher relative contribution of firms to government revenues in transition economies is due to relatively high income from natural resources and to the role of state-owned enterprises in the economy.
To sum up, government revenue collection capabilities are largely a function of levels of income and development. At lower levels of development, corporate
contributions to overall revenues and to income taxes
are more important due to the low levels of collection of
other revenue and tax categories. In addition to taxes
paid by corporates, a significant amount of other taxes
(especially indirect taxes) depend on collection by
corporates. Overall, developing countries rely more on
corporates for government revenue collection than do
developed countries; as a share of the total economy,
fiscal contributions by corporates are at similar levels
in developed and developing countries.
Source: UNCTAD analysis, based on the ICTD Government Revenue Dataset; IMF Government Financial Statistics database as complementary source. Note: Full details on data sources and methods provided in annex I.
Figure V.5. Contribution to government revenues by �rms, domestic and foreign (Per cent)
Taxes Social contributions Other revenues
Contribution paid by �rms as a share of GDP
Contribution paid by �rms as a share of government revenues
27
20
11
13
7
5
13
11
23
22
10
13
Transition economies
Developing economies
Developed economies
Global 13%
13%
13%
26%
37%
34%
47%
57%

World Investment Report 2015: Reforming International Investment Governance184
2. The contribution of MNEs to government revenues
MNEs are important tax contributors worldwide, and in
developing countries in particular. UNCTAD estimates
the contribution of foreign affiliates to government
budgets in developing countries at about $730 billion
annually. This represents, on average, about 23 per
cent of corporate payments and 10 per cent of total
government revenues. (In developed countries these
shares are lower, at roughly 15 per cent and 5 per
cent, respectively, underlining the higher dependence
of developing countries on foreign corporate
contributions). African countries show the highest
relative contribution of foreign affiliates, at more than a
quarter of corporate contributions and at 14 per cent
of total government revenues. Overall, contributions
through royalties on natural resources, tariffs, payroll
taxes and social contributions, and other types of
taxes and levies are on average more than twice as
important as corporate income taxes.
The previous section looked at the level and composition
of overall government revenues and at the contribution
made by corporates (domestic and foreign firms). This
section zooms in on foreign affiliates3 specifically. In
order to do so, two new approaches to estimating
MNE fiscal contributions have been developed:
1. Contribution Method. This approach is based
on the economic contribution of foreign affiliates
to host economies. It estimates the share of
economic activity generated by foreign affiliates
(profits, employment, value added, exports) and
applies it to relevant components of the corporate
contribution.
2. FDI-Income Method. This approach is based on
country-by-country balance-of-payments data
on FDI income. For the main developing regions
it estimates the corporate income taxes paid by
foreign affiliates by applying a suitable average
effective income tax rate to the equity component of
FDI income. It then calculates the contribution items
other than income taxes based on the estimated
weight of income tax in the total contribution paid
by the average corporation operating in the region.
The two approaches should not necessarily lead to the
same result. In fact, the FDI-income method should
in theory yield a lower-bound estimate, given that it
can take into account only the income on the foreign-
owned part of directly invested enterprises, rather
than the full income of foreign affiliates (although the
difference should not be large). Nevertheless, the
estimates are broadly consistent, putting the total
contribution of MNE foreign affiliates to developing-
country government revenues at around $730 billion
annually, representing the midpoint of a range,
including a lower bound of about $650 billion and an
upper bound of about $800 billion. Apart from serving
as a cross-check, the two independent approaches
allow for different perspectives and provide different
insights, discussed below. Comprehensive details on
data and statistical methods are contained in annex I;
box V.2 provides a brief summary of limitations of the
approach and alternative assumptions.
Figure V.6, based on the contribution method,
provides the relevant orders of magnitude and shares
for developing economies, from total government
revenues to the total contribution of foreign affiliates
and the breakdown across the main contribution
items. Out of total government revenues of
$6.9 trillion (27 per cent of 2012 GDP, see figure V.1), 47
per cent is paid by the corporate sector (see figure V.5),
corresponding to some $3.2 trillion. The share of the
corporate contribution pertinent to foreign affiliates is
about one quarter (23 per cent), corresponding to $725
billion or 10 per cent of total government revenues. This
contribution includes 60 per cent ($430 billion) of taxes
and social contributions and 40 per cent ($295 billion)
of other revenues. The bulk of these other revenues
represents royalties on natural resources.
Within taxes, the subcategories show a slightly different
pattern than for corporates as a whole (including
domestic firms). While the corporate income tax
component is similar, at half of total taxes and social
contributions, the share of taxes on international trade
transactions is relatively higher for foreign affiliates,
at 20 per cent, due to the large share of exports
accounted for by foreign affiliates in many developing
countries (see WIR13). In contrast, the share of payroll
taxes and social contributions paid by foreign affiliates
is relatively low compared with that paid by domestic
firms due to the more capital-intensive nature of
many of their operations. Clearly this is an aggregate
developing-country picture, with large variations for
individual countries and regions, explored below.
As discussed in the previous section, in addition to
taxes paid by foreign affiliates, which include not

CHAPTER V International Tax and Investment Policy Coherence 185
only corporate income taxes but also payroll taxes and social contributions, taxes on international transactions, and a host of other taxes, levies and fees, MNEs contribute to government revenues by collecting income taxes from employees, as well as indirect taxes. These taxes are not borne by the MNE; they represent only a compliance cost. In economies with large informal sectors or with relatively limited collection capabilities in the tax authorities, this role can be very important. The collection of taxes on goods and services (e.g. VAT) is especially relevant, as it represents the largest component of developing countries’ total tax revenues (at about 50 per cent). As a consequence, tax collection contributions by MNEs are also relevant, covering another 6-plus per cent of government revenues.
Leveraging the FDI-income method to look at the pattern by region (figure V.7), the average 10 per cent foreign affiliate contribution to government revenues becomes 14 per cent in Africa and 9 per
cent in Latin America and the Caribbean (down to 5 to 7 per cent in South America, compensated by higher shares in the Caribbean), with developing Asia representing the average as well as the bulk of overall absolute contributions. The regional variation reflects in part the relative importance of foreign affiliates in the economy of each region, and in part the foreign affiliate contribution to other revenues – in particular to royalties on natural resources. The relative shares of tax and social contributions seem comparable across regions, although when considering South America separately, the relative share of other revenues (resource-related) increases. Summing foreign affiliates’ fiscal contributions across regions leads to a global contribution of $730 billion, in line with the value reported in figure V.6 through the contribution method.
The methodology developed in this chapter not only provides inputs relevant to the international discussion on MNE taxation and development, especially through the establishment of a baseline for the actual
Sources: UNCTAD estimates, based on the ICTD Government Revenue Dataset; IMF Government Financial Statistics database; United Nations System of National Accounts; Eurostat; U.S. Bureau of Economic Analysis; International Labour Organization; literature review.
Note: Estimates represent range midpoints. Details on data and methods contained in annex I.
100%
47%(100%)
10%(23%)
6%
Corporateincome tax
Internationaltrade taxes
Labor and social contributions
Other taxes
50%
10%
10%
30%
CONTRIBUTION METHOD
Figure V.6.Government revenues contributed by foreign af�liates of MNEsShare of government revenues, developing countries, reference year 2012 (Per cent and billions of dollars)
36%(77%)
4%
53%
Absolute values, Billion of dollars6,900 3,200 725 295 430
Totalgovernmentrevenues
Non-corporatecontribution
Corporatecontribution
Contributionby domestic�rms
Contributionby foreign af�liates
Foreignaf�liates,other revenues
Foreignaf�liates, taxes and social contributions

World Investment Report 2015: Reforming International Investment Governance186
Box V.2. Limitations, alternative assumptions and further research
The analysis of the contribution of MNE foreign affiliates to government revenues presented in this section aims to arrive at meaningful “order of magnitude” estimates. Both the economic contribution and the FDI-income methods developed for this analysis rely on assumptions and approximations to overcome the paucity of relevant data available. The following are some of the most important limitations and assumptions. Full details can be found in annex I.
A meaningful estimate of the actual contribution of foreign affiliates must be calculated net of any profit shifting. The contribution method, however, cannot exclude one form of profit shifting, thin capitalization, because it relies on the national accounts concept of operating surplus to derive profit ratios. A simulation of the impact of this limitation, using extreme assumptions, would bring down the overall contribution from $730 billion to about $650 billion – the lower bound of the estimation range. The separate FDI-income method does not present this problem.
The contribution method has another limitation. It does not separate corporate and non-corporate business income in the baseline for the calculation of foreign affiliates’ contribution to corporate income. Removing non-corporate business income, which would be unlikely to contain any foreign affiliate contribution, would have the effect of increasing the foreign affiliate share in the remaining corporate income part, thereby increasing the share paid by foreign affiliates in total corporate income taxes. Simulation of this effect yields the upper-bound estimate for the total foreign affiliate contribution of about $800 billion. Again, the FDI-income method does not present this problem.
Assumptions regarding the average effective tax rate (ETR) paid by foreign affiliates play an important role, in particular in the FDI-income method. In that method, the ETRs for the developing regions, ranging between 20 and 25 per cent, are based on external studies and confirmed by UNCTAD’s own firm-level analysis, which also finds that ETRs for foreign affiliates and domestic firms are substantially aligned. Other studies have also found no evidence of a substantial difference in ETR between domestic companies and MNEs. The contribution method does not use a specific ETR but, consistent with the empirical findings, it uses the assumption that rates are the same for foreign affiliates and domestic firms.
As uniform ETRs for foreign affiliates and domestic firms may appear counter-intuitive, two important points should be made:
• The fact that domestic firms and foreign affiliates are found to have similar ETRs does not preclude that MNEs, at the consolidated level, may have significantly lower ETRs due to base erosion and profit shifting. (ETRs are calculated on the tax base that remains in foreign affiliates after profit shifting.)
• Many developing countries provide fiscal incentives to MNEs, which (in sofar as they lower the tax rate rather than the base) would normally imply lower ETRs for foreign affiliates than for domestic firms. While incentives may have a significant impact at the individual country level, at the aggregate level the empirical evidence does not clearly show this. Better and more disaggregated data and further research will be needed to quantify the effect of fiscal incentives.
Finally, a number of assumptions have been made regarding the corporate shares of government revenues across individual revenue categories. These ultimately feed into both the contribution and the FDI-income methods. For each revenue category, the estimation approach determines whether the contribution is made by corporates, made partly by corporates, or not made by corporates. Varying allocations are of course possible and may lead to a wider range of estimates. However, the allocation criteria used here reflect the formal definition and the default application of each revenue category. Different criteria would require the introduction of additional assumptions.
To date, the methods and estimates presented here represent the most comprehensive and systematic picture of the total fiscal contribution of MNE foreign affiliates. Future research efforts may build on the approach developed in this section, experiment with different assumptions, explore methods to reduce approximation errors and, most useful of all, seek ways to disaggregate data at the country level.
Source: UNCTAD. Full details are provided in annex I.
value at stake, but from the business perspective it also provides an indication of the fiscal burden for the average foreign affiliate. Adopting an approach similar to the World Bank’s Paying Taxes study, the fiscal burden for foreign affiliates is measured as the ratio between the fiscal contribution and an adjusted measure of profits (“commercial profits” in the Paying
Taxes terminology), gross of all relevant contribution items (including above-the-line contribution items).
The resulting fiscal burden on MNE foreign affiliates – taking into account taxes and social contributions only – represents approximately 35 per cent of commercial profits (figure V.8). The inclusion of “other revenues” (in both the numerator and the denominator of the ratio) significantly increases the estimate of the fiscal burden compared with that found using the more standard approach of considering only taxes and social contributions. The total contribution to government

CHAPTER V International Tax and Investment Policy Coherence 187
Sources: UNCTAD estimates, based on the ICTD Government Revenue Dataset; IMF Government Financial Statistics database; IMF Balance of Payments Statistics.Note: Details on data and methods contained in annex I.
Figure V.7. Government revenues contributed by foreign af�liates of MNEs, by developing regionReference year 2012 (Per cent and billions of dollars)
FDI-INCOME METHOD
6
6
6
6
3
5
8
5
Latin America and the Caribbean
Asia
Africa
Developingeconomies 11%
14%
11%
9%
23%
26% 85
24% 490
21% 155
730
Foreign af�liate (FA) contribution as a share of government revenues
FA contribution as a shareof corporate contribution
Estimated FA contribution (billions of dollars)
Taxes and social contributions Other revenues
revenues represents about 50 per cent of foreign affiliate commercial profits, with minor variations by region.
Comparison with the same calculation for developed economies reveals that the fiscal burden based only on taxes and social contributions is lower in developing
economies (35 per cent of commercial profits against
56 per cent in developed economies); however,
including other revenues in the equation leads to a partial
convergence of the ratios (50 per cent in developing
economies against 65 per cent in developed economies).
Sources: UNCTAD estimates, based on the ICTD Government Revenue Dataset; IMF Government Financial Statistics database; IMF Balance of Payments Statistics.Note: Details on data and methods contained in annex I.
FDI-INCOME METHOD
Effective �scal burden calculated on taxes and social contributionsShare of commercial pro�ts
Effective �scal burden calculated on all contribution itemsShare of commmercial pro�ts
Latin America andthe Caribbean
Asia
Africa
Developingeconomies
41%
33%
33%
35%
53%
49%
54%
50%
Figure V.8. The �scal burden on foreign af�liates of MNEs (Per cent)

World Investment Report 2015: Reforming International Investment Governance188
B. AN INVESTMENT PERSPECTIVE ON INTERNATIONAL TAXATION
MNEs build their corporate structures through cross-
border investment. They will construct those corporate
structures in the most tax-efficient manner possible,
within the constraints of their business and operational
needs. The size and direction of FDI flows are thus
often influenced by MNE tax considerations, because
the structure and modality of investments enable tax
avoidance opportunities on subsequent investment
income. In tackling tax avoidance, most notably in the
BEPS approach, the attention of policymakers focuses
naturally on tax rules, company law and transparency
principles – i.e. on accounting for income. The
fundamental role of investment as the enabler of tax
avoidance warrants a complementary perspective.
This section aims to provide a new perspective on cor-porate international taxation and MNE tax avoidance schemes. It integrates the mainstream approach of the BEPS project with an investment-based approach emphasizing the relevance of corporate structures set up by channelling FDI through offshore investment hubs and OFCs, notably tax havens and jurisdictions offering so-called special purpose entities (SPEs),4 as these are the enablers of most BEPS schemes.5 In essence, corporate structures built through FDI can be considered “the engine” and profit shifting “the fuel” of MNE tax avoidance schemes.
In order to analyse the scope, dimensions and effects of tax-efficient corporate structures (“fuel-efficient engines”), the section looks at FDI flowing through OFCs or conduit jurisdictions (transit FDI). It is important to emphasize from the outset that the notion of transit FDI does not equate with non-productive FDI. FDI designed as part of tax planning strategies of MNEs may or may not have a real economic impact on the countries involved. For example, an investment from a North American firm in Asia to start a new production plant may be channelled through Europe for tax reasons (potentially penalizing tax revenues in both home and host countries) but still carry the productive-asset-creating effects of a greenfield investment. By contrast, transit FDI tends to have very little real economic impact in countries acting as investment hubs in MNE tax planning schemes.
For the purpose of the analysis in this section, a simple (and conservative) approach has been taken
to identifying offshore investment hubs, limiting the scope to tax havens and a few jurisdictions that (at the time of analysis for this chapter) explicitly publish directional SPE investment data.6 Other countries host SPEs and various types of entities that facilitate transit investments. Alternative approaches and perimeters for offshore investment hubs, combining generally accepted tax-based criteria with criteria based on objective FDI data, are discussed in annex II.
It should be noted that the conduit countries discussed in this section are not alone in offering certain tax benefits to foreign investors; a degree of tax competition has led many other countries to adopt similar policies. No policy implications are implied by
the scope of the perimeter for offshore investment
hubs used in this section. In fact, the analysis will show that any action on tax avoidance practices needs to address policies across all jurisdictions – in base (home) countries, conduit (transit) countries and source (host) countries alike.
1. The importance of offshore investment hubs and transit FDI
Offshore investment hubs play a major role in global
investment. Some 30 per cent of cross-border
corporate investment stocks (FDI, plus investments
through SPEs) have been routed through conduit
countries before reaching their destination as
productive assets. The growth of transit investment
saw a sharp acceleration during the second half of the
2000s.
In 2012, the British Virgin Islands were the fifth largest FDI recipient globally with inflows at $72 billion, higher than those of the United Kingdom ($46 billion), which has an economy almost 3,000 times larger. Similarly, outflows from the British Virgin Islands, at $64 billion, were disproportionally high compared with the size of the economy. The British Virgin Islands are only one example of an economy with such unusual FDI behaviour. Such very different economies as the Netherlands and Luxembourg also exhibit amplified investment patterns.7 Despite their heterogeneity, all these countries act as offshore investment hubs for MNEs. Many of these hubs display some degree of the following characteristics: (i) no or low taxes;
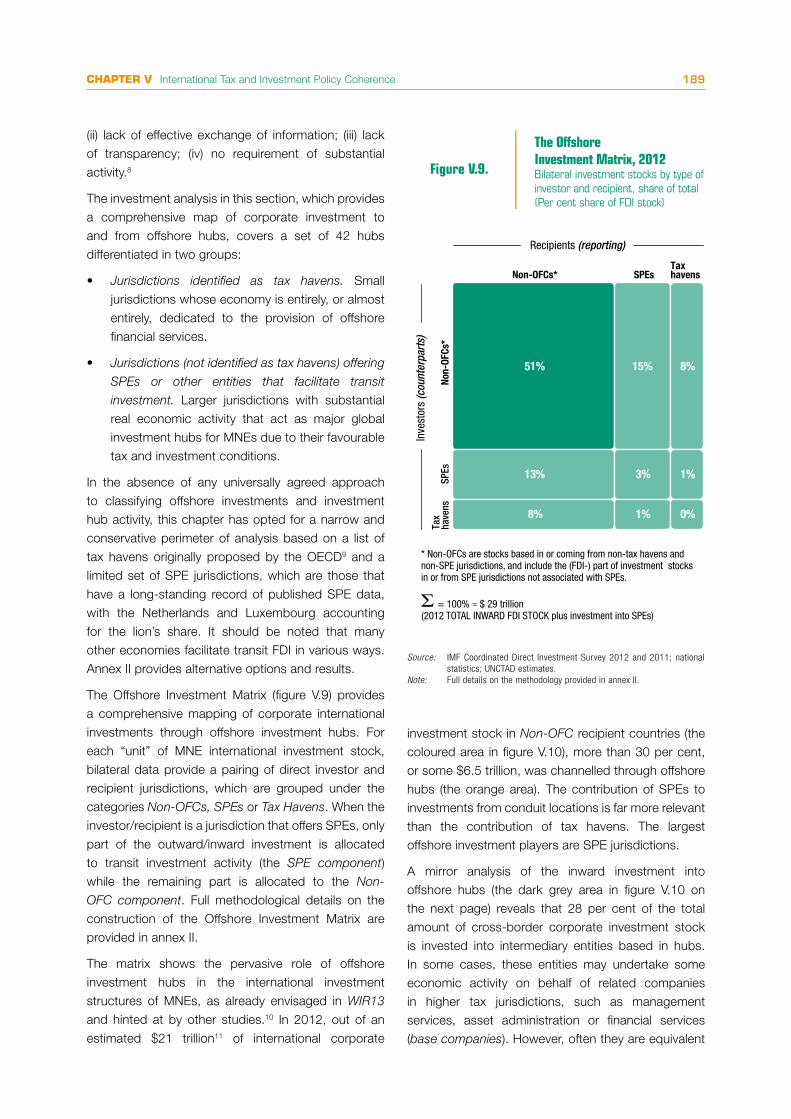
CHAPTER V International Tax and Investment Policy Coherence 189
(ii) lack of effective exchange of information; (iii) lack of transparency; (iv) no requirement of substantial activity.8
The investment analysis in this section, which provides a comprehensive map of corporate investment to and from offshore hubs, covers a set of 42 hubs differentiated in two groups:
• Jurisdictions identified as tax havens. Small jurisdictions whose economy is entirely, or almost entirely, dedicated to the provision of offshore financial services.
• Jurisdictions (not identified as tax havens) offering
SPEs or other entities that facilitate transit
investment. Larger jurisdictions with substantial real economic activity that act as major global investment hubs for MNEs due to their favourable tax and investment conditions.
In the absence of any universally agreed approach to classifying offshore investments and investment hub activity, this chapter has opted for a narrow and conservative perimeter of analysis based on a list of tax havens originally proposed by the OECD9 and a limited set of SPE jurisdictions, which are those that have a long-standing record of published SPE data, with the Netherlands and Luxembourg accounting for the lion’s share. It should be noted that many other economies facilitate transit FDI in various ways. Annex II provides alternative options and results.
The Offshore Investment Matrix (figure V.9) provides a comprehensive mapping of corporate international investments through offshore investment hubs. For each “unit” of MNE international investment stock, bilateral data provide a pairing of direct investor and recipient jurisdictions, which are grouped under the categories Non-OFCs, SPEs or Tax Havens. When the investor/recipient is a jurisdiction that offers SPEs, only part of the outward/inward investment is allocated to transit investment activity (the SPE component) while the remaining part is allocated to the Non-
OFC component. Full methodological details on the construction of the Offshore Investment Matrix are provided in annex II.
The matrix shows the pervasive role of offshore investment hubs in the international investment structures of MNEs, as already envisaged in WIR13 and hinted at by other studies.10 In 2012, out of an estimated $21 trillion11 of international corporate
investment stock in Non-OFC recipient countries (the coloured area in figure V.10), more than 30 per cent, or some $6.5 trillion, was channelled through offshore hubs (the orange area). The contribution of SPEs to investments from conduit locations is far more relevant than the contribution of tax havens. The largest offshore investment players are SPE jurisdictions.
A mirror analysis of the inward investment into offshore hubs (the dark grey area in figure V.10 on the next page) reveals that 28 per cent of the total amount of cross-border corporate investment stock is invested into intermediary entities based in hubs. In some cases, these entities may undertake some economic activity on behalf of related companies in higher tax jurisdictions, such as management services, asset administration or financial services (base companies). However, often they are equivalent
Source: IMF Coordinated Direct Investment Survey 2012 and 2011; national statistics; UNCTAD estimates.
Note: Full details on the methodology provided in annex II.
Figure V.9.
= 100% ≈ $ 29 trillion (2012 TOTAL INWARD FDI STOCK plus investment into SPEs)
* Non-OFCs are stocks based in or coming from non-tax havens and non-SPE jurisdictions, and include the (FDI-) part of investment stocks in or from SPE jurisdictions not associated with SPEs.
The Offshore Investment Matrix, 2012Bilateral investment stocks by type of investor and recipient, share of total (Per cent share of FDI stock)
Recipients (reporting)
Non-
OFCs
*SP
Es
Non-OFCs* SPEs
Tax
have
ns
Taxhavens
Inve
stor
s (c
ount
erpa
rts)
8%
13%
51%
1%
3%
15%
1%
8%
0%

World Investment Report 2015: Reforming International Investment Governance190
to letterbox companies, legal constructions conceived for tax optimization purposes (conduit companies) and potentially to benefit from other advantages associated with intermediate legal entities. The prominent pass-through role of these entities in financing MNE operations causes a degree of double counting in global corporate investment figures, represented by the dark grey area in the Offshore Investment Matrix (inward investments into offshore hubs), which broadly mirrors the orange area (outward investments from hubs).12 In UNCTAD FDI statistics this double-counting effect is largely removed by subtracting the SPE component from reported FDI data.
The share of stock between hubs (light grey area) is also relevant, at 5 per cent of global investment stock. This confirms that offshore investment hubs tend to be highly interconnected within complex multilayered tax avoidance schemes. The “Double Irish-Dutch
Sandwich” employed by IT multinationals is a relevant example of such structures.
An analysis of the Offshore Investment Matrix by the two investment components, Equity and Debt,
Source: IMF Coordinated Direct Investment Survey 2012 and 2011; national statistics; UNCTAD estimates.
Note: Full details on the methodology provided in annex II.
reveals additional dynamics. The picture for the debt
component (figure V.11.b) show a significantly larger
role for hubs (and especially SPEs) compared with the
general pattern. This captures a typical tax avoidance
mechanism whereby an SPE channels funds through
intracompany loans to third-country affiliates. The
basic rationale of this practice is to generate an erosion
of the tax base in the recipient (high-tax) jurisdiction,
with profit shifted to low-tax locations in the form of
deductible interest payments.13
The scenario represented in figures V.9 through V.11 is
the result of a boom in the use of offshore structures in
cross-border corporate investment. Between the start
and end of the 2000s, the average share of investment
flows to non-OFC countries routed through offshore
hubs increased from 19 to 27 per cent (figure V.12).
More recently, greater international efforts to tackle
tax avoidance practices have managed to reduce the
share of offshore investments in developed countries,
but the exposure of developing economies to such
investments is still on the rise (see also section C).
2. The root causes of the outsized role of offshore hubs in global investments
The root cause of the outsized role of offshore hubs
in global corporate investments is tax planning,
although other factors can play a supporting role.
MNEs employ a wide range of tax avoidance levers,
enabled by tax rate differentials between jurisdictions,
legislative mismatches and gaps, and tax treaties.
MNE tax planning involves complex multilayered
corporate structures. From an investment perspective,
two archetypal categories stand out: (i) intangibles-
based transfer pricing schemes and (ii) financing
schemes. Both schemes, which are representative of
a relevant part of tax avoidance practices, make use
of investment structures involving entities in offshore
investment hubs.
The investment data and the results of the analyses
depicted in the previous section highlight the massive
and still growing use of offshore investment hubs by
MNEs. Offshore investment structures are an integral
part of MNE tax planning strategies aimed at shifting
profits from high-tax to low-tax jurisdictions in order
to reduce corporate tax bills. What makes them
attractive for tax optimization purposes is usually
a mix of features. Corporate tax is often reduced to
minimal levels through preferential regimes. Some
Figure V.10.
Non-OFC inward investment stocks, by type of investor Vertical view of the OffshoreInvestment Matrix (Per cent)
30%
70%
Recipients (reporting)
Non-
OFCs
SPEs
Non-OFCs SPEs
Tax
have
ns
Taxhavens
Inve
stor
s (c
ount
erpa
rts)

CHAPTER V International Tax and Investment Policy Coherence 191
Source: UNCTAD FDI database; national statistics; UNCTAD estimates.Note: Elaboration of UNCTAD bilateral flow statistics. The target sample of (recipient)
reporting countries includes all countries reporting bilateral investments flows with the exclusion of offshore hub countries (tax havens and the selected countries reporting SPEs). This approach makes it possible to describe the trend in the penetration of offshore investments in “real” economies while removing the (distorting) effects of investments between hubs. In the context of flow analysis, averaging across multiple years is helpful to mitigate the volatility of the offshore component and capture the underlying trend. For the countries reporting SPEs, the share of SPEs in total outflows is derived from central bank data.
Source: IMF Coordinated Direct Investment Survey 2012 and 2011; national statistics; UNCTAD estimates.Note: The methodology follows directly from the general case illustrated in figure V.9 and explained in annex II.
Recipients (reporting)
a. Equity b. Debt instruments
Non-
OFCs
SPEs
Non-OFCs SPEs
Tax
have
ns
Non-
OFCs
SPEs
Tax
have
ns
Taxhavens
Taxhavens
Inve
stor
s (c
ount
erpa
rts)
= 100% ≈ $24 trillion (corresponding to 82% of total FDI stock) = 100% ≈ $5 trillion (corresponding to 18% of total FDI stock)
8%
12%
54%
1%
3%
13%
1%
8%
0%
Recipients (reporting)
Non-OFCs SPEs
Inve
stor
s (c
ount
erpa
rts)
5%
21%
38%
2%
4%
24%
2%
5%
0%
Figure V.11. The Offshore Investment Matrix, by investment component(Per cent share of FDI stock)
5 10
14
17
Average 2001−2005 Average 2008−2012
19%
27%Tax havens SPEs
Figure V.12.Trend in the share of investment in�ows from offshore hubs, 2001−2012 (Per cent)
of these jurisdictions offer the option to negotiate tax rates or obtain favourable tax rulings from tax authorities. In addition, they may offer special vehicles (special types of entities such as holding structures, foundations, cooperatives, etc.), which result in both tax and operational advantages. Offshore hubs are usually effective in circumventing withholding taxes. For instance, most SPE jurisdictions do not apply withholding taxes on outflows and ensure that withholding tax on inflows is limited through the application of tax treaties. SPE jurisdictions tend to have extensive treaty networks, making them ideal intermediary or regional headquarter locations.
An objective discussion on the root causes of the role of offshore investment hubs, and in particular SPE jurisdictions, in international investment should take into account other factors. Some jurisdictions count on extensive networks of investment treaties providing investor protection and access to international arbitration. In addition, offshore hubs tend to require

World Investment Report 2015: Reforming International Investment Governance192
Enabling factor Specific levers
Tax rate differentials• Transfer pricing manipulation (trade mispricing, use of intangible/IP,
commissionaire structures)
• Excessive debt financing
• Others (e.g. location planning, loss utilization)
Legislative mismatches and/or gaps • Hybrid mismatches
• Derivative transactions
• Disguised domestic investments
• Deferred repatriation
Double taxation treaties • Treaty shopping
• Triangular structures
• Circumvention of treaty thresholds
Source: UNCTAD.
Table V.1. Overview of the main tax avoidance levers
relatively few formalities for the set-up of investment vehicles and offer attractive business climates. Countries providing homes to SPEs generally have strong legal and regulatory frameworks, good in-country infrastructure and sophisticated banking environments and are stable from an economic and political perspective. They also offer other advantages such as a skilled labour force and an established business services industry. Geographical location and language are other important factors. However, the relative importance of non-tax factors in making SPE jurisdictions successful investment hubs should not be overestimated. For example, only one third of investment channelled through SPEs in the Netherlands goes to countries with a bilateral investment protection treaty in place.14
There is significant anecdotal evidence of the occurrence of profit shifting through offshore investment hubs. Google achieved an effective tax rate of 2.4 per cent on its non-United States profits in 2009 by routing profits to Bermuda, with Ireland and the Netherlands playing a key role in the structure. Many examples of multinational corporations that achieved similar results or utilized similar structures have appeared in the media in recent years and will be familiar to the public.
A more systematic, not anecdotal, assessment of BEPS practices at the firm level is difficult. MNEs have very limited interest in disclosing tax-relevant information, especially on their cross-border operations. Figure V.13 shows some basic firm-level evidence confirming the special role of offshore hubs in MNE investment structures based on United States
data. Box V.3, at the end of this section, outlines promising directions of future research using firm-level data at the subsidiary level.
MNEs resort to a large number of tax avoidance levers. Table V.1 lists the main ones, categorized according to three enabling factors: tax rate differentials, legislative mismatches or gaps, and double taxation treaties.
The tax avoidance levers listed in table V.1 are rarely used alone. They synergize in complex multilayered schemes in which one or more layers involve an offshore hub as a facilitator. According to the OECD (2013a), optimized schemes typically minimize taxes under four different aspects:
a. Minimization of taxation in a foreign operating
or source country (which is often a medium- to high-tax jurisdiction) either by shifting gross profits via trading structures or reducing net profit by maximizing deductions at the level of the payer.
b. Low or no withholding tax at source.
c. Low or no taxation at the level of the recipient
(which can be achieved through low-tax jurisdictions, preferential regimes or hybrid mismatch arrangements) with entitlement to substantial non-routine profits often built up through intragroup arrangements.
d. No taxation of the low-taxed profits at the level of
the ultimate parent.
In practice there may be innumerous combinations of tax avoidance levers to achieve tax minimization. A consolidated approach found in the empirical literature is to focus on two archetypal categories

CHAPTER V International Tax and Investment Policy Coherence 193
Source: United States Bureau of Economic Analysis (BEA); UNCTAD analysis.Note: Statistics for the group of “SPE countries” are based on Luxembourg and the Netherlands; for the group of “tax havens” on British Virgin Islands.
Figure V.13. Selected �rm-level evidence on the special role played by tax havens and SPEs in MNE investment structures, 2012
Foreign investment in the United StatesBillion of dollars
Investors
2.452
0
154
2.074
66
456
Other countries
Tax havens
SPE countries
Share of FA gross income generated by equity investment Per cent
FA location
6%
42%
45%
Other countriesaverage
Tax havens
SPE countries
Other countriesaverage
Tax havens
SPE countries
Ratio between FA income taxes and pre-tax net income Per cent
FA location
17%
3%
2%
Key features of MNE af�liates from or in offshore hubs…
Inward
Outward
Often immediate parents, rarely ultimate parents: conduit role…
…mostly performing (and deriving income from) �nancial and holding activities on behalf of a group (with often limited substantial business operations)…
…paying comparatively small amount of taxes compared with af�liates based in other locations.
Activities of af�liates in the United States of foreign parents
Activities of foreign af�liates (FAs) of United States MNEs
As immediate parent As ultimate owner
addressing the most relevant tax avoidance schemes: first, intangibles-based transfer pricing schemes and, second, financing schemes.15 Although the precise separating line between the two is not always clear, both conceptually and empirically,16 it is still valuable to analyse their distinctive features.
(i) Archetype 1: Intangibles-based transfer pricing schemes
The essence of these schemes is to transfer profit to low-tax jurisdictions through transfer pricing
manipulation on intangibles (and associated royalties and licensing fees), generating a divergence between where value is created and where taxes are paid. The higher the intangible component of value creation (IP rights, brands, business services, risks), the higher the profit-shifting opportunities. With the very high share of profits of large MNEs based on what they know rather than what they make, the relevance of this type of scheme is clear, as witnessed also by the continuing trend to introduce so-called IP boxes, where the income on intangibles is taxed at low rates.

World Investment Report 2015: Reforming International Investment Governance194
It should be noted that, although intangibles-based schemes are increasingly relevant at the global level, transfer pricing manipulation related to intra-firm trade (trade mispricing) of tangible goods is also common, especially to the detriment of developing economies where basic expertise and instruments to detect transfer pricing abuses are missing. 17 For a broader discussion of issues related to abusive transfer pricing by MNEs and possible policy directions to reform the current arm’s-length standards, see Eden (2014).
Typical examples of intangibles-based transfer pricing schemes are in the IT sector where the high-value share of the IP rights (with base erosion opportunities related to high royalty payments) and the digitalization of business operations (with the possibility to separate physical presence from value creation) create a
formidable synergy to minimize taxes. OECD countries where IT firms generate most of their value have been particularly exposed to these types of schemes. The case between the United Kingdom and Google has become exemplary18 but it is not the only one. Governments around the world, especially in OECD countries, are stepping up scrutiny of tax affairs of the major multinational players in the digital economy. It is not surprising that transfer pricing in the digital economy stands out as a top priority in the OECD/G20 Action Plan.19 Figure V.14 illustrates the “Double Irish-Dutch Sandwich”, a structure that has become infamous after the Google case.
Although MNEs in the IT sector do not necessarily all use exactly the same technique, the strategies they use follow very similar patterns. The scheme
Source: UNCTAD based on Fuest et al. (2013b).
Parent
Figure V.14. Example: Double Irish-Dutch Sandwich
Irish opco
Group serviceproviders
Irish holdcoBermudan tax
resident
Intellectual propertytransferred
Dividends(deferred)
Royalties
Royalties
FeesCost-plus
agreement
1
2
3
4
5
Check-the-box:disregarded entitiy
6
BERMUDA
IRELAND
NETHERLANDS
Capital �ows
Income �ows
Othersclients
Dutch conduit

CHAPTER V International Tax and Investment Policy Coherence 195
consists of a main tax avoidance lever (transfer pricing manipulation through the use of intangibles) and a number of ancillary tax avoidance levers (including treaty shopping, hybrids, deferred repatriation and commissionaire structures) that in combination achieve the four objectives (a)-(d) listed above, as described in the following example.
a. Minimization of taxation in a foreign operating or
source country.
(1) IP is transferred by a United States parent company (high-tax jurisdiction) to an Irish-incorporated subsidiary that is tax resident in a low-tax jurisdiction (Bermuda). The transfer is usually done under a cost-sharing agreement when the IP is not yet fully developed and hence still has a fairly low value. The price can therefore be manipulated. The transfer value is further obscured by the fact that only the non-United States rights attached to the IP are transferred.
(2) The IP is sublicensed by the Irish IP Holding Company to an Irish Operating Company (incorporated and tax resident in Ireland). The Irish Operating Company exploits the IP and usually earns high revenues. Sales-supporting entities in the country of consumption are disguised as low-risk service providers operating under a cost-plus agreement, minimizing the tax base.
(3) The Irish Operating Company pays high tax-deductible royalties for the use of the IP held by the Irish IP Holding Company, offsetting the high revenues from sales and achieving significant erosion of the tax base.
b. Low or no withholding tax at source.
(4) The Irish Operating Company does not pay royalties to the IP Holding Company directly but through an intermediate company in the Netherlands. The intermediate company is an SPE without any substantial activity, interposed between the Irish Operating Company and the Irish IP Holding Company to avoid the payment of the withholding fees (withholding taxes would otherwise apply because the Irish IP Holding Company is a Bermuda tax resident and Ireland levies withholding taxes on royalty payments to Bermuda). Through interposition of the Dutch conduit, withholding taxes are fully circumvented. No withholding tax is levied on the royalty fees
through use of the EU interest and royalties directive, and the Netherlands does not impose withholding tax on royalty payments, irrespective of the residence state of the receiving company.
c. Low or no taxation at the level of the recipient.
(5) The Irish Holding Company, being a Bermuda tax resident, does not pay tax on its income in Ireland, and Bermuda does not levy corporate tax. The income is retained in the Irish Holding Company (i.e. not repatriated to the United States) to avoid United States tax.
d. No taxation of the low-taxed profits at the level of
the ultimate parent.
(6) The Irish Operating Company and Dutch conduit are elected in the United States as ‘check-the-box’ entities (transparent for United States tax purposes) and are hence disregarded by the United States. Thus no United States tax is levied on their income.
(ii) Archetype 2: Financing schemes
The underlying idea of financing schemes is to use loans from an offshore-based entity to maximize the payments of passive interests at the level of the (high-tax jurisdiction) loan recipient. This category can be generalized to include schemes involving all financing operations through offshore intermediate entities in order to reduce the tax bill. In addition to debt financing, other financial operations conveniently manageable through offshore investment hubs may include merger and acquisition operations where the sale of assets is managed through an affiliate in an offshore hub to reduce taxes on capital gains, or leasing operations managed through intermediate entities in offshore hubs to maximize payments at the level of the operating company and thus to erode the tax base. Unlike the transfer pricing schemes described above, these schemes can be employed also in the presence of tangible assets and are particularly suitable for highly capital-intensive industries (such as the extractive industry). Furthermore, while transfer pricing schemes mostly penalize the country of consumption, this type of scheme hits the investment recipient country where operations take place (often developing countries). Although this type of scheme has had less visibility in the media than transfer pricing schemes, they are not less relevant.20 NGOs are also increasingly recognizing the importance of this type of scheme.21

World Investment Report 2015: Reforming International Investment Governance196
From an investment perspective, this archetypal scheme is particularly interesting as it is directly visible in FDI data, as illustrated by the debt versus equity analysis in the Offshore Investment Matrix.
Also for this category it is possible to identify some notable examples, as illustrated in figure V.15. As in the case of the Double Irish-Dutch Sandwich, the scheme is founded on a basic concept built around the use of debt financing for base erosion, and combined with further levers, including treaty shopping and hybrids, in order to optimize the tax planning strategy along the four objectives explained above, as described in the following example.
a. Minimization of taxation in a foreign operating or
source country.
(1) Parent Company located in Country M (which
could be a medium- or high-tax jurisdiction)
injects equity funding into its intermediary in
Country L, a low-tax jurisdiction.
(2) Intermediary Company injects funding into its
subsidiary in Country H, a high-tax jurisdiction.
It uses a hybrid instrument to do this; hence the
funding is seen as an equity injection by Country
L and debt funding by Country H. The funding
may be either excessive or unnecessary from
an economic perspective and also in relation
to the real equity in the subsidiary; however
Country H does not have any thin capitalization or
similar rules.
(3) Subsidiary Company pays interest to
Intermediary Company, which it deducts for its
own tax purposes, thereby paying lower taxes in
Country H.
b. Low or no withholding tax at source.
(3) The interest is not subject to withholding tax
in Country H due to treaty application.
(4) Similarly, no withholding tax is levied on the
interest – which is considered a dividend – in
Country L due to treaty application.
c. Low or no taxation at the level of the recipient.
(4) The interest is seen as a dividend in Country
L, and Country L does not tax dividends.
d. No current taxation of the low-taxed profits at the
level of the ultimate parent.
(5) If a dividend is declared to the Parent, no
tax is levied on the dividend in Country M due
to a dividend exemption. Country M does not
have CFC (controlled foreign company) or similar
legislation in place.
Table V.2 summarizes the key features of the two types
of schemes.
In conclusion, although some of the individual levers
employed by MNEs to avoid tax, such as trade
mispricing, may not necessarily involve offshore
investment hubs, these levers are rarely deployed
on their own. The archetypal schemes that are
representative of the bulk of tax avoidance practices
all make use of investment structures involving entities
in offshore hubs.
Subsidiary/high-tax
jurisdiction
Intermediary/low-tax
jurisdiction
Parent
Figure V.15.
Example: Debt-�nancing structure using intermediate holding company and hybrid instrument
1
2 3
4
5
Capital �ows Income �ows
Debt injection(hybrid)
Interest payment(hybrid)
Equityinjection
Dividends
ULTIMATEINVESTOR(Country M)
CONDUIT(Country L)
RECIPIENT(Country H)
Source: UNCTAD based on OECD (2013a).

CHAPTER V International Tax and Investment Policy Coherence 197
Archetype 1: Intangible based transfer pricing schemes
Archetype 2: Financing schemes
Objective • Transfer profit to low tax jurisdictions via transfer pricing manipulation on the intangibles
• Erode the taxable base at the level of the financing recipient through deductibles on interest payments
Notable examples • Double Irish-Dutch Sandwich • Financing structure using an intermediate holding company and a hybrid instrument
Tax avoidance levers • Main: transfer pricing manipulation (use of intangibles/IP)
• Main: debt financing
• Ancillary: treaty shopping, hybrids, deferred repatriation, commissionaire structures
• Ancillary: treaty shopping, hybrids, deferred repatriation
Business implications • Intangible businesses, digital economy • Tangible, capital intensive businesses
• Service sector • Primary and secondary sector
• Higher impact on (mostly developed) economies where customers reside
• Higher impact on (mostly developing) economies where investments are made and operations take place
Source: UNCTAD.
Table V.2. Comparison of the two archetypal tax avoidance schemes
Box V.3. Investigating MNE tax avoidance practices at the firm level: possible research directions
Detailed balance sheet data and profit and loss account data on the affiliates of MNEs may enable further investigation of profit shifting and tax planning strategies. Financial information relevant for the analysis of MNE tax avoidance includes long-term loans, equity balances, revenues, gross profit, operating profit, financing costs, net profit and taxation. Asset values (especially fixed assets) and employee numbers are also important indicators.
Financial data inform a number of metrics that can be used as tax avoidance signals:
• Loan and equity balances can be used to compare debt-equity ratios within peer groups in order to provide an indication of potentially excessive debt funding. The ratio of debt to (non-current) assets can also be used for this purpose. For debt-asset ratios, industry-specific analyses are needed to allow for differences between asset-intensive businesses and others. Financing costs as a percentage of interest-bearing debt can be used as a test on artificial inflation of the interest rate (related to transfer pricing abuses).
• Gross margins and operating margins (i.e. gross profit and operating profit as a percentage of revenues) could be used to identify potential base erosion, with carefully selected peer group samples to reduce industry variations or factors.
• Tax-specific ratios include tax as a percentage of revenues, gross profit or operating profit, which may provide insight into excessive deductions that are taking place in a company. Effective tax rates between domestic- and foreign-owned companies can also be compared, e.g. tax (current and deferred tax) over net profit (before tax).
Different approaches are feasible. For a target country, the expectation that foreign-owned companies are more prone than national ones to tax planning techniques can be tested. For a target group of MNEs (e.g. the top 100 global MNEs), the comparison could take place across subsidiaries of the same multinational corporate group with the purpose of identifying differences in profit levels, taxation and debt across countries in accordance with tax arbitrage strategies. In all cases, in addition to firm-level financials, complete visibility of the MNE ownership structure is necessary, which can be provided (with limitations on coverage and depth) by databases such as Orbis, maintained by Bureau van Dijk. UNCTAD aims to explore these options further in future work in this area.
Source: UNCTAD; Fuest and Riedel (2010).

World Investment Report 2015: Reforming International Investment Governance198
C. MNE TAX AVOIDANCE AND DEVELOPING COUNTRIES
The process of formulating the SDGs and the related Financing for Development discussion have raised the political profile and public awareness of the role of taxation as a source of development financing and focused attention on the detrimental impact of tax avoidance schemes on developing economies.
Tax is a major component of the development financing pool. Concord (2013) estimates the total amount of domestic sources of development financing at some 60 per cent of the aggregate GDP of developing economies against 5 per cent for external sources, with taxation at 15 to 30 per cent of GDP, representing a significant share of domestic sources.22 The OECD23 calculated in 2011 that at the aggregate global level up to half of annual additional resources needed to achieve the (first six) Millennium Development Goals (MDGs) could be recovered just by improving tax revenue collection in developing economies. The situation will be similar for the SDGs.
The concerns of development organizations and NGOs related to BEPS practices in developing countries centre on two issues: (i) developing economies are less equipped than developed economies to counter corporate tax avoidance, so therefore their exposure
may be greater; and (ii) the impact in terms of resource losses for developing economies is significant, especially against the background of the scarcity of available local resources and the development financing gap.
The FDI-based analytical toolkit introduced in this section provides a methodology both to assess the exposure of developing economies to FDI from offshore investment hubs, and to estimate the resulting tax revenue losses. The distinctive feature and to some extent also the limitation of the approach is to focus specifically on the role and the impact of offshore hubs as immediate investors into developing economies. It is important to point out that a direct investment link to an offshore hub is not a prerequisite for profit shifting. However, such links enable some important forms of profit shifting and they are usually part of the tax planning strategy of MNEs. In particular, although transfer pricing-based structures (Archetype 1) may or may not entail direct investment exposure to hubs, financing schemes (Archetype 2) typically leverage
FDI links to create a direct channel for profits to easily
reach offshore locations.
1. Exposure of developing economies to corporate investments from offshore hubs
Tax avoidance practices by MNEs are a global issue
relevant to all countries: the exposure to investments
from offshore hubs is broadly similar for developing
and developed countries. However, profit shifting out
of developing countries can have a significant negative
impact on their sustainable development prospects.
Developing countries are often less equipped to deal
with highly complex tax avoidance practices because
of resource constraints and/or lack of technical
expertise.
The share of inward investment stocks originating from
offshore hubs provides an indication of the level of
exposure of developing economies to BEPS practices.
Figure V.16 on the next page shows the share of
investment from offshore hubs (tax havens and SPEs)
in total productive investment into non-OFC countries
across different regions. The shares for developing
and developed regions are substantially aligned, at
around 30 per cent of total investment stock.
While the scale of the exposure is similar, the relative
weight of tax havens and SPEs differs between
developed and developing countries, with tax havens
much more relevant for developing countries (at two
thirds of total offshore hub exposure against only one
tenth for developed economies). Regional patterns
reflect the fact that specific jurisdictions tend to act as
preferential investment hubs for their entire region. For
developed economies, in particular for Europe, SPEs
in Luxembourg and the Netherlands cover the lion’s
share. For developing economies the picture is more
differentiated. Latin America and the Caribbean also
receive a significant share of investment from Dutch
SPEs. However, investment in Africa heavily relies on
Mauritius, while the British Virgin Islands represent
the reference offshore hub for investment in Asia.
Finally, the picture for transition economies is skewed
by very large investment from Cyprus to the Russian
Federation.

CHAPTER V International Tax and Investment Policy Coherence 199
The share of investment in Africa from offshore hubs, at 24 per cent, is lower than in other developing regions. This seems in contrast with other empirical evidence and studies suggesting that Africa faces more severe tax avoidance issues. Africa may face tax avoidance practices that do not require direct investment links to offshore hubs. Also, the average for the continent disguises tax avoidance issues in individual countries – especially the poorest countries, which weigh less in the aggregate picture. Furthermore, the perception of low MNE fiscal contributions in Africa may also be due to high levels of tax competition in individual countries resulting in low effective tax rates, rather than erosion of the tax base.24
While the analysis based on the Offshore Investment Matrix, which is based on stocks, shows a snapshot of the current situation, a look at offshore links in investment flows reveals how exposure to hubs has evolved over time. This perspective highlights a negative trend for developing economies. It shows that their exposure to investments from offshore hubs is on the rise, while that in developed countries has started shrinking in recent years. In particular, although historically developing economies have been more vulnerable to investments from tax havens (as the stock analysis confirms), between 2000 and 2012, the share of inflows from SPEs steadily increased and in fact doubled (figure V.17).
Source: UNCTAD estimates based on IMF Coordinated Direct Investment Survey 2012 and 2011; central banks for SPE investments.
Note: The set of recipient countries includes only non-OFCs. Analysis based on the Offshore Investment Matrix, one-sided perspective. See annex II for further details.
Figure V.16.
Exposure to investments fromoffshore investment hubs, by region, 2012Share of corporate investment stock from offshore hubs (Per cent)
Transition economies
Latin America andthe Caribbean
Developing Asia
Africa
Developing economies
North America
Europe
Developed economies
Global
Investment recipientby region
41
8
25
12
21
2
3
3
11
19
19
6
12
9
16
32
26
19
60%
27%
31%
24%
30%
18%
35%
29%
30%
Corporate investment from SPEs
Corporate investment from tax havens
Source: UNCTAD FDI database; national statistics; UNCTAD estimates.Note: See figure V.12, also based on flows.
10%
26%
Figure V.17. Evolution of exposure to offshore investment hubs, by level of developmentShare of corporate investment �ows from offshore hubs, multiyear averages (Per cent)
Developed economies Developing economies
Corporate investment from SPEsCorporate investment from tax havens
Average 2000−2004
Average 2005−2009
Average 2010−2012
Average 2000−2004
Average 2005−2009
Average 2010−2012
19%
20%
3%
23%
26%
1%1%
19%
20%5%
16%
21%7%
17%
24%
16%

World Investment Report 2015: Reforming International Investment Governance200
2. Tax revenue losses for developing economies from hub-based tax avoidance schemes
Tax avoidance practices are responsible for a significant
leakage of development financing resources. An
estimated $100 billion annual tax revenue loss for
developing countries is related to inward investment
stocks directly linked to offshore investment hubs.
There is a clear relationship between the share of
offshore investment in host countries’ inward FDI
stock and the reported (taxable) rate of return on FDI.
The more investment is routed through offshore hubs,
the less taxable profits accrue. On average, across
developing economies, every 10 percentage points of
offshore investment is associated with a 1 percentage
point lower rate of return. The average effects disguise
country-specific impacts.
The quantification of profit shifting is a challenging
exercise. First, tax avoidance options can be
numerous. MNEs employ highly sophisticated and
creative combinations of individual tax avoidance
levers. Second, by the nature of the phenomenon, the
available data and information is limited. The profits
shifted to offshore locations are difficult to track as
they typically do not appear in any official reporting:
not, obviously, in the financial reporting of the foreign
affiliates where the value is generated and not in that
of the foreign affiliates to which it is shifted due to often
lax reporting requirements. Given the complexity of
the issue, studies aim to quantify specific aspects of
corporate profit shifting rather than attempt a holistic
approach. The effort is still valuable, as integrating the
different approaches provides an order of magnitude
of the losses caused by international corporate tax
avoidance.
Annex II provides an overview of the main approaches
developed for estimating profit shifting and tax revenue
losses due to cross-border corporate tax avoidance.
The FDI-driven approach used in this section stands at
the intersection of some of those approaches.
The methodology proposed builds on the assumption
of a negative relationship at the country level between
the share of inward investment stock from offshore
hubs and the rate of return on the total inward FDI
stock. The underlying assumption is that the portion of
income generated by FDI from offshore hubs is subject
to profit shifting, with the effect of artificially deflating
the average rate of return on foreign investments
(computed as the ratio between return on investment
and inward investment stock). Thus, all things being
equal, the higher the share of inward investment
stocks from offshore hubs, the lower the rate of return.
The relationship is supported by country data that
confirm a negative and significant linear relationship
between the two variables. To capture the full impact
of exposure to offshore hubs on investment profitability,
and to ensure greater statistical validity of the relationship
identified between offshore hub investment links and
rates of return on investment, the econometric analysis
is based on a greater number of offshore investment
hubs than employed in section B. Full details on the
different options are described in annex II.
Econometric analysis suggests that on average,
across developing economies, an additional 10 per
cent share of inward investment stock originating
from offshore investment hubs is associated with a
decrease in the rate of return of 1 to 1.5 percentage
points (figure V.18 illustrates this relationship).
Although it is challenging to irrefutably prove a direct
causal relationship between exposure to offshore hubs
and reduced profitability of FDI,25 this analysis provides
some empirical underpinning to widespread evidence
that MNEs leverage direct investment links to offshore
investment hubs to enable profit-shifting practices
that ultimately result in artificially low FDI income. More
importantly, the quantification of the responsiveness of
the rate of return to offshore hub exposure allows a
simulation of the potential impact of these practices
on tax revenues.
Once a significant relationship between the exposure
to offshore hubs (Offshore Indicator in figure V.18) and
the rate of return of the FDI income (Rate of Return in
the figure) has been established, the tax revenue losses
can be calculated through appropriate assumptions on
the profitability gap (how much FDI income is missing
due to investments from offshore investment hubs)
and on the average corporate tax rate.
UNCTAD’s simulation indicates that the amount of
corporate profits shifted from developing economies is
about $450 billion – implying, at a weighted average
effective tax rate across developing countries at 20 per
cent, annual tax revenue losses of some $90 billion.
Annex II shows the parameters of the simulation and the
outcomes; it includes a sensitivity analysis employing

CHAPTER V International Tax and Investment Policy Coherence 201
two formulations of the dependent variable (total rate of return on FDI income versus rate of return on the equity component of the FDI income) and two definitions of tax rates (effective tax rate versus statutory tax rate), with results ranging from $70 billion to $120 billion.
Notably, the negative relationship between the exposure to offshore investment hubs and the rate of return on FDI also holds (and remains statistically significant) for developed economies. However, its relative impact on profit shifting and tax revenue losses is proportionally smaller. This is due to a number of reasons, including the lower responsiveness of the rate of return to offshore exposure; in the case of developed economies, an additional 10 per cent share of exposure to offshore investment hubs corresponds to a decrease in the rate of return of 0.5 to 1.0 percentage point.26 As a result, despite the larger size of developed-country economies, the simulation of tax revenue losses resulting from direct offshore
investment links for developed countries yields an
estimate similar to that of developing countries, in the
order of $100 billion.
The profit shifting and tax revenue losses estimated
here are mostly confined to those associated with tax
avoidance schemes that exploit a direct investment
relationship through equity or debt. Financing
schemes (Archetype 2) are the most obvious example,
but other schemes also rely on offshore hubs and
financing schemes cannot account for the entirety of
the estimated revenue loss.
Trade mispricing does not require a direct investment
link: MNEs can shift profits between any two affiliates
based in jurisdictions with different tax rates. Especially
in the context of the digitalized economy, a significant
share of transfer pricing practices exploits schemes
similar to Archetype 1 – intangibles-based transfer
pricing schemes. Although these schemes also involve
Source: UNCTAD analysis based on data from the IMF Balance of Payments database and IMF Coordinated Direct Investment Survey.Note: Scatterplot representing the relationship between offshore hub exposure (Offshore Indicator) and rate of return on investment stock (Rate of Return) for developing
countries. “Conservative” case with beta coefficient at -10 per cent. The fitted line is merely illustrative and does not reflect the econometric modelling behind the estimation of the beta coefficient (the econometrics rely on a larger sample of data points, including four years, and accounts for regional fixed effects and time fixed effects; see annex II for details).
Figure V.18.Illustration of the relationship between the share of inward investment from offshore investment hubs and the rate of return on inward investment
0
0.05
0.1
0.15
Rate of return
0.1 0.2 0.3 0.4 0.5 0.6
Offshore indicator
1%
10%
Higher exposure to offshore investment hubs
Lower rate of return on FDI stock
ILLUSTRATIVE

World Investment Report 2015: Reforming International Investment Governance202
Parent A
FA in country B(offshore)
FA in country C (e.g. developing
economy)
ILLUSTRATIVE, SIMPLIFIED
Parent A transfers intangibles to FA in country B (offshore) through convenient transfer pricing
FDI link between hub and the developing economy needed to activate BEPS
Investment �owIncome �ow Focus
Direct FDI link with offshore hubExample: Financing scheme (Archetype 2)
No direct FDI link with offshore hubExample: Transfer pricing scheme (Archetype 1)
Pro�tability approach through FDI data (UNCTAD): $90 billion annual revenue losses for developing economies.
Parent A
FA in country B(offshore)
FA in country C (e.g. developing
economy)
Trade mispricing approach through trade data:Christian Aid: $120 billion–$160 billion annual revenue losses for developing economies
Route as much pro�t as possible from FA in
country C to FA in country B as royalty payments
No FDI link between hub and the developing economy needed to activate BEPS
No direct FDI linkwith offshore hub
Direct FDI link with offshore hub
Figure V.19. Two approaches to estimating pro�t shifting compared
Parent A �nances FA in country C through an intracompany loan from foreign af�liate in B (offshore)
Maximization of deductibles for FA in country C to shift pro�ts from C to B
Source: UNCTAD.
offshore hubs, they do not necessarily appear in host-
country FDI inflows; it is enough that the corporate
network includes an affiliate based in an offshore
location, even if the investment to the particular host
country is not channelled through it. (Figure V.19
illustrates two approaches to estimating profit shifting
and revenue losses).
Therefore, the results presented here do not necessarily
capture the full extent of MNE tax avoidance. They
complement findings from other relevant studies
focusing on the revenue losses for developing
economies generated by corporate trade mispricing
schemes, such as Christian Aid (2008) ($120
billion–$160 billion). It is important to note that the
different types of tax avoidance schemes in practice
are often used in combination and generally hard to
disentangle. The different methods for the calculation
of revenue losses therefore provide only alternative approaches and arrive at overlapping estimates.
Leaving aside the estimates for overall government revenue losses, the Offshore Indicator presented here provides intrinsic value to policymakers as a “signal indicator” for BEPS, and as a rule-of-thumb method for country-level BEPS impact.27
Thus, even based only on the analysis presented here and disregarding potentially significant additional revenue losses from tax avoidance schemes not dependent on direct investment links with offshore hubs, revenue leakage due to tax avoidance practices is substantial. Recovering some or all of these losses could significantly contribute to domestic resource mobilization in developing countries.

CHAPTER V International Tax and Investment Policy Coherence 203
In addition, losses caused by MNE tax avoidance practices are not the only form of revenue leakage for governments. As noted in the introduction, an additional form of “slippage” is caused by fiscal incentives actively provided by governments to attract investment. Estimates from external sources – e.g. ActionAid28 – reach as high as $140 billion, although further empirical investigation, using firm-level data, is needed to better qualify the magnitude of the phenomenon.
The direct investment present in developing countries does contribute to government revenues. Section A
estimated the total contribution of foreign affiliates at some $730 billion. Between a quarter and one third of that amount relates to corporate income taxes, which is the part mostly affected by BEPS practices. The remainder relates to other revenues, especially royalties on natural resources, and other taxes, especially those on international transactions.
Finally, attracting new investment in productive capacity and infrastructure in developing countries remains important for their sustainable development prospects.
D. TAX AND INVESTMENT POLICYMAKING: A PROPOSAL FOR GREATER COHERENCE
Tax avoidance practices by MNEs lead to loss of
revenue for governments in both host and home
countries of investors and to basic issues of fairness in
the distribution of tax revenues between jurisdictions
that must be addressed. In tackling tax avoidance, it is
important to take into account the overall contribution
to government revenues by MNEs and the existing tax
base, as well as new productive investments by MNEs
and the future tax base.
The degree to which MNEs engage in tax avoidance varies by industry and home country (among other factors), but tax avoidance practices are widespread. They cause significant tax revenue losses worldwide – in both host and home countries of international investors. Not only do they cause economic and financial damage to countries, they also raise a basic issue of fairness. In almost all cases, the shift in profits through the use of offshore investment hubs does not reflect actual business operations (i.e. the profits reported and taxes paid in a jurisdiction are disproportionate to the activities that take place there). The shifting of profits between jurisdictions results in an unfair distribution of tax revenues between jurisdictions.
The practice is especially unfair to developing countries that face certain tax related challenges.
• Limited tax collection capabilities. Accurately identifying tax planning practices requires an analysis of global operations for individual MNEs,
an unrealistic task for most countries, and
especially developing ones. There is a clear case
for technical assistance to developing-country tax
authorities.
• Greater reliance on tax revenues from corporate
investors. Developing economies tend to rely
relatively more on tax revenues from a smaller
number of large corporations. In India, 41 of the
largest companies contribute just over 16 per
cent of all corporate tax receipts and almost 5
per cent of the government’s total tax receipts. In
South Africa, close to 24 per cent of all corporate
tax receipts, approximately 6 per cent of total
government tax receipts, is contributed by 35 of
the biggest companies.29
• Growing exposure to harmful tax practices and
tax avoidance by MNEs. Developing countries
have seen the share of investment stock
originating from offshore locations increase in the
last decade. The share of their investments from
tax havens was already higher than in developed
countries, and the share originating from SPEs is
rapidly catching up.
Furthermore, at the business level, the low taxes paid
and higher net after-tax profits can provide MNEs with
an unfair advantage compared with domestic firms. This
directly impacts market competition and suppresses
the survival and growth of the small and medium-sized
businesses that are vital for development. (In fact, the

World Investment Report 2015: Reforming International Investment Governance204
BEPS project is not driven by revenue considerations
alone, but also by the need to reduce distortions between
MNEs and domestic companies, and between those
MNEs prepared to engage in aggressive tax planning
and those that are not – levelling the playing field.)
At the same time, it is fair to note that tax avoidance (as
opposed to tax evasion) is not per se illegal – although
often there is no “bright line”.30 A full perspective on
corporate behaviour warrants these observations:
• Corporate representatives have in the past
often used their obligation towards shareholders
to manage finances efficiently as a shield.
More recently, many MNEs are increasingly
acknowledging a wider set of obligations and
corporate social responsibilities (CSR) and,
more importantly, recognizing reputational risks,
leading them to engage in more open dialogue
with tax authorities.31 They are also recognizing
that aggressive tax planning can lead to greater
fluctuation of effective tax rates, and that it
increases the risk of challenges by tax authorities,
with associated financial liabilities.
• There is an intense ongoing debate, at the level
of basic taxation principles, on the fairness of
some taxes, especially withholding taxes, which
are normally levied on gross fees or royalties
and which can have effects equivalent to double
taxation, thus inducing MNEs to engage in some
avoidance practices.
• The BEPS debate focuses largely on corporate
income tax (and a few other taxes) yet MNEs
pay many other taxes, including taxes on labour,
assets, use of resources, indirect taxes, levies
and duties. As demonstrated in the first section
of this chapter, in developing countries the direct
and induced fiscal contributions of MNEs
constitute a relatively high share of total
government revenues.
These observations do not diminish the clear imperative
to tackle tax avoidance practices and to ensure that
MNEs “pay the right amount of tax, at the right time,
and in the right place”. But they provide a broader
context for the actions required to do so, taking into
consideration the full contribution that MNEs make
to economic growth and development, as well as
to government revenues, and taking into account
the need for countries worldwide, and especially
developing economies, to attract new investment,
especially in productive capacities and infrastructure.32
1. The tax-investment policy link and the need for a synergistic approach
While taking action against tax avoidance is imperative
and urgent, including to meet the financing needs of
the post-2015 agenda, the risk of negative effects on
investment flows, especially to developing countries,
must also be considered carefully. Insufficiently
calibrated measures may deter necessary investment
for development that might otherwise have taken
place. Offshore investment hubs have come to play
a systemic role in international investment flows: they
are part of the global FDI financing infrastructure.
Measures at the international level that might affect
the investment facilitation role of these hubs, or that
might affect key investment facilitation levers (such as
tax treaties), need to take into account the potential
impact on global investment and incorporate an
investment policy perspective.
The investment data and the results of the analyses in
this chapter show the massive and still growing use
of offshore investment hubs by MNEs. As a result of
growing international scrutiny, a number of hubs, and
especially SPE jurisdictions, are becoming more aware
of their role in international investment schemes and
the potential negative effects on other jurisdictions,
and are taking steps to address the situation. There
is increasing cooperation, transparency and exchange
of information. SPE jurisdictions are also gradually
tightening requirements related to substance, or
including stronger anti-abuse and denial of benefits
clauses in their tax treaties. The Netherlands, for
example, has offered its treaty partners the option to
renegotiate existing treaties in order to include anti-
abuse measures. Ireland is proposing amendments to
tax residence rules to prevent “stateless” entities.
Moreover, while some cases can be described as
harmful tax competition and “beggar-thy-neighbour”
policies, underlining the need for concerted action,
the role of offshore hubs in global investment cannot
be explained and addressed only in terms of the
characteristics and “responsibilities” of individual
hub jurisdictions. The scale of the phenomenon
clearly indicates that it is a systemic issue; i.e.
offshore investment hubs play a systemic role in the
current international investment environment. They

CHAPTER V International Tax and Investment Policy Coherence 205
have become, in the current environment, standard
and widely adopted tools for MNE tax and financial
optimization, used by all competitors on a level playing
field for MNEs, if not for domestic firms. Their systemic
nature is clear when considering the fact that they are
even used at times by development finance institutions
– although, for example, the World Bank and the EBRD
have developed a set of internal guidelines to ensure
they are used responsibly.
Responsibility for the widespread use (and abuse) of hub-
based corporate structures and tax avoidance schemes
by MNEs should be widely shared. Home countries of
investors often do not have effective legislation in place
to prevent the use of hub-based structures or even
unintentionally encourage the use of such structures by
their MNEs. The “tick-the-box” practice applied in United
States CFC (controlled foreign company) legislation
is often pointed out as facilitating the use of umbrella
entities based in favourable locations. Host countries
are often complicit as well, as their focus is on attracting
investment, if necessary at the cost of engaging in harmful
tax competition.33 A degree of tolerance for tax avoidance
schemes by MNEs may have been considered by some
countries as a way to reduce the visible component of
such tax competition.
The acknowledgement of the systemic nature of
the issue carries two important consequences with
critical implications for policymaking. First, the past
“naming and shaming” approach targeting offshore
investment hubs may have been too restrictive, as it
left untouched many of the largest hub jurisdictions.
Second, any measures aimed at limiting the role of
offshore hubs in order to counter tax avoidance and
profit shifting should consider the potential impact on
global investment.
Policy action aimed at reducing the use of offshore
locations as investment hubs by MNEs must start
from the basic questions of what makes offshore
hubs attractive and what drives their outsized role in
global investment. Offshore hubs, in particular SPE
jurisdictions, are attractive as conduits for investment
because they often provide large networks of tax
treaties and investment protection treaties. In their
domestic legislation they provide low (or sometimes
negotiated) tax rates; their company law allows for the
set-up of legal entities that are useful in international
investment structures and tax schemes; and they offer
a favourable business climate and other locational
advantages. Many of these features are not exclusive
to these jurisdictions. They are already offered by
an increasing number of other countries, motivated
often by a level of tax competition. Any policy action
addressing offshore hubs must therefore be of a
systemic nature, not aimed at individual jurisdictions
or a small group of countries, because corporate
structures will adapt to new realities and find alternative
conduits, and investment flows will take new routes to
continue exploiting regulatory arbitrage opportunities.
Some of the uses of offshore investment hubs and
offshore vehicles by international investors are not
motivated primarily by tax considerations. For example,
in mergers or joint ventures between partners from
different countries with different legal and tax systems,
offshore hubs may provide an attractive neutral location
for the entity. They can also help firms from countries with
weak institutions set up international businesses more
easily and gain access to international capital markets
and legal systems (a key driver of the phenomenon
of round-tripping FDI).34 Lower transaction costs and
economies of scale also likely play a role: once a
vehicle has been set up to manage an MNE’s overseas
holdings, whether actively or purely administratively, it is
easier to route any new investments or reinvestments
through the same vehicle.
Whether for tax avoidance or other purposes, it is the
reality today that offshore investment hubs are playing
a facilitating role in international investment. Diminishing
that role is likely to have two types of effects on global
investment flows:
(i) Investments will take a different route from their
origin or home country to their destination or host
country. Existing investments will be re-routed,
leading to a likely amplified initial impact of any
policy action. Assuming effective policy action,
investments should take a more direct route,
leading to clearer investment links between host
countries and countries of the ultimate beneficial
owners of the investment.
(ii) Overall international investment levels may be
reduced. Higher transaction costs could make
some investments less attractive, and higher
taxes on international operations could cause
the after-tax returns of some investments to drop
below investor hurdle rates (the rate of return
below which they will not invest).

World Investment Report 2015: Reforming International Investment Governance206
Higher transaction costs and higher taxes on international operations could diminish overall investment levels at a time when such investment is sorely needed for economic growth and development.
On the one hand, where investments are desirable for development or other public policy purposes but unattractive for international investors, it could be argued that artificially increasing investor returns through tolerance of tax avoidance is the wrong tool and would lead to an incorrect distribution of the costs of public policy objectives. Direct support to such investments, or public-private partnerships to share risks and change the risk-return picture, would be more appropriate.
On the other hand, policymakers engaged in interna-tional discussions on BEPS would do well to assess not only the impact on the level and distribution of fiscal revenues of any proposed intervention, but also the impact on investment. The Offshore Investment Matrix is a helpful tool to start such an assessment, as it provides insights into the share of investments from and to countries affected by offshore hubs, and indications on the relative importance of archetypal schemes.
2. Towards guidelines for Coherent International Tax and Investment Policies
Coherent international tax and investment policies
should protect the government revenue base and
promote investment. A set of guidelines may help
realize the synergies between investment policy and
initiatives to counter tax avoidance. Key objectives
of the guidelines proposed for discussion in this
section include: removing aggressive tax planning
opportunities as investment promotion levers;
considering the potential impact on investment of anti-
avoidance measures; taking a partnership approach
in recognition of shared responsibilities between
investor host, home and conduit countries; managing
the interaction between international investment
and tax agreements; and strengthening the role of
both investment and fiscal revenues in sustainable
development as well as the capabilities of developing
countries to address tax avoidance issues.
Recognizing the growing significance of tax avoidance by MNEs, the international community – policymakers in the G20 and beyond, international organizations such as the OECD, the World Bank, the IMF and the United Nations, NGOs and business itself – is engaged in debate and working on concrete initiatives
to counter the phenomenon. The focus of attention is largely on tax policy, accounting rules and company law, and on initiatives to improve information exchange and to increase pressure on tax havens. However, given the fundamental role of investment in building the corporate structures that enable tax avoidance, investment policy should form an integral part of any solution. Conversely, any policy initiative tackling tax avoidance by international investors is likely to affect national and international investment policies.
In considering the interdependence and potential synergies between investment policy and anti-tax-avoidance initiatives, policymakers at both the national and international levels may be helped by a set of guidelines for synergistic international tax and investment policies. These guidelines may be considered design criteria for any action by the UN and/or G20, and common-sense suggestions for national investment policymakers and tax authorities.
The policy guidance for coherent international tax and investment policies proposed below is based on the following three fundamental principles.
• Promoting sustainable development. A core objective of both international tax and investment policies is financing sustainable development. Investment policies promote private investment, and tax policies enable public investment in sustainable development.
• Tackling tax avoidance. MNEs should pay tax where economic activity takes place and value is created. Undue distortions should be minimized to ensure a fair distribution of revenues across countries and a level playing field for domestic and foreign firms.
• Facilitating productive investment. The international tax framework should protect the tax base and ensure fair sharing of the tax base among jurisdictions, and promote future investment for development.
In addition, the guidelines are structured around the following key mechanisms for action:• Action through national tax and investment
policymakers.• Action through international tax and investment
policy architectures and instruments.• Action through multilateral coordination.
Figure V.20 illustrates the concept, and the guidelines are further elaborated in the subsequent numbered text.

CHAPTER V International Tax and Investment Policy Coherence 207
1. Tolerance or facilitation of tax avoidance should not be considered an instrument either to attract inward investment or to support the competitiveness of multinational enterprises (MNEs) abroad.
Where countries wish to provide fiscal advantages to attract investors or to support investment overseas, such advantages should be extended through appropriately designed and administered incentives schemes – which should be sector specific, time-bound, transparent and conditional (e.g. on sustainable development contributions), within the boundaries of existing international commitments. See also box V.4 (on the next page) on the role of incentives.
Similarly, where countries feel compelled to attract specific investments to pursue public policy objectives,
increasing investor returns through tolerance or facilitation of tax avoidance will tend to lead to an incorrect distribution of costs; if any support is required (which must be carefully evaluated), direct support to such investments or risk-sharing arrangements would be more appropriate.
2. Measures to address tax avoidance by MNEs should carefully assess the potential impact on investment for development.
Policymakers engaged in international discussions on base erosion and profit shifting (BEPS) should assess – and scenario-test – not only the impact on the level and distribution of fiscal revenues of any proposed intervention, but also the impact on investment, especially to developing countries.
Mechanisms
Promotesustainable
development by…Policy principles
Guidelines
…tackling tax avoidance…
National tax and investment policymakers
Adopt investment policy measures to prevent tax avoidance
Leverage investment promotion tools to tackle tax avoidance
International tax and investment policy instruments
Manage interdependencies with IIAs of tax policy actions
Multilateral coordination
Align DTTs and IIAs as part of countries’ investment facilitation toolkit
Clarify shared responsibility for global
tax avoidance impact
Take an inclusive approach with full participation of developing
economies and development stakeholders
Address investment and tax avoidance speci�cs of developing economies
Create enablers/tools to tackle tax avoidance and assess investment impacts
…while facilitatingproductive investment
Mitigate the impact on investment of anti-avoidance measures
Ban tolerance or facilitation of tax
avoidance as a means to attract investment
1 2
3
6
7 8 9 10
4
5
Figure V.20. Guidelines for Coherent International Tax and Investment Policies
Source: UNCTAD.
Possible guidelines for Coherent International Tax and Investment Policies
World Investment Report 2015: Reforming International Investment Governance208
Policy measures to tackle international tax avoidance
must inevitably address the role played by offshore
financial centres (OFCs). They have to mitigate the
harmful tax avoidance effects of global investment
hubs, but be mindful of the investment facilitation
role of hubs to avoid disruptions of investment
flows, especially to developing countries. Where
measures might diminish the facilitation role of hubs,
policymakers might consider alternative investment facilitation measures.
A formally agreed list of acceptable uses of offshore investment hubs – e.g. as neutral ground for cross-border mergers or joint ventures – could be a starting point for international action on hubs (see also WIR13); policymakers should consider objectively whether tax benefits are an essential ingredient for such acceptable
Box V.4. Is there still a role for fiscal incentives?
The importance of tax in location decisions (see box V.1) implies that fiscal incentives are an important tool to attract investment. In fact, those developing countries that have been most successful in industrial development over the past decades have made use of various forms of incentives schemes to attract the foreign investment they needed to kick-start economic activities and to bring in the necessary technology and know-how. The success of export-processing and special economic zones in those countries – forms of incentives scheme – is proof of their effectiveness.
Despite the evidence, policy advisors in international organizations have long warned against the dangers and downsides associated with incentives. Ongoing work by the IMF, OECD and WTO on incentives for the G20 adds to the negative policy advice on incentives. The World Bank’s research and advisory work has long focused on the cost of incentives and on the redundancy of many schemes for attracting investment – with good reasons: many schemes have indeed been found to be inefficient and ineffective.
However, almost all the arguments against the use of incentives are based on the way incentives are granted or administered, not on incentives per se. Thus, investment authorities worldwide have continued to include incentives in their investment promotion toolbox, fully aware of the important role tax plays in investment decisions, and unwilling to renounce one of the few available tools that can help overcome specific locational disadvantages, or that can help steer investment to priority areas for growth and development.
UNCTAD’s advice on incentives, in its Investment Policy Framework and in its technical assistance work (Investment Policy Reviews) is (i) to ensure that incentives schemes are based on an overall sustainable development strategy and investment priorities, and (ii) to administer incentives in such a way as to minimize and mitigate the risks of inefficiency and ineffectiveness, as well as the risk of administrative improprieties.
Key to maximizing the strategic value of incentives is focusing schemes on priority activities for development and on underdeveloped regions, and associating them with sustainable development impacts. These may include economic impacts, such as employment generation, training and capacity building, and technology and know-how transfer; social impacts, such as better availability and accessibility of services, the advancement of disadvantaged groups in society, or food security; and environmental impacts, such as the reduction of emissions or the generation of renewable energy.
It is important to tailor schemes to the needs of specific economic activities and associated risk-return profiles. For example, R&D-intensive activities display different profiles of capital investment and payback over time than labour-intensive activities; fiscal incentives schemes must be tailored accordingly. The same holds when schemes are reoriented towards sectors that are central to sustainable development, such as agriculture, education, health and infrastructure.
Key to ensuring the efficiency and effectiveness of incentives schemes is establishing clearly defined and transparent criteria and conditions, granting incentives as much as possible automatically on the basis of those criteria and conditions, and administering the process through competent authorities, preferably independent from investment promotion authorities, with the ultimate say for the ministry of finance.
Such a move away from location-based incentives schemes aimed purely at increasing the competitiveness of a location to schemes aimed at advancing sustainable development, and adherence to common-sense good practices for the administration of incentives schemes go a long way towards ensuring consistency with WTO rules on subsidies. The WTO rules on subsidies and countervailing measures, and the gradual expiry of exceptions, have somewhat blunted the incentive tool for developing countries, making it less suitable as an instrument of industrial development (at least for export-oriented industrial development). But as an instrument for the promotion of sustainable development, and for the attraction of investment in the Sustainable Development Goals, their relevance will increase (see WIR14).
Source: UNCTAD.

CHAPTER V International Tax and Investment Policy Coherence 209
applications, considering their negative side-effects
and potential to escalate into harmful tax competition.
In considering these measures, the international
community should also take into account the potential
economic impact of tax avoidance countermeasures
on some developing OFCs that have adopted
development strategies based on financial services.
3. National investment policymakers should
consider options at the entry and establish-
ment levels to prevent tax avoidance.
Where entry and establishment of investors is subject
to approval, investment authorities could require
information from prospective investors that would
attest to the responsible fiscal behaviour of investors
and facilitate tax collection on future revenue streams,
such as disclosure of financial information and
planning, and country-by-country reporting, while
respecting confidential business information.
Investment authorities may even apply (within the
constraints posed by international commitments and
standards) stricter tax compliance or transparency
conditions and rules for entry and establishment.
This could be feasible in particular in a number of
specific situations, e.g. privatization of state assets,
concession in extractive industries, or investments
related to government procurement.
Promoting adherence to corporate social responsibility
(CSR) and governance standards may also be an
effective tool to foster good taxpayer behaviour and
transparent reporting on fiscal contributions.
4. Investment promotion and facilitation options
and constructive relationship management
with investors can be leveraged to reduce the
motivation and opportunity for tax avoidance.
Foreign direct investment (FDI) incentives schemes
should be designed and structured in such a way
that they do not provide additional avenues for tax
avoidance. They should not create an additional low-
tax location in MNE corporate structures. If fiscal
incentives are provided, they should be specific and
time-bound, and ideally geared towards promoting
investment in sustainable development.
Conversely, it may be possible to design and administer
some fiscal incentives schemes in such a way that they
remove the motivation to shift profits. For example, where
tax breaks are given they could be provided for earnings
reinvested in productive assets; tax incentives could
focus on capital goods (e.g. rollover relief). Incentives
could also be made conditional upon pre-defined or
agreed tax behaviour and on disclosure criteria.
Tax incentives and award processes, if applied,
should be made more transparent, integrated into
the normal budgetary process, and subject to
greater accountability. Investment authorities should
coordinate with tax authorities, promote good taxpayer
service and foster constructive and transparent
dialogue between tax authorities and taxpayers.
5. Any national or international action to tackle
tax avoidance should consider interdepen-
dencies with international investment agree-
ments (IIAs).
The interaction between international tax policy and
IIAs is evident from the fact that the value proposition
of the major global investment hubs that are at the
heart of many tax avoidance schemes relies not only
on their domestic company law and tax rules and on
extensive networks of double taxation treaties (DTTs),
but also on equally extensive – and often matching –
networks of investment protection treaties (IIAs).
There is interaction between international tax policies
(and DTTs) on the one hand and IIAs on the other.
For example, the dispute settlement mechanism of
bilateral investment protection treaties (BITs) has been
used for tax disputes. More than 40 ISDS cases to
date have involved tax-related issues.
As tax avoidance countermeasures can be interpreted
as a change for the worse for investors, reducing the
value of the investment, or be applied selectively on
foreign investors, IIAs may pose limits on countries’
right to regulate. Therefore, in negotiating IIAs,
policymakers may wish to safeguard policy space on
tax issues and possibly strengthen denial of benefits
provisions. Beyond avoiding conflicting effects between
international tax policies and IIAs, policymakers could
consider how the two could mutually reinforce each
other (see Epilogue).
6. IIAs and double taxation treaties (DTTs) are
both part of countries’ investment facilitation
toolkit; these instruments should be aligned.
At the strategic level, just as countries need to
consider whether and how to engage in IIAs, they
need to apply the same considerations to DTTs and

World Investment Report 2015: Reforming International Investment Governance210
to specific provisions in DTTs. At the substantive
level, IIAs and DTTs have not evolved on the basis of
consistent design criteria (see box V.5). For example,
it is conceivable that investors may avoid permanent
establishment status as defined in DTTs but are
covered under IIAs due to their generally broader
definition of investment.
Policy action on DTTs to harmonize and/or consolidate
the treaty regime needs to consider impacts on and
from the international investment policy regime, avoid
conflict between the two and make them mutually
reinforcing as and where appropriate. Given the
importance of regional investment flows (and the
competition for investment that often occurs at regional
levels), regional cooperation approaches covering tax
avoidance may also be fruitful.
IIAs aim to address weaknesses in countries’ regulatory
and institutional environment for investment. For DTTs
this is not an explicit objective (also because DTTs
are equally relevant between developed economies).
However, in developing countries the effect of DTTs is
often to necessitate increased collection capabilities
on the part of tax authorities, if only because DTTs
put limits on withholding taxes, an effective collection
mechanism for countries with weak collection
capabilities. Therefore, both IIAs and DTTs – and efforts
to reform the two systems at the international level –
could be accompanied by development assistance to
reduce those weaknesses (e.g. technical assistance to
investment and tax authorities).
7. Policymakers should recognize the role in
cross-border corporate tax avoidance played
by different types of offshore investment
hubs as well as by home and host countries;
clarify shared responsibility; and take
comprehensive action.
National and international action on offshore investment
links should address both tax havens and special purpose
entities (SPEs) in other countries through which significant
international investments are routed. Comprehensive
action is needed, as partial solutions will lead only
to re-routing and alternative solutions for investors.
Cross-border corporate tax avoidance and the routing
of investment through offshore hubs are systemic
issues, part of the global FDI financing infrastructure.
The phenomenon is not driven solely by tax rules in
offshore hubs, but enabled by tax rules in home and
host countries. Policymakers in non-OFC jurisdictions should address features in their own tax rules that support or incentivize the use of offshore hubs by their own MNEs abroad or by foreign investors.
8. Tax avoidance and the lack of transparency in international financial transactions are global issues that require a multilateral approach, with adequate developing-country participation.
Effective action against tax avoidance requires international cooperation; a commitment to strengthen the United Nations committee of experts on taxation is instrumental to a full participatory approach.
International cooperation is fundamental to prevent harmful tax competition; competition to attract investment should not lead to a race to the bottom.
International cooperation is also important for the success of transparency initiatives, such as the Extractive Industries Transparency Initiative (EITI). Such initiatives should ideally not focus only on governments, but also on companies. International cooperation can help improve monitoring, auditing and accountability, and it can support institutional development and capacity-building.35
Effective exchange of information between tax authorities is a fundamental part of international cooperation. It is crucial to efforts to counter tax avoidance, and to counter illicit financial transactions (information exchange should include law enforcement agencies). The effect on good governance would indirectly benefit the investment climate.
Given the growing importance of tax avoidance in developing countries, the proportionately greater impact of tax avoidance on their budgets, and their greater needs to attract international investment for development, they should be adequately represented in discussions on international action on tax avoidance – particularly the low-income countries.
9. Policymakers should consider the importance of both international investment and tax revenues for sustainable development financing, and the specific features of tax avoidance in developing countries.
Given the lower tax collection capabilities of developing countries, rulemaking at the international level should take into account transition or other special and differential treatment options, as well as technical

CHAPTER V International Tax and Investment Policy Coherence 211
Box V.5. IIAs and DTTs
International investment agreements (IIAs) for the protection and promotion of investment, and treaties governing the fiscal treatment of investment operations between home and host countries (DTTs) are both part of the international policy environment for investors. Together they address the risk-return profile of cross-border investments, with IIAs providing an “insurance policy” to mitigate investor risk, and DTTs protecting investor returns from fiscal erosion. They are two sides of the same coin.
The systems of IIAs and DTTs naturally developed together. As FDI became an increasingly important phenomenon in the globalizing economy, investment partner countries concluded mostly bilateral investment protection treaties (BITs) and DTTs in parallel. Both types of treaties were often negotiated between the same partner countries, simultaneously or in short succession. Where countries have both a BIT and a DTT, in around a quarter of cases the treaties entered into force in the same year; about one third within a two-year period. As a result, in countries with significant outward investment stocks and large treaty networks, and especially in investment hubs, BIT and DTT network coverage often matches.
Conversely, the piecemeal growth of both systems – BIT by BIT, DTT by DTT – has also resulted in gaps in coverage and inconsistencies in treaty substance. This is compounded by the fact that the competency for negotiating BITs and DTTs generally lies with different ministries; for BITs it tends to be national investment agencies (such as Boards of Investment) or Ministries of Trade and Industry or Foreign Affairs who lead the process, whereas with DTTs Ministries of Finance take the lead, with some expertise supplied by tax administrations.
As to coverage, DTTs at first glance appear to be more efficient. Although the number of DTTs and BITs is roughly similar (around 3,000 DTTs are currently in force and around 2,300 BITs), DTTs cover 90 per cent of global FDI stock while BITs cover less than 15 per cent. In part this is due to the fact that the fiscal treatment of cross-border investment is equally relevant in developed countries, while the original purpose of BITs was to provide investment protection mostly in developing countries. Looking only at developing-country FDI stock, BIT coverage increases to 30 per cent, with higher shares among the LDCs. The higher apparent coverage of DTTs also reflects the fact that investment protection and promotion issues are dealt with in a host of other agreements.
As to substance, inconsistencies include differences in covered investments, with the concept of permanent establishment in DTTs substantially differing from the definition of “investment” in BITs; differences in dispute settlement mechanisms, with the mutual agreement procedure in DTTs considered weaker from an investor perspective than the investor-State dispute settlement system in IIAs; and varying approaches to managing the interaction between IIAs and DTTs, with only 10 per cent of BITs excluding tax issues from their scope (although 80 per cent exclude tax issues from most-favoured-nation treatment).
/…
assistance to deal with greater complexity that may result from new anti-avoidance measures. Some tax avoidance schemes are comparatively more relevant for developing countries; some countermeasures are more difficult to implement in developing countries; and the role of incentives is often greater in developing countries, with implications for the effectiveness of some countermeasures: one size does not fit all.
DTTs often have the effect of reducing or removing an effective means to collect taxes (withholding taxes) in developing countries that may have limited alternative tax collection capabilities; international measures related to DTTs should not hurt developing countries.
10. Investment and ownership information is key to analysing tax avoidance schemes and should be prioritized, together with other tools to enable anti-avoidance measures and to foster good tax behaviour.
Measurement of BEPS is critical to designing and implementing effective anti-avoidance measures. FDI data can be an effective signalling indicator for BEPS.
Collection of FDI data at the macro level (balance of
payments, at country level) should be further improved
(extended) to show transit FDI through offshore hubs
and matching FDI income streams.
At the micro level, transparency and disclosure of
investment and ownership information is indispensable.
Ultimately, full transparency can only be achieved if
governments (tax authorities, financial intelligence
units and other regulatory agencies) can get behind
the corporate veil and behind trusts to identify ultimate
beneficial owners. This would complement the move
towards country-by-country reporting, which enables tax
authorities to have a more global view of the operations
of MNEs.
Sharing of country-by-country reporting information
should effectively facilitate host-country tax collection and
take into account lower collection capabilities in some
developing economies. CSR and integrated reporting
requirements for firms could also play a supporting role,
by strengthening documentation of fiscal behaviour.

World Investment Report 2015: Reforming International Investment Governance212
Box V.5. IIAs and DTTs (concluded)
Both the IIA and the DTT regimes are an important part of the investment promotion and facilitation toolkit of the global economy as a whole and of individual countries. Global investment hubs tend to have relatively large treaty networks of both types, with the treaty coverage of their outward investment increasing to near 100 per cent in individual cases. Host economies in some developing regions and in transition economies rarelyreceive investment that is not covered by DTTs or BITs, and often both.
The treaty networks evolved in parallel and for the same overarching purpose of promoting cross-border investment in productive assets (box table V.5.1). Along the way, they have come to face similar challenges. Unintended consequences and side effects have increasingly surfaced. IIAs have led to some policymakers feeling more constrained in regulating for the public good, and they have resulted in often costly claims against host states on grounds that were not anticipated in the early development phase of IIAs. DTTs designed to avoid or to mitigate the effect of double taxation have resulted in many instances of double non-taxation, and many developing countries with weak tax collection capabilities have seen limits imposed on the use of a relatively effective tax collection mechanism (withholding taxes). In both situations, to obtain treaty benefits, investors have resorted to treaty shopping and the indirect routing of investments through conduits. About one third of global FDI stock has been routed through investment hubs before arriving at its destination.
Source: UNCTAD, based on ITIC (2014).
Over time, efforts to address some of these challenges – in model treaties and in negotiations – have led to some common (or directionally similar) trends in IIAs and DTTs. In IIAs, more attention is slowly being paid to sustainable development issues. Analogously, in DTTs, clauses favouring developing countries are becoming more common; for example, countries are increasingly retaining taxing rights on services. IIA negotiators are looking for a better balance between rights and obligations. DTT negotiators are starting to balance lower withholding tax rates with more expansive definitions of permanent establishments, widening the tax base.
In both the IIA and DTT regimes, progress in dealing with challenges is held back by the large inventory of existing treaties. A significant share of global FDI stock, and especially FDI stock in developing countries, is covered by treaties that were signed more than a decade (often decades) ago. These treaties do not yet reflect the gradual changes in treaty norms that have taken place, often in favour of developing countries. Only systemic reform efforts can overcome this problem.
A useful starting point will be to bridge an existing knowledge gap: to date, the interaction between DTTs and IIAs remains largely unexamined. Experts in international taxation and international investment agreements rarely have an occasion to exchange views and learn from each other. UNCTAD will aim to provide such an occasion in its regular expert meetings.
Source: UNCTAD.
IIA-specific themes Shared themes DTT-specific themes
• Ensure fair and equitable treatment of foreign investors
• Provide for adequate compensation for expropriations
• Cover the operation, expansion, management and - potentially - establishment an investment
• Ensure funds can be transferred out of the host country without delay
• Promote economic growth and development in contracting states by facilitating cross-border investment
• Prevent discriminatory treatment of foreign investors/taxpayers and provide a level playing field
• Provide more certainty to taxpayers/investors
• Provide a dispute resolution mechanism
• Allocate taxing rights between the contracting states
• Establish methods for relief from double taxation and double non-taxation
• Exchange tax information and in some cases provide assistance in tax collection
• Establish treatment of certain categories of taxpayer or income
Box table V.5.1. Common and specific themes in IIAs and DTTs

CHAPTER V International Tax and Investment Policy Coherence 213
EPILOGUEREFORMING INTERNATIONAL INVESTMENT GOVERNANCE
Investment in productive assets, infrastructure and knowledge is a necessary prerequisite and the foundation for economic growth and sustainable development in all countries. Foreign direct investment plays an important role in financing for development and in supporting progress towards the Sustainable Development Goals (SDGs). The World Investment Report 2014 presented an action plan to bridge the SDG investment gap. It argued for a concerted push by policymakers to mobilize investment, channel it to where it is most needed and ensure its positive impacts. Part of this concerted push must be the strengthening of the regulatory policy environment for investment, by reforming international investment governance – the topic of this year’s Report.
The international policy environment for investment is not exclusively made up of international investment agreements (IIAs). A host of related policy areas are also important, including trade, taxation, competition, and social and environment issues, as identified in UNCTAD’s comprehensive Investment Policy Framework for Sustainable Development. International governance varies across these policy areas. Some have a global governance framework, some are fragmented; some are overseen by global institutions and have hard enforcement mechanisms, some are governed by soft-law standards or private initiatives.
This WIR focuses on two core areas of international investment governance that are at the center of today’s debate: IIAs and international taxation. Both are the object of significant reform efforts.
In IIAs, a shared view is emerging that reform is needed and that it should be guided by the goal of harnessing IIAs for sustainable development, focusing on key reform areas and following a multilevel, systematic and inclusive approach. Chapter IV of this report offers an action menu for such reform.
In taxation, attention is focusing on coordinated action against base erosion and profit shifting (BEPS), notably in the OECD/G20 BEPS project. Chapter V of this report places the tax avoidance debate in the context of the contribution of MNEs to government revenues, estimates revenue losses associated with BEPS, and
explains the links between investment and tax and the consequent need for policy coherence.
The international investment and tax policy regimes are closely interrelated. The two have the same ultimate objective: promoting and facilitating cross-border investment. They have a similar architecture, with both made up of a “spaghetti bowl” of mostly bilateral agreements. The two systems face similar challenges, for example, in strengthening their sustainable development dimension and maintaining their legitimacy. They interact, with potential consequences in both directions; and both are the object of reform efforts.
Reform efforts must ensure the continued effectiveness of both policy regimes to maintain confidence in and support for both. The policy imperative is to continue to facilitate cross-border productive investment and to take action against tax avoidance to support domestic resource mobilization for the pursuit of sustainable development.
Each regime will have its own specific reform priorities related to its specific area of competence. But there may be merit in greater coherence between the two reform processes, with better-managed interaction not only avoiding conflict between the regimes (e.g. by carving out taxation from BITs) but making them mutually supporting. The guidelines for coherent international tax and investment policies set out in chapter V are a starting point.
Ensuring that international tax and investment policies are mutually reinforcing is fundamental to building and maintaining an enabling environment for investment, maximizing the chances of reaching financing for development targets (to be discussed at the third international conference on financing for development in Addis Ababa, in mid-July 2015), and supporting the integration in the global economy of developing countries.
To that end, the international investment and development community should, and can, eventually build a common framework for global investment cooperation. UNCTAD can facilitate such a process for the benefit of all.

World Investment Report 2015: Reforming International Investment Governance214
Notes
1 The term “investment” in this chapter is used as commonly understood and refers to direct private investment in productive assets. The focus is naturally on foreign direct investment (FDI), although policy implications may occasionally extend to, or be equally relevant for, domestic investment.
2 For a discussion on the relevance of the composition of taxes for development, see UNCTAD’s TDR14.
3 The term “foreign affiliates” covers direct investment enterprises outside the home country of the investor in which the investor owns at least 10 per cent of voting power. It includes both branches and subsidiaries.
4 According to the IMF, “SPEs are autonomous legal entities, directly or indirectly wholly foreign owned, that are part of a group company, without substantial real economic links with the host economy, engaged in a variety of cross-border financial activities, which are aimed at the passing through of all types of financial and non-financial assets, liabilities and related income to third countries”.
5 This chapter groups tax havens and jurisdictions that offer SPEs where doing so is useful to explain the conduit nature of investment structures located there. Tax haven refers to small jurisdictions with economies almost entirely dedicated to offshore financial activities; typical examples are the British Virgin Islands and the Cayman Islands. In contrast, jurisdictions offering SPEs often have substantial real economic activity, but they also act as financial centres for MNEs owing to their favourable tax conditions and other benefits for investors. The terminology is consistent with the WIR13 (chapter 1, section A.1.d).
6 These include Austria, Hungary, Luxembourg and the Netherlands, with the latter two accounting for the bulk of transit FDI discussed here. The number of jurisdictions publishing SPE investment data is currently increasing rapidly as more countries are aligning with the OECD Benchmark Definition (edition 4th) and IMF Balance of Payments and International Investment Position Manual (edition 6th). The countries used here have a long record of publishing SPE data and (especially through the Netherlands and Luxembourg) account for the bulk of global SPE investment.
7 Note that for the Netherlands and Luxembourg such amplified FDI patterns do not affect official FDI statistics. For these countries, UNCTAD removes flows to/from SPEs from reported inflows/outflows. This treatment of the data allows segregating the transit component.
8 This characterization was first introduced by OECD (1998), p. 23. 9 This list of 38 jurisdictions is a revision of the original OECD list
(2000) of 41 jurisdictions meeting the four characteristics (i)-(iv) to qualify as tax havens. Jurisdictions included are Anguilla, Antigua and Barbuda, Aruba, Bahamas, Bahrain, Belize, Bermuda, the British Virgin Islands, the Cayman Islands, Cook Islands, Cyprus, Dominica, Gibraltar, Grenada, Guernsey, the Isle of Man, Jersey, Liberia, Liechtenstein, Malta, Marshall Islands, Mauritius, Monaco, Montserrat, Nauru, the Netherlands Antilles, Niue, Panama, Saint Kitts and Nevis, Saint Lucia, Saint Vincent and the Grenadines, Samoa, San Marino, Seychelles, Turks and Caicos Islands, the United States Virgin Islands and Vanuatu. More recently, the OECD has increasingly focused on transparency standards and information exchange. The 38-jurisdiction list is still published on the OECD website as “Jurisdictions Committed to Improving Transparency and Establishing Effective Exchange of Information in Tax Matters”. This list has also been referred to by other studies, including Tax Justice Network (2007), U.S. Government Accountability Office (2008) and Gravelle (2013). Note that the 38-jurisdiction list employed in this chapter differs slightly from the list of 35 tax havens used in UNCTAD’s WIR13 (p. 36, note 4), based on a more restricted set of countries published in OECD (2000) excluding some advance commitment jurisdictions even if they met the tax haven criteria.
10 UNCTAD’s WIR13 estimates the total amount of inflows to OFCs and conduits in 2011 at over $700 billion, consisting of $600 billion of inflows to the SPEs in three jurisdictions Hungary, Luxembourg and the Netherlands and $90 billion of inflows to tax havens. Of the
estimated $700 billion, only the inflows to tax havens are included in the reported FDI statistics (but excluded from analyses in the WIR). Other studies that look at the phenomenon of offshore FDI include Christian Aid (2013) and ActionAid (2013).
11 The baseline for the calculation of the absolute values (given the shares provided by the Offshore Investment Matrix) is $29 trillion, resulting from the sum of the total inward stock reported by UNCTAD’s WIR13 ($23 trillion) and the (unreported) SPE component ($6 trillion).
12 Also, tax havens display inward/outward symmetry; however, in the derivation of the Offshore Investment Matrix, symmetry in the case of tax havens applies by construction (see annex II).
13 There may be reasons other than base erosion for injecting debt funding as opposed to equity funding. In some cases, ease of repatriation can be an additional motivation. There are generally no or minimal restrictions on the repatriation of the principal amount of debt injected, whereas in some jurisdictions difficulties may arise with respect to repatriation of equity capital.
14 Analysis based on UNCTAD’s bilateral FDI and IIA databases. Less than 15 per cent of non-SPE outward FDI from the Netherlands is covered by bilateral investment treaties (BITs), implying that SPE flows have a higher relative preference for BIT coverage. More than 90 per cent of all outward investment (SPE and non-SPE) is covered by DTTs, indicating that tax is the most important motivation for Netherlands SPE use. Note that for investments to developing countries alone the distinction is less clear, with BIT coverage increasing significantly.
15 For a recent discussion of the two types of schemes in the context of developing economies, see e.g. Fuest et al. (2013b) for transfer pricing schemes and Fuest et al. (2013a) for financing schemes.
16 Conceptually, there may be transfer pricing aspects in financing schemes and financing aspects in transfer pricing schemes. The defining terminology is more conventional than substantive. Empirically, often the schemes are used in combination by MNEs. Nevertheless substantive differences between the two types emerge in the mechanics of the schemes (figures V.14 and V.15) as well as in the business implications (see also table V.2).
17 ActionAid reports some cases (www.actionaid.org.uk/tax-justice).18 In 2012 Google paid only £11.6 million of corporate income taxes
on £3.4 billion of revenues generated in the United Kingdom. This practice put Google under the scrutiny of the country’s tax authority.
19 Action 1 of the OECD Action Plan for the G20 (OECD, 2013b) is dedicated to “Addressing the tax challenge of the digital economy”.
20 Recent empirical work by Dharmapala and Riedel (2013) suggests that financial income shifting due to debt interest payment is even more relevant than operating income shifting (driven by transfer pricing schemes). The work analyses how exogenous earnings shocks at the parent firm propagate across low-tax and high-tax multinational subsidiaries. The central result is that parents’ positive earnings shocks are associated with a significantly positive increase in pre-tax profits at low-tax affiliates, relative to the effect on the pre-tax profits of high-tax affiliates, signalling a profit-shifting effect. Interestingly the estimated effect is attributable primarily to the strategic use of debt across affiliates.
21 ActionAid (2013) proposes some case examples of harmful financing schemes perpetrated by MNEs in developing economies.
22 On the basis of Concord estimates, public domestic sources represent on average 30 per cent of GDP (including in addition to taxation, social security contributions and other revenues such as fines and income from property); the remaining part of domestic sources (28 per cent) consists of domestic private sector investments. Domestic taxation ranges from 15 per cent of GDP for low-income countries to 30 per cent for high-income countries. External sources at 5.4 per cent of GDP include loans (1.8 per cent), remittances (1.5 per cent), FDI (1.3 per cent), official development assistance (0.6 per cent) and others (1.5 per cent).
23 See Atisophon et al. (2011).
CHAPTER V International Tax and Investment Policy Coherence 215
24 Existing studies tend to capture the effect of tax competition rather than that of profit shifting. In empirical studies, individual African countries commonly exhibit low effective tax rates, in part due to the abuse of tax incentives and special regimes to attract investment. However, the effective tax rate assesses tax revenue collection against a baseline (pre-tax corporate profits) that is already depressed by profit shifting. Thus it is more suitable for addressing the impact of tax incentives (leading to cuts of the tax payments, given the taxable base) rather than of profit-shifting schemes (designed instead to erode the taxable base itself).
25 As the relationship between offshore hub investment links and rates of return on investment holds across countries, it is not possible to exclude compositional effects of specific countries driving the results. Annex II reports the results of the analysis and discusses methodological and analytical issues, including robustness tests.
26 In addition to a lower coefficient, there are also features of developed economies that reduce the baseline on which the simulation of the impact takes place. This has a further “mitigating” effect on the aggregate estimate of profit shifting and tax revenue losses. These issues are discussed in more detail in annex II.
27 The Offshore Investment Matrix and the Offshore Indicator developed by UNCTAD are being considered by Working Group 2 of the OECD Fiscal Committee and the Action 11 Focus Group of the OECD/G20 BEPS Project for inclusion in the deliverable for Action 11 as signal indicators.
28 On the basis of tax expenditure data for a sample of 20 developing countries, M. Hearson in 2013 estimated the revenue loss related to tax incentives granted on corporate income taxation at a half percentage point of GDP (0.6 per cent simple average; 0.47 per cent weighted average). Using the 2012 GDP for developing economies, at $25.5 trillion, leads to total losses of around $140 billion. See the ActionAid website for more details: www.actionaid.org/2013/07/tax-incentives-cost-138-billion.
29 See PwC (2008) and PwC (2013a).30 The very concept of “anti-avoidance rules”, which obviously
make a targeted type of avoidance illegal, blurs the definitional distinction. The distinction also does not address the possibility of retrospective measures that would change the characterization of actions over time.
31 For a discussion on the importance of constructive and transparent dialogue between tax authorities and taxpayers, see Owens (2013).
32 For a discussion on tax policy as an investment determinant, see Owens (2012b).
33 For a discussion on positive and negative effects of tax competition, see, for example, Owens (2012a).
34 See UNCTAD WIR13 on FDI and offshore finance, p. 17.35 See also UNCTAD TDR14 (pp. 194−195) for further recommen-
dations specifically regarding EITI.

World Investment Report 2015: Reforming International Investment Governance216
REFERENCES
ActionAid (2013). “How tax havens plunder the poor”. www.gfintegrity.org/wp-content/uploads/2014/05/ActionAid-Tax-Havens-May-2013.pdf.
Ali Abbas, S.M., A. Klemm, S. Bedi and J. Park (2012). “A partial race to the bottom: Corporate tax developments in emerging and developing economies”, IMF Working Papers, 12(28), Washington, D.C.: International Monetary Fund.
Altomonte C., T. Aquilante, G. Békés and G.I.P. Ottaviano (2013). “Internationalization and innovation of firms: evidence and policy”, Economic Policy, 28 (76): 663–700.
Atisophon V, J. Bueren, G. De Paepe, C. Garroway and J.P. Stijns (2011). “Revisiting MDG cost estimates from a domestic resource mobilisation perspective”, OECD Development Center Working Papers 306. Paris: OECD Publishing.
Baker, P. (2013). “Improper use of tax treaties, tax avoidance and tax evasion”, Papers on Selected Topics in Administration of Tax Treaties for Developing CountriesI, No. 9-A, May. New York: UN/ITC. www.un.org/esa/ffd/wp-content/uploads/2013/05/20130530_Paper9A_Baker.pdf.
Baker, R.W. (2005). Capitalism’s Achilles Heel: Dirty Money and How to Renew the Free-Market System. Hoboken, NJ: John Wiley & Sons Ltd.
Bank of Zambia (2014). Foreign Private Investment and Investor Perceptions in Zambia. Lusaka: Bank of Zambia.
Barefoot, K.B. (2012). “U.S. multinational companies: Operations of U.S. parents and their foreign affiliates in 2010”, Survey of Current Business (2012): 51–74.
Beer, S. and J. Loeprick (2014). “Profit shifting: drivers of transfer (mis)pricing and the potential of countermeasures”, International Tax and Public Finance, 22: 1–26.
Chen, D. and J. Mintz (2013). “2013 Annual global tax competitiveness ranking: corporate tax policy at a crossroads”, SPP Research Papers, 6 (35). Calgary: University of Calgary School of Public Policy.
Christian Aid (2008). “Death and taxes: The true toll of tax dodging”, May. www.christianaid.org.uk/images/deathandtaxes.pdf.
Christian Aid (2009). “False profits: Robbing the poor to keep the rich tax-free”, March. https://www.christianaid.org.uk/Images/false-profits.pdf.
Christian Aid (2013). “Invested interests: The UK’s overseas territories hidden role in developing countries”. www.christianaid.org.uk/Images/Invested-Interests-Christian-Aid-tax-report.pdf.
Choudhury, H. and J. Owens (2014). “Bilateral investment treaties and bilateral tax treaties”, International Tax and Investment Center Issues Paper, June.
Clausing, K.A. (2009). “Multinational firm tax avoidance and tax policy”, National Tax Journal, 65: 703–725.
Cobham, A. (2005). «Tax evasion, tax avoidance and development finance», Série documents de travail 129. Oxford: Queen Elizabeth House..
Cobham, A. and S. Loretz (2014). “International distribution of the corporate tax base: Impact of different apportionment factors under unitary taxation”, ICTD Working Paper, 27, April. Brighton, U.K.: International Centre for Tax and Development.
Concord Aidwatch (2013). “Global financial flows, aid and development”, AidWatch Briefing Paper, March. Brussels: Concord. http://eurodad.org/files/integration/2013/03/2013_AW-Briefing-paper_Global-financial-flows-aid-and-development1.pdf.
Deloitte (2013). “Global survey of R&D tax incentives”, March. http://investinamericasfuture.org/PDFs/Global_RD_Survey_March_2013.pdf.
Dharmapala, D. and J.R. Hines (2006). “Which countries become tax havens?”, NBER Working Paper No. 12802, December. Cambridge, MA: National Bureau of Economic Research. www.nber.org/papers/w12802.pdf.
Dharmapala, D. and N. Riedel (2013). “Earnings shocks and tax-motivated income-shifting: Evidence from European multinationals”, Journal of Public Economics, 97: 95–107.
Dischinger, M. and N. Riedel (2011). “Corporate taxes and the location of intangible assets within multinational firms”, Journal of Public Economics, 95(7-8): 691–707.

CHAPTER V International Tax and Investment Policy Coherence 217
Eden, L. (2014). “The arm’s length standard: making it work in a 21st century world of multinationals and nation states”, in Pogge, T. and K. Mehta (eds.), Global Tax Fairness. Oxford: Oxford University Press.
Evers, L. and C. Spengel (2014). “Effective tax rates under IP tax planning”, ZEW Discussion Paper, No. 14-111. Mannheim, Germany: Centre for European Economic Research.
Fuest, C. and N. Riedel (2009). “Tax evasion, tax avoidance and tax expenditures in developing countries: A review of the existing literature”. Report prepared for the U.K. Department for International Development (DFID). Oxford: Oxford University Centre for Business Taxation.
Fuest, C. and N. Riedel (2010). “Tax evasion and tax avoidance in developing countries: The role of international profit shifting”. Centre for Business Taxation Working Papers, 10(12). Oxford: Oxford University Centre for Business Taxation. http://eureka.sbs.ox.ac.uk/3257/1/WP1012.pdf.
Fuest, C., G. Maffini and N. Riedel (2012). “What determines corporate tax payments in developing countries? Evidence from firm panel data”. Paper presented at the XXIV conference, Società italiana di economia pubblica, Pavia, 24–25 September. www.siepweb.it/siep/oldDoc/2012/201227.pdf.
Fuest, C, S. Hebous and N. Riedel (2013a). “International debt shifting and multinational firms in developing economies”, Economics Letters, 113(2): 135–138.
Fuest, C., C. Spengel, K. Finke, J. Heckemeyer and H. Nusser (2013b). “Profit shifting and ‘aggressive’ tax planning by multinational firms: Issues and options for reform”. Center for European Economic Research Discussion Paper, No. 13-04. Mannheim, Germany: Centre for European Economic Research.
Gravelle, J.G. (2013). “Tax havens: International tax avoidance and evasion”. Washington, D.C.: Congressional Research Service. www.fas.org/sgp/crs/misc/R40623.pdf.
Guerriero, M. (2012). “The labour share of income around the world. Evidence from a panel dataset”. Paper prepared for the 4th Economic Development International Conference of GREThA/GRES, Inequalities and Development: New Challenges, New Measurements?, University of Bordeaux, France, 13–15 June. http://piketty.pse.ens.fr/files/Guerriero2012.pdf.
Haberly, D. and D. Wojcik (2014). “Tax havens and the production of offshore FDI: An empirical analysis”, Journal of Economic Geography, 15(1): 75–101. http://joeg.oxfordjournals.org/content/15/1/.
Henry, James S. (2012). “The price of offshore revisited”. Chesham, Buckinghamshire, United Kingdom: Tax Justice Network. www.taxjustice.net/cms/upload/pdf/Price_of_Offshore_Revisited_120722.pdf.
Hines, J.R. and E.M. Rice (1994). “Fiscal paradise: Foreign tax havens and American business”. The Quarterly Journal of Economics, 109(1): 149–182.
Hollingshead, A. (2010). “The implied tax revenues loss from trade mispricing”, February. Washington, DC: Global Financial Integrity. www.gfintegrity.org/storage/gfip/documents/reports/implied%20tax%20revenue%20loss%20report_final.pdf.
IMF, OECD, UN and World Bank (2011). “Supporting the development of more effective tax systems”. Report to the G20 development working group.
IMF (2014). “Spillovers in international corporate taxation”. IMF Policy Paper. Washington, D.C.: International Monetary Fund.
ITIC (2014). “Bilateral Investment Treaties and Bilateral Tax Treaties”, International Tax and Investment Center Issues Paper, by H. Choudhury and J. Ownens, June. www.iticnet.org
Itriago, D. (2011). “Owning development: Taxation to fight poverty”, Oxfam Research Report, September. Oxford, United Kingdom: Oxfam. https://www.oxfam.org/sites/www.oxfam.org/files/rr-owning-development-domestic-resources-tax-260911-en.pdf.
Lequiller, F. and D. Blades (2006). Understanding National Accounts. Paris: OECD Publishing.
Markle, K.S. and D.A. Shackelford (2012). “Cross-country comparisons of corporate income taxes”, National Tax Journal, 65(3): 493–528.
Markle, K.S. and D.A. Shackelford (2013). “The impact of headquarter and subsidiary locations on multinationals’ effective tax rates”, NBER Working Paper, No. 19621. Cambridge, Mass.: National Bureau of Economic Research.
OECD (1998). “Harmful tax competition: An emerging global issue”. Paris: OECD. www.oecd.org/tax/transparency/44430243.pdf.
OECD (2000). “Towards global tax co-operation: Report to the 2000 ministerial council meeting and recommendations by the committee on fiscal affairs”. Paris: OECD.

World Investment Report 2015: Reforming International Investment Governance218
OECD (2013a). Addressing Base Erosion and Profit Shifting. Paris: OECD Publishing. http://dx.doi.org/10.1787/9789264192744-en.
OECD (2013b). Action Plan on Base Erosion and Profit Shifting. Paris: OECD Publishing. http://dx.doi.org/10.1787/9789264202719-en.
Owens, J. (2012a). “Tax competition: to welcome or not”. David Tillinghast Lecture. Tax Law Review, 65(2): 173.
Owens, J. (2012b). “The effect of tax on foreign direct investment”. Tax Notes International, December 3. Falls Church, Va.: Tax Analysts.
Owens, J. (2013). “The role of tax administrations in the current political climate”. Bulletin for International Taxation, March: 156–160.
Oxfam (2000). “Tax havens: Releasing the hidden billions for poverty eradication”, Oxfam Briefing Papers, June. Oxford: Oxfam International.
Oxfam (2013). “Fixing the cracks in tax: A plan of action”. Oxford: Oxfam International. https://www.oxfam.org/sites/www.oxfam.org/files/file_attachments/fix-the-cracks-in-tax_0.pdf.
Prichard, W., A. Cobham and A. Goodall (2014). “The ICTD Government Revenue Dataset”, ICTD Working Paper, 19. Brighton, United Kingdom: International Centre for Tax and Development. www.ictd.ac/sites/default/files/ICTD%20WP19.pdf.
PwC (2008).”Total tax contribution: How much in taxes do Indian companies really pay?” Survey. www.pwc.in/en_IN/in/assets/pdfs/total-tax-contribution.pdf.
PwC (2013a). “Total tax contribution (South Africa): A closer look at the value created by large companies for the fiscus in the form of taxes”, June. www.pwc.co.za/en_ZA/za/assets/pdf/Total-Tax-Contribution-2010.pdf.
PwC (2013b). “Tax transparency and country-by-country reporting. An ever changing landscape”, October. https://www.pwc.com/en_GX/gx/tax/publications/assets/pwc_tax_transparency_and-country_by_country_reporting.pdf.
Tax Justice Network (2007). “Identifying tax havens and offshore finance centers”. Briefing paper. Chesham, Buckinghamshire, United Kingdom. www.taxjustice.net/cms/upload/pdf/Identifying_Tax_Havens_Jul_07.pdf.
Tattawasart, O. (2011). “Toward FATS and beyond: the case of Thailand”. Proceedings of the IFC Conference, Initiatives to Address Data Gaps Revealed by the Financial Crisis, IFC Bulletin, 34: 488–502.
Trapp, K. (2015). “Measuring the labour income of developing countries. Learning from social accounting matrices”, WIDER Working Paper, 2015/041. Helsinki: UNU-WIDER.
United Nations (2011). Model Double Taxation Convention between Developed and Developing Countries. New York: United Nations.
TDR14. Trade and Development Report 2014: Global Governance and Policy Space for Development. New York and Geneva: United Nations.
WIR92. World Investment Report 1992: Transnational Corporations as Engines of Growth. New York and Geneva: United Nations.
WIR12. World Investment Report 2012: Towards a New Generation of Investment Policies. New York and Geneva: United Nations.
WIR13. World Investment Report 2013: Global Value Chains: Investment and Trade for Development. New York and Geneva: United Nations.
WIR14. World Investment Report 2014: Investing in the SDGs: An Action Plan. New York and Geneva: United Nations.
U.S. Government Accountability Office (2008). “Large U.S. corporations and federal contractors with subsidiaries in jurisdictions listed as tax havens or financial privacy jurisdictions”. Report to Congressional Requesters GAO-09-157. Washington, DC: GAO. www.gao.gov/new.items/d09157.pdf.
World Bank (2013). Financing for Development Post-2015. Washington, D.C.: World Bank.
World Bank and PwC (2015). “Paying Taxes 2015”. www.doingbusiness.org/~/media/GIAWB/Doing%20Business/Documents/Special-Reports/Paying-Taxes-2015.pdf.
Yorgason, D.R. (2009). “Collection of data on income and other taxes in surveys of U.S. multinational enterprises”. Paper prepared for the 4th Joint Session of the Working Group on International Investment Statistics and the Working Party on Globalisation of Industry, Organization for Economic Co-operation and Development, Paris, 8 October. www.bea.gov/papers/pdf/Yorgason_multinational_taxes.pdf.

ANNEX TABLES A1
ANNEX TABLES
Table 1. FDI flows, by region and economy, 2009−2014 . . . . . . . . . . . . . . . . . . . . . . . . . . . . . . . . . . . . . . A3
Table 2. FDI stock, by region and economy, 1990, 2000, 2014 . . . . . . . . . . . . . . . . . . . . . . . . . . . . . . . . A7
Table 3. Value of cross-border M&As, by region/economy of seller/purchaser, 2008−2014 . . . . . . . . . . . . . A11
Table 4. Value of cross-border M&As, by sector/industry, 2008−2014 . . . . . . . . . . . . . . . . . . . . . . . . . . A14
Table 5. Cross-border M&A deals worth over $3 billion completed in 2014 . . . . . . . . . . . . . . . . . . . . . . . A15
Table 6. Value of announced greenfield FDI projects, by source/destination, 2008−2014 . . . . . . . . . . . . . . A16

World Investment Report 2015: Reforming International Investment GovernanceA2
List of annex tables available on the UNCTAD site, www.unctad.org/wir, and on the CD-ROM
1. FDI inflows, by region and economy, 1990–2014
2. FDI outflows, by region and economy, 1990–2014
3. FDI inward stock, by region and economy, 1990, 2000, 2014
4. FDI outward stock, by region and economy, 1990, 2000, 2014
5. FDI inflows as a percentage of gross fixed capital formation, 1990–2014
6. FDI outflows as a percentage of gross fixed capital formation, 1990–2014
7. FDI inward stock as percentage of gross domestic products, by region and economy, 1990–2014
8. FDI outward stock as percentage of gross domestic products, by region and economy, 1990–2014
9. Value of cross-border M&A sales, by region/economy of seller, 1990–2014
10. Value of cross-border M&A purchases, by region/economy of purchaser, 1990–2014
11. Number of cross-border M&A sales, by region/economy of seller, 1990–2014
12. Number of cross-border M&A purchases, by region/economy of purchaser, 1990–2014
13. Value of cross-border M&A sales, by sector/industry, 1990–2014
14. Value of cross-border M&A purchases, by sector/industry, 1990–2014
15. Number of cross-border M&A sales, by sector/industry, 1990–2014
16. Number of cross-border M&A purchases, by sector/industry, 1990–2014
17. Cross-border M&A deals worth over $1 billion completed in 2014
18. Value of announced greenfield FDI projects, by source, 2003–2014
19. Value of announced greenfield FDI projects, by destination, 2003–2014
20. Value of announced greenfield FDI projects, by sector/industry, 2003–2014
21. Number of announced greenfield FDI projects, by source, 2003–2014
22. Number of announced greenfield FDI projects, by destination, 2003–2014
23. Number of announced greenfield FDI projects, by sector/industry, 2003–2014

ANNEX TABLES A3
Annex table 1. FDI flows, by region and economy, 2009–2014 (Millions of dollars)
FDI inflows FDI outflows
Region/economy 2009 2010 2011 2012 2013 2014 2009 2010 2011 2012 2013 2014
Worlda 1 186 432 1 328 102 1 563 749 1 402 887 1 467 233 1 228 263 1 101 335 1 366 070 1 587 448 1 283 675 1 305 910 1 354 046
Developed economies 652 306 673 199 827 351 678 730 696 854 498 762 819 605 963 210 1 156 137 872 861 833 630 822 826
Europe 437 075 404 843 489 657 400 723 325 533 288 766 400 223 565 949 586 793 376 402 316 819 315 921
European Union 391 285 358 644 444 824 364 767 333 084 257 567 352 388 459 366 519 862 316 726 285 133 280 124
Austria 9 268 2 575 10 616 3 989 10 376 4 675 10 998 9 585 21 913 13 109 16 216 7 690
Belgium 75 169 60 635 78 258 9 308 23 396 - 4 957 15 251 9 092 46 371 33 985 17 940 8 534
Bulgaria 3 385 1 525 1 849 1 467 1 920 1 710 - 95 230 163 347 240 215
Croatia 3 077b 1 133b 1 682b 1 451b 955b 3 451b 1 260b - 91b 42b - 56b - 180b 1 886b
Cyprus 3 472 766 2 384 1 257 3 497 679b 383 679 2 201 - 281 3 473 2 176b
Czech Republic 2 927 6 141 2 318 7 984 3 639 5 909 949 1 167 - 327 1 790 4 019 - 529
Denmark 392 - 9 163 11 463 418 - 742 3 652 3 688 1 381 11 254 7 355 9 537 10 952
Estonia 1 839 1 024 974 1 569 553 983 1 375 156 - 1 488 1 030 375 236
Finland 718 7 359 2 550 4 158 - 5 165c 18 625c 5 681 10 167 5 011 7 543 - 7 519c 574c
France 30 733 13 889 31 642 16 979 42 892 15 191 100 865 48 156 51 415 31 639 24 997 42 869
Germany 23 805b 65 642b 67 515b 20 316b 18 193b 1 831b 68 541b 125 451b 77 930b 66 089b 30 109b 112 227b
Greece 2 436 330 1 144 1 740 2 818 2 172 2 055 1 557 1 772 678 - 785 856
Hungary 1 995 2 193 6 300 14 375 3 097 4 039 1 849 1 172 4 702 11 678 1 868 3 381
Ireland 25 715 42 804 23 545 45 207 37 033 7 698 26 616 22 348 - 1 165 15 286 23 975 31 795
Italy 20 077 9 178 34 324 93 25 004 11 451b 21 275 32 655 53 629 7 980 30 759 23 451b
Latvia 94 379 1 453 1 109 903 474 - 62 19 61 192 411 137
Lithuania - 14 800 1 448 700 469 217 198 - 6 55 392 192 - 36
Luxembourg 27 313c 38 588c 9 748c 79 645c 23 248c 7 087c 8 201c 23 243c 10 737c 68 428c 34 555c - 4 307c
Malta - 8 645 929 15 510 12 061 9 575 9 279 - 7 059 1 921 922 2 574 2 603 2 335
Netherlands 38 752 - 7 184 24 369 17 655 32 039 30 253 26 273 68 358 34 789 5 235 56 926 40 809
Poland 11 889 12 796 18 258 7 120 120c 13 883c 3 656 6 147 3 671 - 2 656 - 3 299c 5 204c
Portugal 1 611 2 424 7 428 8 242 2 234 8 807 - 367 - 9 782 16 495 - 9 157 - 90 6 664
Romania 4 665 3 041 2 363 3 199 3 602 3 234 - 96 6 - 28 - 114 - 281 - 77
Slovakia - 6 1 770 3 491 2 982 591 479 904 946 713 8 - 423 - 123
Slovenia - 476 105 1 087 339 - 144 1 564 214 - 18 198 - 259 - 223 - 9
Spain 10 407 39 873 28 379 25 696 41 733c 22 904c 13 070 37 844 41 164 - 3 982 25 829c 30 688c
Sweden 10 093 140 12 923 16 334 3 571 10 036 26 202 20 349 29 861 28 952 28 879 12 156
United Kingdom 90 591 58 954 41 803 59 375 47 675 72 241 20 562 46 633 107 801 28 939 - 14 972 - 59 628
Other developed Europe 45 791 46 199 44 833 35 956 - 7 551 31 199 47 835 106 582 66 932 59 676 31 686 35 797
Gibraltar 172d 165d 166d 168d 166d 167d - - - - - -
Iceland 86 246 1 108 1 025 397 436 2 292 - 2 357 23 - 3 206 460 - 247
Norway 16 641 17 044 15 250 18 774 14 441 8 682 19 165 23 239 18 763 19 561 20 987 19 247
Switzerland 28 891 28 744 28 309 15 989 - 22 555c 21 914c 26 378 85 701 48 145 43 321 10 238c 16 798c
North America 166 304 226 449 269 531 208 946 301 333 146 261 327 502 312 502 448 717 365 285 378 879 389 563
Canada 22 700 28 400 39 669 39 266 70 565 53 864 39 601 34 723 52 148 53 938 50 536 52 620
United States 143 604 198 049 229 862 169 680 230 768 92 397 287 901 277 779 396 569 311 347 328 343 336 943
Other developed economies 48 927 41 906 68 162 69 061 69 987 63 735 91 879 84 759 120 627 131 174 137 931 117 343
Australia 31 667 36 443 57 050 55 802 54 239 51 854 16 409 19 804 1 669 5 583 - 3 063 - 351
Bermuda - 70c 231c - 258c 48c 55c - 32c 21c - 33c - 337c 241c 50c 93c
Israel 4 607 5 458 9 095 8 055 11 804 6 432 1 751 8 010 9 166 3 258 4 671 3 975
Japan 11 938 - 1 252 - 1 758 1 732 2 304 2 090 74 699 56 263 107 599 122 549 135 749 113 629
New Zealand 785 1 026 4 034 3 424 1 585 3 391 - 1 001 716 2 530 - 456 525 - 4
Developing economiesa 463 637 579 891 639 135 639 022 670 790 681 387 234 522 340 876 357 570 357 249 380 784 468 148
Africa 54 379 44 072 47 705 56 435 53 969 53 912 6 225 9 264 6 500 12 386 15 951 13 073
North Africa 18 134 15 745 7 548 17 151 13 580 11 541 2 498 4 781 1 491 3 332 951 1 672
Algeria 2 746 2 300 2 580 3 052 2 661 1 488d 214 220 534 193 117 ..
Egypt 6 712 6 386 - 483 6 031 4 192 4 783 571 1 176 626 211 301 253
Libya 3 310 1 909 - 1 425 702 50d 1 165 2 722 131 2 509 180 940d
Morocco 1 952c 1 574c 2 568c 2 728c 3 298c 3 582c 470c 589c 179c 406c 332c 444c
South Sudan - - - - - 78d - 700d - - - - - -
Sudan 1 726 2 064 1 734 2 311 1 688 1 277 - - - - - -
Tunisia 1 688 1 513 1 148 1 603 1 117 1 060 77 74 21 13 22 39
Other Africa 36 246 28 327 40 157 39 284 40 388 42 371 3 727 4 483 5 009 9 053 14 999 11 401
West Africa 14 725 12 008 18 956 16 322 14 208 12 763 2 120 1 292 2 526 3 501 2 166 2 255
Benin 134 177 161 230 360 377 31 - 18 60 19 59 31
Burkina Faso 101 35 144 329 490 342 8 - 4 102 73 58 59
Cabo Verde 174 159 155 70 70 78 1 0 1 - 3 - 5 - 5
Côte d’Ivoire 377 339 302 330 407 462 - 9 25 15 14 - 6 9
Gambia 1 20 66 93 38 28 - - - - - -
Ghana 2 897 2 527 3 237 3 293d 3 226d 3 357d 7 - 25 1 9d 12d
/...

World Investment Report 2015: Reforming International Investment GovernanceA4
Annex table 1. FDI flows, by region and economy, 2009–2014 (continued)
FDI inflows FDI outflows
Region/economy 2009 2010 2011 2012 2013 2014 2009 2010 2011 2012 2013 2014
Guinea 141d 101d 956d 606d 135d 566d - - 1d 2d - 0d 1d
Guinea-Bissau 17 33 25 7 20 21 - 0 6 1 - 0 0 0
Liberia 218 450 785 985 1 061 302d 364 369 372 1 354d 698d ..
Mali 748 406 556 398 308 199 - 1 7 4 16 3 8
Mauritania - 3d 131d 589d 1 389d 1 126d 492d 4d 4d 4d 4d 4d 4d
Niger 791 940 1 066 841 719 769 59 - 60 9 2 101 21
Nigeria 8 650 6 099 8 915 7 127 5 608 4 694 1 542 923 824 1 543 1 238 1 614
Senegal 320 266 338 276 311 343 77 2 47 56 33 37
Sierra Leone 110d 238d 951d 225d 144d 440d - 0d - 0d - - 0d - 4d - 2d
Togo 49 86 711 122 184 292 37 37 1 060 420 - 21 464
Central Africa 5 639 8 315 7 664 9 528 9 035 12 056 48 595 419 191 120 278
Burundi 0 1 3 1 7 32 - - - - 0 0
Cameroon 740d 538d 652d 526d 326d 501d - 69d 503d 187d - 284d - 379d - 159d
Central African Republic 42 62 37 70 2 3 - - - - - -
Chad 375d 313d 282d 343d 538d 761d - - - - - -
Congo 1 274 928 2 180 2 152 2 914 5 502 - 5d 4d 53d - 31d - 0d 7d
Congo, Democratic Republic of the 864 2 939 1 687 3 312 2 098 2 063 35 7 91 421 401 344
Equatorial Guinea 1 636d 2 734d 1 975d 2 015d 1 914d 1 933d - - - - - -
Gabon 573d 499d 696d 832d 968d 973d 87d 81d 88d 85d 85d 86d
Rwanda 119 251 119 255 258 268 - - - - 14 -
Sao Tome and Principe 16 51 32 23 11 20 0 0 0 0 0 0
East Africa 3 903 4 520 4 779 5 473 6 127 6 794 118 174 163 251 101 99
Comoros 14 8 23 10 9 14d - - - - - -
Djibouti 75 37 79 110 286 153 - - - - - -
Eritrea 91d 91d 39d 41d 44d 47d - - - - - -
Ethiopia 221d 288d 627d 279d 953d 1 200d - - - - - -
Kenya 115 178 335 259 505d 989d 46 2 9 16 6d -
Madagascar 1 066 808 810 812 567 351 - - - - - -
Mauritius 248 430 433 589 259 418 37 129 158 180 135 91
Seychelles 171 211 207 260 170 229 5 6 8 9 8 8
Somalia 108d 112d 102d 107d 107d 106d - - - - - -
Uganda 842 544 894 1 205 1 096 1 147 29 37 - 12 46 - 47 0
United Republic of Tanzania 953 1 813 1 229 1 800 2 131 2 142d - - - - - -
Southern Africa 11 978 3 485 8 758 7 961 11 018 10 758 1 441 2 423 1 901 5 110 12 613 8 769
Angola 2 205c - 3 227c - 3 024c - 6 898c - 7 120c - 3 881d 7c 1 340c 2 093c 2 741c 6 044c 2 131d
Botswana 129 218 1 371 487 398 393 6 - 1 10 - 8 - 85 - 43
Lesotho 92 30 61 57 50 46 2 - 21 - 41 - 38 - 34 - 31
Malawi 49 97 129 129 120 130 - 1 42 50 50 - 46 - 50
Mozambique 898 1 018 3 559 5 629 6 175 4 902 3 2 3 3 - -
Namibia 506 793 816 1 133 801 414 - 3 4 5 - 11 - 13 - 34
South Africa 7 502c 3 636c 4 243c 4 559c 8 300c 5 712c 1 151c - 76c - 257c 2 988c 6 649c 6 938c
Swaziland 66 120 107 32 84 13 7 - 8 - 2 39 4 - 1
Zambia 426 634 1 110 2 433 1 810 2 484 270 1 095 - 2 - 702 66 - 213d
Zimbabwe 105 166 387 400 400 545 - 43 43 49 27 72
Asia 323 793 401 851 425 308 400 840 427 879 465 285 214 942 284 078 313 648 299 424 335 318 431 591
East and South-East Asia 209 974 306 975 327 413 320 563 347 537 381 047 180 620 250 008 268 534 266 214 292 427 382 581
East Asia 163 840 201 825 233 878 212 428 221 450 248 180 139 088 194 532 213 680 215 497 225 254 302 520
China 95 000 114 734 123 985 121 080 123 911 128 500 56 530 68 811 74 654 87 804 101 000 116 000
Hong Kong, China 55 535 70 541 96 581 70 180 74 294 103 254b 59 202 86 247 96 341 83 411 80 773 142 700b
Korea, Democratic People’s Republic of 2d 38d 56d 120d 227d 134d - - - - - -
Korea, Republic of 9 022c 9 497c 9 773c 9 496c 12 767c 9 899c 17 436c 28 280c 29 705c 30 632c 28 360 30 558c
Macao, China 852 2 831 726 3 894 4 513 3 046d - 11 - 441 120 469 795 462d
Mongolia 624 1 691 4 715 4 452 2 140 508 54 62 94 44 41 103
Taiwan Province of China 2 805c 2 492c - 1 957c 3 207c 3 598c 2 839c 5 877c 11 574c 12 766c 13 137c 14 285c 12 697c
South-East Asia 46 134 105 151 93 535 108 135 126 087 132 867 41 533 55 476 54 854 50 717 67 172 80 061
Brunei Darussalam 370 481 691 865 776 568 9 6 10 - 422d - 135d -
Cambodia 928 1 342 1 372 1 835 1 872 1 730 19 21 29 36 46 32
Indonesia 4 877 13 771 19 241 19 138 18 817 22 580 2 249 2 664 7 713 5 422 6 647 7 077
Lao People’s Democratic Republic 190 279 301 294 427 721d 1d - 1d 1d - 0d - 44d 2d
Malaysia 1 453 9 060 12 198 9 239 12 115 10 799 7 784 13 399 15 249 17 143 14 107 16 445
Myanmar 27 6 669 1 118 497 584 946 - - - - - -
Philippines 1 963 1 298 1 852 2 033 3 737c 6 201c 359 616 339 1 692 3 647c 6 990c
/...

ANNEX TABLES A5
Annex table 1. FDI flows, by region and economy, 2009–2014 (continued)
FDI inflows FDI outflows
Region/economy 2009 2010 2011 2012 2013 2014 2009 2010 2011 2012 2013 2014
Singapore 23 821c 55 076c 48 002c 56 659c 64 793c 67 523c 26 239c 33 377c 24 490c 15 147c 28 814c 40 660c
Thailand 4 854 9 147 1 195 9 168 14 016 12 566 4 172 4 467 6 106 10 487 12 122 7 692
Timor-Leste 50 29 47 39 50 34 - 26 - 33 13 13 13
Viet Nam 7 600 8 000 7 519 8 368 8 900 9 200 700 900 950 1 200 1 956 1 150
South Asia 42 403 35 024 44 539 32 415 35 624 41 192 16 349 16 298 12 888 10 181 2 135 10 684
Afghanistan 76 211 83 94 69 54d 81d 72d 70d 65d - -
Bangladesh 700 913 1 136 1 293 1 599 1 527 29 15 13 43 34 48
Bhutan 72c 31c 26c 51c 9c 6c - - - - - -
India 35 634 27 417 36 190 24 196 28 199 34 417 16 058 15 947 12 456 8 486 1 679 9 848
Iran, Islamic Republic of 2 983 3 649 4 277 4 662 3 050 2 105 90d 174d 227d 1 441d 146d 605d
Maldives 158d 216d 424d 228d 361d 363d - - - - - -
Nepal 39 87 95 92d 71d 30d - - - - - -
Pakistan 2 338 2 022 1 326 859 1 333 1 747 71 47 62 82 212 116
Sri Lanka 404 478 981 941 933 944 20 43 60 64 65 67
West Asia 71 415 59 852 53 356 47 862 44 718 43 046 17 973 17 771 32 225 23 028 40 756 38 326
Bahrain 257 156 781 891 989 957 - 1 791 334 894 922 1 052 - 80
Iraq 1 598 1 396 1 882 3 400 5 131 4 782 72 125 366 490 227 242
Jordan 2 413 1 651 1 474 1 497 1 747 1 760 72 28 31 5 16 83
Kuwait 1 114 1 305 3 259 2 873 1 434 486 8 582 5 890 10 773 6 741 16 648 13 108
Lebanon 4 379 3 748 3 390 3 170 2 880 3 070d 1 126 487 934 1 009 1 962 1 893d
Oman 1 485c 1 243c 874c 1 040c 1 626c 1 180d 109c 1 498c 1 233c 877c 1 384c 1 164d
Qatar 8 125 4 670 939 396 - 840 1 040 3 215 1 863 10 109 1 840 8 021 6 748
Saudi Arabia 36 458 29 233 16 308 12 182 8 865 8 012d 2 177 3 907 3 430 4 402 4 943 5 396d
State of Palestine 300 206 349 58 176 124 69 84 - 128 29 - 48 - 32
Syrian Arab Republic 2 570 1 469 804 - - - - - - - - -
Turkey 8 585 9 086 16 136 13 283 12 357 12 146 1 553 1 469 2 330 4 106 3 527 6 658
United Arab Emirates 4 003 5 500 7 679 9 602 10 488 10 066 2 723 2 015 2 178 2 536 2 952d 3 072d
Yemen 129 189 - 518 - 531 - 134 - 578d 66d 70d 77d 71d 73d 73d
Latin America and the Caribbeana 83 514 131 727 163 868 178 049 186 151 159 405 13 284 46 879 36 490 43 847 28 466 23 326
South America 57 740 96 345 127 426 143 881 125 987 120 708 3 501 31 370 22 420 19 164 13 861 16 652
Argentina 4 017 11 333 10 840 15 324 11 301 6 612 712 965 1 488 1 055 1 097 2 117
Bolivia, Plurinational State of 423 643 859 1 060 1 750 648 - 3 - 29 - - - -
Brazil 25 949 48 506 66 660 65 272 63 996 62 495 - 10 084 11 588 - 1 029 - 2 821 - 3 495 - 3 540
Chile 11 868 16 789 16 930 25 021 16 577 22 949 6 213 10 524 13 738 17 120 7 621 12 999
Colombia 8 035 6 430 14 648 15 039 16 199 16 054 3 505 5 483 8 420 - 606 7 652 3 899
Ecuador 308 166 644 585 731 774 47d 134d 63d - 6d 42d 33d
Guyana 164 198 247 294 214 255 - - - - - -
Paraguay 95 210 619 738 72 236 54d 7d - 34d 56d 49d 24d
Peru 6 431 8 455 7 665 11 918 9 298 7 607 411 266 147 78 137 84
Suriname - 93 - 248 70 121 138 4 - - 3 - 1 - -
Uruguay 1 529 2 289 2 504 2 536 3 032 2 755 16 - 60 - 7 - 3 5 13
Venezuela, Bolivarian Republic of - 983 1 574 5 740 5 973 2 680 320 2 630 2 492 - 370 4 294 752 1 024
Central America 22 302 32 404 31 998 28 004 55 399 33 416 9 612 15 426 12 897 22 922 13 922 5 929
Belize 109c 97c 95c 189c 92c 141c 0c 1c 1c 1c 1c 3c
Costa Rica 1 347 1 466 2 178 2 332 2 677 2 106 7 25 58 428 290 218
El Salvador 366 - 230 219 482 179 275 - - 5 0 - 2 3 1
Guatemala 600 806 1 026 1 245 1 295 1 396 26 24 17 39 34 31
Honduras 509 969 1 014 1 059 1 060 1 144 4 - 1 2 208 68 24
Mexico 17 679 26 083 23 376 18 951 44 627 22 795 9 604 15 050 12 636 22 470 13 138 5 201
Nicaragua 434 490 936 768 816 840 - 29 16 7 52 107 84
Panama 1 259 2 723 3 153 2 980 4 654 4 719 - 317 176 - 274 281 368
Caribbeana 3 471 2 979 4 445 6 164 4 764 5 281 171 83 1 174 1 761 683 744
Anguilla 44 11 39 44 42 39 0 0 0 0 - -
Antigua and Barbuda 85 101 68 138 101 167 4 5 3 4 6 6
Aruba - 11 190 488 - 319 225 244 1 6 3 3 4 9
Bahamas 873 1 148 1 533 1 073 1 111 1 596 216 150 524 132 277 398
Barbados 247 290 384 436 5 275 - 56 - 54 301 - 129 106 93
Curaçao 55 89 69 57 17 183d 5 15 - 30 12 - 17 27d
Dominica 58 58 51 57 39 41 1 1 0 0 2 2
Dominican Republic 2 165 2 024 2 277 3 142 1 991 2 208 110d 25d 39d 77d - 55d 20d
Grenada 104 64 45 34 114 40 1 3 3 3 1 1
Haiti 55 178 119 156 186 99 - - - - - -
/...

World Investment Report 2015: Reforming International Investment GovernanceA6
Annex table 1. FDI flows, by region and economy, 2009–2014 (concluded)
FDI inflows FDI outflows
Region/economy 2009 2010 2011 2012 2013 2014 2009 2010 2011 2012 2013 2014
Jamaica 541c 228c 218c 413c 593c 551c 61c 58c 75c 3c - 87c - 2c
Montserrat 3 4 2 3 4 6 0 0 0 0 0 0
Saint Kitts and Nevis 136 119 112 110 139 120 5 3 2 2 2 2
Saint Lucia 152 127 100 78 95 75 6 5 4 4 3 3
Saint Vincent and the Grenadines 111 97 86 115 160 139 1 0 0 0 0 0
Sint Maarten 40 33 - 48 14 34 67d 1 3 1 - 4 4 4d
Trinidad and Tobago 709 549 1 831 2 453 1 994 2 423d - - 1 060 1 681 824 726d
Oceania 1 952 2 240 2 254 3 697 2 791 2 784 71 655 932 1 593 1 050 158
Cook Islands - 6d - - - - - 13d 540d 814d 1 307d 887d ..
Fiji 164 350 403 376 272 279d 3 6 1 2 4 1d
French Polynesia 22 64 131 155 101 129d 8 38 27 43 66 46d
Kiribati 3 - 0d 0d 1d 9d 1d - 1 - 0 - - 0d - 0d - 0d
Marshall Islands - 11d 27d 34d 27d 23d 28d - 25d - 11d 29d 24d 19d 24d
Micronesia, Federated States of 1d 1d 1d 1d 1d 1d - - - - - -
Nauru 1d - - - - - - - - - - -
New Caledonia 1 182 1 439 1 715 2 887 2 261 2 288d 58 76 40 109 63 70d
Niue - - - - - - - 0d - - 1d - - -
Palau - 10 - 7 6 9 2 6d - - - - - -
Papua New Guinea 423 29 - 310 25 18 - 30 4 0 1 89 - -
Samoa 10 1 15 21 24 23 1 - 1 9 0 4
Solomon Islands 120 238 146 80 43 24 3 2 4 3 3 1
Tonga 20d 25d 44d 31d 51d 56d 5d 3d 16d 7d 7d 11d
Vanuatu 32c 59c 70c 78c - 19c - 22c 1c 1c 1c 1c 0c 1c
Transition economies 70 489 75 013 97 263 85 135 99 590 48 114 47 208 61 984 73 740 53 565 91 496 63 072
South-East Europe 6 270 4 600 7 890 3 562 4 740 4 698 140 317 403 410 380 430
Albania 996 1 051 876 855 1 266 1 093 39 6 30 23 40 30
Bosnia and Herzegovina 250 406 496 351 283 564 6 46 18 16 - 15 2
Montenegro 1 527 760 558 620 447 497 46 29 17 27 17 27
Serbia 2 896 1 686 4 932 1 299 2 053 1 996 24 185 318 331 329 356
The former Yugoslav Republic of Macedonia 201 213 479 143 335 348 11 5 - 0 - 8 - 15 - 21
CIS 63 560 69 599 88 324 80 662 93 901 42 137 47 087 61 532 73 190 52 858 90 997 62 440
Armenia 760 529 515 489 370 383c 50 8 78 16 19 18c
Azerbaijan 473 563 1 465 2 005 2 632 4 430 326 232 533 1 192 1 490 2 209
Belarus 1 877 1 393 4 002 1 429 2 230 1 798 102 51 126 121 246 - 1
Kazakhstan 13 243 11 551 13 973 13 337 10 221 9 562 3 159 7 885 5 390 1 481 2 287 3 624
Kyrgyzstan 189 438 694 293 626 211 - 0 0 0 - 0 - 0 0
Moldova, Republic of 208 208 288 195 236 207 7 4 21 20 29 41
Russian Federation 36 583c 43 168c 55 084c 50 588c 69 219c 20 958c 43 281c 52 616c 66 851c 48 822c 86 507c 56 438c
Tajikistan 16 - 15 70 233 105 263 - - - - - -
Turkmenistan 4 553d 3 632d 3 391d 3 130d 3 076d 3 164d - - - - - -
Ukraine 4 816 6 495 7 207 8 401 4 499 410 162 736 192 1 206 420 111
Uzbekistan 842d 1 636d 1 635d 563d 686d 751d - - - - - -
Georgia 659 814 1 048 911 949 1 279 - 19 135 147 297 120 202
MemorandumLeast developed countries (LDCs)e 16 865 23 774 21 852 23 524 22 327 23 239 1 123 3 055 4 003 4 698 7 454 2 975
Landlocked developing countries (LLDCs)f 26 108 26 011 36 101 34 426 29 980 29 151 4 119 9 378 6 314 2 393 3 917 5 822
Small island developing states (SIDS)g 4 599 4 606 6 160 6 776 5 703 6 948 275 332 2 158 2 032 1 319 1 377
Source: UNCTAD, FDI-MNE Information System, FDI database (www.unctad.org/fdistatistics).a Excluding the financial centres in the Caribbean (Anguilla, Antigua and Barbuda, Aruba, the Bahamas, Barbados, the British Virgin Islands, the Cayman Islands, Curaçao, Dominica, Grenada,
Montserrat, Saint Kitts and Nevis, Saint Lucia, Saint Vincent and the Grenadines, Sint Maarten and Turks and Caicos Islands).b Directional basis calculated from asset/liability basis.c Asset/liability basis.d Estimates. e Least developed countries include Afghanistan, Angola, Bangladesh, Benin, Bhutan, Burkina Faso, Burundi, Cambodia, the Central African Republic, Chad, the Comoros, the Democratic
Republic of the Congo, Djibouti, Equatorial Guinea, Eritrea, Ethiopia, the Gambia, Guinea, Guinea-Bissau, Haiti, Kiribati, the Lao People’s Democratic Republic, Lesotho, Liberia, Madagascar, Malawi, Mali, Mauritania, Mozambique, Myanmar, Nepal, the Niger, Rwanda, Sao Tome and Principe, Senegal, Sierra Leone, Solomon Islands, Somalia, South Sudan, the Sudan, Timor-Leste, Togo, Tuvalu, Uganda, the United Republic of Tanzania, Vanuatu, Yemen and Zambia.
f Landlocked developing countries include Afghanistan, Armenia, Azerbaijan, Bhutan, the Plurinational State of Bolivia, Botswana, Burkina Faso, Burundi, the Central African Republic, Chad, Ethiopia, Kazakhstan, Kyrgyzstan, the Lao People’s Democratic Republic, Lesotho, the former Yugoslav Republic of Macedonia, Malawi, Mali, the Republic of Moldova, Mongolia, Nepal, the Niger, Paraguay, Rwanda, South Sudan, Swaziland, Tajikistan, Turkmenistan, Uganda, Uzbekistan, Zambia and Zimbabwe.
g Small island developing States include Antigua and Barbuda, the Bahamas, Barbados, Cabo Verde, the Comoros, Dominica, Fiji, Grenada, Jamaica, Kiribati, Maldives, the Marshall Islands, Mauritius, Federated States of Micronesia, Nauru, Palau, Papua New Guinea, Saint Kitts and Nevis, Saint Lucia, Saint Vincent and the Grenadines, Samoa, Sao Tome and Principe, Seychelles, Solomon Islands, Timor-Leste, Tonga, Trinidad and Tobago, Tuvalu and Vanuatu.
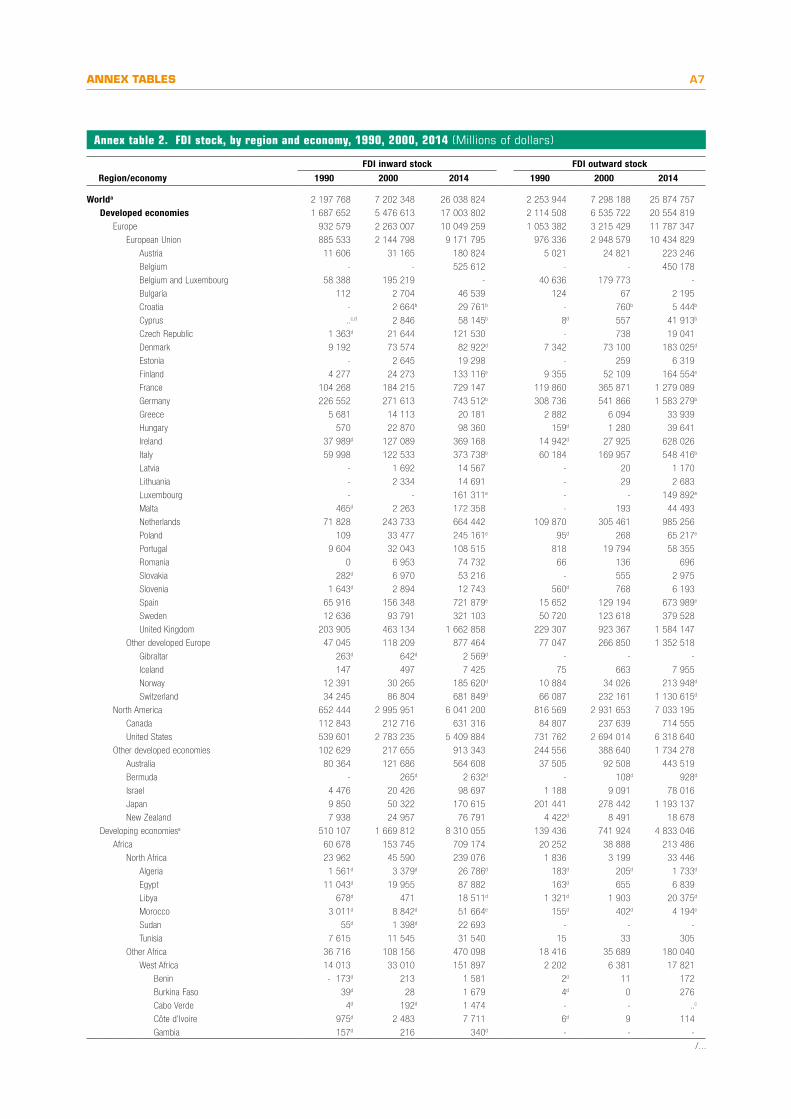
ANNEX TABLES A7
Annex table 2. FDI stock, by region and economy, 1990, 2000, 2014 (Millions of dollars)
FDI inward stock FDI outward stock
Region/economy 1990 2000 2014 1990 2000 2014
Worlda 2 197 768 7 202 348 26 038 824 2 253 944 7 298 188 25 874 757
Developed economies 1 687 652 5 476 613 17 003 802 2 114 508 6 535 722 20 554 819
Europe 932 579 2 263 007 10 049 259 1 053 382 3 215 429 11 787 347
European Union 885 533 2 144 798 9 171 795 976 336 2 948 579 10 434 829
Austria 11 606 31 165 180 824 5 021 24 821 223 246
Belgium - - 525 612 - - 450 178
Belgium and Luxembourg 58 388 195 219 - 40 636 179 773 -
Bulgaria 112 2 704 46 539 124 67 2 195
Croatia - 2 664b 29 761b - 760b 5 444b
Cyprus ..c,d 2 846 58 145b 8d 557 41 913b
Czech Republic 1 363d 21 644 121 530 - 738 19 041
Denmark 9 192 73 574 82 922d 7 342 73 100 183 025d
Estonia - 2 645 19 298 - 259 6 319
Finland 4 277 24 273 133 116e 9 355 52 109 164 554e
France 104 268 184 215 729 147 119 860 365 871 1 279 089
Germany 226 552 271 613 743 512b 308 736 541 866 1 583 279b
Greece 5 681 14 113 20 181 2 882 6 094 33 939
Hungary 570 22 870 98 360 159d 1 280 39 641
Ireland 37 989d 127 089 369 168 14 942d 27 925 628 026
Italy 59 998 122 533 373 738b 60 184 169 957 548 416b
Latvia - 1 692 14 567 - 20 1 170
Lithuania - 2 334 14 691 - 29 2 683
Luxembourg - - 161 311e - - 149 892e
Malta 465d 2 263 172 358 - 193 44 493
Netherlands 71 828 243 733 664 442 109 870 305 461 985 256
Poland 109 33 477 245 161e 95d 268 65 217e
Portugal 9 604 32 043 108 515 818 19 794 58 355
Romania 0 6 953 74 732 66 136 696
Slovakia 282d 6 970 53 216 - 555 2 975
Slovenia 1 643d 2 894 12 743 560d 768 6 193
Spain 65 916 156 348 721 879e 15 652 129 194 673 989e
Sweden 12 636 93 791 321 103 50 720 123 618 379 528
United Kingdom 203 905 463 134 1 662 858 229 307 923 367 1 584 147
Other developed Europe 47 045 118 209 877 464 77 047 266 850 1 352 518
Gibraltar 263d 642d 2 569d - - -
Iceland 147 497 7 425 75 663 7 955
Norway 12 391 30 265 185 620d 10 884 34 026 213 948d
Switzerland 34 245 86 804 681 849d 66 087 232 161 1 130 615d
North America 652 444 2 995 951 6 041 200 816 569 2 931 653 7 033 195
Canada 112 843 212 716 631 316 84 807 237 639 714 555
United States 539 601 2 783 235 5 409 884 731 762 2 694 014 6 318 640
Other developed economies 102 629 217 655 913 343 244 556 388 640 1 734 278
Australia 80 364 121 686 564 608 37 505 92 508 443 519
Bermuda - 265d 2 632d - 108d 928d
Israel 4 476 20 426 98 697 1 188 9 091 78 016
Japan 9 850 50 322 170 615 201 441 278 442 1 193 137
New Zealand 7 938 24 957 76 791 4 422d 8 491 18 678
Developing economiesa 510 107 1 669 812 8 310 055 139 436 741 924 4 833 046
Africa 60 678 153 745 709 174 20 252 38 888 213 486
North Africa 23 962 45 590 239 076 1 836 3 199 33 446
Algeria 1 561d 3 379d 26 786d 183d 205d 1 733d
Egypt 11 043d 19 955 87 882 163d 655 6 839
Libya 678d 471 18 511d 1 321d 1 903 20 375d
Morocco 3 011d 8 842d 51 664e 155d 402d 4 194e
Sudan 55d 1 398d 22 693 - - -
Tunisia 7 615 11 545 31 540 15 33 305
Other Africa 36 716 108 156 470 098 18 416 35 689 180 040
West Africa 14 013 33 010 151 897 2 202 6 381 17 821
Benin - 173d 213 1 581 2d 11 172
Burkina Faso 39d 28 1 679 4d 0 276
Cabo Verde 4d 192d 1 474 - - ..c
Côte d’Ivoire 975d 2 483 7 711 6d 9 114
Gambia 157d 216 340d - - -
/...

World Investment Report 2015: Reforming International Investment GovernanceA8
Annex table 2. FDI stock, by region and economy, 1990, 2000, 2014 (continued)
FDI inward stock FDI outward stock
Region/economy 1990 2000 2014 1990 2000 2014
Ghana 319d 1 554d 23 205d - - 130d
Guinea 69d 263d 2 584d - 12d 68d
Guinea-Bissau 8d 38 123 - - 5
Liberia 2 732d 3 247d 6 569d 846d 2 188d 4 345d
Mali 229d 132 3 109 22d 1 45
Mauritania 59d 146d 5 968d 3d 4d 48d
Niger 286d 45 5 133 54d 1 130
Nigeria 8 539d 23 786 86 671 1 219d 4 144 10 259
Senegal 258d 295 2 699 47d 22 397
Sierra Leone 243d 284d 1 365d - - -
Togo 268d 87 1 685 - ..c 1 843
Central Africa 3 808 5 736 67 425 390 721 2 776
Burundi 30d 47d 48d 0d 2d 1d
Cameroon 1 044d 1 600d 6 493d 150d 254d 43d
Central African Republic 95d 104 623 18d 43 43
Chad 250d 576d 5 518d 37d 70d 70d
Congo 575d 1 893d 22 010d 18d 40d 94d
Congo, Democratic Republic of the 546d 617 7 694d - 34 1 480d
Equatorial Guinea 25d 1 060d 17 250d 0d ..c,d 3d
Gabon 1 208d ..c,d 6 339d 167d 280d 1 006
Rwanda 33d 55 1 105d - - 13d
Sao Tome and Principe 0d 11d 345d - - 22d
East Africa 1 701 7 202 55 447 165 387 2 139
Comoros 17d 21d 121d - - -
Djibouti 13d 40 1 505d - - -
Eritrea 0d 337d 837d - - -
Ethiopia 124d 941d 7 264d - - -
Kenya 668d 932d 4 370d 99d 115d 321d
Madagascar 107d 141 6 277 1d 10d 6d
Mauritius 168d 683d 4 586d 1d 132d 1 482d
Seychelles 213 515 2 567 64 130 280
Somalia ..c,d 4d 988d - - -
Uganda 6d 807 9 917 - - 50
United Republic of Tanzania 388d 2 781 17 013d - - -
Southern Africa 17 194 62 208 195 328 15 658 28 200 157 304
Angola 1 025d 7 977d ..c,d 1d ..c,d 19 218d
Botswana 1 309 1 827 4 367 447 517 795
Lesotho 83d 330 586 0d 2 253
Malawi 228d 358 1 239d - ..c 24
Mozambique 25 1 249 25 577 2d 1 10
Namibia 2 047 1 276 3 722 80 45 60
South Africa 9 210 43 451e 145 384e 15 010 27 328e 133 936e
Swaziland 336 536 759d 38 87 103d
Zambia 2 655d 3 966d 15 009 - - 2 417d
Zimbabwe 277d 1 238 3 546 80d 234 487
Asia 340 242 1 052 754 5 679 670 67 066 597 220 3 948 830
East and South-East Asia 302 285 953 635 4 618 719 58 504 579 768 3 555 214
East Asia 240 645 696 032 2 931 267 49 032 495 206 2 709 546
China 20 691d 193 348 1 085 293d 4 455d 27 768d 729 585d
Hong Kong, China 201 653d 435 417 1 549 849b 11 920d 379 285 1 459 947b
Korea, Democratic People’s Republic of 572d 1 044d 2 012d - - -
Korea, Republic of 5 186 43 738e 182 037e 2 301d 21 497e 258 553e
Macao, China 2 809d 2 801d 26 747d - - 2 277d
Mongolia 0d 182 16 693 - - 355
Taiwan Province of China 9 735d 19 502e 68 636d 30 356d 66 655e 258 829d
South-East Asia 61 640 257 603 1 687 452 9 471 84 563 845 669
Brunei Darussalam 33d 3 868d 6 219 0d 512d 134d
Cambodia 38d 1 580 13 035 0d 193 484
Indonesia 8 732d 25 060d 253 082 86d 6 940d 24 052
Lao People’s Democratic Republic 13d 588d 3 630d 1d 20d ..c,d
Malaysia 10 318 52 747d 133 767 753d 15 878d 135 685
Myanmar 285d 3 752d 17 652d - - -
Philippines 3 268d 13 762d 57 093e 405d 1 032d 35 603e
/...

ANNEX TABLES A9
Annex table 2. FDI stock, by region and economy, 1990, 2000, 2014 (Millions of dollars)
FDI inward stock FDI outward stock
Region/economy 1990 2000 2014 1990 2000 2014
Singapore 30 468 110 570 912 355e 7 808 56 755 576 396e
Thailand 8 242 30 944 199 311 418 3 232 65 769
Timor-Leste - - 316 - - 86
Viet Nam 243d 14 730d 90 991d - - 7 490d
South Asia 6 795 29 834 350 971 478 2 791 136 106
Afghanistan 12d 17d 1 692d - - -
Bangladesh 477d 2 162 9 355 45d 69 130
Bhutan 2d 4d 112e - - -
India 1 657d 16 339 252 331 124d 1 733 129 578
Iran, Islamic Republic of 2 039d 2 597d 43 047 56d 414d 4 096d
Maldives 25d 128d 2 490d - - -
Nepal 12d 72d 541d - - -
Pakistan 1 892d 6 919 30 892 245d 489 1 695
Sri Lanka 679d 1 596 10 511 8d 86 607
West Asia 31 161 69 286 709 981 8 084 14 661 257 510
Bahrain 552 5 906 18 771 719 1 752 10 672
Iraq ..c,d ..c,d 23 161d - - 1 956d
Jordan 1 368d 3 135 28 734 158d 44 608
Kuwait 37d 608 15 362 3 662d 1 428 36 531
Lebanon 53d 14 233 56 834d 43d 352 12 629d
Oman 1 723d 2 577e 19 707d - - 7 453d
Qatar 63d 1 912 31 004d - 74 35 182d
Saudi Arabia 15 193d 17 577 215 909 2 328d 5 285d 44 699
State of Palestine - 1 418d 2 453 - - 167
Syrian Arab Republic 154d 1 244d 10 743d 4d 107d 421d
Turkey 11 150d 18 812 168 645 1 150d 3 668 40 088
United Arab Emirates 751d 1 069d 115 561d 14d 1 938d 66 298d
Yemen 180d 843d 3 097d 5d 12d 806d
Latin America and the Caribbeana 107 187 460 991 1 893 554 52 050 105 533 663 970
South America 74 815 308 952 1 384 301 49 201 95 861 518 205
Argentina 9 085d 67 601 114 076 6 057d 21 141 35 938
Bolivia, Plurinational State of 1 026 5 188 11 206 7d 29 52
Brazil 37 143 122 250 754 769 41 044 51 946 316 339
Chile 16 107d 45 753 207 678 154d 11 154 89 733
Colombia 3 500 11 157 141 667 402 2 989 43 082
Ecuador 1 626 6 337 14 591 18d 252d 697d
Falkland Islands (Malvinas) 0d 58d 75d - - -
Guyana 45d 756 1 960 - 1 2
Paraguay 418d 1 221 5 381 ..c,d 29d 379d
Peru 1 330 11 062 79 429 122 505 4 205d
Suriname - - 1 012 - - -
Uruguay 671d 2 088 22 318d 186d 138 428d
Venezuela, Bolivarian Republic of 3 865 35 480 30 139 1 221 7 676 27 349
Central America 28 496 139 675 439 838 2 793 8 600 138 868
Belize 89d 301e 1 765e 20d 43e 54e
Costa Rica 1 324d 2 709 24 309 44d 86 2 049
El Salvador 212d 1 973 8 504 56d 104 3
Guatemala 1 734 3 420 12 102 0 93 503
Honduras 293 1 392 11 228 - - 393
Mexico 22 424 121 691 337 974 2 672d 8 273 131 246
Nicaragua 145d 1 414 8 040 - - 375
Panama 2 275d 6 775d 35 917 - - 4 246
Caribbeana 3 876 12 365 69 415 56 1 072 6 897
Anguilla 11d 231d 1 131d - 5d 31d
Antigua and Barbuda 290d 619d 2 845d - 5d 112d
Aruba 145d 1 161 3 941 - 675 698
Bahamas 586d 3 278d 18 751d - 452d 3 868d
Barbados 171 308 5 248 23 41 3 840
Curaçao - - 890d - - 86d
Dominica 66d 275d 846d - 3d 38d
Dominican Republic 572 1 673 28 757d 68d 171d
Grenada 70d 348d 1 506d - 2d 51d
Haiti 149d 95 1 209d - 2d 2d
/...

World Investment Report 2015: Reforming International Investment GovernanceA10
Annex table 2. FDI stock, by region and economy, 1990, 2000, 2014 (Millions of dollars)
FDI inward stock FDI outward stock
Region/economy 1990 2000 2014 1990 2000 2014
Jamaica 790d 3 317 13 324 42d 709 314
Montserrat 40d 83d 140d - 0d 1d
Netherlands Antillesf 408d 277 - 21d 6 -d
Saint Kitts and Nevis 160d 487d 2 078d - 3d 59d
Saint Lucia 316d 807d 2 510d - 4d 67d
Saint Vincent and the Grenadines 48d 499d 1 814d - 0d 6d
Sint Maarten - - 321d - - 13d
Trinidad and Tobago 2 365d 7 280d 26 125d 21d 293d 6 411d
Oceania 2 001 2 321 27 657 68 283 6 759Cook Islands 1d 218d 836d - ..c,d 5 037d
Fiji 284 356 3 713d 25d 39 51d
French Polynesia 69d 139d 908d - - 327d
Kiribati - - 15d - - 1d
Marshall Islands 1d 218d 1 057d - ..c,d 205d
Nauru ..c,d ..c,d ..c,d 18d 22d 22d
New Caledonia 70d 67d 15 051d - 2d 582d
Niue - 6d ..c,d - 10d 22d
Palau 2d 126 177d - - -Papua New Guinea 1 582d 935 3 877d 26d 210d 315d
Samoa 9d 51d 235d - - 25d
Solomon Islands - 106d 781 - - 48Tonga 1d 19d 403d 0d 14d 100d
Vanuatu - 61d 503e - - 23e
Transition economies .. 55 924 724 967 .. 20 541 486 892South-East Europe .. 787 55 114 .. 16 3 995
Albania - 247 4 466d - - 239d
Bosnia and Herzegovina - - 7 383d - - 208d
Montenegro - - 4 983d - - 422d
Serbia - - 29 564 - - 2 819The former Yugoslav Republic of Macedonia - 540 5 140 - 16 112
CIS .. 54 375 657 612 .. 20 408 481 382Armenia 9d 513 5 831d - 0 206d
Azerbaijan - 3 735 18 180d - 1 11 214d
Belarus - 1 306 17 730 - 24 588Kazakhstan - 10 078 129 244 - 16 27 200Kyrgyzstan - 432 3 520 - 33 427Moldova, Republic of - 449 3 647 - 23 178Russian Federation - 32 204 378 543e - 20 141 431 865e
Tajikistan - 136 1 887d - - -Turkmenistan - 949d 26 203d - - -Ukraine - 3 875 63 825 - 170 9 705Uzbekistan - 698d 9 002d - - -
Georgia .. 762 12 241 .. 118 1 514
MemorandumLeast developed countries (LDCs)g 11 046 37 095 221 524 1 089 2 673 32 490
Landlocked developing countries (LLDCs)h 7 471 35 793 301 812 699 1 120 44 799
Small island developing states (SIDS)i 7 136 20 611 97 692 220 2 048 17 416
Source: UNCTAD, FDI/MNE database (www.unctad.org/fdistatistics).a Excluding the financial centers in the Caribbean (Anguilla, Antigua and Barbuda, Aruba, the Bahamas, Barbados, the British Virgin Islands, the Cayman Islands, Curaçao,
Dominica, Grenada, Montserrat, Saint Kitts and Nevis, Saint Lucia, Saint Vincent and the Grenadines, Sint Maarten and Turks and Caicos Islands).b Directional basis calculated from asset/liability basis.c Negative stock value. However, this value is included in the regional and global total. d Estimates. e Asset/liability basis.f This economy dissolved on 10 October 2010.g Least developed countries include Afghanistan, Angola, Bangladesh, Benin, Bhutan, Burkina Faso, Burundi, Cambodia, the Central African Republic, Chad, the Comoros, the
Democratic Republic of the Congo, Djibouti, Equatorial Guinea, Eritrea, Ethiopia, the Gambia, Guinea, Guinea-Bissau, Haiti, Kiribati, the Lao People’s Democratic Republic, Lesotho, Liberia, Madagascar, Malawi, Mali, Mauritania, Mozambique, Myanmar, Nepal, the Niger, Rwanda, Sao Tome and Principe, Senegal, Sierra Leone, Solomon Islands, Somalia, South Sudan, the Sudan, Timor-Leste, Togo, Tuvalu, Uganda, the United Republic of Tanzania, Vanuatu, Yemen and Zambia.
h Landlocked developing countries include Afghanistan, Armenia, Azerbaijan, Bhutan, the Plurinational State of Bolivia, Botswana, Burkina Faso, Burundi, the Central African Republic, Chad, Ethiopia, Kazakhstan, Kyrgyzstan, the Lao People’s Democratic Republic, Lesotho, the former Yugoslav Republic of Macedonia, Malawi, Mali, the Republic of Moldova, Mongolia, Nepal, the Niger, Paraguay, Rwanda, South Sudan, Swaziland, Tajikistan, Turkmenistan, Uganda, Uzbekistan, Zambia and Zimbabwe.
i Small island developing States include Antigua and Barbuda, the Bahamas, Barbados, Cabo Verde, the Comoros, Dominica, Fiji, Grenada, Jamaica, Kiribati, Maldives, the Marshall Islands, Mauritius, Federated States of Micronesia, Nauru, Palau, Papua New Guinea, Saint Kitts and Nevis, Saint Lucia, Saint Vincent and the Grenadines, Samoa, Sao Tome and Principe, Seychelles, Solomon Islands, Timor-Leste, Tonga, Trinidad and Tobago, Tuvalu and Vanuatu.

ANNEX TABLES A11
Annex table 3. Value of cross-border M&As, by region/economy of seller/purchaser, 2008–2014 (Millions of dollars)
Net salesa Net purchasesb
Region/economy 2008 2009 2010 2011 2012 2013 2014 2008 2009 2010 2011 2012 2013 2014
Worldc 617 649 287 617 347 094 553 442 328 224 312 509 398 899 617 649 287 617 347 094 553 442 328 224 312 509 398 899Developed economies 474 067 236 784 259 926 436 926 266 773 237 516 274 549 479 590 191 214 224 759 431 899 183 858 178 870 228 389
Europe 172 448 140 217 127 458 213 654 144 243 132 898 197 016 381 684 132 250 44 262 173 190 41 842 34 387 33 137European Union 258 391 120 323 118 187 184 582 128 270 120 748 160 642 321 872 120 347 23 108 142 022 18 998 26 403 15 675
Austria 1 327 2 067 354 7 002 1 687 148 3 087 3 243 3 309 1 525 3 733 1 835 8 813 375Belgium 3 995 12 375 9 449 3 946 1 786 6 553 2 402 30 775 - 9 804 477 7 841 - 1 354 13 251 4 460Bulgaria 227 191 24 - 96 31 - 52 272 39 2 17 - - - 0 11Croatia 274 - 201 92 81 100 15 12 8 325 - - 5 234Cyprus 812 47 693 782 51 1 417 1 230 8 875 647 - 562 5 766 8 060 652 3 771Czech Republic 276 2 473 - 530 725 37 1 617 68 72 1 573 14 25 474 4 012 1Denmark 5 962 1 270 1 319 7 958 4 759 1 341 3 990 2 841 3 337 - 3 570 - 133 553 214 2 768Estonia 110 28 3 239 58 - 39 23 7 - 0 4 - 1 1 - 36 50Finland 1 163 382 336 1 028 1 929 - 35 8 116 12 951 641 1 015 2 353 4 116 1 754 - 1 779France 6 609 609 3 573 23 161 12 013 8 953 27 704 66 800 42 175 6 180 37 090 - 3 051 2 177 16 586Germany 32 216 12 742 10 515 13 440 7 793 16 736 15 034 63 785 26 928 7 025 5 644 15 674 6 833 29 490Greece 7 387 2 074 283 1 204 35 2 488 1 450 3 484 387 553 - 148 - 1 561 - 1 015 268Hungary 1 728 1 853 223 1 714 96 - 1 108 - 285 41 0 799 17 - 7 - - 31Ireland 3 025 1 712 2 127 1 934 12 096 11 147 3 567 3 505 - 664 5 124 - 5 648 2 629 - 4 091 10 496Italy - 5 150 2 335 6 329 15 095 5 286 5 748 15 315 20 976 17 195 - 5 190 3 902 - 1 633 2 440 - 9 770Latvia 195 109 54 1 1 4 49 - - 30 40 - 3 - - -Lithuania 172 23 470 386 39 30 79 31 - - 0 4 - 3 10 1Luxembourg - 3 510 444 2 138 9 495 6 461 177 3 209 5 906 24 1 558 1 110 - 716 3 794 23 172Malta - 13 315 - 96 7 222 - 25 - 235 - 16 25 22 15Netherlands - 9 731 18 114 4 162 14 041 17 637 22 896 13 086 48 466 - 3 506 16 418 - 4 402 - 1 092 - 3 243 - 1 279Poland 1 507 666 1 195 9 963 824 434 907 1 090 229 201 511 3 399 243 1 140Portugal - 1 312 504 2 772 911 8 225 7 465 2 464 1 330 723 - 8 965 1 642 - 4 735 - 603 - 602Romania 996 331 148 88 151 - 45 214 4 7 24 - - - -Slovakia 136 21 - 0 126 541 13 - - 10 - 18 - 30 - - 14Slovenia 418 - 332 51 330 30 495 320 251 - 50 - 10 - - -Spain 37 041 31 849 10 348 17 716 4 978 5 185 23 424 - 12 160 - 507 2 898 15 505 - 1 621 - 7 348 5 555Sweden 17 930 2 158 527 7 647 5 086 - 76 1 027 6 883 9 819 855 - 2 381 151 - 4 994 9 885United Kingdom 154 587 25 933 60 826 46 060 36 576 29 088 33 462 52 619 27 605 - 3 851 69 638 - 2 118 3 514 - 79 128
Other developed Europe - 85 943 19 894 9 271 29 072 15 974 12 150 36 375 59 812 11 904 21 154 31 168 22 845 7 984 17 463Andorra - - - - 12 - - - - - 166 - - 237Faeroe Islands 0 - 85 - - - - - - - - 13 35 -Gibraltar 212 - - - 19 50 - - 13 253 8 1 757 - 527 - 48 0Guernsey 36 1 970 168 9 1 257 17 91 890 4 171 10 338 - 1 183 1 968 - 768 - 164Iceland - - 14 - 11 - 48 744 - 806 - 221 - 437 - 2 559 126 -Isle of Man 35 45 157 - 217 44 1 4 982 247 137 852 - 736 - 162 - 850 917Jersey 251 414 81 88 133 - 2 688 - 686 401 1 054 5 192 3 564 2 015 3 140Liechtenstein - - - - - - - - 12 - - - - 158Monaco - - - 30 - - - - 1 100 16 - 2 0Norway 15 025 1 858 7 445 9 517 5 862 7 874 8 498 7 556 133 - 3 905 5 661 4 191 87 5 012Switzerland - 101 502 15 606 1 321 19 647 8 635 4 208 20 068 51 074 7 601 12 928 20 732 16 357 7 384 8 161
North America 257 007 78 194 97 616 179 459 94 203 80 895 44 134 13 118 41 881 120 717 173 653 110 097 88 852 133 551Canada 35 143 12 364 13 272 33 315 29 450 23 338 33 296 43 986 17 773 35 614 35 922 37 569 30 180 46 739United States 221 864 65 830 84 344 146 144 64 752 57 556 10 838 - 30 868 24 108 85 104 137 731 72 528 58 672 86 812
Other developed economies 44 612 18 373 34 853 43 812 28 327 23 724 33 399 84 788 17 082 59 779 85 056 31 920 55 632 61 700Australia 33 694 22 530 27 172 34 561 23 941 11 914 21 183 18 070 - 3 471 15 629 6 453 - 7 017 - 5 252 5 436Bermuda 1 006 883 - 405 121 905 3 273 1 520 2 064 2 981 2 017 2 557 3 238 4 412 10 389Israel 1 443 1 351 1 207 3 663 1 026 3 339 2 316 11 054 183 5 929 8 720 - 2 210 676 1 464Japan 7 994 - 6 336 7 114 4 671 1 791 4 271 6 997 49 539 17 632 31 271 62 263 37 795 54 898 44 985New Zealand 476 - 55 - 235 797 664 928 1 383 4 061 - 243 4 933 5 063 113 899 - 574
Developing economiesc 117 713 43 899 83 072 83 551 54 626 78 812 120 130 114 408 80 445 100 378 101 277 124 198 120 043 152 106Africa 24 540 5 903 7 493 8 634 - 1 254 3 829 5 058 8 266 2 554 3 792 4 393 629 3 019 5 446
North Africa 19 495 2 520 1 066 1 353 - 388 2 969 - 90 4 729 1 004 1 471 17 85 459 228Algeria 82 - - - - 10 - 180 - - - - - 312 38Egypt 18 903 1 680 120 609 - 705 1 836 61 4 678 76 1 092 - - 16 - 190Libya 307 145 91 20 - - - 51 601 377 - - - -Morocco 80 691 846 274 296 1 092 11 - 324 - 17 101 147 -Sudan - - - 450 - - - 13 - - - - - - -Tunisia 122 4 9 - 21 31 30 - 3 2 - - - -
Other Africa 5 045 3 383 6 426 7 281 - 865 860 5 148 3 537 1 550 2 322 4 376 543 2 560 5 219Angola - 475 - 471 1 300 - - - - - - - - 69 - 25Botswana - 50 - 6 7 - 65 3 - - - 14 10 3 -Burkina Faso 20 - - - 1 - 12 - - - - - - -Cameroon 1 1 - 0 - - - - - - - - - -Congo 435 - - - 7 - 0 - - - - - - -Congo, Democratic Republic of - 5 175 - - - 51 - - - - - 19 - -Côte d’Ivoire - 10 - - 0 - - - - - - - - -Equatorial Guinea - 2 200 - - - - - - - - - - - - -Eritrea - - 12 - 254 - 54 - - - - - - - - -Ethiopia - - - 146 366 - 15 - - - - - - -Gabon - - - - - - - - - - - - - -Ghana 900 0 - - 3 - 15 - - - 1 - - - -Kenya - - - 19 86 103 1 18 - - - 3 - - 1Liberia - - 587 - - - 400 - - - - - - -Madagascar - - - - - 12 - - - - - - - -Malawi - 0 0 - - 20 64 - - - - - - -Mali - - - - - - - - - - - - 2 -
/…

World Investment Report 2015: Reforming International Investment GovernanceA12
Annex table 3. Value of cross-border M&As, by region/economy of seller/purchaser, 2008–2014 (continued)
Net salesa Net purchasesb
Region/economy 2008 2009 2010 2011 2012 2013 2014 2008 2009 2010 2011 2012 2013 2014
Mauritania - - - - - - - - - - - - - -Mauritius 26 37 176 6 13 - 75 136 16 433 - 173 - 418 65 1 219Mozambique - - 35 27 3 2 2 758 - - - - - - -Namibia 15 59 104 40 15 6 - - - - - - - -Niger - - - - - - 1 - - - - - - 185 - -Nigeria - 597 - 197 476 539 - 159 537 997 418 25 - 1 40 241 2 104Rwanda 6 9 - - 69 2 1 - - - - - - -Senegal - - - 457 - - - - - - - - - - -Seychelles 49 - 19 - - - - 66 13 5 - 78 189 1 -Sierra Leone 40 - 13 52 - - - - - - - - - -South Africa 6 815 3 860 3 653 6 673 - 968 195 379 2 873 1 497 1 619 4 291 825 2 246 1 867Swaziland - - - - - - - 101 - - 6 - - - -Togo - - - - - - 529 20 - - 353 - 5 - 2Uganda 1 - - - - 15 - 86 - - 257 - - - -United Republic of Tanzania - 2 60 0 36 - 18 - - - - - - -Zambia 1 11 272 - 8 - - - - 2 - - - -Zimbabwe 7 6 - 27 - 296 5 22 1 - 1 - - - - 1
Asia 84 683 38 903 37 723 55 967 33 360 40 183 89 337 102 475 69 556 79 865 80 499 92 819 100 707 137 059East and South-East Asia 54 553 29 197 27 128 31 714 22 320 33 344 80 653 59 601 41 135 67 218 67 641 78 440 91 009 125 250
East Asia 29 933 16 437 17 855 14 072 11 944 26 914 73 135 40 687 36 520 52 810 51 100 61 861 70 276 103 857China 17 475 11 017 6 758 11 501 9 524 26 404 52 415 35 878 23 402 29 828 36 364 37 908 50 148 39 580Hong Kong, China 8 651 3 530 12 684 2 125 2 912 433 17 070 493 6 217 13 318 9 916 16 009 16 459 58 959Korea, Republic of 1 107 1 962 - 2 063 2 537 - 1 528 - 616 3 843 5 052 6 601 9 952 4 574 5 714 3 765 3 928Macao, China 593 - 57 33 34 30 213 0 0 - 580 52 - 10 - 3Mongolia - 344 57 88 82 - 77 - 80 106 - 24 - - - - -Taiwan Province of China 2 106 - 360 385 - 2 212 925 558 - 112 - 843 904 - 339 247 2 221 - 96 1 387
South-East Asia 24 620 12 759 9 273 17 642 10 376 6 429 7 517 18 914 4 615 14 407 16 541 16 579 20 733 21 393Brunei Darussalam - 3 - - - 0 0 - 10 - - - - - 1Cambodia 30 - 336 5 50 - 100 12 31 - - - - - - -Indonesia 2 744 747 1 384 6 828 477 844 814 757 - 2 402 186 165 315 2 923 1 176Lao People’s Democratic Republic - - 110 6 - - - - - - - - - -
Malaysia 2 905 354 2 837 4 429 721 - 749 472 9 111 3 292 2 372 3 380 9 105 2 144 1 056Myanmar - - 0 - - - - - - - - - - - -Philippines 3 988 1 476 329 2 586 411 890 922 - 150 57 19 479 682 71 3 211Singapore 13 883 9 871 3 859 1 615 8 023 4 147 4 736 7 832 2 793 8 963 7 948 795 5 986 16 674Thailand 150 351 461 954 - 65 40 448 1 339 865 2 810 4 569 5 659 9 602 - 721Viet Nam 921 293 289 1 175 908 1 245 94 25 - 57 - 21 7 - 0
South Asia 12 532 5 931 5 634 13 090 2 821 4 784 5 955 13 376 456 26 626 6 288 2 989 1 621 1 105Bangladesh - 10 13 - - 13 - - - 1 - - - - 4Iran, Islamic Republic of 765 - - - 16 - - - - - - - - -India 10 303 5 877 5 613 12 795 2 805 4 763 5 892 13 370 456 26 642 6 282 2 988 1 619 1 084Maldives 3 - - - - - 0 - - - 3 - - - -Nepal 13 - - 4 - - - - - - - - - -Pakistan 1 377 - - 0 247 - 153 8 - 8 - - - 13 - - 2 -Sri Lanka 71 44 9 44 153 - 0 70 6 - - 6 1 - 25
West Asia 17 598 3 775 4 961 11 163 8 219 2 055 2 729 29 499 27 965 - 13 979 6 571 11 390 8 077 10 705Bahrain 335 - 452 30 - - 111 - 3 451 155 - 3 674 - 2 723 527 317 - 2 131Iraq 34 - 11 717 1 727 324 - - - - - - 14 8 -Jordan 877 30 - 99 183 22 - 5 35 322 - - 29 37 - 2 - -Kuwait 506 - 55 460 16 2 230 414 629 3 688 441 - 10 793 2 078 376 258 1 414Lebanon 108 - 642 46 317 - - - 233 253 26 836 80 - - 63Oman 10 - 388 - - 774 - - 601 893 - 530 222 354 - 20 0Qatar 124 298 12 28 169 - - 6 028 10 276 626 - 790 7 971 3 078 3 796Saudi Arabia 330 42 297 657 1 429 291 235 1 518 121 2 165 107 294 520 - 674Syrian Arab Republic - 2 66 - - - - - - - - - - -Turkey 13 982 3 159 1 958 8 930 2 690 857 2 045 1 495 - - 38 908 2 012 590 398United Arab Emirates 1 292 299 755 556 366 286 - 215 12 629 15 825 - 1 732 5 896 - 207 3 326 7 964Yemen - - 20 - 44 - - - - - - - - -
Latin America and the Caribbeanc 9 233 - 911 29 013 18 927 22 586 34 797 25 457 2 761 8 160 16 725 16 385 30 735 16 239 8 440South America 4 205 - 1 680 18 585 15 535 19 471 17 260 20 567 5 980 4 763 13 698 10 312 23 728 12 501 2 386
Argentina - 1 757 97 3 457 - 295 343 - 76 - 5 334 259 - 80 514 102 2 754 99 42Bolivia, Plurinational State of 24 - 4 - 16 - 1 74 312 - - - - 2 - -Brazil 1 900 84 10 115 15 107 17 316 9 996 14 204 5 480 2 518 9 030 5 541 7 401 2 956 - 2 449Chile 3 252 1 534 826 514 - 78 2 513 8 662 60 1 701 867 628 10 257 2 771 746Colombia - 46 - 1 633 - 1 370 - 1 220 1 974 3 864 681 16 209 3 210 5 085 3 007 6 406 1 629Ecuador 0 6 357 167 140 108 109 0 - - 40 - - -Falkland Islands (Malvinas) 48 - - - - - - - - - - - - -Guyana 1 1 - 3 - - - - - - 0 3 - -Paraguay 4 - 60 - 1 0 - - 6 - - - - - - -Peru 430 34 612 512 - 67 618 1 819 623 417 71 171 319 225 1 041Suriname - - - - 3 - - - - - - - - -Uruguay 20 2 448 747 89 162 108 - - 7 13 0 8 4Venezuela, Bolivarian Republic of 329 - 1 740 4 158 - - 249 - - - 458 - 2 - - 1 268 - 16 35 1 372
Central America 2 900 182 8 853 1 157 1 747 16 845 3 711 - 780 3 354 2 949 4 736 6 887 3 577 5 880Belize 0 - 1 - - - - - 2 - - - - -Costa Rica 405 - 5 17 120 191 3 - - - - 354 50 -El Salvador - 30 43 103 - 1 - - - - - - 12 - -Guatemala 145 - 650 100 - 213 411 15 - - - - - - -Honduras - - 1 23 - - - - - - - - 104 -
/…

ANNEX TABLES A13
Annex table 3. Value of cross-border M&As, by region/economy of seller/purchaser, 2008–2014 (concluded)
Net salesa Net purchasesb
Region/economy 2008 2009 2010 2011 2012 2013 2014 2008 2009 2010 2011 2012 2013 2014
Mexico 2 306 129 7 989 1 143 1 116 15 896 3 652 - 190 3 187 2 896 4 274 6 504 3 845 5 372Nicaragua - - 1 - 6 0 130 - - - - - - - -Panama 44 23 164 - 235 725 216 41 - 590 165 53 462 18 - 421 509
Caribbeanc 2 128 588 1 575 2 235 1 368 693 1 179 - 2 440 44 78 1 337 120 162 174Anguilla - - - - - - - - 2 - - 10 - - - -Bahamas - - - - - - - 514 - 254 - 6 - 558 - - 123 - 374Barbados - - - - - - - - - - - - - - 11British Virgin Islands - - - - - - - - 2 632 - 2 882 - 298 511 444 - 142 - 429Cayman Islands - - - - - - - 35 - 2 615 167 1 079 - 174 - 625 - 160Dominican Republic - 108 0 7 39 1 264 213 - - - - - - - -Haiti - 1 59 - - - 4 - - - - - - -Jamaica - - - 9 - - - 14 28 1 - - 15 26Netherlands Antillesd - - - - - - - 14 - 30 - 156 35 - 158 - -Puerto Rico - 587 1 037 1 214 88 1 079 - - 2 454 22 77 202 120 - 9 - 20Saint Kitts and Nevis - - - - - - - - - - 0 - - - -Trinidad and Tobago 2 236 - - 973 16 - 600 1 175 - - 10 - - 15 - - 244 168U.S. Virgin Islands - - 473 - - - - - 4 - 1 150 - 400 -
Oceania - 742 4 8 844 23 - 67 4 278 906 174 - 4 - 15 78 1 160American Samoa - - - - 11 - 26 - - - - - 29 86 123Fiji 2 - 1 - - 0 - 2 - - - - - - -French Polynesia - - - - - - - - 1 - - 44 - -Marshall Islands - - - - - - 258 136 0 - - - 3 - 79Micronesia, Federated States of - - - - - - - - - - - - 4 -Nauru - - - - - - - - 172 - - - - -Norfolk Island - - - - - - - - - - - 0 - -Papua New Guinea - 758 0 8 843 5 - 78 - - 2 1 051 - - 4 - - - 1 116Samoa 13 - - - - - - - 324 - - - - - 14 -Solomon Islands - - - 19 - - - - - - - - - -Tokelau - - - - - - - - 1 - - - - -Tuvalu - - - - - - - 43 - - - - - -Vanuatu - 4 - - - 3 - - - - - - - -
Transition economies 25 868 6 934 4 095 32 966 6 825 - 3 820 4 220 11 005 7 789 5 378 13 108 9 296 3 054 1 831South-East Europe 587 529 65 1 367 3 16 20 - 9 - 174 - 51 2 - -
Albania 3 146 - - - - - - - - - - - -Bosnia and Herzegovina 9 8 - - 1 6 10 - - - - 1 - -The former Yugoslav Republic of Macedonia 67 - 46 27 - - - - - - - - - -
Serbia and Montenegro 7 3 - - - - - - 3 - - - - - -Serbia 501 10 19 1 340 2 9 10 - 7 - 174 - 51 1 - -Montenegro - 362 - - - - - - - - - - - -Yugoslavia (former) - - - - - - - - - - - - - -
CIS 25 177 6 391 4 001 31 599 6 822 - 3 838 4 189 11 014 7 963 5 378 12 869 9 294 3 054 1 831Armenia 204 - - 26 23 - 30 - - - - 0 - -Azerbaijan 2 - 0 - - - - 519 - - 2 748 - 256Belarus 16 - 649 10 - 13 - 51 - - - - - 215 -Kazakhstan 398 1 621 101 293 - 831 217 - 1 321 1 634 - 1 462 8 088 - 32 - - 1Kyrgyzstan - - 44 6 - 5 - - - - - - - - -Moldova, Republic of 4 - - - 9 - - - - - - - - - 14Russian Federation 18 596 4 620 2 882 29 859 7 201 - 3 901 5 525 7 869 7 957 3 875 4 673 8 302 2 242 1 685Tajikistan - - - 14 - - - - - - - - - -Ukraine 5 931 145 322 1 400 434 - 169 7 993 6 40 106 276 597 - 122Uzbekistan 25 4 1 - - 3 - - - - - - - -
Georgia 104 14 30 - 1 2 11 - - - 0 188 - - -Unspecified - - - - - - - 12 645 8 170 16 580 7 158 10 872 10 541 16 573
MemorandumLeast developed countries (LDCs)e - 2 565 - 765 2 204 501 374 26 3 734 63 - 259 353 - 102 2 23Landlocked developing countries (LLDCs)f 778 1 983 615 634 - 574 258 - 1 062 2 262 - 25 1 727 8 076 544 6 270
Small island developing States (SIDS)g 1 571 41 9 038 1 011 - 48 - 596 1 503 1 637 - 35 424 - 824 - 230 - 294 2 065
Source: UNCTAD, cross-border M&A database (www.unctad.org/fdistatistics).a Net sales by the region/economy of the immediate acquired company.b Net purchases by region/economy of the ultimate acquiring company.c Excluding the financial centers in the Caribbean (Anguilla, Antigua and Barbuda, Aruba, the Bahamas, Barbados, the British Virgin Islands, the Cayman Islands, Curaçao, Dominica, Grenada,
Montserrat, Saint Kitts and Nevis, Saint Lucia, Saint Vincent and the Grenadines, Sint Maarten and Turks and Caicos Islands).d This economy dissolved on 10 October 2010.e Least developed countries include Afghanistan, Angola, Bangladesh, Benin, Bhutan, Burkina Faso, Burundi, Cambodia, the Central African Republic, Chad, the Comoros, the Democratic
Republic of the Congo, Djibouti, Equatorial Guinea, Eritrea, Ethiopia, the Gambia, Guinea, Guinea-Bissau, Haiti, Kiribati, the Lao People’s Democratic Republic, Lesotho, Liberia, Madagascar, Malawi, Mali, Mauritania, Mozambique, Myanmar, Nepal, the Niger, Rwanda, Sao Tome and Principe, Senegal, Sierra Leone, Solomon Islands, Somalia, South Sudan, the Sudan, Timor-Leste, Togo, Tuvalu, Uganda, United Republic of Tanzania, Vanuatu, Yemen and Zambia.
f Landlocked developing countries include Afghanistan, Armenia, Azerbaijan, Bhutan, Bolivia, Botswana, Burkina Faso, Burundi, the Central African Republic, Chad, Ethiopia, Kazakhstan, Kyrgyzstan, the Lao People’s Democratic Republic, Lesotho, The former Yugoslav Republic of Macedonia, Malawi, Mali, Republic of Moldova, Mongolia, Nepal, the Niger, Paraguay, Rwanda, South Sudan, Swaziland, Tajikistan, Turkmenistan, Uganda, Uzbekistan, Zambia and Zimbabwe.
g Small island developing countries include Antigua and Barbuda, the Bahamas, Barbados, Cabo Verde, the Comoros, Dominica, Fiji, Grenada, Jamaica, Kiribati, Maldives, Marshall Islands, Mauritius, Federated States of Micronesia, Nauru, Palau, Papua New Guinea, Saint Kitts and Nevis, Saint Lucia, Saint Vincent and the Grenadines, Samoa, Sao Tome and Principe, Seychelles, Solomon Islands, Timor-Leste, Tonga, Trinidad and Tobago, Tuvalu and Vanuatu.
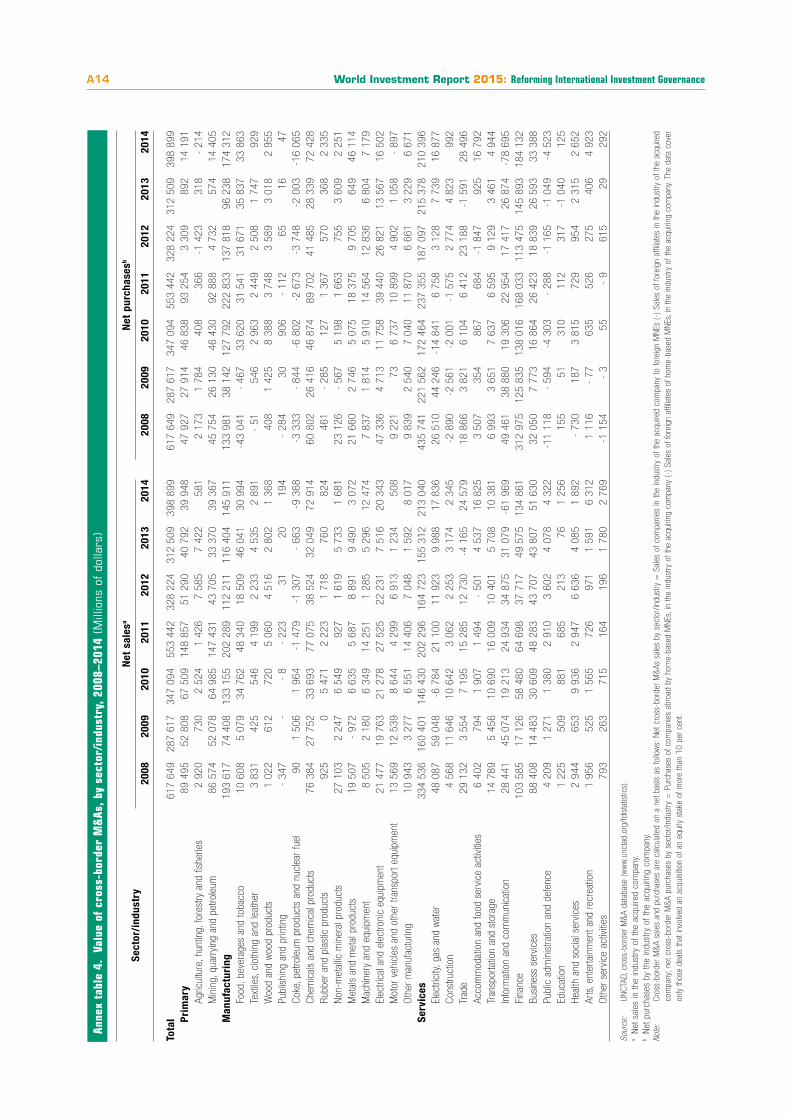
World Investment Report 2015: Reforming International Investment GovernanceA14
Ann
ex t
able
4.
Valu
e of
cro
ss-b
orde
r M
&As
, by
sect
or/i
ndus
try,
200
8–20
14 (
Mill
ions
of
dolla
rs)
Sect
or/i
ndus
try
Net
sal
esa
Net
pur
chas
esb
2008
2009
2010
2011
2012
2013
2014
2008
2009
2010
2011
2012
2013
2014
Tota
l61
7 64
928
7 61
734
7 09
455
3 44
232
8 22
431
2 50
939
8 89
961
7 64
928
7 61
734
7 09
455
3 44
232
8 22
431
2 50
939
8 89
9Pr
imar
y89
495
52 8
0867
509
148
857
51 2
9040
792
39 9
4847
927
27 9
1446
838
93 2
543
309
892
14 1
91Ag
ricul
ture
, hun
ting,
fore
stry
and
fish
erie
s2
920
730
2 52
41
426
7 58
57
422
581
2 17
31
784
408
366
-1 4
23 3
18-
214
Min
ing,
qua
rryi
ng a
nd p
etro
leum
86 5
7452
078
64 9
8514
7 43
143
705
33 3
7039
367
45 7
5426
130
46 4
3092
888
4 73
2 5
7414
405
Man
ufac
turi
ng19
3 61
774
408
133
155
202
289
112
211
116
404
145
911
133
981
38 1
4212
7 79
222
2 83
313
7 81
896
238
174
312
Food
, bev
erag
es a
nd to
bacc
o10
608
5 07
934
762
48 3
4018
509
46 0
4130
994
-43
041
- 46
733
620
31 5
4131
671
35 8
3733
863
Text
iles,
clo
thin
g an
d le
athe
r3
831
425
546
4 19
92
233
4 53
52
891
- 51
546
2 96
32
449
2 50
81
747
929
Woo
d an
d w
ood
prod
ucts
1 02
2 6
12 7
205
060
4 51
62
802
1 36
8 4
081
425
8 38
83
748
3 58
93
018
2 95
5Pu
blis
hing
and
prin
ting
- 34
7-
- 8
- 22
3 3
1 2
0 1
94-
284
30
906
- 11
2 6
5 1
6 4
7Co
ke, p
etro
leum
pro
duct
s an
d nu
clea
r fu
el 9
01
506
1 96
4-1
479
-1 3
07-
663
-9 3
68-3
333
- 84
4-6
802
-2 6
73-3
748
-2 0
03-1
6 06
5Ch
emic
als
and
chem
ical
pro
duct
s76
384
27 7
5233
693
77 0
7538
524
32 0
4972
914
60 8
0226
416
46 8
7489
702
41 4
8528
339
72 4
28Ru
bber
and
pla
stic
pro
duct
s 9
25 0
5 47
12
223
1 71
8 7
60 8
24 4
61-
285
127
1 36
7 5
70 3
682
335
Non
-met
allic
min
eral
pro
duct
s27
103
2 24
76
549
927
1 61
95
733
1 68
123
126
- 56
75
198
1 66
3 7
553
609
2 25
1M
etal
s an
d m
etal
pro
duct
s19
507
- 97
26
635
5 68
78
891
9 49
03
072
21 6
602
746
5 07
518
375
9 70
5 6
4946
114
Mac
hine
ry a
nd e
quip
men
t8
505
2 18
06
349
14 2
511
285
5 29
612
474
7 83
71
814
5 91
014
564
12 8
366
804
7 17
9El
ectri
cal a
nd e
lect
roni
c eq
uipm
ent
21 4
7719
763
21 2
7827
525
22 2
317
516
20 3
4347
336
4 71
311
758
39 4
4026
821
13 5
6716
502
Mot
or v
ehic
les
and
othe
r tra
nspo
rt eq
uipm
ent
13 5
6912
539
8 64
44
299
6 91
31
234
508
9 22
1 7
36
737
10 8
994
902
1 05
8-
897
Oth
er m
anuf
actu
ring
10 9
433
277
6 55
114
406
7 04
81
592
8 01
79
839
2 54
07
040
11 8
706
661
3 22
96
671
Serv
ices
334
536
160
401
146
430
202
296
164
723
155
312
213
040
435
741
221
562
172
464
237
355
187
097
215
378
210
396
Elec
trici
ty, g
as a
nd w
ater
48 0
8759
048
-6 7
8421
100
11 9
239
988
17 8
3626
510
44 2
46-1
4 84
16
758
3 12
87
739
16 8
77Co
nstru
ctio
n4
568
11 6
4610
642
3 06
22
253
3 17
42
345
-2 8
90-2
561
-2 0
01-1
575
2 77
44
823
992
Trad
e29
132
3 55
47
195
15 2
8512
730
-4 1
6524
579
18 8
663
821
6 10
46
412
23 1
88-1
591
28 4
96Ac
com
mod
atio
n an
d fo
od s
ervi
ce a
ctiv
ities
6 40
2 7
941
907
1 49
4-
501
4 53
716
825
3 50
7 3
54 8
67 6
84-1
847
925
16 7
92Tr
ansp
orta
tion
and
stor
age
14 7
895
456
10 6
9016
009
10 4
015
708
10 3
816
993
3 65
17
637
6 59
59
129
3 46
14
944
Info
rmat
ion
and
com
mun
icat
ion
28 4
4145
074
19 2
1324
934
34 8
7531
079
-61
969
49 4
6138
880
19 3
0622
954
17 4
1726
874
-78
695
Fina
nce
103
585
17 1
2658
480
64 6
9837
717
49 5
7513
4 86
131
2 97
512
5 83
513
8 01
616
8 03
311
3 47
514
5 89
318
4 13
2Bu
sine
ss s
ervi
ces
88 4
0814
483
30 6
0948
283
43 7
0743
807
51 6
3032
050
7 77
316
864
26 4
2318
839
26 5
9333
388
Publ
ic a
dmin
istra
tion
and
defe
nce
4 20
91
271
1 38
02
910
3 60
24
078
4 32
2-1
1 11
8-
594
-4 3
03-
288
-1 1
65-1
049
-4 5
23Ed
ucat
ion
1 22
5 5
09 8
81 6
85 2
13 7
61
256
155
51
310
112
317
-1 0
40 1
25H
ealth
and
soc
ial s
ervi
ces
2 94
4 6
539
936
2 94
76
636
4 08
51
892
- 73
0 1
873
815
729
954
2 31
52
652
Arts
, ent
erta
inm
ent a
nd r
ecre
atio
n1
956
525
1 56
5 7
26 9
711
591
6 31
21
116
- 77
635
526
275
406
4 92
3O
ther
ser
vice
act
iviti
es 7
93 2
63 7
15 1
64 1
961
780
2 76
9-1
154
- 3
55
- 9
615
29
292
Source:
UNCT
AD, c
ross
-bor
der
M&
A da
taba
se (w
ww.
unct
ad.o
rg/f
dist
atis
tics)
.a
Net
sal
es in
the
indu
stry
of t
he a
cqui
red
com
pany
.b
Net
pur
chas
es b
y th
e in
dust
ry o
f the
acq
uirin
g co
mpa
ny.
Note:
Cros
s-bo
rder
M&
A sa
les
and
purc
hase
s ar
e ca
lcul
ated
on
a ne
t bas
is a
s fo
llow
s: N
et c
ross
-bor
der
M&
As s
ales
by
sect
or/in
dust
ry =
Sal
es o
f com
pani
es in
the
indu
stry
of t
he a
cqui
red
com
pany
to fo
reig
n M
NEs
(-)
Sal
es o
f for
eign
affi
liate
s in
the
indu
stry
of t
he a
cqui
red
com
pany
; net
cro
ss-b
orde
r M
&A
purc
hase
s by
sec
tor/
indu
stry
= P
urch
ases
of c
ompa
nies
abr
oad
by h
ome-
base
d M
NEs
, in
the
indu
stry
of t
he a
cqui
ring
com
pany
(-) S
ales
of f
orei
gn a
ffilia
tes
of h
ome-
base
d M
NEs
, in
the
indu
stry
of t
he a
cqui
ring
com
pany
. The
dat
a co
ver
only
thos
e de
als
that
invo
lved
an
acqu
isiti
on o
f an
equi
ty s
take
of m
ore
than
10
per
cent
.

ANNEX TABLES A15 A
nnex
tab
le 5
. Cro
ss-b
orde
r M
&A
deal
s w
orth
ove
r $3
bill
ion
com
plet
ed in
201
4
Ran
kVa
lue
($ b
illio
n)A
cqui
red
com
pany
Hos
t ec
onom
yaIn
dust
ry o
f th
e ac
quir
ed c
ompa
nyA
cqui
ring
com
pany
Hom
e ec
onom
yaIn
dust
ry o
f th
e ac
quir
ing
com
pany
Shar
es
acqu
ired
1 1
30.3
Veriz
on W
irele
ss In
cUn
ited
Stat
esRa
diot
elep
hone
com
mun
icat
ions
Veriz
on C
omm
unic
atio
ns In
cUn
ited
Stat
esTe
leph
one
com
mun
icat
ions
, exc
ept r
adio
tele
phon
e 4
52
42.
2CI
TIC
Ltd
Chin
aIn
vest
men
t adv
ice
CITI
C Pa
cific
Ltd
Hong
Kon
g, C
hina
Stee
l wor
ks, b
last
furn
aces
and
rollin
g m
ills 1
003
23.
1So
ciet
e Fr
anca
ise d
u Ra
diot
elep
hone
SA
Fran
ceTe
leph
one
com
mun
icat
ions
, exc
ept r
adio
tele
phon
eNu
mer
icab
le G
roup
SA
Fran
ceCa
ble
and
othe
r pay
tele
visio
n se
rvic
es 1
004
15.
3Al
lianc
e Bo
ots
GmbH
Switz
erla
ndDr
ug s
tore
s an
d pr
oprie
tary
sto
res
Wal
gree
n Co
Unite
d St
ates
Drug
sto
res
and
prop
rieta
ry s
tore
s 5
55
14.
2M
erck
& C
o In
c-Co
nsum
er C
are
Busin
ess
Unite
d St
ates
Phar
mac
eutic
al p
repa
ratio
nsBa
yer A
GGe
rman
yCh
emic
als
and
chem
ical
pre
para
tions
, nec
100
6 1
3.9
Beam
Inc
Unite
d St
ates
Win
es, b
rand
y an
d br
andy
spi
rits
Sunt
ory
Hold
ings
Ltd
Japa
nM
alt b
ever
ages
100
7 1
3.4
Tim
Hor
tons
Inc
Cana
daEa
ting
plac
esBu
rger
Kin
g W
orld
wid
e In
cUn
ited
Stat
esEa
ting
plac
es 1
008
11.
2E-
Plus
Mob
ilfun
k Gm
bH &
Co
KGGe
rman
yRa
diot
elep
hone
com
mun
icat
ions
Tele
foni
ca D
euts
chla
nd H
oldi
ng A
GGe
rman
yTe
leph
one
com
mun
icat
ions
, exc
ept r
adio
tele
phon
e 1
009
10.
0Gr
upo
Corp
orat
ivo O
NO S
ASp
ain
Tele
phon
e co
mm
unic
atio
ns, e
xcep
t rad
iote
leph
one
Voda
fone
Hol
ding
s Eu
rope
SLU
Spai
nRa
diot
elep
hone
com
mun
icat
ions
100
10 9
.1Co
ncur
Tec
hnol
ogie
s In
cUn
ited
Stat
esPr
epac
kage
d so
ftwar
eSA
P Am
eric
a In
cUn
ited
Stat
esPr
epac
kage
d so
ftwar
e 1
0011
9.1
Scan
ia A
BSw
eden
Mot
or v
ehic
les
and
pass
enge
r car
bod
ies
Volk
swag
en A
GGe
rman
yM
otor
veh
icle
s an
d pa
ssen
ger c
ar b
odie
s 3
712
8.3
Inte
rMun
e In
cUn
ited
Stat
esBi
olog
ical
pro
duct
s, ex
cept
dia
gnos
tic s
ubst
ance
sRo
che
Hold
ing
AGSw
itzer
land
Phar
mac
eutic
al p
repa
ratio
ns 1
0013
7.0
Xstra
ta P
eru
SAPe
ruCo
pper
ore
sM
MG
Sout
h Am
eric
a M
anag
emen
t Co
Ltd
Hong
Kon
g, C
hina
Inve
stm
ent o
ffice
s, ne
c 1
0014
6.8
Athl
on E
nerg
y In
cUn
ited
Stat
esCr
ude
petro
leum
and
nat
ural
gas
Enca
na C
orp
Cana
daCr
ude
petro
leum
and
nat
ural
gas
100
15 6
.8Zi
ggo
NVNe
ther
land
sCa
ble
and
othe
r pay
tele
visio
n se
rvic
esLi
berty
Glo
bal P
LCUn
ited
King
dom
Cabl
e an
d ot
her p
ay te
levis
ion
serv
ices
72
16 5
.8O
rient
al B
rew
ery
Co L
tdKo
rea,
Rep
ublic
of
Mal
t bev
erag
esAn
heus
er-B
usch
Inbe
vBe
lgiu
mM
alt b
ever
ages
100
17 5
.7AS
Wat
son
Hold
ings
Ltd
Hong
Kon
g, C
hina
Reta
il st
ores
, nec
May
on In
vest
men
ts P
te L
tdSi
ngap
ore
Inve
stor
s, ne
c 2
518
5.7
Itiss
alat
Al M
aghr
ib S
AM
oroc
coTe
leph
one
com
mun
icat
ions
, exc
ept r
adio
tele
phon
eEm
irate
s Te
leco
mm
unic
atio
ns C
orp
Unite
d Ar
ab E
mira
tes
Tele
phon
e co
mm
unic
atio
ns, e
xcep
t rad
iote
leph
one
53
19 5
.6Q
uest
cor P
harm
aceu
tical
s In
cUn
ited
Stat
esPh
arm
aceu
tical
pre
para
tions
Mal
linck
rodt
PLC
Irela
ndPh
arm
aceu
tical
pre
para
tions
100
20 5
.4In
tern
atio
nal L
ease
Fin
ance
Cor
pUn
ited
Stat
esEq
uipm
ent r
enta
l and
leas
ing,
nec
AerC
ap H
oldi
ngs
NVNe
ther
land
sEq
uipm
ent r
enta
l and
leas
ing,
nec
100
21 5
.4Ga
tes
Corp
Unite
d St
ates
Rubb
er a
nd p
last
ics
hose
and
bel
ting
Blac
ksto
ne G
roup
LP
Unite
d St
ates
Inve
stor
s, ne
c 1
0022
5.3
YPF
SAAr
gent
ina
Petro
leum
refin
ing
Arge
ntin
aAr
gent
ina
Natio
nal g
over
nmen
t 5
123
5.2
Broo
kfie
ld O
ffice
Pro
perti
es In
cCa
nada
Ope
rato
rs o
f non
resid
entia
l bui
ldin
gsBr
ookf
ield
Pro
perty
Par
tner
s LP
Berm
uda
Real
est
ate
inve
stm
ent t
rust
s 5
124
5.0
Inve
nsys
PLC
Unite
d Ki
ngdo
mPr
oces
s co
ntro
l ins
trum
ents
Schn
eide
r Ele
ctric
SA
Fran
cePo
wer
, dist
ribut
ion
and
spec
ialty
tran
sfor
mer
s 1
0025
5.0
Noki
a O
yj-De
vices
& S
ervic
es B
usin
ess
Finl
and
Radi
o an
d TV
bro
adca
stin
g an
d co
mm
unica
tions
equ
ipm
ent
Mic
roso
ft Co
rpUn
ited
Stat
esPr
epac
kage
d so
ftwar
e 1
0026
4.9
Old
ford
Gro
up L
tdIs
le o
f Man
Amus
emen
t and
recr
eatio
n sv
csAm
aya
Gam
ing
Grou
p In
cCa
nada
Amus
emen
t and
recr
eatio
n sv
cs 1
0027
4.9
Sky
Deut
schl
and
AGGe
rman
yCa
ble
and
othe
r pay
tele
visio
n se
rvic
esKr
onen
Tau
send
985
GmbH
Germ
any
Cabl
e an
d ot
her p
ay te
levis
ion
serv
ices
57
28 4
.8W
ing
Hang
Ban
k Lt
dHo
ng K
ong,
Chi
naBa
nks
OCB
C Pe
arl L
tdSi
ngap
ore
Bank
s 9
829
4.8
Cele
sio A
GGe
rman
yDr
ugs,
drug
pro
prie
tarie
s an
d dr
uggi
sts’
sun
drie
sDr
agon
fly G
mbH
& C
o Kg
aAGe
rman
yDr
ugs,
drug
pro
prie
tarie
s an
d dr
uggi
sts’
sun
drie
s 7
430
4.7
OAO
RN
Hold
ing
Russ
ian
Fede
ratio
nCr
ude
petro
leum
and
nat
ural
gas
Novy
Inve
stm
ents
Ltd
Cypr
usIn
vest
ors,
nec
12
31 4
.6O
iltan
king
Par
tner
s LP
Unite
d St
ates
Natu
ral g
as tr
ansm
issio
n an
d di
strib
utio
nEn
terp
rise
Prod
ucts
Par
tner
s LP
Unite
d St
ates
Natu
ral g
as tr
ansm
issio
n 6
632
4.6
TUI T
rave
l PLC
Unite
d Ki
ngdo
mTr
avel
age
ncie
sTU
I AG
Germ
any
Trav
el a
genc
ies
54
33 4
.6Re
psol
SA-
Liqu
efie
d Na
tura
l Gas
Bus
ines
sPe
ruNa
tura
l gas
liqu
ids
Roya
l Dut
ch S
hell
PLC
Neth
erla
nds
Crud
e pe
trole
um a
nd n
atur
al g
as 1
0034
4.5
UNS
Ener
gy C
orp
Unite
d St
ates
Elec
tric
serv
ices
Forti
s In
cCa
nada
Elec
tric
serv
ices
100
35 4
.3Br
istol
-Mye
rs S
quib
b Co
-Dia
bete
s Bu
sines
sUn
ited
Stat
esPh
arm
aceu
tical
pre
para
tions
Astra
Zene
ca A
BSw
eden
Phar
mac
eutic
al p
repa
ratio
ns 1
0036
4.2
Viro
Phar
ma
Inc
Unite
d St
ates
Phar
mac
eutic
al p
repa
ratio
nsSh
ire P
LCIre
land
Phar
mac
eutic
al p
repa
ratio
ns 8
837
4.2
Sky
Italia
Cap
ital
Italy
Cabl
e an
d ot
her p
ay te
levis
ion
serv
ices
Sky
Italia
n Ho
ldin
gsIta
lyIn
vest
men
t offi
ces,
nec
100
38 4
.0No
ble
Agri
Ltd
Hong
Kon
g, C
hina
Grai
n an
d fie
ld b
eans
Inve
stor
Gro
upCh
ina
Inve
stor
s, ne
c 5
139
4.0
Groh
e AG
Germ
any
Plas
tics
plum
bing
fixt
ures
Inve
stor
Gro
upJa
pan
Inve
stor
s, ne
c 8
840
3.7
Chry
sler G
roup
LLC
Unite
d St
ates
Mot
or v
ehic
les
and
pass
enge
r car
bod
ies
Fiat
Nor
th A
mer
ica
LLC
Unite
d St
ates
Auto
mob
iles
and
othe
r mot
or v
ehic
les
41
41 3
.5JP
Mor
gan
Chas
e &
Co-
Phys
ical
Com
mod
ities
Bus
ines
sUn
ited
Stat
esNa
tiona
l com
mer
cial
ban
ksM
ercu
ria E
nerg
y Gr
oup
Ltd
Switz
erla
ndPe
trole
um a
nd p
etro
leum
pro
duct
s w
hole
sale
rs, n
ec 1
0042
3.4
Engi
ne H
oldi
ng G
mbH
Germ
any
Mot
or v
ehic
le p
arts
and
acc
esso
ries
Rolls
-Roy
ce H
oldi
ngs
PLC
Unite
d Ki
ngdo
mTu
rbin
es a
nd tu
rbin
e ge
nera
tor s
ets
50
43 3
.3CF
R Ph
arm
aceu
tical
SA
Chile
Phar
mac
eutic
al p
repa
ratio
nsAb
bott
Labo
rato
ries
Unite
d St
ates
Phar
mac
eutic
al p
repa
ratio
ns 1
0044
3.3
Tele
foni
ca C
zech
Rep
ublic
as
Czec
h Re
publ
icRa
diot
elep
hone
com
mun
icat
ions
PPF
Grou
p NV
Neth
erla
nds
Inve
stor
s, ne
c 6
645
3.3
Banc
o Sa
ntan
der(B
rasil
)SA
Braz
ilBa
nks
Banc
o Sa
ntan
der S
ASp
ain
Bank
s 7
46 3
.2Li
ndor
ff Gr
oup
ABNo
rway
Adju
stm
ent a
nd c
olle
ctio
n se
rvic
esLi
ndor
ff Gr
oup
AB S
PVSw
eden
Inve
stm
ent o
ffice
s, ne
c 1
0047
3.2
Cia
Gene
ral d
e El
ectri
cida
d SA
Chile
Elec
tric
serv
ices
Gas
Natu
ral F
enos
a Ch
ile S
pACh
ileNa
tura
l gas
tran
smiss
ion
97
48 3
.2Ne
ts H
oldi
ng A
/SDe
nmar
kFu
nctio
ns re
late
d to
dep
osito
ry b
anki
ng, n
ecIn
vest
or G
roup
Unite
d St
ates
Inve
stor
s, ne
c 1
0049
3.1
Mot
orol
a M
obilit
y Ho
ldin
gs In
cUn
ited
Stat
esRa
dio
and
TV b
road
cast
ing
and
com
mun
icatio
ns e
quip
men
tLe
novo
Gro
up L
tdHo
ng K
ong,
Chi
naEl
ectro
nic
com
pute
rs 1
0050
3.1
WIL
D Fl
avor
s Gm
bHSw
itzer
land
Flav
orin
g ex
tract
s an
d fla
vorin
g sy
rups
, nec
Arch
er D
anie
ls M
idla
nd C
oUn
ited
Stat
esCo
ttons
eed
oil m
ills 1
0051
3.1
Free
port-
McM
oRan
Oil
& G
as L
LC-
Eagl
e Fo
rd S
hale
Ass
ets
Unite
d St
ates
Crud
e pe
trole
um a
nd n
atur
al g
asEn
Cana
Oil
& G
as(U
SA)In
cUn
ited
Stat
esCr
ude
petro
leum
and
nat
ural
gas
100
52 3
.1Ca
stle
Pea
k Po
wer
Co
Ltd
Hong
Kon
g, C
hina
Elec
tric
serv
ices
Inve
stor
Gro
upCh
ina
Inve
stor
s, ne
c 6
053
3.1
Rotta
phar
m S
pAIta
lyPh
arm
aceu
tical
pre
para
tions
Med
a AB
Swed
enPh
arm
aceu
tical
pre
para
tions
100
54 3
.0Fi
rth R
ixson
Ltd
Unite
d Ki
ngdo
mAl
umin
um ro
lling
and
draw
ing,
nec
Alco
a In
cUn
ited
Stat
esRo
lling,
dra
win
g an
d ex
trudi
ng o
f non
ferro
us m
etal
s 1
00
Source:
UNCT
AD, c
ross
-bor
der
M&
A da
taba
se (w
ww.
unct
ad.o
rg/f
dist
atis
tics)
.a I
mm
edia
te c
ount
ry.
Note:
As lo
ng a
s th
e ul
timat
e ho
st e
cono
my
is d
iffer
ent f
rom
the
ultim
ate
hom
e ec
onom
y, M
&A
deal
s th
at w
ere
unde
rtake
n w
ithin
the
sam
e ec
onom
y ar
e st
ill co
nsid
ered
cro
ss-b
orde
r M
&As
. nec
= n
ot e
lsew
here
cla
ssifi
ed.
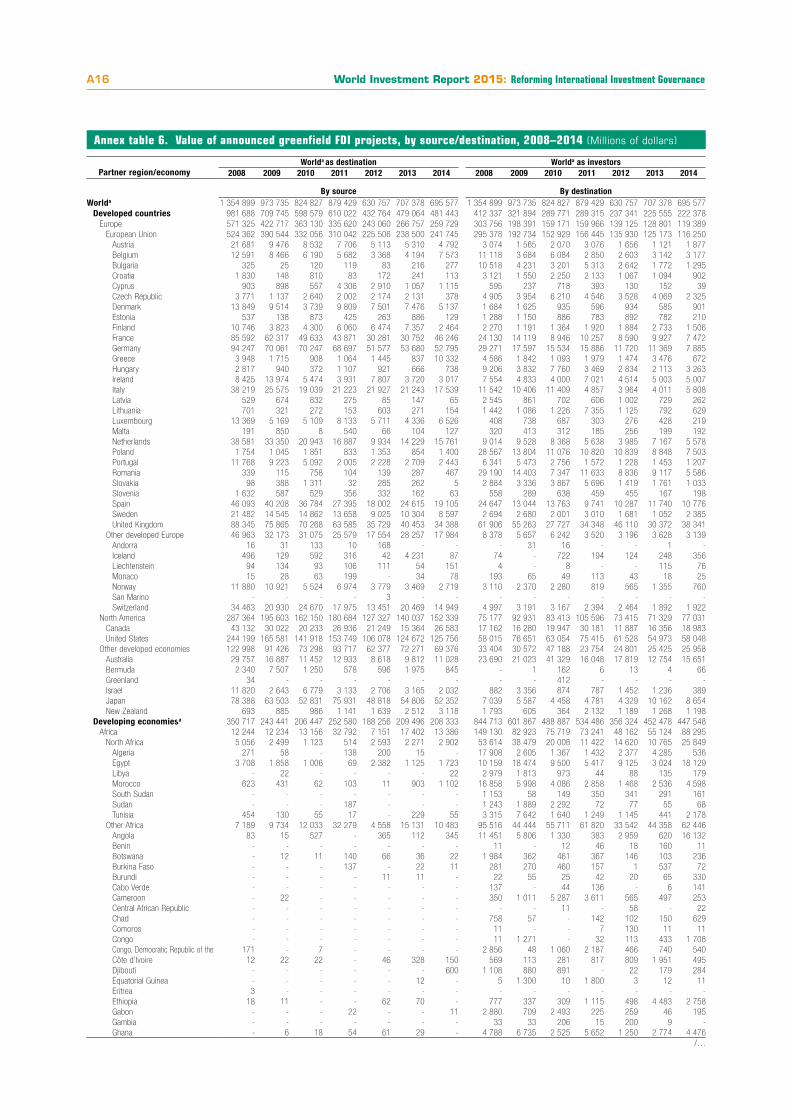
World Investment Report 2015: Reforming International Investment GovernanceA16
Annex table 6. Value of announced greenfield FDI projects, by source/destination, 2008–2014 (Millions of dollars)
Worlda as destination Worlda as investorsPartner region/economy 2008 2009 2010 2011 2012 2013 2014 2008 2009 2010 2011 2012 2013 2014
By source By destinationWorlda 1 354 899 973 735 824 827 879 429 630 757 707 378 695 577 1 354 899 973 735 824 827 879 429 630 757 707 378 695 577
Developed countries 981 688 709 745 598 579 610 022 432 764 479 064 481 443 412 337 321 894 289 771 289 315 237 341 225 555 222 378Europe 571 325 422 717 363 130 335 620 243 060 266 757 259 729 303 756 198 391 159 171 159 966 139 125 128 801 119 389
European Union 524 362 390 544 332 056 310 042 225 506 238 500 241 745 295 378 192 734 152 929 156 445 135 930 125 173 116 250Austria 21 681 9 476 8 532 7 706 5 113 5 310 4 792 3 074 1 565 2 070 3 076 1 656 1 121 1 877Belgium 12 591 8 466 6 190 5 682 3 368 4 194 7 573 11 118 3 684 6 084 2 850 2 603 3 142 3 177Bulgaria 325 25 120 119 83 216 277 10 518 4 231 3 201 5 313 2 642 1 772 1 295Croatia 1 830 148 810 83 172 241 113 3 121 1 550 2 250 2 133 1 067 1 094 902Cyprus 903 898 557 4 306 2 910 1 057 1 115 595 237 718 393 130 152 39Czech Republic 3 771 1 137 2 640 2 002 2 174 2 131 378 4 905 3 954 6 210 4 546 3 528 4 069 2 325Denmark 13 849 9 514 3 739 9 809 7 501 7 476 5 137 1 684 1 625 935 596 934 585 901Estonia 537 138 873 425 263 886 129 1 288 1 150 886 783 892 782 210Finland 10 746 3 823 4 300 6 060 6 474 7 357 2 464 2 270 1 191 1 364 1 920 1 884 2 733 1 506France 85 592 62 317 49 633 43 871 30 281 30 752 46 246 24 130 14 119 8 946 10 257 8 590 9 927 7 472Germany 94 247 70 061 70 247 68 697 51 577 53 680 52 795 29 271 17 597 15 534 15 886 11 720 11 369 7 885Greece 3 948 1 715 908 1 064 1 445 837 10 332 4 586 1 842 1 093 1 979 1 474 3 476 672Hungary 2 817 940 372 1 107 921 666 738 9 206 3 832 7 760 3 469 2 834 2 113 3 263Ireland 8 425 13 974 5 474 3 931 7 807 3 720 3 017 7 554 4 833 4 000 7 021 4 514 5 003 5 007Italy 38 219 25 575 19 039 21 223 21 927 21 243 17 539 11 542 10 406 11 409 4 857 3 964 4 011 5 808Latvia 529 674 832 275 85 147 65 2 545 861 702 606 1 002 729 262Lithuania 701 321 272 153 603 271 154 1 442 1 086 1 226 7 355 1 125 792 629Luxembourg 13 369 5 169 5 109 8 133 5 711 4 336 6 526 408 738 687 303 276 428 219Malta 191 850 8 540 66 104 127 320 413 312 185 256 199 192Netherlands 38 581 33 350 20 943 16 887 9 934 14 229 15 761 9 014 9 528 8 368 5 638 3 985 7 167 5 578Poland 1 754 1 045 1 851 833 1 353 854 1 400 28 567 13 804 11 076 10 820 10 839 8 848 7 503Portugal 11 768 9 223 5 092 2 005 2 228 2 709 2 443 6 341 5 473 2 756 1 572 1 228 1 453 1 207Romania 339 115 758 104 139 287 467 29 190 14 403 7 347 11 633 8 836 9 117 5 586Slovakia 98 388 1 311 32 285 262 5 2 884 3 336 3 867 5 696 1 419 1 761 1 033Slovenia 1 632 587 529 356 332 162 63 558 289 638 459 455 167 198Spain 46 093 40 208 36 784 27 395 18 002 24 615 19 105 24 647 13 044 13 763 9 741 10 287 11 740 10 776Sweden 21 482 14 545 14 862 13 658 9 025 10 304 8 597 2 694 2 680 2 001 3 010 1 681 1 052 2 385United Kingdom 88 345 75 865 70 268 63 585 35 729 40 453 34 388 61 906 55 263 27 727 34 348 46 110 30 372 38 341
Other developed Europe 46 963 32 173 31 075 25 579 17 554 28 257 17 984 8 378 5 657 6 242 3 520 3 196 3 628 3 139Andorra 16 31 133 10 168 - - - 31 16 - - 1 -Iceland 496 129 592 316 42 4 231 87 74 - 722 194 124 248 356Liechtenstein 94 134 93 106 111 54 151 4 - 8 - - 115 76Monaco 15 28 63 199 - 34 78 193 65 49 113 43 18 25Norway 11 880 10 921 5 524 6 974 3 779 3 469 2 719 3 110 2 370 2 280 819 565 1 355 760San Marino - - - - 3 - - - - - - - - -Switzerland 34 463 20 930 24 670 17 975 13 451 20 469 14 949 4 997 3 191 3 167 2 394 2 464 1 892 1 922
North America 287 364 195 603 162 150 180 684 127 327 140 037 152 339 75 177 92 931 83 413 105 596 73 415 71 329 77 031Canada 43 132 30 022 20 233 26 936 21 249 15 364 26 583 17 162 16 280 19 947 30 181 11 887 16 356 18 983United States 244 199 165 581 141 918 153 749 106 078 124 672 125 756 58 015 76 651 63 054 75 415 61 528 54 973 58 048
Other developed economies 122 998 91 426 73 298 93 717 62 377 72 271 69 376 33 404 30 572 47 188 23 754 24 801 25 425 25 958Australia 29 757 16 887 11 452 12 933 8 618 9 812 11 028 23 690 21 023 41 329 16 048 17 819 12 754 15 651Bermuda 2 340 7 507 1 250 578 596 1 975 845 - 1 162 6 13 4 66Greenland 34 - - - - - - - - 412 - - - -Israel 11 820 2 643 6 779 3 133 2 706 3 165 2 032 882 3 356 874 787 1 452 1 236 389Japan 78 388 63 503 52 831 75 931 48 818 54 806 52 352 7 039 5 587 4 458 4 781 4 329 10 162 8 654New Zealand 693 885 986 1 141 1 639 2 512 3 118 1 793 605 364 2 132 1 189 1 268 1 198
Developing economiesa 350 717 243 441 206 447 252 580 188 256 209 496 208 333 844 713 601 867 488 887 534 486 356 324 452 478 447 548Africa 12 244 12 234 13 156 32 792 7 151 17 402 13 386 149 130 82 923 75 719 73 241 48 162 55 124 88 295
North Africa 5 056 2 499 1 123 514 2 593 2 271 2 902 53 614 38 479 20 008 11 422 14 620 10 765 25 849Algeria 271 58 - 138 200 15 - 17 908 2 605 1 367 1 432 2 377 4 285 536Egypt 3 708 1 858 1 006 69 2 382 1 125 1 723 10 159 18 474 9 500 5 417 9 125 3 024 18 129Libya - 22 - - - - 22 2 979 1 813 973 44 88 135 179Morocco 623 431 62 103 11 903 1 102 16 858 5 998 4 086 2 858 1 468 2 536 4 598South Sudan - - - - - - - 1 153 58 149 350 341 291 161Sudan - - - 187 - - - 1 243 1 889 2 292 72 77 55 68Tunisia 454 130 55 17 - 229 55 3 315 7 642 1 640 1 249 1 145 441 2 178
Other Africa 7 189 9 734 12 033 32 279 4 558 15 131 10 483 95 516 44 444 55 711 61 820 33 542 44 358 62 446Angola 83 15 527 - 365 112 345 11 451 5 806 1 330 383 2 959 620 16 132Benin - - - - - - - 11 - 12 46 18 160 11Botswana - 12 11 140 66 36 22 1 984 362 461 367 146 103 236Burkina Faso - - - 137 - 22 11 281 270 460 157 1 537 72Burundi - - - - 11 11 - 22 55 25 42 20 65 330Cabo Verde - - - - - - - 137 - 44 136 - 6 141Cameroon - 22 - - - - - 350 1 011 5 287 3 611 565 497 253Central African Republic - - - - - - - - - 11 - 58 - 22Chad - - - - - - - 758 57 - 142 102 150 629Comoros - - - - - - - 11 - - 7 130 11 11Congo - - - - - - - 11 1 271 - 32 113 433 1 708Congo, Democratic Republic of the 171 - 7 - - - - 2 856 48 1 060 2 187 466 740 540Côte d’Ivoire 12 22 22 - 46 328 150 569 113 281 817 809 1 951 495Djibouti - - - - - - 600 1 108 880 891 - 22 179 284Equatorial Guinea - - - - - 12 - 5 1 300 10 1 800 3 12 11Eritrea 3 - - - - - - - - - - - - -Ethiopia 18 11 - - 62 70 - 777 337 309 1 115 498 4 483 2 758Gabon - - - 22 - - 11 2 880 709 2 493 225 259 46 195Gambia - - - - - - - 33 33 206 15 200 9 -Ghana - 6 18 54 61 29 - 4 788 6 735 2 525 5 652 1 250 2 774 4 476
/…

ANNEX TABLES A17
Annex table 6. Value of announced greenfield FDI projects, by source/destination, 2008–2014 (continued)
Worlda as destination Worlda as investorsPartner region/economy 2008 2009 2010 2011 2012 2013 2014 2008 2009 2010 2011 2012 2013 2014
By source By destinationGuinea - - - - - - - - 67 1 417 556 29 33 6Guinea-Bissau - - - - - - - - 22 - - - - 321Kenya 494 326 3 552 471 532 585 421 597 1 315 912 2 364 1 017 3 635 2 305Lesotho - - - - - - - 12 26 56 512 4 - -Liberia - - - - - - - 2 600 824 5 103 281 53 558 22Madagascar - - - - - - - 1 337 164 - 104 216 211 358Malawi 11 11 - - 2 - - 22 710 316 206 23 559 29Mali 22 11 22 - - - 22 400 58 15 0 792 25 52Mauritania - - - - - - - 270 - 46 274 350 22 1 312Mauritius 334 764 2 534 1 577 298 3 273 1 752 323 108 63 1 389 140 51 341Mozambique - - - - 58 - - 6 590 785 3 200 8 928 3 207 6 281 8 801Namibia 15 - - - 289 402 - 1 799 1 501 378 886 764 1 066 184Niger - - - - - - - 3 141 - 100 277 - 350 19Nigeria 671 724 654 1 012 636 2 812 641 28 402 7 807 9 272 3 789 6 277 6 320 10 800Reunion - - - - - - - - - - - - - 150Rwanda - 15 - - 22 - - 265 315 1 663 591 1 202 434 496Sao Tome and Principe - - - - - - - 280 - - - 150 150 6Senegal - - - 2 6 389 14 1 324 532 801 81 1 159 1 312 377Seychelles - - - - - - - 141 1 130 11 37 156 37Sierra Leone - - - - - - - 78 260 230 218 110 611 -Somalia - - - - - - - 161 - 34 - 40 378 165South Africa 4 526 7 503 4 563 28 533 1 982 6 666 5 564 12 199 5 847 5 951 10 845 4 604 5 765 3 833Swaziland - - - - - - - 21 11 - 439 7 150 67Togo 110 151 48 280 55 199 80 146 15 - - 410 370 22Uganda 39 44 11 - - 7 - 2 935 1 431 7 830 2 393 421 816 426United Republic of Tanzania 11 55 52 51 22 138 297 2 120 431 837 3 112 1 064 782 569Zambia - 9 - - 46 33 - 1 305 2 229 1 206 2 398 747 1 075 2 990Zimbabwe 670 33 12 - - 6 556 1 020 1 000 750 5 432 3 103 473 457
Asia 320 547 218 646 170 813 198 878 170 707 171 595 186 257 558 381 403 869 300 605 332 651 228 966 241 266 268 884East and South-East Asia 155 819 121 350 122 334 126 226 108 398 117 002 145 108 304 815 236 370 198 409 212 085 148 642 158 851 192 612
East Asia 108 541 83 141 86 211 92 672 71 322 93 154 110 991 144 826 127 203 114 474 126 100 97 124 90 942 96 173China 47 529 25 757 20 472 41 158 19 467 22 092 63 295 121 661 109 145 96 010 105 106 78 547 75 740 77 411Hong Kong, China 16 025 16 538 7 389 10 799 11 997 53 614 11 832 6 300 7 943 6 075 6 342 7 285 5 943 5 263Korea, Democratic People’s Republic of - - - - - - - 606 221 - 59 - 227 2
Korea, Republic of 32 897 28 840 30 025 27 499 29 495 11 139 23 412 11 282 4 784 3 793 9 634 6 201 5 934 10 828Macao, China 70 - - - - 81 - 689 490 221 483 2 356 257 870Mongolia - - 150 - - - - 335 257 1 655 356 249 657 165Taiwan Province of China 12 020 12 007 28 176 13 216 10 363 6 229 12 453 3 953 4 363 6 720 4 120 2 486 2 185 1 635
South-East Asia 47 278 38 208 36 123 33 554 37 076 23 848 34 117 159 989 109 167 83 936 85 985 51 518 67 908 96 438Brunei Darussalam 105 - - 70 - - 140 379 434 204 5 928 76 45 134Cambodia 65 209 - - 189 184 108 3 372 3 747 1 423 2 109 1 540 2 186 2 250Indonesia 229 1 097 319 4 998 861 366 856 32 608 26 005 13 062 27 600 15 649 10 579 17 330Lao People’s Democratic Republic 185 - - - - - 81 1 133 2 074 261 1 254 703 459 1 016
Malaysia 16 102 14 362 20 092 3 639 17 694 3 542 9 676 23 411 11 916 15 379 12 906 6 023 6 982 19 190Myanmar - - - 71 - 160 - 1 377 1 800 435 590 1 995 13 727 4 456Philippines 604 1 496 2 044 369 545 530 2 023 13 410 9 960 4 741 4 086 4 124 3 744 7 357Singapore 19 697 13 656 9 498 13 042 15 084 12 903 16 530 12 023 11 541 16 513 18 278 9 072 8 857 11 999Thailand 7 672 5 784 3 322 10 036 2 527 5 235 3 962 14 754 6 776 9 258 4 039 6 065 5 634 8 870Timor-Leste - - - - - - - - - 1 000 - 79 - 10Viet Nam 2 619 1 605 848 1 330 175 928 741 57 521 34 915 21 661 9 197 6 192 15 695 23 828
South Asia 34 253 23 212 20 323 33 177 28 743 15 955 14 220 83 870 66 607 51 883 57 244 39 296 26 368 38 957Afghanistan - - - 37 - 13 - 256 2 980 303 308 227 320 -Bangladesh 104 51 113 101 131 1 48 776 523 2 574 514 2 267 912 2 051Bhutan - - - - - - - - 116 70 91 35 183 -India 32 402 17 382 19 351 32 156 25 974 14 794 13 274 65 437 52 847 41 472 47 461 31 267 18 917 24 976Iran, Islamic Republic of 425 5 726 638 515 1 563 - 382 7 880 2 771 2 743 1 744 - 80 1 667Maldives - - - - - - - 358 401 2 048 902 279 107 108Nepal 1 - 3 31 151 243 - 580 356 339 95 - 603 390Pakistan 1 286 22 146 245 92 739 434 7 353 4 389 1 359 2 325 4 153 3 067 7 858Sri Lanka 33 32 72 93 832 165 84 1 231 2 225 973 3 805 1 068 2 180 1 906
West Asia 130 476 74 085 28 156 39 475 33 565 38 638 26 929 169 696 100 891 50 313 63 321 41 028 56 047 37 316Bahrain 15 800 14 758 797 734 1 530 618 467 7 488 2 086 2 408 3 850 3 950 1 166 1 018Iraq - 20 - 51 - 53 - 25 813 10 970 4 208 8 731 978 15 020 2 270Jordan 547 897 598 50 1 015 107 553 11 882 2 518 2 143 2 822 1 459 10 938 1 730Kuwait 15 779 3 394 2 479 2 824 1 215 9 806 399 2 021 763 572 811 614 2 168 238Lebanon 518 571 268 220 415 166 220 1 938 2 131 1 274 483 222 106 1 182Oman 173 3 069 107 220 99 466 269 7 757 7 364 3 534 3 664 4 311 1 662 1 528Qatar 8 495 13 536 1 583 11 508 7 514 1 496 252 18 543 25 033 4 089 3 796 2 089 1 597 1 215Saudi Arabia 4 896 5 946 1 435 5 627 2 033 2 701 1 926 37 162 14 581 8 315 16 152 7 859 6 351 9 967State of Palestine - - - - 15 - - 1 050 14 15 - - 7 20Syrian Arab Republic 357 61 - 219 0 - - 5 521 3 638 1 992 1 593 3 - 4Turkey 4 871 3 883 3 075 3 019 4 139 6 803 2 685 19 499 19 619 9 483 11 185 8 996 9 714 4 779United Arab Emirates 78 988 27 952 17 744 15 003 15 578 16 402 20 159 28 676 11 264 10 866 10 227 10 245 7 141 12 856Yemen 52 - 70 - 11 21 - 2 345 910 1 413 6 302 178 510
Latin America and the Caribbeana 17 856 12 475 22 462 20 724 10 398 20 499 8 689 132 518 112 792 110 077 125 316 77 808 153 023 89 446South America 15 397 9 983 19 619 9 726 6 661 14 131 4 592 84 077 76 901 86 723 90 590 55 394 68 031 40 528
Argentina 420 875 1 267 533 1 349 1 368 69 5 870 8 491 6 086 11 590 5 837 4 263 3 273Bolivia, Plurinational State of - - - - - 66 - 747 1 912 776 243 10 1 028 502Brazil 11 027 5 896 11 703 4 281 3 130 9 159 1 590 41 844 34 992 42 325 50 054 30 081 28 317 18 713
/…

World Investment Report 2015: Reforming International Investment GovernanceA18
Annex table 6. Value of announced greenfield FDI projects, by source/destination, 2008–2014 (concluded)
Worlda as destination Worlda as investorsPartner region/economy 2008 2009 2010 2011 2012 2013 2014 2008 2009 2010 2011 2012 2013 2014
By source By destinationChile 772 1 462 2 217 1 791 1 175 1 600 1 421 6 515 15 847 5 721 14 814 10 903 10 195 6 610Colombia 600 109 3 384 815 812 1 073 392 8 953 3 167 13 048 7 102 3 258 12 191 3 162Ecuador 69 368 190 81 41 - 2 529 324 108 619 488 803 562Guyana - - - - - - - 1 000 12 159 45 302 38 -Paraguay - - - - - - - 280 65 369 111 369 401 326Peru 16 358 27 265 12 400 376 9 791 10 768 11 320 4 332 3 023 5 688 5 464Suriname - - - - - - - 107 - - 160 31 13 -Uruguay 2 45 2 5 - 11 - 4 356 248 724 1 027 753 1 075 1 160Venezuela, Bolivarian Republic of 2 491 870 830 1 955 142 453 741 4 084 1 075 6 086 494 338 4 021 755
Central America 1 566 2 438 2 748 10 790 3 725 6 121 3 678 41 651 32 507 20 931 26 937 20 447 76 074 45 611Belize - - - 13 - - - - 5 1 - 259 100 4Costa Rica 5 55 119 11 3 114 84 508 1 403 1 711 2 983 677 762 1 363El Salvador - 264 145 20 - 55 - 529 718 252 479 230 858 515Guatemala 48 116 71 146 205 222 7 992 1 108 892 237 384 1 058 379Honduras - - - - 37 373 - 1 062 121 246 483 51 548 1 551Mexico 1 397 1 923 1 701 10 532 3 474 5 291 3 446 35 217 26 173 16 078 20 531 17 706 30 545 33 319Nicaragua 62 - 246 3 3 31 2 147 751 265 270 350 40 597 725Panama 54 81 465 65 4 35 139 3 196 2 228 1 487 1 954 790 1 606 7 755
Caribbeana 893 55 95 209 12 247 420 6 790 3 385 2 422 7 788 1 968 8 918 3 307Antigua and Barbuda - - - - - - - 69 - - - - - 2 221Aruba - - - - - - - 65 - 6 25 65 - 84Bahamas 10 35 - 1 8 96 37 70 6 68 479 24 16 221Barbados - - 5 32 21 - - - 28 122 227 4 - 240Cayman Islands 608 987 65 483 295 76 464 310 98 248 282 299 6 298Cuba 7 - - 31 - - 133 2 281 958 1 552 446 221 195 19Dominica - - - - - - - - - - - - - -Dominican Republic - 39 25 - - - - 2 861 1 336 253 5 307 603 2 858 1 375Grenada - - - - - - - - - 4 6 30 0 1Guadeloupe - - - - - - - 267 - - 25 - - 221Haiti - - 8 - - 9 - 3 49 59 350 45 434 -Jamaica 880 13 28 168 12 237 232 245 38 37 458 12 1 363 505Martinique - - 13 - - - 13 - 6 - - 15 - 221Puerto Rico 5 3 20 10 - 1 42 747 681 497 1 071 952 2 555 965Saint Kitts and Nevis - - - - - - - - - - - 65 - -Saint Lucia - - - - - - - - 1 145 65 - 65 44Saint Vincent and the Grenadines - - - - - - - - - - - - - 31Trinidad and Tobago - - 3 - - - - 387 316 24 131 118 1 513 3Turks and Caicos Islands - - - - - - 1 65 - 31 - - 221 -
Oceania 69 86 16 185 - - 0 4 684 2 283 2 486 3 278 1 388 3 066 923Fiji - 70 10 - - - 0 111 302 - 159 36 12 48French Polynesia - 10 - - - - - - - 70 - - - -Micronesia, Federated States of - - - - - - - - - - - 156 - 35New Caledonia - - - 35 - - - 1 400 18 - 10 - - -Papua New Guinea 67 - 7 150 - - - 2 638 1 927 2 195 3 045 1 196 3 054 840Samoa 2 - - - - - - 500 - - - - - -Solomon Islands - 6 - - - - - 35 36 221 65 - - -
Transition economies 22 495 20 549 19 801 16 827 9 737 18 818 5 801 97 848 49 974 46 169 55 628 37 092 29 345 25 650South-East Europe 660 325 498 182 75 225 148 16 415 5 589 4 937 6 833 7 736 6 345 6 094
Albania - - 105 - - 3 3 3 324 116 58 317 288 56 53Bosnia and Herzegovina 7 - 19 3 4 38 4 1 981 1 316 277 1 258 1 349 878 1 006Montenegro - - 7 - - 9 - 715 120 372 424 350 612 1 143Serbia 653 316 365 146 71 78 142 7 734 3 262 3 775 3 981 4 633 4 223 2 926The former Yugoslav Republic of Macedonia - 9 1 33 - 99 - 2 661 776 454 853 1 117 576 966
CIS 21 761 20 195 19 296 16 464 8 895 18 562 5 653 78 919 40 549 40 185 47 100 28 827 21 707 18 701Armenia 47 - 13 70 120 - - 590 878 229 658 486 811 281Azerbaijan 1 215 3 418 569 422 2 883 220 110 1 530 2 063 646 1 384 1 496 1 006 647Belarus 1 410 395 2 075 109 75 539 222 974 1 143 1 783 1 012 616 594 348Kazakhstan 350 700 693 343 137 219 419 16 218 1 743 2 379 7 455 1 188 1 386 2 165Kyrgyzstan 81 31 - - - - - 463 45 - 277 60 49 70Moldova, Republic of 537 - - 0 - 3 - 153 487 271 346 155 282 115Russian Federation 15 421 14 890 14 885 14 619 4 251 16 376 4 569 46 149 26 583 29 645 22 416 16 683 12 468 12 974Tajikistan 82 8 - - - - - 223 539 2 1 060 587 159 482Turkmenistan - - - - - - - 4 024 1 262 300 2 219 7 - 35Ukraine 2 617 754 1 063 901 1 429 1 206 334 7 644 4 463 4 062 2 869 3 061 4 669 1 090Uzbekistan - - - - 0 - - 952 1 344 867 7 404 4 488 285 495
Georgia 75 29 7 181 766 31 - 2 514 3 836 1 047 1 694 529 1 292 855Memorandum
Least developed countries (LDCs)b 875 589 861 896 1 131 1 624 1 604 52 569 31 192 37 704 31 629 22 061 40 279 47 680Landlocked developing countries (LLDCs)c 3 258 4 312 1 483 1 213 3 500 1 047 1 220 44 241 23 815 22 271 38 535 18 640 17 712 16 398
Small island developing States (SIDS)d 1 292 887 2 585 1 928 339 3 605 2 021 5 302 3 163 6 101 7 079 2 456 6 504 4 841
Source: UNCTAD, based on information from the Financial Times Ltd, fDi Markets (www.fDimarkets.com).a Excluding the financial centers in the Caribbean (Anguilla, Antigua and Barbuda, Aruba, the Bahamas, Barbados, the British Virgin Islands, the Cayman Islands, Curaçao, Dominica, Grenada,
Montserrat, Saint Kitts and Nevis, Saint Lucia, Saint Vincent and the Grenadines, Sint Maarten and Turks and Caicos Islands).b Least developed countries include Afghanistan, Angola, Bangladesh, Benin, Bhutan, Burkina Faso, Burundi, Cambodia, the Central African Republic, Chad, Comoros, the Democratic Republic
of the Congo, Djibouti, Equatorial Guinea, Eritrea, Ethiopia, the Gambia, Guinea, Guinea-Bissau, Haiti, Kiribati, the Lao People’s Democratic Republic, Lesotho, Liberia, Madagascar, Malawi, Mali, Mauritania, Mozambique, Myanmar, Nepal, the Niger, Rwanda, Sao Tome and Principe, Senegal, Sierra Leone, Solomon Islands, Somalia, South Sudan, Sudan, Timor-Leste, Togo, Tuvalu, Uganda, the United Republic of Tanzania, Vanuatu, Yemen and Zambia.
c Landlocked developing countries include Afghanistan, Armenia, Azerbaijan, Bhutan, Bolivia, Botswana, Burkina Faso, Burundi, the Central African Republic, Chad, Ethiopia, Kazakhstan, Kyrgyzstan, the Lao People’s Democratic Republic, Lesotho, The former Yugoslav Republic of Macedonia, Malawi, Mali, the Republic of Moldova, Mongolia, Nepal, the Niger, Paraguay, Rwanda, South Sudan, Swaziland, Republic of Tajikistan, Turkmenistan, Uganda, Uzbekistan, Zambia and Zimbabwe.
d Small island developing countries include Antigua and Barbuda, the Bahamas, Barbados, Cabo Verde, Comoros, Dominica, Fiji, Grenada, Jamaica, Kiribati, Maldives, the Marshall Islands, Mauritius, Federated States of Micronesia, Nauru, Palau, Papua New Guinea, Saint Kitts and Nevis, Saint Lucia, Saint Vincent and the Grenadines, Samoa, Sao Tome and Principe, Seychelles, Solomon Islands, Timor-Leste, Tonga, Trinidad and Tobago, Tuvalu and Vanuatu.
Note: Data refer to estimated amounts of capital investment.

ANNEX TABLES
WORLD INVESTMENT REPORT PAST ISSUES
WIR 2014: Investing in the SDGs: An Action Plan
WIR 2013: Global Value Chains: Investment and Trade for Development
WIR 2012: Towards a New Generation of Investment Policies
WIR 2011: Non-Equity Modes of International Production and Development
WIR 2010: Investing in a Low-carbon Economy
WIR 2009: Transnational Corporations, Agricultural Production and Development
WIR 2008: Transnational Corporations and the Infrastructure Challenge
WIR 2007: Transnational Corporations, Extractive Industries and Development
WIR 2006: FDI from Developing and Transition Economies: Implications for Development
WIR 2005: Transnational Corporations and the Internationalization of R&D
WIR 2004: The Shift Towards Services
WIR 2003: FDI Policies for Development: National and International Perspectives
WIR 2002: Transnational Corporations and Export Competitiveness
WIR 2001: Promoting Linkages
WIR 2000: Cross-border Mergers and Acquisitions and Development
WIR 1999: Foreign Direct Investment and the Challenge of Development
WIR 1998: Trends and Determinants
WIR 1997: Transnational Corporations, Market Structure and Competition Policy
WIR 1996: Investment, Trade and International Policy Arrangements
WIR 1995: Transnational Corporations and Competitiveness
WIR 1994: Transnational Corporations, Employment and the Workplace
WIR 1993: Transnational Corporations and Integrated International Production
WIR 1992: Transnational Corporations as Engines of Growth
WIR 1991: The Triad in Foreign Direct Investment
All downloadable at www.unctad.org/wir

World Investment Report 2015: Reforming International Investment Governance
SELECTED UNCTAD PUBLICATION SERIES ON TNCs AND FDI
World Investment Reportwww.unctad.org/wir
FDI Statisticswww.unctad.org/fdistatistics
Global Investment Trends Monitorwww.unctad.org/diae
Investment Policy Hubhttp://investmentpolicyhub.unctad.org/
Investment Policy Monitorwww.unctad.org/iia
Issues in International Investment Agreements: I and II (Sequels)www.unctad.org/iia
International Investment Policies for Developmentwww.unctad.org/iia
Investment Advisory Series A and Bwww.unctad.org/diae
Investment Policy Reviewswww.unctad.org/ipr
Current Series on FDI and Developmentwww.unctad.org/diae
Transnational Corporations Journalwww.unctad.org/tnc
The sales publications may be purchased from distributors of United Nations publications throughout the world.
They may also be obtained by contacting:
United Nations Publications Customer Servicec/o National Book Network
15200 NBN WayPO Box 190
Blue Ridge Summit, PA 17214email: [email protected]
https://unp.un.org/
For further information on the work on foreign direct investment and transnational corporations, please address inquiries to:
Division on Investment and EnterpriseUnited Nations Conference on Trade and Development
Palais des Nations, Room E-10052CH-1211 Geneva 10 Switzerland
Telephone: +41 22 917 4533Fax: +41 22 917 0498www.unctad.org/diae
HOW TO OBTAIN THE PUBLICATIONS