Embed Size (px)
Citation preview
UNITED ITATEI ENVIRONMENTAL PROTECTION AGENCY
REGION I
J F KENNEDY FEDERAL BUILOINO BOSTON MASSACHUSETTS 02203
March 271 1986
Mr James F Murphy Jr Assistant Vice-President Polyfibron Division WR Grace Company 55 Hayden Avenue Lexington MA 02173
Re Third Quarterly Report on Aquifer Restoration
Dear Mr Murphy
Enclosed with this letter are the government parties comments on the third qgarterly report on Aquifer Restoration In addition several general issues as yet unresolved are addressed as are issues from preceding quarterly reports
Some of the caments raised can be resolved as part of the fourth quarter report the remainder should be responded to directly
We suggest ~ we tentatively plan for a meeting at the completion of the fourth quarter report to discuss the effectiveness of the restoration system middotand to resolve any outstanding issues We would anticipate such a meeting would best be scheduled for late May Ken Wenger will contact you to conft a date
Sincerely
~- n~Re~ vfL pound_ Ator Gilbert T - J8i41Environmental Eng Ira w Leighpound0n~hief
Waste Management Division Department ofpoundnvironmental Quality MA Superfund Section
Engineerllll CoDDonwealtb Yif llusachusetts
Enclosure
cc StaveD 111gliillabull Steve OiliiJwamp
Lany npa Bernard tlaqhy Jr
IIII
COMMENTS ON WR GRACE AQUIFERRESTORATION PROGRAM
March 18 1986
General Comments - applicable to aquifer restoration program in
general andor issues which have come up consistently
Maps showing groundwater contours should include middot locations1
of all wells used to develop those contours This could be
accomplished by the use of transparent overlays of contoursMaps of
in combination with a base map with well locations
well locations and maps of contours should be of the same
scale to facilitate comparison
It has also been noted that although contours and pumping
rates have changed between the October and January reports
the capture zone presented (Fig 3-1 Second Ouarterly Report
Fig 2-1 Third Quarterly Report) has not been modified
All water quality tables should include an explanation that2
a blaak space indicates that the sample was below the detection
limit if this is the case
Table 2-1 (page 2-2) of the Third Quarterly Report Ground3
and SUrface Water Elevations provides no units for the
eleva~ions In future reports all tables and figures must
include unit~ whera appropriate
Acco~fng to Table 2-3 (page 2-11) of the Third Quarterly4
Reportr air stripper efficiency has gone as low as 20 percent
Efforts must be made to keep the tower performing at itsThe Aquifer
maxtmn efficiency (design rate of 95 percent)
Res~ation system can not be considered a success with
eff~ency below the design rate for extended periods as has
beea the case thus far
More frequent sampling of the air stripper would allow for
more complete screening for spikes and would produce
additional tower efficiency information Tower influent and
efflaent samples should be taken at least twice a month
wR- Graces First Quarterly Report (July 1985) describes5
pla~ to conduct additional investigations in Fort Pond
BroOk in order to ascertain a more complete understanding
of thepresence of VDC in the vicinity of FP-5 (page 18)middot (a) FP-5 resampling
Theseinvestigations will include
and ana-lysis of both the groundwater and surface waters at
through FP-5 (b) installation of 2 or 3 additional wellF~poilts into the stream sediments downstream of FP-5 (c)
inampallation of a monitoring well next to FP-5 into the aquifer
I I
~ I I
-2shy
below the level of the str eambed sediments (10 to 15 feet below the streambed) ~o sample and analyze the groundwater at that location and (d) collection and analysis of samples(s) of the ~treambed sediments for volatile organics particle size gradation and organ i c carbonbull
As of yet no further data has been received relative to this outline bull The government parties request a report on the status of this plan middot
6 Th~ October 1985 Second Quarterly Report (page 1-1) states that bullhydraulically the area of containment is similar to that which was planned Locations where contaminment is slightly less than planned occur near where wells are pumping at rates lower than the planned pumping rates (See Fig 3-1) The inactivity of the West Landfill well reduces the area of influence near the Secondary Lagoon Tight soils at the North Lagoon Gravel Pack Well cause its pumping rate to be low and consequently the northward extent of the zone of influence in the glacial sediments is less than planned (Fig 3-1) All waste sites except the North Lagoon are enclosed within the hydraulic contaminment system Continued observation of water levels and water quality in wells to the north (AR-8 AR-16 AR-17 -AR-23 NL-1 and NL-2) will allow accurate observations about the extent of the containment area to the northbull
0 Currently the North Lagoon and the battery separator chip pile (a potential contributor of contamination to groundwater) are not completely within the containment area It has been noted that pumping rates of wellw other than the West Landfill and North Lagoon Gravel Pack Wells have been consistently lower than designed pumping rates (COM 1984 bullFinal Report on Aquifer Restoration Program Volume III Simulation of Aquifer Restoration Alternatives)~ Specifically the RLF wells rate has been significantly lower than its designed rate of 31 gpm throughout the entire program ~g h~s the WRG-3 well in the Assabet well area (designed rate middot350 gpm) Clarify the reasons for the reduced pumping rates and the effect on containment
7 Despite the position taken by the government parties in the response dated October 10 1985 to Graces First Ouarterly Report on Aquifer Restoration that bull[a) detection limit of 10 ppb is unacceptable since levels from 1-10 ppb are not reportedbull (Comment 2-~7) and despite the position taken by the Division of Water Pollution Control in its letter of May 24 1985 regarding Graces permit that bull[u)nder your discharge permit your limitation is 10 ug1 for Total Volatile Organic Compounds therefore your detection limit of 10 ppb is
= shy
I I
r I I
-3shy
unacceptable (Comment 8) Grace continues to assert that the officially proposed detection limit of 10 ug1 (Fe~ Reg Dec 3 1979) should be used for enforcement of permitsbull (3rd QR pages 2-10 2nd QR pag~s 3-15 GraceCOM Response (11185) o 172J GraceCOM Response (61385) Comment 8) Indeed bullwR Grace and COM have specififed that all analyses performed for permit compliance be middot done with detection limit of 10 ppb (GraceCOM Response (1118gt) Comment 41)
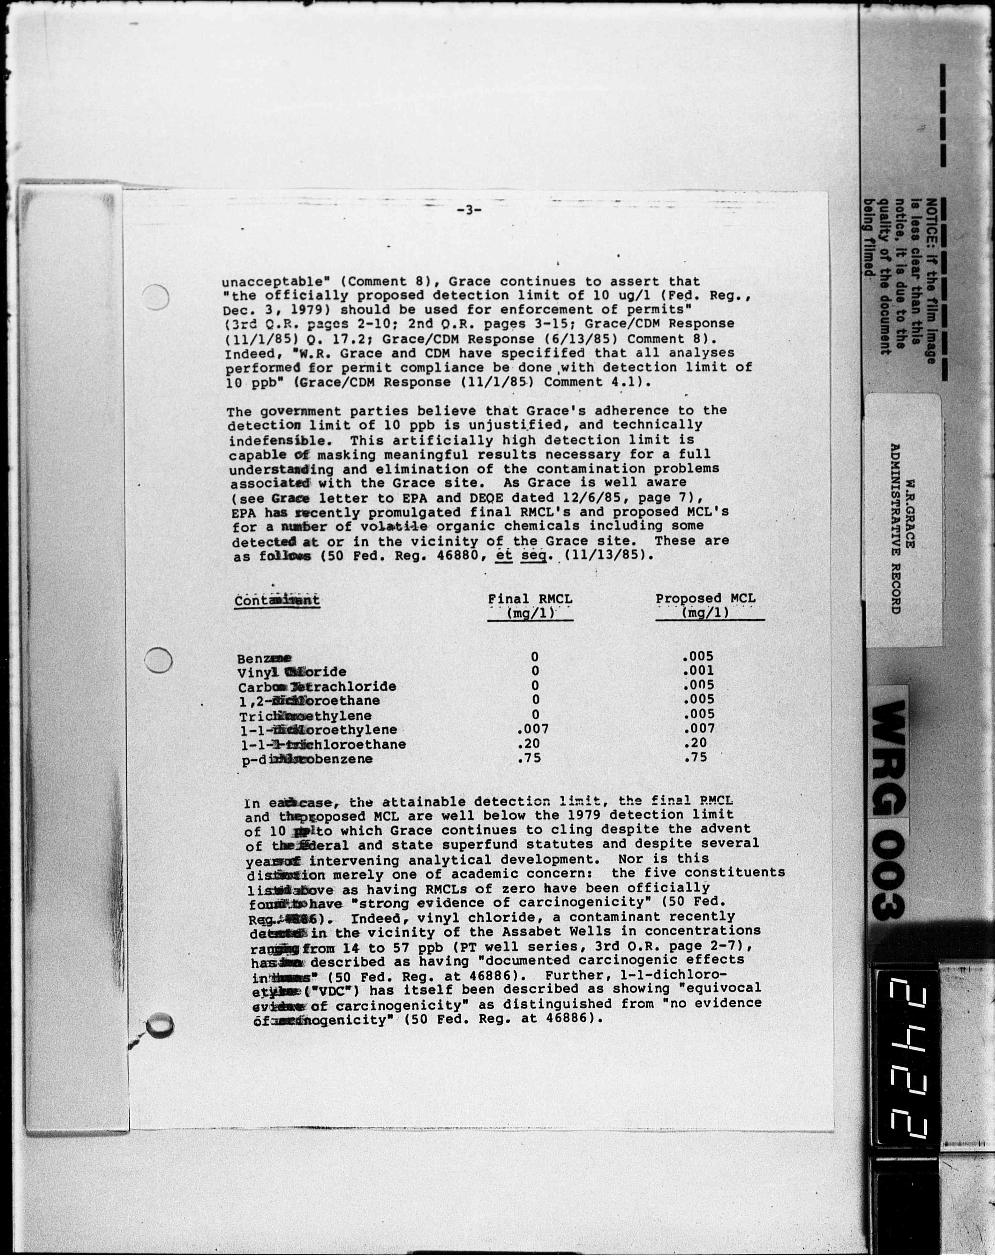
The government parties believe that Graces adherence to the detectiOIJ limit of 10 ppb is unjustified and technically indefensible This artificially high detection limit is capable of masking meaningful results necessary for a full understafing and elimination of the contamination problems associamp~ with the Grace site As Grace is well aware (see Graee letter to EPA and DEOE dated 12685 page 7) EPA has ~ently promulgated final RMCLs and proposed MCLs for a RUEber of volbullt~e organic chemicals including some detec~ at or in the vicinity of the Grace site These are as fGJkMe (SO Fed Reg 46880 et seg _(ll1385)
Final RMCL ~rltlgt(~sed)~~~middot middot hng1 gtmiddotmiddot middot mg11
() Ben~ 0 oos viny1 Moride 0 001 Carbaa~rachloride 0 ~005
12~roethane 0 005 Tricillalethylene 0 005 1-l~roethylene 007 007 1-1-~~hloroethane 20 20
bull75 p-d~benzene bull 75
In e~se tha attainable detection li~it the final P~CL and tbep10posed MCL are well below the 1979 detection limit of lO~o which Grace continues to cling despite the advent of tbe~eral and state superfund statutes and despite several ye~ intervening analytical development Nor is this di~tmiddoton merely one of academic concern the five constituents l~~ve as having RMCLs of zero have been officially foujf~have bullstrong evidence of carcinogenicity (50 Fed R~~)~ rndeed vinyl chloride a contaminant recently da~in the vicinity of the middotAssabet Wells in concentrations ra~frour 14 to 57 ppb (PT well series 3rd OR page 2-7) hasaB described as having documentmiddoted carcinogenic effects inJ ~ (50 Fed Reg at 46886) Further 1-1-dichloroshye~~(bullvocbull) has itself been described as showing equivocal ev~of ~arcinogenicitybull as distinguished from no evidence 6poundCftoqenicitybull (50 Fed Reg at 46886)
middot----shy
I I I I
Moreover it is official EPA policy that a superfund clean-up shall bullattain or exceed applicable or relevant and appropri~te Federal environmental and public health requirementsbull including bullMaximum Contamination Levels (for all sources of drinking water exposure)bull (50 Fed Reg 47946-47949) middot middot
Since the RMCLs state worthwhile attainment goals since the MCLs when finalized will provide enforceablestandards and since the Grace site is listed as a Superfund site there can no longer be any excuse for Grace failing to provide data having a meaningful detection limit A detection limit of 1 ppb for every sampling round from this point forward or at a minimum the Practical Ouantitation Levels established by EPA (50 Fed Reg 46904) must be used by WR Grace
In future reports a detection limit should be listed for each chemical constituent presented
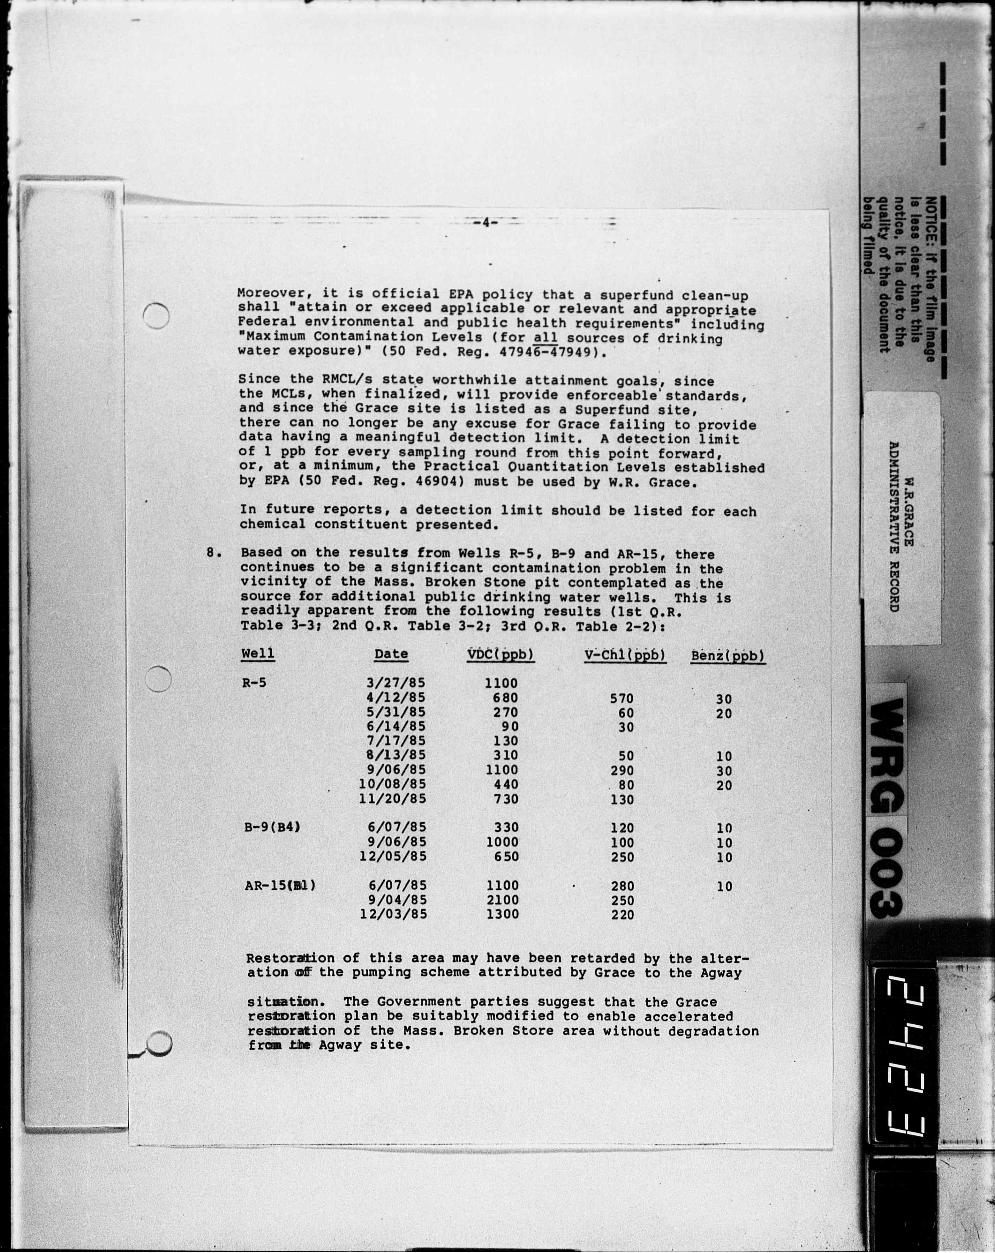
8 Based on the results from Wells R-5 B-9 and AR-15 there continues to be a significant contamination problem in the vicinity of the Mass Broken Stone pit contemplated as the source for additional public drinking water wells This is readily apparent from the following results (1st QR Table 3-3J 2nd OR Table 3-2J 3rd OR Table 2-2)~
Well Date Vbtl22b) vch1l22b) 8enz(22b) I _ R-5 32785 1100
41285 680 570 30 53185 270 60 20 61485 90 30 71785 130 81385 310 50 10 90685 1100 290 30
100885 440 80 20 112085 730 130
B-9(B4) 60785 330 120 10 90685 1000 100 10
120585 650 250 10
AR-15(81) 60785 1100 280 10 90485 2100 250
120385 1300 220
Restoration of this area may have been retarded by the altershyation of the pumping scheme attributed by Grace to the Agway
sitatiDn The Government parties suggest that the Grace resmralion plan be suitably modified to enable accelerated resllloration of the Mass Broken Store area without degradation frm tie Agway site
IIII
-5shy
9 Based on deep level readings from Wells R6 PT-2 and PT-3 there is a significant contamination problem at depth in the immediate vicinity of the Assabet Wells that is not currently
This is read i ly apparen taddressed by Graces recovery wellsfrom the following results (1st OR Table 3-3 2nd OR Tabl es 3-2 3- 4 3rd OR Tables 2-2 2-4)
Well DATE vot(ppb) v thHppb) aenz(pptgt gt
B-6(B5) 32685 120041185 980 58052485 1100 40 62885 1700 560 ~z71085 740 120 3081385 1600 330 20 Bzens90685 1500 420 40 ti middot
100885 1100 220 10
~nPT-2Bl 93085 190 49 3 ==(II (II
120585 200 57 6 (II
PT-3Bl 93085 49 17 1 0n
120585 56 14 ~
0 WR Grace should include this area as part of the restoration program and report to the government how this contamination will be addressed
10 Certain data indicate that Grace continues to experience problems with its treatment system that may adversely affect the quality of Sinking Pond For instance on September 26 1985 the inlet to Sinking Pond showed a VDC concentration of 20 ppb (3rd QR page 2-7) In addition Grace continued to experience bullhigher color turbidity and dissolved iron at ISP in October and November samples bullbullbull bull (Id Inorganic Afaalyses fer Permit Compliance) Gra~A musttake all steps necessary to protect Sinking Pond from itself becoming degraded as a result of the aquifer restoration program and report to the government parties how Sinking Pond will be protected
In addition Graces observation that bull[t]he analytical data that we are aware of from certified laboratories for the Lawsbrook well field show that for more than six years VDC has never b~en above 2 ppbbull (Id Response 17) conflicts with data reported in routine-volatile organic testing conducted by the Acton Water District These data area attached and show that on five different occasions 11-Dichloroetheylene (VDC) was above 20 ppb at the Lawsbrook gravel-packed well
--- -middot -- -~--- - - 6- c_
Although contaminant levels in the Lawsbrook area are currently below d~tection limits we cannot rule out that there is no further potential for contamination by a plume that may be outside of the Grace area of influence and could be migrating
middot towards the LawsbrookFort Pond Brook area bull
Head elevations and water quality data in the area northeast of the WR Grace site would either confirm the existance of a plume in this area and characterize its nature and extent middotor conclusively deny its existence WR Grace should report to the government parties how it will collect and report this information
october middot t isAes middotsPecific middot to middot second middot ouartei1Y middotRePortgt
1 Tables in this report are generally difficult to use because of poor pcint quality GDM should provide replacement copies of the middot followtg from the ~ctober Ouarterly Report Table 3-1 (pages 3-2 thro~ 3-4) and Table 3-4 (pages 3-18 and 3-19)
C)
2 Page 3-l paragraph 4 reads bulltn addition the Northern Lagoon gravel pack wells flow is restricted by tight soils in that area Its flow of 5 gpm results in a small hydraulic - influence in tbe ~acial sediments However the Northern Lagoon Bedrock Well ~ the same location but seventeen feet deeper maintains a flowef 35 gpm It is reasonable to assume that the zone of infl~ middotin the roc~ extends farther to the north than in the overhanfen bull
JanuarY -~es -speclfic - to - the - Third ouarterlY RePort)
1 Page l-l paragraph 2 states that~ bullduring the quarter from Sept~r 22 - December 22 pumpage from each well remain~d stablILbullmiddot This middot statement is contradictory to paragraph four of fe~e page which describes bulltwo events raaulting in do~~ that occurred middot during this quarter middot An eleven day powerutage is described as well as an accident which caused a tMD tD three day shut-down ofmiddot the SLBR and SLGP wells oemiddot~ of the results of the power outage are not provided oe~gmiddot on how many wells were affected there could have beerua s-ignificant impact to the aquifer restoration system The~nment parties reques_t that information regarding whplusmnCh-lls were affected and for what duration be provided Also~~le 1-2 (page 1-5) indicates some significant changes imP~ng rates in the East Landfill well (increased from 10 to28~) and in the South Lagoon gravel pack well (270 to 2UDcQII~ during this quarter
-------------- shy
middot 2
o _ middot
-7~ -
According to the October report bullthe West Landfill Well is not pumping because of OEOEs concern ~egardi~g a reported pesticide dump on abutting (non-Grace) property The principal effect of this wells inactivity is to decrease the area of influence in the vicinity of the Secondary Lagoon relative to that predicted However the Secondary Lagoon is within the contained a~ea and therefore thesystems performance should be as plannedbull
The West Landfill Well is also used to contain contaminants from the WR Grace Landfill Water levels from Table 2-1 of the Third Ouarterly Report indicate that contaminants from the eastern part of the Secondary Lagoon and Graces Landfill may be migrating past the RLF well and towards the Assabet River Therefore the River Landfill pumping rate should be stepped back up to its designed rate of 31 gpm and no reduction in pumping rate of the East Landfill Well should occur without prior approval of government parties bull
0
ROUTINE VOLATILE ORGANICS TESTING
LAWSBROOK GP WELL
DATE LAB CONTAIUNANT
91680 DEOE 111 TRICHLOROETHANE TRICHLOROETHYLENE 11 DICHLOROETHANE
121780 GCA 111 TRICHLOROETHANE CHLOROFORM
U29 PRIORITY 11 DICHLOROETHYLENEPOLLUTANTS) TRICHLOROETHYLENE
BENZENE BR9MODICHLORO~lETHANE
21784 AWD 11 DICHLOROETHYLENE 111 TRICHLOROETHANE TRICHLOROETHYLENE
22184 DEOE 11 DICHLOROETHYLENE 111 TRICHLOROETHANE
AID 11 DICHLOROETHYLENE 111 TRICHLOROETHANE TRICHLOROETHYLENE
3984 AWD 11 DICHLOROETHYLENE 111 TRICHLOROETHANE TRICHLOROETHYLENE
31684 AWD 11 DICHLOROETHYLENE 111 TRICHLOROETHANE TRICHLOROETHYLENE
LEVEL OP CONTAMINATION
11 PPB 01
35
25 TRACE TRACE TRACE TRACE
68 096 027
24 lt10
40 084 018
23 043 007
08 071 008
4684 AWD 11 DICHLOROETHYLENE 26
11 DICHLOROETHANE 034 111 TRICHLOROETHANE 17 TRICHLOROETHYLENE 039
t 51084 AWD 11 DICIILOROETHYLEI~E 19 z
11 DICHLOROETHANE 04 Bafl)111 TRICHLOROETHANE 11
TRICHLOROETHYLENE 025 Sa 53184 AWD 11 DICHLOROETHYLENE 20 ~~
11 DICHLOROETHANE 033 t~~ 111 TRICHLOROETHANE 11 TRICHLOROETHYLENE 024 n=
62084 AWD 11 DICHLOROETHYLENE 26 ~ 111 TRICHLOROETHANE 11 TRICHLOROETHYLENE 041
1112984 AfD 11 DICHLOROETHYLENE middot12 TRICHLOROETHYLENE 0081
2
II
COMMENTS ON WR GRACE AQUIFERRESTORATION PROGRAM
March 18 1986
General Corunerts - applicable to aquifer restoration program in
general andor issues which have come up consistently
Maps showing groundwater contours should include middot locations1
of all wells used to develop those contours This could be
accomplished by the use of transparent overlays of contoursMaps of
in ~ombination with a base map with well locations
well locations and maps of contours should be of the same
scale to facilitate comparison
It has also been noted that although contours and pumping
rates have changed between the October and January reports
the capture zone presented (Fig 3-1 Second Ouarterly Report
Fig 2-1 Third Quarterly Report) has not been modified
All water quality tables should include an explanation that2
a blank space indicates that the sample was below the detection
limit if this is the case
Table 2-1 (page 2-2) of the Third Quarterly Report Ground3
and Surface Water Elevations provides no units for the
elevations In future reports all tables and figures must
0 incluae units where appropriate
AccoratQ to Table 2-3 (page 2-11) of the Third Quarterlymiddot 4
Report air stripper efficiency has gone as low as 20 percent
Efforts aust be made to keep the tower performing at itsThe Aquifer
maximua efficiency (design rate of 95 percent)
Restozation system can not be considered a success with
effic5Mlcy below the design rate middotfor extendedmiddot
periods as has
been middottAe case thus far
More ~ent sampling of the air stripper would allow for
more ~ete screening for spikes and would produce
addittoml tower efficiency information Tower influent and
effluart samples should be taken at least twice a month
5 w R Clrace s First Quarterly Report (July 1985) describes
plans to conduct additional investigations in Fort Pond
Brook iia order to ascertmiddotain a more complete understanding
of ~~resence of VDC in the vicinity of FP-5 (page 18)(a) FP-5 resampling
bullTn~ investigations will include and ~lysis of both the groundwater and surface waters at
FP-~ ~rough FP-5 (b) installation of 2 or 3 additional well
p~ into the stream sediments downstream of FP-5 (c)
i~ation of a monitoring well next to FP-5 into the aquifer
IIII
COMMENTS ON WR GRACE AQUIFERRESTORATION PROGRAM
March 18 1986
General Comments - applicable to aquifer restoration program in
general andor issues which have come up consistently
Maps showing groundwater contours should include middot locations1
of all wells used to develop those contours This could be
accomplished by the use of transparent overlays of contoursMaps of
in combination with a base map with well locations
well locations and maps of contours should be of the same
scale to facilitate comparison
It has also been noted that although contours and pumping
rates have changed between the October and January reports
the capture zone presented (Fig 3-1 Second Ouarterly Report
Fig 2-1 Third Quarterly Report) has not been modified
All water quality tables should include an explanation that2
a blaak space indicates that the sample was below the detection
limit if this is the case
Table 2-1 (page 2-2) of the Third Quarterly Report Ground3
and SUrface Water Elevations provides no units for the
eleva~ions In future reports all tables and figures must
include unit~ whera appropriate
Acco~fng to Table 2-3 (page 2-11) of the Third Quarterly4
Reportr air stripper efficiency has gone as low as 20 percent
Efforts must be made to keep the tower performing at itsThe Aquifer
maxtmn efficiency (design rate of 95 percent)
Res~ation system can not be considered a success with
eff~ency below the design rate for extended periods as has
beea the case thus far
More frequent sampling of the air stripper would allow for
more complete screening for spikes and would produce
additional tower efficiency information Tower influent and
efflaent samples should be taken at least twice a month
wR- Graces First Quarterly Report (July 1985) describes5
pla~ to conduct additional investigations in Fort Pond
BroOk in order to ascertain a more complete understanding
of thepresence of VDC in the vicinity of FP-5 (page 18)middot (a) FP-5 resampling
Theseinvestigations will include
and ana-lysis of both the groundwater and surface waters at
through FP-5 (b) installation of 2 or 3 additional wellF~poilts into the stream sediments downstream of FP-5 (c)
inampallation of a monitoring well next to FP-5 into the aquifer
I I
~ I I
-2shy
below the level of the str eambed sediments (10 to 15 feet below the streambed) ~o sample and analyze the groundwater at that location and (d) collection and analysis of samples(s) of the ~treambed sediments for volatile organics particle size gradation and organ i c carbonbull
As of yet no further data has been received relative to this outline bull The government parties request a report on the status of this plan middot
6 Th~ October 1985 Second Quarterly Report (page 1-1) states that bullhydraulically the area of containment is similar to that which was planned Locations where contaminment is slightly less than planned occur near where wells are pumping at rates lower than the planned pumping rates (See Fig 3-1) The inactivity of the West Landfill well reduces the area of influence near the Secondary Lagoon Tight soils at the North Lagoon Gravel Pack Well cause its pumping rate to be low and consequently the northward extent of the zone of influence in the glacial sediments is less than planned (Fig 3-1) All waste sites except the North Lagoon are enclosed within the hydraulic contaminment system Continued observation of water levels and water quality in wells to the north (AR-8 AR-16 AR-17 -AR-23 NL-1 and NL-2) will allow accurate observations about the extent of the containment area to the northbull
0 Currently the North Lagoon and the battery separator chip pile (a potential contributor of contamination to groundwater) are not completely within the containment area It has been noted that pumping rates of wellw other than the West Landfill and North Lagoon Gravel Pack Wells have been consistently lower than designed pumping rates (COM 1984 bullFinal Report on Aquifer Restoration Program Volume III Simulation of Aquifer Restoration Alternatives)~ Specifically the RLF wells rate has been significantly lower than its designed rate of 31 gpm throughout the entire program ~g h~s the WRG-3 well in the Assabet well area (designed rate middot350 gpm) Clarify the reasons for the reduced pumping rates and the effect on containment
7 Despite the position taken by the government parties in the response dated October 10 1985 to Graces First Ouarterly Report on Aquifer Restoration that bull[a) detection limit of 10 ppb is unacceptable since levels from 1-10 ppb are not reportedbull (Comment 2-~7) and despite the position taken by the Division of Water Pollution Control in its letter of May 24 1985 regarding Graces permit that bull[u)nder your discharge permit your limitation is 10 ug1 for Total Volatile Organic Compounds therefore your detection limit of 10 ppb is
= shy
I I
r I I
-3shy
unacceptable (Comment 8) Grace continues to assert that the officially proposed detection limit of 10 ug1 (Fe~ Reg Dec 3 1979) should be used for enforcement of permitsbull (3rd QR pages 2-10 2nd QR pag~s 3-15 GraceCOM Response (11185) o 172J GraceCOM Response (61385) Comment 8) Indeed bullwR Grace and COM have specififed that all analyses performed for permit compliance be middot done with detection limit of 10 ppb (GraceCOM Response (1118gt) Comment 41)
The government parties believe that Graces adherence to the detectiOIJ limit of 10 ppb is unjustified and technically indefensible This artificially high detection limit is capable of masking meaningful results necessary for a full understafing and elimination of the contamination problems associamp~ with the Grace site As Grace is well aware (see Graee letter to EPA and DEOE dated 12685 page 7) EPA has ~ently promulgated final RMCLs and proposed MCLs for a RUEber of volbullt~e organic chemicals including some detec~ at or in the vicinity of the Grace site These are as fGJkMe (SO Fed Reg 46880 et seg _(ll1385)
Final RMCL ~rltlgt(~sed)~~~middot middot hng1 gtmiddotmiddot middot mg11
() Ben~ 0 oos viny1 Moride 0 001 Carbaa~rachloride 0 ~005
12~roethane 0 005 Tricillalethylene 0 005 1-l~roethylene 007 007 1-1-~~hloroethane 20 20
bull75 p-d~benzene bull 75
In e~se tha attainable detection li~it the final P~CL and tbep10posed MCL are well below the 1979 detection limit of lO~o which Grace continues to cling despite the advent of tbe~eral and state superfund statutes and despite several ye~ intervening analytical development Nor is this di~tmiddoton merely one of academic concern the five constituents l~~ve as having RMCLs of zero have been officially foujf~have bullstrong evidence of carcinogenicity (50 Fed R~~)~ rndeed vinyl chloride a contaminant recently da~in the vicinity of the middotAssabet Wells in concentrations ra~frour 14 to 57 ppb (PT well series 3rd OR page 2-7) hasaB described as having documentmiddoted carcinogenic effects inJ ~ (50 Fed Reg at 46886) Further 1-1-dichloroshye~~(bullvocbull) has itself been described as showing equivocal ev~of ~arcinogenicitybull as distinguished from no evidence 6poundCftoqenicitybull (50 Fed Reg at 46886)
middot----shy
I I I I
Moreover it is official EPA policy that a superfund clean-up shall bullattain or exceed applicable or relevant and appropri~te Federal environmental and public health requirementsbull including bullMaximum Contamination Levels (for all sources of drinking water exposure)bull (50 Fed Reg 47946-47949) middot middot
Since the RMCLs state worthwhile attainment goals since the MCLs when finalized will provide enforceablestandards and since the Grace site is listed as a Superfund site there can no longer be any excuse for Grace failing to provide data having a meaningful detection limit A detection limit of 1 ppb for every sampling round from this point forward or at a minimum the Practical Ouantitation Levels established by EPA (50 Fed Reg 46904) must be used by WR Grace
In future reports a detection limit should be listed for each chemical constituent presented
8 Based on the results from Wells R-5 B-9 and AR-15 there continues to be a significant contamination problem in the vicinity of the Mass Broken Stone pit contemplated as the source for additional public drinking water wells This is readily apparent from the following results (1st QR Table 3-3J 2nd OR Table 3-2J 3rd OR Table 2-2)~
Well Date Vbtl22b) vch1l22b) 8enz(22b) I _ R-5 32785 1100
41285 680 570 30 53185 270 60 20 61485 90 30 71785 130 81385 310 50 10 90685 1100 290 30
100885 440 80 20 112085 730 130
B-9(B4) 60785 330 120 10 90685 1000 100 10
120585 650 250 10
AR-15(81) 60785 1100 280 10 90485 2100 250
120385 1300 220
Restoration of this area may have been retarded by the altershyation of the pumping scheme attributed by Grace to the Agway
sitatiDn The Government parties suggest that the Grace resmralion plan be suitably modified to enable accelerated resllloration of the Mass Broken Store area without degradation frm tie Agway site
IIII
-5shy
9 Based on deep level readings from Wells R6 PT-2 and PT-3 there is a significant contamination problem at depth in the immediate vicinity of the Assabet Wells that is not currently
This is read i ly apparen taddressed by Graces recovery wellsfrom the following results (1st OR Table 3-3 2nd OR Tabl es 3-2 3- 4 3rd OR Tables 2-2 2-4)
Well DATE vot(ppb) v thHppb) aenz(pptgt gt
B-6(B5) 32685 120041185 980 58052485 1100 40 62885 1700 560 ~z71085 740 120 3081385 1600 330 20 Bzens90685 1500 420 40 ti middot
100885 1100 220 10
~nPT-2Bl 93085 190 49 3 ==(II (II
120585 200 57 6 (II
PT-3Bl 93085 49 17 1 0n
120585 56 14 ~
0 WR Grace should include this area as part of the restoration program and report to the government how this contamination will be addressed
10 Certain data indicate that Grace continues to experience problems with its treatment system that may adversely affect the quality of Sinking Pond For instance on September 26 1985 the inlet to Sinking Pond showed a VDC concentration of 20 ppb (3rd QR page 2-7) In addition Grace continued to experience bullhigher color turbidity and dissolved iron at ISP in October and November samples bullbullbull bull (Id Inorganic Afaalyses fer Permit Compliance) Gra~A musttake all steps necessary to protect Sinking Pond from itself becoming degraded as a result of the aquifer restoration program and report to the government parties how Sinking Pond will be protected
In addition Graces observation that bull[t]he analytical data that we are aware of from certified laboratories for the Lawsbrook well field show that for more than six years VDC has never b~en above 2 ppbbull (Id Response 17) conflicts with data reported in routine-volatile organic testing conducted by the Acton Water District These data area attached and show that on five different occasions 11-Dichloroetheylene (VDC) was above 20 ppb at the Lawsbrook gravel-packed well
--- -middot -- -~--- - - 6- c_
Although contaminant levels in the Lawsbrook area are currently below d~tection limits we cannot rule out that there is no further potential for contamination by a plume that may be outside of the Grace area of influence and could be migrating
middot towards the LawsbrookFort Pond Brook area bull
Head elevations and water quality data in the area northeast of the WR Grace site would either confirm the existance of a plume in this area and characterize its nature and extent middotor conclusively deny its existence WR Grace should report to the government parties how it will collect and report this information
october middot t isAes middotsPecific middot to middot second middot ouartei1Y middotRePortgt
1 Tables in this report are generally difficult to use because of poor pcint quality GDM should provide replacement copies of the middot followtg from the ~ctober Ouarterly Report Table 3-1 (pages 3-2 thro~ 3-4) and Table 3-4 (pages 3-18 and 3-19)
C)
2 Page 3-l paragraph 4 reads bulltn addition the Northern Lagoon gravel pack wells flow is restricted by tight soils in that area Its flow of 5 gpm results in a small hydraulic - influence in tbe ~acial sediments However the Northern Lagoon Bedrock Well ~ the same location but seventeen feet deeper maintains a flowef 35 gpm It is reasonable to assume that the zone of infl~ middotin the roc~ extends farther to the north than in the overhanfen bull
JanuarY -~es -speclfic - to - the - Third ouarterlY RePort)
1 Page l-l paragraph 2 states that~ bullduring the quarter from Sept~r 22 - December 22 pumpage from each well remain~d stablILbullmiddot This middot statement is contradictory to paragraph four of fe~e page which describes bulltwo events raaulting in do~~ that occurred middot during this quarter middot An eleven day powerutage is described as well as an accident which caused a tMD tD three day shut-down ofmiddot the SLBR and SLGP wells oemiddot~ of the results of the power outage are not provided oe~gmiddot on how many wells were affected there could have beerua s-ignificant impact to the aquifer restoration system The~nment parties reques_t that information regarding whplusmnCh-lls were affected and for what duration be provided Also~~le 1-2 (page 1-5) indicates some significant changes imP~ng rates in the East Landfill well (increased from 10 to28~) and in the South Lagoon gravel pack well (270 to 2UDcQII~ during this quarter
-------------- shy
middot 2
o _ middot
-7~ -
According to the October report bullthe West Landfill Well is not pumping because of OEOEs concern ~egardi~g a reported pesticide dump on abutting (non-Grace) property The principal effect of this wells inactivity is to decrease the area of influence in the vicinity of the Secondary Lagoon relative to that predicted However the Secondary Lagoon is within the contained a~ea and therefore thesystems performance should be as plannedbull
The West Landfill Well is also used to contain contaminants from the WR Grace Landfill Water levels from Table 2-1 of the Third Ouarterly Report indicate that contaminants from the eastern part of the Secondary Lagoon and Graces Landfill may be migrating past the RLF well and towards the Assabet River Therefore the River Landfill pumping rate should be stepped back up to its designed rate of 31 gpm and no reduction in pumping rate of the East Landfill Well should occur without prior approval of government parties bull
0
ROUTINE VOLATILE ORGANICS TESTING
LAWSBROOK GP WELL
DATE LAB CONTAIUNANT
91680 DEOE 111 TRICHLOROETHANE TRICHLOROETHYLENE 11 DICHLOROETHANE
121780 GCA 111 TRICHLOROETHANE CHLOROFORM
U29 PRIORITY 11 DICHLOROETHYLENEPOLLUTANTS) TRICHLOROETHYLENE
BENZENE BR9MODICHLORO~lETHANE
21784 AWD 11 DICHLOROETHYLENE 111 TRICHLOROETHANE TRICHLOROETHYLENE
22184 DEOE 11 DICHLOROETHYLENE 111 TRICHLOROETHANE
AID 11 DICHLOROETHYLENE 111 TRICHLOROETHANE TRICHLOROETHYLENE
3984 AWD 11 DICHLOROETHYLENE 111 TRICHLOROETHANE TRICHLOROETHYLENE
31684 AWD 11 DICHLOROETHYLENE 111 TRICHLOROETHANE TRICHLOROETHYLENE
LEVEL OP CONTAMINATION
11 PPB 01
35
25 TRACE TRACE TRACE TRACE
68 096 027
24 lt10
40 084 018
23 043 007
08 071 008
4684 AWD 11 DICHLOROETHYLENE 26
11 DICHLOROETHANE 034 111 TRICHLOROETHANE 17 TRICHLOROETHYLENE 039
t 51084 AWD 11 DICIILOROETHYLEI~E 19 z
11 DICHLOROETHANE 04 Bafl)111 TRICHLOROETHANE 11
TRICHLOROETHYLENE 025 Sa 53184 AWD 11 DICHLOROETHYLENE 20 ~~
11 DICHLOROETHANE 033 t~~ 111 TRICHLOROETHANE 11 TRICHLOROETHYLENE 024 n=
62084 AWD 11 DICHLOROETHYLENE 26 ~ 111 TRICHLOROETHANE 11 TRICHLOROETHYLENE 041
1112984 AfD 11 DICHLOROETHYLENE middot12 TRICHLOROETHYLENE 0081
2
II
COMMENTS ON WR GRACE AQUIFERRESTORATION PROGRAM
March 18 1986
General Corunerts - applicable to aquifer restoration program in
general andor issues which have come up consistently
Maps showing groundwater contours should include middot locations1
of all wells used to develop those contours This could be
accomplished by the use of transparent overlays of contoursMaps of
in ~ombination with a base map with well locations
well locations and maps of contours should be of the same
scale to facilitate comparison
It has also been noted that although contours and pumping
rates have changed between the October and January reports
the capture zone presented (Fig 3-1 Second Ouarterly Report
Fig 2-1 Third Quarterly Report) has not been modified
All water quality tables should include an explanation that2
a blank space indicates that the sample was below the detection
limit if this is the case
Table 2-1 (page 2-2) of the Third Quarterly Report Ground3
and Surface Water Elevations provides no units for the
elevations In future reports all tables and figures must
0 incluae units where appropriate
AccoratQ to Table 2-3 (page 2-11) of the Third Quarterlymiddot 4
Report air stripper efficiency has gone as low as 20 percent
Efforts aust be made to keep the tower performing at itsThe Aquifer
maximua efficiency (design rate of 95 percent)
Restozation system can not be considered a success with
effic5Mlcy below the design rate middotfor extendedmiddot
periods as has
been middottAe case thus far
More ~ent sampling of the air stripper would allow for
more ~ete screening for spikes and would produce
addittoml tower efficiency information Tower influent and
effluart samples should be taken at least twice a month
5 w R Clrace s First Quarterly Report (July 1985) describes
plans to conduct additional investigations in Fort Pond
Brook iia order to ascertmiddotain a more complete understanding
of ~~resence of VDC in the vicinity of FP-5 (page 18)(a) FP-5 resampling
bullTn~ investigations will include and ~lysis of both the groundwater and surface waters at
FP-~ ~rough FP-5 (b) installation of 2 or 3 additional well
p~ into the stream sediments downstream of FP-5 (c)
i~ation of a monitoring well next to FP-5 into the aquifer
I I
r I I
-3shy
unacceptable (Comment 8) Grace continues to assert that the officially proposed detection limit of 10 ug1 (Fe~ Reg Dec 3 1979) should be used for enforcement of permitsbull (3rd QR pages 2-10 2nd QR pag~s 3-15 GraceCOM Response (11185) o 172J GraceCOM Response (61385) Comment 8) Indeed bullwR Grace and COM have specififed that all analyses performed for permit compliance be middot done with detection limit of 10 ppb (GraceCOM Response (1118gt) Comment 41)
The government parties believe that Graces adherence to the detectiOIJ limit of 10 ppb is unjustified and technically indefensible This artificially high detection limit is capable of masking meaningful results necessary for a full understafing and elimination of the contamination problems associamp~ with the Grace site As Grace is well aware (see Graee letter to EPA and DEOE dated 12685 page 7) EPA has ~ently promulgated final RMCLs and proposed MCLs for a RUEber of volbullt~e organic chemicals including some detec~ at or in the vicinity of the Grace site These are as fGJkMe (SO Fed Reg 46880 et seg _(ll1385)
Final RMCL ~rltlgt(~sed)~~~middot middot hng1 gtmiddotmiddot middot mg11
() Ben~ 0 oos viny1 Moride 0 001 Carbaa~rachloride 0 ~005
12~roethane 0 005 Tricillalethylene 0 005 1-l~roethylene 007 007 1-1-~~hloroethane 20 20
bull75 p-d~benzene bull 75
In e~se tha attainable detection li~it the final P~CL and tbep10posed MCL are well below the 1979 detection limit of lO~o which Grace continues to cling despite the advent of tbe~eral and state superfund statutes and despite several ye~ intervening analytical development Nor is this di~tmiddoton merely one of academic concern the five constituents l~~ve as having RMCLs of zero have been officially foujf~have bullstrong evidence of carcinogenicity (50 Fed R~~)~ rndeed vinyl chloride a contaminant recently da~in the vicinity of the middotAssabet Wells in concentrations ra~frour 14 to 57 ppb (PT well series 3rd OR page 2-7) hasaB described as having documentmiddoted carcinogenic effects inJ ~ (50 Fed Reg at 46886) Further 1-1-dichloroshye~~(bullvocbull) has itself been described as showing equivocal ev~of ~arcinogenicitybull as distinguished from no evidence 6poundCftoqenicitybull (50 Fed Reg at 46886)
middot----shy
I I I I
Moreover it is official EPA policy that a superfund clean-up shall bullattain or exceed applicable or relevant and appropri~te Federal environmental and public health requirementsbull including bullMaximum Contamination Levels (for all sources of drinking water exposure)bull (50 Fed Reg 47946-47949) middot middot
Since the RMCLs state worthwhile attainment goals since the MCLs when finalized will provide enforceablestandards and since the Grace site is listed as a Superfund site there can no longer be any excuse for Grace failing to provide data having a meaningful detection limit A detection limit of 1 ppb for every sampling round from this point forward or at a minimum the Practical Ouantitation Levels established by EPA (50 Fed Reg 46904) must be used by WR Grace
In future reports a detection limit should be listed for each chemical constituent presented
8 Based on the results from Wells R-5 B-9 and AR-15 there continues to be a significant contamination problem in the vicinity of the Mass Broken Stone pit contemplated as the source for additional public drinking water wells This is readily apparent from the following results (1st QR Table 3-3J 2nd OR Table 3-2J 3rd OR Table 2-2)~
Well Date Vbtl22b) vch1l22b) 8enz(22b) I _ R-5 32785 1100
41285 680 570 30 53185 270 60 20 61485 90 30 71785 130 81385 310 50 10 90685 1100 290 30
100885 440 80 20 112085 730 130
B-9(B4) 60785 330 120 10 90685 1000 100 10
120585 650 250 10
AR-15(81) 60785 1100 280 10 90485 2100 250
120385 1300 220
Restoration of this area may have been retarded by the altershyation of the pumping scheme attributed by Grace to the Agway
sitatiDn The Government parties suggest that the Grace resmralion plan be suitably modified to enable accelerated resllloration of the Mass Broken Store area without degradation frm tie Agway site
IIII
-5shy
9 Based on deep level readings from Wells R6 PT-2 and PT-3 there is a significant contamination problem at depth in the immediate vicinity of the Assabet Wells that is not currently
This is read i ly apparen taddressed by Graces recovery wellsfrom the following results (1st OR Table 3-3 2nd OR Tabl es 3-2 3- 4 3rd OR Tables 2-2 2-4)
Well DATE vot(ppb) v thHppb) aenz(pptgt gt
B-6(B5) 32685 120041185 980 58052485 1100 40 62885 1700 560 ~z71085 740 120 3081385 1600 330 20 Bzens90685 1500 420 40 ti middot
100885 1100 220 10
~nPT-2Bl 93085 190 49 3 ==(II (II
120585 200 57 6 (II
PT-3Bl 93085 49 17 1 0n
120585 56 14 ~
0 WR Grace should include this area as part of the restoration program and report to the government how this contamination will be addressed
10 Certain data indicate that Grace continues to experience problems with its treatment system that may adversely affect the quality of Sinking Pond For instance on September 26 1985 the inlet to Sinking Pond showed a VDC concentration of 20 ppb (3rd QR page 2-7) In addition Grace continued to experience bullhigher color turbidity and dissolved iron at ISP in October and November samples bullbullbull bull (Id Inorganic Afaalyses fer Permit Compliance) Gra~A musttake all steps necessary to protect Sinking Pond from itself becoming degraded as a result of the aquifer restoration program and report to the government parties how Sinking Pond will be protected
In addition Graces observation that bull[t]he analytical data that we are aware of from certified laboratories for the Lawsbrook well field show that for more than six years VDC has never b~en above 2 ppbbull (Id Response 17) conflicts with data reported in routine-volatile organic testing conducted by the Acton Water District These data area attached and show that on five different occasions 11-Dichloroetheylene (VDC) was above 20 ppb at the Lawsbrook gravel-packed well
--- -middot -- -~--- - - 6- c_
Although contaminant levels in the Lawsbrook area are currently below d~tection limits we cannot rule out that there is no further potential for contamination by a plume that may be outside of the Grace area of influence and could be migrating
middot towards the LawsbrookFort Pond Brook area bull
Head elevations and water quality data in the area northeast of the WR Grace site would either confirm the existance of a plume in this area and characterize its nature and extent middotor conclusively deny its existence WR Grace should report to the government parties how it will collect and report this information
october middot t isAes middotsPecific middot to middot second middot ouartei1Y middotRePortgt
1 Tables in this report are generally difficult to use because of poor pcint quality GDM should provide replacement copies of the middot followtg from the ~ctober Ouarterly Report Table 3-1 (pages 3-2 thro~ 3-4) and Table 3-4 (pages 3-18 and 3-19)
C)
2 Page 3-l paragraph 4 reads bulltn addition the Northern Lagoon gravel pack wells flow is restricted by tight soils in that area Its flow of 5 gpm results in a small hydraulic - influence in tbe ~acial sediments However the Northern Lagoon Bedrock Well ~ the same location but seventeen feet deeper maintains a flowef 35 gpm It is reasonable to assume that the zone of infl~ middotin the roc~ extends farther to the north than in the overhanfen bull
JanuarY -~es -speclfic - to - the - Third ouarterlY RePort)
1 Page l-l paragraph 2 states that~ bullduring the quarter from Sept~r 22 - December 22 pumpage from each well remain~d stablILbullmiddot This middot statement is contradictory to paragraph four of fe~e page which describes bulltwo events raaulting in do~~ that occurred middot during this quarter middot An eleven day powerutage is described as well as an accident which caused a tMD tD three day shut-down ofmiddot the SLBR and SLGP wells oemiddot~ of the results of the power outage are not provided oe~gmiddot on how many wells were affected there could have beerua s-ignificant impact to the aquifer restoration system The~nment parties reques_t that information regarding whplusmnCh-lls were affected and for what duration be provided Also~~le 1-2 (page 1-5) indicates some significant changes imP~ng rates in the East Landfill well (increased from 10 to28~) and in the South Lagoon gravel pack well (270 to 2UDcQII~ during this quarter
-------------- shy
middot 2
o _ middot
-7~ -
According to the October report bullthe West Landfill Well is not pumping because of OEOEs concern ~egardi~g a reported pesticide dump on abutting (non-Grace) property The principal effect of this wells inactivity is to decrease the area of influence in the vicinity of the Secondary Lagoon relative to that predicted However the Secondary Lagoon is within the contained a~ea and therefore thesystems performance should be as plannedbull
The West Landfill Well is also used to contain contaminants from the WR Grace Landfill Water levels from Table 2-1 of the Third Ouarterly Report indicate that contaminants from the eastern part of the Secondary Lagoon and Graces Landfill may be migrating past the RLF well and towards the Assabet River Therefore the River Landfill pumping rate should be stepped back up to its designed rate of 31 gpm and no reduction in pumping rate of the East Landfill Well should occur without prior approval of government parties bull
0
ROUTINE VOLATILE ORGANICS TESTING
LAWSBROOK GP WELL
DATE LAB CONTAIUNANT
91680 DEOE 111 TRICHLOROETHANE TRICHLOROETHYLENE 11 DICHLOROETHANE
121780 GCA 111 TRICHLOROETHANE CHLOROFORM
U29 PRIORITY 11 DICHLOROETHYLENEPOLLUTANTS) TRICHLOROETHYLENE
BENZENE BR9MODICHLORO~lETHANE
21784 AWD 11 DICHLOROETHYLENE 111 TRICHLOROETHANE TRICHLOROETHYLENE
22184 DEOE 11 DICHLOROETHYLENE 111 TRICHLOROETHANE
AID 11 DICHLOROETHYLENE 111 TRICHLOROETHANE TRICHLOROETHYLENE
3984 AWD 11 DICHLOROETHYLENE 111 TRICHLOROETHANE TRICHLOROETHYLENE
31684 AWD 11 DICHLOROETHYLENE 111 TRICHLOROETHANE TRICHLOROETHYLENE
LEVEL OP CONTAMINATION
11 PPB 01
35
25 TRACE TRACE TRACE TRACE
68 096 027
24 lt10
40 084 018
23 043 007
08 071 008
4684 AWD 11 DICHLOROETHYLENE 26
11 DICHLOROETHANE 034 111 TRICHLOROETHANE 17 TRICHLOROETHYLENE 039
t 51084 AWD 11 DICIILOROETHYLEI~E 19 z
11 DICHLOROETHANE 04 Bafl)111 TRICHLOROETHANE 11
TRICHLOROETHYLENE 025 Sa 53184 AWD 11 DICHLOROETHYLENE 20 ~~
11 DICHLOROETHANE 033 t~~ 111 TRICHLOROETHANE 11 TRICHLOROETHYLENE 024 n=
62084 AWD 11 DICHLOROETHYLENE 26 ~ 111 TRICHLOROETHANE 11 TRICHLOROETHYLENE 041
1112984 AfD 11 DICHLOROETHYLENE middot12 TRICHLOROETHYLENE 0081
2
II
COMMENTS ON WR GRACE AQUIFERRESTORATION PROGRAM
March 18 1986
General Corunerts - applicable to aquifer restoration program in
general andor issues which have come up consistently
Maps showing groundwater contours should include middot locations1
of all wells used to develop those contours This could be
accomplished by the use of transparent overlays of contoursMaps of
in ~ombination with a base map with well locations
well locations and maps of contours should be of the same
scale to facilitate comparison
It has also been noted that although contours and pumping
rates have changed between the October and January reports
the capture zone presented (Fig 3-1 Second Ouarterly Report
Fig 2-1 Third Quarterly Report) has not been modified
All water quality tables should include an explanation that2
a blank space indicates that the sample was below the detection
limit if this is the case
Table 2-1 (page 2-2) of the Third Quarterly Report Ground3
and Surface Water Elevations provides no units for the
elevations In future reports all tables and figures must
0 incluae units where appropriate
AccoratQ to Table 2-3 (page 2-11) of the Third Quarterlymiddot 4
Report air stripper efficiency has gone as low as 20 percent
Efforts aust be made to keep the tower performing at itsThe Aquifer
maximua efficiency (design rate of 95 percent)
Restozation system can not be considered a success with
effic5Mlcy below the design rate middotfor extendedmiddot
periods as has
been middottAe case thus far
More ~ent sampling of the air stripper would allow for
more ~ete screening for spikes and would produce
addittoml tower efficiency information Tower influent and
effluart samples should be taken at least twice a month
5 w R Clrace s First Quarterly Report (July 1985) describes
plans to conduct additional investigations in Fort Pond
Brook iia order to ascertmiddotain a more complete understanding
of ~~resence of VDC in the vicinity of FP-5 (page 18)(a) FP-5 resampling
bullTn~ investigations will include and ~lysis of both the groundwater and surface waters at
FP-~ ~rough FP-5 (b) installation of 2 or 3 additional well
p~ into the stream sediments downstream of FP-5 (c)
i~ation of a monitoring well next to FP-5 into the aquifer
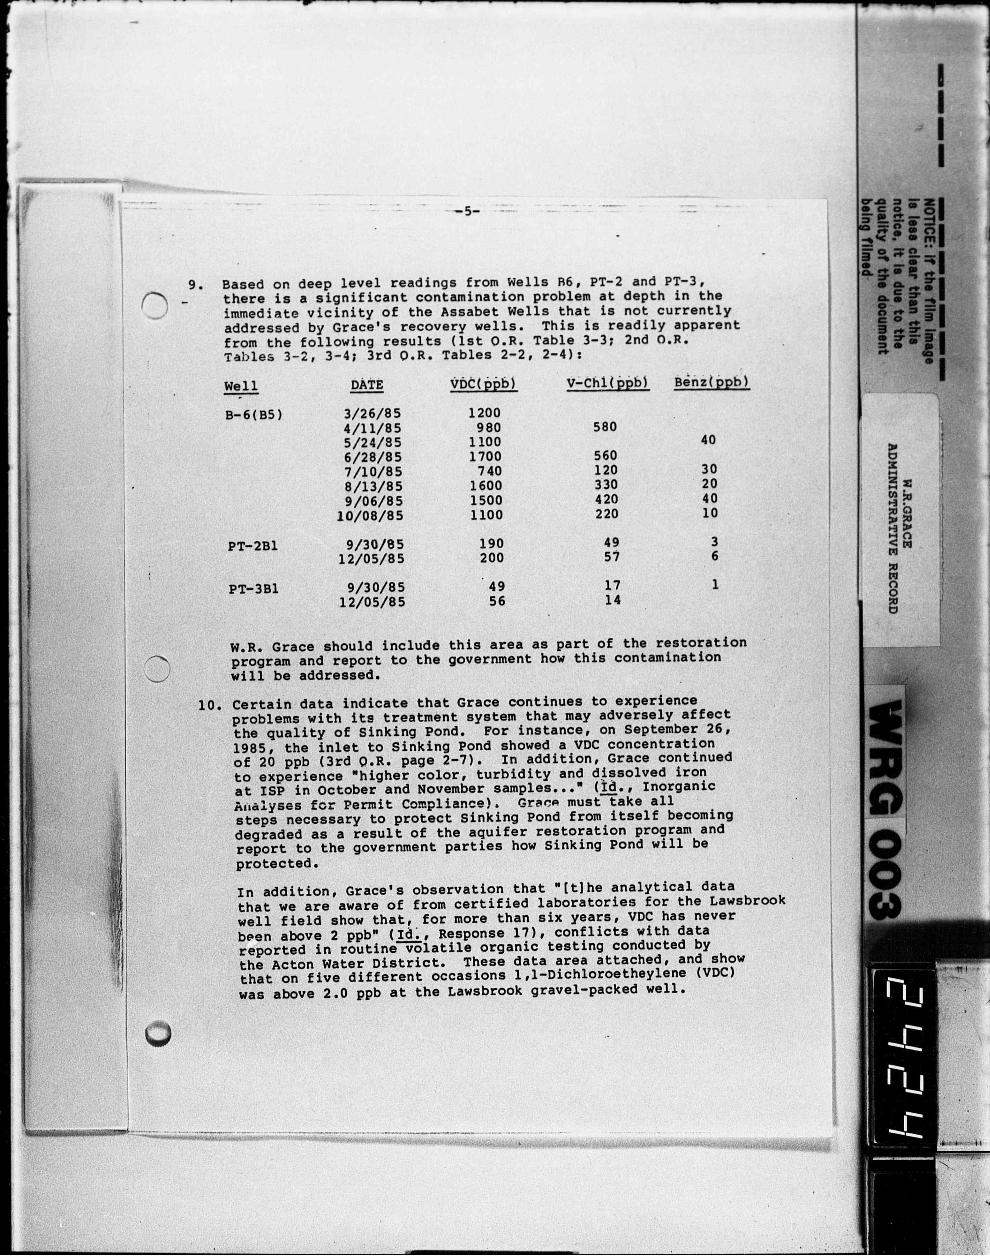
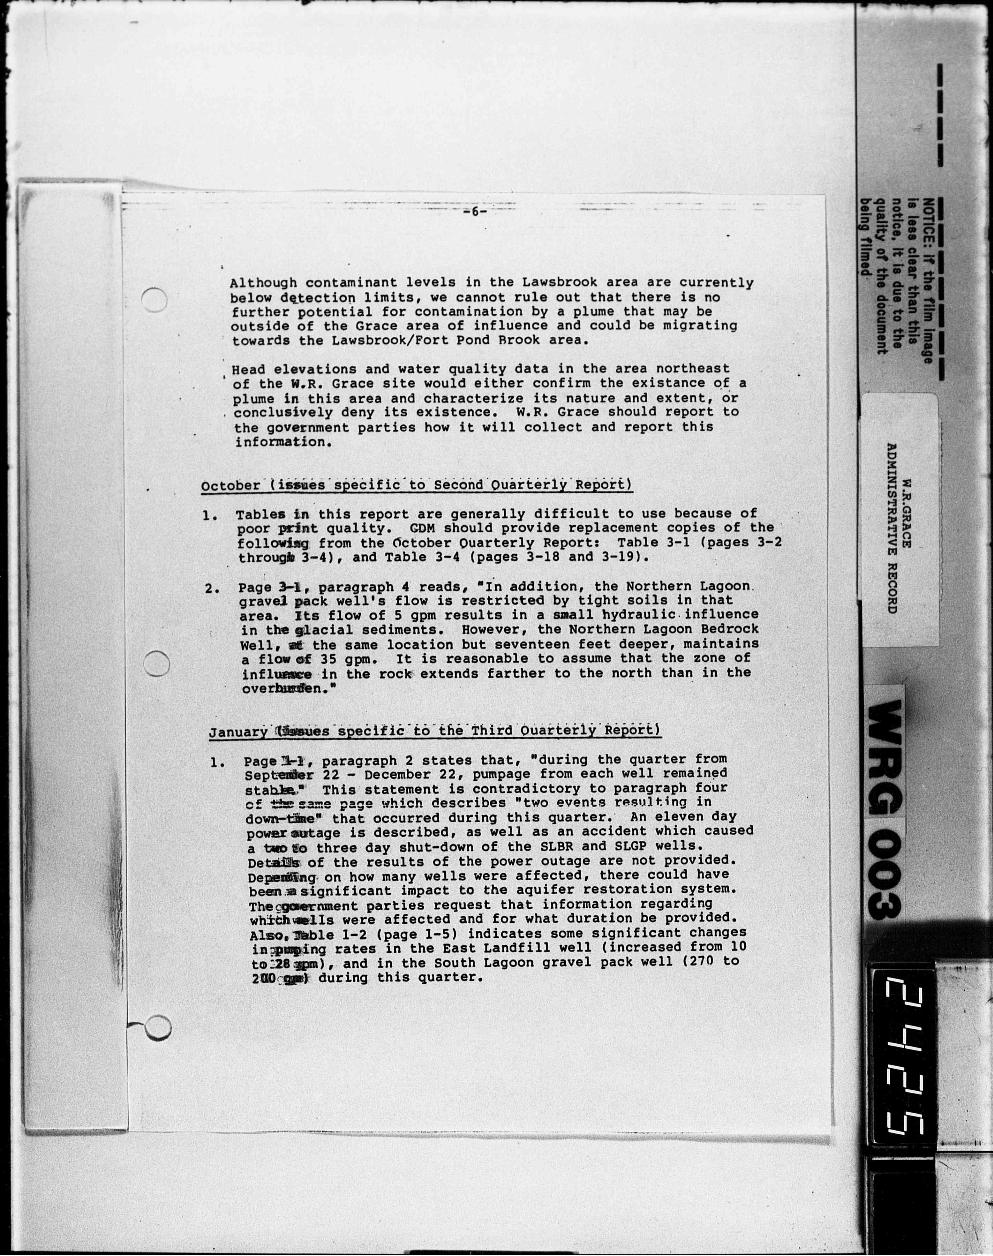
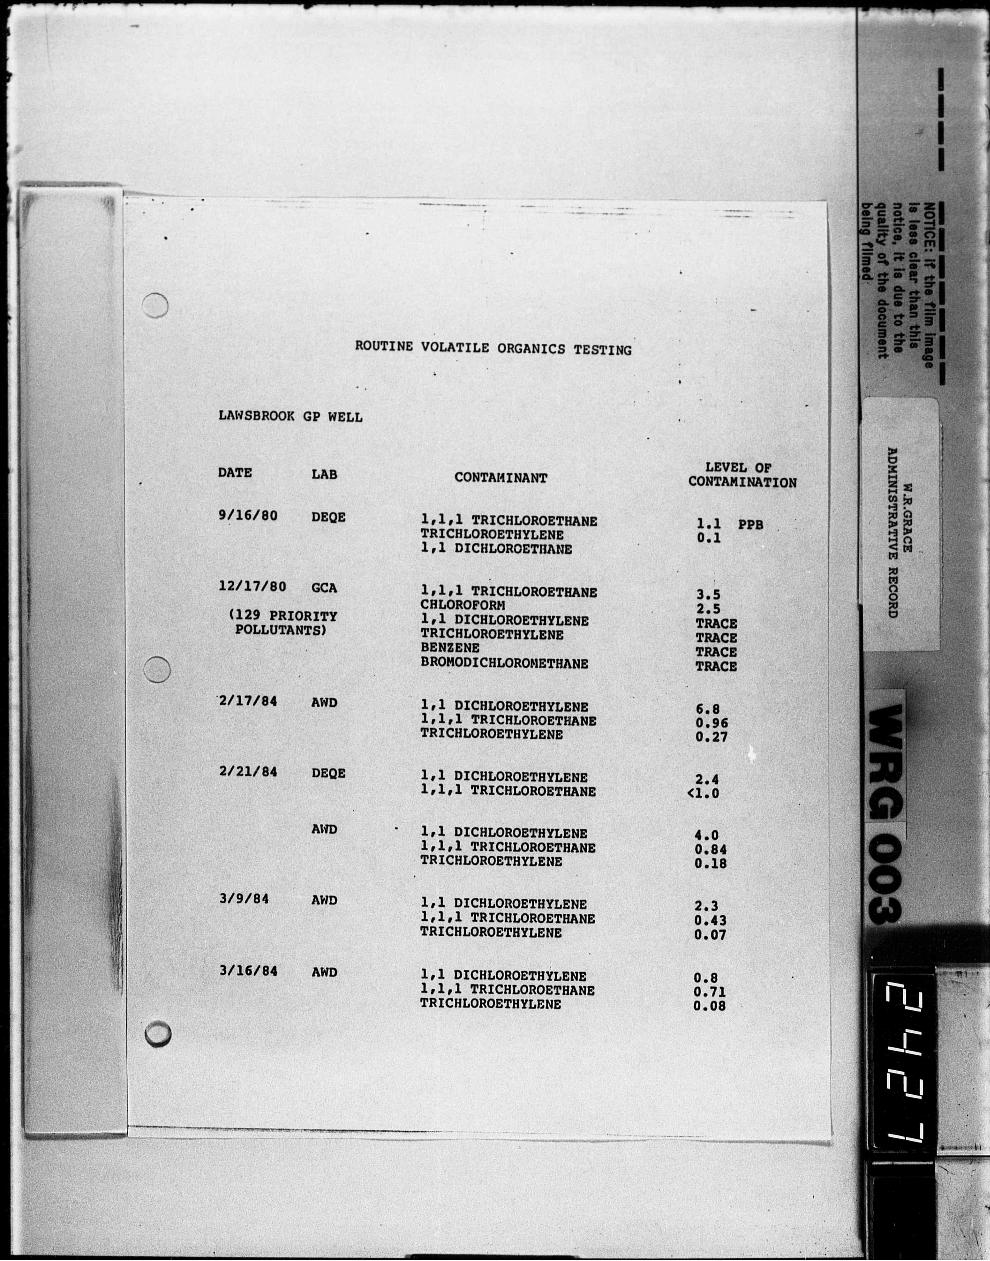
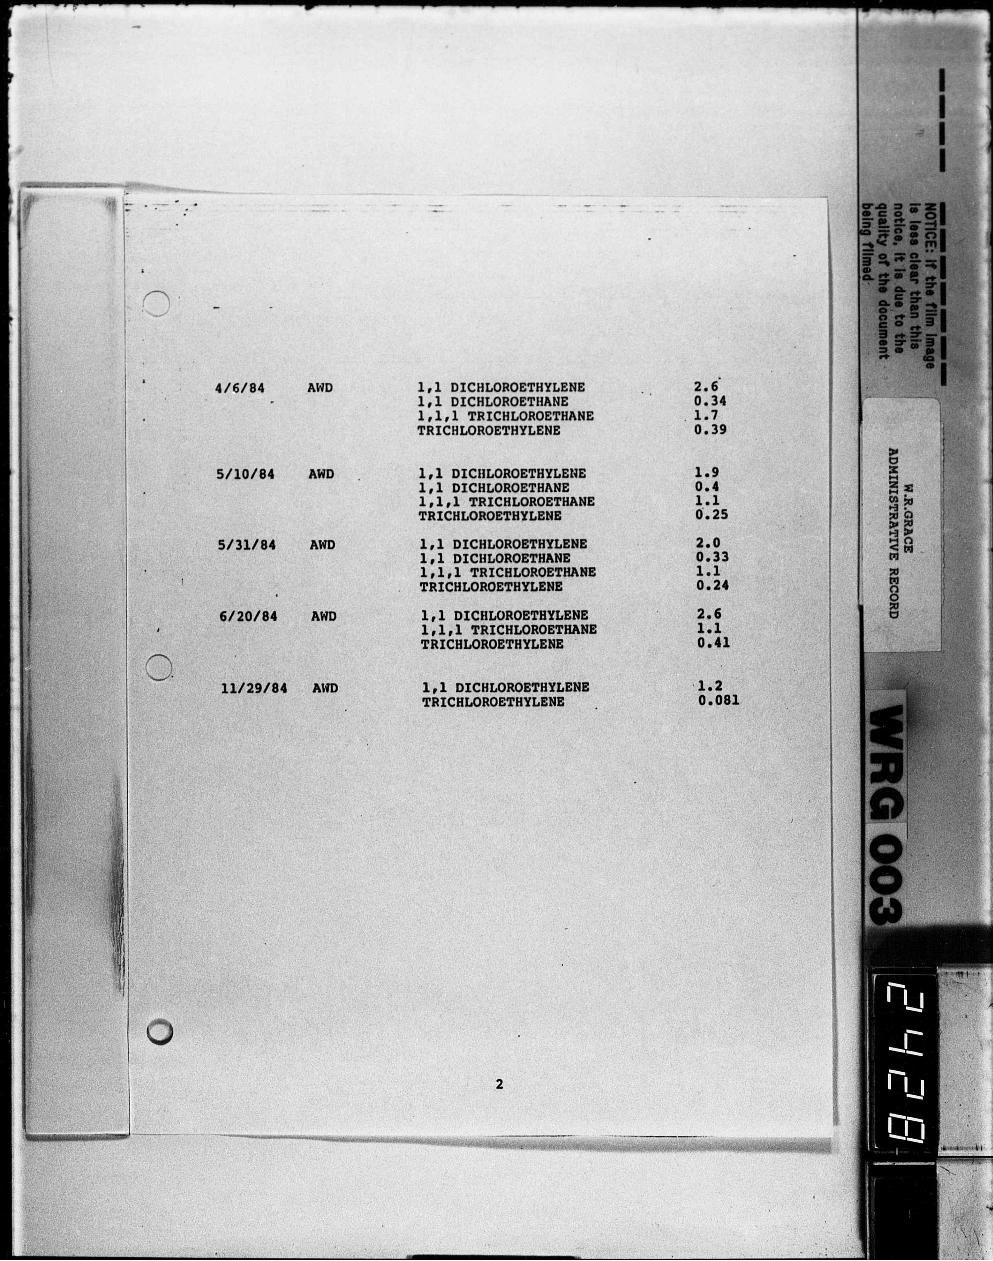
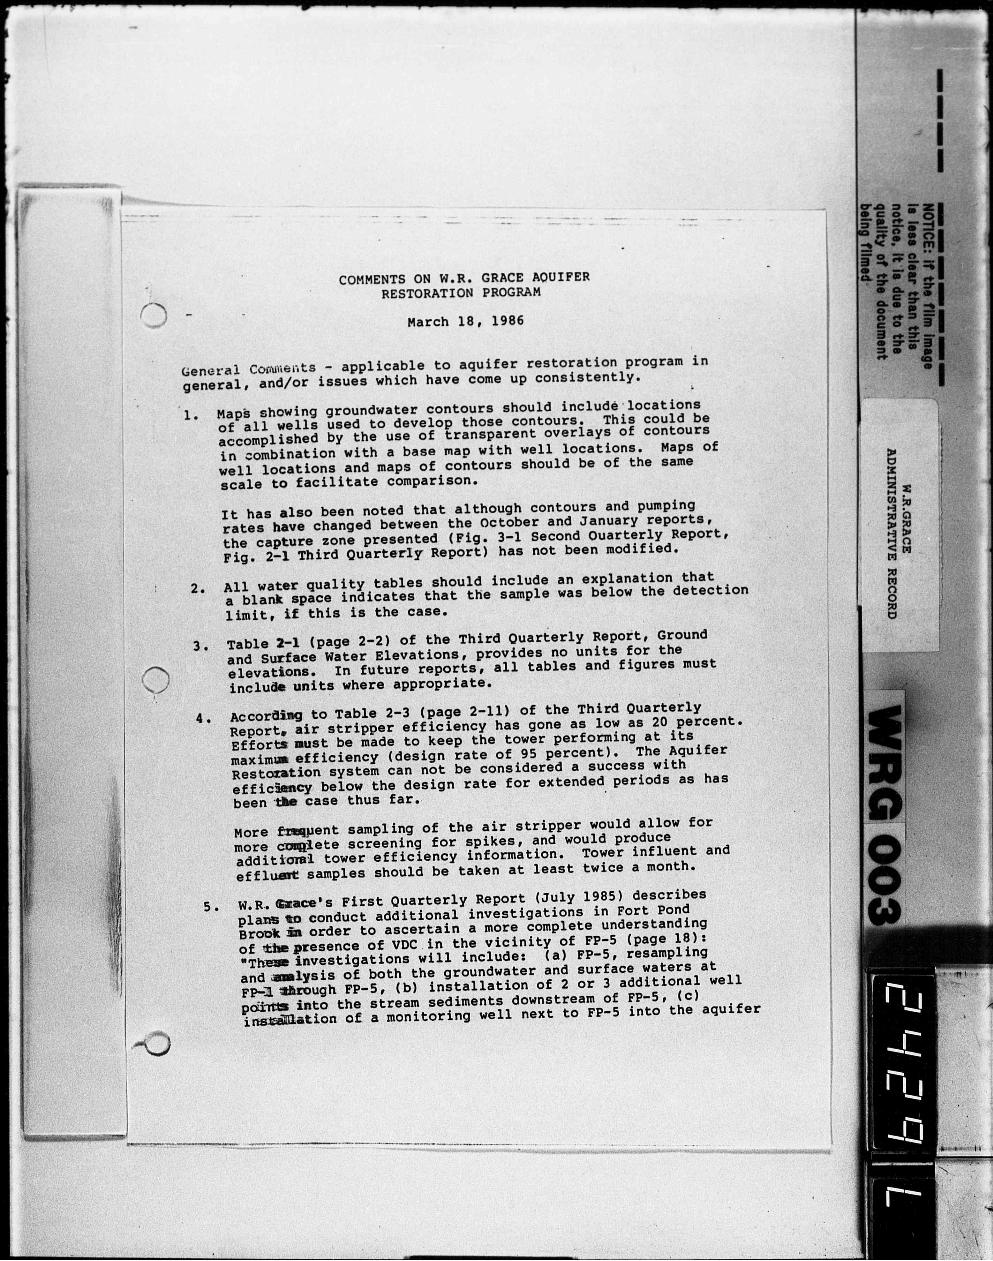