Embed Size (px)
Citation preview
United Bank LimitedCONSOLIDATED FINANCIAL STATEMENTS
AS AT DECEMBER 31, 2019
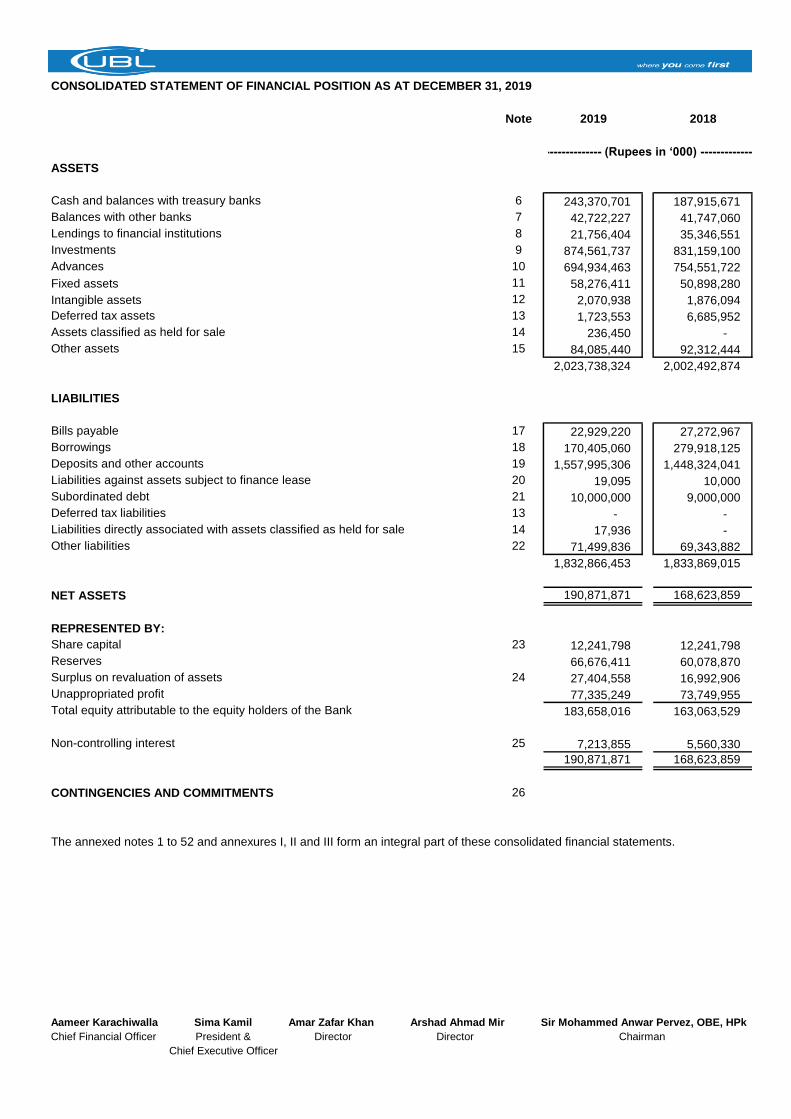
CONSOLIDATED STATEMENT OF FINANCIAL POSITION AS AT DECEMBER 31, 2019
Note 2019 2018
ASSETS
Cash and balances with treasury banks 6 243,370,701 187,915,671
Balances with other banks 7 42,722,227 41,747,060
Lendings to financial institutions 8 21,756,404 35,346,551
Investments 9 874,561,737 831,159,100
Advances 10 694,934,463 754,551,722
Fixed assets 11 58,276,411 50,898,280
Intangible assets 12 2,070,938 1,876,094
Deferred tax assets 13 1,723,553 6,685,952
Assets classified as held for sale 14 236,450 -
Other assets 15 84,085,440 92,312,444
2,023,738,324 2,002,492,874
LIABILITIES
Bills payable 17 22,929,220 27,272,967
Borrowings 18 170,405,060 279,918,125
Deposits and other accounts 19 1,557,995,306 1,448,324,041
Liabilities against assets subject to finance lease 20 19,095 10,000
Subordinated debt 21 10,000,000 9,000,000
Deferred tax liabilities 13 - -
Liabilities directly associated with assets classified as held for sale 14 17,936 -
Other liabilities 22 71,499,836 69,343,882
1,832,866,453 1,833,869,015
NET ASSETS 190,871,871 168,623,859
REPRESENTED BY:
Share capital 23 12,241,798 12,241,798
Reserves 66,676,411 60,078,870
Surplus on revaluation of assets 24 27,404,558 16,992,906
Unappropriated profit 77,335,249 73,749,955
Total equity attributable to the equity holders of the Bank 183,658,016 163,063,529
Non-controlling interest 25 7,213,855 5,560,330
190,871,871 168,623,859
CONTINGENCIES AND COMMITMENTS 26
The annexed notes 1 to 52 and annexures I, II and III form an integral part of these consolidated financial statements.
Aameer Karachiwalla Sima Kamil Amar Zafar Khan Arshad Ahmad Mir Sir Mohammed Anwar Pervez, OBE, HPk
Chief Financial Officer President & Director Director Chairman
Chief Executive Officer
------------------------------------------ (Rupees in ‘000) ------------------------------------------
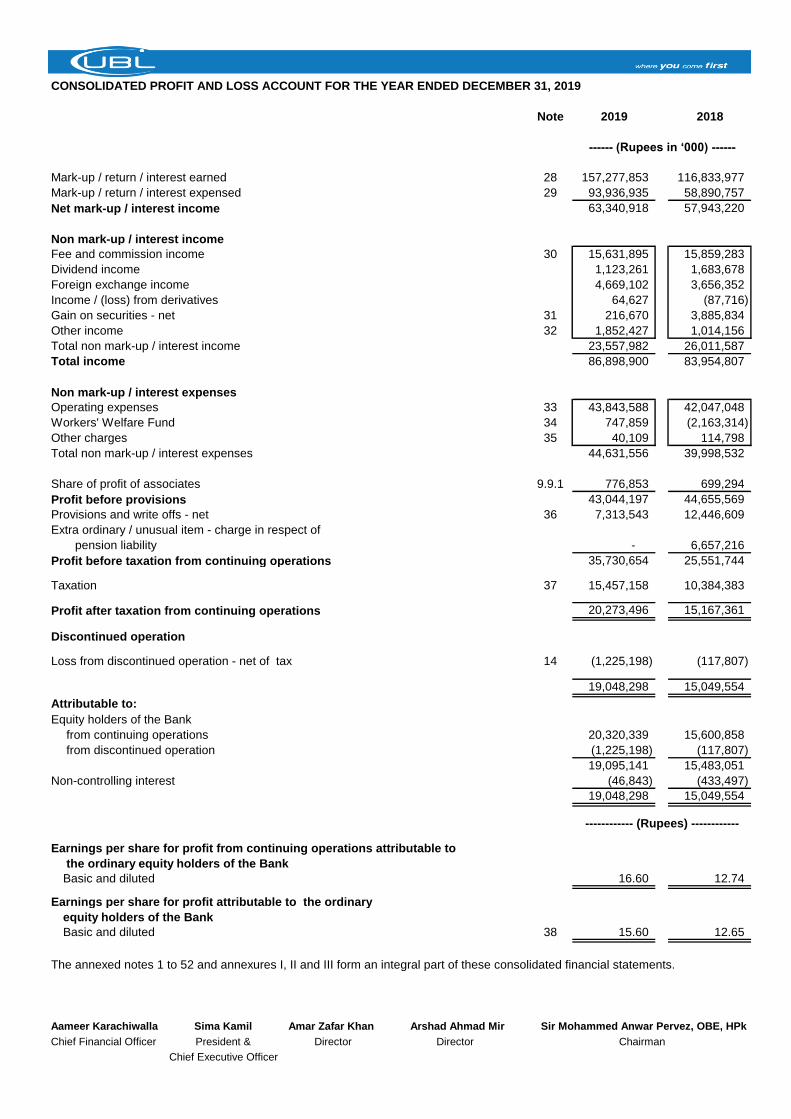
CONSOLIDATED PROFIT AND LOSS ACCOUNT FOR THE YEAR ENDED DECEMBER 31, 2019
Note 2019 2018
Mark-up / return / interest earned 28 157,277,853 116,833,977
Mark-up / return / interest expensed 29 93,936,935 58,890,757
Net mark-up / interest income 63,340,918 57,943,220
Non mark-up / interest income
Fee and commission income 30 15,631,895 15,859,283
Dividend income 1,123,261 1,683,678
Foreign exchange income 4,669,102 3,656,352
Income / (loss) from derivatives 64,627 (87,716)
Gain on securities - net 31 216,670 3,885,834
Other income 32 1,852,427 1,014,156
Total non mark-up / interest income 23,557,982 26,011,587
Total income 86,898,900 83,954,807
Non mark-up / interest expenses
Operating expenses 33 43,843,588 42,047,048
Workers' Welfare Fund 34 747,859 (2,163,314)
Other charges 35 40,109 114,798
Total non mark-up / interest expenses 44,631,556 39,998,532
Share of profit of associates 9.9.1 776,853 699,294
Profit before provisions 43,044,197 44,655,569
Provisions and write offs - net 36 7,313,543 12,446,609
Extra ordinary / unusual item - charge in respect of
pension liability - 6,657,216
Profit before taxation from continuing operations 35,730,654 25,551,744
Taxation 37 15,457,158 10,384,383
Profit after taxation from continuing operations 20,273,496 15,167,361
Discontinued operation
Loss from discontinued operation - net of tax 14 (1,225,198) (117,807)
19,048,298 15,049,554
Attributable to:
Equity holders of the Bank
from continuing operations 20,320,339 15,600,858
from discontinued operation (1,225,198) (117,807)
19,095,141 15,483,051
Non-controlling interest (46,843) (433,497)
19,048,298 15,049,554
Earnings per share for profit from continuing operations attributable to
the ordinary equity holders of the Bank
Basic and diluted 16.60 12.74
Earnings per share for profit attributable to the ordinary
equity holders of the Bank
Basic and diluted 38 15.60 12.65
The annexed notes 1 to 52 and annexures I, II and III form an integral part of these consolidated financial statements.
Aameer Karachiwalla Sima Kamil Amar Zafar Khan Arshad Ahmad Mir Sir Mohammed Anwar Pervez, OBE, HPk
Chief Financial Officer President & Director Director Chairman
Chief Executive Officer
------ (Rupees in ‘000) ------
------------ (Rupees) ------------
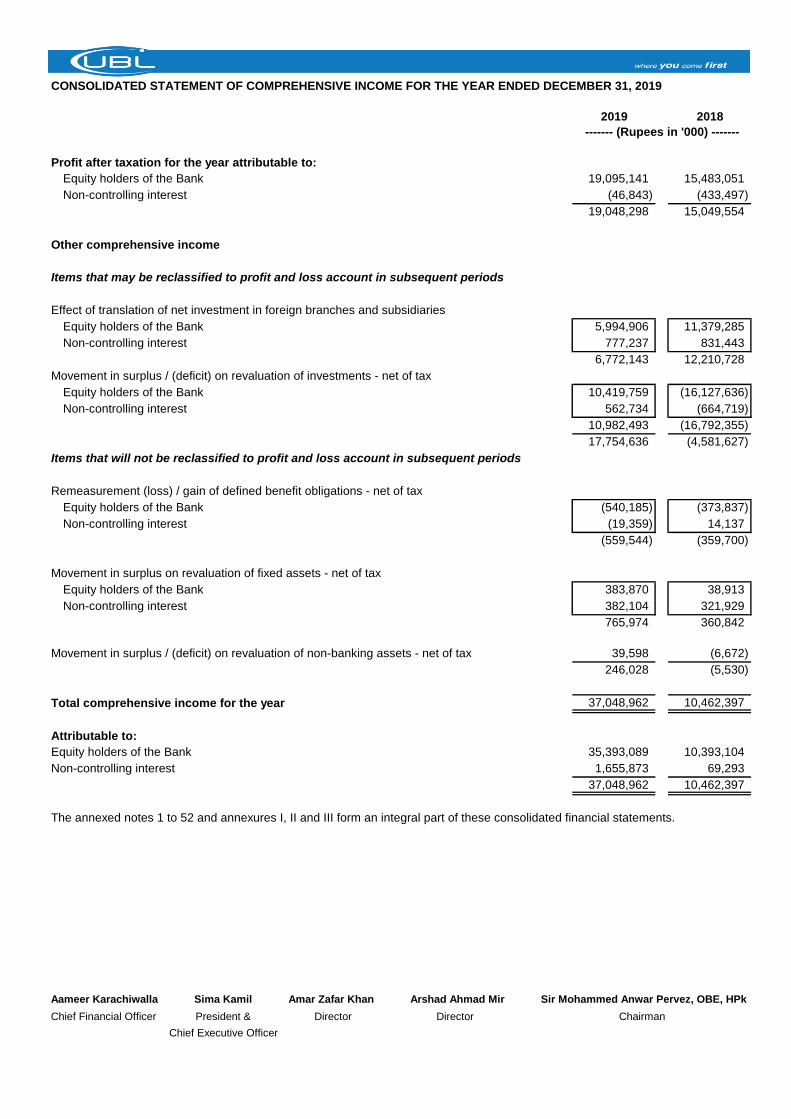
CONSOLIDATED STATEMENT OF COMPREHENSIVE INCOME FOR THE YEAR ENDED DECEMBER 31, 2019
2019 2018
Profit after taxation for the year attributable to:
Equity holders of the Bank 19,095,141 15,483,051
Non-controlling interest (46,843) (433,497)
19,048,298 15,049,554
Other comprehensive income
Items that may be reclassified to profit and loss account in subsequent periods
Effect of translation of net investment in foreign branches and subsidiaries
Equity holders of the Bank 5,994,906 11,379,285
Non-controlling interest 777,237 831,443
6,772,143 12,210,728
Movement in surplus / (deficit) on revaluation of investments - net of tax
Equity holders of the Bank 10,419,759 (16,127,636)
Non-controlling interest 562,734 (664,719)
10,982,493 (16,792,355)
17,754,636 (4,581,627)
Items that will not be reclassified to profit and loss account in subsequent periods
Remeasurement (loss) / gain of defined benefit obligations - net of tax
Equity holders of the Bank (540,185) (373,837)
Non-controlling interest (19,359) 14,137
(559,544) (359,700)
Movement in surplus on revaluation of fixed assets - net of tax
Equity holders of the Bank 383,870 38,913
Non-controlling interest 382,104 321,929
765,974 360,842
Movement in surplus / (deficit) on revaluation of non-banking assets - net of tax 39,598 (6,672)
246,028 (5,530)
Total comprehensive income for the year 37,048,962 10,462,397
Attributable to:
Equity holders of the Bank 35,393,089 10,393,104
Non-controlling interest 1,655,873 69,293
37,048,962 10,462,397
The annexed notes 1 to 52 and annexures I, II and III form an integral part of these consolidated financial statements.
Aameer Karachiwalla Sima Kamil Amar Zafar Khan Arshad Ahmad Mir Sir Mohammed Anwar Pervez, OBE, HPk
Chief Financial Officer President & Director Director Chairman
Chief Executive Officer
------- (Rupees in '000) -------
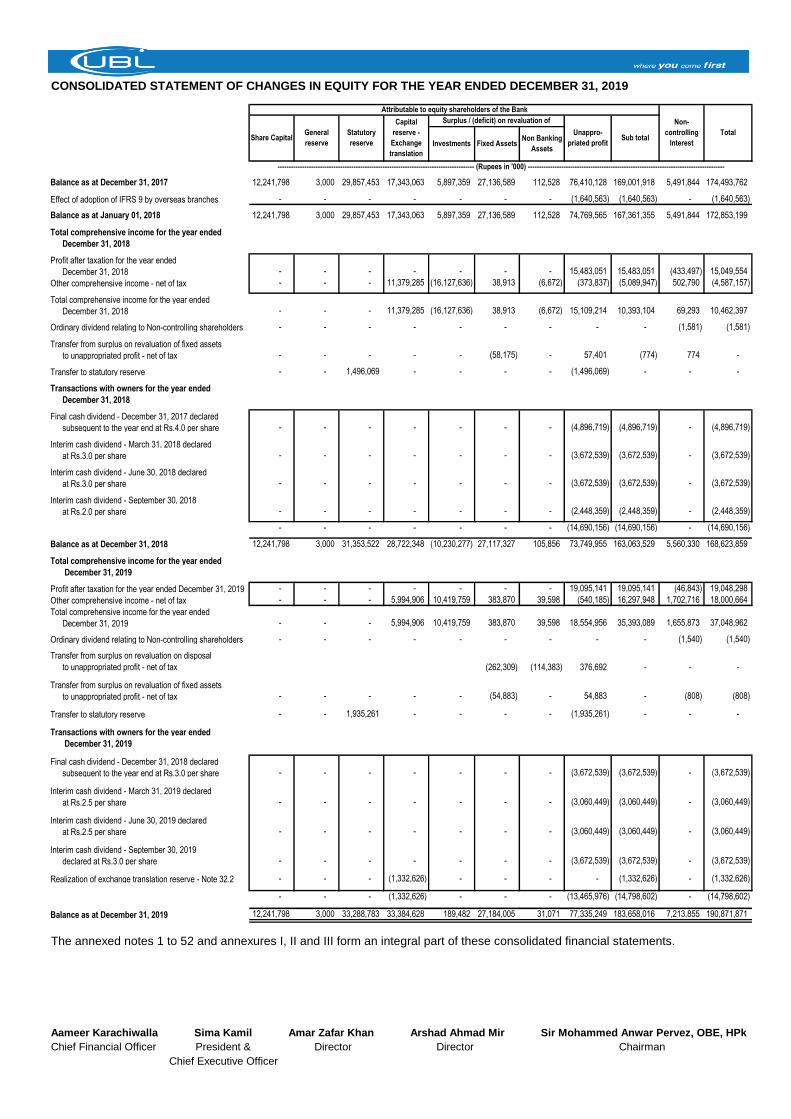
CONSOLIDATED STATEMENT OF CHANGES IN EQUITY FOR THE YEAR ENDED DECEMBER 31, 2019
Balance as at December 31, 2017 12,241,798 3,000 29,857,453 17,343,063 5,897,359 27,136,589 112,528 76,410,128 169,001,918 5,491,844 174,493,762
Effect of adoption of IFRS 9 by overseas branches - - - - - - - (1,640,563) (1,640,563) - (1,640,563)
Balance as at January 01, 2018 12,241,798 3,000 29,857,453 17,343,063 5,897,359 27,136,589 112,528 74,769,565 167,361,355 5,491,844 172,853,199
Total comprehensive income for the year ended
December 31, 2018
Profit after taxation for the year ended
December 31, 2018 - - - - - - - 15,483,051 15,483,051 (433,497) 15,049,554
Other comprehensive income - net of tax - - - 11,379,285 (16,127,636) 38,913 (6,672) (373,837) (5,089,947) 502,790 (4,587,157)
Total comprehensive income for the year ended
December 31, 2018 - - - 11,379,285 (16,127,636) 38,913 (6,672) 15,109,214 10,393,104 69,293 10,462,397
Ordinary dividend relating to Non-controlling shareholders - - - - - - - - - (1,581) (1,581)
Transfer from surplus on revaluation of fixed assets
to unappropriated profit - net of tax - - - - - (58,175) - 57,401 (774) 774 -
Transfer to statutory reserve - - 1,496,069 - - - - (1,496,069) - - -
Transactions with owners for the year ended
December 31, 2018
Final cash dividend - December 31, 2017 declared
subsequent to the year end at Rs.4.0 per share - - - - - - - (4,896,719) (4,896,719) - (4,896,719)
Interim cash dividend - March 31, 2018 declared
at Rs.3.0 per share - - - - - - - (3,672,539) (3,672,539) - (3,672,539)
Interim cash dividend - June 30, 2018 declared
at Rs.3.0 per share - - - - - - - (3,672,539) (3,672,539) - (3,672,539)
Interim cash dividend - September 30, 2018
at Rs.2.0 per share - - - - - - - (2,448,359) (2,448,359) - (2,448,359)
- - - - - - - (14,690,156) (14,690,156) - (14,690,156)
Balance as at December 31, 2018 12,241,798 3,000 31,353,522 28,722,348 (10,230,277) 27,117,327 105,856 73,749,955 163,063,529 5,560,330 168,623,859
Total comprehensive income for the year ended
December 31, 2019
Profit after taxation for the year ended December 31, 2019 - - - - - - - 19,095,141 19,095,141 (46,843) 19,048,298
Other comprehensive income - net of tax - - - 5,994,906 10,419,759 383,870 39,598 (540,185) 16,297,948 1,702,716 18,000,664
Total comprehensive income for the year ended
December 31, 2019 - - - 5,994,906 10,419,759 383,870 39,598 18,554,956 35,393,089 1,655,873 37,048,962
Ordinary dividend relating to Non-controlling shareholders - - - - - - - - - (1,540) (1,540)
Transfer from surplus on revaluation on disposal
to unappropriated profit - net of tax (262,309) (114,383) 376,692 - - -
Transfer from surplus on revaluation of fixed assets
to unappropriated profit - net of tax - - - - - (54,883) - 54,883 - (808) (808)
Transfer to statutory reserve - - 1,935,261 - - - - (1,935,261) - - -
Transactions with owners for the year ended
December 31, 2019
Final cash dividend - December 31, 2018 declared
subsequent to the year end at Rs.3.0 per share - - - - - - - (3,672,539) (3,672,539) - (3,672,539)
Interim cash dividend - March 31, 2019 declared
at Rs.2.5 per share - - - - - - - (3,060,449) (3,060,449) - (3,060,449)
Interim cash dividend - June 30, 2019 declared
at Rs.2.5 per share - - - - - - - (3,060,449) (3,060,449) - (3,060,449)
Interim cash dividend - September 30, 2019
declared at Rs.3.0 per share - - - - - - - (3,672,539) (3,672,539) - (3,672,539)
Realization of exchange translation reserve - Note 32.2 - - - (1,332,626) - - - - (1,332,626) - (1,332,626)
- - - (1,332,626) - - - (13,465,976) (14,798,602) - (14,798,602)
Balance as at December 31, 2019 12,241,798 3,000 33,288,783 33,384,628 189,482 27,184,005 31,071 77,335,249 183,658,016 7,213,855 190,871,871
The annexed notes 1 to 52 and annexures I, II and III form an integral part of these consolidated financial statements.
Aameer Karachiwalla Sima Kamil Amar Zafar Khan Arshad Ahmad Mir Sir Mohammed Anwar Pervez, OBE, HPk
Chief Financial Officer President & Director Director Chairman
Chief Executive Officer
---------------------------------------------------------------------------------------- (Rupees in '000) ----------------------------------------------------------------------------------------
Attributable to equity shareholders of the Bank
Non-
controlling
Interest
TotalShare Capital
General
reserve
Statutory
reserve
Capital
reserve -
Exchange
translation
Unappro-
priated profitSub total
Investments Fixed AssetsNon Banking
Assets
Surplus / (deficit) on revaluation of
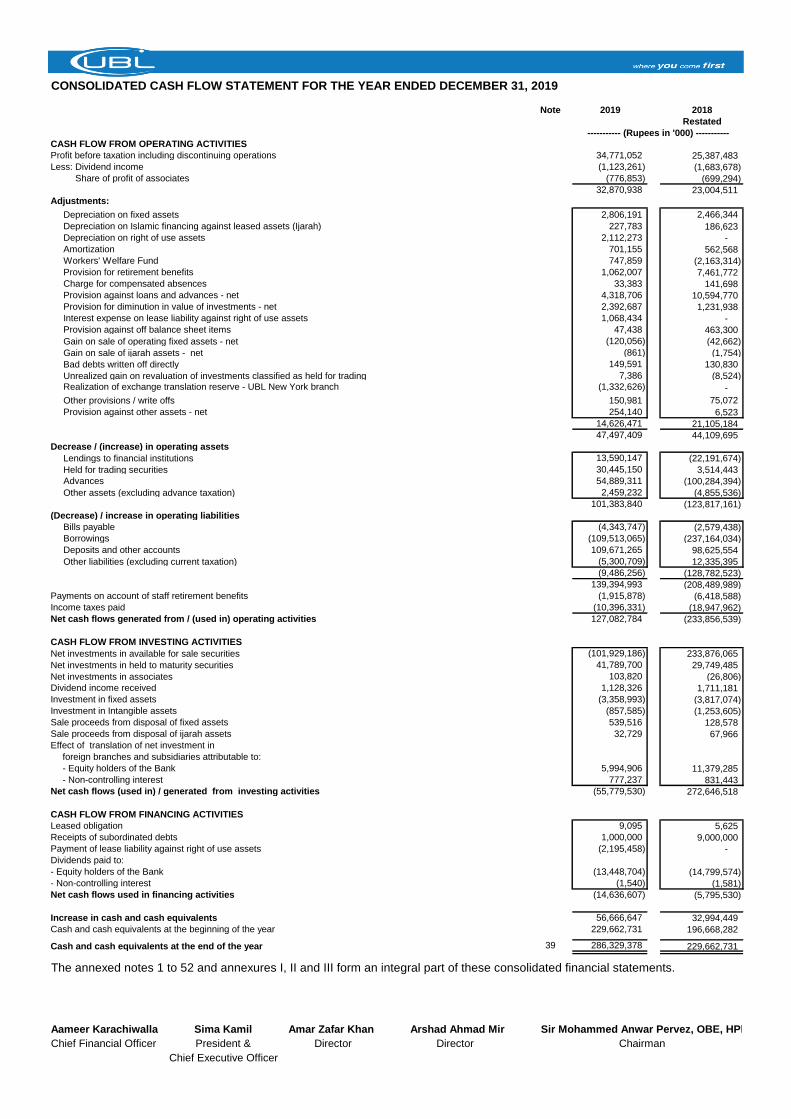
CONSOLIDATED CASH FLOW STATEMENT FOR THE YEAR ENDED DECEMBER 31, 2019
Note 2019 2018
Restated
CASH FLOW FROM OPERATING ACTIVITIES
Profit before taxation including discontinuing operations 34,771,052 25,387,483
Less: Dividend income (1,123,261) (1,683,678)
Less: Share of profit of associates (776,853) (699,294)
32,870,938 23,004,511 Adjustments:
Depreciation on fixed assets 2,806,191 2,466,344
Depreciation on Islamic financing against leased assets (Ijarah) 227,783 186,623
Depreciation on right of use assets 2,112,273 -
Amortization 701,155 562,568
Workers' Welfare Fund 747,859 (2,163,314)
Provision for retirement benefits 1,062,007 7,461,772
Charge for compensated absences 33,383 141,698
Provision against loans and advances - net 4,318,706 10,594,770
Provision for diminution in value of investments - net 2,392,687 1,231,938
Interest expense on lease liability against right of use assets 1,068,434 -
Provision against off balance sheet items 47,438 463,300
Gain on sale of operating fixed assets - net (120,056) (42,662)
Gain on sale of ijarah assets - net (861) (1,754)
Bad debts written off directly 149,591 130,830
Unrealized gain on revaluation of investments classified as held for trading 7,386 (8,524) Realization of exchange translation reserve - UBL New York branch (1,332,626) -
Other provisions / write offs 150,981 75,072
Provision against other assets - net 254,140 6,523
14,626,471 21,105,184
47,497,409 44,109,695
Decrease / (increase) in operating assets
Lendings to financial institutions 13,590,147 (22,191,674)
Held for trading securities 30,445,150 3,514,443
Advances 54,889,311 (100,284,394)
Other assets (excluding advance taxation) 2,459,232 (4,855,536)
101,383,840 (123,817,161)
(Decrease) / increase in operating liabilities
Bills payable (4,343,747) (2,579,438)
Borrowings (109,513,065) (237,164,034)
Deposits and other accounts 109,671,265 98,625,554
Other liabilities (excluding current taxation) (5,300,709) 12,335,395
(9,486,256) (128,782,523)
139,394,993 (208,489,989)
Payments on account of staff retirement benefits (1,915,878) (6,418,588)
Income taxes paid (10,396,331) (18,947,962)
Net cash flows generated from / (used in) operating activities 127,082,784 (233,856,539)
CASH FLOW FROM INVESTING ACTIVITIES
Net investments in available for sale securities (101,929,186) 233,876,065
Net investments in held to maturity securities 41,789,700 29,749,485
Net investments in associates 103,820 (26,806)
Dividend income received 1,128,326 1,711,181
Investment in fixed assets (3,358,993) (3,817,074)
Investment in Intangible assets (857,585) (1,253,605)
Sale proceeds from disposal of fixed assets 539,516 128,578
Sale proceeds from disposal of ijarah assets 32,729 67,966
Effect of translation of net investment in
foreign branches and subsidiaries attributable to:
- Equity holders of the Bank 5,994,906 11,379,285
- Non-controlling interest 777,237 831,443
Net cash flows (used in) / generated from investing activities (55,779,530) 272,646,518
CASH FLOW FROM FINANCING ACTIVITIES
Leased obligation 9,095 5,625
Receipts of subordinated debts 1,000,000 9,000,000
Payment of lease liability against right of use assets (2,195,458) -
Dividends paid to:
- Equity holders of the Bank (13,448,704) (14,799,574)
- Non-controlling interest (1,540) (1,581)
Net cash flows used in financing activities (14,636,607) (5,795,530)
Increase in cash and cash equivalents 56,666,647 32,994,449
Cash and cash equivalents at the beginning of the year 229,662,731 196,668,282
Cash and cash equivalents at the end of the year 39 286,329,378 229,662,731
The annexed notes 1 to 52 and annexures I, II and III form an integral part of these consolidated financial statements.
Aameer Karachiwalla Sima Kamil Amar Zafar Khan Arshad Ahmad Mir Sir Mohammed Anwar Pervez, OBE, HPk
Chief Financial Officer President & Director Director Chairman
Chief Executive Officer
----------- (Rupees in '000) -----------
NOTES TO AND FORMING PART OF THE CONSOLIDATED FINANCIAL STATEMENTS
FOR THE YEAR ENDED DECEMBER 31, 2019
1. STATUS AND NATURE OF BUSINESS
The "Group" consists of:
- Holding Company
- Subsidiary companies
- United National Bank Limited (UBL UK) - 55% holding (2018: 55% holding)
- UBL (Switzerland) AG (USAG) - 100% holding (2018: 100% holding)
- United Executors and Trustees Company Limited, Pakistan - 100% holding (2018: 100% holding)
- UBL Fund Managers Limited, Pakistan - 98.87% holding (2018: 98.87% holding)
- Al Ameen Financial Services (Private) Limited (the Company) - effective holding 98.87% (2018: 98.87% holding)
- UBL Bank (Tanzania) Limited - 100% holding (2018: 100% holding)
United Bank Limited (the Bank) is a banking company incorporated in Pakistan and is engaged in commercial banking
and related services. The Bank's registered office and principal office are situated at UBL Building, Jinnah Avenue,
Blue Area, Islamabad and at UBL Head Office, I. I. Chundrigar Road, Karachi respectively. The Bank operates 1,362
(December 31, 2018: 1,364) branches inside Pakistan including 100 (December 31, 2018: 94) Islamic Banking
branches and 2 (December 31, 2018: 2) branches in Export Processing Zones. The Bank also operates 14 (December
31, 2018: 15) branches outside Pakistan. The Bank is a subsidiary of Bestway (Holdings) Limited and Bestway
(Holdings) Limited is a wholly owned subsidiary of Bestway Group Limited which is incorporated in the United
Kingdom.
The Bank's ordinary shares are listed on Pakistan Stock Exchange. Its Global Depository Receipts (GDRs) are on the
list of the UK Listing Authority and the London Stock Exchange Professional Securities Market. These GDRs are also
eligible for trading on the International Order Book System of the London Stock Exchange. Further, the GDRs
constitute an offering in the United States only to qualified institutional buyers in reliance on Rule 144A under the US
Securities Act of 1933 and an offering outside the United States in reliance on Regulation S.
UBL UK is an authorized banking institution incorporated in the United Kingdom. UBL UK was formed in 2001 from
the merger of the UK branches of United Bank Limited and National Bank of Pakistan. The principal activities of
UBL UK are to provide retail banking services through its branch network in major cities of the UK, wholesale
banking and treasury services to financial institutions and trade finance facilities to businesses of all sizes. United
National Bank Limited operates under the trade name United Bank UK.
UBL (Switzerland) AG is a commercial bank owned by the Bank. Founded in 1967, its main activities are in credit
operations and trade financing. UBL (Switzerland) AG previously operated under the name, United Bank AG
Zurich.
United Executors and Trustees Company Limited ("UET" or the Company) was incorporated in Pakistan in 1965 as
an unlisted public limited company. The registered office of the Company is situated at State Life Building No. 1,
I.I. Chundrigar Road, Karachi. Currently, the Company is engaged in the business of investments.
UBL Fund Managers Limited (UBL FM or the Company) was incorporated as a unlisted public limited company in
Pakistan on April 3, 2001. The Company is licensed to carry out Asset Management and Investment Advisory
Services under the Non-Banking Finance Companies (Establishment and Regulation) Rules, 2003 and the Non-
Banking Finance Companies and Notified Entities Regulations, 2008. The principal activities of the Company are
floating and managing mutual funds and providing investment advisory services. The registered office of the
Company is situated at STSM Building, Beaumont Road, Civil Lines, Karachi.
UBL Fund Managers has incorporated a wholly owned subsidiary Al Ameen Islamic Financial Services (Private)
Limited on February 27, 2015. The principal activity of the subsidiary is provision of shariah compliant financial
services including distribution of shariah compliant mutual funds. The registered office of the Company is situated
at STSM Building, Beaumont Road, Civil Lines, Karachi.
UBL Bank (Tanzania) Limited (UBTL) was incorporated on March 13, 2012 and had commenced operations in
May 2013. The Banking operations of the subsidiary ceased on November 1, 2019. Details of sale agreement and
financial information are disclosed in note 14.
6
NOTES TO AND FORMING PART OF THE CONSOLIDATED FINANCIAL STATEMENTS
FOR THE YEAR ENDED DECEMBER 31, 2019
2. BASIS OF PRESENTATION
2.1
2.2
2.3 Key financial figures of the Islamic Banking branches are disclosed in annexure II to the consolidated financial statements.
3. STATEMENT OF COMPLIANCE
3.1
-
-
- Provisions of and directives issued under the Banking Companies Ordinance, 1962 and the Companies Act, 2017; and
-
3.2
3.3
3.4
Islamic Financial Accounting Standards (IFAS) issued by the Institute of Chartered Accountants of Pakistan as are
notified under the Companies Act, 2017;
Whenever the requirements of the Banking Companies Ordinance, 1962, the Companies Act, 2017 or the directives
issued by the SBP and the SECP differ with the requirements of IFRS or IFAS, the requirements of the Banking
Companies Ordinance, 1962, the Companies Act, 2017 and the said directives shall prevail.
The SBP, vide BSD Circular letter No. 10, dated August 26, 2002 has deferred the applicability of International Accounting
Standard 39, Financial Instruments: Recognition and Measurement and International Accounting Standard 40, Investment
Property for banking companies till further instructions. Moreover, SBP vide BPRD circular no. 4, dated February 25, 2015
has deferred the applicability of Islamic Financial Accounting Standards (IFAS) 3, Profit and Loss Sharing on Deposits.
Further, according to the notification of the SECP issued vide SRO 411(I)/2008 dated April 28, 2008, IFRS 7, Financial
Instruments: Disclosures has not been made applicable for banks. Accordingly, the requirements of these standards have
not been considered in the preparation of these consolidated financial statements. However, investments have been
classified and valued in accordance with the requirements of various circulars issued by the SBP.
These consolidated financial statements have been prepared in conformity with the format of financial statements
prescribed by the State Bank of Pakistan (SBP) vide BSD Circular No. 02, dated January 25, 2018.
In accordance with the directives of the Federal Government regarding the shifting of the banking system to Islamic
modes, SBP has issued various circulars from time to time. Permissible forms of trade-related modes of financing includes
purchase of goods by banks from customers and immediate resale to them at appropriate mark-up in price on deferred
payment basis. The purchase and resale arising under these arrangements are not reflected in these consolidated
financial statements as such, but are restricted to the amount of facility actually utilised and the appropriate portion of
mark-up thereon. However, the Islamic Banking branches of the Bank have complied with the requirements set out under
the Islamic Financial Accounting Standards (IFAS), issued by the Institute of Chartered Accountants of Pakistan (ICAP) as
are notified under the provisions of Companies Act, 2017.
These consolidated financial statements have been prepared in accordance with the accounting and reporting standards
as applicable in Pakistan. The accounting and reporting standards comprise of:
International Financial Reporting Standards (IFRS) issued by the International Accounting Standards Board (IASB) as
are notified under the Companies Act, 2017;
Directives issued by the State Bank of Pakistan (SBP) and the Securities and Exchange Commission of Pakistan
(SECP).
The SECP vide its notification SRO 633 (I)/2014 dated 10 July 2014, adopted IFRS 10 effective from the periods starting
from June 30, 2014. However, vide its notification SRO 56 (I)/2016 dated January 28, 2016, it has been notified that the
requirements of IFRS 10 and section 228 of the Companies Act, 2017 will not be applicable with respect to the investment
in mutual funds established under trust structure.
Standards, interpretations and amendments to accounting and reporting standards that are effective in the
current year
During the current year, IFRS 16, Leases, became effective from annual periods beginning on or after January 01, 2019.
The impact of the adoption of IFRS 16 on the Bank's consolidated financial statements is disclosed in note 5.1.1.
IFRS 15 introduces a single five step revenue recognition model for all contracts with customers, unless those contracts
are in the scope of other standards and, accordingly, has superseded IAS 11 'Construction Contracts', IAS 18 'Revenue'
and related interpretations. Under IFRS 15, revenue is recognized at an amount that reflects the consideration to which an
entity expects to be entitled in exchange for transferring goods or services to customers. The adoption of IFRS 15 does
not have any material impact on the consolidated financial statements of the Group.
7
NOTES TO AND FORMING PART OF THE CONSOLIDATED FINANCIAL STATEMENTS
FOR THE YEAR ENDED DECEMBER 31, 2019
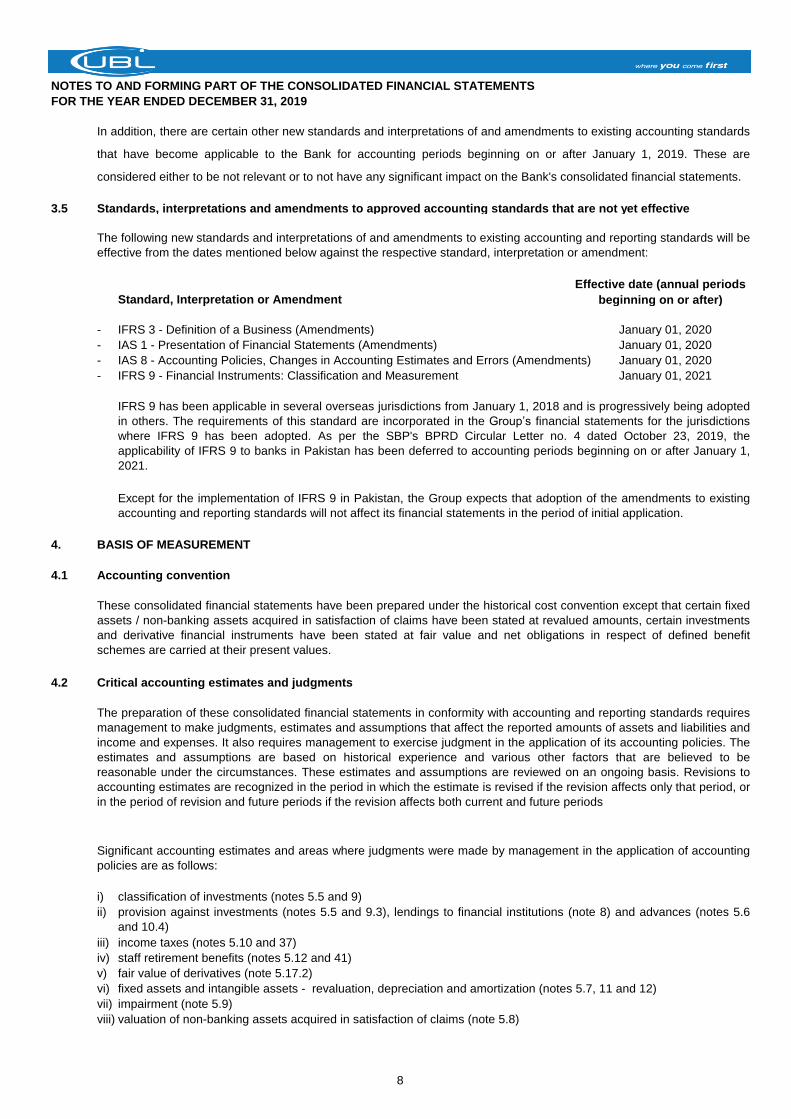
3.5 Standards, interpretations and amendments to approved accounting standards that are not yet effective
Standard, Interpretation or Amendment
- IFRS 3 - Definition of a Business (Amendments) January 01, 2020
- IAS 1 - Presentation of Financial Statements (Amendments) January 01, 2020
- IAS 8 - Accounting Policies, Changes in Accounting Estimates and Errors (Amendments) January 01, 2020
- IFRS 9 - Financial Instruments: Classification and Measurement January 01, 2021
4. BASIS OF MEASUREMENT
4.1 Accounting convention
4.2 Critical accounting estimates and judgments
i) classification of investments (notes 5.5 and 9)
ii)
iii) income taxes (notes 5.10 and 37)
iv) staff retirement benefits (notes 5.12 and 41)
v) fair value of derivatives (note 5.17.2)
vi) fixed assets and intangible assets - revaluation, depreciation and amortization (notes 5.7, 11 and 12)
vii) impairment (note 5.9)
viii) valuation of non-banking assets acquired in satisfaction of claims (note 5.8)
The following new standards and interpretations of and amendments to existing accounting and reporting standards will be
effective from the dates mentioned below against the respective standard, interpretation or amendment:
Effective date (annual periods
beginning on or after)
These consolidated financial statements have been prepared under the historical cost convention except that certain fixed
assets / non-banking assets acquired in satisfaction of claims have been stated at revalued amounts, certain investments
and derivative financial instruments have been stated at fair value and net obligations in respect of defined benefit
schemes are carried at their present values.
The preparation of these consolidated financial statements in conformity with accounting and reporting standards requires
management to make judgments, estimates and assumptions that affect the reported amounts of assets and liabilities and
income and expenses. It also requires management to exercise judgment in the application of its accounting policies. The
estimates and assumptions are based on historical experience and various other factors that are believed to be
reasonable under the circumstances. These estimates and assumptions are reviewed on an ongoing basis. Revisions to
accounting estimates are recognized in the period in which the estimate is revised if the revision affects only that period, or
in the period of revision and future periods if the revision affects both current and future periods
Significant accounting estimates and areas where judgments were made by management in the application of accounting
policies are as follows:
provision against investments (notes 5.5 and 9.3), lendings to financial institutions (note 8) and advances (notes 5.6
and 10.4)
In addition, there are certain other new standards and interpretations of and amendments to existing accounting standards
that have become applicable to the Bank for accounting periods beginning on or after January 1, 2019. These are
considered either to be not relevant or to not have any significant impact on the Bank's consolidated financial statements.
IFRS 9 has been applicable in several overseas jurisdictions from January 1, 2018 and is progressively being adopted
in others. The requirements of this standard are incorporated in the Group’s financial statements for the jurisdictions
where IFRS 9 has been adopted. As per the SBP's BPRD Circular Letter no. 4 dated October 23, 2019, the
applicability of IFRS 9 to banks in Pakistan has been deferred to accounting periods beginning on or after January 1,
2021.
Except for the implementation of IFRS 9 in Pakistan, the Group expects that adoption of the amendments to existing
accounting and reporting standards will not affect its financial statements in the period of initial application.
8
NOTES TO AND FORMING PART OF THE CONSOLIDATED FINANCIAL STATEMENTS
FOR THE YEAR ENDED DECEMBER 31, 2019
5. SUMMARY OF SIGNIFICANT ACCOUNTING POLICIES
5.1 Change in accounting policies
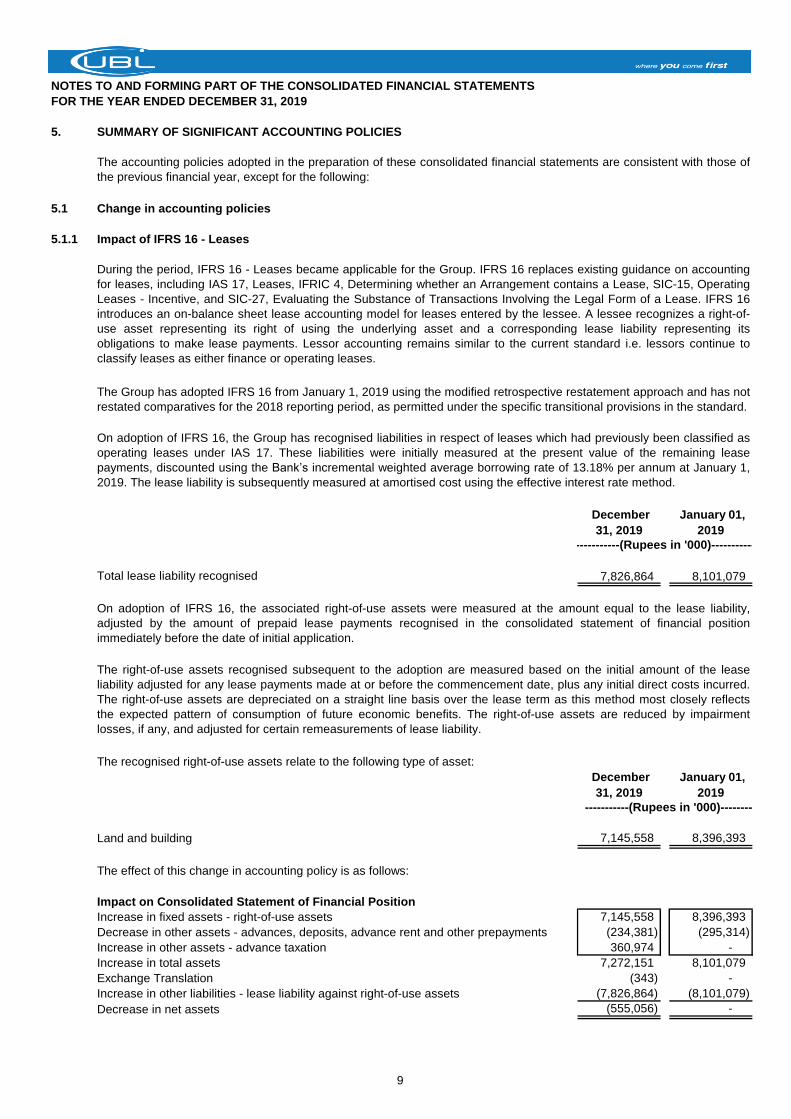
5.1.1 Impact of IFRS 16 - Leases
December
31, 2019
January 01,
2019
Total lease liability recognised 7,826,864 8,101,079
The recognised right-of-use assets relate to the following type of asset:
December
31, 2019
January 01,
2019
Land and building 7,145,558 8,396,393
The effect of this change in accounting policy is as follows:
Impact on Consolidated Statement of Financial Position
Increase in fixed assets - right-of-use assets 7,145,558 8,396,393
Decrease in other assets - advances, deposits, advance rent and other prepayments (234,381) (295,314)
Increase in other assets - advance taxation 360,974 -
Increase in total assets 7,272,151 8,101,079
Exchange Translation (343) -
Increase in other liabilities - lease liability against right-of-use assets (7,826,864) (8,101,079)
Decrease in net assets (555,056) -
The right-of-use assets recognised subsequent to the adoption are measured based on the initial amount of the lease
liability adjusted for any lease payments made at or before the commencement date, plus any initial direct costs incurred.
The right-of-use assets are depreciated on a straight line basis over the lease term as this method most closely reflects
the expected pattern of consumption of future economic benefits. The right-of-use assets are reduced by impairment
losses, if any, and adjusted for certain remeasurements of lease liability.
-----------(Rupees in '000)--------
On adoption of IFRS 16, the associated right-of-use assets were measured at the amount equal to the lease liability,
adjusted by the amount of prepaid lease payments recognised in the consolidated statement of financial position
immediately before the date of initial application.
The accounting policies adopted in the preparation of these consolidated financial statements are consistent with those of
the previous financial year, except for the following:
During the period, IFRS 16 - Leases became applicable for the Group. IFRS 16 replaces existing guidance on accounting
for leases, including IAS 17, Leases, IFRIC 4, Determining whether an Arrangement contains a Lease, SIC-15, Operating
Leases - Incentive, and SIC-27, Evaluating the Substance of Transactions Involving the Legal Form of a Lease. IFRS 16
introduces an on-balance sheet lease accounting model for leases entered by the lessee. A lessee recognizes a right-of-
use asset representing its right of using the underlying asset and a corresponding lease liability representing its
obligations to make lease payments. Lessor accounting remains similar to the current standard i.e. lessors continue to
classify leases as either finance or operating leases.
The Group has adopted IFRS 16 from January 1, 2019 using the modified retrospective restatement approach and has not
restated comparatives for the 2018 reporting period, as permitted under the specific transitional provisions in the standard.
On adoption of IFRS 16, the Group has recognised liabilities in respect of leases which had previously been classified as
operating leases under IAS 17. These liabilities were initially measured at the present value of the remaining lease
payments, discounted using the Bank’s incremental weighted average borrowing rate of 13.18% per annum at January 1,
2019. The lease liability is subsequently measured at amortised cost using the effective interest rate method.
-----------(Rupees in '000)-----------
9
NOTES TO AND FORMING PART OF THE CONSOLIDATED FINANCIAL STATEMENTS
FOR THE YEAR ENDED DECEMBER 31, 2019
2019
(Rupees in '000)
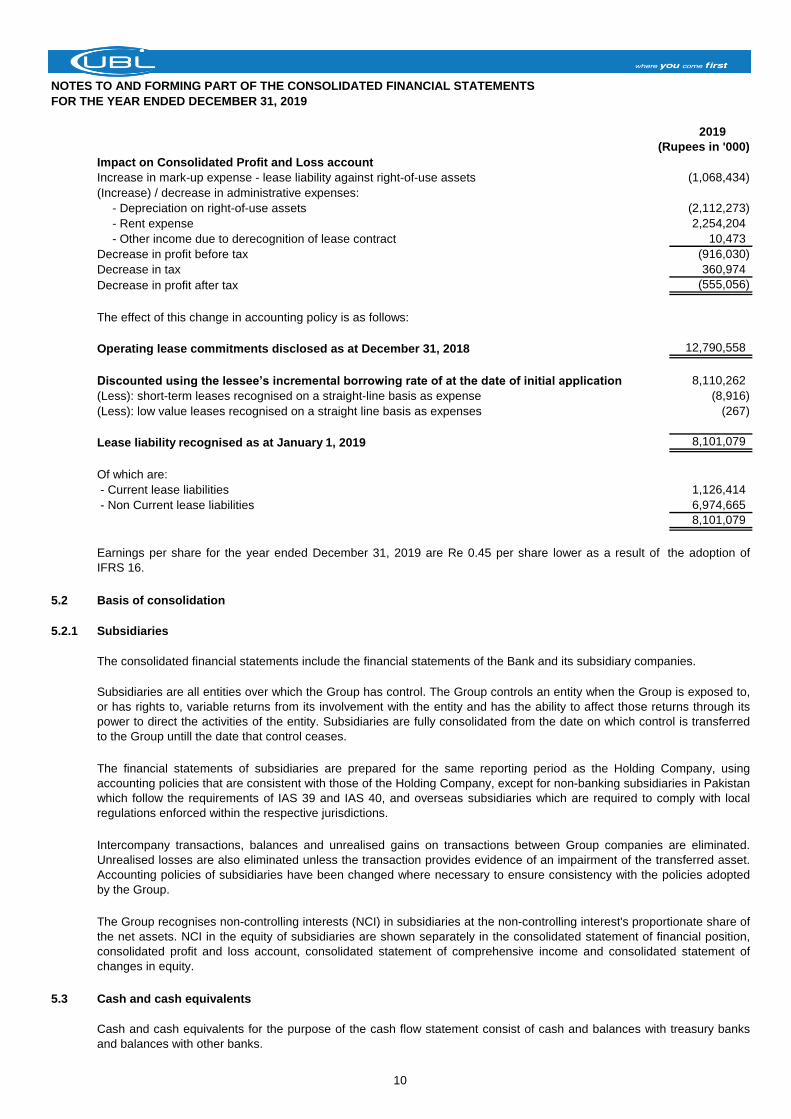
Impact on Consolidated Profit and Loss account
Increase in mark-up expense - lease liability against right-of-use assets (1,068,434)
(Increase) / decrease in administrative expenses:
- Depreciation on right-of-use assets (2,112,273)
- Rent expense 2,254,204
- Other income due to derecognition of lease contract 10,473
Decrease in profit before tax (916,030)
Decrease in tax 360,974
Decrease in profit after tax (555,056)
The effect of this change in accounting policy is as follows:
Operating lease commitments disclosed as at December 31, 2018 12,790,558
Discounted using the lessee’s incremental borrowing rate of at the date of initial application 8,110,262
(Less): short-term leases recognised on a straight-line basis as expense (8,916)
(Less): low value leases recognised on a straight line basis as expenses (267)
Lease liability recognised as at January 1, 2019 8,101,079
Of which are:
- Current lease liabilities 1,126,414
- Non Current lease liabilities 6,974,665
8,101,079
5.2 Basis of consolidation
5.2.1 Subsidiaries
The consolidated financial statements include the financial statements of the Bank and its subsidiary companies.
5.3 Cash and cash equivalents
Earnings per share for the year ended December 31, 2019 are Re 0.45 per share lower as a result of the adoption of
IFRS 16.
Subsidiaries are all entities over which the Group has control. The Group controls an entity when the Group is exposed to,
or has rights to, variable returns from its involvement with the entity and has the ability to affect those returns through its
power to direct the activities of the entity. Subsidiaries are fully consolidated from the date on which control is transferred
to the Group untill the date that control ceases.
Intercompany transactions, balances and unrealised gains on transactions between Group companies are eliminated.
Unrealised losses are also eliminated unless the transaction provides evidence of an impairment of the transferred asset.
Accounting policies of subsidiaries have been changed where necessary to ensure consistency with the policies adopted
by the Group.
The Group recognises non-controlling interests (NCI) in subsidiaries at the non-controlling interest's proportionate share of
the net assets. NCI in the equity of subsidiaries are shown separately in the consolidated statement of financial position,
consolidated profit and loss account, consolidated statement of comprehensive income and consolidated statement of
changes in equity.
Cash and cash equivalents for the purpose of the cash flow statement consist of cash and balances with treasury banks
and balances with other banks.
The financial statements of subsidiaries are prepared for the same reporting period as the Holding Company, using
accounting policies that are consistent with those of the Holding Company, except for non-banking subsidiaries in Pakistan
which follow the requirements of IAS 39 and IAS 40, and overseas subsidiaries which are required to comply with local
regulations enforced within the respective jurisdictions.
10
NOTES TO AND FORMING PART OF THE CONSOLIDATED FINANCIAL STATEMENTS
FOR THE YEAR ENDED DECEMBER 31, 2019
5.4 Lendings to / borrowings from financial institutions
5.4.1 Purchase under resale agreements
5.4.2 Sale under repurchase agreements
5.4.3 Bai Muajjal
5.5 Investments
Held for trading
Held to maturity
Available for sale
Initial measurement
Securities held as collateral are not recognized in the consolidated financial statements, unless these are sold to third
parties, in which case the obligation to return them is recorded at fair value as a trading liability under borrowings from
financial institutions.
Securities sold subject to a repurchase agreement (repo) are retained in the consolidated financial statements as
investments and the counterparty liability is included in borrowings from financial institutions. The differential between the
sale price and the repurchase price is amortized over the period of the agreement and recorded as an expense.
Bai Muajjal transactions represent sales of Sukuks on a deferred payment basis and are shown in lendings to financial
institutions except for transactions undertaken directly with the Government of Pakistan which are disclosed as
investments. The difference between the deferred payment amount receivable and the carrying value at the time of sale is
accrued and recorded as income over the life of the transaction.
Investments of the Group, other than investments in associates, are classified as held for trading, held to maturity and
available for sale.
These are securities which are either acquired for generating a profit from short-term fluctuations in market prices, interest
rate movements and dealer's margin, or are securities included in a portfolio in which a pattern of short term profit taking
exists.
Investments are initially recognized at fair value which, in the case of investments other than held for trading, includes
transaction costs associated with the investments. Transaction costs on investments held for trading are expensed as
incurred.
These are securities with fixed or determinable payments and fixed maturities, in respect of which the Group has the
positive intent and ability to hold to maturity.
These are investments, other than those in subsidiaries and associates, that do not fall under the held for trading or held
to maturity categories.
All “regular way” purchases and sales of investments are recognized on the trade date, i.e., the date that the Group
commits to purchase or sell the investment. Regular way purchases or sales are purchases or sales of investments that
require delivery of investments within the time frame generally established by regulation or convention in the market place.
Securities purchased under agreement to resell (reverse repo) are included in lendings to financial institutions. The
differential between the purchase price and the resale price is amortized over the period of the agreement and recorded
as income.
The Group enters into transactions of reverse repos, repos and other short term money market lendings to financial
institution at contracted rates for a specified period of time. Further, other long term lendings to Financial institution are
classified in advances. These are recorded as under:
11
NOTES TO AND FORMING PART OF THE CONSOLIDATED FINANCIAL STATEMENTS
FOR THE YEAR ENDED DECEMBER 31, 2019
Subsequent measurement
Held for trading
Held to maturity
Available for sale
Associates
Goodwill
Under the equity method of accounting, the investments are initially recognised at cost and adjusted thereafter to
recognise the Group’s share of the post-acquisition profits or losses of the investee in profit or loss, and the Group’s share
of movements in other comprehensive income of the investee in other comprehensive income. Dividends received or
receivable from associates and joint ventures are recognised as a reduction in the carrying amount of the investment.
When the Group’s share of losses in an equity-accounted investment equals or exceeds its interest in the entity, including
any other unsecured long-term receivables, the Group does not recognise further losses, unless it has incurred obligations
or made payments on behalf of the other entity.
Unrealised gains on transactions between the Group and its associates and joint ventures are eliminated to the extent of
the Group’s interest in these entities. Unrealised losses are also eliminated unless the transaction provides evidence of an
impairment of the asset transferred.
These are measured at subsequent reporting dates at fair value. Gains and losses on re-measurement are included in the
profit and loss account.
These are measured at amortized cost using the effective interest rate method, less any impairment loss recognized to
reflect irrecoverable amounts.
Quoted securities classified as available for sale investments are measured at subsequent reporting dates at fair value.
Any surplus / deficit arising thereon is kept in a separate account shown in the statement of financial position as part of
equity and is taken to the profit and loss account when realized upon disposal or when the investment is considered to be
impaired.
Unquoted equity securities are valued at the lower of cost and break-up value. The break-up value of these securities is
calculated with reference to the net assets of the investee company as per the latest available audited financial
statements. A decline in the carrying value is charged to the profit and loss account. A subsequent increase in the carrying
value, upto the cost of the investment, is credited to the profit and loss account. Investments in other unquoted securities
are valued at cost less impairment, if any.
Provisions for diminution in the value of Term Finance Certificates and Sukuks are made as per the ageing criteria
prescribed by the Prudential Regulations issued by the SBP. Provisions for diminution in the value of other securities are
made for impairment, if any.
Goodwill is tested annually for impairment, or more frequently if events or changes in circumstances indicate that it might
be impaired. An impairment loss is recognised for the amount by which the asset’s carrying amount exceeds its
recoverable amount. The recoverable amount is the higher of an asset’s fair value less costs of disposal and value in use.
For the purposes of assessing impairment, assets are grouped at the lowest levels for which there are separately
identifiable cash inflows which are largely independent of the cash inflows from other assets or groups of assets (cash-
generating units).
Associates are all entities over which the Group has significant influence but not control or joint control. This is generally
the case where the Group holds between 20% and 50% of the voting rights. Investments in associates are accounted for
using the equity method of accounting, after initially being recognised at cost.
12
NOTES TO AND FORMING PART OF THE CONSOLIDATED FINANCIAL STATEMENTS
FOR THE YEAR ENDED DECEMBER 31, 2019
5.6 Advances
5.6.1 Finance Lease receivables
5.6.2 Islamic financings and related assets
5.7 Fixed assets and depreciation
5.7.1 Tangible
Depreciation is calculated so as to write-off the depreciable amount of the assets over their expected useful lives at the
rates specified in note 11.2 to these consolidated financial statements. The depreciation charge for the year is calculated
on a straight line basis after taking into account the residual value, if any. The residual values and useful lives are
reviewed and adjusted, if appropriate, at each statement of financial position date.
Depreciation on additions is charged from the month the asset is available for use. No depreciation is charged in the
month of disposal.
Land and buildings are revalued by independent, professionally qualified valuers with sufficient regularity to ensure that
their net carrying amount does not differ materially from their fair value. An increase arising on revaluation is credited to
the surplus on revaluation of fixed assets account. A decrease arising on revaluation of fixed assets is adjusted against
the surplus of that asset or, if no surplus exists, is charged to the profit and loss account as an impairment of the asset. A
surplus arising subsequently on an impaired asset is reversed through the profit and loss account up to the extent of the
original impairment.
Surplus on revaluation of fixed assets (net of associated deferred tax) to the extent of the incremental depreciation
charged on the related assets is transferred to unappropriated profit.
Advances are written off when there is no realistic prospect of recovery. The amount so written off is a book entry and
does not necessarily prejudice to the Group's right of recovery against the customer.
The Bank determines write-offs in accordance with the criteria prescribed by the SBP vide BPRD Circular No. 06 dated
June 05, 2007.
Receivables under Murabaha financing represent cost price plus an agreed mark-up on deferred sale arrangement. Mark-
up income is recognised on a straight line basis over the period of the instalments.
Ijarah financing represents arrangements whereby the Bank (being the owner of assets) transfers its usufruct to its
customers for an agreed period at an agreed consideration. Assets leased out under Ijarah are stated at cost less
accumulated depreciation and accumulated impairment losses, if any. These are depreciated over the term of the lease.
Ijarah income is recognized on an accrual basis.
Diminishing Musharaka is partnership agreement between the Bank and its customer for financing vehicle or plant and
machinery. The receivable is recorded to the extent of Bank's share in the purchase of asset. Income is recognised on
accrual basis.
Property and equipment, other than land (which is not depreciated) and capital work-in-progress, are stated at cost or
revalued amount less accumulated depreciation and accumulated impairment losses, if any. Land is carried at revalued
amount less impairment losses while capital work-in-progress is stated at cost less impairment losses. The cost and the
accumulated depreciation of property and equipment of foreign branches include exchange differences arising on currency
translation at the year-end rates of exchange.
Advances are stated net of specific and general provisions which are charged to the profit and loss account. Specific
provisions against domestic advances and general provision against domestic consumer loans are determined on the
basis of the Prudential Regulations and other directives issued by the SBP. General and specific provisions pertaining to
overseas advances are made in accordance with the requirements of the regulatory authorities of the respective countries.
If circumstances warrant, the Group, from time to time, makes general provisions against weaknesses in its portfolio on
the basis of management's estimation.
Leases, where the Bank transfers substantially all the risks and rewards incidental to ownership of an asset to the lessee
are classified as finance lease. A receivable is recognized at an amount equal to the present value of the minimum lease
payments including guaranteed residual value, if any. Finance lease receivables are included in advances.
13
NOTES TO AND FORMING PART OF THE CONSOLIDATED FINANCIAL STATEMENTS
FOR THE YEAR ENDED DECEMBER 31, 2019
5.7.2 Intangible assets
Gains and losses on sale of intangible assets are included in the profit and loss account.
5.7.3 Lease liability and Right-of-use asset
Gains and losses on sale of fixed assets are included in the profit and loss account, except that the related surplus on
revaluation of fixed assets (net of deferred tax) is transferred directly to unappropriated profit.
Major renewals and improvements are capitalized and the assets so replaced, if any, are retired. Normal repairs and
maintenance are charged to the profit and loss account as and when incurred.
Intangible assets are stated at cost less accumulated amortization and accumulated impairment losses, if any. The cost
and the accumulated amortization of intangible assets of foreign branches and subsidiaries include exchange differences
arising on currency translation at the year-end rates of exchange. Amortization is calculated so as to write-off the
amortizable amount of the assets over their expected useful lives at the rates specified in note 12.1 to these consolidated
financial statements. The amortization charge for the year is calculated on a straight line basis after taking into account the
residual value, if any. The residual values and useful lives are reviewed and adjusted, if appropriate, at each statement of
financial position date. Amortization on additions is charged from the month the asset is available for use. No amortization
is charged in the month of disposal.
The Bank leases various branches, ATMs and warehouses. Rental contracts are typically for a fixed period of 1 year to 50
years and may have extension options as described below. At inception of a contract, the Bank assesses whether a
contract is, or contains, a lease based on whether the contract conveys the right to control the use of an identified asset
for a period of time in exchange for consideration. Lease terms are negotiated on an individual basis and contain a wide
range of different terms and conditions.
In determining the lease term, management considers all facts and circumstances that create an economic incentive to
exercise an extension option or not exercise a termination option. Extension options (or periods after termination options)
are only included in the lease term if the lease is reasonably certain to extended (or not be terminated).
The lease liability is initially measured at the present value of the lease payments over the period lease term and that are
not paid at the commencement date, discounted using the interest rate implicit in the lease, or if that rate cannot be readily
determined, the Bank's incremental borrowing rate.
Lease payments include fixed payments less any lease incentive receivable, variable lease payment that are based on an
index or a rate which are initially measured using the index or rate as at the commencement date, amounts expected to be
payable by the Bank under residual value guarantees, the exercise price of a purchase option if the Banks is reasonably
certain to exercise that option and payments of penalties for terminating the lease if the lease term reflects the lessee
exercising that option. The extension and termination options are incorporated in determination of lease term only when
the Bank is reasonably certain to exercise these options.
The lease liability is subsequently measured at amortised cost using the effective interest rate method. The lease liability
is also remeasured to reflect any reassessment or lease modification, or to reflect revised in-substance fixed lease
payment.
The lease liability is remeasured when the Bank reassesses the reasonable certainty of exercise of extension or
termination option upon occurrence of either a significant event or a significant change in circumstance, or when there is a
change in assessment of an option to purchase underlying asset, or when there is a change in amount expected to be
payable under a residual value guarantee, or when there is a change in future lease payments resulting from a change in
an index or rate used to determine those payment. The corresponding adjustment is made to the carrying amount of the
right-to-use asset, or is recorded in profit and loss if the carrying amount of right-to-use asset has been reduced to zero.
When there is a change in scope of a lease, or the consideration for a lease, that was not part of the original terms and
conditions of the lease is accounted for as a lease modification. The lease modification is accounted for as a separate
lease if modification increase the scope of lease by adding the right to use one or more underlying assets and the
consideration for lease increases by an amount that is commensurate with the stand-alone price for the increase in scope
adjusted to reflect the circumstances of the particular contracts, if any. When the lease modification is not accounted for
as a separate lease, the lease liability is remeasured and corresponding adjustment is made to right-of-use asset.
14
NOTES TO AND FORMING PART OF THE CONSOLIDATED FINANCIAL STATEMENTS
FOR THE YEAR ENDED DECEMBER 31, 2019
5.8 Non-banking assets acquired in satisfaction of claims
5.9 Impairment
Impairment of available for sale equity investments
Impairment in investments in associates
Impairment in non-financial assets (excluding deferred tax)
5.10 Taxation
5.10.1 Current
The right-of-use asset is initially measured based at the initial amount of initial measurement of lease liability adjusted for
any lease payments made at or before the commencement date, plus any initial direct costs incurred and an estimate of
costs to be incurred to dismantle and remove the underlying asset or to restore the underlying asset or the site on which it
is located.
Non-banking assets acquired in satisfaction of claims are carried at revalued amounts less accumulated depreciation.
These assets are revalued by professionally qualified valuers with sufficient regularity to ensure that their net carrying
value does not differ materially from their fair value. A surplus arising on revaluation of property is credited to the 'surplus
on revaluation of non-banking assets' account and any deficit arising on revaluation is taken to profit and loss account
directly. Legal fees, transfer costs and direct costs of acquiring title to property are charged to the profit and loss account
and not capitalised.
Available for sale equity investments are impaired when there has been a significant or prolonged decline in their fair value
below their cost. The determination of what is significant or prolonged requires judgment. In making this judgment, the
Group evaluates, among other factors, the normal volatility in share price.
The Group considers that a decline in the recoverable value of the investment in an associate below its cost may be
evidence of impairment. Recoverable value is calculated as the higher of fair value less costs to sell and value in use. An
impairment loss is recognized when the recoverable value falls below the carrying value and is charged to the profit and
loss account. A subsequent reversal of an impairment loss, upto the cost of the investment in the associate, is credited to
the profit and loss account.
The carrying amounts of non-financial assets are reviewed at each reporting date for impairment whenever events or
changes in circumstances indicate that the carrying amounts of these assets may not be recoverable. The recoverable
amount of an asset is the higher of its fair value less costs of disposal and its value in use. If such indication exists, and
where the carrying value exceeds the estimated recoverable amount, assets are written down to their recoverable amount.
The resulting impairment loss is charged to the profit and loss account except for an impairment loss on revalued assets,
which is adjusted against the related revaluation surplus to the extent that the impairment loss does not exceed the
revaluation surplus.
The income tax expense or credit for the period is the tax payable on the current period’s taxable income based on the
applicable income tax rate for each jurisdiction adjusted by changes in deferred tax assets and liabilities attributable to
temporary differences and to unused tax losses.
The Bank has elected to apply the practical expedient not to recognise right-of-use assets and lease liabilities for short
term leases that have a lease term of 12 months or less and leases of low-value assets. The lease payments associated
with these leases is recognised as an expense on a straight line basis over the lease term.
The right-of-use asset is subsequently measured at cost model. The right of use asset is depreciated on a straight line
method over the lease term as this method most closely reflects the expected pattern of consumption of future economic
benefits. The right-of-use asset is reduced by impairment losses, if any, and adjusted for certain remeasurements of the
lease liability.
15
NOTES TO AND FORMING PART OF THE CONSOLIDATED FINANCIAL STATEMENTS
FOR THE YEAR ENDED DECEMBER 31, 2019
5.10.2 Deferred
5.11 Provisions
Provisions are reviewed at each statement of financial position date and are adjusted to reflect the current best estimate.
5.12 Staff retirement and other benefits
5.12.1 The Bank
Staff retirement benefit schemes
The Bank operates the following staff retirement schemes for its employees
a)
- an approved contributory provident fund (defined contribution scheme); and
- an approved gratuity scheme (defined benefit scheme).
Provision against identified non-funded losses is recognized when intimated and reasonable certainty exists that the
Group will be required to settle the obligation. The provision is charged to the profit and loss account net of expected
recovery and the obligation is classified under other liabilities.
For new employees and for those who opted for the below mentioned conversion option introduced in 2001, the Bank
operates
Deferred income tax is provided in full, using the liability method, on temporary differences arising between the tax bases
of assets and liabilities and their carrying amounts in the consolidated financial statements. However, deferred tax
liabilities are not recognised if they arise from the initial recognition of goodwill. Deferred income tax is also not accounted
for if it arises from initial recognition of an asset or liability in a transaction other than a business combination that at the
time of the transaction affects neither accounting nor taxable profit or loss. Deferred income tax is determined using tax
rates (and laws) that have been enacted or substantially enacted by the end of the reporting period and are expected to
apply when the related deferred income tax asset is realised or the deferred income tax liability is settled.
Deferred tax assets are recognised only if it is probable that future taxable amounts will be available to utilise those
temporary differences and losses.
Deferred tax liabilities and assets are not recognised for temporary differences between the carrying amount and tax
bases of investments in foreign operations where the Bank is able to control the timing of the reversal of the temporary
differences and it is probable that the differences will not reverse in the foreseeable future.
Deferred tax assets and liabilities are offset when there is a legally enforceable right to offset current tax assets and
liabilities and when the deferred tax balances relate to the same taxation authority. Current tax assets and tax liabilities are
offset where the entity has a legally enforceable right to offset and intends either to settle on a net basis, or to realise the
asset and settle the liability simultaneously.
Provisions are recognized when the Group has a legal or constructive obligation as a result of past events which makes it
probable that an outflow of resources will be required to settle the obligation and a reliable estimate of the amount can be
made.
Current and deferred tax is recognised in consolidated profit and loss account, except to the extent that it relates to items
recognised in other comprehensive income or directly in equity. In this case, the tax is also recognised in other
comprehensive income or directly in equity, respectively.
The current income tax charge is calculated on the basis of the tax laws enacted or substantively enacted at the end of the
reporting period in the countries where the Bank and its subsidiaries and associates operate and generate taxable income.
Management periodically evaluates positions taken in tax returns with respect to situations in which applicable tax
regulation is subject to interpretation. It establishes provisions where appropriate on the basis of amounts expected to be
paid to the tax authorities.
16
NOTES TO AND FORMING PART OF THE CONSOLIDATED FINANCIAL STATEMENTS
FOR THE YEAR ENDED DECEMBER 31, 2019
b) For employees who have not opted for the conversion option introduced in 2001, the Bank operates
- an approved non-contributory provident fund in lieu of the contributory provident fund; and
- an approved funded pension scheme, introduced in 1986 (defined benefit scheme).
The Bank also operates benevolent fund for all its eligible employees (defined benefit scheme).
Other benefits
a) Employees' compensated absences
b) Post-retirement medical benefits (defined benefit scheme)
Remeasurement of defined benefit obligations
5.12.2 United National Bank Limited (UBL UK)
Defined benefit scheme
Defined contribution scheme
The Bank provides post-retirement medical benefits to eligible retired employees. Provision is made on the basis of
actuarial advice under the Projected Unit Credit Method.
Remeasurement gains and losses arising from experience adjustments and changes in actuarial assumptions are
recognized in other comprehensive income when they occur with no subsequent recycling through the profit and loss
account.
Remeasurement gains and losses pertaining to long term compensated absences are recognized in the profit and loss
account immediately.
UBL UK operates a pension scheme (defined benefit scheme) for certain staff. This scheme is closed for new members
and the accrual of benefits has ceased from January 1, 2010. Gains and losses on settlements and curtailments are
charged to the profit and loss account. The interest cost and the expected return on assets are included in other liabilities
and other assets respectively. Remeasurement gains and losses are recognised immediately in other comprehensive
income.
The defined benefit scheme is funded, with the assets of the scheme held separately from those of UBL UK, in separate
trustee administered funds. Pension scheme assets are measured at fair value and liabilities are measured based on
actuarial valuations using the Projected Unit Credit Method. The actuarial valuations are obtained at least triennially and
are updated at each statement of financial position date.
UBL UK operates a defined contributory pension scheme. The contribution payable in the year in respect of pension costs
and other post-retirement benefits is charged to the profit and loss account. Differences between the contribution payable
in the year and contribution actually paid are shown as either accruals or prepayments in the statement of financial
position.
In 2001, the Bank modified the pension scheme and introduced a conversion option for employees covered under option
(b) above to move to option (a). This conversion option ceased on December 31, 2003.
Annual contributions towards defined benefit schemes are made on the basis of actuarial advice using the Projected Unit
Credit Method.
For the defined contribution scheme, the Bank pays contributions to the fund on a periodic basis. The Bank has no further
payment obligation once the contributions have been paid. The contributions are recognized as an expense when the
obligation to make payments to the fund has been established. Prepaid contributions are recognized as an asset to the
extent that a cash refund or a reduction in future payments is available.
The Bank makes provisions for compensated vested and non-vested absences accumulated by its eligible employees
on the basis of actuarial advice under the Projected Unit Credit Method.
17
NOTES TO AND FORMING PART OF THE CONSOLIDATED FINANCIAL STATEMENTS
FOR THE YEAR ENDED DECEMBER 31, 2019
5.12.3 UBL Fund Managers Limited (UFML)
Defined benefit plan
Defined contribution plan
UFML operates an approved contributory provident fund (defined contribution scheme) for all eligible employees.
Employee Stock Option Scheme
5.12.4 UBL (Switzerland) AG
5.13 Subordinated Debt
5.14 Borrowings / deposits
a) Borrowings / deposits are recorded at the amount of proceeds received.
b) The cost of borrowings / deposits is recognized on an accrual basis as an expense in the period in which it is incurred.
5.15 Revenue recognition
5.15.1 Advances and investments
Lease financing
Subordinated debt are initially recorded at the amount of proceeds received. Mark-up accrued on subordinated debt is
recognised separately as part of other liabilities and is charged to the profit and loss account over the period on an accrual
basis.
Revenue is recognized to the extent that the economic benefits associated with a transaction will flow to the Group and the
revenue can be reliably measured. The following recognition criteria must be met before revenue is recognized.
Mark-up / return / interest on performing advances and investments is recognized on a time proportionate basis over the
term of the advances and investments that takes into account the effective yield of the asset. Where debt securities are
purchased at a premium or discount, such premium / discount is amortized through the profit and loss account over the
remaining period of maturity of the debt securities.
Interest or mark-up recoverable on non-performing or classified advances and investments is recognized on a receipt
basis.
Income from lease financing is accounted for using the financing method. Under this method, the unearned lease income
(defined as the sum of total lease rentals and estimated residual value less the cost of the leased assets) is deferred and
taken to income over the term of the lease so as to produce a constant periodic rate of return on the outstanding net
investment in the lease. Gains or losses on termination of lease contracts are recognised through the profit and loss
account when these are realised. Unrealised lease income and other fees on classified leases are recognised on a receipt
basis.
UFML operates an approved funded gratuity scheme for all employees. Annual contributions to the fund are made on the
basis of actuarial advice using the Projected Unit Credit Method. Remeasurement gains and losses arising from
experience adjustments and changes in actuarial assumptions are recognized in other comprehensive income when they
occur with no subsequent recycling through the profit and loss account.
UBL Fund Managers provides an incentive scheme for its top performing employees in the form of share options under the
Employee Stock Option Scheme (ESOS). The scheme has been approved by the SECP.
UBL (Switzerland) AG maintains a contribution-oriented pension scheme for employees who have reached the age of 25.
It bears a large share of the costs of the occupational pension plan for all employees as well as their surviving dependents
pursuant to legal requirements. The employee benefit obligations and the assets serving as coverage are outsourced to a
collective insurance firm. The organization, management and financing of the pension plan comply with legal regulations,
the deed of foundation and the applicable regulations of the benefit plan.
18
NOTES TO AND FORMING PART OF THE CONSOLIDATED FINANCIAL STATEMENTS
FOR THE YEAR ENDED DECEMBER 31, 2019
5.15.2 Dividend income
Dividend income is recognised when the right to receive the dividend is established.
5.15.3 Fee, brokerage and commission income
Fee, brokerage and commission income is recognized on an accrual basis.
5.15.4 Grants
5.16 Foreign currencies
5.16.1 Functional and presentation currency
5.16.2 Foreign currency transactions
5.16.3 Foreign operations and subsidiaries
5.16.4 Translation gains and losses
5.16.5 Contingencies and commitments
Provision for claims under guarantees
5.17 Financial instruments
5.17.1 Financial assets and liabilities
Transactions in foreign currencies are translated to rupees at the foreign exchange rates prevailing on the transaction
date. Monetary assets and liabilities in foreign currencies are expressed in rupee terms at the rates of exchange prevailing
at the statement of financial position date. Forward foreign exchange contracts and foreign bills purchased are valued in
rupees at the forward foreign exchange rates applicable to their respective maturities.
Grants received are recorded as income when the right to receive the grant, based on the related expenditure having been
incurred, has been established.
Items included in these consolidated financial statements are measured using the currency of the primary economic
environment in which the Holding Company operates. These consolidated financial statements are presented in Pakistani
Rupees, which is the Group's functional and presentation currency.
A provision for claims under guarantees is recognised when intimated and reasonable certainty exists that the Bank will
settle the obligation. The charge to the profit and loss account is stated net of expected recoveries and the obligation is
recognised in other liabilities.
Non-monetary assets and liabilities in foreign currencies are expressed in rupee terms at the rates of exchange prevailing
at the date of initial recognition of the non-monetary assets / liabilities.
The assets and liabilities of foreign operations and subsidiaries are translated to rupees at exchange rates prevailing at
the statement of financial position date. The results of foreign operations and subsidiaries are translated at the average
rate of exchange for the year.
Translation gains and losses are taken to the profit and loss account, except those arising on translation of the net
investment in foreign branches and subsidiaries which are taken to capital reserves (Exchange Translation Reserve) until
the disposal of the net investment, at which time these are recognised in the profit and loss account.
Commitments for outstanding forward foreign exchange contracts are disclosed in these consolidated financial statements
at contracted rates. Contingent liabilities / commitments denominated in foreign currencies are expressed in rupee terms
at the rates of exchange prevailing at the statement of financial position date.
Financial assets and liabilities carried on the statement of financial position include cash and bank balances, lendings to
financial institutions, investments, advances, certain receivables, bills payable, borrowings from financial institutions,
deposits, subordinated loans and certain payables. The particular recognition methods adopted for significant financial
assets and financial liabilities are disclosed in the individual policy notes associated with them.
19
NOTES TO AND FORMING PART OF THE CONSOLIDATED FINANCIAL STATEMENTS
FOR THE YEAR ENDED DECEMBER 31, 2019
5.17.2 Derivative financial instruments
5.17.3 Off setting
5.18 Segment reporting
5.18.1 Business segments
(a) Corporate / Commercial Banking
(b) Treasury
(c) Branch Banking
(d) Islamic Banking
Represents branch operations of Islamic banking window of the Bank.
(e) International Branch Operations
Represents Bank's operations in 5 countries including two branches in export processing zones in Karachi and Sialkot.
(f) Subsidiaries
Represents operations by Bank's subsidiaries.
(g) Others
Others includes functions which cannot be classified in any of the above segments.
5.18.2 Geographical segments
The Group operates in following geographical regions:
- Pakistan
- Middle East
- United States of America
- Export Processing Zones in Karachi and Sialkot
- Europe
Includes deposits, lending and banking services to private individuals and small businesses including credit cards and
branchless banking.
A segment is a distinguishable component of the Group that is engaged either in providing particular products or services
(business segment), or in providing products or services within a particular economic environment (geographical
segment), and is subject to risks and rewards that are different from those of other segments.
Includes project, trade and working capital finance, import and export, factoring, leasing, lending, deposits and
guarantees. It also include services provided in connection with mergers and acquisitions and the underwriting /
arrangement of debt and equity instruments through syndications, Initial Public Offerings and private placements.
Includes fixed income, equity, foreign exchange, credit, funding, own position securities, lendings and borrowings and
derivatives for hedging and market making.
Derivative financial instruments are initially recognized at fair value on the date on which the derivative contract is entered
into and are subsequently re-measured at fair value using appropriate valuation techniques. All derivative financial
instruments are carried as assets when their fair value is positive and liabilities when their fair value is negative. Any
change in the fair value of derivative financial instruments during the period is taken to the profit and loss account.
Financial assets and financial liabilities are set-off and the net amount is reported in the consolidated financial statements
when there is a legally enforceable right to set-off and the Group intends to either settle on a net basis, or to realize the
assets and to settle the liabilities simultaneously.
20
NOTES TO AND FORMING PART OF THE CONSOLIDATED FINANCIAL STATEMENTS
FOR THE YEAR ENDED DECEMBER 31, 2019
5.19 Dividends and appropriations to reserves
5.20 Earnings per share
5.21 Acceptances
Note 2019 2018
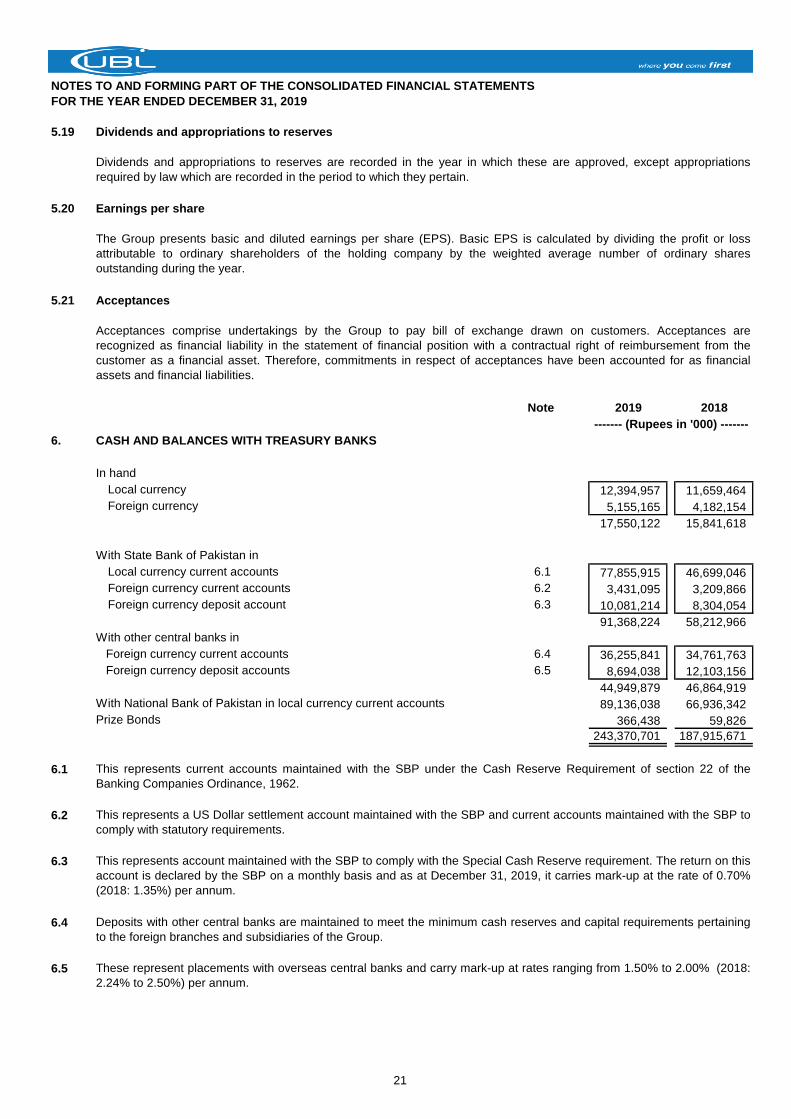
6. CASH AND BALANCES WITH TREASURY BANKS
In hand
Local currency 12,394,957 11,659,464
Foreign currency 5,155,165 4,182,154
17,550,122 15,841,618
With State Bank of Pakistan in
Local currency current accounts 6.1 77,855,915 46,699,046
Foreign currency current accounts 6.2 3,431,095 3,209,866
Foreign currency deposit account 6.3 10,081,214 8,304,054
91,368,224 58,212,966
With other central banks in
Foreign currency current accounts 6.4 36,255,841 34,761,763
Foreign currency deposit accounts 6.5 8,694,038 12,103,156
44,949,879 46,864,919
With National Bank of Pakistan in local currency current accounts 89,136,038 66,936,342
Prize Bonds 366,438 59,826
243,370,701 187,915,671
6.1
6.2
6.3
6.4
6.5
Dividends and appropriations to reserves are recorded in the year in which these are approved, except appropriations
required by law which are recorded in the period to which they pertain.
The Group presents basic and diluted earnings per share (EPS). Basic EPS is calculated by dividing the profit or loss
attributable to ordinary shareholders of the holding company by the weighted average number of ordinary shares
outstanding during the year.
Acceptances comprise undertakings by the Group to pay bill of exchange drawn on customers. Acceptances are
recognized as financial liability in the statement of financial position with a contractual right of reimbursement from the
customer as a financial asset. Therefore, commitments in respect of acceptances have been accounted for as financial
assets and financial liabilities.
These represent placements with overseas central banks and carry mark-up at rates ranging from 1.50% to 2.00% (2018:
2.24% to 2.50%) per annum.
------- (Rupees in '000) -------
This represents current accounts maintained with the SBP under the Cash Reserve Requirement of section 22 of the
Banking Companies Ordinance, 1962.
This represents a US Dollar settlement account maintained with the SBP and current accounts maintained with the SBP to
comply with statutory requirements.
This represents account maintained with the SBP to comply with the Special Cash Reserve requirement. The return on this
account is declared by the SBP on a monthly basis and as at December 31, 2019, it carries mark-up at the rate of 0.70%
(2018: 1.35%) per annum.
Deposits with other central banks are maintained to meet the minimum cash reserves and capital requirements pertaining
to the foreign branches and subsidiaries of the Group.
21
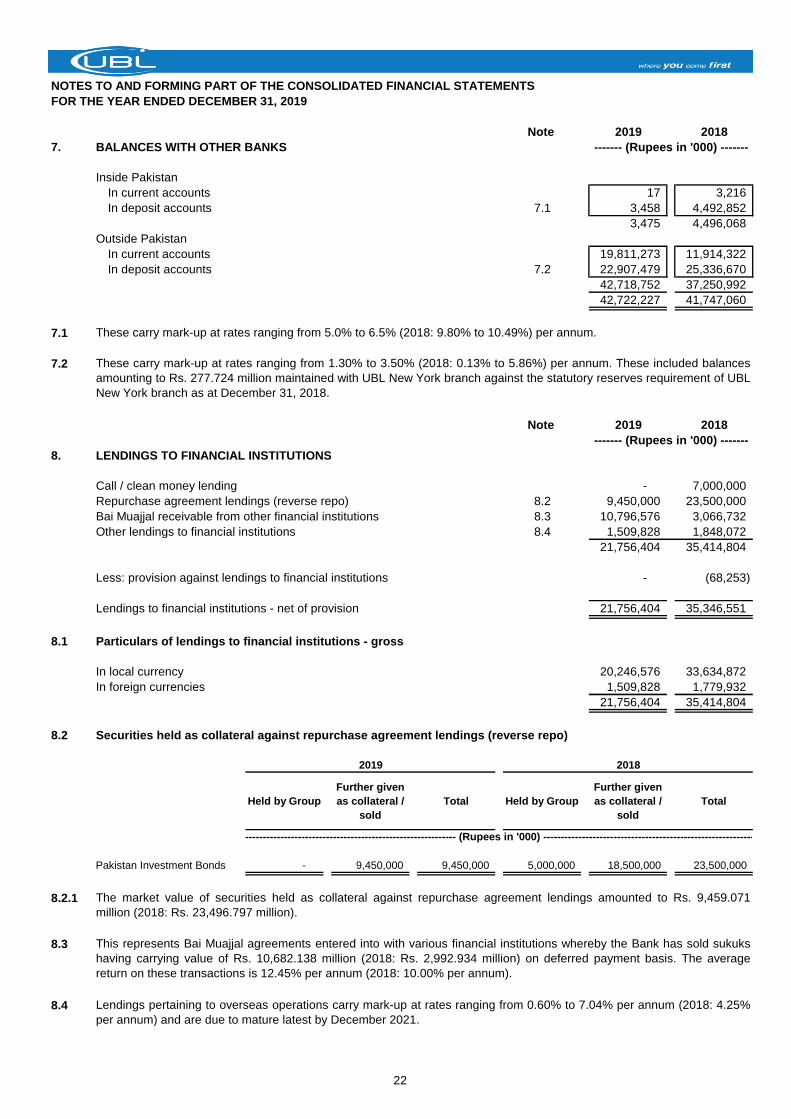
NOTES TO AND FORMING PART OF THE CONSOLIDATED FINANCIAL STATEMENTS
FOR THE YEAR ENDED DECEMBER 31, 2019
Note 2019 2018
7. BALANCES WITH OTHER BANKS
Inside Pakistan
In current accounts 17 3,216
In deposit accounts 7.1 3,458 4,492,852
3,475 4,496,068
Outside Pakistan
In current accounts 19,811,273 11,914,322
In deposit accounts 7.2 22,907,479 25,336,670
42,718,752 37,250,992
42,722,227 41,747,060
7.1
7.2
Note 2019 2018
8. LENDINGS TO FINANCIAL INSTITUTIONS
Call / clean money lending - 7,000,000
Repurchase agreement lendings (reverse repo) 8.2 9,450,000 23,500,000
Bai Muajjal receivable from other financial institutions 8.3 10,796,576 3,066,732
Other lendings to financial institutions 8.4 1,509,828 1,848,072
21,756,404 35,414,804
Less: provision against lendings to financial institutions - (68,253)
Lendings to financial institutions - net of provision 21,756,404 35,346,551
8.1 Particulars of lendings to financial institutions - gross
In local currency 20,246,576 33,634,872
In foreign currencies 1,509,828 1,779,932
21,756,404 35,414,804
8.2 Securities held as collateral against repurchase agreement lendings (reverse repo)
2018
Held by Group
Further given
as collateral /
sold
Total Held by Group
Further given
as collateral /
sold
Total
Pakistan Investment Bonds - 9,450,000 9,450,000 5,000,000 18,500,000 23,500,000
8.2.1
8.3
8.4
------- (Rupees in '000) -------
These carry mark-up at rates ranging from 5.0% to 6.5% (2018: 9.80% to 10.49%) per annum.
These carry mark-up at rates ranging from 1.30% to 3.50% (2018: 0.13% to 5.86%) per annum. These included balances
amounting to Rs. 277.724 million maintained with UBL New York branch against the statutory reserves requirement of UBL
New York branch as at December 31, 2018.
------- (Rupees in '000) -------
2019
------------------------------------------------------------- (Rupees in '000) -------------------------------------------------------------
This represents Bai Muajjal agreements entered into with various financial institutions whereby the Bank has sold sukuks
having carrying value of Rs. 10,682.138 million (2018: Rs. 2,992.934 million) on deferred payment basis. The average
return on these transactions is 12.45% per annum (2018: 10.00% per annum).
Lendings pertaining to overseas operations carry mark-up at rates ranging from 0.60% to 7.04% per annum (2018: 4.25%
per annum) and are due to mature latest by December 2021.
The market value of securities held as collateral against repurchase agreement lendings amounted to Rs. 9,459.071
million (2018: Rs. 23,496.797 million).
22
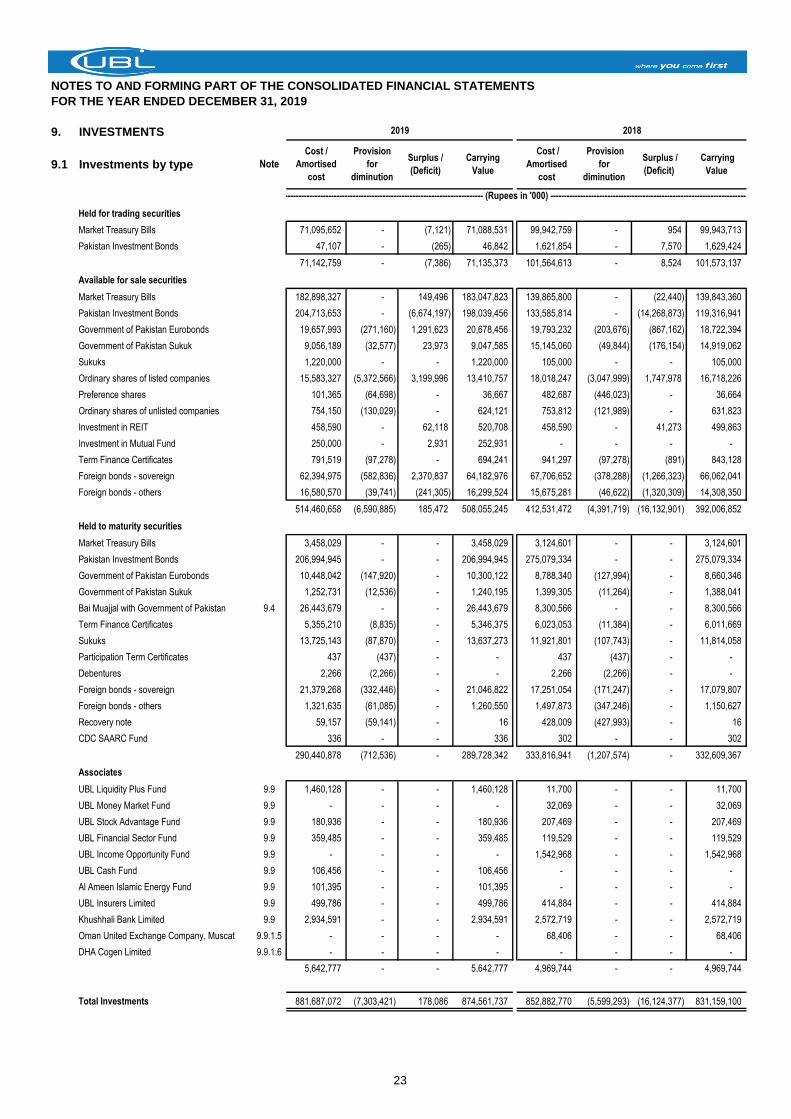
NOTES TO AND FORMING PART OF THE CONSOLIDATED FINANCIAL STATEMENTS
FOR THE YEAR ENDED DECEMBER 31, 2019
9. INVESTMENTS
9.1 Investments by type
Held for trading securities
Market Treasury Bills 71,095,652 - (7,121) 71,088,531 99,942,759 - 954 99,943,713
Pakistan Investment Bonds 47,107 - (265) 46,842 1,621,854 - 7,570 1,629,424
71,142,759 - (7,386) 71,135,373 101,564,613 - 8,524 101,573,137
Available for sale securities
Market Treasury Bills 182,898,327 - 149,496 183,047,823 139,865,800 - (22,440) 139,843,360
Pakistan Investment Bonds 204,713,653 - (6,674,197) 198,039,456 133,585,814 - (14,268,873) 119,316,941
Government of Pakistan Eurobonds 19,657,993 (271,160) 1,291,623 20,678,456 19,793,232 (203,676) (867,162) 18,722,394
Government of Pakistan Sukuk 9,056,189 (32,577) 23,973 9,047,585 15,145,060 (49,844) (176,154) 14,919,062
Sukuks 1,220,000 - - 1,220,000 105,000 - - 105,000
Ordinary shares of listed companies 15,583,327 (5,372,566) 3,199,996 13,410,757 18,018,247 (3,047,999) 1,747,978 16,718,226
Preference shares 101,365 (64,698) - 36,667 482,687 (446,023) - 36,664
Ordinary shares of unlisted companies 754,150 (130,029) - 624,121 753,812 (121,989) - 631,823
Investment in REIT 458,590 - 62,118 520,708 458,590 - 41,273 499,863
Investment in Mutual Fund 250,000 - 2,931 252,931 - - - -
Term Finance Certificates 791,519 (97,278) - 694,241 941,297 (97,278) (891) 843,128
Foreign bonds - sovereign 62,394,975 (582,836) 2,370,837 64,182,976 67,706,652 (378,288) (1,266,323) 66,062,041
Foreign bonds - others 16,580,570 (39,741) (241,305) 16,299,524 15,675,281 (46,622) (1,320,309) 14,308,350
514,460,658 (6,590,885) 185,472 508,055,245 412,531,472 (4,391,719) (16,132,901) 392,006,852
Held to maturity securities
Market Treasury Bills 3,458,029 - - 3,458,029 3,124,601 - - 3,124,601
Pakistan Investment Bonds 206,994,945 - - 206,994,945 275,079,334 - - 275,079,334
Government of Pakistan Eurobonds 10,448,042 (147,920) - 10,300,122 8,788,340 (127,994) - 8,660,346
Government of Pakistan Sukuk 1,252,731 (12,536) - 1,240,195 1,399,305 (11,264) - 1,388,041
Bai Muajjal with Government of Pakistan 9.4 26,443,679 - - 26,443,679 8,300,566 - - 8,300,566
Term Finance Certificates 5,355,210 (8,835) - 5,346,375 6,023,053 (11,384) - 6,011,669
Sukuks 13,725,143 (87,870) - 13,637,273 11,921,801 (107,743) - 11,814,058
Participation Term Certificates 437 (437) - - 437 (437) - -
Debentures 2,266 (2,266) - - 2,266 (2,266) - -
Foreign bonds - sovereign 21,379,268 (332,446) - 21,046,822 17,251,054 (171,247) - 17,079,807
Foreign bonds - others 1,321,635 (61,085) - 1,260,550 1,497,873 (347,246) - 1,150,627
Recovery note 59,157 (59,141) - 16 428,009 (427,993) - 16
CDC SAARC Fund 336 - - 336 302 - - 302
290,440,878 (712,536) - 289,728,342 333,816,941 (1,207,574) - 332,609,367
Associates
UBL Liquidity Plus Fund 9.9 1,460,128 - - 1,460,128 11,700 - - 11,700
UBL Money Market Fund 9.9 - - - - 32,069 - - 32,069
UBL Stock Advantage Fund 9.9 180,936 - - 180,936 207,469 - - 207,469
UBL Financial Sector Fund 9.9 359,485 - - 359,485 119,529 - - 119,529
UBL Income Opportunity Fund 9.9 - - - - 1,542,968 - - 1,542,968
UBL Cash Fund 9.9 106,456 - - 106,456 - - - -
Al Ameen Islamic Energy Fund 9.9 101,395 - - 101,395 - - - -
UBL Insurers Limited 9.9 499,786 - - 499,786 414,884 - - 414,884
Khushhali Bank Limited 9.9 2,934,591 - - 2,934,591 2,572,719 - - 2,572,719
Oman United Exchange Company, Muscat 9.9.1.5 - - - - 68,406 - - 68,406
DHA Cogen Limited 9.9.1.6 - - - - - - - -
5,642,777 - - 5,642,777 4,969,744 - - 4,969,744
Total Investments 881,687,072 (7,303,421) 178,086 874,561,737 852,882,770 (5,599,293) (16,124,377) 831,159,100
Carrying
Value
-------------------------------------------------------------------------- (Rupees in '000) --------------------------------------------------------------------------
2019 2018
Note
Cost /
Amortised
cost
Provision
for
diminution
Surplus /
(Deficit)
Carrying
Value
Cost /
Amortised
cost
Provision
for
diminution
Surplus /
(Deficit)
23
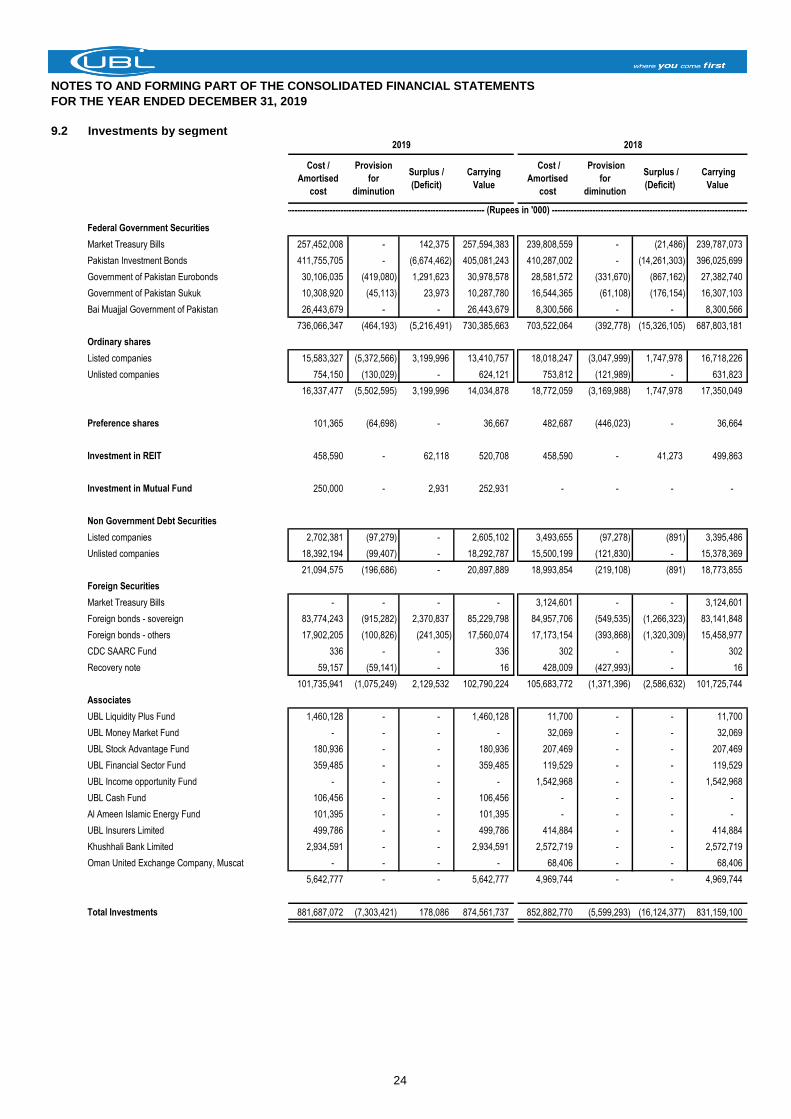
NOTES TO AND FORMING PART OF THE CONSOLIDATED FINANCIAL STATEMENTS
FOR THE YEAR ENDED DECEMBER 31, 2019
9.2 Investments by segment
Federal Government Securities
Market Treasury Bills 257,452,008 - 142,375 257,594,383 239,808,559 - (21,486) 239,787,073
Pakistan Investment Bonds 411,755,705 - (6,674,462) 405,081,243 410,287,002 - (14,261,303) 396,025,699
Government of Pakistan Eurobonds 30,106,035 (419,080) 1,291,623 30,978,578 28,581,572 (331,670) (867,162) 27,382,740
Government of Pakistan Sukuk 10,308,920 (45,113) 23,973 10,287,780 16,544,365 (61,108) (176,154) 16,307,103
Bai Muajjal Government of Pakistan 26,443,679 - - 26,443,679 8,300,566 - - 8,300,566
736,066,347 (464,193) (5,216,491) 730,385,663 703,522,064 (392,778) (15,326,105) 687,803,181
Ordinary shares
Listed companies 15,583,327 (5,372,566) 3,199,996 13,410,757 18,018,247 (3,047,999) 1,747,978 16,718,226
Unlisted companies 754,150 (130,029) - 624,121 753,812 (121,989) - 631,823
16,337,477 (5,502,595) 3,199,996 14,034,878 18,772,059 (3,169,988) 1,747,978 17,350,049
Preference shares 101,365 (64,698) - 36,667 482,687 (446,023) - 36,664
Investment in REIT 458,590 - 62,118 520,708 458,590 - 41,273 499,863
Investment in Mutual Fund 250,000 - 2,931 252,931 - - - -
Non Government Debt Securities
Listed companies 2,702,381 (97,279) - 2,605,102 3,493,655 (97,278) (891) 3,395,486
Unlisted companies 18,392,194 (99,407) - 18,292,787 15,500,199 (121,830) - 15,378,369
21,094,575 (196,686) - 20,897,889 18,993,854 (219,108) (891) 18,773,855
Foreign Securities
Market Treasury Bills - - - - 3,124,601 - - 3,124,601
Foreign bonds - sovereign 83,774,243 (915,282) 2,370,837 85,229,798 84,957,706 (549,535) (1,266,323) 83,141,848
Foreign bonds - others 17,902,205 (100,826) (241,305) 17,560,074 17,173,154 (393,868) (1,320,309) 15,458,977
CDC SAARC Fund 336 - - 336 302 - - 302
Recovery note 59,157 (59,141) - 16 428,009 (427,993) - 16
101,735,941 (1,075,249) 2,129,532 102,790,224 105,683,772 (1,371,396) (2,586,632) 101,725,744
Associates
UBL Liquidity Plus Fund 1,460,128 - - 1,460,128 11,700 - - 11,700
UBL Money Market Fund - - - - 32,069 - - 32,069
UBL Stock Advantage Fund 180,936 - - 180,936 207,469 - - 207,469
UBL Financial Sector Fund 359,485 - - 359,485 119,529 - - 119,529
UBL Income opportunity Fund - - - - 1,542,968 - - 1,542,968
UBL Cash Fund 106,456 - - 106,456 - - - -
Al Ameen Islamic Energy Fund 101,395 - - 101,395 - - - -
UBL Insurers Limited 499,786 - - 499,786 414,884 - - 414,884
Khushhali Bank Limited 2,934,591 - - 2,934,591 2,572,719 - - 2,572,719
Oman United Exchange Company, Muscat - - - - 68,406 - - 68,406
5,642,777 - - 5,642,777 4,969,744 - - 4,969,744
Total Investments 881,687,072 (7,303,421) 178,086 874,561,737 852,882,770 (5,599,293) (16,124,377) 831,159,100
-------------------------------------------------------------------------- (Rupees in '000) --------------------------------------------------------------------------
2019 2018
Cost /
Amortised
cost
Provision
for
diminution
Surplus /
(Deficit)
Carrying
Value
Cost /
Amortised
cost
Provision
for
diminution
Surplus /
(Deficit)
Carrying
Value
24
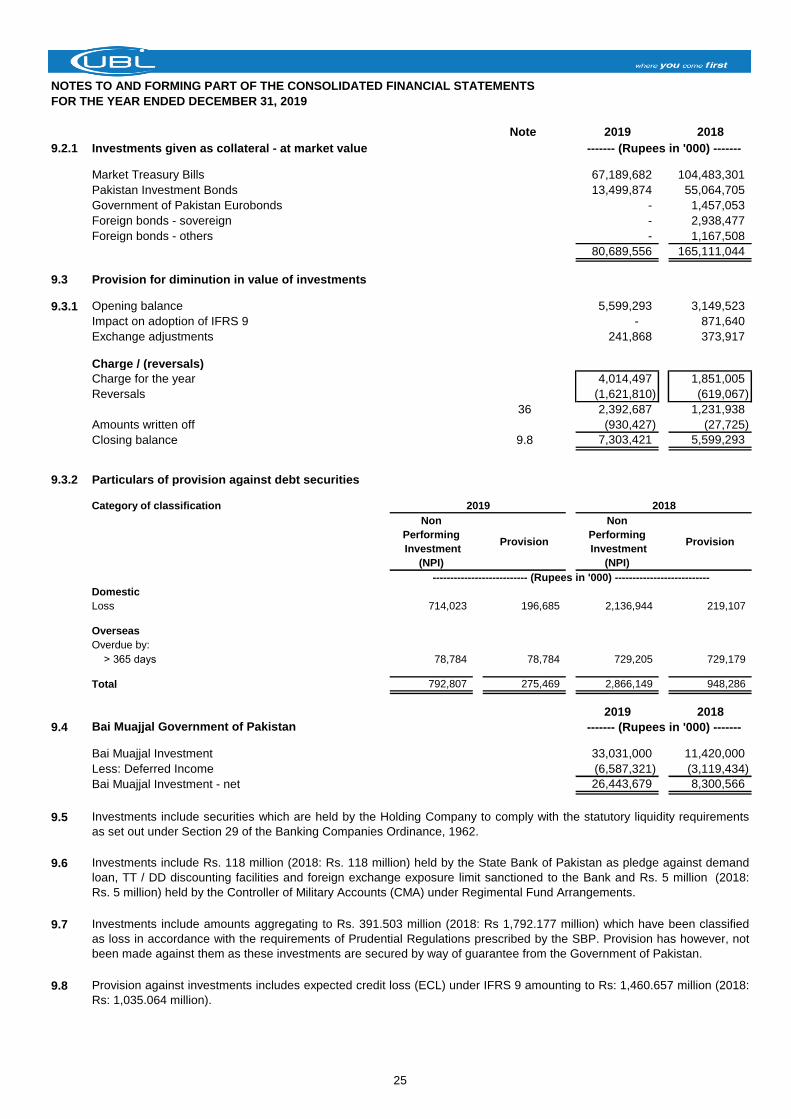
NOTES TO AND FORMING PART OF THE CONSOLIDATED FINANCIAL STATEMENTS
FOR THE YEAR ENDED DECEMBER 31, 2019
Note 2019 2018
9.2.1 Investments given as collateral - at market value
Market Treasury Bills 67,189,682 104,483,301
Pakistan Investment Bonds 13,499,874 55,064,705
Government of Pakistan Eurobonds - 1,457,053
Foreign bonds - sovereign - 2,938,477
Foreign bonds - others - 1,167,508
80,689,556 165,111,044
9.3 Provision for diminution in value of investments
9.3.1 Opening balance 5,599,293 3,149,523
Impact on adoption of IFRS 9 - 871,640
Exchange adjustments 241,868 373,917
Charge / (reversals)
Charge for the year 4,014,497 1,851,005
Reversals (1,621,810) (619,067)
36 2,392,687 1,231,938
Amounts written off (930,427) (27,725)
Closing balance 9.8 7,303,421 5,599,293
9.3.2 Particulars of provision against debt securities
Category of classification 2018
Non
Performing
Investment
(NPI)
Provision
Non
Performing
Investment
(NPI)
Provision
Domestic
Loss 714,023 196,685 2,136,944 219,107
Overseas
Overdue by:
˃ 365 days 78,784 78,784 729,205 729,179
Total 792,807 275,469 2,866,149 948,286
2019 2018
9.4 Bai Muajjal Government of Pakistan
Bai Muajjal Investment 33,031,000 11,420,000
Less: Deferred Income (6,587,321) (3,119,434)
Bai Muajjal Investment - net 26,443,679 8,300,566
9.5
9.6
9.7
9.8 Provision against investments includes expected credit loss (ECL) under IFRS 9 amounting to Rs: 1,460.657 million (2018:
Rs: 1,035.064 million).
Investments include amounts aggregating to Rs. 391.503 million (2018: Rs 1,792.177 million) which have been classified
as loss in accordance with the requirements of Prudential Regulations prescribed by the SBP. Provision has however, not
been made against them as these investments are secured by way of guarantee from the Government of Pakistan.
------- (Rupees in '000) -------
2019
--------------------------- (Rupees in '000) ---------------------------
------- (Rupees in '000) -------
Investments include securities which are held by the Holding Company to comply with the statutory liquidity requirements
as set out under Section 29 of the Banking Companies Ordinance, 1962.
Investments include Rs. 118 million (2018: Rs. 118 million) held by the State Bank of Pakistan as pledge against demand
loan, TT / DD discounting facilities and foreign exchange exposure limit sanctioned to the Bank and Rs. 5 million (2018:
Rs. 5 million) held by the Controller of Military Accounts (CMA) under Regimental Fund Arrangements.
25
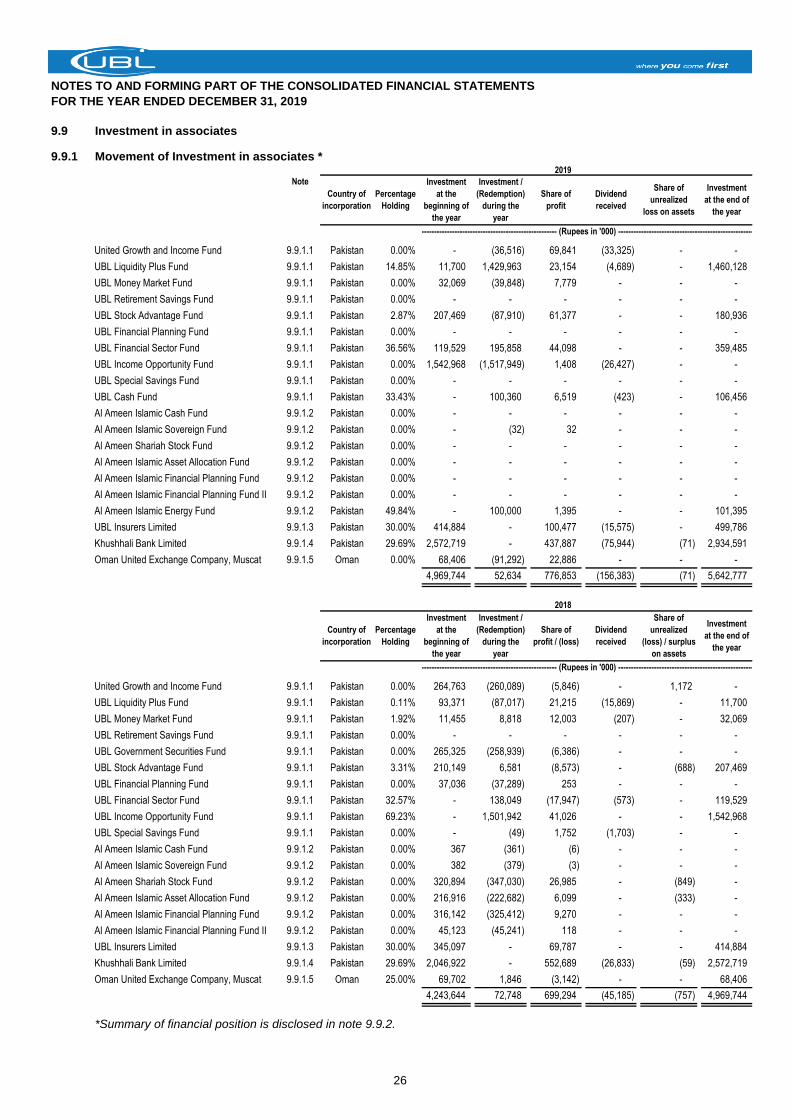
NOTES TO AND FORMING PART OF THE CONSOLIDATED FINANCIAL STATEMENTS
FOR THE YEAR ENDED DECEMBER 31, 2019
9.9 Investment in associates
9.9.1 Movement of Investment in associates *2019
Note
United Growth and Income Fund 9.9.1.1 Pakistan 0.00% - (36,516) 69,841 (33,325) - -
UBL Liquidity Plus Fund 9.9.1.1 Pakistan 14.85% 11,700 1,429,963 23,154 (4,689) - 1,460,128
UBL Money Market Fund 9.9.1.1 Pakistan 0.00% 32,069 (39,848) 7,779 - - -
UBL Retirement Savings Fund 9.9.1.1 Pakistan 0.00% - - - - - -
UBL Stock Advantage Fund 9.9.1.1 Pakistan 2.87% 207,469 (87,910) 61,377 - - 180,936
UBL Financial Planning Fund 9.9.1.1 Pakistan 0.00% - - - - - -
UBL Financial Sector Fund 9.9.1.1 Pakistan 36.56% 119,529 195,858 44,098 - - 359,485
UBL Income Opportunity Fund 9.9.1.1 Pakistan 0.00% 1,542,968 (1,517,949) 1,408 (26,427) - -
UBL Special Savings Fund 9.9.1.1 Pakistan 0.00% - - - - - -
UBL Cash Fund 9.9.1.1 Pakistan 33.43% - 100,360 6,519 (423) - 106,456
Al Ameen Islamic Cash Fund 9.9.1.2 Pakistan 0.00% - - - - - -
Al Ameen Islamic Sovereign Fund 9.9.1.2 Pakistan 0.00% - (32) 32 - - -
Al Ameen Shariah Stock Fund 9.9.1.2 Pakistan 0.00% - - - - - -
Al Ameen Islamic Asset Allocation Fund 9.9.1.2 Pakistan 0.00% - - - - - -
Al Ameen Islamic Financial Planning Fund 9.9.1.2 Pakistan 0.00% - - - - - -
Al Ameen Islamic Financial Planning Fund II 9.9.1.2 Pakistan 0.00% - - - - - -
Al Ameen Islamic Energy Fund 9.9.1.2 Pakistan 49.84% - 100,000 1,395 - - 101,395
UBL Insurers Limited 9.9.1.3 Pakistan 30.00% 414,884 - 100,477 (15,575) - 499,786
Khushhali Bank Limited 9.9.1.4 Pakistan 29.69% 2,572,719 - 437,887 (75,944) (71) 2,934,591
Oman United Exchange Company, Muscat 9.9.1.5 Oman 0.00% 68,406 (91,292) 22,886 - - -
4,969,744 52,634 776,853 (156,383) (71) 5,642,777
2018
United Growth and Income Fund 9.9.1.1 Pakistan 0.00% 264,763 (260,089) (5,846) - 1,172 -
UBL Liquidity Plus Fund 9.9.1.1 Pakistan 0.11% 93,371 (87,017) 21,215 (15,869) - 11,700
UBL Money Market Fund 9.9.1.1 Pakistan 1.92% 11,455 8,818 12,003 (207) - 32,069
UBL Retirement Savings Fund 9.9.1.1 Pakistan 0.00% - - - - - -
UBL Government Securities Fund 9.9.1.1 Pakistan 0.00% 265,325 (258,939) (6,386) - - -
UBL Stock Advantage Fund 9.9.1.1 Pakistan 3.31% 210,149 6,581 (8,573) - (688) 207,469
UBL Financial Planning Fund 9.9.1.1 Pakistan 0.00% 37,036 (37,289) 253 - - -
UBL Financial Sector Fund 9.9.1.1 Pakistan 32.57% - 138,049 (17,947) (573) - 119,529
UBL Income Opportunity Fund 9.9.1.1 Pakistan 69.23% - 1,501,942 41,026 - - 1,542,968
UBL Special Savings Fund 9.9.1.1 Pakistan 0.00% - (49) 1,752 (1,703) - -
Al Ameen Islamic Cash Fund 9.9.1.2 Pakistan 0.00% 367 (361) (6) - - -
Al Ameen Islamic Sovereign Fund 9.9.1.2 Pakistan 0.00% 382 (379) (3) - - -
Al Ameen Shariah Stock Fund 9.9.1.2 Pakistan 0.00% 320,894 (347,030) 26,985 - (849) -
Al Ameen Islamic Asset Allocation Fund 9.9.1.2 Pakistan 0.00% 216,916 (222,682) 6,099 - (333) -
Al Ameen Islamic Financial Planning Fund 9.9.1.2 Pakistan 0.00% 316,142 (325,412) 9,270 - - -
Al Ameen Islamic Financial Planning Fund II 9.9.1.2 Pakistan 0.00% 45,123 (45,241) 118 - - -
UBL Insurers Limited 9.9.1.3 Pakistan 30.00% 345,097 - 69,787 - - 414,884
Khushhali Bank Limited 9.9.1.4 Pakistan 29.69% 2,046,922 - 552,689 (26,833) (59) 2,572,719
Oman United Exchange Company, Muscat 9.9.1.5 Oman 25.00% 69,702 1,846 (3,142) - - 68,406
4,243,644 72,748 699,294 (45,185) (757) 4,969,744
*Summary of financial position is disclosed in note 9.9.2.
------------------------------------------------------------- (Rupees in '000) -------------------------------------------------------------
Country of
incorporation
Country of
incorporation
Investment
at the end of
the year
Percentage
Holding
Investment
at the
beginning of
the year
Investment /
(Redemption)
during the
year
Share of
profit / (loss)
Dividend
received
Share of
unrealized
(loss) / surplus
on assets
Investment
at the end of
the year
Percentage
Holding
Investment
at the
beginning of
the year
Investment /
(Redemption)
during the
year
Share of
profit
Dividend
received
Share of
unrealized
loss on assets
------------------------------------------------------------- (Rupees in '000) -------------------------------------------------------------
26
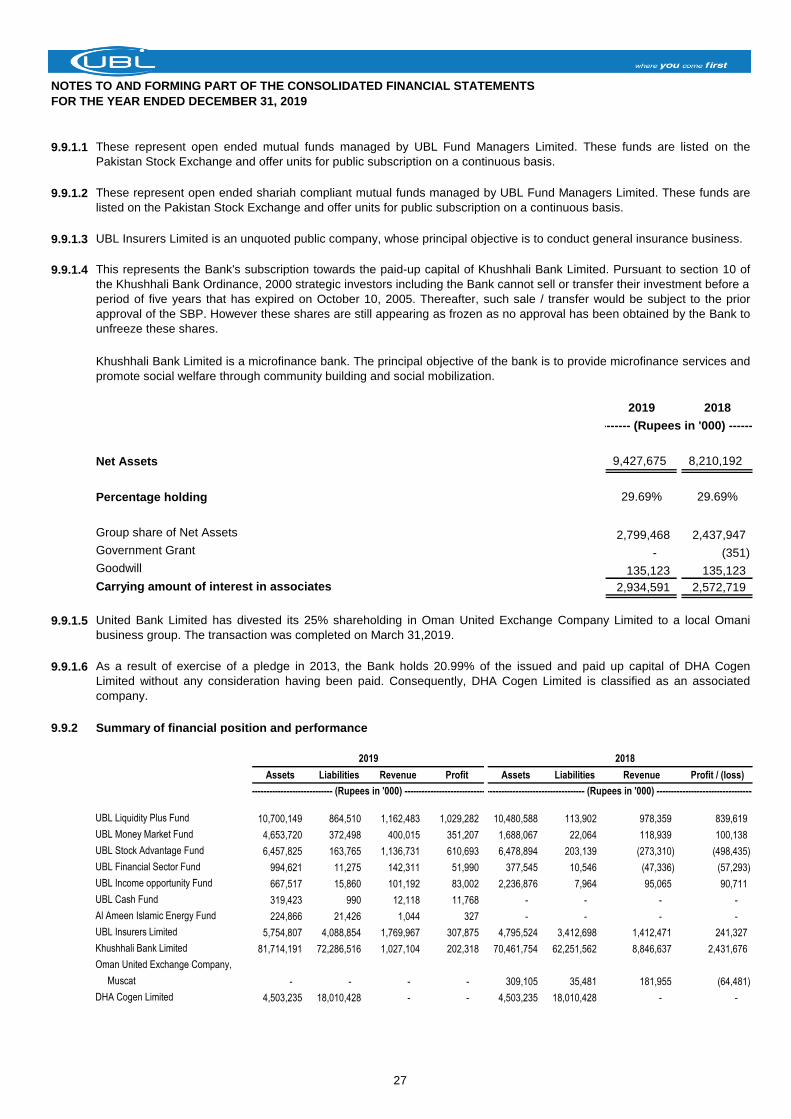
NOTES TO AND FORMING PART OF THE CONSOLIDATED FINANCIAL STATEMENTS
FOR THE YEAR ENDED DECEMBER 31, 2019
9.9.1.1
9.9.1.2
9.9.1.3 UBL Insurers Limited is an unquoted public company, whose principal objective is to conduct general insurance business.
9.9.1.4
2019 2018
Net Assets 9,427,675 8,210,192
Percentage holding 29.69% 29.69%
Group share of Net Assets 2,799,468 2,437,947
Government Grant - (351)
Goodwill 135,123 135,123
Carrying amount of interest in associates 2,934,591 2,572,719
9.9.1.5
9.9.1.6
9.9.2 Summary of financial position and performance
2019 2018
Assets Liabilities Revenue Profit Assets Liabilities Revenue Profit / (loss)
UBL Liquidity Plus Fund 10,700,149 864,510 1,162,483 1,029,282 10,480,588 113,902 978,359 839,619
UBL Money Market Fund 4,653,720 372,498 400,015 351,207 1,688,067 22,064 118,939 100,138
UBL Stock Advantage Fund 6,457,825 163,765 1,136,731 610,693 6,478,894 203,139 (273,310) (498,435)
UBL Financial Sector Fund 994,621 11,275 142,311 51,990 377,545 10,546 (47,336) (57,293)
UBL Income opportunity Fund 667,517 15,860 101,192 83,002 2,236,876 7,964 95,065 90,711
UBL Cash Fund 319,423 990 12,118 11,768 - - - -
Al Ameen Islamic Energy Fund 224,866 21,426 1,044 327 - - - -
UBL Insurers Limited 5,754,807 4,088,854 1,769,967 307,875 4,795,524 3,412,698 1,412,471 241,327
Khushhali Bank Limited 81,714,191 72,286,516 1,027,104 202,318 70,461,754 62,251,562 8,846,637 2,431,676
Oman United Exchange Company,
Muscat - - - - 309,105 35,481 181,955 (64,481)
DHA Cogen Limited 4,503,235 18,010,428 - - 4,503,235 18,010,428 - -
United Bank Limited has divested its 25% shareholding in Oman United Exchange Company Limited to a local Omani
business group. The transaction was completed on March 31,2019.
As a result of exercise of a pledge in 2013, the Bank holds 20.99% of the issued and paid up capital of DHA Cogen
Limited without any consideration having been paid. Consequently, DHA Cogen Limited is classified as an associated
company.
--------------------------------------------- (Rupees in '000) ------------------------------------------------------------------------------------------ (Rupees in '000) ---------------------------------------------
These represent open ended mutual funds managed by UBL Fund Managers Limited. These funds are listed on the
Pakistan Stock Exchange and offer units for public subscription on a continuous basis.
These represent open ended shariah compliant mutual funds managed by UBL Fund Managers Limited. These funds are
listed on the Pakistan Stock Exchange and offer units for public subscription on a continuous basis.
This represents the Bank's subscription towards the paid-up capital of Khushhali Bank Limited. Pursuant to section 10 of
the Khushhali Bank Ordinance, 2000 strategic investors including the Bank cannot sell or transfer their investment before a
period of five years that has expired on October 10, 2005. Thereafter, such sale / transfer would be subject to the prior
approval of the SBP. However these shares are still appearing as frozen as no approval has been obtained by the Bank to
unfreeze these shares.
------- (Rupees in '000) -------
Khushhali Bank Limited is a microfinance bank. The principal objective of the bank is to provide microfinance services and
promote social welfare through community building and social mobilization.
27
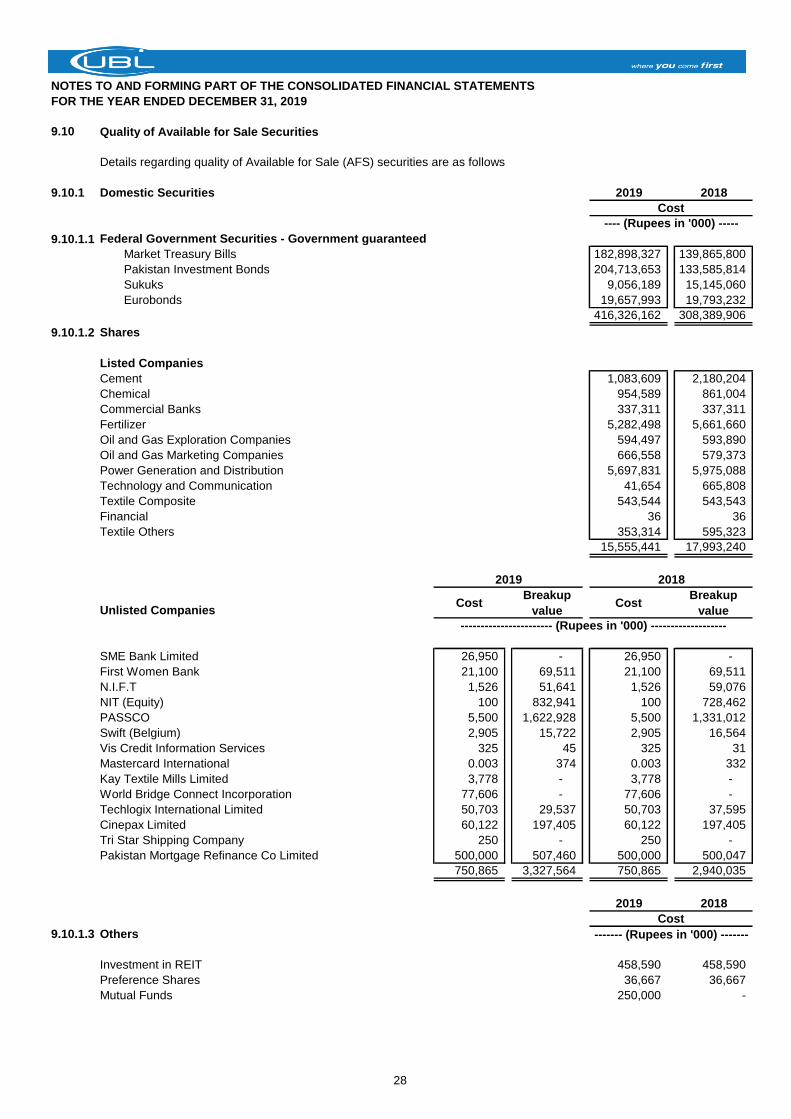
NOTES TO AND FORMING PART OF THE CONSOLIDATED FINANCIAL STATEMENTS
FOR THE YEAR ENDED DECEMBER 31, 2019
9.10 Quality of Available for Sale Securities
Details regarding quality of Available for Sale (AFS) securities are as follows
9.10.1 Domestic Securities 2019 2018
---- (Rupees in '000) -----
9.10.1.1 Federal Government Securities - Government guaranteed
Market Treasury Bills 182,898,327 139,865,800
Pakistan Investment Bonds 204,713,653 133,585,814
Sukuks 9,056,189 15,145,060
Eurobonds 19,657,993 19,793,232
416,326,162 308,389,906
9.10.1.2 Shares
Listed Companies
Cement 1,083,609 2,180,204
Chemical 954,589 861,004
Commercial Banks 337,311 337,311
Fertilizer 5,282,498 5,661,660
Oil and Gas Exploration Companies 594,497 593,890
Oil and Gas Marketing Companies 666,558 579,373
Power Generation and Distribution 5,697,831 5,975,088
Technology and Communication 41,654 665,808
Textile Composite 543,544 543,543
Financial 36 36
Textile Others 353,314 595,323
15,555,441 17,993,240
Unlisted CompaniesCost
Breakup
valueCost
Breakup
value
----------------------- (Rupees in '000) -------------------
SME Bank Limited 26,950 - 26,950 -
First Women Bank 21,100 69,511 21,100 69,511
N.I.F.T 1,526 51,641 1,526 59,076
NIT (Equity) 100 832,941 100 728,462
PASSCO 5,500 1,622,928 5,500 1,331,012
Swift (Belgium) 2,905 15,722 2,905 16,564
Vis Credit Information Services 325 45 325 31
Mastercard International 0.003 374 0.003 332
Kay Textile Mills Limited 3,778 - 3,778 -
World Bridge Connect Incorporation 77,606 - 77,606 -
Techlogix International Limited 50,703 29,537 50,703 37,595
Cinepax Limited 60,122 197,405 60,122 197,405
Tri Star Shipping Company 250 - 250 -
Pakistan Mortgage Refinance Co Limited 500,000 507,460 500,000 500,047
750,865 3,327,564 750,865 2,940,035
2019 2018
9.10.1.3 Others
Investment in REIT 458,590 458,590
Preference Shares 36,667 36,667
Mutual Funds 250,000 -
2019 2018
Cost
------- (Rupees in '000) -------
Cost
28
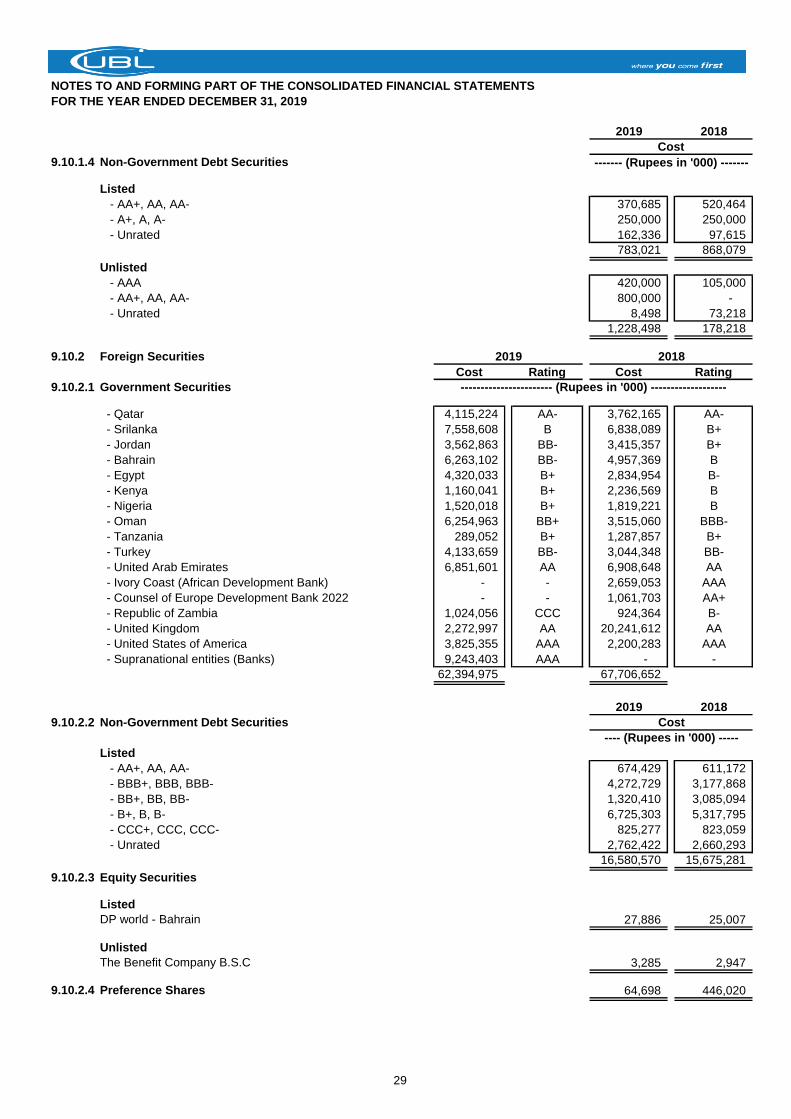
NOTES TO AND FORMING PART OF THE CONSOLIDATED FINANCIAL STATEMENTS
FOR THE YEAR ENDED DECEMBER 31, 2019
2019 2018
9.10.1.4 Non-Government Debt Securities
Listed
- AA+, AA, AA- 370,685 520,464
- A+, A, A- 250,000 250,000
- Unrated 162,336 97,615
783,021 868,079
Unlisted
- AAA 420,000 105,000
- AA+, AA, AA- 800,000 -
- Unrated 8,498 73,218
1,228,498 178,218
9.10.2 Foreign Securities
Cost Rating Cost Rating
9.10.2.1 Government Securities ----------------------- (Rupees in '000) -------------------
- Qatar 4,115,224 AA- 3,762,165 AA-
- Srilanka 7,558,608 B 6,838,089 B+
- Jordan 3,562,863 BB- 3,415,357 B+
- Bahrain 6,263,102 BB- 4,957,369 B
- Egypt 4,320,033 B+ 2,834,954 B-
- Kenya 1,160,041 B+ 2,236,569 B
- Nigeria 1,520,018 B+ 1,819,221 B
- Oman 6,254,963 BB+ 3,515,060 BBB-
- Tanzania 289,052 B+ 1,287,857 B+
- Turkey 4,133,659 BB- 3,044,348 BB-
- United Arab Emirates 6,851,601 AA 6,908,648 AA
- Ivory Coast (African Development Bank) - - 2,659,053 AAA
- Counsel of Europe Development Bank 2022 - - 1,061,703 AA+
- Republic of Zambia 1,024,056 CCC 924,364 B-
- United Kingdom 2,272,997 AA 20,241,612 AA
- United States of America 3,825,355 AAA 2,200,283 AAA
- Supranational entities (Banks) 9,243,403 AAA - -
62,394,975 67,706,652
2019 2018
9.10.2.2 Non-Government Debt Securities
Listed
- AA+, AA, AA- 674,429 611,172
- BBB+, BBB, BBB- 4,272,729 3,177,868
- BB+, BB, BB- 1,320,410 3,085,094
- B+, B, B- 6,725,303 5,317,795
- CCC+, CCC, CCC- 825,277 823,059
- Unrated 2,762,422 2,660,293
16,580,570 15,675,281
9.10.2.3 Equity Securities
Listed
DP world - Bahrain 27,886 25,007
Unlisted
The Benefit Company B.S.C 3,285 2,947
9.10.2.4 Preference Shares 64,698 446,020
2019 2018
Cost
------- (Rupees in '000) -------
Cost
---- (Rupees in '000) -----
29
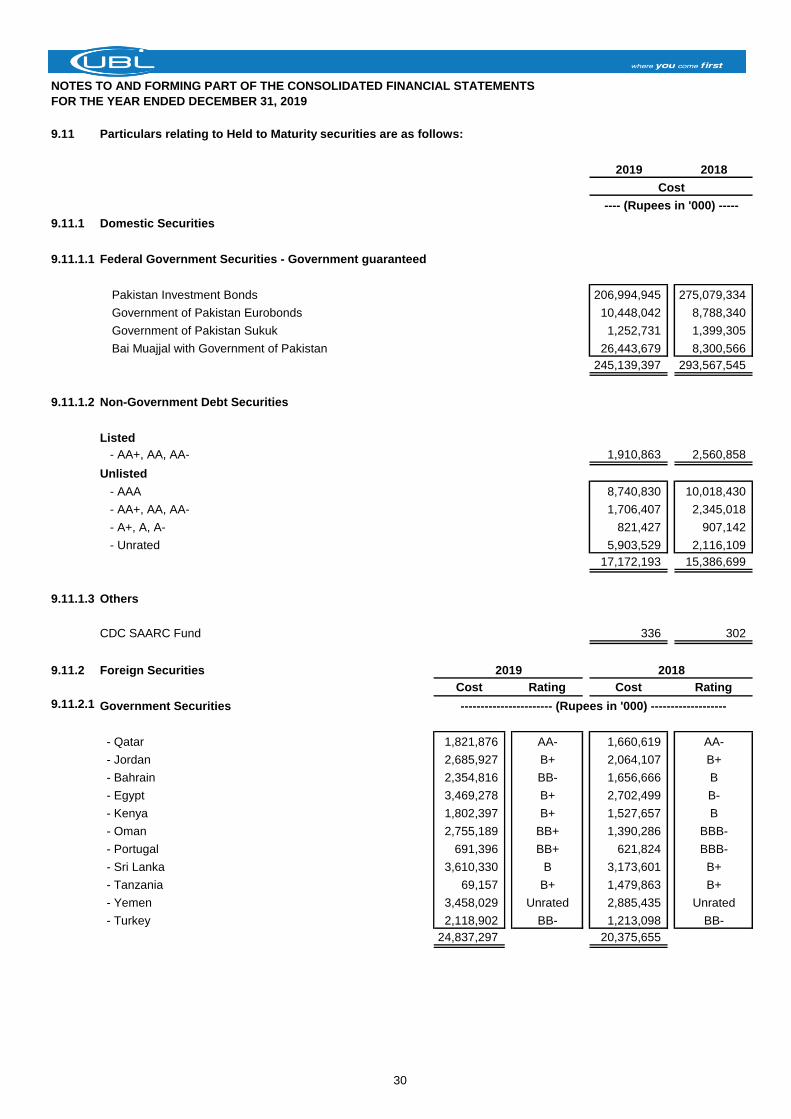
NOTES TO AND FORMING PART OF THE CONSOLIDATED FINANCIAL STATEMENTS
FOR THE YEAR ENDED DECEMBER 31, 2019
9.11 Particulars relating to Held to Maturity securities are as follows:
2019 2018
9.11.1 Domestic Securities
9.11.1.1 Federal Government Securities - Government guaranteed
Pakistan Investment Bonds 206,994,945 275,079,334
Government of Pakistan Eurobonds 10,448,042 8,788,340
Government of Pakistan Sukuk 1,252,731 1,399,305
Bai Muajjal with Government of Pakistan 26,443,679 8,300,566
245,139,397 293,567,545
9.11.1.2 Non-Government Debt Securities
Listed
- AA+, AA, AA- 1,910,863 2,560,858
Unlisted
- AAA 8,740,830 10,018,430
- AA+, AA, AA- 1,706,407 2,345,018
- A+, A, A- 821,427 907,142
- Unrated 5,903,529 2,116,109
17,172,193 15,386,699
9.11.1.3 Others
CDC SAARC Fund 336 302
9.11.2 Foreign Securities
Cost Rating Cost Rating
9.11.2.1 Government Securities ----------------------- (Rupees in '000) -------------------
- Qatar 1,821,876 AA- 1,660,619 AA-
- Jordan 2,685,927 B+ 2,064,107 B+
- Bahrain 2,354,816 BB- 1,656,666 B
- Egypt 3,469,278 B+ 2,702,499 B-
- Kenya 1,802,397 B+ 1,527,657 B
- Oman 2,755,189 BB+ 1,390,286 BBB-
- Portugal 691,396 BB+ 621,824 BBB-
- Sri Lanka 3,610,330 B 3,173,601 B+
- Tanzania 69,157 B+ 1,479,863 B+
- Yemen 3,458,029 Unrated 2,885,435 Unrated
- Turkey 2,118,902 BB- 1,213,098 BB-
24,837,297 20,375,655
2019 2018
Cost
---- (Rupees in '000) -----
30
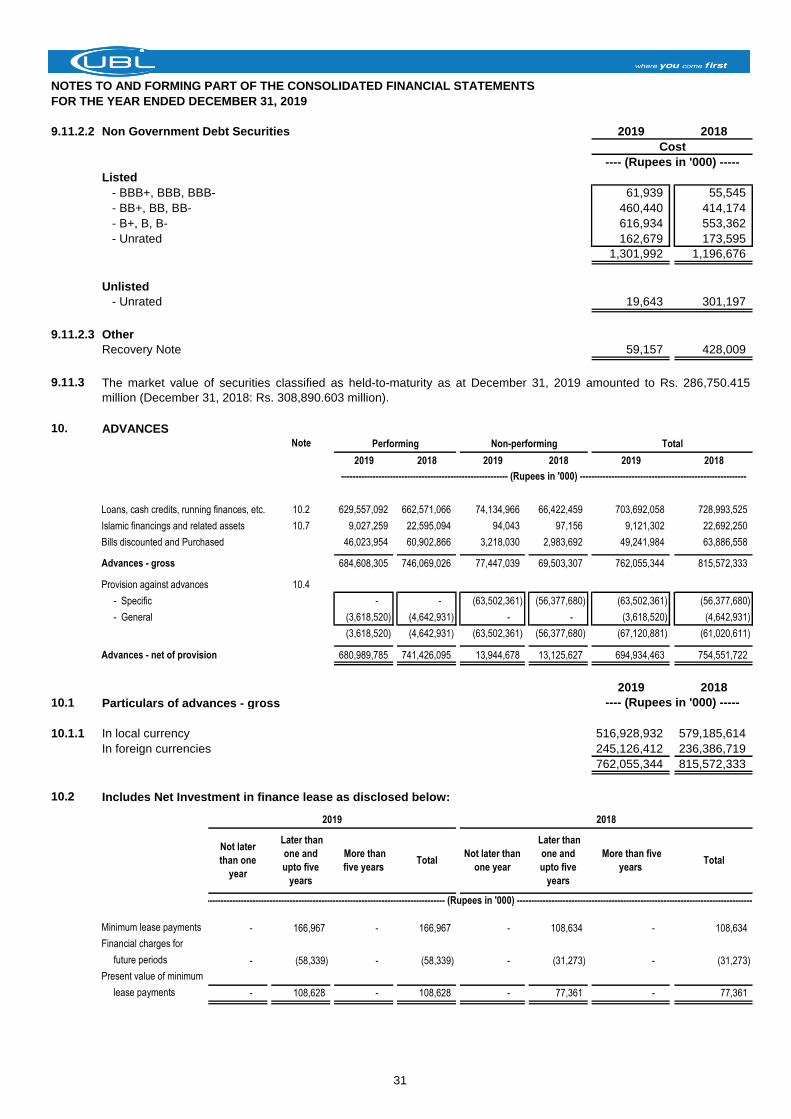
NOTES TO AND FORMING PART OF THE CONSOLIDATED FINANCIAL STATEMENTS
FOR THE YEAR ENDED DECEMBER 31, 2019
9.11.2.2 Non Government Debt Securities 2019 2018
---- (Rupees in '000) -----
Listed
- BBB+, BBB, BBB- 61,939 55,545
- BB+, BB, BB- 460,440 414,174
- B+, B, B- 616,934 553,362
- Unrated 162,679 173,595
1,301,992 1,196,676
Unlisted
- Unrated 19,643 301,197
9.11.2.3 Other
Recovery Note 59,157 428,009
9.11.3
10. ADVANCES Note
2019 2018 2019 2018 2019 2018
Loans, cash credits, running finances, etc. 10.2 629,557,092 662,571,066 74,134,966 66,422,459 703,692,058 728,993,525
Islamic financings and related assets 10.7 9,027,259 22,595,094 94,043 97,156 9,121,302 22,692,250
Bills discounted and Purchased 46,023,954 60,902,866 3,218,030 2,983,692 49,241,984 63,886,558
Advances - gross 684,608,305 746,069,026 77,447,039 69,503,307 762,055,344 815,572,333
Provision against advances 10.4
- Specific - - (63,502,361) (56,377,680) (63,502,361) (56,377,680)
- General (3,618,520) (4,642,931) - - (3,618,520) (4,642,931)
(3,618,520) (4,642,931) (63,502,361) (56,377,680) (67,120,881) (61,020,611)
Advances - net of provision 680,989,785 741,426,095 13,944,678 13,125,627 694,934,463 754,551,722
2019 2018
10.1 Particulars of advances - gross
10.1.1 In local currency 516,928,932 579,185,614
In foreign currencies 245,126,412 236,386,719
762,055,344 815,572,333
10.2 Includes Net Investment in finance lease as disclosed below:
Minimum lease payments - 166,967 - 166,967 - 108,634 - 108,634
Financial charges for
future periods - (58,339) - (58,339) - (31,273) - (31,273)
Present value of minimum
lease payments - 108,628 - 108,628 - 77,361 - 77,361
---- (Rupees in '000) -----
------------------------------------------------------------------------------------- (Rupees in '000) -------------------------------------------------------------------------------------
2019 2018
Not later
than one
year
Later than
one and
upto five
years
More than
five years Total
Not later than
one year
Later than
one and
upto five
years
More than five
years Total
---------------------------------------------------------- (Rupees in '000) ----------------------------------------------------------
Performing Non-performing Total
Cost
The market value of securities classified as held-to-maturity as at December 31, 2019 amounted to Rs. 286,750.415
million (December 31, 2018: Rs. 308,890.603 million).
31
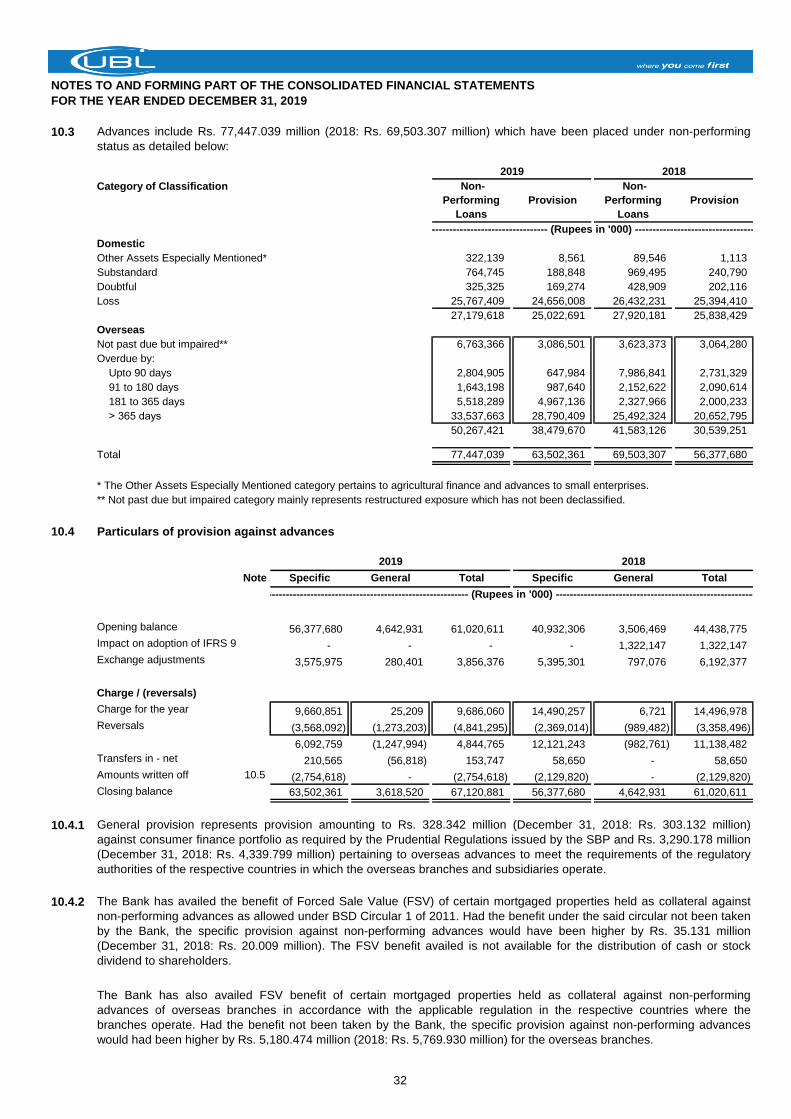
NOTES TO AND FORMING PART OF THE CONSOLIDATED FINANCIAL STATEMENTS
FOR THE YEAR ENDED DECEMBER 31, 2019
10.3
Category of Classification
Domestic
Other Assets Especially Mentioned* 322,139 8,561 89,546 1,113
Substandard 764,745 188,848 969,495 240,790
Doubtful 325,325 169,274 428,909 202,116
Loss 25,767,409 24,656,008 26,432,231 25,394,410
27,179,618 25,022,691 27,920,181 25,838,429
Overseas
Not past due but impaired** 6,763,366 3,086,501 3,623,373 3,064,280
Overdue by:
Upto 90 days 2,804,905 647,984 7,986,841 2,731,329
91 to 180 days 1,643,198 987,640 2,152,622 2,090,614
181 to 365 days 5,518,289 4,967,136 2,327,966 2,000,233
˃ 365 days 33,537,663 28,790,409 25,492,324 20,652,795
50,267,421 38,479,670 41,583,126 30,539,251
Total 77,447,039 63,502,361 69,503,307 56,377,680
* The Other Assets Especially Mentioned category pertains to agricultural finance and advances to small enterprises.
** Not past due but impaired category mainly represents restructured exposure which has not been declassified.
10.4 Particulars of provision against advances
Note Specific General Total Specific General Total
Opening balance 56,377,680 4,642,931 61,020,611 40,932,306 3,506,469 44,438,775
Impact on adoption of IFRS 9 - - - - 1,322,147 1,322,147
Exchange adjustments 3,575,975 280,401 3,856,376 5,395,301 797,076 6,192,377
Charge / (reversals)
Charge for the year 9,660,851 25,209 9,686,060 14,490,257 6,721 14,496,978
Reversals (3,568,092) (1,273,203) (4,841,295) (2,369,014) (989,482) (3,358,496)
6,092,759 (1,247,994) 4,844,765 12,121,243 (982,761) 11,138,482
Transfers in - net 210,565 (56,818) 153,747 58,650 - 58,650
Amounts written off 10.5 (2,754,618) - (2,754,618) (2,129,820) - (2,129,820)
Closing balance 63,502,361 3,618,520 67,120,881 56,377,680 4,642,931 61,020,611
10.4.1
10.4.2
The Bank has also availed FSV benefit of certain mortgaged properties held as collateral against non-performing
advances of overseas branches in accordance with the applicable regulation in the respective countries where the
branches operate. Had the benefit not been taken by the Bank, the specific provision against non-performing advances
would had been higher by Rs. 5,180.474 million (2018: Rs. 5,769.930 million) for the overseas branches.
The Bank has availed the benefit of Forced Sale Value (FSV) of certain mortgaged properties held as collateral against
non-performing advances as allowed under BSD Circular 1 of 2011. Had the benefit under the said circular not been taken
by the Bank, the specific provision against non-performing advances would have been higher by Rs. 35.131 million
(December 31, 2018: Rs. 20.009 million). The FSV benefit availed is not available for the distribution of cash or stock
dividend to shareholders.
---------------------------------------- (Rupees in '000) -----------------------------------------
2019 2018
------------------------------------------------------------------ (Rupees in '000) ------------------------------------------------------------------
General provision represents provision amounting to Rs. 328.342 million (December 31, 2018: Rs. 303.132 million)
against consumer finance portfolio as required by the Prudential Regulations issued by the SBP and Rs. 3,290.178 million
(December 31, 2018: Rs. 4,339.799 million) pertaining to overseas advances to meet the requirements of the regulatory
authorities of the respective countries in which the overseas branches and subsidiaries operate.
Advances include Rs. 77,447.039 million (2018: Rs. 69,503.307 million) which have been placed under non-performing
status as detailed below:
2019 2018
Non-
Performing
Loans
Provision
Non-
Performing
Loans
Provision
32
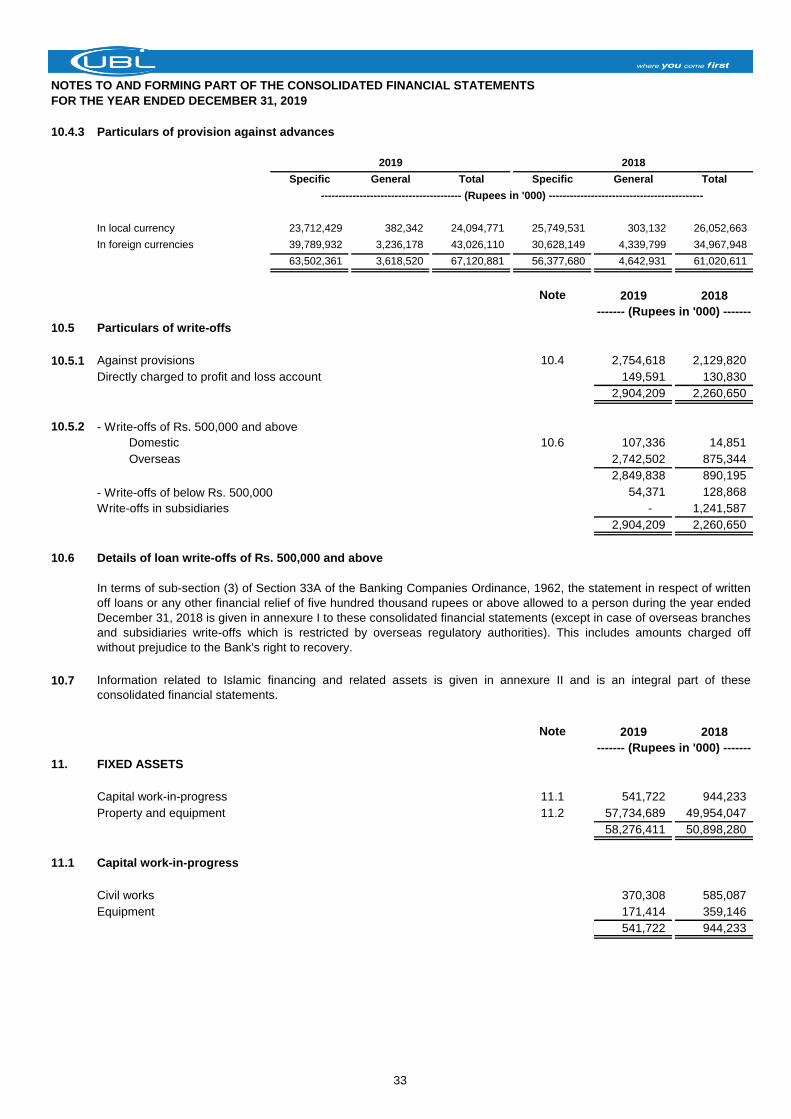
NOTES TO AND FORMING PART OF THE CONSOLIDATED FINANCIAL STATEMENTS
FOR THE YEAR ENDED DECEMBER 31, 2019
10.4.3 Particulars of provision against advances
Specific General Total Specific General Total
In local currency 23,712,429 382,342 24,094,771 25,749,531 303,132 26,052,663
In foreign currencies 39,789,932 3,236,178 43,026,110 30,628,149 4,339,799 34,967,948
63,502,361 3,618,520 67,120,881 56,377,680 4,642,931 61,020,611
Note 2019 2018
10.5 Particulars of write-offs
10.5.1 Against provisions 10.4 2,754,618 2,129,820
Directly charged to profit and loss account 149,591 130,830
2,904,209 2,260,650
10.5.2 - Write-offs of Rs. 500,000 and above
Domestic 10.6 107,336 14,851
Overseas 2,742,502 875,344
2,849,838 890,195
- Write-offs of below Rs. 500,000 54,371 128,868
Write-offs in subsidiaries - 1,241,587
2,904,209 2,260,650
10.6 Details of loan write-offs of Rs. 500,000 and above
10.7
Note 2019 2018
11. FIXED ASSETS
Capital work-in-progress 11.1 541,722 944,233
Property and equipment 11.2 57,734,689 49,954,047
58,276,411 50,898,280
11.1 Capital work-in-progress
Civil works 370,308 585,087
Equipment 171,414 359,146
541,722 944,233
------- (Rupees in '000) -------
2019 2018
---------------------------------------- (Rupees in '000) --------------------------------------------
------- (Rupees in '000) -------
In terms of sub-section (3) of Section 33A of the Banking Companies Ordinance, 1962, the statement in respect of written
off loans or any other financial relief of five hundred thousand rupees or above allowed to a person during the year ended
December 31, 2018 is given in annexure I to these consolidated financial statements (except in case of overseas branches
and subsidiaries write-offs which is restricted by overseas regulatory authorities). This includes amounts charged off
without prejudice to the Bank's right to recovery.
Information related to Islamic financing and related assets is given in annexure II and is an integral part of these
consolidated financial statements.
33
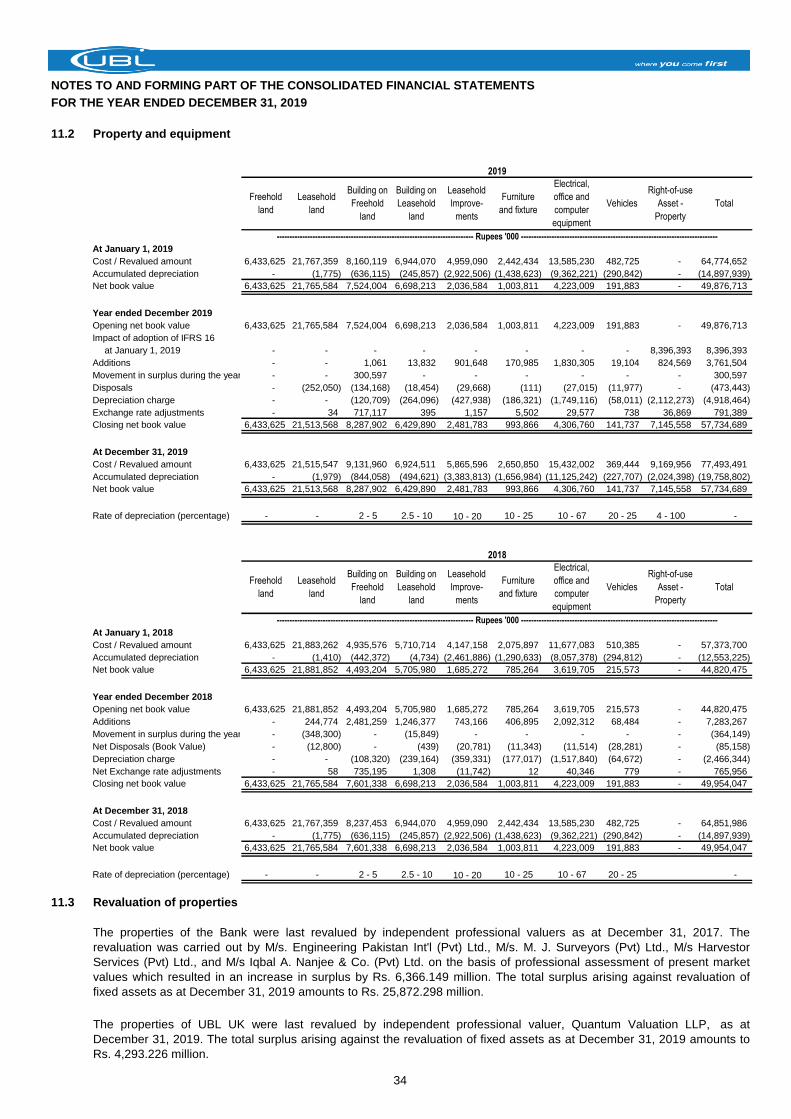
NOTES TO AND FORMING PART OF THE CONSOLIDATED FINANCIAL STATEMENTS
FOR THE YEAR ENDED DECEMBER 31, 2019
11.2 Property and equipment
At January 1, 2019
Cost / Revalued amount 6,433,625 21,767,359 8,160,119 6,944,070 4,959,090 2,442,434 13,585,230 482,725 - 64,774,652
Accumulated depreciation - (1,775) (636,115) (245,857) (2,922,506) (1,438,623) (9,362,221) (290,842) - (14,897,939)
Net book value 6,433,625 21,765,584 7,524,004 6,698,213 2,036,584 1,003,811 4,223,009 191,883 - 49,876,713
Year ended December 2019
Opening net book value 6,433,625 21,765,584 7,524,004 6,698,213 2,036,584 1,003,811 4,223,009 191,883 - 49,876,713
Impact of adoption of IFRS 16
at January 1, 2019 - - - - - - - - 8,396,393 8,396,393
Additions - - 1,061 13,832 901,648 170,985 1,830,305 19,104 824,569 3,761,504
Movement in surplus during the year - - 300,597 - - - - - - 300,597
Disposals - (252,050) (134,168) (18,454) (29,668) (111) (27,015) (11,977) - (473,443)
Depreciation charge - - (120,709) (264,096) (427,938) (186,321) (1,749,116) (58,011) (2,112,273) (4,918,464)
Exchange rate adjustments - 34 717,117 395 1,157 5,502 29,577 738 36,869 791,389
Closing net book value 6,433,625 21,513,568 8,287,902 6,429,890 2,481,783 993,866 4,306,760 141,737 7,145,558 57,734,689
At December 31, 2019
Cost / Revalued amount 6,433,625 21,515,547 9,131,960 6,924,511 5,865,596 2,650,850 15,432,002 369,444 9,169,956 77,493,491
Accumulated depreciation - (1,979) (844,058) (494,621) (3,383,813) (1,656,984) (11,125,242) (227,707) (2,024,398) (19,758,802)
Net book value 6,433,625 21,513,568 8,287,902 6,429,890 2,481,783 993,866 4,306,760 141,737 7,145,558 57,734,689
Rate of depreciation (percentage) - - 2 - 5 2.5 - 10 10 - 20 10 - 25 10 - 67 20 - 25 4 - 100 -
At January 1, 2018
Cost / Revalued amount 6,433,625 21,883,262 4,935,576 5,710,714 4,147,158 2,075,897 11,677,083 510,385 - 57,373,700
Accumulated depreciation - (1,410) (442,372) (4,734) (2,461,886) (1,290,633) (8,057,378) (294,812) - (12,553,225)
Net book value 6,433,625 21,881,852 4,493,204 5,705,980 1,685,272 785,264 3,619,705 215,573 - 44,820,475
Year ended December 2018
Opening net book value 6,433,625 21,881,852 4,493,204 5,705,980 1,685,272 785,264 3,619,705 215,573 - 44,820,475
Additions - 244,774 2,481,259 1,246,377 743,166 406,895 2,092,312 68,484 - 7,283,267
Movement in surplus during the year - (348,300) - (15,849) - - - - - (364,149)
Net Disposals (Book Value) - (12,800) - (439) (20,781) (11,343) (11,514) (28,281) - (85,158)
Depreciation charge - - (108,320) (239,164) (359,331) (177,017) (1,517,840) (64,672) - (2,466,344)
Net Exchange rate adjustments - 58 735,195 1,308 (11,742) 12 40,346 779 - 765,956
Closing net book value 6,433,625 21,765,584 7,601,338 6,698,213 2,036,584 1,003,811 4,223,009 191,883 - 49,954,047
At December 31, 2018
Cost / Revalued amount 6,433,625 21,767,359 8,237,453 6,944,070 4,959,090 2,442,434 13,585,230 482,725 - 64,851,986
Accumulated depreciation - (1,775) (636,115) (245,857) (2,922,506) (1,438,623) (9,362,221) (290,842) - (14,897,939)
Net book value 6,433,625 21,765,584 7,601,338 6,698,213 2,036,584 1,003,811 4,223,009 191,883 - 49,954,047
Rate of depreciation (percentage) - - 2 - 5 2.5 - 10 10 - 20 10 - 25 10 - 67 20 - 25 -
11.3 Revaluation of properties
Total
2019
Right-of-use
Asset -
Property
----------------------------------------------------------------------------- Rupees '000 -----------------------------------------------------------------------------
The properties of the Bank were last revalued by independent professional valuers as at December 31, 2017. The
revaluation was carried out by M/s. Engineering Pakistan Int'l (Pvt) Ltd., M/s. M. J. Surveyors (Pvt) Ltd., M/s Harvestor
Services (Pvt) Ltd., and M/s Iqbal A. Nanjee & Co. (Pvt) Ltd. on the basis of professional assessment of present market
values which resulted in an increase in surplus by Rs. 6,366.149 million. The total surplus arising against revaluation of
fixed assets as at December 31, 2019 amounts to Rs. 25,872.298 million.
Freehold
land
Leasehold
land
Building on
Freehold
land
Building on
Leasehold
land
Leasehold
Improve-
ments
Furniture
and fixture
Electrical,
office and
computer
equipment
Vehicles
Right-of-use
Asset -
Property
The properties of UBL UK were last revalued by independent professional valuer, Quantum Valuation LLP, as at
December 31, 2019. The total surplus arising against the revaluation of fixed assets as at December 31, 2019 amounts to
Rs. 4,293.226 million.
----------------------------------------------------------------------------- Rupees '000 -----------------------------------------------------------------------------
2018
Freehold
land
Leasehold
land
Building on
Freehold
land
Building on
Leasehold
land
Leasehold
Improve-
ments
Furniture
and fixture
Electrical,
office and
computer
equipment
Vehicles Total
34
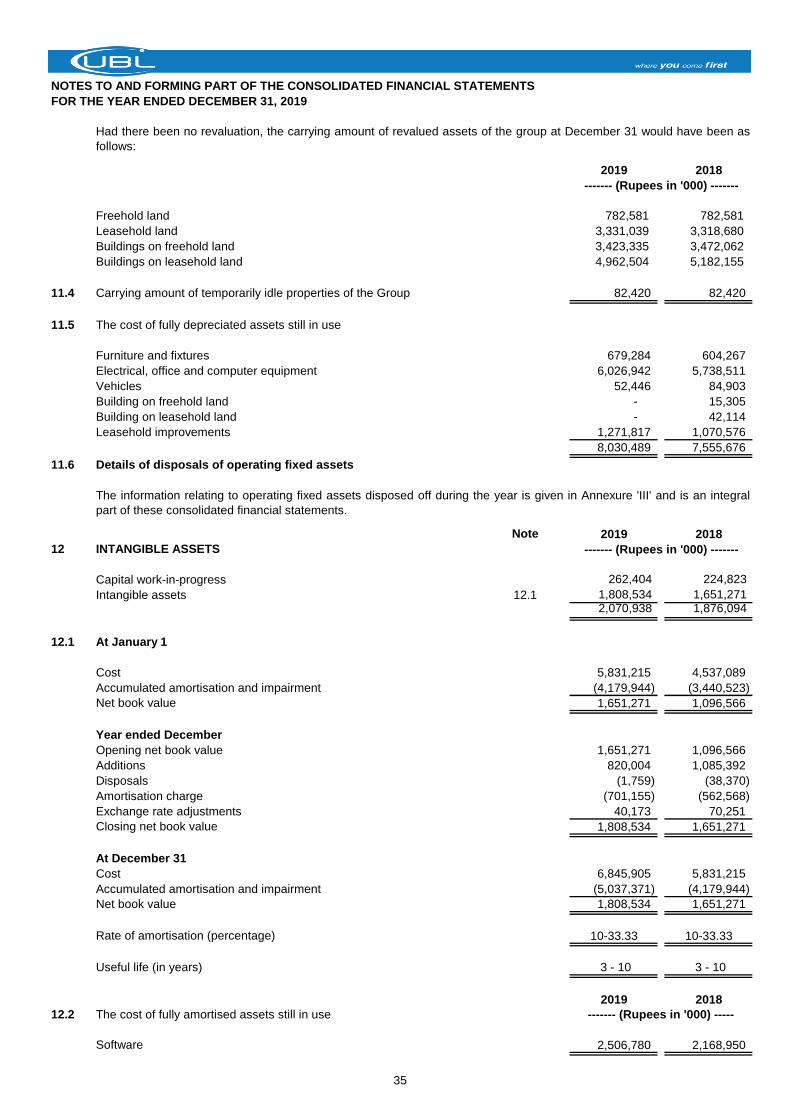
NOTES TO AND FORMING PART OF THE CONSOLIDATED FINANCIAL STATEMENTS
FOR THE YEAR ENDED DECEMBER 31, 2019
2019 2018
Freehold land 782,581 782,581
Leasehold land 3,331,039 3,318,680
Buildings on freehold land 3,423,335 3,472,062
Buildings on leasehold land 4,962,504 5,182,155
11.4 Carrying amount of temporarily idle properties of the Group 82,420 82,420
11.5 The cost of fully depreciated assets still in use
Furniture and fixtures 679,284 604,267
Electrical, office and computer equipment 6,026,942 5,738,511
Vehicles 52,446 84,903
Building on freehold land - 15,305
Building on leasehold land - 42,114
Leasehold improvements 1,271,817 1,070,576
8,030,489 7,555,676
11.6 Details of disposals of operating fixed assets
Note 2019 2018
12 INTANGIBLE ASSETS
Capital work-in-progress 262,404 224,823
Intangible assets 12.1 1,808,534 1,651,271 2,070,938 1,876,094
12.1 At January 1
Cost 5,831,215 4,537,089
Accumulated amortisation and impairment (4,179,944) (3,440,523)
Net book value 1,651,271 1,096,566
Year ended December
Opening net book value 1,651,271 1,096,566
Additions 820,004 1,085,392
Disposals (1,759) (38,370)
Amortisation charge (701,155) (562,568)
Exchange rate adjustments 40,173 70,251
Closing net book value 1,808,534 1,651,271
At December 31
Cost 6,845,905 5,831,215
Accumulated amortisation and impairment (5,037,371) (4,179,944)
Net book value 1,808,534 1,651,271
Rate of amortisation (percentage) 10-33.33 10-33.33
Useful life (in years) 3 - 10 3 - 10
2019 2018
12.2 The cost of fully amortised assets still in use
Software 2,506,780 2,168,950
Had there been no revaluation, the carrying amount of revalued assets of the group at December 31 would have been as
follows:
------- (Rupees in '000) -------
The information relating to operating fixed assets disposed off during the year is given in Annexure 'III' and is an integral
part of these consolidated financial statements.
------- (Rupees in '000) -------
------- (Rupees in '000) -----
35
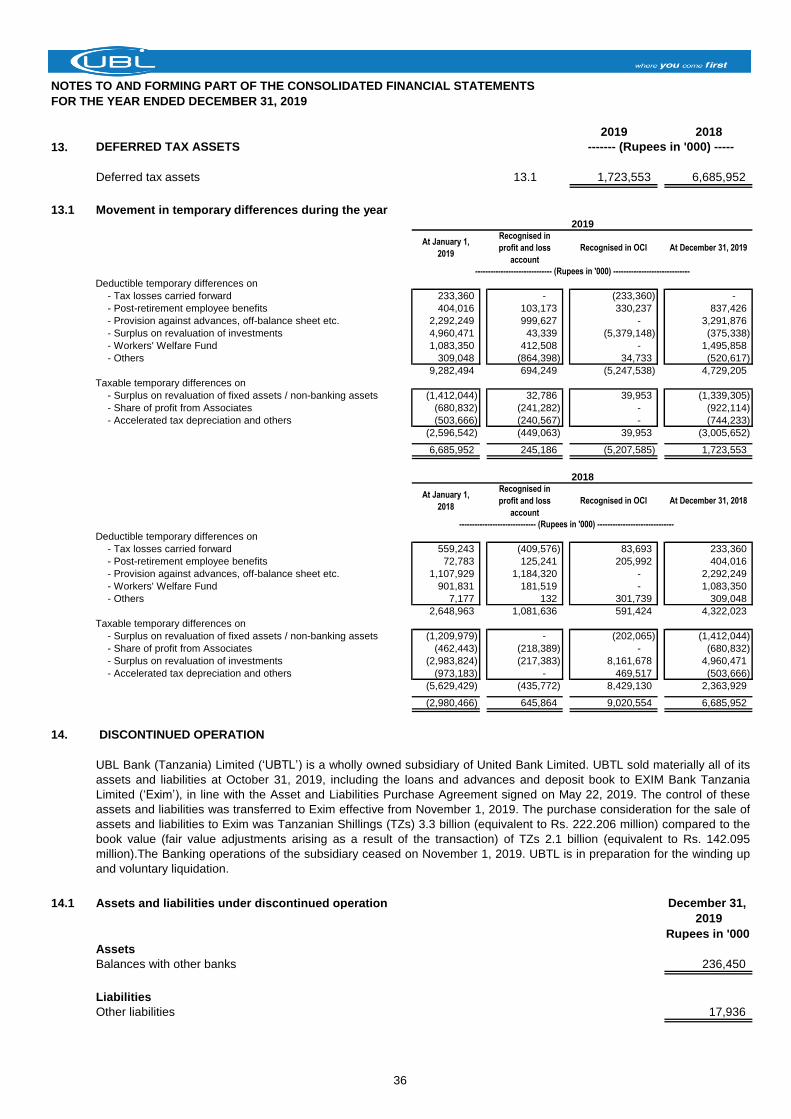
NOTES TO AND FORMING PART OF THE CONSOLIDATED FINANCIAL STATEMENTS
FOR THE YEAR ENDED DECEMBER 31, 2019
2019 2018
13. DEFERRED TAX ASSETS
Deferred tax assets 13.1 1,723,553 6,685,952
13.1 Movement in temporary differences during the year2019
At January 1,
2019
Recognised in
profit and loss
account
Recognised in OCI At December 31, 2019
Deductible temporary differences on
- Tax losses carried forward 233,360 - (233,360) -
- Post-retirement employee benefits 404,016 103,173 330,237 837,426
- Provision against advances, off-balance sheet etc. 2,292,249 999,627 - 3,291,876
- Surplus on revaluation of investments 4,960,471 43,339 (5,379,148) (375,338)
- Workers' Welfare Fund 1,083,350 412,508 - 1,495,858
- Others 309,048 (864,398) 34,733 (520,617)
9,282,494 694,249 (5,247,538) 4,729,205
Taxable temporary differences on
- Surplus on revaluation of fixed assets / non-banking assets (1,412,044) 32,786 39,953 (1,339,305)
- Share of profit from Associates (680,832) (241,282) - (922,114)
- Accelerated tax depreciation and others (503,666) (240,567) - (744,233)
(2,596,542) (449,063) 39,953 (3,005,652)
6,685,952 245,186 (5,207,585) 1,723,553
2018
At January 1,
2018
Recognised in
profit and loss
account
Recognised in OCI At December 31, 2018
------------------------------ (Rupees in '000) ------------------------------
Deductible temporary differences on
- Tax losses carried forward 559,243 (409,576) 83,693 233,360
- Post-retirement employee benefits 72,783 125,241 205,992 404,016
- Provision against advances, off-balance sheet etc. 1,107,929 1,184,320 - 2,292,249
- Workers' Welfare Fund 901,831 181,519 - 1,083,350
- Others 7,177 132 301,739 309,048
2,648,963 1,081,636 591,424 4,322,023
Taxable temporary differences on
- Surplus on revaluation of fixed assets / non-banking assets (1,209,979) - (202,065) (1,412,044)
- Share of profit from Associates (462,443) (218,389) - (680,832)
- Surplus on revaluation of investments (2,983,824) (217,383) 8,161,678 4,960,471
- Accelerated tax depreciation and others (973,183) - 469,517 (503,666)
(5,629,429) (435,772) 8,429,130 2,363,929
(2,980,466) 645,864 9,020,554 6,685,952
14. DISCONTINUED OPERATION
14.1 Assets and liabilities under discontinued operation December 31,
2019
Rupees in '000
Assets
Balances with other banks 236,450
Liabilities
Other liabilities 17,936
------------------------------ (Rupees in '000) ------------------------------
------- (Rupees in '000) -----
UBL Bank (Tanzania) Limited (‘UBTL’) is a wholly owned subsidiary of United Bank Limited. UBTL sold materially all of its
assets and liabilities at October 31, 2019, including the loans and advances and deposit book to EXIM Bank Tanzania
Limited (‘Exim’), in line with the Asset and Liabilities Purchase Agreement signed on May 22, 2019. The control of these
assets and liabilities was transferred to Exim effective from November 1, 2019. The purchase consideration for the sale of
assets and liabilities to Exim was Tanzanian Shillings (TZs) 3.3 billion (equivalent to Rs. 222.206 million) compared to the
book value (fair value adjustments arising as a result of the transaction) of TZs 2.1 billion (equivalent to Rs. 142.095
million).The Banking operations of the subsidiary ceased on November 1, 2019. UBTL is in preparation for the winding up
and voluntary liquidation.
36
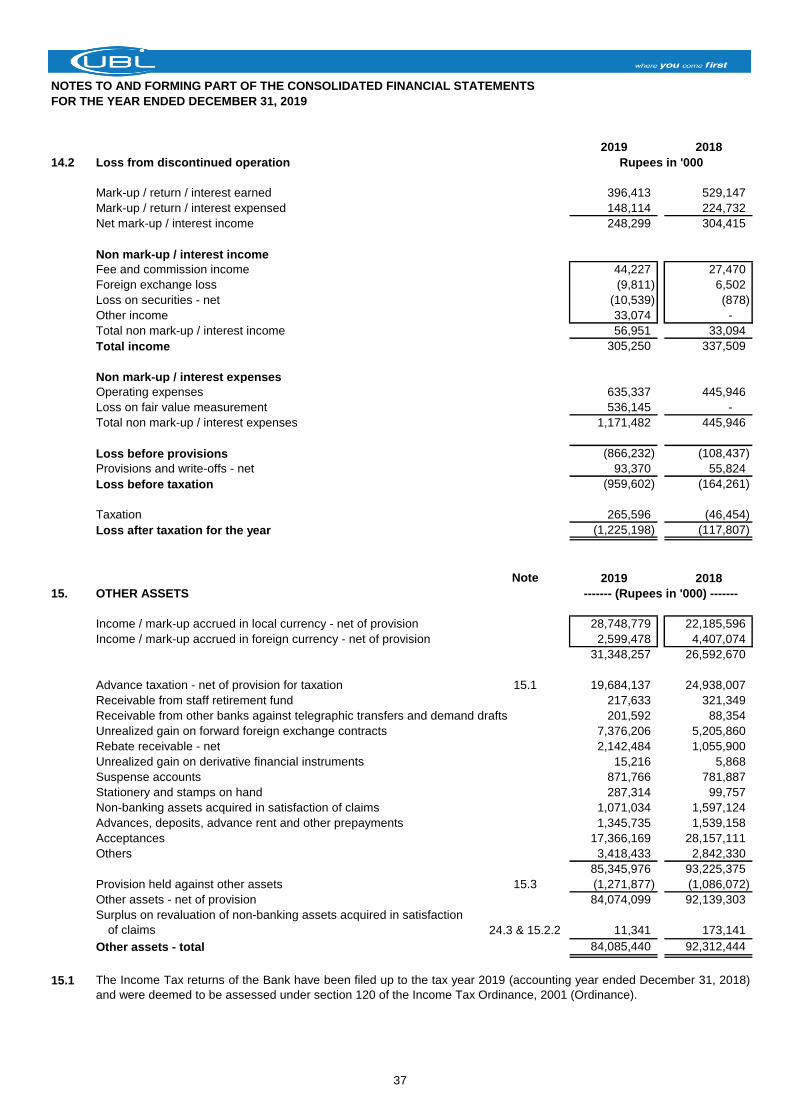
NOTES TO AND FORMING PART OF THE CONSOLIDATED FINANCIAL STATEMENTS
FOR THE YEAR ENDED DECEMBER 31, 2019
2019 2018
14.2 Loss from discontinued operation
Mark-up / return / interest earned 396,413 529,147
Mark-up / return / interest expensed 148,114 224,732
Net mark-up / interest income 248,299 304,415
Non mark-up / interest income
Fee and commission income 44,227 27,470
Foreign exchange loss (9,811) 6,502
Loss on securities - net (10,539) (878)
Other income 33,074 -
Total non mark-up / interest income 56,951 33,094
Total income 305,250 337,509
Non mark-up / interest expenses
Operating expenses 635,337 445,946
Loss on fair value measurement 536,145 -
Total non mark-up / interest expenses 1,171,482 445,946
Loss before provisions (866,232) (108,437)
Provisions and write-offs - net 93,370 55,824
Loss before taxation (959,602) (164,261)
Taxation 265,596 (46,454)
Loss after taxation for the year (1,225,198) (117,807)
Note 2019 2018
15. OTHER ASSETS
Income / mark-up accrued in local currency - net of provision 28,748,779 22,185,596
Income / mark-up accrued in foreign currency - net of provision 2,599,478 4,407,074
31,348,257 26,592,670
Advance taxation - net of provision for taxation 15.1 19,684,137 24,938,007
Receivable from staff retirement fund 217,633 321,349
Receivable from other banks against telegraphic transfers and demand drafts 201,592 88,354
Unrealized gain on forward foreign exchange contracts 7,376,206 5,205,860
Rebate receivable - net 2,142,484 1,055,900
Unrealized gain on derivative financial instruments 15,216 5,868
Suspense accounts 871,766 781,887
Stationery and stamps on hand 287,314 99,757
Non-banking assets acquired in satisfaction of claims 1,071,034 1,597,124
Advances, deposits, advance rent and other prepayments 1,345,735 1,539,158
Acceptances 17,366,169 28,157,111
Others 3,418,433 2,842,330
85,345,976 93,225,375
Provision held against other assets 15.3 (1,271,877) (1,086,072)
Other assets - net of provision 84,074,099 92,139,303
Surplus on revaluation of non-banking assets acquired in satisfaction
of claims 24.3 & 15.2.2 11,341 173,141
Other assets - total 84,085,440 92,312,444
15.1
------- (Rupees in '000) -------
The Income Tax returns of the Bank have been filed up to the tax year 2019 (accounting year ended December 31, 2018)
and were deemed to be assessed under section 120 of the Income Tax Ordinance, 2001 (Ordinance).
Rupees in '000
37
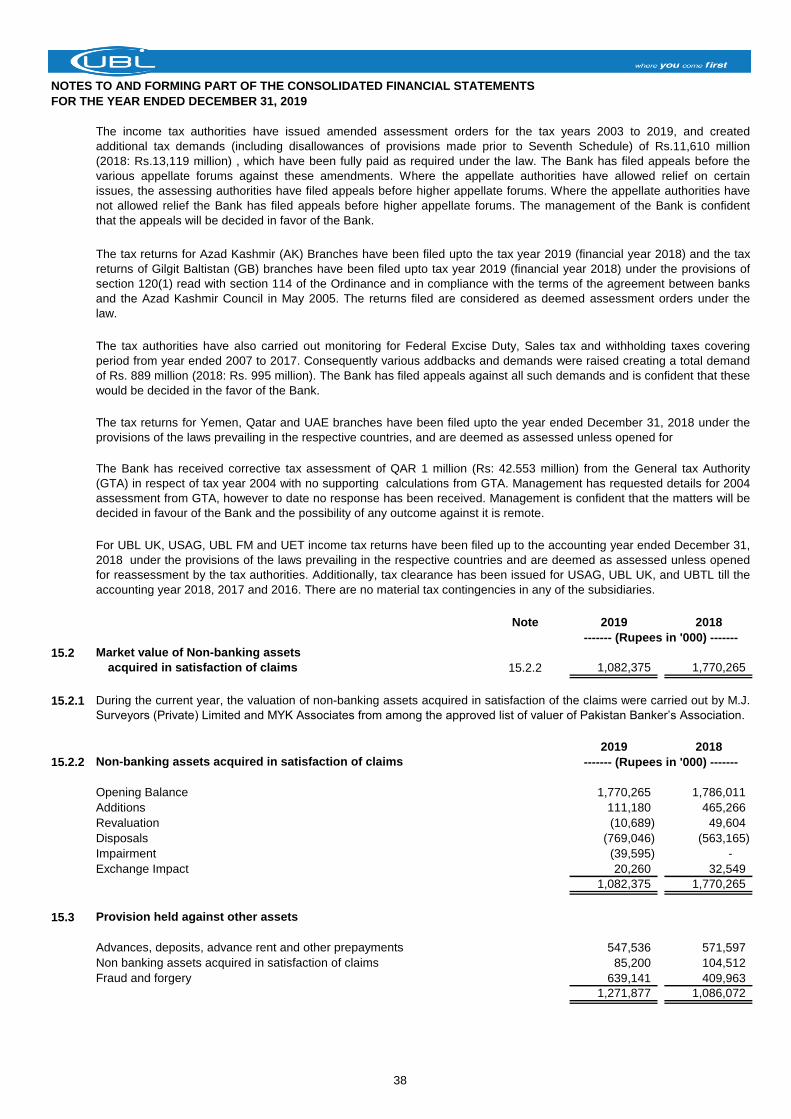
NOTES TO AND FORMING PART OF THE CONSOLIDATED FINANCIAL STATEMENTS
FOR THE YEAR ENDED DECEMBER 31, 2019
Note 2019 2018
15.2 Market value of Non-banking assets
acquired in satisfaction of claims 15.2.2 1,082,375 1,770,265
15.2.1
2019 2018
15.2.2 Non-banking assets acquired in satisfaction of claims
Opening Balance 1,770,265 1,786,011
Additions 111,180 465,266
Revaluation (10,689) 49,604
Disposals (769,046) (563,165)
Impairment (39,595) -
Exchange Impact 20,260 32,549
1,082,375 1,770,265
15.3 Provision held against other assets
Advances, deposits, advance rent and other prepayments 547,536 571,597
Non banking assets acquired in satisfaction of claims 85,200 104,512
Fraud and forgery 639,141 409,963
1,271,877 1,086,072
The tax returns for Yemen, Qatar and UAE branches have been filed upto the year ended December 31, 2018 under the
provisions of the laws prevailing in the respective countries, and are deemed as assessed unless opened for
The Bank has received corrective tax assessment of QAR 1 million (Rs: 42.553 million) from the General tax Authority
(GTA) in respect of tax year 2004 with no supporting calculations from GTA. Management has requested details for 2004
assessment from GTA, however to date no response has been received. Management is confident that the matters will be
decided in favour of the Bank and the possibility of any outcome against it is remote.
For UBL UK, USAG, UBL FM and UET income tax returns have been filed up to the accounting year ended December 31,
2018 under the provisions of the laws prevailing in the respective countries and are deemed as assessed unless opened
for reassessment by the tax authorities. Additionally, tax clearance has been issued for USAG, UBL UK, and UBTL till the
accounting year 2018, 2017 and 2016. There are no material tax contingencies in any of the subsidiaries.
------- (Rupees in '000) -------
------- (Rupees in '000) -------
The income tax authorities have issued amended assessment orders for the tax years 2003 to 2019, and created
additional tax demands (including disallowances of provisions made prior to Seventh Schedule) of Rs.11,610 million
(2018: Rs.13,119 million) , which have been fully paid as required under the law. The Bank has filed appeals before the
various appellate forums against these amendments. Where the appellate authorities have allowed relief on certain
issues, the assessing authorities have filed appeals before higher appellate forums. Where the appellate authorities have
not allowed relief the Bank has filed appeals before higher appellate forums. The management of the Bank is confident
that the appeals will be decided in favor of the Bank.
The tax returns for Azad Kashmir (AK) Branches have been filed upto the tax year 2019 (financial year 2018) and the tax
returns of Gilgit Baltistan (GB) branches have been filed upto tax year 2019 (financial year 2018) under the provisions of
section 120(1) read with section 114 of the Ordinance and in compliance with the terms of the agreement between banks
and the Azad Kashmir Council in May 2005. The returns filed are considered as deemed assessment orders under the
law.
During the current year, the valuation of non-banking assets acquired in satisfaction of the claims were carried out by M.J.
Surveyors (Private) Limited and MYK Associates from among the approved list of valuer of Pakistan Banker’s Association.
The tax authorities have also carried out monitoring for Federal Excise Duty, Sales tax and withholding taxes covering
period from year ended 2007 to 2017. Consequently various addbacks and demands were raised creating a total demand
of Rs. 889 million (2018: Rs. 995 million). The Bank has filed appeals against all such demands and is confident that these
would be decided in the favor of the Bank.
38
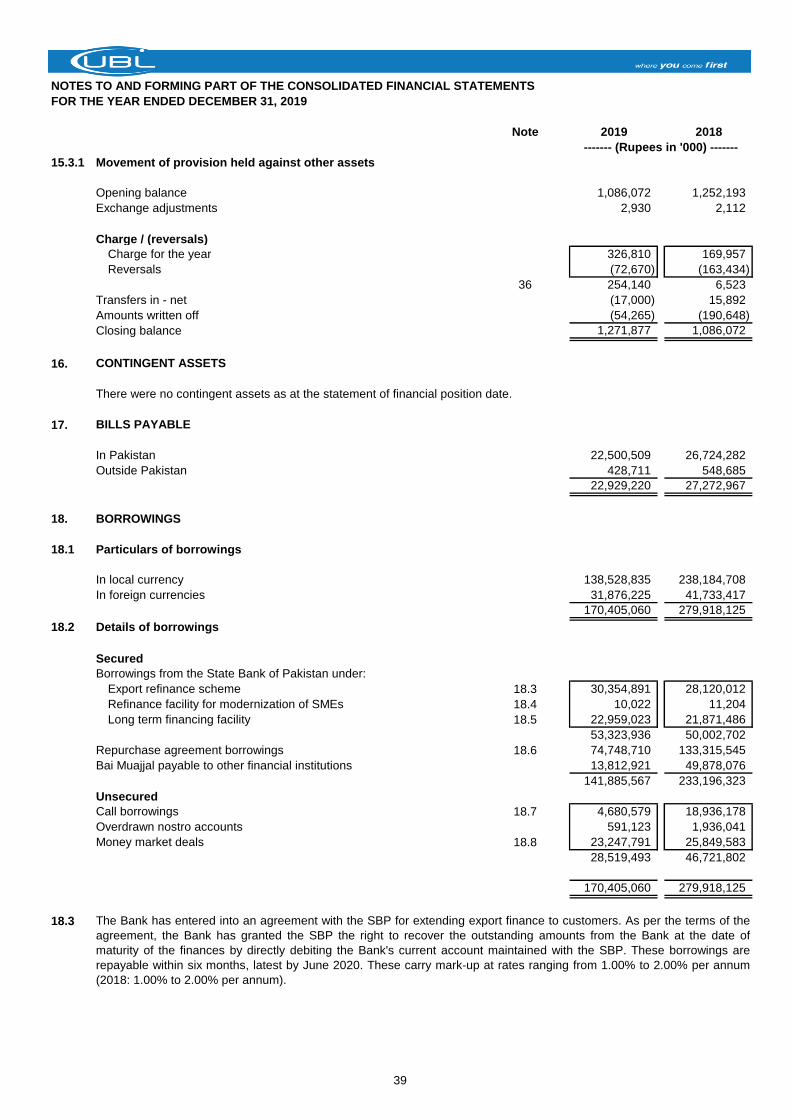
NOTES TO AND FORMING PART OF THE CONSOLIDATED FINANCIAL STATEMENTS
FOR THE YEAR ENDED DECEMBER 31, 2019
Note 2019 2018
15.3.1 Movement of provision held against other assets
Opening balance 1,086,072 1,252,193
Exchange adjustments 2,930 2,112
Charge / (reversals)
Charge for the year 326,810 169,957
Reversals (72,670) (163,434)
36 254,140 6,523
Transfers in - net (17,000) 15,892
Amounts written off (54,265) (190,648)
Closing balance 1,271,877 1,086,072
16. CONTINGENT ASSETS
There were no contingent assets as at the statement of financial position date.
17. BILLS PAYABLE
In Pakistan 22,500,509 26,724,282
Outside Pakistan 428,711 548,685
22,929,220 27,272,967
18. BORROWINGS
18.1 Particulars of borrowings
In local currency 138,528,835 238,184,708
In foreign currencies 31,876,225 41,733,417
170,405,060 279,918,125
18.2 Details of borrowings
Secured
Borrowings from the State Bank of Pakistan under:
Export refinance scheme 18.3 30,354,891 28,120,012
Refinance facility for modernization of SMEs 18.4 10,022 11,204
Long term financing facility 18.5 22,959,023 21,871,486
53,323,936 50,002,702
Repurchase agreement borrowings 18.6 74,748,710 133,315,545
Bai Muajjal payable to other financial institutions 13,812,921 49,878,076
141,885,567 233,196,323
Unsecured
Call borrowings 18.7 4,680,579 18,936,178
Overdrawn nostro accounts 591,123 1,936,041
Money market deals 18.8 23,247,791 25,849,583
28,519,493 46,721,802
170,405,060 279,918,125
18.3
------- (Rupees in '000) -------
The Bank has entered into an agreement with the SBP for extending export finance to customers. As per the terms of the
agreement, the Bank has granted the SBP the right to recover the outstanding amounts from the Bank at the date of
maturity of the finances by directly debiting the Bank's current account maintained with the SBP. These borrowings are
repayable within six months, latest by June 2020. These carry mark-up at rates ranging from 1.00% to 2.00% per annum
(2018: 1.00% to 2.00% per annum).
39
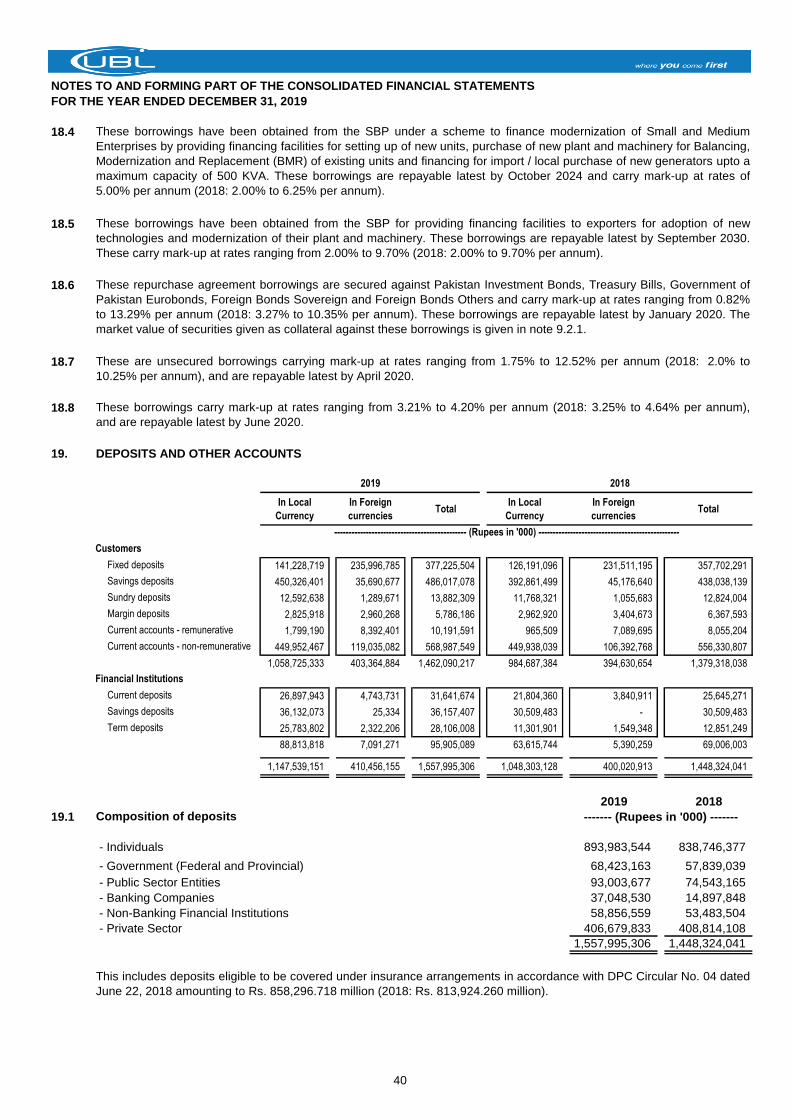
NOTES TO AND FORMING PART OF THE CONSOLIDATED FINANCIAL STATEMENTS
FOR THE YEAR ENDED DECEMBER 31, 2019
18.4
18.5
18.6
18.7
18.8
19. DEPOSITS AND OTHER ACCOUNTS
In Local
Currency
In Foreign
currenciesTotal
In Local
Currency
In Foreign
currenciesTotal
---------------------------------------------- (Rupees in '000) -------------------------------------------------
Customers
Fixed deposits 141,228,719 235,996,785 377,225,504 126,191,096 231,511,195 357,702,291
Savings deposits 450,326,401 35,690,677 486,017,078 392,861,499 45,176,640 438,038,139
Sundry deposits 12,592,638 1,289,671 13,882,309 11,768,321 1,055,683 12,824,004
Margin deposits 2,825,918 2,960,268 5,786,186 2,962,920 3,404,673 6,367,593
Current accounts - remunerative 1,799,190 8,392,401 10,191,591 965,509 7,089,695 8,055,204
Current accounts - non-remunerative 449,952,467 119,035,082 568,987,549 449,938,039 106,392,768 556,330,807
1,058,725,333 403,364,884 1,462,090,217 984,687,384 394,630,654 1,379,318,038
Financial Institutions
Current deposits 26,897,943 4,743,731 31,641,674 21,804,360 3,840,911 25,645,271
Savings deposits 36,132,073 25,334 36,157,407 30,509,483 - 30,509,483
Term deposits 25,783,802 2,322,206 28,106,008 11,301,901 1,549,348 12,851,249
88,813,818 7,091,271 95,905,089 63,615,744 5,390,259 69,006,003
1,147,539,151 410,456,155 1,557,995,306 1,048,303,128 400,020,913 1,448,324,041
2019 2018
19.1 Composition of deposits
- Individuals 893,983,544 838,746,377
- Government (Federal and Provincial) 68,423,163 57,839,039
- Public Sector Entities 93,003,677 74,543,165
- Banking Companies 37,048,530 14,897,848
- Non-Banking Financial Institutions 58,856,559 53,483,504
- Private Sector 406,679,833 408,814,108
1,557,995,306 1,448,324,041
2019 2018
------- (Rupees in '000) -------
These are unsecured borrowings carrying mark-up at rates ranging from 1.75% to 12.52% per annum (2018: 2.0% to
10.25% per annum), and are repayable latest by April 2020.
These borrowings carry mark-up at rates ranging from 3.21% to 4.20% per annum (2018: 3.25% to 4.64% per annum),
and are repayable latest by June 2020.
This includes deposits eligible to be covered under insurance arrangements in accordance with DPC Circular No. 04 dated
June 22, 2018 amounting to Rs. 858,296.718 million (2018: Rs. 813,924.260 million).
These borrowings have been obtained from the SBP under a scheme to finance modernization of Small and Medium
Enterprises by providing financing facilities for setting up of new units, purchase of new plant and machinery for Balancing,
Modernization and Replacement (BMR) of existing units and financing for import / local purchase of new generators upto a
maximum capacity of 500 KVA. These borrowings are repayable latest by October 2024 and carry mark-up at rates of
5.00% per annum (2018: 2.00% to 6.25% per annum).
These borrowings have been obtained from the SBP for providing financing facilities to exporters for adoption of new
technologies and modernization of their plant and machinery. These borrowings are repayable latest by September 2030.
These carry mark-up at rates ranging from 2.00% to 9.70% (2018: 2.00% to 9.70% per annum).
These repurchase agreement borrowings are secured against Pakistan Investment Bonds, Treasury Bills, Government of
Pakistan Eurobonds, Foreign Bonds Sovereign and Foreign Bonds Others and carry mark-up at rates ranging from 0.82%
to 13.29% per annum (2018: 3.27% to 10.35% per annum). These borrowings are repayable latest by January 2020. The
market value of securities given as collateral against these borrowings is given in note 9.2.1.
40
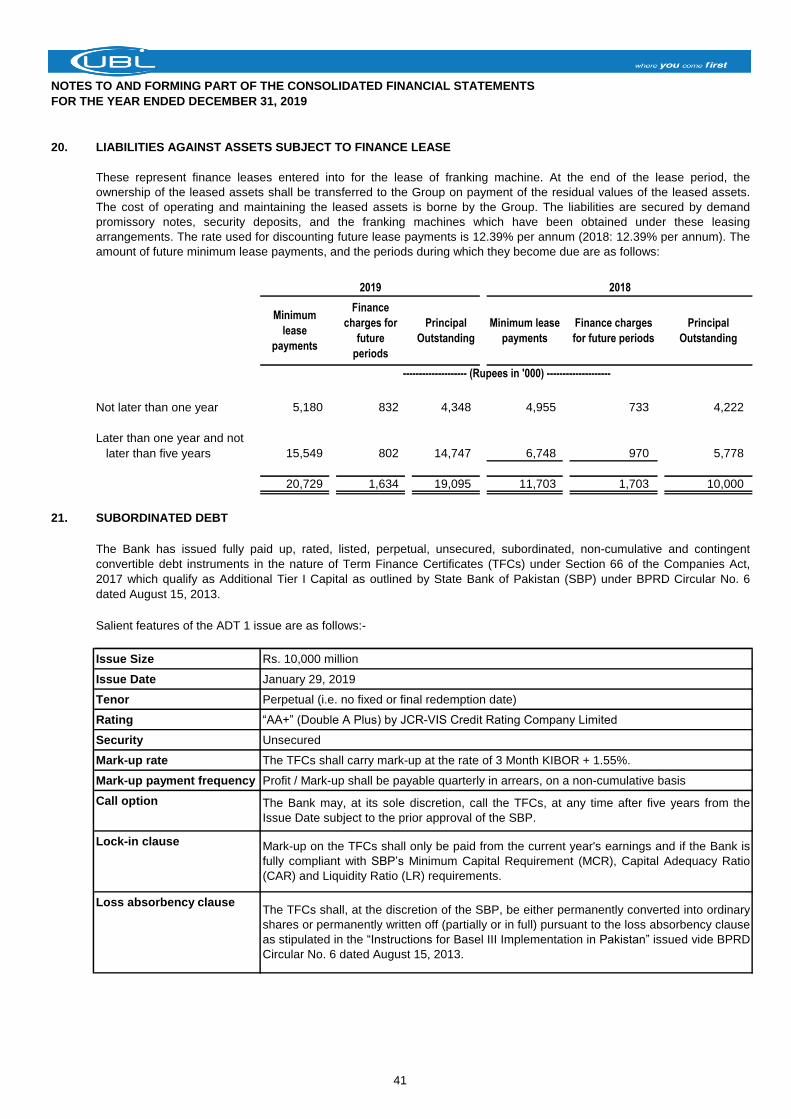
NOTES TO AND FORMING PART OF THE CONSOLIDATED FINANCIAL STATEMENTS
FOR THE YEAR ENDED DECEMBER 31, 2019
20. LIABILITIES AGAINST ASSETS SUBJECT TO FINANCE LEASE
Not later than one year 5,180 832 4,348 4,955 733 4,222
Later than one year and not
later than five years 15,549 802 14,747 6,748 970 5,778
20,729 1,634 19,095 11,703 1,703 10,000
21. SUBORDINATED DEBT
Salient features of the ADT 1 issue are as follows:-
Issue Size Rs. 10,000 million
Issue Date January 29, 2019
Tenor Perpetual (i.e. no fixed or final redemption date)
Rating “AA+” (Double A Plus) by JCR-VIS Credit Rating Company Limited
Security Unsecured
Mark-up rate The TFCs shall carry mark-up at the rate of 3 Month KIBOR + 1.55%.
Mark-up payment frequency Profit / Mark-up shall be payable quarterly in arrears, on a non-cumulative basis
Call option
Lock-in clause
Loss absorbency clause
2018
Finance charges
for future periods
Principal
Outstanding
-------------------- (Rupees in '000) --------------------
These represent finance leases entered into for the lease of franking machine. At the end of the lease period, the
ownership of the leased assets shall be transferred to the Group on payment of the residual values of the leased assets.
The cost of operating and maintaining the leased assets is borne by the Group. The liabilities are secured by demand
promissory notes, security deposits, and the franking machines which have been obtained under these leasing
arrangements. The rate used for discounting future lease payments is 12.39% per annum (2018: 12.39% per annum). The
amount of future minimum lease payments, and the periods during which they become due are as follows:
2019
Finance
charges for
future
periods
Principal
Outstanding
Minimum lease
payments
Minimum
lease
payments
The Bank may, at its sole discretion, call the TFCs, at any time after five years from the
Issue Date subject to the prior approval of the SBP.
Mark-up on the TFCs shall only be paid from the current year's earnings and if the Bank is
fully compliant with SBP’s Minimum Capital Requirement (MCR), Capital Adequacy Ratio
(CAR) and Liquidity Ratio (LR) requirements.
The TFCs shall, at the discretion of the SBP, be either permanently converted into ordinary
shares or permanently written off (partially or in full) pursuant to the loss absorbency clause
as stipulated in the “Instructions for Basel III Implementation in Pakistan” issued vide BPRD
Circular No. 6 dated August 15, 2013.
The Bank has issued fully paid up, rated, listed, perpetual, unsecured, subordinated, non-cumulative and contingent
convertible debt instruments in the nature of Term Finance Certificates (TFCs) under Section 66 of the Companies Act,
2017 which qualify as Additional Tier I Capital as outlined by State Bank of Pakistan (SBP) under BPRD Circular No. 6
dated August 15, 2013.
41
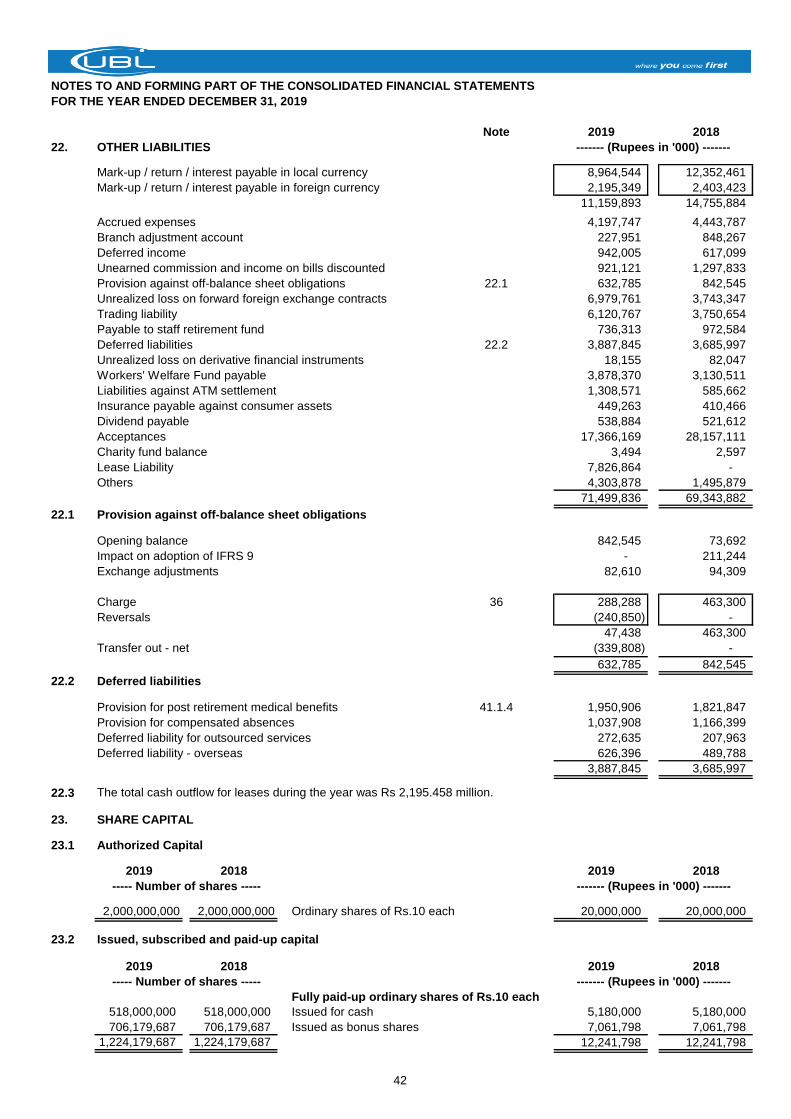
NOTES TO AND FORMING PART OF THE CONSOLIDATED FINANCIAL STATEMENTS
FOR THE YEAR ENDED DECEMBER 31, 2019
Note 2019 2018
22. OTHER LIABILITIES
Mark-up / return / interest payable in local currency 8,964,544 12,352,461
Mark-up / return / interest payable in foreign currency 2,195,349 2,403,423
11,159,893 14,755,884
Accrued expenses 4,197,747 4,443,787
Branch adjustment account 227,951 848,267
Deferred income 942,005 617,099
Unearned commission and income on bills discounted 921,121 1,297,833
Provision against off-balance sheet obligations 22.1 632,785 842,545
Unrealized loss on forward foreign exchange contracts 6,979,761 3,743,347
Trading liability 6,120,767 3,750,654
Payable to staff retirement fund 736,313 972,584
Deferred liabilities 22.2 3,887,845 3,685,997
Unrealized loss on derivative financial instruments 18,155 82,047
Workers' Welfare Fund payable 3,878,370 3,130,511
Liabilities against ATM settlement 1,308,571 585,662
Insurance payable against consumer assets 449,263 410,466
Dividend payable 538,884 521,612
Acceptances 17,366,169 28,157,111
Charity fund balance 3,494 2,597
Lease Liability 7,826,864 -
Others 4,303,878 1,495,879
71,499,836 69,343,882
22.1 Provision against off-balance sheet obligations
Opening balance 842,545 73,692
Impact on adoption of IFRS 9 - 211,244
Exchange adjustments 82,610 94,309
Charge 36 288,288 463,300
Reversals (240,850) -
47,438 463,300
Transfer out - net (339,808) -
632,785 842,545
22.2 Deferred liabilities
Provision for post retirement medical benefits 41.1.4 1,950,906 1,821,847
Provision for compensated absences 1,037,908 1,166,399
Deferred liability for outsourced services 272,635 207,963
Deferred liability - overseas 626,396 489,788
3,887,845 3,685,997
22.3 The total cash outflow for leases during the year was Rs 2,195.458 million.
23. SHARE CAPITAL
23.1 Authorized Capital
2019 2018 2019 2018
2,000,000,000 2,000,000,000 Ordinary shares of Rs.10 each 20,000,000 20,000,000
23.2 Issued, subscribed and paid-up capital
2019 2018 2019 2018
Fully paid-up ordinary shares of Rs.10 each
518,000,000 518,000,000 Issued for cash 5,180,000 5,180,000
706,179,687 706,179,687 Issued as bonus shares 7,061,798 7,061,798
1,224,179,687 1,224,179,687 12,241,798 12,241,798
------- (Rupees in '000) -------
----- Number of shares ----- ------- (Rupees in '000) -------
----- Number of shares ----- ------- (Rupees in '000) -------
42
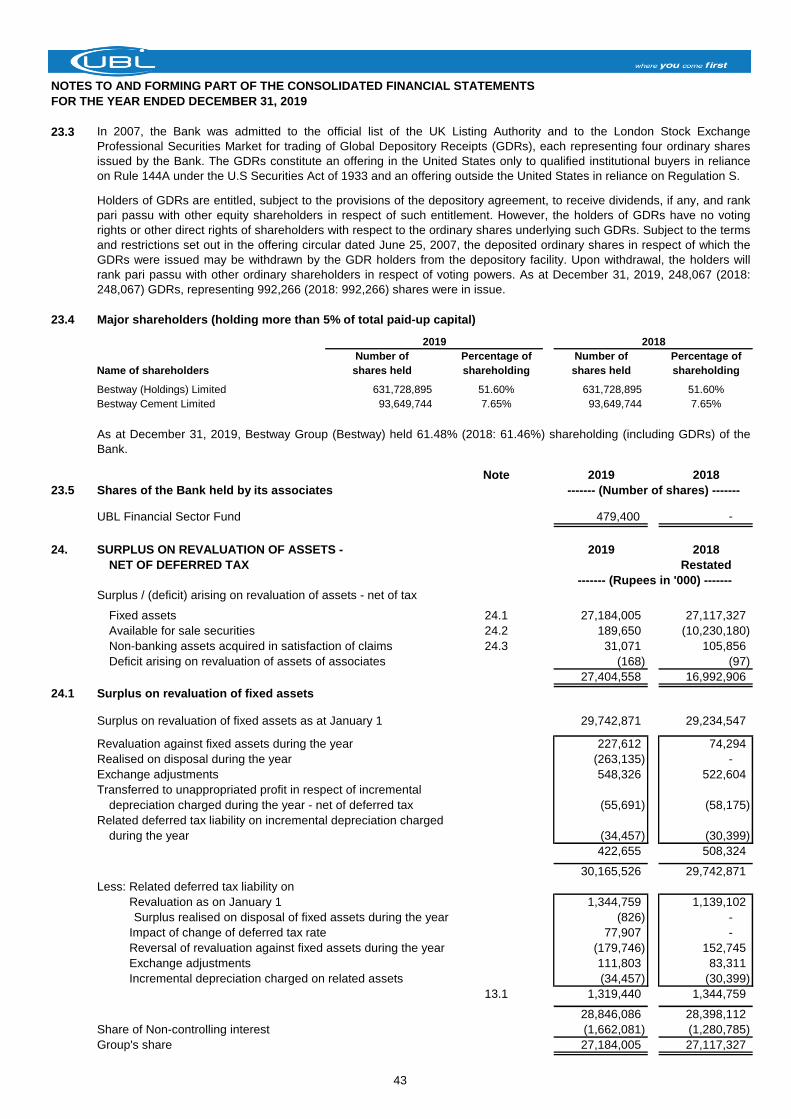
NOTES TO AND FORMING PART OF THE CONSOLIDATED FINANCIAL STATEMENTS
FOR THE YEAR ENDED DECEMBER 31, 2019
23.3
23.4 Major shareholders (holding more than 5% of total paid-up capital)
Number of Percentage of Number of Percentage of
Name of shareholders shares held shareholding shares held shareholding
Bestway (Holdings) Limited 631,728,895 51.60% 631,728,895 51.60%
Bestway Cement Limited 93,649,744 7.65% 93,649,744 7.65%
Note 2019 2018
23.5 Shares of the Bank held by its associates ------- (Number of shares) -------
UBL Financial Sector Fund 479,400 -
24. SURPLUS ON REVALUATION OF ASSETS - 2019 2018
NET OF DEFERRED TAX Restated
Surplus / (deficit) arising on revaluation of assets - net of tax
Fixed assets 24.1 27,184,005 27,117,327
Available for sale securities 24.2 189,650 (10,230,180)
Non-banking assets acquired in satisfaction of claims 24.3 31,071 105,856
Deficit arising on revaluation of assets of associates (168) (97)
27,404,558 16,992,906
24.1 Surplus on revaluation of fixed assets
Surplus on revaluation of fixed assets as at January 1 29,742,871 29,234,547
Revaluation against fixed assets during the year 227,612 74,294
Realised on disposal during the year (263,135) -
Exchange adjustments 548,326 522,604
Transferred to unappropriated profit in respect of incremental
depreciation charged during the year - net of deferred tax (55,691) (58,175)
Related deferred tax liability on incremental depreciation charged
during the year (34,457) (30,399)
422,655 508,324
30,165,526 29,742,871
Less: Related deferred tax liability on
Less: Revaluation as on January 1 1,344,759 1,139,102
Surplus realised on disposal of fixed assets during the year (826) -
Less: Impact of change of deferred tax rate 77,907 -
Less: Reversal of revaluation against fixed assets during the year (179,746) 152,745
Less: Exchange adjustments 111,803 83,311
Less: Incremental depreciation charged on related assets (34,457) (30,399)
13.1 1,319,440 1,344,759
28,846,086 28,398,112
Share of Non-controlling interest (1,662,081) (1,280,785)
Group's share 27,184,005 27,117,327
------- (Rupees in '000) -------
Holders of GDRs are entitled, subject to the provisions of the depository agreement, to receive dividends, if any, and rank
pari passu with other equity shareholders in respect of such entitlement. However, the holders of GDRs have no voting
rights or other direct rights of shareholders with respect to the ordinary shares underlying such GDRs. Subject to the terms
and restrictions set out in the offering circular dated June 25, 2007, the deposited ordinary shares in respect of which the
GDRs were issued may be withdrawn by the GDR holders from the depository facility. Upon withdrawal, the holders will
rank pari passu with other ordinary shareholders in respect of voting powers. As at December 31, 2019, 248,067 (2018:
248,067) GDRs, representing 992,266 (2018: 992,266) shares were in issue.
2019 2018
As at December 31, 2019, Bestway Group (Bestway) held 61.48% (2018: 61.46%) shareholding (including GDRs) of the
Bank.
In 2007, the Bank was admitted to the official list of the UK Listing Authority and to the London Stock Exchange
Professional Securities Market for trading of Global Depository Receipts (GDRs), each representing four ordinary shares
issued by the Bank. The GDRs constitute an offering in the United States only to qualified institutional buyers in reliance
on Rule 144A under the U.S Securities Act of 1933 and an offering outside the United States in reliance on Regulation S.
43
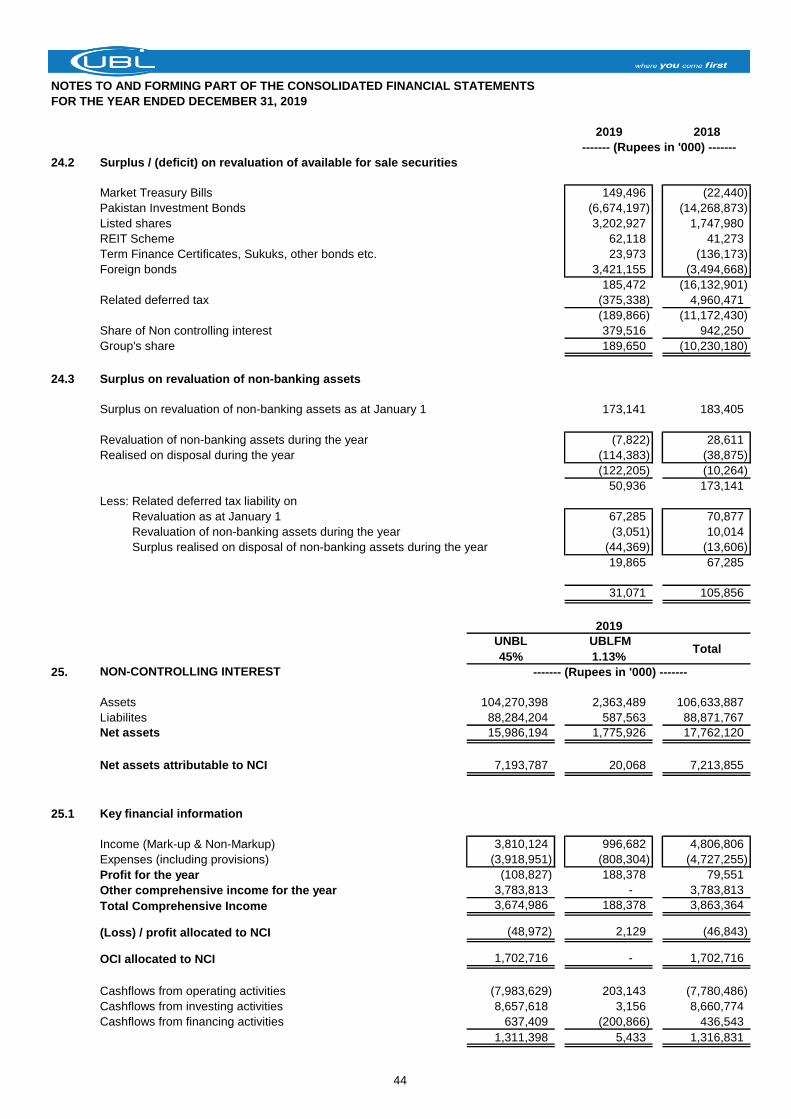
NOTES TO AND FORMING PART OF THE CONSOLIDATED FINANCIAL STATEMENTS
FOR THE YEAR ENDED DECEMBER 31, 2019
2019 2018
24.2 Surplus / (deficit) on revaluation of available for sale securities
Market Treasury Bills 149,496 (22,440)
Pakistan Investment Bonds (6,674,197) (14,268,873)
Listed shares 3,202,927 1,747,980
REIT Scheme 62,118 41,273
Term Finance Certificates, Sukuks, other bonds etc. 23,973 (136,173)
Foreign bonds 3,421,155 (3,494,668)
185,472 (16,132,901)
Related deferred tax (375,338) 4,960,471
(189,866) (11,172,430)
Share of Non controlling interest 379,516 942,250
Group's share 189,650 (10,230,180)
24.3 Surplus on revaluation of non-banking assets
Surplus on revaluation of non-banking assets as at January 1 173,141 183,405
Revaluation of non-banking assets during the year (7,822) 28,611
Realised on disposal during the year (114,383) (38,875)
(122,205) (10,264)
50,936 173,141
Less: Related deferred tax liability on
Less: Revaluation as at January 1 67,285 70,877
Less: Revaluation of non-banking assets during the year (3,051) 10,014
Less: Surplus realised on disposal of non-banking assets during the year (44,369) (13,606)
19,865 67,285
31,071 105,856
2019
UNBL
45%
UBLFM
1.13% Total
25. NON-CONTROLLING INTEREST
Assets 104,270,398 2,363,489 106,633,887
Liabilites 88,284,204 587,563 88,871,767
Net assets 15,986,194 1,775,926 17,762,120
Net assets attributable to NCI 7,193,787 20,068 7,213,855
25.1 Key financial information
Income (Mark-up & Non-Markup) 3,810,124 996,682 4,806,806
Expenses (including provisions) (3,918,951) (808,304) (4,727,255)
Profit for the year (108,827) 188,378 79,551
Other comprehensive income for the year 3,783,813 - 3,783,813
Total Comprehensive Income 3,674,986 188,378 3,863,364
(Loss) / profit allocated to NCI (48,972) 2,129 (46,843)
OCI allocated to NCI 1,702,716 - 1,702,716
Cashflows from operating activities (7,983,629) 203,143 (7,780,486)
Cashflows from investing activities 8,657,618 3,156 8,660,774
Cashflows from financing activities 637,409 (200,866) 436,543
1,311,398 5,433 1,316,831
------- (Rupees in '000) -------
------- (Rupees in '000) -------
44
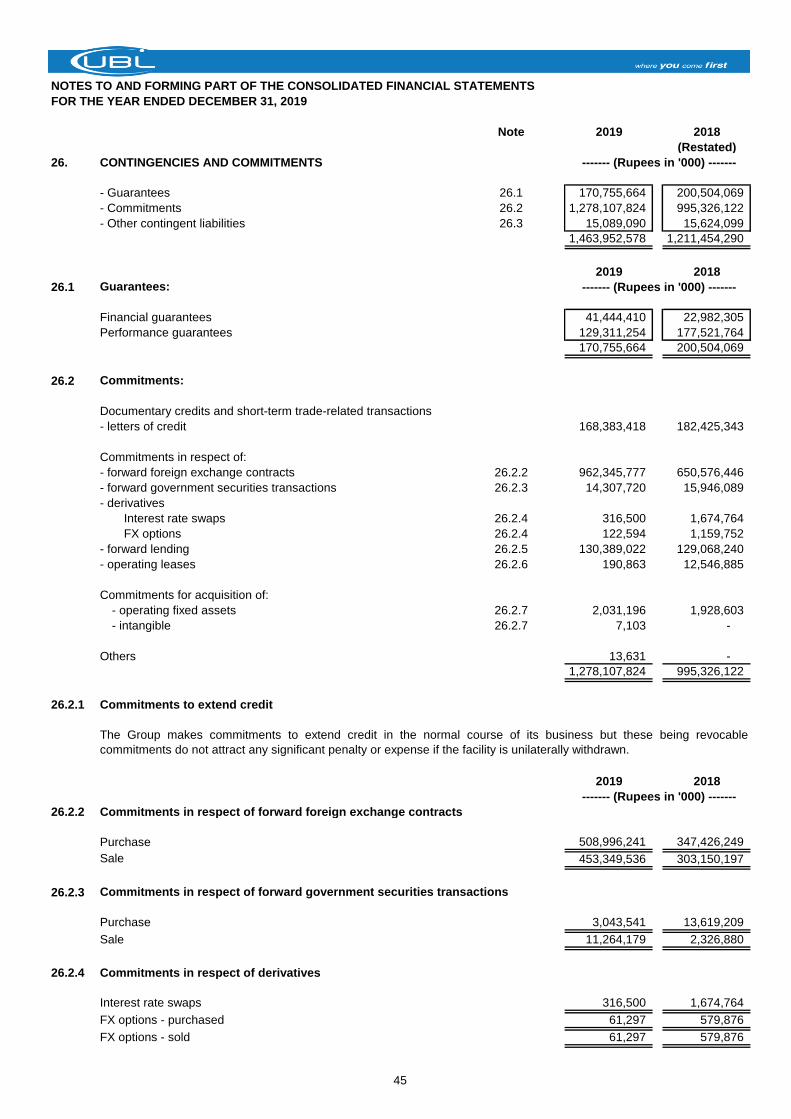
NOTES TO AND FORMING PART OF THE CONSOLIDATED FINANCIAL STATEMENTS
FOR THE YEAR ENDED DECEMBER 31, 2019
Note 2019 2018
(Restated)
26. CONTINGENCIES AND COMMITMENTS
- Guarantees 26.1 170,755,664 200,504,069
- Commitments 26.2 1,278,107,824 995,326,122
- Other contingent liabilities 26.3 15,089,090 15,624,099
1,463,952,578 1,211,454,290
2019 2018
26.1 Guarantees:
Financial guarantees 41,444,410 22,982,305
Performance guarantees 129,311,254 177,521,764
170,755,664 200,504,069
26.2 Commitments:
Documentary credits and short-term trade-related transactions
- letters of credit 168,383,418 182,425,343
Commitments in respect of:
- forward foreign exchange contracts 26.2.2 962,345,777 650,576,446
- forward government securities transactions 26.2.3 14,307,720 15,946,089
- derivatives
Interest rate swaps 26.2.4 316,500 1,674,764
FX options 26.2.4 122,594 1,159,752
- forward lending 26.2.5 130,389,022 129,068,240
- operating leases 26.2.6 190,863 12,546,885
Commitments for acquisition of:
- operating fixed assets 26.2.7 2,031,196 1,928,603
- intangible 26.2.7 7,103 -
Others 13,631 -
1,278,107,824 995,326,122
26.2.1 Commitments to extend credit
2019 2018
26.2.2 Commitments in respect of forward foreign exchange contracts
Purchase 508,996,241 347,426,249
Sale 453,349,536 303,150,197
26.2.3 Commitments in respect of forward government securities transactions
Purchase 3,043,541 13,619,209
Sale 11,264,179 2,326,880
26.2.4 Commitments in respect of derivatives
Interest rate swaps 316,500 1,674,764
FX options - purchased 61,297 579,876
FX options - sold 61,297 579,876
------- (Rupees in '000) -------
------- (Rupees in '000) -------
------- (Rupees in '000) -------
The Group makes commitments to extend credit in the normal course of its business but these being revocable
commitments do not attract any significant penalty or expense if the facility is unilaterally withdrawn.
45
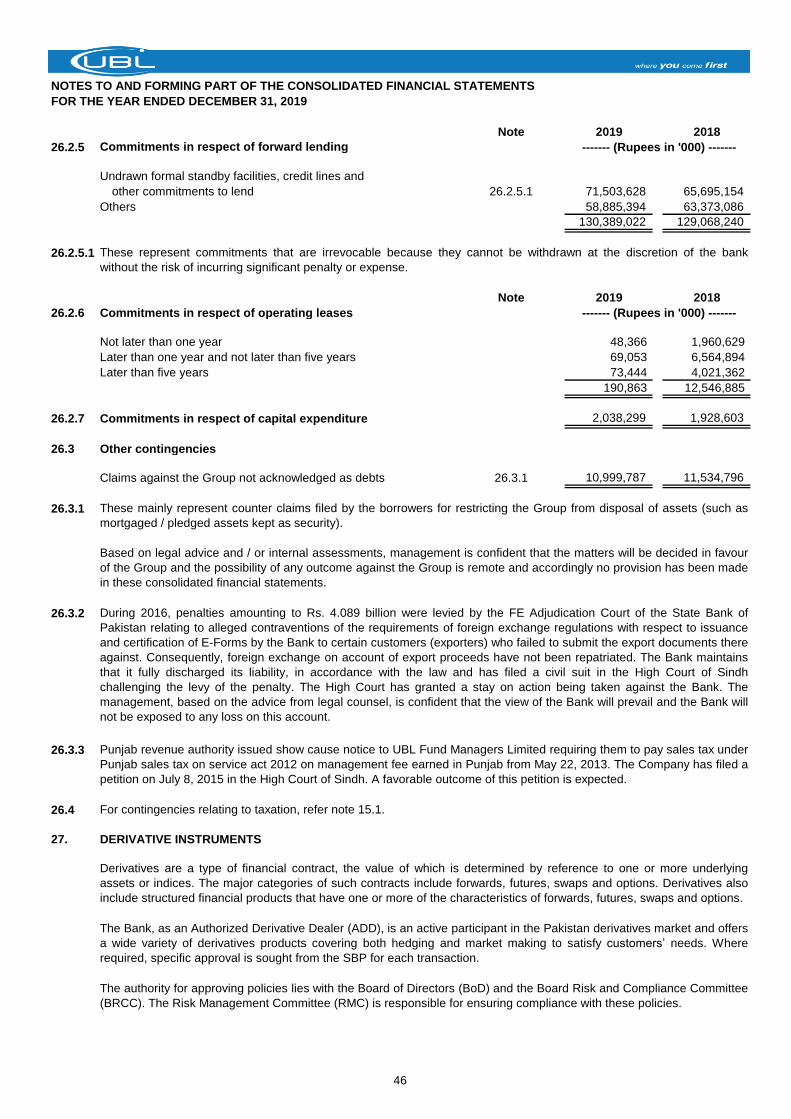
NOTES TO AND FORMING PART OF THE CONSOLIDATED FINANCIAL STATEMENTS
FOR THE YEAR ENDED DECEMBER 31, 2019
Note 2019 2018
26.2.5 Commitments in respect of forward lending
Undrawn formal standby facilities, credit lines and
other commitments to lend 26.2.5.1 71,503,628 65,695,154
Others 58,885,394 63,373,086
130,389,022 129,068,240
26.2.5.1
Note 2019 2018
26.2.6 Commitments in respect of operating leases
Not later than one year 48,366 1,960,629
Later than one year and not later than five years 69,053 6,564,894
Later than five years 73,444 4,021,362
190,863 12,546,885
26.2.7 Commitments in respect of capital expenditure 2,038,299 1,928,603
26.3 Other contingencies
Claims against the Group not acknowledged as debts 26.3.1 10,999,787 11,534,796
26.3.1
26.3.2
26.3.3
26.4 For contingencies relating to taxation, refer note 15.1.
27. DERIVATIVE INSTRUMENTS
------- (Rupees in '000) -------
Derivatives are a type of financial contract, the value of which is determined by reference to one or more underlying
assets or indices. The major categories of such contracts include forwards, futures, swaps and options. Derivatives also
include structured financial products that have one or more of the characteristics of forwards, futures, swaps and options.
These represent commitments that are irrevocable because they cannot be withdrawn at the discretion of the bank
without the risk of incurring significant penalty or expense.
------- (Rupees in '000) -------
These mainly represent counter claims filed by the borrowers for restricting the Group from disposal of assets (such as
mortgaged / pledged assets kept as security).
Based on legal advice and / or internal assessments, management is confident that the matters will be decided in favour
of the Group and the possibility of any outcome against the Group is remote and accordingly no provision has been made
in these consolidated financial statements.
During 2016, penalties amounting to Rs. 4.089 billion were levied by the FE Adjudication Court of the State Bank of
Pakistan relating to alleged contraventions of the requirements of foreign exchange regulations with respect to issuance
and certification of E-Forms by the Bank to certain customers (exporters) who failed to submit the export documents there
against. Consequently, foreign exchange on account of export proceeds have not been repatriated. The Bank maintains
that it fully discharged its liability, in accordance with the law and has filed a civil suit in the High Court of Sindh
challenging the levy of the penalty. The High Court has granted a stay on action being taken against the Bank. The
management, based on the advice from legal counsel, is confident that the view of the Bank will prevail and the Bank will
not be exposed to any loss on this account.
Punjab revenue authority issued show cause notice to UBL Fund Managers Limited requiring them to pay sales tax under
Punjab sales tax on service act 2012 on management fee earned in Punjab from May 22, 2013. The Company has filed a
petition on July 8, 2015 in the High Court of Sindh. A favorable outcome of this petition is expected.
The Bank, as an Authorized Derivative Dealer (ADD), is an active participant in the Pakistan derivatives market and offers
a wide variety of derivatives products covering both hedging and market making to satisfy customers’ needs. Where
required, specific approval is sought from the SBP for each transaction.
The authority for approving policies lies with the Board of Directors (BoD) and the Board Risk and Compliance Committee
(BRCC). The Risk Management Committee (RMC) is responsible for ensuring compliance with these policies.
46
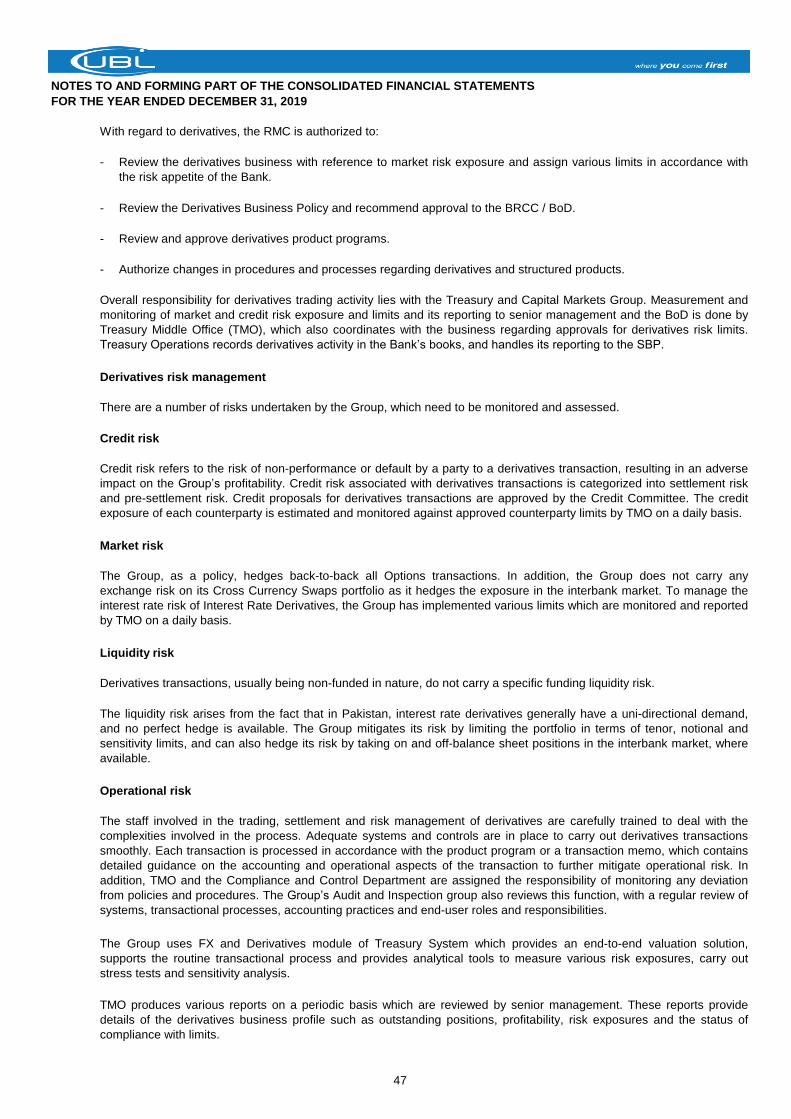
NOTES TO AND FORMING PART OF THE CONSOLIDATED FINANCIAL STATEMENTS
FOR THE YEAR ENDED DECEMBER 31, 2019
With regard to derivatives, the RMC is authorized to:
-
- Review the Derivatives Business Policy and recommend approval to the BRCC / BoD.
- Review and approve derivatives product programs.
- Authorize changes in procedures and processes regarding derivatives and structured products.
Derivatives risk management
There are a number of risks undertaken by the Group, which need to be monitored and assessed.
Credit risk
Market risk
Liquidity risk
Derivatives transactions, usually being non-funded in nature, do not carry a specific funding liquidity risk.
Operational risk
Review the derivatives business with reference to market risk exposure and assign various limits in accordance with
the risk appetite of the Bank.
Overall responsibility for derivatives trading activity lies with the Treasury and Capital Markets Group. Measurement and
monitoring of market and credit risk exposure and limits and its reporting to senior management and the BoD is done by
Treasury Middle Office (TMO), which also coordinates with the business regarding approvals for derivatives risk limits.
Treasury Operations records derivatives activity in the Bank’s books, and handles its reporting to the SBP.
The staff involved in the trading, settlement and risk management of derivatives are carefully trained to deal with the
complexities involved in the process. Adequate systems and controls are in place to carry out derivatives transactions
smoothly. Each transaction is processed in accordance with the product program or a transaction memo, which contains
detailed guidance on the accounting and operational aspects of the transaction to further mitigate operational risk. In
addition, TMO and the Compliance and Control Department are assigned the responsibility of monitoring any deviation
from policies and procedures. The Group’s Audit and Inspection group also reviews this function, with a regular review of
systems, transactional processes, accounting practices and end-user roles and responsibilities.
The Group uses FX and Derivatives module of Treasury System which provides an end-to-end valuation solution,
supports the routine transactional process and provides analytical tools to measure various risk exposures, carry out
stress tests and sensitivity analysis.
TMO produces various reports on a periodic basis which are reviewed by senior management. These reports provide
details of the derivatives business profile such as outstanding positions, profitability, risk exposures and the status of
compliance with limits.
Credit risk refers to the risk of non-performance or default by a party to a derivatives transaction, resulting in an adverse
impact on the Group’s profitability. Credit risk associated with derivatives transactions is categorized into settlement risk
and pre-settlement risk. Credit proposals for derivatives transactions are approved by the Credit Committee. The credit
exposure of each counterparty is estimated and monitored against approved counterparty limits by TMO on a daily basis.
The Group, as a policy, hedges back-to-back all Options transactions. In addition, the Group does not carry any
exchange risk on its Cross Currency Swaps portfolio as it hedges the exposure in the interbank market. To manage the
interest rate risk of Interest Rate Derivatives, the Group has implemented various limits which are monitored and reported
by TMO on a daily basis.
The liquidity risk arises from the fact that in Pakistan, interest rate derivatives generally have a uni-directional demand,
and no perfect hedge is available. The Group mitigates its risk by limiting the portfolio in terms of tenor, notional and
sensitivity limits, and can also hedge its risk by taking on and off-balance sheet positions in the interbank market, where
available.
47
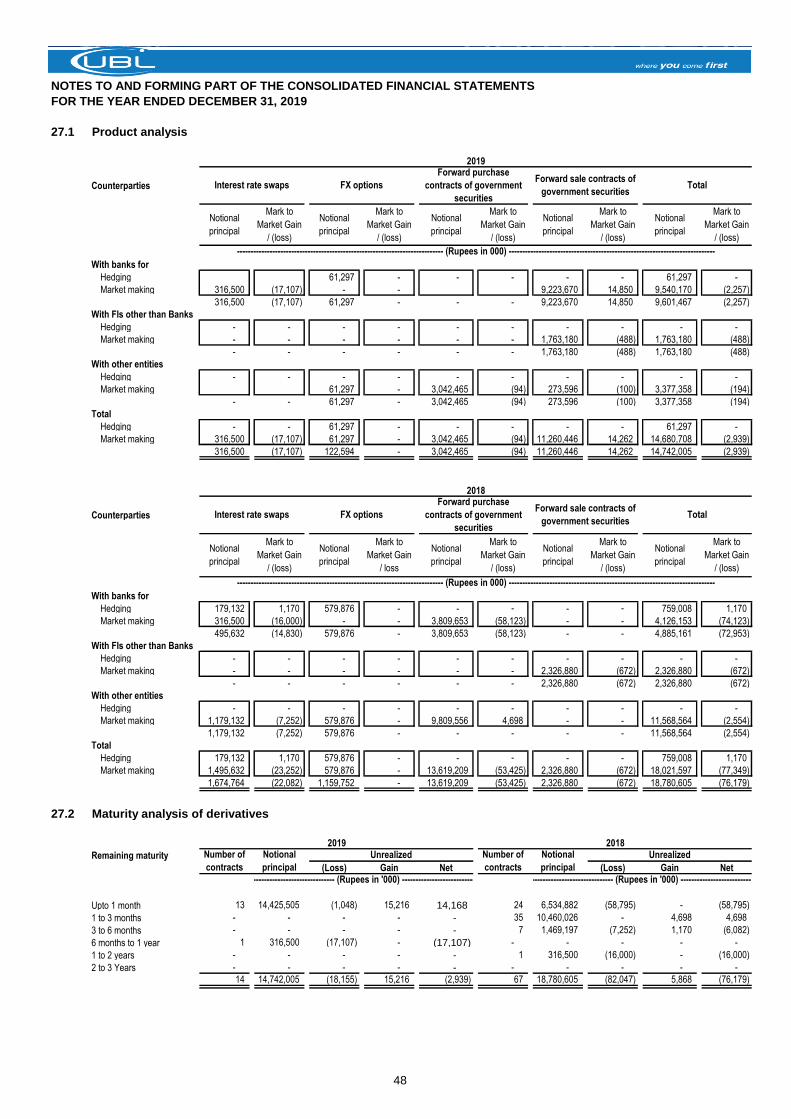
NOTES TO AND FORMING PART OF THE CONSOLIDATED FINANCIAL STATEMENTS
FOR THE YEAR ENDED DECEMBER 31, 2019
27.1 Product analysis
Counterparties
With banks for
Hedging 61,297 - - - - - 61,297 -
Market making 316,500 (17,107) - - 9,223,670 14,850 9,540,170 (2,257)
316,500 (17,107) 61,297 - - - 9,223,670 14,850 9,601,467 (2,257)
With FIs other than Banks
Hedging - - - - - - - - - -
Market making - - - - - - 1,763,180 (488) 1,763,180 (488)
- - - - - - 1,763,180 (488) 1,763,180 (488)
With other entities
Hedging - - - - - - - - - -
Market making 61,297 - 3,042,465 (94) 273,596 (100) 3,377,358 (194)
- - 61,297 - 3,042,465 (94) 273,596 (100) 3,377,358 (194)
Total
Hedging - - 61,297 - - - - - 61,297 -
Market making 316,500 (17,107) 61,297 - 3,042,465 (94) 11,260,446 14,262 14,680,708 (2,939)
316,500 (17,107) 122,594 - 3,042,465 (94) 11,260,446 14,262 14,742,005 (2,939)
Counterparties
With banks for
Hedging 179,132 1,170 579,876 - - - - - 759,008 1,170
Market making 316,500 (16,000) - - 3,809,653 (58,123) - - 4,126,153 (74,123)
495,632 (14,830) 579,876 - 3,809,653 (58,123) - - 4,885,161 (72,953)
With FIs other than Banks
Hedging - - - - - - - - - -
Market making - - - - - - 2,326,880 (672) 2,326,880 (672)
- - - - - - 2,326,880 (672) 2,326,880 (672)
With other entities
Hedging - - - - - - - - - -
Market making 1,179,132 (7,252) 579,876 - 9,809,556 4,698 - - 11,568,564 (2,554)
1,179,132 (7,252) 579,876 - - - - - 11,568,564 (2,554)
Total
Hedging 179,132 1,170 579,876 - - - - - 759,008 1,170
Market making 1,495,632 (23,252) 579,876 - 13,619,209 (53,425) 2,326,880 (672) 18,021,597 (77,349)
1,674,764 (22,082) 1,159,752 - 13,619,209 (53,425) 2,326,880 (672) 18,780,605 (76,179)
27.2 Maturity analysis of derivatives
(Loss) Gain Net (Loss) Gain Net
Upto 1 month 13 14,425,505 (1,048) 15,216 14,168 24 6,534,882 (58,795) - (58,795)
1 to 3 months - - - - - 35 10,460,026 - 4,698 4,698
3 to 6 months - - - - - 7 1,469,197 (7,252) 1,170 (6,082)
6 months to 1 year 1 316,500 (17,107) - (17,107) - - - - -
1 to 2 years - - - - - 1 316,500 (16,000) - (16,000)
2 to 3 Years - - - - - - - - - -
14 14,742,005 (18,155) 15,216 (2,939) 67 18,780,605 (82,047) 5,868 (76,179)
---------------------------------------------------------------------------- (Rupees in 000) ----------------------------------------------------------------------------
Interest rate swaps FX options
Forward purchase
contracts of government
securities
Forward sale contracts of
government securitiesTotal
Notional
principal
Mark to
Market Gain
/ (loss)
Notional
principal
Mark to
Market Gain
/ loss
Notional
principal
Mark to
Market Gain
/ (loss)
Notional
principal
Mark to
Market Gain
/ (loss)
Notional
principal
Mark to
Market Gain
/ (loss)
2018
Notional
principal
Mark to
Market Gain
/ (loss)
Notional
principal
Mark to
Market Gain
/ (loss)
Notional
principal
Mark to
Market Gain
/ (loss)
Notional
principal
Mark to
Market Gain
/ (loss)
Notional
principal
Mark to
Market Gain
/ (loss)
---------------------------------------------------------------------------- (Rupees in 000) ----------------------------------------------------------------------------
2019
Interest rate swaps FX options
Forward purchase
contracts of government
securities
Forward sale contracts of
government securitiesTotal
--------------------------------------------- (Rupees in '000) ------------------------------------------
2019
Remaining maturity Number of
contracts
Notional
principal
Unrealized
--------------------------------------------- (Rupees in '000) ------------------------------------------
2018Number of
contracts
Notional
principal
Unrealized
48
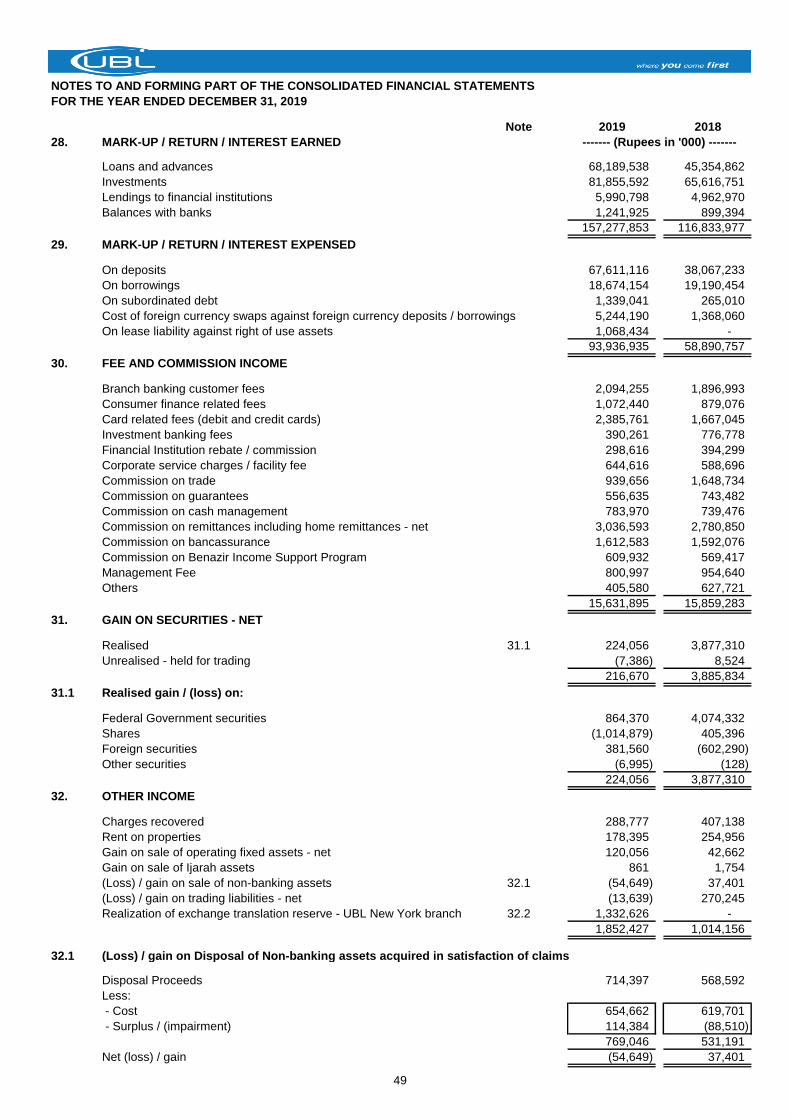
NOTES TO AND FORMING PART OF THE CONSOLIDATED FINANCIAL STATEMENTS
FOR THE YEAR ENDED DECEMBER 31, 2019
Note 2019 2018
28. MARK-UP / RETURN / INTEREST EARNED
Loans and advances 68,189,538 45,354,862
Investments 81,855,592 65,616,751
Lendings to financial institutions 5,990,798 4,962,970
Balances with banks 1,241,925 899,394
157,277,853 116,833,977
29. MARK-UP / RETURN / INTEREST EXPENSED
On deposits 67,611,116 38,067,233
On borrowings 18,674,154 19,190,454
On subordinated debt 1,339,041 265,010
Cost of foreign currency swaps against foreign currency deposits / borrowings 5,244,190 1,368,060
On lease liability against right of use assets 1,068,434 -
93,936,935 58,890,757
30. FEE AND COMMISSION INCOME
Branch banking customer fees 2,094,255 1,896,993
Consumer finance related fees 1,072,440 879,076
Card related fees (debit and credit cards) 2,385,761 1,667,045
Investment banking fees 390,261 776,778
Financial Institution rebate / commission 298,616 394,299
Corporate service charges / facility fee 644,616 588,696
Commission on trade 939,656 1,648,734
Commission on guarantees 556,635 743,482
Commission on cash management 783,970 739,476
Commission on remittances including home remittances - net 3,036,593 2,780,850
Commission on bancassurance 1,612,583 1,592,076
Commission on Benazir Income Support Program 609,932 569,417
Management Fee 800,997 954,640
Others 405,580 627,721
15,631,895 15,859,283
31. GAIN ON SECURITIES - NET
Realised 31.1 224,056 3,877,310
Unrealised - held for trading (7,386) 8,524
216,670 3,885,834
31.1 Realised gain / (loss) on:
Federal Government securities 864,370 4,074,332
Shares (1,014,879) 405,396
Foreign securities 381,560 (602,290)
Other securities (6,995) (128)
224,056 3,877,310
32. OTHER INCOME
Charges recovered 288,777 407,138
Rent on properties 178,395 254,956
Gain on sale of operating fixed assets - net 120,056 42,662
Gain on sale of Ijarah assets 861 1,754
(Loss) / gain on sale of non-banking assets 32.1 (54,649) 37,401
(Loss) / gain on trading liabilities - net (13,639) 270,245
Realization of exchange translation reserve - UBL New York branch 32.2 1,332,626 -
1,852,427 1,014,156
32.1 (Loss) / gain on Disposal of Non-banking assets acquired in satisfaction of claims
Disposal Proceeds 714,397 568,592
Less:
- Cost 654,662 619,701
- Surplus / (impairment) 114,384 (88,510)
769,046 531,191
Net (loss) / gain (54,649) 37,401
------- (Rupees in '000) -------
49
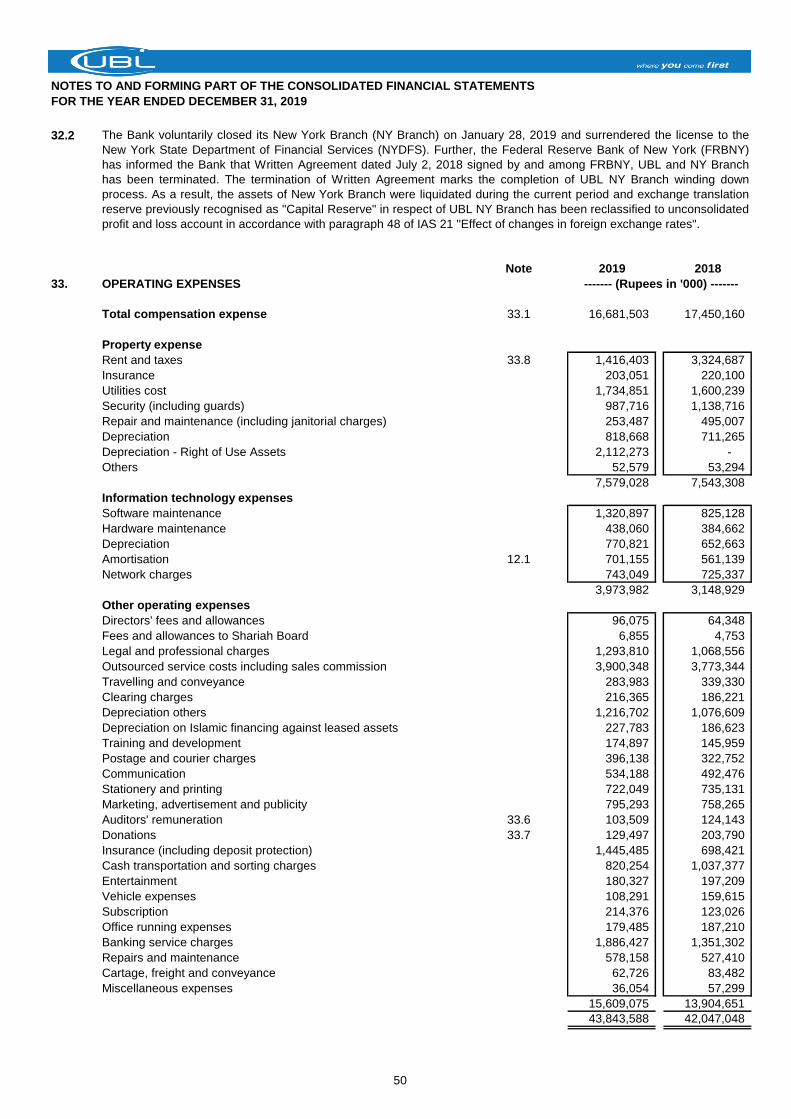
NOTES TO AND FORMING PART OF THE CONSOLIDATED FINANCIAL STATEMENTS
FOR THE YEAR ENDED DECEMBER 31, 2019
32.2
Note 2019 2018
33. OPERATING EXPENSES
Total compensation expense 33.1 16,681,503 17,450,160
Property expense
Rent and taxes 33.8 1,416,403 3,324,687
Insurance 203,051 220,100
Utilities cost 1,734,851 1,600,239
Security (including guards) 987,716 1,138,716
Repair and maintenance (including janitorial charges) 253,487 495,007
Depreciation 818,668 711,265
Depreciation - Right of Use Assets 2,112,273 -
Others 52,579 53,294
7,579,028 7,543,308
Information technology expenses
Software maintenance 1,320,897 825,128
Hardware maintenance 438,060 384,662
Depreciation 770,821 652,663
Amortisation 12.1 701,155 561,139
Network charges 743,049 725,337
3,973,982 3,148,929
Other operating expenses
Directors' fees and allowances 96,075 64,348
Fees and allowances to Shariah Board 6,855 4,753
Legal and professional charges 1,293,810 1,068,556
Outsourced service costs including sales commission 3,900,348 3,773,344
Travelling and conveyance 283,983 339,330
Clearing charges 216,365 186,221
Depreciation others 1,216,702 1,076,609
Depreciation on Islamic financing against leased assets 227,783 186,623
Training and development 174,897 145,959
Postage and courier charges 396,138 322,752
Communication 534,188 492,476
Stationery and printing 722,049 735,131
Marketing, advertisement and publicity 795,293 758,265
Auditors' remuneration 33.6 103,509 124,143
Donations 33.7 129,497 203,790
Insurance (including deposit protection) 1,445,485 698,421
Cash transportation and sorting charges 820,254 1,037,377
Entertainment 180,327 197,209
Vehicle expenses 108,291 159,615
Subscription 214,376 123,026
Office running expenses 179,485 187,210
Banking service charges 1,886,427 1,351,302
Repairs and maintenance 578,158 527,410
Cartage, freight and conveyance 62,726 83,482
Miscellaneous expenses 36,054 57,299
15,609,075 13,904,651
43,843,588 42,047,048
------- (Rupees in '000) -------
The Bank voluntarily closed its New York Branch (NY Branch) on January 28, 2019 and surrendered the license to the
New York State Department of Financial Services (NYDFS). Further, the Federal Reserve Bank of New York (FRBNY)
has informed the Bank that Written Agreement dated July 2, 2018 signed by and among FRBNY, UBL and NY Branch
has been terminated. The termination of Written Agreement marks the completion of UBL NY Branch winding down
process. As a result, the assets of New York Branch were liquidated during the current period and exchange translation
reserve previously recognised as "Capital Reserve" in respect of UBL NY Branch has been reclassified to unconsolidated
profit and loss account in accordance with paragraph 48 of IAS 21 "Effect of changes in foreign exchange rates".
50
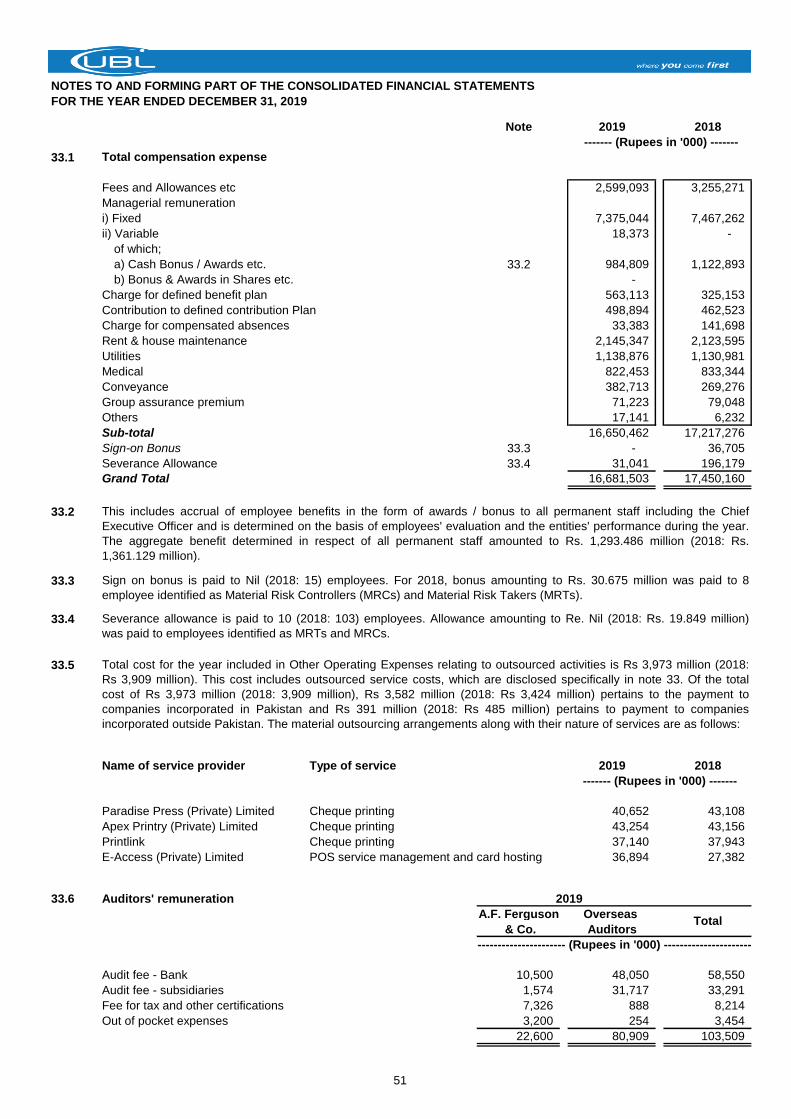
NOTES TO AND FORMING PART OF THE CONSOLIDATED FINANCIAL STATEMENTS
FOR THE YEAR ENDED DECEMBER 31, 2019
Note 2019 2018
33.1 Total compensation expense
Fees and Allowances etc 2,599,093 3,255,271
Managerial remuneration
i) Fixed 7,375,044 7,467,262
ii) Variable 18,373 -
of which;
a) Cash Bonus / Awards etc. 33.2 984,809 1,122,893
b) Bonus & Awards in Shares etc. -
Charge for defined benefit plan 563,113 325,153
Contribution to defined contribution Plan 498,894 462,523
Charge for compensated absences 33,383 141,698
Rent & house maintenance 2,145,347 2,123,595
Utilities 1,138,876 1,130,981
Medical 822,453 833,344
Conveyance 382,713 269,276
Group assurance premium 71,223 79,048
Others 17,141 6,232
Sub-total 16,650,462 17,217,276
Sign-on Bonus 33.3 - 36,705
Severance Allowance 33.4 31,041 196,179
Grand Total 16,681,503 17,450,160
33.2
33.3
33.4
33.5
Name of service provider Type of service 2019 2018
Paradise Press (Private) Limited Cheque printing 40,652 43,108
Apex Printry (Private) Limited Cheque printing 43,254 43,156
Printlink Cheque printing 37,140 37,943
E-Access (Private) Limited POS service management and card hosting 36,894 27,382
33.6 Auditors' remuneration
A.F. Ferguson Overseas
& Co. Auditors
Audit fee - Bank 10,500 48,050 58,550
Audit fee - subsidiaries 1,574 31,717 33,291
Fee for tax and other certifications 7,326 888 8,214
Out of pocket expenses 3,200 254 3,454
22,600 80,909 103,509
Total cost for the year included in Other Operating Expenses relating to outsourced activities is Rs 3,973 million (2018:
Rs 3,909 million). This cost includes outsourced service costs, which are disclosed specifically in note 33. Of the total
cost of Rs 3,973 million (2018: 3,909 million), Rs 3,582 million (2018: Rs 3,424 million) pertains to the payment to
companies incorporated in Pakistan and Rs 391 million (2018: Rs 485 million) pertains to payment to companies
incorporated outside Pakistan. The material outsourcing arrangements along with their nature of services are as follows:
------- (Rupees in '000) -------
------- (Rupees in '000) -------
This includes accrual of employee benefits in the form of awards / bonus to all permanent staff including the Chief
Executive Officer and is determined on the basis of employees' evaluation and the entities' performance during the year.
The aggregate benefit determined in respect of all permanent staff amounted to Rs. 1,293.486 million (2018: Rs.
1,361.129 million).
Sign on bonus is paid to Nil (2018: 15) employees. For 2018, bonus amounting to Rs. 30.675 million was paid to 8
employee identified as Material Risk Controllers (MRCs) and Material Risk Takers (MRTs).
Severance allowance is paid to 10 (2018: 103) employees. Allowance amounting to Re. Nil (2018: Rs. 19.849 million)
was paid to employees identified as MRTs and MRCs.
Total
2019
------------------------------------- (Rupees in '000) -------------------------------------
51
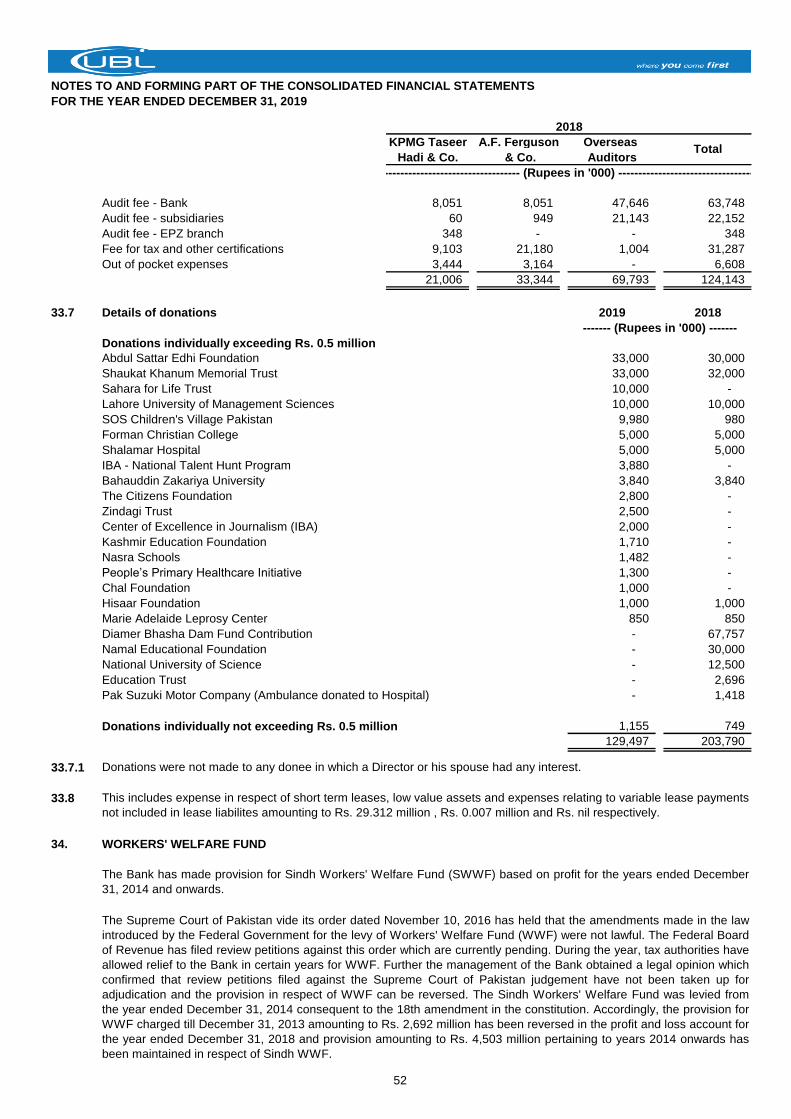
NOTES TO AND FORMING PART OF THE CONSOLIDATED FINANCIAL STATEMENTS
FOR THE YEAR ENDED DECEMBER 31, 2019
KPMG Taseer A.F. Ferguson Overseas
Hadi & Co. & Co. Auditors
Audit fee - Bank 8,051 8,051 47,646 63,748
Audit fee - subsidiaries 60 949 21,143 22,152
Audit fee - EPZ branch 348 - - 348
Fee for tax and other certifications 9,103 21,180 1,004 31,287
Out of pocket expenses 3,444 3,164 - 6,608
21,006 33,344 69,793 124,143
33.7 Details of donations 2019 2018
Donations individually exceeding Rs. 0.5 million
Abdul Sattar Edhi Foundation 33,000 30,000
Shaukat Khanum Memorial Trust 33,000 32,000
Sahara for Life Trust 10,000 -
Lahore University of Management Sciences 10,000 10,000
SOS Children's Village Pakistan 9,980 980
Forman Christian College 5,000 5,000
Shalamar Hospital 5,000 5,000
IBA - National Talent Hunt Program 3,880 -
Bahauddin Zakariya University 3,840 3,840
The Citizens Foundation 2,800 -
Zindagi Trust 2,500 -
Center of Excellence in Journalism (IBA) 2,000 -
Kashmir Education Foundation 1,710 -
Nasra Schools 1,482 -
People’s Primary Healthcare Initiative 1,300 -
Chal Foundation 1,000 -
Hisaar Foundation 1,000 1,000
Marie Adelaide Leprosy Center 850 850
Diamer Bhasha Dam Fund Contribution - 67,757
Namal Educational Foundation - 30,000
National University of Science - 12,500
Education Trust - 2,696
Pak Suzuki Motor Company (Ambulance donated to Hospital) - 1,418
Donations individually not exceeding Rs. 0.5 million 1,155 749
129,497 203,790
33.7.1 Donations were not made to any donee in which a Director or his spouse had any interest.
33.8
34. WORKERS' WELFARE FUND
------------------------------------- (Rupees in '000) -------------------------------------
The Bank has made provision for Sindh Workers' Welfare Fund (SWWF) based on profit for the years ended December
31, 2014 and onwards.
------- (Rupees in '000) -------
The Supreme Court of Pakistan vide its order dated November 10, 2016 has held that the amendments made in the law
introduced by the Federal Government for the levy of Workers' Welfare Fund (WWF) were not lawful. The Federal Board
of Revenue has filed review petitions against this order which are currently pending. During the year, tax authorities have
allowed relief to the Bank in certain years for WWF. Further the management of the Bank obtained a legal opinion which
confirmed that review petitions filed against the Supreme Court of Pakistan judgement have not been taken up for
adjudication and the provision in respect of WWF can be reversed. The Sindh Workers' Welfare Fund was levied from
the year ended December 31, 2014 consequent to the 18th amendment in the constitution. Accordingly, the provision for
WWF charged till December 31, 2013 amounting to Rs. 2,692 million has been reversed in the profit and loss account for
the year ended December 31, 2018 and provision amounting to Rs. 4,503 million pertaining to years 2014 onwards has
been maintained in respect of Sindh WWF.
2018
Total
This includes expense in respect of short term leases, low value assets and expenses relating to variable lease payments
not included in lease liabilites amounting to Rs. 29.312 million , Rs. 0.007 million and Rs. nil respectively.
52
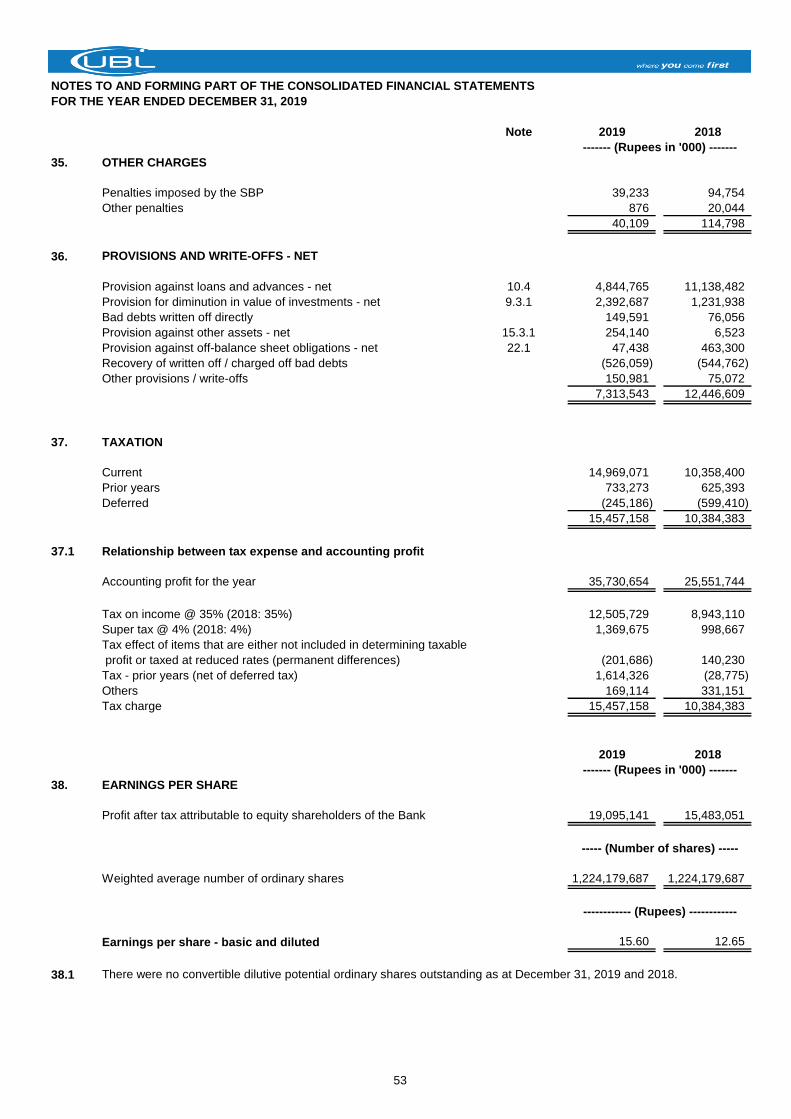
NOTES TO AND FORMING PART OF THE CONSOLIDATED FINANCIAL STATEMENTS
FOR THE YEAR ENDED DECEMBER 31, 2019
Note 2019 2018
35. OTHER CHARGES
Penalties imposed by the SBP 39,233 94,754
Other penalties 876 20,044
40,109 114,798
36. PROVISIONS AND WRITE-OFFS - NET
Provision against loans and advances - net 10.4 4,844,765 11,138,482
Provision for diminution in value of investments - net 9.3.1 2,392,687 1,231,938
Bad debts written off directly 149,591 76,056
Provision against other assets - net 15.3.1 254,140 6,523
Provision against off-balance sheet obligations - net 22.1 47,438 463,300
Recovery of written off / charged off bad debts (526,059) (544,762)
Other provisions / write-offs 150,981 75,072
7,313,543 12,446,609
37. TAXATION
Current 14,969,071 10,358,400
Prior years 733,273 625,393
Deferred (245,186) (599,410)
15,457,158 10,384,383
37.1 Relationship between tax expense and accounting profit
Accounting profit for the year 35,730,654 25,551,744
Tax on income @ 35% (2018: 35%) 12,505,729 8,943,110
Super tax @ 4% (2018: 4%) 1,369,675 998,667
Tax effect of items that are either not included in determining taxable
profit or taxed at reduced rates (permanent differences) (201,686) 140,230
Tax - prior years (net of deferred tax) 1,614,326 (28,775)
Others 169,114 331,151
Tax charge 15,457,158 10,384,383
2019 2018
38. EARNINGS PER SHARE
Profit after tax attributable to equity shareholders of the Bank 19,095,141 15,483,051
Weighted average number of ordinary shares 1,224,179,687 1,224,179,687
Earnings per share - basic and diluted 15.60 12.65
38.1 There were no convertible dilutive potential ordinary shares outstanding as at December 31, 2019 and 2018.
------- (Rupees in '000) -------
------------ (Rupees) ------------
----- (Number of shares) -----
------- (Rupees in '000) -------
53
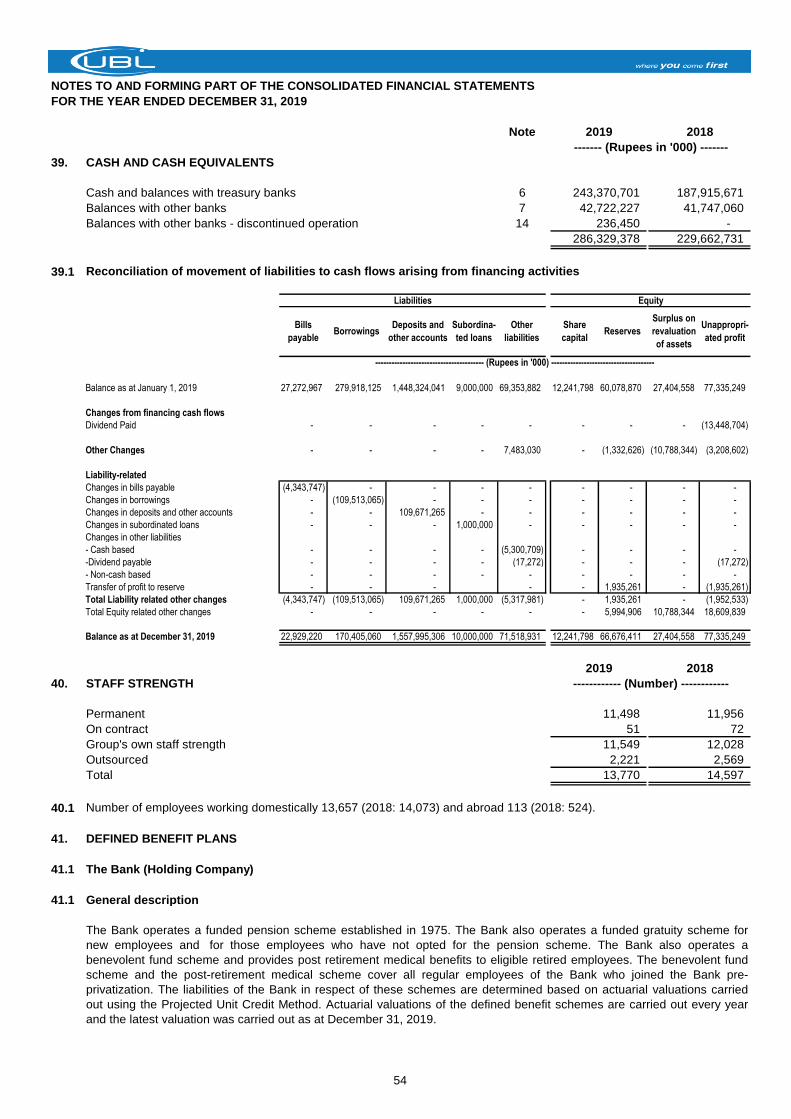
NOTES TO AND FORMING PART OF THE CONSOLIDATED FINANCIAL STATEMENTS
FOR THE YEAR ENDED DECEMBER 31, 2019
Note
39. CASH AND CASH EQUIVALENTS
Cash and balances with treasury banks 6
Balances with other banks 7
Balances with other banks - discontinued operation 14
39.1 Reconciliation of movement of liabilities to cash flows arising from financing activities
Balance as at January 1, 2019 27,272,967 279,918,125 1,448,324,041 9,000,000 69,353,882 12,241,798 60,078,870 27,404,558 77,335,249
Changes from financing cash flows
Dividend Paid - - - - - - - - (13,448,704)
Other Changes - - - - 7,483,030 - (1,332,626) (10,788,344) (3,208,602)
Liability-related
Changes in bills payable (4,343,747) - - - - - - - -
Changes in borrowings - (109,513,065) - - - - - - -
Changes in deposits and other accounts - - 109,671,265 - - - - - -
Changes in subordinated loans - - - 1,000,000 - - - - -
Changes in other liabilities
- Cash based - - - - (5,300,709) - - - -
-Dividend payable - - - - (17,272) - - - (17,272)
- Non-cash based - - - - - - - - -
Transfer of profit to reserve - - - - - 1,935,261 - (1,935,261)
Total Liability related other changes (4,343,747) (109,513,065) 109,671,265 1,000,000 (5,317,981) - 1,935,261 - (1,952,533)
Total Equity related other changes - - - - - - 5,994,906 10,788,344 18,609,839
Balance as at December 31, 2019 22,929,220 170,405,060 1,557,995,306 10,000,000 71,518,931 12,241,798 66,676,411 27,404,558 77,335,249
40. STAFF STRENGTH
Permanent
On contract
Group's own staff strength
Outsourced
Total
40.1 Number of employees working domestically 13,657 (2018: 14,073) and abroad 113 (2018: 524).
41. DEFINED BENEFIT PLANS
41.1 The Bank (Holding Company)
41.1 General description
Subordina-
ted loans
Surplus on
revaluation
of assets
Liabilities Equity
Bills
payableBorrowings
Deposits and
other accounts
Other
liabilities
Share
capitalReserves
Unappropri-
ated profit
2,569
2019
243,370,701
------- (Rupees in '000) -------
2018
187,915,671
2019
11,498
51
------------ (Number) ------------
---------------------------------------- (Rupees in '000) --------------------------------------
14,597
41,747,060
- 236,450
The Bank operates a funded pension scheme established in 1975. The Bank also operates a funded gratuity scheme for
new employees and for those employees who have not opted for the pension scheme. The Bank also operates a
benevolent fund scheme and provides post retirement medical benefits to eligible retired employees. The benevolent fund
scheme and the post-retirement medical scheme cover all regular employees of the Bank who joined the Bank pre-
privatization. The liabilities of the Bank in respect of these schemes are determined based on actuarial valuations carried
out using the Projected Unit Credit Method. Actuarial valuations of the defined benefit schemes are carried out every year
and the latest valuation was carried out as at December 31, 2019.
42,722,227
286,329,378 229,662,731
11,549
2,221
13,770
2018
11,956
72
12,028
54
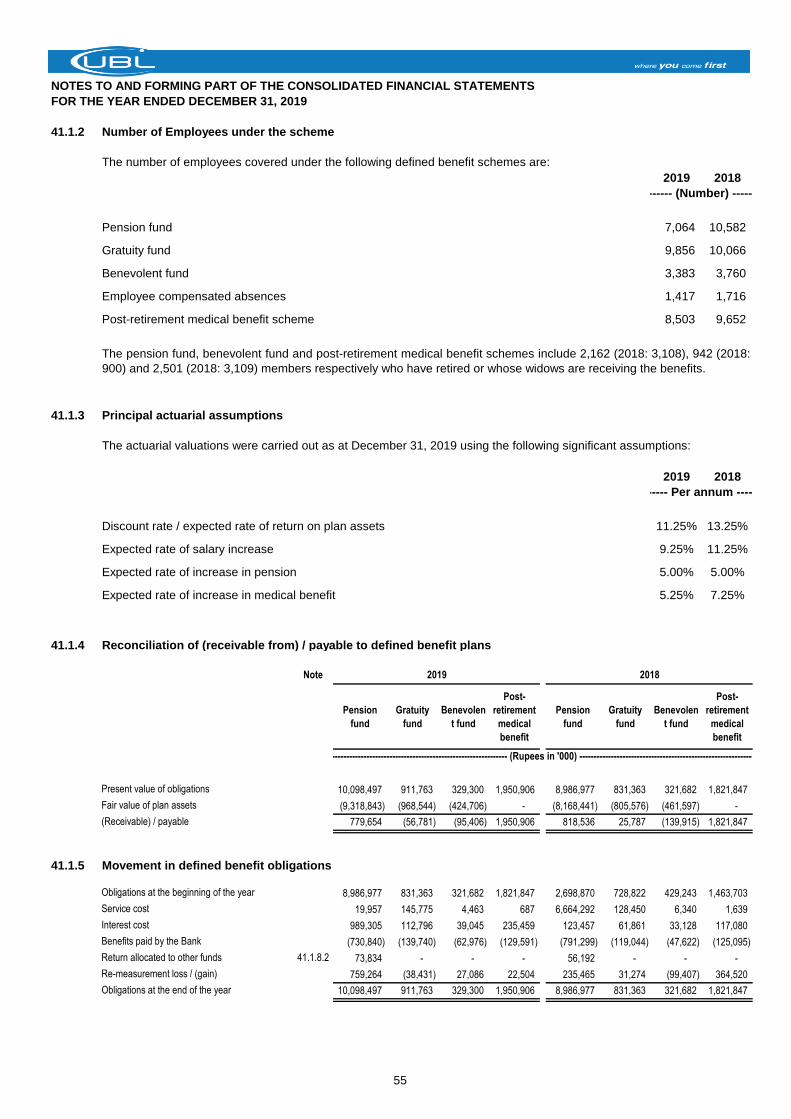
NOTES TO AND FORMING PART OF THE CONSOLIDATED FINANCIAL STATEMENTS
FOR THE YEAR ENDED DECEMBER 31, 2019
41.1.2 Number of Employees under the scheme
The number of employees covered under the following defined benefit schemes are:
2019 2018
Pension fund 7,064 10,582
Gratuity fund 9,856 10,066
Benevolent fund 3,383 3,760
Employee compensated absences 1,417 1,716
Post-retirement medical benefit scheme 8,503 9,652
41.1.3 Principal actuarial assumptions
The actuarial valuations were carried out as at December 31, 2019 using the following significant assumptions:
2019 2018
Discount rate / expected rate of return on plan assets 11.25% 13.25%
Expected rate of salary increase 9.25% 11.25%
Expected rate of increase in pension 5.00% 5.00%
Expected rate of increase in medical benefit 5.25% 7.25%
41.1.4 Reconciliation of (receivable from) / payable to defined benefit plans
Note
Pension
fund
Gratuity
fund
Benevolen
t fund
Post-
retirement
medical
benefit
Pension
fund
Gratuity
fund
Benevolen
t fund
Post-
retirement
medical
benefit
Present value of obligations 10,098,497 911,763 329,300 1,950,906 8,986,977 831,363 321,682 1,821,847
Fair value of plan assets (9,318,843) (968,544) (424,706) - (8,168,441) (805,576) (461,597) -
(Receivable) / payable 779,654 (56,781) (95,406) 1,950,906 818,536 25,787 (139,915) 1,821,847
41.1.5 Movement in defined benefit obligations
Obligations at the beginning of the year 8,986,977 831,363 321,682 1,821,847 2,698,870 728,822 429,243 1,463,703
Service cost 19,957 145,775 4,463 687 6,664,292 128,450 6,340 1,639
Interest cost 989,305 112,796 39,045 235,459 123,457 61,861 33,128 117,080
Benefits paid by the Bank (730,840) (139,740) (62,976) (129,591) (791,299) (119,044) (47,622) (125,095)
Return allocated to other funds 41.1.8.2 73,834 - - - 56,192 - - -
Re-measurement loss / (gain) 759,264 (38,431) 27,086 22,504 235,465 31,274 (99,407) 364,520
Obligations at the end of the year 10,098,497 911,763 329,300 1,950,906 8,986,977 831,363 321,682 1,821,847
------------ (Number) ------------
---------- Per annum ----------
The pension fund, benevolent fund and post-retirement medical benefit schemes include 2,162 (2018: 3,108), 942 (2018:
900) and 2,501 (2018: 3,109) members respectively who have retired or whose widows are receiving the benefits.
2019 2018
------------------------------------------------------------------------ (Rupees in '000) ------------------------------------------------------------------------
55
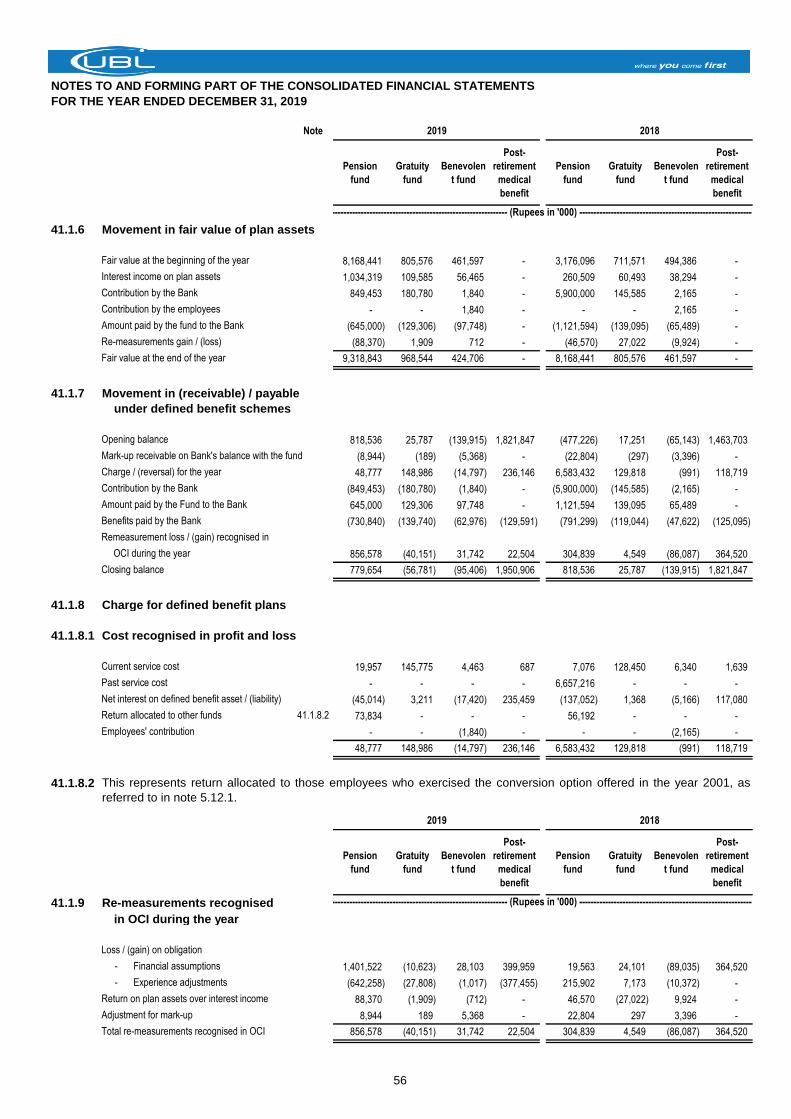
NOTES TO AND FORMING PART OF THE CONSOLIDATED FINANCIAL STATEMENTS
FOR THE YEAR ENDED DECEMBER 31, 2019
Note
Pension
fund
Gratuity
fund
Benevolen
t fund
Post-
retirement
medical
benefit
Pension
fund
Gratuity
fund
Benevolen
t fund
Post-
retirement
medical
benefit
41.1.6 Movement in fair value of plan assets
Fair value at the beginning of the year 8,168,441 805,576 461,597 - 3,176,096 711,571 494,386 -
Interest income on plan assets 1,034,319 109,585 56,465 - 260,509 60,493 38,294 -
Contribution by the Bank 849,453 180,780 1,840 - 5,900,000 145,585 2,165 -
Contribution by the employees - - 1,840 - - - 2,165 -
Amount paid by the fund to the Bank (645,000) (129,306) (97,748) - (1,121,594) (139,095) (65,489) -
Re-measurements gain / (loss) (88,370) 1,909 712 - (46,570) 27,022 (9,924) -
Fair value at the end of the year 9,318,843 968,544 424,706 - 8,168,441 805,576 461,597 -
41.1.7 Movement in (receivable) / payable
under defined benefit schemes
Opening balance 818,536 25,787 (139,915) 1,821,847 (477,226) 17,251 (65,143) 1,463,703
Mark-up receivable on Bank's balance with the fund (8,944) (189) (5,368) - (22,804) (297) (3,396) -
Charge / (reversal) for the year 48,777 148,986 (14,797) 236,146 6,583,432 129,818 (991) 118,719
Contribution by the Bank (849,453) (180,780) (1,840) - (5,900,000) (145,585) (2,165) -
Amount paid by the Fund to the Bank 645,000 129,306 97,748 - 1,121,594 139,095 65,489 -
Benefits paid by the Bank (730,840) (139,740) (62,976) (129,591) (791,299) (119,044) (47,622) (125,095)
Remeasurement loss / (gain) recognised in
OCI during the year 856,578 (40,151) 31,742 22,504 304,839 4,549 (86,087) 364,520
Closing balance 779,654 (56,781) (95,406) 1,950,906 818,536 25,787 (139,915) 1,821,847
41.1.8 Charge for defined benefit plans
41.1.8.1 Cost recognised in profit and loss
Current service cost 19,957 145,775 4,463 687 7,076 128,450 6,340 1,639
Past service cost - - - - 6,657,216 - - -
Net interest on defined benefit asset / (liability) (45,014) 3,211 (17,420) 235,459 (137,052) 1,368 (5,166) 117,080
Return allocated to other funds 41.1.8.2 73,834 - - - 56,192 - - -
Employees' contribution - - (1,840) - - - (2,165) -
48,777 148,986 (14,797) 236,146 6,583,432 129,818 (991) 118,719
41.1.8.2
Pension
fund
Gratuity
fund
Benevolen
t fund
Post-
retirement
medical
benefit
Pension
fund
Gratuity
fund
Benevolen
t fund
Post-
retirement
medical
benefit
41.1.9 Re-measurements recognised
in OCI during the year
Loss / (gain) on obligation
- Financial assumptions 1,401,522 (10,623) 28,103 399,959 19,563 24,101 (89,035) 364,520
- Experience adjustments (642,258) (27,808) (1,017) (377,455) 215,902 7,173 (10,372) -
Return on plan assets over interest income 88,370 (1,909) (712) - 46,570 (27,022) 9,924 -
Adjustment for mark-up 8,944 189 5,368 - 22,804 297 3,396 -
Total re-measurements recognised in OCI 856,578 (40,151) 31,742 22,504 304,839 4,549 (86,087) 364,520
2018
------------------------------------------------------------------------ (Rupees in '000) ------------------------------------------------------------------------
2019
This represents return allocated to those employees who exercised the conversion option offered in the year 2001, as
referred to in note 5.12.1.
------------------------------------------------------------------------ (Rupees in '000) ------------------------------------------------------------------------
2019 2018
56
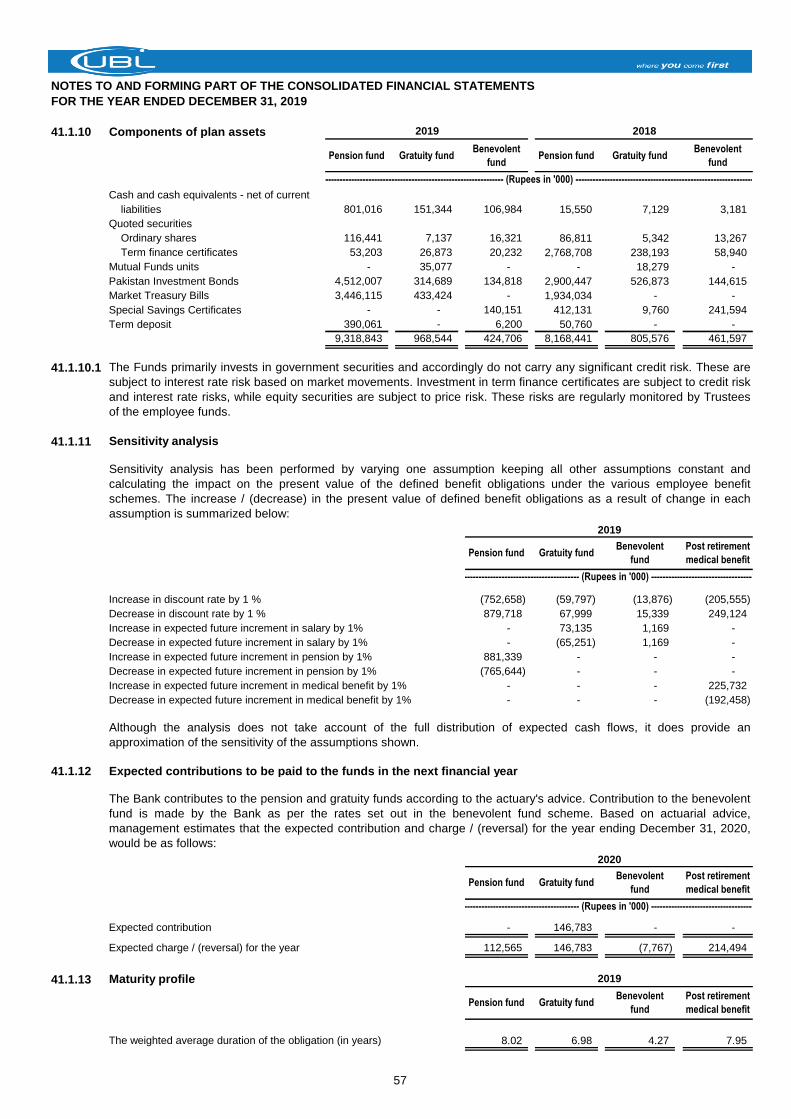
NOTES TO AND FORMING PART OF THE CONSOLIDATED FINANCIAL STATEMENTS
FOR THE YEAR ENDED DECEMBER 31, 2019
41.1.10 Components of plan assets
Pension fund Gratuity fundBenevolent
fundPension fund Gratuity fund
Benevolent
fund
Cash and cash equivalents - net of current
liabilities 801,016 151,344 106,984 15,550 7,129 3,181
Quoted securities
Ordinary shares 116,441 7,137 16,321 86,811 5,342 13,267
Term finance certificates 53,203 26,873 20,232 2,768,708 238,193 58,940
Mutual Funds units - 35,077 - - 18,279 -
Pakistan Investment Bonds 4,512,007 314,689 134,818 2,900,447 526,873 144,615
Market Treasury Bills 3,446,115 433,424 - 1,934,034 - -
Special Savings Certificates - - 140,151 412,131 9,760 241,594
Term deposit 390,061 - 6,200 50,760 - -
9,318,843 968,544 424,706 8,168,441 805,576 461,597
#REF! #REF! #REF! ####### (409,974) (836,962)
41.1.10.1
41.1.11 Sensitivity analysis
Increase in discount rate by 1 % (752,658) (59,797) (13,876) (205,555)
Decrease in discount rate by 1 % 879,718 67,999 15,339 249,124
Increase in expected future increment in salary by 1% - 73,135 1,169 -
Decrease in expected future increment in salary by 1% - (65,251) 1,169 -
Increase in expected future increment in pension by 1% 881,339 - - -
Decrease in expected future increment in pension by 1% (765,644) - - -
Increase in expected future increment in medical benefit by 1% - - - 225,732
Decrease in expected future increment in medical benefit by 1% - - - (192,458)
41.1.12 Expected contributions to be paid to the funds in the next financial year
Expected contribution - 146,783 - -
Expected charge / (reversal) for the year 112,565 146,783 (7,767) 214,494
41.1.13 Maturity profile
The weighted average duration of the obligation (in years) 8.02 6.98 4.27 7.95
-------------------------------------------------- (Rupees in '000) ----------------------------------------------
2019
Pension fund Gratuity fundBenevolent
fund
Post retirement
medical benefit
-------------------------------------------------- (Rupees in '000) ----------------------------------------------
Although the analysis does not take account of the full distribution of expected cash flows, it does provide an
approximation of the sensitivity of the assumptions shown.
The Bank contributes to the pension and gratuity funds according to the actuary's advice. Contribution to the benevolent
fund is made by the Bank as per the rates set out in the benevolent fund scheme. Based on actuarial advice,
management estimates that the expected contribution and charge / (reversal) for the year ending December 31, 2020,
would be as follows:
2020
Pension fund Gratuity fundBenevolent
fund
Post retirement
medical benefit
The Funds primarily invests in government securities and accordingly do not carry any significant credit risk. These are
subject to interest rate risk based on market movements. Investment in term finance certificates are subject to credit risk
and interest rate risks, while equity securities are subject to price risk. These risks are regularly monitored by Trustees
of the employee funds.
Sensitivity analysis has been performed by varying one assumption keeping all other assumptions constant and
calculating the impact on the present value of the defined benefit obligations under the various employee benefit
schemes. The increase / (decrease) in the present value of defined benefit obligations as a result of change in each
assumption is summarized below:
2019
Pension fund Gratuity fundBenevolent
fund
Post retirement
medical benefit
2019 2018
-------------------------------------------------------------- (Rupees in '000) --------------------------------------------------------------
57
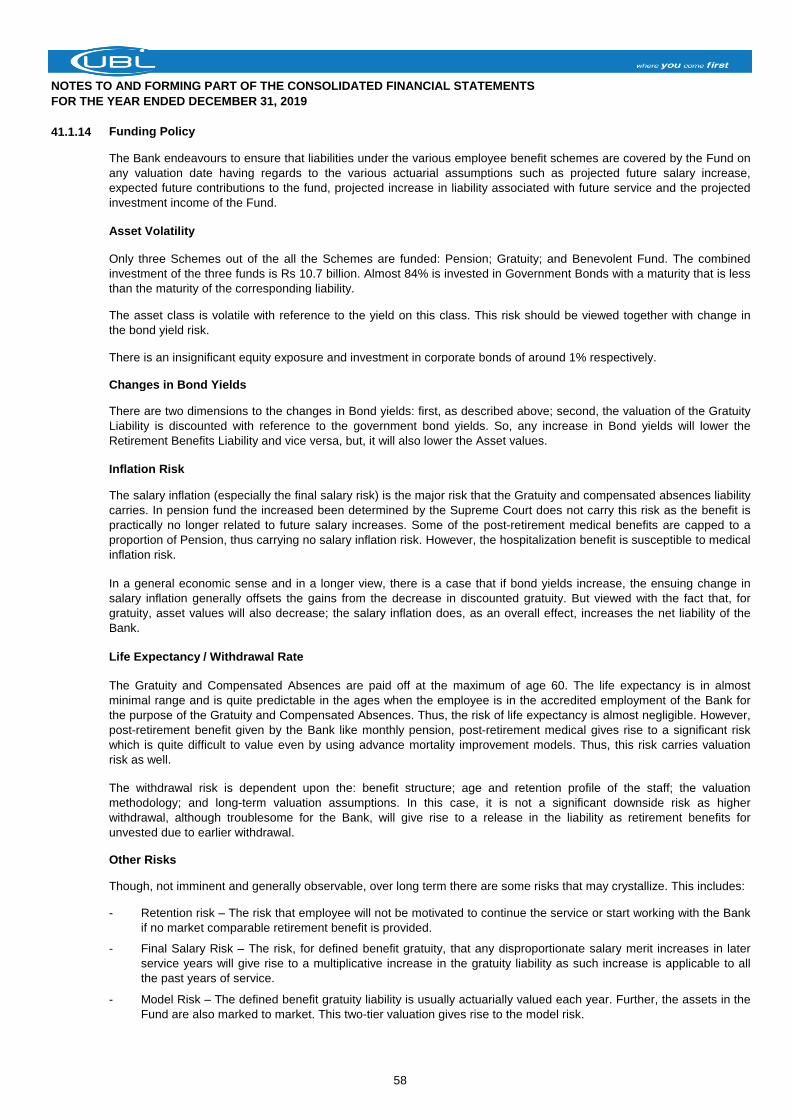
NOTES TO AND FORMING PART OF THE CONSOLIDATED FINANCIAL STATEMENTS
FOR THE YEAR ENDED DECEMBER 31, 2019
41.1.14 Funding Policy
Asset Volatility
Changes in Bond Yields
Inflation Risk
Life Expectancy / Withdrawal Rate
Other Risks
Though, not imminent and generally observable, over long term there are some risks that may crystallize. This includes:
-
-
-
The Gratuity and Compensated Absences are paid off at the maximum of age 60. The life expectancy is in almost
minimal range and is quite predictable in the ages when the employee is in the accredited employment of the Bank for
the purpose of the Gratuity and Compensated Absences. Thus, the risk of life expectancy is almost negligible. However,
post-retirement benefit given by the Bank like monthly pension, post-retirement medical gives rise to a significant risk
which is quite difficult to value even by using advance mortality improvement models. Thus, this risk carries valuation
risk as well.
The withdrawal risk is dependent upon the: benefit structure; age and retention profile of the staff; the valuation
methodology; and long-term valuation assumptions. In this case, it is not a significant downside risk as higher
withdrawal, although troublesome for the Bank, will give rise to a release in the liability as retirement benefits for
unvested due to earlier withdrawal.
Model Risk – The defined benefit gratuity liability is usually actuarially valued each year. Further, the assets in the
Fund are also marked to market. This two-tier valuation gives rise to the model risk.
The Bank endeavours to ensure that liabilities under the various employee benefit schemes are covered by the Fund on
any valuation date having regards to the various actuarial assumptions such as projected future salary increase,
expected future contributions to the fund, projected increase in liability associated with future service and the projected
investment income of the Fund.
Only three Schemes out of the all the Schemes are funded: Pension; Gratuity; and Benevolent Fund. The combined
investment of the three funds is Rs 10.7 billion. Almost 84% is invested in Government Bonds with a maturity that is less
than the maturity of the corresponding liability.
In a general economic sense and in a longer view, there is a case that if bond yields increase, the ensuing change in
salary inflation generally offsets the gains from the decrease in discounted gratuity. But viewed with the fact that, for
gratuity, asset values will also decrease; the salary inflation does, as an overall effect, increases the net liability of the
Bank.
Retention risk – The risk that employee will not be motivated to continue the service or start working with the Bank
if no market comparable retirement benefit is provided.
Final Salary Risk – The risk, for defined benefit gratuity, that any disproportionate salary merit increases in later
service years will give rise to a multiplicative increase in the gratuity liability as such increase is applicable to all
the past years of service.
The asset class is volatile with reference to the yield on this class. This risk should be viewed together with change in
the bond yield risk.
There is an insignificant equity exposure and investment in corporate bonds of around 1% respectively.
There are two dimensions to the changes in Bond yields: first, as described above; second, the valuation of the Gratuity
Liability is discounted with reference to the government bond yields. So, any increase in Bond yields will lower the
Retirement Benefits Liability and vice versa, but, it will also lower the Asset values.
The salary inflation (especially the final salary risk) is the major risk that the Gratuity and compensated absences liability
carries. In pension fund the increased been determined by the Supreme Court does not carry this risk as the benefit is
practically no longer related to future salary increases. Some of the post-retirement medical benefits are capped to a
proportion of Pension, thus carrying no salary inflation risk. However, the hospitalization benefit is susceptible to medical
inflation risk.
58
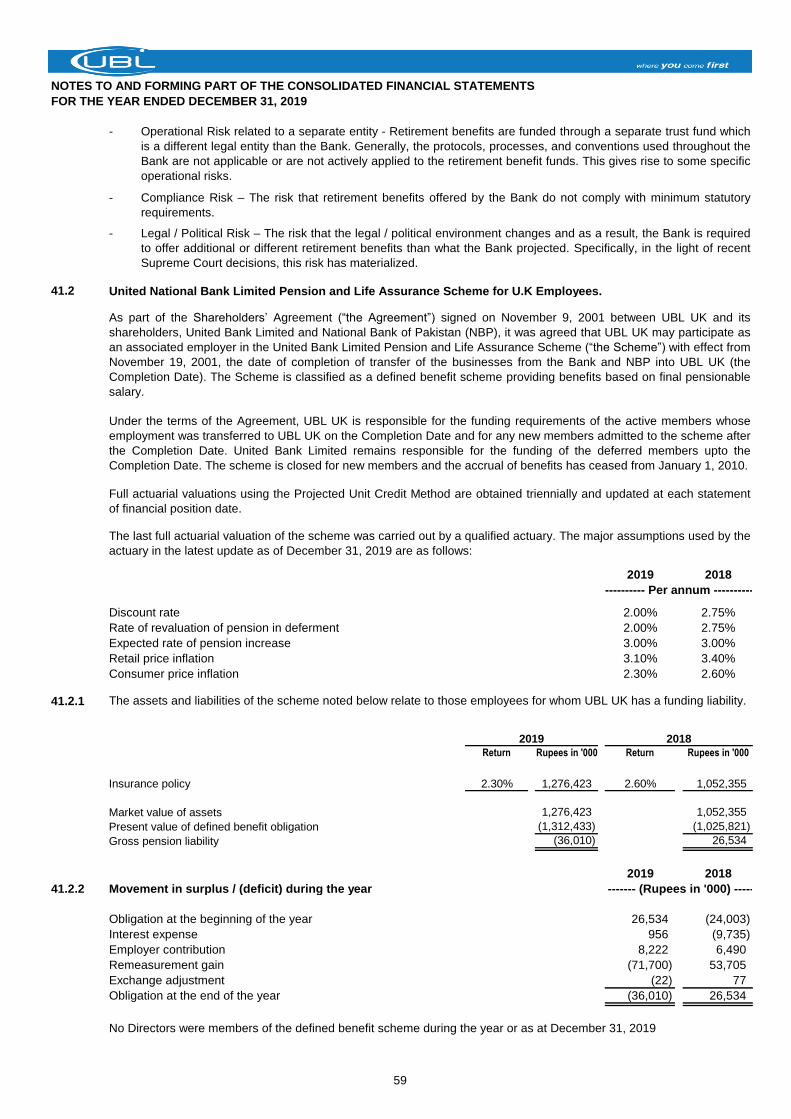
NOTES TO AND FORMING PART OF THE CONSOLIDATED FINANCIAL STATEMENTS
FOR THE YEAR ENDED DECEMBER 31, 2019
-
-
-
41.2 United National Bank Limited Pension and Life Assurance Scheme for U.K Employees.
2019 2018
Discount rate 2.00% 2.75%
Rate of revaluation of pension in deferment 2.00% 2.75%
Expected rate of pension increase 3.00% 3.00%
Retail price inflation 3.10% 3.40%
Consumer price inflation 2.30% 2.60%
41.2.1
Return Rupees in '000 Return Rupees in '000
Insurance policy 2.30% 1,276,423 2.60% 1,052,355
Market value of assets 1,276,423 1,052,355
Present value of defined benefit obligation (1,312,433) (1,025,821)
Gross pension liability (36,010) 26,534
2019 2018
41.2.2 Movement in surplus / (deficit) during the year
Obligation at the beginning of the year 26,534 (24,003)
Interest expense 956 (9,735)
Employer contribution 8,222 6,490
Remeasurement gain (71,700) 53,705
Exchange adjustment (22) 77
Obligation at the end of the year (36,010) 26,534
No Directors were members of the defined benefit scheme during the year or as at December 31, 2019
Compliance Risk – The risk that retirement benefits offered by the Bank do not comply with minimum statutory
requirements.
Legal / Political Risk – The risk that the legal / political environment changes and as a result, the Bank is required
to offer additional or different retirement benefits than what the Bank projected. Specifically, in the light of recent
Supreme Court decisions, this risk has materialized.
Operational Risk related to a separate entity - Retirement benefits are funded through a separate trust fund which
is a different legal entity than the Bank. Generally, the protocols, processes, and conventions used throughout the
Bank are not applicable or are not actively applied to the retirement benefit funds. This gives rise to some specific
operational risks.
2019 2018
As part of the Shareholders’ Agreement (“the Agreement”) signed on November 9, 2001 between UBL UK and its
shareholders, United Bank Limited and National Bank of Pakistan (NBP), it was agreed that UBL UK may participate as
an associated employer in the United Bank Limited Pension and Life Assurance Scheme (“the Scheme”) with effect from
November 19, 2001, the date of completion of transfer of the businesses from the Bank and NBP into UBL UK (the
Completion Date). The Scheme is classified as a defined benefit scheme providing benefits based on final pensionable
salary.
Under the terms of the Agreement, UBL UK is responsible for the funding requirements of the active members whose
employment was transferred to UBL UK on the Completion Date and for any new members admitted to the scheme after
the Completion Date. United Bank Limited remains responsible for the funding of the deferred members upto the
Completion Date. The scheme is closed for new members and the accrual of benefits has ceased from January 1, 2010.
Full actuarial valuations using the Projected Unit Credit Method are obtained triennially and updated at each statement
of financial position date.
The last full actuarial valuation of the scheme was carried out by a qualified actuary. The major assumptions used by the
actuary in the latest update as of December 31, 2019 are as follows:
---------- Per annum ----------
The assets and liabilities of the scheme noted below relate to those employees for whom UBL UK has a funding liability.
------- (Rupees in '000) -----
59
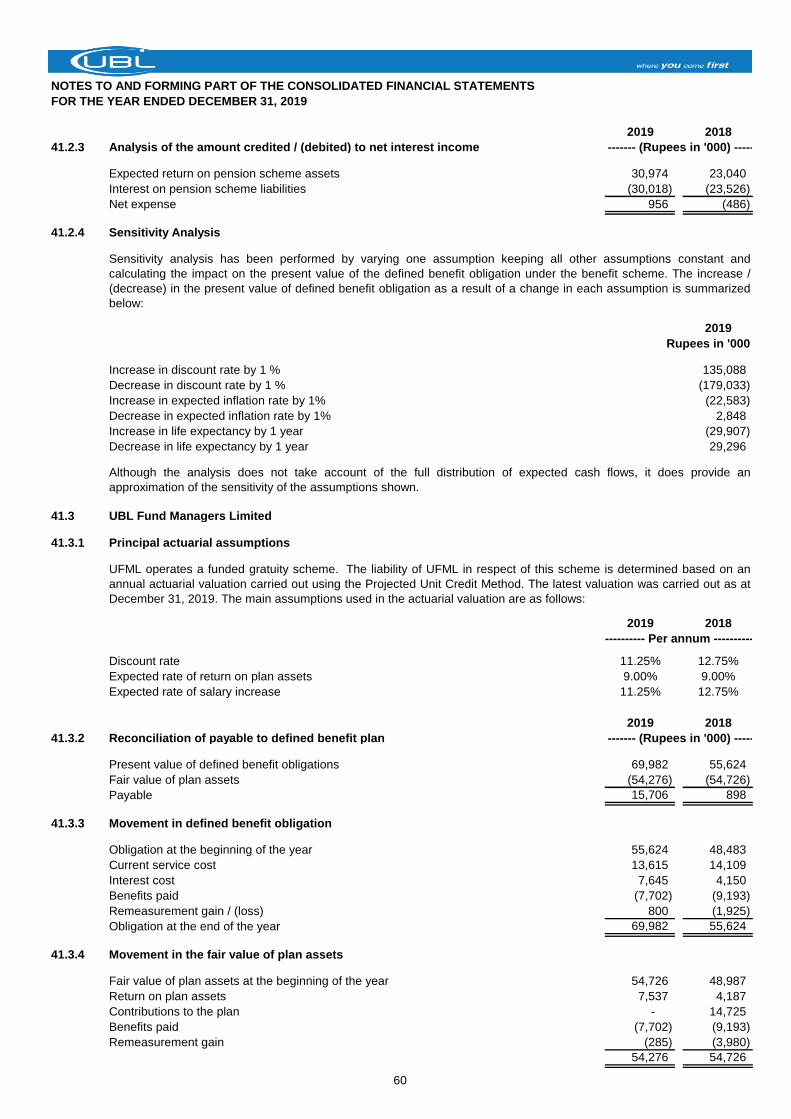
NOTES TO AND FORMING PART OF THE CONSOLIDATED FINANCIAL STATEMENTS
FOR THE YEAR ENDED DECEMBER 31, 2019
2019 2018
41.2.3 Analysis of the amount credited / (debited) to net interest income
Expected return on pension scheme assets 30,974 23,040
Interest on pension scheme liabilities (30,018) (23,526)
Net expense 956 (486)
41.2.4 Sensitivity Analysis
2019
Rupees in '000
Increase in discount rate by 1 % 135,088
Decrease in discount rate by 1 % (179,033)
Increase in expected inflation rate by 1% (22,583)
Decrease in expected inflation rate by 1% 2,848
Increase in life expectancy by 1 year (29,907)
Decrease in life expectancy by 1 year 29,296
41.3 UBL Fund Managers Limited
41.3.1 Principal actuarial assumptions
2019 2018
Discount rate 11.25% 12.75%
Expected rate of return on plan assets 9.00% 9.00%
Expected rate of salary increase 11.25% 12.75%
2019 2018
41.3.2 Reconciliation of payable to defined benefit plan
Present value of defined benefit obligations 69,982 55,624
Fair value of plan assets (54,276) (54,726)
Payable 15,706 898
41.3.3 Movement in defined benefit obligation
Obligation at the beginning of the year 55,624 48,483
Current service cost 13,615 14,109
Interest cost 7,645 4,150
Benefits paid (7,702) (9,193)
Remeasurement gain / (loss) 800 (1,925)
Obligation at the end of the year 69,982 55,624
41.3.4 Movement in the fair value of plan assets
Fair value of plan assets at the beginning of the year 54,726 48,987
Return on plan assets 7,537 4,187
Contributions to the plan - 14,725
Benefits paid (7,702) (9,193)
Remeasurement gain (285) (3,980)
54,276 54,726
---------- Per annum ----------
------- (Rupees in '000) -----
------- (Rupees in '000) -----
Sensitivity analysis has been performed by varying one assumption keeping all other assumptions constant and
calculating the impact on the present value of the defined benefit obligation under the benefit scheme. The increase /
(decrease) in the present value of defined benefit obligation as a result of a change in each assumption is summarized
below:
Although the analysis does not take account of the full distribution of expected cash flows, it does provide an
approximation of the sensitivity of the assumptions shown.
UFML operates a funded gratuity scheme. The liability of UFML in respect of this scheme is determined based on an
annual actuarial valuation carried out using the Projected Unit Credit Method. The latest valuation was carried out as at
December 31, 2019. The main assumptions used in the actuarial valuation are as follows:
60
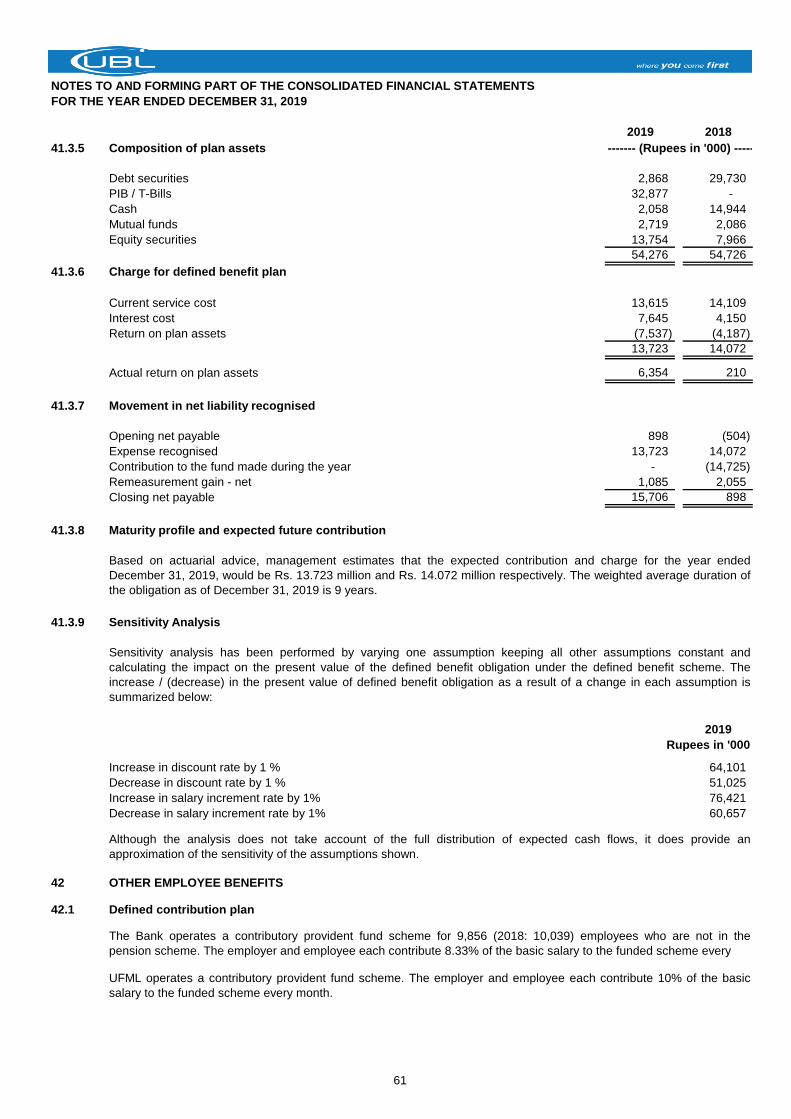
NOTES TO AND FORMING PART OF THE CONSOLIDATED FINANCIAL STATEMENTS
FOR THE YEAR ENDED DECEMBER 31, 2019
2019 2018
41.3.5 Composition of plan assets
Debt securities 2,868 29,730
PIB / T-Bills 32,877 -
Cash 2,058 14,944
Mutual funds 2,719 2,086
Equity securities 13,754 7,966
54,276 54,726
41.3.6 Charge for defined benefit plan
Current service cost 13,615 14,109
Interest cost 7,645 4,150
Return on plan assets (7,537) (4,187)
13,723 14,072
Actual return on plan assets 6,354 210
41.3.7 Movement in net liability recognised
Opening net payable 898 (504)
Expense recognised 13,723 14,072
Contribution to the fund made during the year - (14,725)
Remeasurement gain - net 1,085 2,055
Closing net payable 15,706 898
41.3.8 Maturity profile and expected future contribution
41.3.9 Sensitivity Analysis
2019
Rupees in '000
Increase in discount rate by 1 % 64,101
Decrease in discount rate by 1 % 51,025
Increase in salary increment rate by 1% 76,421
Decrease in salary increment rate by 1% 60,657
42 OTHER EMPLOYEE BENEFITS
42.1 Defined contribution plan
UFML operates a contributory provident fund scheme. The employer and employee each contribute 10% of the basic
salary to the funded scheme every month.
The Bank operates a contributory provident fund scheme for 9,856 (2018: 10,039) employees who are not in the
pension scheme. The employer and employee each contribute 8.33% of the basic salary to the funded scheme every
Based on actuarial advice, management estimates that the expected contribution and charge for the year ended
December 31, 2019, would be Rs. 13.723 million and Rs. 14.072 million respectively. The weighted average duration of
the obligation as of December 31, 2019 is 9 years.
Sensitivity analysis has been performed by varying one assumption keeping all other assumptions constant and
calculating the impact on the present value of the defined benefit obligation under the defined benefit scheme. The
increase / (decrease) in the present value of defined benefit obligation as a result of a change in each assumption is
summarized below:
Although the analysis does not take account of the full distribution of expected cash flows, it does provide an
approximation of the sensitivity of the assumptions shown.
------- (Rupees in '000) -----
61
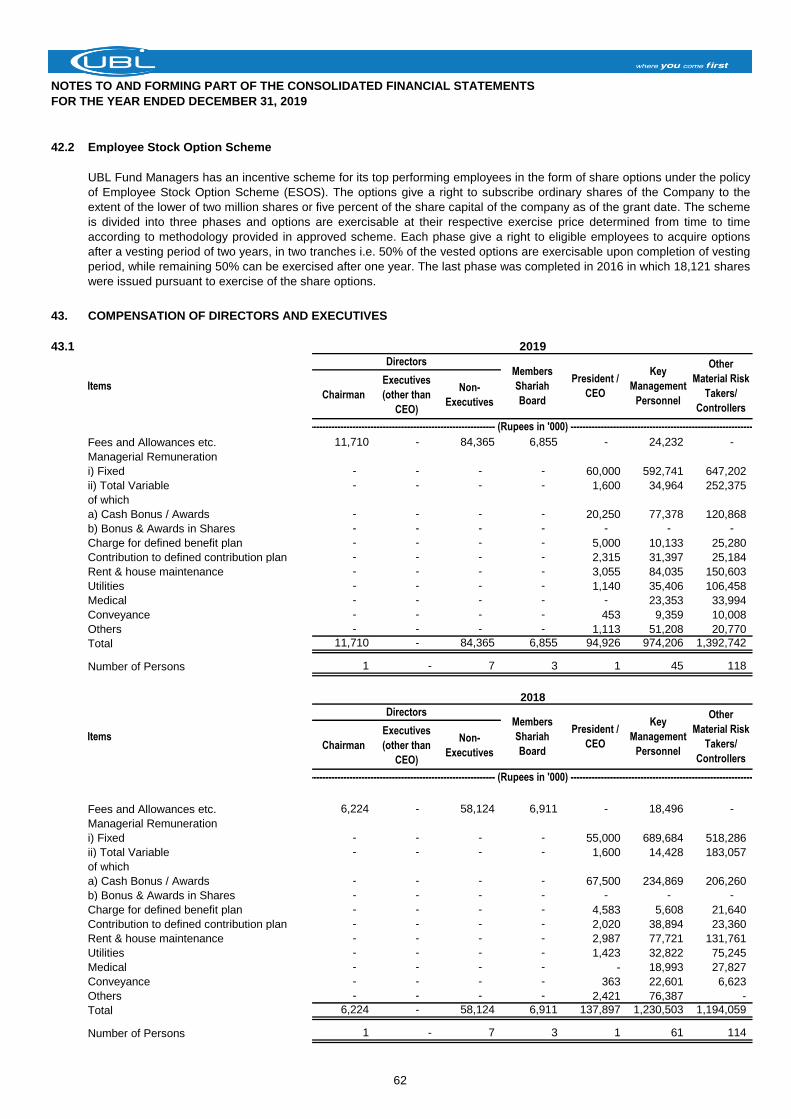
NOTES TO AND FORMING PART OF THE CONSOLIDATED FINANCIAL STATEMENTS
FOR THE YEAR ENDED DECEMBER 31, 2019
42.2 Employee Stock Option Scheme
43. COMPENSATION OF DIRECTORS AND EXECUTIVES
43.1
Chairman
Executives
(other than
CEO)
Non-
Executives
Fees and Allowances etc. 11,710 - 84,365 6,855 - 24,232 -
Managerial Remuneration
i) Fixed - - - - 60,000 592,741 647,202
ii) Total Variable - - - - 1,600 34,964 252,375
of which
a) Cash Bonus / Awards - - - - 20,250 77,378 120,868
b) Bonus & Awards in Shares - - - - - - -
Charge for defined benefit plan - - - - 5,000 10,133 25,280
Contribution to defined contribution plan - - - - 2,315 31,397 25,184
Rent & house maintenance - - - - 3,055 84,035 150,603
Utilities - - - - 1,140 35,406 106,458
Medical - - - - - 23,353 33,994
Conveyance - - - - 453 9,359 10,008
Others - - - - 1,113 51,208 20,770
Total 11,710 - 84,365 6,855 94,926 974,206 1,392,742
Number of Persons 1 - 7 3 1 45 118
Chairman
Executives
(other than
CEO)
Non-
Executives
Fees and Allowances etc. 6,224 - 58,124 6,911 - 18,496 -
Managerial Remuneration
i) Fixed - - - - 55,000 689,684 518,286
ii) Total Variable - - - - 1,600 14,428 183,057
of which
a) Cash Bonus / Awards - - - - 67,500 234,869 206,260
b) Bonus & Awards in Shares - - - - - - -
Charge for defined benefit plan - - - - 4,583 5,608 21,640
Contribution to defined contribution plan - - - - 2,020 38,894 23,360
Rent & house maintenance - - - - 2,987 77,721 131,761
Utilities - - - - 1,423 32,822 75,245
Medical - - - - - 18,993 27,827
Conveyance - - - - 363 22,601 6,623
Others - - - - 2,421 76,387 -
Total 6,224 - 58,124 6,911 137,897 1,230,503 1,194,059
Number of Persons 1 - 7 3 1 61 114
UBL Fund Managers has an incentive scheme for its top performing employees in the form of share options under the policy
of Employee Stock Option Scheme (ESOS). The options give a right to subscribe ordinary shares of the Company to the
extent of the lower of two million shares or five percent of the share capital of the company as of the grant date. The scheme
is divided into three phases and options are exercisable at their respective exercise price determined from time to time
according to methodology provided in approved scheme. Each phase give a right to eligible employees to acquire options
after a vesting period of two years, in two tranches i.e. 50% of the vested options are exercisable upon completion of vesting
period, while remaining 50% can be exercised after one year. The last phase was completed in 2016 in which 18,121 shares
were issued pursuant to exercise of the share options.
------------------------------------------------------------------ (Rupees in '000) ------------------------------------------------------------------
President /
CEO
2019
------------------------------------------------------------------ (Rupees in '000) ------------------------------------------------------------------
Key
Management
Personnel
Other
Material Risk
Takers/
Controllers
Directors
Items
Directors
2018
President /
CEO
Key
Management
Personnel
Other
Material Risk
Takers/
Controllers
Items
Members
Shariah
Board
Members
Shariah
Board
62
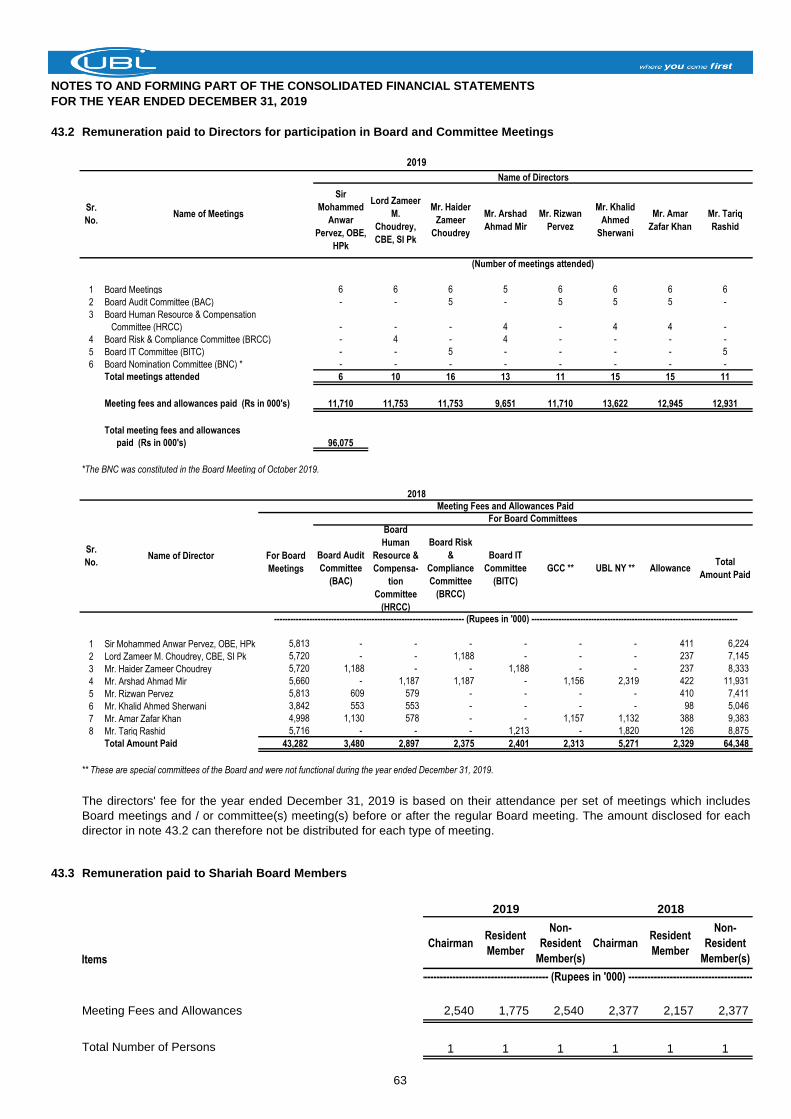
NOTES TO AND FORMING PART OF THE CONSOLIDATED FINANCIAL STATEMENTS
FOR THE YEAR ENDED DECEMBER 31, 2019
43.2 Remuneration paid to Directors for participation in Board and Committee Meetings
1 Board Meetings 6 6 6 5 6 6 6 6
2 Board Audit Committee (BAC) - - 5 - 5 5 5 -
3 Board Human Resource & Compensation
Committee (HRCC) - - - 4 - 4 4 -
4 Board Risk & Compliance Committee (BRCC) - 4 - 4 - - - -
5 Board IT Committee (BITC) - - 5 - - - - 5
6 Board Nomination Committee (BNC) * - - - - - - - -
Total meetings attended 6 10 16 13 11 15 15 11
Meeting fees and allowances paid (Rs in 000's) 11,710 11,753 11,753 9,651 11,710 13,622 12,945 12,931
Total meeting fees and allowances
paid (Rs in 000's) 96,075
*The BNC was constituted in the Board Meeting of October 2019.
1 Sir Mohammed Anwar Pervez, OBE, HPk 5,813 - - - - - - 411 6,224
2 Lord Zameer M. Choudrey, CBE, SI Pk 5,720 - - 1,188 - - - 237 7,145
3 Mr. Haider Zameer Choudrey 5,720 1,188 - - 1,188 - - 237 8,333
4 Mr. Arshad Ahmad Mir 5,660 - 1,187 1,187 - 1,156 2,319 422 11,931
5 Mr. Rizwan Pervez 5,813 609 579 - - - - 410 7,411
6 Mr. Khalid Ahmed Sherwani 3,842 553 553 - - - - 98 5,046
7 Mr. Amar Zafar Khan 4,998 1,130 578 - - 1,157 1,132 388 9,383
8 Mr. Tariq Rashid 5,716 - - - 1,213 - 1,820 126 8,875
Total Amount Paid 43,282 3,480 2,897 2,375 2,401 2,313 5,271 2,329 64,348
** These are special committees of the Board and were not functional during the year ended December 31, 2019.
43.3 Remuneration paid to Shariah Board Members
ChairmanResident
Member
Non-
Resident
Member(s)
ChairmanResident
Member
Non-
Resident
Member(s)
Meeting Fees and Allowances 2,540 1,775 2,540 2,377 2,157 2,377
1 1 1 1 1 1Total Number of Persons
Items
-------------------------------------------- (Rupees in '000) --------------------------------------------
20182019
Total
Amount Paid
2019
Sr.
No.Name of Meetings
Name of Directors
Sir
Mohammed
Anwar
Pervez, OBE,
HPk
Lord Zameer
M.
Choudrey,
CBE, SI Pk
Mr. Haider
Zameer
Choudrey
Mr. Arshad
Ahmad Mir
Mr. Rizwan
Pervez
Mr. Khalid
Ahmed
Sherwani
Mr. Amar
Zafar Khan
Mr. Tariq
Rashid
---------------------------------------------------------------------- (Rupees in '000) ----------------------------------------------------------------------------
The directors' fee for the year ended December 31, 2019 is based on their attendance per set of meetings which includes
Board meetings and / or committee(s) meeting(s) before or after the regular Board meeting. The amount disclosed for each
director in note 43.2 can therefore not be distributed for each type of meeting.
(Number of meetings attended)
2018
Sr.
No.Name of Director
Meeting Fees and Allowances Paid
For Board
Meetings
For Board Committees
Board Audit
Committee
(BAC)
Board
Human
Resource &
Compensa-
tion
Committee
(HRCC)
Board Risk
&
Compliance
Committee
(BRCC)
Board IT
Committee
(BITC)
GCC ** UBL NY ** Allowance
63
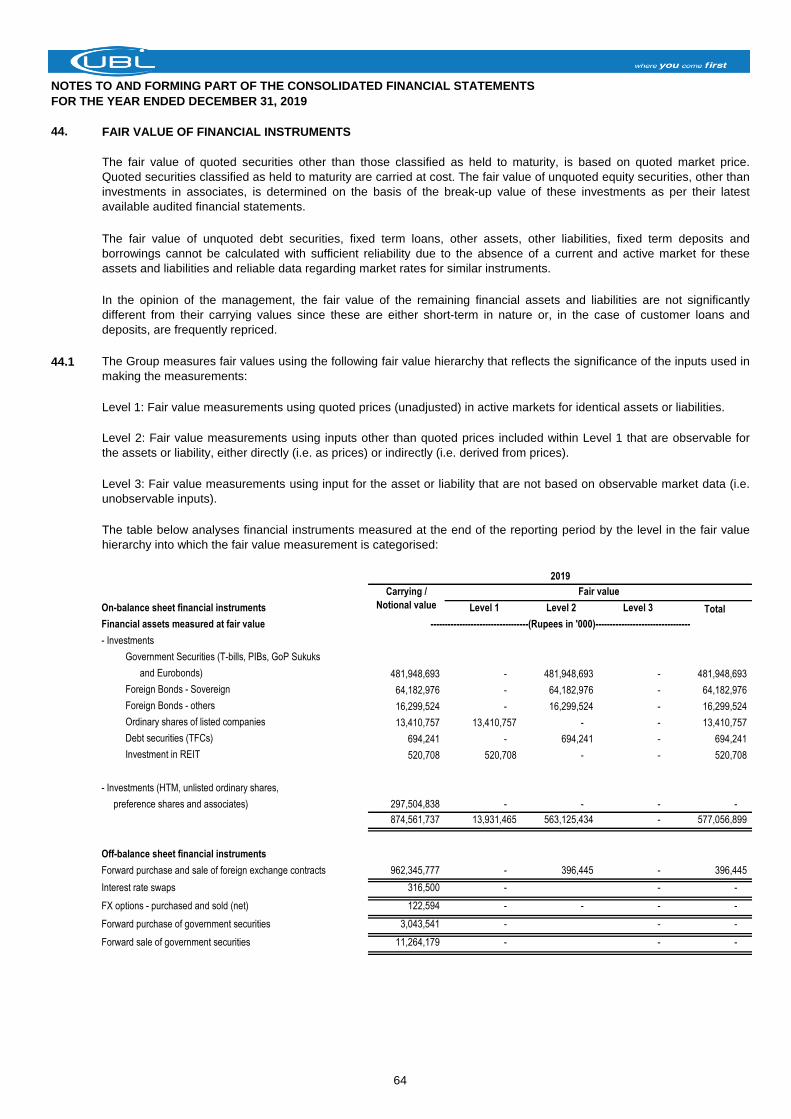
NOTES TO AND FORMING PART OF THE CONSOLIDATED FINANCIAL STATEMENTS
FOR THE YEAR ENDED DECEMBER 31, 2019
44. FAIR VALUE OF FINANCIAL INSTRUMENTS
44.1
Level 1: Fair value measurements using quoted prices (unadjusted) in active markets for identical assets or liabilities.
On-balance sheet financial instruments Level 1 Level 2 Level 3 Total
Financial assets measured at fair value
- Investments
Government Securities (T-bills, PIBs, GoP Sukuks
and Eurobonds) 481,948,693 - 481,948,693 - 481,948,693
Foreign Bonds - Sovereign 64,182,976 - 64,182,976 - 64,182,976
Foreign Bonds - others 16,299,524 - 16,299,524 - 16,299,524
Ordinary shares of listed companies 13,410,757 13,410,757 - - 13,410,757
Debt securities (TFCs) 694,241 - 694,241 - 694,241
Investment in REIT 520,708 520,708 - - 520,708
- Investments (HTM, unlisted ordinary shares,
preference shares and associates) 297,504,838 - - - -
874,561,737 13,931,465 563,125,434 - 577,056,899
Off-balance sheet financial instruments
Forward purchase and sale of foreign exchange contracts 962,345,777 - 396,445 - 396,445
Interest rate swaps 316,500 - - -
FX options - purchased and sold (net) 122,594 - - - -
Forward purchase of government securities 3,043,541 - - -
Forward sale of government securities 11,264,179 - - -
Level 3: Fair value measurements using input for the asset or liability that are not based on observable market data (i.e.
unobservable inputs).
The fair value of quoted securities other than those classified as held to maturity, is based on quoted market price.
Quoted securities classified as held to maturity are carried at cost. The fair value of unquoted equity securities, other than
investments in associates, is determined on the basis of the break-up value of these investments as per their latest
available audited financial statements.
The fair value of unquoted debt securities, fixed term loans, other assets, other liabilities, fixed term deposits and
borrowings cannot be calculated with sufficient reliability due to the absence of a current and active market for these
assets and liabilities and reliable data regarding market rates for similar instruments.
In the opinion of the management, the fair value of the remaining financial assets and liabilities are not significantly
different from their carrying values since these are either short-term in nature or, in the case of customer loans and
deposits, are frequently repriced.
The Group measures fair values using the following fair value hierarchy that reflects the significance of the inputs used in
making the measurements:
Level 2: Fair value measurements using inputs other than quoted prices included within Level 1 that are observable for
the assets or liability, either directly (i.e. as prices) or indirectly (i.e. derived from prices).
The table below analyses financial instruments measured at the end of the reporting period by the level in the fair value
hierarchy into which the fair value measurement is categorised:
2019
Carrying /
Notional value
Fair value
----------------------------------(Rupees in '000)---------------------------------
64
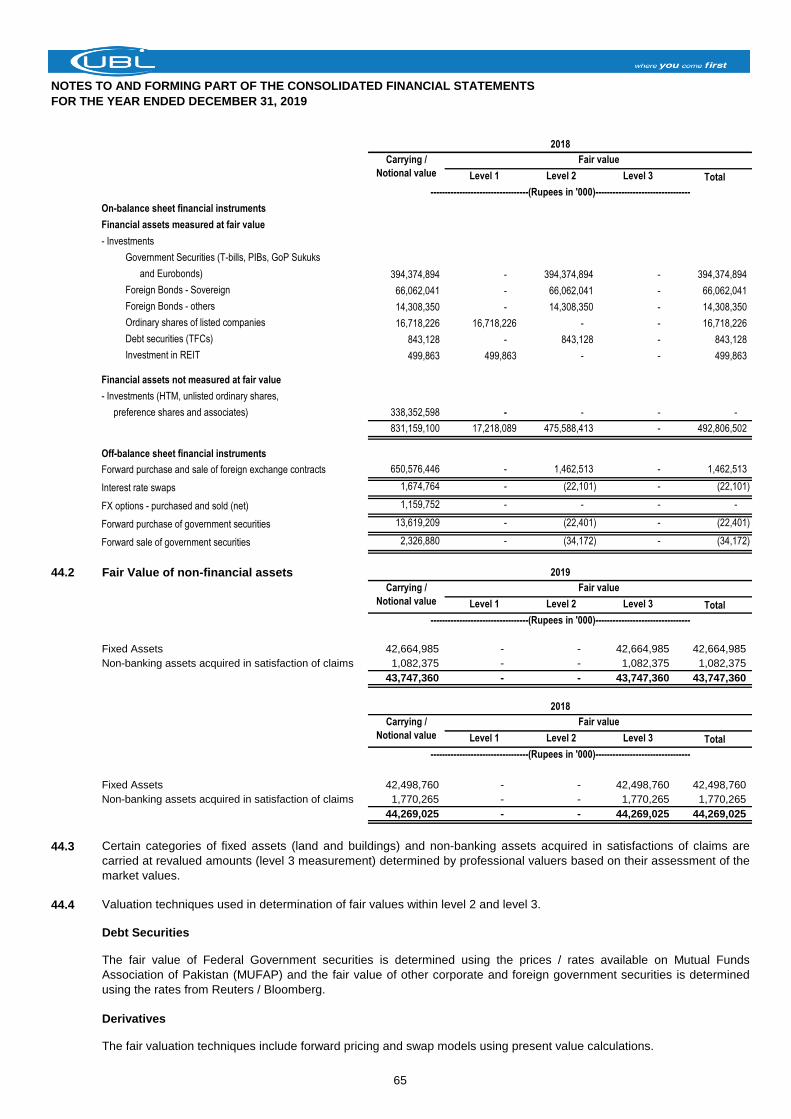
NOTES TO AND FORMING PART OF THE CONSOLIDATED FINANCIAL STATEMENTS
FOR THE YEAR ENDED DECEMBER 31, 2019
Level 1 Level 2 Level 3 Total
On-balance sheet financial instruments
Financial assets measured at fair value
- Investments
Government Securities (T-bills, PIBs, GoP Sukuks
and Eurobonds) 394,374,894 - 394,374,894 - 394,374,894
Foreign Bonds - Sovereign 66,062,041 - 66,062,041 - 66,062,041
Foreign Bonds - others 14,308,350 - 14,308,350 - 14,308,350
Ordinary shares of listed companies 16,718,226 16,718,226 - - 16,718,226
Debt securities (TFCs) 843,128 - 843,128 - 843,128
Investment in REIT 499,863 499,863 - - 499,863
Financial assets not measured at fair value
- Investments (HTM, unlisted ordinary shares,
preference shares and associates) 338,352,598 - - - -
831,159,100 17,218,089 475,588,413 - 492,806,502
Off-balance sheet financial instruments
Forward purchase and sale of foreign exchange contracts 650,576,446 - 1,462,513 - 1,462,513
Interest rate swaps 1,674,764 - (22,101) - (22,101)
FX options - purchased and sold (net) 1,159,752 - - - -
Forward purchase of government securities 13,619,209 - (22,401) - (22,401)
Forward sale of government securities 2,326,880 - (34,172) - (34,172)
44.2 Fair Value of non-financial assets
Level 1 Level 2 Level 3 Total
Fixed Assets 42,664,985 - - 42,664,985 42,664,985
Non-banking assets acquired in satisfaction of claims 1,082,375 - - 1,082,375 1,082,375
43,747,360 - - 43,747,360 43,747,360
Level 1 Level 2 Level 3 Total
Fixed Assets 42,498,760 - - 42,498,760 42,498,760
Non-banking assets acquired in satisfaction of claims 1,770,265 - - 1,770,265 1,770,265
44,269,025 - - 44,269,025 44,269,025
44.3
44.4 Valuation techniques used in determination of fair values within level 2 and level 3.
Debt Securities
Derivatives
The fair valuation techniques include forward pricing and swap models using present value calculations.
The fair value of Federal Government securities is determined using the prices / rates available on Mutual Funds
Association of Pakistan (MUFAP) and the fair value of other corporate and foreign government securities is determined
using the rates from Reuters / Bloomberg.
2019
Carrying /
Notional value
Fair value
----------------------------------(Rupees in '000)---------------------------------
2018
Carrying /
Notional value
Fair value
----------------------------------(Rupees in '000)---------------------------------
2018
Carrying /
Notional value
Certain categories of fixed assets (land and buildings) and non-banking assets acquired in satisfactions of claims are
carried at revalued amounts (level 3 measurement) determined by professional valuers based on their assessment of the
market values.
Fair value
----------------------------------(Rupees in '000)---------------------------------
65
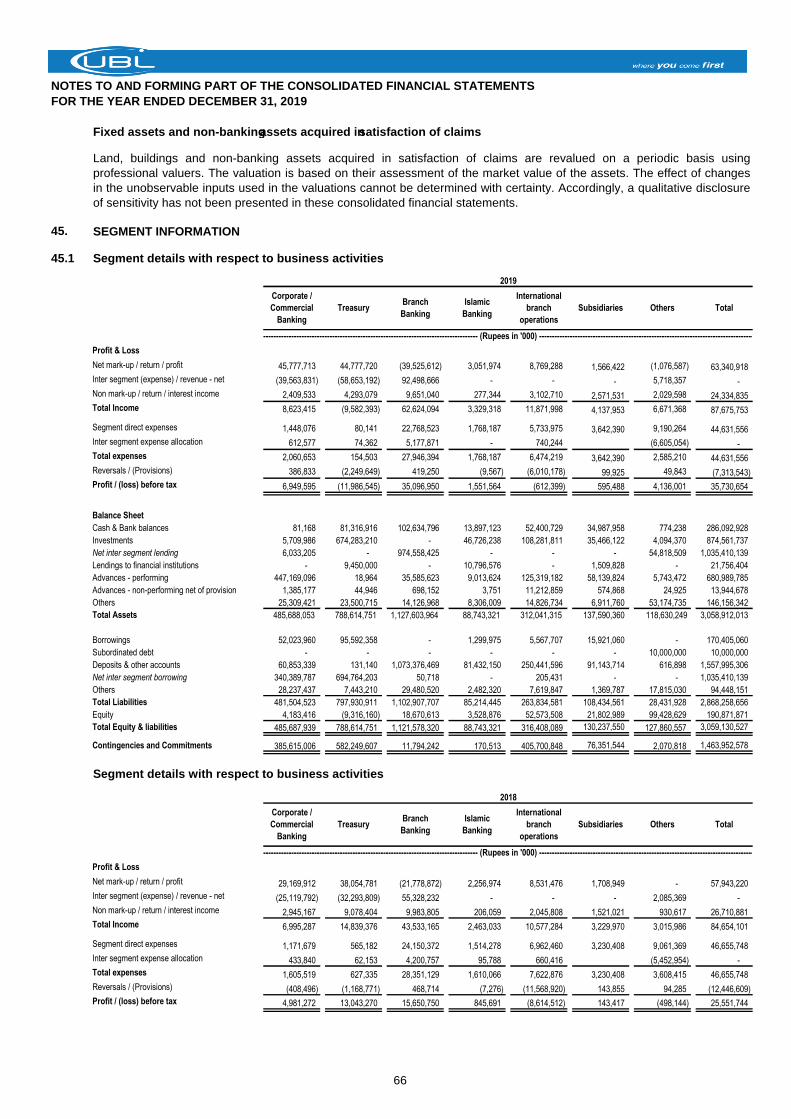
NOTES TO AND FORMING PART OF THE CONSOLIDATED FINANCIAL STATEMENTS
FOR THE YEAR ENDED DECEMBER 31, 2019
Fixed assets and non-banking assets acquired in satisfaction of claims
45. SEGMENT INFORMATION
45.1 Segment details with respect to business activities
Profit & Loss
Net mark-up / return / profit 45,777,713 44,777,720 (39,525,612) 3,051,974 8,769,288 1,566,422 (1,076,587) 63,340,918
Inter segment (expense) / revenue - net (39,563,831) (58,653,192) 92,498,666 - - - 5,718,357 -
Non mark-up / return / interest income 2,409,533 4,293,079 9,651,040 277,344 3,102,710 2,571,531 2,029,598 24,334,835
Total Income 8,623,415 (9,582,393) 62,624,094 3,329,318 11,871,998 4,137,953 6,671,368 87,675,753
Segment direct expenses 1,448,076 80,141 22,768,523 1,768,187 5,733,975 3,642,390 9,190,264 44,631,556
Inter segment expense allocation 612,577 74,362 5,177,871 - 740,244 (6,605,054) -
Total expenses 2,060,653 154,503 27,946,394 1,768,187 6,474,219 3,642,390 2,585,210 44,631,556
Reversals / (Provisions) 386,833 (2,249,649) 419,250 (9,567) (6,010,178) 99,925 49,843 (7,313,543)
Profit / (loss) before tax 6,949,595 (11,986,545) 35,096,950 1,551,564 (612,399) 595,488 4,136,001 35,730,654
Balance Sheet
Cash & Bank balances 81,168 81,316,916 102,634,796 13,897,123 52,400,729 34,987,958 774,238 286,092,928
Investments 5,709,986 674,283,210 - 46,726,238 108,281,811 35,466,122 4,094,370 874,561,737
Net inter segment lending 6,033,205 - 974,558,425 - - - 54,818,509 1,035,410,139
Lendings to financial institutions - 9,450,000 - 10,796,576 - 1,509,828 - 21,756,404
Advances - performing 447,169,096 18,964 35,585,623 9,013,624 125,319,182 58,139,824 5,743,472 680,989,785
Advances - non-performing net of provision 1,385,177 44,946 698,152 3,751 11,212,859 574,868 24,925 13,944,678
Others 25,309,421 23,500,715 14,126,968 8,306,009 14,826,734 6,911,760 53,174,735 146,156,342
Total Assets 485,688,053 788,614,751 1,127,603,964 88,743,321 312,041,315 137,590,360 118,630,249 3,058,912,013
Borrowings 52,023,960 95,592,358 - 1,299,975 5,567,707 15,921,060 - 170,405,060
Subordinated debt - - - - - - 10,000,000 10,000,000
Deposits & other accounts 60,853,339 131,140 1,073,376,469 81,432,150 250,441,596 91,143,714 616,898 1,557,995,306
Net inter segment borrowing 340,389,787 694,764,203 50,718 - 205,431 - - 1,035,410,139
Others 28,237,437 7,443,210 29,480,520 2,482,320 7,619,847 1,369,787 17,815,030 94,448,151
Total Liabilities 481,504,523 797,930,911 1,102,907,707 85,214,445 263,834,581 108,434,561 28,431,928 2,868,258,656
Equity 4,183,416 (9,316,160) 18,670,613 3,528,876 52,573,508 21,802,989 99,428,629 190,871,871
Total Equity & liabilities 485,687,939 788,614,751 1,121,578,320 88,743,321 316,408,089 130,237,550 127,860,557 3,059,130,527
Contingencies and Commitments 385,615,006 582,249,607 11,794,242 170,513 405,700,848 76,351,544 2,070,818 1,463,952,578
Segment details with respect to business activities
Profit & Loss
Net mark-up / return / profit 29,169,912 38,054,781 (21,778,872) 2,256,974 8,531,476 1,708,949 - 57,943,220
Inter segment (expense) / revenue - net (25,119,792) (32,293,809) 55,328,232 - - - 2,085,369 -
Non mark-up / return / interest income 2,945,167 9,078,404 9,983,805 206,059 2,045,808 1,521,021 930,617 26,710,881
Total Income 6,995,287 14,839,376 43,533,165 2,463,033 10,577,284 3,229,970 3,015,986 84,654,101
Segment direct expenses 1,171,679 565,182 24,150,372 1,514,278 6,962,460 3,230,408 9,061,369 46,655,748
Inter segment expense allocation 433,840 62,153 4,200,757 95,788 660,416 (5,452,954) -
Total expenses 1,605,519 627,335 28,351,129 1,610,066 7,622,876 3,230,408 3,608,415 46,655,748
Reversals / (Provisions) (408,496) (1,168,771) 468,714 (7,276) (11,568,920) 143,855 94,285 (12,446,609)
Profit / (loss) before tax 4,981,272 13,043,270 15,650,750 845,691 (8,614,512) 143,417 (498,144) 25,551,744
------------------------------------------------------------------------------------------------ (Rupees in '000) ------------------------------------------------------------------------------------------------
------------------------------------------------------------------------------------------------ (Rupees in '000) ------------------------------------------------------------------------------------------------
2018
Corporate /
Commercial
Banking
TreasuryBranch
Banking
Islamic
Banking
International
branch
operations
Subsidiaries Others Total
Land, buildings and non-banking assets acquired in satisfaction of claims are revalued on a periodic basis using
professional valuers. The valuation is based on their assessment of the market value of the assets. The effect of changes
in the unobservable inputs used in the valuations cannot be determined with certainty. Accordingly, a qualitative disclosure
of sensitivity has not been presented in these consolidated financial statements.
2019
Corporate /
Commercial
Banking
TreasuryBranch
Banking
Islamic
Banking
International
branch
operations
Subsidiaries Others Total
66
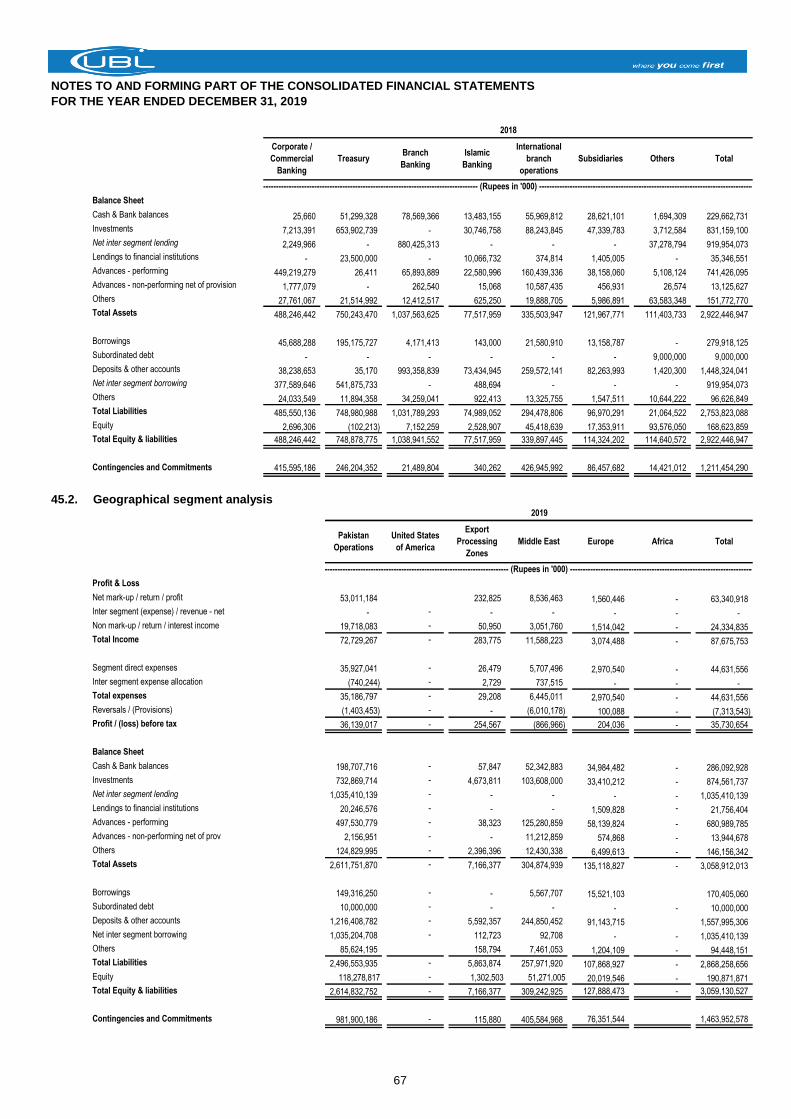
NOTES TO AND FORMING PART OF THE CONSOLIDATED FINANCIAL STATEMENTS
FOR THE YEAR ENDED DECEMBER 31, 2019
Balance Sheet
Cash & Bank balances 25,660 51,299,328 78,569,366 13,483,155 55,969,812 28,621,101 1,694,309 229,662,731
Investments 7,213,391 653,902,739 - 30,746,758 88,243,845 47,339,783 3,712,584 831,159,100
Net inter segment lending 2,249,966 - 880,425,313 - - - 37,278,794 919,954,073
Lendings to financial institutions - 23,500,000 - 10,066,732 374,814 1,405,005 - 35,346,551
Advances - performing 449,219,279 26,411 65,893,889 22,580,996 160,439,336 38,158,060 5,108,124 741,426,095
Advances - non-performing net of provision 1,777,079 - 262,540 15,068 10,587,435 456,931 26,574 13,125,627
Others 27,761,067 21,514,992 12,412,517 625,250 19,888,705 5,986,891 63,583,348 151,772,770
Total Assets 488,246,442 750,243,470 1,037,563,625 77,517,959 335,503,947 121,967,771 111,403,733 2,922,446,947
Borrowings 45,688,288 195,175,727 4,171,413 143,000 21,580,910 13,158,787 - 279,918,125
Subordinated debt - - - - - - 9,000,000 9,000,000
Deposits & other accounts 38,238,653 35,170 993,358,839 73,434,945 259,572,141 82,263,993 1,420,300 1,448,324,041
Net inter segment borrowing 377,589,646 541,875,733 - 488,694 - - - 919,954,073
Others 24,033,549 11,894,358 34,259,041 922,413 13,325,755 1,547,511 10,644,222 96,626,849
Total Liabilities 485,550,136 748,980,988 1,031,789,293 74,989,052 294,478,806 96,970,291 21,064,522 2,753,823,088
Equity 2,696,306 (102,213) 7,152,259 2,528,907 45,418,639 17,353,911 93,576,050 168,623,859
Total Equity & liabilities 488,246,442 748,878,775 1,038,941,552 77,517,959 339,897,445 114,324,202 114,640,572 2,922,446,947
Contingencies and Commitments 415,595,186 246,204,352 21,489,804 340,262 426,945,992 86,457,682 14,421,012 1,211,454,290
45.2. Geographical segment analysis
Profit & Loss
Net mark-up / return / profit 53,011,184 232,825 8,536,463 1,560,446 - 63,340,918
Inter segment (expense) / revenue - net - - - - - - -
Non mark-up / return / interest income 19,718,083 - 50,950 3,051,760 1,514,042 - 24,334,835
Total Income 72,729,267 - 283,775 11,588,223 3,074,488 - 87,675,753
Segment direct expenses 35,927,041 - 26,479 5,707,496 2,970,540 - 44,631,556
Inter segment expense allocation (740,244) - 2,729 737,515 - - -
Total expenses 35,186,797 - 29,208 6,445,011 2,970,540 - 44,631,556
Reversals / (Provisions) (1,403,453) - - (6,010,178) 100,088 - (7,313,543)
Profit / (loss) before tax 36,139,017 - 254,567 (866,966) 204,036 - 35,730,654
Balance Sheet
Cash & Bank balances 198,707,716 - 57,847 52,342,883 34,984,482 - 286,092,928
Investments 732,869,714 - 4,673,811 103,608,000 33,410,212 - 874,561,737
Net inter segment lending 1,035,410,139 - - - - - 1,035,410,139
Lendings to financial institutions 20,246,576 - - - 1,509,828 - 21,756,404
Advances - performing 497,530,779 - 38,323 125,280,859 58,139,824 - 680,989,785
Advances - non-performing net of prov 2,156,951 - - 11,212,859 574,868 - 13,944,678
Others 124,829,995 - 2,396,396 12,430,338 6,499,613 - 146,156,342
Total Assets 2,611,751,870 - 7,166,377 304,874,939 135,118,827 - 3,058,912,013
Borrowings 149,316,250 - - 5,567,707 15,521,103 170,405,060
Subordinated debt 10,000,000 - - - - - 10,000,000
Deposits & other accounts 1,216,408,782 - 5,592,357 244,850,452 91,143,715 1,557,995,306
Net inter segment borrowing 1,035,204,708 - 112,723 92,708 - - 1,035,410,139
Others 85,624,195 158,794 7,461,053 1,204,109 - 94,448,151
Total Liabilities 2,496,553,935 - 5,863,874 257,971,920 107,868,927 - 2,868,258,656
Equity 118,278,817 - 1,302,503 51,271,005 20,019,546 - 190,871,871
Total Equity & liabilities 2,614,832,752 - 7,166,377 309,242,925 127,888,473 - 3,059,130,527
Contingencies and Commitments 981,900,186 - 115,880 405,584,968 76,351,544 1,463,952,578
------------------------------------------------------------------------------------------------ (Rupees in '000) ------------------------------------------------------------------------------------------------
2019
Pakistan
Operations
United States
of America
Export
Processing
Zones
Middle East Europe Africa Total
------------------------------------------------------------------------------------------------ (Rupees in '000) ------------------------------------------------------------------------------------------------
2018
Corporate /
Commercial
Banking
TreasuryBranch
Banking
Islamic
Banking
International
branch
operations
Subsidiaries Others Total
67
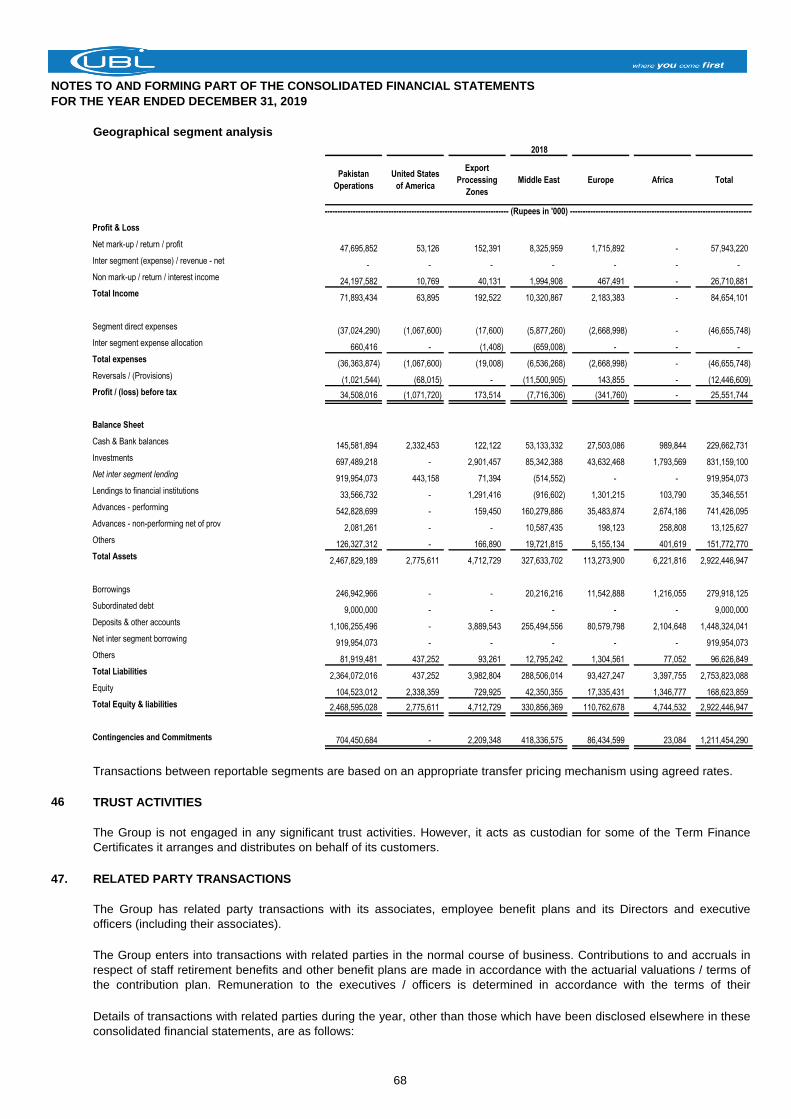
NOTES TO AND FORMING PART OF THE CONSOLIDATED FINANCIAL STATEMENTS
FOR THE YEAR ENDED DECEMBER 31, 2019
Geographical segment analysis
Profit & Loss
Net mark-up / return / profit 47,695,852 53,126 152,391 8,325,959 1,715,892 - 57,943,220
Inter segment (expense) / revenue - net - - - - - - -
Non mark-up / return / interest income 24,197,582 10,769 40,131 1,994,908 467,491 - 26,710,881
Total Income 71,893,434 63,895 192,522 10,320,867 2,183,383 - 84,654,101
Segment direct expenses (37,024,290) (1,067,600) (17,600) (5,877,260) (2,668,998) - (46,655,748)
Inter segment expense allocation 660,416 - (1,408) (659,008) - - -
Total expenses (36,363,874) (1,067,600) (19,008) (6,536,268) (2,668,998) - (46,655,748)
Reversals / (Provisions) (1,021,544) (68,015) - (11,500,905) 143,855 - (12,446,609)
Profit / (loss) before tax 34,508,016 (1,071,720) 173,514 (7,716,306) (341,760) - 25,551,744
Balance Sheet
Cash & Bank balances 145,581,894 2,332,453 122,122 53,133,332 27,503,086 989,844 229,662,731
Investments 697,489,218 - 2,901,457 85,342,388 43,632,468 1,793,569 831,159,100
Net inter segment lending 919,954,073 443,158 71,394 (514,552) - - 919,954,073
Lendings to financial institutions 33,566,732 - 1,291,416 (916,602) 1,301,215 103,790 35,346,551
Advances - performing 542,828,699 - 159,450 160,279,886 35,483,874 2,674,186 741,426,095
Advances - non-performing net of prov 2,081,261 - - 10,587,435 198,123 258,808 13,125,627
Others 126,327,312 - 166,890 19,721,815 5,155,134 401,619 151,772,770
Total Assets 2,467,829,189 2,775,611 4,712,729 327,633,702 113,273,900 6,221,816 2,922,446,947
Borrowings 246,942,966 - - 20,216,216 11,542,888 1,216,055 279,918,125
Subordinated debt 9,000,000 - - - - - 9,000,000
Deposits & other accounts 1,106,255,496 - 3,889,543 255,494,556 80,579,798 2,104,648 1,448,324,041
Net inter segment borrowing 919,954,073 - - - - - 919,954,073
Others 81,919,481 437,252 93,261 12,795,242 1,304,561 77,052 96,626,849
Total Liabilities 2,364,072,016 437,252 3,982,804 288,506,014 93,427,247 3,397,755 2,753,823,088
Equity 104,523,012 2,338,359 729,925 42,350,355 17,335,431 1,346,777 168,623,859
Total Equity & liabilities 2,468,595,028 2,775,611 4,712,729 330,856,369 110,762,678 4,744,532 2,922,446,947
Contingencies and Commitments 704,450,684 - 2,209,348 418,336,575 86,434,599 23,084 1,211,454,290
Transactions between reportable segments are based on an appropriate transfer pricing mechanism using agreed rates.
46 TRUST ACTIVITIES
47. RELATED PARTY TRANSACTIONS
------------------------------------------------------------------------------------------------ (Rupees in '000) ------------------------------------------------------------------------------------------------
The Group is not engaged in any significant trust activities. However, it acts as custodian for some of the Term Finance
Certificates it arranges and distributes on behalf of its customers.
The Group has related party transactions with its associates, employee benefit plans and its Directors and executive
officers (including their associates).
The Group enters into transactions with related parties in the normal course of business. Contributions to and accruals in
respect of staff retirement benefits and other benefit plans are made in accordance with the actuarial valuations / terms of
the contribution plan. Remuneration to the executives / officers is determined in accordance with the terms of their
appointment.
Details of transactions with related parties during the year, other than those which have been disclosed elsewhere in these
consolidated financial statements, are as follows:
2018
Pakistan
Operations
United States
of America
Export
Processing
Zones
Middle East Europe Africa Total
68
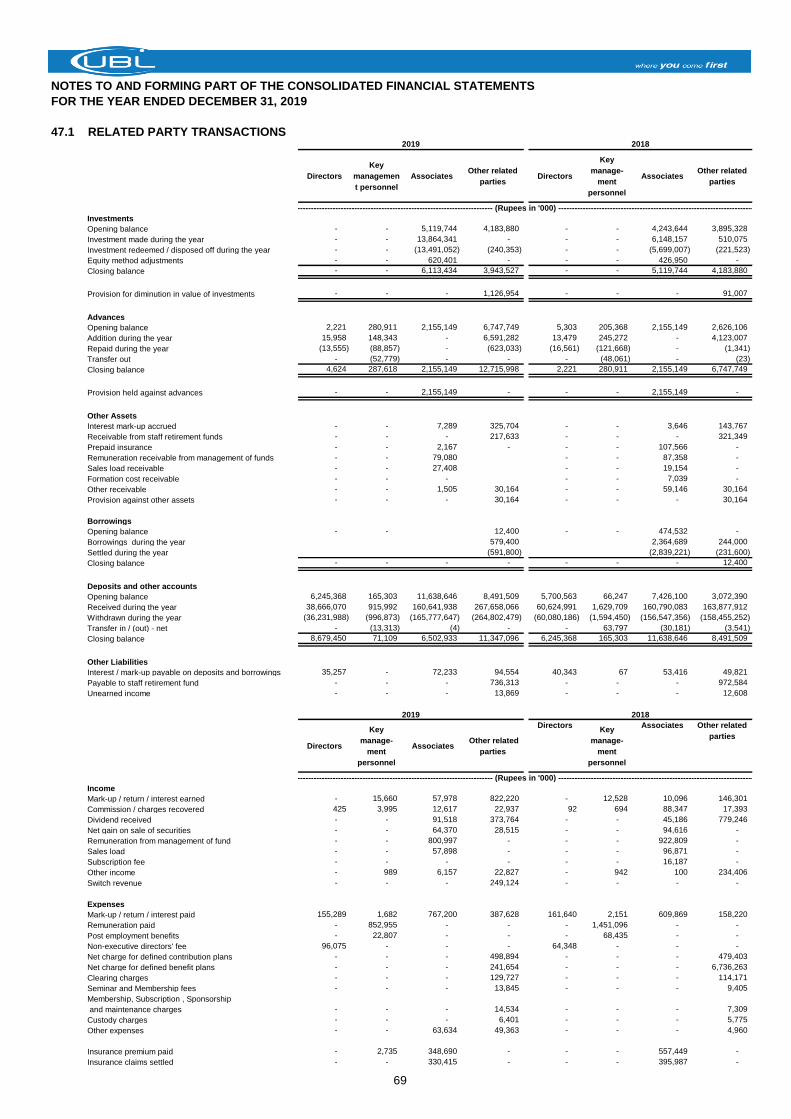
NOTES TO AND FORMING PART OF THE CONSOLIDATED FINANCIAL STATEMENTS
FOR THE YEAR ENDED DECEMBER 31, 2019
47.1 RELATED PARTY TRANSACTIONS
Directors
Key
managemen
t personnel
AssociatesOther related
partiesDirectors
Key
manage-
ment
personnel
AssociatesOther related
parties
Investments
Opening balance - - 5,119,744 4,183,880 - - 4,243,644 3,895,328
Investment made during the year - - 13,864,341 - - - 6,148,157 510,075
Investment redeemed / disposed off during the year - - (13,491,052) (240,353) - - (5,699,007) (221,523)
Equity method adjustments - - 620,401 - - - 426,950 -
Closing balance - - 6,113,434 3,943,527 - - 5,119,744 4,183,880
Provision for diminution in value of investments - - - 1,126,954 - - - 91,007
Advances
Opening balance 2,221 280,911 2,155,149 6,747,749 5,303 205,368 2,155,149 2,626,106
Addition during the year 15,958 148,343 - 6,591,282 13,479 245,272 - 4,123,007
Repaid during the year (13,555) (88,857) - (623,033) (16,561) (121,668) - (1,341)
Transfer out - (52,779) - - - (48,061) - (23)
Closing balance 4,624 287,618 2,155,149 12,715,998 2,221 280,911 2,155,149 6,747,749
Provision held against advances - - 2,155,149 - - - 2,155,149 -
Other Assets
Interest mark-up accrued - - 7,289 325,704 - - 3,646 143,767
Receivable from staff retirement funds - - - 217,633 - - - 321,349
Prepaid insurance - - 2,167 - - - 107,566 -
Remuneration receivable from management of funds - - 79,080 - - 87,358 -
Sales load receivable - - 27,408 - - 19,154 -
Formation cost receivable - - - - - 7,039 -
Other receivable - - 1,505 30,164 - - 59,146 30,164
Provision against other assets - - - 30,164 - - - 30,164
Borrowings
Opening balance - - 12,400 - - 474,532 -
Borrowings during the year 579,400 2,364,689 244,000
Settled during the year (591,800) (2,839,221) (231,600)
Closing balance - - - - - - - 12,400
Deposits and other accounts
Opening balance 6,245,368 165,303 11,638,646 8,491,509 5,700,563 66,247 7,426,100 3,072,390
Received during the year 38,666,070 915,992 160,641,938 267,658,066 60,624,991 1,629,709 160,790,083 163,877,912
Withdrawn during the year (36,231,988) (996,873) (165,777,647) (264,802,479) (60,080,186) (1,594,450) (156,547,356) (158,455,252)
Transfer in / (out) - net - (13,313) (4) - - 63,797 (30,181) (3,541)
Closing balance 8,679,450 71,109 6,502,933 11,347,096 6,245,368 165,303 11,638,646 8,491,509
Other Liabilities
Interest / mark-up payable on deposits and borrowings 35,257 - 72,233 94,554 40,343 67 53,416 49,821
Payable to staff retirement fund - - - 736,313 - - - 972,584
Unearned income - - - 13,869 - - - 12,608
Directors
Key
manage-
ment
personnel
Associates Other related
parties
DirectorsKey
manage-
ment
personnel
Associates Other related
parties
Income
Mark-up / return / interest earned - 15,660 57,978 822,220 - 12,528 10,096 146,301
Commission / charges recovered 425 3,995 12,617 22,937 92 694 88,347 17,393
Dividend received - - 91,518 373,764 - - 45,186 779,246
Net gain on sale of securities - - 64,370 28,515 - - 94,616 -
Remuneration from management of fund - - 800,997 - - - 922,809 -
Sales load - - 57,898 - - - 96,871 -
Subscription fee - - - - - - 16,187 -
Other income - 989 6,157 22,827 - 942 100 234,406
Switch revenue - - - 249,124 - - - -
Expenses
Mark-up / return / interest paid 155,289 1,682 767,200 387,628 161,640 2,151 609,869 158,220
Remuneration paid - 852,955 - - - 1,451,096 - -
Post employment benefits - 22,807 - - - 68,435 - -
Non-executive directors' fee 96,075 - - - 64,348 - - -
Net charge for defined contribution plans - - - 498,894 - - - 479,403
Net charge for defined benefit plans - - - 241,654 - - - 6,736,263
Clearing charges - - - 129,727 - - - 114,171
Seminar and Membership fees - - - 13,845 - - - 9,405
Membership, Subscription , Sponsorship
and maintenance charges - - - 14,534 - - - 7,309
Custody charges - - - 6,401 - - - 5,775
Other expenses - - 63,634 49,363 - - - 4,960
Insurance premium paid - 2,735 348,690 - - - 557,449 -
Insurance claims settled - - 330,415 - - - 395,987 -
------------------------------------------------------------------------------------------------------ (Rupees in '000) ------------------------------------------------------------------------------------------------------
2019 2018
------------------------------------------------------------------------------------------------------ (Rupees in '000) ------------------------------------------------------------------------------------------------------
2019 2018
69
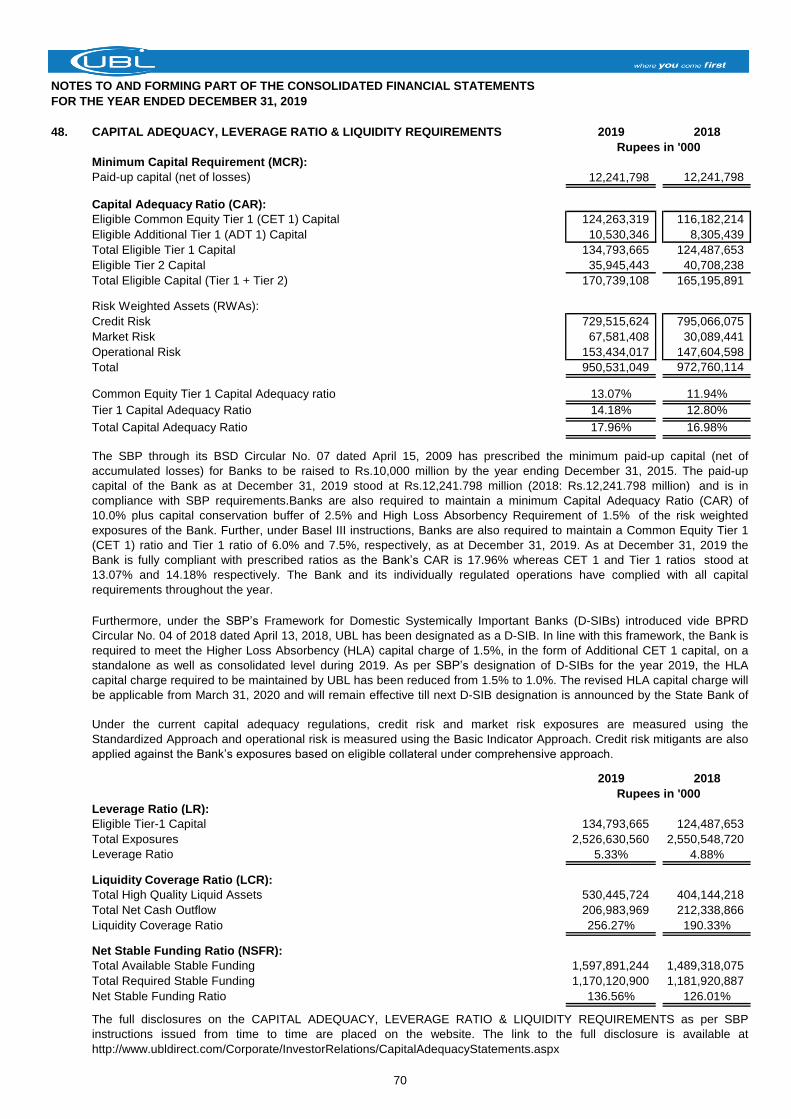
NOTES TO AND FORMING PART OF THE CONSOLIDATED FINANCIAL STATEMENTS
FOR THE YEAR ENDED DECEMBER 31, 2019
48. CAPITAL ADEQUACY, LEVERAGE RATIO & LIQUIDITY REQUIREMENTS 2019 2018
Minimum Capital Requirement (MCR):
Paid-up capital (net of losses) 12,241,798 12,241,798
Capital Adequacy Ratio (CAR):
Eligible Common Equity Tier 1 (CET 1) Capital 124,263,319 116,182,214
Eligible Additional Tier 1 (ADT 1) Capital 10,530,346 8,305,439
Total Eligible Tier 1 Capital 134,793,665 124,487,653
Eligible Tier 2 Capital 35,945,443 40,708,238
Total Eligible Capital (Tier 1 + Tier 2) 170,739,108 165,195,891
Risk Weighted Assets (RWAs):
Credit Risk 729,515,624 795,066,075
Market Risk 67,581,408 30,089,441
Operational Risk 153,434,017 147,604,598
Total 950,531,049 972,760,114
Common Equity Tier 1 Capital Adequacy ratio 13.07% 11.94%
Tier 1 Capital Adequacy Ratio 14.18% 12.80%
Total Capital Adequacy Ratio 17.96% 16.98%
2019 2018
Leverage Ratio (LR):
Eligible Tier-1 Capital 134,793,665 124,487,653
Total Exposures 2,526,630,560 2,550,548,720
Leverage Ratio 5.33% 4.88%
Liquidity Coverage Ratio (LCR):
Total High Quality Liquid Assets 530,445,724 404,144,218
Total Net Cash Outflow 206,983,969 212,338,866
Liquidity Coverage Ratio 256.27% 190.33%
Net Stable Funding Ratio (NSFR):
Total Available Stable Funding 1,597,891,244 1,489,318,075
Total Required Stable Funding 1,170,120,900 1,181,920,887
Net Stable Funding Ratio 136.56% 126.01%
Rupees in '000
The SBP through its BSD Circular No. 07 dated April 15, 2009 has prescribed the minimum paid-up capital (net of
accumulated losses) for Banks to be raised to Rs.10,000 million by the year ending December 31, 2015. The paid-up
capital of the Bank as at December 31, 2019 stood at Rs.12,241.798 million (2018: Rs.12,241.798 million) and is in
compliance with SBP requirements.Banks are also required to maintain a minimum Capital Adequacy Ratio (CAR) of
10.0% plus capital conservation buffer of 2.5% and High Loss Absorbency Requirement of 1.5% of the risk weighted
exposures of the Bank. Further, under Basel III instructions, Banks are also required to maintain a Common Equity Tier 1
(CET 1) ratio and Tier 1 ratio of 6.0% and 7.5%, respectively, as at December 31, 2019. As at December 31, 2019 the
Bank is fully compliant with prescribed ratios as the Bank’s CAR is 17.96% whereas CET 1 and Tier 1 ratios stood at
13.07% and 14.18% respectively. The Bank and its individually regulated operations have complied with all capital
requirements throughout the year.
Under the current capital adequacy regulations, credit risk and market risk exposures are measured using the
Standardized Approach and operational risk is measured using the Basic Indicator Approach. Credit risk mitigants are also
applied against the Bank’s exposures based on eligible collateral under comprehensive approach.
Rupees in '000
The full disclosures on the CAPITAL ADEQUACY, LEVERAGE RATIO & LIQUIDITY REQUIREMENTS as per SBP
instructions issued from time to time are placed on the website. The link to the full disclosure is available at
http://www.ubldirect.com/Corporate/InvestorRelations/CapitalAdequacyStatements.aspx
Furthermore, under the SBP’s Framework for Domestic Systemically Important Banks (D-SIBs) introduced vide BPRD
Circular No. 04 of 2018 dated April 13, 2018, UBL has been designated as a D-SIB. In line with this framework, the Bank is
required to meet the Higher Loss Absorbency (HLA) capital charge of 1.5%, in the form of Additional CET 1 capital, on a
standalone as well as consolidated level during 2019. As per SBP’s designation of D-SIBs for the year 2019, the HLA
capital charge required to be maintained by UBL has been reduced from 1.5% to 1.0%. The revised HLA capital charge will
be applicable from March 31, 2020 and will remain effective till next D-SIB designation is announced by the State Bank of
Pakistan.
70
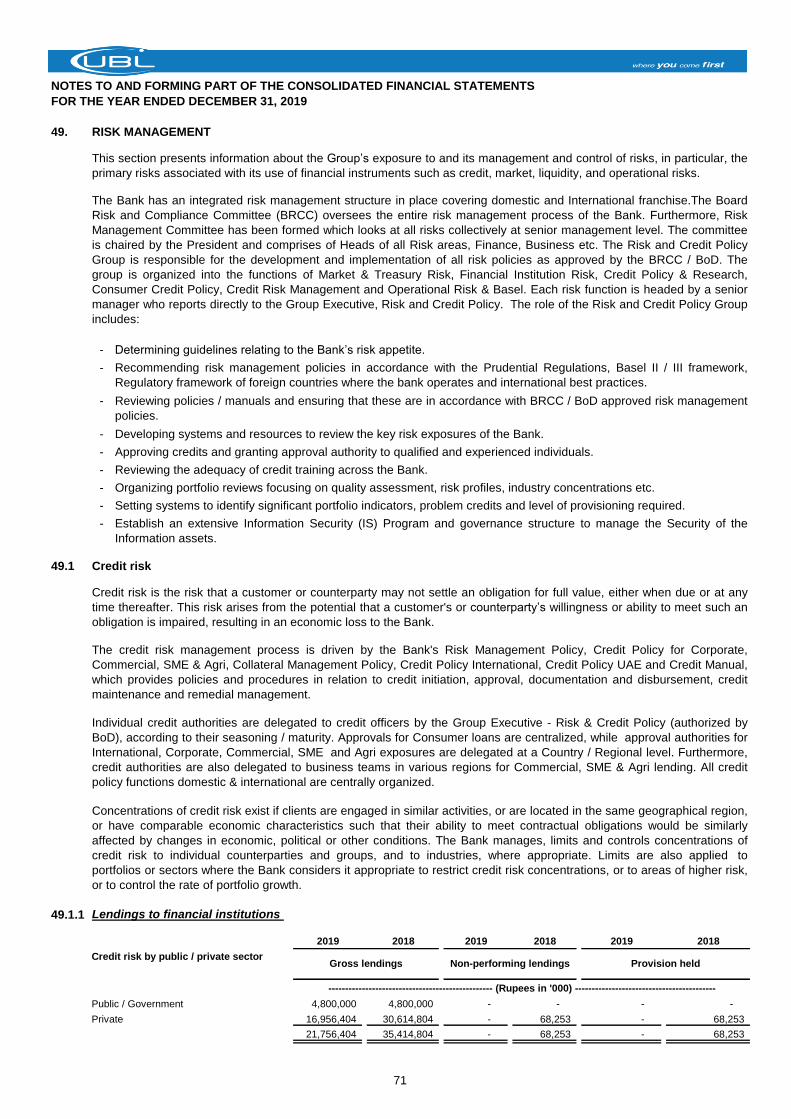
NOTES TO AND FORMING PART OF THE CONSOLIDATED FINANCIAL STATEMENTS
FOR THE YEAR ENDED DECEMBER 31, 2019
49. RISK MANAGEMENT
- Determining guidelines relating to the Bank’s risk appetite.
-
-
- Developing systems and resources to review the key risk exposures of the Bank.
- Approving credits and granting approval authority to qualified and experienced individuals.
- Reviewing the adequacy of credit training across the Bank.
- Organizing portfolio reviews focusing on quality assessment, risk profiles, industry concentrations etc.
- Setting systems to identify significant portfolio indicators, problem credits and level of provisioning required.
-
49.1 Credit risk
49.1.1 Lendings to financial institutions
2019 2018 2019 2018 2019 2018
Credit risk by public / private sector
Public / Government 4,800,000 4,800,000 - - - -
Private 16,956,404 30,614,804 - 68,253 - 68,253
21,756,404 35,414,804 - 68,253 - 68,253
This section presents information about the Group’s exposure to and its management and control of risks, in particular, the
primary risks associated with its use of financial instruments such as credit, market, liquidity, and operational risks.
------------------------------------------------- (Rupees in '000) ------------------------------------------
The Bank has an integrated risk management structure in place covering domestic and International franchise.The Board
Risk and Compliance Committee (BRCC) oversees the entire risk management process of the Bank. Furthermore, Risk
Management Committee has been formed which looks at all risks collectively at senior management level. The committee
is chaired by the President and comprises of Heads of all Risk areas, Finance, Business etc. The Risk and Credit Policy
Group is responsible for the development and implementation of all risk policies as approved by the BRCC / BoD. The
group is organized into the functions of Market & Treasury Risk, Financial Institution Risk, Credit Policy & Research,
Consumer Credit Policy, Credit Risk Management and Operational Risk & Basel. Each risk function is headed by a senior
manager who reports directly to the Group Executive, Risk and Credit Policy. The role of the Risk and Credit Policy Group
includes:
Recommending risk management policies in accordance with the Prudential Regulations, Basel II / III framework,
Regulatory framework of foreign countries where the bank operates and international best practices.
Reviewing policies / manuals and ensuring that these are in accordance with BRCC / BoD approved risk management
policies.
Establish an extensive Information Security (IS) Program and governance structure to manage the Security of the
Information assets.
Credit risk is the risk that a customer or counterparty may not settle an obligation for full value, either when due or at any
time thereafter. This risk arises from the potential that a customer's or counterparty’s willingness or ability to meet such an
obligation is impaired, resulting in an economic loss to the Bank.
The credit risk management process is driven by the Bank's Risk Management Policy, Credit Policy for Corporate,
Commercial, SME & Agri, Collateral Management Policy, Credit Policy International, Credit Policy UAE and Credit Manual,
which provides policies and procedures in relation to credit initiation, approval, documentation and disbursement, credit
maintenance and remedial management.
Individual credit authorities are delegated to credit officers by the Group Executive - Risk & Credit Policy (authorized by
BoD), according to their seasoning / maturity. Approvals for Consumer loans are centralized, while approval authorities for
International, Corporate, Commercial, SME and Agri exposures are delegated at a Country / Regional level. Furthermore,
credit authorities are also delegated to business teams in various regions for Commercial, SME & Agri lending. All credit
policy functions domestic & international are centrally organized.
Concentrations of credit risk exist if clients are engaged in similar activities, or are located in the same geographical region,
or have comparable economic characteristics such that their ability to meet contractual obligations would be similarly
affected by changes in economic, political or other conditions. The Bank manages, limits and controls concentrations of
credit risk to individual counterparties and groups, and to industries, where appropriate. Limits are also applied to
portfolios or sectors where the Bank considers it appropriate to restrict credit risk concentrations, or to areas of higher risk,
or to control the rate of portfolio growth.
Gross lendings Non-performing lendings Provision held
71
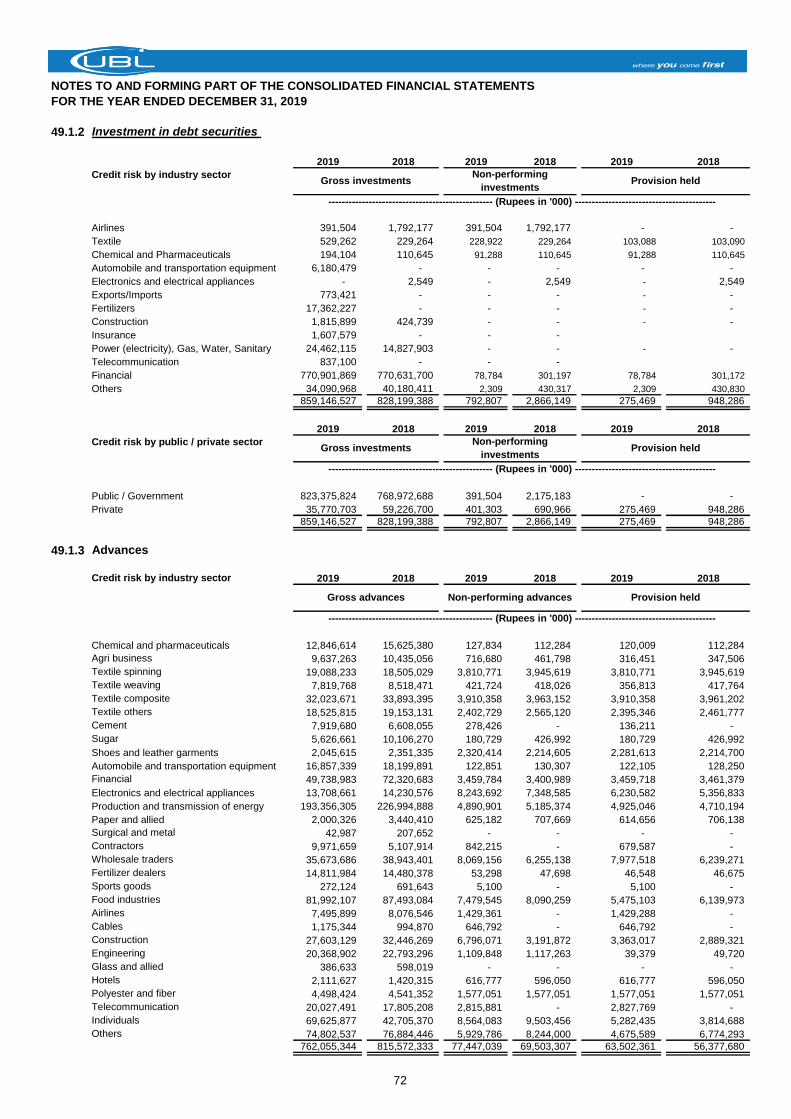
NOTES TO AND FORMING PART OF THE CONSOLIDATED FINANCIAL STATEMENTS
FOR THE YEAR ENDED DECEMBER 31, 2019
49.1.2 Investment in debt securities
2019 2018 2019 2018 2019 2018
Credit risk by industry sector
Airlines 391,504 1,792,177 391,504 1,792,177 - -
Textile 529,262 229,264 228,922 229,264 103,088 103,090
Chemical and Pharmaceuticals 194,104 110,645 91,288 110,645 91,288 110,645
Automobile and transportation equipment 6,180,479 - - - - -
Electronics and electrical appliances - 2,549 - 2,549 - 2,549
Exports/Imports 773,421 - - - - -
Fertilizers 17,362,227 - - - - -
Construction 1,815,899 424,739 - - - -
Insurance 1,607,579 - - -
Power (electricity), Gas, Water, Sanitary 24,462,115 14,827,903 - - - -
Telecommunication 837,100 - - -
Financial 770,901,869 770,631,700 78,784 301,197 78,784 301,172
Others 34,090,968 40,180,411 2,309 430,317 2,309 430,830
859,146,527 828,199,388 792,807 2,866,149 275,469 948,286
2019 2018 2019 2018 2019 2018
Credit risk by public / private sector
Public / Government 823,375,824 768,972,688 391,504 2,175,183 - -
Private 35,770,703 59,226,700 401,303 690,966 275,469 948,286
859,146,527 828,199,388 792,807 2,866,149 275,469 948,286
49.1.3 Advances
Credit risk by industry sector 2019 2018 2019 2018 2019 2018
Chemical and pharmaceuticals 12,846,614 15,625,380 127,834 112,284 120,009 112,284
Agri business 9,637,263 10,435,056 716,680 461,798 316,451 347,506
Textile spinning 19,088,233 18,505,029 3,810,771 3,945,619 3,810,771 3,945,619
Textile weaving 7,819,768 8,518,471 421,724 418,026 356,813 417,764
Textile composite 32,023,671 33,893,395 3,910,358 3,963,152 3,910,358 3,961,202
Textile others 18,525,815 19,153,131 2,402,729 2,565,120 2,395,346 2,461,777
Cement 7,919,680 6,608,055 278,426 - 136,211 -
Sugar 5,626,661 10,106,270 180,729 426,992 180,729 426,992
Shoes and leather garments 2,045,615 2,351,335 2,320,414 2,214,605 2,281,613 2,214,700
Automobile and transportation equipment 16,857,339 18,199,891 122,851 130,307 122,105 128,250
Financial 49,738,983 72,320,683 3,459,784 3,400,989 3,459,718 3,461,379
Electronics and electrical appliances 13,708,661 14,230,576 8,243,692 7,348,585 6,230,582 5,356,833
Production and transmission of energy 193,356,305 226,994,888 4,890,901 5,185,374 4,925,046 4,710,194
Paper and allied 2,000,326 3,440,410 625,182 707,669 614,656 706,138
Surgical and metal 42,987 207,652 - - - -
Contractors 9,971,659 5,107,914 842,215 - 679,587 -
Wholesale traders 35,673,686 38,943,401 8,069,156 6,255,138 7,977,518 6,239,271
Fertilizer dealers 14,811,984 14,480,378 53,298 47,698 46,548 46,675
Sports goods 272,124 691,643 5,100 - 5,100 -
Food industries 81,992,107 87,493,084 7,479,545 8,090,259 5,475,103 6,139,973
Airlines 7,495,899 8,076,546 1,429,361 - 1,429,288 -
Cables 1,175,344 994,870 646,792 - 646,792 -
Construction 27,603,129 32,446,269 6,796,071 3,191,872 3,363,017 2,889,321
Engineering 20,368,902 22,793,296 1,109,848 1,117,263 39,379 49,720
Glass and allied 386,633 598,019 - - - -
Hotels 2,111,627 1,420,315 616,777 596,050 616,777 596,050
Polyester and fiber 4,498,424 4,541,352 1,577,051 1,577,051 1,577,051 1,577,051
Telecommunication 20,027,491 17,805,208 2,815,881 - 2,827,769 -
Individuals 69,625,877 42,705,370 8,564,083 9,503,456 5,282,435 3,814,688
Others 74,802,537 76,884,446 5,929,786 8,244,000 4,675,589 6,774,293
762,055,344 815,572,333 77,447,039 69,503,307 63,502,361 56,377,680
Gross investments Non-performing
investmentsProvision held
------------------------------------------------- (Rupees in '000) ------------------------------------------
Gross investments Non-performing
investmentsProvision held
------------------------------------------------- (Rupees in '000) ------------------------------------------
Gross advances Non-performing advances Provision held
------------------------------------------------- (Rupees in '000) ------------------------------------------
72
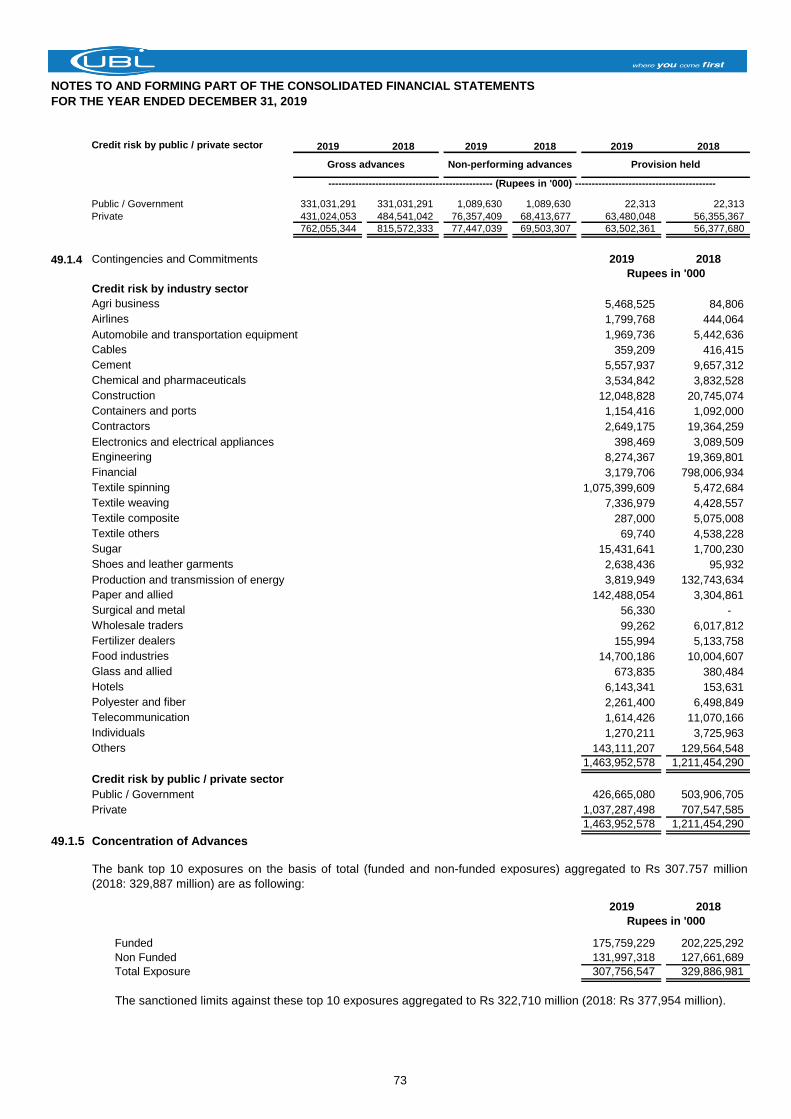
NOTES TO AND FORMING PART OF THE CONSOLIDATED FINANCIAL STATEMENTS
FOR THE YEAR ENDED DECEMBER 31, 2019
Credit risk by public / private sector 2019 2018 2019 2018 2019 2018
Public / Government 331,031,291 331,031,291 1,089,630 1,089,630 22,313 22,313
Private 431,024,053 484,541,042 76,357,409 68,413,677 63,480,048 56,355,367
762,055,344 815,572,333 77,447,039 69,503,307 63,502,361 56,377,680
49.1.4 Contingencies and Commitments 2019 2018
Credit risk by industry sector
Agri business 5,468,525 84,806
Airlines 1,799,768 444,064
Automobile and transportation equipment 1,969,736 5,442,636
Cables 359,209 416,415
Cement 5,557,937 9,657,312
Chemical and pharmaceuticals 3,534,842 3,832,528
Construction 12,048,828 20,745,074
Containers and ports 1,154,416 1,092,000
Contractors 2,649,175 19,364,259
Electronics and electrical appliances 398,469 3,089,509
Engineering 8,274,367 19,369,801
Financial 3,179,706 798,006,934
Textile spinning 1,075,399,609 5,472,684
Textile weaving 7,336,979 4,428,557
Textile composite 287,000 5,075,008
Textile others 69,740 4,538,228
Sugar 15,431,641 1,700,230
Shoes and leather garments 2,638,436 95,932
Production and transmission of energy 3,819,949 132,743,634
Paper and allied 142,488,054 3,304,861
Surgical and metal 56,330 -
Wholesale traders 99,262 6,017,812
Fertilizer dealers 155,994 5,133,758
Food industries 14,700,186 10,004,607
Glass and allied 673,835 380,484
Hotels 6,143,341 153,631
Polyester and fiber 2,261,400 6,498,849
Telecommunication 1,614,426 11,070,166
Individuals 1,270,211 3,725,963
Others 143,111,207 129,564,548
1,463,952,578 1,211,454,290
Credit risk by public / private sector
Public / Government 426,665,080 503,906,705
Private 1,037,287,498 707,547,585
1,463,952,578 1,211,454,290
49.1.5 Concentration of Advances
2019 2018
Funded 175,759,229 202,225,292
Non Funded 131,997,318 127,661,689
Total Exposure 307,756,547 329,886,981
The sanctioned limits against these top 10 exposures aggregated to Rs 322,710 million (2018: Rs 377,954 million).
------------------------------------------------- (Rupees in '000) ------------------------------------------
Rupees in '000
The bank top 10 exposures on the basis of total (funded and non-funded exposures) aggregated to Rs 307.757 million
(2018: 329,887 million) are as following:
Rupees in '000
Gross advances Non-performing advances Provision held
73
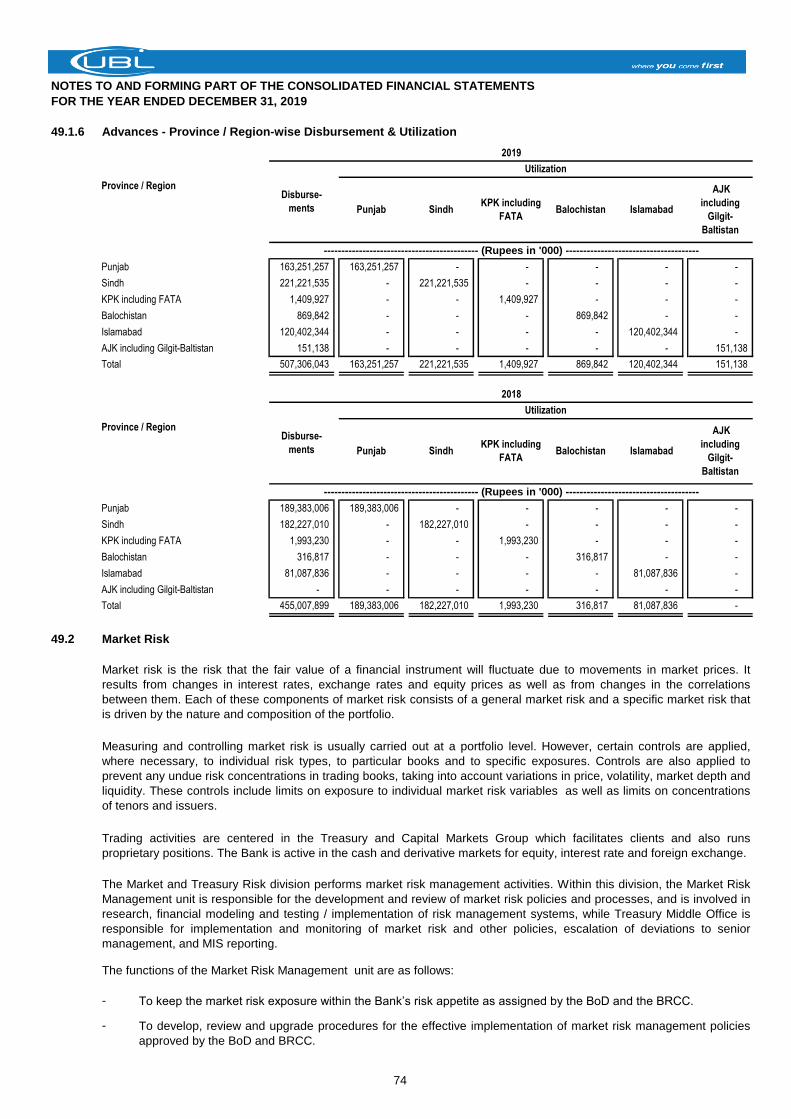
NOTES TO AND FORMING PART OF THE CONSOLIDATED FINANCIAL STATEMENTS
FOR THE YEAR ENDED DECEMBER 31, 2019
49.1.6 Advances - Province / Region-wise Disbursement & Utilization
Province / Region
Punjab 163,251,257 163,251,257 - - - - -
Sindh 221,221,535 - 221,221,535 - - - -
KPK including FATA 1,409,927 - - 1,409,927 - - -
Balochistan 869,842 - - - 869,842 - -
Islamabad 120,402,344 - - - - 120,402,344 -
AJK including Gilgit-Baltistan 151,138 - - - - - 151,138
Total 507,306,043 163,251,257 221,221,535 1,409,927 869,842 120,402,344 151,138
Province / Region
Punjab 189,383,006 189,383,006 - - - - -
Sindh 182,227,010 - 182,227,010 - - - -
KPK including FATA 1,993,230 - - 1,993,230 - - -
Balochistan 316,817 - - - 316,817 - -
Islamabad 81,087,836 - - - - 81,087,836 -
AJK including Gilgit-Baltistan - - - - - - -
Total 455,007,899 189,383,006 182,227,010 1,993,230 316,817 81,087,836 -
49.2 Market Risk
The functions of the Market Risk Management unit are as follows:
- To keep the market risk exposure within the Bank’s risk appetite as assigned by the BoD and the BRCC.
-
2019
Disburse-
ments
Utilization
Punjab SindhKPK including
FATABalochistan Islamabad
AJK
including
Gilgit-
Baltistan
-------------------------------------------- (Rupees in '000) --------------------------------------
2018
Disburse-
ments
Utilization
Punjab SindhKPK including
FATABalochistan Islamabad
AJK
including
Gilgit-
Baltistan
-------------------------------------------- (Rupees in '000) --------------------------------------
Market risk is the risk that the fair value of a financial instrument will fluctuate due to movements in market prices. It
results from changes in interest rates, exchange rates and equity prices as well as from changes in the correlations
between them. Each of these components of market risk consists of a general market risk and a specific market risk that
is driven by the nature and composition of the portfolio.
Measuring and controlling market risk is usually carried out at a portfolio level. However, certain controls are applied,
where necessary, to individual risk types, to particular books and to specific exposures. Controls are also applied to
prevent any undue risk concentrations in trading books, taking into account variations in price, volatility, market depth and
liquidity. These controls include limits on exposure to individual market risk variables as well as limits on concentrations
of tenors and issuers.
Trading activities are centered in the Treasury and Capital Markets Group which facilitates clients and also runs
proprietary positions. The Bank is active in the cash and derivative markets for equity, interest rate and foreign exchange.
The Market and Treasury Risk division performs market risk management activities. Within this division, the Market Risk
Management unit is responsible for the development and review of market risk policies and processes, and is involved in
research, financial modeling and testing / implementation of risk management systems, while Treasury Middle Office is
responsible for implementation and monitoring of market risk and other policies, escalation of deviations to senior
management, and MIS reporting.
To develop, review and upgrade procedures for the effective implementation of market risk management policies
approved by the BoD and BRCC.
74
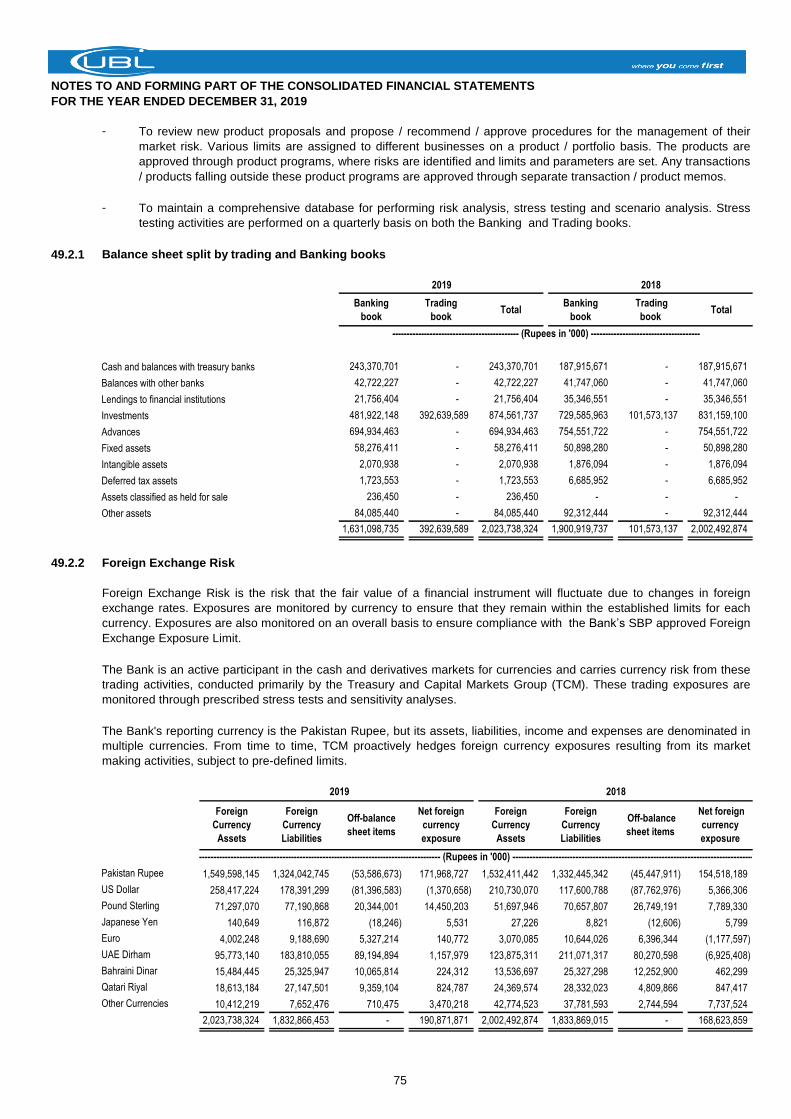
NOTES TO AND FORMING PART OF THE CONSOLIDATED FINANCIAL STATEMENTS
FOR THE YEAR ENDED DECEMBER 31, 2019
-
-
49.2.1 Balance sheet split by trading and Banking books
Banking
book
Trading
bookTotal
Banking
book
Trading
book Total
Cash and balances with treasury banks 243,370,701 - 243,370,701 187,915,671 - 187,915,671
Balances with other banks 42,722,227 - 42,722,227 41,747,060 - 41,747,060
Lendings to financial institutions 21,756,404 - 21,756,404 35,346,551 - 35,346,551
Investments 481,922,148 392,639,589 874,561,737 729,585,963 101,573,137 831,159,100
Advances 694,934,463 - 694,934,463 754,551,722 - 754,551,722
Fixed assets 58,276,411 - 58,276,411 50,898,280 - 50,898,280
Intangible assets 2,070,938 - 2,070,938 1,876,094 - 1,876,094
Deferred tax assets 1,723,553 - 1,723,553 6,685,952 - 6,685,952
Assets classified as held for sale 236,450 - 236,450 - - -
Other assets 84,085,440 - 84,085,440 92,312,444 - 92,312,444
1,631,098,735 392,639,589 2,023,738,324 1,900,919,737 101,573,137 2,002,492,874
49.2.2 Foreign Exchange Risk
2019 2018
Pakistan Rupee 1,549,598,145 1,324,042,745 (53,586,673) 171,968,727 1,532,411,442 1,332,445,342 (45,447,911) 154,518,189
US Dollar 258,417,224 178,391,299 (81,396,583) (1,370,658) 210,730,070 117,600,788 (87,762,976) 5,366,306
Pound Sterling 71,297,070 77,190,868 20,344,001 14,450,203 51,697,946 70,657,807 26,749,191 7,789,330
Japanese Yen 140,649 116,872 (18,246) 5,531 27,226 8,821 (12,606) 5,799
Euro 4,002,248 9,188,690 5,327,214 140,772 3,070,085 10,644,026 6,396,344 (1,177,597)
UAE Dirham 95,773,140 183,810,055 89,194,894 1,157,979 123,875,311 211,071,317 80,270,598 (6,925,408)
Bahraini Dinar 15,484,445 25,325,947 10,065,814 224,312 13,536,697 25,327,298 12,252,900 462,299
Qatari Riyal 18,613,184 27,147,501 9,359,104 824,787 24,369,574 28,332,023 4,809,866 847,417
Other Currencies 10,412,219 7,652,476 710,475 3,470,218 42,774,523 37,781,593 2,744,594 7,737,524
2,023,738,324 1,832,866,453 - 190,871,871 2,002,492,874 1,833,869,015 - 168,623,859
Foreign Exchange Risk is the risk that the fair value of a financial instrument will fluctuate due to changes in foreign
exchange rates. Exposures are monitored by currency to ensure that they remain within the established limits for each
currency. Exposures are also monitored on an overall basis to ensure compliance with the Bank’s SBP approved Foreign
Exchange Exposure Limit.
To review new product proposals and propose / recommend / approve procedures for the management of their
market risk. Various limits are assigned to different businesses on a product / portfolio basis. The products are
approved through product programs, where risks are identified and limits and parameters are set. Any transactions
/ products falling outside these product programs are approved through separate transaction / product memos.
To maintain a comprehensive database for performing risk analysis, stress testing and scenario analysis. Stress
testing activities are performed on a quarterly basis on both the Banking and Trading books.
2019 2018
-------------------------------------------- (Rupees in '000) --------------------------------------
The Bank is an active participant in the cash and derivatives markets for currencies and carries currency risk from these
trading activities, conducted primarily by the Treasury and Capital Markets Group (TCM). These trading exposures are
monitored through prescribed stress tests and sensitivity analyses.
The Bank's reporting currency is the Pakistan Rupee, but its assets, liabilities, income and expenses are denominated in
multiple currencies. From time to time, TCM proactively hedges foreign currency exposures resulting from its market
making activities, subject to pre-defined limits.
Foreign
Currency
Assets
Foreign
Currency
Liabilities
Off-balance
sheet items
Net foreign
currency
exposure
Foreign
Currency
Assets
Foreign
Currency
Liabilities
Off-balance
sheet items
Net foreign
currency
exposure
------------------------------------------------------------------------------------------------ (Rupees in '000) ------------------------------------------------------------------------------------------------
75
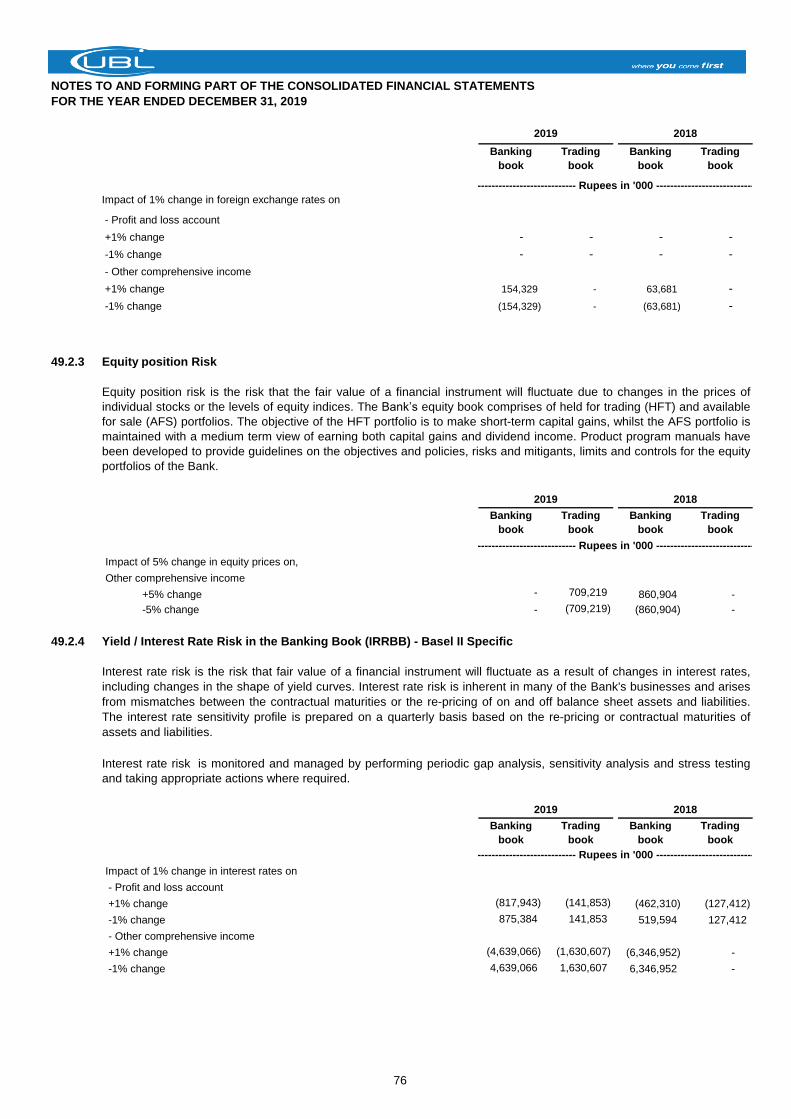
NOTES TO AND FORMING PART OF THE CONSOLIDATED FINANCIAL STATEMENTS
FOR THE YEAR ENDED DECEMBER 31, 2019
Banking
book
Trading
book
Banking
book
Trading
book
Impact of 1% change in foreign exchange rates on
- Profit and loss account
+1% change - - - -
-1% change - - - -
- Other comprehensive income
+1% change 154,329 - 63,681 -
-1% change (154,329) - (63,681) -
49.2.3 Equity position Risk
Banking
book
Trading
book
Banking
book
Trading
book
Impact of 5% change in equity prices on,
Other comprehensive income
+5% change - 709,219 860,904 -
-5% change - (709,219) (860,904) -
49.2.4 Yield / Interest Rate Risk in the Banking Book (IRRBB) - Basel II Specific
Banking
book
Trading
book
Banking
book
Trading
book
Impact of 1% change in interest rates on
- Profit and loss account
+1% change (817,943) (141,853) (462,310) (127,412)
-1% change 875,384 141,853 519,594 127,412
- Other comprehensive income
+1% change (4,639,066) (1,630,607) (6,346,952) -
-1% change 4,639,066 1,630,607 6,346,952 -
---------------------------- Rupees in '000 ----------------------------
2019 2018
---------------------------- Rupees in '000 ----------------------------
Equity position risk is the risk that the fair value of a financial instrument will fluctuate due to changes in the prices of
individual stocks or the levels of equity indices. The Bank’s equity book comprises of held for trading (HFT) and available
for sale (AFS) portfolios. The objective of the HFT portfolio is to make short-term capital gains, whilst the AFS portfolio is
maintained with a medium term view of earning both capital gains and dividend income. Product program manuals have
been developed to provide guidelines on the objectives and policies, risks and mitigants, limits and controls for the equity
portfolios of the Bank.
2019 2018
---------------------------- Rupees in '000 ----------------------------
Interest rate risk is the risk that fair value of a financial instrument will fluctuate as a result of changes in interest rates,
including changes in the shape of yield curves. Interest rate risk is inherent in many of the Bank's businesses and arises
from mismatches between the contractual maturities or the re-pricing of on and off balance sheet assets and liabilities.
The interest rate sensitivity profile is prepared on a quarterly basis based on the re-pricing or contractual maturities of
assets and liabilities.
Interest rate risk is monitored and managed by performing periodic gap analysis, sensitivity analysis and stress testing
and taking appropriate actions where required.
2019 2018
76
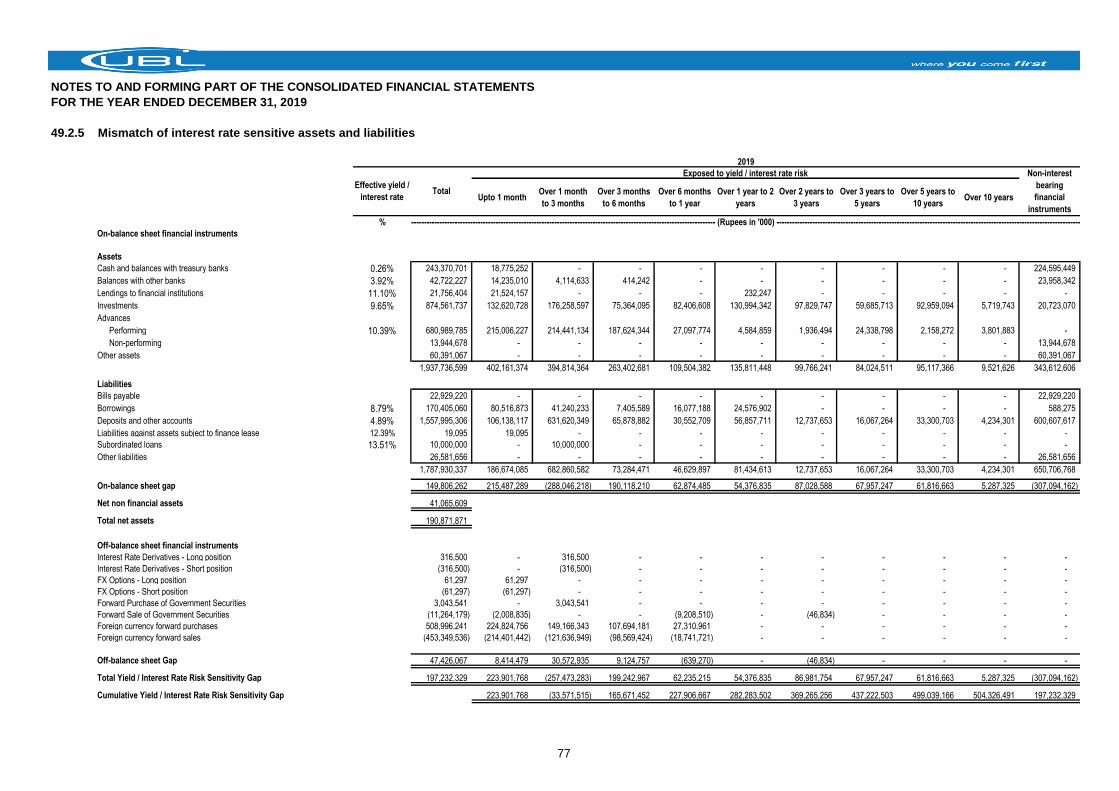
NOTES TO AND FORMING PART OF THE CONSOLIDATED FINANCIAL STATEMENTS
FOR THE YEAR ENDED DECEMBER 31, 2019
49.2.5
Upto 1 monthOver 1 month
to 3 months
Over 3 months
to 6 months
Over 6 months
to 1 year
Over 1 year to 2
years
Over 2 years to
3 years
Over 3 years to
5 years
Over 5 years to
10 yearsOver 10 years
%
On-balance sheet financial instruments
Assets
Cash and balances with treasury banks 0.26% 243,370,701 18,775,252 - - - - - - - - 224,595,449
Balances with other banks 3.92% 42,722,227 14,235,010 4,114,633 414,242 - - - - - - 23,958,342
Lendings to financial institutions 11.10% 21,756,404 21,524,157 - - - 232,247 - - - - -
Investments 9.65% 874,561,737 132,620,728 176,258,597 75,364,095 82,406,608 130,994,342 97,829,747 59,685,713 92,959,094 5,719,743 20,723,070
Advances
Performing 10.39% 680,989,785 215,006,227 214,441,134 187,624,344 27,097,774 4,584,859 1,936,494 24,338,798 2,158,272 3,801,883 -
Non-performing 13,944,678 - - - - - - - - - 13,944,678
Other assets 60,391,067 - - - - - - - - - 60,391,067
1,937,736,599 402,161,374 394,814,364 263,402,681 109,504,382 135,811,448 99,766,241 84,024,511 95,117,366 9,521,626 343,612,606
Liabilities
Bills payable 22,929,220 - - - - - - - - - 22,929,220
Borrowings 8.79% 170,405,060 80,516,873 41,240,233 7,405,589 16,077,188 24,576,902 - - - - 588,275
Deposits and other accounts 4.89% 1,557,995,306 106,138,117 631,620,349 65,878,882 30,552,709 56,857,711 12,737,653 16,067,264 33,300,703 4,234,301 600,607,617
Liabilities against assets subject to finance lease 12.39% 19,095 19,095 - - - - - - - - -
Subordinated loans 13.51% 10,000,000 - 10,000,000 - - - - - - - -
Other liabilities 26,581,656 - - - - - - - - - 26,581,656
1,787,930,337 186,674,085 682,860,582 73,284,471 46,629,897 81,434,613 12,737,653 16,067,264 33,300,703 4,234,301 650,706,768
On-balance sheet gap 149,806,262 215,487,289 (288,046,218) 190,118,210 62,874,485 54,376,835 87,028,588 67,957,247 61,816,663 5,287,325 (307,094,162)
Net non financial assets 41,065,609
Total net assets 190,871,871
Off-balance sheet financial instruments
Interest Rate Derivatives - Long position 316,500 - 316,500 - - - - - - - -
Interest Rate Derivatives - Short position (316,500) - (316,500) - - - - - - - -
FX Options - Long position 61,297 61,297 - - - - - - - - -
FX Options - Short position (61,297) (61,297) - - - - - - - - -
Forward Purchase of Government Securities 3,043,541 - 3,043,541 - - - - - - - -
Forward Sale of Government Securities (11,264,179) (2,008,835) - - (9,208,510) - (46,834) - - - -
Foreign currency forward purchases 508,996,241 224,824,756 149,166,343 107,694,181 27,310,961 - - - - - -
Foreign currency forward sales (453,349,536) (214,401,442) (121,636,949) (98,569,424) (18,741,721) - - - - - -
Off-balance sheet Gap 47,426,067 8,414,479 30,572,935 9,124,757 (639,270) - (46,834) - - - -
Total Yield / Interest Rate Risk Sensitivity Gap 197,232,329 223,901,768 (257,473,283) 199,242,967 62,235,215 54,376,835 86,981,754 67,957,247 61,816,663 5,287,325 (307,094,162)
Cumulative Yield / Interest Rate Risk Sensitivity Gap 223,901,768 (33,571,515) 165,671,452 227,906,667 282,283,502 369,265,256 437,222,503 499,039,166 504,326,491 197,232,329
Mismatch of interest rate sensitive assets and liabilities
2019
Effective yield /
interest rateTotal
Exposed to yield / interest rate risk Non-interest
bearing
financial
instruments
------------------------------------------------------------------------------------------------------------------------- (Rupees in '000) -------------------------------------------------------------------------------------------------------------------------
77
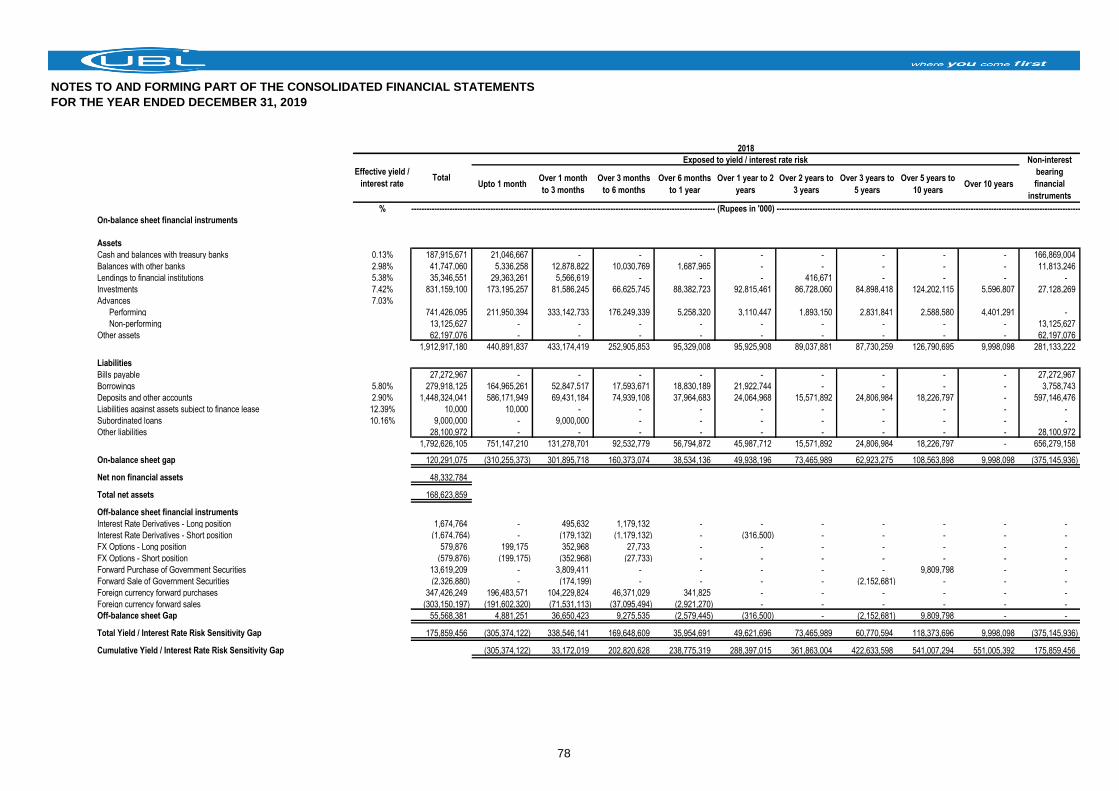
NOTES TO AND FORMING PART OF THE CONSOLIDATED FINANCIAL STATEMENTS
FOR THE YEAR ENDED DECEMBER 31, 2019
Upto 1 monthOver 1 month
to 3 months
Over 3 months
to 6 months
Over 6 months
to 1 year
Over 1 year to 2
years
Over 2 years to
3 years
Over 3 years to
5 years
Over 5 years to
10 yearsOver 10 years
%
On-balance sheet financial instruments
Assets
Cash and balances with treasury banks 0.13% 187,915,671 21,046,667 - - - - - - - - 166,869,004
Balances with other banks 2.98% 41,747,060 5,336,258 12,878,822 10,030,769 1,687,965 - - - - - 11,813,246
Lendings to financial institutions 5.38% 35,346,551 29,363,261 5,566,619 - - - 416,671 - - - -
Investments 7.42% 831,159,100 173,195,257 81,586,245 66,625,745 88,382,723 92,815,461 86,728,060 84,898,418 124,202,115 5,596,807 27,128,269
Advances 7.03%
Performing 741,426,095 211,950,394 333,142,733 176,249,339 5,258,320 3,110,447 1,893,150 2,831,841 2,588,580 4,401,291 -
Non-performing 13,125,627 - - - - - - - - - 13,125,627
Other assets 62,197,076 - - - - - - - - - 62,197,076
1,912,917,180 440,891,837 433,174,419 252,905,853 95,329,008 95,925,908 89,037,881 87,730,259 126,790,695 9,998,098 281,133,222
Liabilities
Bills payable 27,272,967 - - - - - - - - - 27,272,967
Borrowings 5.80% 279,918,125 164,965,261 52,847,517 17,593,671 18,830,189 21,922,744 - - - - 3,758,743
Deposits and other accounts 2.90% 1,448,324,041 586,171,949 69,431,184 74,939,108 37,964,683 24,064,968 15,571,892 24,806,984 18,226,797 - 597,146,476
Liabilities against assets subject to finance lease 12.39% 10,000 10,000 - - - - - - - - -
Subordinated loans 10.16% 9,000,000 - 9,000,000 - - - - - - - -
Other liabilities 28,100,972 - - - - - - - - - 28,100,972
1,792,626,105 751,147,210 131,278,701 92,532,779 56,794,872 45,987,712 15,571,892 24,806,984 18,226,797 - 656,279,158
On-balance sheet gap 120,291,075 (310,255,373) 301,895,718 160,373,074 38,534,136 49,938,196 73,465,989 62,923,275 108,563,898 9,998,098 (375,145,936)
Net non financial assets 48,332,784
Total net assets 168,623,859
Off-balance sheet financial instruments
Interest Rate Derivatives - Long position 1,674,764 - 495,632 1,179,132 - - - - - - -
Interest Rate Derivatives - Short position (1,674,764) - (179,132) (1,179,132) - (316,500) - - - - -
FX Options - Long position 579,876 199,175 352,968 27,733 - - - - - - -
FX Options - Short position (579,876) (199,175) (352,968) (27,733) - - - - - - -
Forward Purchase of Government Securities 13,619,209 - 3,809,411 - - - - - 9,809,798 - -
Forward Sale of Government Securities (2,326,880) - (174,199) - - - - (2,152,681) - - -
Foreign currency forward purchases 347,426,249 196,483,571 104,229,824 46,371,029 341,825 - - - - - -
Foreign currency forward sales (303,150,197) (191,602,320) (71,531,113) (37,095,494) (2,921,270) - - - - - -
Off-balance sheet Gap 55,568,381 4,881,251 36,650,423 9,275,535 (2,579,445) (316,500) - (2,152,681) 9,809,798 - -
Total Yield / Interest Rate Risk Sensitivity Gap 175,859,456 (305,374,122) 338,546,141 169,648,609 35,954,691 49,621,696 73,465,989 60,770,594 118,373,696 9,998,098 (375,145,936)
Cumulative Yield / Interest Rate Risk Sensitivity Gap (305,374,122) 33,172,019 202,820,628 238,775,319 288,397,015 361,863,004 422,633,598 541,007,294 551,005,392 175,859,456
------------------------------------------------------------------------------------------------------------------------- (Rupees in '000) -------------------------------------------------------------------------------------------------------------------------
2018
Effective yield /
interest rateTotal
Exposed to yield / interest rate risk Non-interest
bearing
financial
instruments
78
NOTES TO AND FORMING PART OF THE CONSOLIDATED FINANCIAL STATEMENTS
FOR THE YEAR ENDED DECEMBER 31, 2019
49.3 Operational risk
Operational risk is the risk of loss resulting from inadequate or failed internal processes, people and systems or from external events.
49.4 Liquidity risk
Liquidity risk is the risk that the Bank may be unable to meet its obligations or to fund increases in assets as they fall due without incurring unacceptable cost or losses.
49.4.1 Maturities of assets and liabilities - based on expected maturities of the assets and liabilities of the Group (ALCO)
In compliance with the Regulatory Guidelines, an Operational Risk Division is established within Risk & Credit Policy Group. Operational Risk Division is primarily responsible for the
oversight of operational risk management across the Bank. The operational risk management framework of the Bank is governed by the Operational Risk Management Policy and
Procedures, while the implementation is supported by an operational risk management system and designated operational risk coordinators within different units across the bank. The
framework is in line with international best practices, flexible enough to implement in stages and permits the overall approach to evolve in response to organizational learning and future
requirements.
In accordance with the Operational Risk policy and framework, a database covering losses, control breaches and near misses is being maintained by the division. Major risk events are
analyzed from the control breach perspective and mitigating controls are assessed on design and operating effectiveness. Quarterly updates on Operational Risk events are being
presented to the Senior Management and Board Risk & Compliance Committee of the Bank. Periodic workshops are conducted for Risk & Control Self-Assessment and key risk
exposures are identified and assessed against existing controls to evaluate improvement opportunities. Key Risk Indicators are also defined for monitoring of risk exposures. New
products, systems, activities and processes, are subject to comprehensive operational risk assessments, before implementation.
Business Continuity Plans have been implemented across the bank, clearly defining the roles and responsibilities of respective stakeholders, and covering recovery strategy, IT and
structural backups, scenario and impact analyses and testing directives. The outsourcing policy has also been augmented to address risks associated with such arrangements.
The Group’s approach to liquidity management is to ensure, as far as possible, that it will always have sufficient liquidity to meet its liabilities when due, under both normal and stressed
conditions, without incurring unacceptable losses or risking sustained damage to business franchises. A centralized approach is adopted, based on an integrated framework
incorporating an assessment of all material known and expected cash flows and the availability of collateral which could be used to secure additional funding if required. The framework
entails careful monitoring and control of the daily liquidity position, and regular liquidity stress testing under a variety of scenarios. These encompass both normal and stressed market
conditions, including general market crises and the possibility that access to markets could be impacted by a stress event affecting some part of the Group’s business.
The Assets and Liabilities Management Committee (ALCO) of the Bank is responsible for the oversight of liquidity management and meets on a monthly basis or more frequently, if
required.
In the current year, an external investigation was conducted which highlighted certain bank accounts with unusual transactions. These accounts have already been closed by the Bank
and necessary action has been taken.
Assets and Liabilities having contractual maturity dates are bucketed as per their respective maturities. The maturity profile of non-contractual deposits and bills payable is estimated
using an Exponentially Weighted Moving Average model based on historical data. The maturity profile of certain non-contractual assets and liabilities which are related to specific assets
and liabilities follows the maturity profile of the underlying asset or liability. The maturity profile of other non-contractual assets and liabilities is expected to follow historical patterns of
behaviour. The methodology and the assumptions used to derive the maturity profile of non-contractual assets and liabilities have been approved by ALCO.
79
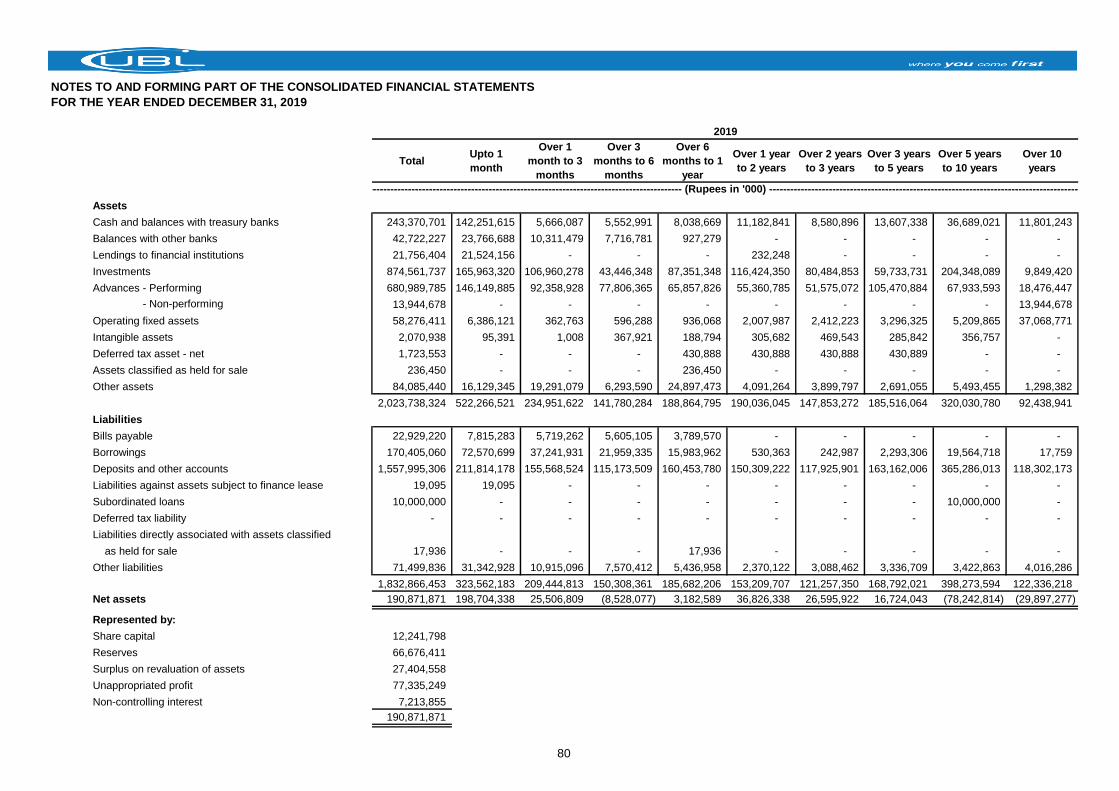
NOTES TO AND FORMING PART OF THE CONSOLIDATED FINANCIAL STATEMENTS
FOR THE YEAR ENDED DECEMBER 31, 2019
TotalUpto 1
month
Over 1
month to 3
months
Over 3
months to 6
months
Over 6
months to 1
year
Over 1 year
to 2 years
Over 2 years
to 3 years
Over 3 years
to 5 years
Over 5 years
to 10 years
Over 10
years
Assets
Cash and balances with treasury banks 243,370,701 142,251,615 5,666,087 5,552,991 8,038,669 11,182,841 8,580,896 13,607,338 36,689,021 11,801,243
Balances with other banks 42,722,227 23,766,688 10,311,479 7,716,781 927,279 - - - - -
Lendings to financial institutions 21,756,404 21,524,156 - - - 232,248 - - - -
Investments 874,561,737 165,963,320 106,960,278 43,446,348 87,351,348 116,424,350 80,484,853 59,733,731 204,348,089 9,849,420
Advances - Performing 680,989,785 146,149,885 92,358,928 77,806,365 65,857,826 55,360,785 51,575,072 105,470,884 67,933,593 18,476,447
Advances - Non-performing 13,944,678 - - - - - - - - 13,944,678
Operating fixed assets 58,276,411 6,386,121 362,763 596,288 936,068 2,007,987 2,412,223 3,296,325 5,209,865 37,068,771
Intangible assets 2,070,938 95,391 1,008 367,921 188,794 305,682 469,543 285,842 356,757 -
Deferred tax asset - net 1,723,553 - - - 430,888 430,888 430,888 430,889 - -
Assets classified as held for sale 236,450 - - - 236,450 - - - - -
Other assets 84,085,440 16,129,345 19,291,079 6,293,590 24,897,473 4,091,264 3,899,797 2,691,055 5,493,455 1,298,382
2,023,738,324 522,266,521 234,951,622 141,780,284 188,864,795 190,036,045 147,853,272 185,516,064 320,030,780 92,438,941
Liabilities
Bills payable 22,929,220 7,815,283 5,719,262 5,605,105 3,789,570 - - - - -
Borrowings 170,405,060 72,570,699 37,241,931 21,959,335 15,983,962 530,363 242,987 2,293,306 19,564,718 17,759
Deposits and other accounts 1,557,995,306 211,814,178 155,568,524 115,173,509 160,453,780 150,309,222 117,925,901 163,162,006 365,286,013 118,302,173
Liabilities against assets subject to finance lease 19,095 19,095 - - - - - - - -
Subordinated loans 10,000,000 - - - - - - - 10,000,000 -
Deferred tax liability - - - - - - - - - -
Liabilities directly associated with assets classified
as held for sale 17,936 - - - 17,936 - - - - -
Other liabilities 71,499,836 31,342,928 10,915,096 7,570,412 5,436,958 2,370,122 3,088,462 3,336,709 3,422,863 4,016,286
1,832,866,453 323,562,183 209,444,813 150,308,361 185,682,206 153,209,707 121,257,350 168,792,021 398,273,594 122,336,218
Net assets 190,871,871 198,704,338 25,506,809 (8,528,077) 3,182,589 36,826,338 26,595,922 16,724,043 (78,242,814) (29,897,277)
Represented by:
Share capital 12,241,798
Reserves 66,676,411
Surplus on revaluation of assets 27,404,558
Unappropriated profit 77,335,249
Non-controlling interest 7,213,855
190,871,871
------------------------------------------------------------------------------------------------------------------ (Rupees in '000) ------------------------------------------------------------------------------------------------------------------
2019
80
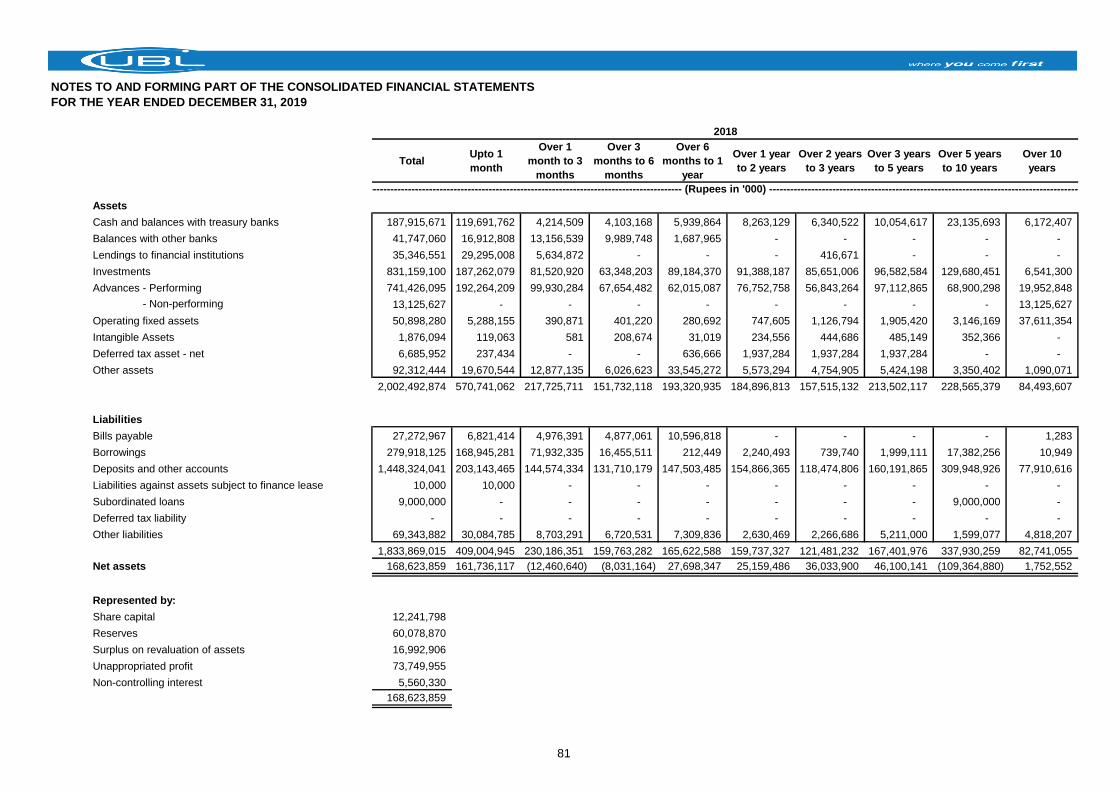
NOTES TO AND FORMING PART OF THE CONSOLIDATED FINANCIAL STATEMENTS
FOR THE YEAR ENDED DECEMBER 31, 2019
TotalUpto 1
month
Over 1
month to 3
months
Over 3
months to 6
months
Over 6
months to 1
year
Over 1 year
to 2 years
Over 2 years
to 3 years
Over 3 years
to 5 years
Over 5 years
to 10 years
Over 10
years
Assets
Cash and balances with treasury banks 187,915,671 119,691,762 4,214,509 4,103,168 5,939,864 8,263,129 6,340,522 10,054,617 23,135,693 6,172,407
Balances with other banks 41,747,060 16,912,808 13,156,539 9,989,748 1,687,965 - - - - -
Lendings to financial institutions 35,346,551 29,295,008 5,634,872 - - - 416,671 - - -
Investments 831,159,100 187,262,079 81,520,920 63,348,203 89,184,370 91,388,187 85,651,006 96,582,584 129,680,451 6,541,300
Advances - Performing 741,426,095 192,264,209 99,930,284 67,654,482 62,015,087 76,752,758 56,843,264 97,112,865 68,900,298 19,952,848
Advances - Non-performing 13,125,627 - - - - - - - - 13,125,627
Operating fixed assets 50,898,280 5,288,155 390,871 401,220 280,692 747,605 1,126,794 1,905,420 3,146,169 37,611,354
Intangible Assets 1,876,094 119,063 581 208,674 31,019 234,556 444,686 485,149 352,366 -
Deferred tax asset - net 6,685,952 237,434 - - 636,666 1,937,284 1,937,284 1,937,284 - -
Other assets 92,312,444 19,670,544 12,877,135 6,026,623 33,545,272 5,573,294 4,754,905 5,424,198 3,350,402 1,090,071
2,002,492,874 570,741,062 217,725,711 151,732,118 193,320,935 184,896,813 157,515,132 213,502,117 228,565,379 84,493,607
Liabilities
Bills payable 27,272,967 6,821,414 4,976,391 4,877,061 10,596,818 - - - - 1,283
Borrowings 279,918,125 168,945,281 71,932,335 16,455,511 212,449 2,240,493 739,740 1,999,111 17,382,256 10,949
Deposits and other accounts 1,448,324,041 203,143,465 144,574,334 131,710,179 147,503,485 154,866,365 118,474,806 160,191,865 309,948,926 77,910,616
Liabilities against assets subject to finance lease 10,000 10,000 - - - - - - - -
Subordinated loans 9,000,000 - - - - - - - 9,000,000 -
Deferred tax liability - - - - - - - - - -
Other liabilities 69,343,882 30,084,785 8,703,291 6,720,531 7,309,836 2,630,469 2,266,686 5,211,000 1,599,077 4,818,207
1,833,869,015 409,004,945 230,186,351 159,763,282 165,622,588 159,737,327 121,481,232 167,401,976 337,930,259 82,741,055
Net assets 168,623,859 161,736,117 (12,460,640) (8,031,164) 27,698,347 25,159,486 36,033,900 46,100,141 (109,364,880) 1,752,552
Represented by:
Share capital 12,241,798
Reserves 60,078,870
Surplus on revaluation of assets 16,992,906
Unappropriated profit 73,749,955
Non-controlling interest 5,560,330
168,623,859
------------------------------------------------------------------------------------------------------------------ (Rupees in '000) ------------------------------------------------------------------------------------------------------------------
2018
81
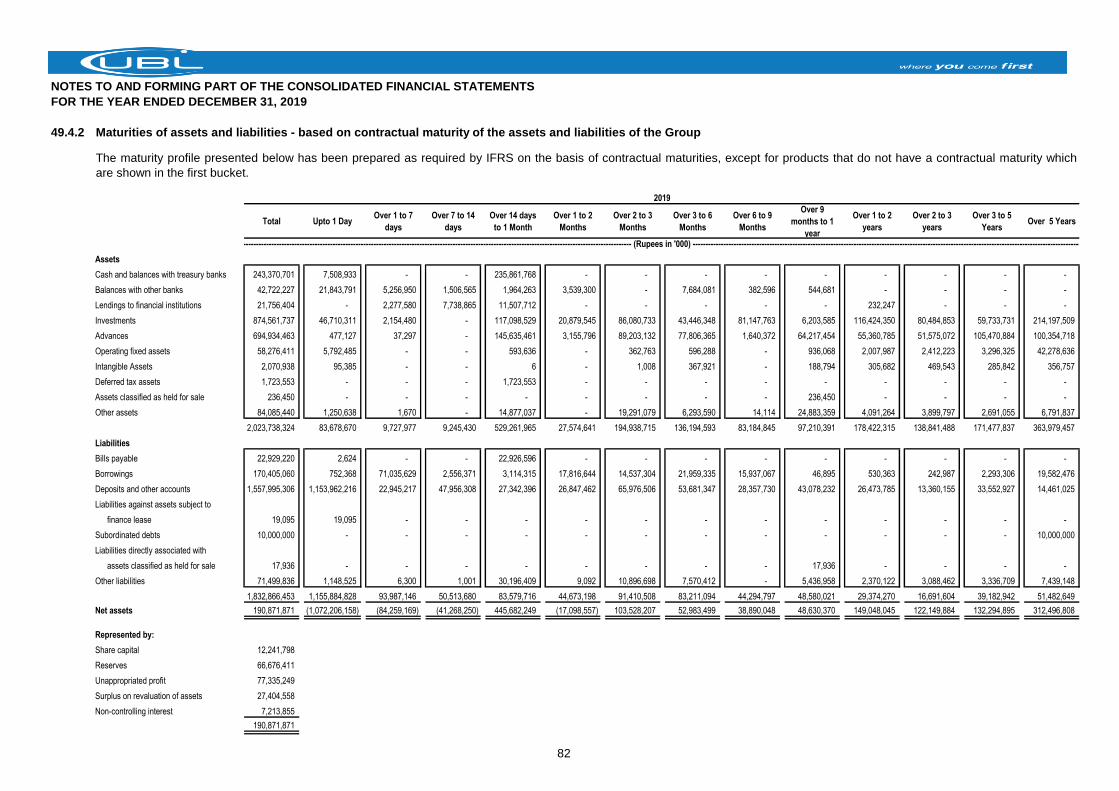
NOTES TO AND FORMING PART OF THE CONSOLIDATED FINANCIAL STATEMENTS
FOR THE YEAR ENDED DECEMBER 31, 2019
49.4.2 Maturities of assets and liabilities - based on contractual maturity of the assets and liabilities of the Group
Total Upto 1 DayOver 1 to 7
days
Over 7 to 14
days
Over 14 days
to 1 Month
Over 1 to 2
Months
Over 2 to 3
Months
Over 3 to 6
Months
Over 6 to 9
Months
Over 9
months to 1
year
Over 1 to 2
years
Over 2 to 3
years
Over 3 to 5
YearsOver 5 Years
Assets
Cash and balances with treasury banks 243,370,701 7,508,933 - - 235,861,768 - - - - - - - - -
Balances with other banks 42,722,227 21,843,791 5,256,950 1,506,565 1,964,263 3,539,300 - 7,684,081 382,596 544,681 - - - -
Lendings to financial institutions 21,756,404 - 2,277,580 7,738,865 11,507,712 - - - - - 232,247 - - -
Investments 874,561,737 46,710,311 2,154,480 - 117,098,529 20,879,545 86,080,733 43,446,348 81,147,763 6,203,585 116,424,350 80,484,853 59,733,731 214,197,509
Advances 694,934,463 477,127 37,297 - 145,635,461 3,155,796 89,203,132 77,806,365 1,640,372 64,217,454 55,360,785 51,575,072 105,470,884 100,354,718
Operating fixed assets 58,276,411 5,792,485 - - 593,636 - 362,763 596,288 - 936,068 2,007,987 2,412,223 3,296,325 42,278,636
Intangible Assets 2,070,938 95,385 - - 6 - 1,008 367,921 - 188,794 305,682 469,543 285,842 356,757
Deferred tax assets 1,723,553 - - - 1,723,553 - - - - - - - - -
Assets classified as held for sale 236,450 - - - - - - - - 236,450 - - - -
Other assets 84,085,440 1,250,638 1,670 - 14,877,037 - 19,291,079 6,293,590 14,114 24,883,359 4,091,264 3,899,797 2,691,055 6,791,837
2,023,738,324 83,678,670 9,727,977 9,245,430 529,261,965 27,574,641 194,938,715 136,194,593 83,184,845 97,210,391 178,422,315 138,841,488 171,477,837 363,979,457
Liabilities
Bills payable 22,929,220 2,624 - - 22,926,596 - - - - - - - - -
Borrowings 170,405,060 752,368 71,035,629 2,556,371 3,114,315 17,816,644 14,537,304 21,959,335 15,937,067 46,895 530,363 242,987 2,293,306 19,582,476
Deposits and other accounts 1,557,995,306 1,153,962,216 22,945,217 47,956,308 27,342,396 26,847,462 65,976,506 53,681,347 28,357,730 43,078,232 26,473,785 13,360,155 33,552,927 14,461,025
Liabilities against assets subject to
finance lease 19,095 19,095 - - - - - - - - - - - -
Subordinated debts 10,000,000 - - - - - - - - - - - - 10,000,000
Liabilities directly associated with
assets classified as held for sale 17,936 - - - - - - - - 17,936 - - - -
Other liabilities 71,499,836 1,148,525 6,300 1,001 30,196,409 9,092 10,896,698 7,570,412 - 5,436,958 2,370,122 3,088,462 3,336,709 7,439,148
1,832,866,453 1,155,884,828 93,987,146 50,513,680 83,579,716 44,673,198 91,410,508 83,211,094 44,294,797 48,580,021 29,374,270 16,691,604 39,182,942 51,482,649
Net assets 190,871,871 (1,072,206,158) (84,259,169) (41,268,250) 445,682,249 (17,098,557) 103,528,207 52,983,499 38,890,048 48,630,370 149,048,045 122,149,884 132,294,895 312,496,808
Represented by:
Share capital 12,241,798
Reserves 66,676,411
Unappropriated profit 77,335,249
Surplus on revaluation of assets 27,404,558
Non-controlling interest 7,213,855
190,871,871
------------------------------------------------------------------------------------------------------------------------------------------------------------------- (Rupees in '000) -------------------------------------------------------------------------------------------------------------------------------------------------------------------
2019
The maturity profile presented below has been prepared as required by IFRS on the basis of contractual maturities, except for products that do not have a contractual maturity which
are shown in the first bucket.
82
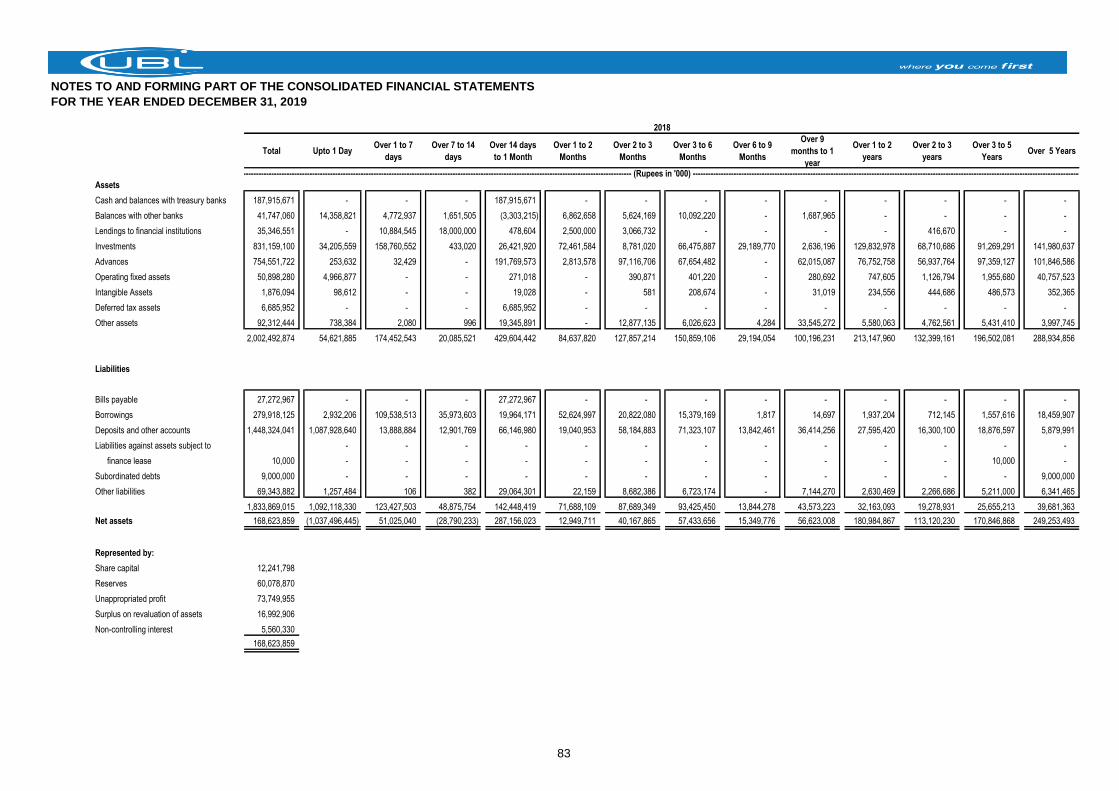
NOTES TO AND FORMING PART OF THE CONSOLIDATED FINANCIAL STATEMENTS
FOR THE YEAR ENDED DECEMBER 31, 2019
Total Upto 1 DayOver 1 to 7
days
Over 7 to 14
days
Over 14 days
to 1 Month
Over 1 to 2
Months
Over 2 to 3
Months
Over 3 to 6
Months
Over 6 to 9
Months
Over 9
months to 1
year
Over 1 to 2
years
Over 2 to 3
years
Over 3 to 5
YearsOver 5 Years
Assets
Cash and balances with treasury banks 187,915,671 - - - 187,915,671 - - - - - - - - -
Balances with other banks 41,747,060 14,358,821 4,772,937 1,651,505 (3,303,215) 6,862,658 5,624,169 10,092,220 - 1,687,965 - - - -
Lendings to financial institutions 35,346,551 - 10,884,545 18,000,000 478,604 2,500,000 3,066,732 - - - - 416,670 - -
Investments 831,159,100 34,205,559 158,760,552 433,020 26,421,920 72,461,584 8,781,020 66,475,887 29,189,770 2,636,196 129,832,978 68,710,686 91,269,291 141,980,637
Advances 754,551,722 253,632 32,429 - 191,769,573 2,813,578 97,116,706 67,654,482 - 62,015,087 76,752,758 56,937,764 97,359,127 101,846,586
Operating fixed assets 50,898,280 4,966,877 - - 271,018 - 390,871 401,220 - 280,692 747,605 1,126,794 1,955,680 40,757,523
Intangible Assets 1,876,094 98,612 - - 19,028 - 581 208,674 - 31,019 234,556 444,686 486,573 352,365
Deferred tax assets 6,685,952 - - - 6,685,952 - - - - - - - - -
Other assets 92,312,444 738,384 2,080 996 19,345,891 - 12,877,135 6,026,623 4,284 33,545,272 5,580,063 4,762,561 5,431,410 3,997,745
2,002,492,874 54,621,885 174,452,543 20,085,521 429,604,442 84,637,820 127,857,214 150,859,106 29,194,054 100,196,231 213,147,960 132,399,161 196,502,081 288,934,856
Liabilities
Bills payable 27,272,967 - - - 27,272,967 - - - - - - - - -
Borrowings 279,918,125 2,932,206 109,538,513 35,973,603 19,964,171 52,624,997 20,822,080 15,379,169 1,817 14,697 1,937,204 712,145 1,557,616 18,459,907
Deposits and other accounts 1,448,324,041 1,087,928,640 13,888,884 12,901,769 66,146,980 19,040,953 58,184,883 71,323,107 13,842,461 36,414,256 27,595,420 16,300,100 18,876,597 5,879,991
Liabilities against assets subject to - - - - - - - - - - - - -
finance lease 10,000 - - - - - - - - - - - 10,000 -
Subordinated debts 9,000,000 - - - - - - - - - - - - 9,000,000
Other liabilities 69,343,882 1,257,484 106 382 29,064,301 22,159 8,682,386 6,723,174 - 7,144,270 2,630,469 2,266,686 5,211,000 6,341,465
1,833,869,015 1,092,118,330 123,427,503 48,875,754 142,448,419 71,688,109 87,689,349 93,425,450 13,844,278 43,573,223 32,163,093 19,278,931 25,655,213 39,681,363
Net assets 168,623,859 (1,037,496,445) 51,025,040 (28,790,233) 287,156,023 12,949,711 40,167,865 57,433,656 15,349,776 56,623,008 180,984,867 113,120,230 170,846,868 249,253,493
Represented by:
Share capital 12,241,798
Reserves 60,078,870
Unappropriated profit 73,749,955
Surplus on revaluation of assets 16,992,906
Non-controlling interest 5,560,330
168,623,859
2018
------------------------------------------------------------------------------------------------------------------------------------------------------------------- (Rupees in '000) -------------------------------------------------------------------------------------------------------------------------------------------------------------------
83
NOTES TO AND FORMING PART OF THE CONSOLIDATED FINANCIAL STATEMENTS
FOR THE YEAR ENDED DECEMBER 31, 2019
50. NON-ADJUSTING EVENT AFTER THE BALANCE SHEET DATE
50.1
51. GENERAL
51.1
51.2 Figures have been rounded off to the nearest thousand rupees unless otherwise stated.
52. DATE OF AUTHORIZATION
Aameer Karachiwalla Sima Kamil Amar Zafar Khan Arshad Ahmad Mir Sir Mohammed Anwar Pervez, OBE, HPk
Chief Financial Officer President & Director Director Chairman
Chief Executive Officer
These consolidated financial statements were authorized for issue on February 19, 2020 by the Board of Directors of the
Bank.
The Board of Directors in its meeting held on February 19, 2020 has proposed a cash dividend in respect of 2019 of Rs. 4
per share (2018: Rs. 3 per share). In addition, the Directors have also announced a bonus issue of Nil (2018: Nil). These
appropriations will be approved in the forthcoming Annual General Meeting. The consolidated financial statements for the
year ended December 31, 2019 do not include the effect of these appropriations which will be accounted for in the
consolidated financial statements for the year ending December 31, 2020.
Comparative Information has been reclassified, rearranged or additionally incorporated in these consolidated financial
statements for the purposes of better presentation.
85
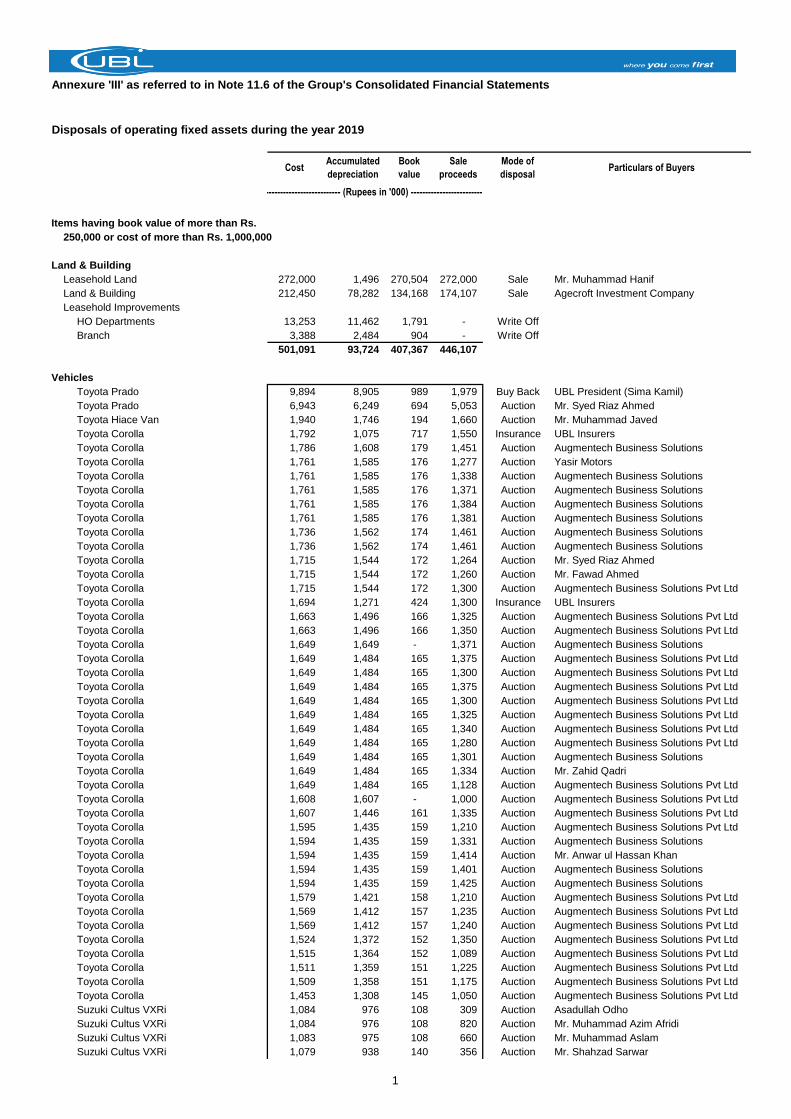
Annexure 'III' as referred to in Note 11.6 of the Group's Consolidated Financial Statements
Disposals of operating fixed assets during the year 2019
Items having book value of more than Rs.
250,000 or cost of more than Rs. 1,000,000
Land & Building
Leasehold Land 272,000 1,496 270,504 272,000 Sale Mr. Muhammad Hanif
Land & Building 212,450 78,282 134,168 174,107 Sale Agecroft Investment Company
Leasehold Improvements
HO Departments 13,253 11,462 1,791 - Write Off
Branch 3,388 2,484 904 - Write Off
501,091 93,724 407,367 446,107
Vehicles
Toyota Prado 9,894 8,905 989 1,979 Buy Back UBL President (Sima Kamil)
Toyota Prado 6,943 6,249 694 5,053 Auction Mr. Syed Riaz Ahmed
Toyota Hiace Van 1,940 1,746 194 1,660 Auction Mr. Muhammad Javed
Toyota Corolla 1,792 1,075 717 1,550 Insurance UBL Insurers
Toyota Corolla 1,786 1,608 179 1,451 Auction Augmentech Business Solutions
Toyota Corolla 1,761 1,585 176 1,277 Auction Yasir Motors
Toyota Corolla 1,761 1,585 176 1,338 Auction Augmentech Business Solutions
Toyota Corolla 1,761 1,585 176 1,371 Auction Augmentech Business Solutions
Toyota Corolla 1,761 1,585 176 1,384 Auction Augmentech Business Solutions
Toyota Corolla 1,761 1,585 176 1,381 Auction Augmentech Business Solutions
Toyota Corolla 1,736 1,562 174 1,461 Auction Augmentech Business Solutions
Toyota Corolla 1,736 1,562 174 1,461 Auction Augmentech Business Solutions
Toyota Corolla 1,715 1,544 172 1,264 Auction Mr. Syed Riaz Ahmed
Toyota Corolla 1,715 1,544 172 1,260 Auction Mr. Fawad Ahmed
Toyota Corolla 1,715 1,544 172 1,300 Auction Augmentech Business Solutions Pvt Ltd
Toyota Corolla 1,694 1,271 424 1,300 Insurance UBL Insurers
Toyota Corolla 1,663 1,496 166 1,325 Auction Augmentech Business Solutions Pvt Ltd
Toyota Corolla 1,663 1,496 166 1,350 Auction Augmentech Business Solutions Pvt Ltd
Toyota Corolla 1,649 1,649 - 1,371 Auction Augmentech Business Solutions
Toyota Corolla 1,649 1,484 165 1,375 Auction Augmentech Business Solutions Pvt Ltd
Toyota Corolla 1,649 1,484 165 1,300 Auction Augmentech Business Solutions Pvt Ltd
Toyota Corolla 1,649 1,484 165 1,375 Auction Augmentech Business Solutions Pvt Ltd
Toyota Corolla 1,649 1,484 165 1,300 Auction Augmentech Business Solutions Pvt Ltd
Toyota Corolla 1,649 1,484 165 1,325 Auction Augmentech Business Solutions Pvt Ltd
Toyota Corolla 1,649 1,484 165 1,340 Auction Augmentech Business Solutions Pvt Ltd
Toyota Corolla 1,649 1,484 165 1,280 Auction Augmentech Business Solutions Pvt Ltd
Toyota Corolla 1,649 1,484 165 1,301 Auction Augmentech Business Solutions
Toyota Corolla 1,649 1,484 165 1,334 Auction Mr. Zahid Qadri
Toyota Corolla 1,649 1,484 165 1,128 Auction Augmentech Business Solutions Pvt Ltd
Toyota Corolla 1,608 1,607 - 1,000 Auction Augmentech Business Solutions Pvt Ltd
Toyota Corolla 1,607 1,446 161 1,335 Auction Augmentech Business Solutions Pvt Ltd
Toyota Corolla 1,595 1,435 159 1,210 Auction Augmentech Business Solutions Pvt Ltd
Toyota Corolla 1,594 1,435 159 1,331 Auction Augmentech Business Solutions
Toyota Corolla 1,594 1,435 159 1,414 Auction Mr. Anwar ul Hassan Khan
Toyota Corolla 1,594 1,435 159 1,401 Auction Augmentech Business Solutions
Toyota Corolla 1,594 1,435 159 1,425 Auction Augmentech Business Solutions
Toyota Corolla 1,579 1,421 158 1,210 Auction Augmentech Business Solutions Pvt Ltd
Toyota Corolla 1,569 1,412 157 1,235 Auction Augmentech Business Solutions Pvt Ltd
Toyota Corolla 1,569 1,412 157 1,240 Auction Augmentech Business Solutions Pvt Ltd
Toyota Corolla 1,524 1,372 152 1,350 Auction Augmentech Business Solutions Pvt Ltd
Toyota Corolla 1,515 1,364 152 1,089 Auction Augmentech Business Solutions Pvt Ltd
Toyota Corolla 1,511 1,359 151 1,225 Auction Augmentech Business Solutions Pvt Ltd
Toyota Corolla 1,509 1,358 151 1,175 Auction Augmentech Business Solutions Pvt Ltd
Toyota Corolla 1,453 1,308 145 1,050 Auction Augmentech Business Solutions Pvt Ltd
Suzuki Cultus VXRi 1,084 976 108 309 Auction Asadullah Odho
Suzuki Cultus VXRi 1,084 976 108 820 Auction Mr. Muhammad Azim Afridi
Suzuki Cultus VXRi 1,083 975 108 660 Auction Mr. Muhammad Aslam
Suzuki Cultus VXRi 1,079 938 140 356 Auction Mr. Shahzad Sarwar
------------------------------------ (Rupees in '000) ------------------------------------
CostAccumulated
depreciation
Book
value
Sale
proceeds
Mode of
disposalParticulars of Buyers
1
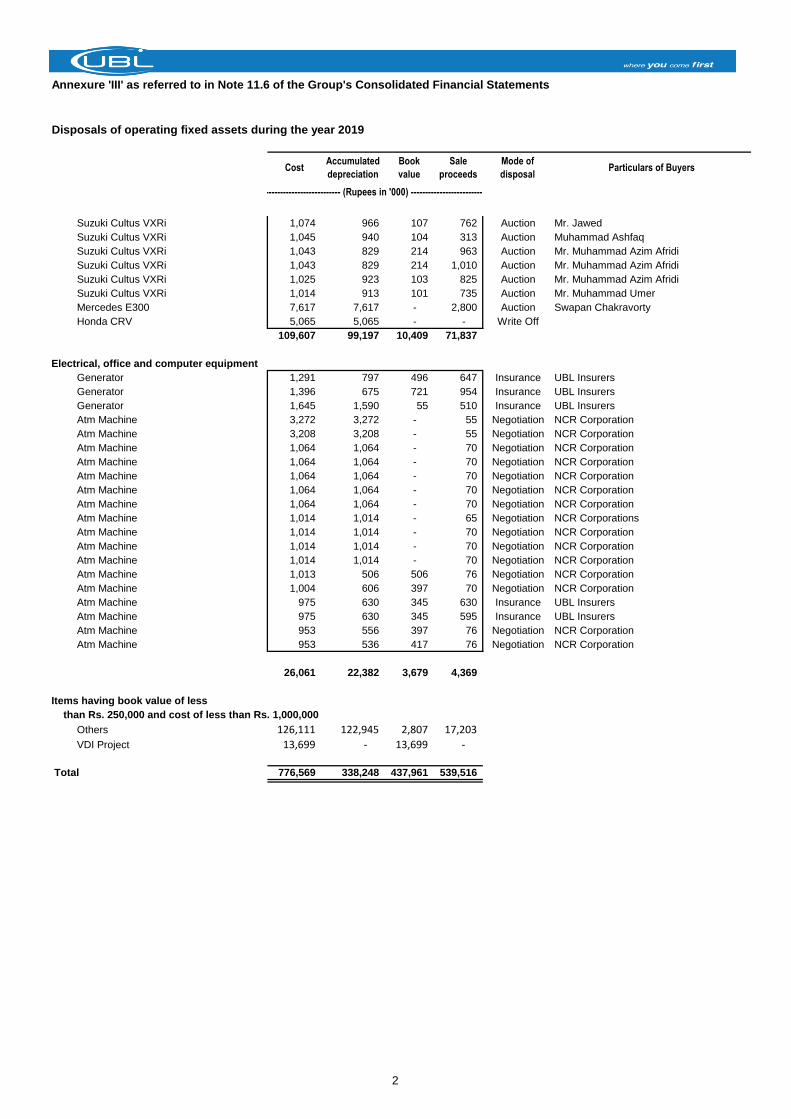
Annexure 'III' as referred to in Note 11.6 of the Group's Consolidated Financial Statements
Disposals of operating fixed assets during the year 2019
------------------------------------ (Rupees in '000) ------------------------------------
CostAccumulated
depreciation
Book
value
Sale
proceeds
Mode of
disposalParticulars of Buyers
Suzuki Cultus VXRi 1,074 966 107 762 Auction Mr. Jawed
Suzuki Cultus VXRi 1,045 940 104 313 Auction Muhammad Ashfaq
Suzuki Cultus VXRi 1,043 829 214 963 Auction Mr. Muhammad Azim Afridi
Suzuki Cultus VXRi 1,043 829 214 1,010 Auction Mr. Muhammad Azim Afridi
Suzuki Cultus VXRi 1,025 923 103 825 Auction Mr. Muhammad Azim Afridi
Suzuki Cultus VXRi 1,014 913 101 735 Auction Mr. Muhammad Umer
Mercedes E300 7,617 7,617 - 2,800 Auction Swapan Chakravorty
Honda CRV 5,065 5,065 - - Write Off
109,607 99,197 10,409 71,837
Electrical, office and computer equipment
Generator 1,291 797 496 647 Insurance UBL Insurers
Generator 1,396 675 721 954 Insurance UBL Insurers
Generator 1,645 1,590 55 510 Insurance UBL Insurers
Atm Machine 3,272 3,272 - 55 Negotiation NCR Corporation
Atm Machine 3,208 3,208 - 55 Negotiation NCR Corporation
Atm Machine 1,064 1,064 - 70 Negotiation NCR Corporation
Atm Machine 1,064 1,064 - 70 Negotiation NCR Corporation
Atm Machine 1,064 1,064 - 70 Negotiation NCR Corporation
Atm Machine 1,064 1,064 - 70 Negotiation NCR Corporation
Atm Machine 1,064 1,064 - 70 Negotiation NCR Corporation
Atm Machine 1,014 1,014 - 65 Negotiation NCR Corporations
Atm Machine 1,014 1,014 - 70 Negotiation NCR Corporation
Atm Machine 1,014 1,014 - 70 Negotiation NCR Corporation
Atm Machine 1,014 1,014 - 70 Negotiation NCR Corporation
Atm Machine 1,013 506 506 76 Negotiation NCR Corporation
Atm Machine 1,004 606 397 70 Negotiation NCR Corporation
Atm Machine 975 630 345 630 Insurance UBL Insurers
Atm Machine 975 630 345 595 Insurance UBL Insurers
Atm Machine 953 556 397 76 Negotiation NCR Corporation
Atm Machine 953 536 417 76 Negotiation NCR Corporation
26,061 22,382 3,679 4,369
Items having book value of less
than Rs. 250,000 and cost of less than Rs. 1,000,000
Others 126,111 122,945 2,807 17,203
VDI Project 13,699 - 13,699 -
Total 776,569 338,248 437,961 539,516
2