Embed Size (px)
Citation preview
United Bank LimitedCONSOLIDATED FINANCIAL STATEMENTS
AS AT DECEMBER 31, 2017
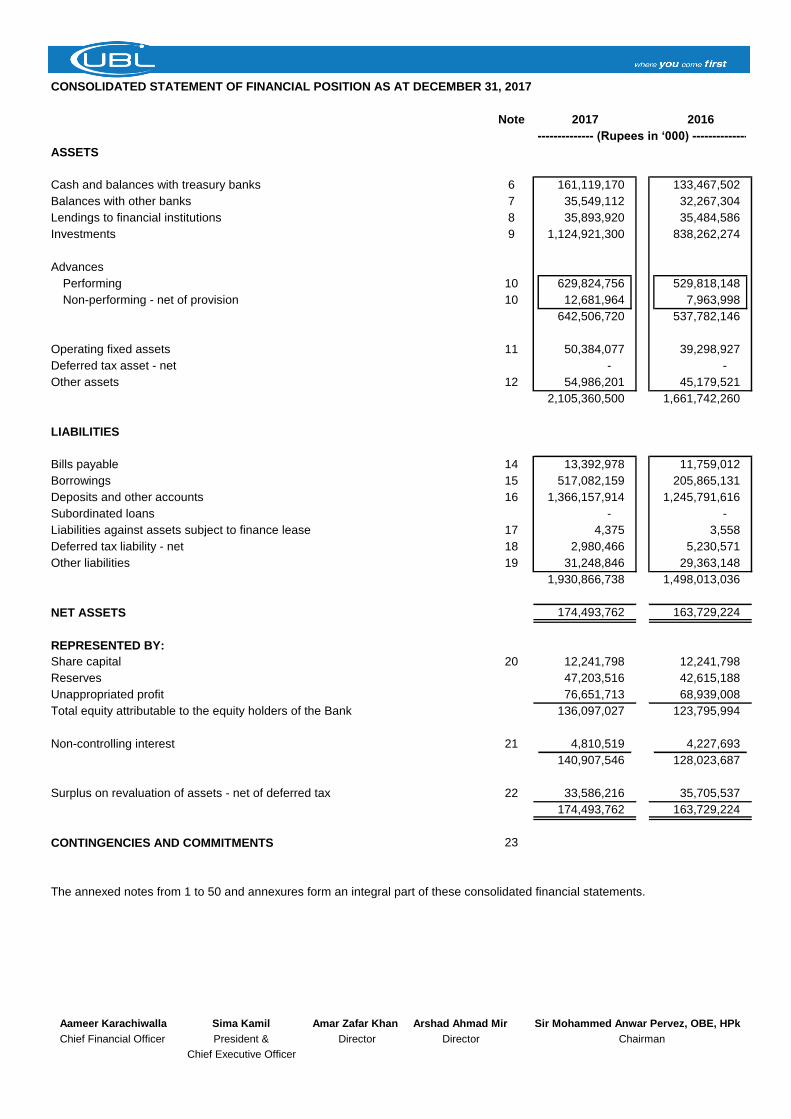
CONSOLIDATED STATEMENT OF FINANCIAL POSITION AS AT DECEMBER 31, 2017
Note 2017 2016
ASSETS
Cash and balances with treasury banks 6 161,119,170 133,467,502
Balances with other banks 7 35,549,112 32,267,304
Lendings to financial institutions 8 35,893,920 35,484,586
Investments 9 1,124,921,300 838,262,274
Advances
Performing 10 629,824,756 529,818,148
Non-performing - net of provision 10 12,681,964 7,963,998
642,506,720 537,782,146
Operating fixed assets 11 50,384,077 39,298,927
Deferred tax asset - net - -
Other assets 12 54,986,201 45,179,521
2,105,360,500 1,661,742,260
LIABILITIES
Bills payable 14 13,392,978 11,759,012
Borrowings 15 517,082,159 205,865,131
Deposits and other accounts 16 1,366,157,914 1,245,791,616
Subordinated loans - -
Liabilities against assets subject to finance lease 17 4,375 3,558
Deferred tax liability - net 18 2,980,466 5,230,571
Other liabilities 19 31,248,846 29,363,148
1,930,866,738 1,498,013,036
NET ASSETS 174,493,762 163,729,224
REPRESENTED BY:
Share capital 20 12,241,798 12,241,798
Reserves 47,203,516 42,615,188
Unappropriated profit 76,651,713 68,939,008
Total equity attributable to the equity holders of the Bank 136,097,027 123,795,994
Non-controlling interest 21 4,810,519 4,227,693
140,907,546 128,023,687
Surplus on revaluation of assets - net of deferred tax 22 33,586,216 35,705,537
174,493,762 163,729,224
CONTINGENCIES AND COMMITMENTS 23
The annexed notes from 1 to 50 and annexures form an integral part of these consolidated financial statements.
Aameer Karachiwalla Sima Kamil Amar Zafar Khan Arshad Ahmad Mir Sir Mohammed Anwar Pervez, OBE, HPk
Chief Financial Officer President & Director Director Chairman
Chief Executive Officer
------------------ (Rupees in ‘000) ------------------
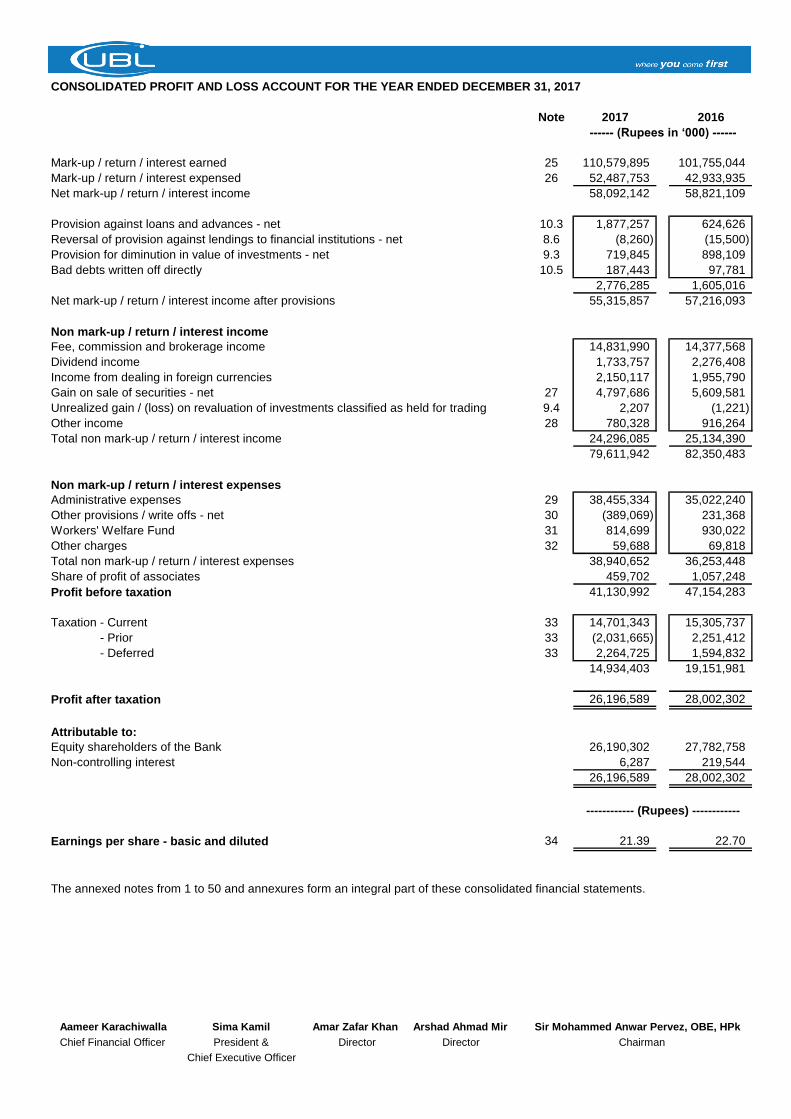
CONSOLIDATED PROFIT AND LOSS ACCOUNT FOR THE YEAR ENDED DECEMBER 31, 2017
Note 2017 2016
Mark-up / return / interest earned 25 110,579,895 101,755,044
Mark-up / return / interest expensed 26 52,487,753 42,933,935
Net mark-up / return / interest income 58,092,142 58,821,109
Provision against loans and advances - net 10.3 1,877,257 624,626
Reversal of provision against lendings to financial institutions - net 8.6 (8,260) (15,500)
Provision for diminution in value of investments - net 9.3 719,845 898,109
Bad debts written off directly 10.5 187,443 97,781
2,776,285 1,605,016
Net mark-up / return / interest income after provisions 55,315,857 57,216,093
Non mark-up / return / interest income
Fee, commission and brokerage income 14,831,990 14,377,568
Dividend income 1,733,757 2,276,408
Income from dealing in foreign currencies 2,150,117 1,955,790
Gain on sale of securities - net 27 4,797,686 5,609,581
Unrealized gain / (loss) on revaluation of investments classified as held for trading 9.4 2,207 (1,221)
Other income 28 780,328 916,264
Total non mark-up / return / interest income 24,296,085 25,134,390
79,611,942 82,350,483
Non mark-up / return / interest expenses
Administrative expenses 29 38,455,334 35,022,240
Other provisions / write offs - net 30 (389,069) 231,368
Workers' Welfare Fund 31 814,699 930,022
Other charges 32 59,688 69,818
Total non mark-up / return / interest expenses 38,940,652 36,253,448
Share of profit of associates 459,702 1,057,248
Profit before taxation 41,130,992 47,154,283
Taxation - Current 33 14,701,343 15,305,737
Taxation - Prior 33 (2,031,665) 2,251,412
Taxation - Deferred 33 2,264,725 1,594,832
14,934,403 19,151,981
Profit after taxation 26,196,589 28,002,302
Attributable to:
Equity shareholders of the Bank 26,190,302 27,782,758
Non-controlling interest 6,287 219,544
26,196,589 28,002,302
Earnings per share - basic and diluted 34 21.39 22.70
The annexed notes from 1 to 50 and annexures form an integral part of these consolidated financial statements.
Aameer Karachiwalla Sima Kamil Amar Zafar Khan Arshad Ahmad Mir Sir Mohammed Anwar Pervez, OBE, HPk
Chief Financial Officer President & Director Director Chairman
Chief Executive Officer
------------ (Rupees) ------------
------ (Rupees in ‘000) ------
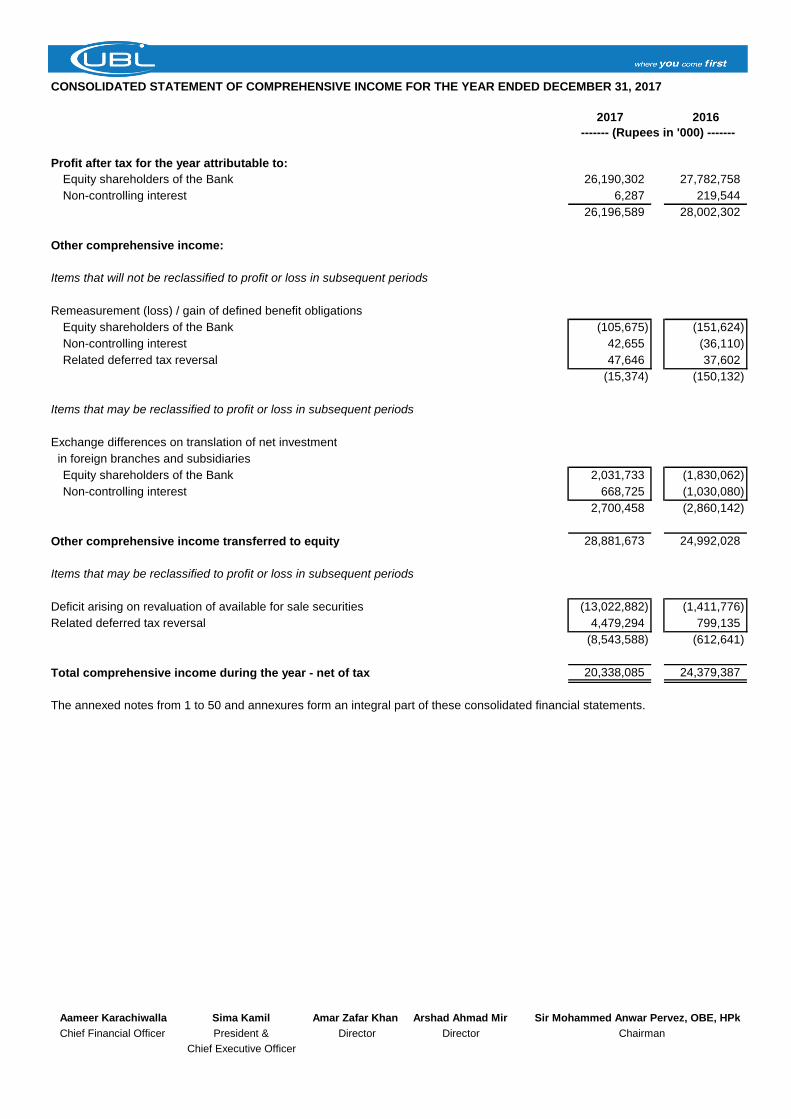
CONSOLIDATED STATEMENT OF COMPREHENSIVE INCOME FOR THE YEAR ENDED DECEMBER 31, 2017
2017 2016
Profit after tax for the year attributable to:
Equity shareholders of the Bank 26,190,302 27,782,758
Non-controlling interest 6,287 219,544
26,196,589 28,002,302
Other comprehensive income:
Items that will not be reclassified to profit or loss in subsequent periods
Remeasurement (loss) / gain of defined benefit obligations
Equity shareholders of the Bank (105,675) (151,624)
Non-controlling interest 42,655 (36,110)
Related deferred tax reversal 47,646 37,602
(15,374) (150,132)
Items that may be reclassified to profit or loss in subsequent periods
Exchange differences on translation of net investment
in foreign branches and subsidiaries
Equity shareholders of the Bank 2,031,733 (1,830,062)
Non-controlling interest 668,725 (1,030,080)
2,700,458 (2,860,142)
Other comprehensive income transferred to equity 28,881,673 24,992,028
Items that may be reclassified to profit or loss in subsequent periods
Deficit arising on revaluation of available for sale securities (13,022,882) (1,411,776)
Related deferred tax reversal 4,479,294 799,135
(8,543,588) (612,641)
Total comprehensive income during the year - net of tax 20,338,085 24,379,387
The annexed notes from 1 to 50 and annexures form an integral part of these consolidated financial statements.
Aameer Karachiwalla Sima Kamil Amar Zafar Khan Arshad Ahmad Mir Sir Mohammed Anwar Pervez, OBE, HPk
Chief Financial Officer President & Director Director Chairman
Chief Executive Officer
------- (Rupees in '000) -------
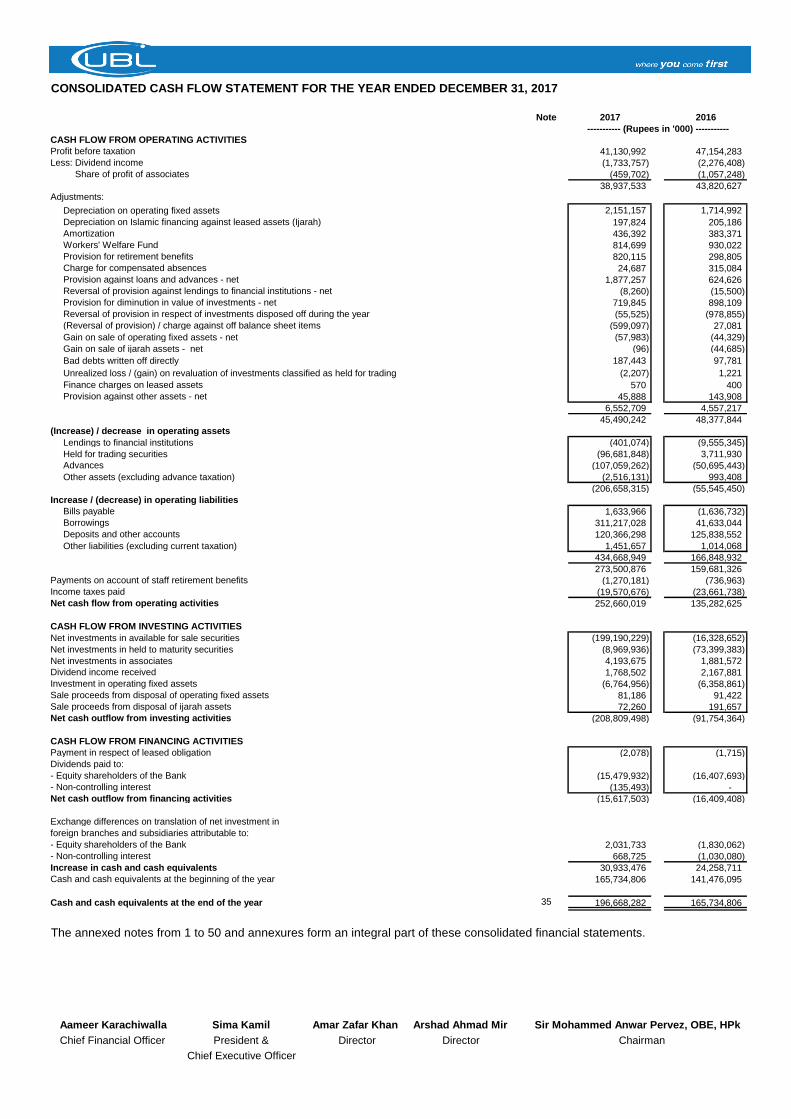
CONSOLIDATED CASH FLOW STATEMENT FOR THE YEAR ENDED DECEMBER 31, 2017
Note 2017 2016
CASH FLOW FROM OPERATING ACTIVITIES
Profit before taxation 41,130,992 47,154,283
Less: Dividend income (1,733,757) (2,276,408)
Less: Share of profit of associates (459,702) (1,057,248)
38,937,533 43,820,627 Adjustments:
Depreciation on operating fixed assets 2,151,157 1,714,992
Depreciation on Islamic financing against leased assets (Ijarah) 197,824 205,186
Amortization 436,392 383,371
Workers' Welfare Fund 814,699 930,022
Provision for retirement benefits 820,115 298,805
Charge for compensated absences 24,687 315,084
Provision against loans and advances - net 1,877,257 624,626
Reversal of provision against lendings to financial institutions - net (8,260) (15,500)
Provision for diminution in value of investments - net 719,845 898,109
Reversal of provision in respect of investments disposed off during the year (55,525) (978,855)
(Reversal of provision) / charge against off balance sheet items (599,097) 27,081
Gain on sale of operating fixed assets - net (57,983) (44,329)
Gain on sale of ijarah assets - net (96) (44,685)
Bad debts written off directly 187,443 97,781
Unrealized loss / (gain) on revaluation of investments classified as held for trading (2,207) 1,221
Finance charges on leased assets 570 400
Provision against other assets - net 45,888 143,908
6,552,709 4,557,217
45,490,242 48,377,844
(Increase) / decrease in operating assets
Lendings to financial institutions (401,074) (9,555,345)
Held for trading securities (96,681,848) 3,711,930
Advances (107,059,262) (50,695,443)
Other assets (excluding advance taxation) (2,516,131) 993,408
(206,658,315) (55,545,450)
Increase / (decrease) in operating liabilities
Bills payable 1,633,966 (1,636,732)
Borrowings 311,217,028 41,633,044
Deposits and other accounts 120,366,298 125,838,552
Other liabilities (excluding current taxation) 1,451,657 1,014,068
434,668,949 166,848,932
273,500,876 159,681,326
Payments on account of staff retirement benefits (1,270,181) (736,963)
Income taxes paid (19,570,676) (23,661,738)
Net cash flow from operating activities 252,660,019 135,282,625
CASH FLOW FROM INVESTING ACTIVITIES
Net investments in available for sale securities (199,190,229) (16,328,652)
Net investments in held to maturity securities (8,969,936) (73,399,383)
Net investments in associates 4,193,675 1,881,572
Dividend income received 1,768,502 2,167,881
Investment in operating fixed assets (6,764,956) (6,358,861)
Sale proceeds from disposal of operating fixed assets 81,186 91,422
Sale proceeds from disposal of ijarah assets 72,260 191,657
Net cash outflow from investing activities (208,809,498) (91,754,364)
CASH FLOW FROM FINANCING ACTIVITIES
Payment in respect of leased obligation (2,078) (1,715)
Dividends paid to:
- Equity shareholders of the Bank (15,479,932) (16,407,693)
- Non-controlling interest (135,493) -
Net cash outflow from financing activities (15,617,503) (16,409,408)
Exchange differences on translation of net investment in
foreign branches and subsidiaries attributable to:
- Equity shareholders of the Bank 2,031,733 (1,830,062)
- Non-controlling interest 668,725 (1,030,080)
Increase in cash and cash equivalents 30,933,476 24,258,711
Cash and cash equivalents at the beginning of the year 165,734,806 141,476,095
Cash and cash equivalents at the end of the year 35 196,668,282 165,734,806
The annexed notes from 1 to 50 and annexures form an integral part of these consolidated financial statements.
Aameer Karachiwalla Sima Kamil Amar Zafar Khan Arshad Ahmad Mir Sir Mohammed Anwar Pervez, OBE, HPk
Chief Financial Officer President & Director Director Chairman
Chief Executive Officer
----------- (Rupees in '000) -----------
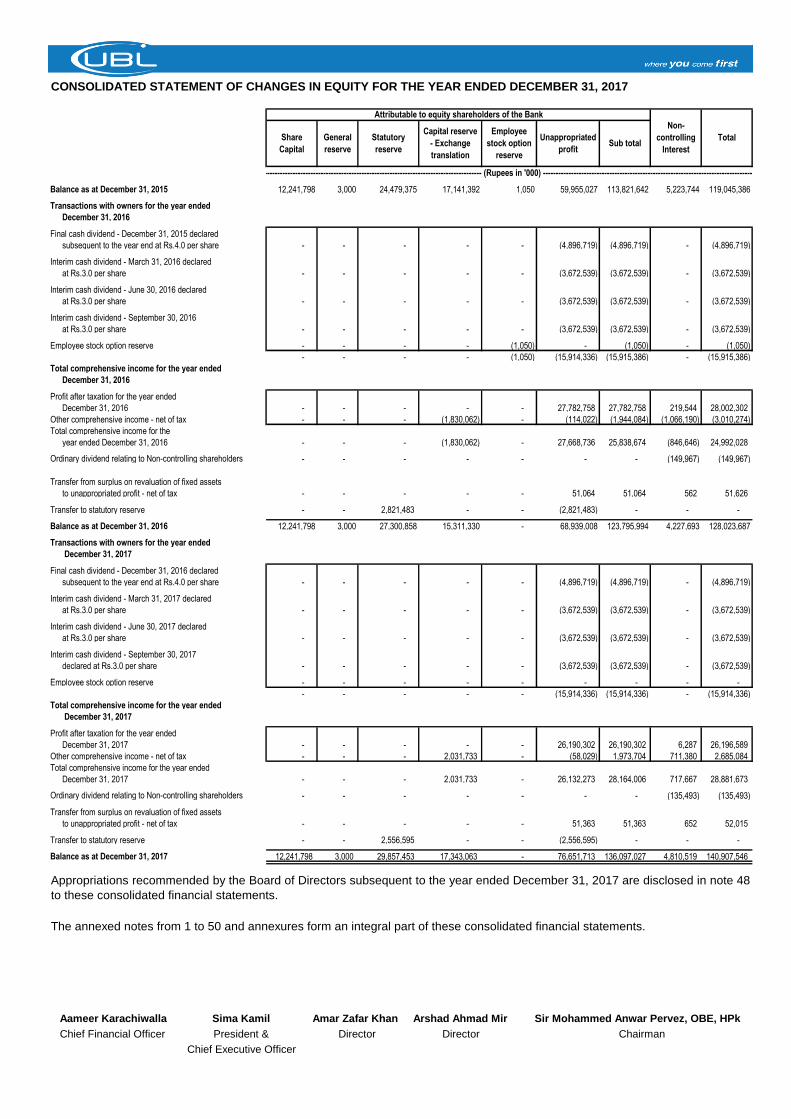
CONSOLIDATED STATEMENT OF CHANGES IN EQUITY FOR THE YEAR ENDED DECEMBER 31, 2017
Balance as at December 31, 2015 12,241,798 3,000 24,479,375 17,141,392 1,050 59,955,027 113,821,642 5,223,744 119,045,386
Transactions with owners for the year ended
December 31, 2016
Final cash dividend - December 31, 2015 declared
subsequent to the year end at Rs.4.0 per share - - - - - (4,896,719) (4,896,719) - (4,896,719)
Interim cash dividend - March 31, 2016 declared
at Rs.3.0 per share - - - - - (3,672,539) (3,672,539) - (3,672,539)
Interim cash dividend - June 30, 2016 declared
at Rs.3.0 per share - - - - - (3,672,539) (3,672,539) - (3,672,539)
Interim cash dividend - September 30, 2016
at Rs.3.0 per share - - - - - (3,672,539) (3,672,539) - (3,672,539)
Employee stock option reserve - - - - (1,050) - (1,050) - (1,050)
- - - - (1,050) (15,914,336) (15,915,386) - (15,915,386)
Total comprehensive income for the year ended
December 31, 2016
Profit after taxation for the year ended
December 31, 2016 - - - - - 27,782,758 27,782,758 219,544 28,002,302
Other comprehensive income - net of tax - - - (1,830,062) - (114,022) (1,944,084) (1,066,190) (3,010,274)
Total comprehensive income for the
year ended December 31, 2016 - - - (1,830,062) - 27,668,736 25,838,674 (846,646) 24,992,028
Ordinary dividend relating to Non-controlling shareholders - - - - - - - (149,967) (149,967)
Transfer from surplus on revaluation of fixed assets
to unappropriated profit - net of tax - - - - - 51,064 51,064 562 51,626
Transfer to statutory reserve - - 2,821,483 - - (2,821,483) - - -
Balance as at December 31, 2016 12,241,798 3,000 27,300,858 15,311,330 - 68,939,008 123,795,994 4,227,693 128,023,687
Transactions with owners for the year ended
December 31, 2017
Final cash dividend - December 31, 2016 declared
subsequent to the year end at Rs.4.0 per share - - - - - (4,896,719) (4,896,719) - (4,896,719)
Interim cash dividend - March 31, 2017 declared
at Rs.3.0 per share - - - - - (3,672,539) (3,672,539) - (3,672,539)
Interim cash dividend - June 30, 2017 declared
at Rs.3.0 per share - - - - - (3,672,539) (3,672,539) - (3,672,539)
Interim cash dividend - September 30, 2017
declared at Rs.3.0 per share - - - - - (3,672,539) (3,672,539) - (3,672,539)
Employee stock option reserve - - - - - - - - -
- - - - - (15,914,336) (15,914,336) - (15,914,336)
Total comprehensive income for the year ended
December 31, 2017
Profit after taxation for the year ended
December 31, 2017 - - - - - 26,190,302 26,190,302 6,287 26,196,589
Other comprehensive income - net of tax - - - 2,031,733 - (58,029) 1,973,704 711,380 2,685,084
Total comprehensive income for the year ended
December 31, 2017 - - - 2,031,733 - 26,132,273 28,164,006 717,667 28,881,673
Ordinary dividend relating to Non-controlling shareholders - - - - - - - (135,493) (135,493)
Transfer from surplus on revaluation of fixed assets
to unappropriated profit - net of tax - - - - - 51,363 51,363 652 52,015
Transfer to statutory reserve - - 2,556,595 - - (2,556,595) - - -
Balance as at December 31, 2017 12,241,798 3,000 29,857,453 17,343,063 - 76,651,713 136,097,027 4,810,519 140,907,546
The annexed notes from 1 to 50 and annexures form an integral part of these consolidated financial statements.
Aameer Karachiwalla Sima Kamil Amar Zafar Khan Arshad Ahmad Mir Sir Mohammed Anwar Pervez, OBE, HPk
Chief Financial Officer President & Director Director Chairman
Chief Executive Officer
Attributable to equity shareholders of the Bank
Sub total
Non-
controlling
Interest
Total
---------------------------------------------------------------------------------------- (Rupees in '000) --------------------------------------------------------------------------------------
Capital reserve
- Exchange
translation
Appropriations recommended by the Board of Directors subsequent to the year ended December 31, 2017 are disclosed in note 48
to these consolidated financial statements.
Share
Capital
General
reserve
Statutory
reserve
Employee
stock option
reserve
Unappropriated
profit
NOTES TO AND FORMING PART OF THE CONSOLIDATED FINANCIAL STATEMENTS
FOR THE YEAR ENDED DECEMBER 31, 2017
1. STATUS AND NATURE OF BUSINESS
The "Group" consists of:
- Holding Company
- Subsidiary companies
- United National Bank Limited (UBL UK) - 55% holding
- UBL (Switzerland) AG -100% holding
- United Executors and Trustees Company Limited, Pakistan - 100% holding
- UBL Fund Managers Limited, Pakistan - 98.87% holding
- Al Ameen Financial Services (Pvt.) Limited - effective holding 98.87%
- UBL Bank (Tanzania) Limited - 100% holding
United Bank Limited (the Bank) is a banking company incorporated in Pakistan and is engaged in commercial banking
and related services. The Bank's registered office and principal office are situated at UBL Building, Jinnah Avenue,
Blue Area, Islamabad and at UBL Head Office, I. I. Chundrigar Road, Karachi respectively. The Bank operates 1,361
(2016: 1,341) branches inside Pakistan including 93 (2016: 47) Islamic Banking branches and 2 (2016: 2) branches in
Export Processing Zones. The Bank also operates 18 (2016: 18) branches outside Pakistan as at December 31,
2017. The Bank is a subsidiary of Bestway (Holdings) Limited which is incorporated in the United Kingdom.
The Bank's ordinary shares are listed on Pakistan Stock Exchange. Its Global Depository Receipts (GDRs) are on the
list of the UK Listing Authority and the London Stock Exchange Professional Securities Market. These GDRs are also
eligible for trading on the International Order Book System of the London Stock Exchange. Further, the GDRs
constitute an offering in the United States only to qualified institutional buyers in reliance on Rule 144A under the US
Securities Act of 1933 and an offering outside the United States in reliance on Regulation S.
UBL UK is an authorized banking institution incorporated in the United Kingdom. The Bank was formed in 2001 from
the merger of the UK branches of United Bank Limited and National Bank of Pakistan. The principal activities of UBL
UK are to provide retail banking services through its branch network in major cities of the UK, wholesale banking and
treasury services to financial institutions and trade finance facilities to businesses of all sizes. United National Bank
Limited operates under the trade name United Bank UK.
UBL (Switzerland) AG is a commercial bank owned by the Bank. Founded in 1967, its main activities are in credit
operations and trade financing. UBL (Switzerland) AG previously operated under the name, United Bank AG Zurich.
UBL Fund Managers Limited was incorporated as an unlisted public limited company in Pakistan on April 3, 2001. The
Company is licensed to carry out Asset Management and Investment Advisory Services under the Non-Banking
Finance Companies (Establishment and Regulation) Rules, 2003 and the Non-Banking Finance Companies and
Notified Entities Regulations, 2008. The principal activities of the Company are floating and managing mutual funds
and providing investment advisory services. The registered office of the Company is situated at STSM Building,
Beaumont Road, Civil Lines, Karachi.
United Executors and Trustees Company Limited ("the Company") was incorporated in Pakistan in 1965 as an
unlisted public limited company. The registered office of the Company is situated at State Life Building No. 1, I.I.
Chundrigar Road, Karachi. Currently, the Company is engaged in the business of investments.
UBL Bank (Tanzania) Limited was incorporated on March 13, 2012 and has commenced operations in May 2013. It is
engaged in providing commercial and retail banking services.
UBL Fund Managers has incorporated a wholly owned subsidiary Al Ameen Islamic Financial Services (Pvt.) Limited
on February 27, 2015. The principal activity of the subsidiary is provision of shariah compliant financial services
including distribution of shariah compliant mutual funds. The registered office of the Company is situated at STSM
Building, Beaumont Road, Civil Lines, Karachi.
6
NOTES TO AND FORMING PART OF THE CONSOLIDATED FINANCIAL STATEMENTS
FOR THE YEAR ENDED DECEMBER 31, 2017
2. BASIS OF PRESENTATION
2.1
2.2 Key financial figures of the Islamic Banking branches are disclosed in note 46 to these consolidated financial statements.
3. STATEMENT OF COMPLIANCE
3.1
-
-
- Provisions of and directives issued by the Banking Companies Ordinance, 1962;
- Provisions of and directives issued under the Companies Ordinance, 1984; and
- Directives issued by the Securities and Exchange Commission of Pakistan (SECP) and the SBP from time to time.
3.2
3.3
3.4
International Financial Reporting Standards (IFRS) and interpretations issued by the International Accounting
Standards Board (IASB) as are notified under the Companies Ordinance, 1984;
Islamic Financial Accounting Standards (IFAS) issued by the Institute of Chartered Accountants of Pakistan as are
notified under the Companies Ordinance, 1984;
Wherever the requirements of the Companies Ordinance, 1984, the Banking Companies Ordinance, 1962 or the directives
issued by the SECP and the SBP differ with the requirements of IFRS or IFAS, the requirements of the Companies
Ordinance, 1984, the Banking Companies Ordinance, 1962 or the said directives prevail.
The Companies Ordinance, 1984 has been repealed after the enactment of the Companies Act, 2017. However, as allowed
by the SECP vide its circular number 23/2017 dated October 4, 2017, these consolidated financial statements have been
prepared in accordance with the provisions of the repealed Companies Ordinance, 1984.
Standards, interpretations and amendments to approved accounting standards that are not yet effective
SECP vide its notification SRO 633 (I)/2014 dated July 10, 2014, adopted IFRS 10 effective from the periods starting from
June 30, 2014. However, vide its notification SRO 56 (I)/2016 dated January 28, 2016, it has been notified that the
requirements of IFRS 10 and section 237 of the Companies Ordinance 1984 will not be applicable with respect to the
investment in mutual funds established under trust structure.
In accordance with the directives of the Federal Government regarding the shifting of the banking system to Islamic modes,
the State Bank of Pakistan (SBP) has issued various circulars from time to time. Permissible forms of trade-related modes
of financing include purchase of goods by banks from their customers and immediate resale to them at appropriate mark-
up in price on deferred payment basis. The purchases and sales arising under these arrangements are not reflected in
these consolidated financial statements as such, but are restricted to the amount of facility actually utilized and the
appropriate portion of mark-up thereon. The Islamic Banking branches of the Bank have complied with the requirements set
out under the Islamic Financial Accounting Standards issued by the Institute of Chartered Accountants of Pakistan (ICAP)
and notified under the provisions of the repealed Companies Ordinance, 1984.
The SBP, vide BSD Circular letter No. 10, dated August 26, 2002 has deferred the applicability of International Accounting
Standard 39, Financial Instruments: Recognition and Measurement and International Accounting Standard 40, Investment
Property for banking companies till further instructions. Moreover, SBP vide BPRD circular no. 4, dated February 25, 2015
has deferred the applicability of Islamic Financial Accounting Standards (IFAS) 3, Profit and Loss Sharing on Deposits.
Further, according to the notification of the SECP issued vide SRO 411(I)/2008 dated April 28, 2008, IFRS 7, Financial
Instruments: Disclosures has not been made applicable for banks. Accordingly, the requirements of these standards have
not been considered in the preparation of these consolidated financial statements. However, investments have been
classified and valued in accordance with the requirements of various circulars issued by the SBP. Further, segment
information is being disclosed in accordance with SBP’s prescribed format as per BSD circular 4 dated February 17, 2006
which prevails over the requirements specified in IFRS 8.
These consolidated financial statements have been prepared in accordance with approved accounting standards as
applicable in Pakistan. Approved accounting standards comprise of:
The following revised standards, amendments and interpretations with respect to the approved accounting standards would
be effective from the dates mentioned below against the respective standard or interpretation:
7
NOTES TO AND FORMING PART OF THE CONSOLIDATED FINANCIAL STATEMENTS
FOR THE YEAR ENDED DECEMBER 31, 2017
Standard, Interpretation or Amendment
- IFRS 2 - Share-based Payments - (Amendments)
- IAS 28 - Investments in Associates and Joint Ventures - (Improvement)
- IFRIC 22 - Foreign Currency Transactions and Advance Consideration
- IFRIC 23 - Uncertainty over Income Tax Treatments
- IFRS 3 - Business Consideration - (Amendments)
- IFRS 11 - Joint Venture - (Amendments)
- IAS 12 - Income Taxes - (Amendments)
- IFRS 15 - Revenue from contracts with customers
- IFRS 9 - Financial Instruments: Classification and Measurement
- IFRS 9 - Financial Instruments: Classification and Measurement - (Amendments)
-
-
3.5 Standards, interpretations and amendments to approved accounting standards that are effective in the current year
4. BASIS OF MEASUREMENT
4.1 Accounting convention
4.2 Critical accounting estimates and judgments
July 01, 2018
January 01, 2019
Effective date (annual periods
beginning on or after)
July 01, 2018
January 01, 2018
January 01, 2018
January 01, 2018
January 01, 2018
January 01, 2018
January 01, 2018
The SBP vide BPRD circular no. 2 dated January 25, 2018 has specified the new reporting format for the financial
statements of banking companies. The new format has revised the disclosure requirements and will become applicable for
the financial statements of the Bank for the year ending December 31, 2018.
July 01, 2018
IFRS 15 - Revenue from contracts with customers - The Bank is currently in the process of assessing the potential
impacts of changes required in revenue recognition policies upon adoption of the standard.
The Group expects that the adoption of remaining amendments, improvements and interpretations will not affect its
financial statements in the period of initial application.
In addition to above, the Companies Act 2017 has been enacted on May 31, 2017 and according to the circular referred to
in note number 3.1 of these financial statements, the act would be applicable for periods after January 1, 2018. This would
result in additional disclosures and certain changes in financial statements presentation.
IFRS 9 - Financial Instruments - The Bank is currently awaiting instructions from SBP as applicability of IAS 39 was
deferred by SBP till further instructions.
There are certain new and amended standards, interpretations and amendments that are mandatory for the Group's
accounting periods beginning on or after January 1, 2017 but are considered not to be relevant or do not have any
significant effect on the Group's operations and therefore not detailed in these financial statements.
The preparation of these consolidated financial statements in conformity with approved accounting standards requires
management to make judgments, estimates and assumptions that affect the reported amounts of assets and liabilities and
income and expenses. It also requires management to exercise judgment in the application of its accounting policies. The
estimates and assumptions are based on historical experience and various other factors that are believed to be reasonable
under the circumstances. These estimates and assumptions are reviewed on an ongoing basis. Revisions to accounting
estimates are recognized in the period in which the estimate is revised if the revision affects only that period, or in the
period of revision and future periods if the revision affects both current and future periods.
These consolidated financial statements have been prepared under the historical cost convention except that certain
operating fixed assets / non-banking assets acquired in satisfaction of claims have been stated at revalued amounts,
certain investments and derivative financial instruments have been stated at fair value and net obligations in respect of
defined benefit schemes are carried at their present values.
8
NOTES TO AND FORMING PART OF THE CONSOLIDATED FINANCIAL STATEMENTS
FOR THE YEAR ENDED DECEMBER 31, 2017
i) classification of investments (notes 5.4 and 9);
ii)
iii) income taxes (notes 5.9 and 33);
iv) staff retirement benefits (notes 5.11 and 37);
v) fair value of derivatives (notes 5.16.2 and 19.3);
vi) operating fixed assets, revaluation, depreciation and amortization (notes 5.6 and 11);
vii) impairment (note 5.8); and
viii) valuation of non-banking assets acquired in satisfaction of claims (note 5.7).
5. SUMMARY OF SIGNIFICANT ACCOUNTING POLICIES
5.1 Basis of consolidation
The consolidated financial statements include the financial statements of the Bank and its subsidiary companies.
All material intra-group balances and transactions have been eliminated.
5.2 Cash and cash equivalents
5.3 Lendings to / borrowings from financial institutions
5.3.1 Purchase under resale agreements
Subsidiary companies are fully consolidated from the date on which more than 50% of voting rights are transferred to the
Group or the power to control the company is established and are excluded from consolidation from the date of disposal or
when the control is lost.
The financial statements of subsidiaries are prepared for the same reporting period as the Holding Company, using
accounting policies that are consistent with those of the Holding Company, except for non-banking subsidiaries in Pakistan
which follow the requirements of IAS 39 and IAS 40, and overseas subsidiaries which are required to comply with local
regulations enforced within the respective jurisdictions.
Securities held as collateral are not recognized in the consolidated financial statements, unless these are sold to third
parties, in which case the obligation to return them is recorded at fair value as a trading liability under borrowings from
financial institutions.
The accounting policies adopted in the preparation of these consolidated financial statements are consistent with those of
the previous financial year.
Cash and cash equivalents for the purpose of the cash flow statement consist of cash and balances with treasury banks
and balances with other banks.
The Group enters into transactions of reverse repos and repos at contracted rates for a specified period of time. These are
recorded as under:
The assets and liabilities of the subsidiaries have been consolidated with those of the Holding Company on a line by line
basis and the carrying value of the Bank's investment in the subsidiaries is eliminated against the subsidiaries' share
capital and pre-acquisition reserves in these consolidated financial statements.
Non-controlling interest represents that part of the net results of operations and of the net assets of the subsidiaries that is
not owned by the Group.
Securities purchased under agreement to resell (reverse repo) are included in lendings to financial institutions. The
differential between the purchase price and the resale price is amortized over the period of the agreement and recorded as
income.
Significant accounting estimates and areas where judgments were made by management in the application of accounting
policies are as follows:
provision against investments (notes 5.4 and 9.3), lendings to financial institutions (note 8.6) and advances (notes 5.5
and 10.3);
9
NOTES TO AND FORMING PART OF THE CONSOLIDATED FINANCIAL STATEMENTS
FOR THE YEAR ENDED DECEMBER 31, 2017
5.3.2 Sale under repurchase agreements
5.3.3 Bai Muajjal
5.4 Investments
Held for trading
Initial measurement
Subsequent measurement
Held for trading
Held to maturity
These are securities which are either acquired for generating a profit from short-term fluctuations in market prices, interest
rate movements and dealer's margin, or are securities included in a portfolio in which a pattern of short term profit taking
exists.
Available for sale
These are measured at subsequent reporting dates at fair value. Gains and losses on re-measurement are included in the
profit and loss account.
All “regular way” purchases and sales of investments are recognized on the trade date, i.e. the date that the Group commits
to purchase or sell the investment. Regular way purchases or sales are purchases or sales of investments that require
delivery of investments within the time frame generally established by regulation or convention in the market place.
Investments of the Group, other than investments in associates, are classified as held for trading, held to maturity and
available for sale.
Securities sold subject to a repurchase agreement (repo) are retained in the consolidated financial statements as
investments and the counterparty liability is included in borrowings from financial institutions. The differential between the
sale price and the repurchase price is amortized over the period of the agreement and recorded as an expense.
Investments are initially recognized at fair value which, in the case of investments other than held for trading, includes
transaction costs associated with the investments. Transaction costs on investments held for trading are expensed as
incurred.
The securities sold under Bai Muajjal agreement are derecognised on the date of disposal. Receivable against such sale is
recognised at the agreed sale price. The difference between the sale price and the carrying value on the date of disposal is
taken to income on straight line basis.
These are investments, other than those in subsidiaries and associates, that do not fall under the held for trading or held to
maturity categories.
These are measured at amortized cost using the effective interest rate method, less any impairment loss recognized to
reflect irrecoverable amounts.
These are securities with fixed or determinable payments and fixed maturities, in respect of which the Group has the
positive intent and ability to hold to maturity.
Held to maturity
10
NOTES TO AND FORMING PART OF THE CONSOLIDATED FINANCIAL STATEMENTS
FOR THE YEAR ENDED DECEMBER 31, 2017
Available for sale
Associates are entities over which the Group has a significant influence, but control does not exist.
5.5 Advances
5.5.1 Islamic financings and related assets
Investments in associates are accounted for using the equity method of accounting. Under the equity method, the
investment in the associate is initially recognised at cost and the carrying amount is increased or decreased to recognise
the investor's share of the profit or loss of the investee subsequent to the date of acquisition. The increase / decrease in the
share of profit or loss of associates is accounted for in the consolidated profit and loss account. The Group applies equity
accounting for UBL Insurers Limited, Oman United Exchange Company Limited, Khushhali Bank Limited, DHA Cogen
Limited and its investments in mutual funds managed by UBL Fund Managers Limited.
Provisions for diminution in the value of term finance certificates and Sukuks are made as per the ageing criteria prescribed
by the Prudential Regulations issued by the SBP. Provisions for diminution in the value of other securities are made for
impairment, if any.
Unquoted equity securities are valued at the lower of cost and break-up value. The break-up value of these securities is
calculated with reference to the net assets of the investee company as per the latest available audited financial statements.
A decline in the carrying value is charged to the profit and loss account. A subsequent increase in the carrying value, upto
the cost of the investment, is credited to the profit and loss account. Investments in other unquoted securities are valued at
cost less impairment, if any.
Advances are stated net of specific and general provisions which are charged to the profit and loss account. Specific
provisions against domestic advances and general provision against domestic consumer loans are determined on the basis
of the Prudential Regulations and other directives issued by the SBP. General and specific provisions pertaining to
overseas advances are made in accordance with the requirements of the regulatory authorities of the respective countries.
If circumstances warrant, the Group, from time to time, makes general provisions against weaknesses in its portfolio on the
basis of management's estimation.
Associates
Ijarah financing represents arrangements whereby the Bank (being the owner of assets) transfers its usufruct to its
customers for an agreed period at an agreed consideration. Assets leased out under Ijarah are stated at cost less
accumulated depreciation and accumulated impairment losses, if any. These are depreciated over the term of the lease.
Ijarah income is recognized on an accrual basis.
Diminishing Musharaka is partnership agreement between the Bank and its customer for financing vehicle or plant and
machinery. The receivable is recorded to the extent of Bank's share in the purchase of asset. Income is recognised on
accrual basis.
Advances are written off when there is no realistic prospect of recovery. The amount so written off is a book entry and does
not necessarily prejudice to the Group's right of recovery against the customer.
Receivables under Murabaha financing represent cost price plus an agreed mark-up on deferred sale arrangement. Mark-
up income is recognised on a straight line basis over the period of the instalments.
The Bank determines write-offs in accordance with the criteria prescribed by the SBP vide BPRD Circular No. 06 dated
June 05, 2007.
Quoted securities classified as available for sale investments are measured at subsequent reporting dates at fair value.
Any surplus / deficit arising thereon is kept in a separate account shown in the statement of financial position below equity
and is taken to the profit and loss account when realized upon disposal or when the investment is considered to be
impaired.
11
NOTES TO AND FORMING PART OF THE CONSOLIDATED FINANCIAL STATEMENTS
FOR THE YEAR ENDED DECEMBER 31, 2017
5.6 Operating fixed assets and depreciation
5.6.1 Tangible
5.6.2 Intangible assets
5.7 Non banking assets acquired in satisfaction of claims
5.8 Impairment
Impairment of available for sale equity investments
Intangible assets are stated at cost less accumulated amortization and accumulated impairment losses, if any. The cost
and the accumulated amortization of intangible assets of foreign branches include exchange differences arising on
currency translation at the year-end rates of exchange. Amortization is calculated so as to write-off the amortizable amount
of the assets over their expected useful lives at the rates specified in note 11.3 to these consolidated financial statements.
The amortization charge for the year is calculated on a straight line basis after taking into account the residual value, if any.
The residual values and useful lives are reviewed and adjusted, if appropriate, at each statement of financial position date.
Amortization on additions is charged from the month the asset is available for use. No amortization is charged in the month
of disposal.
Gains and losses on sale of intangible assets are included in the profit and loss account.
Available for sale equity investments are impaired when there has been a significant or prolonged decline in their fair value
below their cost. The determination of what is significant or prolonged requires judgment. In making this judgment, the
Group evaluates, among other factors, the normal volatility in share price.
Depreciation on additions is charged from the month the asset is available for use. No depreciation is charged in the month
of disposal.
Major renewals and improvements are capitalized and the assets so replaced, if any, are retired. Normal repairs and
maintenance are charged to the profit and loss account as and when incurred.
Property and equipment, other than land (which is not depreciated) and capital work-in-progress, are stated at cost or
revalued amount less accumulated depreciation and accumulated impairment losses, if any. Land is carried at revalued
amount less impairment losses while capital work-in-progress is stated at cost less impairment losses. The cost and the
accumulated depreciation of property and equipment of foreign branches include exchange differences arising on currency
translation at the year-end rates of exchange.
Non banking assets acquired in satisfaction of claims are carried at revalued amounts less accumulated depreciation.
These assets are revalued by professionally qualified valuers with sufficient regularity to ensure that their net carrying value
does not differ materially from their fair value. A surplus arising on revaluation of property is credited to the 'surplus on
revaluation of non-banking assets' account and any deficit arising on revaluation is taken to profit and loss account directly.
Legal fees, transfer costs and direct costs of acquiring title to property are charged to the profit and loss account and not
capitalised.
Depreciation is calculated so as to write-off the depreciable amount of the assets over their expected useful lives at the
rates specified in note 11.2 to these consolidated financial statements. The depreciation charge for the year is calculated
on a straight line basis after taking into account the residual value, if any. The residual values and useful lives are reviewed
and adjusted, if appropriate, at each statement of financial position date.
Gains and losses on sale of fixed assets are included in the profit and loss account, except that the related surplus on
revaluation of fixed assets (net of deferred tax) is transferred directly to unappropriated profit.
Land and buildings are revalued by professionally qualified valuers with sufficient regularity to ensure that their net carrying
value does not differ materially from their fair value. A surplus arising on revaluation is credited to the surplus on
revaluation of fixed assets account. Any deficit arising on subsequent revaluation of fixed assets is adjusted against the
balance in the above mentioned surplus account as allowed under the provisions of the repealed Companies Ordinance,
1984. The surplus on revaluation of fixed assets, to the extent of incremental depreciation, is transferred to unappropriated
profit.
12
NOTES TO AND FORMING PART OF THE CONSOLIDATED FINANCIAL STATEMENTS
FOR THE YEAR ENDED DECEMBER 31, 2017
Impairment in investments in associates
Impairment in non-financial assets (excluding deferred tax)
5.9 Taxation
5.9.1 Current
5.9.2 Prior years
5.9.3 Deferred
5.10 Provisions
Provisions are reviewed at each statement of financial position date and are adjusted to reflect the current best estimate.
Deferred tax is recognized using the balance sheet method on all major temporary differences between the amounts
attributed to assets and liabilities for financial reporting purposes and the amounts used for taxation purposes. Deferred tax
is calculated at the rates that are expected to apply to the period when the differences are expected to reverse, based on
tax rates that have been enacted or substantively enacted at the statement of financial position date.
The Group also recognizes deferred tax asset / liability on the deficit / surplus on revaluation of fixed assets / non-banking
assets acquired in satisfaction of claims and securities which is adjusted against the related deficit / surplus in accordance
with the requirements of IAS 12, Income Taxes.
Provision against identified non-funded losses is recognized when intimated and reasonable certainty exists that the Group
will be required to settle the obligation. The provision is charged to the profit and loss account net of expected recovery and
the obligation is classified under other liabilities.
The Group considers that a decline in the recoverable value of the investment in an associate below its cost may be
evidence of impairment. Recoverable value is calculated as the higher of fair value less costs to sell and value in use. An
impairment loss is recognized when the recoverable value falls below the carrying value and is charged to the profit and
loss account. A subsequent reversal of an impairment loss, upto the cost of the investment in the associate, is credited to
the profit and loss account.
Provisions are recognized when the Group has a legal or constructive obligation as a result of past events which makes it
probable that an outflow of resources will be required to settle the obligation and a reliable estimate of the amount can be
made.
The taxation charge for prior years represents adjustments to the tax charge relating to prior years, arising from
assessments and changes in estimates made during the current year.
The carrying amounts of non-financial assets are reviewed at each reporting date for impairment whenever events or
changes in circumstances indicate that the carrying amounts of these assets may not be recoverable. If such indication
exists, and where the carrying value exceeds the estimated recoverable amount, assets are written down to their
recoverable amount. The resulting impairment loss is charged to the profit and loss account except for an impairment loss
on revalued assets, which is adjusted against the related revaluation surplus to the extent that the impairment loss does not
exceed the revaluation surplus.
Provision for current taxation is based on taxable income for the year determined in accordance with the prevailing laws
and at the prevailing rates for taxation on income earned by the Group in the respective regions / territories.
Deferred tax assets are recognized only to the extent that it is probable that future taxable profits will be available against
which the assets can be utilized.
The carrying amount of deferred tax assets is reviewed at each statement of financial position date and reduced to the
extent that it is no longer probable that sufficient taxable profits will be available to allow all or part of the deferred tax asset
to be utilized.
13
NOTES TO AND FORMING PART OF THE CONSOLIDATED FINANCIAL STATEMENTS
FOR THE YEAR ENDED DECEMBER 31, 2017
5.11 Staff retirement and other benefits
5.11.1 The Bank
The Bank operates the following staff retirement schemes for its employees:
a)
- an approved contributory provident fund (defined contribution scheme); and
- an approved gratuity scheme (defined benefit scheme).
b) For employees who have not opted for the conversion option introduced in 2001, the Bank operates:
- an approved non-contributory provident fund in lieu of the contributory provident fund; and
- an approved funded pension scheme, introduced in 1986 (defined benefit scheme).
The Bank also operates benevolent fund for all its eligible employees (defined benefit scheme).
Other benefits
a) Employees' compensated absences
b) Post retirement medical benefits (defined benefit scheme)
c) Employee motivation and retention scheme
Remeasurement of defined benefit obligations
In 2001, the Bank modified the pension scheme and introduced a conversion option for employees covered under option
(b) above to move to option (a). This conversion option ceased on December 31, 2003.
The Bank provides post retirement medical benefits to eligible retired employees. Provision is made on the basis of
actuarial advice under the Projected Unit Credit Method.
The Bank has a long term motivation and retention scheme for its employees. The liability of the Bank in respect of
the scheme for each year, if any, is fixed, and is accounted for in the year to which the scheme relates.
Remeasurement gains and losses pertaining to long term compensated absences are recognized in the profit and loss
account immediately.
For new employees and for those who opted for the below mentioned conversion option introduced in 2001, the Bank
operates:
The Bank makes provisions for compensated vested and non-vested absences accumulated by its eligible employees
on the basis of actuarial advice under the Projected Unit Credit Method.
Remeasurement gains and losses arising from experience adjustments and changes in actuarial assumptions are
recognized in other comprehensive income when they occur with no subsequent recycling through the profit and loss
account.
Annual contributions towards defined benefit schemes are made on the basis of actuarial advice using the Projected Unit
Credit Method.
For the defined contribution scheme, the Bank pays contributions to the fund on a periodic basis. The Bank has no further
payment obligation once the contributions have been paid. The contributions are recognized as an expense when the
obligation to make payments to the fund has been established. Prepaid contributions are recognized as an asset to the
extent that a cash refund or a reduction in future payments is available.
14
NOTES TO AND FORMING PART OF THE CONSOLIDATED FINANCIAL STATEMENTS
FOR THE YEAR ENDED DECEMBER 31, 2017
5.11.2 United National Bank Limited (UBL UK)
Defined benefit scheme
Defined contribution scheme
5.11.3 UBL Fund Managers Limited (UFML)
Defined benefit plan
Defined contribution plan
Employee Stock Option Scheme
5.11.4 UBL (Switzerland) AG
5.11.5 UBL Bank (Tanzania) Limited
5.12 Subordinated loans
UBL UK operates a defined contributory pension scheme. The contribution payable in the year in respect of pension costs
and other post retirement benefits is charged to the profit and loss account. Differences between the contribution payable in
the year and contribution actually paid are shown as either accruals or prepayments in the statement of financial position.
UBL UK operates a pension scheme (defined benefit scheme) for certain staff. This scheme is closed for new members
and the accrual of benefits has ceased from January 1, 2010. Gains and losses on settlements and curtailments are
charged to the profit and loss account. The interest cost and the expected return on assets are included in other liabilities
and other assets respectively. Remeasurement gains and losses are recognised immediately in other comprehensive
income.
UBL (Switzerland) AG maintains a contribution-oriented pension scheme for employees who have reached the age of 25. It
bears a large share of the costs of the occupational pension plan for all employees as well as their surviving dependents
pursuant to legal requirements. The employee benefit obligations and the assets serving as coverage are outsourced to a
collective insurance firm. The organization, management and financing of the pension plan comply with legal regulations,
the deed of foundation and the applicable regulations of the benefit plan.
All eligible employees are members of the Public Pension Fund (PPF) or National Social Security Fund (NSSF). The fund is
a defined contribution scheme with the Bank having no legal or constructive obligation to pay further top-up contributions.
Subordinated loans are initially recorded at the amount of proceeds received. Mark-up accrued on subordinated loans is
recognised separately as part of other liabilities and is charged to the profit and loss account over the period on an accrual
basis.
UFML operates an approved contributory provident fund (defined contribution scheme) for all eligible employees.
UBL Fund Managers provides an incentive scheme for its top performing employees in the form of share options under the
Employee Stock Option Scheme (ESOS). The scheme has been approved by the SECP.
The defined benefit scheme is funded, with the assets of the scheme held separately from those of UBL UK, in separate
trustee administered funds. Pension scheme assets are measured at fair value and liabilities are measured based on
actuarial valuations using the Projected Unit Credit Method. The actuarial valuations are obtained at least triennially and
are updated at each statement of financial position date.
UFML operates an approved funded gratuity scheme for all employees. Annual contributions to the fund are made on the
basis of actuarial advice using the Projected Unit Credit Method. Remeasurement gains and losses arising from experience
adjustments and changes in actuarial assumptions are recognized in other comprehensive income when they occur with no
subsequent recycling through the profit and loss account.
15
NOTES TO AND FORMING PART OF THE CONSOLIDATED FINANCIAL STATEMENTS
FOR THE YEAR ENDED DECEMBER 31, 2017
5.13 Borrowings / deposits
a) Borrowings / deposits are recorded at the amount of proceeds received.
b) The cost of borrowings / deposits is recognized on an accrual basis as an expense in the period in which it is incurred.
5.14 Revenue recognition
5.14.1 Advances and investments
5.14.2 Dividend income
Dividend income is recognised when the right to receive the dividend is established.
5.14.3 Fee, brokerage and commission
5.14.4 Grants
5.15 Foreign currencies
5.15.1 Functional and presentation currency
5.15.2 Foreign currency transactions
5.15.3 Foreign operations and subsidiaries
Grants received are recorded as income when the right to receive the grant, based on the related expenditure having been
incurred, has been established.
Non-monetary assets and liabilities in foreign currencies are expressed in rupee terms at the rates of exchange prevailing
at the date of initial recognition of the non-monetary assets / liabilities.
The assets and liabilities of foreign operations and subsidiaries are translated to rupees at exchange rates prevailing at the
statement of financial position date. The results of foreign operations and subsidiaries are translated at the average rate of
exchange for the year.
Revenue is recognized to the extent that the economic benefits associated with a transaction will flow to the Group and the
revenue can be reliably measured. The following recognition criteria must be met before revenue is recognized.
Mark-up / return / interest on performing advances and investments is recognized on a time proportionate basis over the
term of the advances and investments that takes into account the effective yield of the asset. Where debt securities are
purchased at a premium or discount, such premium / discount is amortized through the profit and loss account over the
remaining period of maturity of the debt securities.
Interest or mark-up recoverable on non-performing or classified advances and investments is recognized on a receipt
basis.
Fee, brokerage and commission income is recognized on an accrual basis.
Items included in these consolidated financial statements are measured using the currency of the primary economic
environment in which the Holding Company operates. These consolidated financial statements are presented in Pakistani
Rupees, which is the Group's functional and presentation currency.
Transactions in foreign currencies are translated to rupees at the foreign exchange rates prevailing on the transaction date.
Monetary assets and liabilities in foreign currencies are expressed in rupee terms at the rates of exchange prevailing at the
statement of financial position date. Forward foreign exchange contracts and foreign bills purchased are valued in rupees
at the forward foreign exchange rates applicable to their respective maturities.
16
NOTES TO AND FORMING PART OF THE CONSOLIDATED FINANCIAL STATEMENTS
FOR THE YEAR ENDED DECEMBER 31, 2017
5.15.4 Translation gains and losses
5.15.5 Contingencies and commitments
5.16 Financial instruments
5.16.1 Financial assets and liabilities
5.16.2 Derivative financial instruments
5.16.3 Hedge accounting
Cash flow hedges
5.16.4 Off setting
When a hedging instrument expires or is sold, or when a hedge no longer meets the criteria for hedge accounting, any
cumulative gain or loss existing in equity at that time remains in equity and is recognised when the hedged item is
ultimately recognised in the profit and loss account.
Translation gains and losses are taken to the profit and loss account, except those arising on translation of the net
investment in foreign branches and subsidiaries which are taken to capital reserves (Exchange Translation Reserve) until
the disposal of the net investment, at which time these are recognised in the profit and loss account.
Commitments for outstanding forward foreign exchange contracts are disclosed in these consolidated financial statements
at contracted rates. Contingent liabilities / commitments denominated in foreign currencies are expressed in rupee terms at
the rates of exchange prevailing at the statement of financial position date.
For qualifying cash flow hedges, the fair value gain or loss associated with the effective portion of the cash flow hedge is
recognised initially in the statement of changes in equity, and recycled through the profit and loss account in the periods
when the hedged item will affect profit or loss. Any gain or loss on the ineffective portion of the hedging instrument is
recognised in the profit and loss account immediately.
Financial assets and liabilities carried on the statement of financial position include cash and bank balances, lendings to
financial institutions, investments, advances, certain receivables, bills payable, borrowings from financial institutions,
deposits, subordinated loans and certain payables. The particular recognition methods adopted for significant financial
assets and financial liabilities are disclosed in the individual policy notes associated with them.
The Group makes use of derivative instruments to manage exposures to interest rate, foreign currency and credit risks. In
order to manage particular risks, the Group may undertake a hedge. The Group applies hedge accounting for transactions
which meet the specified criteria.
Financial assets and financial liabilities are set off and the net amount is reported in the consolidated financial statements
when there is a legally enforceable right to set off and the Group intends to either settle on a net basis, or to realize the
assets and to settle the liabilities simultaneously.
At the inception of the hedging relationship, the Group formally documents the relationship between the hedged item and
the hedging instrument, including the nature of the risk, the objective and strategy for undertaking the hedge and the
method that will be used to assess the effectiveness of the hedging relationship. A formal assessment is also undertaken to
ascertain whether the hedging instrument is expected to be highly effective in offsetting the designated risk in the hedged
item. A hedge is regarded as highly effective if, during the period for which the hedge is designated, changes in the fair
value or cash flows attributable to the hedged item are expected to be offset by between 80% to 125% by corresponding
changes in the fair value or cash flows attributable to the hedging instrument.
Derivative financial instruments are initially recognized at fair value on the date on which the derivative contract is entered
into and are subsequently re-measured at fair value using appropriate valuation techniques. All derivative financial
instruments are carried as assets when their fair value is positive and liabilities when their fair value is negative. Any
change in the fair value of derivative financial instruments during the period is taken to the profit and loss account.
17
NOTES TO AND FORMING PART OF THE CONSOLIDATED FINANCIAL STATEMENTS
FOR THE YEAR ENDED DECEMBER 31, 2017
5.17 Segment reporting
5.17.1 Business segments
(a) Corporate finance
(b) Trading and sales
(c) Retail banking
(d) Commercial banking
(e) Asset management
(f) Others
Others includes functions of the Group and subsidiaries which cannot be classified in any of the above segments.
5.17.2 Geographical segments
The Group operates in following geographical regions:
- Pakistan
- Middle East
- United States of America
- Export Processing Zones in Karachi and Sialkot
- Europe
- Africa
5.18 Dividends and appropriations to reserves
5.19 Earnings per share
The Group presents basic and diluted earnings per share (EPS). Basic EPS is calculated by dividing the profit or loss
attributable to ordinary shareholders of the Group by the weighted average number of ordinary shares outstanding during
the year.
Dividends and appropriations to reserves are recorded in the year in which these are approved, except appropriations
required by law which are recorded in the period to which they pertain.
Corporate finance includes services provided in connection with mergers and acquisitions, project finance and the
underwriting / arrangement of debt and equity instruments through syndications, Initial Public Offerings and private
placements.
Commercial banking includes project finance, working capital finance, trade finance, import and export, factoring,
leasing, lending, deposits and guarantees.
A segment is a distinguishable component of the Group that is engaged either in providing particular products or services
(business segment), or in providing products or services within a particular economic environment (geographical segment),
and is subject to risks and rewards that are different from those of other segments.
Trading and sales includes fixed income, equity, foreign exchange, credit, funding, own position securities, lendings
and borrowings and derivatives for hedging and market making.
Asset management includes discretionary and non-discretionary fund management activities in the form of pooled,
segregated, retail, institutional, private equity, open, close ended funds etc.
Retail banking includes retail and consumer lending and deposits, banking services, cards and branchless banking.
18
NOTES TO AND FORMING PART OF THE CONSOLIDATED FINANCIAL STATEMENTS
FOR THE YEAR ENDED DECEMBER 31, 2017
Note 2017 2016
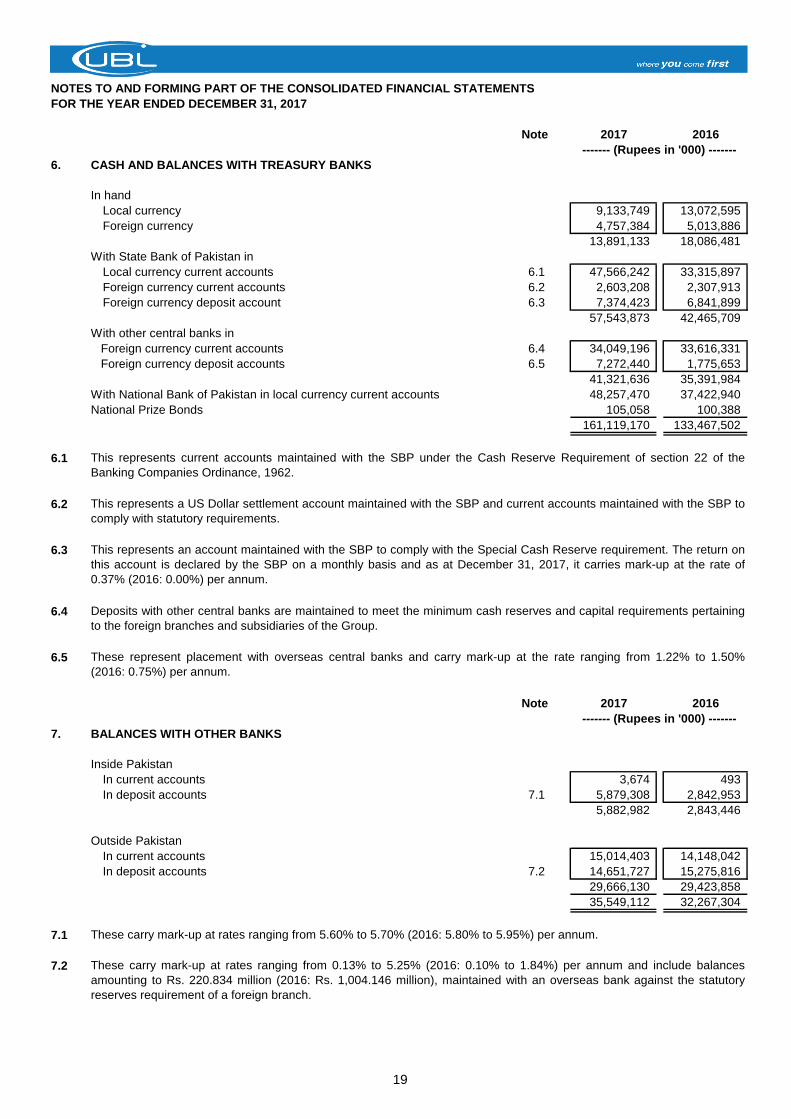
6. CASH AND BALANCES WITH TREASURY BANKS
In hand
Local currency 9,133,749 13,072,595
Foreign currency 4,757,384 5,013,886
13,891,133 18,086,481
With State Bank of Pakistan in
Local currency current accounts 6.1 47,566,242 33,315,897
Foreign currency current accounts 6.2 2,603,208 2,307,913
Foreign currency deposit account 6.3 7,374,423 6,841,899
57,543,873 42,465,709
With other central banks in
Foreign currency current accounts 6.4 34,049,196 33,616,331
Foreign currency deposit accounts 6.5 7,272,440 1,775,653
41,321,636 35,391,984
With National Bank of Pakistan in local currency current accounts 48,257,470 37,422,940
National Prize Bonds 105,058 100,388
161,119,170 133,467,502
6.1
6.2
6.3
6.4
6.5
Note 2017 2016
7. BALANCES WITH OTHER BANKS
Inside Pakistan
In current accounts 3,674 493
In deposit accounts 7.1 5,879,308 2,842,953
5,882,982 2,843,446
Outside Pakistan
In current accounts 15,014,403 14,148,042
In deposit accounts 7.2 14,651,727 15,275,816
29,666,130 29,423,858
35,549,112 32,267,304
7.1
7.2
------- (Rupees in '000) -------
These carry mark-up at rates ranging from 0.13% to 5.25% (2016: 0.10% to 1.84%) per annum and include balances
amounting to Rs. 220.834 million (2016: Rs. 1,004.146 million), maintained with an overseas bank against the statutory
reserves requirement of a foreign branch.
This represents an account maintained with the SBP to comply with the Special Cash Reserve requirement. The return on
this account is declared by the SBP on a monthly basis and as at December 31, 2017, it carries mark-up at the rate of
0.37% (2016: 0.00%) per annum.
This represents a US Dollar settlement account maintained with the SBP and current accounts maintained with the SBP to
comply with statutory requirements.
These represent placement with overseas central banks and carry mark-up at the rate ranging from 1.22% to 1.50%
(2016: 0.75%) per annum.
These carry mark-up at rates ranging from 5.60% to 5.70% (2016: 5.80% to 5.95%) per annum.
This represents current accounts maintained with the SBP under the Cash Reserve Requirement of section 22 of the
Banking Companies Ordinance, 1962.
Deposits with other central banks are maintained to meet the minimum cash reserves and capital requirements pertaining
to the foreign branches and subsidiaries of the Group.
------- (Rupees in '000) -------
19
NOTES TO AND FORMING PART OF THE CONSOLIDATED FINANCIAL STATEMENTS
FOR THE YEAR ENDED DECEMBER 31, 2017
Note 2017 2016
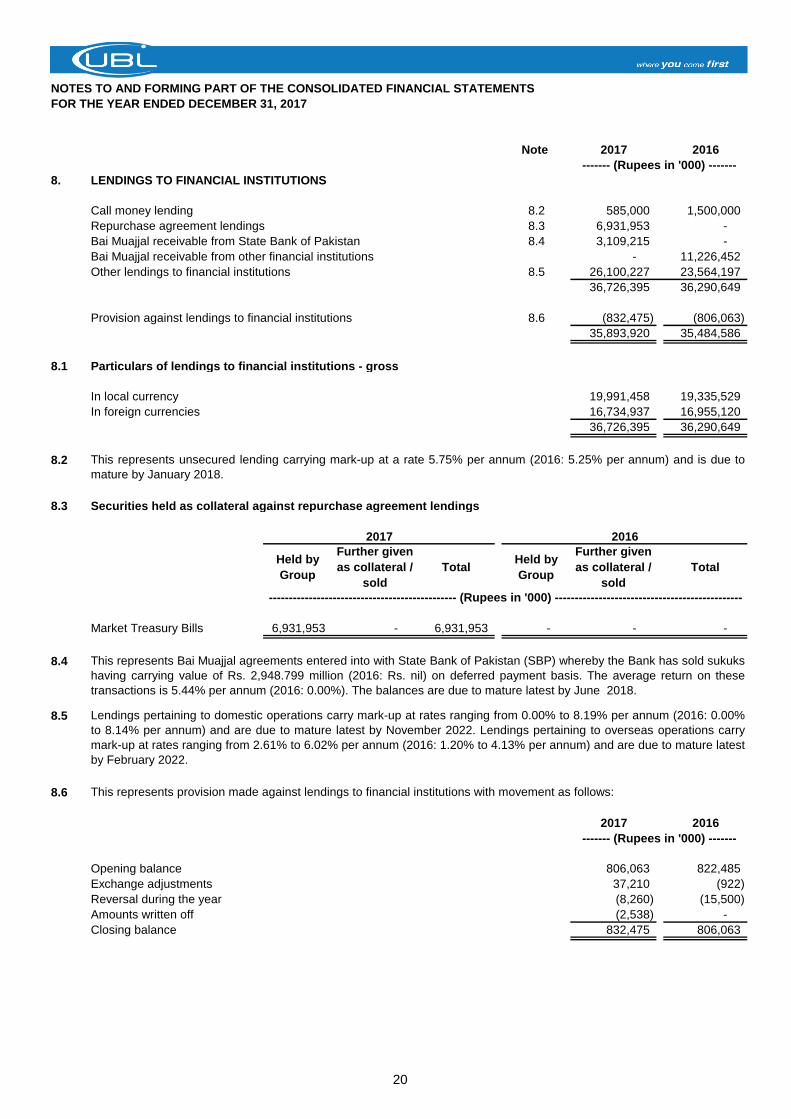
8. LENDINGS TO FINANCIAL INSTITUTIONS
Call money lending 8.2 585,000 1,500,000
Repurchase agreement lendings 8.3 6,931,953 -
Bai Muajjal receivable from State Bank of Pakistan 8.4 3,109,215 -
Bai Muajjal receivable from other financial institutions - 11,226,452
Other lendings to financial institutions 8.5 26,100,227 23,564,197
36,726,395 36,290,649
Provision against lendings to financial institutions 8.6 (832,475) (806,063)
35,893,920 35,484,586
8.1 Particulars of lendings to financial institutions - gross
In local currency 19,991,458 19,335,529
In foreign currencies 16,734,937 16,955,120
36,726,395 36,290,649
8.2
8.3 Securities held as collateral against repurchase agreement lendings
2016
Held by
Group
Further given
as collateral /
sold
TotalHeld by
Group
Further given
as collateral /
sold
Total
Market Treasury Bills 6,931,953 - 6,931,953 - - -
8.4
8.5
8.6
2017 2016
Opening balance 806,063 822,485
Exchange adjustments 37,210 (922)
Reversal during the year (8,260) (15,500)
Amounts written off (2,538) -
Closing balance 832,475 806,063
2017
------- (Rupees in '000) -------
------- (Rupees in '000) -------
----------------------------------------------- (Rupees in '000) -----------------------------------------------
This represents unsecured lending carrying mark-up at a rate 5.75% per annum (2016: 5.25% per annum) and is due to
mature by January 2018.
This represents provision made against lendings to financial institutions with movement as follows:
Lendings pertaining to domestic operations carry mark-up at rates ranging from 0.00% to 8.19% per annum (2016: 0.00%
to 8.14% per annum) and are due to mature latest by November 2022. Lendings pertaining to overseas operations carry
mark-up at rates ranging from 2.61% to 6.02% per annum (2016: 1.20% to 4.13% per annum) and are due to mature latest
by February 2022.
This represents Bai Muajjal agreements entered into with State Bank of Pakistan (SBP) whereby the Bank has sold sukuks
having carrying value of Rs. 2,948.799 million (2016: Rs. nil) on deferred payment basis. The average return on these
transactions is 5.44% per annum (2016: 0.00%). The balances are due to mature latest by June 2018.
20
NOTES TO AND FORMING PART OF THE CONSOLIDATED FINANCIAL STATEMENTS
FOR THE YEAR ENDED DECEMBER 31, 2017
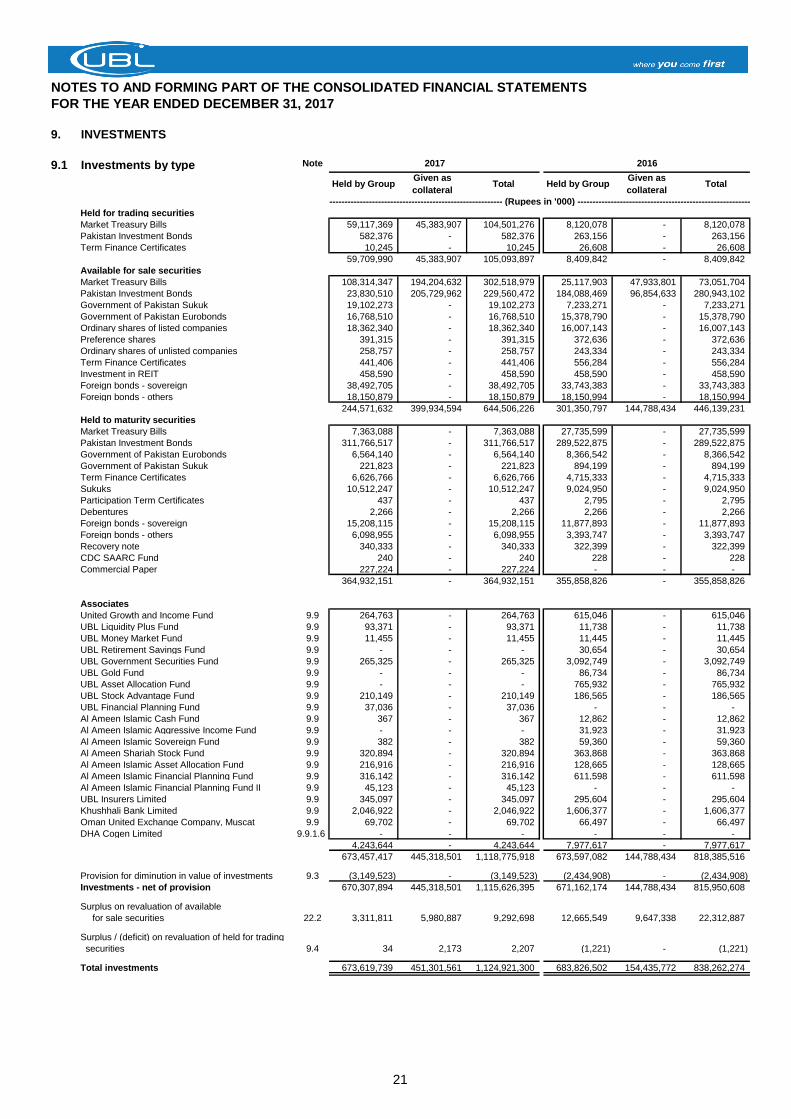
9. INVESTMENTS
9.1 Investments by type Note
Held by GroupGiven as
collateralTotal Held by Group
Given as
collateralTotal
Held for trading securities
Market Treasury Bills 59,117,369 45,383,907 104,501,276 8,120,078 - 8,120,078
Pakistan Investment Bonds 582,376 - 582,376 263,156 - 263,156
Term Finance Certificates 10,245 - 10,245 26,608 - 26,608
59,709,990 45,383,907 105,093,897 8,409,842 - 8,409,842
Available for sale securities
Market Treasury Bills 108,314,347 194,204,632 302,518,979 25,117,903 47,933,801 73,051,704
Pakistan Investment Bonds 23,830,510 205,729,962 229,560,472 184,088,469 96,854,633 280,943,102
Government of Pakistan Sukuk 19,102,273 - 19,102,273 7,233,271 - 7,233,271
Government of Pakistan Eurobonds 16,768,510 - 16,768,510 15,378,790 - 15,378,790
Ordinary shares of listed companies 18,362,340 - 18,362,340 16,007,143 - 16,007,143
Preference shares 391,315 - 391,315 372,636 - 372,636
Ordinary shares of unlisted companies 258,757 - 258,757 243,334 - 243,334
Term Finance Certificates 441,406 - 441,406 556,284 - 556,284
Investment in REIT 458,590 - 458,590 458,590 - 458,590
Foreign bonds - sovereign 38,492,705 - 38,492,705 33,743,383 - 33,743,383
Foreign bonds - others 18,150,879 - 18,150,879 18,150,994 - 18,150,994
244,571,632 399,934,594 644,506,226 301,350,797 144,788,434 446,139,231
Held to maturity securities
Market Treasury Bills 7,363,088 - 7,363,088 27,735,599 - 27,735,599
Pakistan Investment Bonds 311,766,517 - 311,766,517 289,522,875 - 289,522,875
Government of Pakistan Eurobonds 6,564,140 - 6,564,140 8,366,542 - 8,366,542
Government of Pakistan Sukuk 221,823 - 221,823 894,199 - 894,199
Term Finance Certificates 6,626,766 - 6,626,766 4,715,333 - 4,715,333
Sukuks 10,512,247 - 10,512,247 9,024,950 - 9,024,950
Participation Term Certificates 437 - 437 2,795 - 2,795
Debentures 2,266 - 2,266 2,266 - 2,266
Foreign bonds - sovereign 15,208,115 - 15,208,115 11,877,893 - 11,877,893
Foreign bonds - others 6,098,955 - 6,098,955 3,393,747 - 3,393,747
Recovery note 340,333 - 340,333 322,399 - 322,399
CDC SAARC Fund 240 - 240 228 - 228
Commercial Paper 227,224 - 227,224 - - -
364,932,151 - 364,932,151 355,858,826 - 355,858,826
Associates
United Growth and Income Fund 9.9 264,763 - 264,763 615,046 - 615,046
UBL Liquidity Plus Fund 9.9 93,371 - 93,371 11,738 - 11,738
UBL Money Market Fund 9.9 11,455 - 11,455 11,445 - 11,445
UBL Retirement Savings Fund 9.9 - - - 30,654 - 30,654
UBL Government Securities Fund 9.9 265,325 - 265,325 3,092,749 - 3,092,749
UBL Gold Fund 9.9 - - - 86,734 - 86,734
UBL Asset Allocation Fund 9.9 - - - 765,932 - 765,932
UBL Stock Advantage Fund 9.9 210,149 - 210,149 186,565 - 186,565
UBL Financial Planning Fund 9.9 37,036 - 37,036 - - -
Al Ameen Islamic Cash Fund 9.9 367 - 367 12,862 - 12,862
Al Ameen Islamic Aggressive Income Fund 9.9 - - - 31,923 - 31,923
Al Ameen Islamic Sovereign Fund 9.9 382 - 382 59,360 - 59,360
Al Ameen Shariah Stock Fund 9.9 320,894 - 320,894 363,868 - 363,868
Al Ameen Islamic Asset Allocation Fund 9.9 216,916 - 216,916 128,665 - 128,665
Al Ameen Islamic Financial Planning Fund 9.9 316,142 - 316,142 611,598 - 611,598
Al Ameen Islamic Financial Planning Fund II 9.9 45,123 - 45,123 - - -
UBL Insurers Limited 9.9 345,097 - 345,097 295,604 - 295,604
Khushhali Bank Limited 9.9 2,046,922 - 2,046,922 1,606,377 - 1,606,377
Oman United Exchange Company, Muscat 9.9 69,702 - 69,702 66,497 - 66,497
DHA Cogen Limited 9.9.1.6 - - - - - -
4,243,644 - 4,243,644 7,977,617 - 7,977,617
673,457,417 445,318,501 1,118,775,918 673,597,082 144,788,434 818,385,516
Provision for diminution in value of investments 9.3 (3,149,523) - (3,149,523) (2,434,908) - (2,434,908)
Investments - net of provision 670,307,894 445,318,501 1,115,626,395 671,162,174 144,788,434 815,950,608
Surplus on revaluation of available
for sale securities 22.2 3,311,811 5,980,887 9,292,698 12,665,549 9,647,338 22,312,887
Surplus / (deficit) on revaluation of held for trading
securities 9.4 34 2,173 2,207 (1,221) - (1,221)
Total investments 673,619,739 451,301,561 1,124,921,300 683,826,502 154,435,772 838,262,274
---------------------------------------------------------- (Rupees in '000) ----------------------------------------------------------
2017 2016
21
NOTES TO AND FORMING PART OF THE CONSOLIDATED FINANCIAL STATEMENTS
FOR THE YEAR ENDED DECEMBER 31, 2017
Note 2017 2016
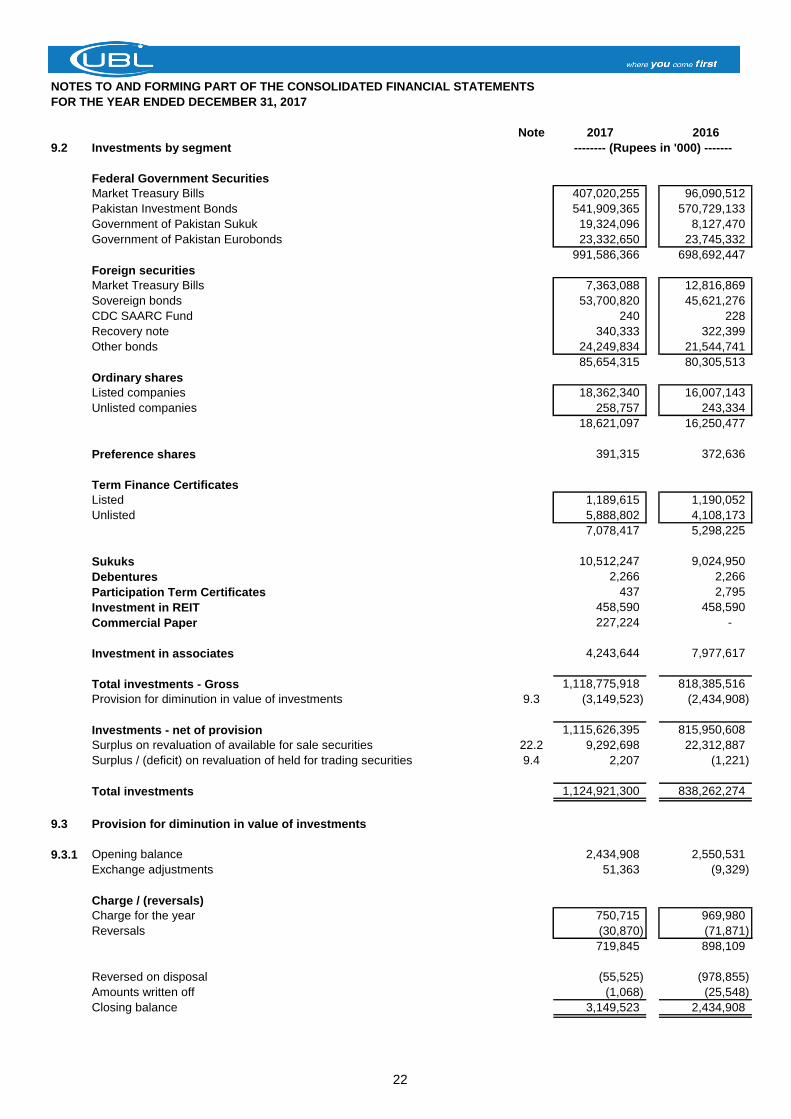
9.2 Investments by segment
Federal Government Securities
Market Treasury Bills 407,020,255 96,090,512
Pakistan Investment Bonds 541,909,365 570,729,133
Government of Pakistan Sukuk 19,324,096 8,127,470
Government of Pakistan Eurobonds 23,332,650 23,745,332
991,586,366 698,692,447
Foreign securities
Market Treasury Bills 7,363,088 12,816,869
Sovereign bonds 53,700,820 45,621,276
CDC SAARC Fund 240 228
Recovery note 340,333 322,399
Other bonds 24,249,834 21,544,741
85,654,315 80,305,513
Ordinary shares
Listed companies 18,362,340 16,007,143
Unlisted companies 258,757 243,334
18,621,097 16,250,477
Preference shares 391,315 372,636
Term Finance Certificates
Listed 1,189,615 1,190,052
Unlisted 5,888,802 4,108,173
7,078,417 5,298,225
Sukuks 10,512,247 9,024,950
Debentures 2,266 2,266
Participation Term Certificates 437 2,795
Investment in REIT 458,590 458,590
Commercial Paper 227,224 -
Investment in associates 4,243,644 7,977,617
Total investments - Gross 1,118,775,918 818,385,516
Provision for diminution in value of investments 9.3 (3,149,523) (2,434,908)
Investments - net of provision 1,115,626,395 815,950,608
Surplus on revaluation of available for sale securities 22.2 9,292,698 22,312,887
Surplus / (deficit) on revaluation of held for trading securities 9.4 2,207 (1,221)
Total investments 1,124,921,300 838,262,274
9.3 Provision for diminution in value of investments
9.3.1 Opening balance 2,434,908 2,550,531
Exchange adjustments 51,363 (9,329)
Charge / (reversals)
Charge for the year 750,715 969,980
Reversals (30,870) (71,871)
719,845 898,109
Reversed on disposal (55,525) (978,855)
Amounts written off (1,068) (25,548)
Closing balance 3,149,523 2,434,908
-------- (Rupees in '000) -------
22
NOTES TO AND FORMING PART OF THE CONSOLIDATED FINANCIAL STATEMENTS
FOR THE YEAR ENDED DECEMBER 31, 2017
2017 2016
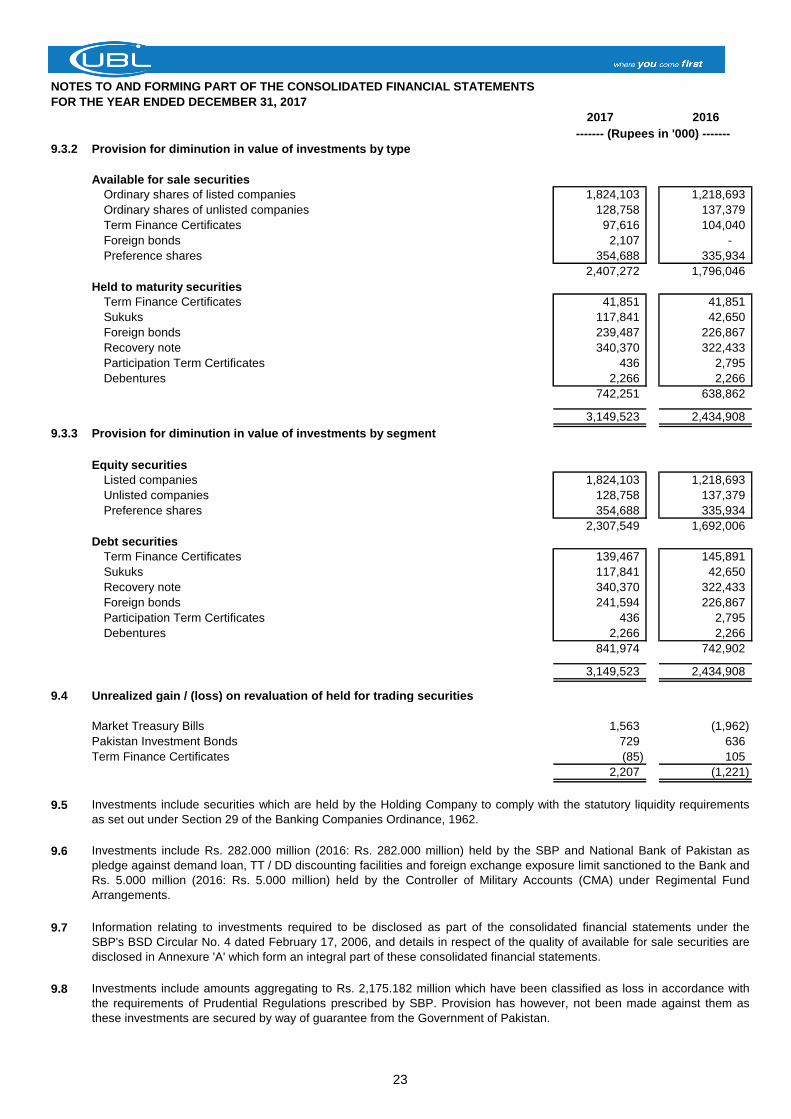
9.3.2 Provision for diminution in value of investments by type
Available for sale securities
Ordinary shares of listed companies 1,824,103 1,218,693
Ordinary shares of unlisted companies 128,758 137,379
Term Finance Certificates 97,616 104,040
Foreign bonds 2,107 -
Preference shares 354,688 335,934
2,407,272 1,796,046
Held to maturity securities
Term Finance Certificates 41,851 41,851
Sukuks 117,841 42,650
Foreign bonds 239,487 226,867
Recovery note 340,370 322,433
Participation Term Certificates 436 2,795
Debentures 2,266 2,266
742,251 638,862
3,149,523 2,434,908
9.3.3 Provision for diminution in value of investments by segment
Equity securities
Listed companies 1,824,103 1,218,693
Unlisted companies 128,758 137,379
Preference shares 354,688 335,934
2,307,549 1,692,006
Debt securities
Term Finance Certificates 139,467 145,891
Sukuks 117,841 42,650
Recovery note 340,370 322,433
Foreign bonds 241,594 226,867
Participation Term Certificates 436 2,795
Debentures 2,266 2,266
841,974 742,902
3,149,523 2,434,908
9.4 Unrealized gain / (loss) on revaluation of held for trading securities
Market Treasury Bills 1,563 (1,962)
Pakistan Investment Bonds 729 636
Term Finance Certificates (85) 105
2,207 (1,221)
9.5
9.6
9.7
9.8
Information relating to investments required to be disclosed as part of the consolidated financial statements under the
SBP's BSD Circular No. 4 dated February 17, 2006, and details in respect of the quality of available for sale securities are
disclosed in Annexure 'A' which form an integral part of these consolidated financial statements.
------- (Rupees in '000) -------
Investments include Rs. 282.000 million (2016: Rs. 282.000 million) held by the SBP and National Bank of Pakistan as
pledge against demand loan, TT / DD discounting facilities and foreign exchange exposure limit sanctioned to the Bank and
Rs. 5.000 million (2016: Rs. 5.000 million) held by the Controller of Military Accounts (CMA) under Regimental Fund
Arrangements.
Investments include securities which are held by the Holding Company to comply with the statutory liquidity requirements
as set out under Section 29 of the Banking Companies Ordinance, 1962.
Investments include amounts aggregating to Rs. 2,175.182 million which have been classified as loss in accordance with
the requirements of Prudential Regulations prescribed by SBP. Provision has however, not been made against them as
these investments are secured by way of guarantee from the Government of Pakistan.
23
NOTES TO AND FORMING PART OF THE CONSOLIDATED FINANCIAL STATEMENTS
FOR THE YEAR ENDED DECEMBER 31, 2017
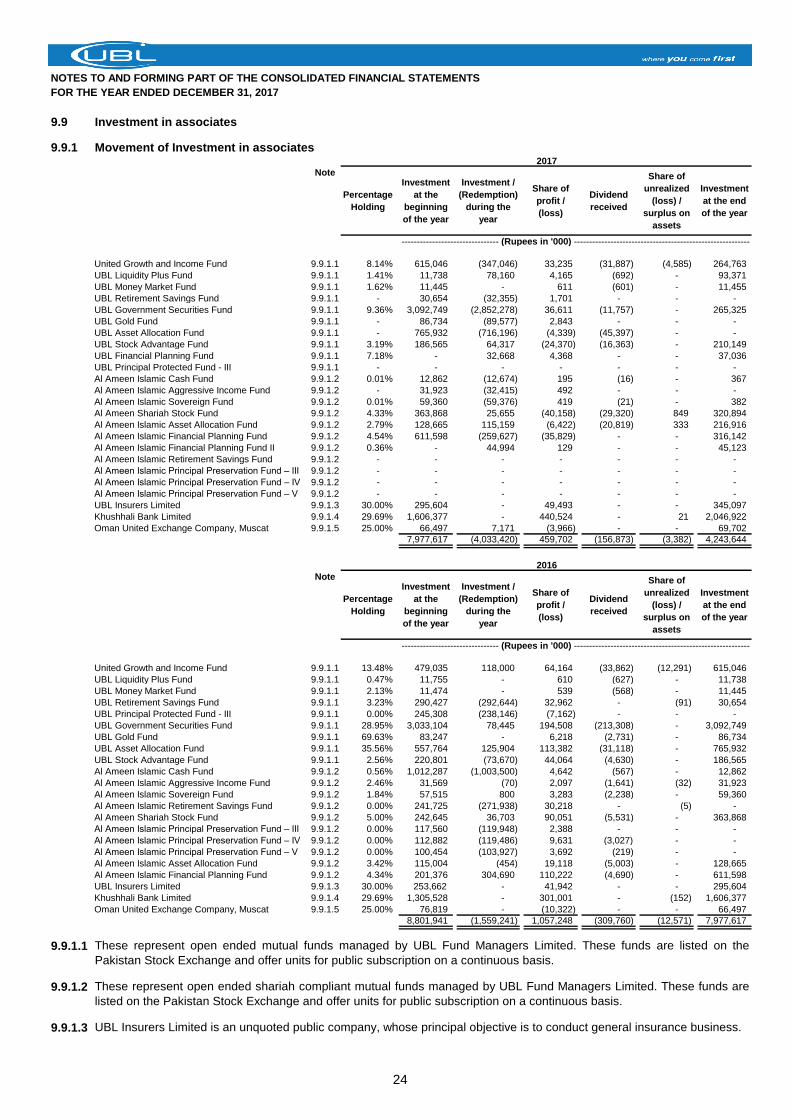
9.9 Investment in associates
9.9.1 Movement of Investment in associates2017
Note
Percentage
Holding
Investment
at the
beginning
of the year
Investment /
(Redemption)
during the
year
Share of
profit /
(loss)
Dividend
received
Share of
unrealized
(loss) /
surplus on
assets
Investment
at the end
of the year
United Growth and Income Fund 9.9.1.1 8.14% 615,046 (347,046) 33,235 (31,887) (4,585) 264,763
UBL Liquidity Plus Fund 9.9.1.1 1.41% 11,738 78,160 4,165 (692) - 93,371
UBL Money Market Fund 9.9.1.1 1.62% 11,445 - 611 (601) - 11,455
UBL Retirement Savings Fund 9.9.1.1 - 30,654 (32,355) 1,701 - - -
UBL Government Securities Fund 9.9.1.1 9.36% 3,092,749 (2,852,278) 36,611 (11,757) - 265,325
UBL Gold Fund 9.9.1.1 - 86,734 (89,577) 2,843 - - -
UBL Asset Allocation Fund 9.9.1.1 - 765,932 (716,196) (4,339) (45,397) - -
UBL Stock Advantage Fund 9.9.1.1 3.19% 186,565 64,317 (24,370) (16,363) - 210,149
UBL Financial Planning Fund 9.9.1.1 7.18% - 32,668 4,368 - - 37,036
UBL Principal Protected Fund - III 9.9.1.1 - - - - - - -
Al Ameen Islamic Cash Fund 9.9.1.2 0.01% 12,862 (12,674) 195 (16) - 367
Al Ameen Islamic Aggressive Income Fund 9.9.1.2 - 31,923 (32,415) 492 - - -
Al Ameen Islamic Sovereign Fund 9.9.1.2 0.01% 59,360 (59,376) 419 (21) - 382
Al Ameen Shariah Stock Fund 9.9.1.2 4.33% 363,868 25,655 (40,158) (29,320) 849 320,894
Al Ameen Islamic Asset Allocation Fund 9.9.1.2 2.79% 128,665 115,159 (6,422) (20,819) 333 216,916
Al Ameen Islamic Financial Planning Fund 9.9.1.2 4.54% 611,598 (259,627) (35,829) - - 316,142
Al Ameen Islamic Financial Planning Fund II 9.9.1.2 0.36% - 44,994 129 - - 45,123
Al Ameen Islamic Retirement Savings Fund 9.9.1.2 - - - - - - -
Al Ameen Islamic Principal Preservation Fund – III 9.9.1.2 - - - - - - -
Al Ameen Islamic Principal Preservation Fund – IV 9.9.1.2 - - - - - - -
Al Ameen Islamic Principal Preservation Fund – V 9.9.1.2 - - - - - - -
UBL Insurers Limited 9.9.1.3 30.00% 295,604 - 49,493 - - 345,097
Khushhali Bank Limited 9.9.1.4 29.69% 1,606,377 - 440,524 - 21 2,046,922
Oman United Exchange Company, Muscat 9.9.1.5 25.00% 66,497 7,171 (3,966) - - 69,702
7,977,617 (4,033,420) 459,702 (156,873) (3,382) 4,243,644
2016
Note
Percentage
Holding
Investment
at the
beginning
of the year
Investment /
(Redemption)
during the
year
Share of
profit /
(loss)
Dividend
received
Share of
unrealized
(loss) /
surplus on
assets
Investment
at the end
of the year
---------------------- (Rupees in '000) --------------------------------------
United Growth and Income Fund 9.9.1.1 13.48% 479,035 118,000 64,164 (33,862) (12,291) 615,046
UBL Liquidity Plus Fund 9.9.1.1 0.47% 11,755 - 610 (627) - 11,738
UBL Money Market Fund 9.9.1.1 2.13% 11,474 - 539 (568) - 11,445
UBL Retirement Savings Fund 9.9.1.1 3.23% 290,427 (292,644) 32,962 - (91) 30,654
UBL Principal Protected Fund - III 9.9.1.1 0.00% 245,308 (238,146) (7,162) - - -
UBL Government Securities Fund 9.9.1.1 28.95% 3,033,104 78,445 194,508 (213,308) - 3,092,749
UBL Gold Fund 9.9.1.1 69.63% 83,247 - 6,218 (2,731) - 86,734
UBL Asset Allocation Fund 9.9.1.1 35.56% 557,764 125,904 113,382 (31,118) - 765,932
UBL Stock Advantage Fund 9.9.1.1 2.56% 220,801 (73,670) 44,064 (4,630) - 186,565
Al Ameen Islamic Cash Fund 9.9.1.2 0.56% 1,012,287 (1,003,500) 4,642 (567) - 12,862
Al Ameen Islamic Aggressive Income Fund 9.9.1.2 2.46% 31,569 (70) 2,097 (1,641) (32) 31,923
Al Ameen Islamic Sovereign Fund 9.9.1.2 1.84% 57,515 800 3,283 (2,238) - 59,360
Al Ameen Islamic Retirement Savings Fund 9.9.1.2 0.00% 241,725 (271,938) 30,218 - (5) -
Al Ameen Shariah Stock Fund 9.9.1.2 5.00% 242,645 36,703 90,051 (5,531) - 363,868
Al Ameen Islamic Principal Preservation Fund – III 9.9.1.2 0.00% 117,560 (119,948) 2,388 - - -
Al Ameen Islamic Principal Preservation Fund – IV 9.9.1.2 0.00% 112,882 (119,486) 9,631 (3,027) - -
Al Ameen Islamic Principal Preservation Fund – V 9.9.1.2 0.00% 100,454 (103,927) 3,692 (219) - -
Al Ameen Islamic Asset Allocation Fund 9.9.1.2 3.42% 115,004 (454) 19,118 (5,003) - 128,665
Al Ameen Islamic Financial Planning Fund 9.9.1.2 4.34% 201,376 304,690 110,222 (4,690) - 611,598
UBL Insurers Limited 9.9.1.3 30.00% 253,662 - 41,942 - - 295,604
Khushhali Bank Limited 9.9.1.4 29.69% 1,305,528 - 301,001 - (152) 1,606,377
Oman United Exchange Company, Muscat 9.9.1.5 25.00% 76,819 - (10,322) - - 66,497
8,801,941 (1,559,241) 1,057,248 (309,760) (12,571) 7,977,617
9.9.1.1
9.9.1.2
9.9.1.3
These represent open ended mutual funds managed by UBL Fund Managers Limited. These funds are listed on the
Pakistan Stock Exchange and offer units for public subscription on a continuous basis.
These represent open ended shariah compliant mutual funds managed by UBL Fund Managers Limited. These funds are
listed on the Pakistan Stock Exchange and offer units for public subscription on a continuous basis.
UBL Insurers Limited is an unquoted public company, whose principal objective is to conduct general insurance business.
-------------------------------- (Rupees in '000) ----------------------------------------------------------
-------------------------------- (Rupees in '000) ----------------------------------------------------------
24
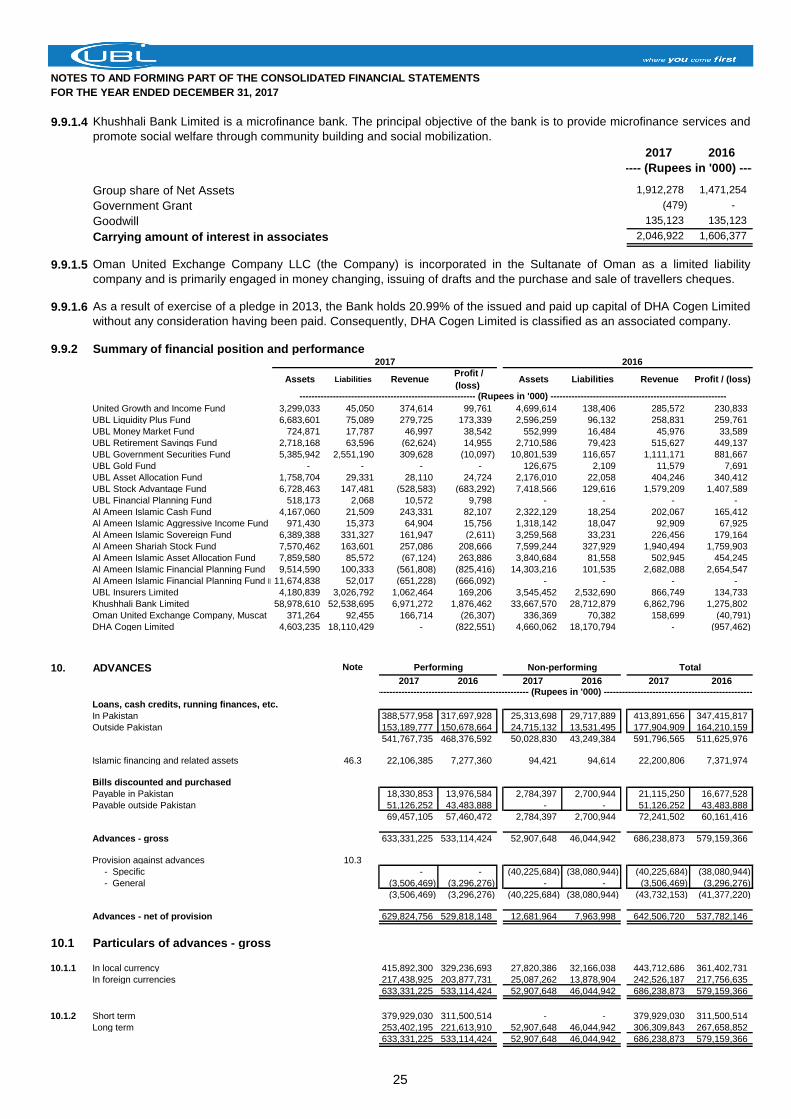
NOTES TO AND FORMING PART OF THE CONSOLIDATED FINANCIAL STATEMENTS
FOR THE YEAR ENDED DECEMBER 31, 2017
9.9.1.4
2017 2016
Group share of Net Assets 1,912,278 1,471,254
Government Grant (479) -
Goodwill 135,123 135,123
Carrying amount of interest in associates 2,046,922 1,606,377
9.9.1.5
9.9.1.6
9.9.2 Summary of financial position and performance2017 2016
Assets Liabilities Revenue Profit /
(loss) Assets Liabilities Revenue Profit / (loss)
United Growth and Income Fund 3,299,033 45,050 374,614 99,761 4,699,614 138,406 285,572 230,833
UBL Liquidity Plus Fund 6,683,601 75,089 279,725 173,339 2,596,259 96,132 258,831 259,761
UBL Money Market Fund 724,871 17,787 46,997 38,542 552,999 16,484 45,976 33,589
UBL Retirement Savings Fund 2,718,168 63,596 (62,624) 14,955 2,710,586 79,423 515,627 449,137
UBL Government Securities Fund 5,385,942 2,551,190 309,628 (10,097) 10,801,539 116,657 1,111,171 881,667
UBL Gold Fund - - - - 126,675 2,109 11,579 7,691
UBL Asset Allocation Fund 1,758,704 29,331 28,110 24,724 2,176,010 22,058 404,246 340,412
UBL Stock Advantage Fund 6,728,463 147,481 (528,583) (683,292) 7,418,566 129,616 1,579,209 1,407,589
UBL Financial Planning Fund 518,173 2,068 10,572 9,798 - - - -
Al Ameen Islamic Cash Fund 4,167,060 21,509 243,331 82,107 2,322,129 18,254 202,067 165,412
Al Ameen Islamic Aggressive Income Fund 971,430 15,373 64,904 15,756 1,318,142 18,047 92,909 67,925
Al Ameen Islamic Sovereign Fund 6,389,388 331,327 161,947 (2,611) 3,259,568 33,231 226,456 179,164
Al Ameen Shariah Stock Fund 7,570,462 163,601 257,086 208,666 7,599,244 327,929 1,940,494 1,759,903
Al Ameen Islamic Asset Allocation Fund 7,859,580 85,572 (67,124) 263,886 3,840,684 81,558 502,945 454,245
Al Ameen Islamic Financial Planning Fund 9,514,590 100,333 (561,808) (825,416) 14,303,216 101,535 2,682,088 2,654,547
Al Ameen Islamic Financial Planning Fund II 11,674,838 52,017 (651,228) (666,092) - - - -
UBL Insurers Limited 4,180,839 3,026,792 1,062,464 169,206 3,545,452 2,532,690 866,749 134,733
Khushhali Bank Limited 58,978,610 52,538,695 6,971,272 1,876,462 33,667,570 28,712,879 6,862,796 1,275,802
Oman United Exchange Company, Muscat 371,264 92,455 166,714 (26,307) 336,369 70,382 158,699 (40,791)
DHA Cogen Limited 4,603,235 18,110,429 - (822,551) 4,660,062 18,170,794 - (957,462)
10. ADVANCES Note
2017 2016 2017 2016 2017 2016
Loans, cash credits, running finances, etc.
In Pakistan 388,577,958 317,697,928 25,313,698 29,717,889 413,891,656 347,415,817
Outside Pakistan 153,189,777 150,678,664 24,715,132 13,531,495 177,904,909 164,210,159
541,767,735 468,376,592 50,028,830 43,249,384 591,796,565 511,625,976
Islamic financing and related assets 46.3 22,106,385 7,277,360 94,421 94,614 22,200,806 7,371,974
Bills discounted and purchased
Payable in Pakistan 18,330,853 13,976,584 2,784,397 2,700,944 21,115,250 16,677,528
Payable outside Pakistan 51,126,252 43,483,888 - - 51,126,252 43,483,888
69,457,105 57,460,472 2,784,397 2,700,944 72,241,502 60,161,416
Advances - gross 633,331,225 533,114,424 52,907,648 46,044,942 686,238,873 579,159,366
Provision against advances 10.3
- Specific - - (40,225,684) (38,080,944) (40,225,684) (38,080,944)
- General (3,506,469) (3,296,276) - - (3,506,469) (3,296,276)
(3,506,469) (3,296,276) (40,225,684) (38,080,944) (43,732,153) (41,377,220)
Advances - net of provision 629,824,756 529,818,148 12,681,964 7,963,998 642,506,720 537,782,146
10.1 Particulars of advances - gross
10.1.1 In local currency 415,892,300 329,236,693 27,820,386 32,166,038 443,712,686 361,402,731
In foreign currencies 217,438,925 203,877,731 25,087,262 13,878,904 242,526,187 217,756,635
633,331,225 533,114,424 52,907,648 46,044,942 686,238,873 579,159,366
10.1.2 Short term 379,929,030 311,500,514 - - 379,929,030 311,500,514
Long term 253,402,195 221,613,910 52,907,648 46,044,942 306,309,843 267,658,852
633,331,225 533,114,424 52,907,648 46,044,942 686,238,873 579,159,366
Khushhali Bank Limited is a microfinance bank. The principal objective of the bank is to provide microfinance services and
promote social welfare through community building and social mobilization.
Oman United Exchange Company LLC (the Company) is incorporated in the Sultanate of Oman as a limited liability
company and is primarily engaged in money changing, issuing of drafts and the purchase and sale of travellers cheques.
------- (Rupees in '000) -------
---------------------------------------------------------- (Rupees in '000) ----------------------------------------------------------
TotalNon-performingPerforming
As a result of exercise of a pledge in 2013, the Bank holds 20.99% of the issued and paid up capital of DHA Cogen Limited
without any consideration having been paid. Consequently, DHA Cogen Limited is classified as an associated company.
---------------------------------------------------------- (Rupees in '000) ----------------------------------------------------------
25
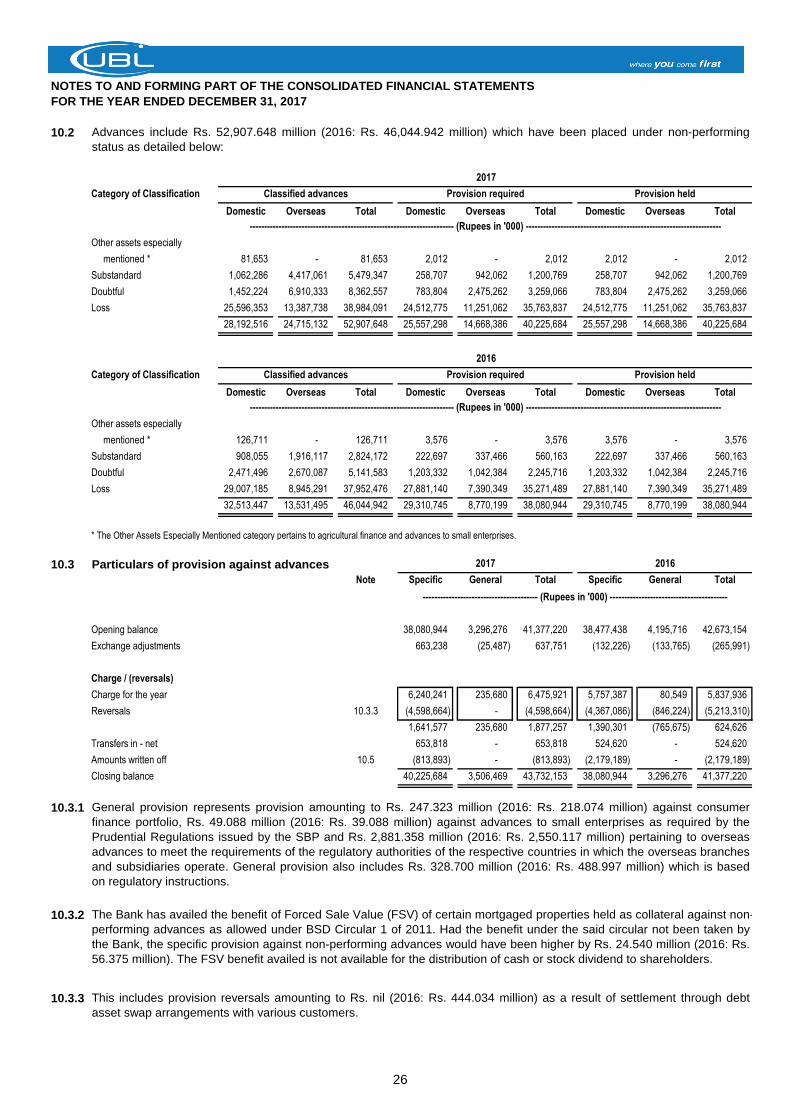
NOTES TO AND FORMING PART OF THE CONSOLIDATED FINANCIAL STATEMENTS
FOR THE YEAR ENDED DECEMBER 31, 2017
10.2
Domestic Overseas Total Domestic Overseas Total Domestic Overseas Total
Other assets especially
mentioned * 81,653 - 81,653 2,012 - 2,012 2,012 - 2,012
Substandard 1,062,286 4,417,061 5,479,347 258,707 942,062 1,200,769 258,707 942,062 1,200,769
Doubtful 1,452,224 6,910,333 8,362,557 783,804 2,475,262 3,259,066 783,804 2,475,262 3,259,066
Loss 25,596,353 13,387,738 38,984,091 24,512,775 11,251,062 35,763,837 24,512,775 11,251,062 35,763,837
28,192,516 24,715,132 52,907,648 25,557,298 14,668,386 40,225,684 25,557,298 14,668,386 40,225,684
Domestic Overseas Total Domestic Overseas Total Domestic Overseas Total
Other assets especially
mentioned * 126,711 - 126,711 3,576 - 3,576 3,576 - 3,576
Substandard 908,055 1,916,117 2,824,172 222,697 337,466 560,163 222,697 337,466 560,163
Doubtful 2,471,496 2,670,087 5,141,583 1,203,332 1,042,384 2,245,716 1,203,332 1,042,384 2,245,716
Loss 29,007,185 8,945,291 37,952,476 27,881,140 7,390,349 35,271,489 27,881,140 7,390,349 35,271,489
32,513,447 13,531,495 46,044,942 29,310,745 8,770,199 38,080,944 29,310,745 8,770,199 38,080,944
* The Other Assets Especially Mentioned category pertains to agricultural finance and advances to small enterprises.
10.3 Particulars of provision against advances
Note Specific General Total Specific General Total
Opening balance 38,080,944 3,296,276 41,377,220 38,477,438 4,195,716 42,673,154
Exchange adjustments 663,238 (25,487) 637,751 (132,226) (133,765) (265,991)
Charge / (reversals)
Charge for the year 6,240,241 235,680 6,475,921 5,757,387 80,549 5,837,936
Reversals 10.3.3 (4,598,664) - (4,598,664) (4,367,086) (846,224) (5,213,310)
1,641,577 235,680 1,877,257 1,390,301 (765,675) 624,626
Transfers in - net 653,818 - 653,818 524,620 - 524,620
Amounts written off 10.5 (813,893) - (813,893) (2,179,189) - (2,179,189)
Closing balance 40,225,684 3,506,469 43,732,153 38,080,944 3,296,276 41,377,220
10.3.1
10.3.2
10.3.3 This includes provision reversals amounting to Rs. nil (2016: Rs. 444.034 million) as a result of settlement through debt
asset swap arrangements with various customers.
Provision required
Provision requiredClassified advances
Provision heldClassified advancesCategory of Classification
Provision held
----------------------------------------------------------------------- (Rupees in '000) --------------------------------------------------------------------
General provision represents provision amounting to Rs. 247.323 million (2016: Rs. 218.074 million) against consumer
finance portfolio, Rs. 49.088 million (2016: Rs. 39.088 million) against advances to small enterprises as required by the
Prudential Regulations issued by the SBP and Rs. 2,881.358 million (2016: Rs. 2,550.117 million) pertaining to overseas
advances to meet the requirements of the regulatory authorities of the respective countries in which the overseas branches
and subsidiaries operate. General provision also includes Rs. 328.700 million (2016: Rs. 488.997 million) which is based
on regulatory instructions.
The Bank has availed the benefit of Forced Sale Value (FSV) of certain mortgaged properties held as collateral against non-
performing advances as allowed under BSD Circular 1 of 2011. Had the benefit under the said circular not been taken by
the Bank, the specific provision against non-performing advances would have been higher by Rs. 24.540 million (2016: Rs.
56.375 million). The FSV benefit availed is not available for the distribution of cash or stock dividend to shareholders.
2016
2017
Advances include Rs. 52,907.648 million (2016: Rs. 46,044.942 million) which have been placed under non-performing
status as detailed below:
---------------------------------------- (Rupees in '000) -----------------------------------------
20162017
----------------------------------------------------------------------- (Rupees in '000) --------------------------------------------------------------------
Category of Classification
26
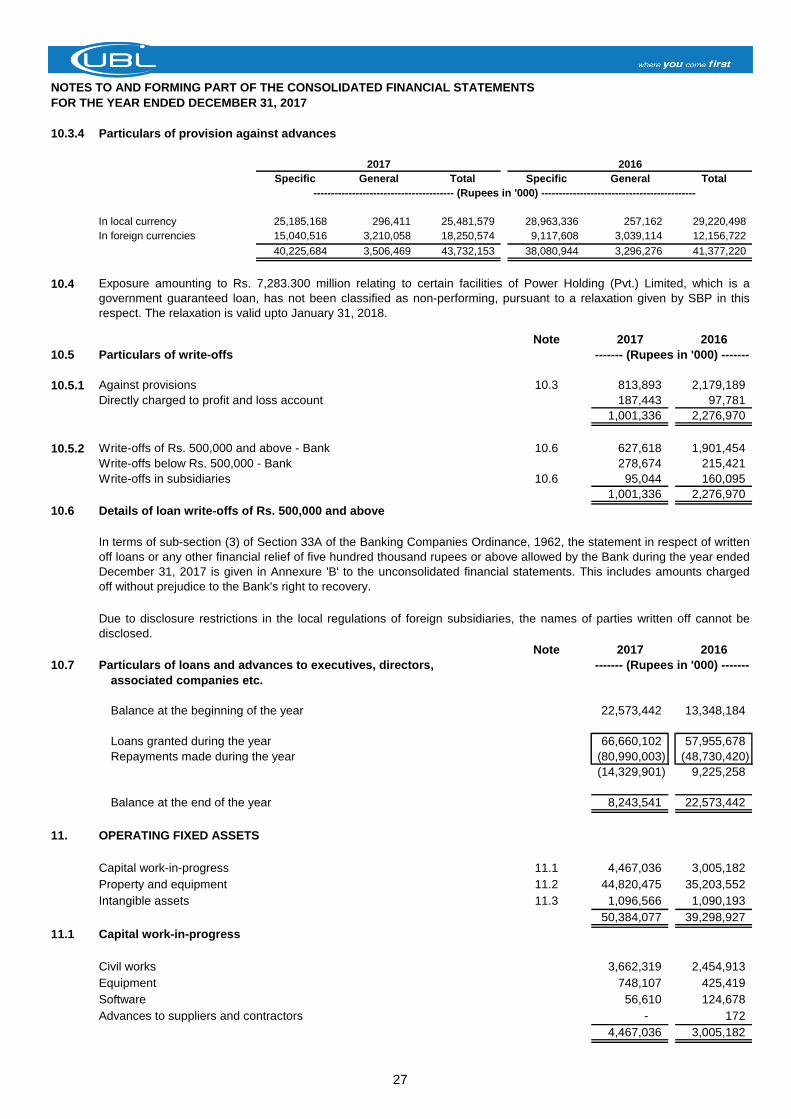
NOTES TO AND FORMING PART OF THE CONSOLIDATED FINANCIAL STATEMENTS
FOR THE YEAR ENDED DECEMBER 31, 2017
10.3.4 Particulars of provision against advances
Specific General Total Specific General Total
In local currency 25,185,168 296,411 25,481,579 28,963,336 257,162 29,220,498
In foreign currencies 15,040,516 3,210,058 18,250,574 9,117,608 3,039,114 12,156,722
40,225,684 3,506,469 43,732,153 38,080,944 3,296,276 41,377,220
10.4
Note 2017 2016
10.5 Particulars of write-offs
10.5.1 Against provisions 10.3 813,893 2,179,189
Directly charged to profit and loss account 187,443 97,781
1,001,336 2,276,970
10.5.2 Write-offs of Rs. 500,000 and above - Bank 10.6 627,618 1,901,454
Write-offs below Rs. 500,000 - Bank 278,674 215,421
Write-offs in subsidiaries 10.6 95,044 160,095
1,001,336 2,276,970
10.6 Details of loan write-offs of Rs. 500,000 and above
Note 2017 2016
10.7 Particulars of loans and advances to executives, directors,
associated companies etc.
Balance at the beginning of the year 22,573,442 13,348,184
Loans granted during the year 66,660,102 57,955,678
Repayments made during the year (80,990,003) (48,730,420)
(14,329,901) 9,225,258
Balance at the end of the year 8,243,541 22,573,442
11. OPERATING FIXED ASSETS
Capital work-in-progress 11.1 4,467,036 3,005,182
Property and equipment 11.2 44,820,475 35,203,552
Intangible assets 11.3 1,096,566 1,090,193
50,384,077 39,298,927
11.1 Capital work-in-progress
Civil works 3,662,319 2,454,913
Equipment 748,107 425,419
Software 56,610 124,678
Advances to suppliers and contractors - 172
4,467,036 3,005,182
20162017
------- (Rupees in '000) -------
---------------------------------------- (Rupees in '000) --------------------------------------------
------- (Rupees in '000) -------
In terms of sub-section (3) of Section 33A of the Banking Companies Ordinance, 1962, the statement in respect of written
off loans or any other financial relief of five hundred thousand rupees or above allowed by the Bank during the year ended
December 31, 2017 is given in Annexure 'B' to the unconsolidated financial statements. This includes amounts charged
off without prejudice to the Bank's right to recovery.
Due to disclosure restrictions in the local regulations of foreign subsidiaries, the names of parties written off cannot be
disclosed.
Exposure amounting to Rs. 7,283.300 million relating to certain facilities of Power Holding (Pvt.) Limited, which is a
government guaranteed loan, has not been classified as non-performing, pursuant to a relaxation given by SBP in this
respect. The relaxation is valid upto January 31, 2018.
27
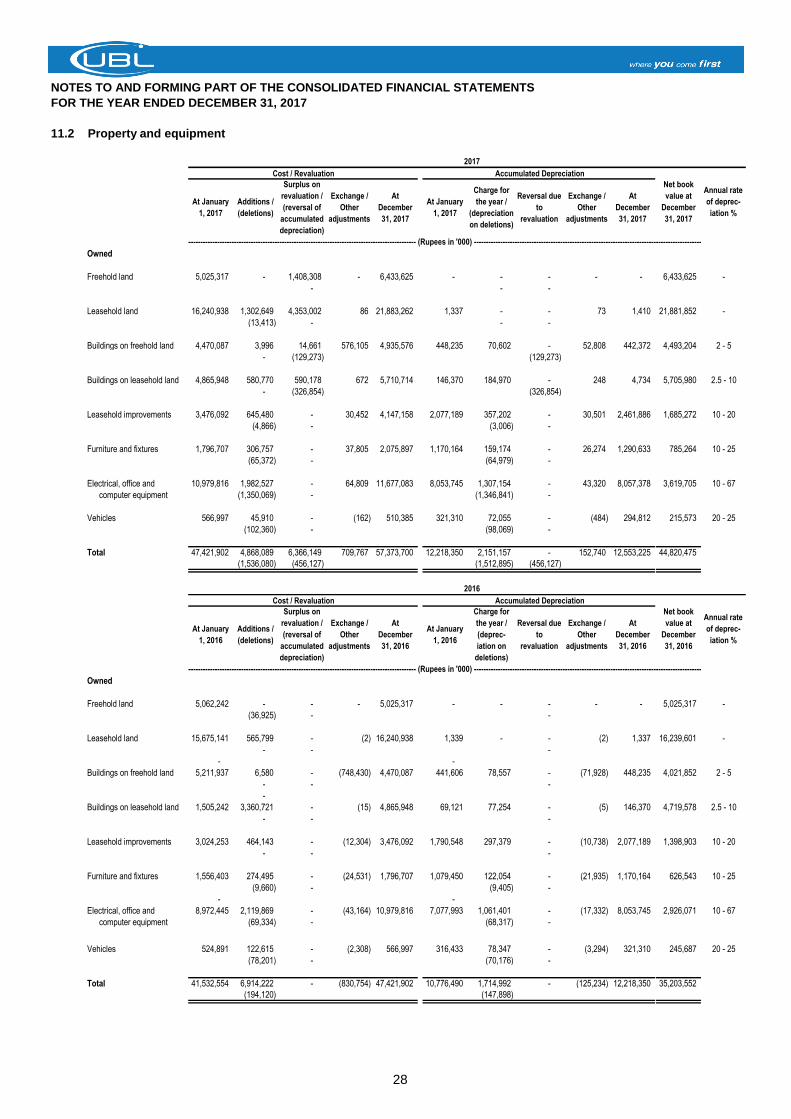
NOTES TO AND FORMING PART OF THE CONSOLIDATED FINANCIAL STATEMENTS
FOR THE YEAR ENDED DECEMBER 31, 2017
11.2 Property and equipment
Cost / Revaluation Accumulated Depreciation
Owned
Freehold land 5,025,317 - 1,408,308 - 6,433,625 - - - - - 6,433,625 -
- - -
Leasehold land 16,240,938 1,302,649 4,353,002 86 21,883,262 1,337 - - 73 1,410 21,881,852 -
(13,413) - - -
Buildings on freehold land 4,470,087 3,996 14,661 576,105 4,935,576 448,235 70,602 - 52,808 442,372 4,493,204 2 - 5
- (129,273) (129,273)
Buildings on leasehold land 4,865,948 580,770 590,178 672 5,710,714 146,370 184,970 - 248 4,734 5,705,980 2.5 - 10
- (326,854) (326,854)
Leasehold improvements 3,476,092 645,480 - 30,452 4,147,158 2,077,189 357,202 - 30,501 2,461,886 1,685,272 10 - 20
(4,866) - (3,006) -
Furniture and fixtures 1,796,707 306,757 - 37,805 2,075,897 1,170,164 159,174 - 26,274 1,290,633 785,264 10 - 25
(65,372) - (64,979) -
Electrical, office and 10,979,816 1,982,527 - 64,809 11,677,083 8,053,745 1,307,154 - 43,320 8,057,378 3,619,705 10 - 67
computer equipment (1,350,069) - (1,346,841) -
Vehicles 566,997 45,910 - (162) 510,385 321,310 72,055 - (484) 294,812 215,573 20 - 25
(102,360) - (98,069) -
Total 47,421,902 4,868,089 6,366,149 709,767 57,373,700 12,218,350 2,151,157 - 152,740 12,553,225 44,820,475
(1,536,080) (456,127) (1,512,895) (456,127)
Cost / Revaluation Accumulated Depreciation
Owned
Freehold land 5,062,242 - - - 5,025,317 - - - - - 5,025,317 -
(36,925) - -
Leasehold land 15,675,141 565,799 - (2) 16,240,938 1,339 - - (2) 1,337 16,239,601 -
- - -
- -
Buildings on freehold land 5,211,937 6,580 - (748,430) 4,470,087 441,606 78,557 - (71,928) 448,235 4,021,852 2 - 5
- - -
-
Buildings on leasehold land 1,505,242 3,360,721 - (15) 4,865,948 69,121 77,254 - (5) 146,370 4,719,578 2.5 - 10
- - -
Leasehold improvements 3,024,253 464,143 - (12,304) 3,476,092 1,790,548 297,379 - (10,738) 2,077,189 1,398,903 10 - 20
- - -
Furniture and fixtures 1,556,403 274,495 - (24,531) 1,796,707 1,079,450 122,054 - (21,935) 1,170,164 626,543 10 - 25
(9,660) - (9,405) -
- -
Electrical, office and 8,972,445 2,119,869 - (43,164) 10,979,816 7,077,993 1,061,401 - (17,332) 8,053,745 2,926,071 10 - 67
computer equipment (69,334) - (68,317) -
Vehicles 524,891 122,615 - (2,308) 566,997 316,433 78,347 - (3,294) 321,310 245,687 20 - 25
(78,201) - (70,176) -
Total 41,532,554 6,914,222 - (830,754) 47,421,902 10,776,490 1,714,992 - (125,234) 12,218,350 35,203,552
(194,120) (147,898)
2017
Exchange /
Other
adjustments
At
December
31, 2017
Net book
value at
December
31, 2017
Charge for
the year /
(deprec-
iation on
deletions)
Surplus on
revaluation /
(reversal of
accumulated
depreciation)
Surplus on
revaluation /
(reversal of
accumulated
depreciation)
Reversal due
to
revaluation
Reversal due
to
revaluation
------------------------------------------------------------------------------------------------------ (Rupees in '000) ------------------------------------------------------------------------------------------------------
At January
1, 2017
Exchange /
Other
adjustments
At
December
31, 2016
2016
Annual rate
of deprec-
iation %
At January
1, 2017
Additions /
(deletions)
Exchange /
Other
adjustments
At
December
31, 2017
Annual rate
of deprec-
iation %
Net book
value at
December
31, 2016
Exchange /
Other
adjustments
At January
1, 2016
Additions /
(deletions)
At
December
31, 2016
Charge for
the year /
(depreciation
on deletions)
------------------------------------------------------------------------------------------------------ (Rupees in '000) ------------------------------------------------------------------------------------------------------
At January
1, 2016
28
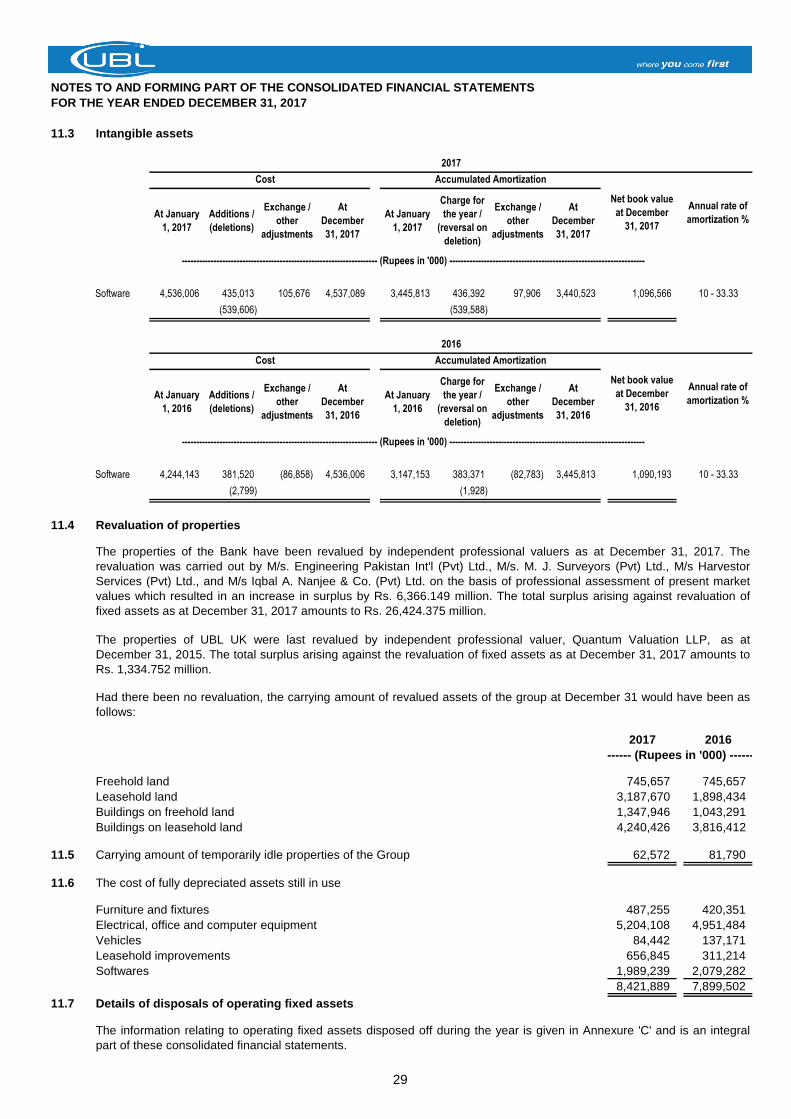
NOTES TO AND FORMING PART OF THE CONSOLIDATED FINANCIAL STATEMENTS
FOR THE YEAR ENDED DECEMBER 31, 2017
11.3 Intangible assets
Software 4,536,006 435,013 105,676 4,537,089 3,445,813 436,392 97,906 3,440,523 1,096,566 10 - 33.33
(539,606) (539,588)
Software 4,244,143 381,520 (86,858) 4,536,006 3,147,153 383,371 (82,783) 3,445,813 1,090,193 10 - 33.33
(2,799) (1,928)
11.4 Revaluation of properties
2017 2016
Freehold land 745,657 745,657
Leasehold land 3,187,670 1,898,434
Buildings on freehold land 1,347,946 1,043,291
Buildings on leasehold land 4,240,426 3,816,412
11.5 Carrying amount of temporarily idle properties of the Group 62,572 81,790
11.6 The cost of fully depreciated assets still in use
Furniture and fixtures 487,255 420,351
Electrical, office and computer equipment 5,204,108 4,951,484
Vehicles 84,442 137,171
Leasehold improvements 656,845 311,214
Softwares 1,989,239 2,079,282
8,421,889 7,899,502
11.7 Details of disposals of operating fixed assets
The information relating to operating fixed assets disposed off during the year is given in Annexure 'C' and is an integral
part of these consolidated financial statements.
Accumulated Amortization
------- (Rupees in '000) -------
-------------------------------------------------------------------- (Rupees in '000) --------------------------------------------------------------------
At
December
31, 2016
Exchange /
other
adjustments
Exchange /
other
adjustments
At
December
31, 2016
Accumulated Amortization
-------------------------------------------------------------------- (Rupees in '000) --------------------------------------------------------------------
Cost
Net book value
at December
31, 2016
Annual rate of
amortization %At January
1, 2016
Additions /
(deletions)
Net book value
at December
31, 2017
Annual rate of
amortization %
2017
2016
At January
1, 2017
Additions /
(deletions)
Exchange /
other
adjustments
At
December
31, 2017
At January
1, 2017
Charge for
the year /
(reversal on
deletion)
Cost
Exchange /
other
adjustments
At
December
31, 2017
At January
1, 2016
Charge for
the year /
(reversal on
deletion)
The properties of UBL UK were last revalued by independent professional valuer, Quantum Valuation LLP, as at
December 31, 2015. The total surplus arising against the revaluation of fixed assets as at December 31, 2017 amounts to
Rs. 1,334.752 million.
The properties of the Bank have been revalued by independent professional valuers as at December 31, 2017. The
revaluation was carried out by M/s. Engineering Pakistan Int'l (Pvt) Ltd., M/s. M. J. Surveyors (Pvt) Ltd., M/s Harvestor
Services (Pvt) Ltd., and M/s Iqbal A. Nanjee & Co. (Pvt) Ltd. on the basis of professional assessment of present market
values which resulted in an increase in surplus by Rs. 6,366.149 million. The total surplus arising against revaluation of
fixed assets as at December 31, 2017 amounts to Rs. 26,424.375 million.
Had there been no revaluation, the carrying amount of revalued assets of the group at December 31 would have been as
follows:
29
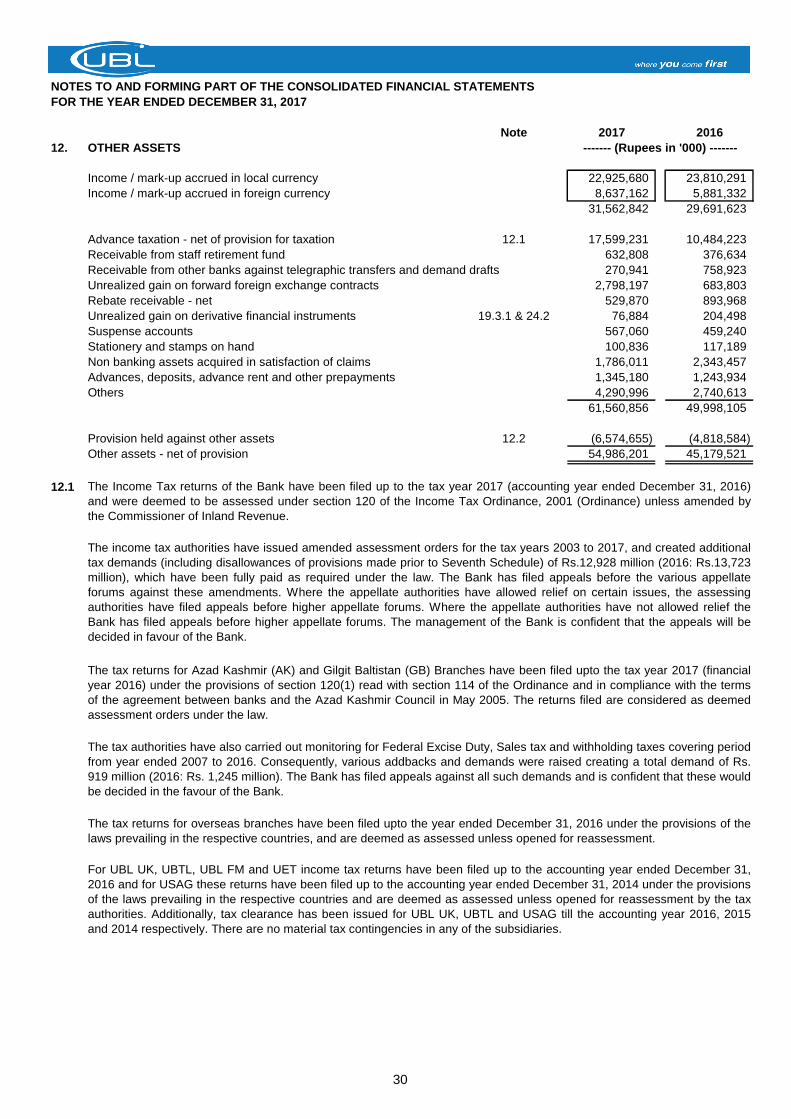
NOTES TO AND FORMING PART OF THE CONSOLIDATED FINANCIAL STATEMENTS
FOR THE YEAR ENDED DECEMBER 31, 2017
Note 2017 2016
12. OTHER ASSETS
Income / mark-up accrued in local currency 22,925,680 23,810,291
Income / mark-up accrued in foreign currency 8,637,162 5,881,332
31,562,842 29,691,623
Advance taxation - net of provision for taxation 12.1 17,599,231 10,484,223
Receivable from staff retirement fund 632,808 376,634
Receivable from other banks against telegraphic transfers and demand drafts 270,941 758,923
Unrealized gain on forward foreign exchange contracts 2,798,197 683,803
Rebate receivable - net 529,870 893,968
Unrealized gain on derivative financial instruments 19.3.1 & 24.2 76,884 204,498
Suspense accounts 567,060 459,240
Stationery and stamps on hand 100,836 117,189
Non banking assets acquired in satisfaction of claims 1,786,011 2,343,457
Advances, deposits, advance rent and other prepayments 1,345,180 1,243,934
Others 4,290,996 2,740,613
61,560,856 49,998,105
Provision held against other assets 12.2 (6,574,655) (4,818,584)
Other assets - net of provision 54,986,201 45,179,521
12.1
------- (Rupees in '000) -------
The tax returns for overseas branches have been filed upto the year ended December 31, 2016 under the provisions of the
laws prevailing in the respective countries, and are deemed as assessed unless opened for reassessment.
For UBL UK, UBTL, UBL FM and UET income tax returns have been filed up to the accounting year ended December 31,
2016 and for USAG these returns have been filed up to the accounting year ended December 31, 2014 under the provisions
of the laws prevailing in the respective countries and are deemed as assessed unless opened for reassessment by the tax
authorities. Additionally, tax clearance has been issued for UBL UK, UBTL and USAG till the accounting year 2016, 2015
and 2014 respectively. There are no material tax contingencies in any of the subsidiaries.
The tax authorities have also carried out monitoring for Federal Excise Duty, Sales tax and withholding taxes covering period
from year ended 2007 to 2016. Consequently, various addbacks and demands were raised creating a total demand of Rs.
919 million (2016: Rs. 1,245 million). The Bank has filed appeals against all such demands and is confident that these would
be decided in the favour of the Bank.
The tax returns for Azad Kashmir (AK) and Gilgit Baltistan (GB) Branches have been filed upto the tax year 2017 (financial
year 2016) under the provisions of section 120(1) read with section 114 of the Ordinance and in compliance with the terms
of the agreement between banks and the Azad Kashmir Council in May 2005. The returns filed are considered as deemed
assessment orders under the law.
The income tax authorities have issued amended assessment orders for the tax years 2003 to 2017, and created additional
tax demands (including disallowances of provisions made prior to Seventh Schedule) of Rs.12,928 million (2016: Rs.13,723
million), which have been fully paid as required under the law. The Bank has filed appeals before the various appellate
forums against these amendments. Where the appellate authorities have allowed relief on certain issues, the assessing
authorities have filed appeals before higher appellate forums. Where the appellate authorities have not allowed relief the
Bank has filed appeals before higher appellate forums. The management of the Bank is confident that the appeals will be
decided in favour of the Bank.
The Income Tax returns of the Bank have been filed up to the tax year 2017 (accounting year ended December 31, 2016)
and were deemed to be assessed under section 120 of the Income Tax Ordinance, 2001 (Ordinance) unless amended by
the Commissioner of Inland Revenue.
30
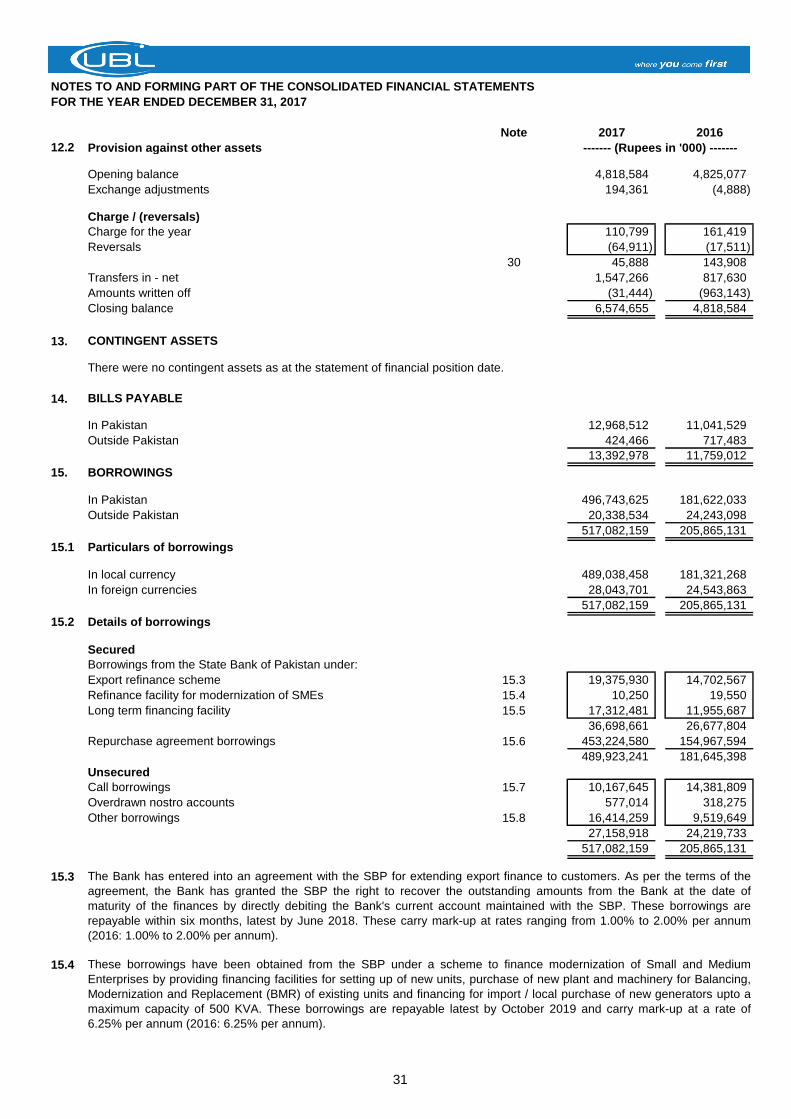
NOTES TO AND FORMING PART OF THE CONSOLIDATED FINANCIAL STATEMENTS
FOR THE YEAR ENDED DECEMBER 31, 2017
Note 2017 2016
12.2 Provision against other assets
Opening balance 4,818,584 4,825,077
Exchange adjustments 194,361 (4,888)
Charge / (reversals)
Charge for the year 110,799 161,419
Reversals (64,911) (17,511)
30 45,888 143,908
Transfers in - net 1,547,266 817,630
Amounts written off (31,444) (963,143)
Closing balance 6,574,655 4,818,584
13. CONTINGENT ASSETS
There were no contingent assets as at the statement of financial position date.
14. BILLS PAYABLE
In Pakistan 12,968,512 11,041,529
Outside Pakistan 424,466 717,483
13,392,978 11,759,012
15. BORROWINGS
In Pakistan 496,743,625 181,622,033
Outside Pakistan 20,338,534 24,243,098
517,082,159 205,865,131
15.1 Particulars of borrowings
In local currency 489,038,458 181,321,268
In foreign currencies 28,043,701 24,543,863
517,082,159 205,865,131
15.2 Details of borrowings
Secured
Borrowings from the State Bank of Pakistan under:
Export refinance scheme 15.3 19,375,930 14,702,567
Refinance facility for modernization of SMEs 15.4 10,250 19,550
Long term financing facility 15.5 17,312,481 11,955,687
36,698,661 26,677,804
Repurchase agreement borrowings 15.6 453,224,580 154,967,594
489,923,241 181,645,398
Unsecured
Call borrowings 15.7 10,167,645 14,381,809
Overdrawn nostro accounts 577,014 318,275
Other borrowings 15.8 16,414,259 9,519,649
27,158,918 24,219,733
517,082,159 205,865,131
15.3
15.4
The Bank has entered into an agreement with the SBP for extending export finance to customers. As per the terms of the
agreement, the Bank has granted the SBP the right to recover the outstanding amounts from the Bank at the date of
maturity of the finances by directly debiting the Bank's current account maintained with the SBP. These borrowings are
repayable within six months, latest by June 2018. These carry mark-up at rates ranging from 1.00% to 2.00% per annum
(2016: 1.00% to 2.00% per annum).
These borrowings have been obtained from the SBP under a scheme to finance modernization of Small and Medium
Enterprises by providing financing facilities for setting up of new units, purchase of new plant and machinery for Balancing,
Modernization and Replacement (BMR) of existing units and financing for import / local purchase of new generators upto a
maximum capacity of 500 KVA. These borrowings are repayable latest by October 2019 and carry mark-up at a rate of
6.25% per annum (2016: 6.25% per annum).
------- (Rupees in '000) -------
31
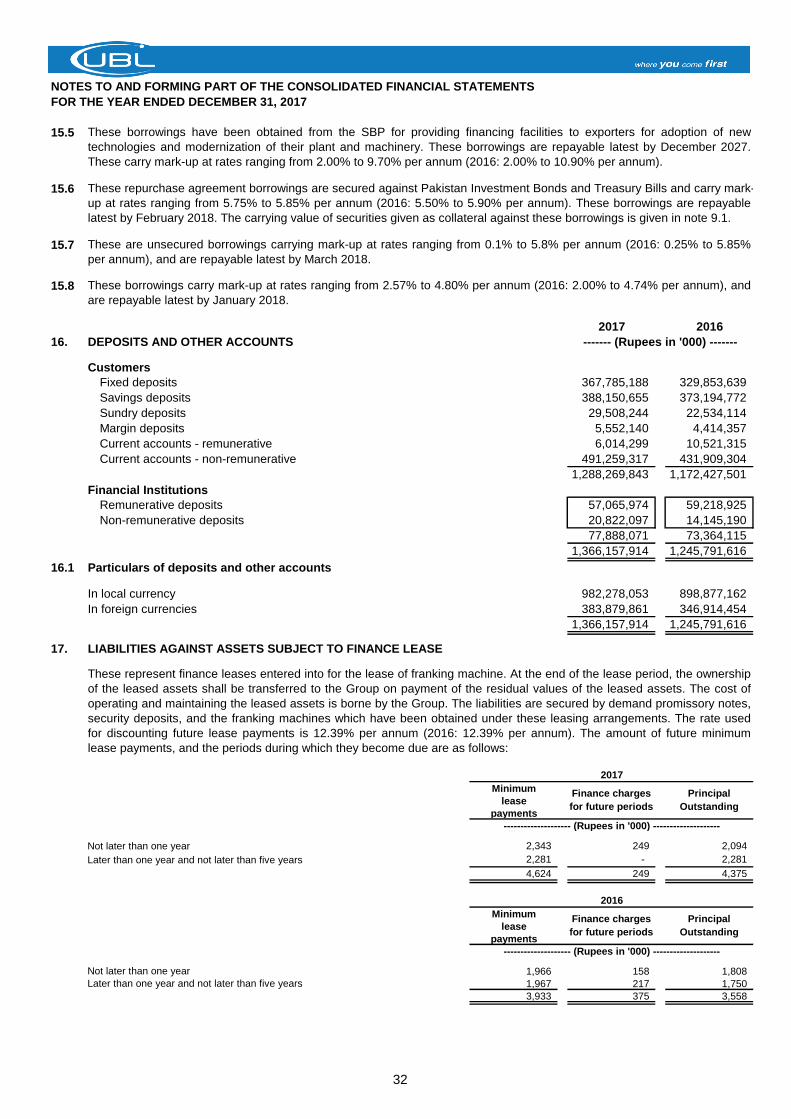
NOTES TO AND FORMING PART OF THE CONSOLIDATED FINANCIAL STATEMENTS
FOR THE YEAR ENDED DECEMBER 31, 2017
15.5
15.6
15.7
15.8
2017 2016
16. DEPOSITS AND OTHER ACCOUNTS
Customers
Fixed deposits 367,785,188 329,853,639
Savings deposits 388,150,655 373,194,772
Sundry deposits 29,508,244 22,534,114
Margin deposits 5,552,140 4,414,357
Current accounts - remunerative 6,014,299 10,521,315
Current accounts - non-remunerative 491,259,317 431,909,304
1,288,269,843 1,172,427,501
Financial Institutions
Remunerative deposits 57,065,974 59,218,925
Non-remunerative deposits 20,822,097 14,145,190
77,888,071 73,364,115
1,366,157,914 1,245,791,616
16.1 Particulars of deposits and other accounts
In local currency 982,278,053 898,877,162
In foreign currencies 383,879,861 346,914,454
1,366,157,914 1,245,791,616
17. LIABILITIES AGAINST ASSETS SUBJECT TO FINANCE LEASE
Minimum
lease
payments
Not later than one year 2,343 249 2,094
Later than one year and not later than five years 2,281 - 2,281
4,624 249 4,375
Minimum
lease
payments
Not later than one year 1,966 158 1,808
Later than one year and not later than five years 1,967 217 1,750
3,933 375 3,558
These borrowings have been obtained from the SBP for providing financing facilities to exporters for adoption of new
technologies and modernization of their plant and machinery. These borrowings are repayable latest by December 2027.
These carry mark-up at rates ranging from 2.00% to 9.70% per annum (2016: 2.00% to 10.90% per annum).
Finance charges
for future periods
Principal
Outstanding
These repurchase agreement borrowings are secured against Pakistan Investment Bonds and Treasury Bills and carry mark-
up at rates ranging from 5.75% to 5.85% per annum (2016: 5.50% to 5.90% per annum). These borrowings are repayable
latest by February 2018. The carrying value of securities given as collateral against these borrowings is given in note 9.1.
These are unsecured borrowings carrying mark-up at rates ranging from 0.1% to 5.8% per annum (2016: 0.25% to 5.85%
per annum), and are repayable latest by March 2018.
-------------------- (Rupees in '000) --------------------
2017
Finance charges
for future periods
Principal
Outstanding
-------------------- (Rupees in '000) --------------------
These borrowings carry mark-up at rates ranging from 2.57% to 4.80% per annum (2016: 2.00% to 4.74% per annum), and
are repayable latest by January 2018.
These represent finance leases entered into for the lease of franking machine. At the end of the lease period, the ownership
of the leased assets shall be transferred to the Group on payment of the residual values of the leased assets. The cost of
operating and maintaining the leased assets is borne by the Group. The liabilities are secured by demand promissory notes,
security deposits, and the franking machines which have been obtained under these leasing arrangements. The rate used
for discounting future lease payments is 12.39% per annum (2016: 12.39% per annum). The amount of future minimum
lease payments, and the periods during which they become due are as follows:
------- (Rupees in '000) -------
2016
32
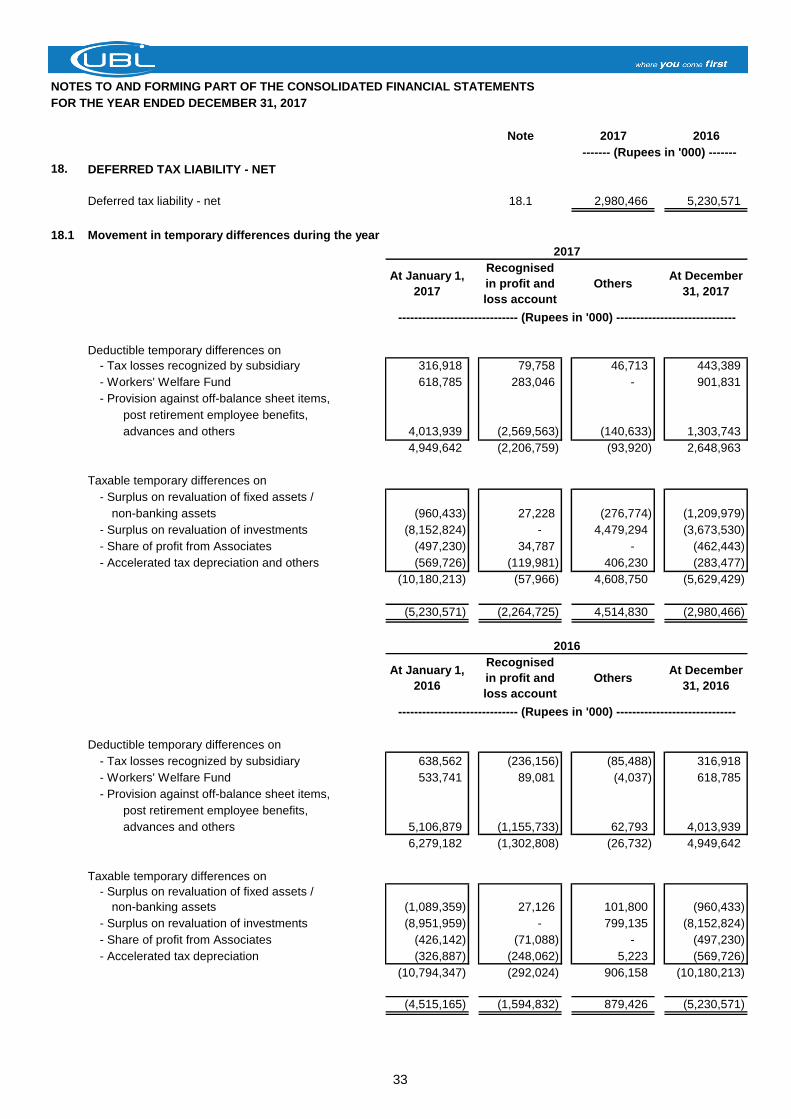
NOTES TO AND FORMING PART OF THE CONSOLIDATED FINANCIAL STATEMENTS
FOR THE YEAR ENDED DECEMBER 31, 2017
Note 2017 2016
18. DEFERRED TAX LIABILITY - NET
Deferred tax liability - net 18.1 2,980,466 5,230,571
18.1 Movement in temporary differences during the year
2017
Deductible temporary differences on
- Tax losses recognized by subsidiary 316,918 79,758 46,713 443,389
- Workers' Welfare Fund 618,785 283,046 - 901,831
- Provision against off-balance sheet items,
post retirement employee benefits,
advances and others 4,013,939 (2,569,563) (140,633) 1,303,743
4,949,642 (2,206,759) (93,920) 2,648,963
Taxable temporary differences on
- Surplus on revaluation of fixed assets /
non-banking assets (960,433) 27,228 (276,774) (1,209,979)
- Surplus on revaluation of investments (8,152,824) - 4,479,294 (3,673,530)
- Share of profit from Associates (497,230) 34,787 - (462,443)
- Accelerated tax depreciation and others (569,726) (119,981) 406,230 (283,477)
(10,180,213) (57,966) 4,608,750 (5,629,429)
(5,230,571) (2,264,725) 4,514,830 (2,980,466)
2016
Deductible temporary differences on
- Tax losses recognized by subsidiary 638,562 (236,156) (85,488) 316,918
- Workers' Welfare Fund 533,741 89,081 (4,037) 618,785
- Provision against off-balance sheet items,
post retirement employee benefits,
advances and others 5,106,879 (1,155,733) 62,793 4,013,939
6,279,182 (1,302,808) (26,732) 4,949,642
Taxable temporary differences on
- Surplus on revaluation of fixed assets /
non-banking assets (1,089,359) 27,126 101,800 (960,433)
- Surplus on revaluation of investments (8,951,959) - 799,135 (8,152,824)
- Share of profit from Associates (426,142) (71,088) - (497,230)
- Accelerated tax depreciation (326,887) (248,062) 5,223 (569,726)
(10,794,347) (292,024) 906,158 (10,180,213)
(4,515,165) (1,594,832) 879,426 (5,230,571)
------------------------------ (Rupees in '000) ------------------------------
At January 1,
2017
Recognised
in profit and
loss account
OthersAt December
31, 2017
------- (Rupees in '000) -------
At January 1,
2016
Recognised
in profit and
loss account
OthersAt December
31, 2016
------------------------------ (Rupees in '000) ------------------------------
33
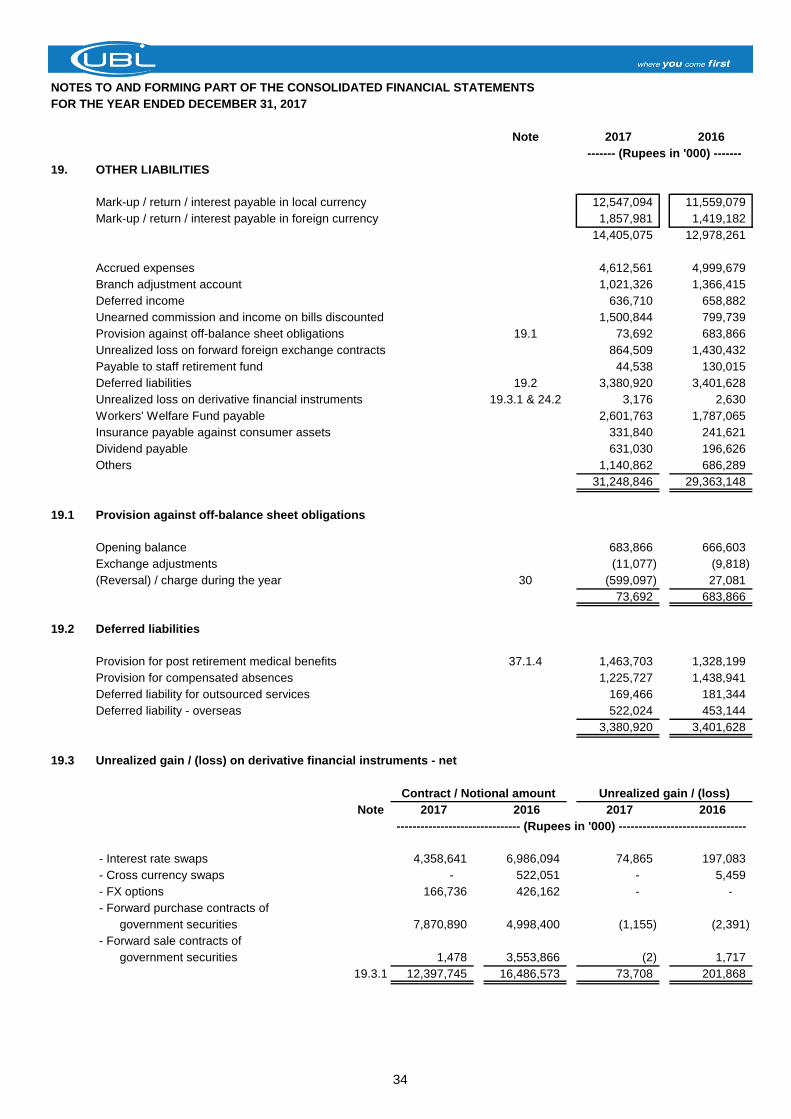
NOTES TO AND FORMING PART OF THE CONSOLIDATED FINANCIAL STATEMENTS
FOR THE YEAR ENDED DECEMBER 31, 2017
Note 2017 2016
19. OTHER LIABILITIES
Mark-up / return / interest payable in local currency 12,547,094 11,559,079
Mark-up / return / interest payable in foreign currency 1,857,981 1,419,182
14,405,075 12,978,261
Accrued expenses 4,612,561 4,999,679
Branch adjustment account 1,021,326 1,366,415
Deferred income 636,710 658,882
Unearned commission and income on bills discounted 1,500,844 799,739
Provision against off-balance sheet obligations 19.1 73,692 683,866
Unrealized loss on forward foreign exchange contracts 864,509 1,430,432
Payable to staff retirement fund 44,538 130,015
Deferred liabilities 19.2 3,380,920 3,401,628
Unrealized loss on derivative financial instruments 19.3.1 & 24.2 3,176 2,630
Workers' Welfare Fund payable 2,601,763 1,787,065
Insurance payable against consumer assets 331,840 241,621
Dividend payable 631,030 196,626
Others 1,140,862 686,289
31,248,846 29,363,148
19.1 Provision against off-balance sheet obligations
Opening balance 683,866 666,603
Exchange adjustments (11,077) (9,818)
(Reversal) / charge during the year 30 (599,097) 27,081
73,692 683,866
19.2 Deferred liabilities
Provision for post retirement medical benefits 37.1.4 1,463,703 1,328,199
Provision for compensated absences 1,225,727 1,438,941
Deferred liability for outsourced services 169,466 181,344
Deferred liability - overseas 522,024 453,144
3,380,920 3,401,628
19.3 Unrealized gain / (loss) on derivative financial instruments - net
Note 2017 2016 2017 2016
- Interest rate swaps 4,358,641 6,986,094 74,865 197,083
- Cross currency swaps - 522,051 - 5,459
- FX options 166,736 426,162 - -
- Forward purchase contracts of
government securities 7,870,890 4,998,400 (1,155) (2,391)
- Forward sale contracts of
government securities 1,478 3,553,866 (2) 1,717
19.3.1 12,397,745 16,486,573 73,708 201,868
------------------------------- (Rupees in '000) --------------------------------
------- (Rupees in '000) -------
Contract / Notional amount Unrealized gain / (loss)
34
NOTES TO AND FORMING PART OF THE CONSOLIDATED FINANCIAL STATEMENTS
FOR THE YEAR ENDED DECEMBER 31, 2017
2017 2016
Note
19.3.1 Unrealized gain / (loss) on derivative financial instruments - net
Unrealized gain on derivative financial instruments 12 76,884 204,498
Unrealized loss on derivative financial instruments 19 (3,176) (2,630)
24.2 73,708 201,868
20. SHARE CAPITAL
20.1 Authorized Capital
2017 2016 2017 2016
2,000,000,000 2,000,000,000 Ordinary shares of Rs.10 each 20,000,000 20,000,000
20.2 Issued, subscribed and paid-up capital
2017 2016 2017 2016
Fully paid-up ordinary shares of Rs.10 each
518,000,000 518,000,000 Issued for cash 5,180,000 5,180,000
706,179,687 706,179,687 Issued as bonus shares 7,061,798 7,061,798
1,224,179,687 1,224,179,687 12,241,798 12,241,798
20.3
20.4 Major shareholders (holding more than 5% of total paid-up capital)
Number of Percentage of Number of Percentage of
Name of shareholders shares held shareholding shares held shareholding
Bestway (Holdings) Limited 631,728,895 51.60% 631,728,895 51.60%
Bestway Cement Limited 93,649,744 7.65% 93,649,744 7.65%
2017 2016
20.5 Shares of the Bank held by its associates ------- (Number of shares) -------
UBL Asset Allocation Fund 225,900 114,200
UBL Stock Advantage Fund 1,645,800 1,153,000
1,871,700 1,267,200
----- Number of shares -----
--------- (Rupees in '000) ---------
Holders of GDRs are entitled, subject to the provisions of the depository agreement, to receive dividends, if any, and rank
pari passu with other equity shareholders in respect of such entitlement. However, the holders of GDRs have no voting
rights or other direct rights of shareholders with respect to the ordinary shares underlying such GDRs. Subject to the terms
and restrictions set out in the offering circular dated June 25, 2007, the deposited ordinary shares in respect of which the
GDRs were issued may be withdrawn by the GDR holders from the depository facility. Upon withdrawal, the holders will
rank pari passu with other ordinary shareholders in respect of voting powers. As at December 31, 2017, 1,318,827 (2016:
1,845,734) GDRs, representing 5,275,310 (2016: 7,382,938) shares were in issue.
----- Number of shares -----
20162017
------- (Rupees in '000) -------
In 2007, the Bank was admitted to the official list of the UK Listing Authority and to the London Stock Exchange
Professional Securities Market for trading of Global Depository Receipts (GDRs), each representing four ordinary shares
issued by the Bank. The GDRs constitute an offering in the United States only to qualified institutional buyers in reliance
on Rule 144A under the U.S Securities Act of 1933 and an offering outside the United States in reliance on Regulation S.
------- (Rupees in '000) -------
As at December 31, 2017, Bestway Group (Bestway) held 61.46% (2016: 61.46%) shareholding (including GDRs) of the
Bank.
35
NOTES TO AND FORMING PART OF THE CONSOLIDATED FINANCIAL STATEMENTS
FOR THE YEAR ENDED DECEMBER 31, 2017
Note 2017 2016
21. NON-CONTROLLING INTEREST
United National Bank Limited (UBL UK) 21.1 4,794,057 4,214,942
UBL Fund Managers Limited 16,462 12,751
4,810,519 4,227,693
21.1 Key financial information before intra group eliminations
Assets 76,936,191 66,522,162
Liabilities 64,779,488 56,297,741
Net Assets 12,156,703 10,224,421
Income (Mark-up & Non Mark-up) 2,540,816 2,868,660
Expenses (including provisions) (2,444,231) (1,863,326)
Profit for the year 96,585 1,005,334
22. SURPLUS ON REVALUATION OF ASSETS - NET OF DEFERRED TAX
Surplus / (deficit) arising on revaluation of assets - net of tax
Fixed assets / non-banking assets
- Group's share 27,007,532 20,714,664
- Non-controlling interest 958,856 827,457
22.1 27,966,388 21,542,121
Available for sale securities
- Group's share 5,896,699 14,601,472
- Non-controlling interest (277,531) (441,409)
22.2 5,619,168 14,160,063
Surplus / (deficit) arising on revaluation of assets of associates 660 3,353
33,586,216 35,705,537
22.1 Surplus on revaluation of fixed assets / non-banking assets
Surplus on revaluation of fixed assets / non-banking assets as at January 1 22,502,554 22,883,840
Revaluation of fixed assets / non-banking assets during the year 6,399,394 169,861
Exchange adjustments 353,662 (472,395)
Transferred to unappropriated profit in respect of incremental
depreciation charged during the year - net of deferred tax (52,015) (51,626)
Related deferred tax liability on incremental depreciation charged
during the year 18.1 (27,228) (27,126)
6,673,813 (381,286)
29,176,367 22,502,554
Less: Related deferred tax liability on:
Less: Revaluation as on January 1 960,433 1,089,359
Less: Revaluation of fixed assets / non-banking assets during the year 216,535 (7,174)
Less: Exchange adjustments 60,239 (92,660)
Less: Incremental depreciation charged on related assets (27,228) (29,092)
18.1 1,209,979 960,433
27,966,388 21,542,121
22.2 Surplus / (deficit) on revaluation of available for sale securities
Market Treasury Bills (3,034) (9,729)
Pakistan Investment Bonds 6,285,489 14,625,102
Listed shares 1,780,430 7,432,242
REIT Scheme - (5,420)
Term Finance Certificates, Sukuks, other bonds etc. 28,475 104,054
Foreign bonds 1,201,338 166,638
9,292,698 22,312,887
Related deferred tax liability 18.1 (3,673,530) (8,152,824)
5,619,168 14,160,063
------- (Rupees in '000) -------
36
NOTES TO AND FORMING PART OF THE CONSOLIDATED FINANCIAL STATEMENTS
FOR THE YEAR ENDED DECEMBER 31, 2017
Note 2017 2016
23. CONTINGENCIES AND COMMITMENTS
23.1 Direct credit substitutes
Contingent liabilities in respect of guarantees given favouring:
Government 15,500,693 10,418,980
Banking companies and other financial institutions 1,064,067 1,320,355
Others 5,425,848 6,209,086
21,990,608 17,948,421
23.2 Transaction-related contingent liabilities
Contingent liabilities in respect of performance bonds, bid bonds, warranties, etc. given favouring:
Government 128,096,424 114,871,452
Banking companies and other financial institutions 8,408,147 7,068,771
Others 57,090,192 38,194,938
193,594,763 160,135,161
23.3 Trade-related contingent liabilities
Contingent liabilities in respect of letters of credit opened favouring:
Government 74,060,985 68,523,943
Banking companies and other financial institutions 8,732,484 6,512,864
Others 112,409,643 99,848,165
195,203,112 174,884,972
23.4 Other contingencies
Claims against the Group not acknowledged as debts 23.4.1 12,918,162 12,490,082
23.4.1
23.4.2
23.4.3
------- (Rupees in '000) -------
Based on legal advice and / or internal assessments, management is confident that the matters will be decided in favour of
the Group and the possibility of any outcome against the Group is remote and accordingly no provision has been made in
these consolidated financial statements.
These mainly represent counter claims filed by the borrowers for restricting the Group from disposal of assets (such as
mortgaged / pledged assets kept as security).
Penalties amounting to Rs. 4.058 billion have been levied by the FE Adjudication Court of the State Bank of Pakistan
relating to alleged contraventions of the requirements of foreign exchange regulations with respect to issuance and
certification of E-Forms by the Bank to certain customers (exporters) who failed to submit the export documents
thereagainst. Consequently, foreign exchange on account of export proceeds have not been repatriated. The Bank
maintains that it fully discharged its liability, in accordance with the law and has filed a civil suit in the High Court of Sindh
challenging the levy of the penalty. The High Court has granted a stay on action being taken against the Bank. The
management, based on the advice from legal counsel, is confident that the view of the Bank will prevail and the Bank will
not be exposed to any loss on this account.
On November 10, 2016, a judgement was passed by the Supreme Court (SC) declaring the insertions of amendments in
WWF Ordinance through Finance Act 2008 as unlawful. The Board of Directors of UBL FM in their meeting held on May 29,
2013, had resolved that accumulated unrecorded WWF provision from the date of its application till May 29, 2013 on all
the funds under management amounting to Rs. 296.124 million will be borne by the Holding Company in case the said
accumulated amount is required to be paid to the Government authorities. The tax department has filed review petition
against the order of the SC which is currently pending.
37
NOTES TO AND FORMING PART OF THE CONSOLIDATED FINANCIAL STATEMENTS
FOR THE YEAR ENDED DECEMBER 31, 2017
23.4.4
23.4.5
23.4.6
23.5 For contingencies relating to taxation, refer note 12.1 and for an update on pension matter, refer note 48.2.
23.6 Commitments to extend credit
2017 2016
23.7 Commitments in respect of forward foreign exchange contracts
Purchase 242,093,757 216,641,748
Sale 213,172,200 193,057,693
23.8 Commitments in respect of derivatives
Interest rate swaps 4,358,641 6,986,094
Cross currency swaps - 522,051
FX options - purchased 83,368 213,081
FX options - sold 83,368 213,081
Forward purchase of government securities 7,870,890 4,998,400
Forward sale of government securities 1,478 3,553,866
The Group makes commitments to extend credit in the normal course of its business but these being revocable
commitments do not attract any significant penalty or expense if the facility is unilaterally withdrawn.
United Bank Limited Yemen (“UBL”) issued two Standby Letters of Credit (SBLCs) for USD 12 million (Rs. 1,325 million)
and USD 13 million (Rs. 1,435 million) in favour of Ministry of Oil and Minerals, Yemen (MOM) against the counter SBLCs
of a foreign bank. In March 2015, the counter party to the underlying performance agreement notified MOM of suspension
of the SBLCs due to force majeure. In September 2015, MOM filed a law suit against UBL at the Preliminary Commercial
Court in Sana’a, Yemen claiming payment of both SBLCs for the total sum of USD 25 million (Rs. 2,760 million).
During the course of the last year, no major debate was held as all hearings of the commercial case were adjourned to
subsequent dates, due to either non-appearance of legal counsel of MOM or non-submission of responses by MOM, as
required by legal counsel of UBL. As per provisions of Yemeni procedural law, if 60 days lapse from the last hearing without
the case being reinitiated/followed up by the plaintiff, the case shall be considered as if not filed and all procedures have to
be re-initiated afresh. In light of the foregoing provision of law, and non-follow up by MOM for over 60 days, UBL counsel
submitted a motion to dismiss the case. On September 25, 2017 the Honourable judge presiding over the commercial case
filed by MOM against UBL in Yemen, accepted UBL’s motion to drop the case. In light of the foregoing, the case filed by
MOM against UBL in Yemen stands dismissed. Although the case against UBL, Yemen has been dismissed by the
Honourable judge, the said dismissal is on the basis of a procedural lapse by MOM in pursuing the case, and not on the
actual merits. Hence MOM can reinitiate the case against UBL afresh.
The ICC Award has also been announced whereby ICC has accepted the request of Reliance to declare Force Mejure as
per the terms of the Production Sharing Agreement (PSA) between Reliance and MOM. In terms of the ICC Award, the
PSA stands cancelled.
Based on the legal advice of the Bank's legal counsel in Yemen and in view of facts surrounding the matter, management
is of the view that it is unlikely that there will be any financial impact on the Group.
UBL & its New York Branch have entered into a written Agreement in 2013 with the Federal Reserve Bank of New York
(FRBNY) to address certain compliance and risk management matters relating primarily to compliance with Anti Money
Laundering Regulations including the Banking Secrecy Act. Management is in the process of addressing the matters
highlighted in the Written Agreement and in the subsequent inspections. While the Bank seeks to comply with all possible
laws and regulations and at this stage there is no indication of any financial impact, it is not possible to ascertain the
eventual outcome of these matters.
------- (Rupees in '000) -------
Punjab Revenue Authority issued show cause notice to UBL Fund Managers Limited requiring them to pay sales tax under
Punjab sales tax on service act 2012 on management fee earned in Punjab from May 22, 2013. The Company has filed a
petition on July 8, 2015 in the High Court of Sindh. A favourable outcome of this petition is expected.
38
NOTES TO AND FORMING PART OF THE CONSOLIDATED FINANCIAL STATEMENTS
FOR THE YEAR ENDED DECEMBER 31, 2017
2017 2016
23.9 Commitments in respect of capital expenditure 1,987,978 2,755,836
24. DERIVATIVE INSTRUMENTS
With regard to derivatives, the RMC is authorized to:
-
- Review the Derivatives Business Policy and recommend approval to the BRCC / BoD.
- Review and approve derivatives product programs.
- Authorize changes in procedures and processes regarding derivatives and structured products.
Derivatives risk management
There are a number of risks undertaken by the Group, which need to be monitored and assessed.
Credit risk
Market risk
Derivatives are a type of financial contract, the value of which is determined by reference to one or more underlying assets
or indices. The major categories of such contracts include forwards, futures, swaps and options. Derivatives also include
structured financial products that have one or more of the characteristics of forwards, futures, swaps and options.
The Bank, as an Authorized Derivative Dealer (ADD), is an active participant in the Pakistan derivatives market and offers a
wide variety of derivatives products covering both hedging and market making to satisfy customers’ needs. Where required,
specific approval is sought from the SBP for each transaction.
------- (Rupees in '000) -------
The Group, as a policy, hedges back-to-back all Options transactions. In addition, the Group does not carry any exchange
risk on its Cross Currency Swaps portfolio as it hedges the exposure in the interbank market. To manage the interest rate
risk of Interest Rate Derivatives, the Group has implemented various limits which are monitored and reported by TMO on a
daily basis.
Review the derivatives business with reference to market risk exposure and assign various limits in accordance with
the risk appetite of the Bank.
Credit risk refers to the risk of non-performance or default by a party to a derivatives transaction, resulting in an adverse
impact on the Group’s profitability. Credit risk associated with derivatives transactions is categorized into settlement risk
and pre-settlement risk. Credit proposals for derivatives transactions are approved by the Credit Committee. The credit
exposure of each counterparty is estimated and monitored against approved counterparty limits by TMO on a daily basis.
The authority for approving policies lies with the Board of Directors (BoD) and the Board Risk and Compliance Committee
(BRCC). The Risk Management Committee (RMC) is responsible for ensuring compliance with these policies.
Overall responsibility for derivatives trading activity lies with the Treasury and Capital Markets Group. Measurement and
monitoring of market and credit risk exposure and limits and its reporting to senior management and the BoD is done by
Treasury Middle Office (TMO), which also coordinates with the business regarding approvals for derivatives risk limits.
Treasury Operations records derivatives activity in the Bank’s books, and handles its reporting to the SBP.
39
NOTES TO AND FORMING PART OF THE CONSOLIDATED FINANCIAL STATEMENTS
FOR THE YEAR ENDED DECEMBER 31, 2017
Liquidity risk
Derivatives transactions, usually being non-funded in nature, do not carry a specific funding liquidity risk.
Operational risk
24.1 Product analysis
With Banks for
Hedging 1 413,071 - - 6 83,368 - - - - 496,439
Market making 1 316,499 - - - - 5 7,870,890 2 1,478 8,188,867
2 729,570 - - 6 83,368 5 7,870,890 2 1,478 8,685,306
With other entities
Market making 5 3,629,071 - - 6 83,368 - - - - 3,712,439
Total
Hedging 1 413,071 - - 6 83,368 - - - - 496,439
Market making 6 3,945,570 - - 6 83,368 5 7,870,890 2 1,478 11,901,306
7 4,358,641 - - 12 166,736 5 7,870,890 2 1,478 12,397,745
With Banks for
Hedging 2 669,047 - - 4 213,081 - - - - 882,128
Market making 1 34,866 1 522,051 - - 1 4,998,400 2 3,553,866 9,109,183
3 703,913 1 522,051 4 213,081 1 4,998,400 2 3,553,866 9,991,311
With other entities
Market making 5 6,282,181 - - 4 213,081 - - - - 6,495,262
Total
Hedging 2 669,047 - - 4 213,081 - - - - 882,128
Market making 6 6,317,047 1 522,051 4 213,081 1 4,998,400 2 3,553,866 15,604,445
8 6,986,094 1 522,051 8 426,162 1 4,998,400 2 3,553,866 16,486,573
Total
Notional
Principal
The staff involved in the trading, settlement and risk management of derivatives are carefully trained to deal with the
complexities involved in the process. Adequate systems and controls are in place to carry out derivatives transactions
smoothly. Each transaction is processed in accordance with the product program or a transaction memo, which contains
detailed guidance on the accounting and operational aspects of the transaction to further mitigate operational risk. In
addition, TMO and the Compliance and Control Department are assigned the responsibility of monitoring any deviation from
policies and procedures. The Group’s Audit and Inspection group also reviews this function, with a regular review of
systems, transactional processes, accounting practices and end-user roles and responsibilities.
The Group uses a derivatives system which provides an end-to-end valuation solution, supports the routine transactional
process and provides analytical tools to measure various risk exposures, carry out stress tests and sensitivity analysis.
TMO produces various reports on a periodic basis which are reviewed by senior management. These reports provide
details of the derivatives business profile such as outstanding positions, profitability, risk exposures and the status of
compliance with limits.
Number of
contracts
Notional
principal
Number of
contracts
Notional
principal
Total
Notional
Principal
Number of
contracts
(Rupees in
'000)
(Rupees in
'000)
(Rupees in
'000)
(Rupees in
'000)
(Rupees in
'000)
(Rupees in
'000)
Notional
principal
Number of
contracts
Notional
principal
Number of
contracts
Notional
principal
Notional
principal
Number of
contracts
Notional
principal
(Rupees in
'000)
(Rupees in
'000)
(Rupees in
'000)
(Rupees in
'000)
(Rupees in
'000)
Number of
contracts
(Rupees in
'000)
Notional
principal
2017
Forward purchase
contracts of government
securities
Interest rate swaps
Forward purchase
contracts of government
securities
2016
Interest rate swaps
Number of
contracts
Notional
principal
The liquidity risk arises from the fact that in Pakistan, interest rate derivatives generally have a uni-directional demand, and
no perfect hedge is available. The Group mitigates its risk by limiting the portfolio in terms of tenor, notional and sensitivity
limits, and can also hedge its risk by taking on and off balance sheet positions in the interbank market, where available.
FX options
FX optionsCross currency swaps
Cross currency swapsForward sale contracts of
government securities
Forward sale contracts of
government securities
Number of
contracts
Notional
principal
Number of
contracts
40
NOTES TO AND FORMING PART OF THE CONSOLIDATED FINANCIAL STATEMENTS
FOR THE YEAR ENDED DECEMBER 31, 2017
24.2 Maturity analysis of derivatives
(Loss) Gain Net
Upto 1 month 4 90,234 - - -
1 to 3 months 11 6,760,752 (3,173) - (3,173)
3 to 6 months 3 216,000 - 6,807 6,807
1 to 2 years 6 4,835,194 (3) 64,161 64,158
2 to 3 years 1 316,500 - 5,432 5,432
5 to 10 years 1 179,065 - 484 484
26 12,397,745 (3,176) 76,884 73,708
(Loss) Gain Net
Upto 1 month 7 8,765,347 (2,391) 1,717 (674)
1 to 3 months 5 735,133 - 5,459 5,459
3 to 6 months 2 69,732 (239) 251 12
1 to 2 years 3 648,000 - 46,347 46,347
2 to 3 years 3 6,268,361 - 150,724 150,724
20 16,486,573 (2,630) 204,498 201,868
2017 2016
25. MARK-UP / RETURN / INTEREST EARNED
On loans and advances to customers 35,119,920 32,034,440
On lendings to financial institutions
Call money lending 148,823 172,303
Securities purchased under resale agreements 472,376 138,814
Bai Muajjal with SBP / other financial institutions 427,359 47,028
Other lendings to financial institutions 1,082,399 966,180
2,130,957 1,324,325
On investments in
Held for trading securities 1,993,227 1,087,718
Available for sale securities 39,741,486 36,041,435
Held to maturity securities 31,275,559 31,026,195
73,010,272 68,155,348
On deposits with financial institutions 318,746 240,931
110,579,895 101,755,044
26. MARK-UP / RETURN / INTEREST EXPENSED
On deposits 32,805,964 30,478,543
On securities sold under repurchase agreements 16,786,983 10,197,470
On other short term borrowings 2,436,719 1,858,211
On long term borrowings 458,087 399,711
52,487,753 42,933,935
27. GAIN ON SALE OF SECURITIES - NET
Federal government securities
Market Treasury Bills 18,585 11,461
Pakistan Investment Bonds 3,612,720 3,507,471
3,631,305 3,518,932
Ordinary shares of listed companies 209,673 1,054,440
Other securities 956,708 1,036,209
4,797,686 5,609,581
2017
Remaining maturity Number of
contracts
Notional
principal
Unrealized
--------------------------------------------- (Rupees in '000) ------------------------------------------
------- (Rupees in '000) -------
2016
Remaining maturity Number of
contracts
Notional
principal
Unrealized
--------------------------------------------- (Rupees in '000) ------------------------------------------
41
NOTES TO AND FORMING PART OF THE CONSOLIDATED FINANCIAL STATEMENTS
FOR THE YEAR ENDED DECEMBER 31, 2017
Note 2017 2016
28. OTHER INCOME
Charges recovered 377,891 367,980
Rent on properties 245,731 249,644
Income from dealing in derivatives 32,793 93,351
Gain on sale of operating fixed assets - net 57,983 44,329
Gain on sale of Ijarah assets 96 44,685
Income from sale of non-banking asset 28.1 - 20,574
Gain on trading liabilities - net 65,834 95,701
780,328 916,264
28.1 The Group earned income of nil (2016: Rs. 20.574 million) against the sale of
following non-banking assets:
Commercial open plot situated in Faisalabad - 14,199
Agricultural open land situated in Lahore - 6,375
- 20,574
29. ADMINISTRATIVE EXPENSES
Salaries, allowances etc. 29.1 14,377,128 13,246,456
Charge for compensated absences 24,687 315,084
Medical expenses 713,410 616,182
Contribution to defined contribution plan 395,981 364,734
Charge / (reversal) in respect of defined benefit obligations 424,134 (65,929)
Rent, taxes, insurance, electricity etc. 4,672,149 4,398,243
Depreciation on operating fixed assets 11.2 2,151,157 1,714,992
Depreciation on Islamic financing against leased assets (Ijarah) 46.4 197,824 205,186
Amortization 11.3 436,392 383,371
Outsourced service charges including sales commission 4,631,033 4,626,193
Communications 1,373,600 1,171,152
Banking service charges 1,302,234 1,184,850
Cash transportation charges 895,500 653,789
Stationery and printing 647,618 688,689
Legal and professional charges 706,110 473,431
Advertisement and publicity 1,141,267 794,290
Repairs and maintenance 1,725,076 1,589,403
Travelling 335,884 297,343
Office running expense 859,939 776,902
Vehicle expense 203,078 185,223
Entertainment 224,402 252,832
Cartage, freight and conveyance 94,788 101,271
Insurance expense 137,516 137,922
Auditors' remuneration 29.2 105,495 102,658
Training and seminars 170,653 136,363
Brokerage expenses 25,994 19,041
Subscriptions 156,029 161,975
Donations 29.3 110,250 87,252
Non-executive Directors' fees 48,721 41,963
Zakat paid by overseas branch 75,828 283,971
Miscellaneous expenses 91,457 77,408
38,455,334 35,022,240
29.1
------- (Rupees in '000) -------
This includes accrual of employee benefits in the form of awards / bonus to all permanent staff including the Chief Executive
Officer and is determined on the basis of employees' evaluation and the entities' performance during the year. The
aggregate benefit determined in respect of all permanent staff amounted to Rs. 1,520.435 million (2016: Rs. 1,681.198
million).
42
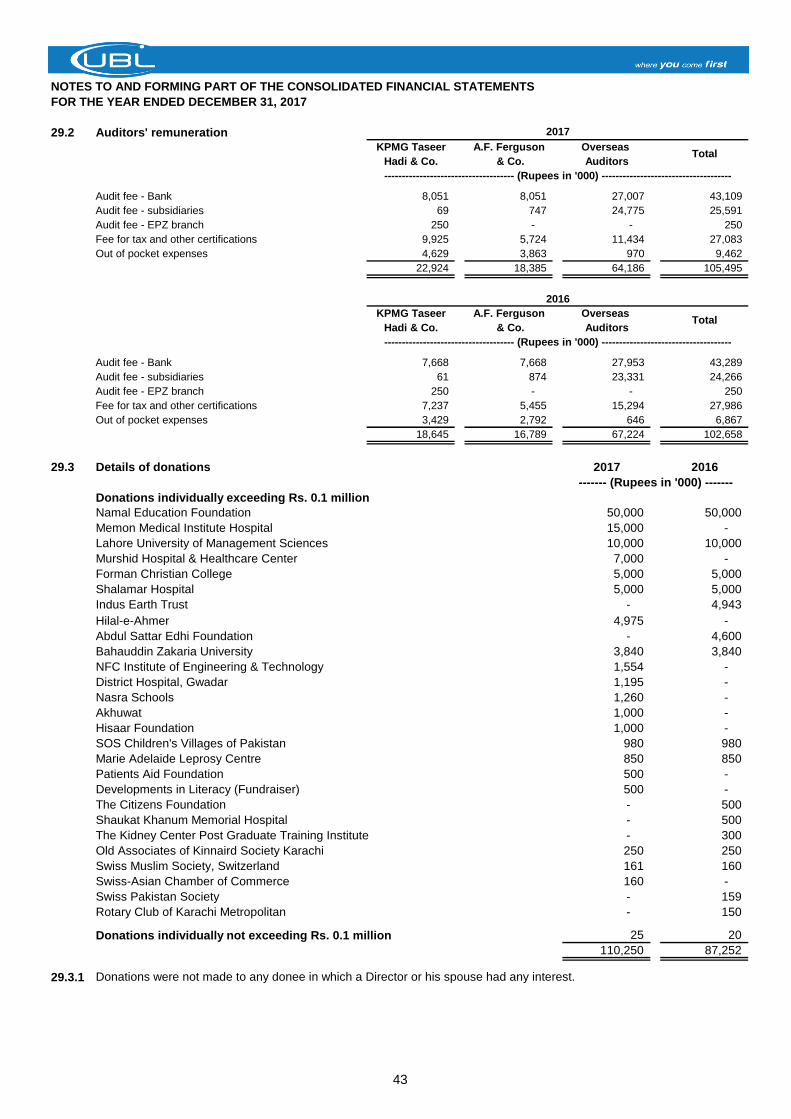
NOTES TO AND FORMING PART OF THE CONSOLIDATED FINANCIAL STATEMENTS
FOR THE YEAR ENDED DECEMBER 31, 2017
29.2 Auditors' remuneration
KPMG Taseer A.F. Ferguson Overseas
Hadi & Co. & Co. Auditors
Audit fee - Bank 8,051 8,051 27,007 43,109
Audit fee - subsidiaries 69 747 24,775 25,591
Audit fee - EPZ branch 250 - - 250
Fee for tax and other certifications 9,925 5,724 11,434 27,083
Out of pocket expenses 4,629 3,863 970 9,462
22,924 18,385 64,186 105,495
KPMG Taseer A.F. Ferguson Overseas
Hadi & Co. & Co. Auditors
Audit fee - Bank 7,668 7,668 27,953 43,289
Audit fee - subsidiaries 61 874 23,331 24,266
Audit fee - EPZ branch 250 - - 250
Fee for tax and other certifications 7,237 5,455 15,294 27,986
Out of pocket expenses 3,429 2,792 646 6,867
18,645 16,789 67,224 102,658
29.3 Details of donations 2017 2016
Donations individually exceeding Rs. 0.1 million
Namal Education Foundation 50,000 50,000
Memon Medical Institute Hospital 15,000 -
Lahore University of Management Sciences 10,000 10,000
Murshid Hospital & Healthcare Center 7,000 -
Forman Christian College 5,000 5,000
Shalamar Hospital 5,000 5,000
Indus Earth Trust - 4,943
Hilal-e-Ahmer 4,975 -
Abdul Sattar Edhi Foundation - 4,600
Bahauddin Zakaria University 3,840 3,840
NFC Institute of Engineering & Technology 1,554 -
District Hospital, Gwadar 1,195 -
Nasra Schools 1,260 -
Akhuwat 1,000 -
Hisaar Foundation 1,000 -
SOS Children's Villages of Pakistan 980 980
Marie Adelaide Leprosy Centre 850 850
Patients Aid Foundation 500 -
Developments in Literacy (Fundraiser) 500 -
The Citizens Foundation - 500
Shaukat Khanum Memorial Hospital - 500
The Kidney Center Post Graduate Training Institute - 300
Old Associates of Kinnaird Society Karachi 250 250
Swiss Muslim Society, Switzerland 161 160
Swiss-Asian Chamber of Commerce 160 -
Swiss Pakistan Society - 159
Rotary Club of Karachi Metropolitan - 150
Donations individually not exceeding Rs. 0.1 million 25 20
110,250 87,252
29.3.1 Donations were not made to any donee in which a Director or his spouse had any interest.
------------------------------------- (Rupees in '000) -------------------------------------
------- (Rupees in '000) -------
2017
------------------------------------- (Rupees in '000) -------------------------------------
Total
Total
2016
43
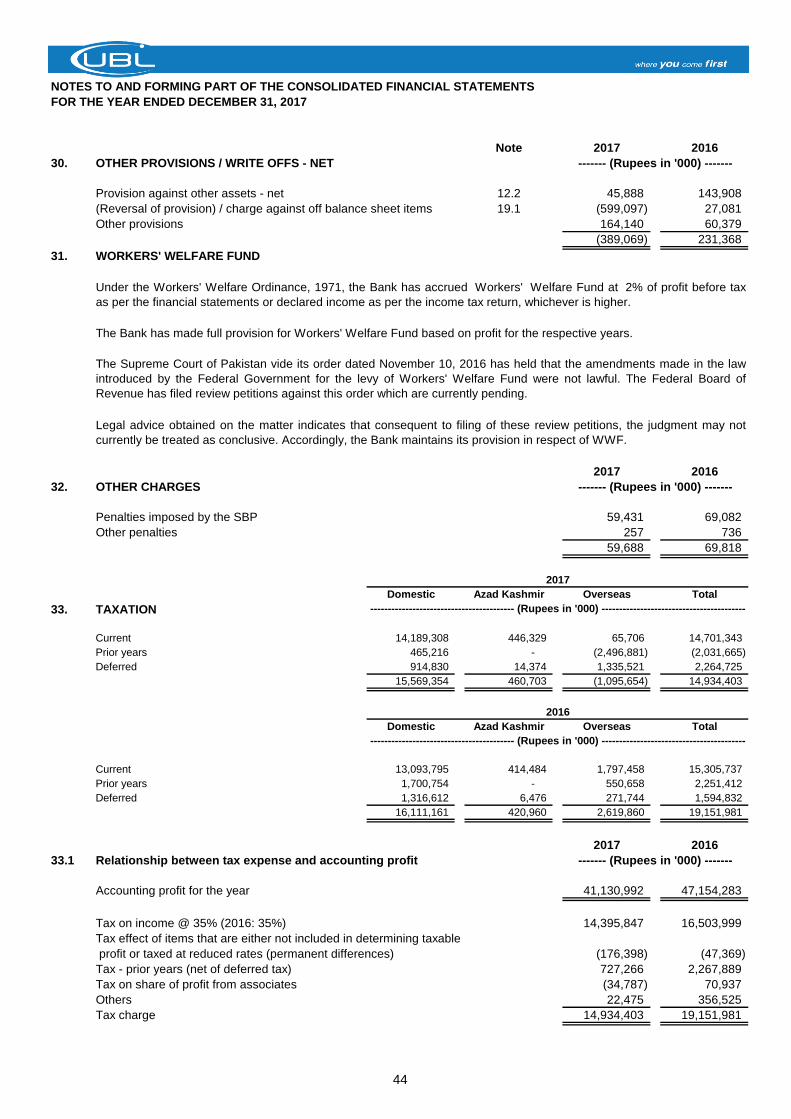
NOTES TO AND FORMING PART OF THE CONSOLIDATED FINANCIAL STATEMENTS
FOR THE YEAR ENDED DECEMBER 31, 2017
Note 2017 2016
30. OTHER PROVISIONS / WRITE OFFS - NET
Provision against other assets - net 12.2 45,888 143,908
(Reversal of provision) / charge against off balance sheet items 19.1 (599,097) 27,081
Other provisions 164,140 60,379
(389,069) 231,368
31. WORKERS' WELFARE FUND
The Bank has made full provision for Workers' Welfare Fund based on profit for the respective years.
2017 2016
32. OTHER CHARGES
Penalties imposed by the SBP 59,431 69,082
Other penalties 257 736
59,688 69,818
2017
Domestic Azad Kashmir Overseas Total
33. TAXATION
Current 14,189,308 446,329 65,706 14,701,343
Prior years 465,216 - (2,496,881) (2,031,665)
Deferred 914,830 14,374 1,335,521 2,264,725
15,569,354 460,703 (1,095,654) 14,934,403
2016
Domestic Azad Kashmir Overseas Total
Current 13,093,795 414,484 1,797,458 15,305,737
Prior years 1,700,754 - 550,658 2,251,412
Deferred 1,316,612 6,476 271,744 1,594,832
16,111,161 420,960 2,619,860 19,151,981
2017 2016
33.1 Relationship between tax expense and accounting profit
Accounting profit for the year 41,130,992 47,154,283
Tax on income @ 35% (2016: 35%) 14,395,847 16,503,999
Tax effect of items that are either not included in determining taxable
profit or taxed at reduced rates (permanent differences) (176,398) (47,369)
Tax - prior years (net of deferred tax) 727,266 2,267,889
Tax on share of profit from associates (34,787) 70,937
Others 22,475 356,525
Tax charge 14,934,403 19,151,981
----------------------------------------- (Rupees in '000) -----------------------------------------
----------------------------------------- (Rupees in '000) -----------------------------------------
------- (Rupees in '000) -------
------- (Rupees in '000) -------
------- (Rupees in '000) -------
The Supreme Court of Pakistan vide its order dated November 10, 2016 has held that the amendments made in the law
introduced by the Federal Government for the levy of Workers' Welfare Fund were not lawful. The Federal Board of
Revenue has filed review petitions against this order which are currently pending.
Legal advice obtained on the matter indicates that consequent to filing of these review petitions, the judgment may not
currently be treated as conclusive. Accordingly, the Bank maintains its provision in respect of WWF.
Under the Workers' Welfare Ordinance, 1971, the Bank has accrued Workers' Welfare Fund at 2% of profit before tax
as per the financial statements or declared income as per the income tax return, whichever is higher.
44
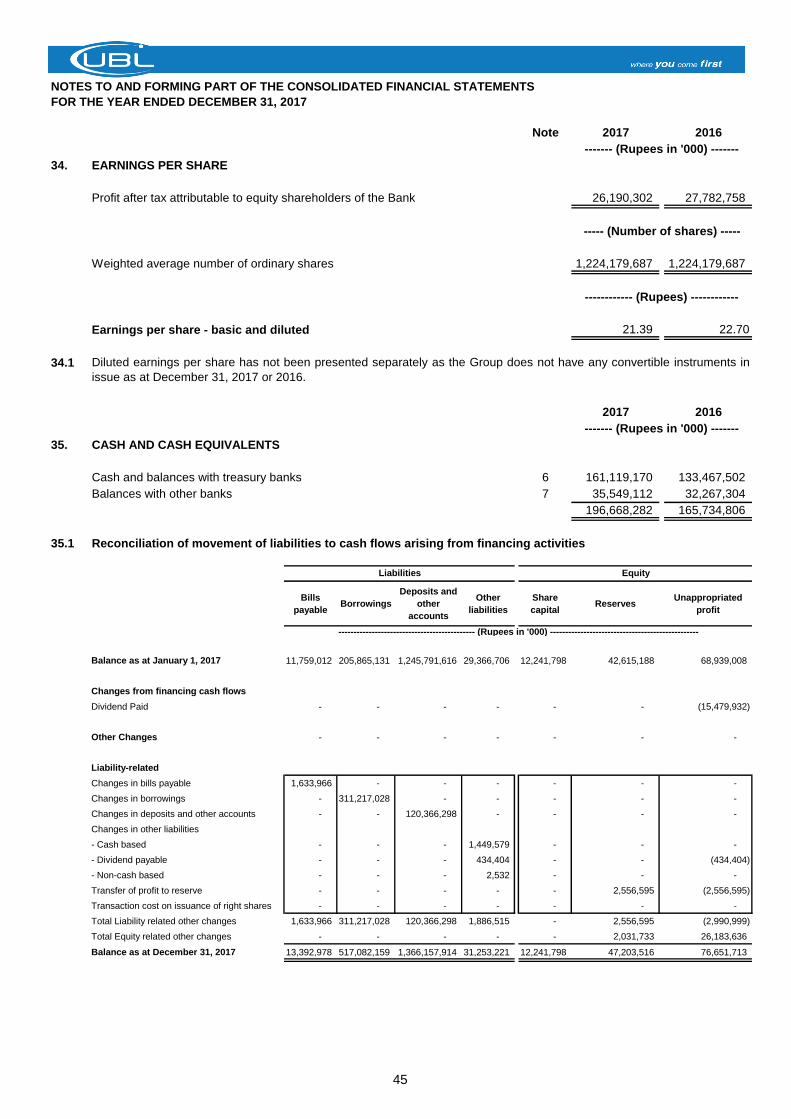
NOTES TO AND FORMING PART OF THE CONSOLIDATED FINANCIAL STATEMENTS
FOR THE YEAR ENDED DECEMBER 31, 2017
Note 2017 2016
34. EARNINGS PER SHARE
Profit after tax attributable to equity shareholders of the Bank 26,190,302 27,782,758
Weighted average number of ordinary shares 1,224,179,687 1,224,179,687
Earnings per share - basic and diluted 21.39 22.70
34.1
2017 2016
35. CASH AND CASH EQUIVALENTS
Cash and balances with treasury banks 6 161,119,170 133,467,502
Balances with other banks 7 35,549,112 32,267,304
196,668,282 165,734,806
35.1 Reconciliation of movement of liabilities to cash flows arising from financing activities
Bills
payableBorrowings
Deposits and
other
accounts
Other
liabilities
Share
capitalReserves
Unappropriated
profit
--------------------------------------------- (Rupees in '000) -------------------------------------------------
Balance as at January 1, 2017 11,759,012 205,865,131 1,245,791,616 29,366,706 12,241,798 42,615,188 68,939,008
Changes from financing cash flows
Dividend Paid - - - - - - (15,479,932)
Other Changes - - - - - - -
Liability-related
Changes in bills payable 1,633,966 - - - - - -
Changes in borrowings - 311,217,028 - - - - -
Changes in deposits and other accounts - - 120,366,298 - - - -
Changes in other liabilities
- Cash based - - - 1,449,579 - - -
- Dividend payable - - - 434,404 - - (434,404)
- Non-cash based - - - 2,532 - - -
Transfer of profit to reserve - - - - - 2,556,595 (2,556,595)
Transaction cost on issuance of right shares - - - - - - -
Total Liability related other changes 1,633,966 311,217,028 120,366,298 1,886,515 - 2,556,595 (2,990,999)
Total Equity related other changes - - - - - 2,031,733 26,183,636
Balance as at December 31, 2017 13,392,978 517,082,159 1,366,157,914 31,253,221 12,241,798 47,203,516 76,651,713
EquityLiabilities
------------ (Rupees) ------------
----- (Number of shares) -----
------- (Rupees in '000) -------
------- (Rupees in '000) -------
Diluted earnings per share has not been presented separately as the Group does not have any convertible instruments in
issue as at December 31, 2017 or 2016.
45
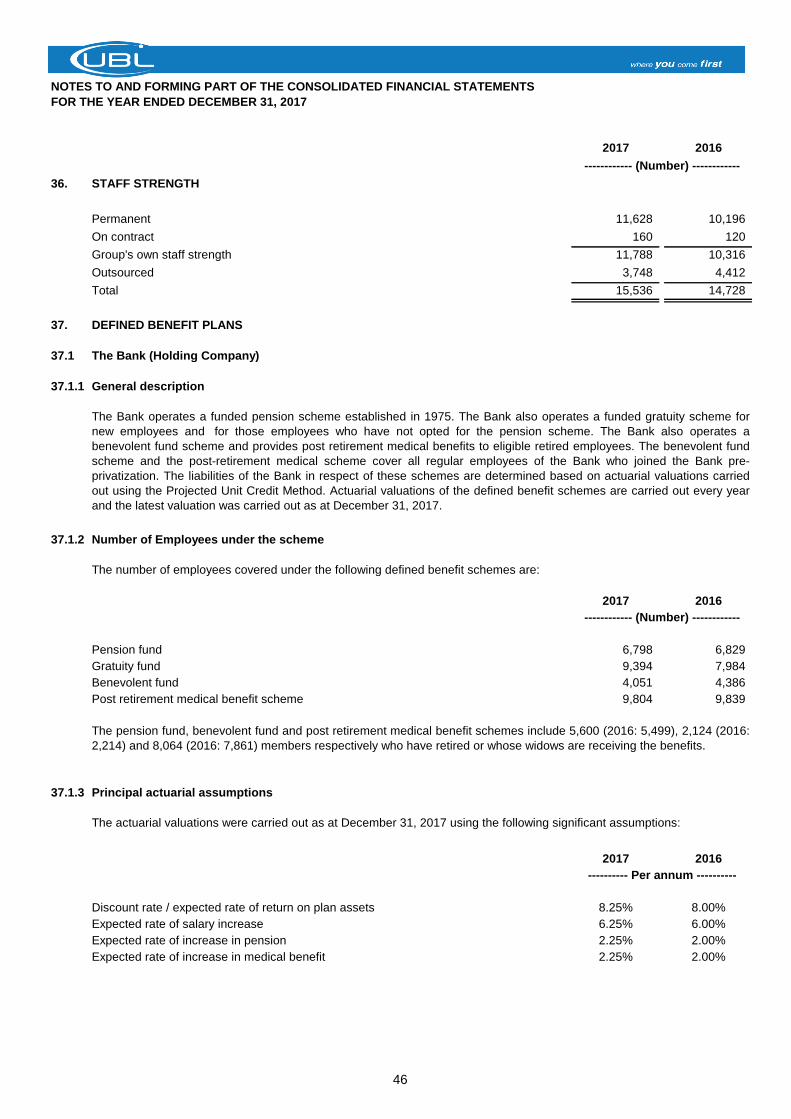
NOTES TO AND FORMING PART OF THE CONSOLIDATED FINANCIAL STATEMENTS
FOR THE YEAR ENDED DECEMBER 31, 2017
2017 2016
36. STAFF STRENGTH
Permanent 11,628 10,196
On contract 160 120
Group's own staff strength 11,788 10,316
Outsourced 3,748 4,412
Total 15,536 14,728
37. DEFINED BENEFIT PLANS
37.1 The Bank (Holding Company)
37.1.1 General description
37.1.2 Number of Employees under the scheme
The number of employees covered under the following defined benefit schemes are:
2017 2016
Pension fund 6,798 6,829
Gratuity fund 9,394 7,984
Benevolent fund 4,051 4,386
Post retirement medical benefit scheme 9,804 9,839
37.1.3 Principal actuarial assumptions
The actuarial valuations were carried out as at December 31, 2017 using the following significant assumptions:
2017 2016
Discount rate / expected rate of return on plan assets 8.25% 8.00%
Expected rate of salary increase 6.25% 6.00%
Expected rate of increase in pension 2.25% 2.00%
Expected rate of increase in medical benefit 2.25% 2.00%
---------- Per annum ----------
The pension fund, benevolent fund and post retirement medical benefit schemes include 5,600 (2016: 5,499), 2,124 (2016:
2,214) and 8,064 (2016: 7,861) members respectively who have retired or whose widows are receiving the benefits.
The Bank operates a funded pension scheme established in 1975. The Bank also operates a funded gratuity scheme for
new employees and for those employees who have not opted for the pension scheme. The Bank also operates a
benevolent fund scheme and provides post retirement medical benefits to eligible retired employees. The benevolent fund
scheme and the post-retirement medical scheme cover all regular employees of the Bank who joined the Bank pre-
privatization. The liabilities of the Bank in respect of these schemes are determined based on actuarial valuations carried
out using the Projected Unit Credit Method. Actuarial valuations of the defined benefit schemes are carried out every year
and the latest valuation was carried out as at December 31, 2017.
------------ (Number) ------------
------------ (Number) ------------
46
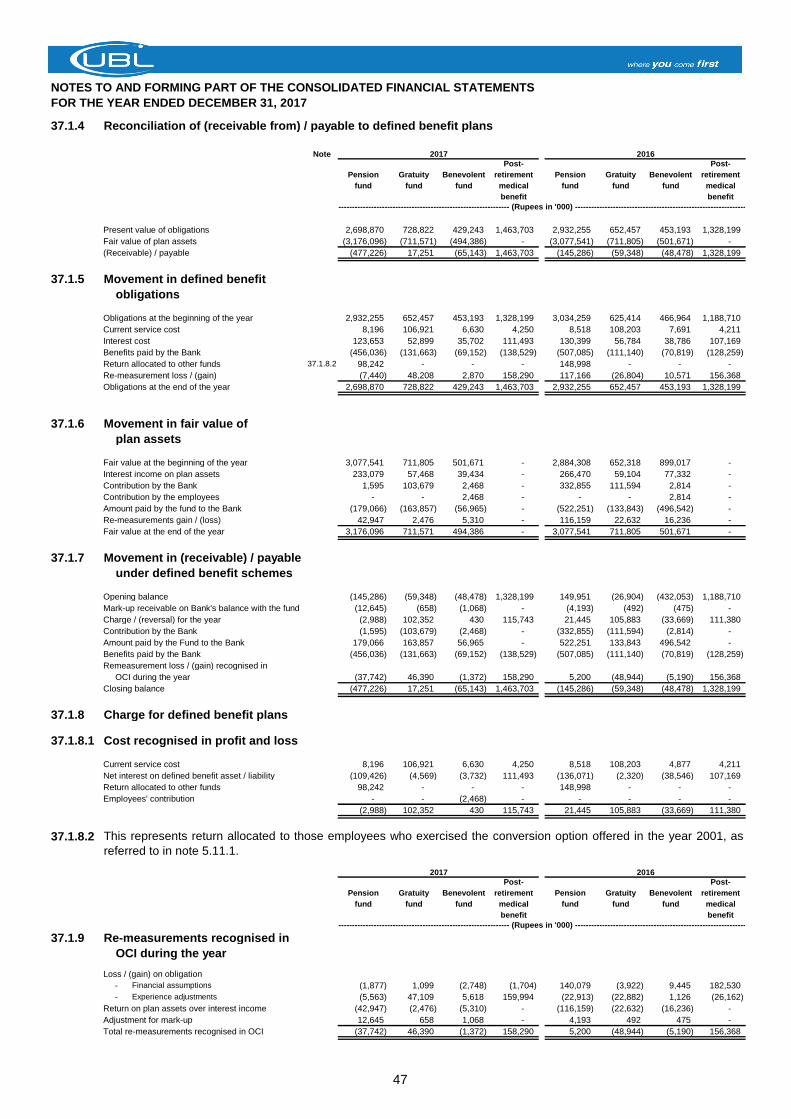
NOTES TO AND FORMING PART OF THE CONSOLIDATED FINANCIAL STATEMENTS
FOR THE YEAR ENDED DECEMBER 31, 2017
37.1.4 Reconciliation of (receivable from) / payable to defined benefit plans
Note
Pension
fund
Gratuity
fund
Benevolent
fund
Post-
retirement
medical
benefit
Pension
fund
Gratuity
fund
Benevolent
fund
Post-
retirement
medical
benefit
Present value of obligations 2,698,870 728,822 429,243 1,463,703 2,932,255 652,457 453,193 1,328,199
Fair value of plan assets (3,176,096) (711,571) (494,386) - (3,077,541) (711,805) (501,671) -
(Receivable) / payable (477,226) 17,251 (65,143) 1,463,703 (145,286) (59,348) (48,478) 1,328,199
37.1.5 Movement in defined benefit
obligations
Obligations at the beginning of the year 2,932,255 652,457 453,193 1,328,199 3,034,259 625,414 466,964 1,188,710
Current service cost 8,196 106,921 6,630 4,250 8,518 108,203 7,691 4,211
Interest cost 123,653 52,899 35,702 111,493 130,399 56,784 38,786 107,169
Benefits paid by the Bank (456,036) (131,663) (69,152) (138,529) (507,085) (111,140) (70,819) (128,259)
Return allocated to other funds 37.1.8.2 98,242 - - - 148,998 - - -
Re-measurement loss / (gain) (7,440) 48,208 2,870 158,290 117,166 (26,804) 10,571 156,368
Obligations at the end of the year 2,698,870 728,822 429,243 1,463,703 2,932,255 652,457 453,193 1,328,199
37.1.6 Movement in fair value of
plan assets
Fair value at the beginning of the year 3,077,541 711,805 501,671 - 2,884,308 652,318 899,017 -
Interest income on plan assets 233,079 57,468 39,434 - 266,470 59,104 77,332 -
Contribution by the Bank 1,595 103,679 2,468 - 332,855 111,594 2,814 -
Contribution by the employees - - 2,468 - - - 2,814 -
Amount paid by the fund to the Bank (179,066) (163,857) (56,965) - (522,251) (133,843) (496,542) -
Re-measurements gain / (loss) 42,947 2,476 5,310 - 116,159 22,632 16,236 -
Fair value at the end of the year 3,176,096 711,571 494,386 - 3,077,541 711,805 501,671 -
37.1.7 Movement in (receivable) / payable
under defined benefit schemes
Opening balance (145,286) (59,348) (48,478) 1,328,199 149,951 (26,904) (432,053) 1,188,710
Mark-up receivable on Bank's balance with the fund (12,645) (658) (1,068) - (4,193) (492) (475) -
Charge / (reversal) for the year (2,988) 102,352 430 115,743 21,445 105,883 (33,669) 111,380
Contribution by the Bank (1,595) (103,679) (2,468) - (332,855) (111,594) (2,814) -
Amount paid by the Fund to the Bank 179,066 163,857 56,965 - 522,251 133,843 496,542 -
Benefits paid by the Bank (456,036) (131,663) (69,152) (138,529) (507,085) (111,140) (70,819) (128,259)
Remeasurement loss / (gain) recognised in
OCI during the year (37,742) 46,390 (1,372) 158,290 5,200 (48,944) (5,190) 156,368
Closing balance (477,226) 17,251 (65,143) 1,463,703 (145,286) (59,348) (48,478) 1,328,199
37.1.8 Charge for defined benefit plans
37.1.8.1 Cost recognised in profit and loss
Current service cost 8,196 106,921 6,630 4,250 8,518 108,203 4,877 4,211
Net interest on defined benefit asset / liability (109,426) (4,569) (3,732) 111,493 (136,071) (2,320) (38,546) 107,169
Return allocated to other funds 98,242 - - - 148,998 - - -
Employees' contribution - - (2,468) - - - - -
(2,988) 102,352 430 115,743 21,445 105,883 (33,669) 111,380
37.1.8.2
Pension
fund
Gratuity
fund
Benevolent
fund
Post-
retirement
medical
benefit
Pension
fund
Gratuity
fund
Benevolent
fund
Post-
retirement
medical
benefit
37.1.9 Re-measurements recognised in
OCI during the year
Loss / (gain) on obligation
- Financial assumptions (1,877) 1,099 (2,748) (1,704) 140,079 (3,922) 9,445 182,530
- Experience adjustments (5,563) 47,109 5,618 159,994 (22,913) (22,882) 1,126 (26,162)
Return on plan assets over interest income (42,947) (2,476) (5,310) - (116,159) (22,632) (16,236) -
Adjustment for mark-up 12,645 658 1,068 - 4,193 492 475 -
Total re-measurements recognised in OCI (37,742) 46,390 (1,372) 158,290 5,200 (48,944) (5,190) 156,368
2017 2016
------------------------------------------------------------------------ (Rupees in '000) ------------------------------------------------------------------------
20162017
------------------------------------------------------------------------ (Rupees in '000) ------------------------------------------------------------------------
This represents return allocated to those employees who exercised the conversion option offered in the year 2001, as
referred to in note 5.11.1.
47
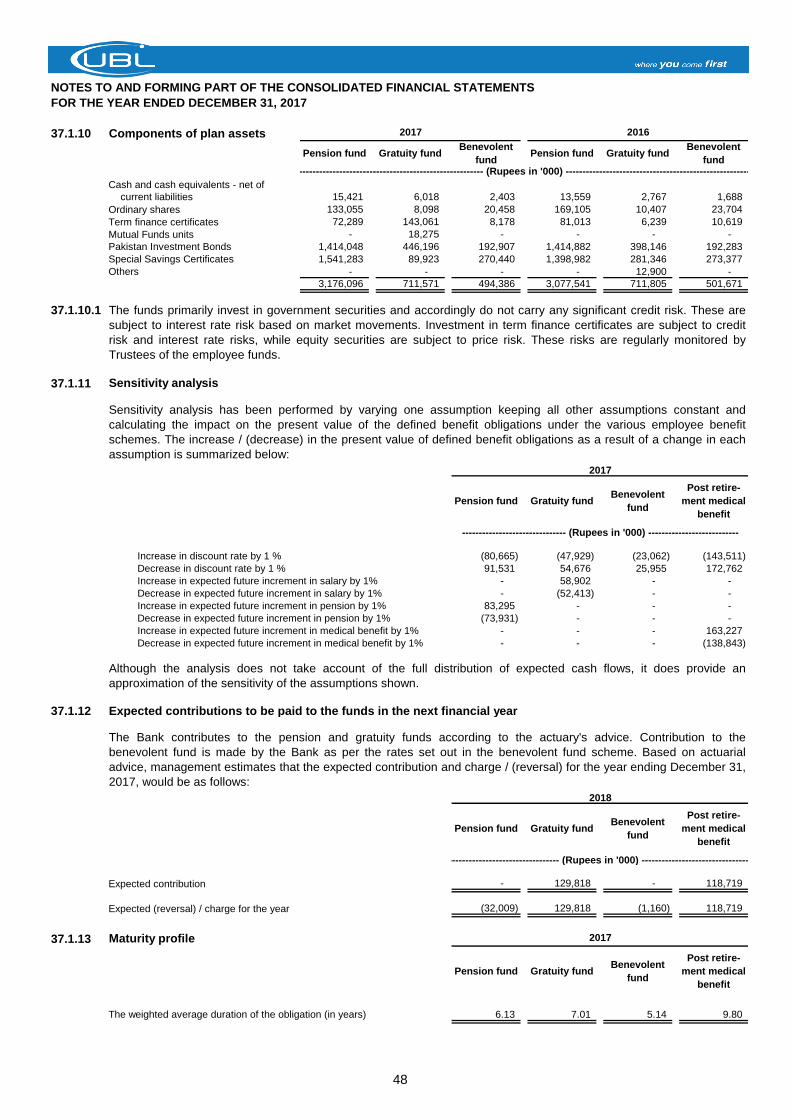
NOTES TO AND FORMING PART OF THE CONSOLIDATED FINANCIAL STATEMENTS
FOR THE YEAR ENDED DECEMBER 31, 2017
37.1.10 Components of plan assets
Pension fund Gratuity fundBenevolent
fundPension fund Gratuity fund
Benevolent
fund
Cash and cash equivalents - net of
current liabilities 15,421 6,018 2,403 13,559 2,767 1,688
Ordinary shares 133,055 8,098 20,458 169,105 10,407 23,704
Term finance certificates 72,289 143,061 8,178 81,013 6,239 10,619
Mutual Funds units - 18,275 - - - -
Pakistan Investment Bonds 1,414,048 446,196 192,907 1,414,882 398,146 192,283
Special Savings Certificates 1,541,283 89,923 270,440 1,398,982 281,346 273,377
Others - - - - 12,900 -
3,176,096 711,571 494,386 3,077,541 711,805 501,671
######## (441,759) (856,535) ######## (409,974) (836,962)
37.1.10.1
37.1.11 Sensitivity analysis
Pension fund Gratuity fundBenevolent
fund
Post retire-
ment medical
benefit
Increase in discount rate by 1 % (80,665) (47,929) (23,062) (143,511)
Decrease in discount rate by 1 % 91,531 54,676 25,955 172,762
Increase in expected future increment in salary by 1% - 58,902 - -
Decrease in expected future increment in salary by 1% - (52,413) - -
Increase in expected future increment in pension by 1% 83,295 - - -
Decrease in expected future increment in pension by 1% (73,931) - - -
Increase in expected future increment in medical benefit by 1% - - - 163,227
Decrease in expected future increment in medical benefit by 1% - - - (138,843)
37.1.12 Expected contributions to be paid to the funds in the next financial year
Pension fund Gratuity fundBenevolent
fund
Post retire-
ment medical
benefit
Expected contribution - 129,818 - 118,719
Expected (reversal) / charge for the year (32,009) 129,818 (1,160) 118,719
37.1.13 Maturity profile
Pension fund Gratuity fundBenevolent
fund
Post retire-
ment medical
benefit
The weighted average duration of the obligation (in years) 6.13 7.01 5.14 9.80
2017 2016
----------------------------------------------- (Rupees in '000) -----------------------------------------------
2017
2017
2018
Although the analysis does not take account of the full distribution of expected cash flows, it does provide an
approximation of the sensitivity of the assumptions shown.
Sensitivity analysis has been performed by varying one assumption keeping all other assumptions constant and
calculating the impact on the present value of the defined benefit obligations under the various employee benefit
schemes. The increase / (decrease) in the present value of defined benefit obligations as a result of a change in each
assumption is summarized below:
The Bank contributes to the pension and gratuity funds according to the actuary's advice. Contribution to the
benevolent fund is made by the Bank as per the rates set out in the benevolent fund scheme. Based on actuarial
advice, management estimates that the expected contribution and charge / (reversal) for the year ending December 31,
2017, would be as follows:
------------------------------- (Rupees in '000) ---------------------------
The funds primarily invest in government securities and accordingly do not carry any significant credit risk. These are
subject to interest rate risk based on market movements. Investment in term finance certificates are subject to credit
risk and interest rate risks, while equity securities are subject to price risk. These risks are regularly monitored by
Trustees of the employee funds.
-------------------------------------------------------------- (Rupees in '000) --------------------------------------------------------------
48
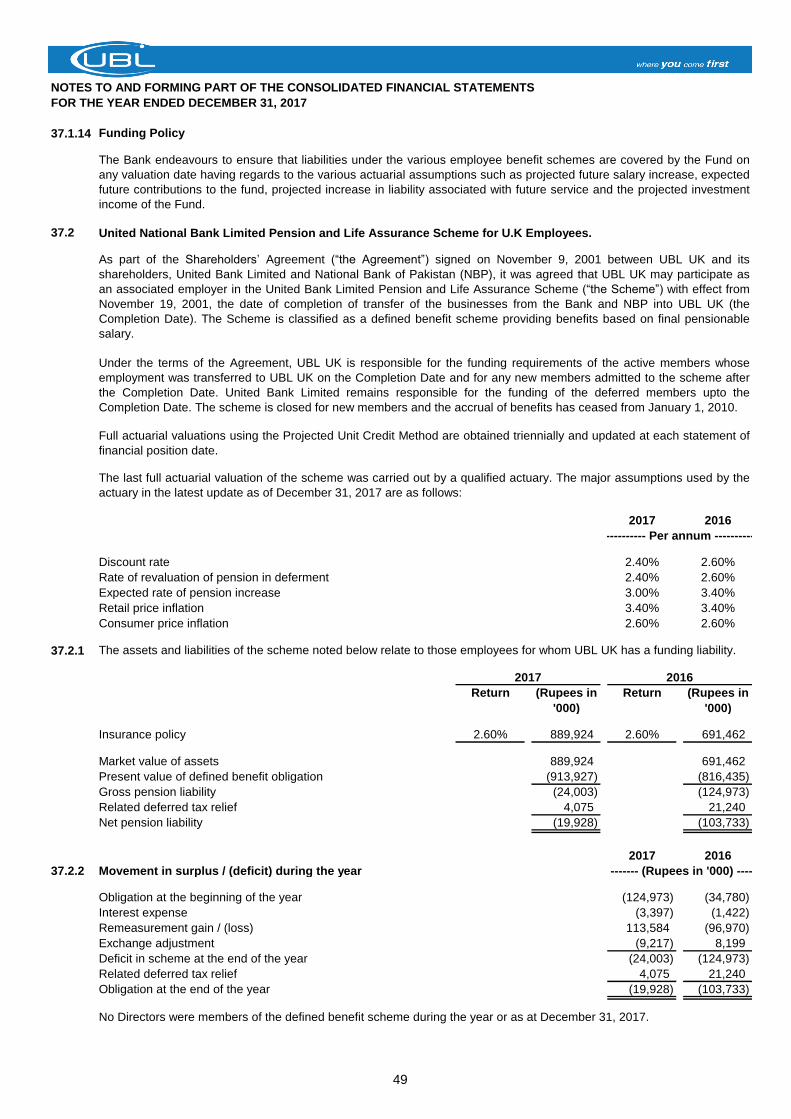
NOTES TO AND FORMING PART OF THE CONSOLIDATED FINANCIAL STATEMENTS
FOR THE YEAR ENDED DECEMBER 31, 2017
37.1.14 Funding Policy
37.2 United National Bank Limited Pension and Life Assurance Scheme for U.K Employees.
2017 2016
Discount rate 2.40% 2.60%
Rate of revaluation of pension in deferment 2.40% 2.60%
Expected rate of pension increase 3.00% 3.40%
Retail price inflation 3.40% 3.40%
Consumer price inflation 2.60% 2.60%
37.2.1 The assets and liabilities of the scheme noted below relate to those employees for whom UBL UK has a funding liability.
Return (Rupees in Return (Rupees in
'000) '000)
Insurance policy 2.60% 889,924 2.60% 691,462
Market value of assets 889,924 691,462
Present value of defined benefit obligation (913,927) (816,435)
Gross pension liability (24,003) (124,973)
Related deferred tax relief 4,075 21,240
Net pension liability (19,928) (103,733)
2017 2016
37.2.2 Movement in surplus / (deficit) during the year
Obligation at the beginning of the year (124,973) (34,780)
Interest expense (3,397) (1,422)
Remeasurement gain / (loss) 113,584 (96,970)
Exchange adjustment (9,217) 8,199
Deficit in scheme at the end of the year (24,003) (124,973)
Related deferred tax relief 4,075 21,240
Obligation at the end of the year (19,928) (103,733)
No Directors were members of the defined benefit scheme during the year or as at December 31, 2017.
The last full actuarial valuation of the scheme was carried out by a qualified actuary. The major assumptions used by the
actuary in the latest update as of December 31, 2017 are as follows:
---------- Per annum ----------
The Bank endeavours to ensure that liabilities under the various employee benefit schemes are covered by the Fund on
any valuation date having regards to the various actuarial assumptions such as projected future salary increase, expected
future contributions to the fund, projected increase in liability associated with future service and the projected investment
income of the Fund.
As part of the Shareholders’ Agreement (“the Agreement”) signed on November 9, 2001 between UBL UK and its
shareholders, United Bank Limited and National Bank of Pakistan (NBP), it was agreed that UBL UK may participate as
an associated employer in the United Bank Limited Pension and Life Assurance Scheme (“the Scheme”) with effect from
November 19, 2001, the date of completion of transfer of the businesses from the Bank and NBP into UBL UK (the
Completion Date). The Scheme is classified as a defined benefit scheme providing benefits based on final pensionable
salary.
Under the terms of the Agreement, UBL UK is responsible for the funding requirements of the active members whose
employment was transferred to UBL UK on the Completion Date and for any new members admitted to the scheme after
the Completion Date. United Bank Limited remains responsible for the funding of the deferred members upto the
Completion Date. The scheme is closed for new members and the accrual of benefits has ceased from January 1, 2010.
Full actuarial valuations using the Projected Unit Credit Method are obtained triennially and updated at each statement of
financial position date.
------- (Rupees in '000) ----
2017 2016
49
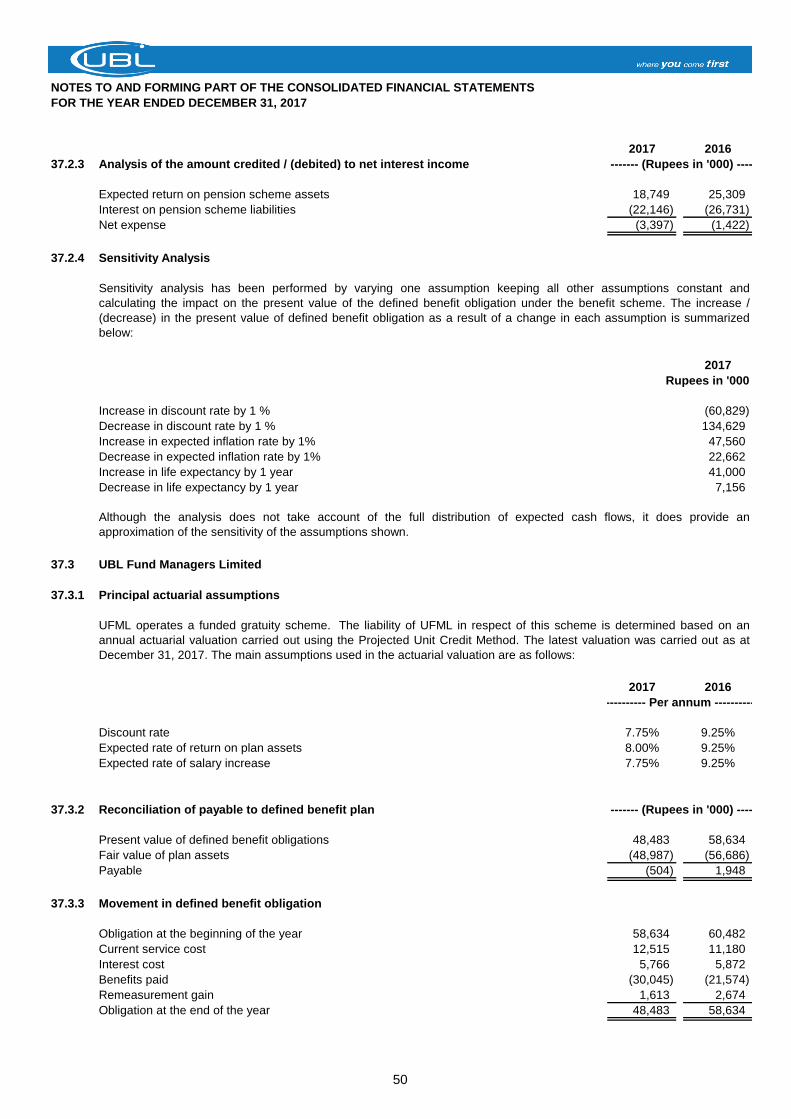
NOTES TO AND FORMING PART OF THE CONSOLIDATED FINANCIAL STATEMENTS
FOR THE YEAR ENDED DECEMBER 31, 2017
2017 2016
37.2.3 Analysis of the amount credited / (debited) to net interest income
Expected return on pension scheme assets 18,749 25,309
Interest on pension scheme liabilities (22,146) (26,731)
Net expense (3,397) (1,422)
37.2.4 Sensitivity Analysis
2017
Rupees in '000
Increase in discount rate by 1 % (60,829)
Decrease in discount rate by 1 % 134,629
Increase in expected inflation rate by 1% 47,560
Decrease in expected inflation rate by 1% 22,662
Increase in life expectancy by 1 year 41,000
Decrease in life expectancy by 1 year 7,156
37.3 UBL Fund Managers Limited
37.3.1 Principal actuarial assumptions
2017 2016
Discount rate 7.75% 9.25%
Expected rate of return on plan assets 8.00% 9.25%
Expected rate of salary increase 7.75% 9.25%
37.3.2 Reconciliation of payable to defined benefit plan
Present value of defined benefit obligations 48,483 58,634
Fair value of plan assets (48,987) (56,686)
Payable (504) 1,948
37.3.3 Movement in defined benefit obligation
Obligation at the beginning of the year 58,634 60,482
Current service cost 12,515 11,180
Interest cost 5,766 5,872
Benefits paid (30,045) (21,574)
Remeasurement gain 1,613 2,674
Obligation at the end of the year 48,483 58,634
------- (Rupees in '000) ----
UFML operates a funded gratuity scheme. The liability of UFML in respect of this scheme is determined based on an
annual actuarial valuation carried out using the Projected Unit Credit Method. The latest valuation was carried out as at
December 31, 2017. The main assumptions used in the actuarial valuation are as follows:
Sensitivity analysis has been performed by varying one assumption keeping all other assumptions constant and
calculating the impact on the present value of the defined benefit obligation under the benefit scheme. The increase /
(decrease) in the present value of defined benefit obligation as a result of a change in each assumption is summarized
below:
Although the analysis does not take account of the full distribution of expected cash flows, it does provide an
approximation of the sensitivity of the assumptions shown.
------- (Rupees in '000) ----
---------- Per annum ----------
50
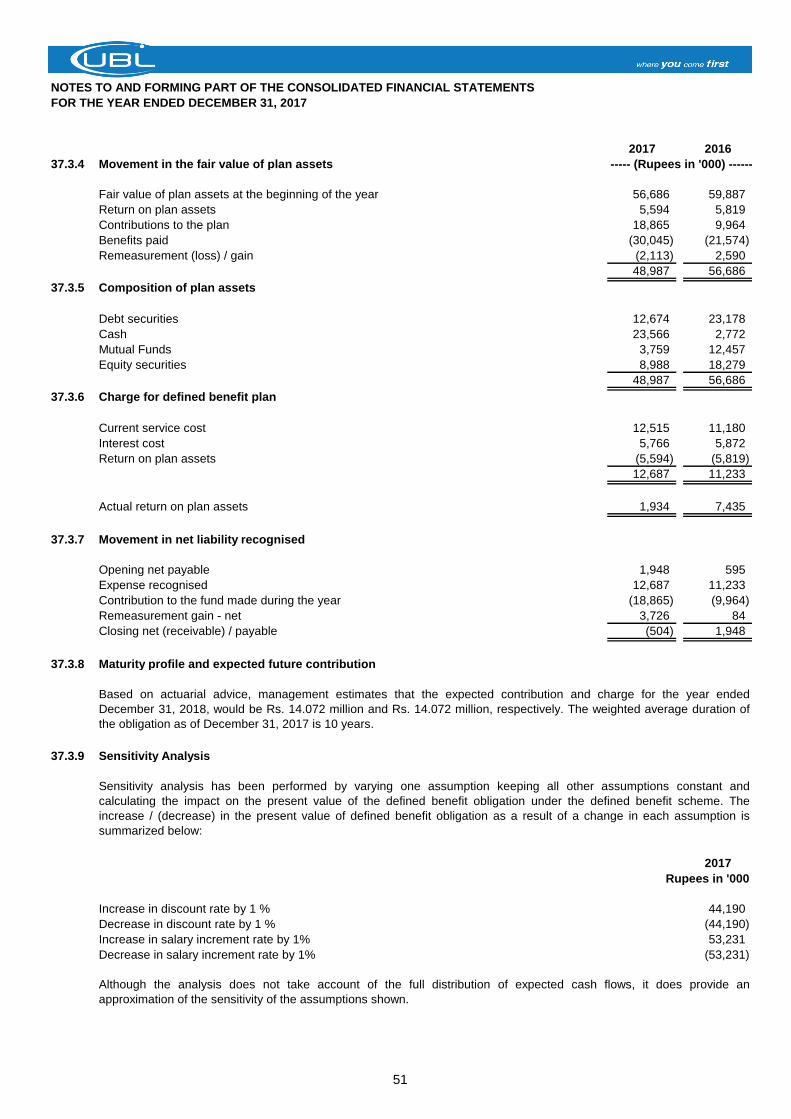
NOTES TO AND FORMING PART OF THE CONSOLIDATED FINANCIAL STATEMENTS
FOR THE YEAR ENDED DECEMBER 31, 2017
2017 2016
37.3.4 Movement in the fair value of plan assets
Fair value of plan assets at the beginning of the year 56,686 59,887
Return on plan assets 5,594 5,819
Contributions to the plan 18,865 9,964
Benefits paid (30,045) (21,574)
Remeasurement (loss) / gain (2,113) 2,590
48,987 56,686
37.3.5 Composition of plan assets
Debt securities 12,674 23,178
Cash 23,566 2,772
Mutual Funds 3,759 12,457
Equity securities 8,988 18,279
48,987 56,686
37.3.6 Charge for defined benefit plan
Current service cost 12,515 11,180
Interest cost 5,766 5,872
Return on plan assets (5,594) (5,819)
12,687 11,233
Actual return on plan assets 1,934 7,435
37.3.7 Movement in net liability recognised
Opening net payable 1,948 595
Expense recognised 12,687 11,233
Contribution to the fund made during the year (18,865) (9,964)
Remeasurement gain - net 3,726 84
Closing net (receivable) / payable (504) 1,948
37.3.8 Maturity profile and expected future contribution
37.3.9 Sensitivity Analysis
2017
Rupees in '000
Increase in discount rate by 1 % 44,190
Decrease in discount rate by 1 % (44,190)
Increase in salary increment rate by 1% 53,231
Decrease in salary increment rate by 1% (53,231)
Based on actuarial advice, management estimates that the expected contribution and charge for the year ended
December 31, 2018, would be Rs. 14.072 million and Rs. 14.072 million, respectively. The weighted average duration of
the obligation as of December 31, 2017 is 10 years.
Although the analysis does not take account of the full distribution of expected cash flows, it does provide an
approximation of the sensitivity of the assumptions shown.
----- (Rupees in '000) ------
Sensitivity analysis has been performed by varying one assumption keeping all other assumptions constant and
calculating the impact on the present value of the defined benefit obligation under the defined benefit scheme. The
increase / (decrease) in the present value of defined benefit obligation as a result of a change in each assumption is
summarized below:
51
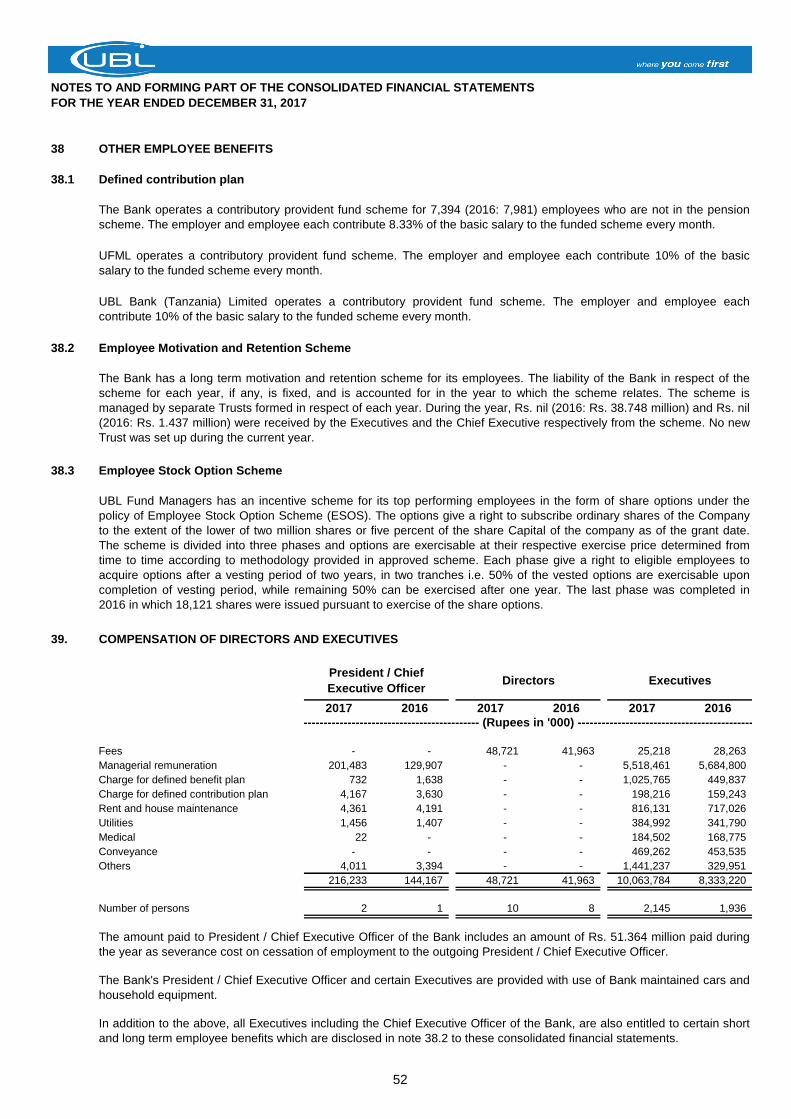
NOTES TO AND FORMING PART OF THE CONSOLIDATED FINANCIAL STATEMENTS
FOR THE YEAR ENDED DECEMBER 31, 2017
38 OTHER EMPLOYEE BENEFITS
38.1 Defined contribution plan
38.2 Employee Motivation and Retention Scheme
38.3 Employee Stock Option Scheme
39. COMPENSATION OF DIRECTORS AND EXECUTIVES
2017 2016 2017 2016 2017 2016
Fees - - 48,721 41,963 25,218 28,263
Managerial remuneration 201,483 129,907 - - 5,518,461 5,684,800
Charge for defined benefit plan 732 1,638 - - 1,025,765 449,837
Charge for defined contribution plan 4,167 3,630 - - 198,216 159,243
Rent and house maintenance 4,361 4,191 - - 816,131 717,026
Utilities 1,456 1,407 - - 384,992 341,790
Medical 22 - - - 184,502 168,775
Conveyance - - - - 469,262 453,535
Others 4,011 3,394 - - 1,441,237 329,951
216,233 144,167 48,721 41,963 10,063,784 8,333,220
Number of persons 2 1 10 8 2,145 1,936
UBL Bank (Tanzania) Limited operates a contributory provident fund scheme. The employer and employee each
contribute 10% of the basic salary to the funded scheme every month.
UFML operates a contributory provident fund scheme. The employer and employee each contribute 10% of the basic
salary to the funded scheme every month.
In addition to the above, all Executives including the Chief Executive Officer of the Bank, are also entitled to certain short
and long term employee benefits which are disclosed in note 38.2 to these consolidated financial statements.
The Bank's President / Chief Executive Officer and certain Executives are provided with use of Bank maintained cars and
household equipment.
The Bank operates a contributory provident fund scheme for 7,394 (2016: 7,981) employees who are not in the pension
scheme. The employer and employee each contribute 8.33% of the basic salary to the funded scheme every month.
---------------------------------------------------------- (Rupees in '000) ----------------------------------------------------------
The amount paid to President / Chief Executive Officer of the Bank includes an amount of Rs. 51.364 million paid during
the year as severance cost on cessation of employment to the outgoing President / Chief Executive Officer.
ExecutivesPresident / Chief
Executive OfficerDirectors
UBL Fund Managers has an incentive scheme for its top performing employees in the form of share options under the
policy of Employee Stock Option Scheme (ESOS). The options give a right to subscribe ordinary shares of the Company
to the extent of the lower of two million shares or five percent of the share Capital of the company as of the grant date.
The scheme is divided into three phases and options are exercisable at their respective exercise price determined from
time to time according to methodology provided in approved scheme. Each phase give a right to eligible employees to
acquire options after a vesting period of two years, in two tranches i.e. 50% of the vested options are exercisable upon
completion of vesting period, while remaining 50% can be exercised after one year. The last phase was completed in
2016 in which 18,121 shares were issued pursuant to exercise of the share options.
The Bank has a long term motivation and retention scheme for its employees. The liability of the Bank in respect of the
scheme for each year, if any, is fixed, and is accounted for in the year to which the scheme relates. The scheme is
managed by separate Trusts formed in respect of each year. During the year, Rs. nil (2016: Rs. 38.748 million) and Rs. nil
(2016: Rs. 1.437 million) were received by the Executives and the Chief Executive respectively from the scheme. No new
Trust was set up during the current year.
52
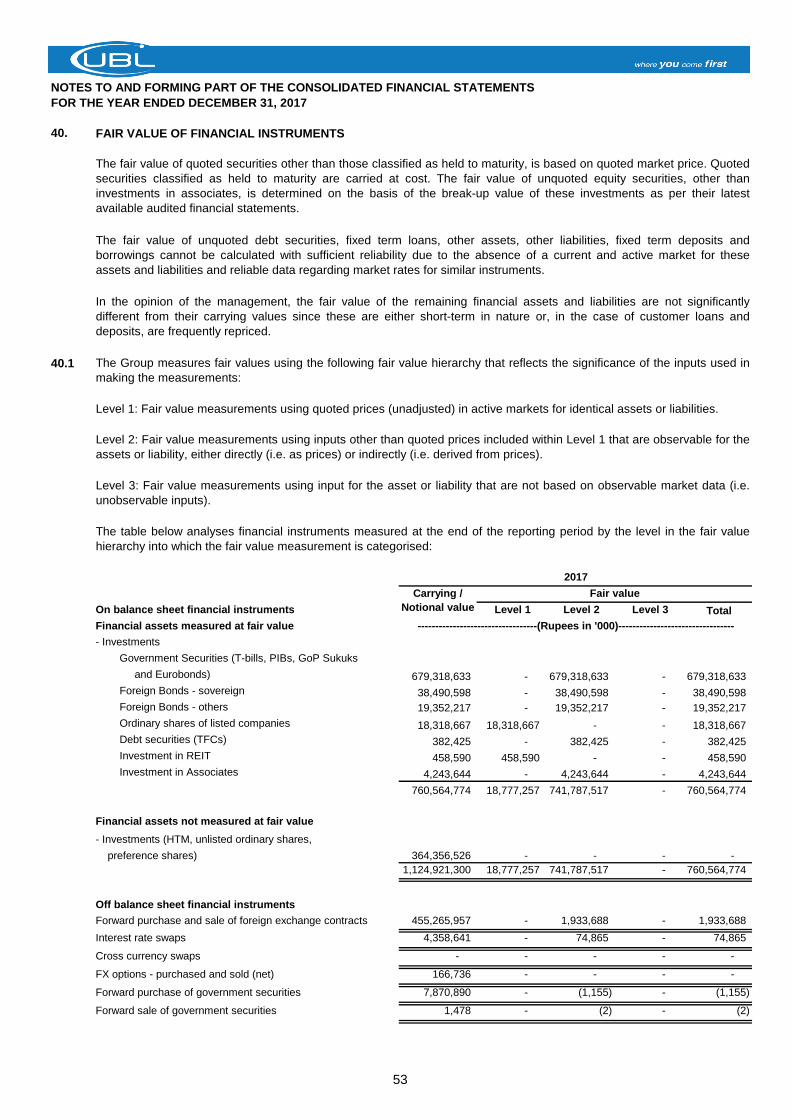
NOTES TO AND FORMING PART OF THE CONSOLIDATED FINANCIAL STATEMENTS
FOR THE YEAR ENDED DECEMBER 31, 2017
40. FAIR VALUE OF FINANCIAL INSTRUMENTS
40.1
Level 1: Fair value measurements using quoted prices (unadjusted) in active markets for identical assets or liabilities.
On balance sheet financial instruments Level 1 Level 2 Level 3 Total
Financial assets measured at fair value
- Investments
Government Securities (T-bills, PIBs, GoP Sukuks
and Eurobonds) 679,318,633 - 679,318,633 - 679,318,633
Foreign Bonds - sovereign 38,490,598 - 38,490,598 - 38,490,598
Foreign Bonds - others 19,352,217 - 19,352,217 - 19,352,217
Ordinary shares of listed companies 18,318,667 18,318,667 - - 18,318,667
Debt securities (TFCs) 382,425 - 382,425 - 382,425
Investment in REIT 458,590 458,590 - - 458,590
Investment in Associates 4,243,644 - 4,243,644 - 4,243,644
760,564,774 18,777,257 741,787,517 - 760,564,774
Financial assets not measured at fair value
- Investments (HTM, unlisted ordinary shares,
preference shares) 364,356,526 - - - -
1,124,921,300 18,777,257 741,787,517 - 760,564,774
Off balance sheet financial instruments
Forward purchase and sale of foreign exchange contracts 455,265,957 - 1,933,688 - 1,933,688
Interest rate swaps 4,358,641 - 74,865 - 74,865
Cross currency swaps - - - - -
FX options - purchased and sold (net) 166,736 - - - -
Forward purchase of government securities 7,870,890 - (1,155) - (1,155)
Forward sale of government securities 1,478 - (2) - (2)
The fair value of quoted securities other than those classified as held to maturity, is based on quoted market price. Quoted
securities classified as held to maturity are carried at cost. The fair value of unquoted equity securities, other than
investments in associates, is determined on the basis of the break-up value of these investments as per their latest
available audited financial statements.
The fair value of unquoted debt securities, fixed term loans, other assets, other liabilities, fixed term deposits and
borrowings cannot be calculated with sufficient reliability due to the absence of a current and active market for these
assets and liabilities and reliable data regarding market rates for similar instruments.
In the opinion of the management, the fair value of the remaining financial assets and liabilities are not significantly
different from their carrying values since these are either short-term in nature or, in the case of customer loans and
deposits, are frequently repriced.
The Group measures fair values using the following fair value hierarchy that reflects the significance of the inputs used in
making the measurements:
----------------------------------(Rupees in '000)---------------------------------
The table below analyses financial instruments measured at the end of the reporting period by the level in the fair value
hierarchy into which the fair value measurement is categorised:
Carrying /
Notional value
Fair value
2017
Level 2: Fair value measurements using inputs other than quoted prices included within Level 1 that are observable for the
assets or liability, either directly (i.e. as prices) or indirectly (i.e. derived from prices).
Level 3: Fair value measurements using input for the asset or liability that are not based on observable market data (i.e.
unobservable inputs).
53
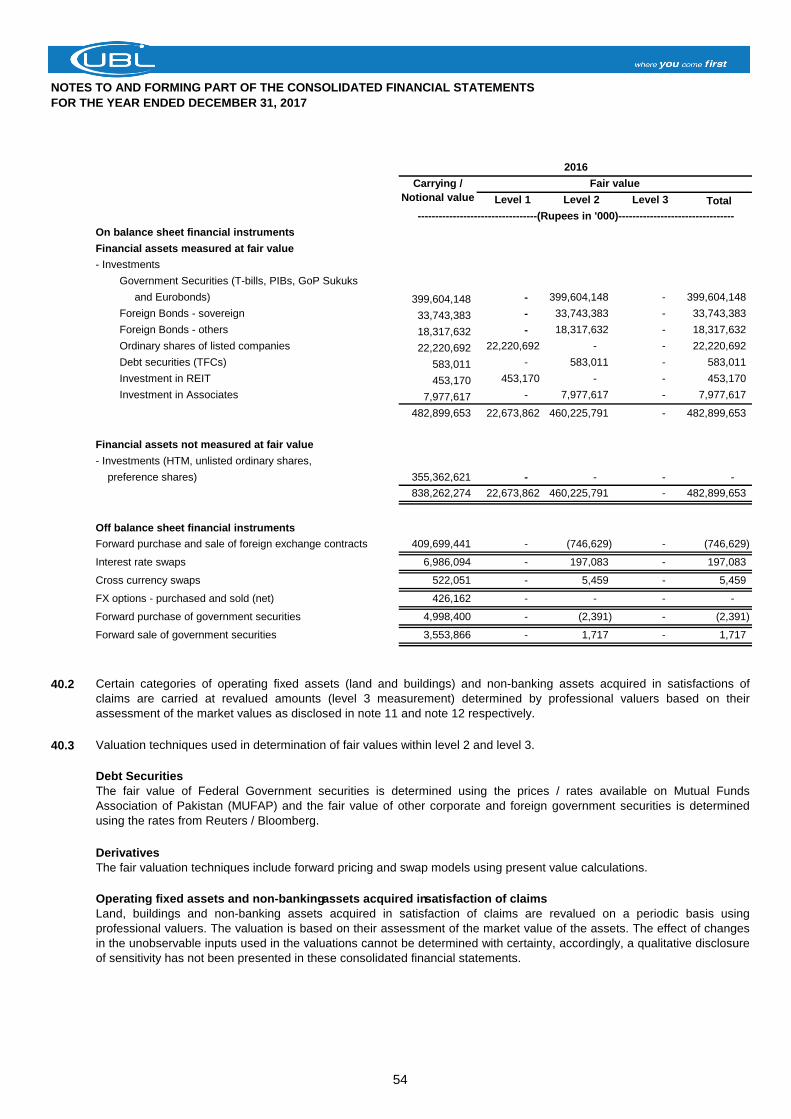
NOTES TO AND FORMING PART OF THE CONSOLIDATED FINANCIAL STATEMENTS
FOR THE YEAR ENDED DECEMBER 31, 2017
Level 1 Level 2 Level 3 Total
On balance sheet financial instruments
Financial assets measured at fair value
- Investments
Government Securities (T-bills, PIBs, GoP Sukuks
and Eurobonds) 399,604,148 - 399,604,148 - 399,604,148
Foreign Bonds - sovereign 33,743,383 - 33,743,383 - 33,743,383
Foreign Bonds - others 18,317,632 - 18,317,632 - 18,317,632
Ordinary shares of listed companies 22,220,692 22,220,692 - - 22,220,692
Debt securities (TFCs) 583,011 - 583,011 - 583,011
Investment in REIT 453,170 453,170 - - 453,170
Investment in Associates 7,977,617 - 7,977,617 - 7,977,617
482,899,653 22,673,862 460,225,791 - 482,899,653
Financial assets not measured at fair value
- Investments (HTM, unlisted ordinary shares,
preference shares) 355,362,621 - - - -
838,262,274 22,673,862 460,225,791 - 482,899,653
Off balance sheet financial instruments
Forward purchase and sale of foreign exchange contracts 409,699,441 - (746,629) - (746,629)
Interest rate swaps 6,986,094 - 197,083 - 197,083
Cross currency swaps 522,051 - 5,459 - 5,459
FX options - purchased and sold (net) 426,162 - - - -
Forward purchase of government securities 4,998,400 - (2,391) - (2,391)
Forward sale of government securities 3,553,866 - 1,717 - 1,717
40.2
40.3 Valuation techniques used in determination of fair values within level 2 and level 3.
Debt Securities
Derivatives
The fair valuation techniques include forward pricing and swap models using present value calculations.
Operating fixed assets and non-banking assets acquired in satisfaction of claims
The fair value of Federal Government securities is determined using the prices / rates available on Mutual Funds
Association of Pakistan (MUFAP) and the fair value of other corporate and foreign government securities is determined
using the rates from Reuters / Bloomberg.
Land, buildings and non-banking assets acquired in satisfaction of claims are revalued on a periodic basis using
professional valuers. The valuation is based on their assessment of the market value of the assets. The effect of changes
in the unobservable inputs used in the valuations cannot be determined with certainty, accordingly, a qualitative disclosure
of sensitivity has not been presented in these consolidated financial statements.
Carrying /
Notional value
Fair value
Certain categories of operating fixed assets (land and buildings) and non-banking assets acquired in satisfactions of
claims are carried at revalued amounts (level 3 measurement) determined by professional valuers based on their
assessment of the market values as disclosed in note 11 and note 12 respectively.
2016
----------------------------------(Rupees in '000)---------------------------------
54
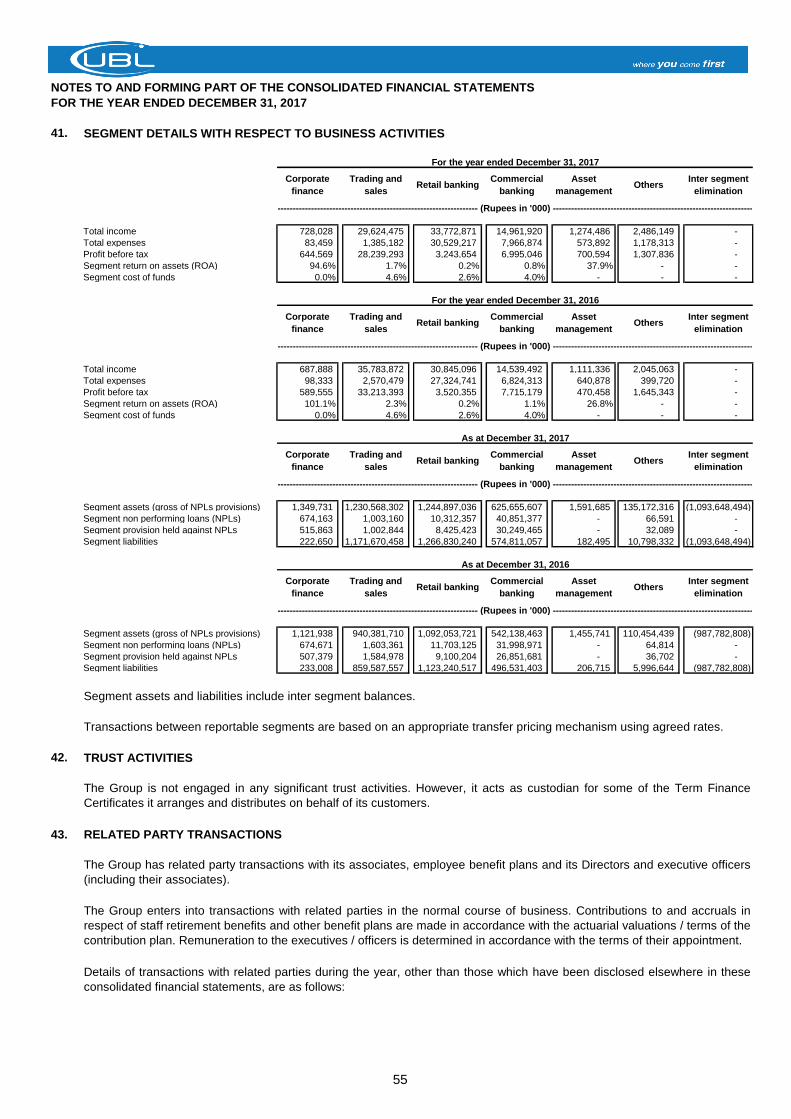
NOTES TO AND FORMING PART OF THE CONSOLIDATED FINANCIAL STATEMENTS
FOR THE YEAR ENDED DECEMBER 31, 2017
41. SEGMENT DETAILS WITH RESPECT TO BUSINESS ACTIVITIES
Corporate
finance
Trading and
salesRetail banking
Commercial
banking
Asset
managementOthers
Inter segment
elimination
Total income 728,028 29,624,475 33,772,871 14,961,920 1,274,486 2,486,149 -
Total expenses 83,459 1,385,182 30,529,217 7,966,874 573,892 1,178,313 -
Profit before tax 644,569 28,239,293 3,243,654 6,995,046 700,594 1,307,836 -
Segment return on assets (ROA) 94.6% 1.7% 0.2% 0.8% 37.9% - -
Segment cost of funds 0.0% 4.6% 2.6% 4.0% - - -
Corporate
finance
Trading and
salesRetail banking
Commercial
banking
Asset
managementOthers
Inter segment
elimination
Total income 687,888 35,783,872 30,845,096 14,539,492 1,111,336 2,045,063 -
Total expenses 98,333 2,570,479 27,324,741 6,824,313 640,878 399,720 -
Profit before tax 589,555 33,213,393 3,520,355 7,715,179 470,458 1,645,343 -
Segment return on assets (ROA) 101.1% 2.3% 0.2% 1.1% 26.8% - -
Segment cost of funds 0.0% 4.6% 2.6% 4.0% - - -
Corporate
finance
Trading and
salesRetail banking
Commercial
banking
Asset
managementOthers
Inter segment
elimination
Segment assets (gross of NPLs provisions) 1,349,731 1,230,568,302 1,244,897,036 625,655,607 1,591,685 135,172,316 (1,093,648,494)
Segment non performing loans (NPLs) 674,163 1,003,160 10,312,357 40,851,377 - 66,591 -
Segment provision held against NPLs 515,863 1,002,844 8,425,423 30,249,465 - 32,089 -
Segment liabilities 222,650 1,171,670,458 1,266,830,240 574,811,057 182,495 10,798,332 (1,093,648,494)
Corporate
finance
Trading and
salesRetail banking
Commercial
banking
Asset
managementOthers
Inter segment
elimination
Segment assets (gross of NPLs provisions) 1,121,938 940,381,710 1,092,053,721 542,138,463 1,455,741 110,454,439 (987,782,808)
Segment non performing loans (NPLs) 674,671 1,603,361 11,703,125 31,998,971 - 64,814 -
Segment provision held against NPLs 507,379 1,584,978 9,100,204 26,851,681 - 36,702 -
Segment liabilities 233,008 859,587,557 1,123,240,517 496,531,403 206,715 5,996,644 (987,782,808)
Segment assets and liabilities include inter segment balances.
Transactions between reportable segments are based on an appropriate transfer pricing mechanism using agreed rates.
42. TRUST ACTIVITIES
43. RELATED PARTY TRANSACTIONS
------------------------------------------------------------------ (Rupees in '000) ------------------------------------------------------------------
The Group enters into transactions with related parties in the normal course of business. Contributions to and accruals in
respect of staff retirement benefits and other benefit plans are made in accordance with the actuarial valuations / terms of the
contribution plan. Remuneration to the executives / officers is determined in accordance with the terms of their appointment.
Details of transactions with related parties during the year, other than those which have been disclosed elsewhere in these
consolidated financial statements, are as follows:
------------------------------------------------------------------ (Rupees in '000) ------------------------------------------------------------------
The Group is not engaged in any significant trust activities. However, it acts as custodian for some of the Term Finance
Certificates it arranges and distributes on behalf of its customers.
For the year ended December 31, 2017
For the year ended December 31, 2016
------------------------------------------------------------------ (Rupees in '000) ------------------------------------------------------------------
------------------------------------------------------------------ (Rupees in '000) ------------------------------------------------------------------
The Group has related party transactions with its associates, employee benefit plans and its Directors and executive officers
(including their associates).
As at December 31, 2017
As at December 31, 2016
55
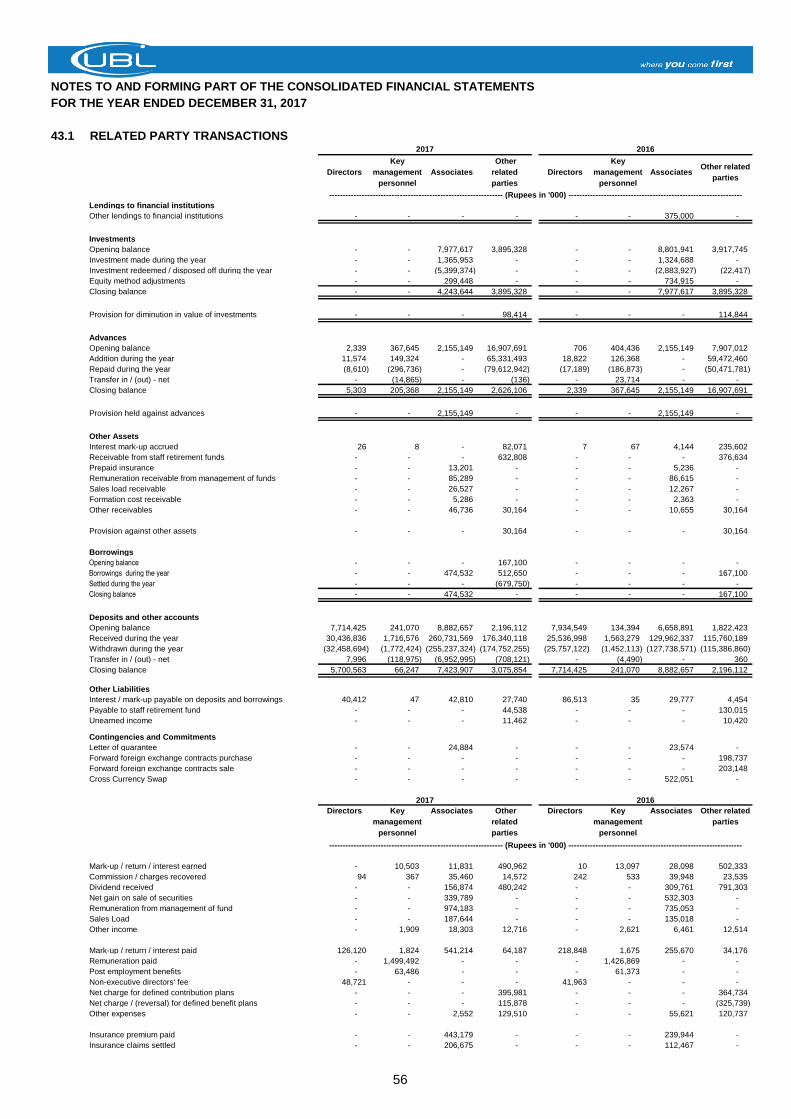
NOTES TO AND FORMING PART OF THE CONSOLIDATED FINANCIAL STATEMENTS
FOR THE YEAR ENDED DECEMBER 31, 2017
43.1 RELATED PARTY TRANSACTIONS
Directors
Key
management
personnel
Associates
Other
related
parties
Directors
Key
management
personnel
AssociatesOther related
parties
Lendings to financial institutions
Other lendings to financial institutions - - - - - - 375,000 -
Investments
Opening balance - - 7,977,617 3,895,328 - - 8,801,941 3,917,745
Investment made during the year - - 1,365,953 - - - 1,324,688 -
Investment redeemed / disposed off during the year - - (5,399,374) - - - (2,883,927) (22,417)
Equity method adjustments - - 299,448 - - - 734,915 -
Closing balance - - 4,243,644 3,895,328 - - 7,977,617 3,895,328
Provision for diminution in value of investments - - - 98,414 - - - 114,844
Advances
Opening balance 2,339 367,645 2,155,149 16,907,691 706 404,436 2,155,149 7,907,012
Addition during the year 11,574 149,324 - 65,331,493 18,822 126,368 - 59,472,460
Repaid during the year (8,610) (296,736) - (79,612,942) (17,189) (186,873) - (50,471,781)
Transfer in / (out) - net - (14,865) - (136) - 23,714 - -
Closing balance 5,303 205,368 2,155,149 2,626,106 2,339 367,645 2,155,149 16,907,691
Provision held against advances - - 2,155,149 - - - 2,155,149 -
Other Assets
Interest mark-up accrued 26 8 - 82,071 7 67 4,144 235,602
Receivable from staff retirement funds - - - 632,808 - - - 376,634
Prepaid insurance - - 13,201 - - - 5,236 -
Remuneration receivable from management of funds - - 85,289 - - - 86,615 -
Sales load receivable - - 26,527 - - - 12,267 -
Formation cost receivable - - 5,286 - - - 2,363 -
Other receivables - - 46,736 30,164 - - 10,655 30,164
Provision against other assets - - - 30,164 - - - 30,164
Borrowings
Opening balance - - - 167,100 - - - -
Borrowings during the year - - 474,532 512,650 - - - 167,100
Settled during the year - - - (679,750) - - - -
Closing balance - - 474,532 - - - - 167,100
Deposits and other accounts
Opening balance 7,714,425 241,070 8,882,657 2,196,112 7,934,549 134,394 6,658,891 1,822,423
Received during the year 30,436,836 1,716,576 260,731,569 176,340,118 25,536,998 1,563,279 129,962,337 115,760,189
Withdrawn during the year (32,458,694) (1,772,424) (255,237,324) (174,752,255) (25,757,122) (1,452,113) (127,738,571) (115,386,860)
Transfer in / (out) - net 7,996 (118,975) (6,952,995) (708,121) - (4,490) - 360
Closing balance 5,700,563 66,247 7,423,907 3,075,854 7,714,425 241,070 8,882,657 2,196,112
Other Liabilities
Interest / mark-up payable on deposits and borrowings 40,412 47 42,810 27,740 86,513 35 29,777 4,454
Payable to staff retirement fund - - - 44,538 - - - 130,015
Unearned income - - - 11,462 - - - 10,420
Contingencies and Commitments
Letter of guarantee - - 24,884 - - - 23,574 -
Forward foreign exchange contracts purchase - - - - - - - 198,737
Forward foreign exchange contracts sale - - - - - - - 203,148
Cross Currency Swap - - - - - - 522,051 -
Directors Key
management
personnel
Associates Other
related
parties
Directors Key
management
personnel
Associates Other related
parties
Mark-up / return / interest earned - 10,503 11,831 490,962 10 13,097 28,098 502,333
Commission / charges recovered 94 367 35,460 14,572 242 533 39,948 23,535
Dividend received - - 156,874 480,242 - - 309,761 791,303
Net gain on sale of securities - - 339,789 - - - 532,303 -
Remuneration from management of fund - - 974,183 - - - 735,053 -
Sales Load - - 187,644 - - - 135,018 -
Other income - 1,909 18,303 12,716 - 2,621 6,461 12,514
Mark-up / return / interest paid 126,120 1,824 541,214 64,187 218,848 1,675 255,670 34,176
Remuneration paid - 1,499,492 - - - 1,426,869 - -
Post employment benefits - 63,486 - - - 61,373 - -
Non-executive directors' fee 48,721 - - - 41,963 - - -
Net charge for defined contribution plans - - - 395,981 - - - 364,734
Net charge / (reversal) for defined benefit plans - - - 115,878 - - - (325,739)
Other expenses - - 2,552 129,510 - - 55,621 120,737
Insurance premium paid - - 443,179 - - - 239,944 -
Insurance claims settled - - 206,675 - - - 112,467 -
---------------------------------------------------------------- (Rupees in '000) ----------------------------------------------------------------
2017 2016
---------------------------------------------------------------- (Rupees in '000) ----------------------------------------------------------------
2017 2016
56
NOTES TO AND FORMING PART OF THE CONSOLIDATED FINANCIAL STATEMENTS
FOR THE YEAR ENDED DECEMBER 31, 2017
44. CAPITAL ADEQUACY
44.1
44.2 Capital Management
Statutory minimum capital and capital adequacy requirements
Tier 1 capital comprises of Common Equity Tier 1 (CET 1) and Additional Tier 1 (AT 1) capital.
AT 1 capital includes instruments meeting the prescribed SBP criteria e.g. perpetual non-cumulative preference shares.
The deductions from Tier 1 capital include mainly:
i) Book value of goodwill / intangibles;
ii) Shortfall in provision;
iii) Deficit on revaluation of available for sale investments - AFS & fixed assets;
iv) Defined benefit pension fund asset;
v) Investment in own shares;
vi) Reciprocal cross holdings in equity capital instruments of other banks, financial institutions and insurance companies;
vii) Investment in mutual funds above a prescribed ceiling;
viii) Threshold deductions applicable from 2014 on deferred tax assets and certain investments;
ix)
i) Reciprocal cross holdings in other capital instruments of other banks, financial institution and insurance companies;
ii)
10% of investments in majority capital instruments or other financial subsidiaries not consolidated in the statement of
financial position during transition phase.
CET 1 capital includes fully paid-up capital, balance in share premium account, reserve for issuance of bonus shares,
general reserves,minority interest as per the financial statements and net unappropriated profits.
Banks are also required to maintain a minimum Capital Adequacy Ratio (CAR) of 10.0% plus capital conservation buffer of
1.275% of the risk weighted exposures of the Bank. Further, under Basel III instructions, Banks are also required to maintain
a Common Equity Tier 1 (CET 1) ratio and Tier 1 ratio of 6.0% and 7.5%, respectively, as at December 31, 2017. As at
December 31, 2017 the Bank is fully compliant with prescribed ratios as the Bank’s CAR is 15.11% whereas CET 1 and Tier
1 ratios both stood at 11.03% and 11.04%. The Bank and its individually regulated operations have complied with all capital
requirements throughout the year.
The State Bank of Pakistan (SBP) through its BPRD Circular No. 6 dated August 15, 2013 has issued Basel III Capital
instructions for Banks / DFIs. The revision to the previously applicable Capital Adequacy regulations pertain to components of
eligible capital and related deductions. The amendments have been introduced with an aim to further strengthen the existing
capital related rules. Basel III instructions have become effective from December 31, 2013; however, there is a transitional
phase during which the complete requirements would become applicable with full implementation by December 31, 2019.
The SBP through its BSD Circular No. 07 dated April 15, 2009 has prescribed the minimum paid-up capital (net of
accumulated losses) for Banks to be raised to Rs.10,000 million by the year ending December 31, 2015. The paid-up capital
of the Bank for the year ended December 31, 2017 stood at Rs.12,241.798 million (2016: Rs.12,241.798 million) and is in
compliance with SBP requirements.
The Bank’s capital adequacy is reported using the rules and ratios provided by the State Bank of Pakistan. The capital
adequacy ratio is a measure of the amount of a Bank's capital expressed as a percentage of its risk weighted assets (RWAs).
Banking operations are categorized as either Trading Book or Banking Book and RWAs are determined according to specific
treatments as per the requirements of SBP that measure the varying levels of risk attached to on balance sheet and off-
balance sheet exposures. Under the current capital adequacy regulations, credit risk and market risk exposures are
measured using the Standardized Approach and operational risk is measured using the Basic Indicator Approach. Credit risk
mitigants are also applied against the Bank’s exposures based on eligible collateral.
The Bank performs its Internal Capital Adequacy Assessment Process (ICAAP) as per the guidelines provided by the SBP.
The ICAAP has been approved by the Bank’s Board of Directors and submitted to the SBP. The Bank additionally covers
risks not yet included under Pillar I, so as to carry adequate capital to cater for any future business requirements.
The objective of managing capital is to safeguard the Bank's ability to continue as a going concern. It is the policy of the Bank
to maintain a strong capital base so as to maintain investor, depositor and market confidence and to sustain future
development of the business. The Bank aims to maintain an optimum level of capital along with maximizing shareholders’
return as we consider a sound capital position as more appropriate as opposed to leverage supporting business growth.
Tier 2 capital includes general provisions for loan losses, surplus on the revaluation of fixed assets, fixed income financial
instruments (AFS) and equity investments (AFS), foreign exchange translation reserves and subordinated debts (meeting the
revised eligibility criteria). The deductions from Tier 2 include mainly:
10% of investments in majority capital instruments or other financial subsidiaries not consolidated in the statement of
financial position, during transition phase.
57
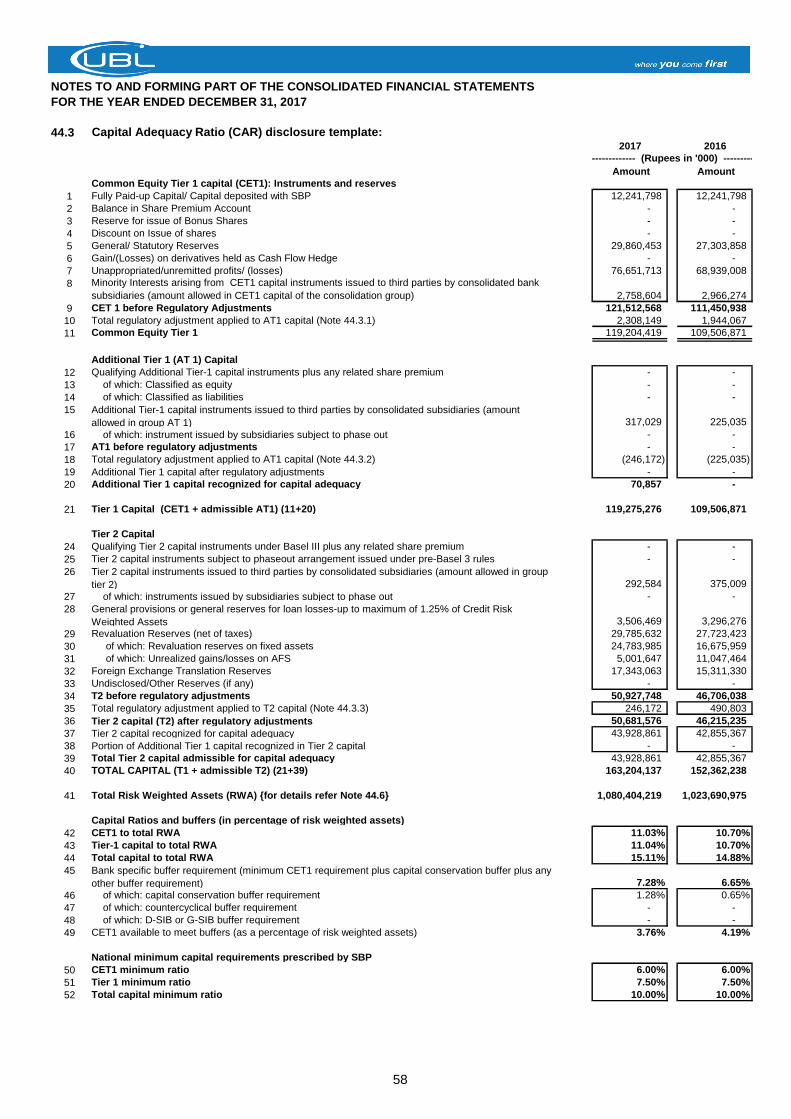
NOTES TO AND FORMING PART OF THE CONSOLIDATED FINANCIAL STATEMENTS
FOR THE YEAR ENDED DECEMBER 31, 2017
44.3 Capital Adequacy Ratio (CAR) disclosure template:2017 2016
Amount Amount
Common Equity Tier 1 capital (CET1): Instruments and reserves
1 Fully Paid-up Capital/ Capital deposited with SBP 12,241,798 12,241,798
2 Balance in Share Premium Account - -
3 Reserve for issue of Bonus Shares - -
4 Discount on Issue of shares - -
5 General/ Statutory Reserves 29,860,453 27,303,858
6 Gain/(Losses) on derivatives held as Cash Flow Hedge - -
7 Unappropriated/unremitted profits/ (losses) 76,651,713 68,939,008
8 Minority Interests arising from CET1 capital instruments issued to third parties by consolidated bank
subsidiaries (amount allowed in CET1 capital of the consolidation group) 2,758,604 2,966,274
9 CET 1 before Regulatory Adjustments 121,512,568 111,450,938
10 Total regulatory adjustment applied to AT1 capital (Note 44.3.1) 2,308,149 1,944,067
11 Common Equity Tier 1 119,204,419 109,506,871
Additional Tier 1 (AT 1) Capital
12 Qualifying Additional Tier-1 capital instruments plus any related share premium - -
13 of which: Classified as equity - -
14 of which: Classified as liabilities - -
15 Additional Tier-1 capital instruments issued to third parties by consolidated subsidiaries (amount
allowed in group AT 1) 317,029 225,035
16 of which: instrument issued by subsidiaries subject to phase out - -
17 AT1 before regulatory adjustments - -
18 Total regulatory adjustment applied to AT1 capital (Note 44.3.2) (246,172) (225,035)
19 Additional Tier 1 capital after regulatory adjustments - -
20 Additional Tier 1 capital recognized for capital adequacy 70,857 -
21 Tier 1 Capital (CET1 + admissible AT1) (11+20) 119,275,276 109,506,871
Tier 2 Capital
24 Qualifying Tier 2 capital instruments under Basel III plus any related share premium - -
25 Tier 2 capital instruments subject to phaseout arrangement issued under pre-Basel 3 rules - -
26 Tier 2 capital instruments issued to third parties by consolidated subsidiaries (amount allowed in group
tier 2) 292,584 375,009
27 of which: instruments issued by subsidiaries subject to phase out - -
28 General provisions or general reserves for loan losses-up to maximum of 1.25% of Credit Risk
Weighted Assets 3,506,469 3,296,276
29 Revaluation Reserves (net of taxes) 29,785,632 27,723,423
30 of which: Revaluation reserves on fixed assets 24,783,985 16,675,959
31 of which: Unrealized gains/losses on AFS 5,001,647 11,047,464
32 Foreign Exchange Translation Reserves 17,343,063 15,311,330
33 Undisclosed/Other Reserves (if any) - -
34 T2 before regulatory adjustments 50,927,748 46,706,038
35 Total regulatory adjustment applied to T2 capital (Note 44.3.3) 246,172 490,803
36 Tier 2 capital (T2) after regulatory adjustments 50,681,576 46,215,235
37 Tier 2 capital recognized for capital adequacy 43,928,861 42,855,367
38 Portion of Additional Tier 1 capital recognized in Tier 2 capital - -
39 Total Tier 2 capital admissible for capital adequacy 43,928,861 42,855,367
40 TOTAL CAPITAL (T1 + admissible T2) (21+39) 163,204,137 152,362,238
41 Total Risk Weighted Assets (RWA) {for details refer Note 44.6} 1,080,404,219 1,023,690,975
Capital Ratios and buffers (in percentage of risk weighted assets)
42 CET1 to total RWA 11.03% 10.70%
43 Tier-1 capital to total RWA 11.04% 10.70%
44 Total capital to total RWA 15.11% 14.88%
45 Bank specific buffer requirement (minimum CET1 requirement plus capital conservation buffer plus any
other buffer requirement) 7.28% 6.65%
46 of which: capital conservation buffer requirement 1.28% 0.65%
47 of which: countercyclical buffer requirement - -
48 of which: D-SIB or G-SIB buffer requirement - -
49 CET1 available to meet buffers (as a percentage of risk weighted assets) 3.76% 4.19%
National minimum capital requirements prescribed by SBP
50 CET1 minimum ratio 6.00% 6.00%
51 Tier 1 minimum ratio 7.50% 7.50%
52 Total capital minimum ratio 10.00% 10.00%
------------------------ (Rupees in '000) --------------------
58
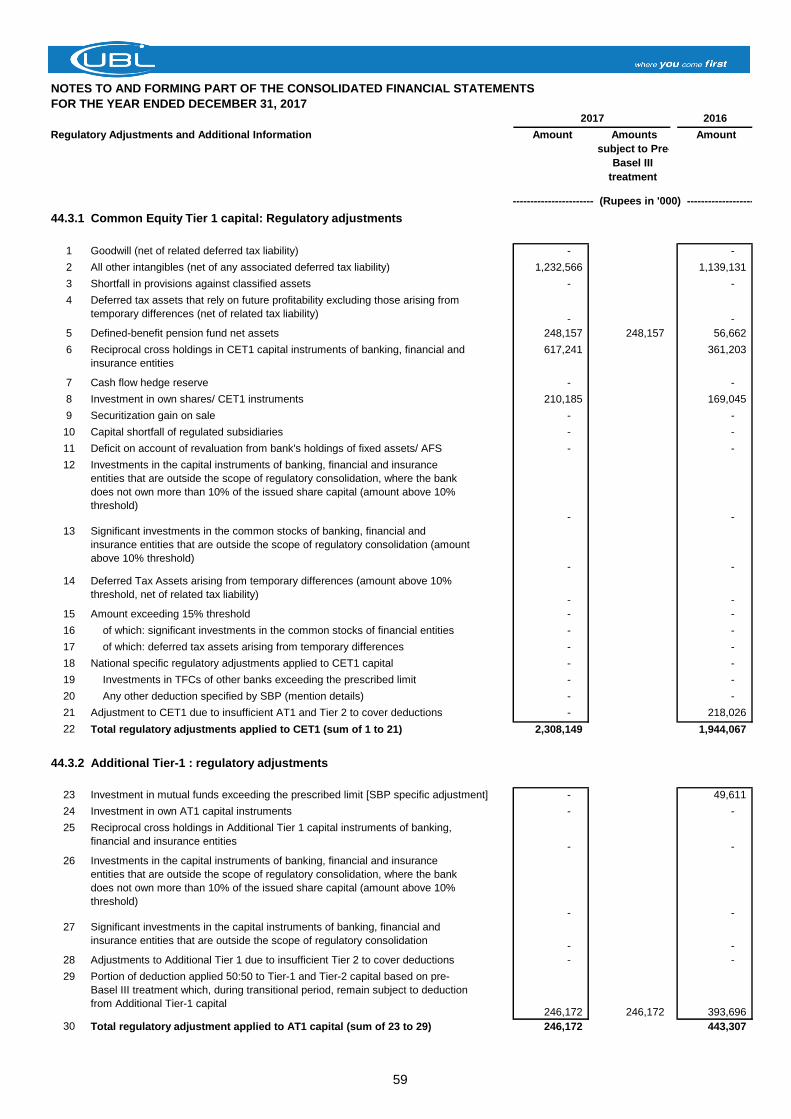
NOTES TO AND FORMING PART OF THE CONSOLIDATED FINANCIAL STATEMENTS
FOR THE YEAR ENDED DECEMBER 31, 2017
2016
Regulatory Adjustments and Additional Information Amount Amounts
subject to Pre-
Basel III
treatment
Amount
44.3.1 Common Equity Tier 1 capital: Regulatory adjustments
1 Goodwill (net of related deferred tax liability) - -
2 All other intangibles (net of any associated deferred tax liability) 1,232,566 1,139,131
3 Shortfall in provisions against classified assets - -
4 Deferred tax assets that rely on future profitability excluding those arising from
temporary differences (net of related tax liability)- -
5 Defined-benefit pension fund net assets 248,157 248,157 56,662
6 Reciprocal cross holdings in CET1 capital instruments of banking, financial and
insurance entities
617,241 361,203
7 Cash flow hedge reserve - -
8 Investment in own shares/ CET1 instruments 210,185 169,045
9 Securitization gain on sale - -
10 Capital shortfall of regulated subsidiaries - -
11 Deficit on account of revaluation from bank's holdings of fixed assets/ AFS - -
12 Investments in the capital instruments of banking, financial and insurance
entities that are outside the scope of regulatory consolidation, where the bank
does not own more than 10% of the issued share capital (amount above 10%
threshold)- -
13 Significant investments in the common stocks of banking, financial and
insurance entities that are outside the scope of regulatory consolidation (amount
above 10% threshold)- -
14 Deferred Tax Assets arising from temporary differences (amount above 10%
threshold, net of related tax liability)- -
15 Amount exceeding 15% threshold - -
16 of which: significant investments in the common stocks of financial entities - -
17 of which: deferred tax assets arising from temporary differences - -
18 National specific regulatory adjustments applied to CET1 capital - -
19 Investments in TFCs of other banks exceeding the prescribed limit - -
20 Any other deduction specified by SBP (mention details) - -
21 Adjustment to CET1 due to insufficient AT1 and Tier 2 to cover deductions - 218,026
22 Total regulatory adjustments applied to CET1 (sum of 1 to 21) 2,308,149 1,944,067
44.3.2 Additional Tier-1 : regulatory adjustments
23 Investment in mutual funds exceeding the prescribed limit [SBP specific adjustment] - 49,611
24 Investment in own AT1 capital instruments - -
25 Reciprocal cross holdings in Additional Tier 1 capital instruments of banking,
financial and insurance entities- -
26 Investments in the capital instruments of banking, financial and insurance
entities that are outside the scope of regulatory consolidation, where the bank
does not own more than 10% of the issued share capital (amount above 10%
threshold)- -
27 Significant investments in the capital instruments of banking, financial and
insurance entities that are outside the scope of regulatory consolidation- -
28 Adjustments to Additional Tier 1 due to insufficient Tier 2 to cover deductions - -
29 Portion of deduction applied 50:50 to Tier-1 and Tier-2 capital based on pre-
Basel III treatment which, during transitional period, remain subject to deduction
from Additional Tier-1 capital246,172 246,172 393,696
30 Total regulatory adjustment applied to AT1 capital (sum of 23 to 29) 246,172 443,307
2017
------------------------ (Rupees in '000) --------------------
59
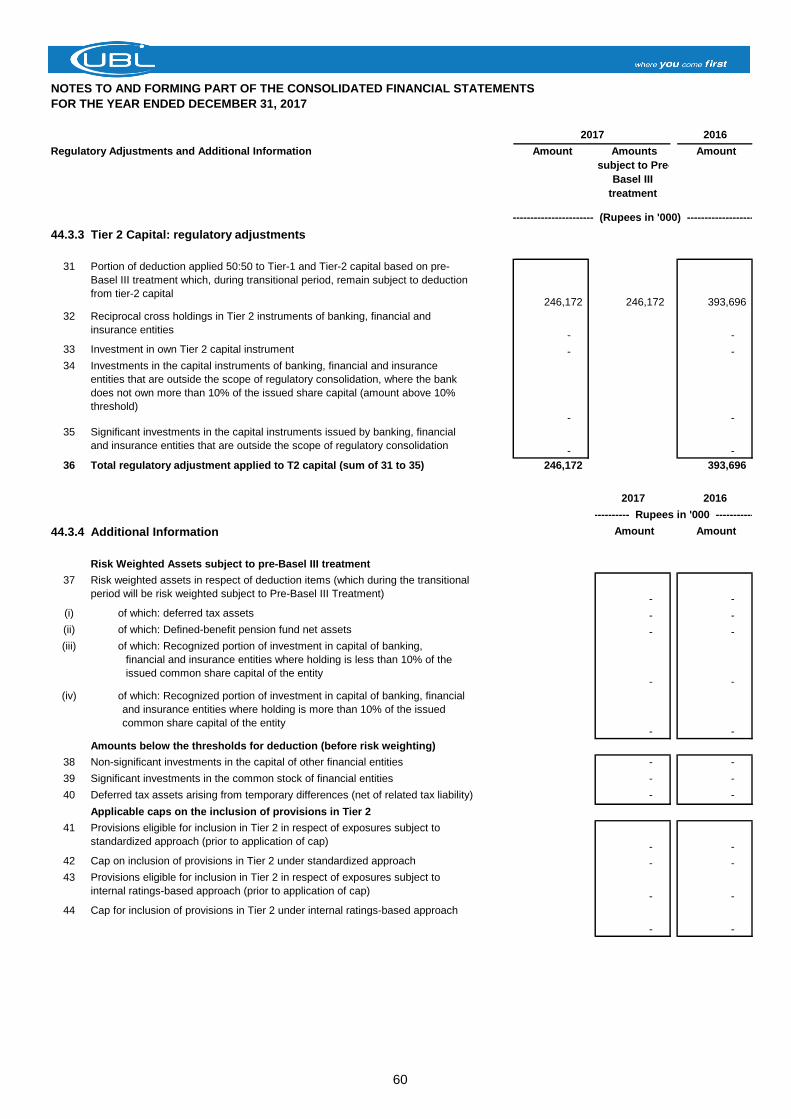
NOTES TO AND FORMING PART OF THE CONSOLIDATED FINANCIAL STATEMENTS
FOR THE YEAR ENDED DECEMBER 31, 2017
2016
Regulatory Adjustments and Additional Information Amount Amounts
subject to Pre-
Basel III
treatment
Amount
44.3.3 Tier 2 Capital: regulatory adjustments
31 Portion of deduction applied 50:50 to Tier-1 and Tier-2 capital based on pre-
Basel III treatment which, during transitional period, remain subject to deduction
from tier-2 capital246,172 246,172 393,696
32 Reciprocal cross holdings in Tier 2 instruments of banking, financial and
insurance entities- -
33 Investment in own Tier 2 capital instrument - -
34 Investments in the capital instruments of banking, financial and insurance
entities that are outside the scope of regulatory consolidation, where the bank
does not own more than 10% of the issued share capital (amount above 10%
threshold)- -
35 Significant investments in the capital instruments issued by banking, financial
and insurance entities that are outside the scope of regulatory consolidation- -
36 Total regulatory adjustment applied to T2 capital (sum of 31 to 35) 246,172 393,696
2017 2016
44.3.4 Additional Information Amount Amount
Risk Weighted Assets subject to pre-Basel III treatment
37 Risk weighted assets in respect of deduction items (which during the transitional
period will be risk weighted subject to Pre-Basel III Treatment)- -
(i) of which: deferred tax assets - -
(ii) of which: Defined-benefit pension fund net assets - -
(iii) of which: Recognized portion of investment in capital of banking,
----------financial and insurance entities where holding is less than 10% of the ------
----------issued common share capital of the entity - -
(iv) of which: Recognized portion of investment in capital of banking, financial --
---------and insurance entities where holding is more than 10% of the issued --------
---------common share capital of the entity - -
Amounts below the thresholds for deduction (before risk weighting)
38 Non-significant investments in the capital of other financial entities - -
39 Significant investments in the common stock of financial entities - -
40 Deferred tax assets arising from temporary differences (net of related tax liability) - -
Applicable caps on the inclusion of provisions in Tier 2
41 Provisions eligible for inclusion in Tier 2 in respect of exposures subject to
standardized approach (prior to application of cap)- -
42 Cap on inclusion of provisions in Tier 2 under standardized approach - -
43 Provisions eligible for inclusion in Tier 2 in respect of exposures subject to
internal ratings-based approach (prior to application of cap)- -
44 Cap for inclusion of provisions in Tier 2 under internal ratings-based approach
- -
------------------- Rupees in '000 --------------------
2017
------------------------ (Rupees in '000) --------------------
60
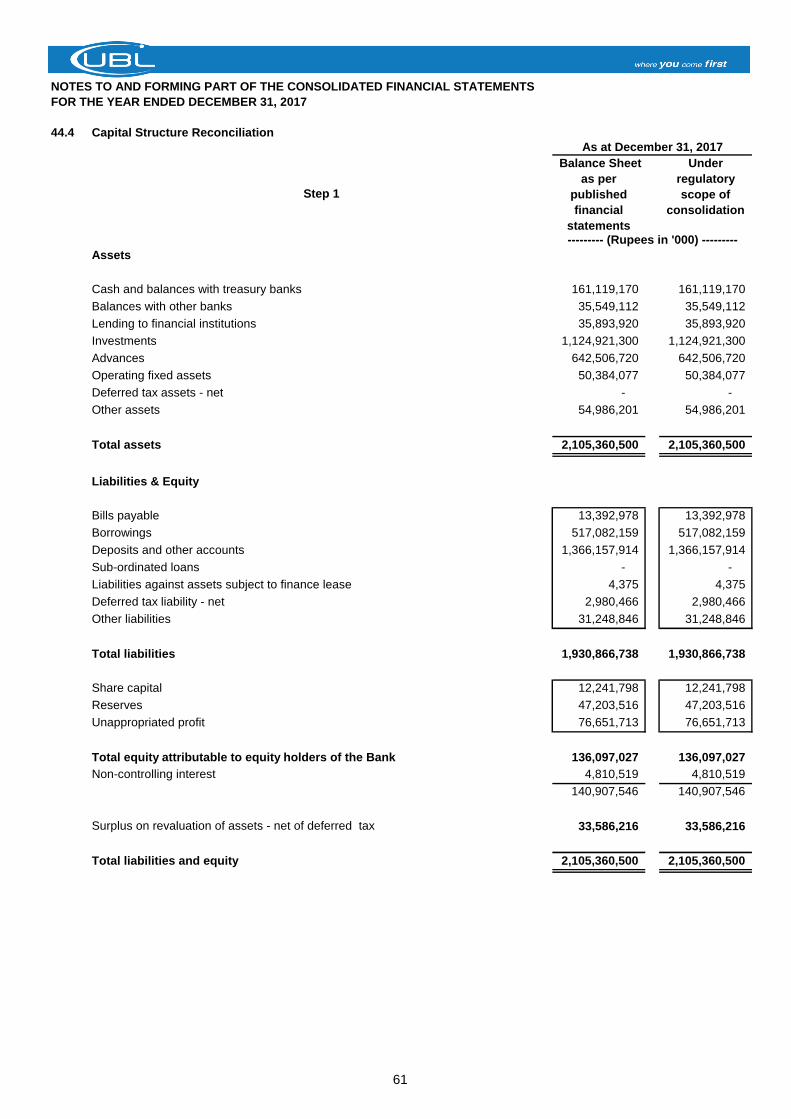
NOTES TO AND FORMING PART OF THE CONSOLIDATED FINANCIAL STATEMENTS
FOR THE YEAR ENDED DECEMBER 31, 2017
44.4 Capital Structure Reconciliation
Step 1
Balance Sheet
as per
published
financial
statements
Under
regulatory
scope of
consolidation
Assets
Cash and balances with treasury banks 161,119,170 161,119,170
Balances with other banks 35,549,112 35,549,112
Lending to financial institutions 35,893,920 35,893,920
Investments 1,124,921,300 1,124,921,300
Advances 642,506,720 642,506,720
Operating fixed assets 50,384,077 50,384,077
Deferred tax assets - net - -
Other assets 54,986,201 54,986,201
Total assets 2,105,360,500 2,105,360,500
Liabilities & Equity
Bills payable 13,392,978 13,392,978
Borrowings 517,082,159 517,082,159
Deposits and other accounts 1,366,157,914 1,366,157,914
Sub-ordinated loans - -
Liabilities against assets subject to finance lease 4,375 4,375
Deferred tax liability - net 2,980,466 2,980,466
Other liabilities 31,248,846 31,248,846
Total liabilities 1,930,866,738 1,930,866,738
Share capital 12,241,798 12,241,798
Reserves 47,203,516 47,203,516
Unappropriated profit 76,651,713 76,651,713
Total equity attributable to equity holders of the Bank 136,097,027 136,097,027
Non-controlling interest 4,810,519 4,810,519
140,907,546 140,907,546
Surplus on revaluation of assets - net of deferred tax 33,586,216 33,586,216
Total liabilities and equity 2,105,360,500 2,105,360,500
--------- (Rupees in '000) ---------
As at December 31, 2017
61
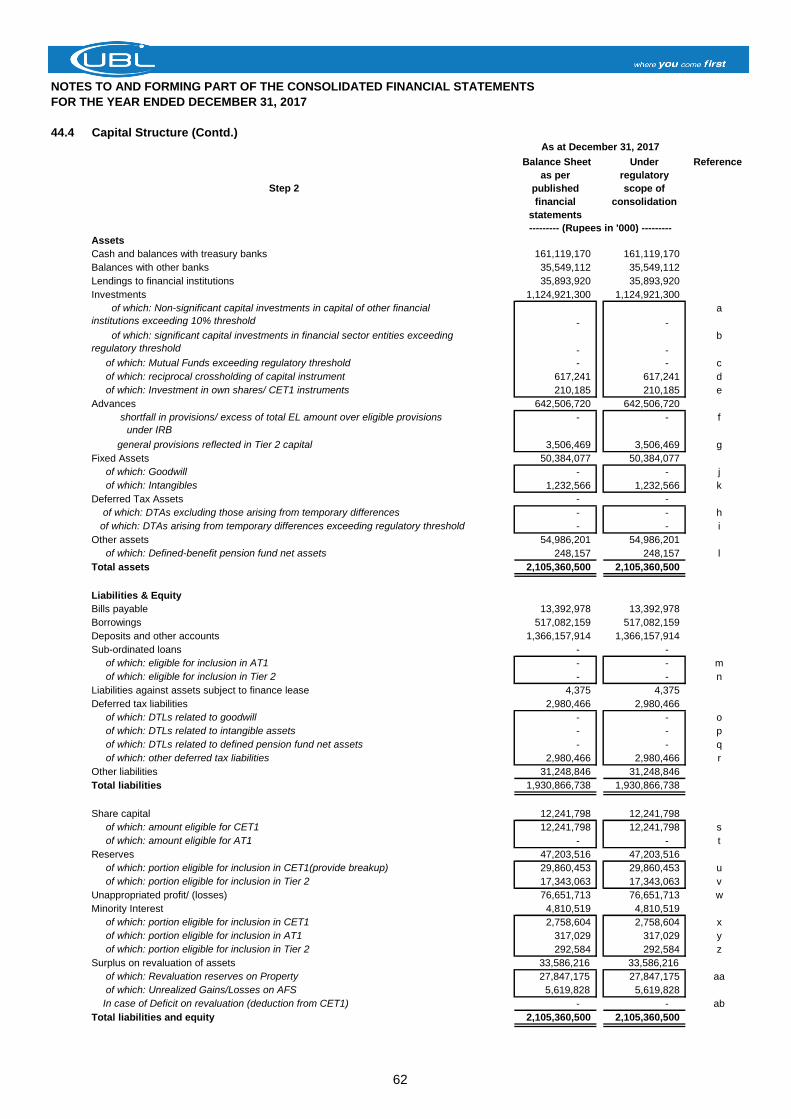
NOTES TO AND FORMING PART OF THE CONSOLIDATED FINANCIAL STATEMENTS
FOR THE YEAR ENDED DECEMBER 31, 2017
44.4 Capital Structure (Contd.)
Step 2
Balance Sheet
as per
published
financial
statements
Under
regulatory
scope of
consolidation
Reference
Assets
Cash and balances with treasury banks 161,119,170 161,119,170
Balances with other banks 35,549,112 35,549,112
Lendings to financial institutions 35,893,920 35,893,920
Investments 1,124,921,300 1,124,921,300
of which: Non-significant capital investments in capital of other financial
institutions exceeding 10% threshold - -
a
of which: significant capital investments in financial sector entities exceeding
regulatory threshold - -
b
of which: Mutual Funds exceeding regulatory threshold - - c
of which: reciprocal crossholding of capital instrument 617,241 617,241 d
of which: Investment in own shares/ CET1 instruments 210,185 210,185 e
Advances 642,506,720 642,506,720
shortfall in provisions/ excess of total EL amount over eligible provisions ----
---------- under IRB
- - f
general provisions reflected in Tier 2 capital 3,506,469 3,506,469 g
Fixed Assets 50,384,077 50,384,077
of which: Goodwill - - j
of which: Intangibles 1,232,566 1,232,566 k
Deferred Tax Assets - -
of which: DTAs excluding those arising from temporary differences - - h
of which: DTAs arising from temporary differences exceeding regulatory threshold - - i
Other assets 54,986,201 54,986,201
of which: Defined-benefit pension fund net assets 248,157 248,157 l
Total assets 2,105,360,500 2,105,360,500
Liabilities & Equity
Bills payable 13,392,978 13,392,978
Borrowings 517,082,159 517,082,159
Deposits and other accounts 1,366,157,914 1,366,157,914
Sub-ordinated loans - -
of which: eligible for inclusion in AT1 - - m
of which: eligible for inclusion in Tier 2 - - n
Liabilities against assets subject to finance lease 4,375 4,375
Deferred tax liabilities 2,980,466 2,980,466
of which: DTLs related to goodwill - - o
of which: DTLs related to intangible assets - - p
of which: DTLs related to defined pension fund net assets - - q
of which: other deferred tax liabilities 2,980,466 2,980,466 r
Other liabilities 31,248,846 31,248,846
Total liabilities 1,930,866,738 1,930,866,738
Share capital 12,241,798 12,241,798
of which: amount eligible for CET1 12,241,798 12,241,798 s
of which: amount eligible for AT1 - - t
Reserves 47,203,516 47,203,516
of which: portion eligible for inclusion in CET1(provide breakup) 29,860,453 29,860,453 u
of which: portion eligible for inclusion in Tier 2 17,343,063 17,343,063 v
Unappropriated profit/ (losses) 76,651,713 76,651,713 w
Minority Interest 4,810,519 4,810,519
of which: portion eligible for inclusion in CET1 2,758,604 2,758,604 x
of which: portion eligible for inclusion in AT1 317,029 317,029 y
of which: portion eligible for inclusion in Tier 2 292,584 292,584 z
Surplus on revaluation of assets 33,586,216 33,586,216
of which: Revaluation reserves on Property 27,847,175 27,847,175 aa
of which: Unrealized Gains/Losses on AFS 5,619,828 5,619,828
In case of Deficit on revaluation (deduction from CET1) - - ab
Total liabilities and equity 2,105,360,500 2,105,360,500
--------- (Rupees in '000) ---------
As at December 31, 2017
62
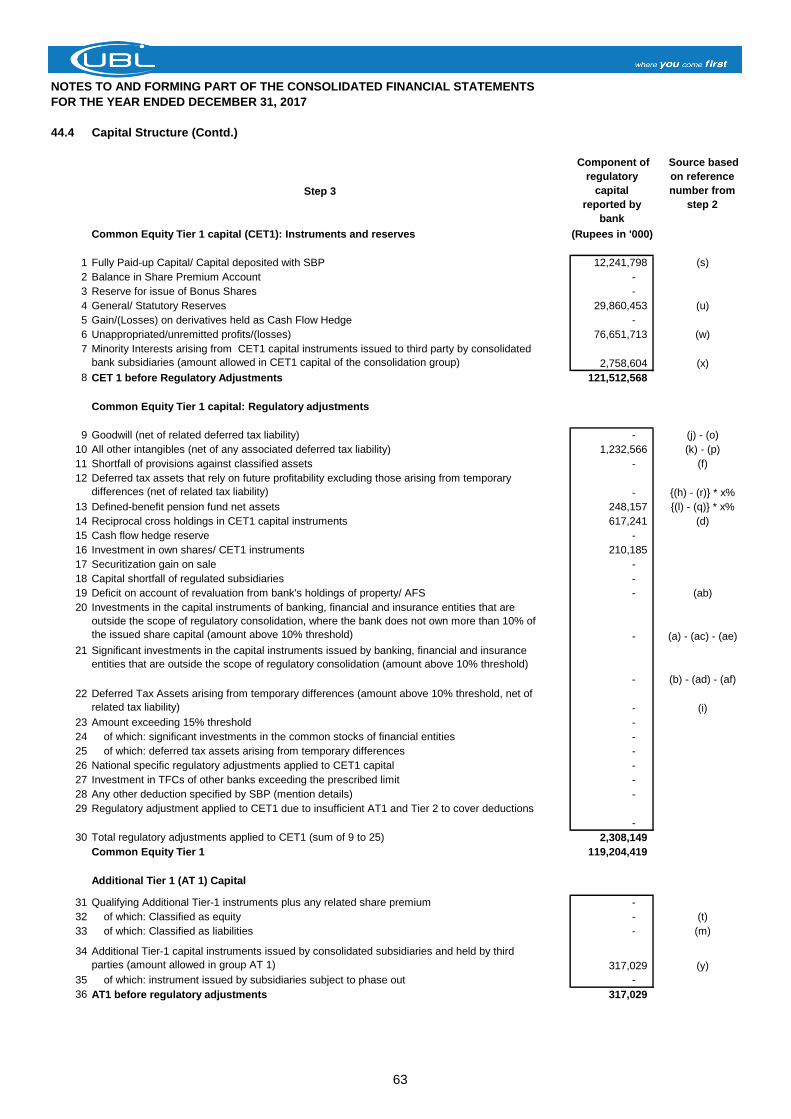
NOTES TO AND FORMING PART OF THE CONSOLIDATED FINANCIAL STATEMENTS
FOR THE YEAR ENDED DECEMBER 31, 2017
44.4 Capital Structure (Contd.)
Step 3
Component of
regulatory
capital
reported by
bank
Source based
on reference
number from
step 2
Common Equity Tier 1 capital (CET1): Instruments and reserves (Rupees in '000)
1 Fully Paid-up Capital/ Capital deposited with SBP 12,241,798
2 Balance in Share Premium Account -
3 Reserve for issue of Bonus Shares -
4 General/ Statutory Reserves 29,860,453
5 Gain/(Losses) on derivatives held as Cash Flow Hedge -
6 Unappropriated/unremitted profits/(losses) 76,651,713 (w)
7 Minority Interests arising from CET1 capital instruments issued to third party by consolidated
bank subsidiaries (amount allowed in CET1 capital of the consolidation group) 2,758,604 (x)
8 CET 1 before Regulatory Adjustments 121,512,568
Common Equity Tier 1 capital: Regulatory adjustments
9 Goodwill (net of related deferred tax liability) - (j) - (o)
10 All other intangibles (net of any associated deferred tax liability) 1,232,566 (k) - (p)
11 Shortfall of provisions against classified assets - (f)
12 Deferred tax assets that rely on future profitability excluding those arising from temporary
differences (net of related tax liability) - {(h) - (r)} * x%
13 Defined-benefit pension fund net assets 248,157 {(l) - (q)} * x%
14 Reciprocal cross holdings in CET1 capital instruments 617,241 (d)
15 Cash flow hedge reserve -
16 Investment in own shares/ CET1 instruments 210,185
17 Securitization gain on sale -
18 Capital shortfall of regulated subsidiaries -
19 Deficit on account of revaluation from bank's holdings of property/ AFS - (ab)
20 Investments in the capital instruments of banking, financial and insurance entities that are
outside the scope of regulatory consolidation, where the bank does not own more than 10% of
the issued share capital (amount above 10% threshold) - (a) - (ac) - (ae)
21 Significant investments in the capital instruments issued by banking, financial and insurance
entities that are outside the scope of regulatory consolidation (amount above 10% threshold)
- (b) - (ad) - (af)
22 Deferred Tax Assets arising from temporary differences (amount above 10% threshold, net of
related tax liability) - (i)
23 Amount exceeding 15% threshold -
24 of which: significant investments in the common stocks of financial entities -
25 of which: deferred tax assets arising from temporary differences -
26 National specific regulatory adjustments applied to CET1 capital -
27 Investment in TFCs of other banks exceeding the prescribed limit -
28 Any other deduction specified by SBP (mention details) -
29 Regulatory adjustment applied to CET1 due to insufficient AT1 and Tier 2 to cover deductions
-
30 Total regulatory adjustments applied to CET1 (sum of 9 to 25) 2,308,149
Common Equity Tier 1 119,204,419
Additional Tier 1 (AT 1) Capital
31 Qualifying Additional Tier-1 instruments plus any related share premium -
32 of which: Classified as equity - (t)
33 of which: Classified as liabilities - (m)
34 Additional Tier-1 capital instruments issued by consolidated subsidiaries and held by third
parties (amount allowed in group AT 1) 317,029 (y)
35 of which: instrument issued by subsidiaries subject to phase out -
36 AT1 before regulatory adjustments 317,029
(s)
(u)
63
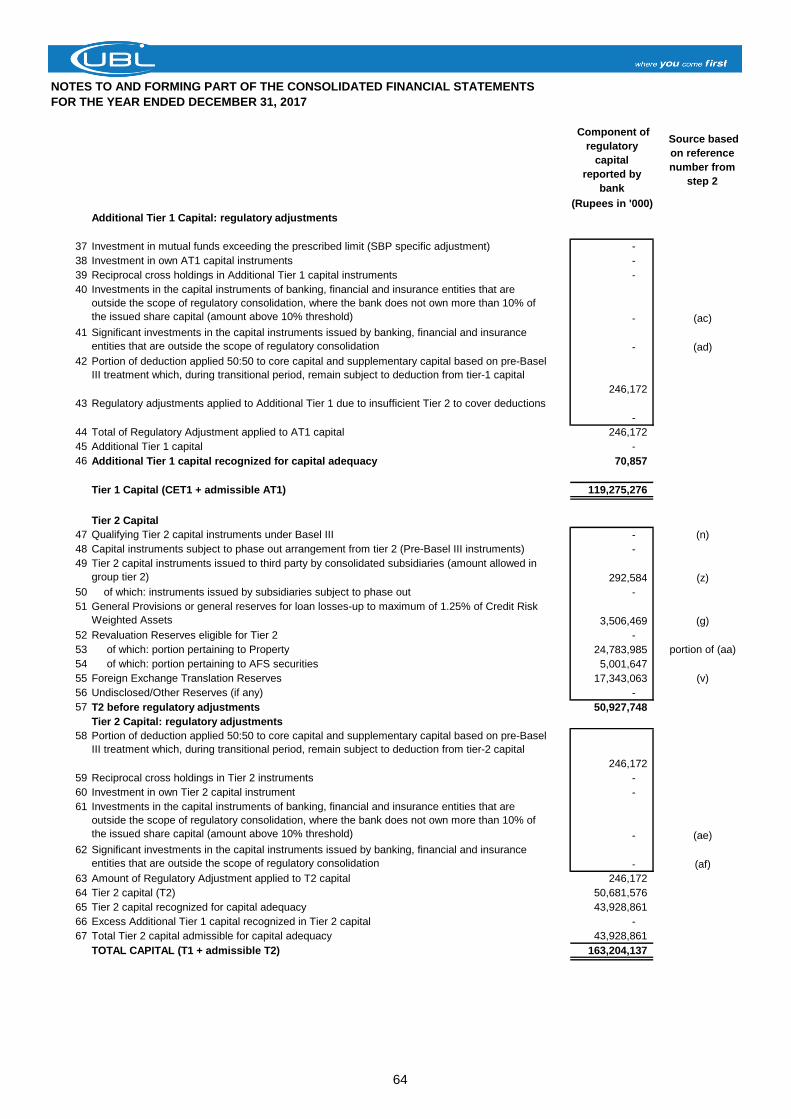
NOTES TO AND FORMING PART OF THE CONSOLIDATED FINANCIAL STATEMENTS
FOR THE YEAR ENDED DECEMBER 31, 2017
Component of
regulatory
capital
reported by
bank
Source based
on reference
number from
step 2
(Rupees in '000)
Additional Tier 1 Capital: regulatory adjustments
37 Investment in mutual funds exceeding the prescribed limit (SBP specific adjustment) -
38 Investment in own AT1 capital instruments -
39 Reciprocal cross holdings in Additional Tier 1 capital instruments -
40 Investments in the capital instruments of banking, financial and insurance entities that are
outside the scope of regulatory consolidation, where the bank does not own more than 10% of
the issued share capital (amount above 10% threshold) - (ac)
41 Significant investments in the capital instruments issued by banking, financial and insurance
entities that are outside the scope of regulatory consolidation - (ad)
42 Portion of deduction applied 50:50 to core capital and supplementary capital based on pre-Basel
III treatment which, during transitional period, remain subject to deduction from tier-1 capital
246,172
43 Regulatory adjustments applied to Additional Tier 1 due to insufficient Tier 2 to cover deductions
-
44 Total of Regulatory Adjustment applied to AT1 capital 246,172
45 Additional Tier 1 capital -
46 Additional Tier 1 capital recognized for capital adequacy 70,857
Tier 1 Capital (CET1 + admissible AT1) 119,275,276
Tier 2 Capital
47 Qualifying Tier 2 capital instruments under Basel III - (n)
48 Capital instruments subject to phase out arrangement from tier 2 (Pre-Basel III instruments) -
49 Tier 2 capital instruments issued to third party by consolidated subsidiaries (amount allowed in
group tier 2) 292,584 (z)
50 of which: instruments issued by subsidiaries subject to phase out -
51 General Provisions or general reserves for loan losses-up to maximum of 1.25% of Credit Risk
Weighted Assets 3,506,469 (g)
52 Revaluation Reserves eligible for Tier 2 -
53 of which: portion pertaining to Property 24,783,985
54 of which: portion pertaining to AFS securities 5,001,647
55 Foreign Exchange Translation Reserves 17,343,063 (v)
56 Undisclosed/Other Reserves (if any) -
57 T2 before regulatory adjustments 50,927,748
Tier 2 Capital: regulatory adjustments
58 Portion of deduction applied 50:50 to core capital and supplementary capital based on pre-Basel
III treatment which, during transitional period, remain subject to deduction from tier-2 capital
246,172
59 Reciprocal cross holdings in Tier 2 instruments -
60 Investment in own Tier 2 capital instrument -
61 Investments in the capital instruments of banking, financial and insurance entities that are
outside the scope of regulatory consolidation, where the bank does not own more than 10% of
the issued share capital (amount above 10% threshold) - (ae)
62 Significant investments in the capital instruments issued by banking, financial and insurance
entities that are outside the scope of regulatory consolidation - (af)
63 Amount of Regulatory Adjustment applied to T2 capital 246,172
64 Tier 2 capital (T2) 50,681,576
65 Tier 2 capital recognized for capital adequacy 43,928,861
66 Excess Additional Tier 1 capital recognized in Tier 2 capital -
67 Total Tier 2 capital admissible for capital adequacy 43,928,861
TOTAL CAPITAL (T1 + admissible T2) 163,204,137
portion of (aa)
64
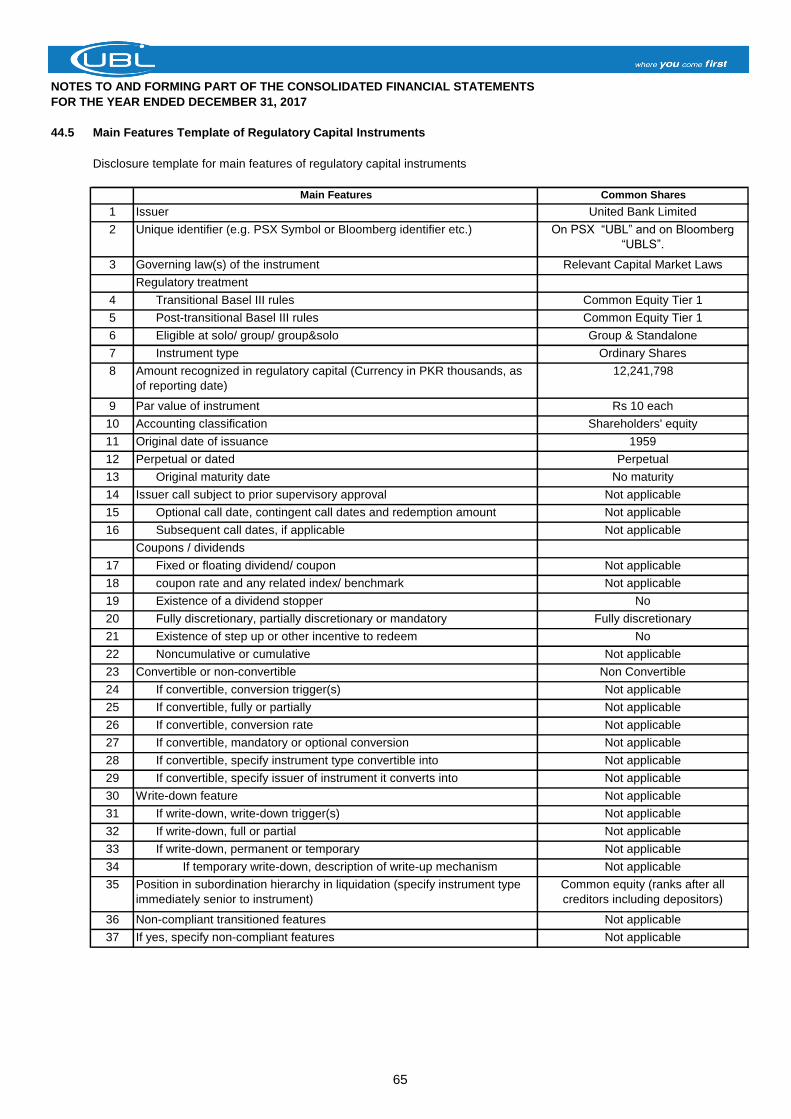
NOTES TO AND FORMING PART OF THE CONSOLIDATED FINANCIAL STATEMENTS
FOR THE YEAR ENDED DECEMBER 31, 2017
44.5 Main Features Template of Regulatory Capital Instruments
Main Features Common Shares
1 Issuer United Bank Limited
2 Unique identifier (e.g. PSX Symbol or Bloomberg identifier etc.) On PSX “UBL” and on Bloomberg
“UBLS”.
3 Governing law(s) of the instrument Relevant Capital Market Laws
Regulatory treatment
4 Transitional Basel III rules Common Equity Tier 1
5 Post-transitional Basel III rules Common Equity Tier 1
6 Eligible at solo/ group/ group&solo Group & Standalone
7 Instrument type Ordinary Shares
8 Amount recognized in regulatory capital (Currency in PKR thousands, as
of reporting date)
12,241,798
9 Par value of instrument Rs 10 each
10 Accounting classification Shareholders' equity
11 Original date of issuance 1959
12 Perpetual or dated Perpetual
13 Original maturity date No maturity
14 Issuer call subject to prior supervisory approval Not applicable
15 Optional call date, contingent call dates and redemption amount Not applicable
16 Subsequent call dates, if applicable Not applicable
Coupons / dividends
17 Fixed or floating dividend/ coupon Not applicable
18 coupon rate and any related index/ benchmark Not applicable
19 Existence of a dividend stopper No
20 Fully discretionary, partially discretionary or mandatory Fully discretionary
21 Existence of step up or other incentive to redeem No
22 Noncumulative or cumulative Not applicable
23 Convertible or non-convertible Non Convertible
24 If convertible, conversion trigger(s) Not applicable
25 If convertible, fully or partially Not applicable
26 If convertible, conversion rate Not applicable
27 If convertible, mandatory or optional conversion Not applicable
28 If convertible, specify instrument type convertible into Not applicable
29 If convertible, specify issuer of instrument it converts into Not applicable
30 Write-down feature Not applicable
31 If write-down, write-down trigger(s) Not applicable
32 If write-down, full or partial Not applicable
33 If write-down, permanent or temporary Not applicable
34 If temporary write-down, description of write-up mechanism Not applicable
35 Position in subordination hierarchy in liquidation (specify instrument type
immediately senior to instrument)
Common equity (ranks after all
creditors including depositors)
36 Non-compliant transitioned features Not applicable
37 If yes, specify non-compliant features Not applicable
Disclosure template for main features of regulatory capital instruments
65
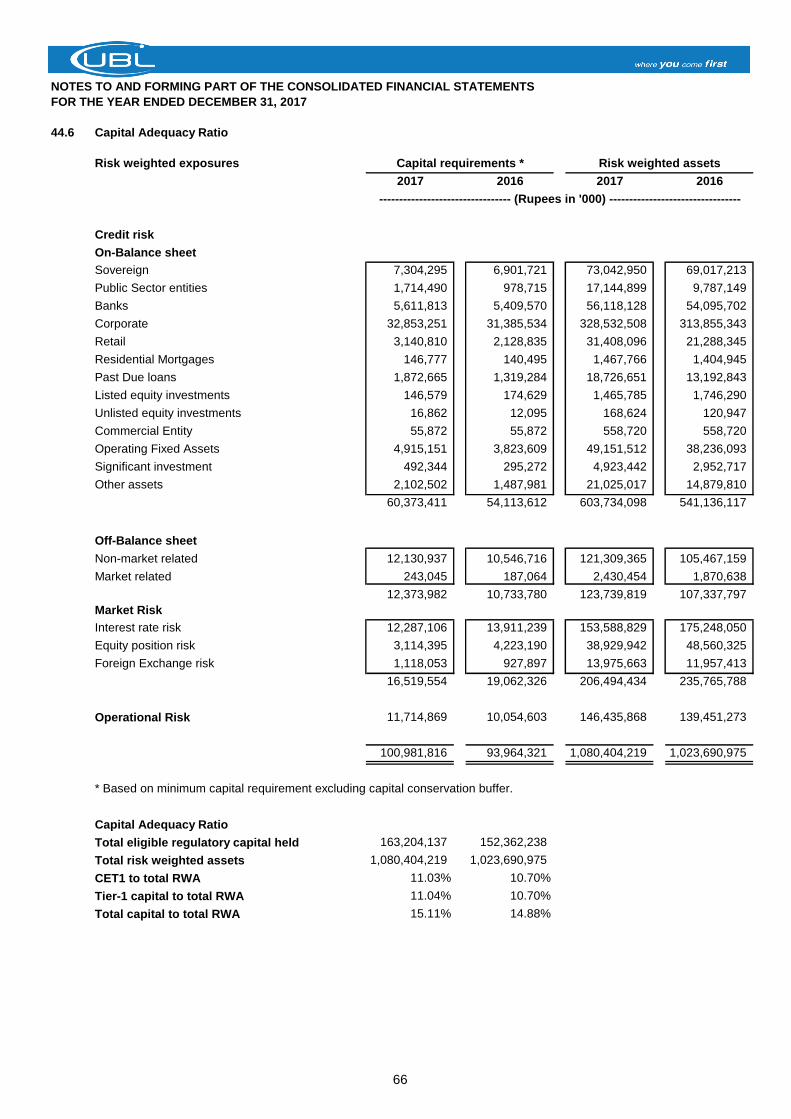
NOTES TO AND FORMING PART OF THE CONSOLIDATED FINANCIAL STATEMENTS
FOR THE YEAR ENDED DECEMBER 31, 2017
44.6 Capital Adequacy Ratio
Risk weighted exposures
2017 2016 2017 2016
Credit risk
On-Balance sheet
Sovereign 7,304,295 6,901,721 73,042,950 69,017,213
Public Sector entities 1,714,490 978,715 17,144,899 9,787,149
Banks 5,611,813 5,409,570 56,118,128 54,095,702
Corporate 32,853,251 31,385,534 328,532,508 313,855,343
Retail 3,140,810 2,128,835 31,408,096 21,288,345
Residential Mortgages 146,777 140,495 1,467,766 1,404,945
Past Due loans 1,872,665 1,319,284 18,726,651 13,192,843
Listed equity investments 146,579 174,629 1,465,785 1,746,290
Unlisted equity investments 16,862 12,095 168,624 120,947
Commercial Entity 55,872 55,872 558,720 558,720
Operating Fixed Assets 4,915,151 3,823,609 49,151,512 38,236,093
Significant investment 492,344 295,272 4,923,442 2,952,717
Other assets 2,102,502 1,487,981 21,025,017 14,879,810
60,373,411 54,113,612 603,734,098 541,136,117
Off-Balance sheet
Non-market related 12,130,937 10,546,716 121,309,365 105,467,159
Market related 243,045 187,064 2,430,454 1,870,638
12,373,982 10,733,780 123,739,819 107,337,797
Market Risk
Interest rate risk 12,287,106 13,911,239 153,588,829 175,248,050
Equity position risk 3,114,395 4,223,190 38,929,942 48,560,325
Foreign Exchange risk 1,118,053 927,897 13,975,663 11,957,413
16,519,554 19,062,326 206,494,434 235,765,788
Operational Risk 11,714,869 10,054,603 146,435,868 139,451,273
100,981,816 93,964,321 1,080,404,219 1,023,690,975
* Based on minimum capital requirement excluding capital conservation buffer.
Capital Adequacy Ratio
Total eligible regulatory capital held 163,204,137 152,362,238
Total risk weighted assets 1,080,404,219 1,023,690,975
CET1 to total RWA 11.03% 10.70%
Tier-1 capital to total RWA 11.04% 10.70%
Total capital to total RWA 15.11% 14.88%
Capital requirements * Risk weighted assets
--------------------------------- (Rupees in '000) ---------------------------------
66
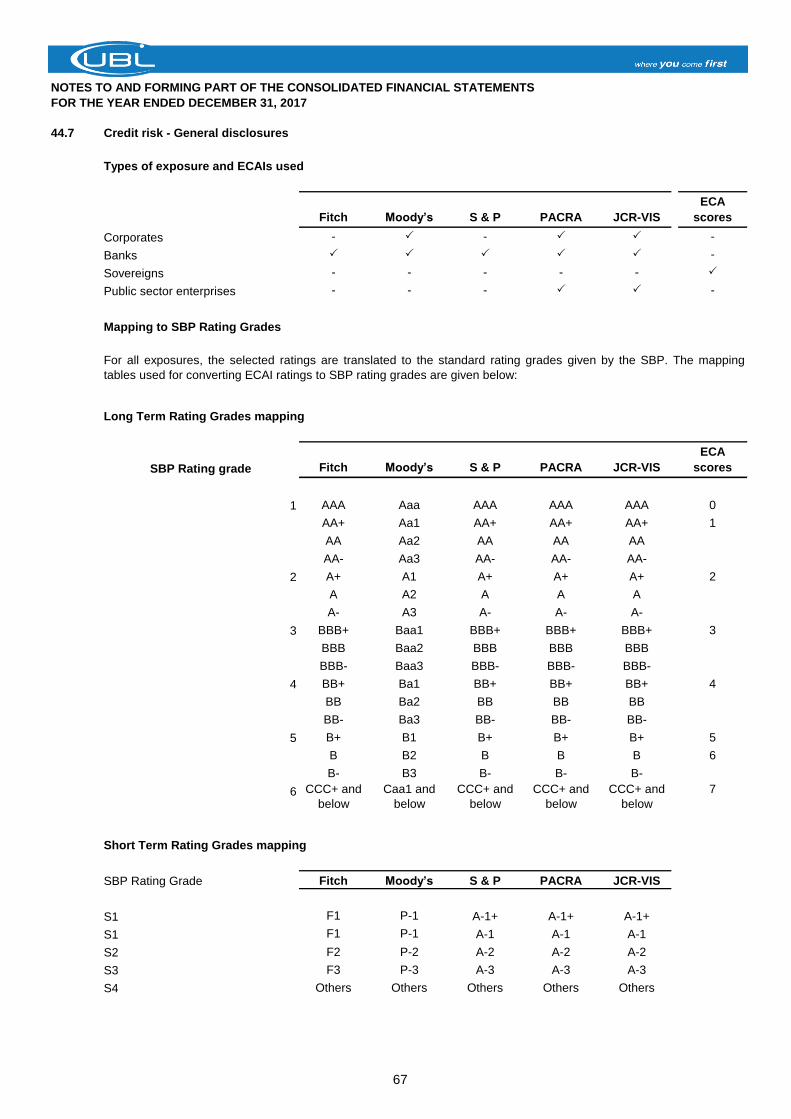
NOTES TO AND FORMING PART OF THE CONSOLIDATED FINANCIAL STATEMENTS
FOR THE YEAR ENDED DECEMBER 31, 2017
44.7 Credit risk - General disclosures
Types of exposure and ECAIs used
Fitch Moody’s S & P PACRA JCR-VIS
ECA
scores
Corporates - P - P P -
Banks P P P P P -
Sovereigns - - - - - P
Public sector enterprises - - - P P -
Mapping to SBP Rating Grades
Long Term Rating Grades mapping
Fitch Moody’s S & P PACRA JCR-VIS
ECA
scores
AAA Aaa AAA AAA AAA 0
AA+ Aa1 AA+ AA+ AA+ 1
AA Aa2 AA AA AA
AA- Aa3 AA- AA- AA-
A+ A1 A+ A+ A+ 2
A A2 A A A
A- A3 A- A- A-
BBB+ Baa1 BBB+ BBB+ BBB+ 3
BBB Baa2 BBB BBB BBB
BBB- Baa3 BBB- BBB- BBB-
BB+ Ba1 BB+ BB+ BB+ 4
BB Ba2 BB BB BB
BB- Ba3 BB- BB- BB-
B+ B1 B+ B+ B+ 5
B B2 B B B 6
B- B3 B- B- B-
7
Short Term Rating Grades mapping
Fitch Moody’s S & P PACRA JCR-VIS
F1 P-1 A-1+ A-1+ A-1+
F1 P-1 A-1 A-1 A-1
F2 P-2 A-2 A-2 A-2
F3 P-3 A-3 A-3 A-3
Others Others Others Others Others
4
1
For all exposures, the selected ratings are translated to the standard rating grades given by the SBP. The mapping
tables used for converting ECAI ratings to SBP rating grades are given below:
SBP Rating grade
S3
2
3
Caa1 and
below
5
S1
S2
CCC+ and
below
CCC+ and
below
CCC+ and
below6
S4
S1
SBP Rating Grade
CCC+ and
below
67
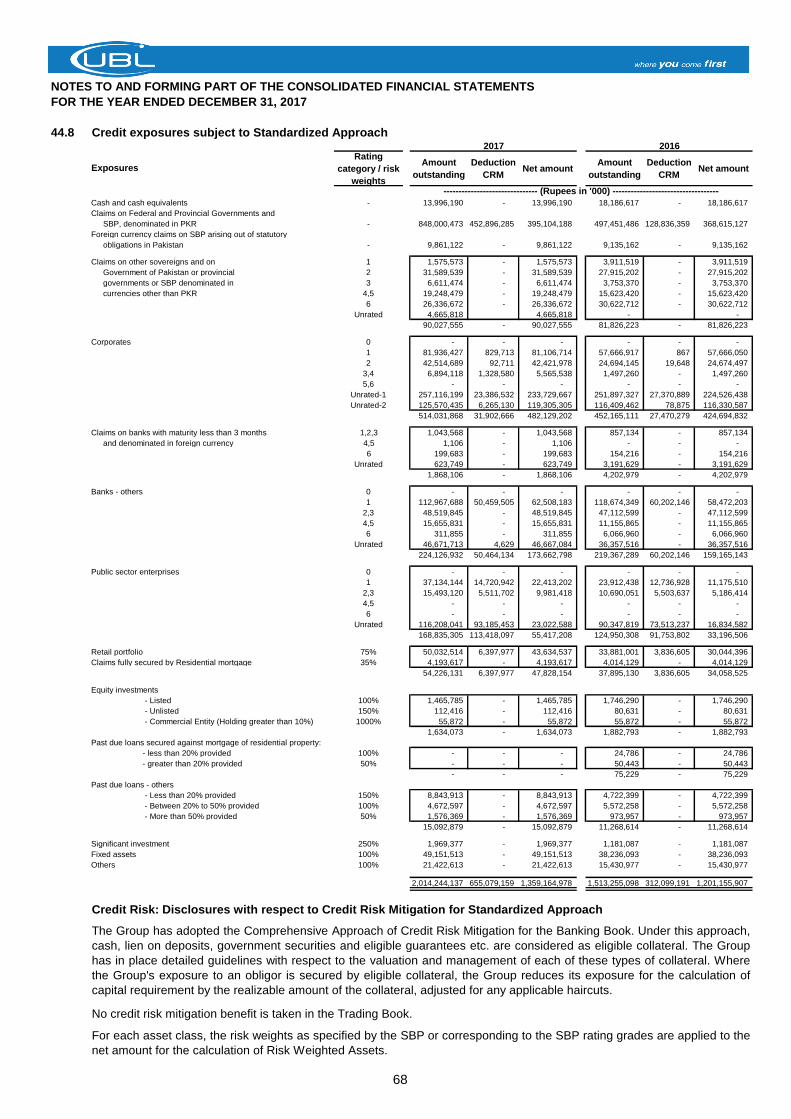
NOTES TO AND FORMING PART OF THE CONSOLIDATED FINANCIAL STATEMENTS
FOR THE YEAR ENDED DECEMBER 31, 2017
44.8 Credit exposures subject to Standardized Approach
Rating
category / risk
weights
Amount
outstanding
Deduction
CRMNet amount
Amount
outstanding
Deduction
CRMNet amount
Cash and cash equivalents - 13,996,190 - 13,996,190 18,186,617 - 18,186,617
Claims on Federal and Provincial Governments and
SBP, denominated in PKR - 848,000,473 452,896,285 395,104,188 497,451,486 128,836,359 368,615,127
Foreign currency claims on SBP arising out of statutory
obligations in Pakistan - 9,861,122 - 9,861,122 9,135,162 - 9,135,162
Claims on other sovereigns and on 1 1,575,573 - 1,575,573 3,911,519 - 3,911,519
Government of Pakistan or provincial 2 31,589,539 - 31,589,539 27,915,202 - 27,915,202
governments or SBP denominated in 3 6,611,474 - 6,611,474 3,753,370 - 3,753,370
currencies other than PKR 4,5 19,248,479 - 19,248,479 15,623,420 - 15,623,420
6 26,336,672 - 26,336,672 30,622,712 - 30,622,712
Unrated 4,665,818 4,665,818 - -
90,027,555 - 90,027,555 81,826,223 - 81,826,223
Corporates 0 - - - - - -
1 81,936,427 829,713 81,106,714 57,666,917 867 57,666,050
2 42,514,689 92,711 42,421,978 24,694,145 19,648 24,674,497
3,4 6,894,118 1,328,580 5,565,538 1,497,260 - 1,497,260
5,6 - - - - - -
Unrated-1 257,116,199 23,386,532 233,729,667 251,897,327 27,370,889 224,526,438
Unrated-2 125,570,435 6,265,130 119,305,305 116,409,462 78,875 116,330,587
514,031,868 31,902,666 482,129,202 452,165,111 27,470,279 424,694,832
Claims on banks with maturity less than 3 months 1,2,3 1,043,568 - 1,043,568 857,134 - 857,134
and denominated in foreign currency 4,5 1,106 - 1,106 - - -
6 199,683 - 199,683 154,216 - 154,216
Unrated 623,749 - 623,749 3,191,629 - 3,191,629
1,868,106 - 1,868,106 4,202,979 - 4,202,979
Banks - others 0 - - - - - -
1 112,967,688 50,459,505 62,508,183 118,674,349 60,202,146 58,472,203
2,3 48,519,845 - 48,519,845 47,112,599 - 47,112,599
4,5 15,655,831 - 15,655,831 11,155,865 - 11,155,865
6 311,855 - 311,855 6,066,960 - 6,066,960
Unrated 46,671,713 4,629 46,667,084 36,357,516 - 36,357,516
224,126,932 50,464,134 173,662,798 219,367,289 60,202,146 159,165,143
Public sector enterprises 0 - - - - - -
1 37,134,144 14,720,942 22,413,202 23,912,438 12,736,928 11,175,510
2,3 15,493,120 5,511,702 9,981,418 10,690,051 5,503,637 5,186,414
4,5 - - - - - -
6 - - - - - -
Unrated 116,208,041 93,185,453 23,022,588 90,347,819 73,513,237 16,834,582
168,835,305 113,418,097 55,417,208 124,950,308 91,753,802 33,196,506
Retail portfolio 75% 50,032,514 6,397,977 43,634,537 33,881,001 3,836,605 30,044,396
Claims fully secured by Residential mortgage 35% 4,193,617 - 4,193,617 4,014,129 - 4,014,129
54,226,131 6,397,977 47,828,154 37,895,130 3,836,605 34,058,525
Equity investments
- Listed 100% 1,465,785 - 1,465,785 1,746,290 - 1,746,290
- Unlisted 150% 112,416 - 112,416 80,631 - 80,631
- Commercial Entity (Holding greater than 10%) 1000% 55,872 - 55,872 55,872 - 55,872
1,634,073 - 1,634,073 1,882,793 - 1,882,793
Past due loans secured against mortgage of residential property:
- less than 20% provided 100% - - - 24,786 - 24,786
- greater than 20% provided 50% - - - 50,443 - 50,443
- - - 75,229 - 75,229
Past due loans - others
- Less than 20% provided 150% 8,843,913 - 8,843,913 4,722,399 - 4,722,399
- Between 20% to 50% provided 100% 4,672,597 - 4,672,597 5,572,258 - 5,572,258
- More than 50% provided 50% 1,576,369 - 1,576,369 973,957 - 973,957
15,092,879 - 15,092,879 11,268,614 - 11,268,614
Significant investment 250% 1,969,377 - 1,969,377 1,181,087 - 1,181,087
Fixed assets 100% 49,151,513 - 49,151,513 38,236,093 - 38,236,093
Others 100% 21,422,613 - 21,422,613 15,430,977 - 15,430,977
2,014,244,137 655,079,159 1,359,164,978 1,513,255,098 312,099,191 1,201,155,907
Credit Risk: Disclosures with respect to Credit Risk Mitigation for Standardized Approach
No credit risk mitigation benefit is taken in the Trading Book.
The Group has adopted the Comprehensive Approach of Credit Risk Mitigation for the Banking Book. Under this approach,
cash, lien on deposits, government securities and eligible guarantees etc. are considered as eligible collateral. The Group
has in place detailed guidelines with respect to the valuation and management of each of these types of collateral. Where
the Group's exposure to an obligor is secured by eligible collateral, the Group reduces its exposure for the calculation of
capital requirement by the realizable amount of the collateral, adjusted for any applicable haircuts.
For each asset class, the risk weights as specified by the SBP or corresponding to the SBP rating grades are applied to the
net amount for the calculation of Risk Weighted Assets.
2017 2016
Exposures
------------------------------- (Rupees in '000) -----------------------------------
68
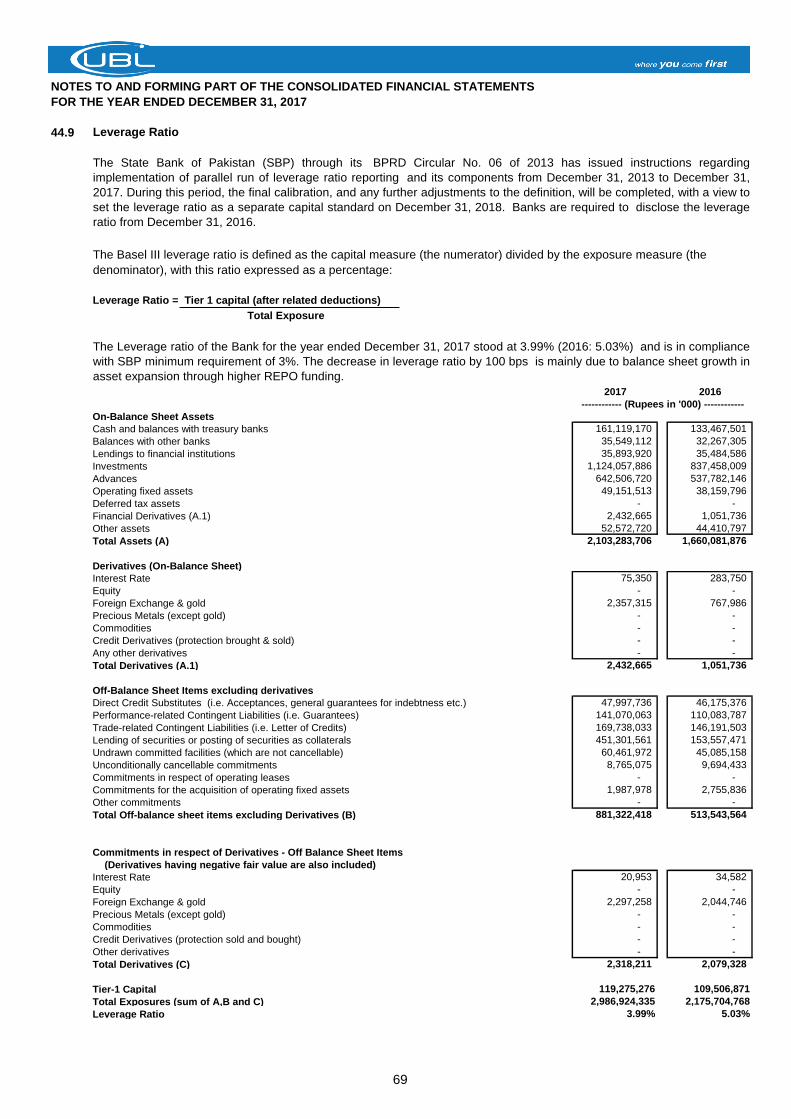
NOTES TO AND FORMING PART OF THE CONSOLIDATED FINANCIAL STATEMENTS
FOR THE YEAR ENDED DECEMBER 31, 2017
44.9 Leverage Ratio
The Basel III leverage ratio is defined as the capital measure (the numerator) divided by the exposure measure (the
denominator), with this ratio expressed as a percentage:
Leverage Ratio = Tier 1 capital (after related deductions)
Total Exposure
2017 2016
On-Balance Sheet Assets
Cash and balances with treasury banks 161,119,170 133,467,501
Balances with other banks 35,549,112 32,267,305
Lendings to financial institutions 35,893,920 35,484,586
Investments 1,124,057,886 837,458,009
Advances 642,506,720 537,782,146
Operating fixed assets 49,151,513 38,159,796
Deferred tax assets - -
Financial Derivatives (A.1) 2,432,665 1,051,736
Other assets 52,572,720 44,410,797
Total Assets (A) 2,103,283,706 1,660,081,876
Derivatives (On-Balance Sheet)
Interest Rate 75,350 283,750
Equity - -
Foreign Exchange & gold 2,357,315 767,986
Precious Metals (except gold) - -
Commodities - -
Credit Derivatives (protection brought & sold) - -
Any other derivatives - -
Total Derivatives (A.1) 2,432,665 1,051,736
Off-Balance Sheet Items excluding derivatives
Direct Credit Substitutes (i.e. Acceptances, general guarantees for indebtness etc.) 47,997,736 46,175,376
Performance-related Contingent Liabilities (i.e. Guarantees) 141,070,063 110,083,787
Trade-related Contingent Liabilities (i.e. Letter of Credits) 169,738,033 146,191,503
Lending of securities or posting of securities as collaterals 451,301,561 153,557,471
Undrawn committed facilities (which are not cancellable) 60,461,972 45,085,158
Unconditionally cancellable commitments 8,765,075 9,694,433
Commitments in respect of operating leases - -
Commitments for the acquisition of operating fixed assets 1,987,978 2,755,836
Other commitments - -
Total Off-balance sheet items excluding Derivatives (B) 881,322,418 513,543,564
Commitments in respect of Derivatives - Off Balance Sheet Items
(Derivatives having negative fair value are also included)
Interest Rate 20,953 34,582
Equity - -
Foreign Exchange & gold 2,297,258 2,044,746
Precious Metals (except gold) - -
Commodities - -
Credit Derivatives (protection sold and bought) - -
Other derivatives - -
Total Derivatives (C) 2,318,211 2,079,328
Tier-1 Capital 119,275,276 109,506,871
Total Exposures (sum of A,B and C) 2,986,924,335 2,175,704,768
Leverage Ratio 3.99% 5.03%
------------ (Rupees in '000) ------------
The State Bank of Pakistan (SBP) through its BPRD Circular No. 06 of 2013 has issued instructions regarding
implementation of parallel run of leverage ratio reporting and its components from December 31, 2013 to December 31,
2017. During this period, the final calibration, and any further adjustments to the definition, will be completed, with a view to
set the leverage ratio as a separate capital standard on December 31, 2018. Banks are required to disclose the leverage
ratio from December 31, 2016.
The Leverage ratio of the Bank for the year ended December 31, 2017 stood at 3.99% (2016: 5.03%) and is in compliance
with SBP minimum requirement of 3%. The decrease in leverage ratio by 100 bps is mainly due to balance sheet growth in
asset expansion through higher REPO funding.
69
NOTES TO AND FORMING PART OF THE CONSOLIDATED FINANCIAL STATEMENTS
FOR THE YEAR ENDED DECEMBER 31, 2017
45. RISK MANAGEMENT
- Determining guidelines relating to the Bank’s risk appetite.
-
-
- Developing systems and resources to review the key risk exposures of the Bank.
- Approving credits and granting approval authority to qualified and experienced individuals.
- Reviewing the adequacy of credit training across the Bank.
- Organizing portfolio reviews focusing on quality assessment, risk profiles, industry concentrations etc.
- Setting systems to identify significant portfolio indicators, problem credits and level of provisioning required.
- Establish an extensive Information Security (IS) Program and governance structure to manage the Security of the
Information assets.
45.1 Credit risk
Individual credit authorities are delegated to credit officers by the Group Executive - Risk & Credit Policy (authorized by
BoD), according to their seasoning / maturity. Approvals for Consumer loans are centralized, while approval authorities
for International, Corporate, Commercial, SME and Agri exposures are delegated at a Country / Regional level. Further
more, credit authorities are also delegated to business teams in various regions for Commercial, SME & Agri lending. All
credit policy functions domestic & international are centrally organized.
Concentrations of credit risk exist if clients are engaged in similar activities, or are located in the same geographical
region, or have comparable economic characteristics such that their ability to meet contractual obligations would be
similarly affected by changes in economic, political or other conditions. The Bank manages, limits and controls
concentrations of credit risk to individual counterparties and groups, and to industries, where appropriate. Limits are also
applied to portfolios or sectors where the Bank considers it appropriate to restrict credit risk concentrations, or to areas
of higher risk, or to control the rate of portfolio growth.
The credit risk management process is driven by the Bank's Risk Management Policy, Credit Policy for Corporate,
Commercial, SME & Agri and Credit Manual, which provides policies and procedures in relation to credit initiation,
approval, documentation and disbursement, credit maintenance and remedial management.
This section presents information about the Group’s exposure to and its management and control of risks, in particular,
the primary risks associated with its use of financial instruments such as credit, market, liquidity and operational risks.
Credit risk is the risk that a customer or counterparty may not settle an obligation for full value, either when due or at any
time thereafter. This risk arises from the potential that a customer's or counterparty’s willingness or ability to meet such
an obligation is impaired, resulting in an economic loss to the Group.
The Bank has an integrated risk management structure in place. The Board Risk and Compliance Committee (BRCC)
oversees the entire risk management process of the Bank. Furthermore, Risk Management Committee has been formed
which looks at all risks collectively at senior management level. The committee is chaired by the President and comprises
of Heads of all Risk areas, Finance, Business etc. The Risk and Credit Policy Group is responsible for the development
and implementation of all risk policies as approved by the BRCC / BoD. The group is organized into the functions of
Market & Treasury Risk, Financial Institution Risk, Credit Policy, Research & Operational Risk, Consumer Credit Policy,
Credit Risk Management, Basel II, IT security and International Risk. Each risk function is headed by a senior manager
who reports directly to the Group Executive, Risk and Credit Policy. The role of the Risk and Credit Policy Group
includes:
Reviewing policies / manuals and ensuring that these are in accordance with BRCC / BoD approved risk
management policies.
Recommending risk management policies in accordance with the Prudential Regulations, Basel II / III framework and
international best practices.
70
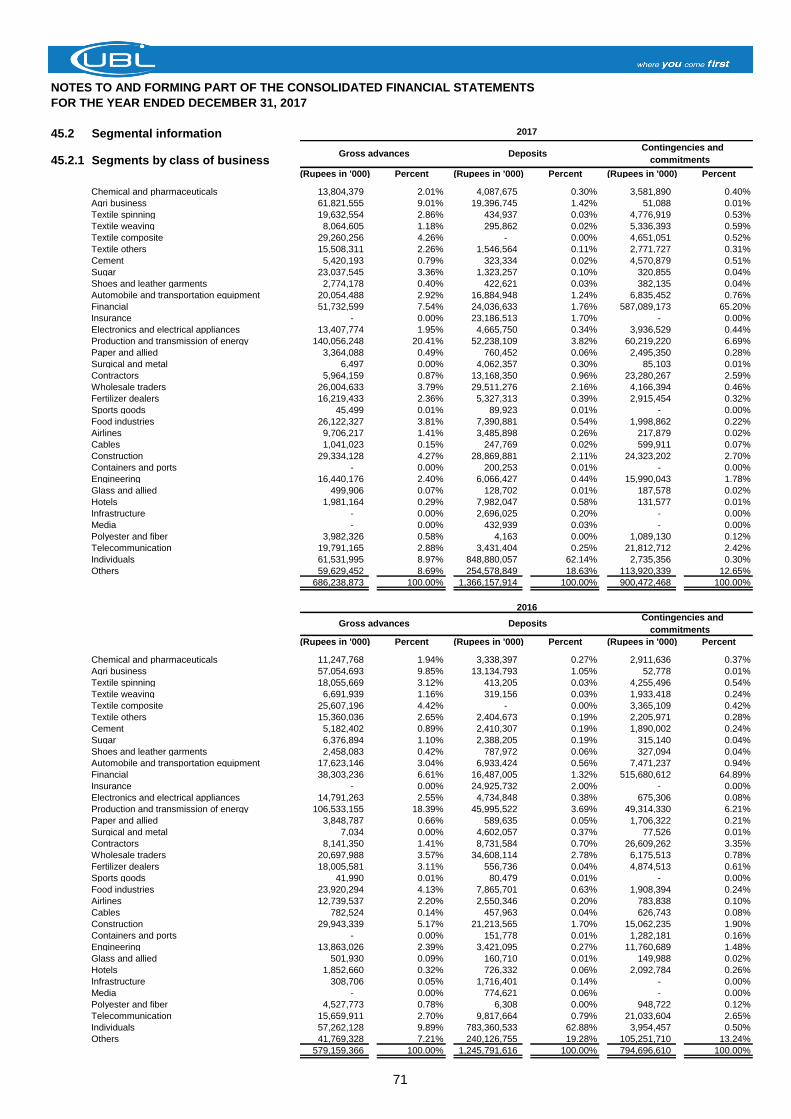
NOTES TO AND FORMING PART OF THE CONSOLIDATED FINANCIAL STATEMENTS
FOR THE YEAR ENDED DECEMBER 31, 2017
45.2 Segmental information
45.2.1 Segments by class of business(Rupees in '000) Percent (Rupees in '000) Percent (Rupees in '000) Percent
Chemical and pharmaceuticals 13,804,379 2.01% 4,087,675 0.30% 3,581,890 0.40%
Agri business 61,821,555 9.01% 19,396,745 1.42% 51,088 0.01%
Textile spinning 19,632,554 2.86% 434,937 0.03% 4,776,919 0.53%
Textile weaving 8,064,605 1.18% 295,862 0.02% 5,336,393 0.59%
Textile composite 29,260,256 4.26% - 0.00% 4,651,051 0.52%
Textile others 15,508,311 2.26% 1,546,564 0.11% 2,771,727 0.31%
Cement 5,420,193 0.79% 323,334 0.02% 4,570,879 0.51%
Sugar 23,037,545 3.36% 1,323,257 0.10% 320,855 0.04%
Shoes and leather garments 2,774,178 0.40% 422,621 0.03% 382,135 0.04%
Automobile and transportation equipment 20,054,488 2.92% 16,884,948 1.24% 6,835,452 0.76%
Financial 51,732,599 7.54% 24,036,633 1.76% 587,089,173 65.20%
Insurance - 0.00% 23,186,513 1.70% - 0.00%
Electronics and electrical appliances 13,407,774 1.95% 4,665,750 0.34% 3,936,529 0.44%
Production and transmission of energy 140,056,248 20.41% 52,238,109 3.82% 60,219,220 6.69%
Paper and allied 3,364,088 0.49% 760,452 0.06% 2,495,350 0.28%
Surgical and metal 6,497 0.00% 4,062,357 0.30% 85,103 0.01%
Contractors 5,964,159 0.87% 13,168,350 0.96% 23,280,267 2.59%
Wholesale traders 26,004,633 3.79% 29,511,276 2.16% 4,166,394 0.46%
Fertilizer dealers 16,219,433 2.36% 5,327,313 0.39% 2,915,454 0.32%
Sports goods 45,499 0.01% 89,923 0.01% - 0.00%
Food industries 26,122,327 3.81% 7,390,881 0.54% 1,998,862 0.22%
Airlines 9,706,217 1.41% 3,485,898 0.26% 217,879 0.02%
Cables 1,041,023 0.15% 247,769 0.02% 599,911 0.07%
Construction 29,334,128 4.27% 28,869,881 2.11% 24,323,202 2.70%
Containers and ports - 0.00% 200,253 0.01% - 0.00%
Engineering 16,440,176 2.40% 6,066,427 0.44% 15,990,043 1.78%
Glass and allied 499,906 0.07% 128,702 0.01% 187,578 0.02%
Hotels 1,981,164 0.29% 7,982,047 0.58% 131,577 0.01%
Infrastructure - 0.00% 2,696,025 0.20% - 0.00%
Media - 0.00% 432,939 0.03% - 0.00%
Polyester and fiber 3,982,326 0.58% 4,163 0.00% 1,089,130 0.12%
Telecommunication 19,791,165 2.88% 3,431,404 0.25% 21,812,712 2.42%
Individuals 61,531,995 8.97% 848,880,057 62.14% 2,735,356 0.30%
Others 59,629,452 8.69% 254,578,849 18.63% 113,920,339 12.65%
686,238,873 100.00% 1,366,157,914 100.00% 900,472,468 100.00%
(Rupees in '000) Percent (Rupees in '000) Percent (Rupees in '000) Percent
Chemical and pharmaceuticals 11,247,768 1.94% 3,338,397 0.27% 2,911,636 0.37%
Agri business 57,054,693 9.85% 13,134,793 1.05% 52,778 0.01%
Textile spinning 18,055,669 3.12% 413,205 0.03% 4,255,496 0.54%
Textile weaving 6,691,939 1.16% 319,156 0.03% 1,933,418 0.24%
Textile composite 25,607,196 4.42% - 0.00% 3,365,109 0.42%
Textile others 15,360,036 2.65% 2,404,673 0.19% 2,205,971 0.28%
Cement 5,182,402 0.89% 2,410,307 0.19% 1,890,002 0.24%
Sugar 6,376,894 1.10% 2,388,205 0.19% 315,140 0.04%
Shoes and leather garments 2,458,083 0.42% 787,972 0.06% 327,094 0.04%
Automobile and transportation equipment 17,623,146 3.04% 6,933,424 0.56% 7,471,237 0.94%
Financial 38,303,236 6.61% 16,487,005 1.32% 515,680,612 64.89%
Insurance - 0.00% 24,925,732 2.00% - 0.00%
Electronics and electrical appliances 14,791,263 2.55% 4,734,848 0.38% 675,306 0.08%
Production and transmission of energy 106,533,155 18.39% 45,995,522 3.69% 49,314,330 6.21%
Paper and allied 3,848,787 0.66% 589,635 0.05% 1,706,322 0.21%
Surgical and metal 7,034 0.00% 4,602,057 0.37% 77,526 0.01%
Contractors 8,141,350 1.41% 8,731,584 0.70% 26,609,262 3.35%
Wholesale traders 20,697,988 3.57% 34,608,114 2.78% 6,175,513 0.78%
Fertilizer dealers 18,005,581 3.11% 556,736 0.04% 4,874,513 0.61%
Sports goods 41,990 0.01% 80,479 0.01% - 0.00%
Food industries 23,920,294 4.13% 7,865,701 0.63% 1,908,394 0.24%
Airlines 12,739,537 2.20% 2,550,346 0.20% 783,838 0.10%
Cables 782,524 0.14% 457,963 0.04% 626,743 0.08%
Construction 29,943,339 5.17% 21,213,565 1.70% 15,062,235 1.90%
Containers and ports - 0.00% 151,778 0.01% 1,282,181 0.16%
Engineering 13,863,026 2.39% 3,421,095 0.27% 11,760,689 1.48%
Glass and allied 501,930 0.09% 160,710 0.01% 149,988 0.02%
Hotels 1,852,660 0.32% 726,332 0.06% 2,092,784 0.26%
Infrastructure 308,706 0.05% 1,716,401 0.14% - 0.00%
Media - 0.00% 774,621 0.06% - 0.00%
Polyester and fiber 4,527,773 0.78% 6,308 0.00% 948,722 0.12%
Telecommunication 15,659,911 2.70% 9,817,664 0.79% 21,033,604 2.65%
Individuals 57,262,128 9.89% 783,360,533 62.88% 3,954,457 0.50%
Others 41,769,328 7.21% 240,126,755 19.28% 105,251,710 13.24%
579,159,366 100.00% 1,245,791,616 100.00% 794,696,610 100.00%
2016
Deposits Gross advances Contingencies and
commitments
2017
Contingencies and
commitments Gross advances Deposits
71
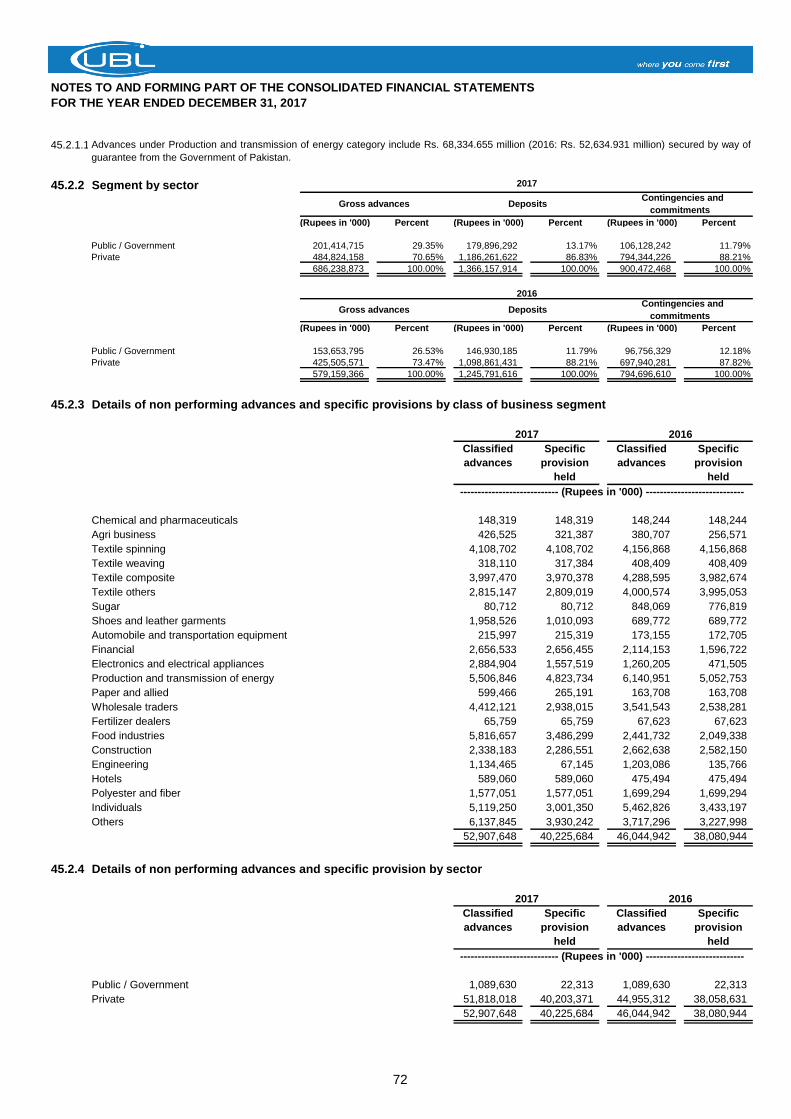
NOTES TO AND FORMING PART OF THE CONSOLIDATED FINANCIAL STATEMENTS
FOR THE YEAR ENDED DECEMBER 31, 2017
45.2.1.1
45.2.2 Segment by sector
(Rupees in '000) Percent (Rupees in '000) Percent (Rupees in '000) Percent
Public / Government 201,414,715 29.35% 179,896,292 13.17% 106,128,242 11.79%
Private 484,824,158 70.65% 1,186,261,622 86.83% 794,344,226 88.21%
686,238,873 100.00% 1,366,157,914 100.00% 900,472,468 100.00%
(Rupees in '000) Percent (Rupees in '000) Percent (Rupees in '000) Percent
Public / Government 153,653,795 26.53% 146,930,185 11.79% 96,756,329 12.18%
Private 425,505,571 73.47% 1,098,861,431 88.21% 697,940,281 87.82%
579,159,366 100.00% 1,245,791,616 100.00% 794,696,610 100.00%
45.2.3 Details of non performing advances and specific provisions by class of business segment
Classified
advances
Specific
provision
held
Classified
advances
Specific
provision
held
Chemical and pharmaceuticals 148,319 148,319 148,244 148,244
Agri business 426,525 321,387 380,707 256,571
Textile spinning 4,108,702 4,108,702 4,156,868 4,156,868
Textile weaving 318,110 317,384 408,409 408,409
Textile composite 3,997,470 3,970,378 4,288,595 3,982,674
Textile others 2,815,147 2,809,019 4,000,574 3,995,053
Sugar 80,712 80,712 848,069 776,819
Shoes and leather garments 1,958,526 1,010,093 689,772 689,772
Automobile and transportation equipment 215,997 215,319 173,155 172,705
Financial 2,656,533 2,656,455 2,114,153 1,596,722
Electronics and electrical appliances 2,884,904 1,557,519 1,260,205 471,505
Production and transmission of energy 5,506,846 4,823,734 6,140,951 5,052,753
Paper and allied 599,466 265,191 163,708 163,708
Wholesale traders 4,412,121 2,938,015 3,541,543 2,538,281
Fertilizer dealers 65,759 65,759 67,623 67,623
Food industries 5,816,657 3,486,299 2,441,732 2,049,338
Construction 2,338,183 2,286,551 2,662,638 2,582,150
Engineering 1,134,465 67,145 1,203,086 135,766
Hotels 589,060 589,060 475,494 475,494
Polyester and fiber 1,577,051 1,577,051 1,699,294 1,699,294
Individuals 5,119,250 3,001,350 5,462,826 3,433,197
Others 6,137,845 3,930,242 3,717,296 3,227,998
52,907,648 40,225,684 46,044,942 38,080,944
45.2.4 Details of non performing advances and specific provision by sector
Classified
advances
Specific
provision
held
Classified
advances
Specific
provision
held
Public / Government 1,089,630 22,313 1,089,630 22,313
Private 51,818,018 40,203,371 44,955,312 38,058,631
52,907,648 40,225,684 46,044,942 38,080,944
Advances under Production and transmission of energy category include Rs. 68,334.655 million (2016: Rs. 52,634.931 million) secured by way of
guarantee from the Government of Pakistan.
Gross advances Deposits Contingencies and
commitments
2016
Contingencies and
commitments
2017
Gross advances Deposits
---------------------------- (Rupees in '000) ----------------------------
---------------------------- (Rupees in '000) ----------------------------
2017 2016
2017 2016
72
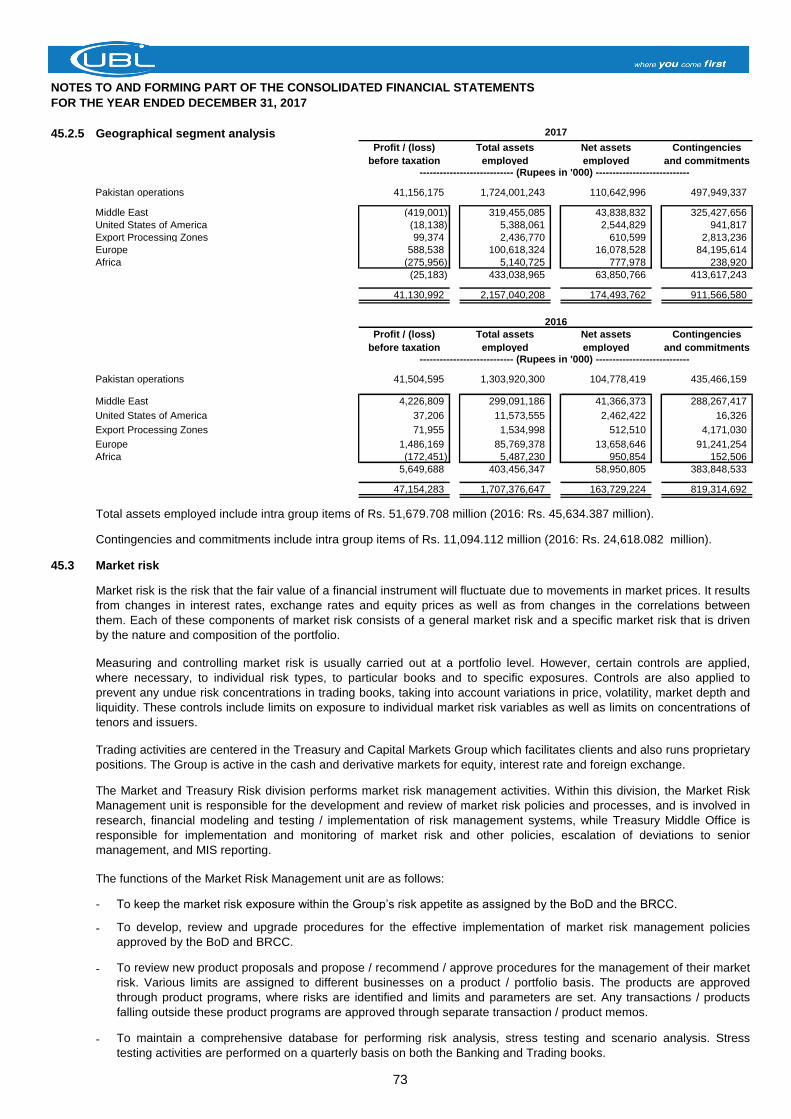
NOTES TO AND FORMING PART OF THE CONSOLIDATED FINANCIAL STATEMENTS
FOR THE YEAR ENDED DECEMBER 31, 2017
45.2.5 Geographical segment analysis
Pakistan operations 41,156,175 1,724,001,243 110,642,996 497,949,337
Middle East (419,001) 319,455,085 43,838,832 325,427,656
United States of America (18,138) 5,388,061 2,544,829 941,817
Export Processing Zones 99,374 2,436,770 610,599 2,813,236
Europe 588,538 100,618,324 16,078,528 84,195,614
Africa (275,956) 5,140,725 777,978 238,920
(25,183) 433,038,965 63,850,766 413,617,243
41,130,992 2,157,040,208 174,493,762 911,566,580
Pakistan operations 41,504,595 1,303,920,300 104,778,419 435,466,159
Middle East 4,226,809 299,091,186 41,366,373 288,267,417
United States of America 37,206 11,573,555 2,462,422 16,326
Export Processing Zones 71,955 1,534,998 512,510 4,171,030
Europe 1,486,169 85,769,378 13,658,646 91,241,254
Africa (172,451) 5,487,230 950,854 152,506
5,649,688 403,456,347 58,950,805 383,848,533
47,154,283 1,707,376,647 163,729,224 819,314,692
Total assets employed include intra group items of Rs. 51,679.708 million (2016: Rs. 45,634.387 million).
Contingencies and commitments include intra group items of Rs. 11,094.112 million (2016: Rs. 24,618.082 million).
45.3 Market risk
The functions of the Market Risk Management unit are as follows:
- To keep the market risk exposure within the Group’s risk appetite as assigned by the BoD and the BRCC.
-
-
-
2017
2016
Contingencies
and commitments
Market risk is the risk that the fair value of a financial instrument will fluctuate due to movements in market prices. It results
from changes in interest rates, exchange rates and equity prices as well as from changes in the correlations between
them. Each of these components of market risk consists of a general market risk and a specific market risk that is driven
by the nature and composition of the portfolio.
Measuring and controlling market risk is usually carried out at a portfolio level. However, certain controls are applied,
where necessary, to individual risk types, to particular books and to specific exposures. Controls are also applied to
prevent any undue risk concentrations in trading books, taking into account variations in price, volatility, market depth and
liquidity. These controls include limits on exposure to individual market risk variables as well as limits on concentrations of
tenors and issuers.
Contingencies
and commitments
Profit / (loss)
before taxation
Total assets
employed
Net assets
employed---------------------------- (Rupees in '000) ----------------------------
To review new product proposals and propose / recommend / approve procedures for the management of their market
risk. Various limits are assigned to different businesses on a product / portfolio basis. The products are approved
through product programs, where risks are identified and limits and parameters are set. Any transactions / products
falling outside these product programs are approved through separate transaction / product memos.
To maintain a comprehensive database for performing risk analysis, stress testing and scenario analysis. Stress
testing activities are performed on a quarterly basis on both the Banking and Trading books.
To develop, review and upgrade procedures for the effective implementation of market risk management policies
approved by the BoD and BRCC.
Trading activities are centered in the Treasury and Capital Markets Group which facilitates clients and also runs proprietary
positions. The Group is active in the cash and derivative markets for equity, interest rate and foreign exchange.
The Market and Treasury Risk division performs market risk management activities. Within this division, the Market Risk
Management unit is responsible for the development and review of market risk policies and processes, and is involved in
research, financial modeling and testing / implementation of risk management systems, while Treasury Middle Office is
responsible for implementation and monitoring of market risk and other policies, escalation of deviations to senior
management, and MIS reporting.
Profit / (loss)
before taxation
Total assets
employed
Net assets
employed---------------------------- (Rupees in '000) ----------------------------
73
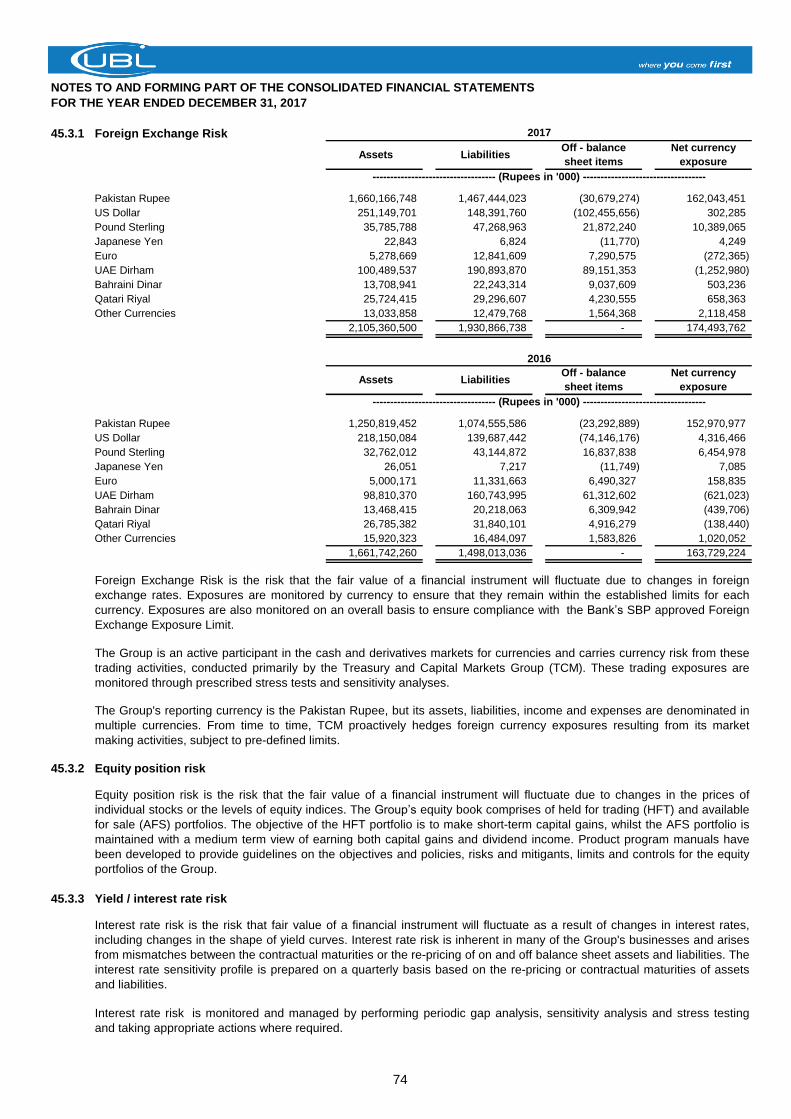
NOTES TO AND FORMING PART OF THE CONSOLIDATED FINANCIAL STATEMENTS
FOR THE YEAR ENDED DECEMBER 31, 2017
45.3.1 Foreign Exchange Risk
Pakistan Rupee 1,660,166,748 1,467,444,023 (30,679,274) 162,043,451
US Dollar 251,149,701 148,391,760 (102,455,656) 302,285
Pound Sterling 35,785,788 47,268,963 21,872,240 10,389,065
Japanese Yen 22,843 6,824 (11,770) 4,249
Euro 5,278,669 12,841,609 7,290,575 (272,365)
UAE Dirham 100,489,537 190,893,870 89,151,353 (1,252,980)
Bahraini Dinar 13,708,941 22,243,314 9,037,609 503,236
Qatari Riyal 25,724,415 29,296,607 4,230,555 658,363
Other Currencies 13,033,858 12,479,768 1,564,368 2,118,458
2,105,360,500 1,930,866,738 - 174,493,762
Pakistan Rupee 1,250,819,452 1,074,555,586 (23,292,889) 152,970,977
US Dollar 218,150,084 139,687,442 (74,146,176) 4,316,466
Pound Sterling 32,762,012 43,144,872 16,837,838 6,454,978
Japanese Yen 26,051 7,217 (11,749) 7,085
Euro 5,000,171 11,331,663 6,490,327 158,835
UAE Dirham 98,810,370 160,743,995 61,312,602 (621,023)
Bahrain Dinar 13,468,415 20,218,063 6,309,942 (439,706)
Qatari Riyal 26,785,382 31,840,101 4,916,279 (138,440)
Other Currencies 15,920,323 16,484,097 1,583,826 1,020,052
1,661,742,260 1,498,013,036 - 163,729,224
45.3.2 Equity position risk
45.3.3 Yield / interest rate risk
Liabilities
Off - balance
sheet items
Net currency
exposure
2017
Off - balance
sheet items
Net currency
exposure
Assets Liabilities
The Group's reporting currency is the Pakistan Rupee, but its assets, liabilities, income and expenses are denominated in
multiple currencies. From time to time, TCM proactively hedges foreign currency exposures resulting from its market
making activities, subject to pre-defined limits.
The Group is an active participant in the cash and derivatives markets for currencies and carries currency risk from these
trading activities, conducted primarily by the Treasury and Capital Markets Group (TCM). These trading exposures are
monitored through prescribed stress tests and sensitivity analyses.
Interest rate risk is the risk that fair value of a financial instrument will fluctuate as a result of changes in interest rates,
including changes in the shape of yield curves. Interest rate risk is inherent in many of the Group's businesses and arises
from mismatches between the contractual maturities or the re-pricing of on and off balance sheet assets and liabilities. The
interest rate sensitivity profile is prepared on a quarterly basis based on the re-pricing or contractual maturities of assets
and liabilities.
Interest rate risk is monitored and managed by performing periodic gap analysis, sensitivity analysis and stress testing
and taking appropriate actions where required.
Equity position risk is the risk that the fair value of a financial instrument will fluctuate due to changes in the prices of
individual stocks or the levels of equity indices. The Group’s equity book comprises of held for trading (HFT) and available
for sale (AFS) portfolios. The objective of the HFT portfolio is to make short-term capital gains, whilst the AFS portfolio is
maintained with a medium term view of earning both capital gains and dividend income. Product program manuals have
been developed to provide guidelines on the objectives and policies, risks and mitigants, limits and controls for the equity
portfolios of the Group.
----------------------------------- (Rupees in '000) -----------------------------------
Foreign Exchange Risk is the risk that the fair value of a financial instrument will fluctuate due to changes in foreign
exchange rates. Exposures are monitored by currency to ensure that they remain within the established limits for each
currency. Exposures are also monitored on an overall basis to ensure compliance with the Bank’s SBP approved Foreign
Exchange Exposure Limit.
----------------------------------- (Rupees in '000) -----------------------------------
2016
Assets
74
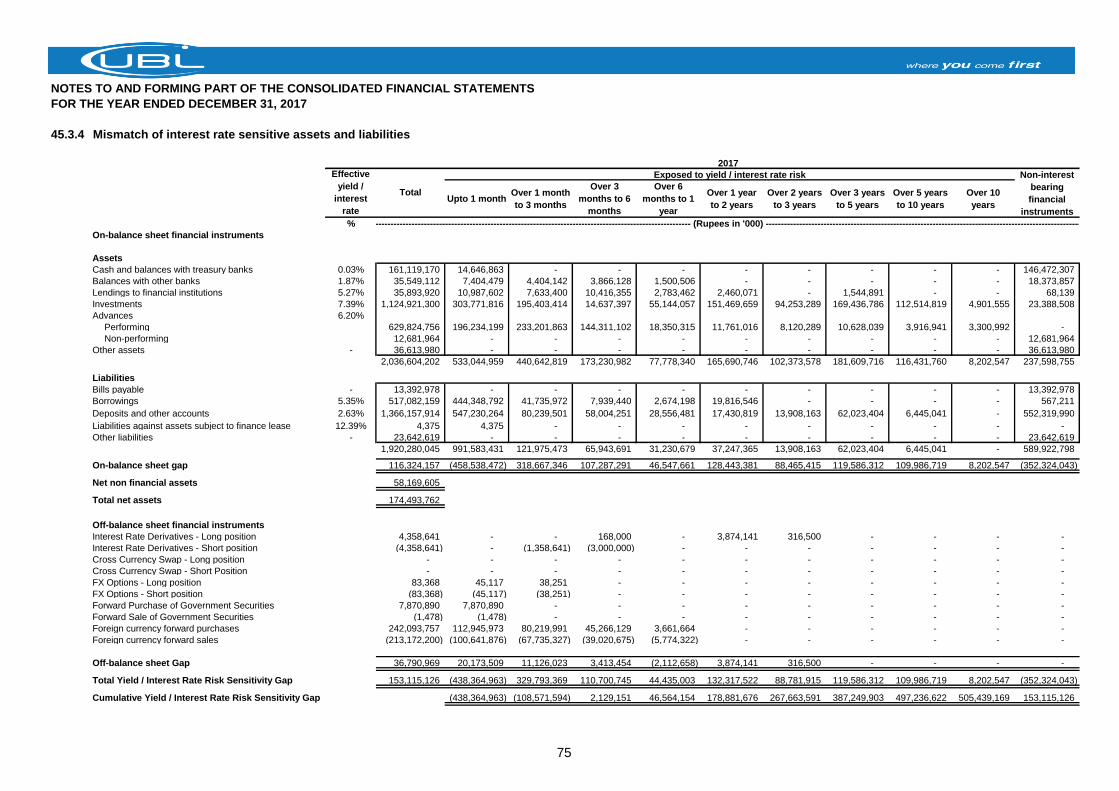
NOTES TO AND FORMING PART OF THE CONSOLIDATED FINANCIAL STATEMENTS
FOR THE YEAR ENDED DECEMBER 31, 2017
45.3.4
Upto 1 monthOver 1 month
to 3 months
Over 3
months to 6
months
Over 6
months to 1
year
Over 1 year
to 2 years
Over 2 years
to 3 years
Over 3 years
to 5 years
Over 5 years
to 10 years
Over 10
years
%
On-balance sheet financial instruments
Assets
Cash and balances with treasury banks 0.03% 161,119,170 14,646,863 - - - - - - - - 146,472,307
Balances with other banks 1.87% 35,549,112 7,404,479 4,404,142 3,866,128 1,500,506 - - - - - 18,373,857
Lendings to financial institutions 5.27% 35,893,920 10,987,602 7,633,400 10,416,355 2,783,462 2,460,071 - 1,544,891 - - 68,139
Investments 7.39% 1,124,921,300 303,771,816 195,403,414 14,637,397 55,144,057 151,469,659 94,253,289 169,436,786 112,514,819 4,901,555 23,388,508
Advances 6.20%
Performing 629,824,756 196,234,199 233,201,863 144,311,102 18,350,315 11,761,016 8,120,289 10,628,039 3,916,941 3,300,992 -
Non-performing 12,681,964 - - - - - - - - - 12,681,964
Other assets - 36,613,980 - - - - - - - - - 36,613,980
2,036,604,202 533,044,959 440,642,819 173,230,982 77,778,340 165,690,746 102,373,578 181,609,716 116,431,760 8,202,547 237,598,755
Liabilities
Bills payable - 13,392,978 - - - - - - - - - 13,392,978
Borrowings 5.35% 517,082,159 444,348,792 41,735,972 7,939,440 2,674,198 19,816,546 - - - - 567,211
Deposits and other accounts 2.63% 1,366,157,914 547,230,264 80,239,501 58,004,251 28,556,481 17,430,819 13,908,163 62,023,404 6,445,041 - 552,319,990
Liabilities against assets subject to finance lease 12.39% 4,375 4,375 - - - - - - - - -
Other liabilities - 23,642,619 - - - - - - - - - 23,642,619
1,920,280,045 991,583,431 121,975,473 65,943,691 31,230,679 37,247,365 13,908,163 62,023,404 6,445,041 - 589,922,798
On-balance sheet gap 116,324,157 (458,538,472) 318,667,346 107,287,291 46,547,661 128,443,381 88,465,415 119,586,312 109,986,719 8,202,547 (352,324,043)
Net non financial assets 58,169,605
Total net assets 174,493,762
Off-balance sheet financial instruments
Interest Rate Derivatives - Long position 4,358,641 - - 168,000 - 3,874,141 316,500 - - - -
Interest Rate Derivatives - Short position (4,358,641) - (1,358,641) (3,000,000) - - - - - - -
Cross Currency Swap - Long position - - - - - - - - - - -
Cross Currency Swap - Short Position - - - - - - - - - - -
FX Options - Long position 83,368 45,117 38,251 - - - - - - - -
FX Options - Short position (83,368) (45,117) (38,251) - - - - - - - -
Forward Purchase of Government Securities 7,870,890 7,870,890 - - - - - - - - -
Forward Sale of Government Securities (1,478) (1,478) - - - - - - - - -
Foreign currency forward purchases 242,093,757 112,945,973 80,219,991 45,266,129 3,661,664 - - - - - -
Foreign currency forward sales (213,172,200) (100,641,876) (67,735,327) (39,020,675) (5,774,322) - - - - - -
Off-balance sheet Gap 36,790,969 20,173,509 11,126,023 3,413,454 (2,112,658) 3,874,141 316,500 - - - -
Total Yield / Interest Rate Risk Sensitivity Gap 153,115,126 (438,364,963) 329,793,369 110,700,745 44,435,003 132,317,522 88,781,915 119,586,312 109,986,719 8,202,547 (352,324,043)
Cumulative Yield / Interest Rate Risk Sensitivity Gap (438,364,963) (108,571,594) 2,129,151 46,564,154 178,881,676 267,663,591 387,249,903 497,236,622 505,439,169 153,115,126
Total
Exposed to yield / interest rate risk
------------------------------------------------------------------------------------------------------------------------- (Rupees in '000) -------------------------------------------------------------------------------------------------------------------------
Mismatch of interest rate sensitive assets and liabilities
Effective
yield /
interest
rate
2017
Non-interest
bearing
financial
instruments
75
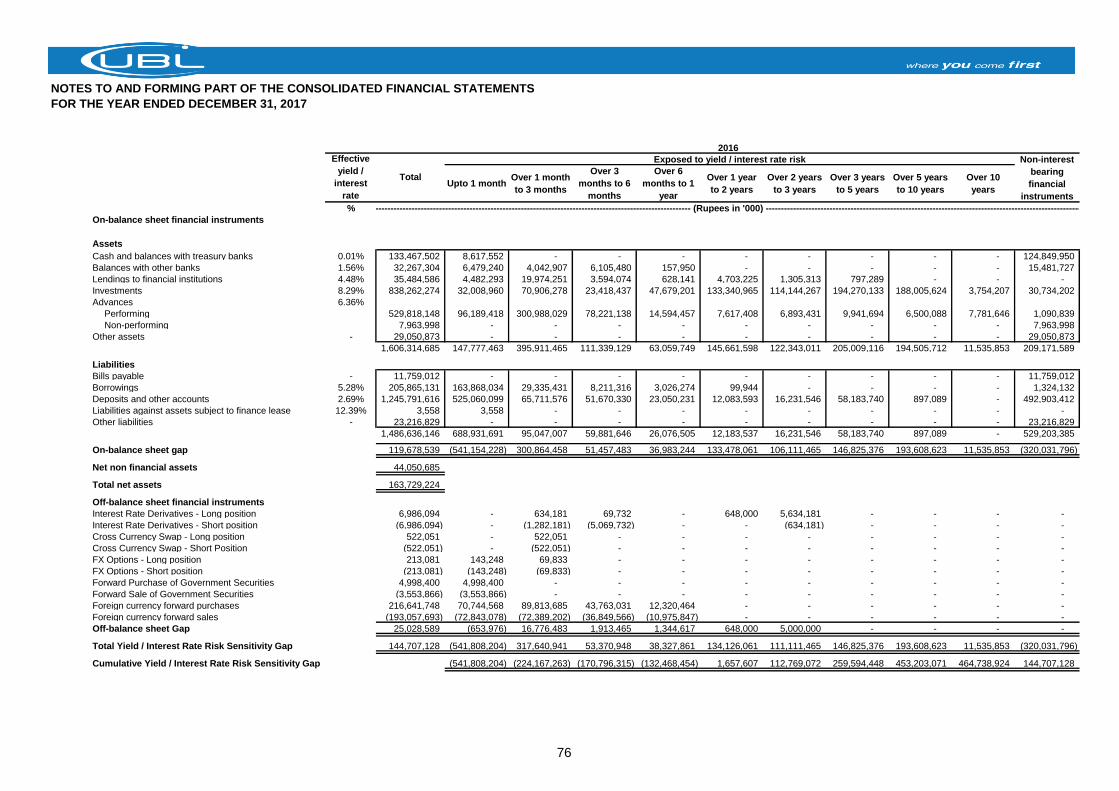
NOTES TO AND FORMING PART OF THE CONSOLIDATED FINANCIAL STATEMENTS
FOR THE YEAR ENDED DECEMBER 31, 2017
Upto 1 monthOver 1 month
to 3 months
Over 3
months to 6
months
Over 6
months to 1
year
Over 1 year
to 2 years
Over 2 years
to 3 years
Over 3 years
to 5 years
Over 5 years
to 10 years
Over 10
years
%
On-balance sheet financial instruments
Assets
Cash and balances with treasury banks 0.01% 133,467,502 8,617,552 - - - - - - - - 124,849,950
Balances with other banks 1.56% 32,267,304 6,479,240 4,042,907 6,105,480 157,950 - - - - - 15,481,727
Lendings to financial institutions 4.48% 35,484,586 4,482,293 19,974,251 3,594,074 628,141 4,703,225 1,305,313 797,289 - - -
Investments 8.29% 838,262,274 32,008,960 70,906,278 23,418,437 47,679,201 133,340,965 114,144,267 194,270,133 188,005,624 3,754,207 30,734,202
Advances 6.36%
Performing 529,818,148 96,189,418 300,988,029 78,221,138 14,594,457 7,617,408 6,893,431 9,941,694 6,500,088 7,781,646 1,090,839
Non-performing 7,963,998 - - - - - - - - - 7,963,998
Other assets - 29,050,873 - - - - - - - - - 29,050,873
1,606,314,685 147,777,463 395,911,465 111,339,129 63,059,749 145,661,598 122,343,011 205,009,116 194,505,712 11,535,853 209,171,589
Liabilities
Bills payable - 11,759,012 - - - - - - - - - 11,759,012
Borrowings 5.28% 205,865,131 163,868,034 29,335,431 8,211,316 3,026,274 99,944 - - - - 1,324,132
Deposits and other accounts 2.69% 1,245,791,616 525,060,099 65,711,576 51,670,330 23,050,231 12,083,593 16,231,546 58,183,740 897,089 - 492,903,412
Liabilities against assets subject to finance lease 12.39% 3,558 3,558 - - - - - - - - -
Other liabilities - 23,216,829 - - - - - - - - - 23,216,829
1,486,636,146 688,931,691 95,047,007 59,881,646 26,076,505 12,183,537 16,231,546 58,183,740 897,089 - 529,203,385
On-balance sheet gap 119,678,539 (541,154,228) 300,864,458 51,457,483 36,983,244 133,478,061 106,111,465 146,825,376 193,608,623 11,535,853 (320,031,796)
Net non financial assets 44,050,685
Total net assets 163,729,224
Off-balance sheet financial instruments
Interest Rate Derivatives - Long position 6,986,094 - 634,181 69,732 - 648,000 5,634,181 - - - -
Interest Rate Derivatives - Short position (6,986,094) - (1,282,181) (5,069,732) - - (634,181) - - - -
Cross Currency Swap - Long position 522,051 - 522,051 - - - - - - - -
Cross Currency Swap - Short Position (522,051) - (522,051) - - - - - - - -
FX Options - Long position 213,081 143,248 69,833 - - - - - - - -
FX Options - Short position (213,081) (143,248) (69,833) - - - - - - - -
Forward Purchase of Government Securities 4,998,400 4,998,400 - - - - - - - - -
Forward Sale of Government Securities (3,553,866) (3,553,866) - - - - - - - - -
Foreign currency forward purchases 216,641,748 70,744,568 89,813,685 43,763,031 12,320,464 - - - - - -
Foreign currency forward sales (193,057,693) (72,843,078) (72,389,202) (36,849,566) (10,975,847) - - - - - -
Off-balance sheet Gap 25,028,589 (653,976) 16,776,483 1,913,465 1,344,617 648,000 5,000,000 - - - -
Total Yield / Interest Rate Risk Sensitivity Gap 144,707,128 (541,808,204) 317,640,941 53,370,948 38,327,861 134,126,061 111,111,465 146,825,376 193,608,623 11,535,853 (320,031,796)
Cumulative Yield / Interest Rate Risk Sensitivity Gap (541,808,204) (224,167,263) (170,796,315) (132,468,454) 1,657,607 112,769,072 259,594,448 453,203,071 464,738,924 144,707,128
Non-interest
bearing
financial
instruments
------------------------------------------------------------------------------------------------------------------------- (Rupees in '000) -------------------------------------------------------------------------------------------------------------------------
Total
Exposed to yield / interest rate risk
2016Effective
yield /
interest
rate
76
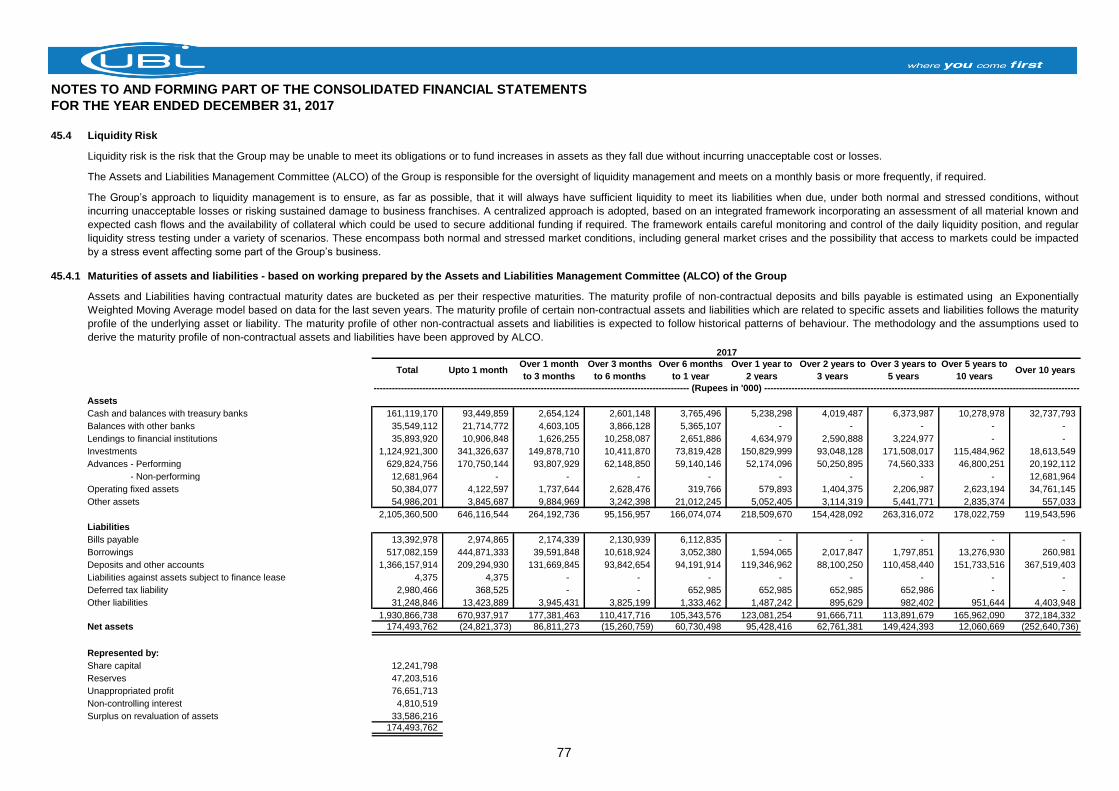
NOTES TO AND FORMING PART OF THE CONSOLIDATED FINANCIAL STATEMENTS
FOR THE YEAR ENDED DECEMBER 31, 2017
45.4 Liquidity Risk
Liquidity risk is the risk that the Group may be unable to meet its obligations or to fund increases in assets as they fall due without incurring unacceptable cost or losses.
The Assets and Liabilities Management Committee (ALCO) of the Group is responsible for the oversight of liquidity management and meets on a monthly basis or more frequently, if required.
45.4.1 Maturities of assets and liabilities - based on working prepared by the Assets and Liabilities Management Committee (ALCO) of the Group
Total Upto 1 monthOver 1 month
to 3 months
Over 3 months
to 6 months
Over 6 months
to 1 year
Over 1 year to
2 years
Over 2 years to
3 years
Over 3 years to
5 years
Over 5 years to
10 yearsOver 10 years
Assets
Cash and balances with treasury banks 161,119,170 93,449,859 2,654,124 2,601,148 3,765,496 5,238,298 4,019,487 6,373,987 10,278,978 32,737,793
Balances with other banks 35,549,112 21,714,772 4,603,105 3,866,128 5,365,107 - - - - -
Lendings to financial institutions 35,893,920 10,906,848 1,626,255 10,258,087 2,651,886 4,634,979 2,590,888 3,224,977 - -
Investments 1,124,921,300 341,326,637 149,878,710 10,411,870 73,819,428 150,829,999 93,048,128 171,508,017 115,484,962 18,613,549
Advances - Performing 629,824,756 170,750,144 93,807,929 62,148,850 59,140,146 52,174,096 50,250,895 74,560,333 46,800,251 20,192,112
Advances - Non-performing 12,681,964 - - - - - - - - 12,681,964
Operating fixed assets 50,384,077 4,122,597 1,737,644 2,628,476 319,766 579,893 1,404,375 2,206,987 2,623,194 34,761,145
Other assets 54,986,201 3,845,687 9,884,969 3,242,398 21,012,245 5,052,405 3,114,319 5,441,771 2,835,374 557,033
2,105,360,500 646,116,544 264,192,736 95,156,957 166,074,074 218,509,670 154,428,092 263,316,072 178,022,759 119,543,596
Liabilities
Bills payable 13,392,978 2,974,865 2,174,339 2,130,939 6,112,835 - - - - -
Borrowings 517,082,159 444,871,333 39,591,848 10,618,924 3,052,380 1,594,065 2,017,847 1,797,851 13,276,930 260,981
Deposits and other accounts 1,366,157,914 209,294,930 131,669,845 93,842,654 94,191,914 119,346,962 88,100,250 110,458,440 151,733,516 367,519,403
Liabilities against assets subject to finance lease 4,375 4,375 - - - - - - - -
Deferred tax liability 2,980,466 368,525 - - 652,985 652,985 652,985 652,986 - -
Other liabilities 31,248,846 13,423,889 3,945,431 3,825,199 1,333,462 1,487,242 895,629 982,402 951,644 4,403,948
1,930,866,738 670,937,917 177,381,463 110,417,716 105,343,576 123,081,254 91,666,711 113,891,679 165,962,090 372,184,332
Net assets 174,493,762 (24,821,373) 86,811,273 (15,260,759) 60,730,498 95,428,416 62,761,381 149,424,393 12,060,669 (252,640,736)
Represented by:
Share capital 12,241,798
Reserves 47,203,516
Unappropriated profit 76,651,713
Non-controlling interest 4,810,519
Surplus on revaluation of assets 33,586,216
174,493,762
2017
The Group’s approach to liquidity management is to ensure, as far as possible, that it will always have sufficient liquidity to meet its liabilities when due, under both normal and stressed conditions, without
incurring unacceptable losses or risking sustained damage to business franchises. A centralized approach is adopted, based on an integrated framework incorporating an assessment of all material known and
expected cash flows and the availability of collateral which could be used to secure additional funding if required. The framework entails careful monitoring and control of the daily liquidity position, and regular
liquidity stress testing under a variety of scenarios. These encompass both normal and stressed market conditions, including general market crises and the possibility that access to markets could be impacted
by a stress event affecting some part of the Group’s business.
Assets and Liabilities having contractual maturity dates are bucketed as per their respective maturities. The maturity profile of non-contractual deposits and bills payable is estimated using an Exponentially
Weighted Moving Average model based on data for the last seven years. The maturity profile of certain non-contractual assets and liabilities which are related to specific assets and liabilities follows the maturity
profile of the underlying asset or liability. The maturity profile of other non-contractual assets and liabilities is expected to follow historical patterns of behaviour. The methodology and the assumptions used to
derive the maturity profile of non-contractual assets and liabilities have been approved by ALCO.
-------------------------------------------------------------------------------------------------------- (Rupees in '000) --------------------------------------------------------------------------------------------------------
77
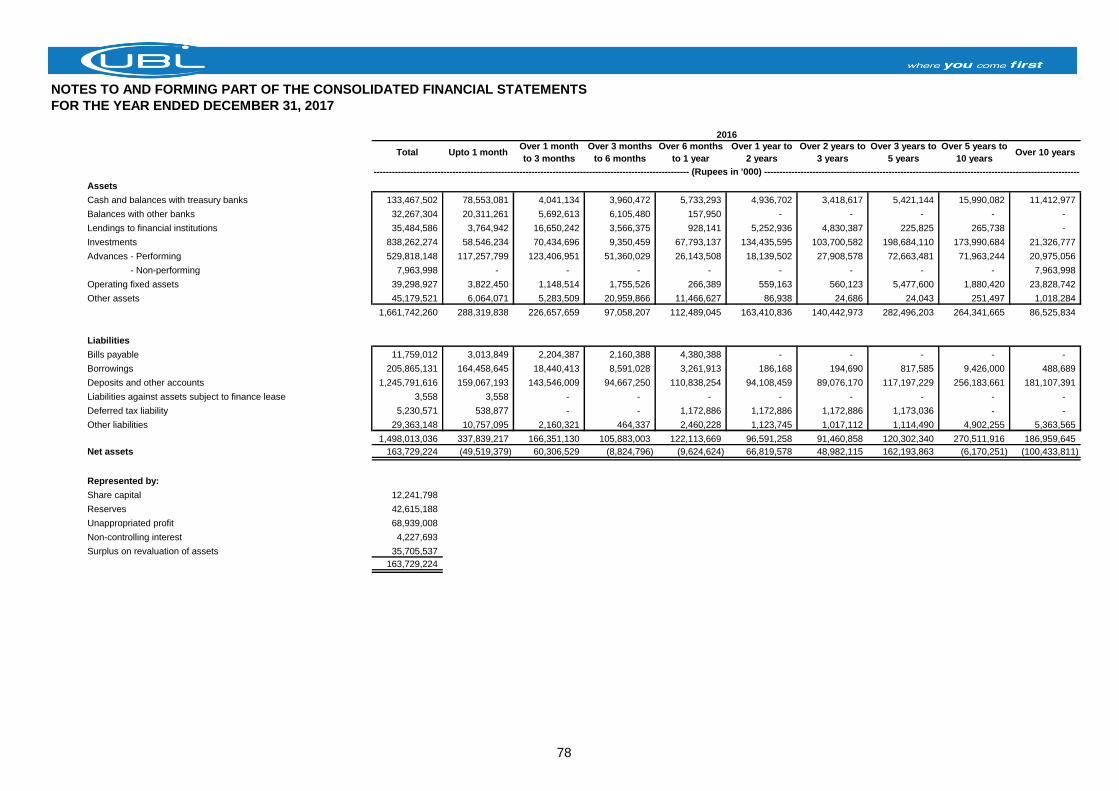
NOTES TO AND FORMING PART OF THE CONSOLIDATED FINANCIAL STATEMENTS
FOR THE YEAR ENDED DECEMBER 31, 2017
Total Upto 1 monthOver 1 month
to 3 months
Over 3 months
to 6 months
Over 6 months
to 1 year
Over 1 year to
2 years
Over 2 years to
3 years
Over 3 years to
5 years
Over 5 years to
10 yearsOver 10 years
Assets
Cash and balances with treasury banks 133,467,502 78,553,081 4,041,134 3,960,472 5,733,293 4,936,702 3,418,617 5,421,144 15,990,082 11,412,977
Balances with other banks 32,267,304 20,311,261 5,692,613 6,105,480 157,950 - - - - -
Lendings to financial institutions 35,484,586 3,764,942 16,650,242 3,566,375 928,141 5,252,936 4,830,387 225,825 265,738 -
Investments 838,262,274 58,546,234 70,434,696 9,350,459 67,793,137 134,435,595 103,700,582 198,684,110 173,990,684 21,326,777
Advances - Performing 529,818,148 117,257,799 123,406,951 51,360,029 26,143,508 18,139,502 27,908,578 72,663,481 71,963,244 20,975,056
Advances - Non-performing 7,963,998 - - - - - - - - 7,963,998
Operating fixed assets 39,298,927 3,822,450 1,148,514 1,755,526 266,389 559,163 560,123 5,477,600 1,880,420 23,828,742
Other assets 45,179,521 6,064,071 5,283,509 20,959,866 11,466,627 86,938 24,686 24,043 251,497 1,018,284
1,661,742,260 288,319,838 226,657,659 97,058,207 112,489,045 163,410,836 140,442,973 282,496,203 264,341,665 86,525,834
Liabilities
Bills payable 11,759,012 3,013,849 2,204,387 2,160,388 4,380,388 - - - - -
Borrowings 205,865,131 164,458,645 18,440,413 8,591,028 3,261,913 186,168 194,690 817,585 9,426,000 488,689
Deposits and other accounts 1,245,791,616 159,067,193 143,546,009 94,667,250 110,838,254 94,108,459 89,076,170 117,197,229 256,183,661 181,107,391
Liabilities against assets subject to finance lease 3,558 3,558 - - - - - - - -
Deferred tax liability 5,230,571 538,877 - - 1,172,886 1,172,886 1,172,886 1,173,036 - -
Other liabilities 29,363,148 10,757,095 2,160,321 464,337 2,460,228 1,123,745 1,017,112 1,114,490 4,902,255 5,363,565
1,498,013,036 337,839,217 166,351,130 105,883,003 122,113,669 96,591,258 91,460,858 120,302,340 270,511,916 186,959,645
Net assets 163,729,224 (49,519,379) 60,306,529 (8,824,796) (9,624,624) 66,819,578 48,982,115 162,193,863 (6,170,251) (100,433,811)
Represented by:
Share capital 12,241,798
Reserves 42,615,188
Unappropriated profit 68,939,008
Non-controlling interest 4,227,693
Surplus on revaluation of assets 35,705,537
163,729,224
-------------------------------------------------------------------------------------------------------- (Rupees in '000) --------------------------------------------------------------------------------------------------------
2016
78
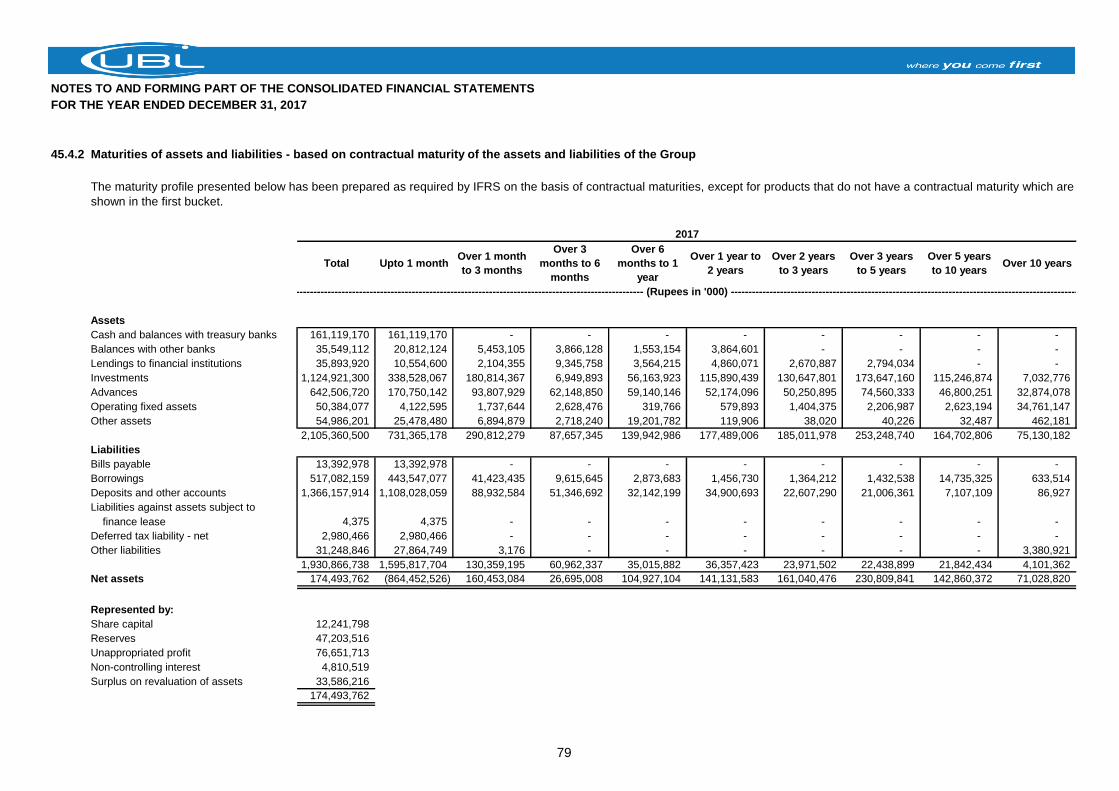
NOTES TO AND FORMING PART OF THE CONSOLIDATED FINANCIAL STATEMENTS
FOR THE YEAR ENDED DECEMBER 31, 2017
45.4.2 Maturities of assets and liabilities - based on contractual maturity of the assets and liabilities of the Group
Total Upto 1 monthOver 1 month
to 3 months
Over 3
months to 6
months
Over 6
months to 1
year
Over 1 year to
2 years
Over 2 years
to 3 years
Over 3 years
to 5 years
Over 5 years
to 10 yearsOver 10 years
Assets
Cash and balances with treasury banks 161,119,170 161,119,170 - - - - - - - -
Balances with other banks 35,549,112 20,812,124 5,453,105 3,866,128 1,553,154 3,864,601 - - - -
Lendings to financial institutions 35,893,920 10,554,600 2,104,355 9,345,758 3,564,215 4,860,071 2,670,887 2,794,034 - -
Investments 1,124,921,300 338,528,067 180,814,367 6,949,893 56,163,923 115,890,439 130,647,801 173,647,160 115,246,874 7,032,776
Advances 642,506,720 170,750,142 93,807,929 62,148,850 59,140,146 52,174,096 50,250,895 74,560,333 46,800,251 32,874,078
Operating fixed assets 50,384,077 4,122,595 1,737,644 2,628,476 319,766 579,893 1,404,375 2,206,987 2,623,194 34,761,147
Other assets 54,986,201 25,478,480 6,894,879 2,718,240 19,201,782 119,906 38,020 40,226 32,487 462,181
2,105,360,500 731,365,178 290,812,279 87,657,345 139,942,986 177,489,006 185,011,978 253,248,740 164,702,806 75,130,182
Liabilities
Bills payable 13,392,978 13,392,978 - - - - - - - -
Borrowings 517,082,159 443,547,077 41,423,435 9,615,645 2,873,683 1,456,730 1,364,212 1,432,538 14,735,325 633,514
Deposits and other accounts 1,366,157,914 1,108,028,059 88,932,584 51,346,692 32,142,199 34,900,693 22,607,290 21,006,361 7,107,109 86,927
Liabilities against assets subject to
finance lease 4,375 4,375 - - - - - - - -
Deferred tax liability - net 2,980,466 2,980,466 - - - - - - - -
Other liabilities 31,248,846 27,864,749 3,176 - - - - - - 3,380,921
1,930,866,738 1,595,817,704 130,359,195 60,962,337 35,015,882 36,357,423 23,971,502 22,438,899 21,842,434 4,101,362
Net assets 174,493,762 (864,452,526) 160,453,084 26,695,008 104,927,104 141,131,583 161,040,476 230,809,841 142,860,372 71,028,820
Represented by:
Share capital 12,241,798
Reserves 47,203,516
Unappropriated profit 76,651,713
Non-controlling interest 4,810,519
Surplus on revaluation of assets 33,586,216
174,493,762
The maturity profile presented below has been prepared as required by IFRS on the basis of contractual maturities, except for products that do not have a contractual maturity which are
shown in the first bucket.
2017
--------------------------------------------------------------------------------------------------- (Rupees in '000) ---------------------------------------------------------------------------------------------------
79
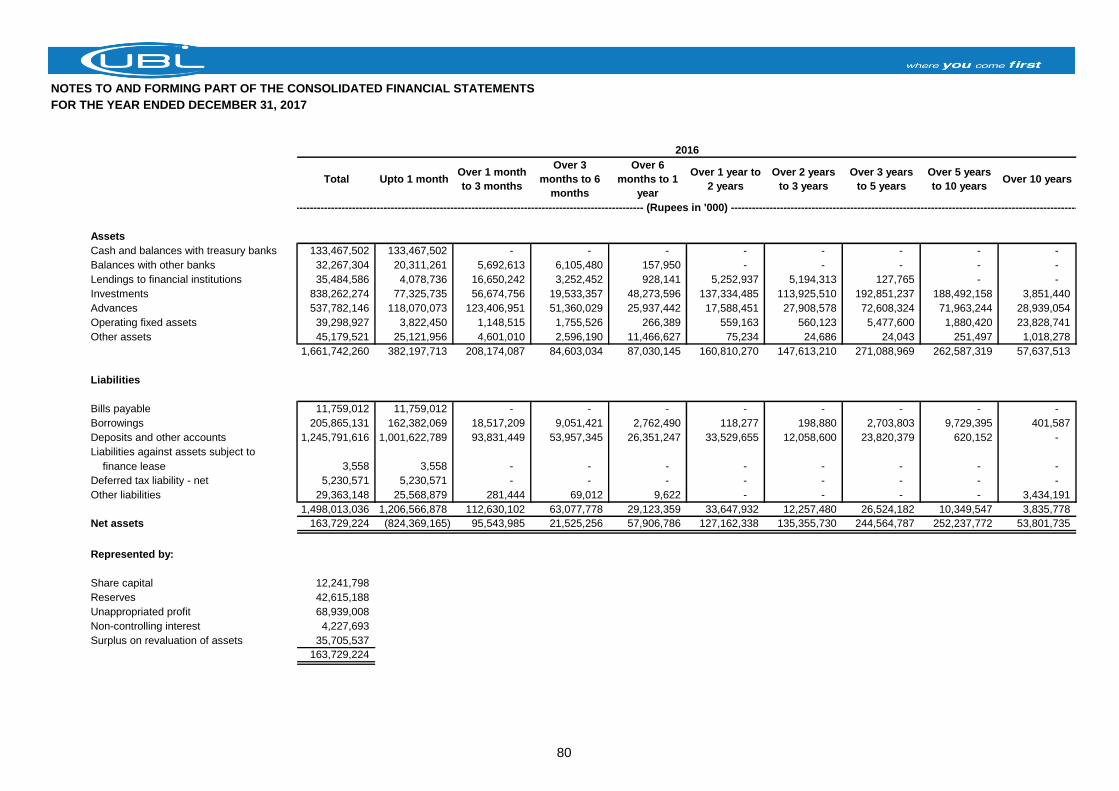
NOTES TO AND FORMING PART OF THE CONSOLIDATED FINANCIAL STATEMENTS
FOR THE YEAR ENDED DECEMBER 31, 2017
Total Upto 1 monthOver 1 month
to 3 months
Over 3
months to 6
months
Over 6
months to 1
year
Over 1 year to
2 years
Over 2 years
to 3 years
Over 3 years
to 5 years
Over 5 years
to 10 yearsOver 10 years
Assets
Cash and balances with treasury banks 133,467,502 133,467,502 - - - - - - - -
Balances with other banks 32,267,304 20,311,261 5,692,613 6,105,480 157,950 - - - - -
Lendings to financial institutions 35,484,586 4,078,736 16,650,242 3,252,452 928,141 5,252,937 5,194,313 127,765 - -
Investments 838,262,274 77,325,735 56,674,756 19,533,357 48,273,596 137,334,485 113,925,510 192,851,237 188,492,158 3,851,440
Advances 537,782,146 118,070,073 123,406,951 51,360,029 25,937,442 17,588,451 27,908,578 72,608,324 71,963,244 28,939,054
Operating fixed assets 39,298,927 3,822,450 1,148,515 1,755,526 266,389 559,163 560,123 5,477,600 1,880,420 23,828,741
Other assets 45,179,521 25,121,956 4,601,010 2,596,190 11,466,627 75,234 24,686 24,043 251,497 1,018,278
1,661,742,260 382,197,713 208,174,087 84,603,034 87,030,145 160,810,270 147,613,210 271,088,969 262,587,319 57,637,513
Liabilities
Bills payable 11,759,012 11,759,012 - - - - - - - -
Borrowings 205,865,131 162,382,069 18,517,209 9,051,421 2,762,490 118,277 198,880 2,703,803 9,729,395 401,587
Deposits and other accounts 1,245,791,616 1,001,622,789 93,831,449 53,957,345 26,351,247 33,529,655 12,058,600 23,820,379 620,152 -
Liabilities against assets subject to
finance lease 3,558 3,558 - - - - - - - -
Deferred tax liability - net 5,230,571 5,230,571 - - - - - - - -
Other liabilities 29,363,148 25,568,879 281,444 69,012 9,622 - - - - 3,434,191
1,498,013,036 1,206,566,878 112,630,102 63,077,778 29,123,359 33,647,932 12,257,480 26,524,182 10,349,547 3,835,778
Net assets 163,729,224 (824,369,165) 95,543,985 21,525,256 57,906,786 127,162,338 135,355,730 244,564,787 252,237,772 53,801,735
Represented by:
Share capital 12,241,798
Reserves 42,615,188
Unappropriated profit 68,939,008
Non-controlling interest 4,227,693
Surplus on revaluation of assets 35,705,537
163,729,224
--------------------------------------------------------------------------------------------------- (Rupees in '000) ---------------------------------------------------------------------------------------------------
2016
80
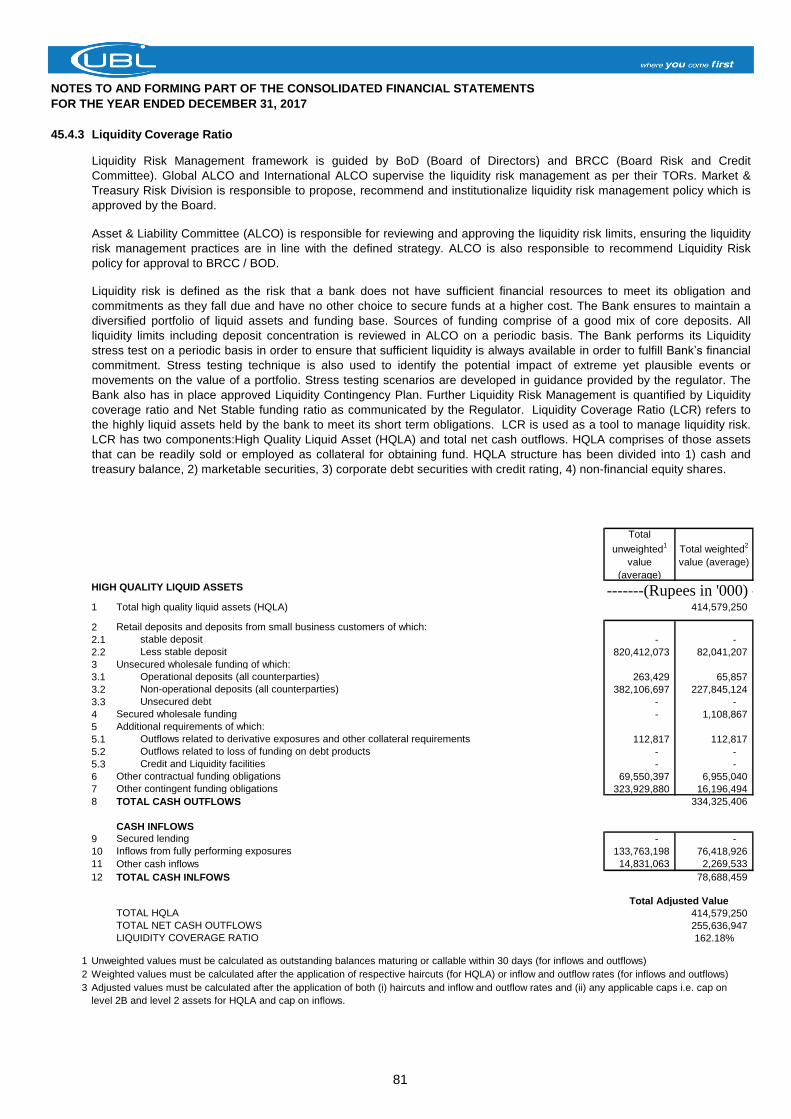
NOTES TO AND FORMING PART OF THE CONSOLIDATED FINANCIAL STATEMENTS
FOR THE YEAR ENDED DECEMBER 31, 2017
45.4.3 Liquidity Coverage Ratio
Total
unweighted1
value
(average)
Total weighted2
value (average)
-------(Rupees in '000) ---------1 Total high quality liquid assets (HQLA) 414,579,250
2 Retail deposits and deposits from small business customers of which:
2.1 stable deposit - -
2.2 Less stable deposit 820,412,073 82,041,207
3 Unsecured wholesale funding of which:
3.1 Operational deposits (all counterparties) 263,429 65,857
3.2 Non-operational deposits (all counterparties) 382,106,697 227,845,124
3.3 Unsecured debt - -
4 Secured wholesale funding - 1,108,867
5 Additional requirements of which:
5.1 Outflows related to derivative exposures and other collateral requirements 112,817 112,817
5.2 Outflows related to loss of funding on debt products - -
5.3 Credit and Liquidity facilities - -
6 Other contractual funding obligations 69,550,397 6,955,040
7 Other contingent funding obligations 323,929,880 16,196,494
8 TOTAL CASH OUTFLOWS 334,325,406
CASH INFLOWS
9 Secured lending - -
10 Inflows from fully performing exposures 133,763,198 76,418,926
11 Other cash inflows 14,831,063 2,269,533
12 TOTAL CASH INLFOWS 78,688,459
TOTAL HQLA 414,579,250
TOTAL NET CASH OUTFLOWS 255,636,947
LIQUIDITY COVERAGE RATIO 162.18%
1 Unweighted values must be calculated as outstanding balances maturing or callable within 30 days (for inflows and outflows)
2 Weighted values must be calculated after the application of respective haircuts (for HQLA) or inflow and outflow rates (for inflows and outflows)
3
HIGH QUALITY LIQUID ASSETS
Total Adjusted Value
Adjusted values must be calculated after the application of both (i) haircuts and inflow and outflow rates and (ii) any applicable caps i.e. cap on
level 2B and level 2 assets for HQLA and cap on inflows.
Liquidity Risk Management framework is guided by BoD (Board of Directors) and BRCC (Board Risk and Credit
Committee). Global ALCO and International ALCO supervise the liquidity risk management as per their TORs. Market &
Treasury Risk Division is responsible to propose, recommend and institutionalize liquidity risk management policy which is
approved by the Board.
Asset & Liability Committee (ALCO) is responsible for reviewing and approving the liquidity risk limits, ensuring the liquidity
risk management practices are in line with the defined strategy. ALCO is also responsible to recommend Liquidity Risk
policy for approval to BRCC / BOD.
Liquidity risk is defined as the risk that a bank does not have sufficient financial resources to meet its obligation and
commitments as they fall due and have no other choice to secure funds at a higher cost. The Bank ensures to maintain a
diversified portfolio of liquid assets and funding base. Sources of funding comprise of a good mix of core deposits. All
liquidity limits including deposit concentration is reviewed in ALCO on a periodic basis. The Bank performs its Liquidity
stress test on a periodic basis in order to ensure that sufficient liquidity is always available in order to fulfill Bank’s financial
commitment. Stress testing technique is also used to identify the potential impact of extreme yet plausible events or
movements on the value of a portfolio. Stress testing scenarios are developed in guidance provided by the regulator. The
Bank also has in place approved Liquidity Contingency Plan. Further Liquidity Risk Management is quantified by Liquidity
coverage ratio and Net Stable funding ratio as communicated by the Regulator. Liquidity Coverage Ratio (LCR) refers to
the highly liquid assets held by the bank to meet its short term obligations. LCR is used as a tool to manage liquidity risk.
LCR has two components:High Quality Liquid Asset (HQLA) and total net cash outflows. HQLA comprises of those assets
that can be readily sold or employed as collateral for obtaining fund. HQLA structure has been divided into 1) cash and
treasury balance, 2) marketable securities, 3) corporate debt securities with credit rating, 4) non-financial equity shares.
81
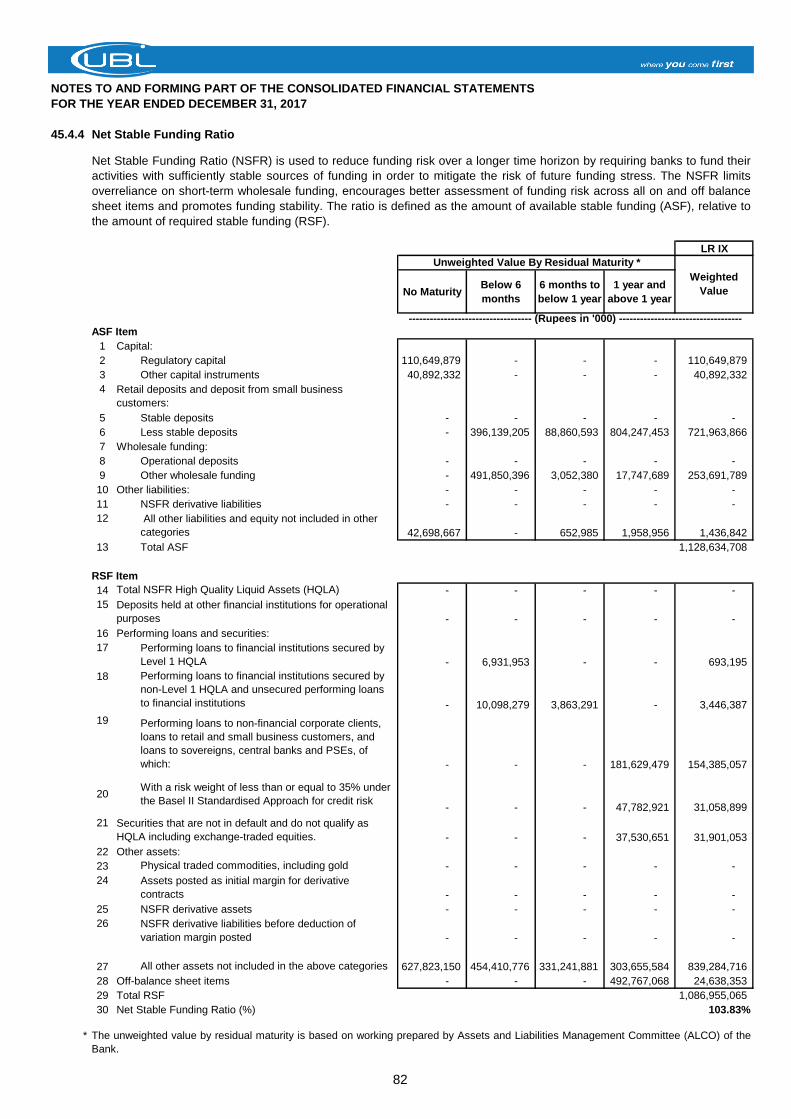
NOTES TO AND FORMING PART OF THE CONSOLIDATED FINANCIAL STATEMENTS
FOR THE YEAR ENDED DECEMBER 31, 2017
45.4.4 Net Stable Funding Ratio
LR IX
No MaturityBelow 6
months
6 months to
below 1 year
1 year and
above 1 year
ASF Item
1 Capital:
2 Regulatory capital 110,649,879 - - - 110,649,879
3 Other capital instruments 40,892,332 - - - 40,892,332
4 Retail deposits and deposit from small business
customers:
5 Stable deposits - - - - -
6 Less stable deposits - 396,139,205 88,860,593 804,247,453 721,963,866
7 Wholesale funding:
8 Operational deposits - - - - -
9 Other wholesale funding - 491,850,396 3,052,380 17,747,689 253,691,789
10 Other liabilities: - - - - -
11 NSFR derivative liabilities - - - - -
12 All other liabilities and equity not included in other
categories 42,698,667 - 652,985 1,958,956 1,436,842
13 Total ASF 1,128,634,708
RSF Item
14 Total NSFR High Quality Liquid Assets (HQLA) - - - - -
15 Deposits held at other financial institutions for operational
purposes - - - - -
16 Performing loans and securities:
17 Performing loans to financial institutions secured by
Level 1 HQLA - 6,931,953 - - 693,195
18 Performing loans to financial institutions secured by
non-Level 1 HQLA and unsecured performing loans
to financial institutions - 10,098,279 3,863,291 - 3,446,387
19 Performing loans to non-financial corporate clients,
loans to retail and small business customers, and
loans to sovereigns, central banks and PSEs, of
which: - - - 181,629,479 154,385,057
20With a risk weight of less than or equal to 35% under
the Basel II Standardised Approach for credit risk- - - 47,782,921 31,058,899
21 Securities that are not in default and do not qualify as
HQLA including exchange-traded equities. - - - 37,530,651 31,901,053
22 Other assets:
23 Physical traded commodities, including gold - - - - -
24 Assets posted as initial margin for derivative
contracts - - - - -
25 NSFR derivative assets - - - - -
26 NSFR derivative liabilities before deduction of
variation margin posted - - - - -
27 All other assets not included in the above categories 627,823,150 454,410,776 331,241,881 303,655,584 839,284,716
28 Off-balance sheet items - - - 492,767,068 24,638,353
29 Total RSF 1,086,955,065
30 Net Stable Funding Ratio (%) 103.83%
*
----------------------------------- (Rupees in '000) -----------------------------------
Unweighted Value By Residual Maturity *
The unweighted value by residual maturity is based on working prepared by Assets and Liabilities Management Committee (ALCO) of the
Bank.
Weighted
Value
Net Stable Funding Ratio (NSFR) is used to reduce funding risk over a longer time horizon by requiring banks to fund their
activities with sufficiently stable sources of funding in order to mitigate the risk of future funding stress. The NSFR limits
overreliance on short-term wholesale funding, encourages better assessment of funding risk across all on and off balance
sheet items and promotes funding stability. The ratio is defined as the amount of available stable funding (ASF), relative to
the amount of required stable funding (RSF).
82
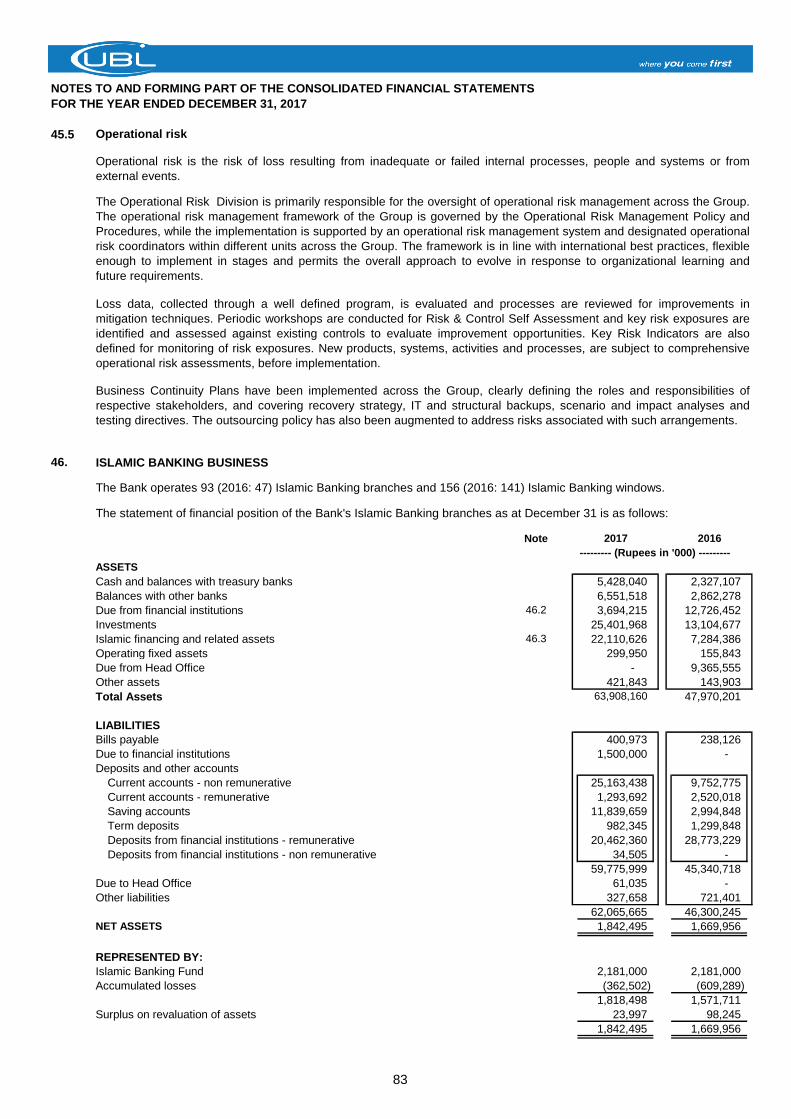
NOTES TO AND FORMING PART OF THE CONSOLIDATED FINANCIAL STATEMENTS
FOR THE YEAR ENDED DECEMBER 31, 2017
45.5 Operational risk
46. ISLAMIC BANKING BUSINESS
The Bank operates 93 (2016: 47) Islamic Banking branches and 156 (2016: 141) Islamic Banking windows.
Note 2017 2016
--------- (Rupees in '000) ---------
ASSETS
Cash and balances with treasury banks 5,428,040 2,327,107
Balances with other banks 6,551,518 2,862,278
Due from financial institutions 46.2 3,694,215 12,726,452
Investments 25,401,968 13,104,677
Islamic financing and related assets 46.3 22,110,626 7,284,386
Operating fixed assets 299,950 155,843
Due from Head Office - 9,365,555
Other assets 421,843 143,903
Total Assets 63,908,160 47,970,201
LIABILITIES
Bills payable 400,973 238,126
Due to financial institutions 1,500,000 -
Deposits and other accounts
Current accounts - non remunerative 25,163,438 9,752,775
Current accounts - remunerative 1,293,692 2,520,018
Saving accounts 11,839,659 2,994,848
Term deposits 982,345 1,299,848
Deposits from financial institutions - remunerative 20,462,360 28,773,229
Deposits from financial institutions - non remunerative 34,505 -
59,775,999 45,340,718
Due to Head Office 61,035 -
Other liabilities 327,658 721,401
62,065,665 46,300,245
NET ASSETS 1,842,495 1,669,956
REPRESENTED BY:
Islamic Banking Fund 2,181,000 2,181,000
Accumulated losses (362,502) (609,289)
1,818,498 1,571,711
Surplus on revaluation of assets 23,997 98,245
1,842,495 1,669,956
Operational risk is the risk of loss resulting from inadequate or failed internal processes, people and systems or from
external events.
The Operational Risk Division is primarily responsible for the oversight of operational risk management across the Group.
The operational risk management framework of the Group is governed by the Operational Risk Management Policy and
Procedures, while the implementation is supported by an operational risk management system and designated operational
risk coordinators within different units across the Group. The framework is in line with international best practices, flexible
enough to implement in stages and permits the overall approach to evolve in response to organizational learning and
future requirements.
Loss data, collected through a well defined program, is evaluated and processes are reviewed for improvements in
mitigation techniques. Periodic workshops are conducted for Risk & Control Self Assessment and key risk exposures are
identified and assessed against existing controls to evaluate improvement opportunities. Key Risk Indicators are also
defined for monitoring of risk exposures. New products, systems, activities and processes, are subject to comprehensive
operational risk assessments, before implementation.
Business Continuity Plans have been implemented across the Group, clearly defining the roles and responsibilities of
respective stakeholders, and covering recovery strategy, IT and structural backups, scenario and impact analyses and
testing directives. The outsourcing policy has also been augmented to address risks associated with such arrangements.
The statement of financial position of the Bank's Islamic Banking branches as at December 31 is as follows:
83
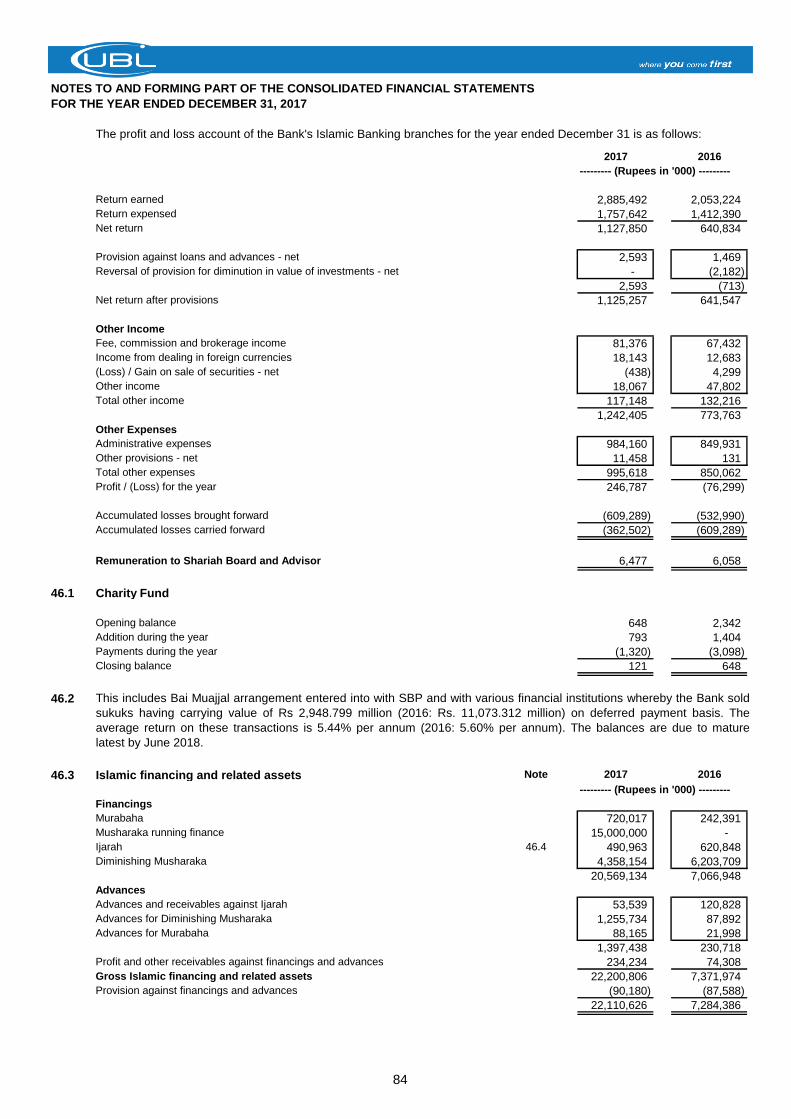
NOTES TO AND FORMING PART OF THE CONSOLIDATED FINANCIAL STATEMENTS
FOR THE YEAR ENDED DECEMBER 31, 2017
The profit and loss account of the Bank's Islamic Banking branches for the year ended December 31 is as follows:
2017 2016
--------- (Rupees in '000) ---------
Return earned 2,885,492 2,053,224
Return expensed 1,757,642 1,412,390
Net return 1,127,850 640,834
Provision against loans and advances - net 2,593 1,469
Reversal of provision for diminution in value of investments - net - (2,182)
2,593 (713)
Net return after provisions 1,125,257 641,547
Other Income
Fee, commission and brokerage income 81,376 67,432
Income from dealing in foreign currencies 18,143 12,683
(Loss) / Gain on sale of securities - net (438) 4,299
Other income 18,067 47,802
Total other income 117,148 132,216
1,242,405 773,763
Other Expenses
Administrative expenses 984,160 849,931
Other provisions - net 11,458 131
Total other expenses 995,618 850,062
Profit / (Loss) for the year 246,787 (76,299)
Accumulated losses brought forward (609,289) (532,990)
Accumulated losses carried forward (362,502) (609,289)
Remuneration to Shariah Board and Advisor 6,477 6,058
46.1 Charity Fund
Opening balance 648 2,342
Addition during the year 793 1,404
Payments during the year (1,320) (3,098)
Closing balance 121 648
46.2
46.3 Islamic financing and related assets Note 2017 2016
--------- (Rupees in '000) ---------
Financings
Murabaha 720,017 242,391
Musharaka running finance 15,000,000 -
Ijarah 46.4 490,963 620,848
Diminishing Musharaka 4,358,154 6,203,709
20,569,134 7,066,948
Advances
Advances and receivables against Ijarah 53,539 120,828
Advances for Diminishing Musharaka 1,255,734 87,892
Advances for Murabaha 88,165 21,998
1,397,438 230,718
Profit and other receivables against financings and advances 234,234 74,308
Gross Islamic financing and related assets 22,200,806 7,371,974
Provision against financings and advances (90,180) (87,588)
22,110,626 7,284,386
This includes Bai Muajjal arrangement entered into with SBP and with various financial institutions whereby the Bank sold
sukuks having carrying value of Rs 2,948.799 million (2016: Rs. 11,073.312 million) on deferred payment basis. The
average return on these transactions is 5.44% per annum (2016: 5.60% per annum). The balances are due to mature
latest by June 2018.
84
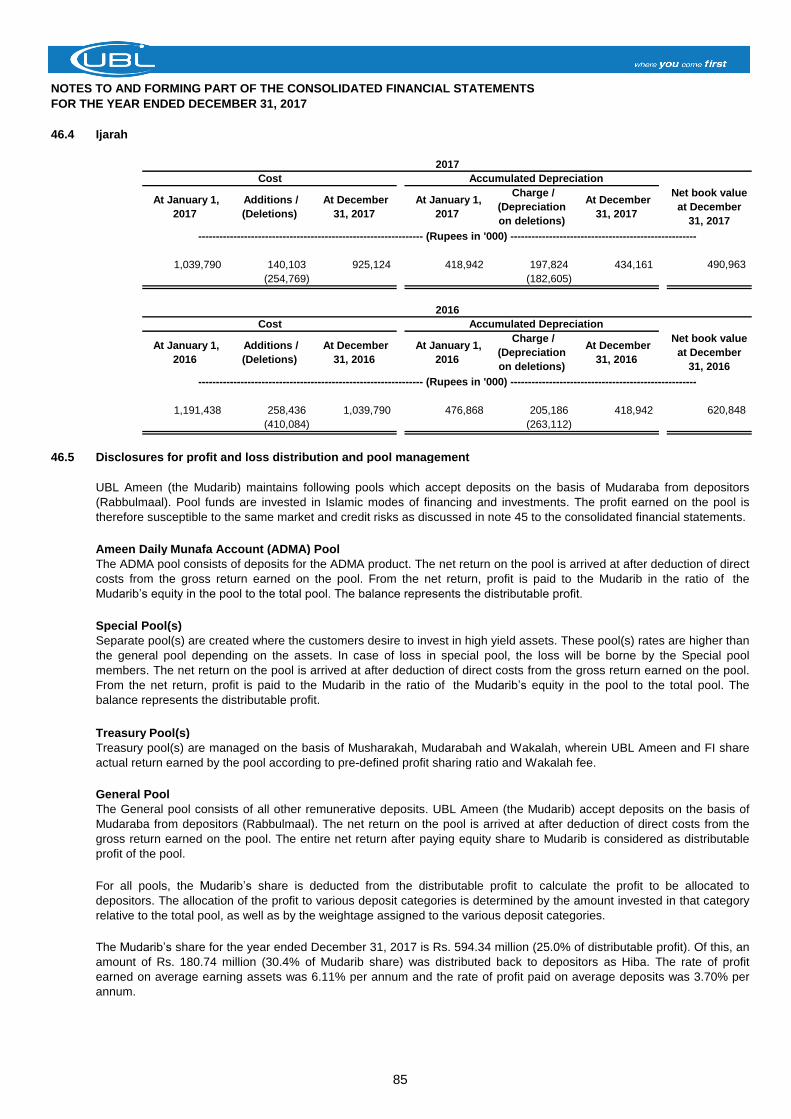
NOTES TO AND FORMING PART OF THE CONSOLIDATED FINANCIAL STATEMENTS
FOR THE YEAR ENDED DECEMBER 31, 2017
46.4 Ijarah
2017
Cost Accumulated Depreciation
---------------------------------------------------------------- (Rupees in '000) -----------------------------------------------------
1,039,790 140,103 925,124 418,942 197,824 434,161 490,963
(254,769) (182,605)
2016
Cost Accumulated Depreciation
---------------------------------------------------------------- (Rupees in '000) -----------------------------------------------------
1,191,438 258,436 1,039,790 476,868 205,186 418,942 620,848
(410,084) (263,112)
46.5 Disclosures for profit and loss distribution and pool management
Ameen Daily Munafa Account (ADMA) Pool
Special Pool(s)
Treasury Pool(s)
General Pool
The Mudarib’s share for the year ended December 31, 2017 is Rs. 594.34 million (25.0% of distributable profit). Of this, an
amount of Rs. 180.74 million (30.4% of Mudarib share) was distributed back to depositors as Hiba. The rate of profit
earned on average earning assets was 6.11% per annum and the rate of profit paid on average deposits was 3.70% per
annum.
Charge /
(Depreciation
on deletions)
UBL Ameen (the Mudarib) maintains following pools which accept deposits on the basis of Mudaraba from depositors
(Rabbulmaal). Pool funds are invested in Islamic modes of financing and investments. The profit earned on the pool is
therefore susceptible to the same market and credit risks as discussed in note 45 to the consolidated financial statements.
The ADMA pool consists of deposits for the ADMA product. The net return on the pool is arrived at after deduction of direct
costs from the gross return earned on the pool. From the net return, profit is paid to the Mudarib in the ratio of the
Mudarib’s equity in the pool to the total pool. The balance represents the distributable profit.
Separate pool(s) are created where the customers desire to invest in high yield assets. These pool(s) rates are higher than
the general pool depending on the assets. In case of loss in special pool, the loss will be borne by the Special pool
members. The net return on the pool is arrived at after deduction of direct costs from the gross return earned on the pool.
From the net return, profit is paid to the Mudarib in the ratio of the Mudarib’s equity in the pool to the total pool. The
balance represents the distributable profit.
At January 1,
2016
For all pools, the Mudarib’s share is deducted from the distributable profit to calculate the profit to be allocated to
depositors. The allocation of the profit to various deposit categories is determined by the amount invested in that category
relative to the total pool, as well as by the weightage assigned to the various deposit categories.
Treasury pool(s) are managed on the basis of Musharakah, Mudarabah and Wakalah, wherein UBL Ameen and FI share
actual return earned by the pool according to pre-defined profit sharing ratio and Wakalah fee.
The General pool consists of all other remunerative deposits. UBL Ameen (the Mudarib) accept deposits on the basis of
Mudaraba from depositors (Rabbulmaal). The net return on the pool is arrived at after deduction of direct costs from the
gross return earned on the pool. The entire net return after paying equity share to Mudarib is considered as distributable
profit of the pool.
Net book value
at December
31, 2017
Charge /
(Depreciation
on deletions)
Net book value
at December
31, 2016
At December
31, 2016
At December
31, 2017
Additions /
(Deletions)
At January 1,
2017
At January 1,
2017
At December
31, 2017
At January 1,
2016
At December
31, 2016
Additions /
(Deletions)
85
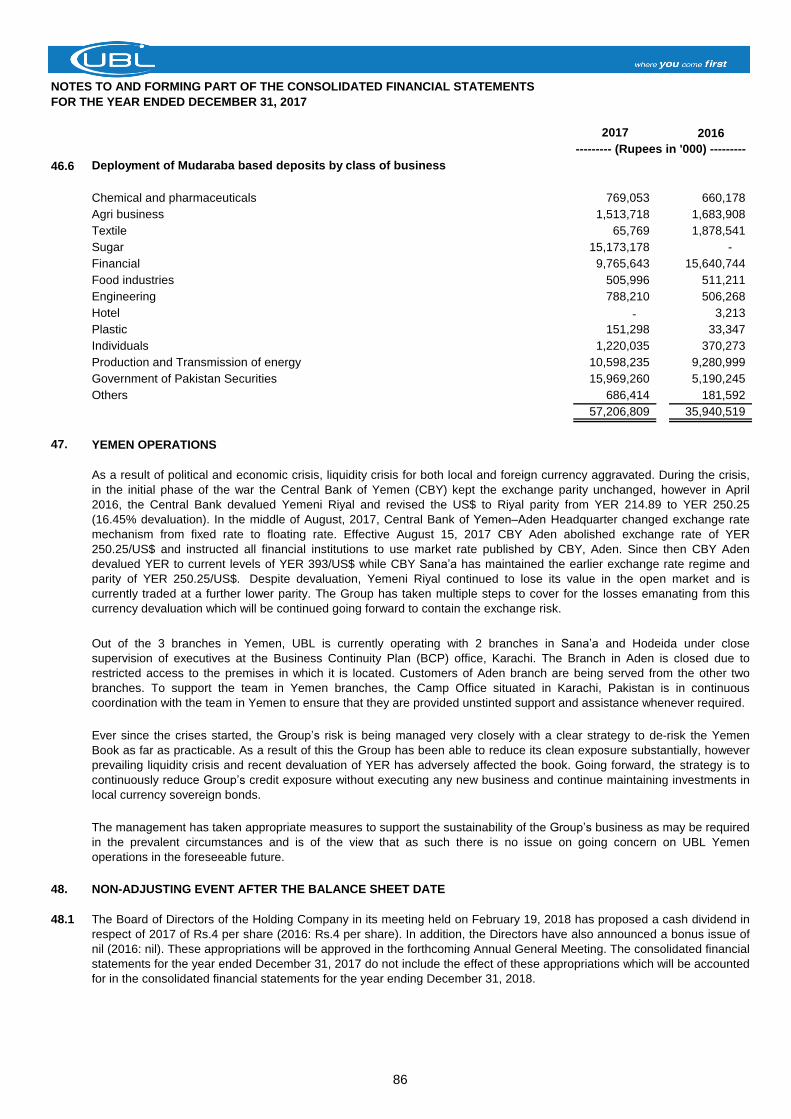
NOTES TO AND FORMING PART OF THE CONSOLIDATED FINANCIAL STATEMENTS
FOR THE YEAR ENDED DECEMBER 31, 2017
2017 2016
--------- (Rupees in '000) ---------
46.6 Deployment of Mudaraba based deposits by class of business
Chemical and pharmaceuticals 769,053 660,178
Agri business 1,513,718 1,683,908
Textile 65,769 1,878,541
Sugar 15,173,178 -
Financial 9,765,643 15,640,744
Food industries 505,996 511,211
Engineering 788,210 506,268
Hotel - 3,213
Plastic 151,298 33,347
Individuals 1,220,035 370,273
Production and Transmission of energy 10,598,235 9,280,999
Government of Pakistan Securities 15,969,260 5,190,245
Others 686,414 181,592
57,206,809 35,940,519
47. YEMEN OPERATIONS
48. NON-ADJUSTING EVENT AFTER THE BALANCE SHEET DATE
48.1 The Board of Directors of the Holding Company in its meeting held on February 19, 2018 has proposed a cash dividend in
respect of 2017 of Rs.4 per share (2016: Rs.4 per share). In addition, the Directors have also announced a bonus issue of
nil (2016: nil). These appropriations will be approved in the forthcoming Annual General Meeting. The consolidated financial
statements for the year ended December 31, 2017 do not include the effect of these appropriations which will be accounted
for in the consolidated financial statements for the year ending December 31, 2018.
As a result of political and economic crisis, liquidity crisis for both local and foreign currency aggravated. During the crisis,
in the initial phase of the war the Central Bank of Yemen (CBY) kept the exchange parity unchanged, however in April
2016, the Central Bank devalued Yemeni Riyal and revised the US$ to Riyal parity from YER 214.89 to YER 250.25
(16.45% devaluation). In the middle of August, 2017, Central Bank of Yemen–Aden Headquarter changed exchange rate
mechanism from fixed rate to floating rate. Effective August 15, 2017 CBY Aden abolished exchange rate of YER
250.25/US$ and instructed all financial institutions to use market rate published by CBY, Aden. Since then CBY Aden
devalued YER to current levels of YER 393/US$ while CBY Sana’a has maintained the earlier exchange rate regime and
parity of YER 250.25/US$. Despite devaluation, Yemeni Riyal continued to lose its value in the open market and is
currently traded at a further lower parity. The Group has taken multiple steps to cover for the losses emanating from this
currency devaluation which will be continued going forward to contain the exchange risk.
Out of the 3 branches in Yemen, UBL is currently operating with 2 branches in Sana’a and Hodeida under close
supervision of executives at the Business Continuity Plan (BCP) office, Karachi. The Branch in Aden is closed due to
restricted access to the premises in which it is located. Customers of Aden branch are being served from the other two
branches. To support the team in Yemen branches, the Camp Office situated in Karachi, Pakistan is in continuous
coordination with the team in Yemen to ensure that they are provided unstinted support and assistance whenever required.
The management has taken appropriate measures to support the sustainability of the Group’s business as may be required
in the prevalent circumstances and is of the view that as such there is no issue on going concern on UBL Yemen
operations in the foreseeable future.
Ever since the crises started, the Group’s risk is being managed very closely with a clear strategy to de-risk the Yemen
Book as far as practicable. As a result of this the Group has been able to reduce its clean exposure substantially, however
prevailing liquidity crisis and recent devaluation of YER has adversely affected the book. Going forward, the strategy is to
continuously reduce Group’s credit exposure without executing any new business and continue maintaining investments in
local currency sovereign bonds.
86
NOTES TO AND FORMING PART OF THE CONSOLIDATED FINANCIAL STATEMENTS
FOR THE YEAR ENDED DECEMBER 31, 2017
48.2
49. DATE OF AUTHORIZATION
50. GENERAL
50.1 Comparatives
50.2 Figures have been rounded off to the nearest thousand rupees unless otherwise stated.
Aameer Karachiwalla Sima Kamil Amar Zafar Khan Arshad Ahmad Mir Sir Mohammed Anwar Pervez, OBE, HPk
Chief Financial Officer President & Director Director Chairman
Chief Executive Officer
Comparative information has been reclassified, rearranged or additionally incorporated in these consolidated financial
statements for the purposes of better presentation.
The Bank is a party to a Suo Moto case No. 20/2016 and Constitution Petition No. 45 of 2016 in the Honourable Supreme
Court of Pakistan. Through these cases, the Honourable Supreme Court has taken up the matter relating to pension
arrangements of certain banks which were previously under the control of the Federal Government. Various applications
had been filed by ex-employees of those banks in Suo Moto case contesting the freezing of their pensions and
discontinuation of its indexation. The Bank maintains that being a private employer, it is not under any legal obligation to
increase the pension of the employees and that post privatization, the new management gave multiple notices up to
December 31, 2003 to allow employees to convert their end of service benefits from Pension Fund to Gratuity Fund.
During the course of hearing of the above cases, the Supreme Court of Pakistan indicated that the concerned Banks may,
on their own, consider increasing the pension of their ex-employees. The Bank understands that although it is not legally
liable to change the benefit plan however, purely on humanitarian basis and for the betterment of its ex-employees from a
prospective date and future indexation mechanism, it has prepared and submitted a proposal before the Honourable
Supreme Court of Pakistan whereby minimum pension has been fixed to Rs. 5,250/- with 5% increase every year. In
response to the proposal submitted by the Bank, the Supreme Court of Pakistan in its hearing held on February 13, 2018
has ordered, at its discretion, fixation of minimum pension of Rs 8,000/- per month with 5 percent indexation on an annual
basis and that the said increase would be on a prospective basis. Detailed Judgement has not been received till date. In
the meantime, the Bank has also initiated an exercise to assess the impact of the revision which, among other things,
includes life verification process of the pensioners. Based on initial actuarial estimates, the impact of increase in pension
will range between Rs 3.4 billion to Rs 5.9 billion. The estimated amount can only be finalised after receipt of written court
order and completion of life verification exercise. Suitable amendments in the pension plan will be made accordingly. As
required under the approved accounting standards, the impact of the revision will be accounted for in the financial
statements of the Bank as past service cost in the financial year 2018 once the plan is formally approved.
These consolidated financial statements were authorized for issue on February 19, 2018 by the Board of Directors of the
Holding Company.
87
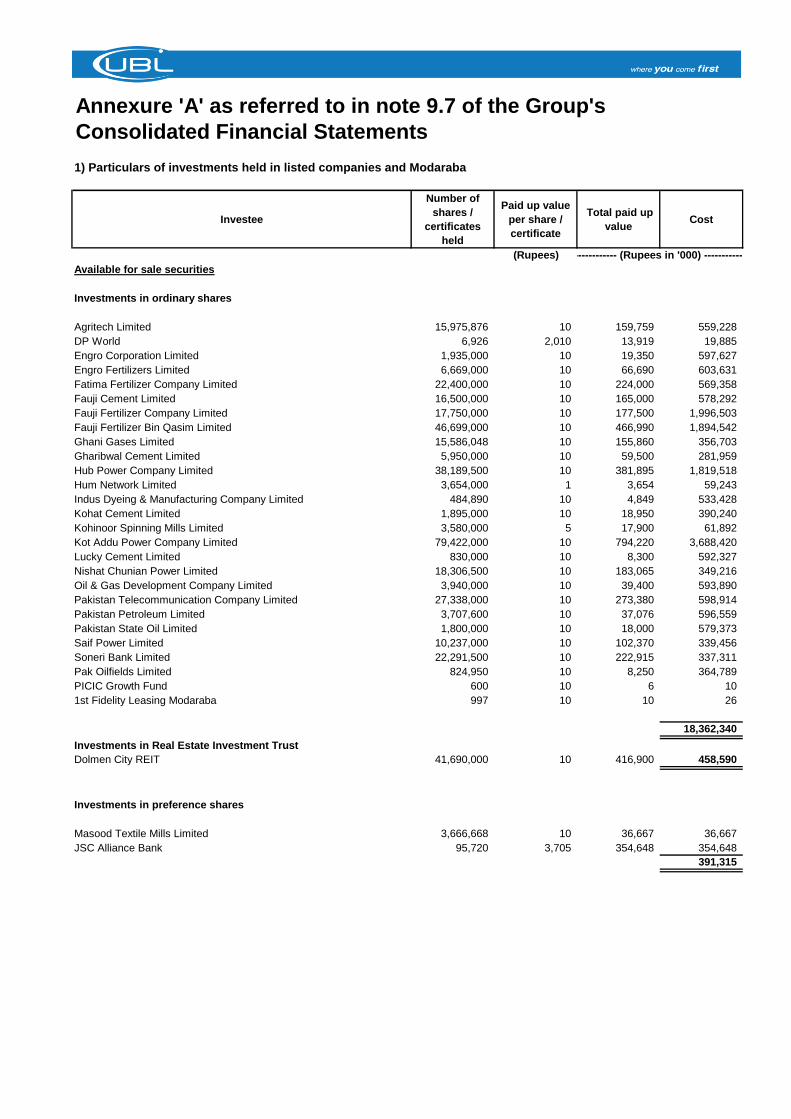
Consolidated Financial Statements
1) Particulars of investments held in listed companies and Modaraba
Investee
Number of
shares /
certificates
held
Paid up value
per share /
certificate
Total paid up
value Cost
(Rupees)
Available for sale securities
Investments in ordinary shares
Agritech Limited 15,975,876 10 159,759 559,228
DP World 6,926 2,010 13,919 19,885
Engro Corporation Limited 1,935,000 10 19,350 597,627
Engro Fertilizers Limited 6,669,000 10 66,690 603,631
Fatima Fertilizer Company Limited 22,400,000 10 224,000 569,358
Fauji Cement Limited 16,500,000 10 165,000 578,292
Fauji Fertilizer Company Limited 17,750,000 10 177,500 1,996,503
Fauji Fertilizer Bin Qasim Limited 46,699,000 10 466,990 1,894,542
Ghani Gases Limited 15,586,048 10 155,860 356,703
Gharibwal Cement Limited 5,950,000 10 59,500 281,959
Hub Power Company Limited 38,189,500 10 381,895 1,819,518
Hum Network Limited 3,654,000 1 3,654 59,243
Indus Dyeing & Manufacturing Company Limited 484,890 10 4,849 533,428
Kohat Cement Limited 1,895,000 10 18,950 390,240
Kohinoor Spinning Mills Limited 3,580,000 5 17,900 61,892
Kot Addu Power Company Limited 79,422,000 10 794,220 3,688,420
Lucky Cement Limited 830,000 10 8,300 592,327
Nishat Chunian Power Limited 18,306,500 10 183,065 349,216
Oil & Gas Development Company Limited 3,940,000 10 39,400 593,890
Pakistan Telecommunication Company Limited 27,338,000 10 273,380 598,914
Pakistan Petroleum Limited 3,707,600 10 37,076 596,559
Pakistan State Oil Limited 1,800,000 10 18,000 579,373
Saif Power Limited 10,237,000 10 102,370 339,456
Soneri Bank Limited 22,291,500 10 222,915 337,311
Pak Oilfields Limited 824,950 10 8,250 364,789
PICIC Growth Fund 600 10 6 10
1st Fidelity Leasing Modaraba 997 10 10 26
18,362,340
Investments in Real Estate Investment Trust
Dolmen City REIT 41,690,000 10 416,900 458,590
Investments in preference shares
Masood Textile Mills Limited 3,666,668 10 36,667 36,667
JSC Alliance Bank 95,720 3,705 354,648 354,648
391,315
Annexure 'A' as referred to in note 9.7 of the Group's
---------------------- (Rupees in '000) ----------------------
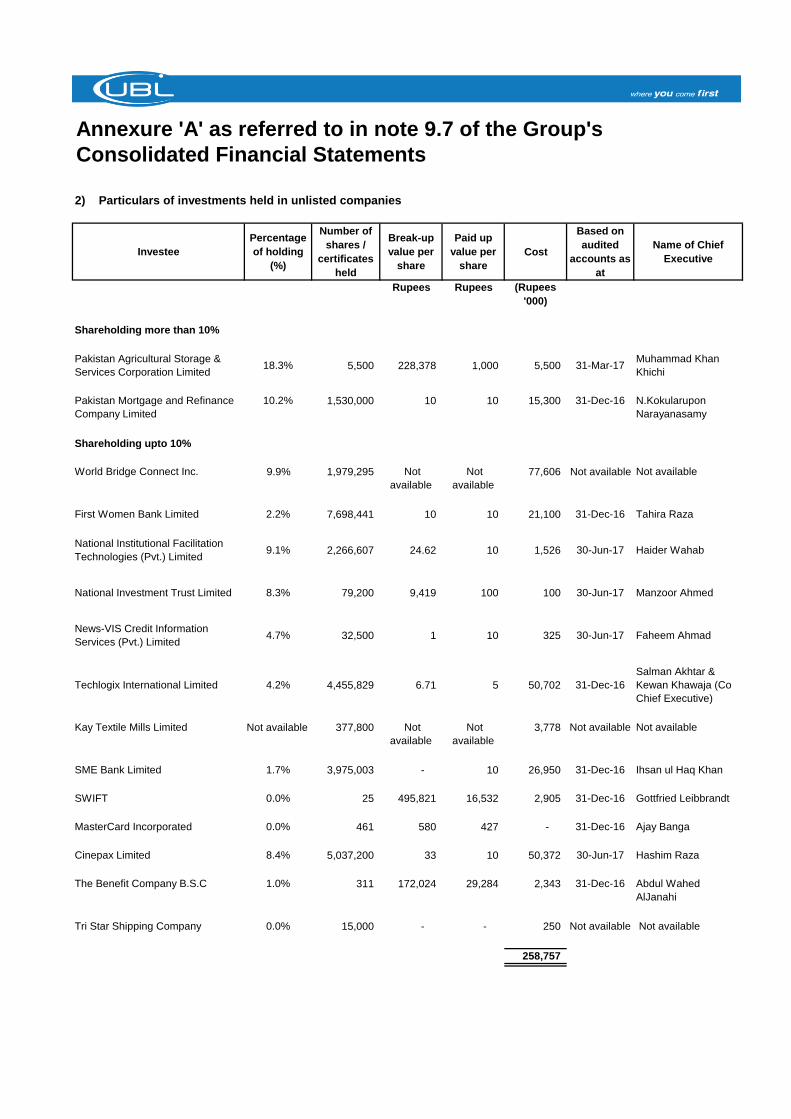
Annexure 'A' as referred to in note 9.7 of the Group's
Consolidated Financial Statements
2) Particulars of investments held in unlisted companies
Investee
Percentage
of holding
(%)
Number of
shares /
certificates
held
Break-up
value per
share
Paid up
value per
share
Cost
Based on
audited
accounts as
at
Name of Chief
Executive
Rupees Rupees (Rupees
'000)
Shareholding more than 10%
Pakistan Agricultural Storage &
Services Corporation Limited18.3% 5,500 228,378 1,000 5,500 31-Mar-17
Muhammad Khan
Khichi
Pakistan Mortgage and Refinance
Company Limited
10.2% 1,530,000 10 10 15,300 31-Dec-16 N.Kokularupon
Narayanasamy
Shareholding upto 10%
World Bridge Connect Inc. 9.9% 1,979,295 Not
available
Not
available
77,606 Not available Not available
First Women Bank Limited 2.2% 7,698,441 10 10 21,100 31-Dec-16 Tahira Raza
National Institutional Facilitation
Technologies (Pvt.) Limited9.1% 2,266,607 24.62 10 1,526 30-Jun-17 Haider Wahab
National Investment Trust Limited 8.3% 79,200 9,419 100 100 30-Jun-17 Manzoor Ahmed
News-VIS Credit Information
Services (Pvt.) Limited4.7% 32,500 1 10 325 30-Jun-17 Faheem Ahmad
Techlogix International Limited 4.2% 4,455,829 6.71 5 50,702 31-Dec-16
Salman Akhtar &
Kewan Khawaja (Co
Chief Executive)
Kay Textile Mills Limited Not available 377,800 Not
available
Not
available
3,778 Not available Not available
SME Bank Limited 1.7% 3,975,003 - 10 26,950 31-Dec-16 Ihsan ul Haq Khan
SWIFT 0.0% 25 495,821 16,532 2,905 31-Dec-16 Gottfried Leibbrandt
MasterCard Incorporated 0.0% 461 580 427 - 31-Dec-16 Ajay Banga
Cinepax Limited 8.4% 5,037,200 33 10 50,372 30-Jun-17 Hashim Raza
The Benefit Company B.S.C 1.0% 311 172,024 29,284 2,343 31-Dec-16 Abdul Wahed
AlJanahi
Tri Star Shipping Company 0.0% 15,000 - - 250 Not available Not available
258,757
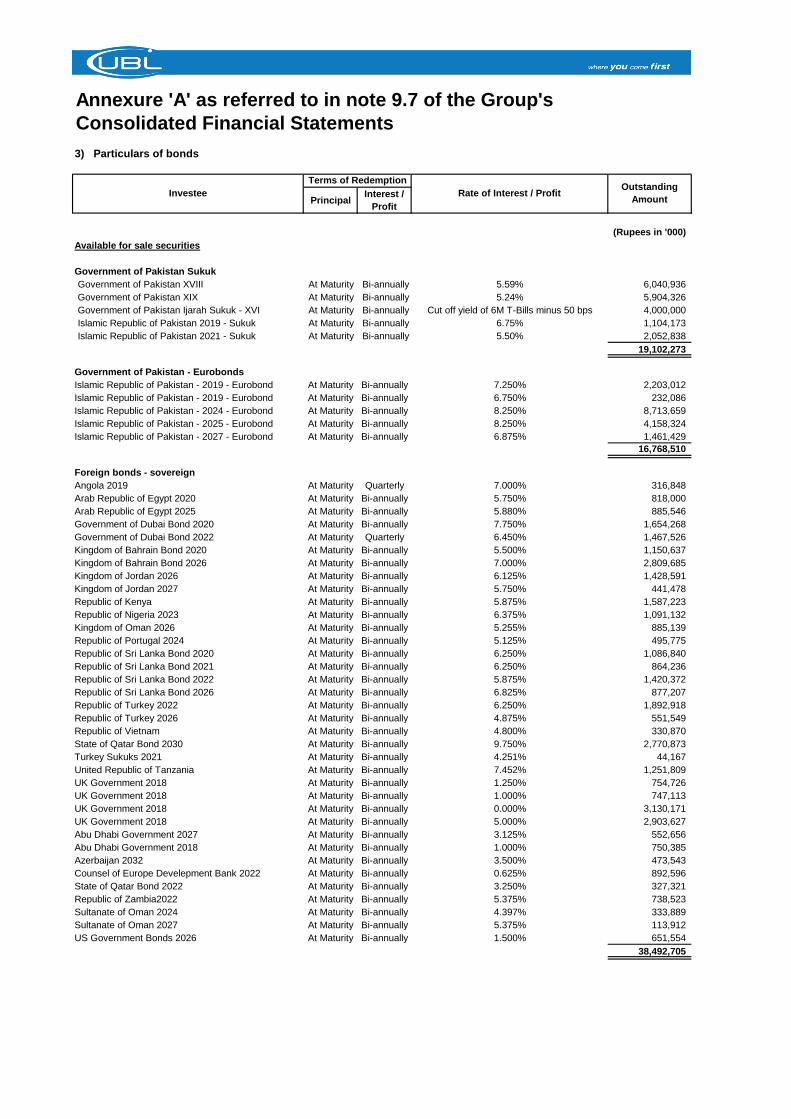
Annexure 'A' as referred to in note 9.7 of the Group's
Consolidated Financial Statements
3) Particulars of bonds
PrincipalInterest /
Profit
(Rupees in '000)
Available for sale securities
Government of Pakistan Sukuk
Government of Pakistan XVIII At Maturity Bi-annually 5.59% 6,040,936
Government of Pakistan XIX At Maturity Bi-annually 5.24% 5,904,326
Government of Pakistan Ijarah Sukuk - XVI At Maturity Bi-annually Cut off yield of 6M T-Bills minus 50 bps 4,000,000
Islamic Republic of Pakistan 2019 - Sukuk At Maturity Bi-annually 6.75% 1,104,173
Islamic Republic of Pakistan 2021 - Sukuk At Maturity Bi-annually 5.50% 2,052,838
19,102,273
Government of Pakistan - Eurobonds
Islamic Republic of Pakistan - 2019 - Eurobond At Maturity Bi-annually 7.250% 2,203,012
Islamic Republic of Pakistan - 2019 - Eurobond At Maturity Bi-annually 6.750% 232,086
Islamic Republic of Pakistan - 2024 - Eurobond At Maturity Bi-annually 8.250% 8,713,659
Islamic Republic of Pakistan - 2025 - Eurobond At Maturity Bi-annually 8.250% 4,158,324
Islamic Republic of Pakistan - 2027 - Eurobond At Maturity Bi-annually 6.875% 1,461,429
16,768,510
Foreign bonds - sovereign
Angola 2019 At Maturity Quarterly 7.000% 316,848
Arab Republic of Egypt 2020 At Maturity Bi-annually 5.750% 818,000
Arab Republic of Egypt 2025 At Maturity Bi-annually 5.880% 885,546
Government of Dubai Bond 2020 At Maturity Bi-annually 7.750% 1,654,268
Government of Dubai Bond 2022 At Maturity Quarterly 6.450% 1,467,526
Kingdom of Bahrain Bond 2020 At Maturity Bi-annually 5.500% 1,150,637
Kingdom of Bahrain Bond 2026 At Maturity Bi-annually 7.000% 2,809,685
Kingdom of Jordan 2026 At Maturity Bi-annually 6.125% 1,428,591
Kingdom of Jordan 2027 At Maturity Bi-annually 5.750% 441,478
Republic of Kenya At Maturity Bi-annually 5.875% 1,587,223
Republic of Nigeria 2023 At Maturity Bi-annually 6.375% 1,091,132
Kingdom of Oman 2026 At Maturity Bi-annually 5.255% 885,139
Republic of Portugal 2024 At Maturity Bi-annually 5.125% 495,775
Republic of Sri Lanka Bond 2020 At Maturity Bi-annually 6.250% 1,086,840
Republic of Sri Lanka Bond 2021 At Maturity Bi-annually 6.250% 864,236
Republic of Sri Lanka Bond 2022 At Maturity Bi-annually 5.875% 1,420,372
Republic of Sri Lanka Bond 2026 At Maturity Bi-annually 6.825% 877,207
Republic of Turkey 2022 At Maturity Bi-annually 6.250% 1,892,918
Republic of Turkey 2026 At Maturity Bi-annually 4.875% 551,549
Republic of Vietnam At Maturity Bi-annually 4.800% 330,870
State of Qatar Bond 2030 At Maturity Bi-annually 9.750% 2,770,873
Turkey Sukuks 2021 At Maturity Bi-annually 4.251% 44,167
United Republic of Tanzania At Maturity Bi-annually 7.452% 1,251,809
UK Government 2018 At Maturity Bi-annually 1.250% 754,726
UK Government 2018 At Maturity Bi-annually 1.000% 747,113
UK Government 2018 At Maturity Bi-annually 0.000% 3,130,171
UK Government 2018 At Maturity Bi-annually 5.000% 2,903,627
Abu Dhabi Government 2027 At Maturity Bi-annually 3.125% 552,656
Abu Dhabi Government 2018 At Maturity Bi-annually 1.000% 750,385
Azerbaijan 2032 At Maturity Bi-annually 3.500% 473,543
Counsel of Europe Develepment Bank 2022 At Maturity Bi-annually 0.625% 892,596
State of Qatar Bond 2022 At Maturity Bi-annually 3.250% 327,321
Republic of Zambia2022 At Maturity Bi-annually 5.375% 738,523
Sultanate of Oman 2024 At Maturity Bi-annually 4.397% 333,889
Sultanate of Oman 2027 At Maturity Bi-annually 5.375% 113,912
US Government Bonds 2026 At Maturity Bi-annually 1.500% 651,554
38,492,705
Investee
Terms of Redemption
Rate of Interest / ProfitOutstanding
Amount
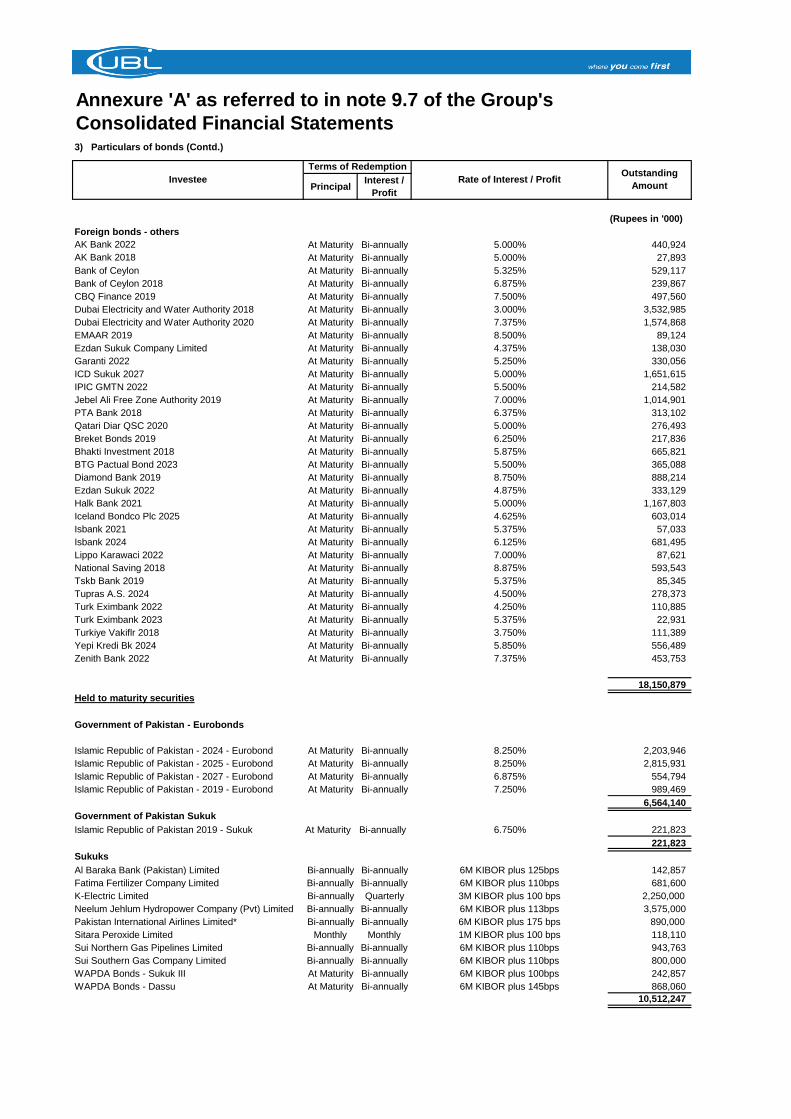
Annexure 'A' as referred to in note 9.7 of the Group's
Consolidated Financial Statements
PrincipalInterest /
Profit
(Rupees in '000)
Foreign bonds - others
AK Bank 2022 At Maturity Bi-annually 5.000% 440,924
AK Bank 2018 At Maturity Bi-annually 5.000% 27,893
Bank of Ceylon At Maturity Bi-annually 5.325% 529,117
Bank of Ceylon 2018 At Maturity Bi-annually 6.875% 239,867
CBQ Finance 2019 At Maturity Bi-annually 7.500% 497,560
Dubai Electricity and Water Authority 2018 At Maturity Bi-annually 3.000% 3,532,985
Dubai Electricity and Water Authority 2020 At Maturity Bi-annually 7.375% 1,574,868
EMAAR 2019 At Maturity Bi-annually 8.500% 89,124
Ezdan Sukuk Company Limited At Maturity Bi-annually 4.375% 138,030
Garanti 2022 At Maturity Bi-annually 5.250% 330,056
ICD Sukuk 2027 At Maturity Bi-annually 5.000% 1,651,615
IPIC GMTN 2022 At Maturity Bi-annually 5.500% 214,582
Jebel Ali Free Zone Authority 2019 At Maturity Bi-annually 7.000% 1,014,901
PTA Bank 2018 At Maturity Bi-annually 6.375% 313,102
Qatari Diar QSC 2020 At Maturity Bi-annually 5.000% 276,493
Breket Bonds 2019 At Maturity Bi-annually 6.250% 217,836
Bhakti Investment 2018 At Maturity Bi-annually 5.875% 665,821
BTG Pactual Bond 2023 At Maturity Bi-annually 5.500% 365,088
Diamond Bank 2019 At Maturity Bi-annually 8.750% 888,214
Ezdan Sukuk 2022 At Maturity Bi-annually 4.875% 333,129
Halk Bank 2021 At Maturity Bi-annually 5.000% 1,167,803
Iceland Bondco Plc 2025 At Maturity Bi-annually 4.625% 603,014
Isbank 2021 At Maturity Bi-annually 5.375% 57,033
Isbank 2024 At Maturity Bi-annually 6.125% 681,495
Lippo Karawaci 2022 At Maturity Bi-annually 7.000% 87,621
National Saving 2018 At Maturity Bi-annually 8.875% 593,543
Tskb Bank 2019 At Maturity Bi-annually 5.375% 85,345
Tupras A.S. 2024 At Maturity Bi-annually 4.500% 278,373
Turk Eximbank 2022 At Maturity Bi-annually 4.250% 110,885
Turk Eximbank 2023 At Maturity Bi-annually 5.375% 22,931
Turkiye Vakiflr 2018 At Maturity Bi-annually 3.750% 111,389
Yepi Kredi Bk 2024 At Maturity Bi-annually 5.850% 556,489
Zenith Bank 2022 At Maturity Bi-annually 7.375% 453,753
18,150,879
Held to maturity securities
Government of Pakistan - Eurobonds
Islamic Republic of Pakistan - 2024 - Eurobond At Maturity Bi-annually 8.250% 2,203,946
Islamic Republic of Pakistan - 2025 - Eurobond At Maturity Bi-annually 8.250% 2,815,931
Islamic Republic of Pakistan - 2027 - Eurobond At Maturity Bi-annually 6.875% 554,794
Islamic Republic of Pakistan - 2019 - Eurobond At Maturity Bi-annually 7.250% 989,469
6,564,140
Government of Pakistan Sukuk
Islamic Republic of Pakistan 2019 - Sukuk At Maturity Bi-annually 6.750% 221,823
221,823
Sukuks
Al Baraka Bank (Pakistan) Limited Bi-annually Bi-annually 6M KIBOR plus 125bps 142,857
Fatima Fertilizer Company Limited Bi-annually Bi-annually 6M KIBOR plus 110bps 681,600
K-Electric Limited Bi-annually Quarterly 3M KIBOR plus 100 bps 2,250,000
Neelum Jehlum Hydropower Company (Pvt) Limited Bi-annually Bi-annually 6M KIBOR plus 113bps 3,575,000
Pakistan International Airlines Limited* Bi-annually Bi-annually 6M KIBOR plus 175 bps 890,000
Sitara Peroxide Limited Monthly Monthly 1M KIBOR plus 100 bps 118,110
Sui Northern Gas Pipelines Limited Bi-annually Bi-annually 6M KIBOR plus 110bps 943,763
Sui Southern Gas Company Limited Bi-annually Bi-annually 6M KIBOR plus 110bps 800,000
WAPDA Bonds - Sukuk III At Maturity Bi-annually 6M KIBOR plus 100bps 242,857
WAPDA Bonds - Dassu At Maturity Bi-annually 6M KIBOR plus 145bps 868,060
10,512,247
Investee
Terms of Redemption
Rate of Interest / ProfitOutstanding
Amount
3) Particulars of bonds (Contd.)
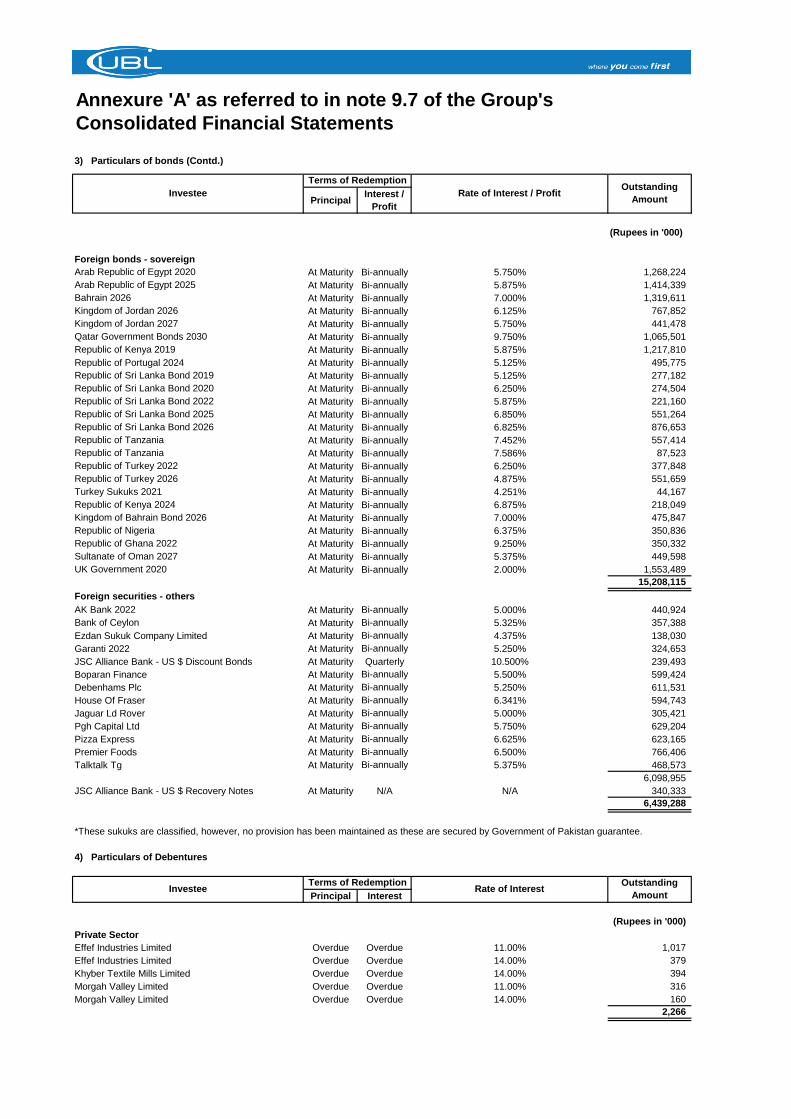
Annexure 'A' as referred to in note 9.7 of the Group's
Consolidated Financial Statements
PrincipalInterest /
Profit
(Rupees in '000)
Foreign bonds - sovereign
Arab Republic of Egypt 2020 At Maturity Bi-annually 5.750% 1,268,224
Arab Republic of Egypt 2025 At Maturity Bi-annually 5.875% 1,414,339
Bahrain 2026 At Maturity Bi-annually 7.000% 1,319,611
Kingdom of Jordan 2026 At Maturity Bi-annually 6.125% 767,852
Kingdom of Jordan 2027 At Maturity Bi-annually 5.750% 441,478
Qatar Government Bonds 2030 At Maturity Bi-annually 9.750% 1,065,501
Republic of Kenya 2019 At Maturity Bi-annually 5.875% 1,217,810
Republic of Portugal 2024 At Maturity Bi-annually 5.125% 495,775
Republic of Sri Lanka Bond 2019 At Maturity Bi-annually 5.125% 277,182
Republic of Sri Lanka Bond 2020 At Maturity Bi-annually 6.250% 274,504
Republic of Sri Lanka Bond 2022 At Maturity Bi-annually 5.875% 221,160
Republic of Sri Lanka Bond 2025 At Maturity Bi-annually 6.850% 551,264
Republic of Sri Lanka Bond 2026 At Maturity Bi-annually 6.825% 876,653
Republic of Tanzania At Maturity Bi-annually 7.452% 557,414
Republic of Tanzania At Maturity Bi-annually 7.586% 87,523
Republic of Turkey 2022 At Maturity Bi-annually 6.250% 377,848
Republic of Turkey 2026 At Maturity Bi-annually 4.875% 551,659
Turkey Sukuks 2021 At Maturity Bi-annually 4.251% 44,167
Republic of Kenya 2024 At Maturity Bi-annually 6.875% 218,049
Kingdom of Bahrain Bond 2026 At Maturity Bi-annually 7.000% 475,847
Republic of Nigeria At Maturity Bi-annually 6.375% 350,836
Republic of Ghana 2022 At Maturity Bi-annually 9.250% 350,332
Sultanate of Oman 2027 At Maturity Bi-annually 5.375% 449,598
UK Government 2020 At Maturity Bi-annually 2.000% 1,553,489
15,208,115
Foreign securities - others
AK Bank 2022 At Maturity Bi-annually 5.000% 440,924
Bank of Ceylon At Maturity Bi-annually 5.325% 357,388
Ezdan Sukuk Company Limited At Maturity Bi-annually 4.375% 138,030
Garanti 2022 At Maturity Bi-annually 5.250% 324,653
JSC Alliance Bank - US $ Discount Bonds At Maturity Quarterly 10.500% 239,493
Boparan Finance At Maturity Bi-annually 5.500% 599,424
Debenhams Plc At Maturity Bi-annually 5.250% 611,531
House Of Fraser At Maturity Bi-annually 6.341% 594,743
Jaguar Ld Rover At Maturity Bi-annually 5.000% 305,421
Pgh Capital Ltd At Maturity Bi-annually 5.750% 629,204
Pizza Express At Maturity Bi-annually 6.625% 623,165
Premier Foods At Maturity Bi-annually 6.500% 766,406
Talktalk Tg At Maturity Bi-annually 5.375% 468,573
6,098,955
JSC Alliance Bank - US $ Recovery Notes At Maturity N/A N/A 340,333
6,439,288
*These sukuks are classified, however, no provision has been maintained as these are secured by Government of Pakistan guarantee.
4) Particulars of Debentures
Principal Interest
(Rupees in '000)
Private Sector
Effef Industries Limited Overdue Overdue 11.00% 1,017
Effef Industries Limited Overdue Overdue 14.00% 379
Khyber Textile Mills Limited Overdue Overdue 14.00% 394
Morgah Valley Limited Overdue Overdue 11.00% 316
Morgah Valley Limited Overdue Overdue 14.00% 160
2,266
Investee
Terms of Redemption
Rate of Interest / ProfitOutstanding
Amount
InvesteeTerms of Redemption
Rate of InterestOutstanding
Amount
3) Particulars of bonds (Contd.)
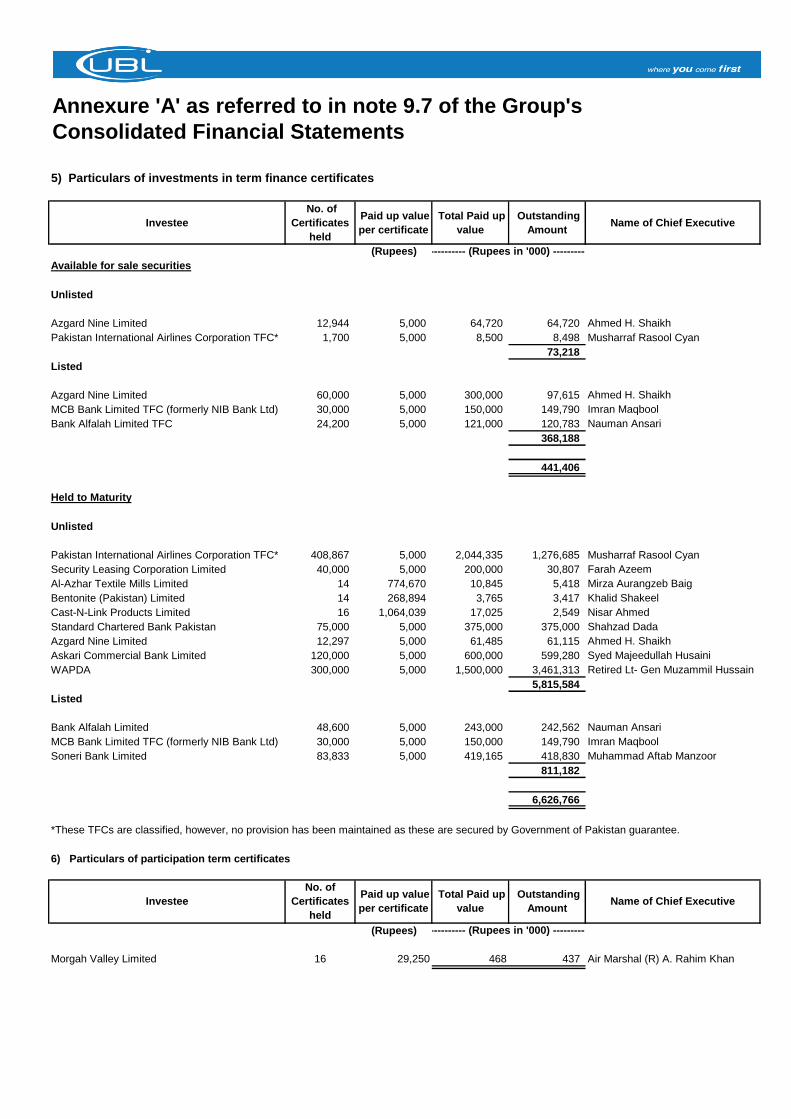
Annexure 'A' as referred to in note 9.7 of the Group's
Consolidated Financial Statements
5) Particulars of investments in term finance certificates
Investee
No. of
Certificates
held
Paid up value
per certificate
Total Paid up
value
Outstanding
Amount Name of Chief Executive
(Rupees)
Available for sale securities
Unlisted
Azgard Nine Limited 12,944 5,000 64,720 64,720 Ahmed H. Shaikh
Pakistan International Airlines Corporation TFC* 1,700 5,000 8,500 8,498 Musharraf Rasool Cyan
73,218
Listed
Azgard Nine Limited 60,000 5,000 300,000 97,615 Ahmed H. Shaikh
MCB Bank Limited TFC (formerly NIB Bank Ltd) 30,000 5,000 150,000 149,790 Imran Maqbool
Bank Alfalah Limited TFC 24,200 5,000 121,000 120,783 Nauman Ansari
368,188
441,406
Held to Maturity
Unlisted
Pakistan International Airlines Corporation TFC* 408,867 5,000 2,044,335 1,276,685 Musharraf Rasool Cyan
Security Leasing Corporation Limited 40,000 5,000 200,000 30,807 Farah Azeem
Al-Azhar Textile Mills Limited 14 774,670 10,845 5,418 Mirza Aurangzeb Baig
Bentonite (Pakistan) Limited 14 268,894 3,765 3,417 Khalid Shakeel
Cast-N-Link Products Limited 16 1,064,039 17,025 2,549 Nisar Ahmed
Standard Chartered Bank Pakistan 75,000 5,000 375,000 375,000 Shahzad Dada
Azgard Nine Limited 12,297 5,000 61,485 61,115 Ahmed H. Shaikh
Askari Commercial Bank Limited 120,000 5,000 600,000 599,280 Syed Majeedullah Husaini
WAPDA 300,000 5,000 1,500,000 3,461,313 Retired Lt- Gen Muzammil Hussain
5,815,584
Listed
Bank Alfalah Limited 48,600 5,000 243,000 242,562 Nauman Ansari
MCB Bank Limited TFC (formerly NIB Bank Ltd) 30,000 5,000 150,000 149,790 Imran Maqbool
Soneri Bank Limited 83,833 5,000 419,165 418,830 Muhammad Aftab Manzoor
811,182
6,626,766
*These TFCs are classified, however, no provision has been maintained as these are secured by Government of Pakistan guarantee.
6) Particulars of participation term certificates
(Rupees)
Morgah Valley Limited 16 29,250 468 437 Air Marshal (R) A. Rahim Khan
Name of Chief Executive
------------- (Rupees in '000) -------------
------------- (Rupees in '000) -------------
Investee
No. of
Certificates
held
Paid up value
per certificate
Total Paid up
value
Outstanding
Amount
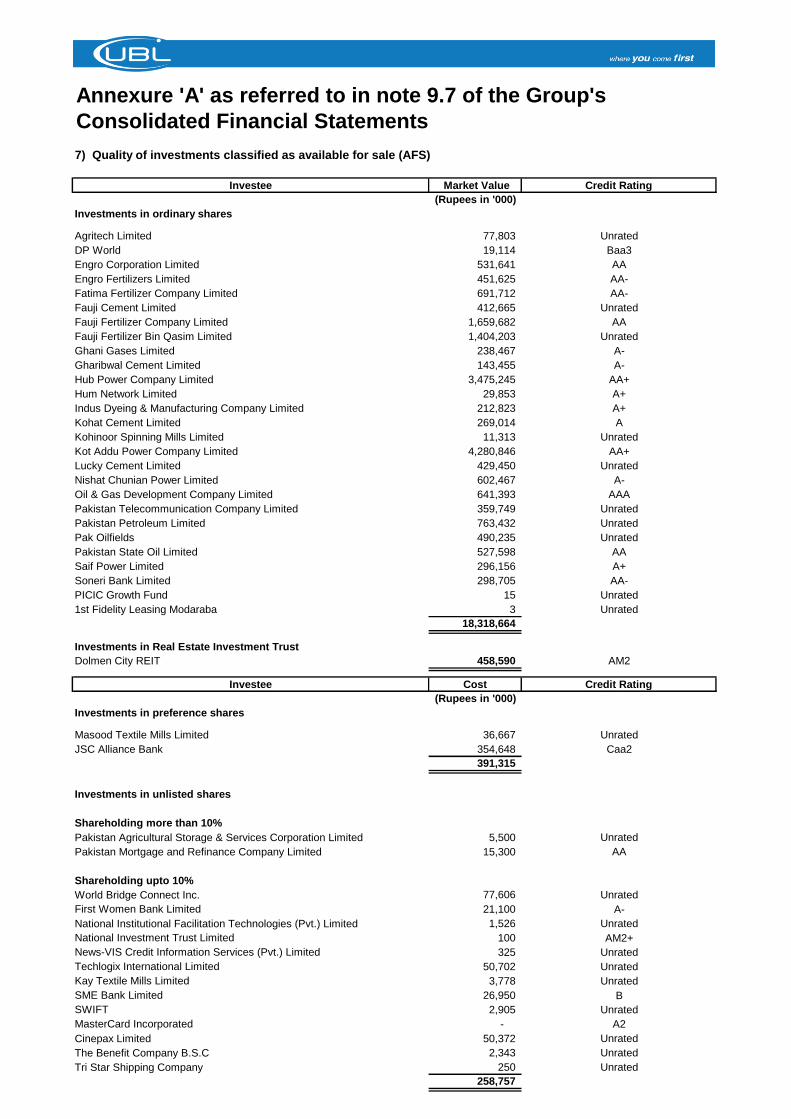
Annexure 'A' as referred to in note 9.7 of the Group's
Consolidated Financial Statements
7) Quality of investments classified as available for sale (AFS)
Investee Market Value Credit Rating
(Rupees in '000)
Investments in ordinary shares
Agritech Limited 77,803 Unrated
DP World 19,114 Baa3
Engro Corporation Limited 531,641 AA
Engro Fertilizers Limited 451,625 AA-
Fatima Fertilizer Company Limited 691,712 AA-
Fauji Cement Limited 412,665 Unrated
Fauji Fertilizer Company Limited 1,659,682 AA
Fauji Fertilizer Bin Qasim Limited 1,404,203 Unrated
Ghani Gases Limited 238,467 A-
Gharibwal Cement Limited 143,455 A-
Hub Power Company Limited 3,475,245 AA+
Hum Network Limited 29,853 A+
Indus Dyeing & Manufacturing Company Limited 212,823 A+
Kohat Cement Limited 269,014 A
Kohinoor Spinning Mills Limited 11,313 Unrated
Kot Addu Power Company Limited 4,280,846 AA+
Lucky Cement Limited 429,450 Unrated
Nishat Chunian Power Limited 602,467 A-
Oil & Gas Development Company Limited 641,393 AAA
Pakistan Telecommunication Company Limited 359,749 Unrated
Pakistan Petroleum Limited 763,432 Unrated
Pak Oilfields 490,235 Unrated
Pakistan State Oil Limited 527,598 AA
Saif Power Limited 296,156 A+
Soneri Bank Limited 298,705 AA-
PICIC Growth Fund 15 Unrated
1st Fidelity Leasing Modaraba 3 Unrated
18,318,664
Investments in Real Estate Investment Trust
Dolmen City REIT 458,590 AM2
Investee Cost Credit Rating
(Rupees in '000)
Investments in preference shares
Masood Textile Mills Limited 36,667 Unrated
JSC Alliance Bank 354,648 Caa2
391,315
Investments in unlisted shares
Shareholding more than 10%
Pakistan Agricultural Storage & Services Corporation Limited 5,500 Unrated
Pakistan Mortgage and Refinance Company Limited 15,300 AA
Shareholding upto 10%
World Bridge Connect Inc. 77,606 Unrated
First Women Bank Limited 21,100 A-
National Institutional Facilitation Technologies (Pvt.) Limited 1,526 Unrated
National Investment Trust Limited 100 AM2+
News-VIS Credit Information Services (Pvt.) Limited 325 Unrated
Techlogix International Limited 50,702 Unrated
Kay Textile Mills Limited 3,778 Unrated
SME Bank Limited 26,950 B
SWIFT 2,905 Unrated
MasterCard Incorporated - A2
Cinepax Limited 50,372 Unrated
The Benefit Company B.S.C 2,343 Unrated
Tri Star Shipping Company 250 Unrated
258,757

Annexure 'A' as referred to in note 9.7 of the Group's
Consolidated Financial Statements
7) Quality of investments classified as available for sale (AFS) (Contd.)
Particulars Market Value Credit Rating
(Rupees in '000)
Federal Government Securities
Market Treasury Bills 302,515,945 Unrated - Government Securities
Pakistan Investment Bonds 235,845,961 Unrated - Government Securities
538,361,906
Government of Pakistan Ijarah Sukuk
Government of Pakistan Ijarah Sukuk - XVIII 6,044,400 Score7
Government of Pakistan Ijarah Sukuk - XIX 5,896,460 Score7
Government of Pakistan Ijarah Sukuk - XVI 4,028,400 Score7
Islamic Republic of Pakistan 2019 - Sukuk 1,145,955 Score7
Islamic Republic of Pakistan 2021 - Sukuk 2,044,051 Score7
19,159,266
Government of Pakistan - Euro bond
Islamic Republic of Pakistan - 2019 - Euro Bond 2,255,694 Score7
Islamic Republic of Pakistan - 2019 - Euro Bond 230,353 Score7
Islamic Republic of Pakistan - 2024 - Euro Bond 9,190,342 Score7
Islamic Republic of Pakistan - 2025 - Euro Bond 4,182,661 Score7
Islamic Republic of Pakistan - 2027 - Euro Bond 1,466,279 Score7
17,325,329
Foreign bonds - sovereign
Angola 2019 323,224 Score5
Arab Republic of Egypt 2020 845,917 Score6
Arab Republic of Egypt 2025 919,844 Score6
Government of Dubai Bond 2020 1,729,796 Score2
Government of Dubai Bond 2022 1,558,080 Score2
Kingdom of Bahrain Bond 2020 1,155,336 Score4
Kingdom of Bahrain Bond 2026 2,817,349 Score4
Kingdom of Jordan 2026 1,431,548 Score5
Kingdom of Jordan 2027 442,003 Score5
Republic of Kenya 1,636,715 Score6
Republic of Nigeria 2023 1,137,490 Score5
Kingdom of Oman 2026 891,562 Score3
Republic of Portugal 2024 521,900 Unrated
Republic of Sri Lanka Bond 2020 1,128,396 Score6
Republic of Sri Lanka Bond 2021 893,783 Score5
Republic of Sri Lanka Bond 2022 1,507,540 Score6
Republic of Sri Lanka Bond 2026 903,386 Score6
Republic of Turkey 2022 1,925,895 Score4
Republic of Turkey 2026 545,188 Score4
Republic of Vietnam 354,212 Score5
State of Qatar Bond 2030 2,893,753 Score3
Turkey Sukuks 2021 44,639 Score4
United Republic of Tanzania 1,299,595 Score6
UK Government 2018 753,393 AA
UK Government 2018 749,647 AA
UK Government 2018 3,130,271 AA
UK Government 2018 2,901,677 AA
Abu Dhabi Government 2027 545,066 AA
Abu Dhabi Government 2018 749,647 AA
Azerbaijan 2032 488,057 BB+
Counsel of Europe Development Bank 2022 882,459 AA+
State of Qatar Bond 2022 321,878 AA-
Republic of Zambia 2022 712,551 B
Sultanate of Oman 2024 332,586 BBB-
Sultanate of Oman 2027 113,486 BBB-
US Government Bonds 2026 619,806 AAA
39,207,675
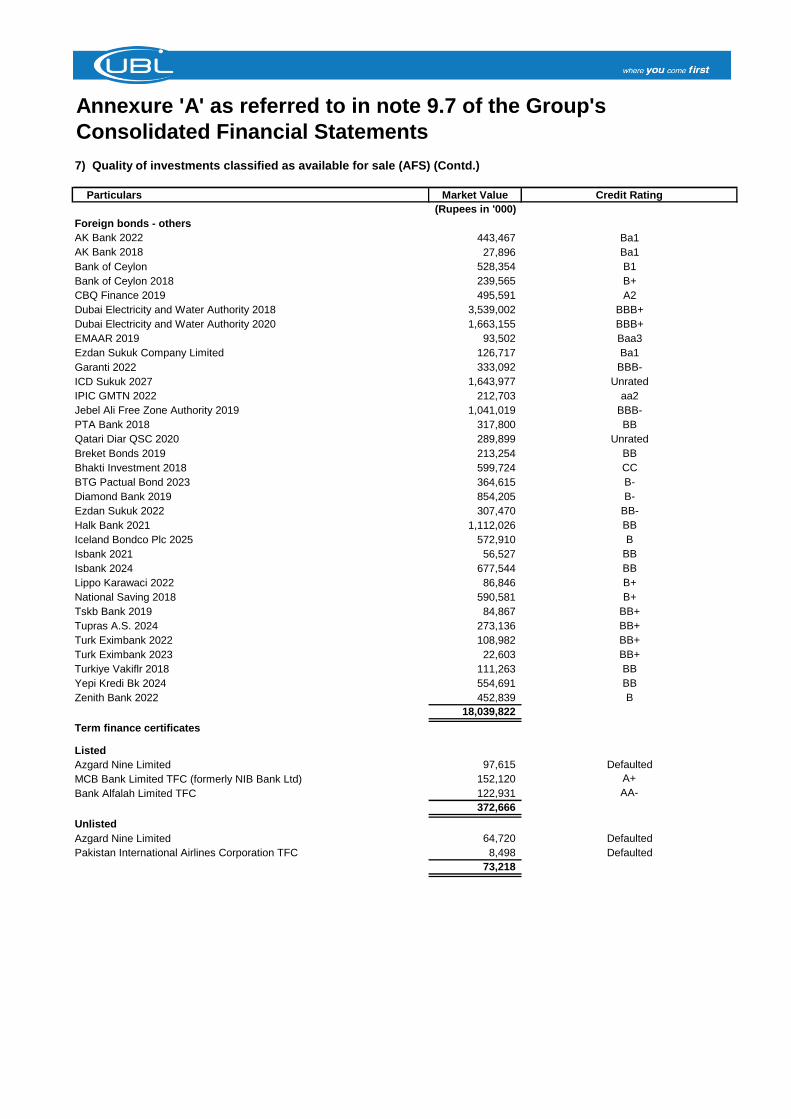
Annexure 'A' as referred to in note 9.7 of the Group's
Consolidated Financial Statements
7) Quality of investments classified as available for sale (AFS) (Contd.)
Particulars Market Value Credit Rating
(Rupees in '000)
Foreign bonds - others
AK Bank 2022 443,467 Ba1
AK Bank 2018 27,896 Ba1
Bank of Ceylon 528,354 B1
Bank of Ceylon 2018 239,565 B+
CBQ Finance 2019 495,591 A2
Dubai Electricity and Water Authority 2018 3,539,002 BBB+
Dubai Electricity and Water Authority 2020 1,663,155 BBB+
EMAAR 2019 93,502 Baa3
Ezdan Sukuk Company Limited 126,717 Ba1
Garanti 2022 333,092 BBB-
ICD Sukuk 2027 1,643,977 Unrated
IPIC GMTN 2022 212,703 aa2
Jebel Ali Free Zone Authority 2019 1,041,019 BBB-
PTA Bank 2018 317,800 BB
Qatari Diar QSC 2020 289,899 Unrated
Breket Bonds 2019 213,254 BB
Bhakti Investment 2018 599,724 CC
BTG Pactual Bond 2023 364,615 B-
Diamond Bank 2019 854,205 B-
Ezdan Sukuk 2022 307,470 BB-
Halk Bank 2021 1,112,026 BB
Iceland Bondco Plc 2025 572,910 B
Isbank 2021 56,527 BB
Isbank 2024 677,544 BB
Lippo Karawaci 2022 86,846 B+
National Saving 2018 590,581 B+
Tskb Bank 2019 84,867 BB+
Tupras A.S. 2024 273,136 BB+
Turk Eximbank 2022 108,982 BB+
Turk Eximbank 2023 22,603 BB+
Turkiye Vakiflr 2018 111,263 BB
Yepi Kredi Bk 2024 554,691 BB
Zenith Bank 2022 452,839 B
18,039,822
Term finance certificates
Listed
Azgard Nine Limited 97,615 Defaulted
MCB Bank Limited TFC (formerly NIB Bank Ltd) 152,120 A+
Bank Alfalah Limited TFC 122,931 AA-
372,666
Unlisted
Azgard Nine Limited 64,720 Defaulted
Pakistan International Airlines Corporation TFC 8,498 Defaulted
73,218
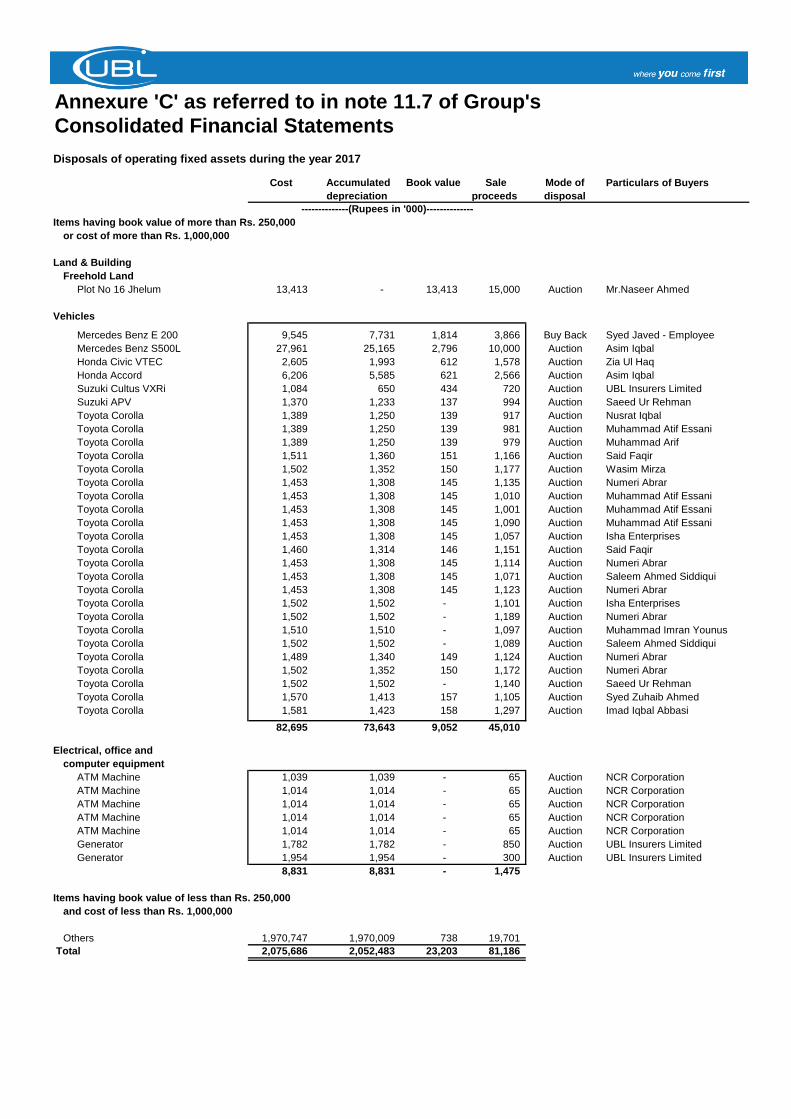
Disposals of operating fixed assets during the year 2017
Cost Accumulated
depreciation
Book value Sale
proceeds
Mode of
disposal
Particulars of Buyers
or cost of more than Rs. 1,000,000
Land & Building
Freehold Land
Plot No 16 Jhelum 13,413 - 13,413 15,000 Auction Mr.Naseer Ahmed
Vehicles
Mercedes Benz E 200 9,545 7,731 1,814 3,866 Buy Back Syed Javed - Employee
Mercedes Benz S500L 27,961 25,165 2,796 10,000 Auction Asim Iqbal
Honda Civic VTEC 2,605 1,993 612 1,578 Auction Zia Ul Haq
### Honda Accord 6,206 5,585 621 2,566 Auction Asim Iqbal
### Suzuki Cultus VXRi 1,084 650 434 720 Auction UBL Insurers Limited
### Suzuki APV 1,370 1,233 137 994 Auction Saeed Ur Rehman
### Toyota Corolla 1,389 1,250 139 917 Auction Nusrat Iqbal
### Toyota Corolla 1,389 1,250 139 981 Auction Muhammad Atif Essani
### Toyota Corolla 1,389 1,250 139 979 Auction Muhammad Arif
### Toyota Corolla 1,511 1,360 151 1,166 Auction Said Faqir
### Toyota Corolla 1,502 1,352 150 1,177 Auction Wasim Mirza
Toyota Corolla 1,453 1,308 145 1,135 Auction Numeri Abrar
Toyota Corolla 1,453 1,308 145 1,010 Auction Muhammad Atif Essani
Toyota Corolla 1,453 1,308 145 1,001 Auction Muhammad Atif Essani
Toyota Corolla 1,453 1,308 145 1,090 Auction Muhammad Atif Essani
Toyota Corolla 1,453 1,308 145 1,057 Auction Isha Enterprises
### Toyota Corolla 1,460 1,314 146 1,151 Auction Said Faqir
### Toyota Corolla 1,453 1,308 145 1,114 Auction Numeri Abrar
### Toyota Corolla 1,453 1,308 145 1,071 Auction Saleem Ahmed Siddiqui
### Toyota Corolla 1,453 1,308 145 1,123 Auction Numeri Abrar
### Toyota Corolla 1,502 1,502 - 1,101 Auction Isha Enterprises
### Toyota Corolla 1,502 1,502 - 1,189 Auction Numeri Abrar
### Toyota Corolla 1,510 1,510 - 1,097 Auction Muhammad Imran Younus
### Toyota Corolla 1,502 1,502 - 1,089 Auction Saleem Ahmed Siddiqui
### Toyota Corolla 1,489 1,340 149 1,124 Auction Numeri Abrar
### Toyota Corolla 1,502 1,352 150 1,172 Auction Numeri Abrar
### Toyota Corolla 1,502 1,502 - 1,140 Auction Saeed Ur Rehman
### Toyota Corolla 1,570 1,413 157 1,105 Auction Syed Zuhaib Ahmed
### Toyota Corolla 1,581 1,423 158 1,297 Auction Imad Iqbal Abbasi
82,695 73,643 9,052 45,010
Electrical, office and
computer equipment
ATM Machine 1,039 1,039 - 65 Auction NCR Corporation
ATM Machine 1,014 1,014 - 65 Auction NCR Corporation
ATM Machine 1,014 1,014 - 65 Auction NCR Corporation
ATM Machine 1,014 1,014 - 65 Auction NCR Corporation
ATM Machine 1,014 1,014 - 65 Auction NCR Corporation
Generator 1,782 1,782 - 850 Auction UBL Insurers Limited
Generator 1,954 1,954 - 300 Auction UBL Insurers Limited
8,831 8,831 - 1,475
Items having book value of less than Rs. 250,000
and cost of less than Rs. 1,000,000
Others 1,970,747 1,970,009 738 19,701
Total 2,075,686 2,052,483 23,203 81,186
Annexure 'C' as referred to in note 11.7 of Group's
Consolidated Financial Statements
--------------(Rupees in '000)--------------
Items having book value of more than Rs. 250,000
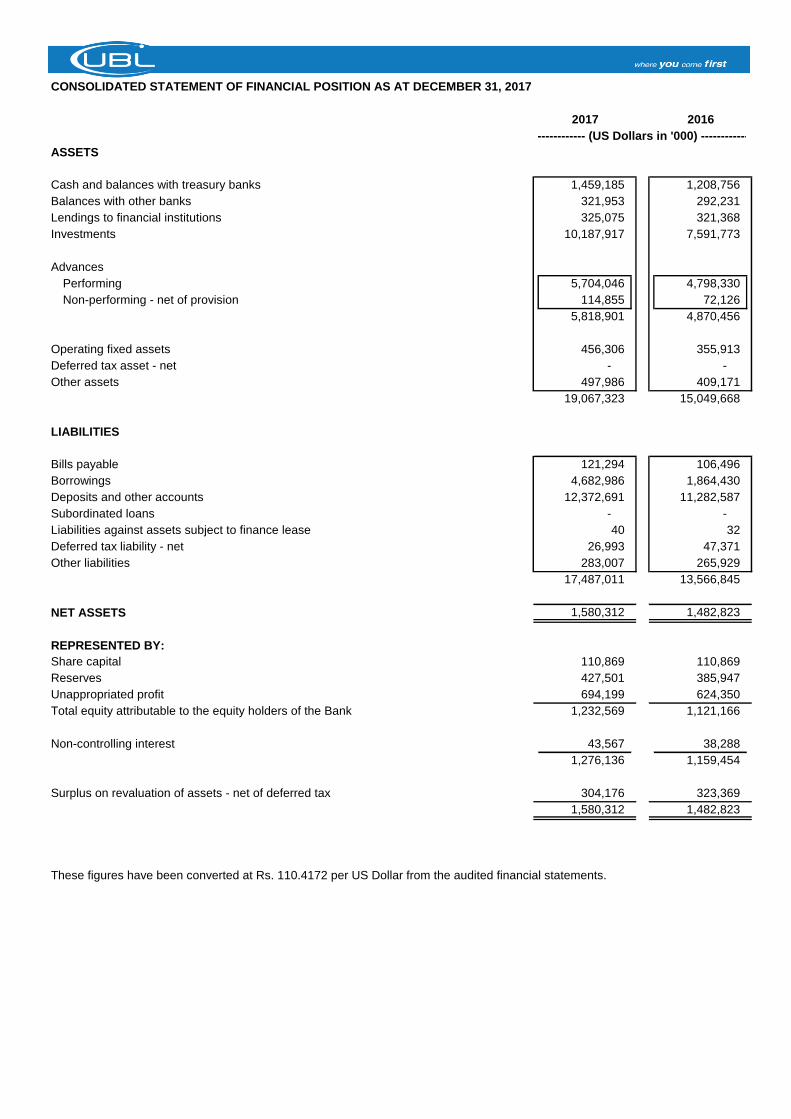
CONSOLIDATED STATEMENT OF FINANCIAL POSITION AS AT DECEMBER 31, 2017
2017 2016
ASSETS
Cash and balances with treasury banks 1,459,185 1,208,756
Balances with other banks 321,953 292,231
Lendings to financial institutions 325,075 321,368
Investments 10,187,917 7,591,773
Advances
Performing 5,704,046 4,798,330
Non-performing - net of provision 114,855 72,126
5,818,901 4,870,456
Operating fixed assets 456,306 355,913
Deferred tax asset - net - -
Other assets 497,986 409,171
19,067,323 15,049,668
LIABILITIES
Bills payable 121,294 106,496
Borrowings 4,682,986 1,864,430
Deposits and other accounts 12,372,691 11,282,587
Subordinated loans - -
Liabilities against assets subject to finance lease 40 32
Deferred tax liability - net 26,993 47,371
Other liabilities 283,007 265,929
17,487,011 13,566,845
NET ASSETS 1,580,312 1,482,823
REPRESENTED BY:
Share capital 110,869 110,869
Reserves 427,501 385,947
Unappropriated profit 694,199 624,350
Total equity attributable to the equity holders of the Bank 1,232,569 1,121,166
Non-controlling interest 43,567 38,288
1,276,136 1,159,454
Surplus on revaluation of assets - net of deferred tax 304,176 323,369
1,580,312 1,482,823
These figures have been converted at Rs. 110.4172 per US Dollar from the audited financial statements.
------------- (US Dollars in '000) -------------
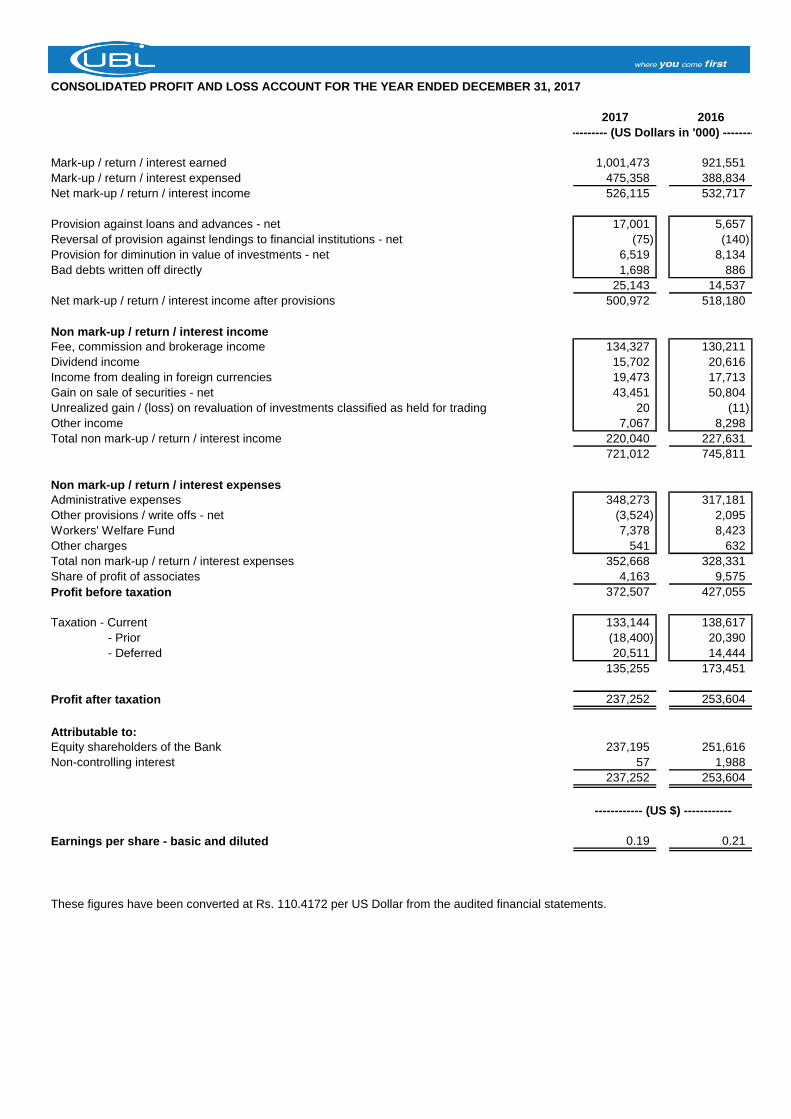
CONSOLIDATED PROFIT AND LOSS ACCOUNT FOR THE YEAR ENDED DECEMBER 31, 2017
2017 2016
Mark-up / return / interest earned 1,001,473 921,551
Mark-up / return / interest expensed 475,358 388,834
Net mark-up / return / interest income 526,115 532,717
Provision against loans and advances - net 17,001 5,657
Reversal of provision against lendings to financial institutions - net (75) (140)
Provision for diminution in value of investments - net 6,519 8,134
Bad debts written off directly 1,698 886
25,143 14,537
Net mark-up / return / interest income after provisions 500,972 518,180
Non mark-up / return / interest income
Fee, commission and brokerage income 134,327 130,211
Dividend income 15,702 20,616
Income from dealing in foreign currencies 19,473 17,713
Gain on sale of securities - net 43,451 50,804
Unrealized gain / (loss) on revaluation of investments classified as held for trading 20 (11)
Other income 7,067 8,298
Total non mark-up / return / interest income 220,040 227,631
721,012 745,811
Non mark-up / return / interest expenses
Administrative expenses 348,273 317,181
Other provisions / write offs - net (3,524) 2,095
Workers' Welfare Fund 7,378 8,423
Other charges 541 632
Total non mark-up / return / interest expenses 352,668 328,331
Share of profit of associates 4,163 9,575
Profit before taxation 372,507 427,055
Taxation - Current 133,144 138,617
- Prior (18,400) 20,390
- Deferred 20,511 14,444
135,255 173,451
Profit after taxation 237,252 253,604
Attributable to:
Equity shareholders of the Bank 237,195 251,616
Non-controlling interest 57 1,988
237,252 253,604
Earnings per share - basic and diluted 0.19 0.21
These figures have been converted at Rs. 110.4172 per US Dollar from the audited financial statements.
--------- (US Dollars in '000) --------
------------ (US $) ------------


![Universal Business Language Version 2docs.oasis-open.org/ubl/cs1-UBL-2.1/UBL-2.1.pdf · OASIS Universal Business Language TC Chairs: Jon Bosak (bosak@pinax.com), Individual ... [UBL-2.1]](https://img.pdfslide.us/doc/110x75/5e7065bd965725432c6cc8bd/universal-business-language-version-2docsoasis-openorgublcs1-ubl-21ubl-21pdf.jpg)