Embed Size (px)
Citation preview
United Asia Pacific Infrastructure FundAnnual Report
for the financial year ended 31st December 2013

United Asia Pacific Infrastructure Fund(Constituted under a Trust Deed in the Republic of Singapore)
1
MANAGERUOB Asset Management LtdRegistered Address:80 Raffles PlaceUOB PlazaSingapore 048624Company Registration No. : 198600120Z
OPERATIONS ADDRESS80 Raffles Place#06-00, UOB Plaza 2Singapore 048624Tel: 1800 22 22 228
DIRECTORS OF UOB ASSET MANAGEMENTTerence Ong Sea EngCheo Chai HongThio Boon Kiat
TRUSTEE / REGISTRARHSBC Institutional Trust Services (Singapore) Limited21 Collyer Quay#10-02, HSBC BuildingSingapore 049320
CUSTODIANState Street Bank and Trust CompanyState Street Financial CenterOne Lincoln StreetBoston, Massachusetts 02111United States of America
AUDITORSPricewaterhouseCoopers LLP8 Cross Street#17-00, PWC BuildingSingapore 048424
SOLICITORS TO THE MANAGERTan Peng Chin LLC30 Raffles Place #11-00, Chevron HouseSingapore 048622
SOLICITORS TO THE TRUSTEEAllen & Gledhill LLPOne Marina Boulevard#28-00Singapore 018989
United Asia Pacific Infrastructure Fund(Constituted under a Trust Deed in the Republic of Singapore)
2
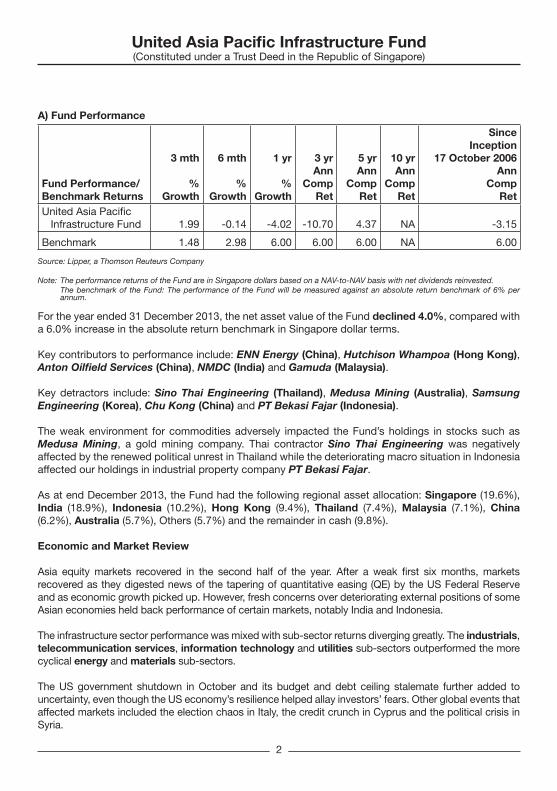
A) Fund Performance
Fund Performance/ Benchmark Returns
3 mth
% Growth
6 mth
%Growth
1 yr %
Growth
3 yr Ann
Comp Ret
5 yr Ann
Comp Ret
10 yr Ann
Comp Ret
Since Inception
17 October 2006 Ann
Comp Ret
United Asia Pacific Infrastructure Fund 1.99 -0.14 -4.02 -10.70 4.37 NA -3.15
Benchmark 1.48 2.98 6.00 6.00 6.00 NA 6.00
Source: Lipper, a Thomson Reuteurs Company
Note: The performance returns of the Fund are in Singapore dollars based on a NAV-to-NAV basis with net dividends reinvested. The benchmark of the Fund: The performance of the Fund will be measured against an absolute return benchmark of 6% per
annum.
For the year ended 31 December 2013, the net asset value of the Fund declined 4.0%, compared with a 6.0% increase in the absolute return benchmark in Singapore dollar terms.
Key contributors to performance include: ENN Energy (China), Hutchison Whampoa (Hong Kong), Anton Oilfield Services (China), NMDC (India) and Gamuda (Malaysia).
Key detractors include: Sino Thai Engineering (Thailand), Medusa Mining (Australia), Samsung Engineering (Korea), Chu Kong (China) and PT Bekasi Fajar (Indonesia).
The weak environment for commodities adversely impacted the Fund’s holdings in stocks such as Medusa Mining, a gold mining company. Thai contractor Sino Thai Engineering was negatively affected by the renewed political unrest in Thailand while the deteriorating macro situation in Indonesia affected our holdings in industrial property company PT Bekasi Fajar.
As at end December 2013, the Fund had the following regional asset allocation: Singapore (19.6%), India (18.9%), Indonesia (10.2%), Hong Kong (9.4%), Thailand (7.4%), Malaysia (7.1%), China (6.2%), Australia (5.7%), Others (5.7%) and the remainder in cash (9.8%).
Economic and Market Review
Asia equity markets recovered in the second half of the year. After a weak first six months, markets recovered as they digested news of the tapering of quantitative easing (QE) by the US Federal Reserve and as economic growth picked up. However, fresh concerns over deteriorating external positions of some Asian economies held back performance of certain markets, notably India and Indonesia.
The infrastructure sector performance was mixed with sub-sector returns diverging greatly. The industrials, telecommunication services, information technology and utilities sub-sectors outperformed the more cyclical energy and materials sub-sectors.
The US government shutdown in October and its budget and debt ceiling stalemate further added to uncertainty, even though the US economy’s resilience helped allay investors’ fears. Other global events that affected markets included the election chaos in Italy, the credit crunch in Cyprus and the political crisis in Syria.
United Asia Pacific Infrastructure Fund(Constituted under a Trust Deed in the Republic of Singapore)
3
In Asia, economic momentum stabilized in the middle of the year. After a growth scare in China mid-year the economy picked up momentum again. Market sentiment was lifted when the Chinese Premier Li Keqiang assured investors that China’s growth would not slip below 7 per cent last year, and the political leaders affirmed their commitment to wide-ranging reforms. Nonetheless, investors continue to dial back growth expectations for China.
The Asean and India markets were negatively impacted by concerns over their deteriorating current account positions, slower GDP growth and increased leverage. The Indonesian rupiah sold off sharply as investors feared a sudden withdrawal of liquidity and were worried over the country’s widening current account deficit, which was exacerbated by the weak global demand for commodities. The rupiah decline compounded weakness in the equity market. India was similarly hit by depreciation of the rupee, although the new central bank governor, a well-respected former IMF chief economist, managed to calm market fears with some concrete reform measures.
In the period under review, the Philippines was adversely impacted by typhoon Haiyan. Political protests in Thailand led to fears of delays in the country’s 2.1 trillion baht infrastructure bill. Doubts were also casted on Malaysia’s ability to spend on key infrastructure projects due to its reducing current account balances.
Outlook and Fund Strategy
The growth outlook for Asia ex-Japan looks to have stabilised, thanks to a broadening out of the economic recovery in the developed markets. This should in time bode well for Asian exports. However, the US Fed’s tapering of its asset purchase programme could keep markets volatile in the near term. In particular, some ASEAN markets and India are more vulnerable to capital outflows and currency depreciation, putting upward pressure on local interest rates.
In China, we see signs of growth stabilization. Following the Third Plenary session in November, China’s senior leadership announced its aim to achieve wide ranging economic and social reforms by 2020. The key points of focus include fiscal reform, factor price and market reforms, as well as providing a social safety net and government administration reforms. While these proposed reforms will take time to play out fundamentally and the implementation progress will be gradual, positive reform momentum should boost market confidence and sentiment. The challenges presented by a rebalancing of China’s economy remain.
The Fund continues to remain bottom-up in its stock selection. The Fund has been taking advantage of the negative macro environment to gain exposure to good quality companies at cheaper valuations. The Fund is also invested in companies with strong cash flow and balance sheets that are currently mispriced, some of which could potentially distribute special dividends. The Fund is positioned with a long term investment horizon and is therefore invested in companies that are among the leaders within their industry, generating high returns on their capital with competitive advantages reflected in their high margins.
United Asia Pacific Infrastructure Fund(Constituted under a Trust Deed in the Republic of Singapore)
4
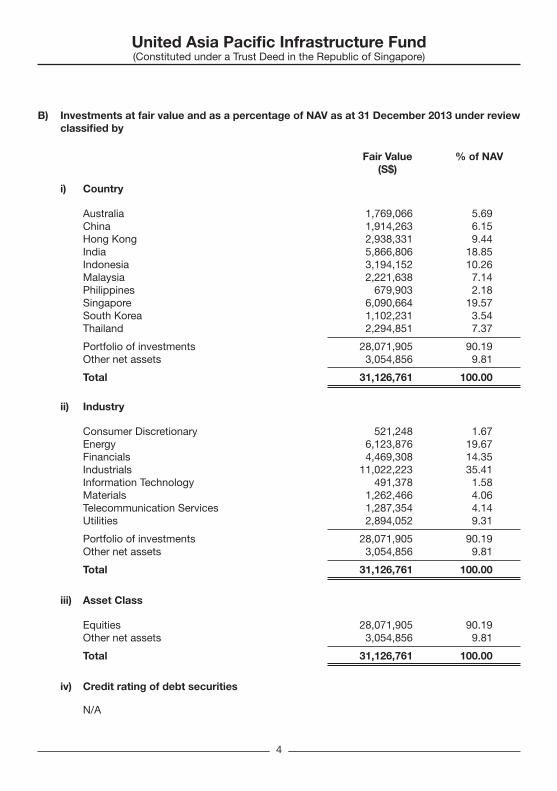
B) Investments at fair value and as a percentage of NAV as at 31 December 2013 under review classified by
Fair Value % of NAV (S$)
i) Country
Australia 1,769,066 5.69 China 1,914,263 6.15 Hong Kong 2,938,331 9.44 India 5,866,806 18.85 Indonesia 3,194,152 10.26 Malaysia 2,221,638 7.14 Philippines 679,903 2.18 Singapore 6,090,664 19.57 South Korea 1,102,231 3.54 Thailand 2,294,851 7.37
Portfolio of investments 28,071,905 90.19Other net assets 3,054,856 9.81
Total 31,126,761 100.00
ii) Industry
Consumer Discretionary 521,248 1.67Energy 6,123,876 19.67Financials 4,469,308 14.35Industrials 11,022,223 35.41Information Technology 491,378 1.58Materials 1,262,466 4.06Telecommunication Services 1,287,354 4.14Utilities 2,894,052 9.31
Portfolio of investments 28,071,905 90.19Other net assets 3,054,856 9.81
Total 31,126,761 100.00
iii) Asset Class
Equities 28,071,905 90.19Other net assets 3,054,856 9.81
Total 31,126,761 100.00
iv) Credit rating of debt securities
N/A
United Asia Pacific Infrastructure Fund(Constituted under a Trust Deed in the Republic of Singapore)
5
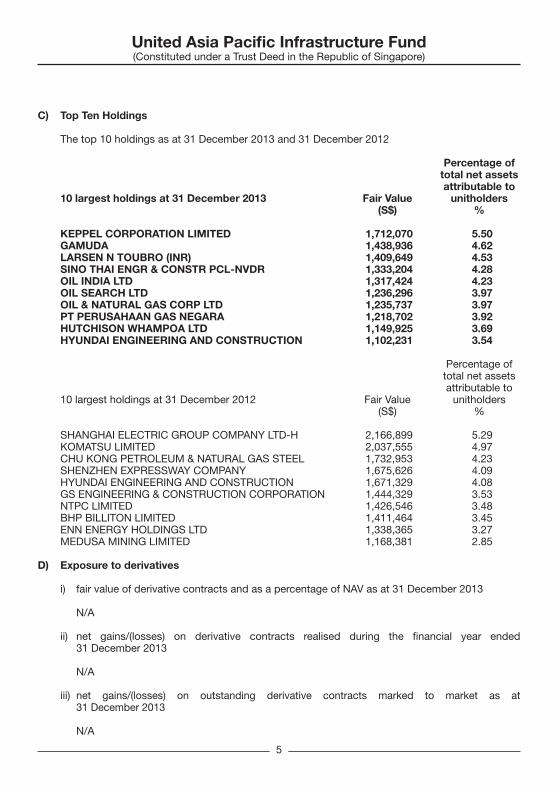
C) Top Ten Holdings
The top 10 holdings as at 31 December 2013 and 31 December 2012
Percentage of total net assets attributable to 10 largest holdings at 31 December 2013 Fair Value unitholders (S$) %
KEPPEL CORPORATION LIMITED 1,712,070 5.50GAMUDA 1,438,936 4.62LARSEN N TOUBRO (INR) 1,409,649 4.53SINO THAI ENGR & CONSTR PCL-NVDR 1,333,204 4.28OIL INDIA LTD 1,317,424 4.23OIL SEARCH LTD 1,236,296 3.97OIL & NATURAL GAS CORP LTD 1,235,737 3.97PT PERUSAHAAN GAS NEGARA 1,218,702 3.92HUTCHISON WHAMPOA LTD 1,149,925 3.69HYUNDAI ENGINEERING AND CONSTRUCTION 1,102,231 3.54
Percentage of total net assets attributable to 10 largest holdings at 31 December 2012 Fair Value unitholders (S$) %
SHANGHAI ELECTRIC GROUP COMPANY LTD-H 2,166,899 5.29KOMATSU LIMITED 2,037,555 4.97CHU KONG PETROLEUM & NATURAL GAS STEEL 1,732,953 4.23SHENZHEN EXPRESSWAY COMPANY 1,675,626 4.09HYUNDAI ENGINEERING AND CONSTRUCTION 1,671,329 4.08GS ENGINEERING & CONSTRUCTION CORPORATION 1,444,329 3.53NTPC LIMITED 1,426,546 3.48BHP BILLITON LIMITED 1,411,464 3.45ENN ENERGY HOLDINGS LTD 1,338,365 3.27MEDUSA MINING LIMITED 1,168,381 2.85
D) Exposure to derivatives
i) fair value of derivative contracts and as a percentage of NAV as at 31 December 2013
N/A
ii) net gains/(losses) on derivative contracts realised during the financial year ended 31 December 2013
N/A
iii) net gains/(losses) on outstanding derivative contracts marked to market as at 31 December 2013
N/A
United Asia Pacific Infrastructure Fund(Constituted under a Trust Deed in the Republic of Singapore)
6
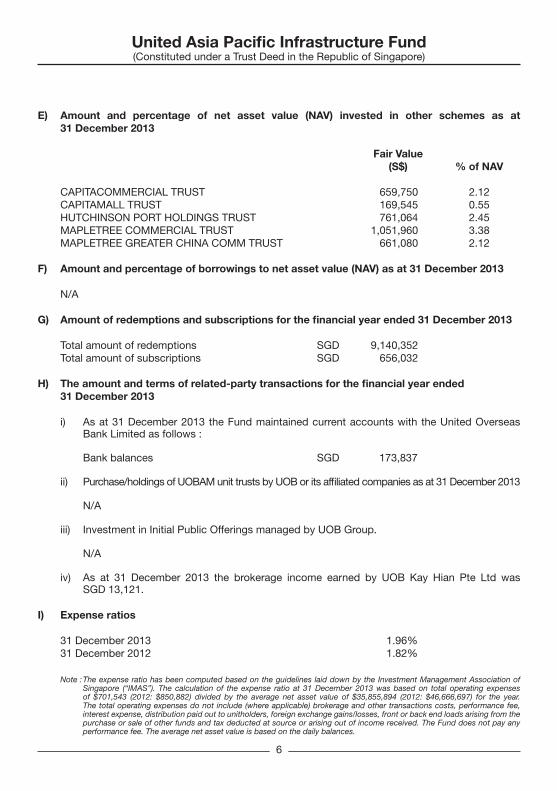
E) Amount and percentage of net asset value (NAV) invested in other schemes as at 31 December 2013
Fair Value (S$) % of NAV
CAPITACOMMERCIAL TRUST 659,750 2.12CAPITAMALL TRUST 169,545 0.55HUTCHINSON PORT HOLDINGS TRUST 761,064 2.45MAPLETREE COMMERCIAL TRUST 1,051,960 3.38MAPLETREE GREATER CHINA COMM TRUST 661,080 2.12
F) Amount and percentage of borrowings to net asset value (NAV) as at 31 December 2013
N/A
G) Amount of redemptions and subscriptions for the financial year ended 31 December 2013
Total amount of redemptions SGD 9,140,352 Total amount of subscriptions SGD 656,032
H) The amount and terms of related-party transactions for the financial year ended 31 December 2013
i) As at 31 December 2013 the Fund maintained current accounts with the United Overseas Bank Limited as follows :
Bank balances SGD 173,837
ii) Purchase/holdings of UOBAM unit trusts by UOB or its affiliated companies as at 31 December 2013
N/A
iii) Investment in Initial Public Offerings managed by UOB Group.
N/A
iv) As at 31 December 2013 the brokerage income earned by UOB Kay Hian Pte Ltd was SGD 13,121.
I) Expense ratios
31 December 2013 1.96%31 December 2012 1.82%
Note : The expense ratio has been computed based on the guidelines laid down by the Investment Management Association of Singapore (“IMAS”). The calculation of the expense ratio at 31 December 2013 was based on total operating expenses of $701,543 (2012: $850,882) divided by the average net asset value of $35,855,894 (2012: $46,666,697) for the year. The total operating expenses do not include (where applicable) brokerage and other transactions costs, performance fee, interest expense, distribution paid out to unitholders, foreign exchange gains/losses, front or back end loads arising from the purchase or sale of other funds and tax deducted at source or arising out of income received. The Fund does not pay any performance fee. The average net asset value is based on the daily balances.
United Asia Pacific Infrastructure Fund(Constituted under a Trust Deed in the Republic of Singapore)
7
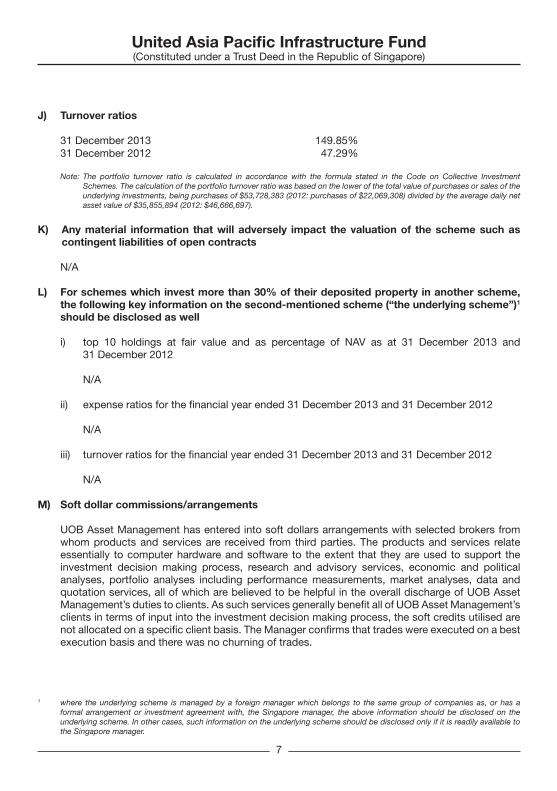
J) Turnover ratios
31 December 2013 149.85%31 December 2012 47.29%
Note: The portfolio turnover ratio is calculated in accordance with the formula stated in the Code on Collective Investment Schemes. The calculation of the portfolio turnover ratio was based on the lower of the total value of purchases or sales of the underlying investments, being purchases of $53,728,383 (2012: purchases of $22,069,308) divided by the average daily net asset value of $35,855,894 (2012: $46,666,697).
K) Any material information that will adversely impact the valuation of the scheme such as contingent liabilities of open contracts
N/A
L) For schemes which invest more than 30% of their deposited property in another scheme, the following key information on the second-mentioned scheme (“the underlying scheme”)1
should be disclosed as well
i) top 10 holdings at fair value and as percentage of NAV as at 31 December 2013 and 31 December 2012
N/A
ii) expense ratios for the financial year ended 31 December 2013 and 31 December 2012
N/A
iii) turnover ratios for the financial year ended 31 December 2013 and 31 December 2012
N/A
M) Soft dollar commissions/arrangements
UOB Asset Management has entered into soft dollars arrangements with selected brokers from whom products and services are received from third parties. The products and services relate essentially to computer hardware and software to the extent that they are used to support the investment decision making process, research and advisory services, economic and political analyses, portfolio analyses including performance measurements, market analyses, data and quotation services, all of which are believed to be helpful in the overall discharge of UOB Asset Management’s duties to clients. As such services generally benefit all of UOB Asset Management’s clients in terms of input into the investment decision making process, the soft credits utilised are not allocated on a specific client basis. The Manager confirms that trades were executed on a best execution basis and there was no churning of trades.
1 where the underlying scheme is managed by a foreign manager which belongs to the same group of companies as, or has a formal arrangement or investment agreement with, the Singapore manager, the above information should be disclosed on the underlying scheme. In other cases, such information on the underlying scheme should be disclosed only if it is readily available to the Singapore manager.
United Asia Pacific Infrastructure Fund(Constituted under a Trust Deed in the Republic of Singapore)
8
REPORT OF THE TRUSTEE
The Trustee is under a duty to take into custody and hold the assets of United Asia Pacific Infrastructure Fund (the “Fund”) in trust for the unitholders. In accordance with the Securities and Futures Act (Cap. 289), its subsidiary legislation and the Code on Collective Investment Schemes, the Trustee shall monitor the activities of the Manager for compliance with the limitations imposed on the investment and borrowing powers as set out in the Trust Deed in each annual accounting year and report thereon to unitholders in an annual report.
To the best knowledge of the Trustee, the Manager has, in all material respects, managed the Fund during the year covered by these financial statements, set out on pages 11 to 35, in accordance with the limitations imposed on the investment and borrowing powers set out in the Trust Deed.
For and on behalf of the TrusteeHSBC INSTITUTIONAL TRUST SERVICES (SINGAPORE) LIMITED
Authorised signatory
24 March 2014
United Asia Pacific Infrastructure Fund(Constituted under a Trust Deed in the Republic of Singapore)
9
STATEMENT BY THE MANAGER
In the opinion of the directors of UOB Asset Management Ltd, the accompanying financial statements set out on pages 11 to 35, comprising the Statement of Total Return, Statement of Financial Position, Statement of Movements of Unitholders’ Funds, Statement of Portfolio and Notes to the Financial Statements are drawn up so as to present fairly, in all material respects, the financial position of United Asia Pacific Infrastructure Fund (the “Fund”) as at 31 December 2013, and the total deficit and changes in unitholders’ funds for the year then ended in accordance with the recommendations of Statement of Recommended Accounting Practice 7 “Reporting Framework for Unit Trusts” issued by the Institute of Singapore Chartered Accountants (formerly known as the Institute of Certified Public Accountants of Singapore). At the date of this statement, there are reasonable grounds to believe that the Fund will be able to meet its financial obligations as and when they materialise.
For and on behalf of the ManagerUOB ASSET MANAGEMENT LTD
THIO BOON KIATAuthorised signatory
24 March 2014
United Asia Pacific Infrastructure Fund(Constituted under a Trust Deed in the Republic of Singapore)
10
INDEPENDENT AUDITOR’S REPORT TO THE UNITHOLDERS OFUNITED ASIA PACIFIC INFRASTRUCTURE FUND(Constituted under a Trust Deed in the Republic of Singapore)
We have audited the accompanying financial statements of United Asia Pacific Infrastructure Fund (the “Fund”), which comprise the Statement of Financial Position and Statement of Portfolio as at 31 December 2013, the Statement of Total Return and Statement of Movements of Unitholders’ Funds for the year then ended, and a summary of significant accounting policies and other explanatory information, as set out on pages 11 to 35.
Manager’s Responsibility for the Financial Statements
The Fund’s Manager (the “Manager”) is responsible for the preparation and fair presentation of these financial statements in accordance with the recommendations of Statement of Recommended Accounting Practice 7 “Reporting Framework for Unit Trusts” issued by the Institute of Singapore Chartered Accountants (formerly known as the Institute of Certified Public Accountants of Singapore), and for such internal control as the Manager determines is necessary to enable the preparation of financial statements that are free from material misstatement, whether due to fraud or error.
Auditor’s Responsibility
Our responsibility is to express an opinion on these financial statements based on our audit. We conducted our audit in accordance with Singapore Standards on Auditing. Those standards require that we comply with ethical requirements and plan and perform the audit to obtain reasonable assurance about whether the financial statements are free from material misstatement.
An audit involves performing procedures to obtain audit evidence about the amounts and disclosures in the financial statements. The procedures selected depend on the auditor’s judgement, including the assessment of the risks of material misstatement of the financial statements, whether due to fraud or error. In making those risk assessments, the auditor considers internal control relevant to the Fund’s preparation and fair presentation of the financial statements in order to design audit procedures that are appropriate in the circumstances, but not for the purpose of expressing an opinion on the effectiveness of the Fund’s internal control. An audit also includes evaluating the appropriateness of accounting policies used and the reasonableness of accounting estimates made by the Manager, as well as evaluating the overall presentation of the financial statements.
We believe that the audit evidence we have obtained is sufficient and appropriate to provide a basis for our audit opinion.
Opinion
In our opinion, the financial statements present fairly, in all material respects, the financial position of the Fund as at 31 December 2013 and the total deficit for the year then ended in accordance with the recommendations of Statement of Recommended Accounting Practice 7 “Reporting Framework for Unit Trusts” issued by the Institute of Singapore Chartered Accountants.
PricewaterhouseCoopers LLPPublic Accountants and Chartered Accountants
Singapore, 24 March 2014
United Asia Pacific Infrastructure Fund(Constituted under a Trust Deed in the Republic of Singapore)
11
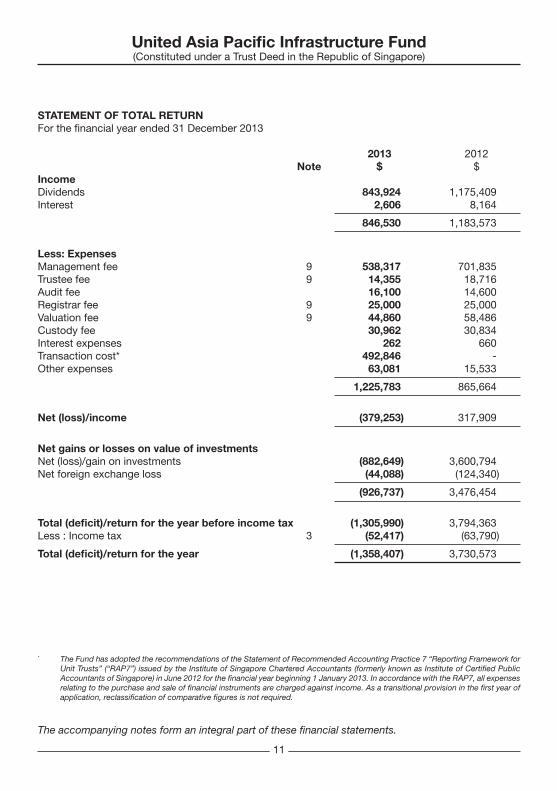
STATEMENT OF TOTAL RETURNFor the financial year ended 31 December 2013
2013 2012 Note $ $IncomeDividends 843,924 1,175,409 Interest 2,606 8,164
846,530 1,183,573
Less: Expenses Management fee 9 538,317 701,835 Trustee fee 9 14,355 18,716 Audit fee 16,100 14,600 Registrar fee 9 25,000 25,000 Valuation fee 9 44,860 58,486 Custody fee 30,962 30,834 Interest expenses 262 660 Transaction cost* 492,846 - Other expenses 63,081 15,533
1,225,783 865,664
Net (loss)/income (379,253) 317,909
Net gains or losses on value of investments Net (loss)/gain on investments (882,649) 3,600,794 Net foreign exchange loss (44,088) (124,340)
(926,737) 3,476,454
Total (deficit)/return for the year before income tax (1,305,990) 3,794,363 Less : Income tax 3 (52,417) (63,790)
Total (deficit)/return for the year (1,358,407) 3,730,573
* The Fund has adopted the recommendations of the Statement of Recommended Accounting Practice 7 “Reporting Framework for Unit Trusts” (“RAP7”) issued by the Institute of Singapore Chartered Accountants (formerly known as Institute of Certified Public Accountants of Singapore) in June 2012 for the financial year beginning 1 January 2013. In accordance with the RAP7, all expenses relating to the purchase and sale of financial instruments are charged against income. As a transitional provision in the first year of application, reclassification of comparative figures is not required.
The accompanying notes form an integral part of these financial statements.
United Asia Pacific Infrastructure Fund(Constituted under a Trust Deed in the Republic of Singapore)
12
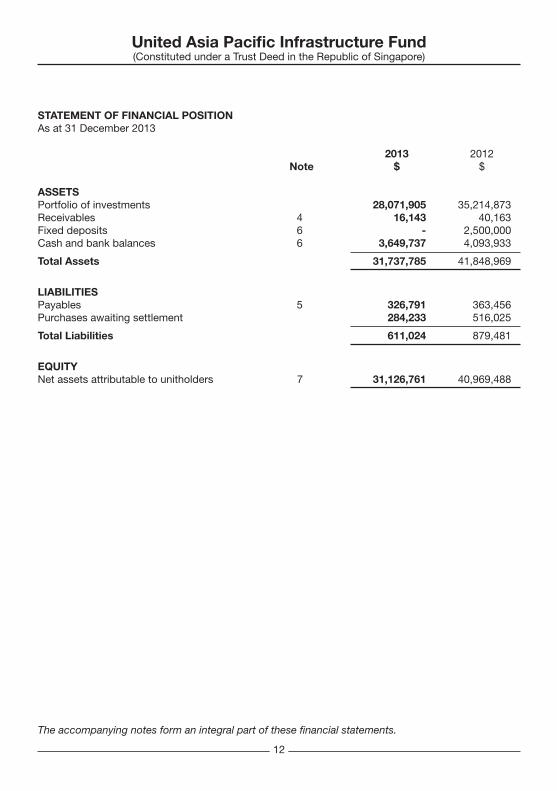
STATEMENT OF FINANCIAL POSITIONAs at 31 December 2013
2013 2012 Note $ $
ASSETSPortfolio of investments 28,071,905 35,214,873 Receivables 4 16,143 40,163 Fixed deposits 6 - 2,500,000 Cash and bank balances 6 3,649,737 4,093,933
Total Assets 31,737,785 41,848,969
LIABILITIESPayables 5 326,791 363,456 Purchases awaiting settlement 284,233 516,025
Total Liabilities 611,024 879,481
EQUITYNet assets attributable to unitholders 7 31,126,761 40,969,488
The accompanying notes form an integral part of these financial statements.
United Asia Pacific Infrastructure Fund(Constituted under a Trust Deed in the Republic of Singapore)
13
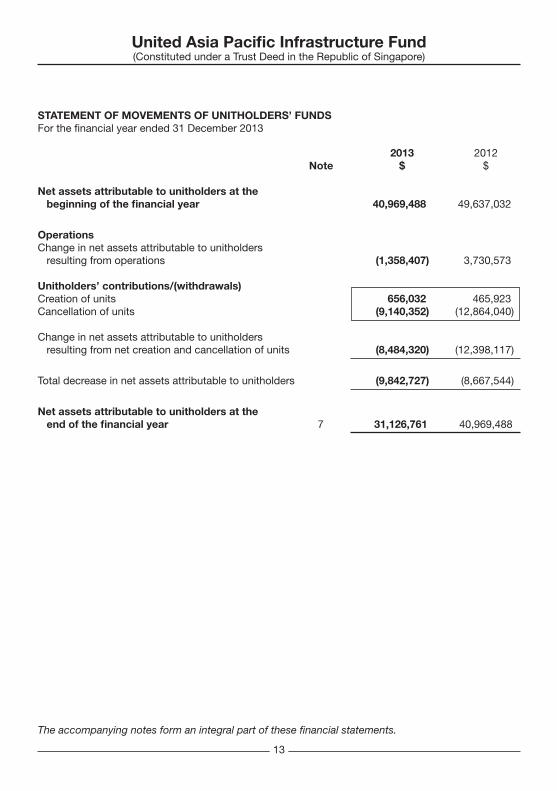
STATEMENT OF MOVEMENTS OF UNITHOLDERS’ FUNDS For the financial year ended 31 December 2013
2013 2012 Note $ $
Net assets attributable to unitholders at the beginning of the financial year 40,969,488 49,637,032
Operations Change in net assets attributable to unitholders resulting from operations (1,358,407) 3,730,573
Unitholders’ contributions/(withdrawals) Creation of units 656,032 465,923 Cancellation of units (9,140,352) (12,864,040)
Change in net assets attributable to unitholders resulting from net creation and cancellation of units (8,484,320) (12,398,117)
Total decrease in net assets attributable to unitholders (9,842,727) (8,667,544)
Net assets attributable to unitholders at the end of the financial year 7 31,126,761 40,969,488
The accompanying notes form an integral part of these financial statements.
United Asia Pacific Infrastructure Fund(Constituted under a Trust Deed in the Republic of Singapore)
14
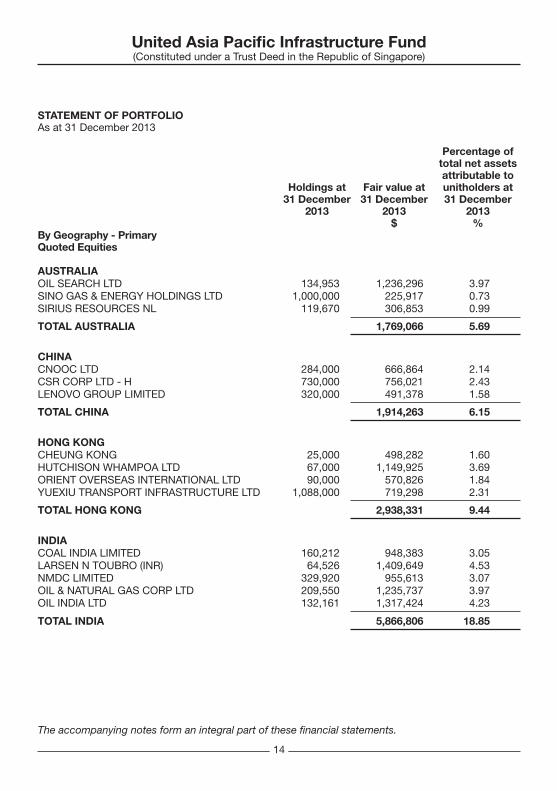
STATEMENT OF PORTFOLIOAs at 31 December 2013
Percentage of total net assets attributable to Holdings at Fair value at unitholders at 31 December 31 December 31 December 2013 2013 2013 $ %By Geography - PrimaryQuoted Equities
AUSTRALIAOIL SEARCH LTD 134,953 1,236,296 3.97 SINO GAS & ENERGY HOLDINGS LTD 1,000,000 225,917 0.73 SIRIUS RESOURCES NL 119,670 306,853 0.99
TOTAL AUSTRALIA 1,769,066 5.69
CHINA CNOOC LTD 284,000 666,864 2.14 CSR CORP LTD - H 730,000 756,021 2.43 LENOVO GROUP LIMITED 320,000 491,378 1.58
TOTAL CHINA 1,914,263 6.15
HONG KONG CHEUNG KONG 25,000 498,282 1.60 HUTCHISON WHAMPOA LTD 67,000 1,149,925 3.69 ORIENT OVERSEAS INTERNATIONAL LTD 90,000 570,826 1.84 YUEXIU TRANSPORT INFRASTRUCTURE LTD 1,088,000 719,298 2.31
TOTAL HONG KONG 2,938,331 9.44
INDIA COAL INDIA LIMITED 160,212 948,383 3.05 LARSEN N TOUBRO (INR) 64,526 1,409,649 4.53 NMDC LIMITED 329,920 955,613 3.07 OIL & NATURAL GAS CORP LTD 209,550 1,235,737 3.97 OIL INDIA LTD 132,161 1,317,424 4.23
TOTAL INDIA 5,866,806 18.85
The accompanying notes form an integral part of these financial statements.
United Asia Pacific Infrastructure Fund(Constituted under a Trust Deed in the Republic of Singapore)
15
STATEMENT OF PORTFOLIOAs at 31 December 2013
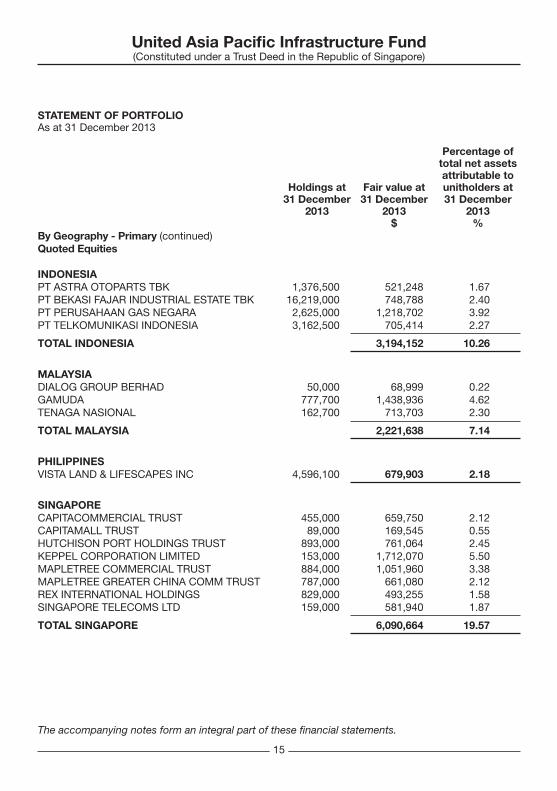
Percentage of total net assets attributable to Holdings at Fair value at unitholders at 31 December 31 December 31 December 2013 2013 2013 $ %By Geography - Primary (continued)Quoted Equities
INDONESIAPT ASTRA OTOPARTS TBK 1,376,500 521,248 1.67 PT BEKASI FAJAR INDUSTRIAL ESTATE TBK 16,219,000 748,788 2.40 PT PERUSAHAAN GAS NEGARA 2,625,000 1,218,702 3.92 PT TELKOMUNIKASI INDONESIA 3,162,500 705,414 2.27
TOTAL INDONESIA 3,194,152 10.26
MALAYSIA DIALOG GROUP BERHAD 50,000 68,999 0.22 GAMUDA 777,700 1,438,936 4.62 TENAGA NASIONAL 162,700 713,703 2.30
TOTAL MALAYSIA 2,221,638 7.14
PHILIPPINES VISTA LAND & LIFESCAPES INC 4,596,100 679,903 2.18
SINGAPORE CAPITACOMMERCIAL TRUST 455,000 659,750 2.12 CAPITAMALL TRUST 89,000 169,545 0.55 HUTCHISON PORT HOLDINGS TRUST 893,000 761,064 2.45 KEPPEL CORPORATION LIMITED 153,000 1,712,070 5.50 MAPLETREE COMMERCIAL TRUST 884,000 1,051,960 3.38 MAPLETREE GREATER CHINA COMM TRUST 787,000 661,080 2.12 REX INTERNATIONAL HOLDINGS 829,000 493,255 1.58 SINGAPORE TELECOMS LTD 159,000 581,940 1.87
TOTAL SINGAPORE 6,090,664 19.57
The accompanying notes form an integral part of these financial statements.
United Asia Pacific Infrastructure Fund(Constituted under a Trust Deed in the Republic of Singapore)
16
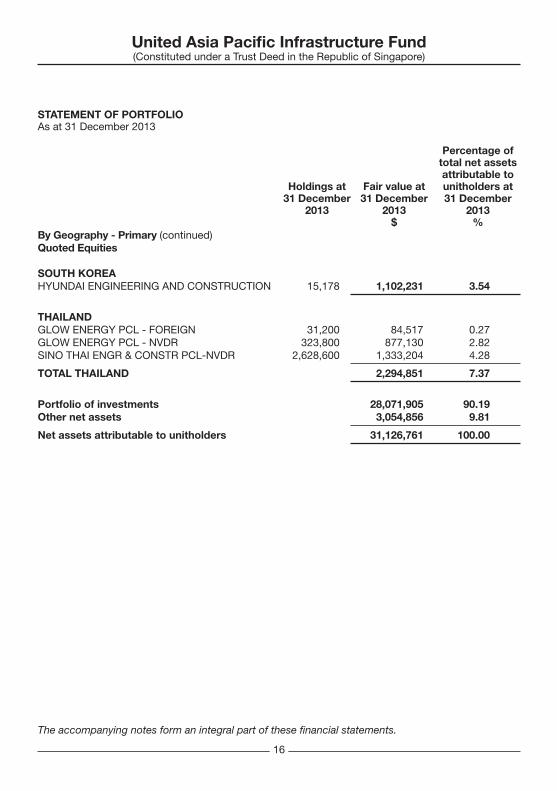
STATEMENT OF PORTFOLIOAs at 31 December 2013
Percentage of total net assets attributable to Holdings at Fair value at unitholders at 31 December 31 December 31 December 2013 2013 2013 $ %By Geography - Primary (continued)Quoted Equities SOUTH KOREAHYUNDAI ENGINEERING AND CONSTRUCTION 15,178 1,102,231 3.54
THAILAND GLOW ENERGY PCL - FOREIGN 31,200 84,517 0.27 GLOW ENERGY PCL - NVDR 323,800 877,130 2.82 SINO THAI ENGR & CONSTR PCL-NVDR 2,628,600 1,333,204 4.28
TOTAL THAILAND 2,294,851 7.37
Portfolio of investments 28,071,905 90.19 Other net assets 3,054,856 9.81
Net assets attributable to unitholders 31,126,761 100.00
The accompanying notes form an integral part of these financial statements.
United Asia Pacific Infrastructure Fund(Constituted under a Trust Deed in the Republic of Singapore)
17
STATEMENT OF PORTFOLIO As at 31 December 2013
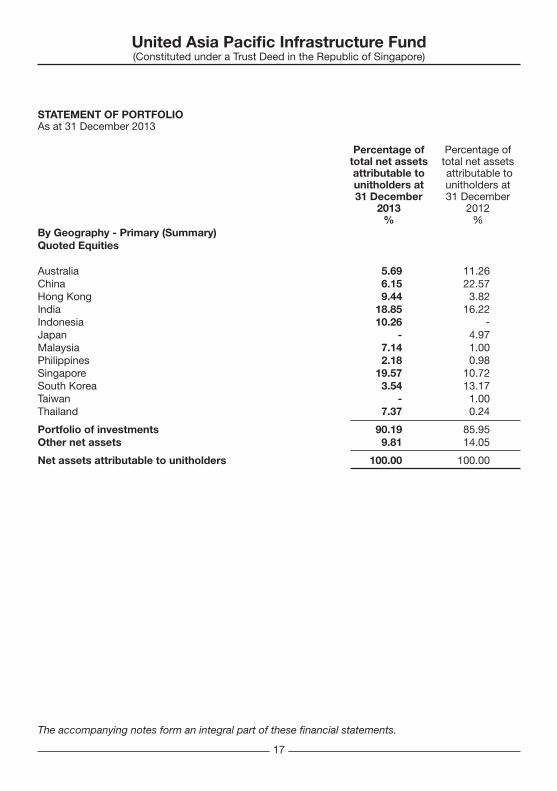
Percentage of Percentage of total net assets total net assets attributable to attributable to unitholders at unitholders at 31 December 31 December 2013 2012 % %By Geography - Primary (Summary) Quoted Equities
Australia 5.69 11.26 China 6.15 22.57 Hong Kong 9.44 3.82 India 18.85 16.22 Indonesia 10.26 - Japan - 4.97 Malaysia 7.14 1.00 Philippines 2.18 0.98 Singapore 19.57 10.72 South Korea 3.54 13.17 Taiwan - 1.00 Thailand 7.37 0.24
Portfolio of investments 90.19 85.95 Other net assets 9.81 14.05
Net assets attributable to unitholders 100.00 100.00
The accompanying notes form an integral part of these financial statements.
United Asia Pacific Infrastructure Fund(Constituted under a Trust Deed in the Republic of Singapore)
18
STATEMENT OF PORTFOLIO As at 31 December 2013
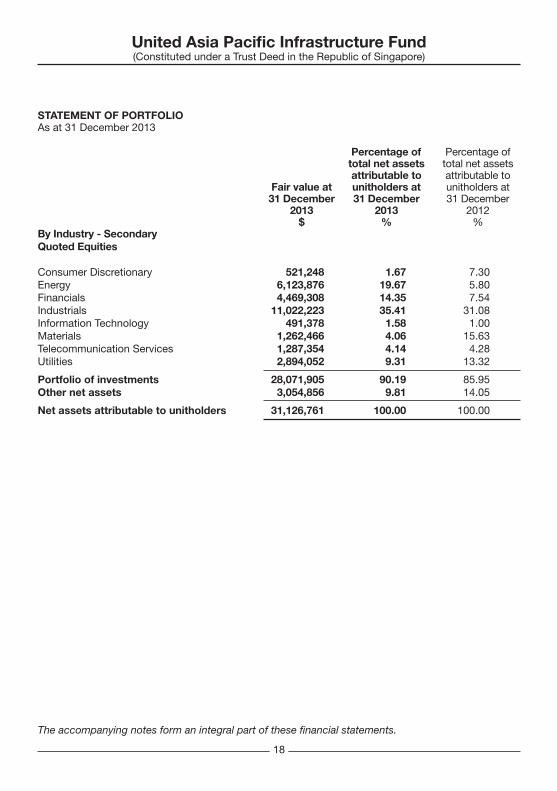
Percentage of Percentage of total net assets total net assets attributable to attributable to Fair value at unitholders at unitholders at 31 December 31 December 31 December 2013 2013 2012 $ % %By Industry - SecondaryQuoted Equities
Consumer Discretionary 521,248 1.67 7.30 Energy 6,123,876 19.67 5.80 Financials 4,469,308 14.35 7.54 Industrials 11,022,223 35.41 31.08 Information Technology 491,378 1.58 1.00 Materials 1,262,466 4.06 15.63 Telecommunication Services 1,287,354 4.14 4.28 Utilities 2,894,052 9.31 13.32
Portfolio of investments 28,071,905 90.19 85.95 Other net assets 3,054,856 9.81 14.05
Net assets attributable to unitholders 31,126,761 100.00 100.00
The accompanying notes form an integral part of these financial statements.
United Asia Pacific Infrastructure Fund(Constituted under a Trust Deed in the Republic of Singapore)
19
NOTES TO THE FINANCIAL STATEMENTSFor the financial year ended 31 December 2013
These notes form an integral part of and should be read in conjunction with the accompanying financial statements.
1. General
United Asia Pacific Infrastructure Fund (the “Fund”) is a Singapore-registered trust fund constituted by a Trust Deed dated 31 August 2006 between UOB Asset Management Ltd (the “Manager”) and RBC Dexia Trust Services Singapore Limited (the “Trustee”). The Deed and all supplemental deeds are governed by the laws of the Republic of Singapore.
With effect from 1 March 2011, the Trustee of the Fund has changed from RBC Dexia Trust Services Singapore Limited (the “Retired Trustee”) to HSBC Institutional Trust Services (Singapore) Limited (the “Trustee”).
The primary activity of the Fund is that of investment trading. The Fund’s investment objective is to achieve medium to long term capital growth by investing in securities (equities or equity-related securities) issued by companies which carry on infrastructure-related businesses in the Asia-Pacific region.
Subscriptions and redemptions of the units are denominated in Singapore Dollars and United States Dollars. Investors may subscribe in United States Dollars at the applicable rate of exchange from Singapore Dollars.
2. Significant accounting policies
(a) Basis of preparation
The financial statements have been prepared under the historical cost convention, modified by the revaluation of financial assets at fair value through profit or loss.
The Fund has adopted the recommendations of Recommended Accounting Practice 7 “Reporting Framework for Unit Trusts” issued by the Institute of Singapore Chartered Accountants (formerly known as the Institute of Certified Public Accountants of Singapore) in June 2012 (“RAP7”) for the financial year beginning 1 January 2013.
United Asia Pacific Infrastructure Fund(Constituted under a Trust Deed in the Republic of Singapore)
20
NOTES TO THE FINANCIAL STATEMENTSFor the financial year ended 31 December 2013
2. Significant accounting policies (continued)
(a) Basis of preparation (continued)
The adoption of the revised RAP7 did not result in substantial changes to the Fund’s accounting policies and had no material effect on the amounts reported for the current or prior financial years except as disclosed below.
(i) Classification of net assets attributable to unitholders
RAP7 recommends that a unit trust should classify its units on initial recognition as equity and present a Statement of Movement in Unitholders’ Funds summarising the movements in the value of the Fund. Previously, the Fund had classified its units as liabilities and presented the movements in value in the Notes to the Financial Statements in accordance with the existing framework issued in May 2005. On the adoption of revised RAP7, the Fund has reclassified its units from liabilities to equity. Consequently, the Fund’s distributions will no longer be classified as a finance cost in the Statement of Total Return, but will be recorded as a dividend in the Statement of Movement in Unitholders’ Funds.
The reclassification has been applied retrospectively.
(ii) Transaction costs
RAP7 recommends that transaction costs, including all expenses relating to the purchase and sale of financial instruments, should be charged against income. Previously, the Fund had capitalised such expenses and recognised realised gains/losses on a net basis.
As the changes have been implemented prospectively, no adjustments were necessary to any of the amounts previously recognised in the financial statements.
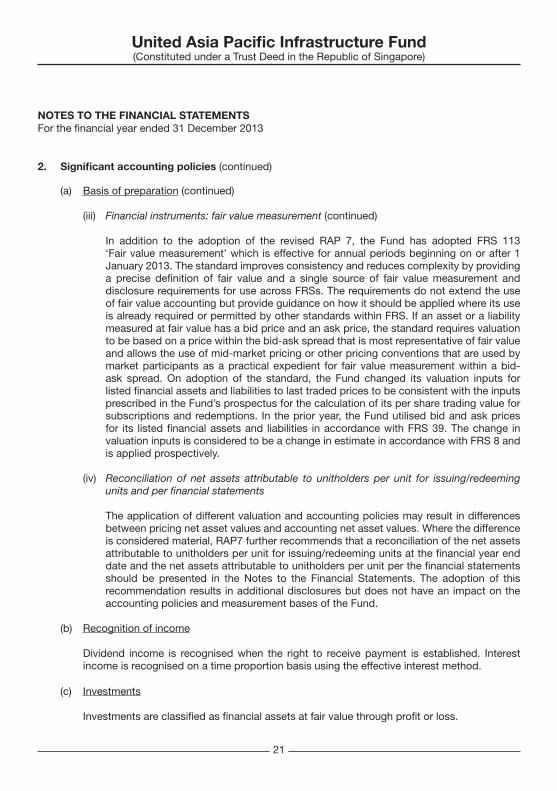
(iii) Financial instruments: fair value measurement
RAP7 recommends disclosures and presentation of financial instruments in accordance with Singapore Financial Reporting Standard 107 “Financial Instruments: Disclosures” (“FRS107”) wherever possible.
Apart from enhanced disclosures to present fair value measurements by level of a fair value measurement hierarchy, the Fund has previously presented disclosures of its financial instruments in accordance with FRS 107 voluntarily. The adoption of this recommendation results in additional disclosures but does not have an impact on the accounting policies and measurement bases of the Fund.
United Asia Pacific Infrastructure Fund(Constituted under a Trust Deed in the Republic of Singapore)
21
NOTES TO THE FINANCIAL STATEMENTSFor the financial year ended 31 December 2013
2. Significant accounting policies (continued)
(a) Basis of preparation (continued)
(iii) Financial instruments: fair value measurement (continued)
In addition to the adoption of the revised RAP 7, the Fund has adopted FRS 113 ‘Fair value measurement’ which is effective for annual periods beginning on or after 1 January 2013. The standard improves consistency and reduces complexity by providing a precise definition of fair value and a single source of fair value measurement and disclosure requirements for use across FRSs. The requirements do not extend the use of fair value accounting but provide guidance on how it should be applied where its use is already required or permitted by other standards within FRS. If an asset or a liability measured at fair value has a bid price and an ask price, the standard requires valuation to be based on a price within the bid-ask spread that is most representative of fair value and allows the use of mid-market pricing or other pricing conventions that are used by market participants as a practical expedient for fair value measurement within a bid-ask spread. On adoption of the standard, the Fund changed its valuation inputs for listed financial assets and liabilities to last traded prices to be consistent with the inputs prescribed in the Fund’s prospectus for the calculation of its per share trading value for subscriptions and redemptions. In the prior year, the Fund utilised bid and ask prices for its listed financial assets and liabilities in accordance with FRS 39. The change in valuation inputs is considered to be a change in estimate in accordance with FRS 8 and is applied prospectively.
(iv) Reconciliation of net assets attributable to unitholders per unit for issuing/redeeming units and per financial statements
The application of different valuation and accounting policies may result in differences between pricing net asset values and accounting net asset values. Where the difference is considered material, RAP7 further recommends that a reconciliation of the net assets attributable to unitholders per unit for issuing/redeeming units at the financial year end date and the net assets attributable to unitholders per unit per the financial statements should be presented in the Notes to the Financial Statements. The adoption of this recommendation results in additional disclosures but does not have an impact on the accounting policies and measurement bases of the Fund.
(b) Recognition of income
Dividend income is recognised when the right to receive payment is established. Interest income is recognised on a time proportion basis using the effective interest method.
(c) Investments
Investments are classified as financial assets at fair value through profit or loss.
United Asia Pacific Infrastructure Fund(Constituted under a Trust Deed in the Republic of Singapore)
22
NOTES TO THE FINANCIAL STATEMENTSFor the financial year ended 31 December 2013
2. Significant accounting policies (continued)
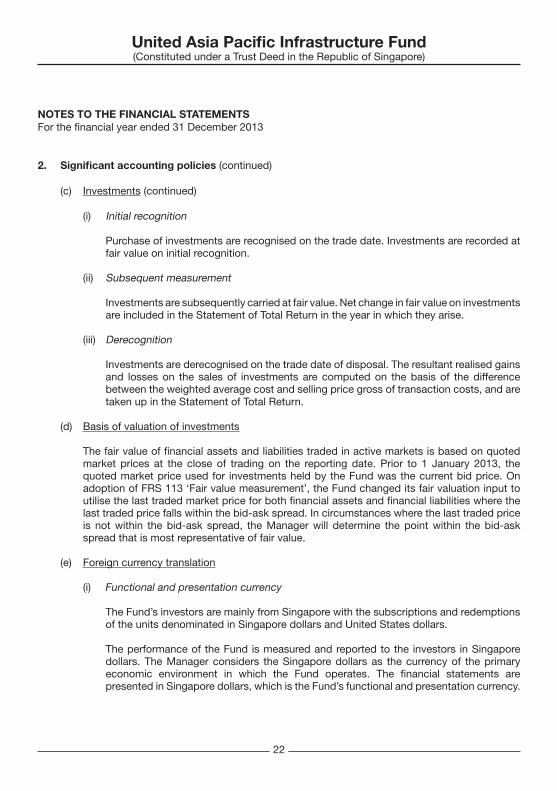
(c) Investments (continued)
(i) Initial recognition
Purchase of investments are recognised on the trade date. Investments are recorded at fair value on initial recognition.
(ii) Subsequent measurement
Investments are subsequently carried at fair value. Net change in fair value on investments are included in the Statement of Total Return in the year in which they arise.
(iii) Derecognition
Investments are derecognised on the trade date of disposal. The resultant realised gains and losses on the sales of investments are computed on the basis of the difference between the weighted average cost and selling price gross of transaction costs, and are taken up in the Statement of Total Return.
(d) Basis of valuation of investments
The fair value of financial assets and liabilities traded in active markets is based on quoted market prices at the close of trading on the reporting date. Prior to 1 January 2013, the quoted market price used for investments held by the Fund was the current bid price. On adoption of FRS 113 ‘Fair value measurement’, the Fund changed its fair valuation input to utilise the last traded market price for both financial assets and financial liabilities where the last traded price falls within the bid-ask spread. In circumstances where the last traded price is not within the bid-ask spread, the Manager will determine the point within the bid-ask spread that is most representative of fair value.
(e) Foreign currency translation
(i) Functional and presentation currency
The Fund’s investors are mainly from Singapore with the subscriptions and redemptions of the units denominated in Singapore dollars and United States dollars.
The performance of the Fund is measured and reported to the investors in Singapore dollars. The Manager considers the Singapore dollars as the currency of the primary economic environment in which the Fund operates. The financial statements are presented in Singapore dollars, which is the Fund’s functional and presentation currency.
United Asia Pacific Infrastructure Fund(Constituted under a Trust Deed in the Republic of Singapore)
23
NOTES TO THE FINANCIAL STATEMENTSFor the financial year ended 31 December 2013
2. Significant accounting policies (continued)
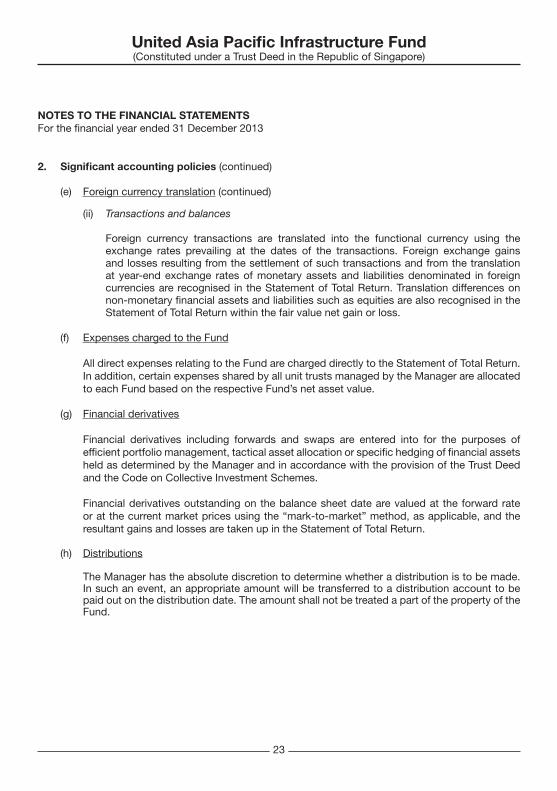
(e) Foreign currency translation (continued)
(ii) Transactions and balances
Foreign currency transactions are translated into the functional currency using the exchange rates prevailing at the dates of the transactions. Foreign exchange gains and losses resulting from the settlement of such transactions and from the translation at year-end exchange rates of monetary assets and liabilities denominated in foreign currencies are recognised in the Statement of Total Return. Translation differences on non-monetary financial assets and liabilities such as equities are also recognised in the Statement of Total Return within the fair value net gain or loss.
(f) Expenses charged to the Fund
All direct expenses relating to the Fund are charged directly to the Statement of Total Return. In addition, certain expenses shared by all unit trusts managed by the Manager are allocated to each Fund based on the respective Fund’s net asset value.
(g) Financial derivatives
Financial derivatives including forwards and swaps are entered into for the purposes of efficient portfolio management, tactical asset allocation or specific hedging of financial assets held as determined by the Manager and in accordance with the provision of the Trust Deed and the Code on Collective Investment Schemes.
Financial derivatives outstanding on the balance sheet date are valued at the forward rate or at the current market prices using the “mark-to-market” method, as applicable, and the resultant gains and losses are taken up in the Statement of Total Return.
(h) Distributions
The Manager has the absolute discretion to determine whether a distribution is to be made. In such an event, an appropriate amount will be transferred to a distribution account to be paid out on the distribution date. The amount shall not be treated a part of the property of the Fund.
United Asia Pacific Infrastructure Fund(Constituted under a Trust Deed in the Republic of Singapore)
24
NOTES TO THE FINANCIAL STATEMENTSFor the financial year ended 31 December 2013
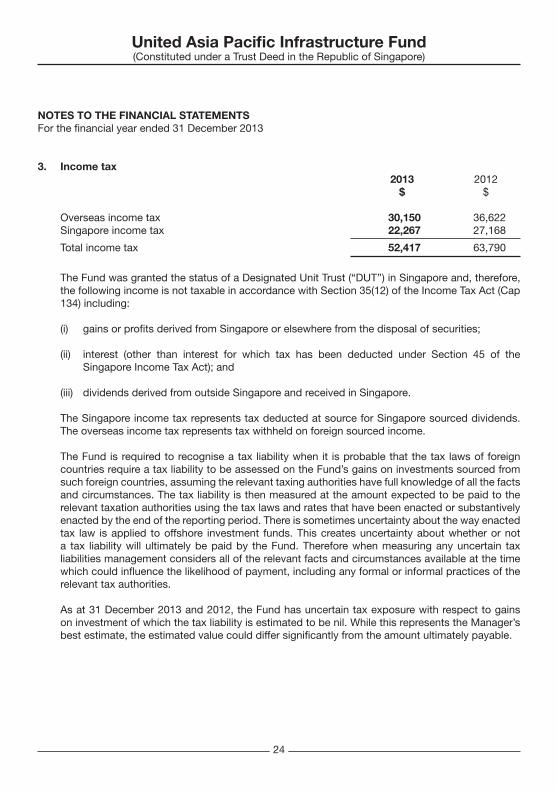
3. Income tax 2013 2012 $ $
Overseas income tax 30,150 36,622 Singapore income tax 22,267 27,168
Total income tax 52,417 63,790
The Fund was granted the status of a Designated Unit Trust (“DUT’’) in Singapore and, therefore, the following income is not taxable in accordance with Section 35(12) of the Income Tax Act (Cap 134) including:
(i) gains or profits derived from Singapore or elsewhere from the disposal of securities;
(ii) interest (other than interest for which tax has been deducted under Section 45 of the Singapore Income Tax Act); and
(iii) dividends derived from outside Singapore and received in Singapore.
The Singapore income tax represents tax deducted at source for Singapore sourced dividends. The overseas income tax represents tax withheld on foreign sourced income.
The Fund is required to recognise a tax liability when it is probable that the tax laws of foreign countries require a tax liability to be assessed on the Fund’s gains on investments sourced from such foreign countries, assuming the relevant taxing authorities have full knowledge of all the facts and circumstances. The tax liability is then measured at the amount expected to be paid to the relevant taxation authorities using the tax laws and rates that have been enacted or substantively enacted by the end of the reporting period. There is sometimes uncertainty about the way enacted tax law is applied to offshore investment funds. This creates uncertainty about whether or not a tax liability will ultimately be paid by the Fund. Therefore when measuring any uncertain tax liabilities management considers all of the relevant facts and circumstances available at the time which could influence the likelihood of payment, including any formal or informal practices of the relevant tax authorities.
As at 31 December 2013 and 2012, the Fund has uncertain tax exposure with respect to gains on investment of which the tax liability is estimated to be nil. While this represents the Manager’s best estimate, the estimated value could differ significantly from the amount ultimately payable.
United Asia Pacific Infrastructure Fund(Constituted under a Trust Deed in the Republic of Singapore)
25
NOTES TO THE FINANCIAL STATEMENTSFor the financial year ended 31 December 2013
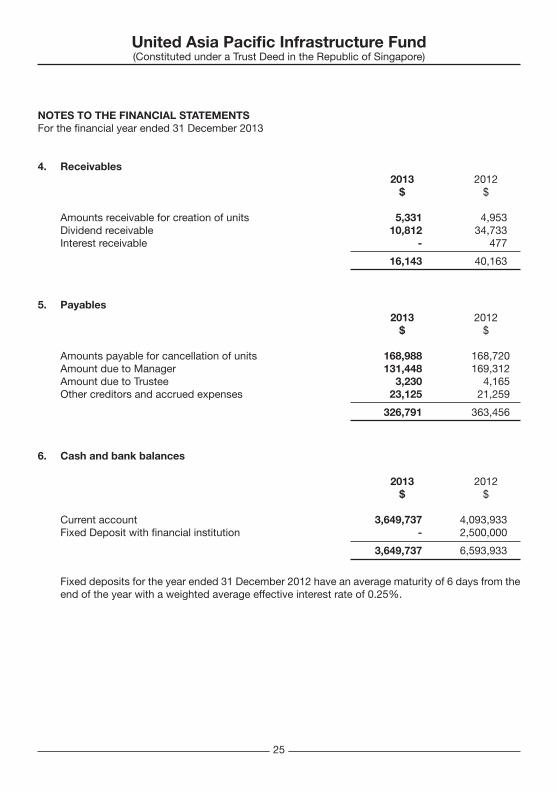
4. Receivables 2013 2012 $ $
Amounts receivable for creation of units 5,331 4,953 Dividend receivable 10,812 34,733 Interest receivable - 477
16,143 40,163
5. Payables 2013 2012 $ $
Amounts payable for cancellation of units 168,988 168,720 Amount due to Manager 131,448 169,312 Amount due to Trustee 3,230 4,165 Other creditors and accrued expenses 23,125 21,259
326,791 363,456
6. Cash and bank balances
2013 2012 $ $
Current account 3,649,737 4,093,933 Fixed Deposit with financial institution - 2,500,000
3,649,737 6,593,933
Fixed deposits for the year ended 31 December 2012 have an average maturity of 6 days from the end of the year with a weighted average effective interest rate of 0.25%.
United Asia Pacific Infrastructure Fund(Constituted under a Trust Deed in the Republic of Singapore)
26
NOTES TO THE FINANCIAL STATEMENTSFor the financial year ended 31 December 2013
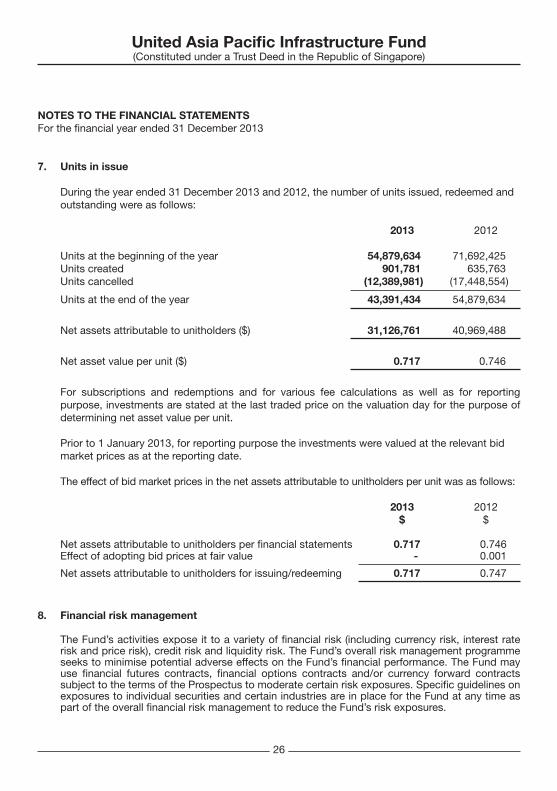
7. Units in issue
During the year ended 31 December 2013 and 2012, the number of units issued, redeemed and outstanding were as follows:
2013 2012
Units at the beginning of the year 54,879,634 71,692,425 Units created 901,781 635,763 Units cancelled (12,389,981) (17,448,554)
Units at the end of the year 43,391,434 54,879,634
Net assets attributable to unitholders ($) 31,126,761 40,969,488
Net asset value per unit ($) 0.717 0.746
For subscriptions and redemptions and for various fee calculations as well as for reporting purpose, investments are stated at the last traded price on the valuation day for the purpose of determining net asset value per unit.
Prior to 1 January 2013, for reporting purpose the investments were valued at the relevant bid market prices as at the reporting date.
The effect of bid market prices in the net assets attributable to unitholders per unit was as follows:
2013 2012 $ $
Net assets attributable to unitholders per financial statements 0.717 0.746 Effect of adopting bid prices at fair value - 0.001
Net assets attributable to unitholders for issuing/redeeming 0.717 0.747
8. Financial risk management
The Fund’s activities expose it to a variety of financial risk (including currency risk, interest rate risk and price risk), credit risk and liquidity risk. The Fund’s overall risk management programme seeks to minimise potential adverse effects on the Fund’s financial performance. The Fund may use financial futures contracts, financial options contracts and/or currency forward contracts subject to the terms of the Prospectus to moderate certain risk exposures. Specific guidelines on exposures to individual securities and certain industries are in place for the Fund at any time as part of the overall financial risk management to reduce the Fund’s risk exposures.
United Asia Pacific Infrastructure Fund(Constituted under a Trust Deed in the Republic of Singapore)
27
NOTES TO THE FINANCIAL STATEMENTSFor the financial year ended 31 December 2013
8. Financial risk management (continued) The Fund’s assets principally consist of financial instruments such as equity investments and cash. They are held in accordance with the published investment policies of the Fund. The allocation of assets between the various types of investments is determined by the Manager to achieve their investment objectives.
(a) Market risk
Market risk is the risk of loss arising from uncertainty concerning movements in market prices and rates, including observable variables such as interest rates, credit spreads, exchange rates, and others that may be only indirectly observable such as volatilities and correlations. Market risk includes such factors as changes in economic environment, consumption pattern and investor’s expectation etc. which may have significant impact on the value of the investments. The Fund’s investments are substantially dependent on changes in market prices. The Fund’s investments are monitored by the Manager on a regular basis so as to assess changes in fundamentals and valuation. Although the Manager makes reasonable efforts in the choice of investments, events beyond reasonable control of the Manager could affect the prices of the underlying investments and hence the asset value of the Fund. Guidelines are set to reduce the Fund’s risk exposures to market volatility such as diversifying the portfolio by investing across various geographies, alternatively, the Fund may be hedged using derivative strategies.
(i) Foreign exchange risk
The Fund has securities denominated in currencies other than Singapore dollars and it may be affected favourably or unfavourably by exchange rate regulations or changes in the exchange rates between the Singapore dollars and such other currencies. The Manager may at his discretion, implement a currency management strategy either to reduce currency volatility or to hedge the currency exposures of the Fund.
United Asia Pacific Infrastructure Fund(Constituted under a Trust Deed in the Republic of Singapore)
28
NOTES TO THE FINANCIAL STATEMENTSFor the financial year ended 31 December 2013
8. Financial risk management (continued)
(a) Market risk (continued)
(i) Foreign exchange risk (continued)
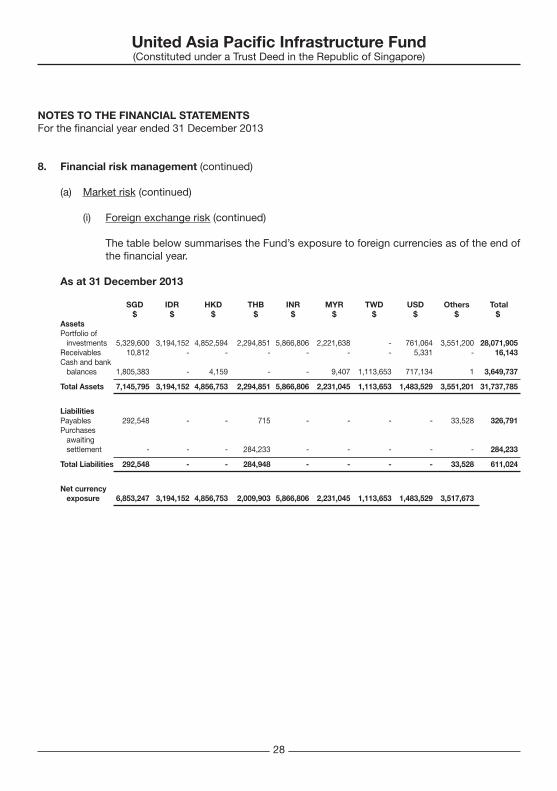
The table below summarises the Fund’s exposure to foreign currencies as of the end of the financial year.
As at 31 December 2013
SGD IDR HKD THB INR MYR TWD USD Others Total $ $ $ $ $ $ $ $ $ $
AssetsPortfolio of investments 5,329,600 3,194,152 4,852,594 2,294,851 5,866,806 2,221,638 - 761,064 3,551,200 28,071,905 Receivables 10,812 - - - - - - 5,331 - 16,143 Cash and bank balances 1,805,383 - 4,159 - - 9,407 1,113,653 717,134 1 3,649,737
Total Assets 7,145,795 3,194,152 4,856,753 2,294,851 5,866,806 2,231,045 1,113,653 1,483,529 3,551,201 31,737,785
LiabilitiesPayables 292,548 - - 715 - - - - 33,528 326,791 Purchases awaiting settlement - - - 284,233 - - - - - 284,233
Total Liabilities 292,548 - - 284,948 - - - - 33,528 611,024
Net currency exposure 6,853,247 3,194,152 4,856,753 2,009,903 5,866,806 2,231,045 1,113,653 1,483,529 3,517,673
United Asia Pacific Infrastructure Fund(Constituted under a Trust Deed in the Republic of Singapore)
29
NOTES TO THE FINANCIAL STATEMENTSFor the financial year ended 31 December 2013
8. Financial risk management (continued)
(a) Market risk (continued)
(i) Foreign exchange risk (continued)
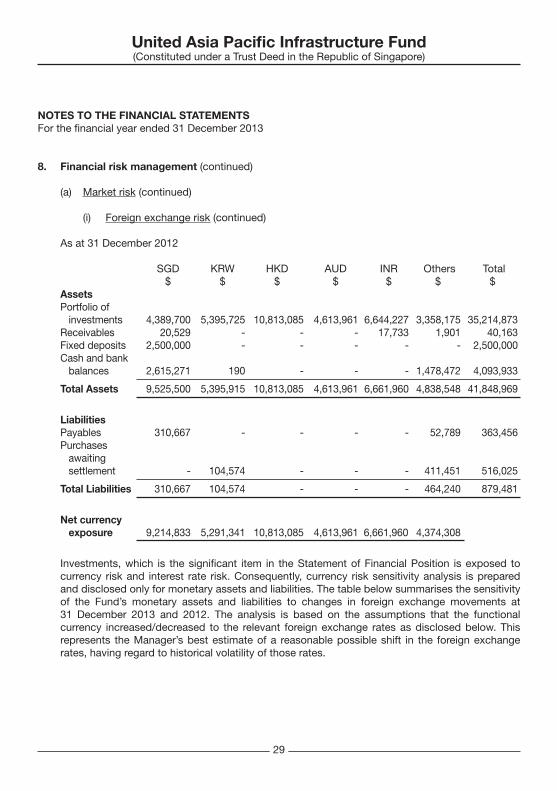
As at 31 December 2012
SGD KRW HKD AUD INR Others Total $ $ $ $ $ $ $
AssetsPortfolio of investments 4,389,700 5,395,725 10,813,085 4,613,961 6,644,227 3,358,175 35,214,873 Receivables 20,529 - - - 17,733 1,901 40,163 Fixed deposits 2,500,000 - - - - - 2,500,000 Cash and bank balances 2,615,271 190 - - - 1,478,472 4,093,933
Total Assets 9,525,500 5,395,915 10,813,085 4,613,961 6,661,960 4,838,548 41,848,969
LiabilitiesPayables 310,667 - - - - 52,789 363,456 Purchases awaiting settlement - 104,574 - - - 411,451 516,025
Total Liabilities 310,667 104,574 - - - 464,240 879,481
Net currency exposure 9,214,833 5,291,341 10,813,085 4,613,961 6,661,960 4,374,308
Investments, which is the significant item in the Statement of Financial Position is exposed to currency risk and interest rate risk. Consequently, currency risk sensitivity analysis is prepared and disclosed only for monetary assets and liabilities. The table below summarises the sensitivity of the Fund’s monetary assets and liabilities to changes in foreign exchange movements at 31 December 2013 and 2012. The analysis is based on the assumptions that the functional currency increased/decreased to the relevant foreign exchange rates as disclosed below. This represents the Manager’s best estimate of a reasonable possible shift in the foreign exchange rates, having regard to historical volatility of those rates.
United Asia Pacific Infrastructure Fund(Constituted under a Trust Deed in the Republic of Singapore)
30
NOTES TO THE FINANCIAL STATEMENTSFor the financial year ended 31 December 2013
8. Financial risk management (continued)
(a) Market risk (continued)
(i) Foreign exchange risk (continued)
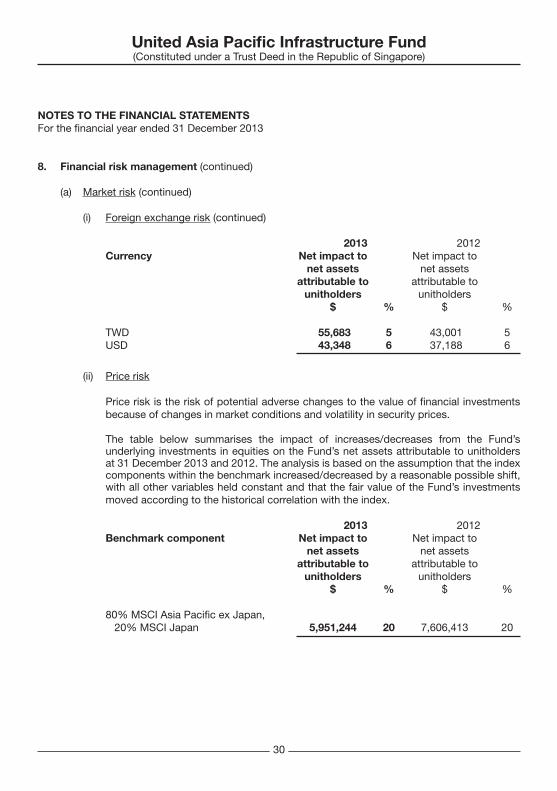
2013 2012Currency Net impact to Net impact to net assets net assets attributable to attributable to unitholders unitholders $ % $ %
TWD 55,683 5 43,001 5USD 43,348 6 37,188 6
(ii) Price risk
Price risk is the risk of potential adverse changes to the value of financial investments because of changes in market conditions and volatility in security prices.
The table below summarises the impact of increases/decreases from the Fund’s underlying investments in equities on the Fund’s net assets attributable to unitholders at 31 December 2013 and 2012. The analysis is based on the assumption that the index components within the benchmark increased/decreased by a reasonable possible shift, with all other variables held constant and that the fair value of the Fund’s investments moved according to the historical correlation with the index.
2013 2012Benchmark component Net impact to Net impact to net assets net assets attributable to attributable to unitholders unitholders $ % $ %
80% MSCI Asia Pacific ex Japan, 20% MSCI Japan 5,951,244 20 7,606,413 20
United Asia Pacific Infrastructure Fund(Constituted under a Trust Deed in the Republic of Singapore)
31
NOTES TO THE FINANCIAL STATEMENTSFor the financial year ended 31 December 2013
8. Financial risk management (continued)
(a) Market risk (continued)
(iii) Interest rate risk
Interest rate risk is the risk that the value of a financial instrument will fluctuate due to changes in market interest rates.
Other than cash balances, the Fund’s financial assets and liabilities are largely non-interest bearing. Hence, the Fund is not subjected to significant risk due to fluctuations in the prevailing levels of market interest rates.
(b) Liquidity risk
The Fund is exposed to daily cash redemptions and disbursements for the settlements of purchases. The Manager therefore ensures that the Fund maintains sufficient cash and cash equivalents and that it is able to obtain cash from the sale of investments held to meet its liquidity requirements. Reasonable efforts will be taken to invest in securities which are traded in a relatively active market and which can be readily disposed of.
The Fund’s investments in listed securities are considered to be readily realisable as they are listed on established regional stock exchanges.
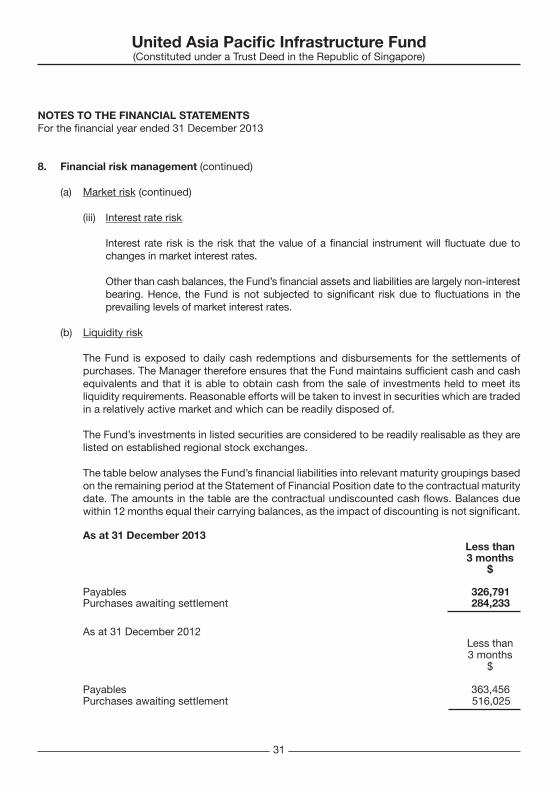
The table below analyses the Fund’s financial liabilities into relevant maturity groupings based on the remaining period at the Statement of Financial Position date to the contractual maturity date. The amounts in the table are the contractual undiscounted cash flows. Balances due within 12 months equal their carrying balances, as the impact of discounting is not significant.
As at 31 December 2013 Less than
3 months $
Payables 326,791 Purchases awaiting settlement 284,233
As at 31 December 2012 Less than 3 months $
Payables 363,456Purchases awaiting settlement 516,025
United Asia Pacific Infrastructure Fund(Constituted under a Trust Deed in the Republic of Singapore)
32
NOTES TO THE FINANCIAL STATEMENTSFor the financial year ended 31 December 2013
8. Financial risk management (continued)
(c) Credit risk
The Fund takes on exposure to credit risk, which is the risk that a counterparty will be unable to pay amounts in full when due. The Fund’s credit risk is concentrated on amounts or securities receivable on the sale and purchase of investments respectively. In order to mitigate exposure to credit risk, all transactions in listed securities are settled/paid for upon delivery and transacted with approved counterparties using an approved list of brokers that are regularly assessed and updated by the Manager.
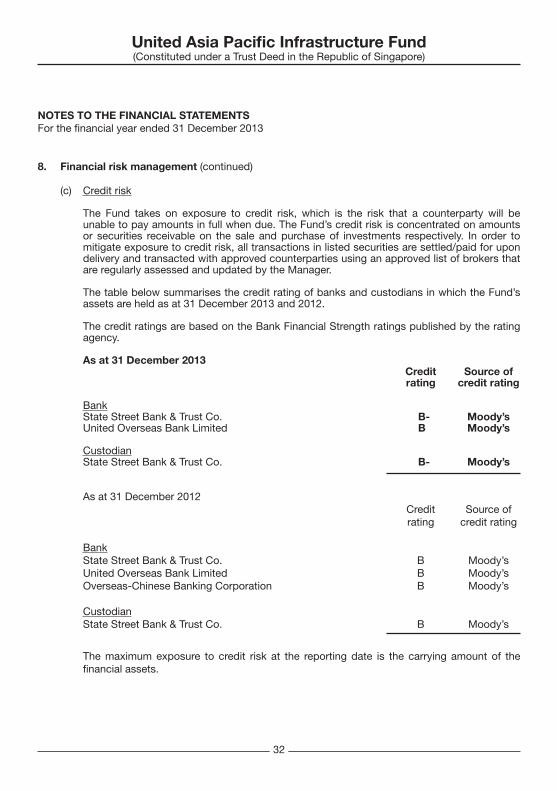
The table below summarises the credit rating of banks and custodians in which the Fund’s assets are held as at 31 December 2013 and 2012.
The credit ratings are based on the Bank Financial Strength ratings published by the rating agency.
As at 31 December 2013 Credit Source of rating credit rating
BankState Street Bank & Trust Co. B- Moody’sUnited Overseas Bank Limited B Moody’s
CustodianState Street Bank & Trust Co. B- Moody’s
As at 31 December 2012 Credit Source of rating credit rating
BankState Street Bank & Trust Co. B Moody’sUnited Overseas Bank Limited B Moody’sOverseas-Chinese Banking Corporation B Moody’s
CustodianState Street Bank & Trust Co. B Moody’s
The maximum exposure to credit risk at the reporting date is the carrying amount of the financial assets.
United Asia Pacific Infrastructure Fund(Constituted under a Trust Deed in the Republic of Singapore)
33
NOTES TO THE FINANCIAL STATEMENTSFor the financial year ended 31 December 2013
8. Financial risk management (continued)
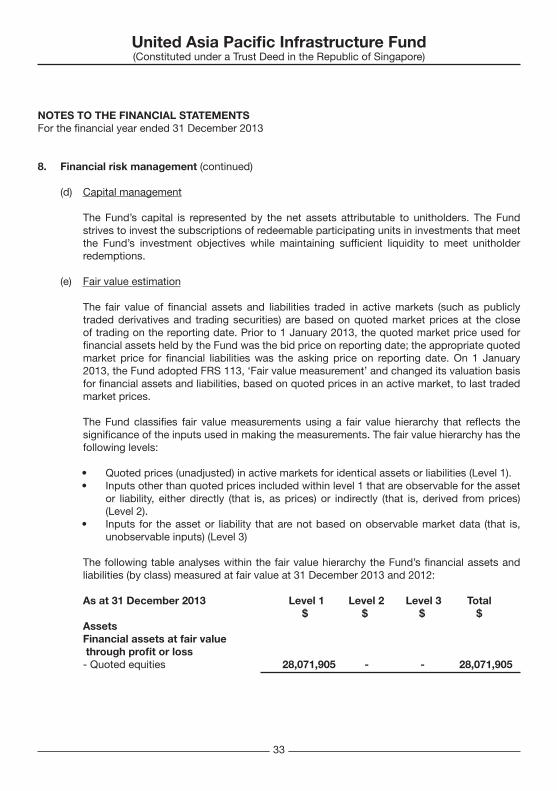
(d) Capital management
The Fund’s capital is represented by the net assets attributable to unitholders. The Fund strives to invest the subscriptions of redeemable participating units in investments that meet the Fund’s investment objectives while maintaining sufficient liquidity to meet unitholder redemptions.
(e) Fair value estimation
The fair value of financial assets and liabilities traded in active markets (such as publicly traded derivatives and trading securities) are based on quoted market prices at the close of trading on the reporting date. Prior to 1 January 2013, the quoted market price used for financial assets held by the Fund was the bid price on reporting date; the appropriate quoted market price for financial liabilities was the asking price on reporting date. On 1 January 2013, the Fund adopted FRS 113, ‘Fair value measurement’ and changed its valuation basis for financial assets and liabilities, based on quoted prices in an active market, to last traded market prices.
The Fund classifies fair value measurements using a fair value hierarchy that reflects the significance of the inputs used in making the measurements. The fair value hierarchy has the following levels:
• Quoted prices (unadjusted) in active markets for identical assets or liabilities (Level 1).• Inputs other than quoted prices included within level 1 that are observable for the asset
or liability, either directly (that is, as prices) or indirectly (that is, derived from prices) (Level 2).
• Inputs for the asset or liability that are not based on observable market data (that is, unobservable inputs) (Level 3)
The following table analyses within the fair value hierarchy the Fund’s financial assets and liabilities (by class) measured at fair value at 31 December 2013 and 2012:
As at 31 December 2013 Level 1 Level 2 Level 3 Total $ $ $ $AssetsFinancial assets at fair value through profit or loss- Quoted equities 28,071,905 - - 28,071,905
United Asia Pacific Infrastructure Fund(Constituted under a Trust Deed in the Republic of Singapore)
34
NOTES TO THE FINANCIAL STATEMENTSFor the financial year ended 31 December 2013
8. Financial risk management (continued)
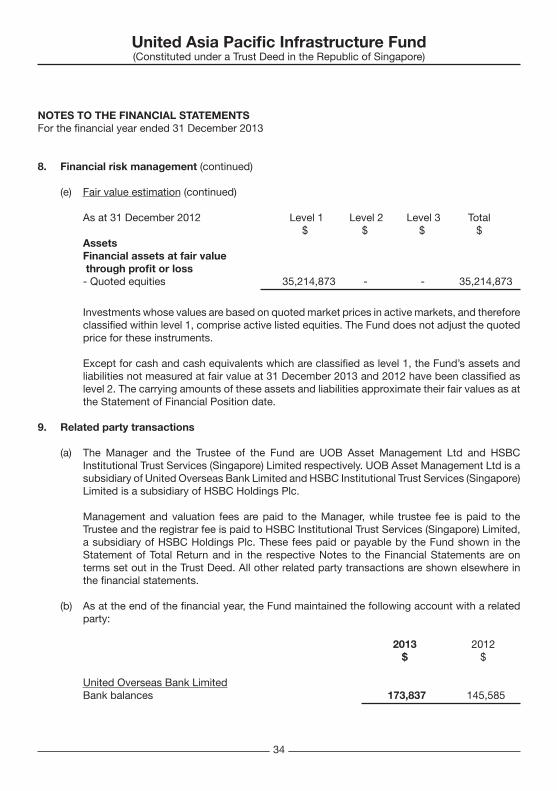
(e) Fair value estimation (continued)
As at 31 December 2012 Level 1 Level 2 Level 3 Total $ $ $ $AssetsFinancial assets at fair value through profit or loss- Quoted equities 35,214,873 - - 35,214,873
Investments whose values are based on quoted market prices in active markets, and therefore classified within level 1, comprise active listed equities. The Fund does not adjust the quoted price for these instruments.
Except for cash and cash equivalents which are classified as level 1, the Fund’s assets and liabilities not measured at fair value at 31 December 2013 and 2012 have been classified as level 2. The carrying amounts of these assets and liabilities approximate their fair values as at the Statement of Financial Position date.
9. Related party transactions
(a) The Manager and the Trustee of the Fund are UOB Asset Management Ltd and HSBC Institutional Trust Services (Singapore) Limited respectively. UOB Asset Management Ltd is a subsidiary of United Overseas Bank Limited and HSBC Institutional Trust Services (Singapore) Limited is a subsidiary of HSBC Holdings Plc.
Management and valuation fees are paid to the Manager, while trustee fee is paid to the Trustee and the registrar fee is paid to HSBC Institutional Trust Services (Singapore) Limited, a subsidiary of HSBC Holdings Plc. These fees paid or payable by the Fund shown in the Statement of Total Return and in the respective Notes to the Financial Statements are on terms set out in the Trust Deed. All other related party transactions are shown elsewhere in the financial statements.
(b) As at the end of the financial year, the Fund maintained the following account with a related party:
2013 2012 $ $
United Overseas Bank LimitedBank balances 173,837 145,585
United Asia Pacific Infrastructure Fund(Constituted under a Trust Deed in the Republic of Singapore)
35
NOTES TO THE FINANCIAL STATEMENTSFor the financial year ended 31 December 2013
9. Related party transactions (continued)
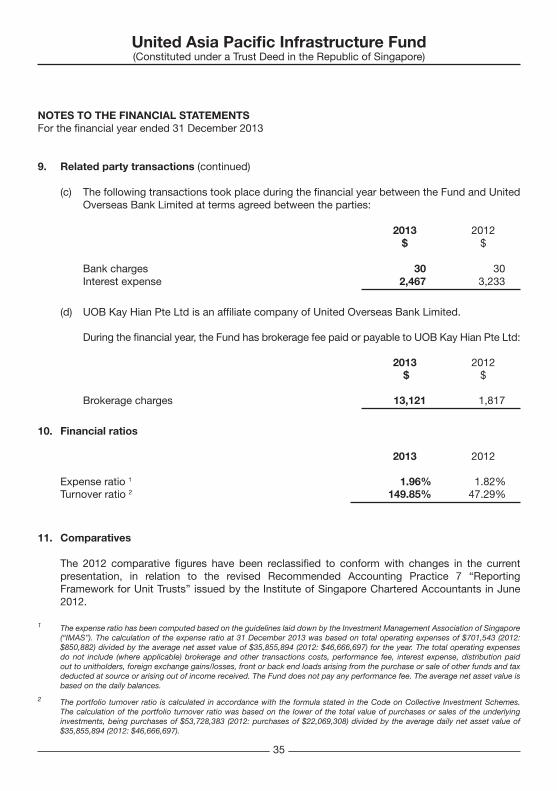
(c) The following transactions took place during the financial year between the Fund and United Overseas Bank Limited at terms agreed between the parties:
2013 2012 $ $
Bank charges 30 30 Interest expense 2,467 3,233
(d) UOB Kay Hian Pte Ltd is an affiliate company of United Overseas Bank Limited.
During the financial year, the Fund has brokerage fee paid or payable to UOB Kay Hian Pte Ltd:
2013 2012 $ $
Brokerage charges 13,121 1,817
10. Financial ratios
2013 2012
Expense ratio 1 1.96% 1.82%Turnover ratio 2 149.85% 47.29%
11. Comparatives
The 2012 comparative figures have been reclassified to conform with changes in the current presentation, in relation to the revised Recommended Accounting Practice 7 “Reporting Framework for Unit Trusts” issued by the Institute of Singapore Chartered Accountants in June 2012.
1 The expense ratio has been computed based on the guidelines laid down by the Investment Management Association of Singapore (“IMAS”). The calculation of the expense ratio at 31 December 2013 was based on total operating expenses of $701,543 (2012: $850,882) divided by the average net asset value of $35,855,894 (2012: $46,666,697) for the year. The total operating expenses do not include (where applicable) brokerage and other transactions costs, performance fee, interest expense, distribution paid out to unitholders, foreign exchange gains/losses, front or back end loads arising from the purchase or sale of other funds and tax deducted at source or arising out of income received. The Fund does not pay any performance fee. The average net asset value is based on the daily balances.
2 The portfolio turnover ratio is calculated in accordance with the formula stated in the Code on Collective Investment Schemes. The calculation of the portfolio turnover ratio was based on the lower of the total value of purchases or sales of the underlying investments, being purchases of $53,728,383 (2012: purchases of $22,069,308) divided by the average daily net asset value of $35,855,894 (2012: $46,666,697).
United Asia Pacific Infrastructure Fund(Constituted under a Trust Deed in the Republic of Singapore)
36
This page has been intentionally left blank.