Embed Size (px)
Citation preview

Copyright © 2016. Cape Cod Regional STEM Network in coordination with B. Heller, A. Smith, K. Tribou, and D. Zarra (Falmouth Public Schools). For personal or classroom use only
Unit Title: Human Impact on Global Temperature (Solar Sprint)
Course Title: Physical Science
Grade Level: Grade 8 Instructors: B. Heller, A. Smith, K. Tribou and D. Zarra
Stage 1: Desired Results
Established Goals
8.MS-ESS3-5. Examine and interpret data
to describe the role that human activities
have played in causing the rise in global
temperatures over the past century.
7.MS-ETS1-2. Evaluate competing
solutions to a given design problem using a
decision matrix to determine how well each
meets the criteria and constraints of the
problem. Use a model of each solution to
evaluate how variations in one or more
design features, including size, shape,
weight, or cost, may affect the function or
effectiveness of the solution.
Transfer
Students will be able to independently use their learning to:
● Define criteria and constraints of a design problem with precision
● Examine and interpret data to describe the role human activities have played in the rise of global
temperatures over time
● Construct, analyze, and/or interpret graphical displays of data and/or large data sets to identify
linear and nonlinear relationships
Meaning
Understandings ● Our life can be positively impacted by technology ● That there are alternative resources to choose
from that negatively and positively impact our environment
Essential Questions
● How does technology impact human life? ● How does technology impact the environment? ● How do people interact with the environment?
Acquisition
Students will know: ● There is a direct relationship between CO2
emissions and rising global temperatures. ● Human activities have lead to rising levels of CO2
in the atmosphere. ● Students will be able to explain the carbon cycle. ● It is important for people to consider where their
personal activities may be contributing to the issue of climate change.
● The difference between renewable and nonrenewable resources
Students will be skilled at: ● Students will be able to make a model of how to use
an alternative resource such as solar energy. ● Students will be able to use scientific methods in order
to problem solve. ● Students will use a variety of tools and methods to
conduct scientific inquiry. ● Students will be able to collect information from
different sources in order to present their findings in front of the class.

Copyright © 2016. Cape Cod Regional STEM Network in coordination with B. Heller, A. Smith, K. Tribou, and D. Zarra (Falmouth Public Schools). For personal or classroom use only
● The kinds of alternative resources available today.
Stage 2: Evidence
Evaluation Criteria Assessment Evidence
● Rubric on Solar Sprint assignment Performance Task(s):
● Solar Sprint ● Solar Energy Sales Pitch Presentation
Other Evidence: ● Human Impact on Global Temperature Test
Stage 3: Learning Plan
Core/Tier 1
- Watch the film An Inconvenient Truth - Promote discussion through analysis questions about the movie (Inconvenient Truth Analysis Questions from aurumscience.org-link below) - NWF’s Carbon Cycle Activity (separate pdf file) - Discuss the differences between renewable and nonrenewable energies - Students will calculate their own carbon footprint using http://www.meetthegreens.org/features/carbon-calculator.html - Have students create presentations on energy sources and their advantages vs. disadvantages (Discussion will include: Which of the sources are renewable/non-
renewable? What are the Pros and Cons of each? Where does a majority of our energy come from? What changes can we make to the ways we generate and use energy?)
- Wind Energy -Geothermal Energy -Hydropower -Fossil Fuels - Biomass -Solar -Nuclear
Literacy - Students will create a Slide
Presentation about renewable and nonrenewable resources.
- Students will analyze a model they created in order to see where people can make changes to reduce global warming.
- An Inconvenient Truth: The Crisis of Global Warming, Al Gore, 2006
Instructional Technology - An Inconvenient Truth documentary (2006) - Solar Energy Powerpoint - Solar Car Sales Pitch Digital Presentation
Tier 2 Extension/Enrichment
- Provide step-by-step tutorial videos for constructing the solar car.
- The Solar Sprint Car can be entered into the Cape Cod Junior Solar Sprint Competition.

Copyright © 2016. Cape Cod Regional STEM Network in coordination with B. Heller, A. Smith, K. Tribou, and D. Zarra (Falmouth Public Schools). For personal or classroom use only
- Provide an outline and example of a renewable energy powerpoint presentation.
- Students may use the Inconvenient Truth book to support their video discussion and analysis questions.
- Allow extra time to complete the Human Impact on Global Temperature quiz and repeat instructions if necessary
Inconvenient Truth Discussion Questions- http://www.bhasd.org/wp-
content/uploads/sites/143/2013/09/125338495-Inconvenient-Truth-Answer-Key.pdf

Copyright © 2016. Cape Cod Regional STEM Network in coordination with B. Heller, A. Smith, K. Tribou, and D. Zarra (Falmouth Public Schools). For personal or classroom use only
Name: ______________________________
Date: ____/____/______ Period: _____
Human Impact on Global Temperature Quiz
1. Scientists think that in the next 100 years global warming will cause water levels in
oceans to:
A. Decrease at least 100 cm
B. Stay the same
C. Increase by between 15 and 95 cm
2. Kenya is the world’s fourth largest tea producer and its second biggest exporter. If
temperatures rise by 2°C, what would happen to tea growers in Kenya?
A. They’d be able to grow more tea in more parts of the country
B. Many of the areas where they grow tea would become unsuitable for tea growing
C. They would be able to grow better quality tea
3. The greenhouse effect is caused by…
A. Greenhouse gases in the lower atmosphere absorbing solar radiation
B. Greenhouse gases in the lower atmosphere absorbing radiation from the Earth's surface, and
preventing much of it escaping into space
C. Too much heat in the atmosphere
D. Too much sunshine reaching Earth
4. Which of these natural events affect the climate?
A. Thawing permafrost
B. The path of the Earth around the sun
C. Volcanic eruptions
D. All of the above
Copyright © 2016. Cape Cod Regional STEM Network in coordination with B. Heller, A. Smith, K. Tribou, and D. Zarra (Falmouth Public Schools). For personal or classroom use only
5. Which of these greenhouse gases is most abundant in the atmosphere?
A. Carbon dioxide B. Methane
C. Nitrous oxide D. Water vapour
6. Which of these countries has the highest per capita carbon dioxide emissions?
A. United States B. Australia
C. Saudi Arabia D. China
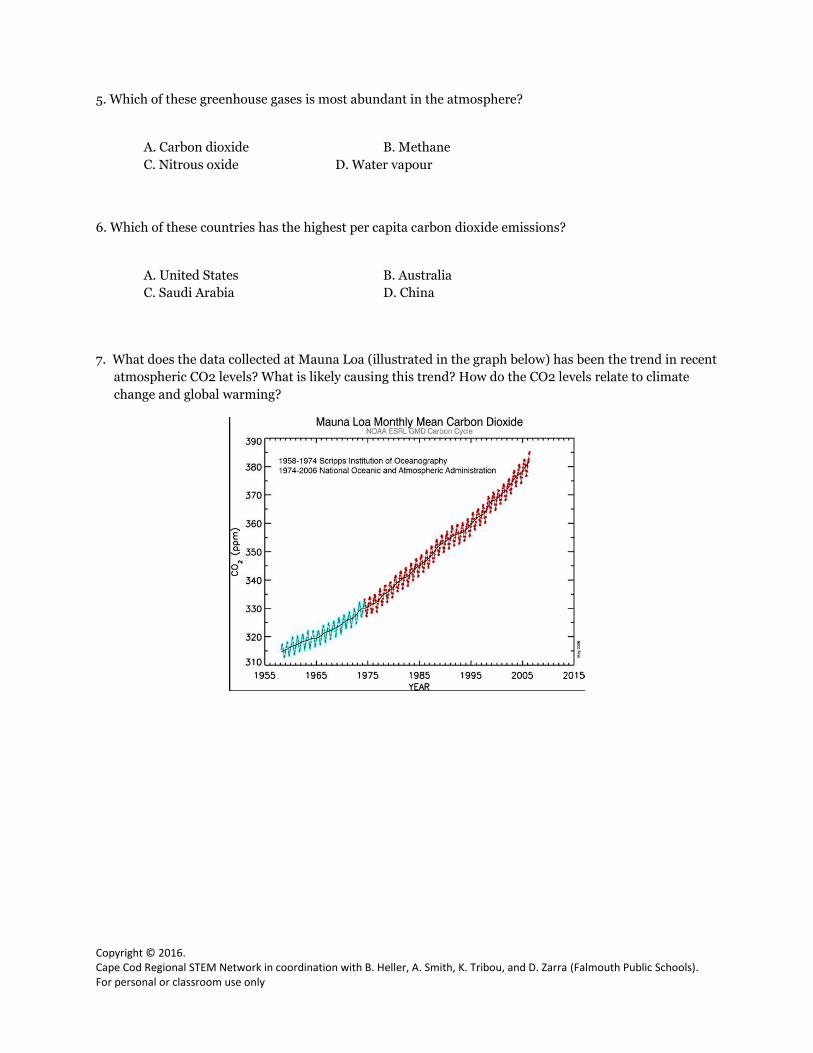
7. What does the data collected at Mauna Loa (illustrated in the graph below) has been the trend in recent
atmospheric CO2 levels? What is likely causing this trend? How do the CO2 levels relate to climate
change and global warming?

Copyright © 2016. Cape Cod Regional STEM Network in coordination with B. Heller, A. Smith, K. Tribou, and D. Zarra (Falmouth Public Schools). For personal or classroom use only
8. How are glaciers indicators of climate change?
9. List some of the ways in which human activities are contributing to global warming.
10. If global warming continues into the coming centuries, what are some consequences predicted by
models?

Copyright © 2016. Cape Cod Regional STEM Network in coordination with B. Heller, A. Smith, K. Tribou, and D. Zarra (Falmouth Public Schools). For personal or classroom use only
The Carbon Cycle
Purpose: To understand the carbon cycle in the context of climate change.
Background Information:
● Everything is connected to everything else in ecology which means that changes must
occur in other Earth systems.
● Energy can be changed from one form to another, but it cannot be created or
destroyed.
● Photosynthesis is the basis of life on Earth:
carbon dioxide + water + sunlight → sugar + oxygen
6CO2 + 6H2O → C6H12O6 + 6O2
● Respiration is the reverse of photosynthesis:
organic material + oxygen → carbon dioxide + water + energy
Box Modeling: As a part of this activity, you will create a box model to show how matter and
energy move through a system. Arrows in a box model show where matter and energy are
moving to and from. Below is a very simple box model of a food chain:
Procedures:
1. Read and explore the “Illustrated Carbon Cycle” handout. Pay attention to the direction
of the arrows since they indicate where matter and energy are moving to and from.

Copyright © 2016. Cape Cod Regional STEM Network in coordination with B. Heller, A. Smith, K. Tribou, and D. Zarra (Falmouth Public Schools). For personal or classroom use only
2. You will now be placed into one of the sphere groups below:
• Carbon in the atmosphere
• Carbon in the lithosphere
• Carbon in the hydrosphere
• Carbon in the biosphere
3. In your group, use the internet to gather information on the rates at which carbon flows
into and out of the sphere you have been assigned.
4. Now, create a box model for carbon flow in your sphere. Begin by drawing a box with
the name of your sphere in the middle of it on your group’s flip chart sheet.
5. Draw arrows into and out of your box to indicate carbon inputs and outputs that
affect your sphere.
6. Nominate one representative for your group, and have them bring your sheet to the
front of the classroom and post it on the board.
7. As a class, examine the boxes and to create an overall model of the carbon
cycle. Where are there links between the boxes?
Analysis:
● Look at the overall model of the carbon cycle we created and identify at least four
places in the cycle where humans can make changes to reduce global warming.

Copyright © 2016. Cape Cod Regional STEM Network in coordination with B. Heller, A. Smith, K. Tribou, and D. Zarra (Falmouth Public Schools). For personal or classroom use only
The Illustrated Carbon Cycle
The carbon cycle is the process by which carbon is exchanged between the various geological
systems of the Earth and its atmosphere. The carbon keeps circulating between the four main
carbon reservoirs: the atmosphere (i.e. the air, where it exists mainly as carbon dioxide),
lithosphere (i.e., the Earth’s crust, including rocks and soil), hydrosphere (i.e., the Earth’s water,
including fresh and saltwater), and biosphere (i.e., living things on land and in water). Carbon is
unquestionably one of the most important elements on Earth. It is the principal building block
for the organic compounds that make up life. Carbon’s electron structure can readily form
bonds with itself, leading to a great diversity in the chemical compounds that can be formed
around carbon; hence the diversity and complexity of life. Carbon occurs in many other forms
and places on Earth. It is a major constituent
of limestone, occurring as calcium carbonate
and it is dissolved in ocean and freshwater. It
is present in the atmosphere as carbon
dioxide, the second most important
greenhouse gas. The flow of carbon
throughout the biosphere, atmosphere,
hydrosphere and lithosphere is one of the
most complex, interesting and important of
the global cycles. The carbon cycle challenges
us more than any other global cycle as it
draws together information from biology,
chemistry, oceanography and geology. All
scientific disciplines are needed to
understand how it works and what causes it
to change. It is human
alteration of the quantity and movement
of carbon that is mostly responsible for
climate change. You will discuss these processes in more detail as you construct and
experiment with various renditions of the carbon cycle.
Copyright: National Wildlife Federation CLASSROOM LESSON PLANS | page 37

Copyright © 2016. Cape Cod Regional STEM Network in coordination with B. Heller, A. Smith, K. Tribou, and D. Zarra (Falmouth Public Schools). For personal or classroom use only
Solar Sprint
Purpose: To design, build, and test a car that runs on solar power, and create a Google Slides presentation to pitch your car to Ford Motor Company.
Problem: As we have discussed in class, one of the ways humans have impacted our environment is by burning fossil fuels and adding large amounts of carbon dioxide gas into the atmosphere. One of the major contributors of this gas is the fuel we burn driving our cars. In this assignment, you will design and build a solar powered car and then plan a presentation to explain the importance of your design to an automobile manufacturer.
Solar Car Procedures: 1. View these tutorial videos to familiarize yourself with building a Solar Sprint Car:
○ How to Build a Model Solar Car ○ Tutorial videos:
■ How to make a Solar Car
■ Solar Activity: How to Build a Solar Car
■ Solar Car Tutorial
2. As a group, come up with a list of variables that might affect the way your car works. For example; How does the size of a wheel affect the speed of a car? Research your variables to determine the optimal design for your car.
3. Design a prototype of the Solar Sprint Car that fits the following criteria:
- The materials used to construct the model car must cost less than $50. Original receipts for all materials
purchased should be put in an envelope and placed in the notebook. The total cost of construction materials should be clearly written on the outside of the envelope. Model cars that exceed this construction cost limit will be disqualified from the competition.
- The Junior Solar Sprint kit sold by Solar Made and the Ray Catcher Sprint Kit sold by PITCO are the solar panel/motor kits that are recommended, but not required, to be used in the competition. Solar panels cannot be shaved, drilled, or delaminated. Only the motor supplied in the kit can be used. Motors cannot be re-wound or disassembled. If an evaluation group convened by the event coordinator determines that the solar panel and/or motor have been modified, the car and team will be disqualified from the competition.
- The remainder of the vehicle can be innovative in design and materials.
- One solar panel (limited to a maximum output of 3.2 W), and one motor (limited to a maximum 3.0 VDC)
are allowed per car. Reflectors, supports, and power leads can be added to these components as needed. Energy-enhancing devices, like mirrors, must be firmly attached to the vehicle.
- The vehicle must be structurally sound, without the solar panel attached. The solar panel cannot be used as the chassis, or body of the car. The axles and wheels cannot be directly attached to the solar panel. The model car must not exceed the following dimensions: 30 cm (11 3/4 inches) wide by 60 cm (23 5/8 inches)

Copyright © 2016. Cape Cod Regional STEM Network in coordination with B. Heller, A. Smith, K. Tribou, and D. Zarra (Falmouth Public Schools). For personal or classroom use only
long by 30 cm (11 3/4 inches) high (as measured from the surface the car is resting upon to the highest point of the car with all its components attached) and positioned as during the time trials and races.
- The team is encouraged to decorate the body of the car, but a clearly visible 3-cm square space must be
available on the car to attach an assigned car number for the race.
- The sun’s light is the only energy source that can be used to power the vehicle. Batteries, capacitors, flywheels, or any other energy storage devices are prohibited.
4. Collaborate with your group members to determine what you think the best design is.
5. Build and test your car.
○ Recommended Suppliers for materials: ■ PITSCO
■ Solar Made
6. Brainstorm ideas on how to improve the car’s performance and make any changes necessary.
7. Race the car against classmates. Google Slides Presentation Requirements:
1. As a group, create a presentation to pitch your Solar Sprint car design to Ford Motor Company. Do some research to fully explain the need for a solar car.
2. Your presentation must include the following slides:
a. An explanation of the link between carbon dioxide emissions and rising global temperature. b. Information about the amount of carbon dioxide generated annually by the average American by
driving a gasoline powered car. c. Information about how solar energy works and it’s advantages. d. Your car’s design and how it works. e. What is the future of solar energy? What other uses might there be?
3. Remember, digital presentations are meant to be visual. Try not to have too much text on your slides, use
mostly labeled diagrams.

Copyright © 2016. Cape Cod Regional STEM Network in coordination with B. Heller, A. Smith, K. Tribou, and D. Zarra (Falmouth Public Schools). For personal or classroom use only
Solar Car/Presentation Rubric
(from the Junior Solar Sprint 2016)
Criteria Needs
improvement 1-4
Satisfactory 5-8
Exemplary 9-10
Technical Merit – Does the car pass inspection
and how well do the
components work individually?
Car does not pass
inspection. Car passed inspection, and some
elements of the car, for example,
the frame, bearing, or tires are
constructed with precision and
accuracy.
Car passed inspection, and the
frame, bearings tires, and
other elements of the car are
constructed with precision
and accuracy.
Innovation – How are creativity and
innovation evidenced in design?
The design of the
car does not show
creativity or
innovation.
The design of the car is shows
some creativity and innovation. The design of the car shows
exemplary innovation and
originality.
Craftsmanship and Design
- How well constructed is the car
overall?
Car is unsteady or
unable to race. Car is steady and able to race,
but movement could be better if
some elements of the car were to
be altered.
Car is steady and able to race,
and there is evidence of
thoughtful craftsmanship and
attention to construction.
Best Use of Recycled
Materials – How much of the car is constructed using
recycled, not purchased,
materials
Car shows very
little use of
recycled materials.
Car shows some use of recycled
materials. Car is almost or entirely
crafted of recyclable
materials.
Speed – Speed will be
determined via races
Google Slides Presentation The presentation is
incomplete and
lacks detail.
The presentation includes all
required slides but lacks
thorough research and/or is not
visually appealing.
The presentation includes all
required slides, is visually
appealing, and well-
researched.