Embed Size (px)
Citation preview

Unit R073 – How scientists test their ideas
Evaluating and communicating scientific information
Instructions and answers for teachers These instructions should accompany the learner tasks - OCR resource ‘Evaluating and communicating scientific information’, which supports Cambridge Nationals in Science Level 1/2 Unit R073 – How scientists test their ideas.
The learner tasks cover LO3 – Be able to plan a scientific investigation and LO5 – Be able to communicate scientific information.
The tasks will involve learners in evaluating methods of data collection, by considering the
quality and validity of the data, suggesting improvements in methods of data collection and
identifying what further evidence would be need to make a secure conclusion.
There will also be an opportunity for learners to review hypotheses, suggest conclusions and
plan further investigations.
There is a handout sheet for evaluating.
Associated Files: Evaluating and communicating scientific information Expected Duration: Activity 1 – 30–45 minutes Activity 2 – 30 minutes Activity 3 – 1 hour
Activity 1 Using the correct terms
Scientists use specialist terms to evaluate experiments and results.
Work in a group to sort out the cards so that a correct definition and example is given for each
of the terms.
Copy the definitions and examples into the correct place in your table.
Term Definition Example
Accuracy
Precision
Repeatability
Uncertainty
Validity
Explain that specialist terms are used to evaluate experimental methods and data collection.
The terms they should be familiar with are: accuracy, precision, validity, uncertainty, and
repeatability.
A full list of terms is included as an appendix.

Learners in small groups use a card sort to match terms to the appropriate definition and an
example.
Materials
Three sets of different coloured cards: term, definition and example.
Accuracy
how close a reading is to
the true value
My results tell me that the boiling point
of water is 99 oC. I know that it should
be 100 oC .
Precision
how close the agreement is
between measured values
I tested the time for a trolley to go down
a ramp at different heights. The results
at 10cm were 4.3s, 4.0s, 4.2s.
Repeatability
how close (precise) values
are when repeated by the
same person with the
same equipment
I did my trolley experiment again. This
time at 10cm my results were 4.1s, 4.4s,
4.3s
Uncertainty
the likelihood of a
measurement falling close
to the true value
Some points were close to the line of
best fit but there was one point that was
way off.
Validity
suitability of the
investigative procedure to
answer the question being
asked
In testing the strength of concrete
beams, I found out how much mass they
go hold before breaking.

Completed table for teacher use.
Term Definition Example
Accuracy how close a reading is to the true value
My results tell me that the boiling point of water is 99 oC. I know that it should be 100 oC .
Precision how close the agreement is between measured values
I tested the time for a trolley to go down a ramp at different heights. The results at 10cm were 4.3s, 4.0s, 4.2s.
Repeatability how close (precise) values are when repeated by the same person with the same equipment
I did my trolley experiment again. This time at 10cm my results were 4.1s, 4.4s, 4.3s
Uncertainty the likelihood of a measurement falling close to the true value
Some points were close to the line of best fit but there was one point that was way off.
Validity suitability of the investigative procedure to answer the question being asked
In testing the strength of concrete beams, I found out how much mass they go hold before breaking.

Activity 2 Extracting copper This activity links with R071 LO3 and LO7.
You are going to investigate the electrolysis of copper sulfate solution. As you do the
experiment think about:
• how accurate and precise your results are
• any errors in the method you are using
• how you could improve the method.
Method
1. Set up your apparatus and circuit as in the diagram.
2. Measure out 200cm3 of copper sulphate solution using a measuring cylinder and add it to
a beaker.
3. Clean the copper strips with emery paper so they are shiny.
4. Write an A on the top of one strip and a C on the top of the other strip.
5. Weigh each copper strip and record the mass in the results table.
6. Hang each strip in the beaker so it is in the copper sulfate solution. Your teacher will show
you how to do this.
7. Connect the strips into the circuit using crocodile clips and leads.
8. Set the power pack to 6v. Quickly adjust the rheostat so the ammeter reads 0.2 amps.
Start the stop watch.
9. Time the experiment for 5 minutes. Switch off the power supply.
10. Remove the copper strips and weigh them. Record the mass in the results table.
11. Repeat steps 5 to 9 with a current of 0.4, 0.6, 0.8 and 1 amp.

Current in amps
Anode before in
g Anode
after in g Mass
loss in g
Cathode before in
g
Cathode after in g
Mass gain in g
0.20
0.40
0.60
0.80
1.00
Now calculate the gain and loss in mass at each electrode.
Plot a graph of gain in mass against current. On the same axes plot a graph of loss in
mass against current.
Make an evaluation of your data:
• How good is your data?
• How precise is your data?
Make an evaluation of your method:
• Did you make any errors in measuring the mass of the copper?
• How could you have improved the measurements?
• Did the method you used provide valid data?
• What are the limitations of this method?
The activity enables learners to carry out the electrolysis of copper(II) sulfate solution
and to link their findings with the industrial electrolytic refining of copper.
Learners will consider the imitations in the method of data collection and how they
could improve the quality of their data.

Using copper electrodes will show the deposition of copper on the cathode (-ve) and eroding
to the copper strip at the anode (+ve).
Apparatus
For each group of learners:
6 volt DC supply – adjustable power pack
rheostat
ammeter
200 cm3 copper(II) sulfate solution 0.5M
2 Copper strips (electrodes)
Emery paper or wire wool to clean strips before use
Leads and crocodile clips
Measuring cylinder
250cm3 beaker
a small strip of wood to rest on top of the beaker and Blue tac – see note below
retort stand and clamp
Practical instructions
Goggles must be worn and students reminded to wash their hands at the end of the lesson.
Teachers are recommended to check the CLEAPSS data sheets.
There are several ways of securing the carbon electrodes:
• using a retort stand and clamp
• fixed using Blutac on to a small strip of wood resting on the top of the beaker
• strips bent over and hung on the rim of the beaker.

The method selected should be demonstrated to the learners before the experiment starts.
The copper strips will need cleaning with emery paper or wirer wool before use.
It is important that the voltage remains constant throughout the experiment. The equipment
can be set up as in the diagram below.
The amount of copper deposited as the current is increased is measured.
Each time the electrolysis needs about 5 minutes.
Teachers are encouraged to try out the experiment to ascertain the best time interval required.
Sample results
Current in amps
Anode before in
g
Anode after in g
Mass loss in g
Cathode before in
g
Cathode after in g
Mass gain in g
0.2 1.39 1.36 - 0.03 1.33 1.38. 0.05
0.2 1.35 1.31 -0.04 1.37 1.40 0.03
0.2 mean - 0.04 0.04
0.4 1.29 1.20 -0.09 1.40 1.48 0.08
0.4 1.20 1.18 - 0.02 1.47 1.57 0.10
0.4 mean - 0.06 0.09
0.60 1.01 0.91 - 0.10 0.98 1.11 0.13
0.60 0.98 0.89 - 0.09 0.92 1.60 0.14
0.6 mean - 0.10 0.14
0.8 0.91 0.75 - 0.16 1.11 1.27 0.16
0.8 0.72 0.57 - 0.15 1.25 1.41 0.16
0.8 mean - 0.16 0.16
1.00 0.70 0.54 -0.16 1.20 1.03 0.17
1.00 0.68 0.55 -0.13 1.18 1.35 0.17
1.00 mean - 0.15 0.17

Limitations in collecting data
Copper strips have to be removed from the solution for weighing. Not all the cooper will
remain attached to the strip but will drop off into the beaker so the mass recorded will not be
accurate.
Copper strips will hold moisture so mass of copper will not be accurate.
Not changing the copper sulphate solution each time.
Adjusting the current used for each repeat may not be exact.
Errors can also occur in the timing of the electrolysis.
Learners may comment on the lack of repeats at each current setting.
Activity 3 How fit are you? This activity links with R071 LO4 and reinforces R073 LO3.
You are concerned about how fit you are. A friend tells you to do some exercise and count
your pulse rate.
This activity investigates the effect of increasing the speed on the pulse rate.
Measuring your resting pulse rate
1. Sit down and rest for two minutes.
2. Find your pulse at the wrist.
3. Your partner will start the stopwatch and you will count your pulse out loud so your partner
can hear.
4. Record the number of beats after 15 seconds and then after 60 seconds in table 1.
Measuring your pulse rate at different speeds
1. Measure out a set distance. Your teacher will tell you where to measure.
2. Make sure you are wearing suitable shoes and clothes.

3. Work with a partner. Your partner starts the stopwatch as you start to walk the distance
you have measured.
4. Stop the stopwatch as soon as you complete the distance. Record the time taken in table
2.
5. Straight away measure your pulse in the same way as you did before. Count out loud so
you partner can hear.
6. Your partner will record your pulse after 15 seconds and then after 60 seconds in table 1.
7. Rest for 2 minutes before starting the next part of the activity.
8. Repeat the method for steps 3 – 7 for a quick walk, a jog, a run, and then a sprint. These
will give you different speeds.
9. Make sure you have recorded all your results in the table 1 and 2.
Put your results in the table below.
Table 1
Activity Number of pulse beats in 15s
Number of pulse beats in 60s
Rest
Walk
Quick walk
Jog
Run
Sprint
Look at the results for the time taken for each activity.
Use the formula below to calculate the speed for each activity.
Speed = distance/time
Complete the table below.

Table 2
Activity Distance in m Time taken in s Average speed in m/s
Rest
Walk
Quick walk
Jog
Run
Sprint
Copy your results for the pulse rate after 15 seconds into table 3.
Calculate the pulse rate per minute by multiplying the number of beats in 15 seconds by 4.
Write your answer in table 3.
Table 3
Activity Number of pulse beats in 15s
Number of pulse beats in 60s
Rest
Walk
Quick walk
Jog
Run
Sprint
Plot a graph of average speed against pulse rate (number of beats per minute) using the data
from table 1. Make sure you use suitable scales, label the axes and complete the graph with a
suitable line.
On the same axes, now plot the results for the calculated pulse rate per minute using data
from table 3.

Describe any patterns in your results.
Were there any unexpected results?
Write a conclusion using the data.
Use your scientific knowledge about the effect of exercise on the body to explain any
difference in the patterns in the data from calculating the rate per minute and measuring the
rate per minute.
This is a more complex approach to the usual experiment on the affect of exercise on pulse
rate. This will introduce the idea of rate. Results could be used to deliver the calculation of
rate and also speed.
Learners could carry out the experiment and collect their own results if time permits. A sample
set of results is provided if teachers do not wish learners to carry out the experiment.
They will need to covert beats per 15s and 60s to rates.
They will require the equation for calculating speed: average speed = distance/time
Learners will plot a graph for pulse rate against speed of exercise. Two graphs can be plotted
on the same axes so as to compare counting pulse rate for 15s and 60s.
More able learners can also calculate the pulse rate per minute and discuss why this is
different from the results gained for measuring over one minute.
Sample experimental results
Learners measured their pulse rate after taking part in different types of exercise.
The exercise took place over 80m. The pulse was counted for 15s and also for 60s.

Table 1
Activity Number of pulse beats in 15s
Number of pulse beats in 60s
Rest 17 68 Walk 19 71 Quick walk 27 105 Jog 33 127 Run 34 133 Sprint 36 143
Table 2
Activity Distance in m Time taken in s Average speed in m/s
Rest 0 0 0
Walk 80 53.5 1.5
Quick walk 80 29.0 2.8
Jog 80 22.4 3.8
Run 80 15.9 5.0
Sprint 80 13.4 6.0 Table 3
Activity Number of pulse beats in 15s
Number of pulse beats in 60s
Rest 17 68 Walk 19 76 Quick walk 27 108 Jog 33 132 Run 34 136 Sprint 36 144

Apparatus
Stopwatches
Tape or trundle wheel
Calculators to work out speed
Practical instructions
Learners carrying out the activity will need appropriate clothing and footwear. It is important to
check they are physically fit on the day.
You should demonstrate taking the pulse and timing the pulse for 15 seconds and 1 minute.
The measurement of the pulse must be for a continuous minute, with the pulse for 15 seconds
recorded; this will allow them to consider the effect of recovery.
A suitable track is needed for example, a 100m running track or 4 or more lengths of the play
area (this must be measured).
The learners will need to rest for two minutes between each activity. The recovery time will
form an important part of the evaluation.

Activity 4 Survival of the fittest This activity links with R072 LO1.
Charles Darwin noticed that some organisms were better adapted to their surroundings than
others. He thought that the best adapted were more likely to survive and breed. The least
adapted ones would die without leaving any offspring.
Animals that stand out are more likely to be caught by predators.
The hypothesis is: the varieties of animals with the better adaptation will increase in number
because more will survive to breed. To find out if the hypothesis is correct you are going to do
an experiment which models the effect of a predator catching its prey.
Method
1. Choose two colours of rice grains. These will represent two different varieties of the same
animal.
2. Count out 50 rice grains of each colour and then mix them together. This is the original
population of animals [e.g. 50 red and 50 grey making 100 in total].
3. Take a shallow container e.g. a margarine tub and add a handful of coloured sawdust.
This is the habitat.
4. Add the 100 rice grains and shake the container to mix the contents thoroughly.
5. You are going to be the predator. Use a pair of tweezers to pick out as many rice grains as
you can in exactly 1 minute.
6. Count the number of each colour of rice grain. If the total number of rice grains is an odd
number, pick out one more from the container and add it to your catch. Write down your
results in the table.
7. Now you are going to replace the rice grains you removed with equal numbers of the two
different colours. For example, if you removed 10 of one colour and 20 of the other [30
total] you will replace them with 15 of each colour.

8. This will have changed the proportions of the two colours of rice grain. In the example, the
population of one colour will have decreased by 5 and the other will have increased by 5.
9. You now need to repeat steps 5, 6 and 7 four more times. Write down how many rice
grains of each colour you removed and replaced each time. Record your results in the
table.
Colour of background ……………………………..
Before predation
(a)
red grey
Number removed in 1
min (b)
red grey
Number replaced
(c)
red grey
Number after Predation (a – b) + c
red grey
Parents 50 50
1st generation
2nd generation
3rd generation
4th generation
5th generation
Analysing and interpreting results
1. Complete the data table by writing in your results for the five separate minutes of
predation.
Work out how the numbers of the two different colours of rice grains changed for each
generation – ( a- b) + c. Fill in your answer in the last column of the table. [This is after
each minute of predation when you have removed and replaced the rice grains]
2. Draw a graph to show how the numbers of each colour of rice grain changes after each
minute of predation.
You can use graph paper or a computer to draw your graph.
Make sure you choose suitable scales, and remember to label the axes.
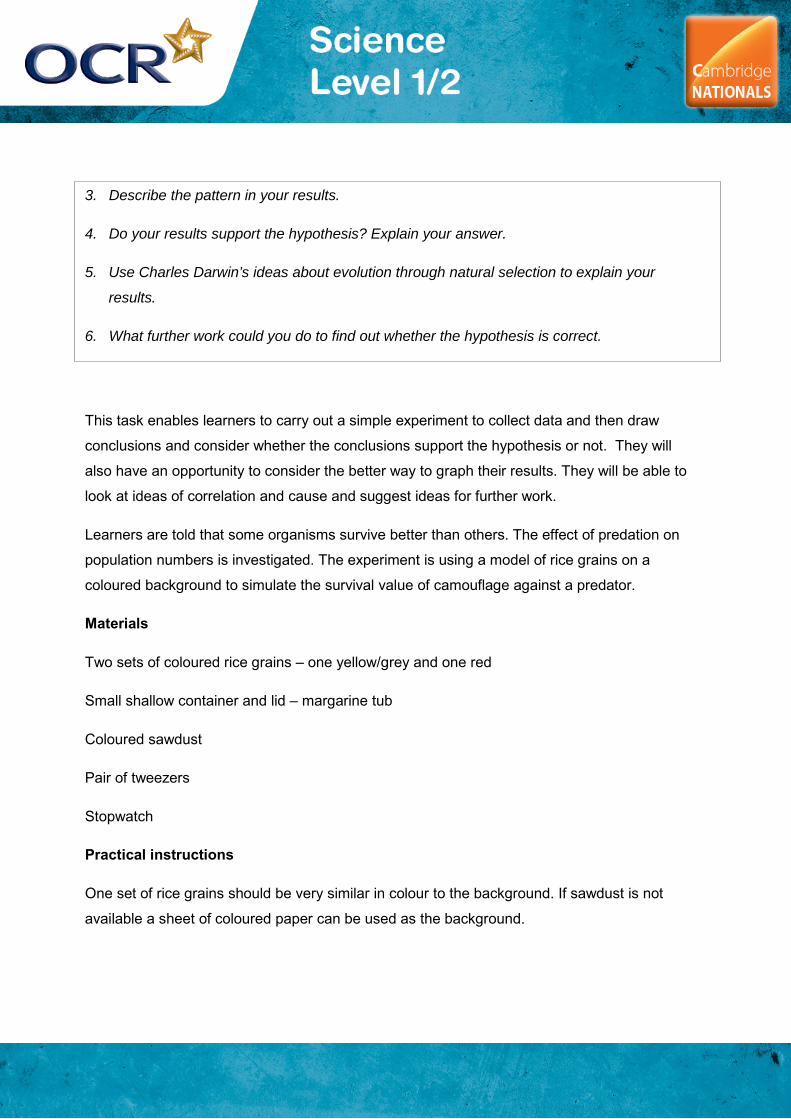
3. Describe the pattern in your results.
4. Do your results support the hypothesis? Explain your answer.
5. Use Charles Darwin’s ideas about evolution through natural selection to explain your
results.
6. What further work could you do to find out whether the hypothesis is correct.
This task enables learners to carry out a simple experiment to collect data and then draw
conclusions and consider whether the conclusions support the hypothesis or not. They will
also have an opportunity to consider the better way to graph their results. They will be able to
look at ideas of correlation and cause and suggest ideas for further work.
Learners are told that some organisms survive better than others. The effect of predation on
population numbers is investigated. The experiment is using a model of rice grains on a
coloured background to simulate the survival value of camouflage against a predator.
Materials
Two sets of coloured rice grains – one yellow/grey and one red
Small shallow container and lid – margarine tub
Coloured sawdust
Pair of tweezers
Stopwatch
Practical instructions
One set of rice grains should be very similar in colour to the background. If sawdust is not
available a sheet of coloured paper can be used as the background.
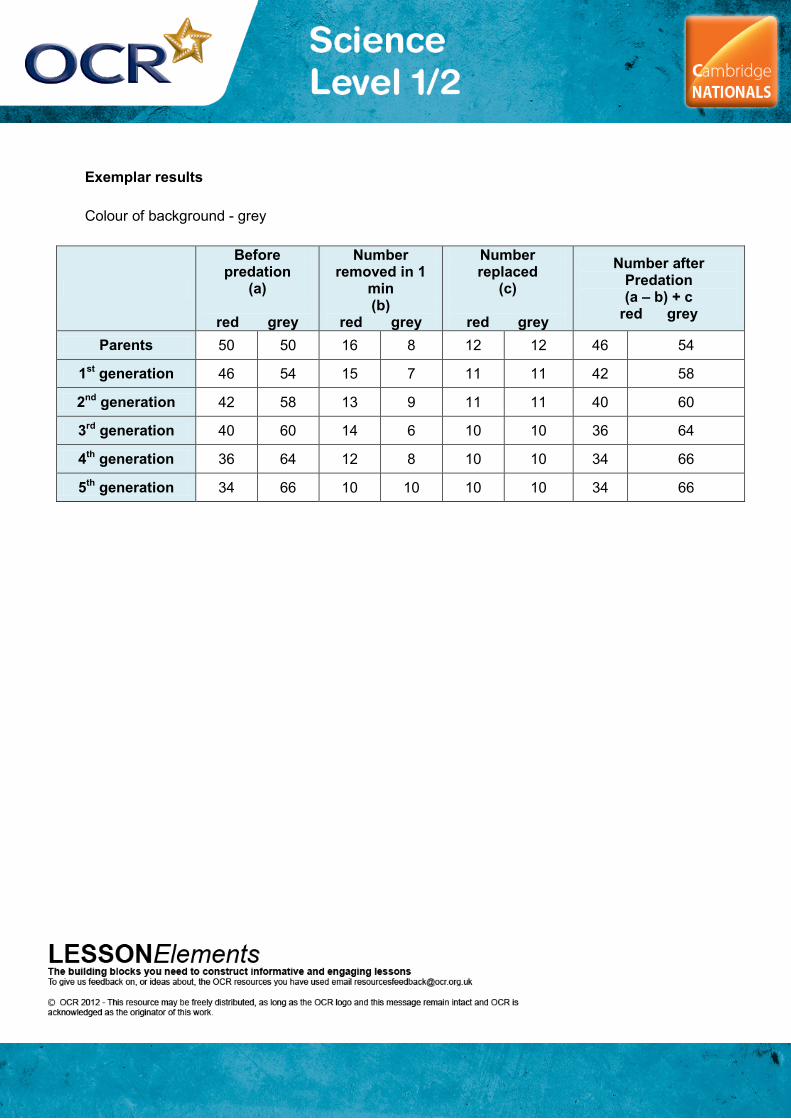
Exemplar results
Colour of background - grey
Before predation
(a)
red grey
Number removed in 1
min (b)
red grey
Number replaced
(c)
red grey
Number after Predation (a – b) + c
red grey
Parents 50 50 16 8 12 12 46 54
1st generation 46 54 15 7 11 11 42 58
2nd generation 42 58 13 9 11 11 40 60
3rd generation 40 60 14 6 10 10 36 64
4th generation 36 64 12 8 10 10 34 66
5th generation 34 66 10 10 10 10 34 66


![MAGNESIUM SULPHATE - ::krishna::krishna.nic.in/pdffiles/msme/chemical/magnesium sulphate[1].pdf · 1 magnesium sulphate contents section i product characteristics and specification](https://img.pdfslide.us/doc/110x75/5a9ea3327f8b9a0d158ba493/magnesium-sulphate-krishna-sulphate1pdf1-magnesium-sulphate-contents-section.jpg)


![Aluminium Sulphate[1]](https://img.pdfslide.us/doc/110x75/563db7b2550346aa9a8d1fe5/aluminium-sulphate1.jpg)