Embed Size (px)
Citation preview
CENTRAL RESEARCH LIBRARYDOCUMENT COLLECTION
3
ORNL-4366
UC-4 —Chemistry
CHEMICAL TECHNOLOGY DIVISION
UNIT OPERATIONS SECTION
QUARTERLY PROGRESS REPORT
JULY-SEPTEMBER 1968
OAK RIDGE NATIONAL LABORATORY
operated by
UNION CARBIDE CORPORATION
for the
U.S. ATOMIC ENERGY COMMISSION
Printed in the United States of America. Available from Clearinghouse for Federal
Scientific and Technical Information, Notional Bureau of Standards,
U.S. Department of Commerce, Springfield, Virginio 22151
Price: Printed Copy $3,00; Microfiche $0.65
LEGAL NOTICE
This report was prepared as an account of Government sponsored work. Neither the United States,
nor the Commission, nor any person acting on behalf of the Commission:
A. Makes any warranty or representation, expressed or implied, with respect to the accuracy,
completeness, or usefulness of the information contained in this report, or that the use of
any information, apparatus, method, or process disclosed in this report may not infringe
privately owned rights; or
B. Assumes any liabilities with respect to the use of, or for damages resulting from the use of
any information, opporotus, mothod, or process disclosed in this report.
As used in the above, "person acting on behalf of the Commission*' includes any employee or
contractor of the Commission, or employee of such contractor, to the extent that such employee
or contractor of the Commission, or employee of such contractor prepares, disseminates, or
provides access to, any information pursuant to his employment or contract with the Commission,
or his employment with such contractor.
ORNL-k%6
Contract No. W-7405-eng-26
UNIT OPERATIONS SECTION QUARTERLY PROGRESS REPORT
July-September I968
CHEMICAL TECHNOLOGY DIVISION
M. E. Whatley
P. A. Haas
L. E. McNeese
A• D. Ryon
C. D. Watson
APRIL 1970
OAK RIDGE NATIONAL LABORATORY
Oak Ridge, TennesseeOperated by
UNION CARBIDE CORPORATION
for the
U. S. ATOMIC ENERGY COMMISSION
IIIJ iSnim "ENERGY RESEARCH L™™ES
3 44Sb DS1SSS3 2

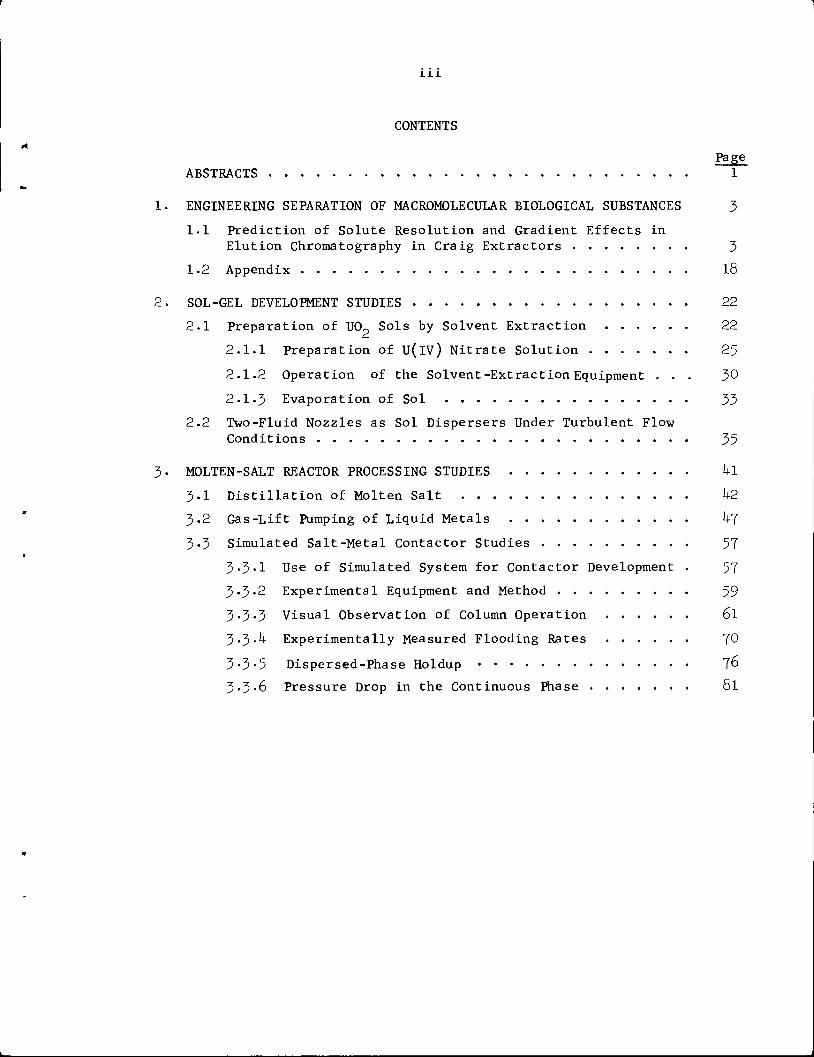
CONTENTS
PagJABSTRACTS 1
ENGINEERING SEPARATION OF MACROMOLECULAR BIOLOGICAL SUBSTANCES 3
1.1 Prediction of Solute Resolution and Gradient Effects in
Elution Chromatography in Craig Extractors 3
1.2 Appendix 18
SOL-GEL DEVELOPMENT STUDIES 22
2.1 Preparation of UO? Sols by Solvent Extraction 22
2.1.1 Preparation of U(lV) Nitrate Solution 25
2.1.2 Operation of the Solvent-Extraction Equipment ... 30
2.1-3 Evaporation of Sol 33
2.2 Two-Fluid Nozzles as Sol Dispersers Under Turbulent FlowConditions 35
MOLTEN-SALT REACTOR PROCESSING STUDIES 4l
3.1 Distillation of Molten Salt 42
3.2 Gas-Lift Pumping of Liquid Metals h'J
3.3 Simulated Salt-Metal Contactor Studies 57
3-3-1 Use of Simulated System for Contactor Development . 57
3.3-2 Experimental Equipment and Method 59
3-3-3 Visual Observation of Column Operation 6l
3.3.4 Experimentally Measured Flooding Rates 70
3-3-5 Dispersed-Phase Holdup 76
3«3*6 Pressure Drop in the Continuous Phase 81

ABSTRACTS
1. ENGINEERING SEPARATION OF MACROMOLECULAR BIOLOGICAL SUBSTANCES
Key parameters for the successful separation of solutes in the chroma
tographic elution of macromolecules have been identified by means of a
mathematical analysis based on the Craig type of solvent extraction.
2. SOL-GEL DEVELOPMENT STUDIES
2.1 Preparation of U0p Sols by Solvent Extraction
The preparation of U0„ sols by solvent extraction has been success
fully scaled up, and engineering equipment has been operated continuously
to produce 6 liters of 0.2 M sol per hour. A 14-liter batch slurry
reductor was developed, and was used to produce more than kO kg of U(lV)
nitrate solution that was suitable as feed for the solvent-extraction
process. In the extraction process, a 30-min interstage digestion step
carried out at about 60°C produced the best-quality sol.
2.2 Development of Two-Fluid Nozzle
The development of processes and equipment for sol-gel ceramic fuels
was continued. The two-fluid nozzle in conjunction with turbulent flow
conditions was applied to the preparation of sol droplets 20 to 300 \i in
diameter, and a dimensionless correlation was derived for the results.
3- MOLTEN-SALT REACTOR PROCESSING STUDIES
Information obtained from the nonradioactive operation of the MSRE
Distillation Experiment is summarized. Calculations indicate that dis
tillation of 10 to 40$ of MSBR fuel salt will produce a significant
increase in the free-fluoride content, which will improve the rare-earth:
thorium separation factor in the subsequent reductive extraction.
A series of experiments to test the feasibility of gas-lift pumping
of liquid metals such as bismuth was made with mercury.
Measurements of dispersed-phase holdup, continuous-phase pressure
drop, and throughput at flooding have been made for the countercurrent
flow of water and mercury in a l-in.-diam column containing various types
and sizes of packing materials.
Previous Reports in This Series for the Year I968
January-March ORNL-4-364April-June ORNL-4365
1. ENGINEERING SEPARATION OF MACROMOLECULAR BIOLOGICAL SUBSTANCES
1.1 Prediction of Solute Resolution and Gradient Effects in
Elution Chromatography in Craig Extractors
W. S. Groenier A. D. Ryon
The elution operation of the Craig solvent extractor was analyzed
mathematically to enable us to predict its performance for the separation
of solutes. The analysis should also be helpful in simulating the trans
port of macromolecules in elution chromatography.
During each cycle of operation of a Craig extractor, two immiscible
liquid phases are mixed in each stage, allowed to settle, and then
separated completely. The heavy phase in each stage is stationary, while
the light phase progresses from one stage to the next. By this method,
the portion of heavy phase in each stage is successively contacted in a
stepwise manner with new portions of light phase. The analogy between
such extractions and elution chromatography is straightforward when one
considers Craig extractors to have a sufficient number of stages to account
for chromatographic adsorption sites and enough cycles to approximate the
continuous operation of an elution column.
Craig extractors perform mass-transfer operations as follows; First,
a portion of the heavy phase is added to each stage. Then, the feed
(i.e., the light phase) is admitted to stage 1 in cycle 1. On contact of
the two phases, some solute is transferred from the feed to the heavy
phase in that stage. In succeeding cycles, the feed progresses to other
stages and is further depleted of solute, while fresh portions of the
light phase (but containing no solute) are admitted to stage 1. These
additions serve to wash the solute through the device by reextracting some
solute in each stage. Now if the original feed contains more than one
solute, and if each solute exhibits a different mass distribution to the
opposite phase, these solutes will be washed out of the contactor in
different cycles and will, therefore, be separated. A Gaussian concen
tration distribution of solutes is obtained if we assume constant dis-
tribution coefficients and phase ratios. The sharpness of the emerging
concentration peak and the overlap of emerging concentration distributions
are of interest, since clean separation of solutes demands minimum overlap,
and significant product concentration demands a high concentration peak.
To more closely fit Craig-type extractions to conditions observed with
real chromatographic columns, we deviated from normal operation as follows:
Allowances were made for the case in which solute is delayed in the column
packing by some stronger adsorbing medium. This can be expressed as an
incomplete phase separation in the extraction analogy. Also, in order to
wash all solutes through the column in a reasonable period of time, the
salt content of the wash solution (weak sodium chloride solution) was
usually altered in a programmed manner to hasten emergence of the last
solute. This type of operation, known as gradient elution, was treated
in the extraction analogy by having the mass distribution coefficient vary
in a programmed manner with each cycle. The influence of such a gradient
on concentration distribution overlap was determined.
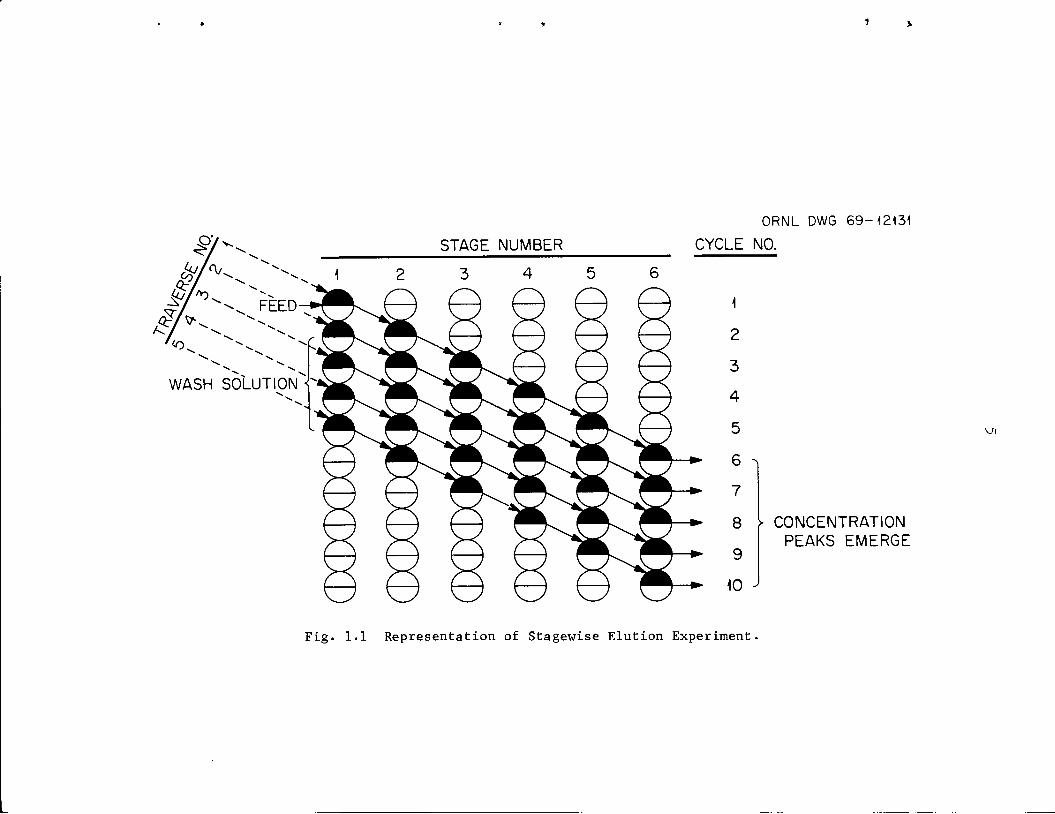
In Fig. 1.1, a schematic diagram of the process is shown. All of the
stages retain heavy phase. Note the manner in which feed and wash
solutions proceed through the stages with succeeding cycles. The path
of feed or any solvent portion is labeled as a traverse.
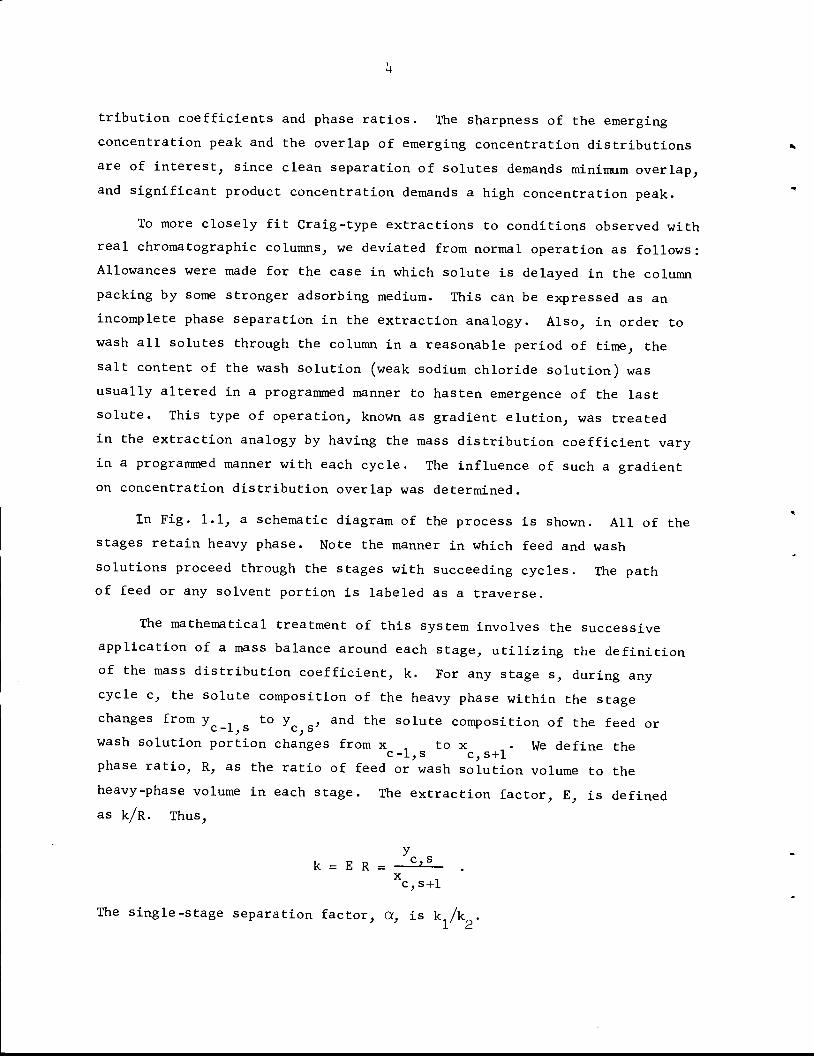
The mathematical treatment of this system involves the successive
application of a mass balance around each stage, utilizing the definition
of the mass distribution coefficient, k. For any stage s, during any
cycle c, the solute composition of the heavy phase within the stage
changes from y^^ g to y^ g, and the solute composition of the feed orwash solution portion changes from x , to x -We define the
c-l,s c,s+lphase ratio, R, as the ratio of feed or wash solution volume to the
heavy-phase volume in each stage. The extraction factor, E, is definedas k/R. Thus,
yc sk = E R = C'S .c,s+l
The single-stage separation factor, a, is k /k .
STAGE NUMBER
ORNL DWG 69-12131
CYCLE NO.
Y CONCENTRATIONPEAKS EMERGE
Fig. 1.1 Representation of Stagewise Elution Experiment,
The stage product compositions in terms of inlet compositions are;
1
c,s+l 1 + E
_ 1yc,s ~ 1 - E
Rx 1 + y nc-l,s yc-l,s
R
-l,s +yc-l,sV
A computer program (ELUGRA) was written to perform the above calcula
tions for systems of up to 1000 stages involving up to 3 solutes and 1000
traverses (2000 cycles). Provisions were made for both linear and log
arithmic gradients and for incomplete phase separation. The program, along
with instructions for its use, is presented in the Appendix (Sect. 1.2).
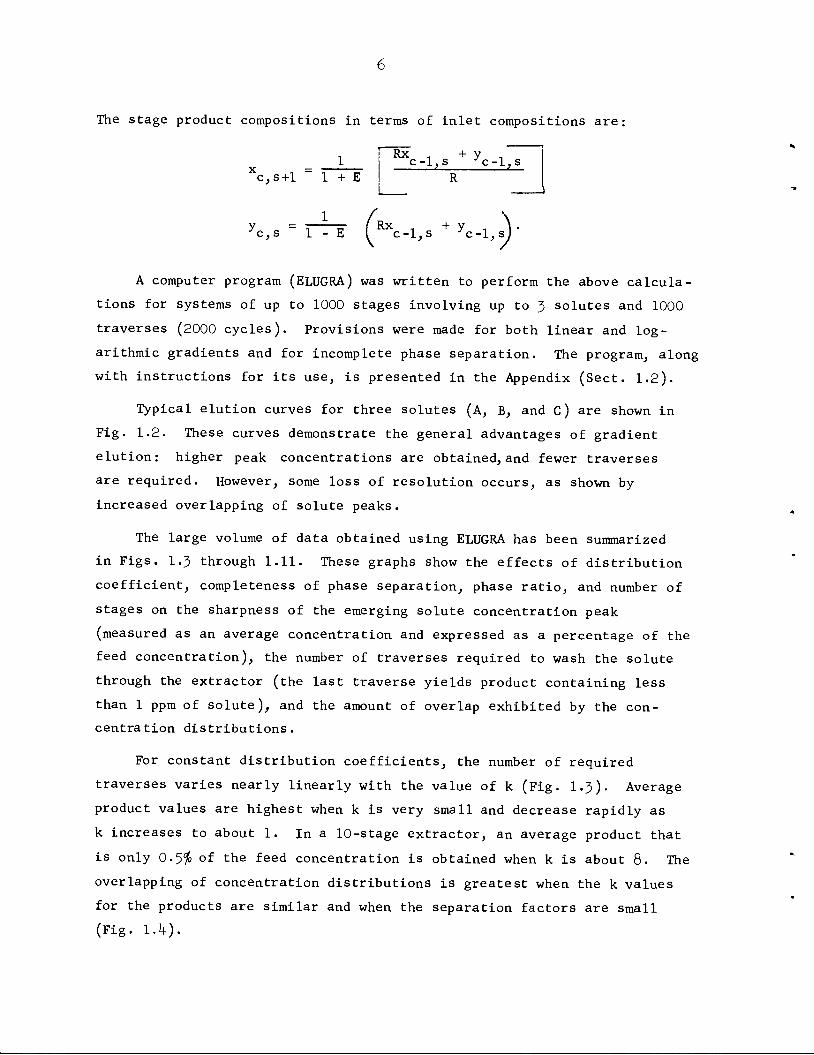
Typical elution curves for three solutes (A, B, and C) are shown in
Fig. 1.2. These curves demonstrate the general advantages of gradient
elution: higher peak concentrations are obtained, and fewer traverses
are required. However, some loss of resolution occurs, as shown by
increased overlapping of solute peaks.
The large volume of data obtained using ELUGRA has been summarized
in Figs. 1.3 through 1.11. These graphs show the effects of distribution
coefficient, completeness of phase separation, phase ratio, and number of
stages on the sharpness of the emerging solute concentration peak
(measured as an average concentration and expressed as a percentage of the
feed concentration), the number of traverses required to wash the solute
through the extractor (the last traverse yields product containing less
than 1 ppm of solute), and the amount of overlap exhibited by the con
centration distributions.
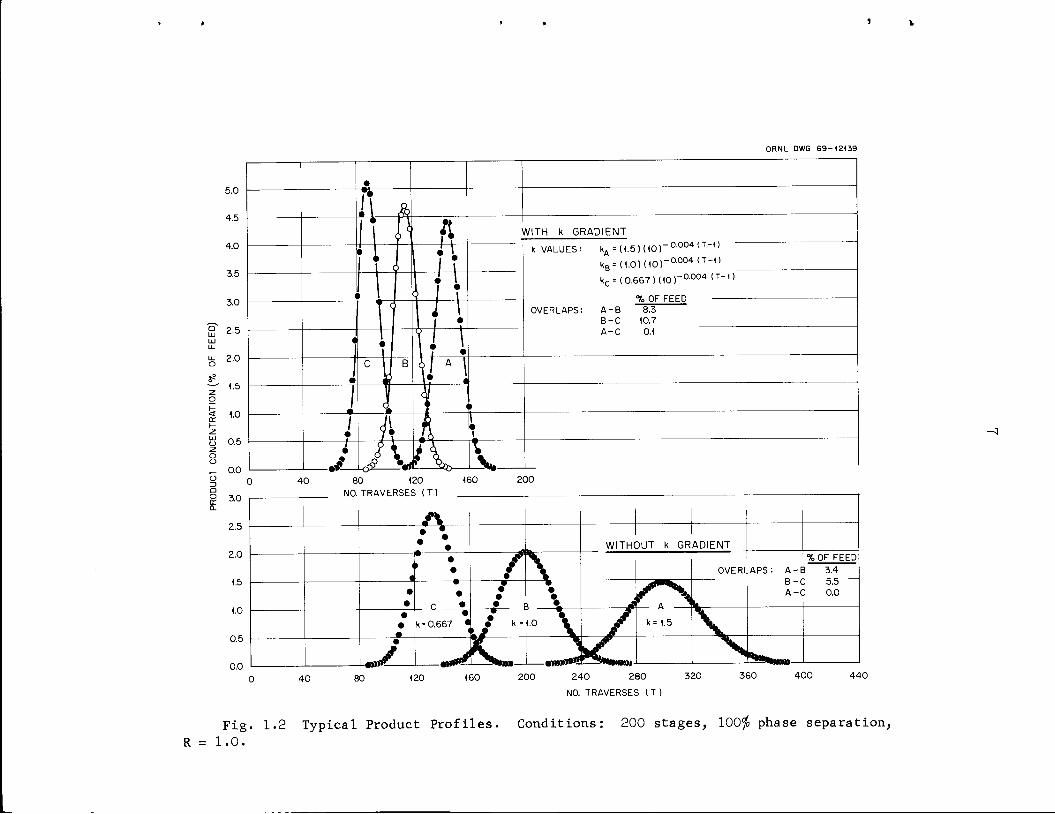
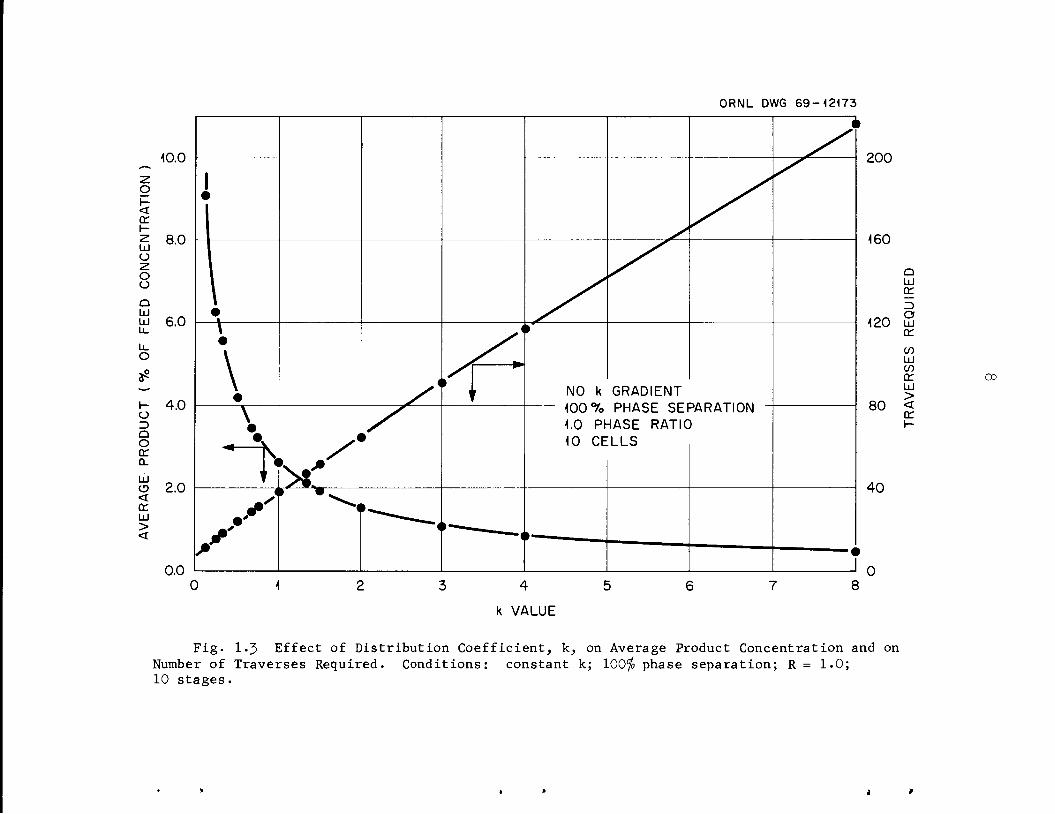
For constant distribution coefficients, the number of required
traverses varies nearly linearly with the value of k (Fig. 1-3). Average
product values are highest when k is very small and decrease rapidly as
k increases to about 1. In a 10-stage extractor, an average product that
is only 0.5$ of the feed concentration is obtained when k is about 8. The
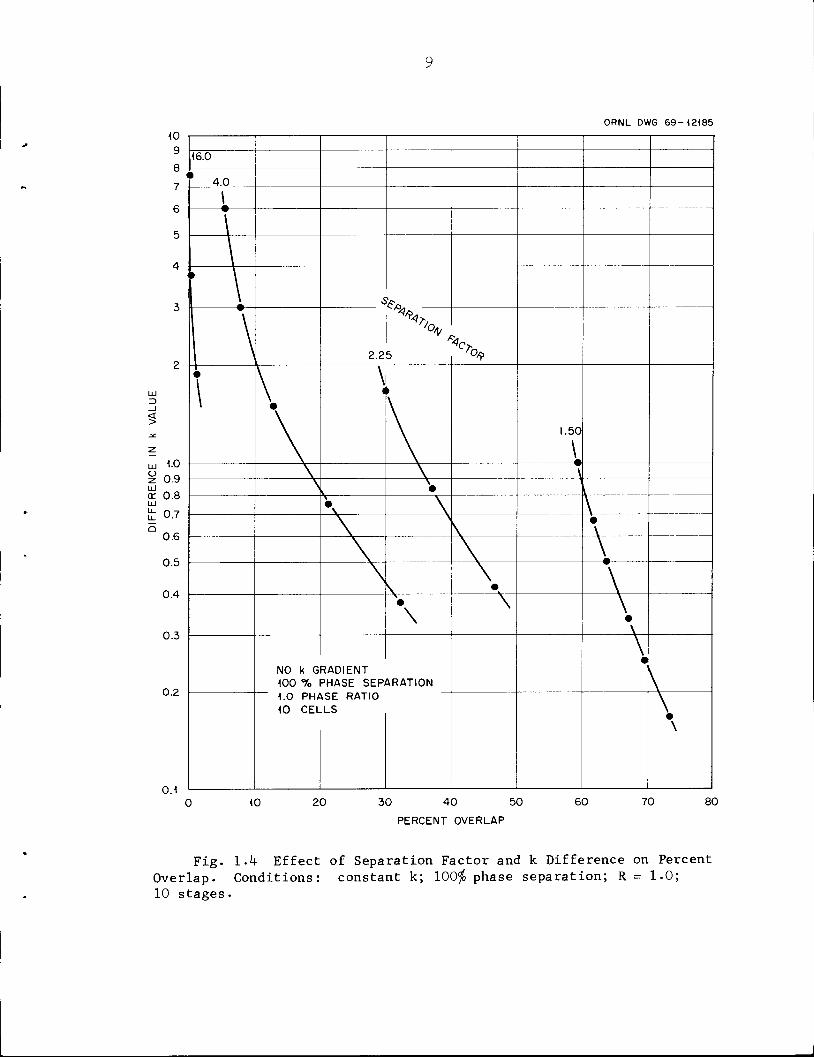
overlapping of concentration distributions is greatest when the k values
for the products are similar and when the separation factors are small
(Fig. 1.4).
§ 3.0a.
2.5
2.0
1.5
1.0
0.5
0.0
WITH k GRADIENT
k VALUES'- kA =(1.5)(10)-°-004(TH) "kB=(1.0)(10)-a004(TH)kc =(0.667)(10ra004(T-n
% OF FEED
OVERLAPS: A-B 8.3B-C 10.7
A-C 0.1
ORNL DWG 69-12139
A;\ WITHOUT k GRADIENT
1
•
•
» • ~7\% OF FEED
OVERLAPS: A-B 3.4
•
•
•
r •
••
•
• L
••
#P/"\
t
A-C 0.0
•
••
•
k =0.667 « J k.,o \ / k=1.5 X•
mas? -^c *my>yvfir*t>*i»m, \40 80 120 160 200 240 280
NO. TRAVERSES ( T )
320 360 400 440
Fig. 1.2 Typical Product Profiles. Conditions: 200 stages, 100$ phase separation,R = 1.0.
<or
UJ
o
oo
QUJUJU_
U_o
8*
o3QOQC0.
UJo<
uj><
ORNL DWG 69-12173
10.0
Fig. 1-3 Effect of Distribution Coefficient, k, on Average Product Concentration and onNumber of Traverses Required. Conditions: constant k; 100$ phase separation; R = 1.0;10 stages.
CD
30 40 50
PERCENT OVERLAP
ORNL DWG 69-12185
Fig. 1-4 Effect of Separation Factor and k Difference on PercentOverlap. Conditions: constant k; 100$ phase separation; R = 1.0;10 stages.
<or
LU
cj
oc_>
QLUUJU_
U_
O
o
QOorQ_
LUO<orUJ
10
ORNL DWG 69-12174
280
240
200
or
3
OUJcc
COLUCO0TLU><or
60 70 80 90
PHASE SEPARATION (%)
<00
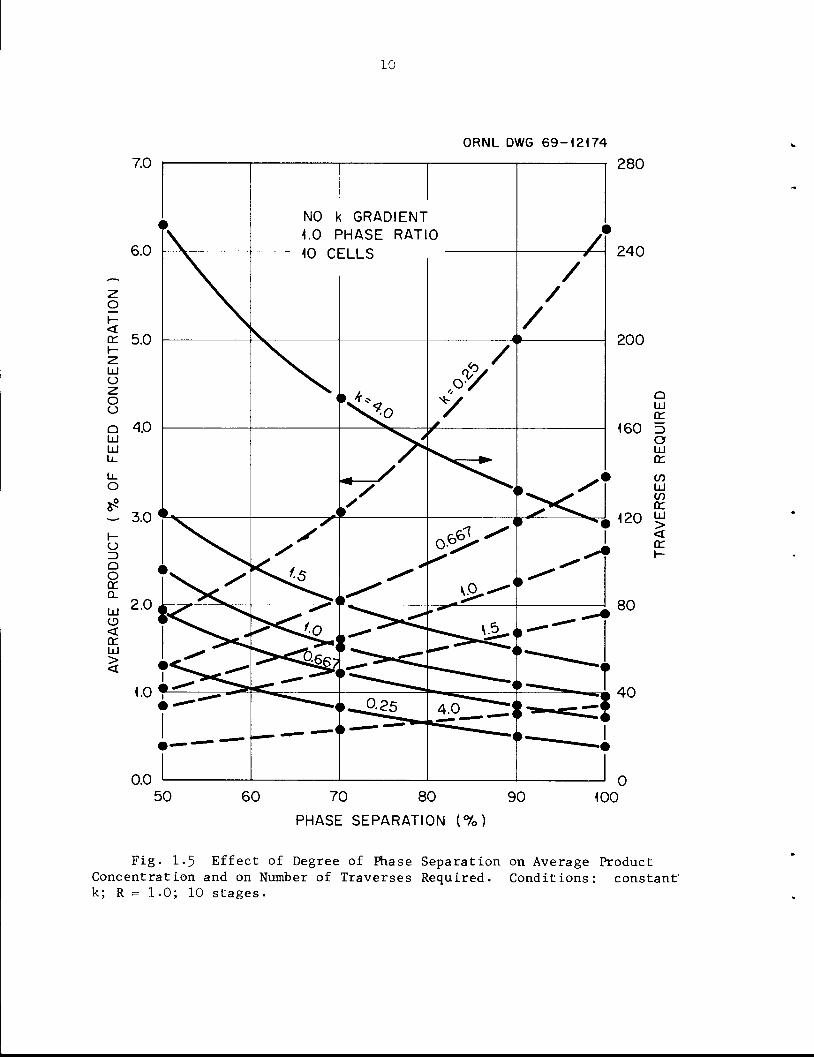
Fig. 1-5 Effect of Degree of Phase Separation on Average ProductConcentration and on Number of Traverses Required. Conditions: constant'k; R = 1.0; 10 stages.
11
ORNL DWG 69-12175
70 80 90
PHASE SEPARATION (%)
Ak
0.167
0.25
0.333
0.5
0.667
1.0
• 2.25 0.417
2.25 0.833
4.0 0.375
*-—• 2.25 1.667
• 4.0 0.75
• 4.0 1.5
• 4.0 3.0
16.0I 16.0
6.0
1.8753.75
,16.0 7.5
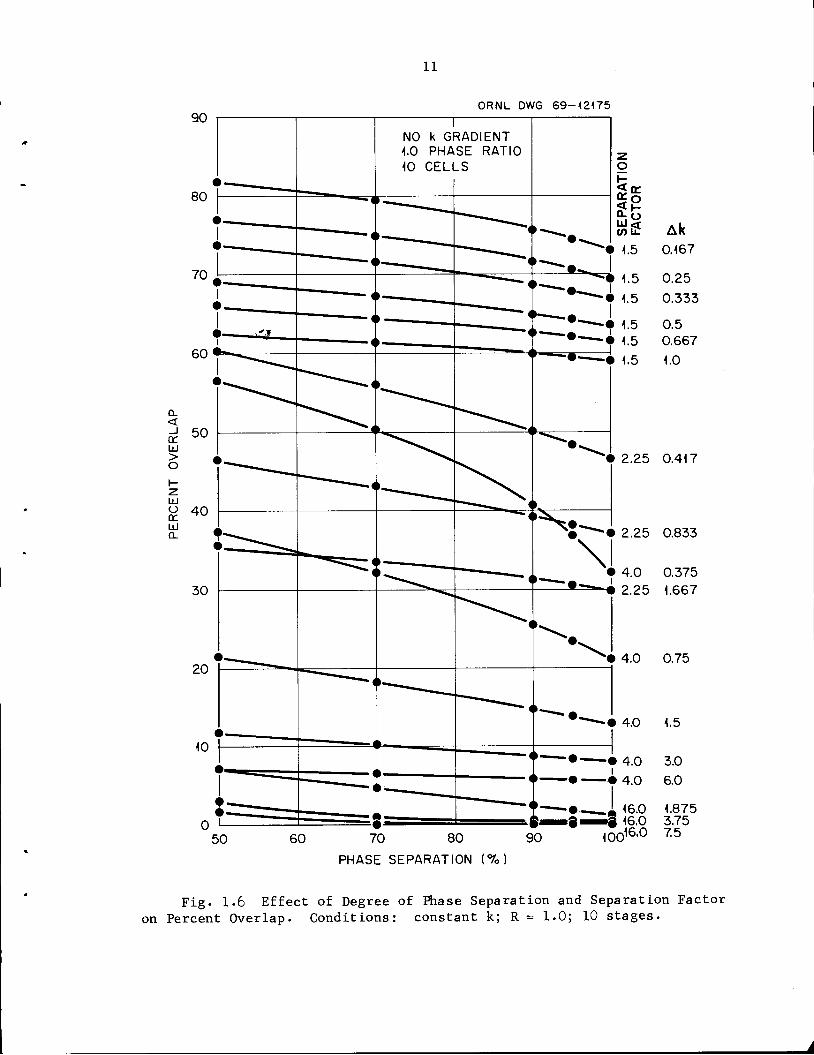
Fig. 1.6 Effect of Degree of Phase Separation and Separation Factolron Percent Overlap. Conditions: constant k; R = 1.0; 10 stages.
o
e
oo
•
o
o
Q
Oora.
UJ
©<cc111
><
0.8 1.0
PHASE RATIO
ORNL DWG 69-12183
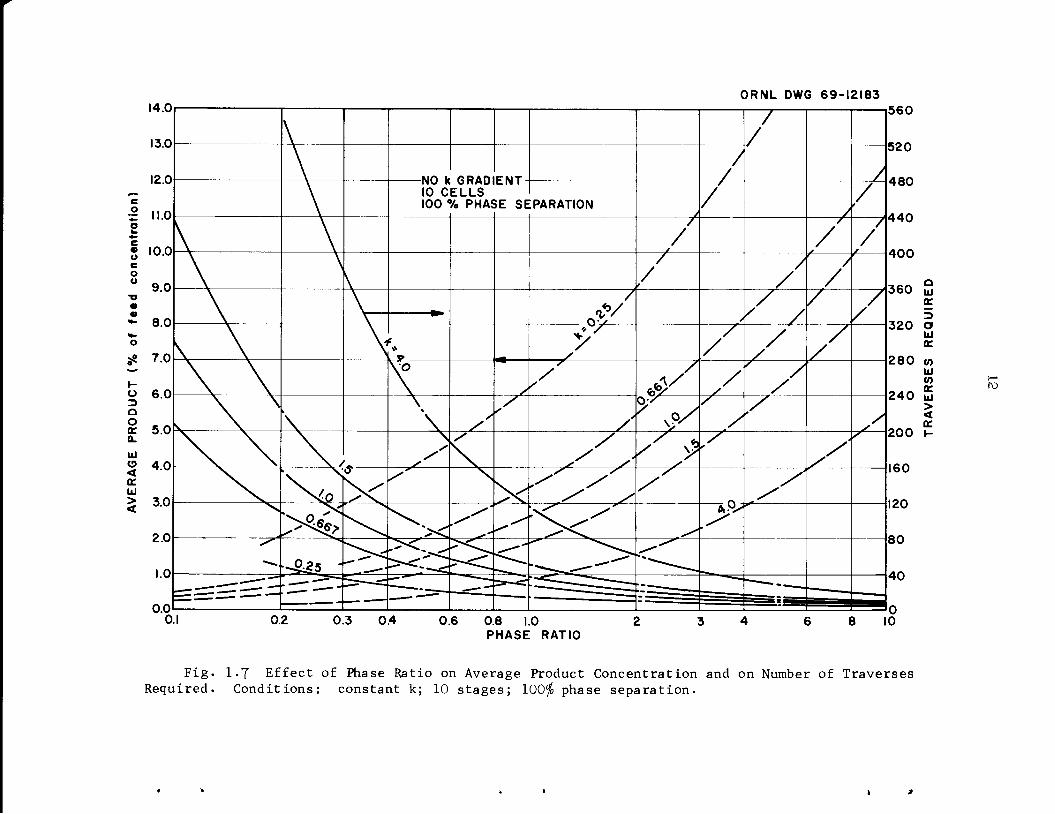
Fig. 1-7 Effect of Phase Ratio on Average Product Concentration and on Number of TraversesRequired. Conditions: constant k; 10 stages; 100$ phase separation.
ro
100
<
CCUJ>o
ocrUlQ-
0.8 1
PHASE RATIO
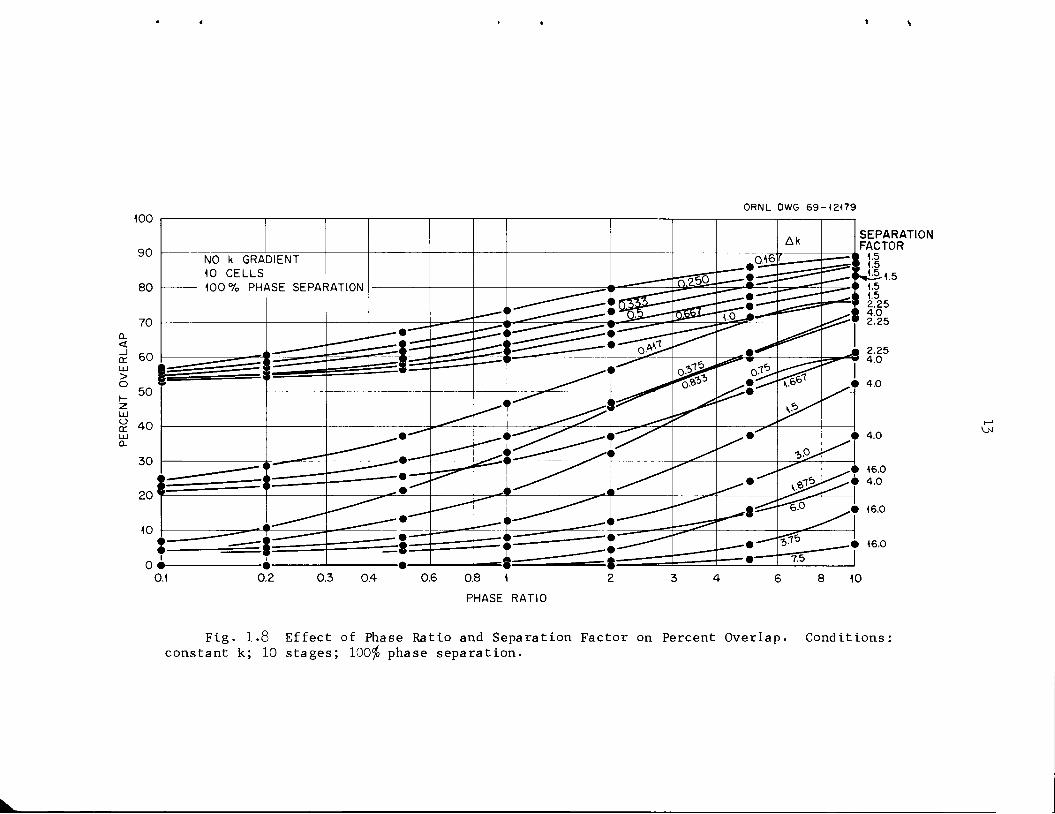
ORNL DWG 69-12179
SEPARATIONFACTOR' 1.5
Fig. 1.8 Effect of Phase Ratio and Separation Factor on Percent Overlap. Conditions:constant k; 10 stages; 100$ phase separation.
VJJ
<or
LUUz
o(_>
QLUUJU-
L_O
O
QOcr
<
ui><
40 50 60 80 100
NO. STAGES
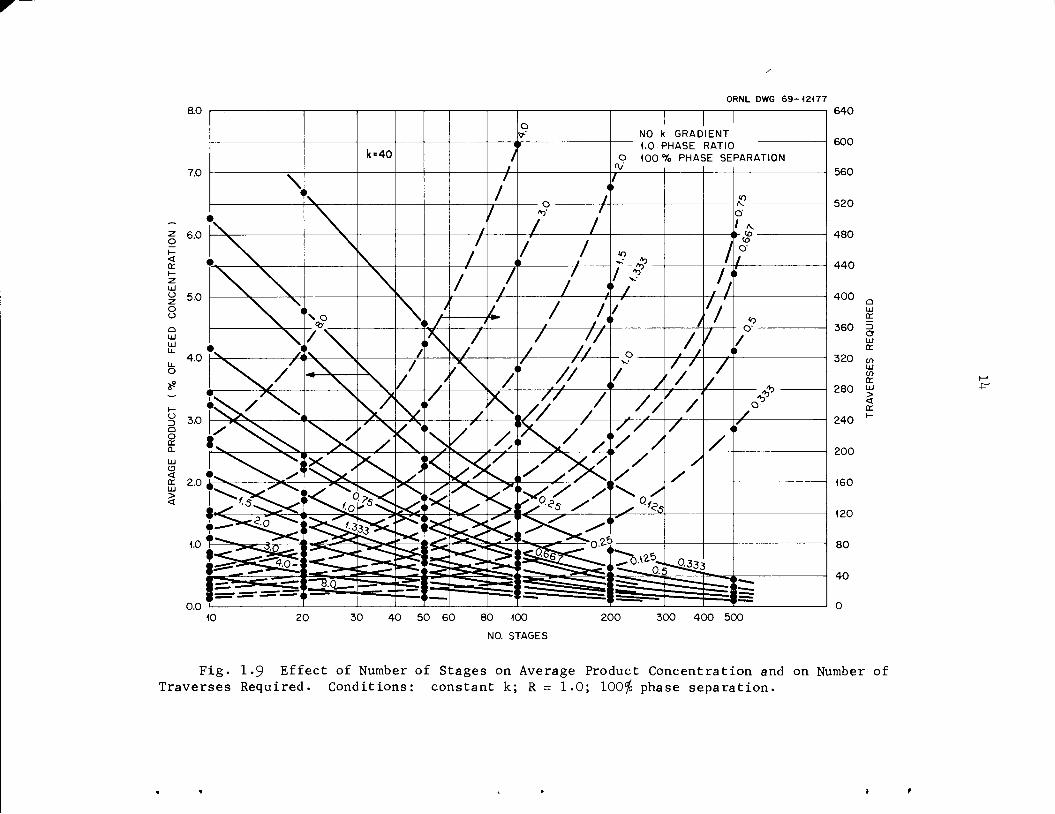
ORNL DWG 69-12177
300 400 500
Fig. 1-9 Effect of Number of Stages on Average Product Concentration and on Number ofTraverses Required. Conditions: constant k; R = 1.0; 100$ phase separation.
15
50 60 80 100NO. STAGES
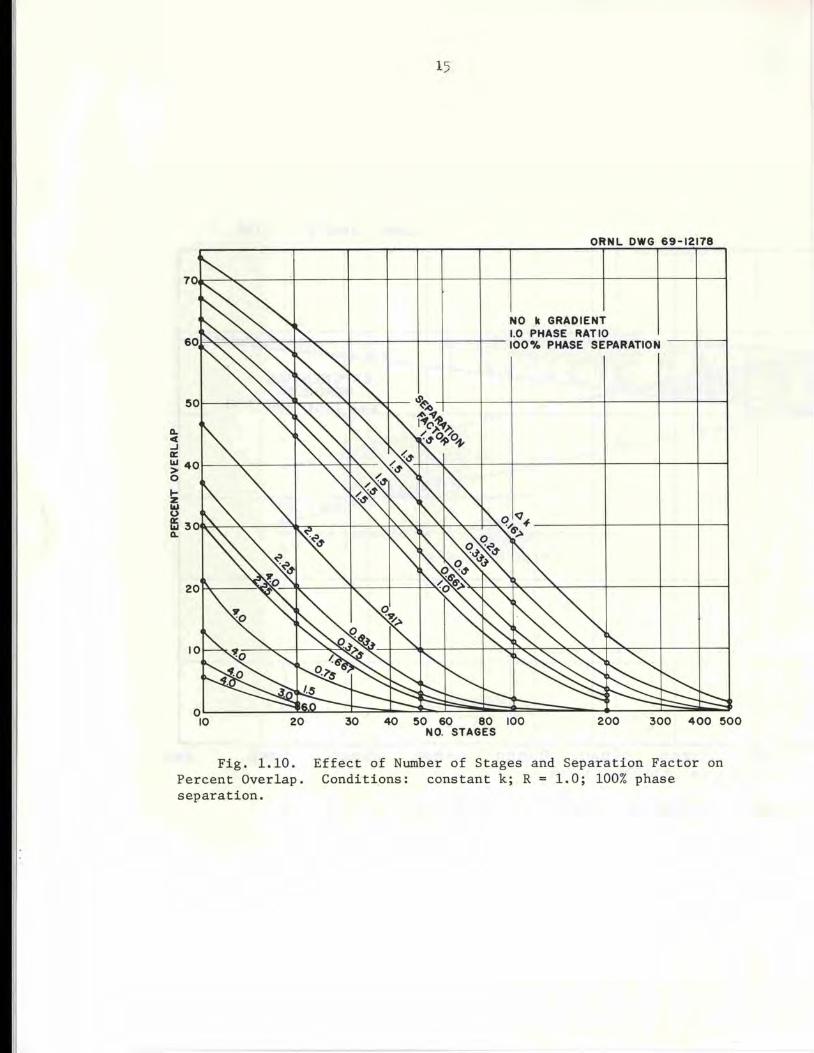
ORNL DWG 69-12178
300 400 500
Fig. 1.10. Effect of Number of Stages and Separation Factor onPercent Overlap. Conditions: constant k; R = 1.0; 100% phaseseparation.
160 180 200 220
NO. TRAVERSES (no gradient)240 260 280
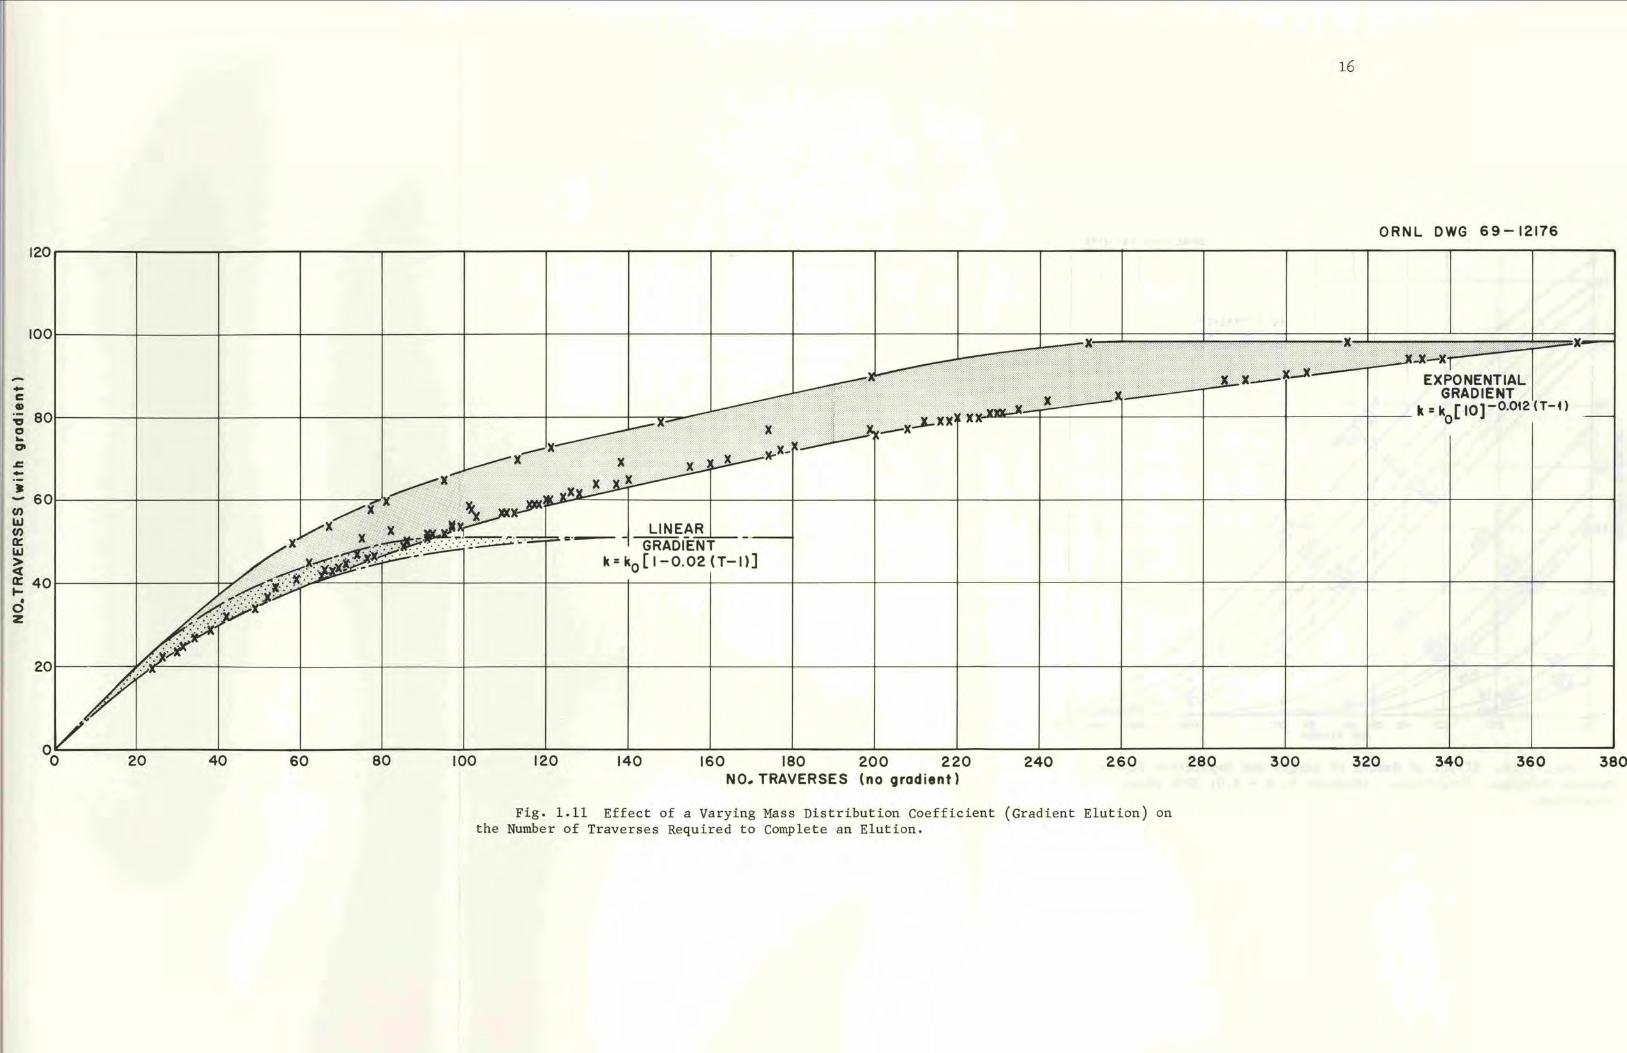
Fig. 1.11 Effect of a Varying Mass Distribution Coefficient (Gradient Elution) onthe Number of Traverses Required to Complete an Elution.
300
16
ORNL DWG 69-12176
320 340 360 380
17
The effects of incomplete phase separation are shown in Figs. 1.5
and 1.6. Whereas poor phase separation causes rather large increases in
the number of traverses required (producing large decreases in average
product concentration), the effect on overlap is small. A greater effect
is noted when the phase ratio is varied (Figs. 1.7 and 1.8).
Increasing the number of stages (Fig. I.9 and 1.10) disperses the
solute peak and requires a larger number of traverses in order to recover
all the product. The average concentration of the product is lower in
this case, but resolution is improved considerably.
Gradient elution serves to hasten the emergence of slow components
(strongly adsorbed ones). Fewer traverses are required when a gradient
is used (Fig. l.ll). However, the overlapping of distributions is some
what greater.
The calculated effects shown here, along with subsequent use of the
ELUGRA program, will allow a better interpretation of chromatographic
elution data and make possible more efficient planning of elution
experiments.
18
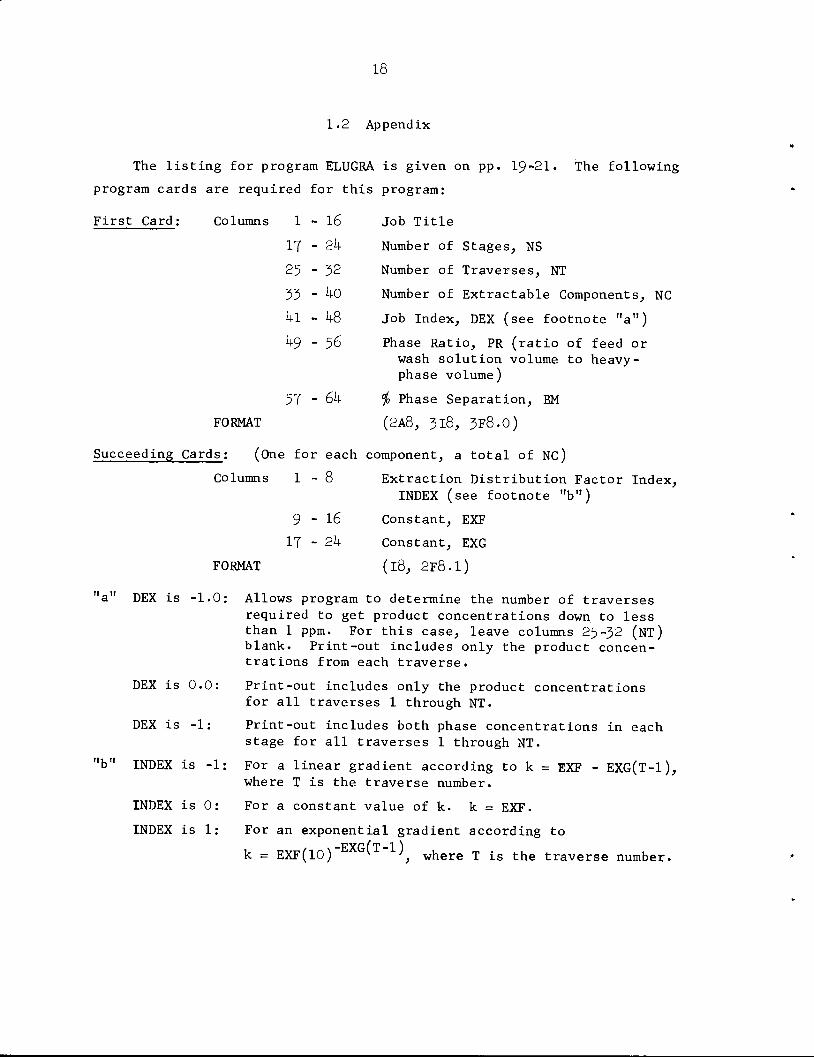
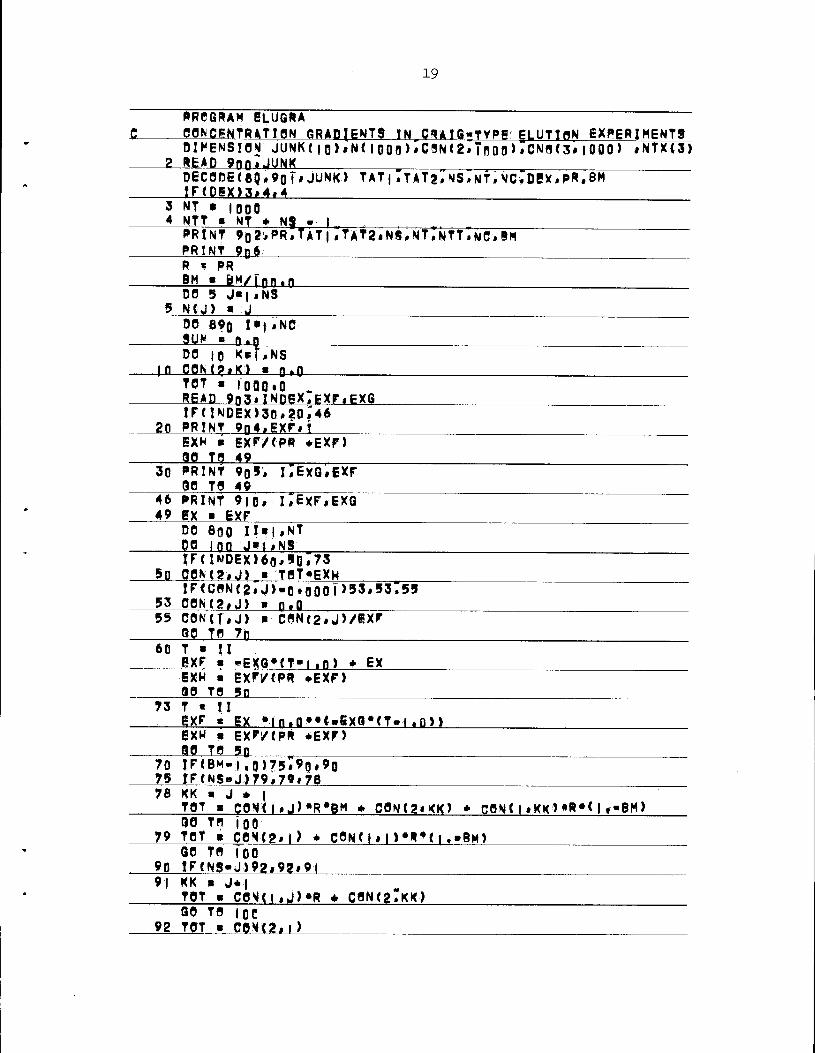
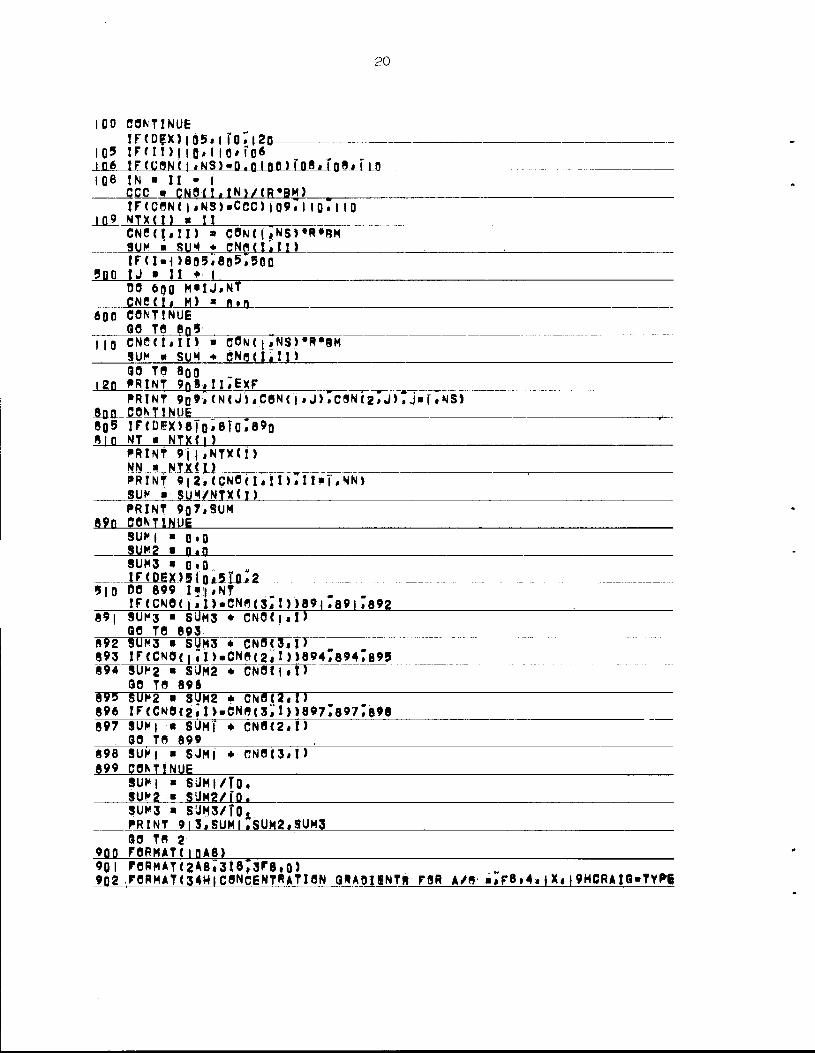
1.2 Appendix
The listing for program ELUGRA is given on pp. 19-21,
program cards are required for this program:
The following
First Card: Columns 1 - 16
17 - 24
25 - 32
33 - 40
41 - 48
49 - 56
57 - 64
FORMAT
Job Title
Number of Stages, NS
Number of Traverses, NT
Number of Extractable Components, NC
Job Index, DEX (see footnote "a")
Phase Ratio, PR (ratio of feed orwash solution volume to heavy-phase volume)
$ Phase Separation, BM
(2A8, 318, 3F8.0)
Succeeding Cards: (One for each component, a total of NC)
Columns 1-8 Extraction Distribution Factor Index,INDEX (see footnote "b")
9-16 Constant, EXF
17 - 24 Constant, EXG
FORMAT (l8, 2F8.1)
"a" DEX is -1.0: Allows program to determine the number of traversesrequired to get product concentrations down to lessthan 1 ppm. For this case, leave columns 25-32 (NT)blank. Print-out includes only the product concentrations from each traverse.
DEX is 0.0:
DEX is -1:
INDEX is -1;
INDEX is 0:
INDEX is 1:
Print-out includes only the product concentrationsfor all traverses 1 through NT.
Print-out includes both phase concentrations in eachstage for all traverses 1 through NT.
For a linear gradient according to k = EXF - EXG(T-l),where T is the traverse number.
For a constant value of k. k = EXF.
For an exponential gradient according to
k= EXF(10)"EXG(T"1), where T is the traverse number.
19
c
PROGRAM ELUGRA
CONCENTRATION GRADIENTS IN CSAIG- TYPE' ELUTIflN EXPERIMENTS
2
OIKEMSIOM JUNK(|0)*N<l000>iC9N(2«READ 9n(j^JUNK
Tooo>iiCN0(3« 1000) iNTX(3)
DECODE(83#9oT# JUNK) TAT| ^TATgi'NS*IF<DfX>3»4.4
NT.NC-'DIX.PR ,BM
3
4NT • |000NTT • NT * NS. •- IPRINT 9o2*PR*TAT|,T*T2,NS,NT»NTT.PRINT 9ni
NC,SM
R * PR
BM • BM/lnn.n
5
DO 5 J»|*NSN(J) • J
08 890 I*|»NCSU* • n.n
MLDO |0 K*i%NSCflfct9.KJ • n.n
TOT • 1o a0 10 .READ 9n3,INDEX.PXFiPXG
2fl
tFUNDEX>30»20.46PRINT 9n4»EXF#T
EXM » EXF/<PR *EXF>90 Tfl 49
30 PRINT 9q5, UEXG.EXF80 TO 49
46
49PRINT 9|0# i;EXF,EXGEX • EXFDO 8(10 11«|*NTDO inn J»1,N5
5oIFUNDEX>6o»*D»73C0M2.J) • TflT*EXH
53!F<Q«N(2,J>-0t000T>53#53;5500N(2,J) • n.O
55 CON(T.J) « C0N(2,J)/EXF80 TO 7h
60 T • IIEXF i «EXG#(T-i.n) ♦ EXEXH • EXF'/tPR *EXF>90 TO 5n
73 T « II
EXF c EX •m.O^UExaVT.t.onexh • ixr/(pR *Exr>80 TO 5n
7075
IF(BM»|,o)75i"9g,9orF(NS»J)79#79#78
78 KK • J * |TOT • C0M(I»J)*R#BM * C0N(2*<K) * CON(l •KlO**1»<|fBM>
7980 TB 100TOT • C0NC2.I) * C0N<1#1!•«*(I.•B«»
90QO TO 100IF(NS-J)92,92*91
9| KK • J*|TOT • COY<l,J)*R * C0N<2,KK)
9280 TO IOCTOT - C0M(2,l)
00 CONTINUE!F(DfXl-M)5^4fO;i20
I0? IFni) | |Q. I io» To*IQfe IF(CBN(|»NS)»»O.OloaiiJltxIJl8iLr_UL108 IN • II • I
CCC • CN9(I,tN)/tR«BM)IF(C8N(|»NS)
09 NTX(l) a II•CCOIQ9.I IQ'I 10
CNC(I,msum • sm
COn(|#NS)*R*BMCNWCIilH
IF<I-4 »803•885.500500 IJ » II * I
600
I 10
L2JL
DO 6Q0CNCd,
M'lJ.NT
m) « nu_CONTINUE
QO TB Bn"-CNOtLII)
SUM • SUM
CON(|,NS)#R*6cNq(i;m
80 TOPRINT
80S9nl«Il«exF
20
PRINT' 9D9«(N(J)«CeN('i*J),C9Nf2tJ).Jar«NS)8nn CONTINUE8q5 IF(DEX)8|o»8TO»89o8|n NT a NTX(|)
PRINT 9j|«NTX<i)NN • NTX(I)
PRINT 9|2•(CNOM •11 >«11 «• T« MN>SUN a SUM/NTX(I)PRINT 907.SUM
89n CONTINUE9UK|9UM2
9UM3 » OtOIF(DEX)SiQ^5Ttl
91 0 DO 899 Ifj.NTIF(CN0(|,I).CNq<3iTl))89|;89|7892
0.0JUJJ-
89| SUP3 • SUMS * CNB(|.180 TB 893
892 SUMS * SUM3 ♦ CN0C3«I893 IF(CNQ(| ri>.CNB(2|D;8947894l895"894 3UM2 a SUM2 ♦ CNB(|.I
80 TB 896895 SUM2 a SLIM2 * CN0(2.i:896 IF(CN0(2»I>-CN8(S.I))89778977e98897 SUHj » SJMf ♦ CN0I2.I
80 TB 899
898 SUM| • SJM|899 CONTINUE
* CN0(3.I
SUM| • SUMI/TO.SUM2 a SUM2/I0.
SUMS a S'JM3/T0.PRINT 9l3.SUMI.SUM2.9UM3
80 TB 2900 FORMAT(IBAg)901 FORMATC2A8.3I8.3F8.0)902 .F0RMAT(34H|CBNCENT*ATIflN Q*AQIf,NTS F8R A/fl a,FBt4« |X,|9HCRAI6»TYP6
21
ELUTIONS//|OX.2A8/2OX,I8.2X.|3HC0NTACT CEILS/2QX,16,2X,9HTRAVERSE29/gQX.Ig.gX.6HCYCLgS/2fiX7l8.?X.|nMCBMPBNgNTS/goX,F8t2.2X,18HPERCEN3T SEPARATION)
9Q3 FQRMAT(I9,gF8tt) r_m „904 FORMAT(|Ho.|oX,2oHDISTRI8UTI9N COgF a ,F8.4.5X.I3HF0R COMPONENT,18
905 FORMAT(|H0,|nX;3|MD!3TRlBUTl9N COEF FOR COMPONENT,18.5X,|6HVARIE8|LIN'EARLY./15X.4HKW «7F8.4.5X7g7HTfHES (TRAVERSE NQ,»|) PLUS,F8.4>
906 FORMAT(|Mo»I0X*38MA a MOBILE PHASE, 9 a STATIONARY PHASE)9Q7 FORMAT(|M .SX,T|HAVERAGE^X a7F8,4l9q8 FORMAT(j4HqTRAVEP9E NO. .I8,|0X,4HK a .F8.4/5X.4HCELL.7X,|HX,|2X,
||HViT4X.4HCELi;7X«"|HXn2X.|HYf |4,x74HgELL77X7|HX.|2X.|HY)9n9 F0RMAT(3(I|«5X;f8,4.5X,F8.4,5X))9ln F0RMAT(iHn,|nX,3)HDlSTRl9UTI9N CBgF FOR COMPONENT,18.?X,tpHVARIEB
|AS /J5X.4HK a »F8,4.5X,32HTIMES |q TS THE -A TIMES B P0WIR/j5X,|0H2WHERB A a 7f8.4.5X."3qHAND B a TRAV6R9E NO. MINUS |.q)
9|| FORMAT(76H0VALUES OF X«A FROM LAST CELL (WEIGHT UNITS BF SBLUTE. ||qnn UNITS INlTjALLY).I8,9X79MTRAVFRSES)
9|2 FORMAT(|0(F8.4,4X))9|3 FQRMAT(iM «sX.g7HQVERLAPS COMPONENTS j»»3.F8.4/|9X,|4HC0MP0NENT
|S |-2.F8.4/|9X.|4HC0MP0NENTS |«3.F8,4)END ELUGRA
22
SOL-GEL DEVELOPMENT STUDIES
P. A. Haas
The objective of these studies is to develop optimum sol-gel processes
for the preparation of ceramic fuels containing uranium, plutonium, thorium,
and their mixtures. The present emphasis is on the preparation of urania
or urania-thoria sols, and the subsequent use of these sols in preparing
oxide microspheres.
Several flowsheets have been developed for preparing U0Q sols. All
of these processes use uranyl nitrate solution as the starting material,
and involve the following conversions:
1. Reduction of uranyl nitrate to uranous nitrate by hydrogen in
the presence of a catalyst.
2. Formation of a hydrated uranous oxide.
3- Removal of nitrate ion, and other anions or cations.
k. Dispersion of the hydrated uranous hydroxide as colloidal
crystallites.
The suitability of the sol for preparing U0p microspheres depends on the
preparation conditions and on the operating conditions in the sphere-
forming system. This quarter we report on the preparation of U0Q sols by
solvent extraction, and the forming of spheres via a two-fluid nozzle
under turbulent flow conditions.
2.1 Preparation of U0p Sols by Solvent Extraction
F. L. Daley A. D. Ryon
The process for preparing U0p sols by solvent extraction has been
successfully scaled up and operated continuously in engineering experi
ments. Forty runs have been made, each producing about 2 kg of U0„ in the
form of a dilute (about 0.2 m) sol. Laboratory studies to characterize
the sol and to aid in the engineering studies are still in progress. We
23
have studied three operating parameters that affect sol properties: the
method for preparing the initial u(lV) solution, nitrate-to-uranium mole
ratio during digestion, and digestion temperature.
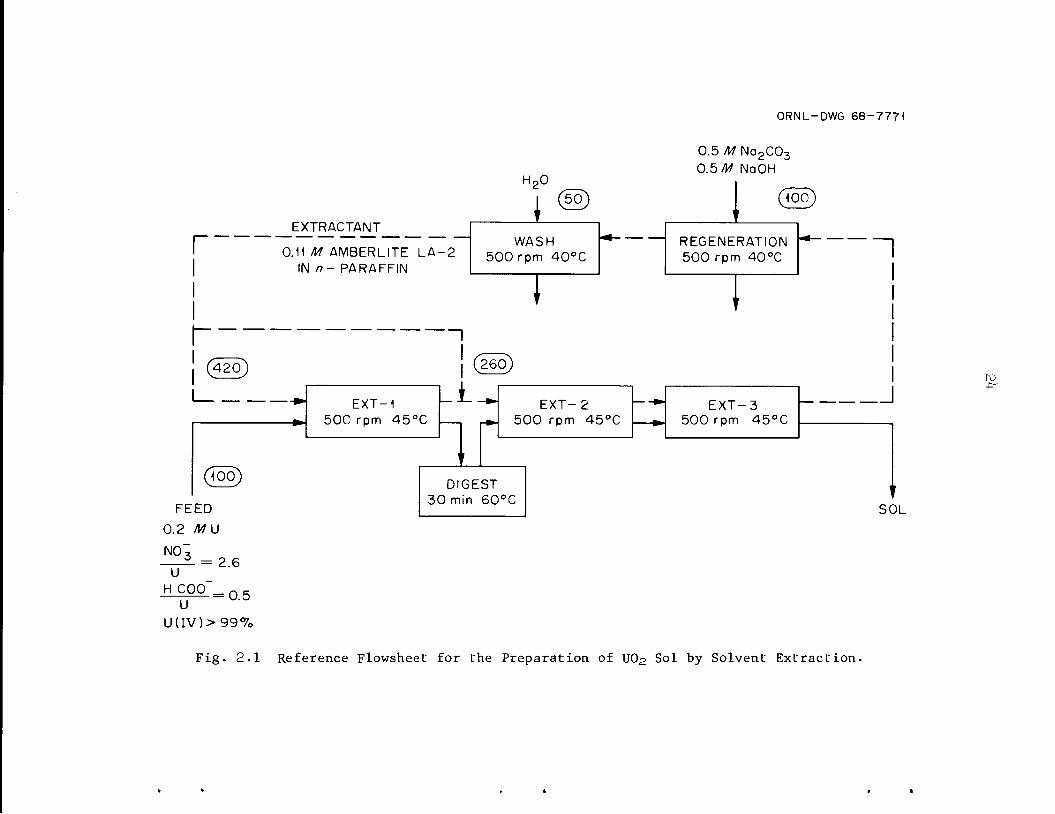
The basic method for preparing U0p sol by solvent extraction (Fig.
2.1) was developed from laboratory batch studies. It consists of
extracting nitrate from an aqueous solution of U(lV) nitrate-formate with
a long-chain amine (e.g., Amberlite LA-2*) dissolved in a liquid paraffin.
Digestion of the resulting nitrate-deficient solution produces the U0p
sol. Final nitrate adjustment is obtained in subsequent extractions. The
amine, which is regenerated by contact with sodium carbonate is recycled.
The equipment for the engineering study of the process is the same as2
that used for preparing ThOp-UO_ sol. The contacting devices for extrac
tion, water scrubbing, and amine regeneration are mixer-settlers designed
to be geometrically safe with regard to criticality. Each mixer has six
compartments which, with cocurrent flow of the organic and aqueous phases,
give the same effect as mixing vessels in series. The phases separate
in the settler section below the mixer. The position of the interface is
controlled by adjustable weirs on both the organic-phase outlet and the
aqueous-phase outlet. Maintaining the interface below the mixer helps to
produce a water-in-oil type of dispersion, which is important in mini
mizing emulsions. At shutdown the aqueous phase is drained out of the
mixer, so that at subsequent startup the incoming aqueous phase is
readily dispersed into the organic phase. The digester is an enlargement
of the aqueous-phase jackleg on the first extraction mixer-settler. The
temperature in each extractor and in the digester is controlled by
circulating water through internal coils. The design capacity of the
equipment is 6 liters of sol per hour; the capacity is determined by
the size of the digester and the required residence time in the digester
(30 min).
Product of Rohm and Haas Co.
Chem. Technol. Div. Ann. Progr. Rept. May 31, I967, ORNL-41^5, p. 184.pM. E. Whatley et_ al_., Unit Operations Section Quarterly Progress Report,July-September I967, ORNL-U23U, pp. 57"79-
r
r
(Too)
FEED
0.2 M\J
NO"
U
H COO"U
= 2.6
= 0.5
U(IV)>997o
EXTRACTANT
0.11 M AMBERLITE LA-2
IN n- PARAFFIN
EXT-1
500 rpm 45°C
•~i
H20
®
WASH
500 rpm 40°C
DIGEST
30 min 60°C
ORNL-DWG 68-7771
0.5 M Na2C030.5 M NaOH
REGENERATION
500 rpm 40°C ~l
EXT-3
500 rpm 45°C
I
1
SOL
Fig. 2.1 Reference Flowsheet for the Preparation of UO2 Sol by Solvent Extraction.
25
2.1.1 Preparation of U(lV) Nitrate Solution
During the laboratory studies, U(lV) nitrate solution was prepared by
contacting 0.2 M U0p(N0 )p--0.1 M HC00H with hydrogen, using platinizedAlp0, powder as the catalyst. Although this procedure usually produced
good results, it did not appear very practical for the larger engineering
tests because of the time required for removing (by settling and filtra
tion) the catalyst. Consequently, several alternative methods of reduc
tion were evaluated. One of these consisted of continuous reduction in
a pressurized fixed bed of platinized Al^O^ pellets. Attempts to make sol2 3
by using U(lV) nitrate solution prepared in this reductor failed because
the material became viscous in the second extraction stage. Another
method involved batch operation of the fixed catalyst bed at approximately
atmospheric pressure. This allowed better control of the reduction and,
in turn, resulted in an improved product sol. However, the sol tended to
thicken, or gel, on concentration (by vacuum evaporation) to 1 M. We
believe that this tendency was caused by the presence of a nitrogen-bearing
basic material, which behaved like ammonia during chemical analysis but
degraded on standing, in the U(lV) nitrate solution. [Ammonia, on addition
(NH-Vu mole ratio = 0.02) to laboratory-prepared U(lV) nitrate solution,
has been shown to cause thickening of the sol which is subsequently formed
by batch extraction.]
Most of the recent runs have been made by using U(lV) feed that was
prepared in a slurry-type reductor, where finely divided PtOp catalyst
is suspended in a well-mixed uranium nitrate solution and the hydrogen
enters through a sparger. Since the catalyst is reduced to metal that
becomes flocculated in the presence of excess hydrogen, it settles very
rapidly and is readily retained on a filter when reduction of the uranium
is nearly complete. The filter consists of a flat disk of porous stain
less steel (10-(j. pore) that forms the bottom of the reductor. The
reduction is monitored by measuring the redox potential of the solution,
using a platinum electrode vs a glass reference electrode. (other
reference electrodes such as silver--silver chloride or calomel can also
be used, but are not as rugged and trouble-free as glass.) The end
26
point is readily detected as a sharp break in emf, which occurs when
reduction has progressed to between 96 and 100$ U(lV). The feed com
position was fixed at 0.6 M U0p(N0 ) ~-0.k M HNO --0-3 M HC00H; the N0~/uand HC00H/U mole ratios were 2.6 and 0-5, respectively.
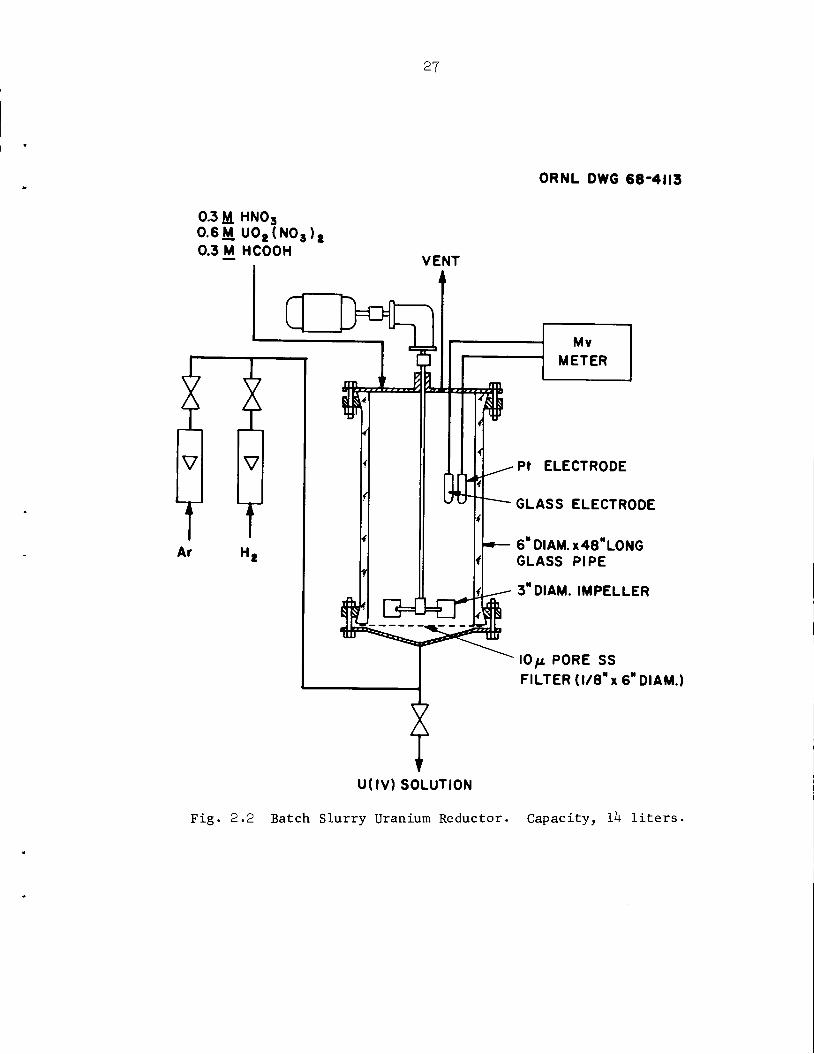
Both a small laboratory slurry reductor (l.6-liter capacity) and a
larger unit (ll+-liter capacity, Fig. 2.2) have been evaluated as devices
for supplying feed for engineering tests of the solvent-extraction sol
process. About 10 kg of uranium was reduced in the small reductor, thus
demonstrating the feasibility of the slurry catalyst. The design and
construction of the larger reductor were based on laboratory data. The
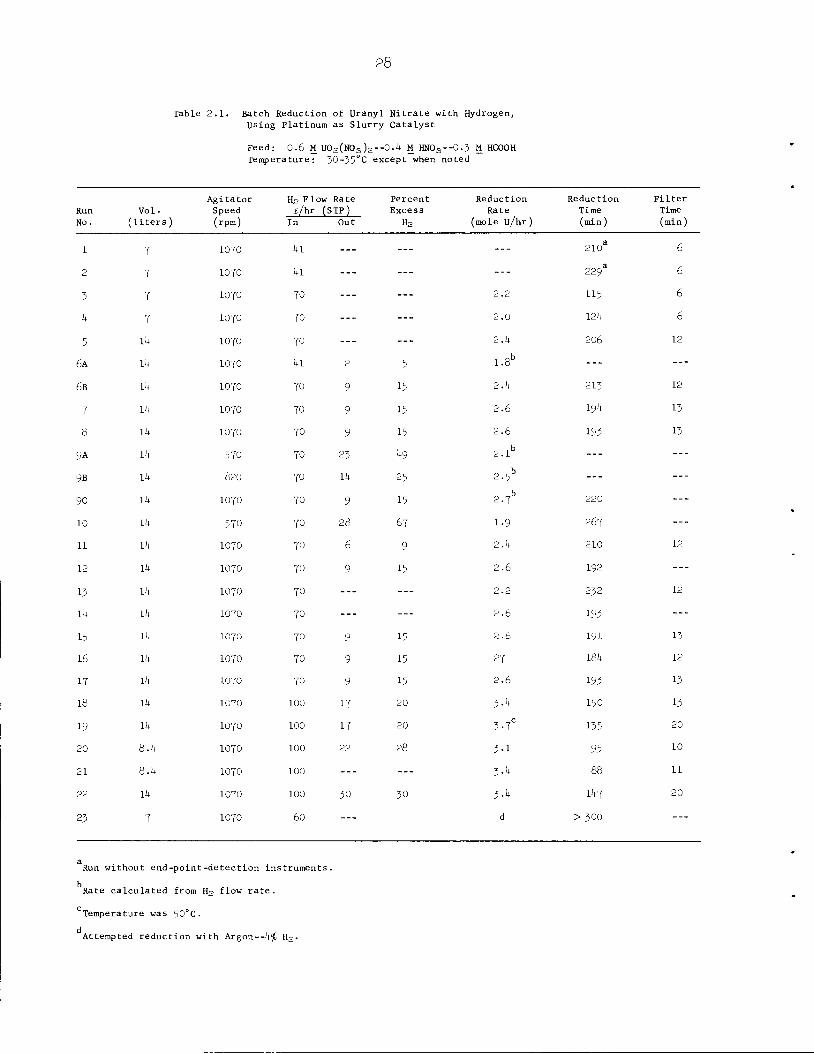
results of 20 runs (Table 2.1), which produced a total of kO kg of U(lV),
indicate excellent performance. (Reduction time is not definitely known
for runs 1 and 2; reduction was not complete in run 23, which was attempted
with diluted hydrogen.) The catalyst (initial charge, 30 kg of Pt0p )hasshown no sign of loss in activity or of decrease in filtration efficiency
(filtration time by gravity was 12 min for 1^4- liters). No subsequent
additions have been required. Reduction of greater than 99.5$ of the
uranium was easily obtained; very little ammonia was formed (NH,/u mole
ratio < 0.002). The rate of uranium reduction increased linearly with
hydrogen flow rate (Fig. 2.3) from 1.8 moles/hr at a hydrogen flow rate of
^1 liters/hr (95$ utilization) to 3.h moles/hr at a hydrogen flow rate of
100 liters/hr (80$ utilization). The rate of uranium reduction also
increased with agitator speed (Fig. 2.U), from an average of 2 moles/hr at
an agitator speed of 57O rpm to 2-7 moles/hr at 1070 rpm. Doubling the
amount of uranium present by doubling the volume of solution processed
had virtually no effect on the rate of uranium reduction. One run (run 19)
at 50°C showed only a slightly higher reduction rate than that for the
remainder of the runs at 30 to 35°C An attempt was made (run 23) to effect
reduction by using a mixture of argon--4$ YU • This gas has the obvious
advantage of being non-explosive; however, the rate of uranium reduction
was very slow when it was used (i.e., only 10$ was reduced after 6 hr
as compared with complete reduction in 2 hr with pure hydrogen).
Adams catalyst obtained from Englehard Industries Div. of EnglehardMinerals and Chemicals Corp., Newark, N. J.
HN03U08(N03)2HCOOH
27
VENT
ORNL DWG 68-4113
1, ^Pt ELECTRODE
Lrcrrt GLASS ELECTRODE
6 DIAM. x 48 LONGGLASS PIPE
3 DIAM. IMPELLER
IO/i PORE SSFILTER (1/8" x 6" DIAM.)
U(IV) SOLUTION
Fig. 2.2 Batch Slurry Uranium Reductor. Capacity, lk liters.
28
Table 2.1. Batch Reduction of Uranyl Nitrate with Hydrogen,Using Platinum as Slurry Catalyst
Feed: 0.6 M U02(N03 )2~0.k MHNO3--O.3 M HCOOHTemperature: 30-35°C except when noted
Agitator H2 Fl dw Rate Percent Reduction Reduction Filter
Run Vol. Speed i/lo (STP) Exce s s Rate Time Time
No. (liters) (rpm) in Out H2 (mole u/hr) (min) (min)
1 7 1070 1+1 ... ... 2103 6
2 7 1070 1+1 ... ...
—
2293 6
3 7 1070 70 ... ... 2.2 115 6
1+ 7 1070 70 ... ... 2.0 121+ 6
5 14 1070 70 ... ... 2.1+ 206 12
6A 11+ 1070 1+1 2 5 1.8b ...
—
6B lit 1070 70 9 15 2.1+ 213 12
7 14 1070 70 9 15 2.6 I9I+ 13
8 14 1070 70 9 15 2.6 193 13
9A 11+ 570 70 23 1+9 2.1b ... ...
9B 11+ 820 70 11+ 25 2-5b ... ...
9C 11+ 1070 70 9 15 2-7b 220 —
10 11+ 570 70 28 67 1-9 267 — -
11 11+ 1070 70 6 9 2.1+ 210 12
12 11+ 1070 70 9 15 2.6 192 ...
13 11+ 1070 70 ...
—2.2 232 12
11+ 11+ 1070 70 ...
—2.6 193 ...
15 11+ 1070 70 9 15 2.6 191 13
16 11+ 1070 70 9 15 27 181+ 12
IT li+ 1070 70 9 15 2.6 193 13
18 11+ 1070 100 17 20 3-4 150 13
19 11+ 1070 100 17 20 3-7C 135 20
20 8.1+ 1070 100 22 28 3-1 95 10
21 8.1+ 1070 100 ... ... 3-h 88 11
22 11+ 1070 100 30 30 3-4 11+7 20
23 7 1070 60---
d > 300
a
Run without end-point-detection instruments.
Rate calculated from H2 flow rate.
c 0Temperature was 50 C.
dAttempted reduction with Argon--l+^t Hg.
29
4.0ORNL DWG 69-13164
x:
4)AGITATOR SPEED1 = 4070 rpm i
O
E 30
UJ1-<or ^
REDUCTIONrodb
0 20 40 60 80
H2 FLOW RATE (liters/hr)
400
Fig. 2-3 Effect of Hydrogen Flow Rate on Rate of Reduction of Uranyl Nitrate,
£ 3ORNL DWG 69-12156
H2FL0W= 70 A/hr r^%£ •^^^
UJ
£ 2or
• .
~9
z0
0
UJ 0or u 200 400 600 800
AGITATOR SPEED (rpm)
1000 1200
Fig. 2.4 Effect of Agitator Speed on the Rate of Reduction of Uranyl Nitrate.
30
2.1.2 Operation of the Solvent-Extraction Equipment
About kO runs have been made (Table 2.2) to demonstrate the operation
of the solvent extraction equipment. As was noted in the section on the
preparation of U(lV) nitrate solutions, a number of the runs were made
to test various feed solutions. In the last 20 runs, for which the feed
was prepared by batch slurry catalyst, about 1000 liters of 0.2 M U0p sol
was produced. The equipment operated satisfactorily at the design rate of
6 liters of sol per hour. No emulsions or entrainment difficulties were
encountered. The entrainment of extractant in the sol product was con
sistently less than 0.1 vol $. The small amount of entrained sol in the
used extractant can be removed by scrubbing with water to prevent loss of
uranium to the waste stream. Although three extractors were used in most
of the runs, only two are needed because the nitrate content of the sol
changes only slightly in the third extractor. Approach to chemical
equilibrium in the extractor has been consistently greater than 90$ at a
mixer speed of 500 rpm.
Variation of the uranium concentration from 0.15 to 0.3 M (the re
ference concentration is 0.2 M) did not cause any difficulty, and good-
quality sols were produced; however, two attempts to prepare a sol having
a uranium concentration of 0.6 M were unsuccessful because the product
material thickened in the second extractor.
The temperature at which the digestion step (see Fig. 2.1) was
carried out was found to be an important variable (Table 2.3). At 50°C
the sol contains a significant amount of amorphous U0„ (as determined by
x-ray diffraction). The sol gels at a uranium concentration of about
0.5 M if it is evaporated immediately after preparation; however, after
aging overnight it can be concentrated to greater than 1.0 M and will
remain fluid for more than 30 days. When the digestion temperature is
increased to 60°C, the sol contains more U0p crystallites, and the fresh
sol can be concentrated without gelling. To minimize oxidation of the
uranium at the higher digestion temperature, the laboratory flowsheet was
modified to include the use of an excess of amine in the first stage.
01ro
>-
0
w^
uh
-u
vji
vji
^h
jUji
roro
roro
roro
roro
roro
i-*
m-
*-•f
!-•i-
>f
t->(-•
m-
i-*
fy-
'!-
•£
,~
.„
~»
.,k
,^
^v
n^
4^
V>
JVW
|\3
i-<
ON
OO
O^
c7\v
n4
r-V
NrO
i--'
ON
OO
O^
^C
T\0
>v
nv
n4
^4
r-v
*V
>ir
Oi-
-'^
ttf>
es>
e»
>t»
>w
>e»
>c»
>B
>i|M
Dn
B)>
VnV
nvTl
vTjV
WvT
ivN
V^V
^vTi
vlj'v
/!Ip
-t-do
IvjJ
VM
VM
VM
VO
[\1NO
VONO
HU
5P"
-prO
-P"-p-
NO-P"
00—
]ON
ONON
NJ1P"
P"ro
V»J
Ml\)
HH
M
k^
i_
ii_
ii-ik
-ii-ii-.)
->
t-ii-i
t-tf
-»
t-»
i-»
i-'i
-«
(-»
r-»
i-»
i-'(
-li
-,(
-'>
-'M
'i—
•i—
••—
»i—
*>—
*i—
'i—
*i—
•h-
*i-
1m
*v
nv
no
oo
oo
Qo
oo
ov
nv
no
oo
oo
oo
oo
oo
oQ
oo
go
gg
o-p
-noK
^'S
SS
^y
;^
^^
^^
^o
oo
oo
oo
oo
oo
oo
oo
oo
oo
oo
oo
oo
oo
oo
oo
oo
oo
oo
oo
oo
oo
oo
oo
oo
vnv>
jro
rovn
jr^
ioiv
nw
on
ji.p
--p
-vn
j^-v
jjvn
vn^
j=-.
p-.
p--
p-p
--p
-.p
--p
-.p
-.p
--p
-p--
p--
p--
P'-
P--
P--
P--
p-r
or
*-v
>h
ji^
yro
>-;
**v
ov
ov
o^
vo
rov
oN
Ov
ov
oN
Op
-ro
wv
nro
vn
vn
vn
roro
roro
ruro
roro
roh
jiN
jraw
r^O
OO
OO
OO
OO
OO
OO
OO
OO
TO
OO
OO
OO
OO
OO
OO
OO
OO
OO
OO
Ov
nO
ON
JIO
OO
OO
O
ro
M^
OJru
ro
ro
wiu
raH
MP
oru
ro
ro
ro
ro
Mro
^w
ru
ro
wro
ru
ro
iuro
ww
iww
^-f-r*
--p
-vn
£-
p-v
nro
roro
rom
-t-
-_!
^.!^
-o-3
VOO
N-J
--}-
;£-
£JO
OC
NC
NH
ON
I-'f
f'O
NCT
NO
NO
NaN
ON
ON
ON
ON
ON
ON
aNO
NO
NO
NO
oO
OO
—l
OO
-i-p
"*--
p"V
^2?
9?O
OO
OO
OO
OO
OO
OO
OO
OO
OO
OO
OO
OO
OO
OO
OO
OO
OO
OO
OO
VJIO
OV
iO
OO
OO
O
(^
(^
,Ji_
i|^
l_
i^
!_
i^
^^
wf-J|-
-!t-'l
-JM
't-,t-,l-Jl-Jl-,l-Jl-Jl-'l
-'t
-'l
-,l—
•h
-'h
-'t
-'H
-'l
-'l
-'l
—'h
-'l
-'l
-'t
-'t
-*
^o
oo
oo
oo
oo
oo
oo
oo
oo
oo
oo
oo
oo
oo
oo
oo
go
gg
oo
gg
gM
'>o
^o
^c^
qN
O\p
oo
oo
oo
oo
oo
oo
oo
oo
oo
oo
oo
oo
oo
oo
oo
oo
oo
oo
oo
oo
oo
oo
oo
uiu
iv
no
oo
vn
vn
v/i
v/i
vn
vri
vn
vn
vn
vn
vn
vn
vn
v/i
vn
vn
vn
vn
vn
vn
vn
vn
v/i
vn
i^v
nv
nv
nv
nv
nv
nv
nv
nv
nv
nv
nv
^i
ii
ii
roo
oo
oo
oo
oo
oo
oo
oo
oo
oo
oo
oo
oo
oo
oo
oo
oo
oo
oo
oo
oo
oi
II
II
lO
ON
ON
ON
Vn—
i-^i
aNO
NO
NO
NO
NaN
ON
ON
Nji
ON
ON
ON
ON
Uiv
nv
nv
nO
NV
nu
ivi
o>
vn
vn
vn
vn
vn
vn
vn
vn
vn
vn
vn
vn
^v
n^
vn
vn
^v
nv
nv
nO
OO
OO
OO
OO
OO
OO
OO
OO
OO
OO
OO
Vn
OO
Ov
nO
OO
OO
OO
OO
OO
OO
OO
OO
OO
ON
/1
Table2.2.SummaryofUOSolRuns
(-»
M*
I-*
I-*
t~*
M*
vn
.fr-
VN
rv)
I-1
ON
OO
O—
lO
wn
.p-V
NR
un
No
.
mmentsonfeed;Preparedincontinuous-flowpressurizedfixed-bedreductor.Preparedinbatchfixed-bedreductor.£
cn
c/J
HcJen
cn
cn
t-d
H'O
lO
lM
OlO
lO
lM
n3
3»
33
3»
yro
ro
xiro
ro
ro
xi
0101
hh
01O
lM
01
01
01rt
en
09
CO
en
M»
ti01
0101
01M
i-l
33
33
roro
roro
roro
"0
to01
o>01
0101
01M
M.
Co
mm
en
tso
n
Fee
d3
edinbatchplatinum-slurryreductoratauraniedincontinuousplatinum-slurryreductoratasktexcepturaniumconcentrationinfeedtososk,excepturaniumconcentrationinfeedtosos2,excepturaniumconcentrationinfeedtosos2,excepturaniumconcentrationinfeedtosoedinbatchplatinum-slurryreductoratauranis9,exceptfeedtosolventextractorwas0.005s9,exceptfeedtosolventextractorwas0.01s9,exceptfeedtosolventextractorwas0.01edinlarge-scale(14-liter)platinum-slurryres13,excepturaniumconcentrationinfeedtoss 13,excepturaniumconcentrationinfeedtoseedtogiveauraniumconcentrationof0.2MinF
eed
3 p.
•pa
301
srt
ro
Ex
tracta
nt
to
Fir
st
Sta
ge
Ex
tractan
tto
Seco
nd
Sta
ge
0-5
MN
a2C
03
--0
.5M
NaO
H
HaO
Dig
esti
on
Tem
per
atu
re(°
C)
umconceiMinhycMinhydiMinhydiductoralolvente:olventejstreami
umconceturaniumcIventextIventextIventextIventext
OO
OO
OO
OO
OO
OO
OO
OO
OO
OO
OO
OO
OO
OO
OO
OO
OO
OO
OO
OO
OO
OO
OO
OO
O
roro
roro
roro
roro
roro
roro
c-o
Nw
roi^
roro
ro^
ui0
00
00
00
00
00
00
00
00
00
0v
nv
no
oo
N/io
oo
oo
oo
oo
OO
f-i-O
OO
OO
OO
Oi-'l
OO
OO
OO
OO
OO
OO
OO
OO
OO
Ol-'O
OO
OO
Oi-'i
-'i
-'O
OO
ilO
UC
on
cn
.in
So
l(M
)
Srtrf
OlO
irtrtrti-lrtrtO
rf
ItH
11
Htl
O1
MO
1O
1O
1O
13
H.
ro
oio
iH
*p
*N
oio
oo
on
oi
MO
OC
33
H*
rtrtrtrtrrro
rt
H-rtrtrtro
ro
3r-''0
00
03
l-'-
3O
O0
1-
•(B
OIIiilrtO
00
i-l
i-(
3-3
|-I3
(-*•
£43
flS3
01M
ifiS
CO
OiB
OiO
irtO
NO
3/U
Mol
eR
atio
in
Pro
du
ct
fro
m
First
Ex
tracto
r-^
-^b
bm
p-v
nv
nv
Viv
nv
nO
\i--
'i^v
>(J
^V4
VC
tjC
nG
jV-^
4V
^tti
lnJ^
vri
vn
jr-M
VO
VO
Oo
NO
^vn
i--'
OJ^
O>
^-H
l1
V?ro
vno
hro
wu
iiji
hu
io
>-•
oo
vn
mf-rv
in
ioi\
)<
ji^
M\O
i-'o
No
ro
uiH
Vjn
oi\
)H
~io
oo
oo
roro
i-l
enen
Oen
00
00
00
3I-"
Co
nd
ucti
vit
yat
35
°C(m
illi
mho
s/cm
)
en
0 Tl
rt
0 •oro rt
rt
H-
ro en
£>o
ovo
no
—ih
co
iw
hi
ii
ii
ii
ii
ii-p
-ro
Oo
vn
OO
ll
II
II
Iro
-f-
On
0O
Nv
nv
n0
nji
Mi
nim
is5
|S|3
|3|S
|S*-
n^
•p
r.....
Olrt
|S
001
01rt
3rt
0a
rt-
MO
.01
3O i-
lO
Cm
,o
f
Oeo 0
ON
I-1 S
'?0 3 cr 1 ro a
ro
oo
-3
oo
oo
vo
—q
rov
np
-v
ni
il-
',
OO
OO
OO
OO
OO
OO
OI
OO
OO
OO
OO
OO
OO
OO
OO
OO
OO
OO
OO
OO
OO
OO
OO
IlO
NO
3/U
Mol
eR
atio
OH
OH
ob
bb
bp
HH
Ol!
MO
Hb
bM
MH
wb
foW
MH
MH
Hi-
'HH
MIO
HQ
HM
rOM
IOO
HM
ii
ov
oo
CD
H-j-n
av
ov
oo
fw
ui
4r^
oo
\o
\o
^^
-^
ON
ai(jiJrH
M-)~
nu
ia)O
Nu
iv
jii-'M
3ro
ro
oiJr-)H
Hv
i
OO
OO
OO
OO
OO
OO
O1
OO
OO
OO
Or-'O
OO
OO
OO
OO
OO
OO
OO
OO
OO
OO
OO
Ol
lO
C/U
Ato
mR
ati
oC
nu
iuiv
jiIV
Jr^
Jiu
iuio
iuiu
iri
ui\
jiC
nO
ii-b
Nir
i-Ju
iui\
Ji4
rf-P
-p-V
jiv
>i
mu
ioi
jr4r
\Jiv
njr
o\j
:-u
iro
iH
H1
1•£
OO
OO
UD
Oi-
'i-'l
-'M
'ro
OV
OO
OM
l\JM
I\)
WIU
U1
00
-P
Jrl\
)IU
-P
-fC
AK
IH
HC
T\0
0^
)C
OO
\PO
OU
i\Jl
*?
OOC
oO
OV
OO
OV
OVO
NONO
NO
VO
Co
OOI
NOI
NO
NO
\£)N
ON
JDN
ON
ON
ON
ON
ON
ON
ON
£>N
ON
ON
ON
O00
NO00
COCO
CDNO
NONO
CoN
O00
03ON
Io?
00
^1
«rC
Ot-
'H
HM
MH
\D\J
11
—;
1-P
-VO
VN
NO
Vn
VO
NO
VN
—]O
NC
T\O
N/1
oo
oo
NO
oro
oo
00N
O—
}o
ni-
1nj
jo
ov
nvn
00
ON1
oo
ii
NO
AA
ii
JX>
i-1
t-,r
Oh
-*
vn
vn
vn
iiv
nro
aN
VN
VN
aN
-P
'NO
P~
ON
ni-
»i-
*m
>->
ii
ON
-p-
vn
-op
-o
ov
nv
no
oo
oi
iO
nji
oO
Nv
no
oo
vtJ
o-]V
ji^
\O
WV
>iH
ON
HO
io
-rtT
\H
oo
vn
•-•
Oi
Oi
OO
O
*u4+
Sh
elf
Lif
e
of
1M
So
l(d
aysj
11
11
11
11
11
11
11
11
11
11
11
11
11
I1
11
11
11
1V
N1
11
11
11
||
||
i|
11
1I
|1
|p
|p
JrljIljIfW
||
||
|i
|V
NV
N-p
"V
NV
NV
N1
11
11
••—
qI
It
iiiiiliiiiiV
Oii-'O
MD
Oo
rO
OO
iiiiiii-~
lM
DO
*--p
--p
-|llllil
Cry
sta
llit
eS
ize
(A)
11
11
11
11
11
I1
11
—]
11
11
11
11
11
11
11
OI
II
II
II
ii
it
ii
I
It
•1
»1
*—*
i1—
•1—
•I—
11
11
11
11
11
11
11
11
11
11
'iiiiilO
lO
ON
Jip
-o
vn
iiiiiiiiiiiiiiiiiii'
llllllO
lO
OO
OO
Olll
llllllll1
1°C
ryst
all
ized
Aft
er
1-3
wee
ks
Run
No.
DigestionTemp.
(°C)
15A 50
15B 50
16A 50
1TA 50
18 50
19 50
24 50
23 60
20 60
21 60
22 60
29 60
30 60
31 60
32 60
3^B 60
35 60
36 60
27 60
28 60
i6b 65
33A 70
33B 70
32
Table 2.3- Effect of Digestion Temperature and ExcessAmine on Properties of U02 Sol
Excess
Amine
(i)
nos/uMole
Ratio
50 0.17
50 0.24
50 0.26
50 0.26
50 0.24
50 0.24
50 0.24
65 0.09
50 0.09
50 0.09
50 0.10
50 0.10
50 0.09
50 0.09
50 0.09
35 0.08
35 0.10
35 0.09
20 0.13
20 0.14
50 0.08
35 0.07
35 0.07
0.2 M. Sol
Conductivity
(millimhos/cm)
2.1
2.1
1-7
2.1
1.9
1-9
1-9
1.8
3-3
3-2
2-7
2.9
3-0
2.8
3-4
4-5
5-4
1-3
2.8
2.8
U(IV)
96
96
97
99
95
99
97
93
99
9U
91
91
91
91
85
87
91
93
91
Shelf Life
of
1 M Sol
(days )
1?
17
50
^3
1+0
60
50
25
35
36
60
50
10
25
15
5
14
26
50
50
41
15
33
This amine extracts sufficient nitrate to give a NO"/u mole ratio of less
than O.5. Sol prepared at a digester temperature of 70°C has a shorter
shelf life after concentration, perhaps because extensive oxidation of
uranium occurs even at the low NO,/u mole ratio. The digester temperature
also affects the NO~/u mole ratio of the sol product; for example, the
ratio averages 0.24, 0.10, and 0.07 when digestion is carried out at
50, 60, and 70°C, respectively. The addition of 20 to 65% excess amine
(i.e., 20 to 65$ more than the stoichiometric quantity required to extract
the nitrate from the feed) appears to have very little effect on the
nitrate content of the sol. The average size of the U0„ crystallites
in the sol product is 35 to ^0 A and does not seem to depend on either
the temperature of the digester or the period of aging.
2.1-3 Evaporation of Sol
Dilute sol (~ 0.2 M) must be concentrated until it is about 1 M in
uranium in order to facilitate the formation of microspheres. Vacuum
evaporation is used to avoid overheating the sol; the temperature is
kept below about 35°C- Because the sol is quite sensitive to oxidation,
exposure to air is a common cause of thickening or, in extreme cases,
flocculation of the sol.
Representative samples from each run were concentrated to 1 M in
uranium in a rotating, evacuated 500-ml flask, in order to determine the
effects of variables on the shelf life on the concentrated sol. Most of
the sols prepared according to the reference flowsheet remained fluid at
a uranium concentration of 1 M for 50 days or more.
Several batches (each containing 2 kg of uranium) of dilute sol were
successfully concentrated in the forced-circulation vertical-tube2
evaporator to yield 1 M sol for use in forming microspheres. The data
are summarized in Table 2.k- The evaporation was satisfactory at the
design boilup rate of 15 liters/hr and an absolute pressure of 30 torrs.
No foaming or scaling was observed. About 25$ of the formic acid was
"Rotavapor," Rinco Instrument Co., Inc., Greenville, 111,
3k
Table 2.1+. Summary of Data for the Concentration of U02 Sol in theForced-Circulation Vertical-Tube Evaporator
Shelf Life
Evaporator Sol
Run
No.a
AgeBefore
Evaporation(days)
t U(IV) inc/uRat
Atom
1.0 in
of
Evaporator
Run
No.
Fresh
Sol
EvaporatorFeed
EvaporatorProduct
EvaporatorFeed
Evaporator
Product
Product
(days)
7 6 18 93 90.0 90.9 O.38 0.1+2—
10 7 16 88 85.9 85-3 0.1+1 0.26—
11 8 ll+ 90 88.5 88.0 O.59 0.1+7—
12 8 16 90 88.1 88.1 0.51 0.1+7—
13 8 21 90 89.O 88.3— — —
11+ 8 23 90 87-1+ 86.7 — — —
15 10 7 88 88.1 87.0 O.65 0.51 —
- 1'15B
„16A
1+2
31+
96
97 :::
» 1'i6b
_17A
1+6
1+0
93
99
87.0
::: 45
18 18 1+0 95 88.6 87-7 — —kh
19 27 8 89 89.2 88.2 0.51 0.1+0 10
20 22 20 91+ 90.1+ 90.1 0.1+5 0.1+0 17
21 21 22 99 90.3 89.6 0.1+7 0.1+1 28
22
20
_21
30
29
93
99
91.6 89.2 0.1+6 0.37 > 10
23 29 20 91 91.5 89.6 0.53 0.1+0 > 1+
21+ 30 36 90 88.8 87.6 0.1+7 0.35 3
25 31 1+5 91 89.0 88.0 0.50 0.37 —
26 32 57 91 89.2 88.1 0.51 0.31+—
27 P5I*
!+3
1+2
87
88— — — —
> 1
See Table 2.2 for properties of these sols.
b. .Air was inadvertently admitted during the evaporation-
35
removed from the sol during evaporation. Shelf lives of the large batches
of concentrated sol were shorter than the shelf life of the product from
the small laboratory evaporator. We believe that this decreased shelf life
is the result of oxidation of the uranium, due to leakage of air, during
storage (~ 30 days) prior to evaporation and also during evaporation.
2.2 Two-Fluid Nozzles as Sol Dispersers Under Turbulent Flow Conditions
P. A. Haas
We have continued to use the two-fluid nozzle as a sol disperser.
During this report period, we employed organic flow rates that are too3 klarge to allow varicose dispersion (which gives large sol droplets). '
Product diameters were determined for a wide range of variables and a
variety of sols, and a dimensionless correlation was developed.
To obtain a dispersion of a sol in an alcohol as droplets of a uniform
and controlled diameter, a controllable, uniform force should be applied
to a uniform configuration of undispersed sol. The formation of the new
surface requires energy; however, dispersion is usually a very inefficient
operation, and most of the supplied energy is dissipated as fluid friction.
An important practical requirement is capacity, and the number of drops
per unit weight increases inversely as the cube of the diameter. The
viscosity of the sol and the sol-alcohol interfacial tension vary and
are thus difficult to control; therefore, disperser control will be
simpler if the importance of these variables can be minimized.
In operations employing the two-fluid nozzle, turbulence of the
continuous (alcohol) phase flowing through a tube provides a uniform and
controllable force for dispersing a sol stream that is introduced into
the channel. The degree of turbulence can be varied easily and
5M. E. Whatley et_ al., Unit Operations Section Quarterly Progress Report,October-December I967, ORNL-4235.
kM. E. Whatley et al_., Unit Operations Section Quarterly Progress Report,April-June 19657 ORNL-^365.
36
reproducibly by varying the alcohol flow rate. The transition from
viscous or laminar flow to turbulent flow depends on a dimensionless
parameter called Reynolds number. The scale of the turbulence in the
two-fluid nozzle and the localized forces that cause dispersion depend
on the dimensions of the channel and on the properties of the continuous
fluid, as well as on the Reynolds number.
The underlying principle for operation of this disperser is the use
of controlled turbulence (as the primary force) to disperse the sol into a
flowing alcohol stream. The promotion of turbulence by the sol inlet
configuration and the addition of shearing forces to the turbulent forces
are unavoidable supplementary effects. The sol stream from a capillary
inlet gives a uniform configuration. The force causing dispersion is
easily controlled and is more uniform than the somewhat similar forces
used in dispersion by agitation or by fluid-driven atomizing nozzles.
Information found in the literature on dispersion by agitation indicates
that the viscosity of the sol is probably not a controlling variable if
it is of the same magnitude as, or less than, that of the alcohol.
The results obtained by operating the two-fluid nozzle under turbu
lent flow conditions have been correlated using dimensional analyses.
The following dimensionless relationship has been developed:
D •, /„ \0.1 -1.5-& -**>( l) Re .where
D n = diameter of the sol droplet,sol v >
ID = diameter of the alcohol flow channel,
G = alcohol flow rate,
F = sol flow rate,
Re = Reynolds number for the alcohol.
For our two-fluid nozzle configuration with the sol inlet capillary
positioned perpendicular to the axis of the alcohol channel, this
expression was valid for Reynolds numbers greater than 600, perhaps due to
37
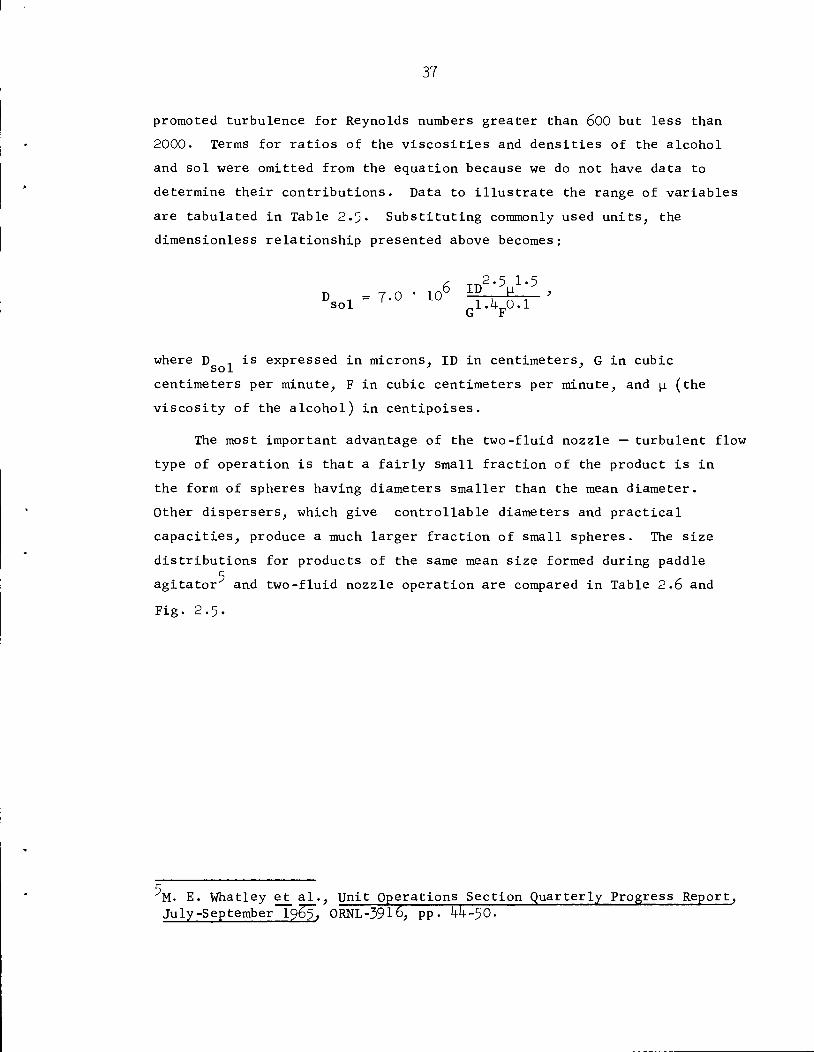
promoted turbulence for Reynolds numbers greater than 600 but less than
2000. Terms for ratios of the viscosities and densities of the alcohol
and sol were omitted from the equation because we do not have data to
determine their contributions. Data to illustrate the range of variables
are tabulated in Table 2-5• Substituting commonly used units, the
dimensionless relationship presented above becomes:
r ™2-5 l.SD 7.o • io6 ">, k; >sol G^V'1
where D , is expressed in microns, ID in centimeters, G in cubicsol ' '
centimeters per minute, F in cubic centimeters per minute, and \x (the
viscosity of the alcohol) in centipoises.
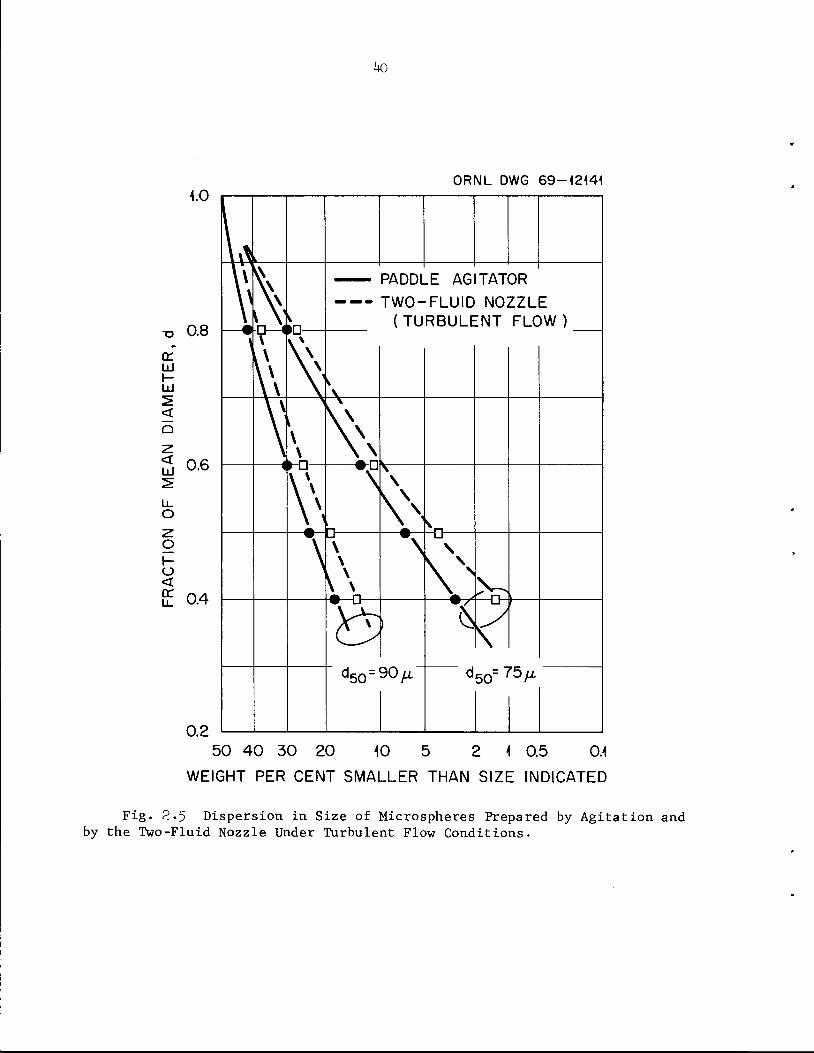
The most important advantage of the two-fluid nozzle — turbulent flow
type of operation is that a fairly small fraction of the product is in
the form of spheres having diameters smaller than the mean diameter.
Other dispersers, which give controllable diameters and practical
capacities, produce a much larger fraction of small spheres. The size
distributions for products of the same mean size formed during paddle
agitator'
Fig. 2.5.
agitator and two-fluid nozzle operation are compared in Table 2.6 and
M. E. Whatley et_al., Unit Operations Section Quarterly Progress Report,July-September 196^", ORNL-3916, pp. M+-50.
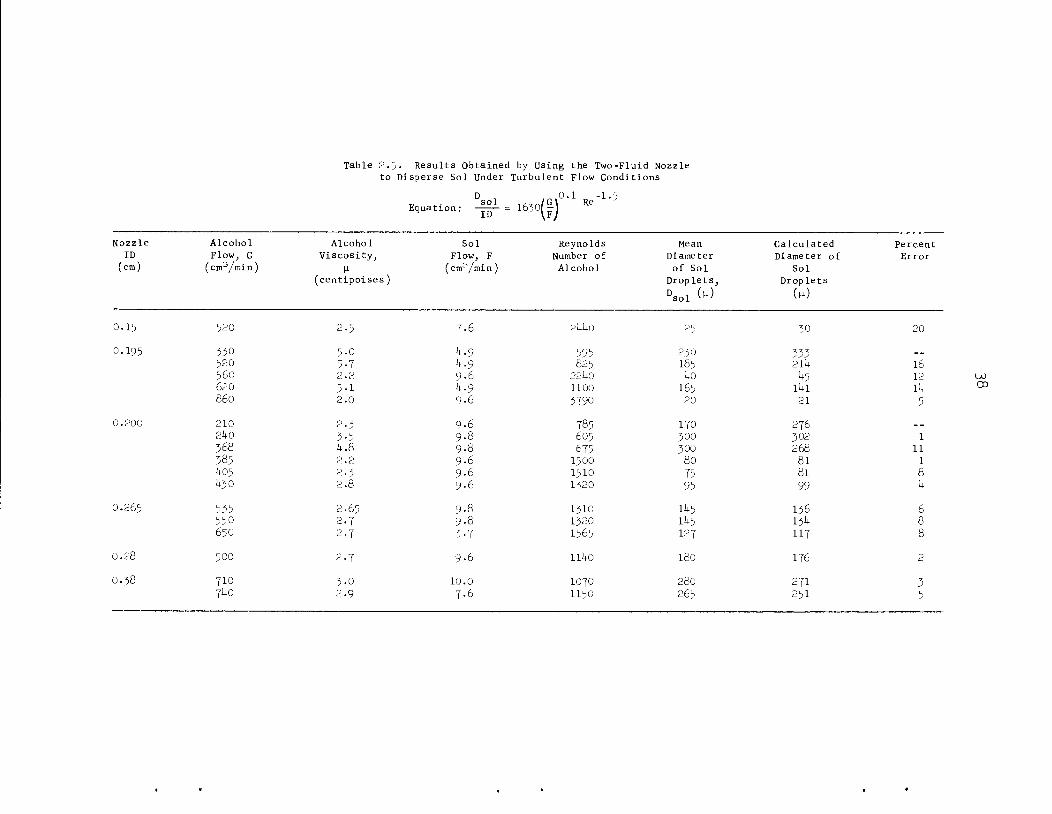
Table 2.5 Results Obtained by Using the Two-Fluid Nozzleto Disperse Sol Under
D ,s°lEquation: =
Turbu
1630)
ent Flow Conditions
Gj0-1 Re"1'*
Nozzle Alcoh 3l Alcohol Sol Reynolds Mean Calculated Percent
ID Flow, G Viscosity, Flow, F Number of Diameter Diameter of Error
(cm) (cm3/min) V- (cm3/min) Alcohol of Sol Sol
(centipoises) Droplets,
Dsol MDroplets
(+0
0.15 520 2-5 7-6 21+1+0 25 30 20
0.195 330 5.0 k-9 395 230 333 __
520 5-7 1+.9 825 185 211+ 16560 2.2 9.6 221+0 1+0 ^5 12
620 5-1 it.9 1100 165 ll+l 11+860 2.0 9.6 3790 20 21 5
0.200 210 2-3 9.6 785 170 27621+0 3-5 9-8 605 300 302 1
368 1+.8 9-8 675 300 268 11
385 2.2 9-6 1500 80 81 1
1+05 2.3 9.6 1510 73 81 81+30 2.8 9-6 1320 95 99 1+
0.265 335 2.65 9.8 1310 11+5 136 6550 2.7 9-8 1320 11+5 131+ 8650 2.7 3-7 1563 127 117 8
0.28 500 2-7 9-6 lii+o 180 176 2
0.58 710 3.0 10.0 1070 280 271 37I+0 2.9 7.6 1150 265 251 5
CO
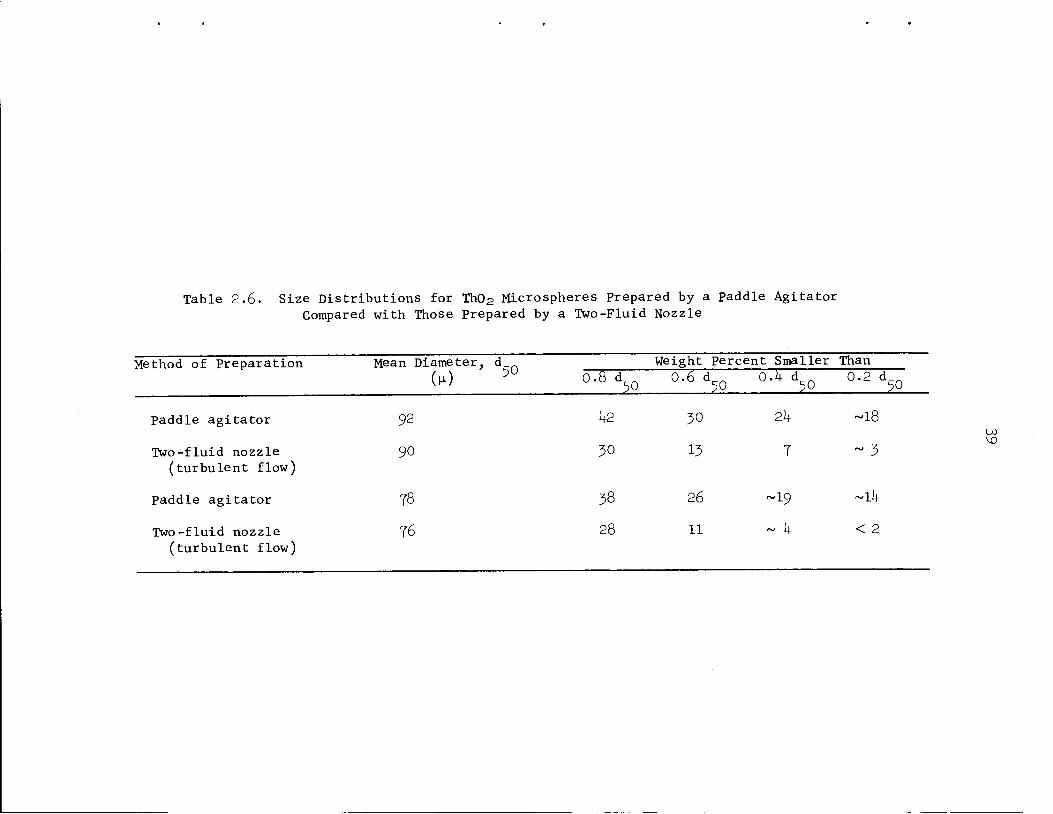
Table 2.6. Size Distributions for Th02 Microspheres Prepared by a paddle AgitatorCompared with Those Prepared by a Two-Fluid Nozzle
Method of Preparation Mean Diameter, d Weight Percent Smaller Than
paddle agitator 92
Two-fluid nozzle 90
(turbulent flow)
Paddle agitator 78
Two-fluid nozzle 76(turbulent flow)
0.8 d50
0 .6 d50
0.1+ d50 °-2 %
1+2 30 21+ -18
30 13 7 ~ 3
38 26 ~19 ~ll+
28 11 ~ k < 2
a:LUHUJ
<
Q
<UJ
o<cru_
10
0.8
0.6
0.4
0.2
50 40 30 20 40 5 Z \ 0.5 OA
WEIGHT PER CENT SMALLER THAN SIZE INDICATED
1+0
ORNL DWG 69-42141
Fig. 2>5 Dispersion in Size of Microspheres Prepared by Agitation andby the Two-Fluid Nozzle Under Turbulent Flow Conditions.
kl
3- MOLTEN-SALT REACTOR PROCESSING STUDIES
L. E. McNeese
A molten-salt breeder reactor (MSBR) will be fueled with a molten
fluoride mixture that will circulate through the blanket and core regions
and through the primary heat exchanger. A close-coupled processing
facility for removing fission products, corrosion products, and fissile
materials from the fused fluoride mixture will be an integral part of
the reactor system.
Work involving several operations related to MSBR processing is
reported. A summary is presented of the nonradioactive operation of the
MSRE Distillation Experiment; emphasis is on the application of this
information to the adjustment of the composition of single-fluid MSBR
fuel salt. It is shown that distillation of 10 to 1+0$ of the fuel salt
produces a significant increase in free fluoride, which will, in turn,
increase the separation factor for rare earths from thorium in the
subsequent reductive extraction.
Gas-lift pumps are being considered for use with liquid bismuth and
molten salt for the Flow Electrolytic Cell Facility. A series of room-
temperature experiments to test the feasibility of a gas lift for pumping
liquid metals such as bismuth was made with mercury.
Multistage equipment for contacting molten salt and liquid bismuth
will be required for the removal of protactinium and the rare earths from
molten salt by reductive extraction. Initial studies of contactor
development are being made with water and mercury, which simulate molten
salt and bismuth. Measurements of dispersed-phase holdup, continuous-
phase pressure drop, and throughput at flooding have been made for a 1-in.
diam column containing various types and sizes of packing materials.
1+2
3-1 Distillation of Molten Salt
J. R. Hightower, Jr. L. E. McNeeseH. D. Cochran, Jr.
The emphasis in the Molten Salt Reactor program has shifted toward
a single-fluid breeder reactor, and the potential role of molten-salt
distillation in fuel processing has changed considerably. A single-
fluid reactor will require the removal of rare-earth fluorides from salt
containing considerable quantities of ThF, ; however, the relatively low
volatility of ThF^ complicates the removal of rare earths by this method.Nevertheless, distillation of molten salt may be useful in fuel processing
as a means for adjusting the salt composition prior to reductive
extraction. Another possible area of application is in the partial
recovery of salt from the waste stream of a reductive extraction plant.
The conclusions from the nonradioactive tests for the MSRE Distil
lation Experiment may be summarized as follows:
(1) Separations were predicted satisfactorily by equilibrium data
obtained from laboratory-scale experiments. No evidence of
entrainment or concentration polarization was observed.
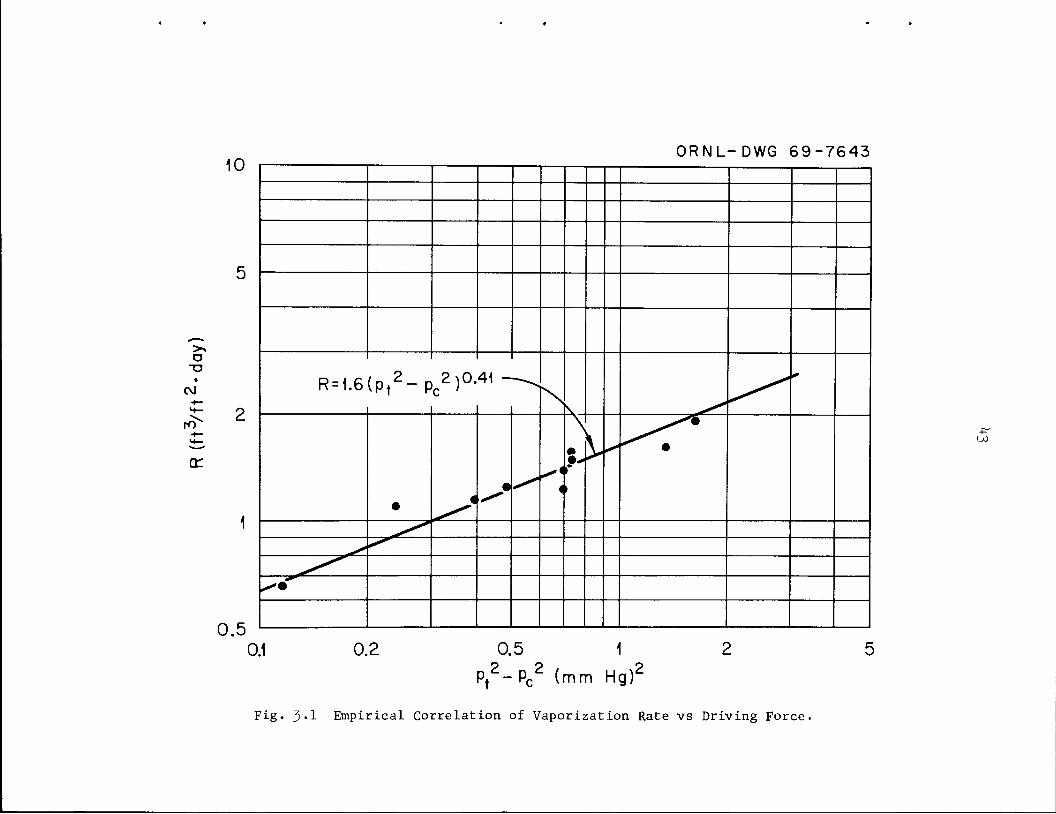
(2) Distillation rates at 1000°C are reasonably high and are given
approximately by the following empirical expression:
«- 1-6 (Pt2 -PC2)°-U, (3-Dwhere
R=distillation rate (ft5 salt/ft day),Pt = total equilibrium vapor pressure above the liquid in the
still pot (mm Hg),
Pc = pressure maintained at the condenser exit (mm Hg).
The correlation (Fig. 3-1) represented by Eq. (3-1) was suggested
by the fact that a steady-state mechanical-energy balance for the
isothermal flow of an ideal gas through a conduit of constant cross
section shows the flow of gas to be a function of the difference in
o
•
CVJ
cr
10
0.5
ORNL-DWG 69-7643
R = 1.6 (Pt2"Pc2)°-41 -
•4
•
—'^^^
<
8.r
>
"""^ •
*"•
0.1 0.2 0.5 1
Pt2-Pc2 (mm Hg)2Fig. 3-1 Empirical Correlation of Vaporization Rate vs Driving Force.
-p-
kk
the squares of the upstream and downstream pressures. Although
the flow path was not isothermal and the condenser cross section
was not uniform in the tests summarized in Fig. 3-1, a fair
correlation of all the distillation rate data was obtained.
The value of p ranged from O.O55 to 0-5 mm Hg, and the value
of p ranged from O.7O to 1.28 mm Hg.
(3) The still pot was operated for 300 hr at temperatures in
excess of 900°C, including a l+5-hr period at temperatures
greater than 1000°C, without evidence of serious corrosion or
deformation of the Hastelloy N structural material.
(1+) No important difficulties or unexpected results were observed.
Thus we conclude that distillation performance, distillation rates,
and separation faccors may be predicted from vapor-liquid equilibrium
measurements made on a laboratory scale. Calculations were made to show
that distillation can be used as a means for adjusting the composition
of salts containing thorium prior to reductive extraction. The
calculational method and the results are described in the following
paragraphs.
Laboratory experiments have indicated that optimal reductive
extraction is obtained with a salt of maximum "free-fluoride" content,
a concept advanced by M. A. Bredig. The free-fluoride content, F, for
a mixture of LiF, BeFp, and ThF, is given by:
F=(XLi-2XBeF2-5XThF^ X10°' ^-2)
where
x. . = mole fraction of lithium,
x.„ _ = mole fraction of BeF ,BeF2 2'x^ = mole fraction of ThF .IhF^ 4
J. H. Shaffer, D. M. Moulton, and W. R. Grimes, MSR Program Semiann.Progr. Rept. Aug. 31, 1968, ORNL-1+3kk, pp. 176-78"!
^
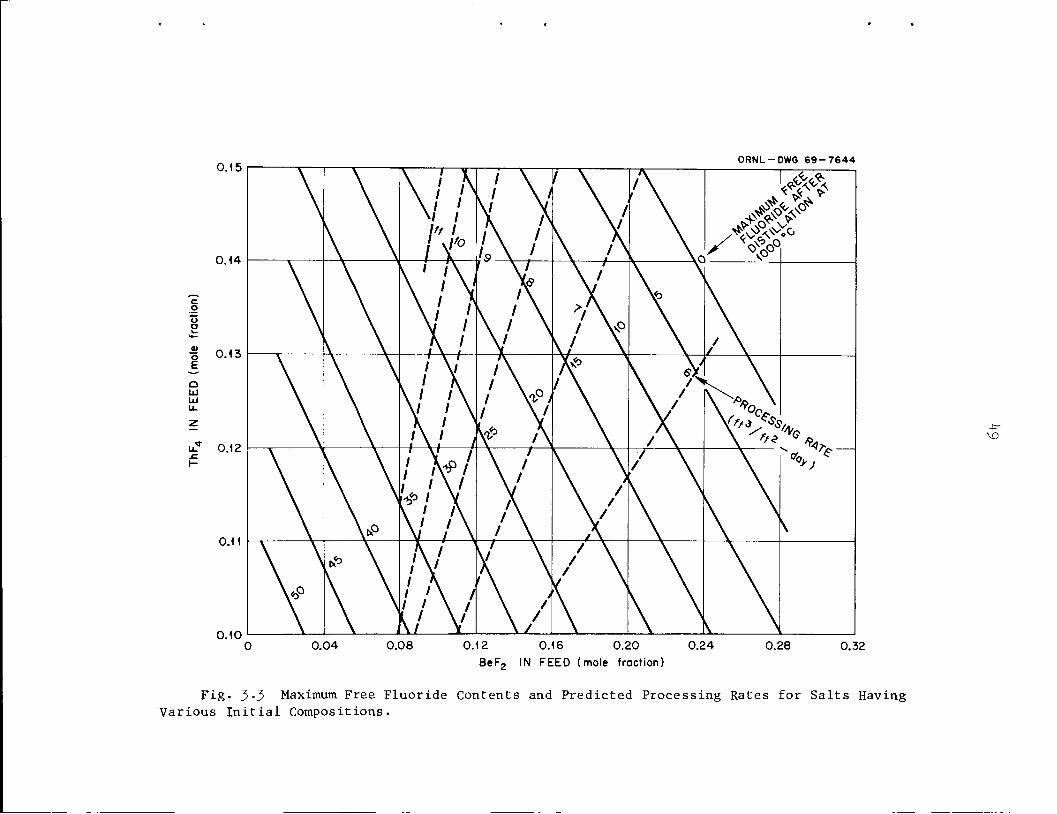
We have calculated the maximum free-fluoride concentration that is
obtainable by single-stage distillation and the processing rate that one
might expect in attaining this enhancement of free-fluoride content for
various initial salt compositions, using equilibrium separation factors
and mass balances. The composition of the bottoms and the free-fluoride
content were calculated for vaporization of 2 to 50$ of the feed salt.
In all cases studied, the bottoms showed a maximum in free-fluoride
content at a fractional vaporization between 10 and 1+0$. A description
of the calculation procedure is given below.
In order to apply Eq. (3«l) to the calculation of the processing
rate at the fractional vaporization necessary to attain the maximum free-
fluoride concentration in the bottoms, the vapor pressure of the salt,
p , must be calculated. (The condenser pressure, p , was assumed to be
0.07 n™ Hg, which is the average condenser pressure used in the exper
iments represented in Fig. J>.l.) For vapor at very low pressure, Dalton's
law is applicable and states that
PLiF = Pt yLiF' (3'5)
where p . is the partial pressure of LiF, and y is the mole fraction
of LiF in vapor. For a nonideal solution,
where
.v.
PLiF~ PLiF 7LiF *LiF' (5'U)
p = the vapor pressure of pure LiF at 1000°C ~ 0.1+8 mm Hg,LiF
y, .„ = the activity coefficient of LiF in solution,LiF
^iFmole fraction of LiF in solution.
Thus,
k6
D 7.XFLiF7LiF LiF
yLiF(3-5)
The activity coefficient, 7 . can be obtained from the following empir
ical expression!
In 7Lip = 0.336 1 " (5-71 x - 1)< (3-6)
where
ThF, = mole fraction of ThF, in solution.1+ 1+
The mole fraction of LiF in the vapor, y . , needed to solve Eq. (3.5) isLiF rj
obtained from the empirical separation factors,
and
a
a.
V X'ThF, LiF
ThvLiF s^ y^
V X'BeFg LiF
BevLiF s ^ >W 3-5
by recognizing that
1.5 fxThF,
1 + 100 W'
yLiF 1"yThF^ "yBeF2'
The final equation for the vapor pressure of salt in the still pot,
obtained by combining Eqs. (3-5) - (3*9), is then:
(3-7)
(3.8)
(3-9)
Pt =?LiFPLiF ^XLiF + aBeF„-LiF XBeF0 +°W, -LiF "ThF,2 2 1+ 1+
x^ ). (3.IO)
7 J. R. Hightower, ORNL, personal communication.
^7
The empirical expressions for y_ ._, CC_ _ T ._,, and QL,, were usedr K 'LiF' BeF_-LiF' ThF, -LiF
in the actual calculations.
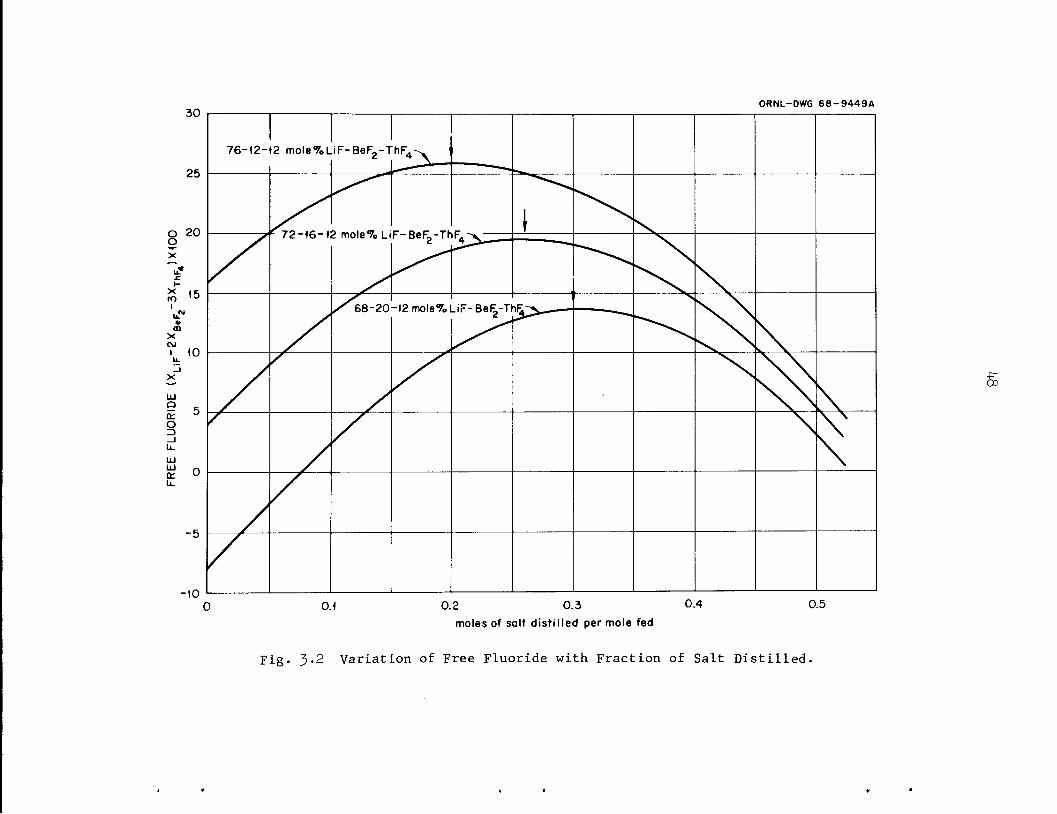
These relations were used to predict approximate distillation
performance at 1000°C for feed-salt compositions in which the initial
BeF and ThF, concentrations ranged from 0 to 3° wt $ and from 10 to 15
wt $, respectively, with the remaining material being LiF. Figure 3.2
shows that, for three feed-salt compositions of interest, the free-
fluoride content achieves a maximum after 10 to 1+0$ of the salt has been
distilled. This general behavior was exhibited by all compositions
studied. Figure 3 »3 shows the maximum free-fluoride contents that can
be attained by distillation at 1000°C The predicted processing rates
(distillation rate divided by fraction vaporized) are also shown.
3.2 Gas-Lift Pumping of Liquid Metals
M. S. Lin L. E. McNeese
Gas-lift pumps are being considered for use with liquid bismuth and
molten salt for the Flow Electrolytic Cell Facility. This type of pump
is simple, appears to be adequate, and is easily fabricated. Most of the
data on gas-lift pumps are limited to the air-water system. A series of
experiments to test the feasibility of pumping liquid metals such as
bismuth was made with air and mercury at room temperature.
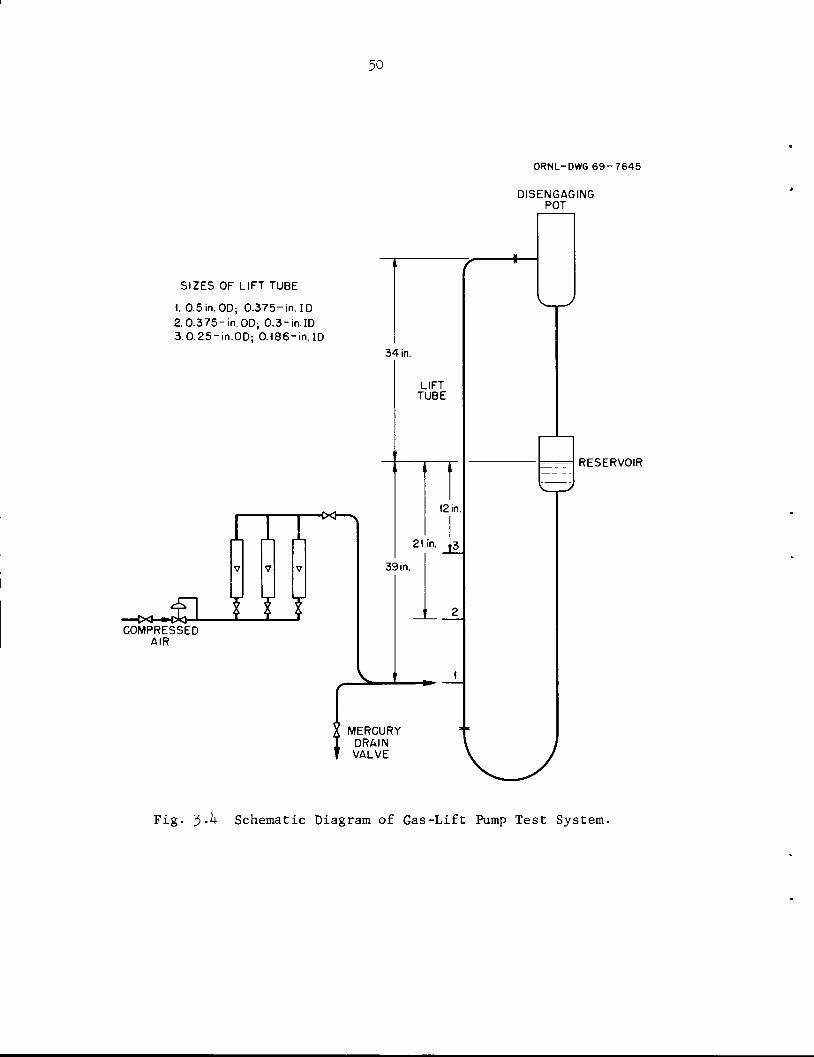
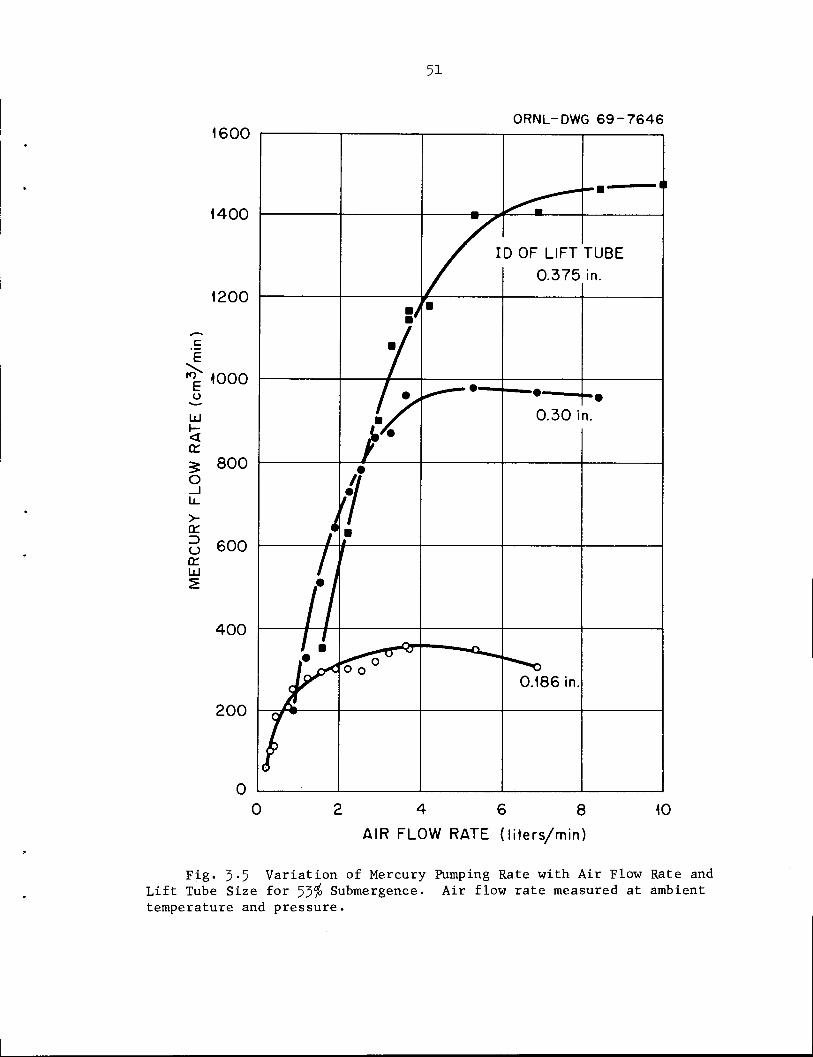
The experimental equipment is shown schematically in Fig. 3-^- Most
of the components were made of stainless steel. The pump consists of a
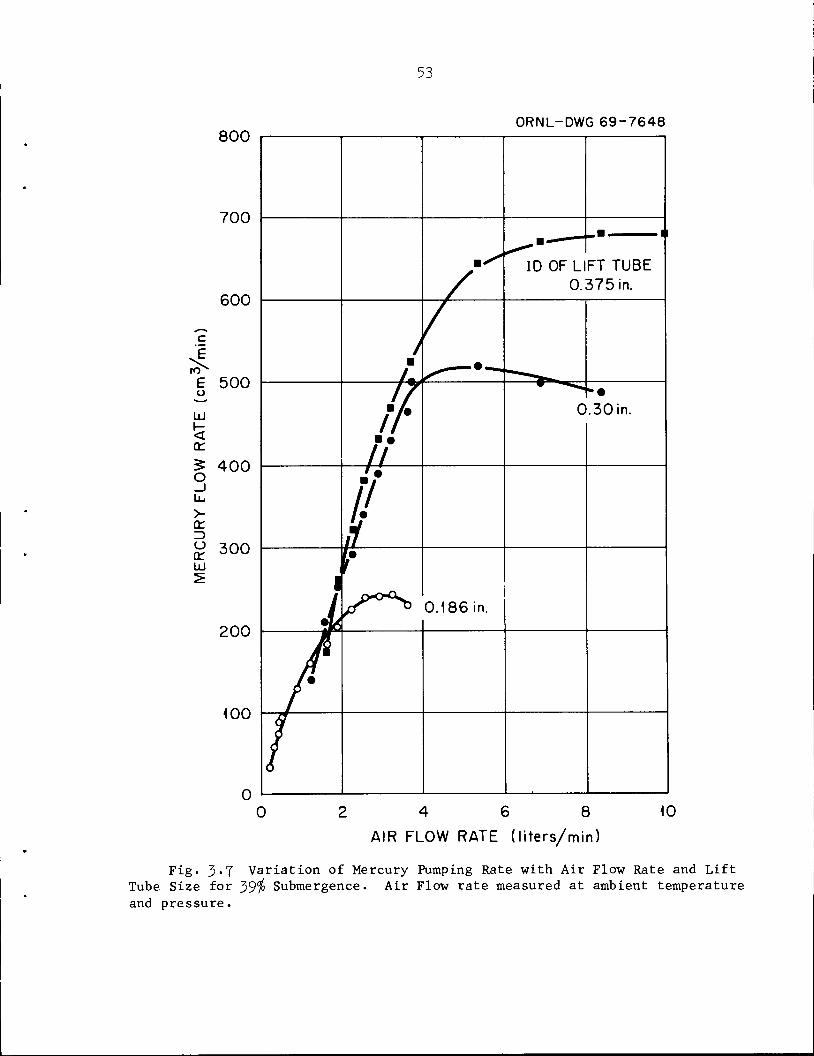
lift tube, a submergence leg with a reservoir, and a gas-liquid dis
engaging head pot. Three sizes of lift tubes (0-375> 0.3, and 0.186 in.
ID) were tested. Each tube had three air-injection points, which provide
three different submergence depths. Air fed to the system was metered
by one of three rotameters. The results of the tests are shown in
Figs. 3-5 - 3-10.
30
25
O 20O
rol
,~
x
CO
i 10
a:o3
-10
ORNL-DWG 68-9449A
76-12- 2 mole%LiF-BeF2-ThF4->.
2 mole%LiF-BeF2-TI- 172-16 1
s>-—
/68-20 -12 mole7o .ir-Belg-T 1'4>-—
0.1 0.2 0.3
moles of salt distilled per mole fed
0.4 0.5
Fig- 3-2 Variation of Free Fluoride with Fraction of Salt Distilled.
4=-00
0.15
0.100.04 0.08 0.12 0.16 0.20 0.24
BeF2 IN FEED (mole fraction)
ORNL-DWG 69-7644
0.28 0.32
Fig. 3-3 Maximum Free Fluoride Contents and Predicted Processing Rates for Salts HavingVarious Initial Compositions.
4=-
SIZES OF LIFT TUBE
1. 0.5in.0D; 0.375-in. ID2.0.375-in.OD; 0.3-in.ID3.0.25-in.OD; 0.186-in.ID
rrr
—rxi-M><3—1 *—*—iCOMPRESSED
AIR
•« V
50
ORNL-DWG 69-7645
DISENGAGINGPOT
RESERVOIR
Fig. 3.k Schematic Diagram of Gas-Lift Pump Test System.
1600
1400
1200
c
E
Eo
LU
o
>-or
orUJ
4000
800
600
400
200
0
0
51
ORNL-DWG 69-7646
2 4 6 8
AIR FLOW RATE (liters/min)
10
Fig* 3-5 Variation of Mercury Pumping Rate with Air Flow Rate andLift Tube Size for 53$ Submergence. Air flow rate measured at ambienttemperature and pressure.
52
ORNL-DWG 69-7647
2 4 6 8
AIR FLOW RATE (liters/min)
Fig. 3-6 Variation of Ratio of Air Flow Rate to Mercury Flow Ratewith Air Flow Rate and Lift Tube Size for 53$ Submergence. Air flowrate measured at ambient temperature and pressure.
Eo
UJ
or
Lu
>-or
(JorUJ
800
700
600
500
400
300
200
100
0
0
53
0.186 in.
ORNL-DWG 69-7648
ID OF LIFT TUBE
0.375 in.
2 4 6 8
AIR FLOW RATE (liters/min)10
Fig. 3-7 Variation of Mercury Pumping Rate with Air Flow Rate and LiftTube Size for 39$ Submergence. Air Flow rate measured at ambient temperatureand pressure.
5^
ORNL-DWG 69-7649
2 4 6 8
AIR FLOW RATE (liters/min)
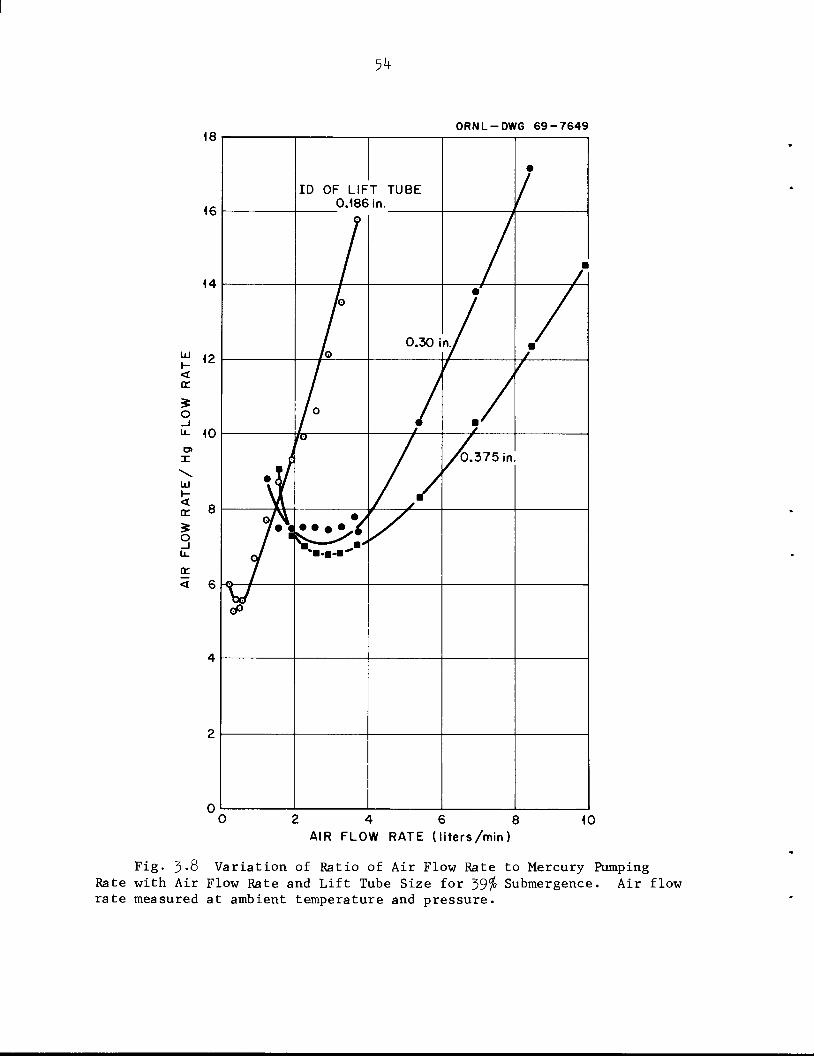
Fig. 3-8 Variation of Ratio of Air Flow Rate to Mercury PumpingRate with Air Flow Rate and Lift Tube Size for 39$ Submergence. Air flowrate measured at ambient temperature and pressure.
4Eo
UJI-<or
or3
O
orUJ
55
360ORNL-DWG 69-7650
/ •
ID OF LIFT TUBE
320
10.375 in.
I1
m
1
280//
240/
/
•
/—" v200 / N o.30 in.
t
• 0
160 /J /
/ A o
/ 1 "*Sw
120
80
/ o"
>3 0 .186 in.
fo
i•
40
0 12 3 4 5
AIR FLOW RATE (liters/min)
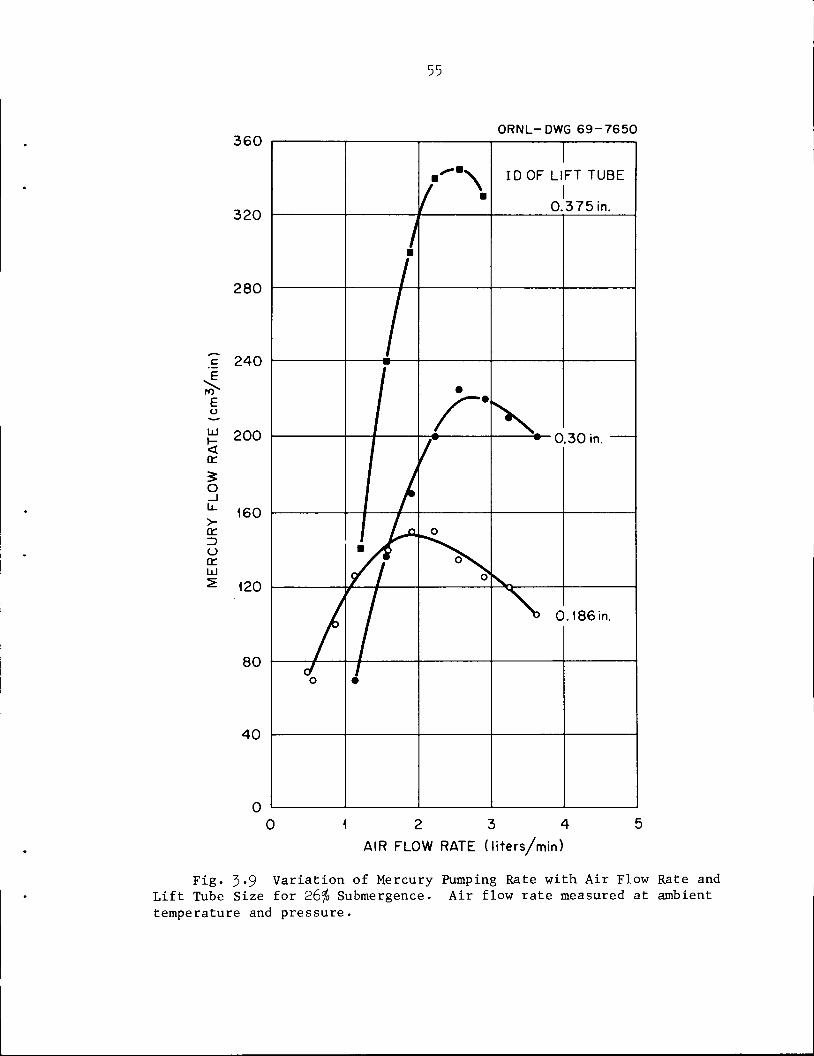
Fig. 3.9 Variation of Mercury Pumping Rate with Air Flow Rate andLift Tube Size for 26$ Submergence. Air flow rate measured at ambienttemperature and pressure.
56
ORNL-DWG 69-7651
12 3 4
AIR FLOW RATE (liters/min)
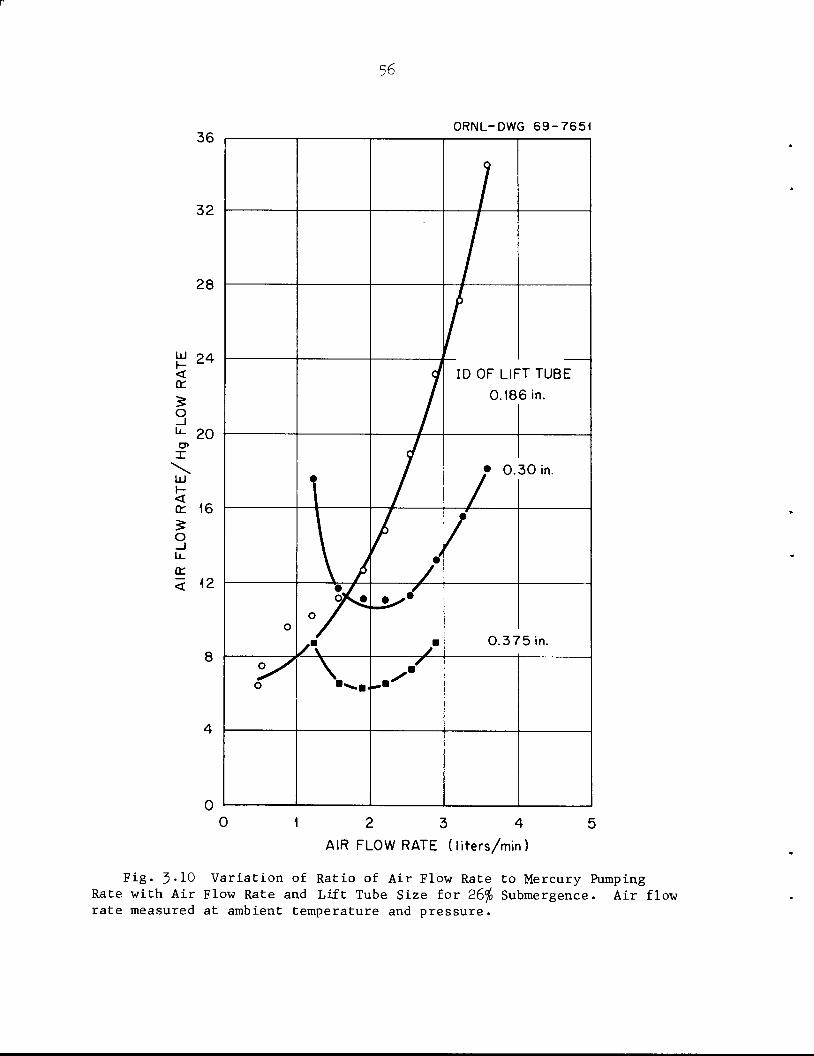
Fig. 3.10 Variation of Ratio of Air Flow Rate to Mercury PumpingRate with Air Flow Rate and Lift Tube Size for 26$ Submergence. Air flowrate measured at ambient temperature and pressure.
57
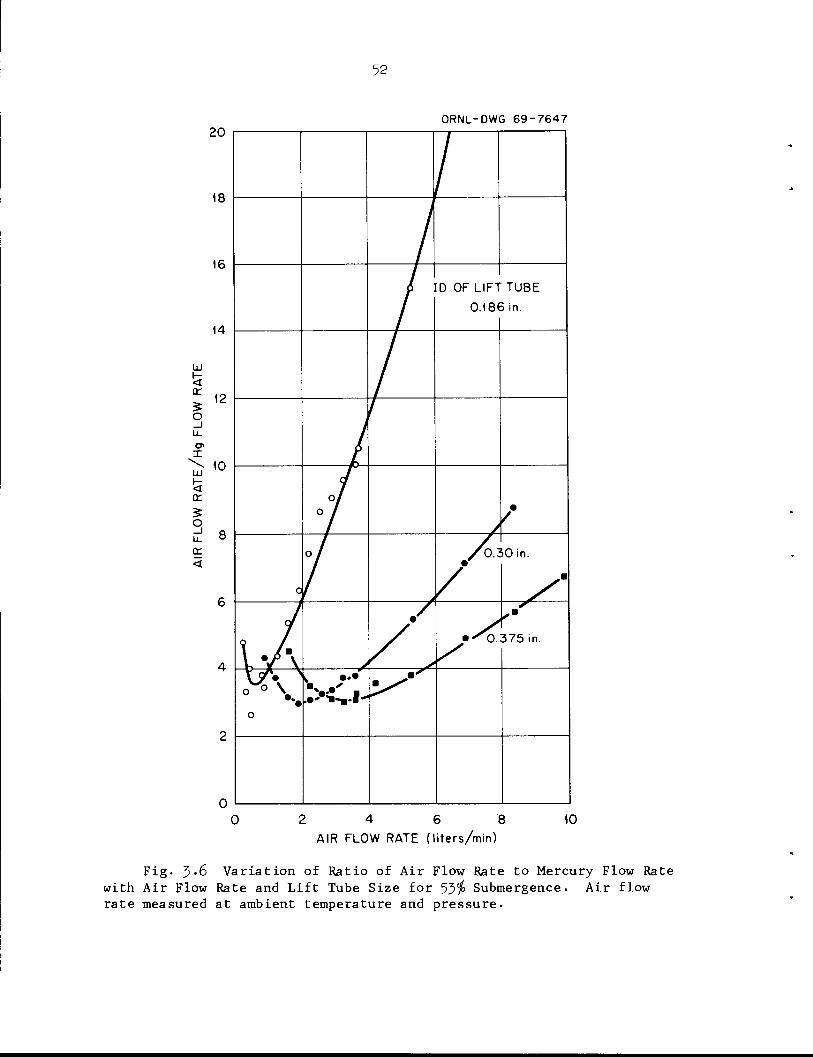
For a given size of lift tube with a fixed submergence depth, a
maximum mercury pumping rate and a minimum air-to-mercury flow ratio
are obtained. The air flow rate yielding the maximum pumping rate is
always greater than the air rate that yields the maximum air-to-mercury
flow ratio. For a given submergence depth, the pumping capacity increases
as the diameter of the lift tube increases. However, as this diameter
is increased, the metal flow rate becomes less stable.
It was concluded that gas-lift pumping of bismuth is feasible for
the Flow Electrolytic Cell Facility and that two 3/8-in.-OD lift tubes
would provide the desired maximum flow of 0-5 gpm.
3.3 Simulated Salt-Metal Contactor Studies
J. S. Watson L. E. McNeese
The flowsheets currently proposed for processing the fuel stream of
molten salt breeder reactors (MSBR's) to remove protactinium and rare-
earth fission products involve reductive extraction of these elements into
molten bismuth containing lithium and thorium metals as reductants.
Multistage, countercurrent contactors for bismuth and molten salt to be
used in this process present several unique difficulties or requirements.
First, the requirements as to temperature and material of construction
dictate a reasonably simple design. Second, the high densities of the
fluids and the high interfacial tension between the phases make design
data and experience from conventional aqueous-organic liquid contactors
of little, if any, use. Finally, the rare-earth-removal system requires
very high flow ratios, for which conventional columns (packed or spray)
have relatively large stage heights because of axial mixing in the
continuous phase (i.e., the phase having the lower throughput).
3«3-l Use of Simulated System for Contactor Development
Contactor development is being studied initially with a low-temper
ature (i.e., room-temperature) system, mercury-water, which has physical
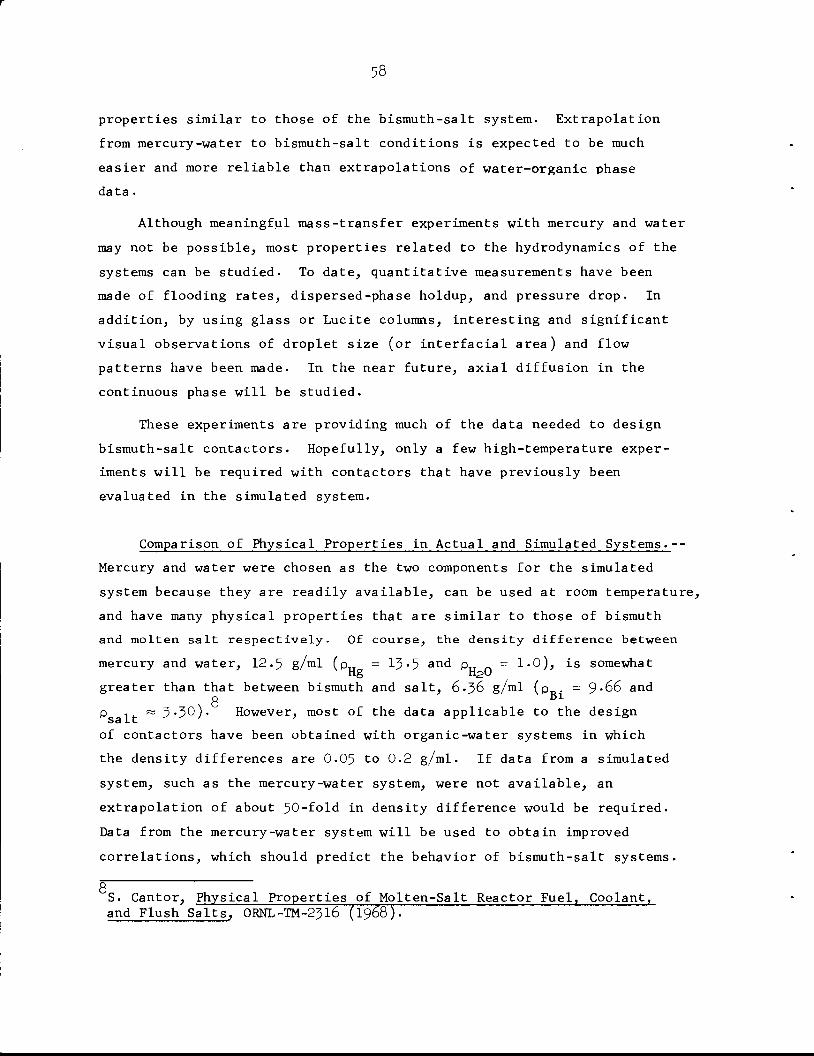
58
properties similar to those of the bismuth-salt system. Extrapolation
from mercury-water to bismuth-salt conditions is expected to be much
easier and more reliable than extrapolations of water-organic phase
data .
Although meaningful mass-transfer experiments with mercury and water
may not be possible, most properties related to the hydrodynamics of the
systems can be studied. To date, quantitative measurements have been
made of flooding rates, dispersed-phase holdup, and pressure drop. In
addition, by using glass or Lucite columns, interesting and significant
visual observations of droplet size (or interfacial area) and flow
patterns have been made. In the near future, axial diffusion in the
continuous phase will be studied.
These experiments are providing much of the data needed to design
bismuth-salt contactors. Hopefully, only a few high-temperature exper
iments will be required with contactors that have previously been
evaluated in the simulated system.
Comparison of Physical Properties in Actual and Simulated Systems.--
Mercury and water were chosen as the two components for the simulated
system because they are readily available, can be used at room temperature,
and have many physical properties that are similar to those of bismuth
and molten salt respectively. Of course, the density difference between
mercury and water, 12.5 g/ml (p = 13-5 and p = 1-0), is somewhatHg H2O
greater than that between bismuth and salt, 6.36 g/ml (p,,. = 9-66 ando Bi
p . « 3-30)- However, most of the data applicable to the designSa lL
of contactors have been obtained with organic-water systems in which
the density differences are 0.05 to 0.2 g/ml. If data from a simulated
system, such as the mercury-water system, were not available, an
extrapolation of about 50-fold in density difference would be required.
Data from the mercury-water system will be used to obtain improved
correlations, which should predict the behavior of bismuth-salt systems.
S. Cantor, Physical Properties of Molten-Salt Reactor Fuel, Coolant,and Flush Salts, ORNL-TM-2316 (1968).
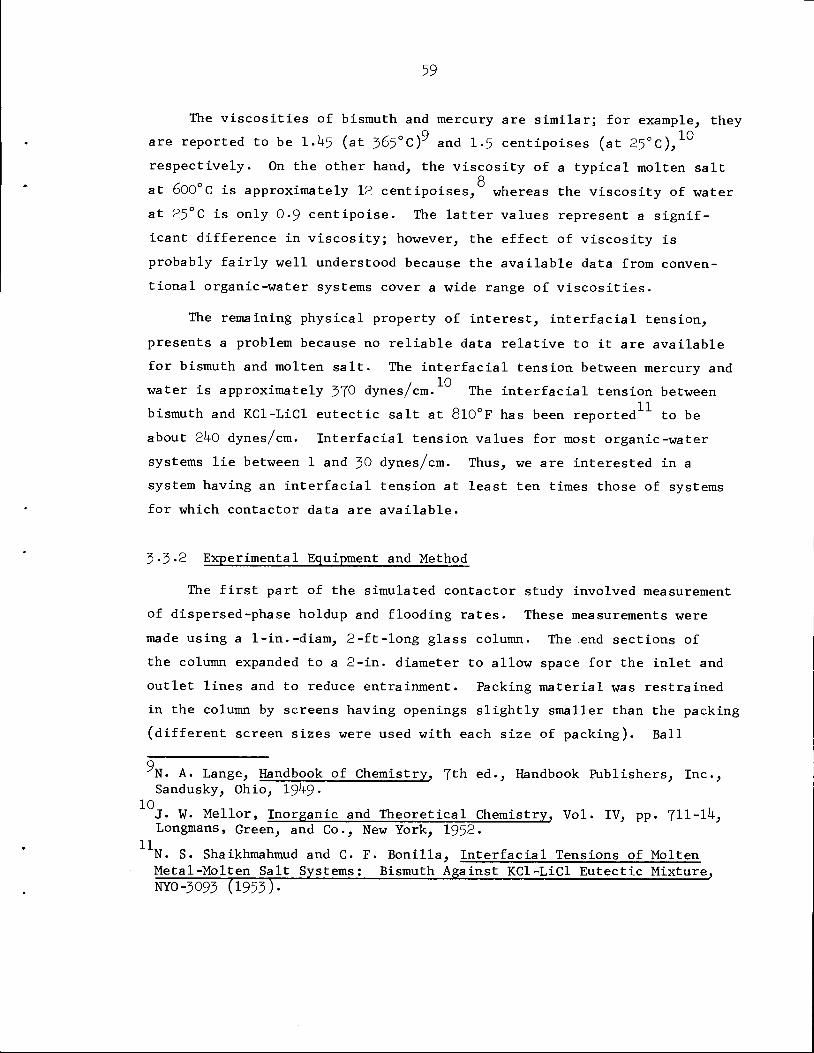
59
The viscosities of bismuth and mercury are similar; for example, they
are reported to be 1.1+5 (at 3650 cy and 1.5 centipoises (at 25°c),10respectively. On the other hand, the viscosity of a typical molten salt
Q
at 600°C is approximately 12 centipoises, whereas the viscosity of water
at 25°C is only 0-9 centipoise. The latter values represent a signif
icant difference in viscosity; however, the effect of viscosity is
probably fairly well understood because the available data from conven
tional organic-water systems cover a wide range of viscosities.
The remaining physical property of interest, interfacial tension,
presents a problem because no reliable data relative to it are available
for bismuth and molten salt. The interfacial tension between mercury and
water is approximately 370 dynes/cm. The interfacial tension between
bismuth and KCl-LiCl eutectic salt at 8l0°F has been reported to be
about 2l+0 dynes/cm. Interfacial tension values for most organic-water
systems lie between 1 and 30 dynes/cm. Thus, we are interested in a
system having an interfacial tension at least ten times those of systems
for which contactor data are available.
3-3-2 Experimental Equipment and Method
The first part of the simulated contactor study involved measurement
of dispersed-phase holdup and flooding rates. These measurements were
made using a l-in.-diam, 2-ft-long glass column. The end sections of
the column expanded to a 2-in. diameter to allow space for the inlet and
outlet lines and to reduce entrainment. Packing material was restrained
in the column by screens having openings slightly smaller than the packing
(different screen sizes were used with each size of packing). Ball
9N. A. Lange, Handbook of Chemistry, 7th ed., Handbook Publishers, Inc.,Sandusky, Ohio, I9I+9.
J. W- Mellor, Inorganic and Theoretical Chemistry, Vol. IV, pp. 711-14,Longmans, Green, and Co., New York, 1952.
11N. S. Shaikhmahmud and C. F. Bonilla, Interfacial Tensions of MoltenMetal-Molten Salt Systems; Bismuth Against KCl-LiCl Eutectic Mixture,
NYO-3093 (1953).
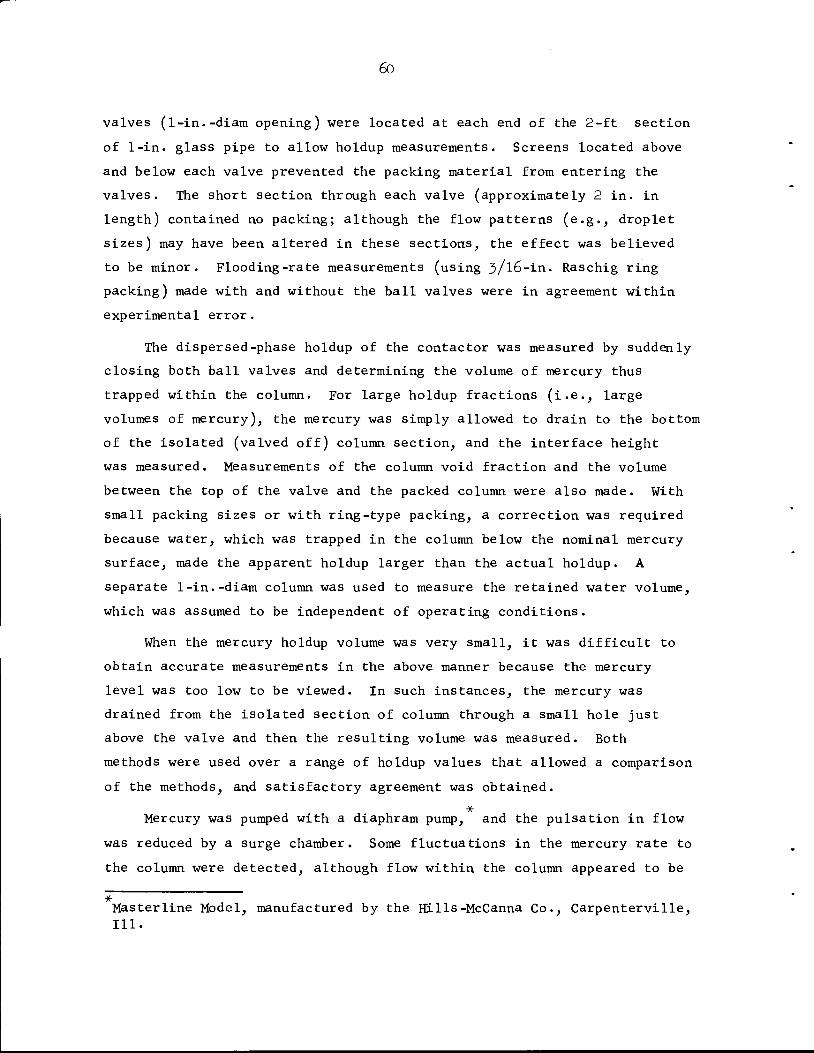
6o
valves (l-in.-diam opening) were located at each end of the 2-ft section
of 1-in. glass pipe to allow holdup measurements. Screens located above
and below each valve prevented the packing material from entering the
valves. The short section through each valve (approximately 2 in. in
length) contained no packing; although the flow patterns (e.g., droplet
sizes) may have been altered in these sections, the effect was believed
to be minor. Flooding-rate measurements (using 3/l6-in. Raschig ring
packing) made with and without the ball valves were in agreement within
experimental error.
The dispersed-phase holdup of the contactor was measured by suddenly
closing both ball valves and determining the volume of mercury thus
trapped within the column. For large holdup fractions (i.e., large
volumes of mercury), the mercury was simply allowed to drain to the bottom
of the isolated (valved off) column section, and the interface height
was measured. Measurements of the column void fraction and the volume
between the top of the valve and the packed column were also made. With
small packing sizes or with ring-type packing, a correction was required
because water, which was trapped in the column below the nominal mercury
surface, made the apparent holdup larger than the actual holdup. A
separate l-in.-diam column was used to measure the retained water volume,
which was assumed to be independent of operating conditions.
When the mercury holdup volume was very small, it was difficult to
obtain accurate measurements in the above manner because the mercury
level was too low to be viewed. In such instances, the mercury was
drained from the isolated section of column through a small hole just
above the valve and then the resulting volume was measured. Both
methods were used over a range of holdup values that allowed a comparison
of the methods, and satisfactory agreement was obtained.
Mercury was pumped with a diaphram pump, and the pulsation in flow
was reduced by a surge chamber. Some fluctuations in the mercury rate to
the column were detected, although flow within the column appeared to be
Masterline Model, manufactured by the Hills-McCanna Co., Carpenterville,
111.
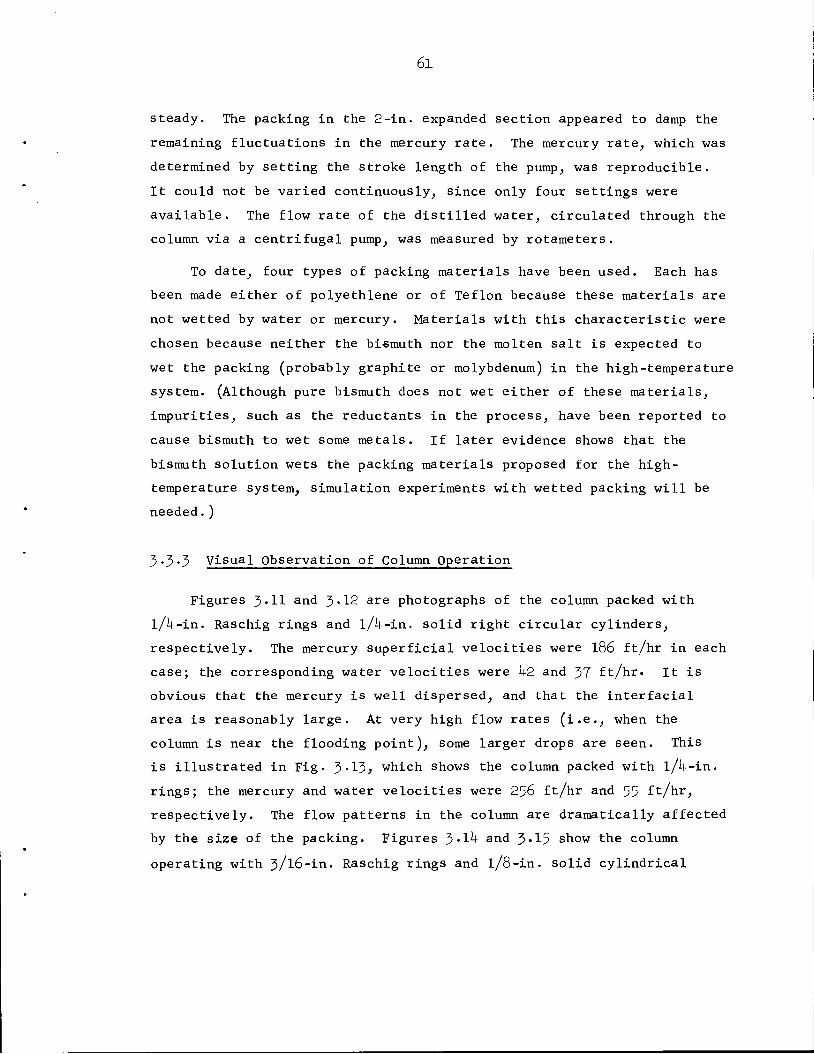
61
steady. The packing in the 2-in. expanded section appeared to damp the
remaining fluctuations in the mercury rate. The mercury rate, which was
determined by setting the stroke length of the pump, was reproducible.
It could not be varied continuously, since only four settings were
available. The flow rate of the distilled water, circulated through the
column via a centrifugal pump, was measured by rotameters.
To date, four types of packing materials have been used. Each has
been made either of polyethlene or of Teflon because these materials are
not wetted by water or mercury. Materials with this characteristic were
chosen because neither the bismuth nor the molten salt is expected to
wet the packing (probably graphite or molybdenum) in the high-temperature
system. (Although pure bismuth does not wet either of these materials,
impurities, such as the reductants in the process, have been reported to
cause bismuth to wet some metals. If later evidence shows that the
bismuth solution wets the packing materials proposed for the high-
temperature system, simulation experiments with wetted packing will be
needed. )
3-3-3 Visual Observation of Column Operation
Figures 3-H and 3-12 are photographs of the column packed with
l/l+-in. Raschig rings and l/4-in. solid right circular cylinders,
respectively. The mercury superficial velocities were 186 ft/hr in each
case; the corresponding water velocities were 1+2 and 37 ft/hr. It is
obvious that the mercury is well dispersed, and that the interfacial
area is reasonably large. At very high flow rates (i.e., when the
column is near the flooding point), some larger drops are seen. This
is illustrated in Fig. 3-13; which shows the column packed with l/l+-in.
rings; the mercury and water velocities were 256 ft/hr and 55 ft/hr,
respectively. The flow patterns in the column are dramatically affected
by the size of the packing. Figures J>.lk and 3'15 show the column
operating with 3/16-in. Raschig rings and l/8-in. solid cylindrical
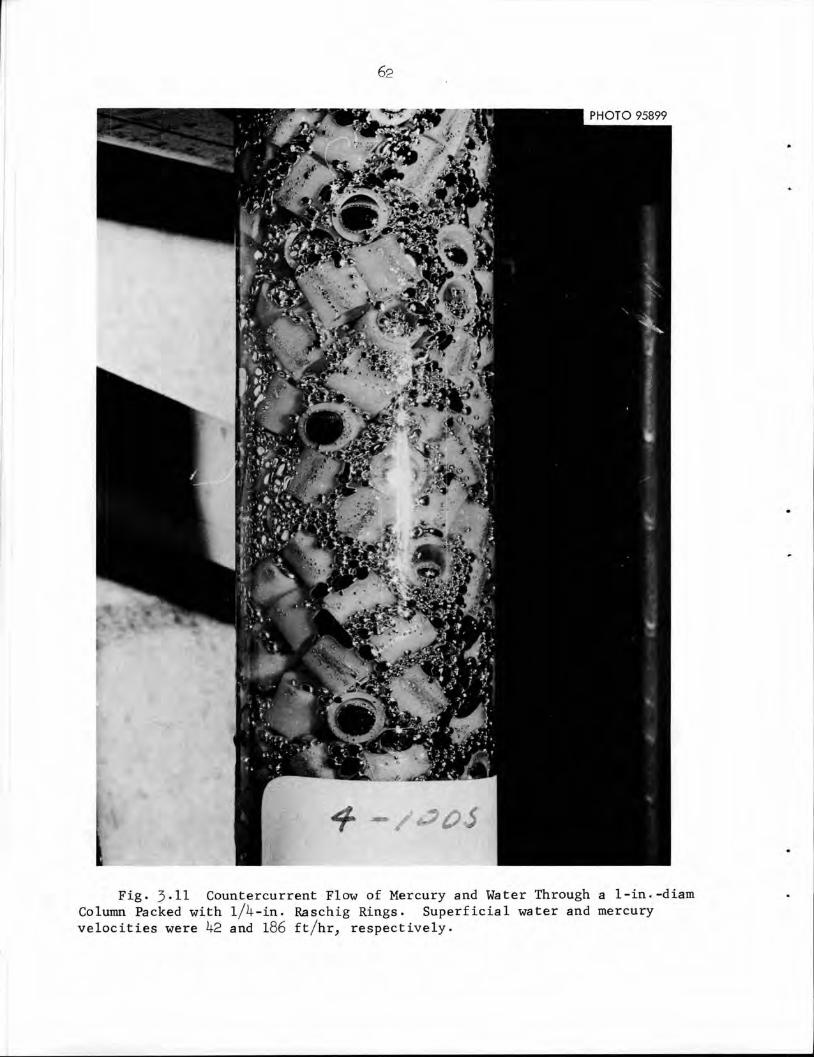
62
PHOTO 95899
Fig. 3-11 Countercurrent Flow of Mercury and Water Through a l-in.-diamColumn Packed with l/^-in. Raschig Rings. Superficial water and mercuryvelocities were k-2. and 186 ft/hr, respectively.
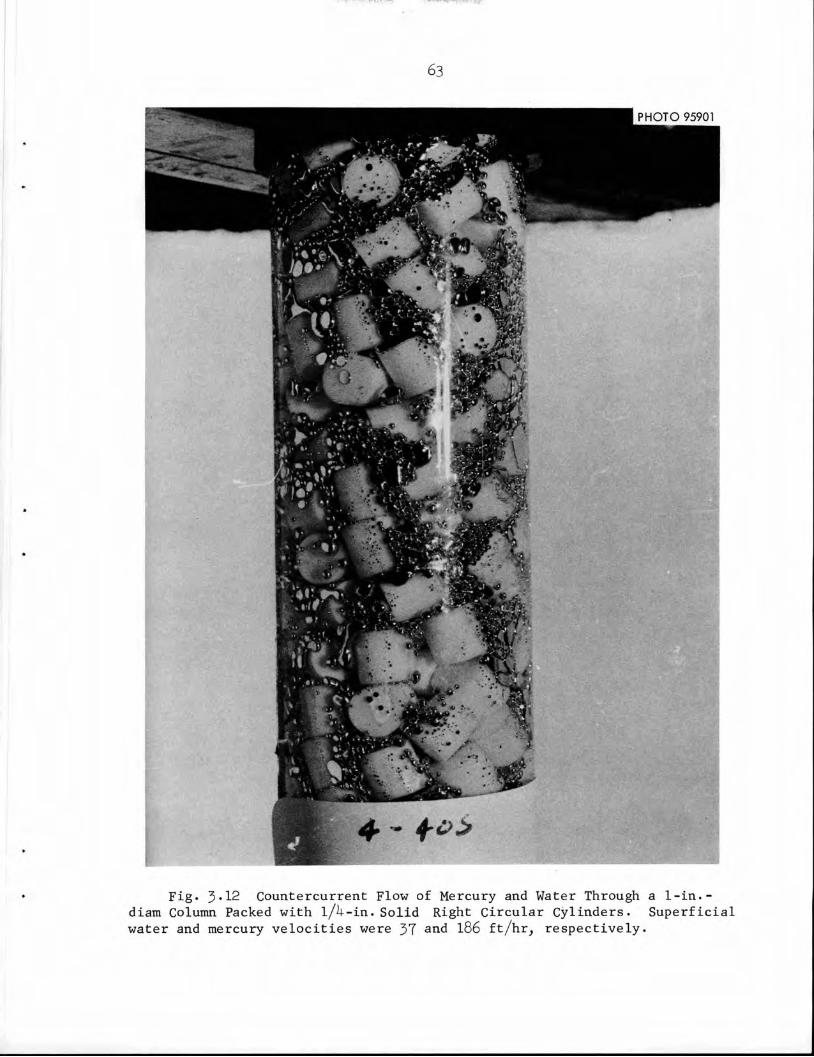
•
' J&\.J' ,'ft.
;
»»!•'*:
63
PHOTO 95901
" 'j
jl
5*8^Hfe'^^BJ^£- ^Ml
jJtor10CcS 3F^P^ HIl',.
imfMBy•*.• ~s*m&BB' a!
' .WL ,•• . :'^3fii5^K'- ^#*:-f
V *Hr^jy^ •tH8E$T'
4 ^^Sq^ff' ''^Ki f
E: •*Hfe- HHr *•
•Li-** / - '"
4 - f *>
Fig. 3•12 Countercurrent Flow of Mercury and Water Through a 1-in.-diam Column Packed with l/U-in. Solid Right Circular Cylinders. Superficialwater and mercury velocities were 37 and 186 ft/hr, respectively.
6k
HOTO 95898
Fig. 3.13 Countercurrent Flow of Mercury and Water Through a 1-in.diam Column Packed with l/4-in. Raschig Rings. Superficial water andmercury velocities were 55 and 256 ft/hr, respectively.
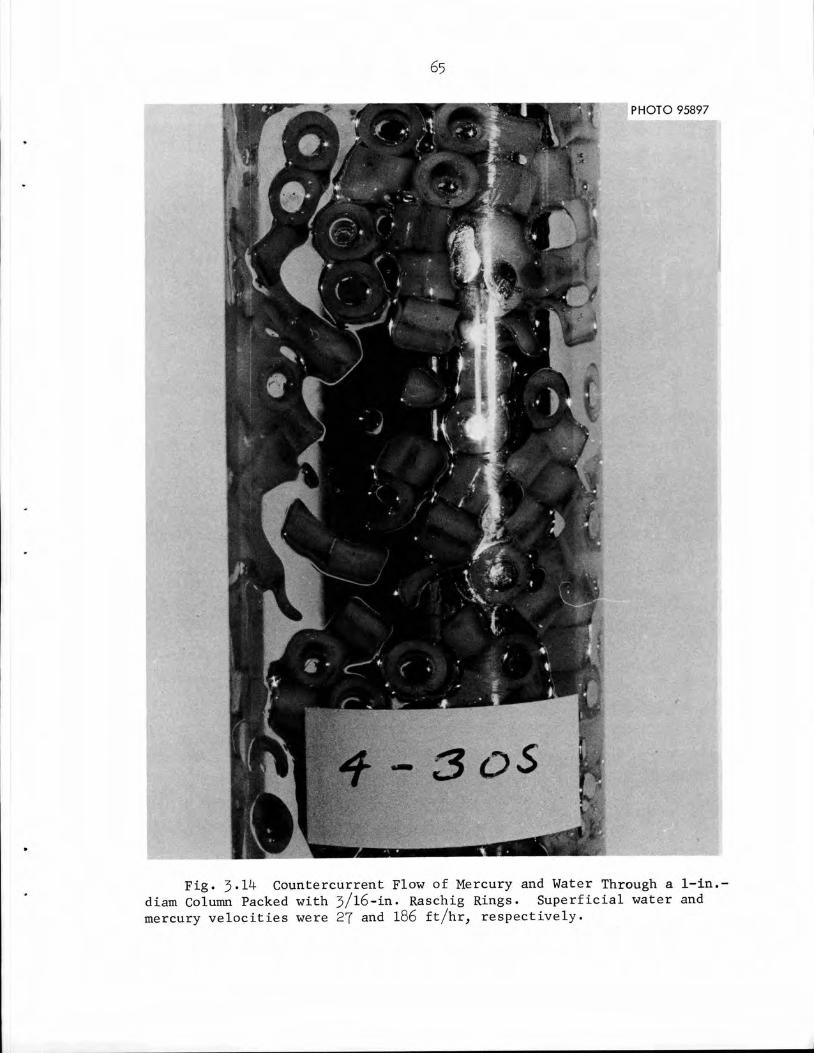
65
PHOTO 95897
Fig. 3-14 Countercurrent Flow of Mercury and Water Through a 1-in.diam Column Packed with 3/16-in. Raschig Rings. Superficial water andmercury velocities were 27 and 186 ft/hr, respectively.
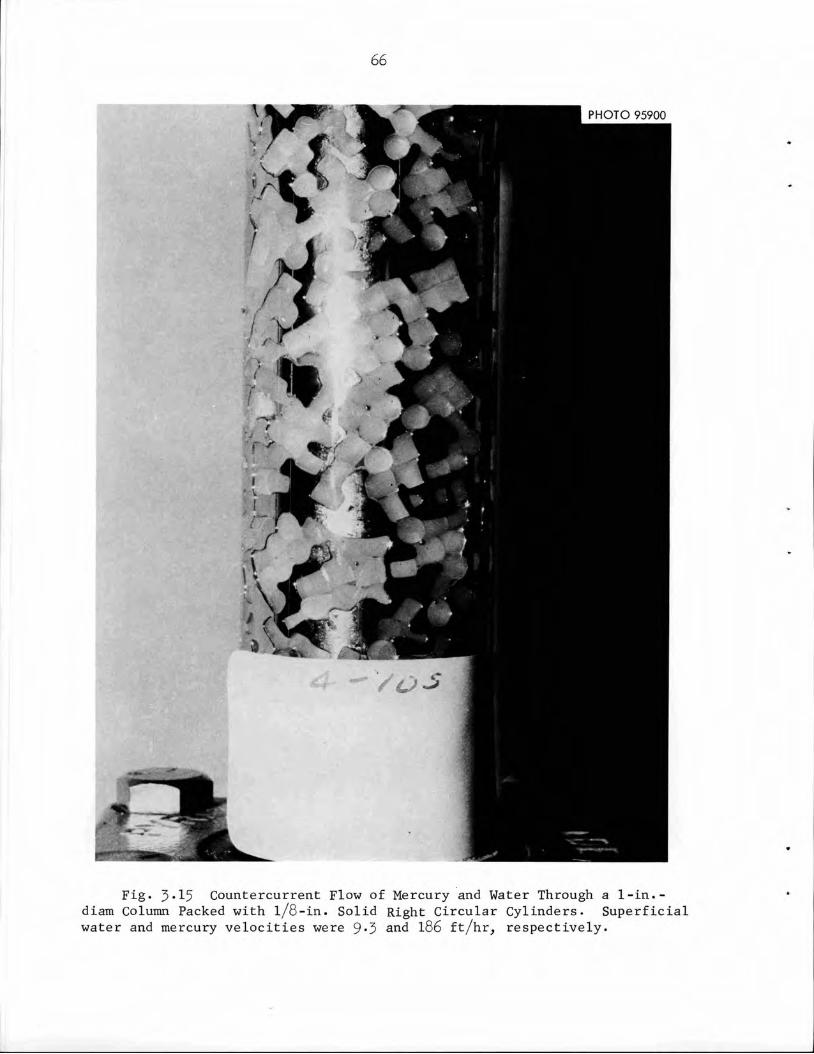
66
PHOTO 95900
Fig. 3.15 Countercurrent Flow of Mercury and Water Through a 1-in.-diam Column Packed with l/8-in. Solid Right Circular Cylinders. Superficialwater and mercury velocities were 9-3 and 186 ft/hr, respectively.
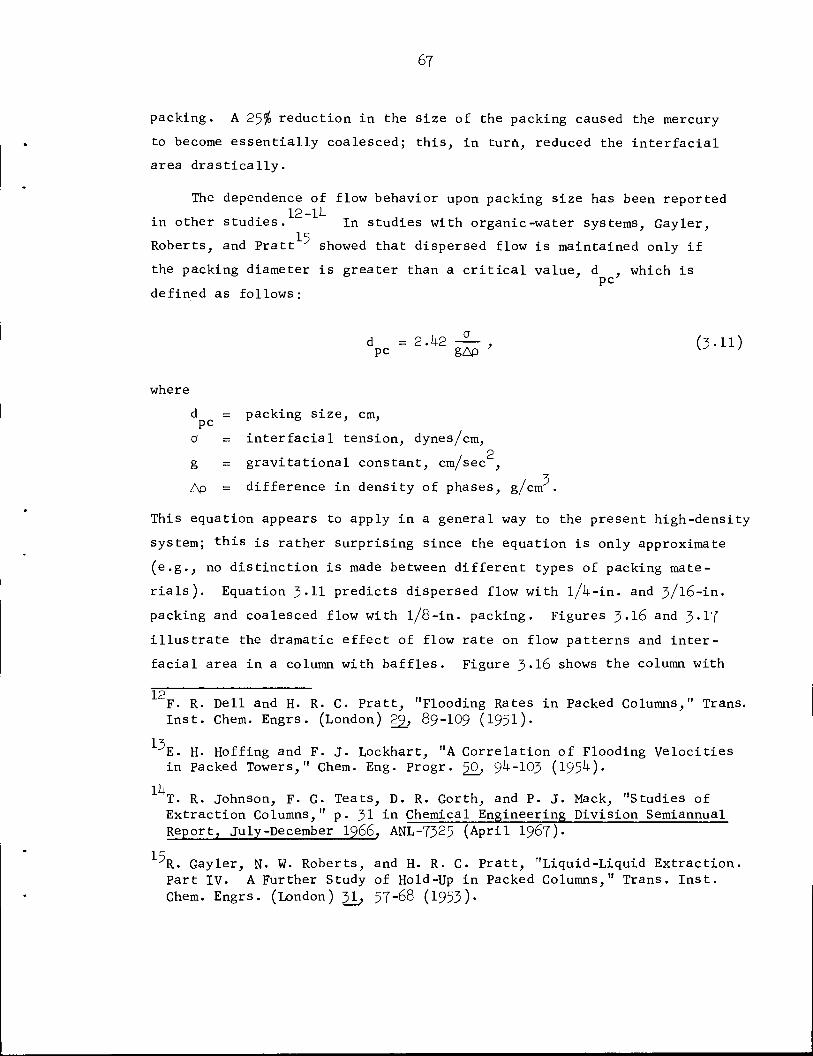
67
packing. A 25$ reduction in the size of the packing caused the mercury
to become essentially coalesced; this, in turn, reduced the interfacial
area drastically.
The dependence of flow behavior upon packing size has been reported12-11+
in other studies. In studies with organic-water systems, Gayler,
Roberts, and Pratt showed that dispersed flow is maintained only if
the packing diameter is greater than a critical value, d , which ispc
defined as follows:
d = 2.1+2 -2- , (3.11)pc gAp w '
where
d = packing size, cm,pc ' '
o = interfacial tension, dynes/cm,o
g = gravitational constant, cm/sec ,•z
Ap = difference in density of phases, g/cm .
This equation appears to apply in a general way to the present high-density
system; this is rather surprising since the equation is only approximate
(e.g., no distinction is made between different types of packing mate
rials). Equation 3-H predicts dispersed flow with l/U-in. and 3/16-in.
packing and coalesced flow with l/8-in. packing. Figures 3.I6 and 3.17
illustrate the dramatic effect of flow rate on flow patterns and inter
facial area in a column with baffles. Figure 3.I6 shows the column with
12F. R. Dell and H. R. C Pratt, "Flooding Rates in Packed Columns," Trans.Inst. Chem. Engrs. (London) 2%, 89-IO9 (I95I).
13E. H. Hoffing and F. J. Lockhart, "A Correlation of Flooding Velocitiesin Packed Towers," Chem. Eng. Progr. 5_0, 9I+-IO3 (195!+).
IkT. R. Johnson, F. G. Teats, D. R. Gorth, and P. J. Mack, "Studies ofExtraction Columns," p. 31 in Chemical Engineering Division SemiannualReport, July-December I966, ANL-7325 (April I967).
R. Gayler, N. W. Roberts, and H. R. C Pratt, "Liquid-Liquid Extraction.Part IV. A Further Study of Hold-Up in Packed Columns," Trans. Inst.Chem. Engrs. (London) 31, 57-68 (1953).
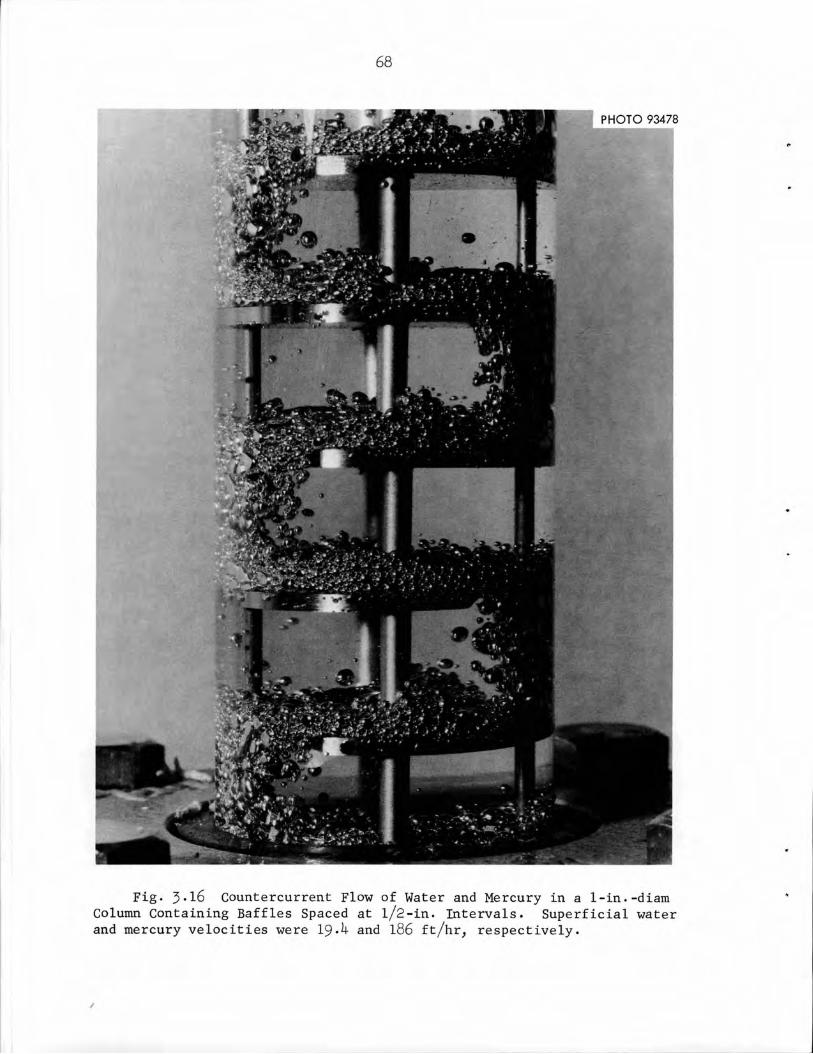
68
PHOTO 93478
Fig. 3-16 Countercurrent Flow of Water and Mercury in a 1-in.-diamColumn Containing Baffles Spaced at l/2-in. Intervals. Superficial waterand mercury velocities were 19>^- and 186 ft/hr, respectively.
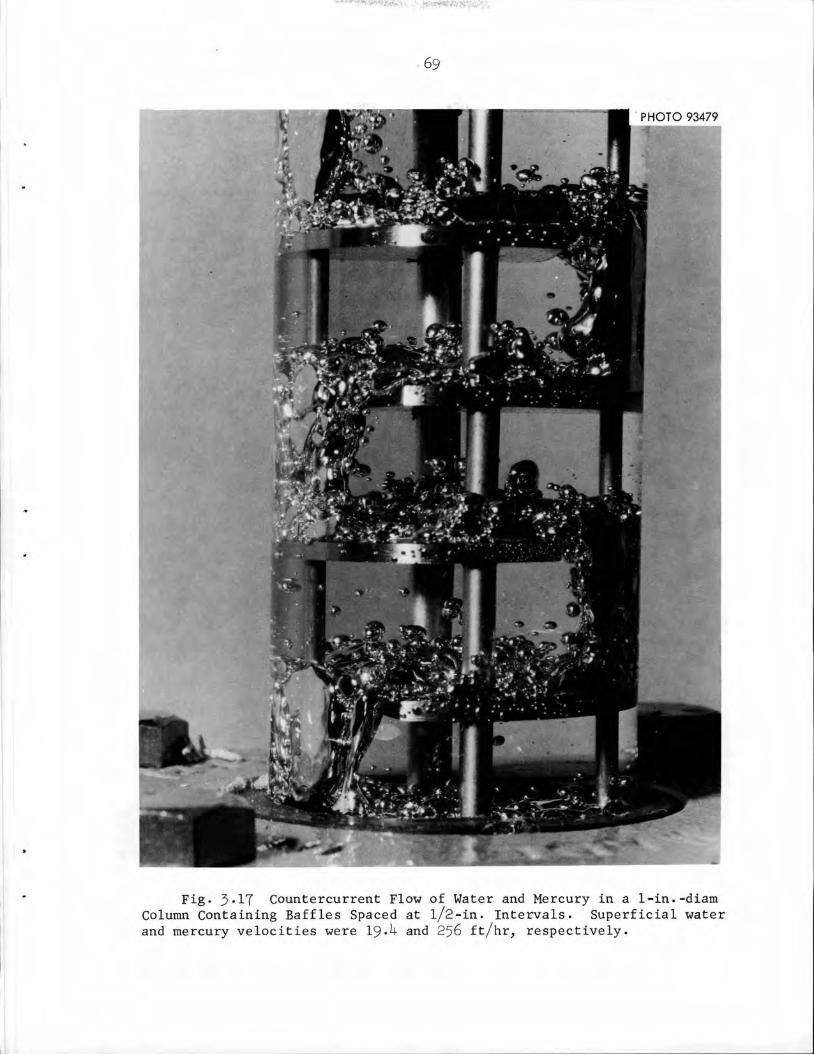
69
PHOTO 93479
Fig. 3-17 Countercurrent Flow of Water and Mercury in a 1-in.-diamColumn Containing Baffles Spaced at l/2-in. Intervals. Superficial waterand mercury velocities were 19«^- and 256 ft/hr, respectively.
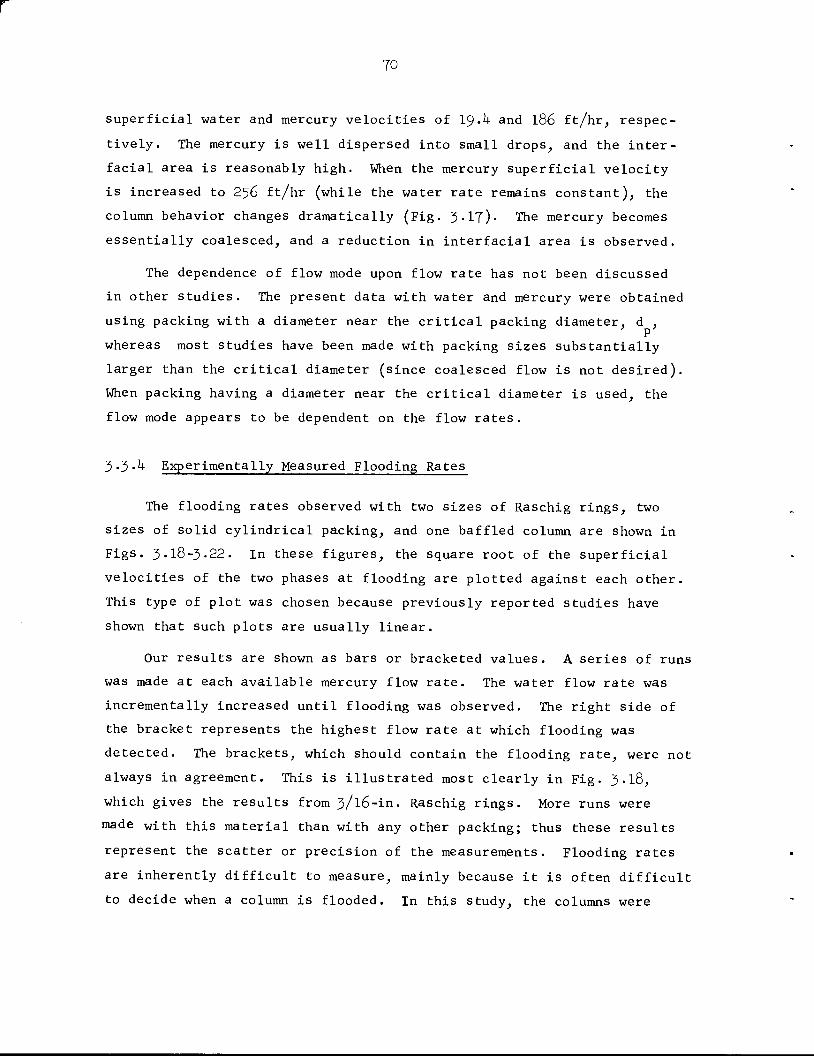
70
superficial water and mercury velocities of I9.I+ and 186 ft/hr, respec
tively. The mercury is well dispersed into small drops, and the inter
facial area is reasonably high. When the mercury superficial velocity
is increased to 256 ft/hr (while the water rate remains constant), the
column behavior changes dramatically (Fig. 3'17)- The mercury becomes
essentially coalesced, and a reduction in interfacial area is observed.
The dependence of flow mode upon flow rate has not been discussed
in other studies. The present data with water and mercury were obtained
using packing with a diameter near the critical packing diameter, d ,
whereas most studies have been made with packing sizes substantially
larger than the critical diameter (since coalesced flow is not desired).
When packing having a diameter near the critical diameter is used, the
flow mode appears to be dependent on the flow rates.
3-3-k Experimentally Measured Flooding Rates
The flooding rates observed with two sizes of Raschig rings, two
sizes of solid cylindrical packing, and one baffled column are shown in
Figs. 3.18-3-22. In these figures, the square root of the superficial
velocities of the two phases at flooding are plotted against each other.
This type of plot was chosen because previously reported studies have
shown that such plots are usually linear.
Our results are shown as bars or bracketed values. A series of runs
was made at each available mercury flow rate. The water flow rate was
incrementally increased until flooding was observed. The right side of
the bracket represents the highest flow rate at which flooding was
detected. The brackets, which should contain the flooding rate, were not
always in agreement. This is illustrated most clearly in Fig. 3-l8,
which gives the results from 3/16-in. Raschig rings. More runs were
made with this material than with any other packing; thus these results
represent the scatter or precision of the measurements. Flooding rates
are inherently difficult to measure, mainly because it is often difficult
to decide when a column is flooded. In this study, the columns were
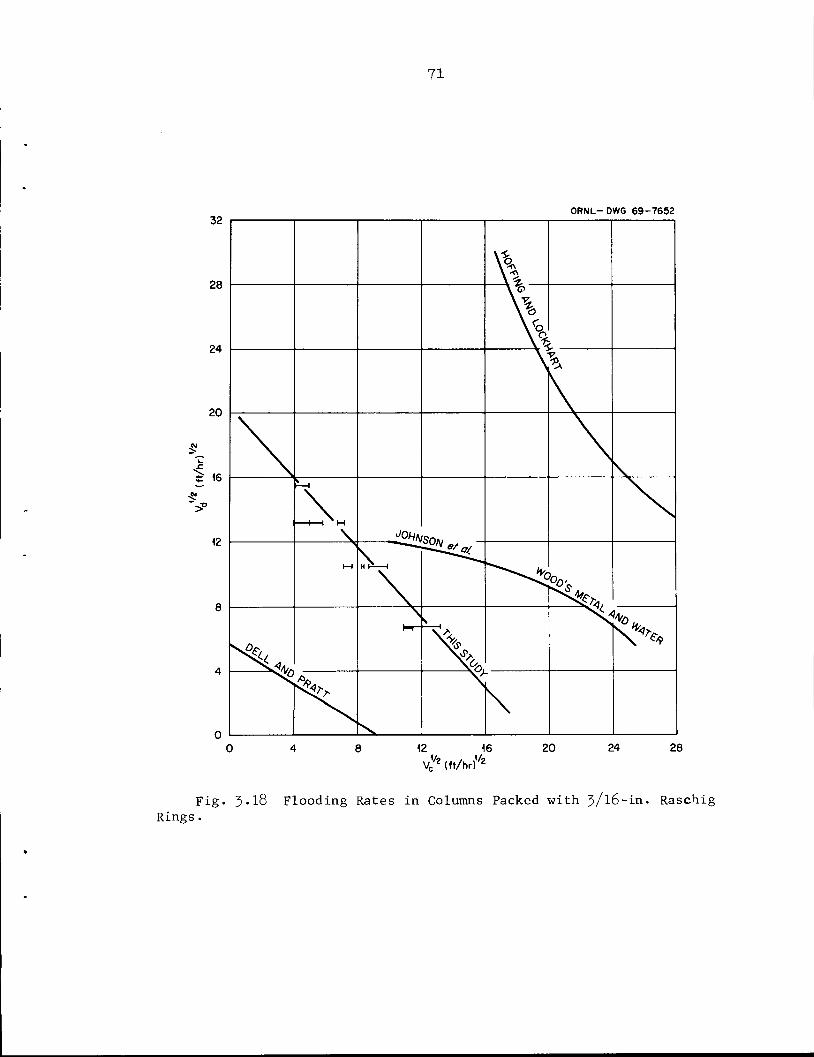
71
ORNL- DWG 69-7652
y/Z (ft/hr)Vz
Fig. 3»l8 Flooding Rates in Columns Packed with 3/l6-in. RaschigRings,
28
24
20
CVJ
* 16
CM
->12
8
0
72
ORNL-DWG 69-7653
8 12 16 20 24 28
VCV2 (ft/hr)1/2
Fig. 3-19 Flooding Rates in a Column Packed with l/l+-in. Raschig Rings.
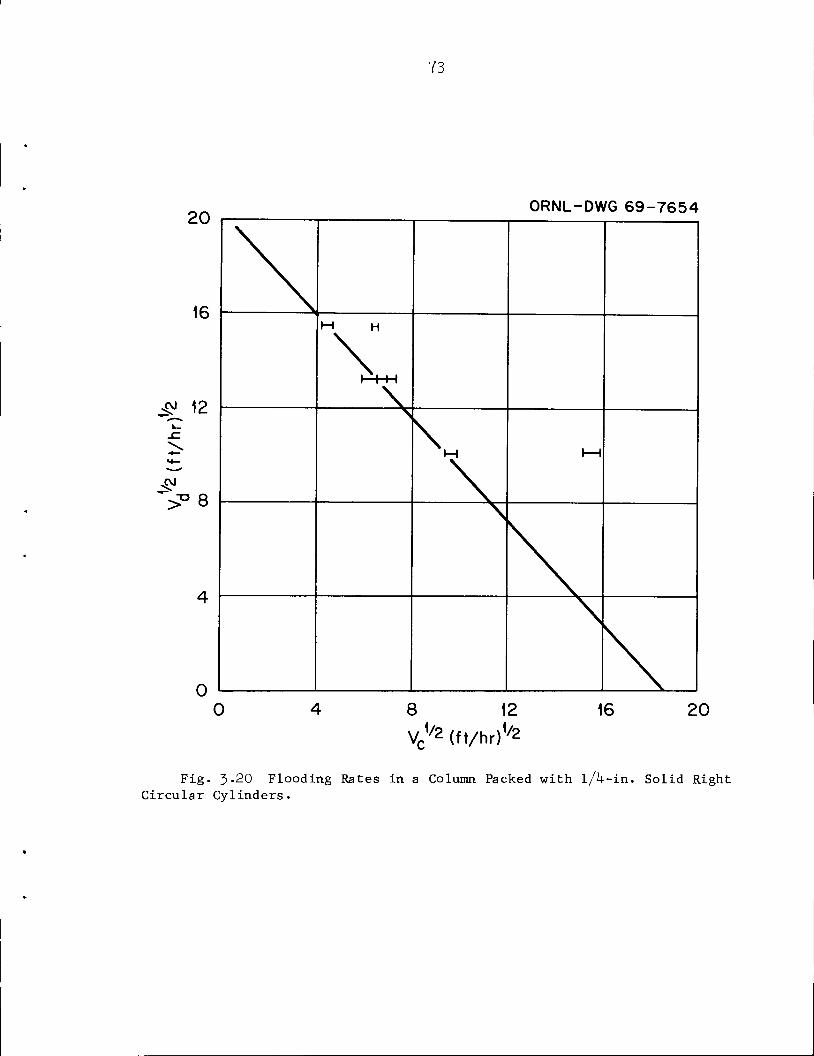
20
16
^ 12
>"° 8
73
ORNL-DWG 69-7654
M H
r 1 t"i
\>
\I—I
0 8 12
Vr1/2 (f t/hr)1/216 20
Fig. 3-20 Flooding Rates in a Column Packed with l/l+-in. Solid RightCircular Cylinders.
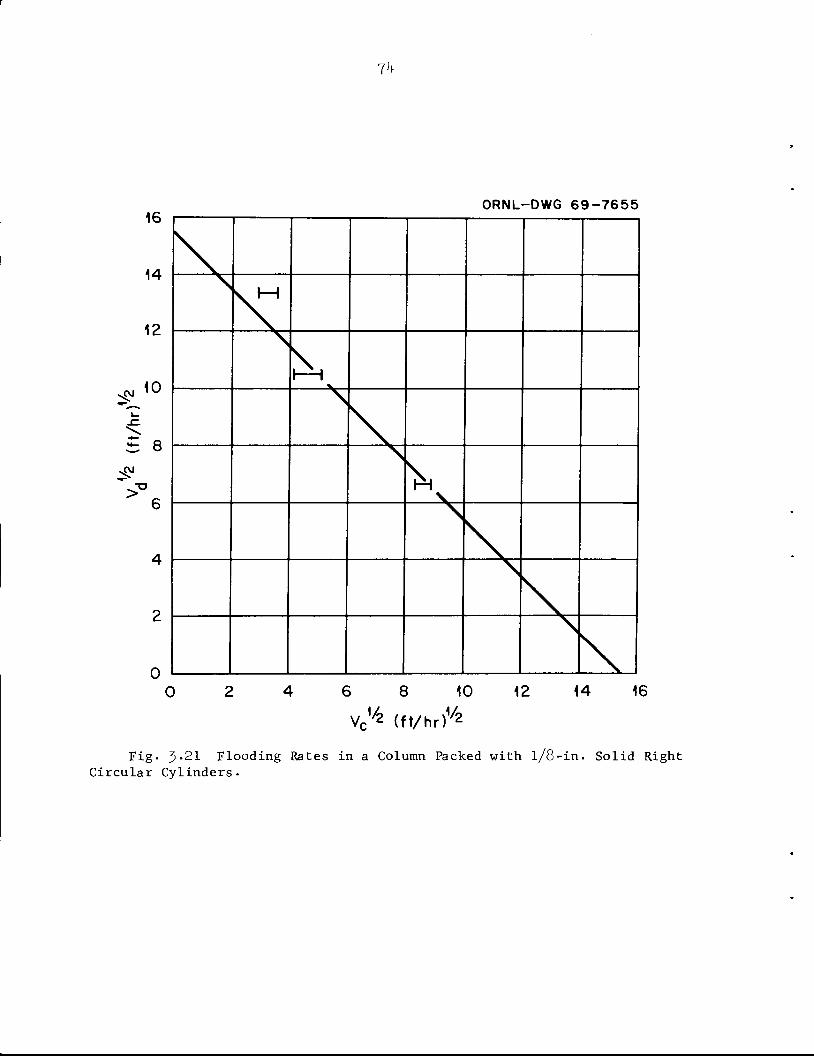
16
14
12
sPJ10
2= 8
0
0
71+
ORNL-DWG 69-7655
6 8 10
VCV2 (ft/hr)V212 14 16
Fig. 3-21 Flooding Rates in a Column Packed with l/8-in. Solid RightCircular Cylinders.
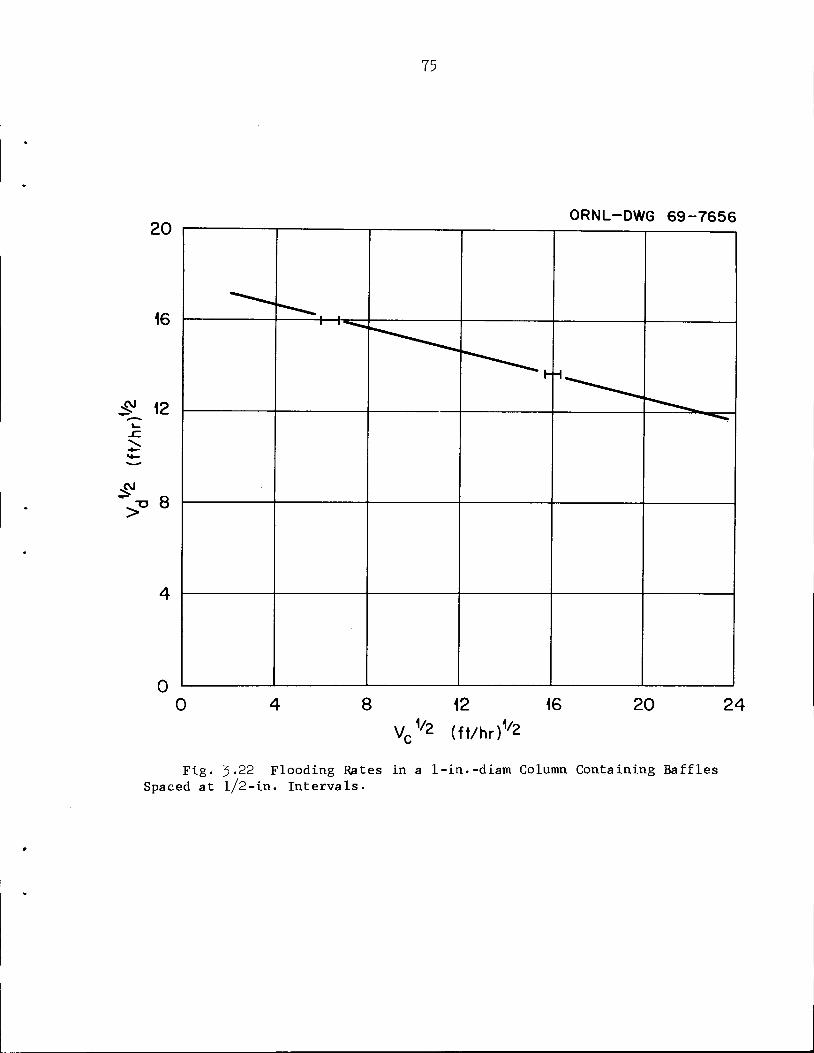
75
20
16 —
ORNL-DWG 69-7656
1 1_
h -i.^
JH 12
V>8
08 12 16
Vr1/2 (ft/hr)1/220 24
Fig. 3-22 Flooding Rates in a l-in.-diam Column Containing BafflesSpaced at l/2-in. Intervals.
76
considered to be flooded when a constant mercury holdup could not be
maintained in the column, that is, when the mercury holdup continued to
increase with time. Sometimes this was observed by following the pressure
drop (continuous or water phase) across the column; in some cases, the
accumulation of mercury within the column could be noted visually. It
was necessary to allow operation to proceed for several minutes to ensure
that the column was not slowly accumulating mercury. Often the column
would operate stably for a time and then suddenly flood, apparently
because of some undetected disturbance. If the column could be operated
for 10 to 15 min under steady conditions (flow rates and pressure drop),
it was not considered to be flooded.
The screens located above and below the ball valves, which were
necessary for holdup measurements, represented a potential problem; that
is, it was possible for the screens, rather than the packing, to cause
flooding. The openings in these screens were only slightly smaller than
the packing, and the wires represented a small portion of the column cross
section (relative to the solid packing fraction of the column). With the
l/l+-in. packing, two different screen sizes were used; no detectable
difference in the flooding rates or holdup was observed.
The results with 3/16-in. Raschig rings are compared with two
frequently used correlations (Dell and Pratt, and Hoffing and Lockhart)
in Fig. 3.18. The correlations are based on data from organic-water
systems for which the density differences and the interfacial tension
values are much lower than in salt-bismuth or water-mercury systems.
Although the two correlations are in reasonably good agreement when
applied to organic-water systems, use in the region of interest with
mercury and water is not possible since neither of the curves falls near
the data of this study and since the predicted results are not in
agreement with each other.
3-3-5 Dispersed-Phase Holdup
The fraction of the column void volume that is occupied by the
dispersed phase (referred to as holdup) is important for two reasons.
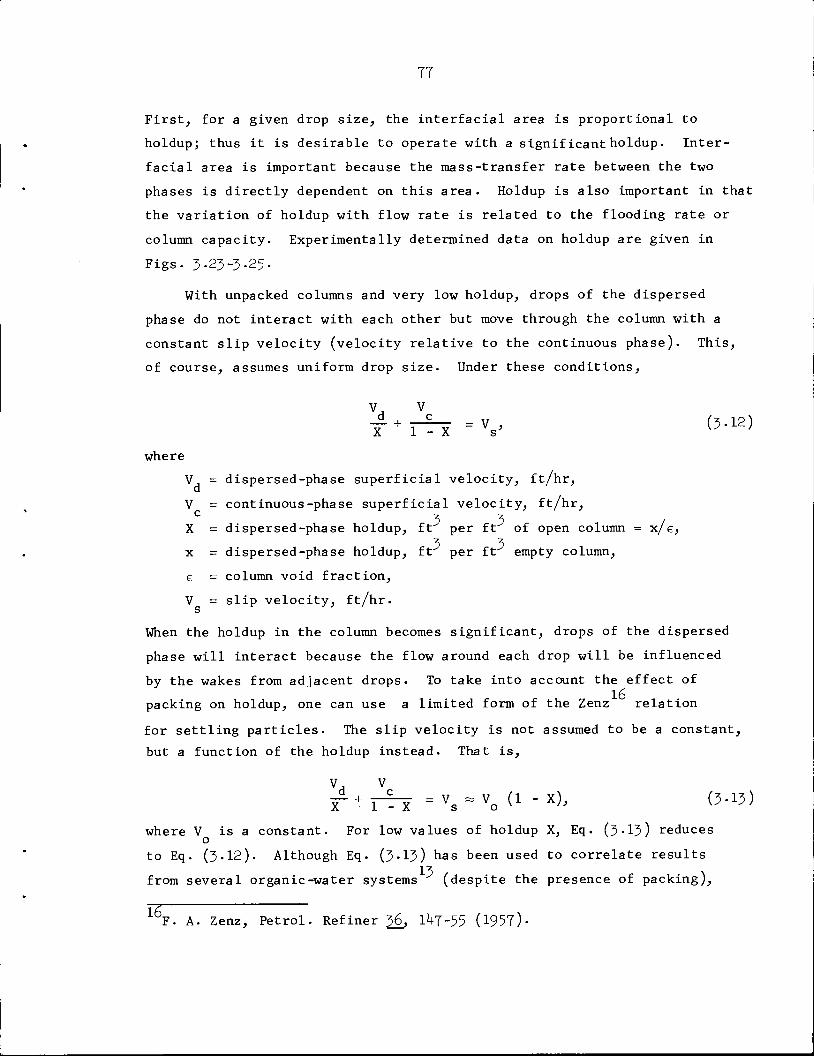
77
First, for a given drop size, the interfacial area is proportional to
holdup; thus it is desirable to operate with a significant holdup. Inter
facial area is important because the mass-transfer rate between the two
phases is directly dependent on this area. Holdup is also important in that
the variation of holdup with flow rate is related to the flooding rate or
column capacity. Experimentally determined data on holdup are given in
Figs. 3-23-3-25-
With unpacked columns and very low holdup, drops of the dispersed
phase do not interact with each other but move through the column with a
constant slip velocity (velocity relative to the continuous phase). This,
of course, assumes uniform drop size. Under these conditions,
V^ V— + T-9— = V , (3-12)X 1 - X V K '
where
V, = dispersed-phase superficial velocity, ft/hr,d
V - continuous-phase superficial velocity, ft/hr,c 3 3 /X = dispersed-phase holdup, ft per ft of open column = x/e,
3 3x = dispersed-phase holdup, ft per ft empty column,
e = column void fraction,
V = slip velocity, ft/hr.
When the holdup in the column becomes significant, drops of the dispersed
phase will interact because the flow around each drop will be influenced
by the wakes from adjacent drops. To take into account the effect of
packing on holdup, one can use a limited form of the Zenz relation
for settling particles. The slip velocity is not assumed to be a constant,
but a function of the holdup instead. That is,
rtri",".!1-'). (5.i3)where V is a constant. For low values of holdup X, Eq. (3-13) reduces
o
to Eq. (3.12). Although Eq. (3-13) has been used to correlate results
from several organic-water systems (despite the presence of packing),
1F. A. Zenz, Petrol. Refiner 36, 11+7-55 (1957)'
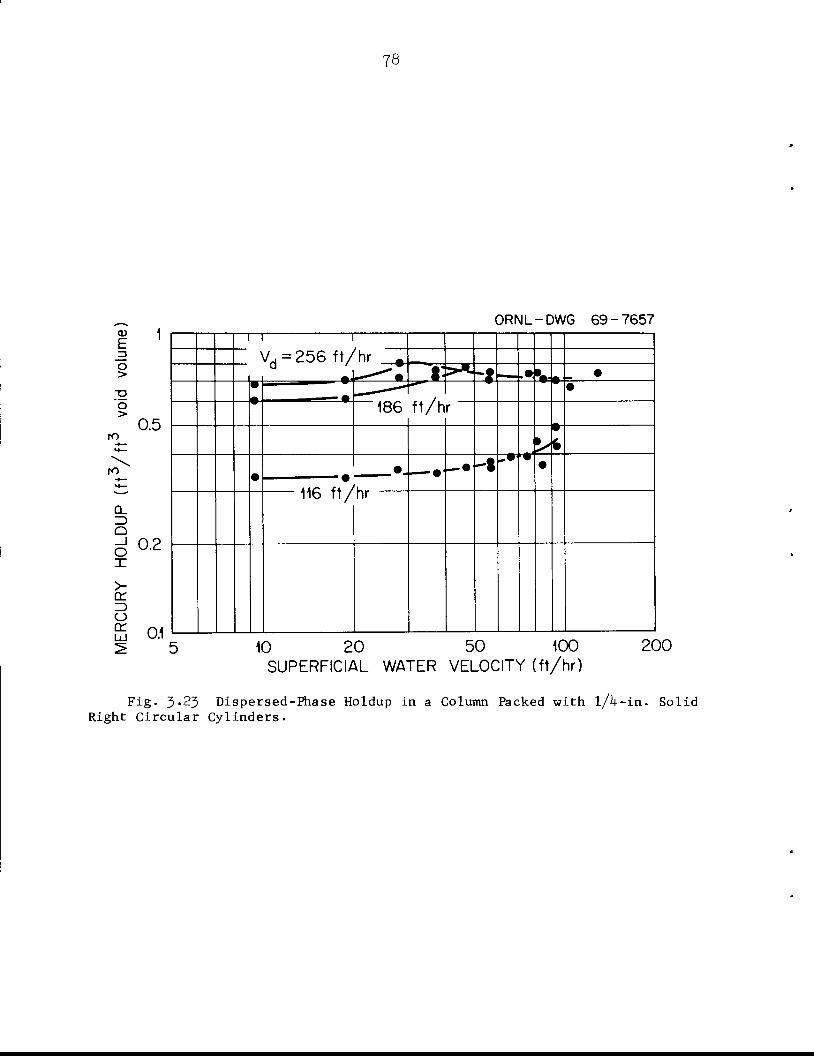
CD
E_5o>
•go
ro
ro
0_Z)
_l
OX
>-orZ3OrrLU
0.5
0.2
0.1
78
ORNL-DWG 69-7657
I I
VH=256 ft/ hr .a '
a.****** ^l>*-J .•, Vt •
i—__ &
ft/h•
186 r
^ >
•. —••—• -t
„»J'••
L116 ft/ hr
10 20 50 100
SUPERFICIAL WATER VELOCITY (ft/hr)200
Fig. 3-23 Dispersed-Phase Holdup in a Column Packed with l/l+-in. SolidRight Circular Cylinders.
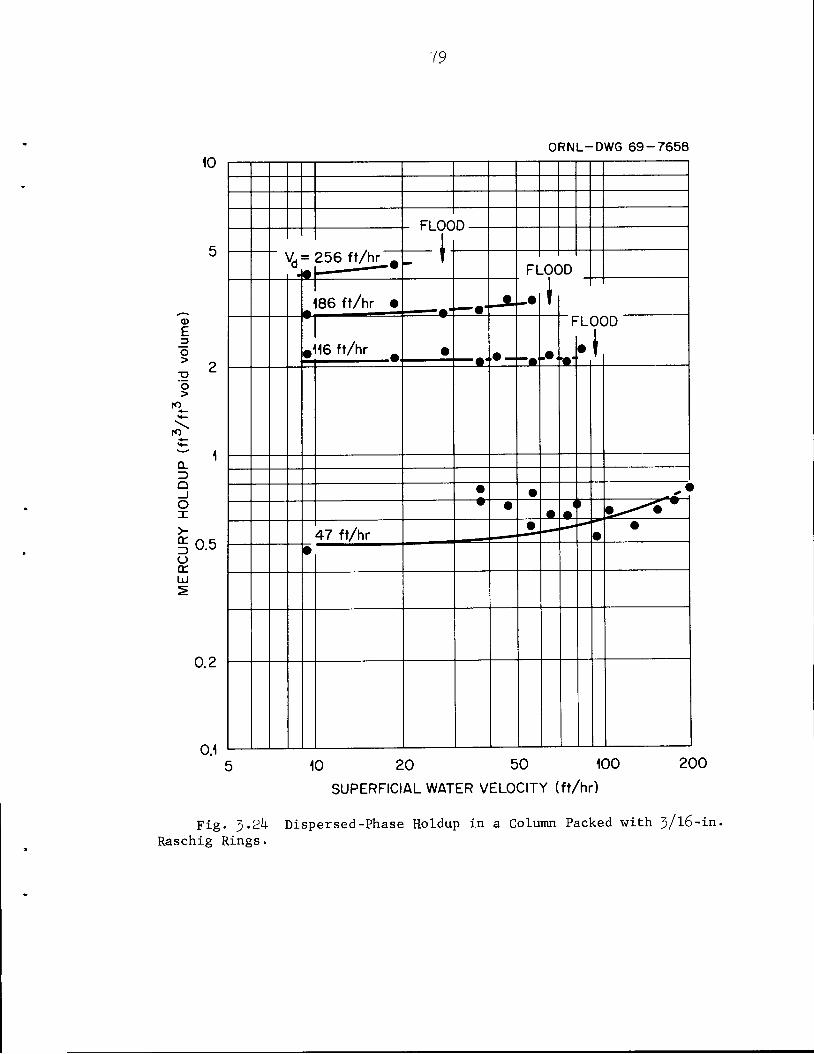
E
O>
o>
to
IO
Q.
Q_JOX
or
Oo:UJ
10
0.5
0.2
0.1
79
ORNL-DWG 69-7658
FLOO
1n
vd= 256 ft/hr # _ fFLOOD
186 ft/hr •*""""•"—•"
_• 1
16 ft/hr m •.• — •"•'
-••
LO
.1OD
• • ^«• •
• m>
9*****
47 ft/hr_•_
4•
•
10 20 50 100 200
SUPERFICIAL WATER VELOCITY (ft/hr)
Fig. 3.21+ Dispersed-Phase Holdup in a Column Packed with 3/16-in.Raschig Rings.
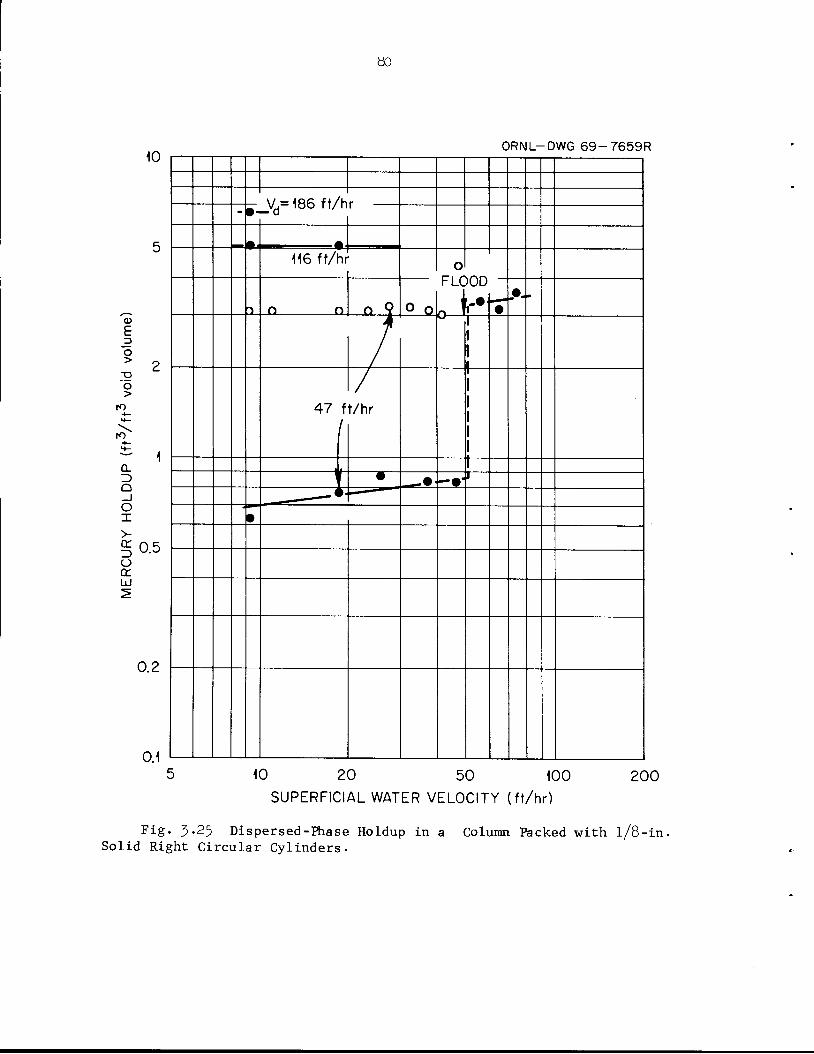
E
o>
o>
to
to
o_Z)Q_l
OX
>-orz>oorLU
10
0.5
0.2
0.1
80
ORNL-DWG 69-7659R
_Vd= 186 ft/h- •-
—
116 ft/hro
T o o o 9 o o
FLOuu
H T.•.
/47 f
1
/t/hr
J • • -••1
•
^^_____«>-
10 20 50 100
SUPERFICIAL WATER VELOCITY (ft/hr)
200
Fig. 3-25 Dispersed-Phase Holdup in a Column Packed with l/8-in.Solid Right Circular Cylinders.
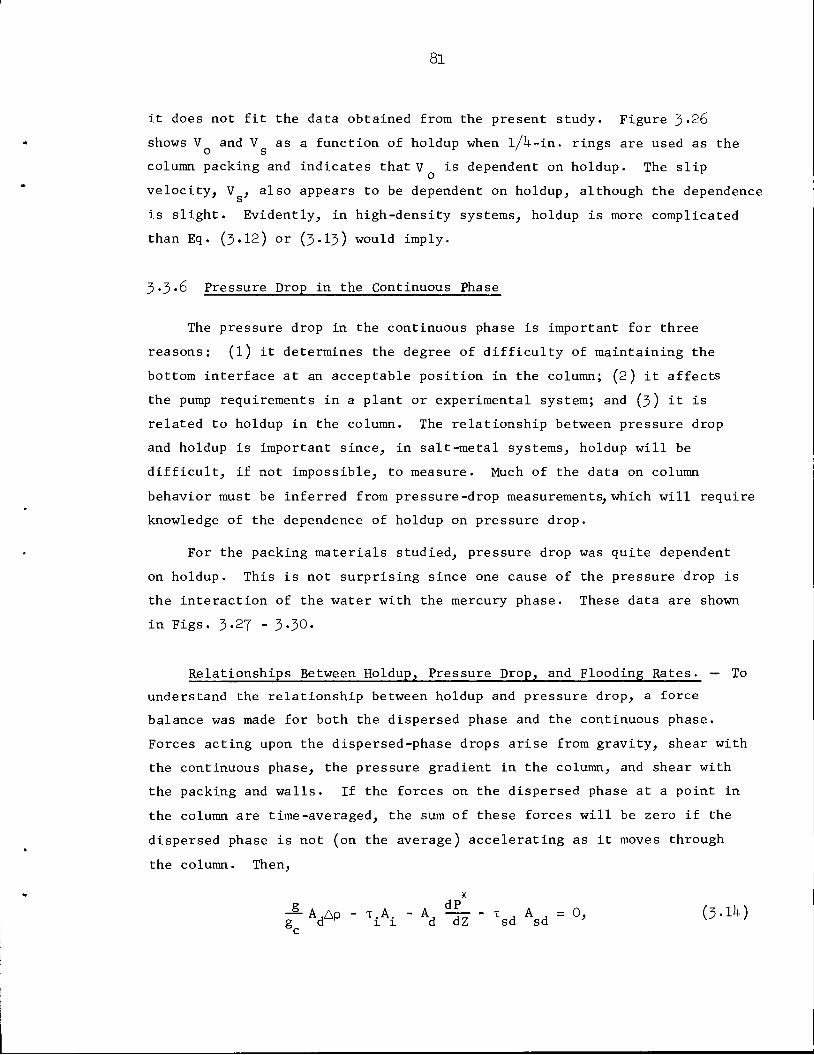
81
it does not fit the data obtained from the present study. Figure 3-26
shows V and V as a function of holdup when l/l+-in. rings are used as theOS r / o
column packing and indicates that V is dependent on holdup. The slip
velocity, V , also appears to be dependent on holdup, although the dependence
is slight. Evidently, in high-density systems, holdup is more complicated
than Eq. (3.12) or (3.I3) would imply.
3.3-6 Pressure Drop in the Continuous Phase
The pressure drop in the continuous phase is important for three
reasons: (l) it determines the degree of difficulty of maintaining the
bottom interface at an acceptable position in the column; (2) it affects
the pump requirements in a plant or experimental system; and (3) it is
related to holdup in the column. The relationship between pressure drop
and holdup is important since, in salt-metal systems, holdup will be
difficult, if not impossible, to measure. Much of the data on column
behavior must be inferred from pressure-drop measurements, which will require
knowledge of the dependence of holdup on pressure drop.
For the packing materials studied, pressure drop was quite dependent
on holdup. This is not surprising since one cause of the pressure drop is
the interaction of the water with the mercury phase. These data are shown
in Figs. 3.27 - 3.30.
Relationships Between Holdup, Pressure Drop, and Flooding Rates. — To
understand the relationship between holdup and pressure drop, a force
balance was made for both the dispersed phase and the continuous phase.
Forces acting upon the dispersed-phase drops arise from gravity, shear with
the continuous phase, the pressure gradient in the column, and shear with
the packing and walls. If the forces on the dispersed phase at a point in
the column are time-averaged, the sum of these forces will be zero if the
dispersed phase is not (on the average) accelerating as it moves through
the column. Then,
•*
-S-A-Ap -t.A. -A, ^J- -t ,A =0, (3-H+)g d 1 1 d dZ sd sd
c
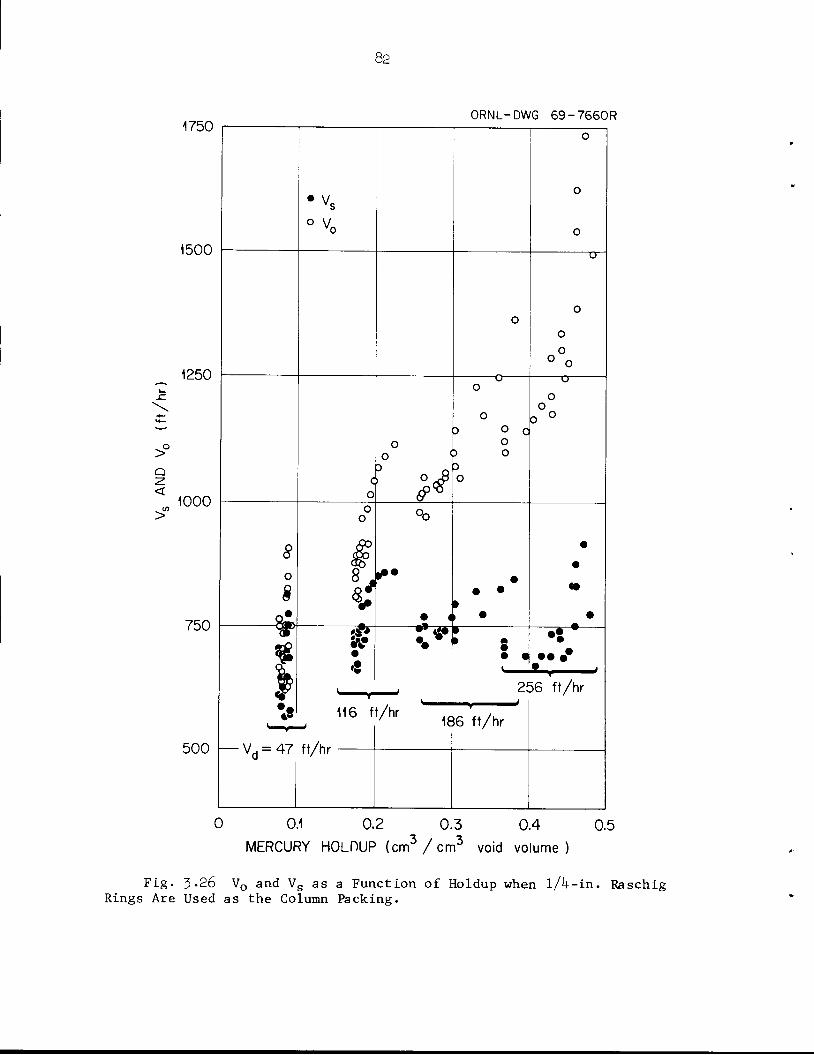
>°Q
<
1750
1500
1250
1000
750
8
o
*
• Vvs
° V„
82
oo
8 >•
116 ft/hr
500 — V, = 47 ft/hr
6?
ORNL-DWG 69-7660R
O
° ao
o
• 4
o
o
•••"
256 ft/hr
186 ft/hr
0 0.1 0.2 0.3 0.4 0.5
MERCURY HOLDUP (cm3/cm3 void volume)
Fig. 3-26 V0 and Vs as a Function of Holdup when l/l+-in. RaschigRings Are Used as the Column Packing.
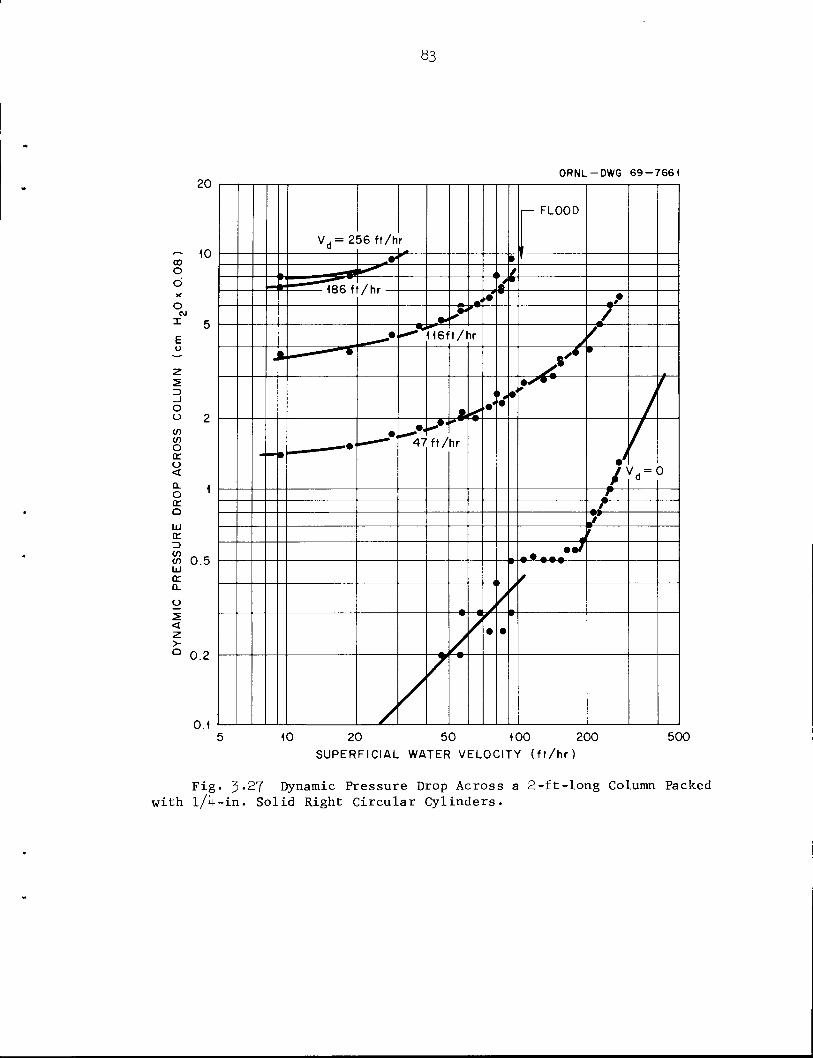
20
~ 10ooO
b
o
I
OO
00oo
Oq:o<
Q.
OorQ
"> ~ .-co 0.5UJ
o:o_
o
<
° 0.2
0.1
83
ORNL-DWG 69-7661
Vd= 256 ft/h r
r— FLOOD
1'* I '
i 4r
*m Iftfi ff /u- ? i
•' •• ,*•*>"' /
^i» -"- 116f't/hr/ /
y•
£ <• /
'
— • -
•
^47 ft/hr
3
r
JJ
, f
-.-V
• •
10 20 50 100 200
SUPERFICIAL WATER VELOCITY (ft/hr)
500
Fig. 3-27 Dynamic Pressure Drop Across a 2-ft-long Column Packedwith l/l+-in. Solid Right Circular Cylinders.
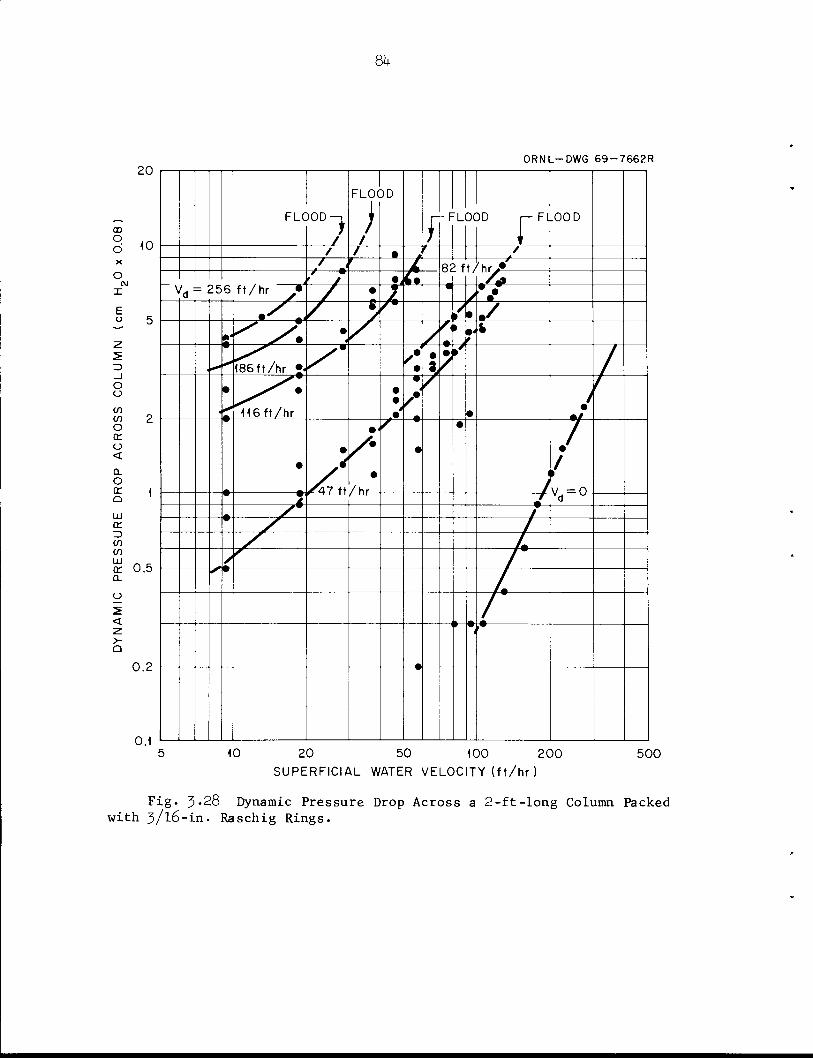
20
oo
§ <0
oCM
X
E" 5
oo
CO
co 2Oor
o
<
o.
o
£ 1
UJ
or
z>CO
coUJ
or 0.50.
c_>
0.2
0.1
84
ORNL-DWG 69-7662R
FLC)0D-i
/
FL0(
)/
3D
•
n_00D r— FLOOD
/ f \ /
/ . ' I 82 ft /hrV*. / • , £ mf*Vd = 256 ft/hr ^ / • 1 s*
•/.i/ 7/*
i»<yr<X? / /.'
-•"186 ft/hr ••/' /\ • 5*3/
/
/•^116 ft/hr
•
V
• /•
•
/
•
/^7ft
• <
•
/hr -
/
•
<»
/
//V —0
^ r vd u. /* /* / /
/ /,S /
> //
•'•
10 20 50 100 200
SUPERFICIAL WATER VELOCITY (ft/hr)
500
Fig. 3«28 Dynamic Pressure Drop Across a 2-ft-long Column Packedwith 3/l6-in. Raschig Rings.
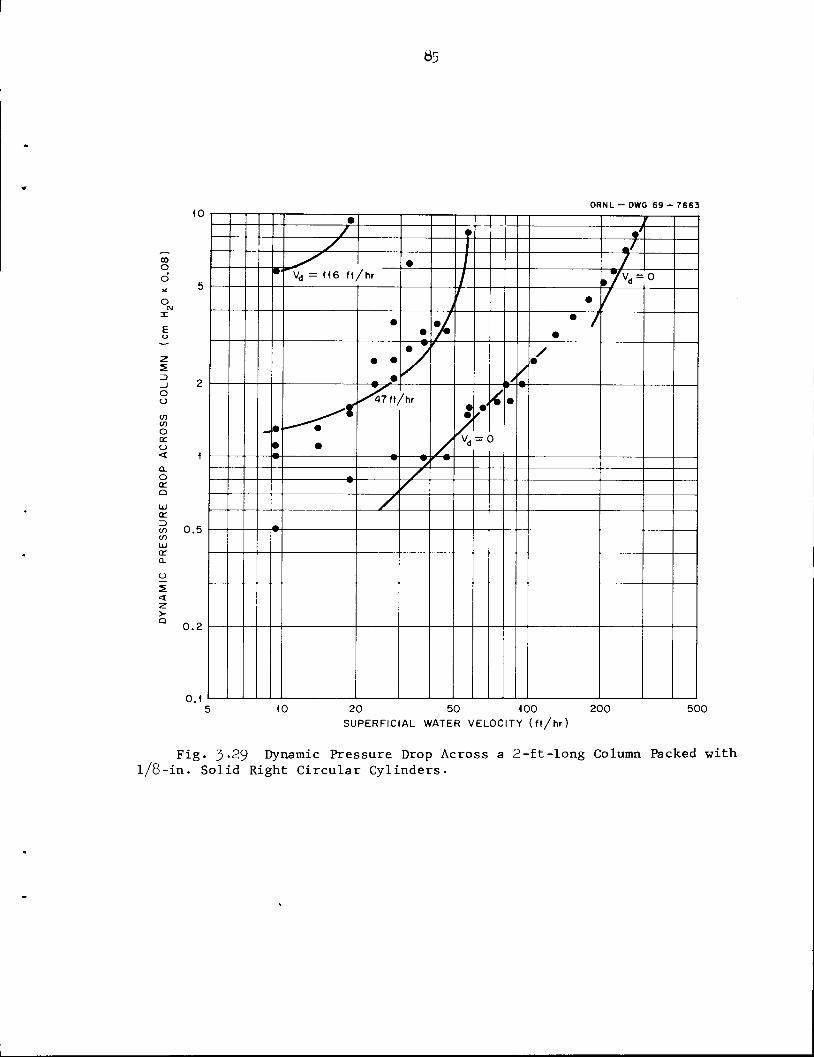
COO
Ocvj
X
E
5
_l
oO
COco
o<r
o
<
a.
ocra
tr
Z>COCO
UJ
a.a.
5<
10
0.5
0.2
0.1
S5
ORNL — DWG 69-7663
• I // • /
s J^^ • 71V' Vd = 116 ft/hr fa 0
• '•
••/
•
• •
• y
/ /
/•
•
^t
•
^47 ft//hr••
= (
< •
10 20 50 100 200
SUPERFICIAL WATER VELOCITY (ft/hr)500
Fig. 3-29 Dynamic Pressure Drop Across a 2-ft-long Column Packed withl/8-in. Solid Right Circular Cylinders.
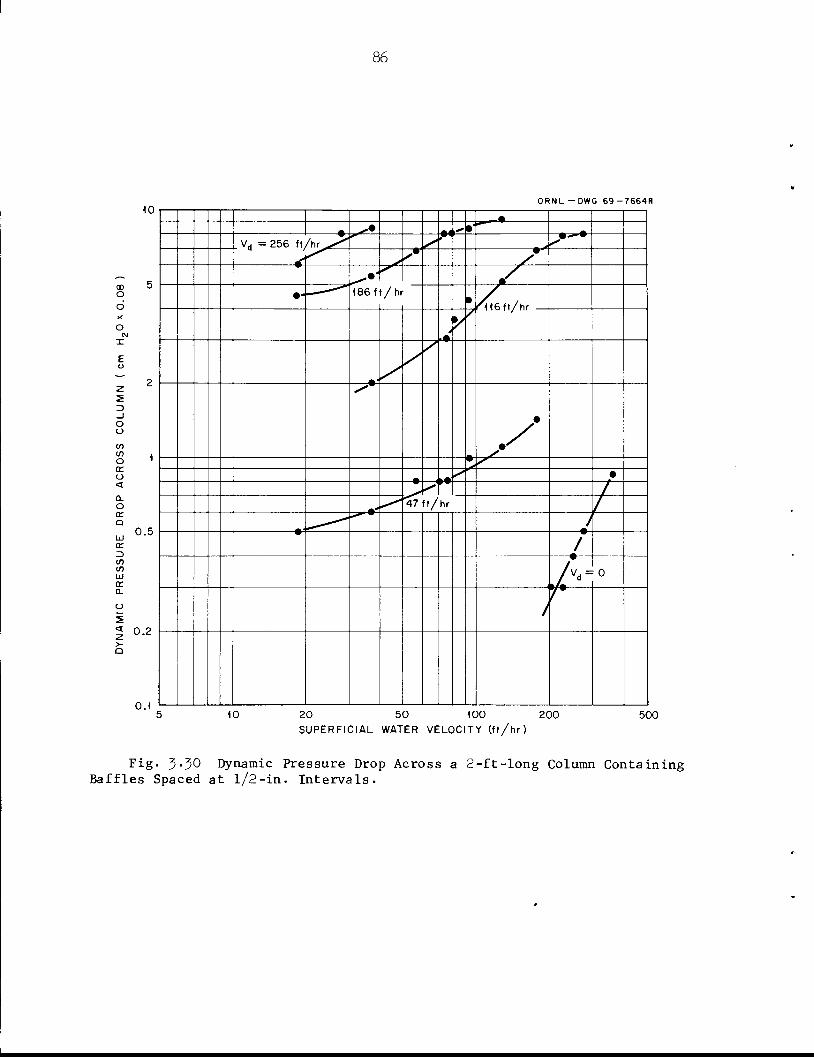
COO
OCJ
X
E
2ID_1
OO
COCO
occo
<
0.
otcQ
LU
cr
3COCOUJ
01a.
<z
Q
10
0.5
0.2
0.1
86
ORNL-DWG 69-7664R
, *^.« ,^ •
Vd = 256 ft/hr ^ ^» ^"'
~^^•* /
• " 186ft/ht• r\ 16ft/hr
,0
^'
+*
/•
/47 ft/hr /
/
/
A--o
r
10 20 50 100 200
SUPERFICIAL WATER VELOCITY (ft/hr)500
Fig- 3-30 Dynamic Pressure Drop Across a 2-ft-long Column ContainingBaffles Spaced at l/2-in. Intervals.
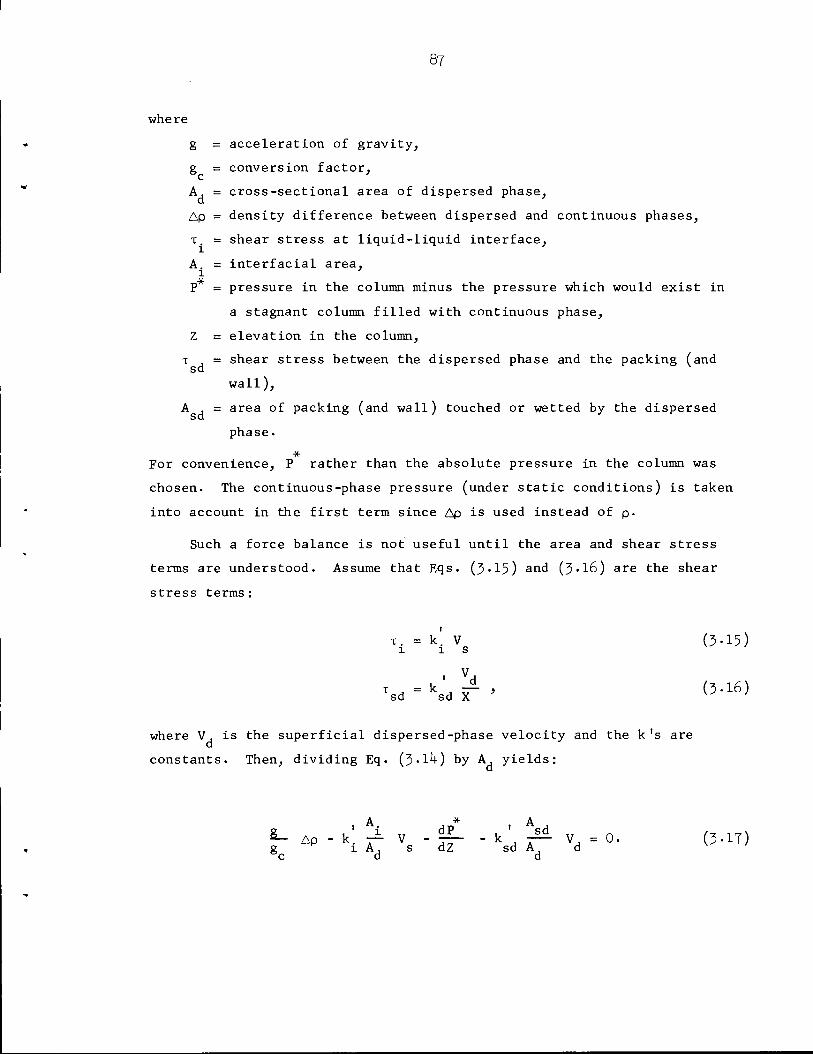
87
where
g = acceleration of gravity,
g = conversion factor,c
A, = cross-sectional area of dispersed phase,
Ap = density difference between dispersed and continuous phases,
t. = shear stress at liquid-liquid interface,
A. = interfacial area,1
P = pressure in the column minus the pressure which would exist in
a stagnant column filled with continuous phase,
Z = elevation in the column,
t , = shear stress between the dispersed phase and the packing (andsd
wall),
A , = area of packing (and wall) touched or wetted by the dispersed
phase.
*
For convenience, P rather than the absolute pressure in the column was
chosen. The continuous-phase pressure (under static conditions) is taken
into account in the first term since Ap is used instead of p.
Such a force balance is not useful until the area and shear stress
terms are understood. Assume that Eqs. (3 •15) and (3.I6) are the shear
stress terms:
t. . k! vs (3.15)
%< - C r > <5-l6>
where V, is the superficial dispersed-phase velocity and the k's ared
constants. Then, dividing Eq. (j>.lk) by A, yields:
8- Ap - k'. ^ v - ±f -k*ts± v =0. (3-17)g H 1 A, s dZ sd A, dcd d
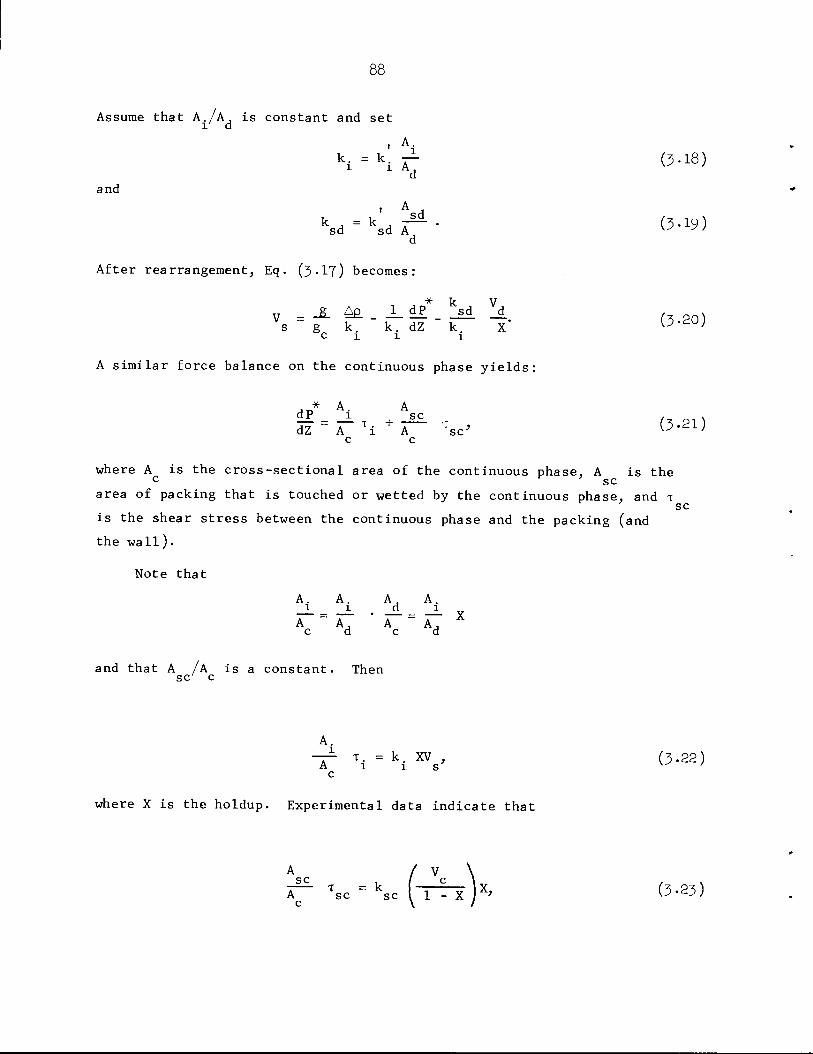
Assume that A./A, is constant and set1 d
and
k
i
= kL
1 L Ad
A ,k k ,
sd
sd sd Ad
(3-18)
(3-19)
After rearrangement, Eq. (3.I7) becomes:
, * k J V,v = JL A£. J_dP _ _sd _ds g k. k. dZ k X V^v)
c 1 l i
A similar force balance on the continuous phase yields:
* A A
§=jL--+r^- > (3.21)dZ A 1 A sc w 'c c
where A is the cross-sectional area of the continuous phase, A is thec sc
area of packing that is touched or wetted by the continuous phase, and tsc
is the shear stress between the continuous phase and the packing (and
the wall).
Note that
A. A. A, A._i_ = _i. . _d_ l yA A. A A,c d c d
and that A Ik is a constant. Thensc c
A.1.
— \=\*»B> (3-22)c
where X is the holdup. Experimental data indicate that
JT- V =ksc h-TT)X> (3-23)
89
where V is the continuous-Dhase suoerficial velocity. Thus,c ' J '
^- =k.V X +k (r-^Jx. 0.2k)dZ 1 s sc \1 - v ' \>> i
No attempt will be made to obtain a rigorous development for the second
term in Eq. (3-21+); however, a crude justification can be given. Pressure
drop associated with flow of fluids through packed beds can be correlated
17by the Ergun equation, which contains two terms: a viscous term, and
an inertial term. With relatively small channels (which would resemble
the region between the mercury drops and the wall) and at low velocity,
the viscous term dominates. In this case, the Ergun equation becomes:
Or d 1 c C /-, r~,r-\
dp-^ \ n-"—" ~ > ^.25)Re c c c
where X) is the velocity of the fluid through the channel. Note that v>c c
and V are related as follows:c
Vc
•o =c 1 - X '
and d is the effective diameter of the channel. If the mercury drops are
small, the average distance from the wall to a drop will vary inversely with
the concentration of drops. As an approximation, d will be assumed to be
inversely proportional to X- Using these two approximations, one obtains
the second term of Eq. (3-21+).
The justification for using Eq. (3.2I+) rests upon its ability to
correlate the experimental data. Figures 3«31 and 3*32 show pressure-drop
measurements made with no water flow. Only data for the large-size packing
(l/l+-in. rings and solid cylinders), where dispersed flow occurs, are
presented. Under these conditions, only the first term of Eq. (3-21+) is
nonzero. Within experimental error, straight lines are obtained. The
1^S. Ergun, Chem. Engr. Progr. 48, 89 (1952).
125
Q_ —o O 100q: cvjq x
mi EGET 3Z) _, 75CO gCO ^LU Z>cr _iQ_ O
o 50o ,„=r CO2 CO< o2 cr>- o ?5Q <
0
ORNL-DWG 69-7665
•
s^1,02^.^
^^*>%
^^9%
0 50 100 150 200 250 300
SUPERFICIAL MERCURY VELOCITY (ft/hr)
350
Fig. 3-31 Dynamic Pressure Drop Across a 2-ft-long Column Packed with l/l+-in. RaschigRings. No water flow.
150
X
Eo 125
O 100
coCOooro<
o_ooro
UJorZ>COCOUJoro_
o
>-Q
75
50
25
ORNL-DWG 69-7666
SLOPE = 0.45 >•
• S
^ •
50 100 150 200 250
SUPERFICIAL MERCURY VELOCITY (ft/hr)
300
Fig. 3-32 Dynamic Pressure Drop Across a 2-ft-long Column Packed with l/l+-in. Solid RightCircular Cylinders. No water flow.
92
slopes of the lines are equal to k.X and can be used for determining k..
Similarly, in Fig. 3-33, (AP - k.V X) is plotted versus V X/(l - X) for l/l+-
in. rings. This plot gives a straight line with a slope of k . Althoughsc
more scatter is evident in this plot, it shows no significant trend; that is,
there is no detectable dependence of the data on the mercury flow rate.
With l/l+-in. solid cylinders, the slope is essentially zero. Data obtained
by using small packing cannot be correlated in a similar manner. This is
not surprising since, with packing l/l+ in. or larger in size, the dispersed
phase exists as small droplets, whereas with smaller packing it coalesces
(Fig. 3-14).
The third constant, k ,, is difficult to evaluate. In principle
[from Eqs. (3-13) and (3.20)], one could plot
VgAp AP cIHT. " k. " 1 - X
vs V,/X, which would yield a straight line with a slope of (k ,/k.) + 1-
This approach is limited by the fact that the experimental data do not
cover a wide range of V,/x. Although this does not affect the accuracy
with which k can be evaluated, it does prevent a satisfactory evaluation
of the assumed linear relation for shear between the dispersed phase and
the packing. With l/l+-in. Raschig rings, the data appear to form
essentially a straight line (Fig. 3-3k), and the use of Eq• (3-20) appears
valid. Less data have been obtained with l/l+-in. solid packing, and the
results are somewhat more scattered (see Fig. 3-35).
Having evaluated the three constants, k., k , and k „, we can, in' 1 sc7 sd' '
principle, now calculate the holdup, pressure drop, and flooding curves
from Eqs. (3-20) and (3-21+). Since pressure drop and holdup were used
directly to evaluate the constants, the flooding curve affords an
independent check of Eqs. (3-20) and (3.2I+). There is, of course, an
obvious danger in this approach because the flow patterns often change
near the flooding point. To evaluate the flooding curve, Eqs. (3.21) and
(3-21+) were combined in order to eliminate the pressure drop. The
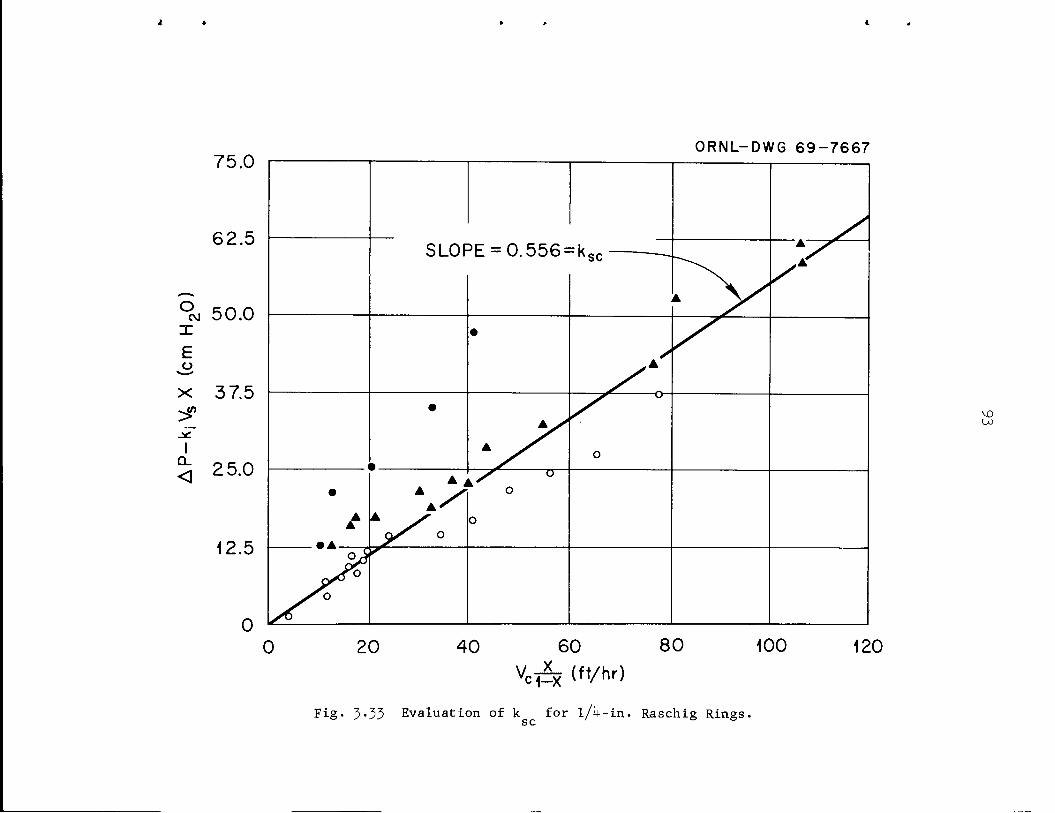
I *
75.0
62.5
So 50.0
£
x 37.5
Q_25.0
12.5
0
» *
ORNL-DWG 69-7667
SLOP*7 = n RR£ =-k
k y/^
A >^.A
Ksc
•
A
(
•
Ay/
A yr
^^ O
o
•
AA L A>'• yf^r o
^ oo
0 20 40 60 80X
100 120
Vc^ (ft/hr)
Fig. 3>33 Evaluation of k for l/U-in. Raschig Rings.
vo
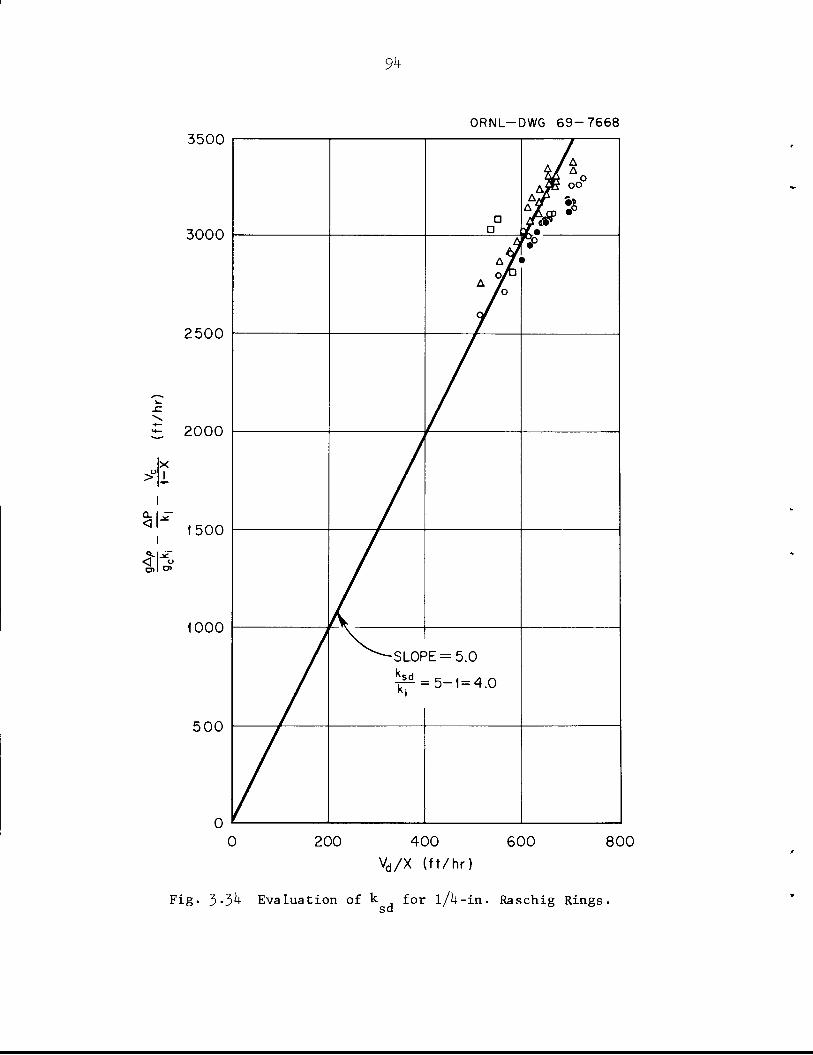
>°X
I
a J£
<
3500
3000
2500
2000
1500
1000
500
0
9k
ORNL-DWG 69-7668
a
D
A/ AA3E oo°
Afffl >x«
a/
a °r1°
—SLOF
ksdki "
>E=5.0
-5-1=4.0
200 400
Vd/X (ft/hr)
600 800
Fig. 3-3^ Evaluation of k for l/L-in. Raschig Rings.
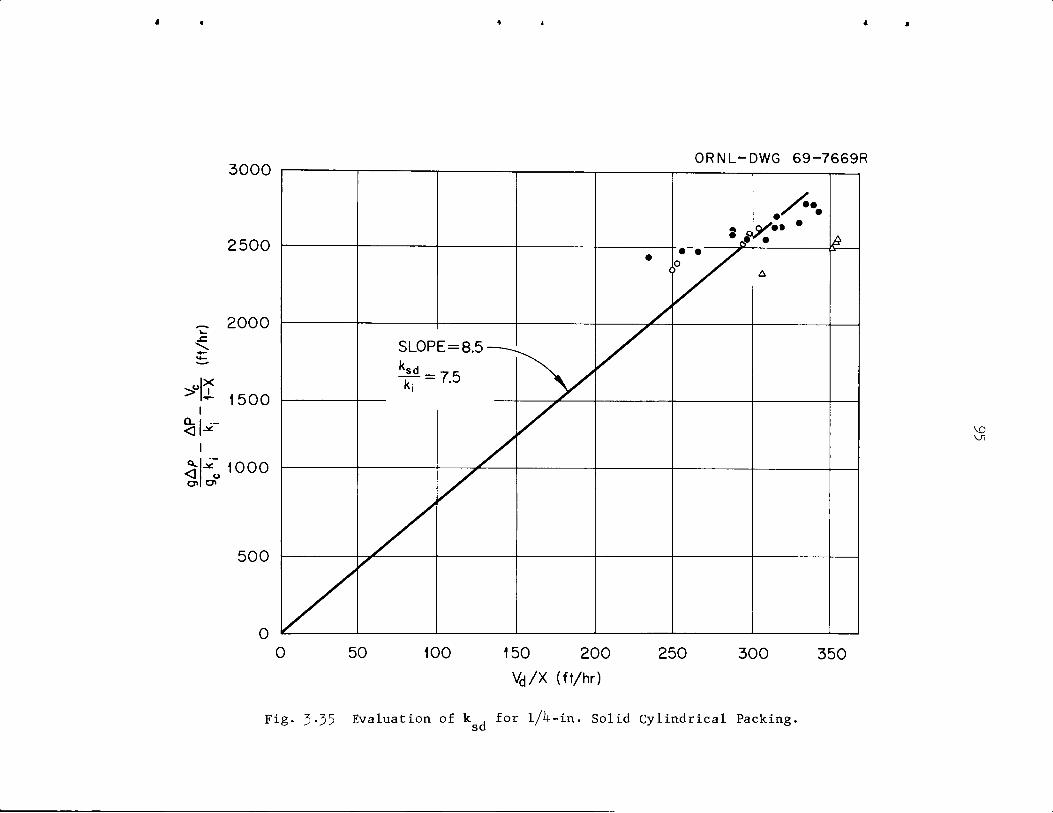
3000
2500
**—
2000
olX>IJ-
11500
0-| -
< u1000
500
0
♦ t- * *
ORNL-DWG 69-7669R
S«f* • *
£•
<P / A
SL0PE=8.5—-^
^ =75
0 50 100 150 200
Vd/X (ft/hr)
250 300 350
Fig. 3-35 Evaluation of k for l/l+-in. Solid Cylindrical Packing.
VJ1
96
quantities V and V then become functions of holdup. For a given value
of V,, a trial-and-error procedure was used to determine the maximum value
of V . This maximum value of V was considered to be the flooding rate:c c
that is, dV /dX = dV,/dX = 0 at flooding. For a given dispersed rate, V,,
we look for a holdup X that will yield the maximum V , or where
dV /dX = 0. The results of these calculations are given in Figs. 3-36
and 3-37; and the agreement with the experimental flooding curve is
encouraging.
In principle, it is possible to use only pressure drop data (no holdup
data) to evaluate the three constants. Although the calculations would be
more complicated than those just described, the approach should be useful
in evaluating or estimating holdup and flooding rates in salt-metal systems.
Data from smaller packing materials (3/l6-in. rings and l/8-in. solid
packing) are not correlated by the above model. To date, a model that
satisfactorily describes the data from both of these smaller packing materi
als has not been found. This study, like studies in the past, has concen
trated upon larger packing materials, which are of more interest for
operating systems.
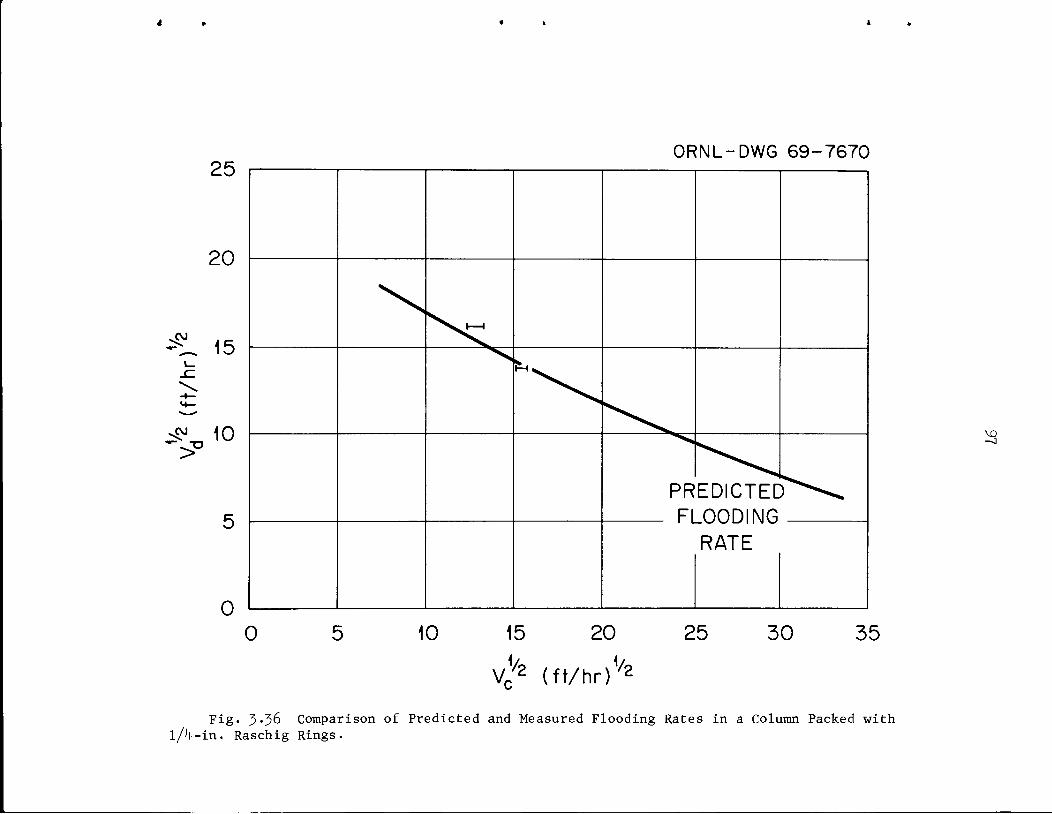
25
20
^0J
15
^,10
0
ORNL-DWG 69-7670
^—'
^^
PR
FL
EDICTEL"
_OODING
RATE
r**-^
0 10 15 20 25
VrV2 (ft/hr)1/230 35
Fig. 3-36 Comparison of Predicted and Measured Flooding Rates in a Column Packed withl/l+-in. Raschig Rings.
-J
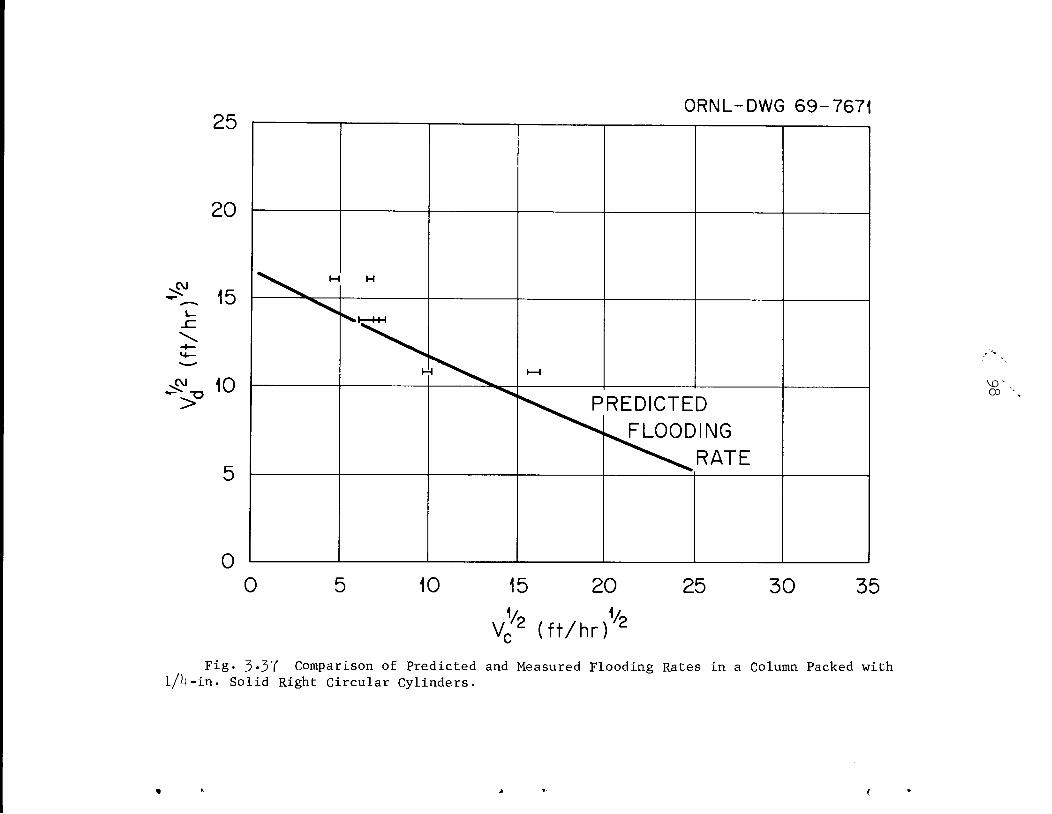
25
20
SL 15
& \0
0
ORNL-DWG 69-7671
^^ M H
^111 1
<̂SVS%^ 1—1
^. predicted
^^^^Lflooding^^^RATE
0 10 15 20
v/2 (ft/hr)V225 30 35
Fig. 3-37 Comparison of Predicted and Measured Flooding Rates in a Column Packed withl/l+-in. Solid Right Circular Cylinders.
OO
1.
2-1+.
5-6.
1-kl.1+2.
1+3.kk.k$.1+6.
1+8.
1+9.50.
51.
52.
53.
5U.55.56.
57.58.
59-60.
61.
62.
63.61+.
65.66.
67.68.
69.70.
71.
72.
\
99^y
ORNL-1+366UC-1+ — Chemistry
INTERNAL DISTRIBUTION
Biology LibraryCentral Research LibraryORNL - Y-12 Technical LibraryDocument Reference Section
Laboratory Records DepartmentLaboratory Records, ORNL R.C.
R. E. Blanco
J. 0. Blomeke
R. E. Brooksbank
K. B. Brown
F. R. Bruce
W. D. Burch
W. H. Carr
G. I. Cathers
J. M. Chandler
W. E. Clark
K. E. Cowser
D. J. Crouse
F. L. Culler, Jr.
W. Davis, Jr.
D. E. Ferguson
L. M. Ferris
J. R. Flanary
H. E. Goeller
J. M. Googin (Y-12)P. A. Haas
F. E. Harrington
R. F. Hibbs
R. W. Horton
G. Jasny (Y-12)F. Johnson
H. Jordan
H. Jury
J. KingB. B. Klima
E. Lamb
73. D. M. Lang
Ik. R. E. Leuze
75. R. B. Lindauer
76. H. G. MacPherson
77. G. M. Marrow (Y-12)78. J. L. Matherne
79. J. P. McBride
80. W. T. McDuffee
81. W. H. McVey82. J. P. Nichols
83. E. L. Nicholson
81+. F. L. Parker
85. J. R. Parrott
86. J. H. Pashley (K-25)87- F. S. Patton, Jr. (Y-12)88. R. H. Rainey
89. A. D. Ryon
90. W. D. Schaffer, Jr.
91. M. J. Skinner
92. Martha Stewart
93. J. C. Suddath
91+• D. A. Sundberg
95. W. E. Unger
96-117. Unit Operations Section
118. C. D. Watson
119. A. M. Weinberg120. M. E. Whatley
121. R. H. Winget
122. R. G. Wymer
123. E. L. Youngblood
12l+. P. H. Emmett (consultant)125. J. J. Katz (consultant)126. J. L. Margrave (consultant)127. E. A. Mason (consultant)128. R. B. Richards (consultant)
EXTERNAL DISTRIBUTION
129. E. L. Anderson, Atomic Energy Commission, Washington130. A. L. Babb, University of Washington131. F. P. Baranowski, Atomic Energy Commission, Washington132. W. G. Belter, Atomic Energy Commission, Washington133. S. Bernstein, Union Carbide Corporation, Paducah13l+. J. M. Berty, Research and Development Department, Union Carbide
Corporation, P. 0. Box 8361, South Charleston, West Virginia 253lH135. D. E. Bloomfield, Battelle Northwest, Richland, Washington
100
136. J. A. Buckham, Idaho Chemical Processing Plant137- J. T. Christy, Richland Operations Office138. C. R. Cooley, Pacific Northwest, Richland, Washington139- Kermit Laughon, ORNL, RDT Site Office
ll+0. E. R. Gilliland, Massachusetts Institute of Technologyll+l. W. W. Grigorieff, Assistant to the Executive Director, Oak Ridge
Associated Universities
ll+2. M. J. Harmon, Pacific Northwest, Richland, Washingtonll+3. L. P. Hatch, Brookhaven National Laboratoryll+l+. 0. F. Hill, Pacific Northwest, Richland, Washingtonll+5. C. H. Ice, Savannah River Laboratoryll+6. E. R. Irish, Pacific Northwest, Richland, Washingtonll+7. B. M. Legler, Idaho Chemical Processing Plantll+8. J. A. Lieberman, Atomic Energy Commission, Washingtonll+9. B. Manowitz, Brookhaven National Laboratory150. J. A. McBride, DML, Atomic Energy Commission, Washington151. J. W. Nehls, Atomic Energy Commission, Oak Ridge152. C. M. Nicholls, AERE, Harwell, England
153. E. 0. Nurmi, Babcock and Wilcox Company15I+. H. Pearlman, Atomics International155. A. M. Piatt, Pacific Northwest, Richland, Washington156. R. A. Proebstle, Knolls Atomic Power Laboratory157. J. W. Pollock, Idaho Operations Office158. K. L. Rohde, Idaho Chemical Processing Plant159. C. A. Rohrmann, Pacific Northwest, Richland, Washington
160. C. M. Slansky, Idaho Chemical Processing Plant161. M. Smutz, Ames Laboratory, Ames, Iowa162. C. E. Stevenson, Idaho Division, Argonne National Laboratory,
P. 0. Box 2528, Idaho Falls, Idaho163. K. G. Steyer, General Atomicl61+. J. A. Swartout, Union Carbide Corporation, New York165. C. D. Tabor, Goodyear Atomic166. V. R. Thayer, Du Pont, Wilmington167. R. C. Vogel, Argonne National Laboratory, 9700 South Cass Ave.,
Argonne, Illinois
168. G. H. Wagner, General Ele.ctric Company, Santa Clara, California169. D. C. Webster, Associate Director of Chemical Engineering
Division, Argonne National Laboratory, 9700 South Case Ave.,
Argonne, Illinois
170. Laboratory and University Division, AEC, 0R0171-360. Given distribution as shown in TID-1+500 under Chemistry category
(25 copies - CFSTI)