Embed Size (px)
Citation preview
Unit I: Basic
Economic Concepts

What is Economics in General?
Economics is the study of _________.
• Economics is the science of scarcity.
• Scarcity is the condition in which our wants
are greater than our limited resources.
• Since we are unable to have everything we
desire, we must make choices on how we will
use our resources.
• In economics we will study the choices of
individuals, firms, and governments.
choices

Economics Defined
Economics-Social science concerned with the
efficient use of limited resources to achieve
maximum satisfaction of economic wants.
(Study of how individuals and societies deal
with ________)
Examples:
You must choose between buying jeans or buying shoes.
Businesses must choose how many people to hire
Governments must choose how much to spend on welfare.
scarcity

Micro vs. Macro
MICROeconomics- Study of small economic units such as
individuals, firms, and industries (competitive
markets, labor markets, personal decision
making, etc.)
MACROeconomics- Study of the large economy as a whole or in
its basic subdivisions (National Economic
Growth, Government Spending, Inflation,
Unemployment, etc.)

Positive vs. Normative Positive Statements- Based on facts. Avoids value
judgements (what is).
Normative Statements- Includes value judgements
(what ought to be).
How is Economics used?
• Economists use the scientific method to make
generalizations and abstractions to develop
theories. This is called theoretical economics.
• These theories are then applied to fix problems
or meet economic goals. This is called policy
economics.

Would you see the movie three times?
Notice that the total benefit is more than the
total cost but you would NOT watch the movie
the 3rd time.
Thinking at the Margin
# Times
Watching Movie Benefit Cost
1st $30 $10
2nd $15 $10
3rd $5 $10
Total $50 $30

Marginal Analysis
In economics the term marginal = additional
“Thinking on the margin”, or MARGINAL ANALYSIS
involves making decisions based on the additional
benefit vs. the additional cost.
For Example:
You have been shopping at the mall for a half hour, the
additional benefit of shopping for an additional half-hour
might outweigh the additional cost (the opportunity cost).
After three hours, the additional benefit from staying an
additional half-hour would likely be less than the additional
cost.

5 Key Economic Assumptions 1. Society’s wants are unlimited, but ALL resources
are limited (scarcity).
2. Due to scarcity, choices must be made. Every choice
has a cost (a trade-off).
3. Everyone’s goal is to make choices that maximize
their satisfaction. Everyone acts in their own “self-
interest.”
4. Everyone acts rationally by comparing the marginal
costs and marginal benefits of every choice
5. Real-life situations can be explained and analyzed
through simplified models and graphs.
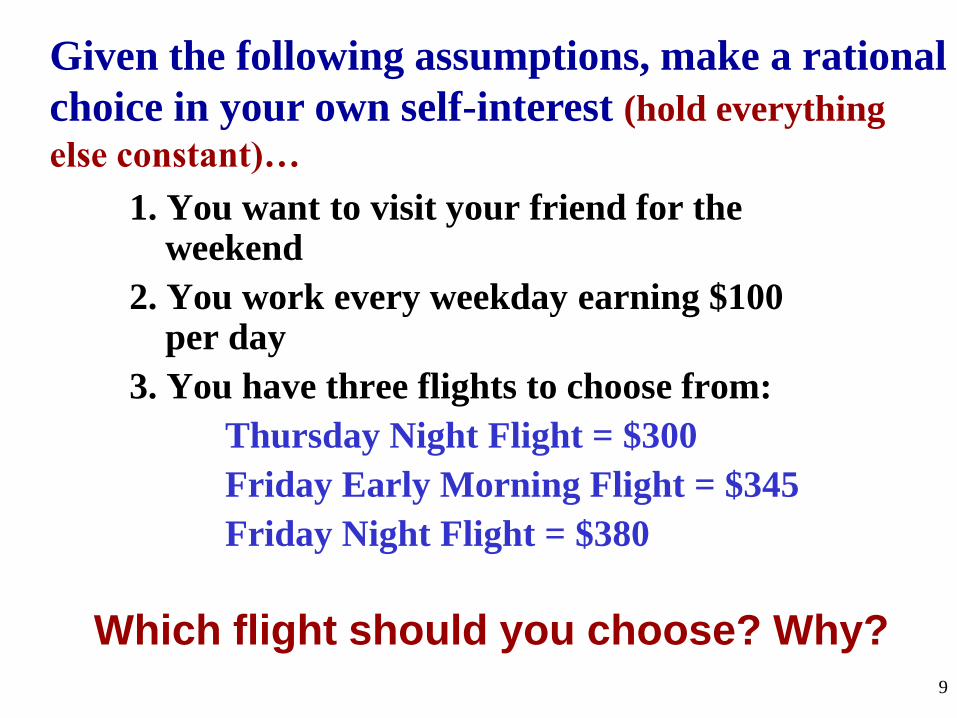
Given the following assumptions, make a rational
choice in your own self-interest (hold everything
else constant)…
1. You want to visit your friend for the weekend
2. You work every weekday earning $100 per day
3. You have three flights to choose from:
Thursday Night Flight = $300
Friday Early Morning Flight = $345
Friday Night Flight = $380
Which flight should you choose? Why? 9

Trade-offs
ALL decisions involve trade-offs.
The most desirable alternative given up as a result of a
decision is known as opportunity cost.
Trade-offs are all the alternatives that we give up
whenever we choose one course of action over others.
(Examples: going to the movies)
What are trade-offs of deciding to go to college?
What is the opportunity cost of going to college?
10

The Factors of Production
11

The Production
Possibilities Curve
(PPC) Using Economic Models…
Step 1: Explain concept in words
Step 2: Use numbers as examples
Step 3: Generate graphs from numbers
Step 4: Make generalizations using graph
12

What is the Production Possibilities Curve?
• A production possibilities graph (PPG) is a model that shows alternative ways that an economy can use its scarce resources
• This model graphically demonstrates scarcity, trade-offs, opportunity costs, and efficiency.
4 Key Assumptions
• Only two goods can be produced
• Full employment of resources
• Fixed Resources (Ceteris Paribus)
• Fixed Technology 13

a
b
c
d
e
f
14 12
9
5
0
0
0
2
4
6
8
10
Bikes
Computers
NOW GRAPH IT: Put bikes on y-axis and
computers on x-axis
Production “Possibilities” Table
Each point represents a specific
combination of goods that can be
produced given full employment of
resources.
14

Bik
es
Computers
14
12
10
8
6
4
2
0
0 2 4 6 8 10
A
B
C
D
E
G
Inefficient/
Unemployment
Impossible/Unattainable (given current resources)
Efficient
PRODUCTION POSSIBILITIES How does the PPG graphically demonstrates scarcity,
trade-offs, opportunity costs, and efficiency?
15

2 Bikes
2.The opportunity cost of moving from b to d is…
4.The opportunity cost of moving from f to c is…
3.The opportunity cost of moving from d to b is…
7 Bikes
4 Computers
0 Computers
5.What can you say about point G?
Unattainable
1. The opportunity cost of
moving from a to b is…
Example:
Opportunity Cost
16

The Production Possibilities
Curve (or Frontier)
17

PIZZA 0 1 2 3 4 CALZONES 4 3 2 1 0
• List the Opportunity Cost of moving from a-b,
b-c, c-d, and d-e.
• Constant Opportunity Cost- Resources are
easily adaptable for producing either good.
• Result is a straight line PPC (not common)
PRODUCTION POSSIBILITIES
A B C D E
18

PIZZA 18 17 15 10 0 ROBOTS 0 1 2 3 4
• List the Opportunity Cost of moving from a-b,
b-c, c-d, and d-e.
• Law of Increasing Opportunity Cost-
• As you produce more of any good, the
opportunity cost (forgone production of
another good) will increase.
• Why? Resources are NOT easily adaptable
to producing both goods.
• Result is a bowed out (Concave) PPC
A B C D E PRODUCTION POSSIBILITIES
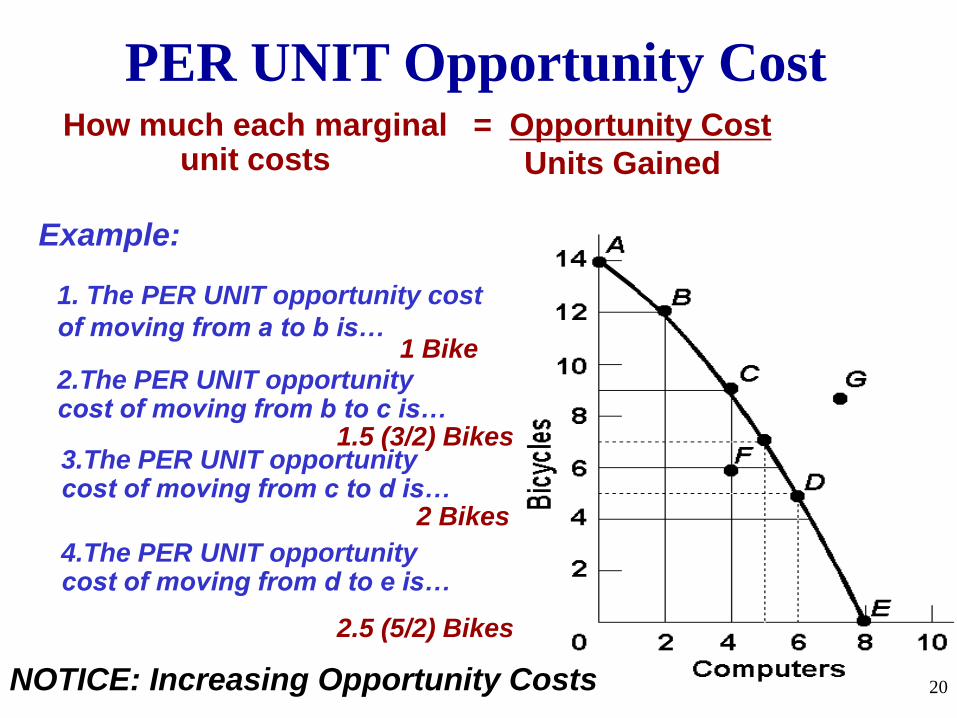
1 Bike 2.The PER UNIT opportunity cost of moving from b to c is…
4.The PER UNIT opportunity cost of moving from d to e is…
3.The PER UNIT opportunity cost of moving from c to d is…
1.5 (3/2) Bikes
2 Bikes
2.5 (5/2) Bikes
= Opportunity Cost
Units Gained
1. The PER UNIT opportunity cost
of moving from a to b is…
Example:
PER UNIT Opportunity Cost How much each marginal
unit costs
NOTICE: Increasing Opportunity Costs 20

Shifting the Production
Possibilities Curve
21

PRODUCTION POSSIBILITIES
4 Key Assumptions Revisited
• Only two goods can be produced
• Full employment of resources
• Fixed Resources (4 Factors)
• Fixed Technology
What if there is a change?
3 Shifters of the PPC 1. Change in resource quantity or quality
2. Change in Technology
3. Change in Trade 22

PRODUCTION POSSIBILITIES
Q
Q
Ro
bo
ts
Pizzas
14
13
12
11
10
9
8
7
6
5
4
3
2
1
1 2 3 4 5 6 7 8
What happens if
there is an increase
in population?
23

PRODUCTION POSSIBILITIES
Q
Q
Ro
bo
ts
Pizzas
14
13
12
11
10
9
8
7
6
5
4
3
2
1
1 2 3 4 5 6 7 8
A’
B’
C’
D’
E’
What happens if
there is an increase
in population?
24

Technology
improvements in pizza
ovens
Q
Q
Ro
bo
ts
Pizzas
14
13
12
11
10
9
8
7
6
5
4
3
2
1
1 2 3 4 5 6 7 8
PRODUCTION POSSIBILITIES
25

The Production Possibilities
Curve and Efficiency
26

Productive Efficiency-
• Products are being produced in the
least costly way.
• This is any point ON the Production
Possibilities Curve
Allocative Efficiency-
• The products being produced are the
ones most desired by society.
• This optimal point on the PPC depends
on the desires of society.
Two Types of Efficiency
27

Productive and Allocative Efficiency B
ikes
Computers
14
12
10
8
6
4
2
0
0 2 4 6 8 10
A
B
C
D
F
E
Which points are productively efficient?
Which are allocatively efficient?
G
28
Productively Efficient points are A through D
Allocative Efficient points depend on the
wants of society (What if this represents a
country with no electricity?)

Panama - FAVORS
CONSUMER GOODS
Mexico - FAVORS
CAPITAL GOODS
Consumer goods
Cap
ital G
oo
ds
CURRENT
CURVE
FUTURE
CURVE
Consumer goods
Ca
pit
al G
oo
ds
FUTURE
CURVE
CURRENT
CURVE
Capital Goods and Future Growth
Mexico Panama 29
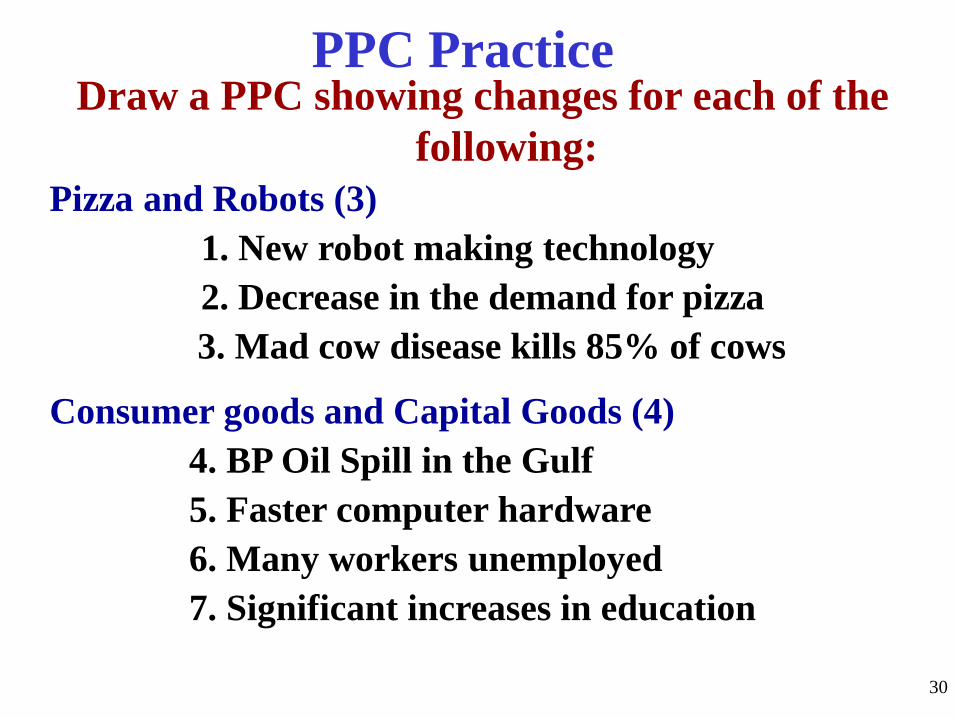
PPC Practice Draw a PPC showing changes for each of the
following:
Pizza and Robots (3)
1. New robot making technology
2. Decrease in the demand for pizza
3. Mad cow disease kills 85% of cows
Consumer goods and Capital Goods (4)
4. BP Oil Spill in the Gulf
5. Faster computer hardware
6. Many workers unemployed
7. Significant increases in education
30

New robot making technology
Q
Q
Ro
bo
ts
Pizzas
Question #1
31
A shift only for Robots

Decrease in the demand for pizza
Q
Q
Ro
bo
ts
Pizzas
Question #2
32
The curve doesn’t shift!
A change in demand
doesn’t shift the curve
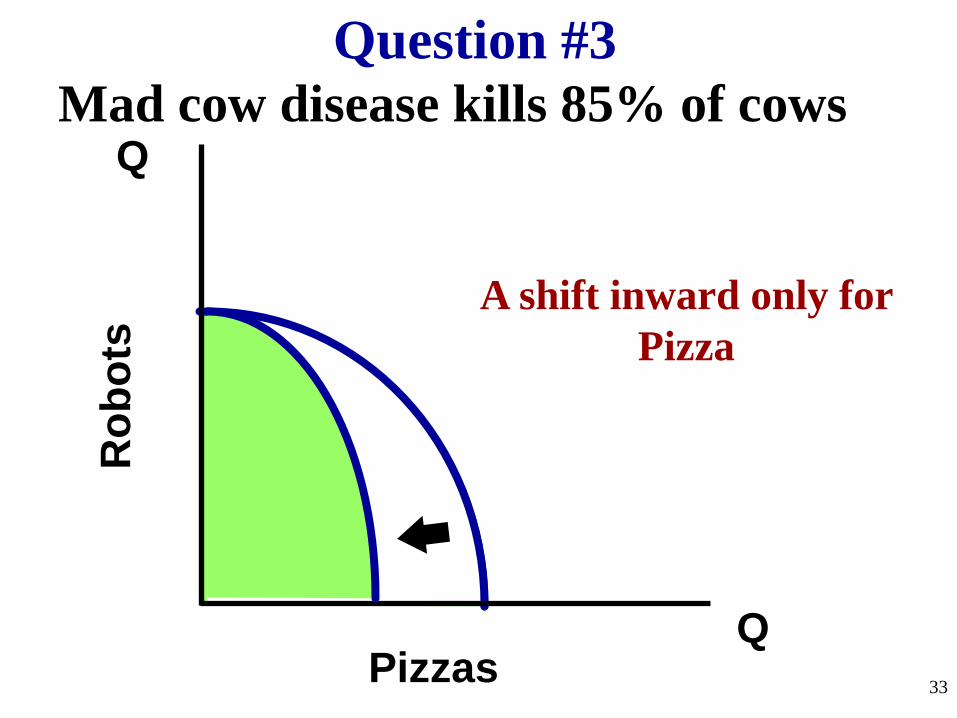
Mad cow disease kills 85% of cows
Q
Q
Ro
bo
ts
Pizzas
Question #3
33
A shift inward only for
Pizza

BP Oil Spill in the Gulf Q
Q
Ca
pit
al G
oo
ds
(G
un
s)
Consumer Goods (Butter)
Question #4
34
Decrease in resources
decrease production
possibilities for both

Faster computer hardware Q
Q
Ca
pit
al G
oo
ds
(G
un
s)
Consumer Goods (Butter)
Question #5
35
Quality of a resource
improves shifting the
curve outward

Many workers unemployed Q
Q
Ca
pit
al G
oo
ds
(G
un
s)
Consumer Goods (Butter)
Question #6
36
The curve doesn’t shift!
Unemployment is just a
point inside the curve

Significant increases in education
Q
Q
Ca
pit
al G
oo
ds
(G
un
s)
Consumer Goods (Butter)
Question #7
37
The quality of labor is
improved. Curve shifts
outward.

Scarcity Means There Is Not Enough For
Everyone
Government must step in to help allocate
(distribute) resources 38

Every society must answer three questions:
The Three Economic Questions 1. What goods and services should be
produced?
2. How should these goods and services be produced?
3. Who consumes these goods and services?
The way these questions are answered
determines the economic system
An economic system is the method used by a
society to produce and distribute goods and
services. 39

Economic Systems 1. Centrally-Planned
(Command) Economy
2. Free Market Economy
3. Mixed Economy
40
Centrally-Planned
Economies (aka Communism)
41
Centrally Planned Economies In a centrally planned economy (communism)
the government…
1. owns all the resources.
2. decides what to produce, how much to
produce, and who will receive it.
Examples: – Cuba, China, North Korea, former Soviet Union
Why do centrally planned economies face problems of poor-quality goods, shortages,
and unhappy citizens?
NO PROFIT MEANS NO INCENTIVES!! 42

Advantages and Disadvantages
1. Low unemployment-everyone has a job
2. Great Job Security-the government doesn’t go out of business
3. Equal incomes means no extremely poor people
4. Free Health Care
What is GOOD about
Communism? What is BAD about
Communism? 1. No incentive to work
harder 2. No incentive to
innovate or come up with good ideas
3. No Competition keeps quality of goods poor.
4. Corrupt leaders 5. Few individual
freedoms 43

Free Market System (aka Capitalism)
44

Characteristics of Free Market
1. Little government involvement in the economy.
(Laissez Faire = Let it be)
2. Individuals OWN resources and answer the three
economic questions.
3. The opportunity to make PROFIT gives people
INCENTIVE to produce quality items efficiently.
4. Wide variety of goods available to consumers.
5. Competition and Self-Interest work together to
regulate the economy (keep prices down and
quality up).
Reword for Communism 45

Example of Free Market Example of how the free market regulates itself:
If consumers want computers and only one company
is making them…
Other businesses have the INCENTIVE to start
making computers to earn PROFIT.
This leads to more COMPETITION….
Which means lower prices, better quality, and more
product variety.
We produce the goods and services that society
wants because “resources follow profits”.
The End Result: Most efficient production of the
goods that consumers want, produced at the lowest
prices and the highest quality. 46
The Invisible Hand The concept that society’s goals will be met as
individuals seek their own self-interest.
Example: Society wants fuel efficient cars…
•Profit seeking producers will make more.
•Competition between firms results in low
prices, high quality, and greater efficiency.
•The government doesn’t need to get
involved since the needs of society are
automatically met.
Competition and self-interest act as an invisible
hand that regulates the free market. 47

The difference between North and South Korea at night. North Korea's GDP is $40 Billion
South Korea's GDP is $1.3 Trillion (32 times greater).

Connection to the PPC
Communism in the
Long Run Free Markets in the
Long Run
Consumer goods
Ca
pit
al G
oo
ds
CURRENT
CURVE
FUTURE
CURVE
Consumer goods C
ap
ita
l G
oo
ds
FUTURE
CURVE
CURRENT
CURVE
Puerto Rico Cuba
49

The Circular Flow Model
50

Supply and Demand
51

52 Product Market
Resource Market
Businesses Individuals
SUPPLY DEMAND
DEMAND SUPPLY

DEMAND DEFINED
What is Demand?
Demand is the different quantities of goods
that consumers are willing and able to buy at
different prices. (Ex: Bill Gates is able to purchase a Ferrari, but if
he isn’t willing he has NO demand for one)
What is the Law of Demand?
The law of demand states There is an
INVERSE relationship between price and
quantity demanded 53

Why does the Law of Demand occur?
The law of demand is the result of three
separate behavior patterns that overlap:
1.The Substitution effect
2.The Income effect
3.The Law of Diminishing Marginal
Utility
We will define and explain each…
54

• If the price goes up for a product, consumer
but less of that product and more of
another substitute product (and vice versa)
1. The Substitution Effect
• If the price goes down for a product, the purchasing power increases for consumers -allowing them to purchase more.
2. The Income Effect
Why does the Law of Demand occur?
55

• Utility = Satisfaction
• We buy goods because we get utility from them
• The law of diminishing marginal utility states that as you consume more units of any good, the additional satisfaction from each additional unit will eventually start to decrease
• In other words, the more you buy of ANY GOOD the less satisfaction you get from each new unit.
Discussion Questions:
1. What does this have to do with the Law of Demand?
2. How does this effect the pricing of businesses?
3. Law of Diminishing Marginal Utility
Why does the Law of Demand occur?
U- TIL- IT- Y
56

The Demand Curve • A demand curve is a graphical representation
of a demand schedule.
• The demand curve is downward sloping showing the inverse relationship between price (on the y-axis) and quantity demanded (on the x-axis)
• When reading a demand curve, assume all outside factors, such as income, are held constant. (This is called ceteris paribus)
Let’s draw a new demand curve for cereal…
57

GRAPHING DEMAND
Q o
$5
4
3
2
1
Price of Cereal
Quantity of Cereal
Demand
Schedule
10 20 30 40 50 60 70 80
58
Price Quantity
Demanded
$5 10
$4 20
$3 30
$2 50
$1 80
Demand

Where do you get the Market Demand?
Q
Billy
Price Q Demd
$5 1
$4 2
$3 3
$2 5
$1 7
Jean Other Individuals
Price Q Demd
$5 0
$4 1
$3 2
$2 3
$1 5
Price Q Demd
$5 9
$4 17
$3 25
$2 42
$1 68
Price Q Demd
$5 10
$4 20
$3 30
$2 50
$1 80
Market
3
P
Q 2
P
Q 25
P
Q 30
P
$3 $3 $3 $3
D D D D

Shifts in Demand CHANGES IN DEMAND
• Ceteris paribus-“all other things held constant.”
• When the ceteris paribus assumption is dropped, movement no longer occurs along the demand curve. Rather, the entire demand curve shifts.
• A shift means that at the same prices, more people are willing and able to purchase that good.
This is a change in demand, not a change in quantity demanded
60
Changes in price
DON’T shift
the curve!

Change in Demand
Q o
$5
4
3
2
1
Price of Cereal
Quantity of Cereal
Demand
Schedule
10 20 30 40 50 60 70 80
61
Price Quantity
Demanded
$5 10
$4 20
$3 30
$2 50
$1 80
Demand
What if cereal
makes you smarter?
Change in Demand
Q o
$5
4
3
2
1
Price of Cereal
Quantity of Cereal
Demand
Schedule
10 20 30 40 50 60 70 80
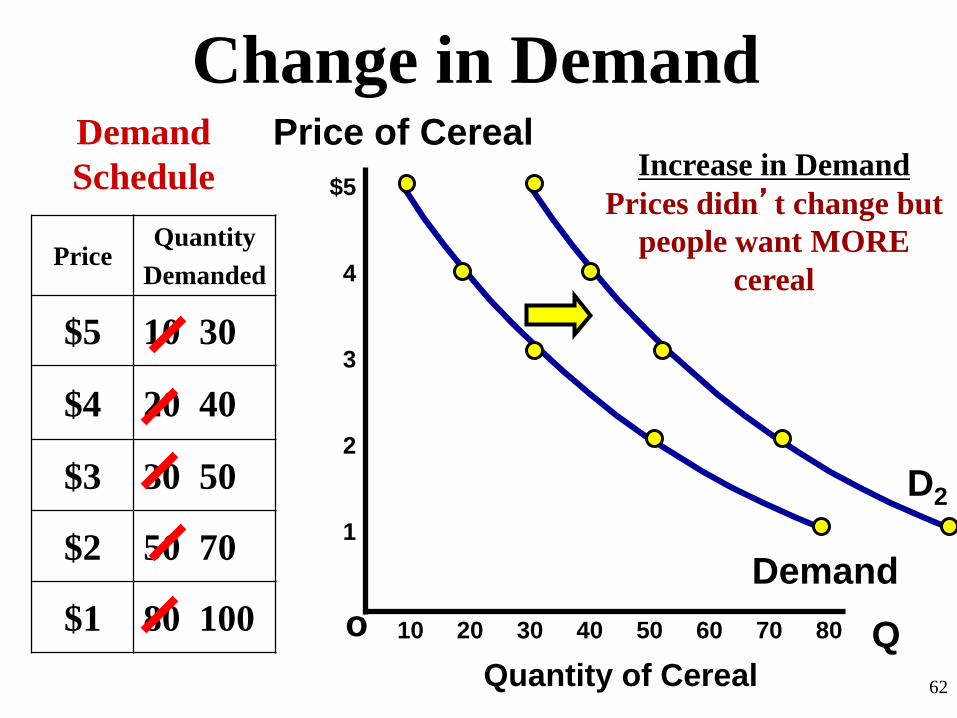
62
Price Quantity
Demanded
$5 10 30
$4 20 40
$3 30 50
$2 50 70
$1 80 100
Demand
D2
Increase in Demand
Prices didn’t change but
people want MORE
cereal

Change in Demand
Q o
$5
4
3
2
1
Price of Cereal
Quantity of Cereal
Demand
Schedule
10 20 30 40 50 60 70 80
63
Price Quantity
Demanded
$5 10
$4 20
$3 30
$2 50
$1 80
What if cereal
causes baldness?
Demand

Change in Demand
Q o
$5
4
3
2
1
Price of Cereal
Quantity of Cereal
Demand
Schedule
10 20 30 40 50 60 70 80
64
Price Quantity
Demanded
$5 10 0
$4 20 5
$3 30 20
$2 50 30
$1 80 60
Demand D2
Decrease in Demand
Prices didn’t change but
people want LESS cereal
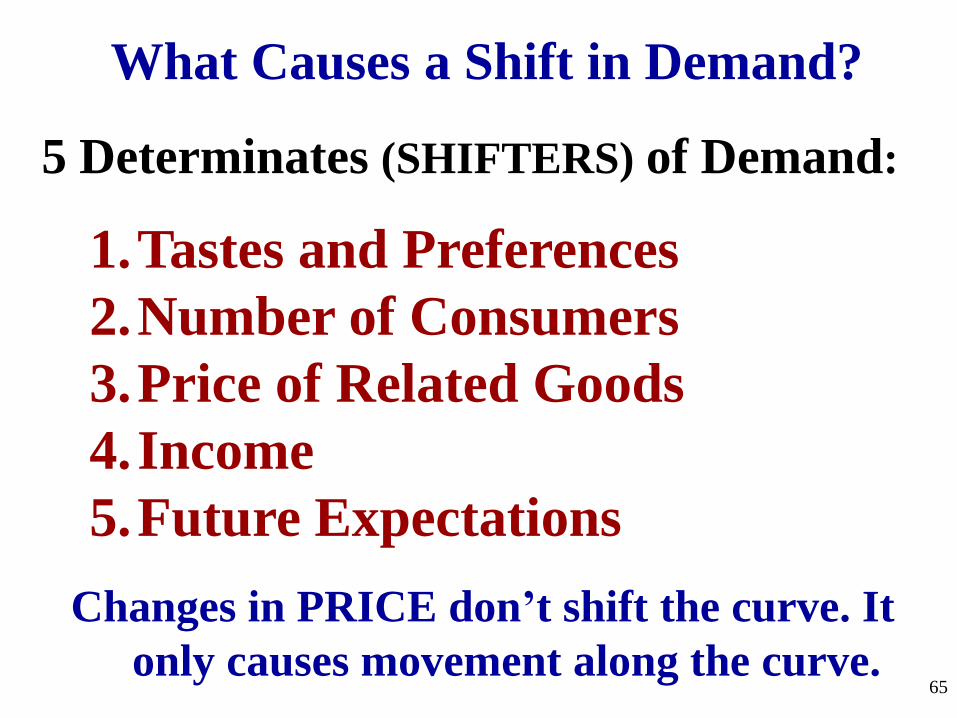
What Causes a Shift in Demand?
5 Determinates (SHIFTERS) of Demand:
1.Tastes and Preferences
2.Number of Consumers
3.Price of Related Goods
4.Income
5.Future Expectations
Changes in PRICE don’t shift the curve. It
only causes movement along the curve. 65

Prices of Related Goods
2. Complements are two goods that are bought
and used together. – If the price of one increase, the demand for the
other will fall. (or vice versa)
– Ex: If price of skis falls, demand for ski boots will...
1. Substitutes are goods used in place of one
another. – If the price of one increases, the demand for the
other will increase (or vice versa)
– Ex: If price of Pepsi falls, demand for coke will…
The demand curve for one good can be affected by a
change in the price of ANOTHER related good.
66

Income
2. Inferior Goods – As income increases, demand falls – As income falls, demand increases – Ex: Top Romen, used cars, used cloths,
1. Normal Goods – As income increases, demand increases – As income falls, demand falls – Ex: Luxury cars, Sea Food, jewelry, homes
The incomes of consumer change the demand, but
how depends on the type of good.
67

P
Q Cereal o
$3
$2
D1
Price of Cereal
Quantity of Cereal
10 20
Change in Qd vs. Change in Demand
A C
B
There are two ways to increase quantity from 10 to 20
D2
1. A to B is a change
in quantity
demand (due to a
change in price)
2. A to C is a change
in demand (shift
in the curve)

Practice First, identify the determinant (shifter) then
decide if demand will increase or decrease
69
Shifter Increase or
Decrease Left or Right
1
2
3
4
5
6
7
8

Practice
Hamburgers (a normal good) 1. Population boom 2. Incomes fall due to recession 3. Price for Carne Asada burritos falls to $1 4. Price increases to $5 for hamburgers 5. New health craze- “No ground beef” 6. Hamburger restaurants announce that they
will significantly increase prices NEXT month 7. Government heavily taxes shake and fries
causes their prices to quadruple. 8. Restaurants lower price of burgers to $.50
First identify the determinant (Shifter). Then
decide if demand will increase or decrease
70
Supply
71

Supply Defined What is supply?
Supply is the different quantities of a good that sellers
are willing and able to sell (produce) at different prices.
What is the Law of Supply?
There is a DIRECT (or positive) relationship between
price and quantity supplied.
•As price increases, the quantity producers make
increases
•As price falls, the quantity producers make falls.
Why? Because, at higher prices profit seeking
firms have an incentive to produce more.
EXAMPLE: Mowing Lawns 72

GRAPHING SUPPLY
Q o
$5
4
3
2
1
Price of Cereal
Quantity of Cereal
Supply
Schedule
10 20 30 40 50 60 70 80
73
Price Quantity
Supplied
$5 50
$4 40
$3 30
$2 20
$1 10
Supply
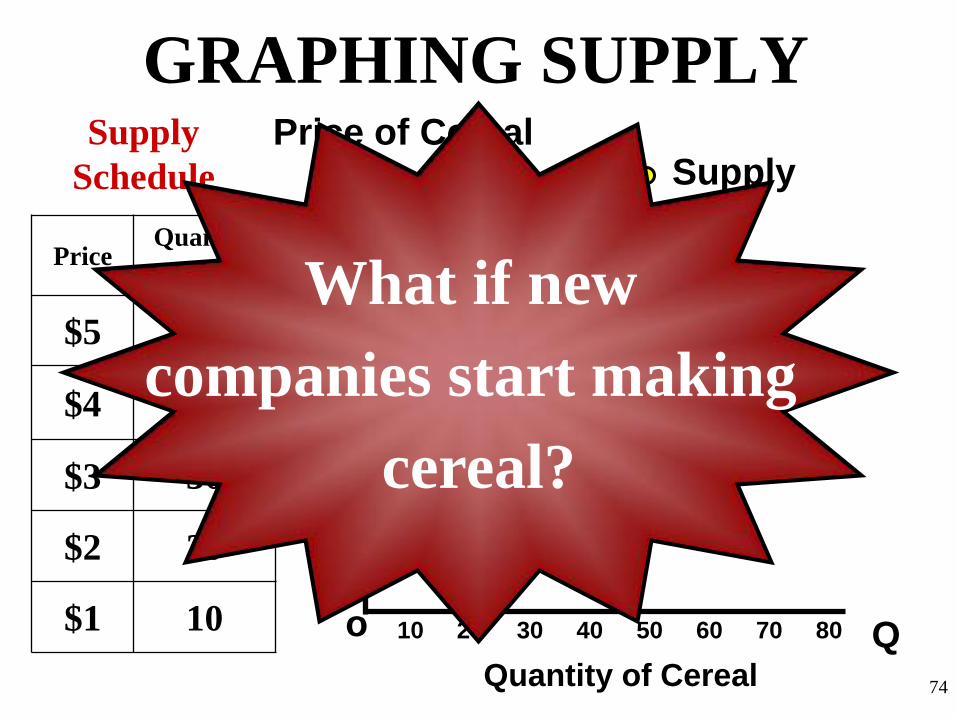
GRAPHING SUPPLY
Q o
$5
4
3
2
1
Price of Cereal
Quantity of Cereal
Supply
Schedule
10 20 30 40 50 60 70 80
74
Price Quantity
Supplied
$5 50
$4 40
$3 30
$2 20
$1 10
Supply
What if new
companies start making
cereal?

Change in Supply
Q o
$5
4
3
2
1
Price of Cereal
Quantity of Cereal
Supply
Schedule
10 20 30 40 50 60 70 80
75
Supply S2
Price Quantity
Supplied
$5 50 70
$4 40 60
$3 30 50
$2 20 40
$1 10 30
Increase in Supply Prices didn’t change but
there is MORE cereal produced

Change in Supply
Q o
$5
4
3
2
1
Price of Cereal
Quantity of Cereal
Supply
Schedule
10 20 30 40 50 60 70 80
76
Price Quantity
Supplied
$5 50
$4 40
$3 30
$2 20
$1 10
Supply
What if a drought
destroys corn and wheat
crops?

Change in Supply
Q o
$5
4
3
2
1
Price of Cereal
Quantity of Cereal
Supply
Schedule
10 20 30 40 50 60 70 80
77
Supply
S2
Price Quantity
Supplied
$5 50 30
$4 40 20
$3 30 10
$2 20 1
$1 10 0
Decrease in Supply Prices didn’t change but
there is LESS cereal produced

6 Determinants (SHIFTERS) of Supply
1. Prices/Availability of inputs (resources)
2. Number of Sellers
3. Technology
4. Government Action: Taxes & Subsidies
SubsidiesA subsidy is a government payment that supports a business or market.
Subsidies cause the supply of a good to increase.
TaxesThe government can reduce the
supply of some goods by placing anexcise tax on them. An excise taxis a tax on the production or sale of
a good.
RegulationRegulation occurs when the
government steps into a market toaffect the price, quantity, or quality of
a good. Regulation usually raisescosts.
5. Opportunity Cost of Alternative
Production
6. Expectations of Future Profit Changes in PRICE don’t shift the curve. It only
causes movement along the curve. 78

Supply Practice First, identify the determinant (shifter) then
decide if supply will increase or decrease
79
Shifter Increase or
Decrease Left or Right
1
2
3
4
5
6

Supply Practice
Hamburgers 1. Mad cow kills 20% of cows 2. Price of burgers increase 30% 3. Government taxes burger producers 4. Restaurants can produce burgers and/or
tacos. A demand increase causes the price for tacos to increase 500%
5. New bun baking technology cuts production time in half
6. Minimum wage increases to $10
1. Which determinant (SHIFTER)?
2. Increase or decrease?
3. Which direction will curve shift?
80

Q o
$5
4
3
2
1
P Demand
Schedule
10 20 30 40 50 60 70 80
81
P Qd
$5 10
$4 20
$3 30
$2 50
$1 80
Supply
Schedule
P Qs
$5 50
$4 40
$3 30
$2 20
$1 10
Supply and Demand are put together to determine
equilibrium price and equilibrium quantity
Equilibrium Price = $3
(Qd=Qs)
Equilibrium Quantity is 30
D
S

Q o
$5
4
3
2
1
P Demand
Schedule
10 20 30 40 50 60 70 80
82
P Qd
$5 10
$4 20
$3 30
$2 50
$1 80
Supply
Schedule
P Qs
$5 50
$4 40
$3 30
$2 20
$1 10
Supply and Demand are put together to determine
equilibrium price and equilibrium quantity
D
S
What if the price
increases to $4?

Q o
$5
4
3
2
1
P Demand
Schedule
10 20 30 40 50 60 70 80
83
P Qd
$5 10
$4 20
$3 30
$2 50
$1 80
Supply
Schedule
P Qs
$5 50
$4 40
$3 30
$2 20
$1 10
D
S
At $4, there is disequilibrium. The quantity
demanded is less than quantity supplied.
Surplus (Qd<Qs)
How much is the surplus at $4?
Answer: 20

Q o
$5
4
3
2
1
P Demand
Schedule
10 20 30 40 50 60 70 80
84
P Qd
$5 10
$4 20
$3 30
$2 50
$1 80
Supply
Schedule
P Qs
$5 50
$4 40
$3 30
$2 20
$1 10
D
S
How much is the surplus if the price is $5?
Answer: 40 What if the price
decreases to $2?

Q o
$5
4
3
2
1
P Demand
Schedule
10 20 30 40 50 60 70 80
85
P Qd
$5 10
$4 20
$3 30
$2 50
$1 80
Supply
Schedule
P Qs
$5 50
$4 40
$3 30
$2 20
$1 10
D
S
At $2, there is disequilibrium. The quantity
demanded is greater than quantity supplied.
Shortage (Qd>Qs)
How much is the shortage at $2?
Answer: 30

Q o
$5
4
3
2
1
P Demand
Schedule
10 20 30 40 50 60 70 80
86
P Qd
$5 10
$4 20
$3 30
$2 50
$1 80
Supply
Schedule
P Qs
$5 50
$4 40
$3 30
$2 20
$1 10
D
S
Answer: 70
How much is the shortage if the price is $1?

Q o
$5
4
3
2
1
P Demand
Schedule
10 20 30 40 50 60 70 80
87
P Qd
$5 10
$4 20
$3 30
$2 50
$1 80
Supply
Schedule
P Qs
$5 50
$4 40
$3 30
$2 20
$1 10
D
S When there is a
surplus, producers lower prices
The FREE MARKET system automatically pushes the price toward equilibrium.
When there is a shortage, producers
raise prices

Shifting Supply and
Demand
88
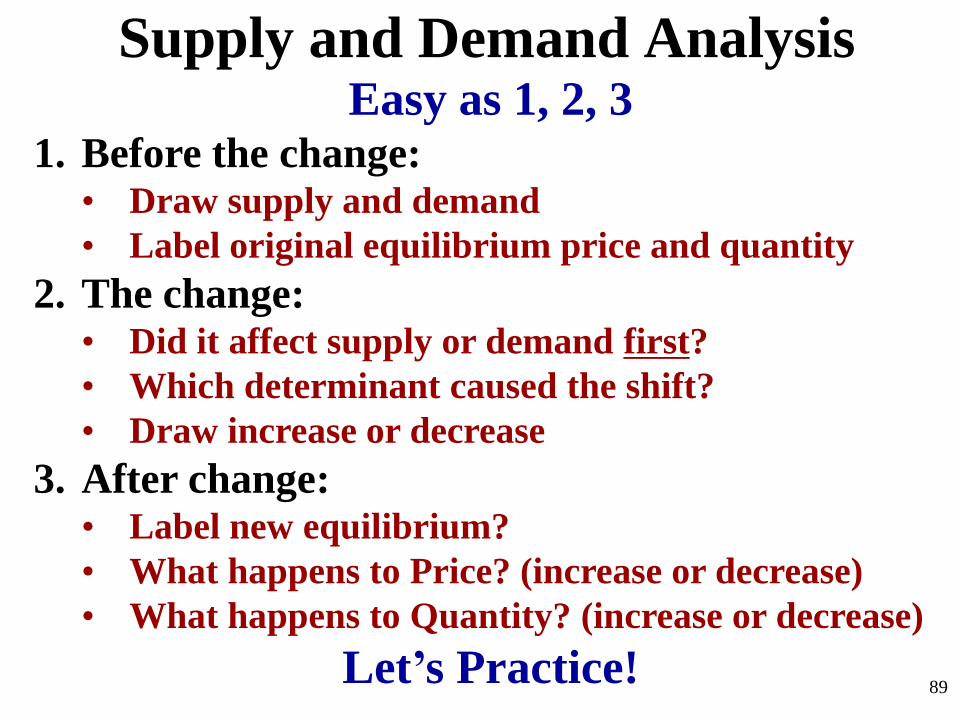
Supply and Demand Analysis Easy as 1, 2, 3
1. Before the change: • Draw supply and demand
• Label original equilibrium price and quantity
2. The change: • Did it affect supply or demand first?
• Which determinant caused the shift?
• Draw increase or decrease
3. After change:
• Label new equilibrium?
• What happens to Price? (increase or decrease)
• What happens to Quantity? (increase or decrease)
Let’s Practice! 89

S&D Analysis Practice
Analyze Hamburgers 1. Price of sushi (a substitute) increases 2. New grilling technology cuts production
time in half 3. Price of burgers falls from $3 to $1. 4. Price for ground beef triples 5. Human fingers found in multiple burger
restaurants.
1. Before Change (Draw equilibrium)
2. The Change (S or D, Identify Shifter)
3. After Change (Price and Quantity After)
90

Double Shifts • Suppose the demand for sports cars fell at the
same time as production technology improved.
• Use S&D Analysis to show what will happen to
PRICE and QUANTITY.
If TWO curves shift at the same
time, EITHER price or quantity
will be indeterminate.
91

Consumer Surplus is the difference
between what you are willing to pay
and what you actually pay.
CS = Buyer’s Maximum – Price
Producer’s Surplus is the difference
between the price the seller received
and how much they were willing to sell
it for.
PS = Price – Seller’s Minimum
Voluntary Exchange Terms
92

S
P
Q
D
Consumer and Producer’s Surplus
$10
8
6
$5 4
2
1
10 2 4 6 8
CS
PS
93
Calculate the area of: 1. Consumer Surplus 2. Producer Surplus 3. Total Surplus
1. CS= $25 2. PS= $20 3. Total= $45

Government
Involvement #1-Price Controls: Floors and Ceilings
#2-Import Quotas
#3-Subsidies
#4-Excise Taxes
94

#1-PRICE CONTROLS Who likes the idea of having a price ceiling on
gas so prices will never go over $1 per gallon?
95

Q o
$5
4
3
2
1
P
10 20 30 40 50 60 70 80 96
D
S
Shortage (Qd>Qs)
Maximum legal price a seller can charge for a product. Goal: Make affordable by keeping price from reaching Eq.
Gasoline
Does this
policy help
consumers?
Result:
BLACK
MARKETS Price
Ceiling
Price Ceiling
To have an effect,
a price ceiling must be
below equilibrium

Q o
$
4
3
2
1
P
10 20 30 40 50 60 70 80 97
D
S Surplus (Qd<Qs)
Minimum legal price a seller can sell a product.
Goal: Keep price high by keeping price from falling to Eq.
Corn
Does this
policy help
corn
producers?
Price Floor
Price Floor
To have an effect,
a price floor must be
above equilibrium

Practice Questions 1. Which of the following will occur if a legal price floor is
placed on a good below its free market equilibrium?
A. Surpluses will develop
B. Shortages will develop
C. Underground markets will develop
D. The equilibrium price will ration the good
E. The quantity sold will increase
A. A price ceiling causes a shortage if the ceiling price is
above the equilibrium price
B. A price floor causes a surplus if the price floor is below
the equilibrium price
C. Price ceilings and price floors result in a misallocation of
resources
D. Price floors above equilibrium cause a shortage
2. Which of the following statements about price control is true?
98

Are Price Controls Good or Bad? To be “efficient” a market must maximize
consumers and producers surplus
Q
P
D
S
Pc
Qe
CS
PS
99

Are Price Controls Good or Bad? To be “efficient” a market must maximize consumers and
producers surplus
Price
FLOOR
Q
P
D
S
Pc
Qe Qfloor
DEADWEIGHT LOSS
The Lost CS and PS.
INEFFICIENT!
CS
PS
100
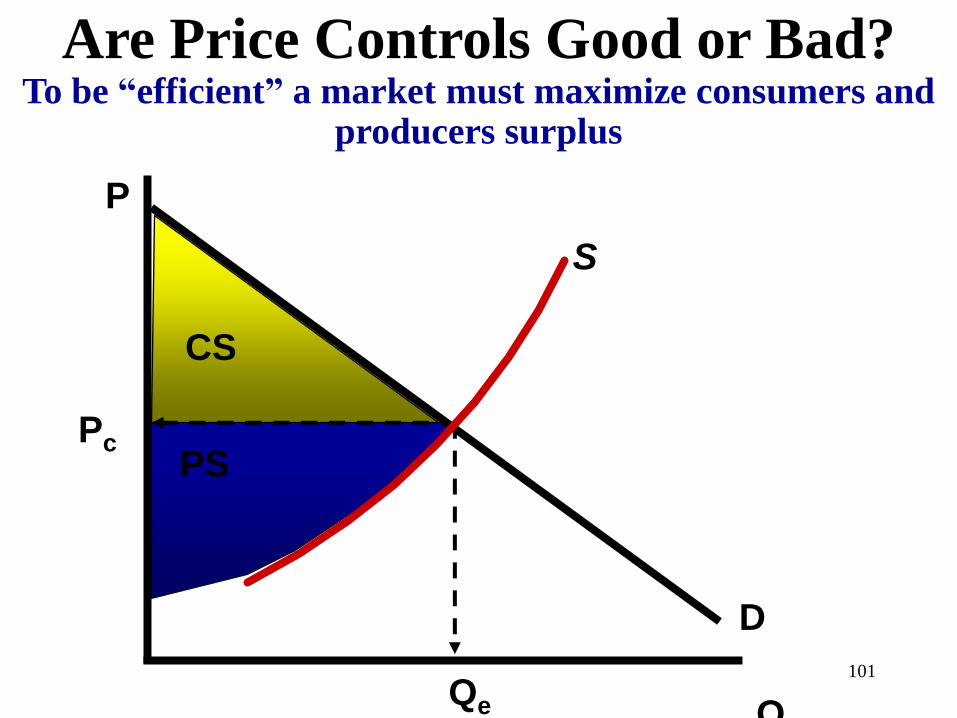
Are Price Controls Good or Bad? To be “efficient” a market must maximize consumers and
producers surplus
Q
P
D
S
Pc
Qe
CS
PS
101

Are Price Controls Good or Bad? To be “efficient” a market must maximize consumers and
producers surplus
Price
CEILING
Q
P
D
S
Pc
Qe Qceiling
DEADWEIGHT LOSS
The Lost CS and PS.
INEFFICIENT!
CS
PS
102

#2 Import Quotas A quota is a limit on number of exports.
The government sets the maximum amount that
can come in the country. Purpose: •To protect domestic producers from a cheaper world price. •To prevent domestic unemployment
103

International Trade and Quotas
Identify the following:
1. CS with no trade
2. PS with no trade
3. CS if we trade at
world price (PW)
4. PS if we trade at
world price (PW)
5. Amount we import at
world price (PW)
6. If the government sets
a quota on imports of
Q4 - Q2, what happens
to CS and PS?
This graphs show the domestic
supply and demand for grain.
The letters represent area.

#3 Subsidies The government just gives producers money.
The goal is for them to make more of the goods
that the government thinks are important.
Ex: •Agriculture (to prevent famine) •Pharmaceutical Companies •Environmentally Safe Vehicles •FAFSA
105

Result of Subsidies to Corn Producers
Q o
Price of Corn
Quantity of Corn 106
S SSubsidy
Price Down
Quantity Up
Everyone
Wins, Right?
Pe
P1
Qe Q1
D

#4 Excise Taxes Excise Tax = A per unit tax on producers
For every unit made, the producer must pay $
NOT a Lump Sum (one time only)Tax
The goal is for them to make less of the goods that
the government deems dangerous or unwanted.
Ex: •Cigarettes “sin tax” •Alcohol “sin tax” •Tariffs on imported goods •Environmentally Unsafe Products •Etc.
107

Excise Taxes
Q o
$5
4
3
2
1
P
108
Supply
Schedule
P Qs
$5 140
$4 120
$3 100
$2 80
$1 60 D
S
40 60 80 100 120 140
Government sets a $2 per unit tax on Cigarettes

Excise Taxes
Q o
$5
4
3
2
1
P
109
Supply
Schedule
P Qs
$5 $7 140
$4 $6 120
$3 $5 100
$2 $4 80
$1 $3 60 D
S
40 60 80 100 120 140
Government sets a $2 per unit tax on Cigarettes
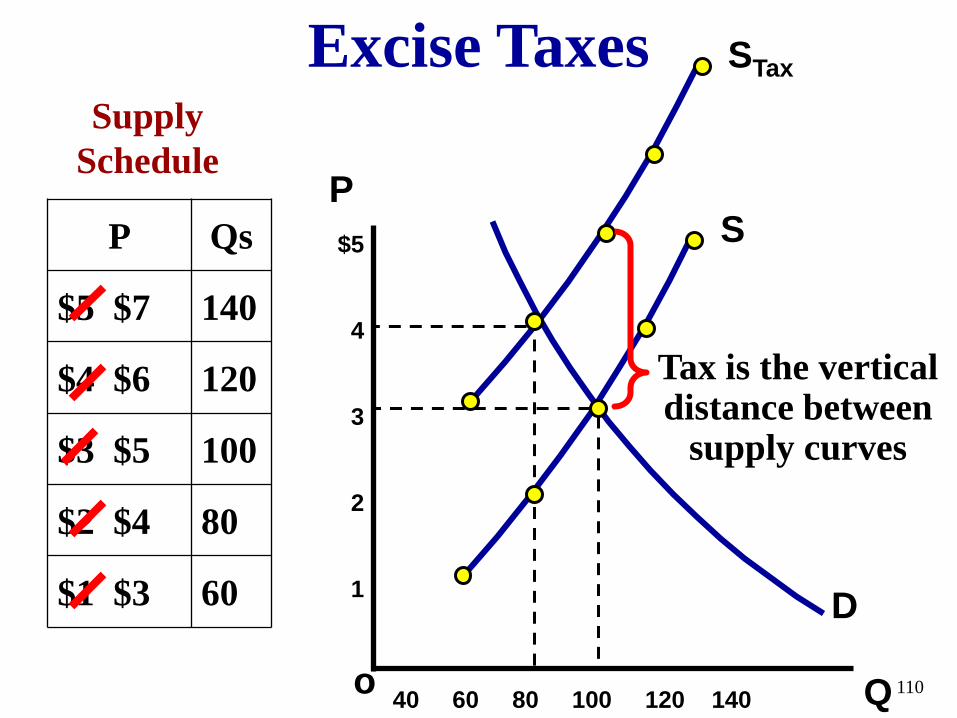
Excise Taxes
Q o
$5
4
3
2
1
P
110
Supply
Schedule
P Qs
$5 $7 140
$4 $6 120
$3 $5 100
$2 $4 80
$1 $3 60 D
S
40 60 80 100 120 140
Tax is the vertical distance between
supply curves
STax