Embed Size (px)
Citation preview

1GREAT EASTERN LIFE ASSURANCE (MALAYSIA) BERHAD
UNIT FUNDS ANNUAL REPORT 2013
UNIT FUNDS ANNUAL REPORT For The Period 1 January 2013 to 31 December 2013
• Centennial Max Fund • Lion AU-i Fund • Lion Progressive Fund
• Dana Gemilang • Lion Balanced Fund • Lion Strategic Fund
• Dana Restu • Lion Enhanced Equity Fund • Lion UK-i Fund
• Dana Sejati • Lion Fixed Income Fund • Lion US-i Fund
• Lion Asia Pac Fund • Lion Growth Fund • Smart Invest Gain Fund

2
25 Balance Sheet as at 31 December 2013
33 Statement of Changes in Equity for Financial Year Ended 31 December 2013
40 Cash Flow Statement for Financial Year Ended 31 December 2013
48 Details of Investment as at 31 December 2013
76 Notes to the Financial Statements
162 Statement by Manager
163 Independent Auditors’ Report
165 Corporate Shariah Advisor’s Report
166 Comparative Performance Table
189 Branch Network
3 CEO’s Message
5 Funds Objectives
7 Investment Review and Outlook
9 Funds Performance
17 Statement of Comprehensive Income for Financial Year Ended 31 December 2013
CONTENTS
Note:Some of the data contained herein have been extracted from the following Source: FTSE International Limited (“FTSE”) ©FTSE [2013]. FTSE is a trade mark of London Stock Exchange Plc and The Financial Times Limited and is used by FTSE under licence. All rights in the FTSE Indices vest in FTSE and/or its licensors. Neither FTSE nor its licensors accept any liability for any errors or omissions in the FTSE indices or underlying data. No further distribution of FTSE data is permitted without FTSE’s express written consent.

3GREAT EASTERN LIFE ASSURANCE (MALAYSIA) BERHAD
UNIT FUNDS ANNUAL REPORT 2013
CEO’SMESSAGE
Dear Investment-Linked Policy OwnerWe are pleased to present the 2013 Annual Report of Great Eastern Life’s Unit Funds (“UFs”) consisting of Dana Restu (DR), Dana Sejati (DS), Lion Balanced Fund (LBF), Lion Fixed Income Fund (LFIF), Lion Growth Fund (LGF), Lion Progressive Fund (LPF), Lion Strategic Fund (LSF), Lion US-i Fund, Lion UK-i Fund, Lion AU-i Fund, Smart Invest Gain Fund (SIG), Lion Asia Pac Fund, Lion Enhanced Equity Fund (LEEF) and Dana Gemilang (DG), for year ended 31 December 2013.
DATO KOH YAW HUIDirector & Chief Executive Officer

4 CEO’SMESSAGE
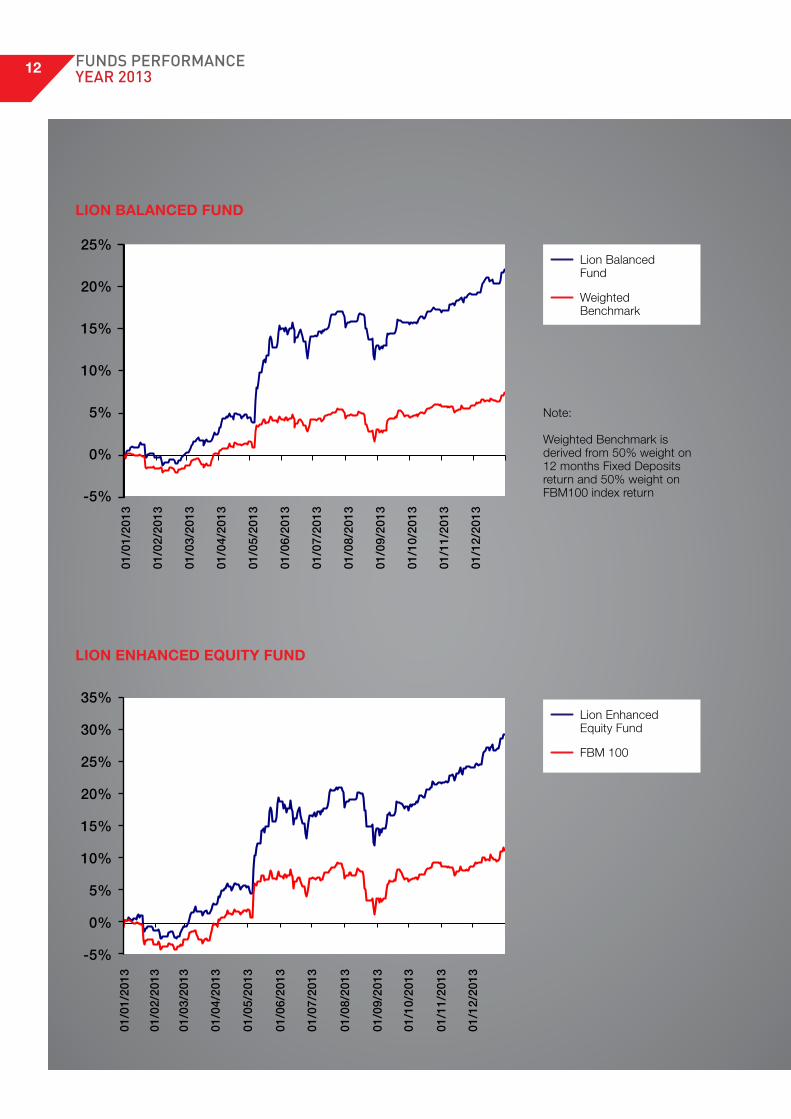
In 2013, Great Eastern Life’s equity UFs’ managed to outperform all their respective benchmarks. Looking at the recent 1-year performance, LGF, LPF, and LEEF registered return of +14.7%, +14.9%, and +29.2% vs. FTSE Bursa Malaysia Top 100 Index (“FBM100”)’s return of +11.4%. As for LSF and LBF, they rose +14.8% and +22.0% respectively vs. their weighted benchmark’s gain of +7.3%. In addition, DG and DR also chalked up gains of +27.8% and +15.4%, and outperformed the FTSE Bursa Malaysia Emas Shariah (“FBMS”) Index +13.3% in 2013.
The fixed income funds recorded another year of positive returns amidst a challenging environment. Fixed income funds continued to meet expectations of the 12-month fixed deposit benchmark of 3.2%. LFIF was +3.2% in 2013, while over 3 years and 5 years, the fund registered +5.1% and +5.4% annualised returns respectively. Similarly for DS, the annualised returns were +3.2%, +5.5% and +5.7% over 1, 3 and 5 years respectively.
2013 was a positive year for equities asset class with MSCI World Index recorded +24.1% gain. We saw developed markets outperformed emerging markets, driven mainly by the economic recovery in the US and Eurozone. Concerns over the deteriorating current account and fiscal position of the Asean countries, and slower growth in China drove investors to position their funds in favour of developed markets. Over in Asia, the Morgan Stanley Capital International Asia Ex Japan (“MSCI Asia Ex Japan”) ended the year up marginally higher, +0.7%. All the major Asian markets including Malaysia, recorded positive gain for the year except for China and Indonesia. Domestically, Malaysia outperformed the region as the FTSE Bursa Malaysia Top 100 Index (FBM100) rose +11.4% during the year on the back of political overhang removal when the ruling coalition won the general election in May. In addition, the government’s commitment in strengthening public finances by implementing subsidy rationalisation, Goods and Services Tax (“GST”) and other fiscal consolidation efforts also contributed to the outperformance.
Going into 2014, equities will continue to be the preferred asset class. Major central banks are expected to adopt an accommodative monetary policy as inflationary pressure remains tame. For the 1H2014, we expect investors to turn cautious given the Quantitative Easing (“QE”) tapering commencement. However, we are unlikely to see a sharp selldown as most funds already underweighted the Asian markets. We expect equities to perform relatively better in 2H2014 as developed countries economic recovery gain momentum, hence a positive spillover into Asia. Investors to focus on the implementation of the structural reforms which is expected to weaken consumer sentiment and dampen profit margins of certain sectors. Other area of focus includes
impact of the property cooling measures. The positives include Petronas spending remain intact, continuity of some key infrastructure projects, and recovery of exporters on a stronger global economy. We are of the view that market downside is fairly limited given the strong domestic liquidity, lower political risk and fiscal concerns being addressed. The risk to our market view is sovereign rating downgrade and domestic fiscal measures implementation delay.
For fixed income, 2013 was a volatile year with yield movements influenced by political uncertainties in the run-up to the general elections during the first half of the year and expectations of the timing and quantum of the U.S. QE tapering in the second half of 2013. Revision of Malaysia’s sovereign rating outlook from Stable to Negative by Fitch Rating Agency further dampened the domestic sovereign market sentiment. In response to the concerns, the Malaysian government announced resumption of subsidy rationalisation and reiterated its commitment to further reduce the country’s budget deficit as part of the fiscal reform efforts. While sovereign and corporate bond yields shifted higher during the year, the Overnight Policy Rate (“OPR”) ended 2013 unchanged at 3.00%.
Moving into 2014, domestic fixed income market will likely be driven by further QE tapering and potential renewed inflationary concerns as the Malaysian government embarks on budgetary reforms. While QE tapering may inevitably push global yields higher going forward, prolonged low Fed Fund rate could moderate some upward pressure on U.S. Treasury yields. Locally, Malaysia’s growth prospect is expected to be on track for a better 2014. Meanwhile, uptrend in inflation numbers, largely driven by domestic cost factors, is unlikely to trigger any substantial change in BNM’s interest rate stance. On this note, the Overnight Policy Rate is expected to remain stable at 3.00% in 2014 with a possibility of a 25 basis points increase should BNM adopt a pre-emptive measure to address potential multiplier impact of higher prices to the real domestic economy.
While 2014 poses new challenges, the coming year also holds various opportunities for our professional team of in-house fund managers to strive for sound returns to policyholders. We continue to advocate policyholders to adopt dollar cost averaging to ensure consistent long-term returns and enjoy benefits of diversification through investments in our funds. With extreme pleasure, I would like to express my sincere gratitude for your unwavering support and look forward to charting another great year of success.
Dato Koh Yaw HuiDirector & Chief Executive Officer

5GREAT EASTERN LIFE ASSURANCE (MALAYSIA) BERHAD
UNIT FUNDS ANNUAL REPORT 2013
FUNDSOBJECTIVES
1. Lion Balanced Fund
A fund which invests in a mixture of equities (ranging from 40% to 60%) and fixed income securities. This fund seeks to provide medium to long-term capital appreciation, with a moderate level of volatility.
2. Lion Growth Fund
A fund where 70% to 100% of the investment instruments are equities, which may be volatile in the short term. This fund seeks to provide medium to long-term capital appreciation.
3. Dana Restu*
A fund where 70% to 100% of the investment instruments are equities, which may be volatile in the short term. This fund seeks to provide medium to long-term capital appreciation. Dana Restu invests in Shariah-approved securities.
4. Lion Fixed Income Fund
A fund which invests in fixed income securities like government and corporate bonds (ranging from 40% to 95%) with the balance invested in cash and cash equivalent. This fund seeks to provide consistent return at low levels of volatility.
5. Lion Progressive Fund
A fund which invests in a mixture of equities (ranging from 50% to 90%) and fixed income securities. This fund seeks to provide medium to long-term capital appreciation, with a moderate-to-high level of volatility.
6. Dana Sejati* A fund which invests in Shariah approved debt
securities, for example government and corporate sukuk (ranging from 40% to 95%) with the balance invested in Islamic money market papers/deposits. This fund seeks to provide consistent return at low levels of volatility.
7. Lion Strategic Fund
A fund which invests in a mixture of equities, fixed income securities and money market instruments. There is flexibility in asset allocation as this fund may invest solely in fixed income securities or equities. This fund seeks to provide medium to long-term capital appreciation, with a moderate level of volatility.
8. Lion US-i Fund
A fund which is passively managed and aims to track the performance of S&P500 over the medium to long term (indexing strategy), which may be volatile in the short term. This fund seeks to provide medium to long-term capital appreciation.

6
9. Lion UK-i Fund
A fund which is passively managed and aims to track the performance of FTSE100 over the medium to long term (indexing strategy), which may be volatile in the short term. This fund seeks to provide medium to long-term capital appreciation.
10. Lion AU-i Fund
A fund which is passively managed and aims to track the performance of S&P/ASX200 over the medium to long term (indexing strategy), which may be volatile in the short term. This fund seeks to provide medium to long-term capital appreciation.
11. Centennial Max Fund (This fund matured on 15 July 2013)
A five-year closed-end fund which invests in a five-year structured product issued by OCBC Bank (Malaysia) Berhad. The product will provide 100% capital protection at maturity, and seeks to participate in positive returns generated by the Spectrum Long/Short Style Excess Return Index produced by BNP Paribas. At the inception date of 15 July 2008, approximately 90% of the product was invested in fixed income instrument while the remaining was in a call option based on the Spectrum Long/Short Style Excess Return Index.
12 Lion Asia Pac Fund
A feeder fund that aims to achieve long-term capital appreciation by investing primarily in the equities markets of the Asia Pacific (ex-Japan) region. The Fund invests in emerging and developed markets. There is no target industry or sector.
FUNDSOBJECTIVES
13 Lion Enhanced Equity Fund
A fund where 80% to 100% of the investments are in equities, which may be volatile in the short term. This fund seeks to achieve medium to long-term capital appreciation. Although the fund invests mainly in Malaysia (50% to 100%), it may also partially invest in Singapore (up to 25%) and Hong Kong (up to 25%), if and when necessary, to enhance the fund’s returns.
14 Dana Gemilang*
A fund where 80% to 100% of the investments are in equities, which may be volatile in the short term. This fund seeks to achieve medium to long-term capital appreciation. Although the fund invests mainly in Malaysia (50% to 100%), it may also partially invest in Singapore (up to 25%) and Hong Kong (up to 25%), if and when necessary, to enhance the fund’s returns. The fund only invests in Shariah-approved securities.
15 Smart Invest Gain Fund (New fund launched on 30 August 2013)
The fund is a 4-year closed-end fund, which invests in a 4-year Structured Product, embedded with an option linked to the performance of a volatility-controlled strategy on iShares MSCI All Country Asia ex-Japan Index Fund. The Fund aims to provide a guaranteed one-off coupon payment of 7.166% of Single Premium at the end of the 6th policy month and 100% capital guarantee at maturity. It also seeks to participate in a non-guaranteed upside return at maturity generated by the option. After deduction of Upfront Fee, the Fund invests 97.0% of the total collected premium in the Structured Product.
Note: * Although this fund invests in Shariah-approved securities,
the investment-linked insurance plan that utilises this fund is not classified as a Shariah-compliant product.

7GREAT EASTERN LIFE ASSURANCE (MALAYSIA) BERHAD
UNIT FUNDS ANNUAL REPORT 2013
INVESTMENT REVIEWAND OUTLOOK
2013 Equity Market Review
2013 was a positive year for equities asset class with MSCI World Index recorded +24.1% gain. We saw developed markets outperformed emerging markets, driven mainly by the economic recovery in the US and Eurozone. Concerns over the deteriorating current account and fiscal position of the Asean countries, and slower growth in China drove investors to position their funds in favour of the developed markets. Over in Asia, the Morgan Stanley Capital International Asia Ex Japan (“MSCI Asia Ex Japan”) ended the year up marginally higher, +0.7%. All the major Asian markets including Malaysia, recorded positive gain for the year except for China and Indonesia.
Domestically, Malaysia outperformed the region as the FTSE Bursa Malaysia Top 100 Index (“FBM100”) rose +11.4% during the year. The major political overhang was removed when the ruling coalition won the general election in May. In addition, the government’s commitment in strengthening our public finances by implementing subsidy rationalisation, GST and other fiscal consolidation efforts also contributed to the outperformance.
2013 Fixed Income Market Review
2013 was a volatile year for the domestic fixed income market. Early 2013, focus was on the political climate as Malaysia conducted one of its most challenging general elections in May. Nonetheless, sovereign and corporate bond markets were generally well supported in the first half of 2013, on the back of healthy demand supply dynamics and overall positive credit fundamentals. Market sentiment improved following the win by the existing ruling party for another term.
Moving into the second half of 2013, talks on possible tapering of U.S.’s asset purchase programme (i.e. Quantitative Easing: “QE3”) took the driving seat in guiding both international and domestic financial markets. While the U.S. economy has shown signs of sustainable growth in 2013, the Federal Reserve (“the Fed”) has been increasingly concerned over QE3’s marginal benefits and its potential cause of inflationary pressure in the long term. International financial markets started to price in expectations of QE3 tapering as soon as July, resulting in an upward shift in global sovereign yields on withdrawal of liquidity following the eventual scaling back of QE. Malaysian sovereign market was not spared with yields moving up amidst intensified expectations on timing and quantum of the QE tapering. Volatility increased markedly during the second half of the year.
In addition, revision of Malaysia’s sovereign rating outlook from Stable to Negative by Fitch Rating Agency further fueled upward pressure along the domestic sovereign yields. The negative rating outlook revision was due to Malaysia’s weaknesses in public finances and lack of budgetary reform by the federal government. These concerns were however, partially alleviated when the federal government announced a cut in fuel subsidy in September, reiterating its commitment to further reduce budget deficit as well as measures to broaden its tax revenue base including the long awaited implementation of Goods and Services Tax (“GST”) in 2015 in order to improve the national fiscal positions.
In December, the Fed finally announced the tapering of QE3 by reducing its bond purchase at USD10 bil per month to USD75 bil beginning January 2014. While the decision was largely priced in by the international and domestic fixed income markets, domestic sovereign yields continued to increase as investors demanded higher yields in anticipation of further upward shift in yields going into 2014. The Malaysian conventional sovereign 10-year benchmark yield closed the year 63 basis points (bps) higher at 4.14% from 3.51% as of end 2012. Meanwhile, Malaysia’s reference interest rate, the Overnight Policy Rate (“OPR”) ended 2013 unchanged at 3.00%.
Tracking the volatile domestic sovereign market, yields on corporate bonds increased across the tenure especially the AAA and AA rated papers, albeit at a much smaller magnitude. While sovereign yields shifted up by some 40-75 bps, the AAA and AA credit curves increased by about 25-45 bps and 20-40 bps respectively. The better performing corporate bond market was partly attributable to a muted primary market with fewer than expected new issuances. Net corporate bond issuances totaled RM4.9 bil in 2013, compared to RM19.4 bil in 2012. Some potential issuers were seen holding back as borrowing costs were creeping up amidst higher interest rate expectations. Scarce corporate bond supply provided support to the domestic corporate bond yields, resulting in credit spread tightening across all rating segments.

8
2014 Equity Market Outlook
Going into 2014, equities will continue to be the preferred asset class. Major central banks are expected to adopt an accommodative monetary policy as inflationary pressure remains tame. For the 1H2014, we expect the investor to turn cautious given the QE tapering commencement. However, we are unlikely to see a sharp selldown as most funds have already underweighted the Asian markets. We expect equities to perform relatively better in 2H2014 as developed countries economic recovery should gain momentum, hence a positive spillover into Asia.
Domestically, year-end Investors focus will be on the implementation of the structural reforms which is expected to weaken consumer sentiment and dampen profit margins of certain sectors. Other area of focus includes impact of the property cooling measures. The positives are Petronas spending on oil and gas sector to remain intact, continuity of some key infrastructure projects, and recovery of exporters on a stronger global economy. We are of the view that market downside is fairly limited given the strong domestic liquidity, lower political risk and fiscal concerns being addressed. The risk to our market view is sovereign rating downgrade and domestic fiscal measures implementation delay.
2014 Fixed Income Market Outlook
Domestic fixed income market will likely be driven by further QE tapering and inflationary concerns as the Malaysian government embarks on budgetary reforms. On the external front, while further reduction of asset-purchase is on the card as the U.S. economy continues to show signs of sustained recovery, Fed has also reiterated its stance to keep the Fed Fund rate low. Thus, while QE tapering may inevitably push yields higher going forward, prolonged low Fed Fund rate could moderate some upward pressure on U.S. Treasury yields.
On the local economic outlook, Malaysia’s growth prospect should be on track for a better 2014. An improved outlook for the world economy in general is expected to render better exports and contribute positively to domestic growth. While domestic demand may soften marginally on higher administered price expectation, it is likely to remain resilient, supported by healthy employment market. Meanwhile, Malaysian government’s commitment to improve its fiscal position via further subsidy rationalisation may exert pressure on domestic inflation. This is coupled with expectations of higher price adjustment effects with the eventual Goods and Services Tax (“GST”) implementation in 2015. However, given Bank Negara Malaysia (“BNM”)’s assessment on higher inflationary environment as largely driven by domestic cost factors, higher inflation numbers are unlikely to trigger any substantial change in BNM’s interest rate stance. With this backdrop, the OPR is expected to remain stable at 3.00% in 2014 with the possibility of a 25 bps increase should BNM adopt a pre-emptive measure to address potential multiplier impact of higher prices to the real domestic economy.
In short, yields on domestic bonds in general are expected to trend higher driven by the forth-coming QE tapering and the upward trend of domestic inflation numbers. On a more positive note however, healthy macro dynamics and improved country fiscal positions are expected to continue to support Malaysian sovereign ratings, hence sustaining the high foreign participation in the domestic sovereign bond market, especially the long-term structural positions.
INVESTMENT REVIEWAND OUTLOOK

9GREAT EASTERN LIFE ASSURANCE (MALAYSIA) BERHAD
UNIT FUNDS ANNUAL REPORT 2013
-5%
0%
5%
10%
15%
20%
25%
30%
1/1/
2013
1/2/
2013
1/3/
2013
1/4/
2013
1/5/
2013
1/6/
2013
1/7/
2013
1/8/
2013
1/9/
2013
1/10
/201
3
1/11
/201
3
1/12
/201
3
Dana Gemilang
Dana Gemilang
FBMS
-1%
0%
1%
2%
3%
01/0
1/20
13
16/0
1/20
13
31/0
1/20
13
15/0
2/20
13
02/0
3/20
13
17/0
3/20
13
01/0
4/20
13
16/0
4/20
13
01/0
5/20
13
16/0
5/20
13
31/0
5/20
13
15/0
6/20
13
30/0
6/20
13
15/0
7/20
13
Centennial Max Fund
Centennial Max
FD - 12 month
FUNDS PERFORMANCEYEAR 2013
CENTENNIAL MAX FUND
DANA GEMILANG
01/0
1/20
1301
/01/
2013
3%
30%
25%
20%
15%
10%
5%
0%
-5%
2%
1%
0%
-1%
16/0
1/20
1301
/02/
2013
01/0
3/20
1331
/01/
2013
01/0
4/20
13
01/0
5/20
13
01/0
6/20
13
01/0
7/20
13
01/0
8/20
13
01/0
9/20
13
01/1
0/20
13
01/1
1/20
13
01/1
2/20
13
15/0
2/20
13
02/0
3/20
13
17/0
3/20
13
01/0
4/20
13
16/0
4/20
13
01/0
5/20
13
16/0
5/20
13
31/0
5/20
13
15/0
6/20
13
30/0
6/20
13
15/0
7/20
13
Centennial Max
Dana Gemilang
FD-12 month
FBMS

10
0%
1%
2%
3%
4%
5%
1/1/
2013
1/2/
2013
1/3/
2013
1/4/
2013
1/5/
2013
1/6/
2013
1/7/
2013
1/8/
2013
1/9/
2013
1/10
/201
3
1/11
/201
3
1/12
/201
3
Dana Sejati Dana Sejati
Benchmark- 12 month Mudharabah Deposit
-5%
0%
5%
10%
15%
20%
1/1/
2013
1/2/
2013
1/3/
2013
1/4/
2013
1/5/
2013
1/6/
2013
1/7/
2013
1/8/
2013
1/9/
2013
1/10
/201
3
1/11
/201
3
1/12
/201
3
Dana Restu
Dana Restu
FBMS
FUNDS PERFORMANCEYEAR 2013
DANA RESTU
DANA SEJATI
01/0
1/20
13
20%
5%
4%
3%
2%
1%
0%
15%
10%
5%
0%
-5%
01/0
2/20
13
01/0
3/20
13
01/0
4/20
13
01/0
5/20
13
01/0
6/20
13
01/0
7/20
13
01/0
8/20
13
01/0
9/20
13
01/1
0/20
13
01/1
1/20
13
01/1
2/20
13
Dana Restu
Dana Sejati
FBMS
Benchmark - 12 month Mudharabah Deposit
01/0
1/20
13
01/0
2/20
13
01/0
3/20
13
01/0
4/20
13
01/0
5/20
13
01/0
6/20
13
01/0
7/20
13
01/0
8/20
13
01/0
9/20
13
01/1
0/20
13
01/1
1/20
13
01/1
2/20
13

11GREAT EASTERN LIFE ASSURANCE (MALAYSIA) BERHAD
UNIT FUNDS ANNUAL REPORT 2013
-15%
-10%
-5%
0%
5%
10%
15%
20%
25%
01/0
1/20
13
01/0
2/20
13
01/0
3/20
13
01/0
4/20
13
01/0
5/20
13
01/0
6/20
13
01/0
7/20
13
01/0
8/20
13
01/0
9/20
13
01/1
0/20
13
01/1
1/20
13
01/1
2/20
13
Lion AUI Fund
Lion AUI Fund
S&P / ASX 200 Index
-25%
-20%
-15%
-10%
-5%
0%
5%
10%
15%
20%
01/0
1/20
13
01/0
2/20
13
01/0
3/20
13
01/0
4/20
13
01/0
5/20
13
01/0
6/20
13
01/0
7/20
13
01/0
8/20
13
01/0
9/20
13
01/1
0/20
13
01/1
1/20
13
01/1
2/20
13
Lion Asia Pac Fund
Lion Asia Pac Fund
MSCI AC AP ex Japan
FUNDS PERFORMANCEYEAR 2013
LION ASIA PAC FUND
LION AU-i FUND
01/0
1/20
13
20%
25%
20%
15%
10%
5%
0%
-5%
-10%
-15%
10%
15%
5%
0%
-10%
-5%
-15%
-20%
-25%
01/0
2/20
13
01/0
3/20
13
01/0
4/20
13
01/0
5/20
13
01/0
6/20
13
01/0
7/20
13
01/0
8/20
13
01/0
9/20
13
01/1
0/20
13
01/1
1/20
13
01/1
2/20
13
Lion Asia Pac Fund
Lion AU-i Fund
MSCIAC AP ex Japan
S&P/ASX 200 Index
01/0
1/20
13
01/0
2/20
13
01/0
3/20
13
01/0
4/20
13
01/0
5/20
13
01/0
6/20
13
01/0
7/20
13
01/0
8/20
13
01/0
9/20
13
01/1
0/20
13
01/1
1/20
13
01/1
2/20
13
12
-5%
0%
5%
10%
15%
20%
25%
30%
35%
1/1/
2013
1/2/
2013
1/3/
2013
1/4/
2013
1/5/
2013
1/6/
2013
1/7/
2013
1/8/
2013
1/9/
2013
1/10
/201
3
1/11
/201
3
1/12
/201
3
Lion Enhanced Equity Fund
Lion Enhanced Equity Fund
FBM100
-5%
0%
5%
10%
15%
20%
25%
1/1/
2013
1/2/
2013
1/3/
2013
1/4/
2013
1/5/
2013
1/6/
2013
1/7/
2013
1/8/
2013
1/9/
2013
1/10
/201
3
1/11
/201
3
1/12
/201
3
Lion Balanced Fund
Lion Balanced Fund
Weighted Benchmark
Note :
Weighted Benchmark is derived from 50% weight on 12 months Fixed Deposits return and 50% weight on FBM100 index return
LION BALANCED FUND
LION ENHANCED EqUITY FUND
01/0
1/20
13
25%
35%
30%
20%
25%
10%
15%
0%
5%
-5%
20%
15%
10%
5%
0%
-5%
01/0
2/20
13
01/0
3/20
13
01/0
4/20
13
01/0
5/20
13
01/0
6/20
13
01/0
7/20
13
01/0
8/20
13
01/0
9/20
13
01/1
0/20
13
01/1
1/20
13
01/1
2/20
13
Lion Balanced Fund
Lion Enhanced Equity Fund
Weighted Benchmark
Note:
Weighted Benchmark is derived from 50% weight on 12 months Fixed Deposits return and 50% weight on FBM100 index return
FBM 100
01/0
1/20
13
01/0
2/20
13
01/0
3/20
13
01/0
4/20
13
01/0
5/20
13
01/0
6/20
13
01/0
7/20
13
01/0
8/20
13
01/0
9/20
13
01/1
0/20
13
01/1
1/20
13
01/1
2/20
13
FUNDS PERFORMANCEYEAR 2013

13GREAT EASTERN LIFE ASSURANCE (MALAYSIA) BERHAD
UNIT FUNDS ANNUAL REPORT 2013
FUNDS PERFORMANCEYEAR 2013
-5%
0%
5%
10%
15%
20%
1/1/
2013
1/2/
2013
1/3/
2013
1/4/
2013
1/5/
2013
1/6/
2013
1/7/
2013
1/8/
2013
1/9/
2013
1/10
/201
3
1/11
/201
3
1/12
/201
3
Lion Growth Fund
Lion Growth Fund
FBM100
0%
1%
1%
2%
2%
3%
3%
4%
01/0
1/20
13
01/0
2/20
13
01/0
3/20
13
01/0
4/20
13
01/0
5/20
13
01/0
6/20
13
01/0
7/20
13
01/0
8/20
13
01/0
9/20
13
01/1
0/20
13
01/1
1/20
13
01/1
2/20
13
Lion Fixed Income Fund
Lion Fixed Income Fund
Benchmark -12 month FD
LION FIXED INCOME FUND
LION GROWTH FUND
01/0
1/20
13
4%
20%
15%
10%
5%
0%
-5%
3%
3%
2%
2%
1%
1%
0%
01/0
2/20
13
01/0
3/20
13
01/0
4/20
13
01/0
5/20
13
01/0
6/20
13
01/0
7/20
13
01/0
8/20
13
01/0
9/20
13
01/1
0/20
13
01/1
1/20
13
01/1
2/20
13
Lion Fixed Income Fund
Lion Growth Fund
Benchmark - 12 month FD
FBM100
01/0
1/20
13
01/0
2/20
13
01/0
3/20
13
01/0
4/20
13
01/0
5/20
13
01/0
6/20
13
01/0
7/20
13
01/0
8/20
13
01/0
9/20
13
01/1
0/20
13
01/1
1/20
13
01/1
2/20
13

14
-5%
0%
5%
10%
15%
20%
1/1/
2013
1/2/
2013
1/3/
2013
1/4/
2013
1/5/
2013
1/6/
2013
1/7/
2013
1/8/
2013
1/9/
2013
1/10
/201
3
1/11
/201
3
1/12
/201
3
Lion Strategic Fund
Lion Strategic Fund
Weighted Benchmark
Note : Weighted Benchmark is derived from 50% weight on 12 months Fixed Deposits return and 50% weight on FBM100 index return
-5%
0%
5%
10%
15%
20%
01/0
1/20
13
01/0
2/20
13
01/0
3/20
13
01/0
4/20
13
01/0
5/20
13
01/0
6/20
13
01/0
7/20
13
01/0
8/20
13
01/0
9/20
13
01/1
0/20
13
01/1
1/20
13
01/1
2/20
13
Lion Progressive Fund
Lion Progressive Fund
FBM100
LION PROGRESSIvE FUND
LION STRATEGIC FUND
01/0
1/20
13
20%
20%
10%
15%
0%
5%
-5%
15%
10%
5%
0%
-5%
01/0
2/20
13
01/0
3/20
13
01/0
4/20
13
01/0
5/20
13
01/0
6/20
13
01/0
7/20
13
01/0
8/20
13
01/0
9/20
13
01/1
0/20
13
01/1
1/20
13
01/1
2/20
13
Lion Progressive Fund
Lion Strategic Fund
FBM100
Weighted Benchmark
01/0
1/20
13
01/0
2/20
13
01/0
3/20
13
01/0
4/20
13
01/0
5/20
13
01/0
6/20
13
01/0
7/20
13
01/0
8/20
13
01/0
9/20
13
01/1
0/20
13
01/1
1/20
13
01/1
2/20
13
Note:
Weighted Benchmark is derived from 50% weight on 12 months Fixed Deposits return and 50% weight on FBM100 index return
FUNDS PERFORMANCEYEAR 2013

15GREAT EASTERN LIFE ASSURANCE (MALAYSIA) BERHAD
UNIT FUNDS ANNUAL REPORT 2013
-5%
0%
5%
10%
15%
20%
25%
30%
35%
40%
45%
01/0
1/20
13
01/0
2/20
13
01/0
3/20
13
01/0
4/20
13
01/0
5/20
13
01/0
6/20
13
01/0
7/20
13
01/0
8/20
13
01/0
9/20
13
01/1
0/20
13
01/1
1/20
13
01/1
2/20
13
Lion USI Fund
Lion USI Fund
S&P 500 Index
-5%
0%
5%
10%
15%
20%
25%
30%
01/0
1/20
13
01/0
2/20
13
01/0
3/20
13
01/0
4/20
13
01/0
5/20
13
01/0
6/20
13
01/0
7/20
13
01/0
8/20
13
01/0
9/20
13
01/1
0/20
13
01/1
1/20
13
01/1
2/20
13
Lion UKI Fund
Lion UKI Fund
FTSE 100 Index
LION UK-i FUND
LION US-i FUND
01/0
1/20
13
30%
45%
40%
35%
30%
25%
20%
15%
10%
5%
0%
-5%
25%
20%
10%
15%
5%
0%
-5%
01/0
2/20
13
01/0
3/20
13
01/0
4/20
13
01/0
5/20
13
01/0
6/20
13
01/0
7/20
13
01/0
8/20
13
01/0
9/20
13
01/1
0/20
13
01/1
1/20
13
01/1
2/20
13
Lion UK-i Fund
Lion US-i Fund
FTSE 100 Index
S&P 500 Index
01/0
1/20
13
01/0
2/20
13
01/0
3/20
13
01/0
4/20
13
01/0
5/20
13
01/0
6/20
13
01/0
7/20
13
01/0
8/20
13
01/0
9/20
13
01/1
0/20
13
01/1
1/20
13
01/1
2/20
13
FUNDS PERFORMANCEYEAR 2013

16
SMART INvEST GAIN FUND
5%
0%
-5%
Smart Invest Gain Fund
Benchmark - 12 month FD
30/0
8/20
13
30/0
9/20
13
31/1
0/20
13
01/1
2/20
13
FUNDS PERFORMANCEYEAR 2013

STATEMENT OF COMPREHENSIVE INCOMEFor financial year ended 31 December 2013
CENTENNIAL MAX FUND DANA RESTU01.01.2013
to 15.07.2013
01.01.2012to
31.12.2012 2013 2012RM RM RM RM
Net Investment Income Interest Income Loans And Receivables ("LAR") 23,408 8,123 3,701,980 5,060,908 Cash And Cash Equivalents - - 372 417 Dividend Income Fair Value Through Profit Or Loss ("FVTPL") - Held For Trading
- - 22,999,662 19,108,217
Investment Expenses - - (2,320,030) (662,919)Net Gain On Disposal Of Securities 5,282,614 741,333 - 7,679,906 Net Unrealised Investment Gain - 12,646,052 107,857,859 48,528,223 Other Income - - - 695 Total Income 5,306,022 13,395,508 132,239,843 79,715,447
Management Expenses 1,198 2,706 8,844 8,596 Net Loss On Disposal Of Securities - - 1,011,417 - Investment Charge - - 11,074,855 9,284,885 Others - - 695 - Total Expenses 1,198 2,706 12,095,811 9,293,481
Excess Of Income Over Expenditure Before Taxation 5,304,824 13,392,802 120,144,032 70,421,966 Taxation (Note 9) (424,482) (1,071,641) (7,926,263) (4,186,667)
Excess Of Income Over Expenditure After Taxation, Representing Total Comprehensive Income For The Period/Year 4,880,342 12,321,161 112,217,769 66,235,299
17GREAT EASTERN LIFE ASSURANCE (MALAYSIA) BERHAD
UNIT FUNDS ANNUAL REPORT 2013
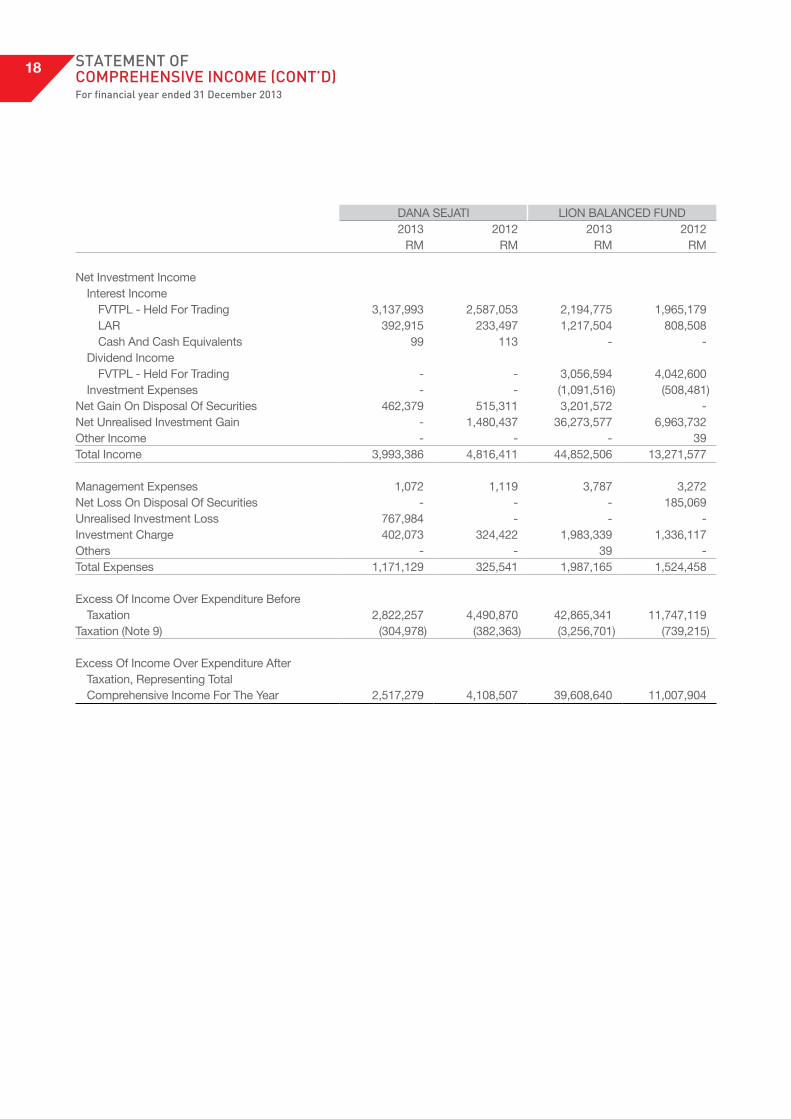
STATEMENT OF COMPREHENSIVE INCOME (CONT’D)For financial year ended 31 December 2013
DANA SEJATI LION BALANCED FUND2013 2012 2013 2012
RM RM RM RM
Net Investment Income Interest Income FVTPL - Held For Trading 3,137,993 2,587,053 2,194,775 1,965,179 LAR 392,915 233,497 1,217,504 808,508 Cash And Cash Equivalents 99 113 - - Dividend Income FVTPL - Held For Trading - - 3,056,594 4,042,600 Investment Expenses - - (1,091,516) (508,481)Net Gain On Disposal Of Securities 462,379 515,311 3,201,572 - Net Unrealised Investment Gain - 1,480,437 36,273,577 6,963,732 Other Income - - - 39 Total Income 3,993,386 4,816,411 44,852,506 13,271,577
Management Expenses 1,072 1,119 3,787 3,272 Net Loss On Disposal Of Securities - - - 185,069 Unrealised Investment Loss 767,984 - - - Investment Charge 402,073 324,422 1,983,339 1,336,117 Others - - 39 - Total Expenses 1,171,129 325,541 1,987,165 1,524,458
Excess Of Income Over Expenditure Before Taxation 2,822,257 4,490,870 42,865,341 11,747,119 Taxation (Note 9) (304,978) (382,363) (3,256,701) (739,215)
Excess Of Income Over Expenditure After Taxation, Representing Total Comprehensive Income For The Year 2,517,279 4,108,507 39,608,640 11,007,904
18

STATEMENT OF COMPREHENSIVE INCOME (CONT’D)For financial year ended 31 December 2013
LION FIXED INCOME FUND LION GROWTH FUND2013 2012 2013 2012
RM RM RM RM
Net Investment Income Interest Income FVTPL - Held For Trading 18,141,134 15,904,712 58,224 65,422 LAR 2,032,796 1,292,172 2,828,430 3,732,231 Dividend Income FVTPL - Held For Trading - - 22,927,520 20,893,877 Investment Expenses - - (1,845,205) (1,175,901)Net Gain On Disposal Of Securities 1,000,985 1,001,584 134,313 - Net Unrealised Investment Gain - 6,286,712 87,656,565 49,745,207 Other Income - 548 - 151 Total Income 21,174,915 24,485,728 111,759,847 73,260,987
Management Expenses 5,779 5,480 8,296 8,676 Net Loss On Disposal Of Securities - - - 895,202 Unrealised Investment Loss 2,149,891 - - - Investment Charge 2,350,990 1,910,151 9,907,372 8,590,711 Others 548 - 151 - Total Expenses 4,507,208 1,915,631 9,915,819 9,494,589
Excess Of Income Over Expenditure Before Taxation 16,667,707 22,570,097 101,844,028 63,766,398 Taxation (Note 9) (1,720,019) (1,980,777) (6,610,299) (3,694,069)
Excess Of Income Over Expenditure After Taxation, Representing Total Comprehensive Income For The Year 14,947,688 20,589,320 95,233,729 60,072,329
19GREAT EASTERN LIFE ASSURANCE (MALAYSIA) BERHAD
UNIT FUNDS ANNUAL REPORT 2013
STATEMENT OF COMPREHENSIVE INCOME (CONT’D)For financial year ended 31 December 2013
LION PROGRESSIVE FUND LION STRATEGIC FUND2013 2012 2013 2012
RM RM RM RM
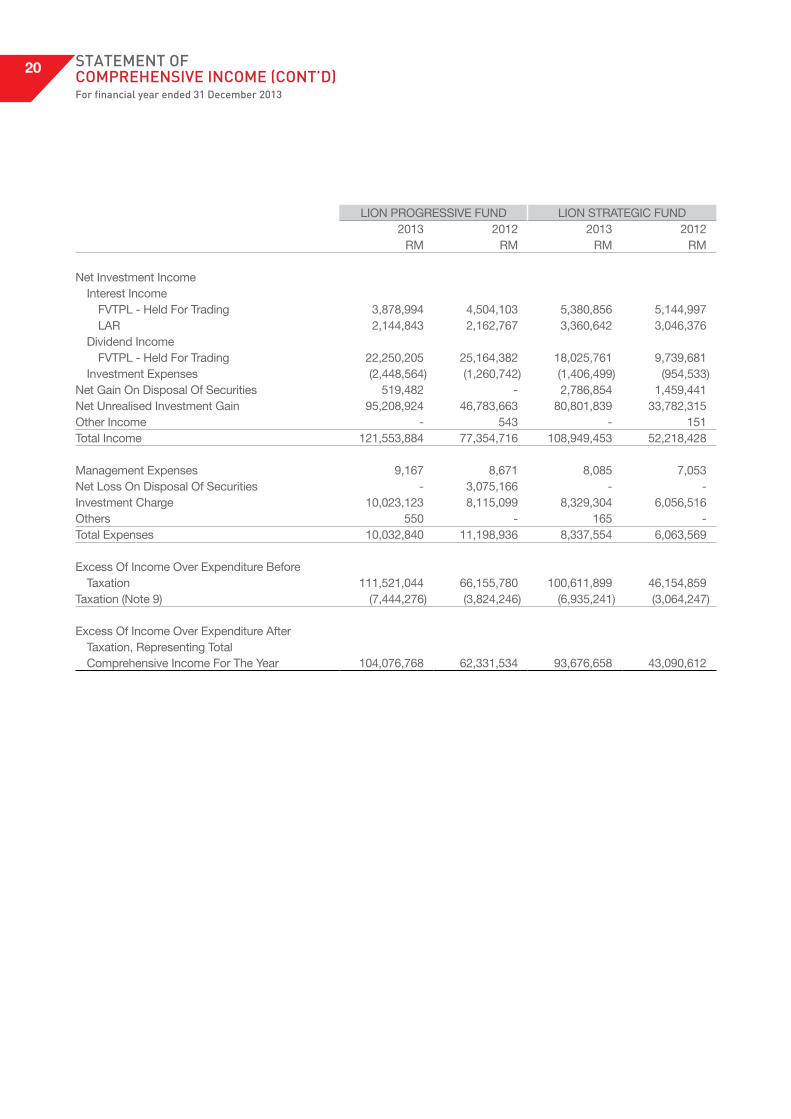
Net Investment Income Interest Income FVTPL - Held For Trading 3,878,994 4,504,103 5,380,856 5,144,997 LAR 2,144,843 2,162,767 3,360,642 3,046,376 Dividend Income FVTPL - Held For Trading 22,250,205 25,164,382 18,025,761 9,739,681 Investment Expenses (2,448,564) (1,260,742) (1,406,499) (954,533)Net Gain On Disposal Of Securities 519,482 - 2,786,854 1,459,441 Net Unrealised Investment Gain 95,208,924 46,783,663 80,801,839 33,782,315 Other Income - 543 - 151 Total Income 121,553,884 77,354,716 108,949,453 52,218,428
Management Expenses 9,167 8,671 8,085 7,053 Net Loss On Disposal Of Securities - 3,075,166 - - Investment Charge 10,023,123 8,115,099 8,329,304 6,056,516 Others 550 - 165 - Total Expenses 10,032,840 11,198,936 8,337,554 6,063,569
Excess Of Income Over Expenditure Before Taxation 111,521,044 66,155,780 100,611,899 46,154,859 Taxation (Note 9) (7,444,276) (3,824,246) (6,935,241) (3,064,247)
Excess Of Income Over Expenditure After Taxation, Representing Total Comprehensive Income For The Year 104,076,768 62,331,534 93,676,658 43,090,612
20

STATEMENT OF COMPREHENSIVE INCOME (CONT’D)For financial year ended 31 December 2013
LION US-I FUND LION UK-I FUND2013 2012 2013 2012
RM RM RM RM
Net Investment Income Interest Income LAR 752 265 - - Cash And Cash Equivalents - - 75 - Dividend Income FVTPL - Held For Trading 94,276 69,281 105,449 86,396 Investment Expenses (1,233) (613) (1,031) (932)Net Gain On Disposal Of Securities - - 1,347 - Net Unrealised Investment Gain 1,399,784 261,962 686,871 230,150 Other Income - - 3,225 - Total Income 1,493,579 330,895 795,936 315,614
Management Expenses 1,814 1,562 1,139 1,502 Net Loss On Disposal Of Securities 3,712 2,512 - 99 Investment Charge 31,323 22,686 22,770 18,377 Others 2,706 7,803 - 1,894 Total Expenses 39,555 34,563 23,909 21,872
Excess Of Income Over Expenditure Before Taxation 1,454,024 296,332 772,027 293,742 Taxation (Note 9) (144,237) (44,643) (60,698) (23,619)
Excess Of Income Over Expenditure After Taxation, Representing Total Comprehensive Income For The Year 1,309,787 251,689 711,329 270,123
21GREAT EASTERN LIFE ASSURANCE (MALAYSIA) BERHAD
UNIT FUNDS ANNUAL REPORT 2013

STATEMENT OF COMPREHENSIVE INCOME (CONT’D)For financial year ended 31 December 2013
LION AU-I FUND LION ASIA PAC FUND2013 2012 2013 2012
RM RM RM RM
Net Investment Income Interest Income LAR 14,128 6,562 6,460 6,247 Cash And Cash Equivalents 635 6,110 9,393 6,920 Dividend Income FVTPL - Held For Trading 434,927 367,139 - - Investment Expenses (30,698) (45,730) - - Net Gain On Disposal Of Securities 39,762 32,416 - 52,477 Net Unrealised Investment Gain 75,027 952,898 63,572 91,930 Total Income 533,781 1,319,395 79,425 157,574
Management Expenses 2,934 2,494 424 1,047 Net Loss On Disposal Of Securities - - 58,623 - Investment Charge 65,538 53,371 13,539 13,201 Others 63,634 93,699 26,631 37,178 Total Expenses 132,106 149,564 99,217 51,426
Excess Of Income Over Expenditure/ (Expenditure Over Income) Before Taxation 401,675 1,169,831 (19,792) 106,148 Taxation (Note 9) (33,589) (129,853) 2,345 (8,022)
Excess Of Income Over Expenditure/ (Expenditure Over Income) After Taxation, Representing Total Comprehensive Income For The Year 368,086 1,039,978 (17,447) 98,126
22

STATEMENT OF COMPREHENSIVE INCOME (CONT’D)For financial year ended 31 December 2013
LION ENHANCED EQUITY FUND DANA GEMILANG2013 2012 2013 2012
RM RM RM RM
Net Investment Income Interest Income FVTPL - Held For Trading 1,400 1,404 - - LAR 367,264 216,227 121,292 78,334 Cash And Cash Equivalents 242 - 135 150 Dividend Income FVTPL - Held For Trading 3,289,728 2,451,914 876,312 716,151 Investment Expenses (490,349) (326,422) (219,107) (56,264)Net Gain On Disposal Of Securities 348,444 - - - Net Unrealised Investment Gain 31,803,635 6,777,058 9,676,216 2,191,648 Other Income 86,763 5,020 38,521 245 Total Income 35,407,127 9,125,201 10,493,369 2,930,264
Management Expenses 2,764 1,667 1,160 707 Net Loss On Disposal Of Securities - 279,920 136,653 69,775 Investment Charge 1,791,322 854,152 532,388 279,770 Total Expenses 1,794,086 1,135,739 670,201 350,252
Excess Of Income Over Expenditure Before Taxation 33,613,041 7,989,462 9,823,168 2,580,012 Taxation (Note 9) (2,485,367) (492,149) (722,526) (159,741)
Excess Of Income Over Expenditure After Taxation, Representing Total Comprehensive Income For The Year 31,127,674 7,497,313 9,100,642 2,420,271
23GREAT EASTERN LIFE ASSURANCE (MALAYSIA) BERHAD
UNIT FUNDS ANNUAL REPORT 2013

STATEMENT OF COMPREHENSIVE INCOME (CONT’D)For financial year ended 31 December 2013
SMART INVEST GAIN FUND30.08.2013 to 31.12.2013
RM
Net Investment Income Interest Income LAR 27,208 Total Income 27,208
Management Expenses 104 Net Unrealised Investment Loss 741,000 Investment Charge 1 Total Expenses 741,105
Excess Of Expenditure Over Income Before Taxation (713,897)Taxation (Note 9) 57,103
Excess Of Expenditure Over Income After Taxation, Representing Total Comprehensive Income For The Period (656,794)
24

BALANCE SHEETAs at 31 December 2013
CENTENNIAL MAX FUND DANA RESTU15.07.2013 31.12.2012 2013 2012
RM RM RM RM
Assets Investments (Note 5) 235,500,000 231,471,822 886,196,186 725,927,342 Equity Securities - - 811,738,787 521,207,087 Financial Instruments With Embedded Derivatives - 231,171,822 3,988,762 1,802,539 Unit And Property Trust Funds - - 10,318,637 10,947,716 Deposits With Financial Institutions 235,500,000 300,000 60,150,000 191,970,000 Cash And Bank Balances 57,962 43,085 51,407 85,674 Other Assets (Note 7) 18,601 2,370,626 8,113,288 1,978,256 Total Assets 235,576,653 233,885,533 894,360,881 727,991,272
Liabilities Provision for Taxation 997,408 - 2,712,302 - Deferred Tax Liabilities (Note 6) 1,489 600,869 14,050,559 9,682,800 Financial Liabilities (Note 8) - - 19,327,681 3,633,746 Other Payables (Note 8) 3,794 2,284,663 33,591,090 27,337,987 Total Liabilities 1,002,691 2,885,532 69,681,632 40,654,533
Net Assets Value of Funds ("NAV") 234,573,872 231,000,001 824,679,249 687,336,739
EquityUnitholders' Capital 223,106,361 224,412,832 479,942,308 454,817,567 Undistributed Income 11,467,511 6,587,169 344,736,941 232,519,172 Total Equity 234,573,872 231,000,001 824,679,249 687,336,739
No. Of Units 234,198,507 235,474,006 279,268,286 268,490,914 NAV Per Unit 1.002 0.981 2.953 2.560
25GREAT EASTERN LIFE ASSURANCE (MALAYSIA) BERHAD
UNIT FUNDS ANNUAL REPORT 2013

BALANCESHEET (CONT’D)As at 31 December 2013
DANA SEJATI LION BALANCED FUND2013 2012 2013 2012
RM RM RM RM
Assets Investments (Note 5) 88,925,915 74,448,946 250,674,187 168,738,153 Malaysian Government Securities 10,610,045 11,697,470 - 5,993,867 Debt Securities 62,765,870 57,601,476 52,024,796 53,844,115 Equity Securities - - 133,075,609 76,143,894 Financial Instruments With Embedded Derivatives - - 3,183,782 1,539,497 Unit And Property Trust Funds - - - 3,926,780 Deposits With Financial Institutions 15,550,000 5,150,000 62,390,000 27,290,000 Cash And Bank Balances 172,639 27,105 60,964 24,996 Other Assets (Note 7) 2,167,446 2,074,054 6,406,123 4,791,683 Total Assets 91,266,000 76,550,105 257,141,274 173,554,832
Liabilities Provision for Taxation 1,669,586 1,289,923 3,625,770 1,900,791 Deferred Tax Liabilities (Note 6) 34,363 109,047 1,926,494 583,573 Financial Liabilities (Note 8) - - 2,996,835 3,242,233 Other Payables (Note 8) 355 8,144 2,628 37,871 Total Liabilities 1,704,304 1,407,114 8,551,727 5,764,468
Net Assets Value of Funds ("NAV") 89,561,696 75,142,991 248,589,547 167,790,364
EquityUnitholders' Capital 71,190,125 59,288,699 155,509,065 114,318,522 Undistributed Income 18,371,571 15,854,292 93,080,482 53,471,842 Total Equity 89,561,696 75,142,991 248,589,547 167,790,364
No. Of Units 47,740,776 41,332,778 67,790,986 55,837,060 NAV Per Unit 1.876 1.818 3.667 3.005
26

BALANCESHEET (CONT’D)As at 31 December 2013
LION FIXED INCOME FUND LION GROWTH FUND2013 2012 2013 2012
RM RM RM RM
Assets Investments (Note 5) 518,452,046 446,664,119 762,562,897 652,584,730 Malaysian Government Securities 42,205,000 49,723,753 - - Debt Securities 433,947,046 358,330,366 - - Equity Securities - - 720,430,169 456,123,014 Financial Instruments With Embedded Derivatives - - 4,123,060 1,737,208 Unit And Property Trust Funds - - 6,759,668 61,644,508 Deposits With Financial Institutions 42,300,000 38,610,000 31,250,000 133,080,000 Cash And Bank Balances 54,452 47,307 54,736 98,013 Other Assets (Note 7) 7,836,285 8,688,482 1,553,093 727,164 Total Assets 526,342,783 455,399,908 764,170,726 653,409,907
Liabilities Provision for Taxation 9,226,747 6,984,214 5,860,674 2,296,537 Deferred Tax Liabilities (Note 6) 299,849 822,364 9,811,913 7,685,483 Financial Liabilities (Note 8) - - 2,141,239 - Other Payables (Note 8) 111,097 128,576 141,635 317,523 Total Liabilities 9,637,693 7,935,154 17,955,461 10,299,543
Net Assets Value of Funds ("NAV") 516,705,090 447,464,754 746,215,265 643,110,364
EquityUnitholders' Capital 417,266,969 362,974,321 365,283,467 357,412,295 Undistributed Income 99,438,121 84,490,433 380,931,798 285,698,069 Total Equity 516,705,090 447,464,754 746,215,265 643,110,364
No. Of Units 218,664,871 195,484,821 368,683,432 364,575,036 NAV Per Unit 2.363 2.289 2.024 1.764
27GREAT EASTERN LIFE ASSURANCE (MALAYSIA) BERHAD
UNIT FUNDS ANNUAL REPORT 2013

BALANCESHEET (CONT’D)As at 31 December 2013
LION PROGRESSIVE FUND LION STRATEGIC FUND2013 2012 2013 2012
RM RM RM RM
Assets Investments (Note 5) 848,368,251 683,692,677 842,380,391 576,563,678 Malaysian Government Securities - 11,140,430 - 10,081,300 Debt Securities 45,007,096 119,507,630 76,071,596 152,427,250 Equity Securities 734,322,997 428,762,883 609,276,785 283,675,546 Financial Instruments With Embedded Derivatives 6,502,260 808,264 2,096,800 1,807,772 Unit And Property Trust Funds 3,245,898 59,893,470 46,235,210 37,451,810 Deposits With Financial Institutions 59,290,000 63,580,000 108,700,000 91,120,000 Cash And Bank Balances 63,769 105,573 66,740 34,432 Other Assets (Note 7) 4,291,329 2,610,174 6,658,509 7,556,769 Total Assets 852,723,349 686,408,424 849,105,640 584,154,879
Liabilities Provision for Taxation 3,305,299 670,985 3,759,919 2,532,186 Deferred Tax Liabilities (Note 6) 11,041,868 7,136,455 8,606,514 3,756,366 Financial Liabilities (Note 8) 1,416,499 - 29,702,142 1,083,134 Other Payables (Note 8) 880,740 1,634,370 3,045 65,241 Total Liabilities 16,644,406 9,441,810 42,071,620 7,436,927
Net Assets Value of Funds ("NAV") 836,078,943 676,966,614 807,034,020 576,717,952
EquityUnitholders' Capital 501,321,985 446,286,424 578,069,310 441,429,900 Undistributed Income 334,756,958 230,680,190 228,964,710 135,288,052 Total Equity 836,078,943 676,966,614 807,034,020 576,717,952
No. Of Units 218,069,625 202,806,056 347,260,766 284,798,988 NAV Per Unit 3.834 3.338 2.324 2.025
28

BALANCESHEET (CONT’D)As at 31 December 2013
LION US-I FUND LION UK-I FUND2013 2012 2013 2012
RM RM RM RM
Assets Investments (Note 5) 5,474,314 3,254,763 3,574,499 2,670,568 Equity Securities 5,474,314 3,254,763 3,574,499 2,670,568 Cash And Bank Balances 23,440 77,825 39,206 16,837 Other Assets (Note 7) 34,537 16,348 3,794 6,150 Total Assets 5,532,291 3,348,936 3,617,499 2,693,555
Liabilities Provision for Taxation 23,982 4,908 10,040 2,523 Deferred Tax Liabilities (Note 6) 128,766 31,887 59,110 5,929 Other Payables (Note 8) 20 91,718 14 84 Total Liabilities 152,768 128,513 69,164 8,536
Net Assets Value of Funds ("NAV") 5,379,523 3,220,423 3,548,335 2,685,019
EquityUnitholders' Capital 3,729,811 2,880,498 2,747,456 2,595,469 Undistributed Income 1,649,712 339,925 800,879 89,550 Total Equity 5,379,523 3,220,423 3,548,335 2,685,019
No. Of Units 4,255,951 3,519,588 3,353,815 3,181,302 NAV Per Unit 1.264 0.915 1.058 0.844
29GREAT EASTERN LIFE ASSURANCE (MALAYSIA) BERHAD
UNIT FUNDS ANNUAL REPORT 2013

BALANCESHEET (CONT’D)As at 31 December 2013
LION AU-I FUND LION ASIA PAC FUND2013 2012 2013 2012
RM RM RM RM
Assets Investments (Note 5) 10,020,671 9,034,626 899,392 1,584,284 Equity Securities 8,200,671 8,434,626 - - Unit And Property Trust Funds - - 899,392 1,584,284 Deposits With Financial Institutions 1,820,000 600,000 - - Cash And Bank Balances 50,611 83,549 76,320 22,802 Other Assets (Note 7) 2,276,527 224,290 13,509 9,562 Total Assets 12,347,809 9,342,465 989,221 1,616,648
Liabilities Provision for Taxation 78,096 45,896 - - Deferred Tax Liabilities (Note 6) 31,886 31,281 7,096 5,495 Other Payables (Note 8) 2,927,776 1,657,591 67,861 613,711 Total Liabilities 3,037,758 1,734,768 74,957 619,206
Net Assets Value of Funds ("NAV") 9,310,051 7,607,697 914,264 997,442
EquityUnitholders' Capital 8,125,461 6,791,193 968,873 1,034,604 Undistributed Income/(Deficit) 1,184,590 816,504 (54,609) (37,162)Total Equity 9,310,051 7,607,697 914,264 997,442
No. Of Units 8,440,663 6,891,030 1,344,505 1,280,414 NAV Per Unit 1.103 1.104 0.680 0.779
30

BALANCESHEET (CONT’D)As at 31 December 2013
LION ENHANCED EQUITY FUND DANA GEMILANG2013 2012 2013 2012
RM RM RM RM
Assets Investments (Note 5) 191,598,546 82,616,490 55,881,468 25,617,183 Equity Securities 171,374,926 63,140,656 48,970,067 21,305,188 Financial Instruments With Embedded Derivatives 288,536 96,924 86,683 93,821 Unit And Property Trust Funds 1,365,084 6,528,910 384,718 408,174 Deposits With Financial Institutions 18,570,000 12,850,000 6,440,000 3,810,000 Cash And Bank Balances 329,613 1,248,571 610,488 336,582 Other Assets (Note 7) 7,851,318 3,147,880 145,737 813,268 Total Assets 199,779,477 87,012,941 56,637,693 26,767,033
Liabilities Provision for Taxation 413,093 151,229 123,373 - Deferred Tax Liabilities (Note 6) 2,588,629 482,147 771,592 254,798 Financial Liabilities (Note 8) 351,439 861,928 1,869,144 - Other Payables (Note 8) 1,274 1,180 1,130,824 434 Total Liabilities 3,354,435 1,496,484 3,894,933 255,232
Net Assets Value of Funds ("NAV") 196,425,042 85,516,457 52,742,760 26,511,801
EquityUnitholders' Capital 152,880,860 73,099,949 39,792,657 22,662,340 Undistributed Income 43,544,182 12,416,508 12,950,103 3,849,461 Total Equity 196,425,042 85,516,457 52,742,760 26,511,801
No. Of Units 106,868,902 60,095,894 31,753,618 20,393,693 NAV Per Unit 1.838 1.423 1.661 1.300
31GREAT EASTERN LIFE ASSURANCE (MALAYSIA) BERHAD
UNIT FUNDS ANNUAL REPORT 2013

BALANCESHEET (CONT’D)As at 31 December 2013
SMART INVEST GAIN FUND2013
RM
Assets Investments (Note 5) 28,344,000 Financial Instruments With Embedded Derivatives 25,944,000 Deposits With Financial Institutions 2,400,000 Cash And Bank Balances 15,538 Deferred Tax Assets (Note 6) 57,148Other Assets (Note 7) 26,653Total Assets 28,443,339
LiabilitiesProvision for Taxation 45 Other Payables (Note 8) 3,294 Total Liabilities 3,339
Net Assets Value of Funds ("NAV") 28,440,000
EquityUnitholders' Capital 29,096,794 Undistributed Deficit (656,794)Total Equity 28,440,000
No. Of Units 30,000,000NAV Per Unit 0.948
32

STATEMENT OF CHANGES IN EqUITYFor financial year ended 31 December 2013
CENTENNIAL MAX FUNDUnitholders'
capitalUndistributed
(deficit)/income Total equityRM RM RM
At 1 January 2012 230,967,703 (5,733,992) 225,233,711 Total Comprehensive Income For The Year - 12,321,161 12,321,161 Amounts Paid For Units Cancelled (6,554,871) - (6,554,871)At 31 December 2012 224,412,832 6,587,169 231,000,001
At 1 January 2013 224,412,832 6,587,169 231,000,001 Total Comprehensive Income For The Period - 4,880,342 4,880,342 Amounts Paid For Units Cancelled (1,306,471) - (1,306,471)At 15 July 2013 223,106,361 11,467,511 234,573,872
DANA RESTUUnitholders'
capitalUndistributed
income Total equityRM RM RM
At 1 January 2012 404,698,949 166,283,873 570,982,822 Total Comprehensive Income For The Year - 66,235,299 66,235,299 Amounts Received From Units Created 88,522,489 - 88,522,489 Amounts Paid For Units Cancelled (38,403,871) - (38,403,871)At 31 December 2012 454,817,567 232,519,172 687,336,739
At 1 January 2013 454,817,567 232,519,172 687,336,739 Total Comprehensive Income For The Year - 112,217,769 112,217,769 Amounts Received From Units Created 82,981,203 - 82,981,203 Amounts Paid For Units Cancelled (57,856,462) - (57,856,462)At 31 December 2013 479,942,308 344,736,941 824,679,249
33GREAT EASTERN LIFE ASSURANCE (MALAYSIA) BERHAD
UNIT FUNDS ANNUAL REPORT 2013

STATEMENT OFCHANGES IN EqUITY (CONT’D)For financial year ended 31 December 2013
DANA SEJATIUnitholders'
capitalUndistributed
income Total equityRM RM RM
At 1 January 2012 49,000,617 11,745,785 60,746,402 Total Comprehensive Income For The Year - 4,108,507 4,108,507 Amounts Received From Units Created 15,730,109 - 15,730,109 Amounts Paid For Units Cancelled (5,442,027) - (5,442,027)At 31 December 2012 59,288,699 15,854,292 75,142,991
At 1 January 2013 59,288,699 15,854,292 75,142,991 Total Comprehensive Income For The Year - 2,517,279 2,517,279 Amounts Received From Units Created 18,721,484 - 18,721,484 Amounts Paid For Units Cancelled (6,820,058) - (6,820,058)At 31 December 2013 71,190,125 18,371,571 89,561,696
LION BALANCED FUNDUnitholders'
capitalUndistributed
income Total equityRM RM RM
At 1 January 2012 76,546,576 42,463,938 119,010,514 Total Comprehensive Income For The Year - 11,007,904 11,007,904 Amounts Received From Units Created 52,660,125 - 52,660,125 Amounts Paid For Units Cancelled (14,888,179) - (14,888,179)At 31 December 2012 114,318,522 53,471,842 167,790,364
At 1 January 2013 114,318,522 53,471,842 167,790,364 Total Comprehensive Income For The Year - 39,608,640 39,608,640 Amounts Received From Units Created 69,367,323 - 69,367,323 Amounts Paid For Units Cancelled (28,176,780) - (28,176,780)At 31 December 2013 155,509,065 93,080,482 248,589,547
34

STATEMENT OFCHANGES IN EqUITY (CONT’D)For financial year ended 31 December 2013
LION FIXED INCOME FUNDUnitholders'
capitalUndistributed
income Total equityRM RM RM
At 1 January 2012 288,999,397 63,901,113 352,900,510 Total Comprehensive Income For The Year - 20,589,320 20,589,320 Amounts Received From Units Created 114,144,163 - 114,144,163 Amounts Paid For Units Cancelled (40,169,239) - (40,169,239)At 31 December 2012 362,974,321 84,490,433 447,464,754
At 1 January 2013 362,974,321 84,490,433 447,464,754 Total Comprehensive Income For The Year - 14,947,688 14,947,688 Amounts Received From Units Created 103,709,482 - 103,709,482 Amounts Paid For Units Cancelled (49,416,834) - (49,416,834)At 31 December 2013 417,266,969 99,438,121 516,705,090
LION GROWTH FUNDUnitholders’
capitalUndistributed
income Total equityRM RM RM
At 1 January 2012 336,030,979 225,625,740 561,656,719 Total Comprehensive Income For The Year - 60,072,329 60,072,329 Amounts Received From Units Created 49,618,737 - 49,618,737 Amounts Paid For Units Cancelled (28,237,421) - (28,237,421)At 31 December 2012 357,412,295 285,698,069 643,110,364
At 1 January 2013 357,412,295 285,698,069 643,110,364 Total Comprehensive Income For The Year - 95,233,729 95,233,729 Amounts Received From Units Created 47,052,814 - 47,052,814 Amounts Paid For Units Cancelled (39,181,642) - (39,181,642)At 31 December 2013 365,283,467 380,931,798 746,215,265
35GREAT EASTERN LIFE ASSURANCE (MALAYSIA) BERHAD
UNIT FUNDS ANNUAL REPORT 2013

LION PROGRESSIVE FUNDUnitholders'
capitalUndistributed
income Total equityRM RM RM
At 1 January 2012 383,602,904 168,348,656 551,951,560 Total Comprehensive Income For The Year - 62,331,534 62,331,534 Amounts Received From Units Created 89,616,277 - 89,616,277 Amounts Paid For Units Cancelled (26,932,757) - (26,932,757)At 31 December 2012 446,286,424 230,680,190 676,966,614
At 1 January 2013 446,286,424 230,680,190 676,966,614 Total Comprehensive Income For The Year - 104,076,768 104,076,768 Amounts Received From Units Created 97,241,954 - 97,241,954 Amounts Paid For Units Cancelled (42,206,393) - (42,206,393)At 31 December 2013 501,321,985 334,756,958 836,078,943
LION STRATEGIC FUNDUnitholders'
capitalUndistributed
income Total equityRM RM RM
At 1 January 2012 335,359,628 92,197,440 427,557,068 Total Comprehensive Income For The Year - 43,090,612 43,090,612 Amounts Received From Units Created 140,896,860 - 140,896,860 Amounts Paid For Units Cancelled (34,826,588) - (34,826,588)At 31 December 2012 441,429,900 135,288,052 576,717,952
At 1 January 2013 441,429,900 135,288,052 576,717,952 Total Comprehensive Income For The Year - 93,676,658 93,676,658 Amounts Received From Units Created 184,433,811 - 184,433,811 Amounts Paid For Units Cancelled (47,794,401) - (47,794,401)At 31 December 2013 578,069,310 228,964,710 807,034,020
STATEMENT OFCHANGES IN EqUITY (CONT’D)For financial year ended 31 December 2013
36

LION US-I FUNDUnitholders'
capitalUndistributed
income Total equityRM RM RM
At 1 January 2012 2,660,776 88,236 2,749,012 Total Comprehensive Income For The Year - 251,689 251,689 Amounts Received From Units Created 467,564 - 467,564 Amounts Paid For Units Cancelled (247,842) - (247,842)At 31 December 2012 2,880,498 339,925 3,220,423
At 1 January 2013 2,880,498 339,925 3,220,423 Total Comprehensive Income For The Year - 1,309,787 1,309,787 Amounts Received From Units Created 1,487,623 - 1,487,623 Amounts Paid For Units Cancelled (638,310) - (638,310)At 31 December 2013 3,729,811 1,649,712 5,379,523
LION UK-I FUNDUnitholders'
capitalUndistributed
(deficit)/income Total equityRM RM RM
At 1 January 2012 2,517,622 (180,573) 2,337,049 Total Comprehensive Income For The Year - 270,123 270,123 Amounts Received From Units Created 281,712 - 281,712 Amounts Paid For Units Cancelled (203,865) - (203,865)At 31 December 2012 2,595,469 89,550 2,685,019
At 1 January 2013 2,595,469 89,550 2,685,019 Total Comprehensive Income For The Year - 711,329 711,329 Amounts Received From Units Created 487,651 - 487,651 Amounts Paid For Units Cancelled (335,664) - (335,664)At 31 December 2013 2,747,456 800,879 3,548,335
STATEMENT OFCHANGES IN EqUITY (CONT’D)For financial year ended 31 December 2013
37GREAT EASTERN LIFE ASSURANCE (MALAYSIA) BERHAD
UNIT FUNDS ANNUAL REPORT 2013

LION AU-I FUNDUnitholders'
capitalUndistributed
(deficit)/income Total equityRM RM RM
At 1 January 2012 8,383,570 (223,474) 8,160,096 Total Comprehensive Income For The Year - 1,039,978 1,039,978 Amounts Paid For Units Cancelled (1,592,377) - (1,592,377)At 31 December 2012 6,791,193 816,504 7,607,697
At 1 January 2013 6,791,193 816,504 7,607,697 Total Comprehensive Income For The Year - 368,086 368,086 Amounts Received From Units Created 2,750,406 - 2,750,406 Amounts Paid For Units Cancelled (1,416,138) - (1,416,138)At 31 December 2013 8,125,461 1,184,590 9,310,051
LION ASIA PAC FUNDUnitholders'
capitalUndistributed
(deficit)/income Total equityRM RM RM
At 1 January 2012 1,006,931 (135,288) 871,643 Total Comprehensive Income For The Year - 98,126 98,126 Amounts Received From Units Created 145,400 - 145,400 Amounts Paid For Units Cancelled (117,727) - (117,727)At 31 December 2012 1,034,604 (37,162) 997,442
At 1 January 2013 1,034,604 (37,162) 997,442 Total Comprehensive Income For The Year - (17,447) (17,447)Amounts Received From Units Created 285,944 - 285,944 Amounts Paid For Units Cancelled (351,675) - (351,675)At 31 December 2013 968,873 (54,609) 914,264
STATEMENT OFCHANGES IN EqUITY (CONT’D)For financial year ended 31 December 2013
38

LION ENHANCED EQUITY FUNDUnitholders'
capitalUndistributed
income Total equityRM RM RM
At 1 January 2012 42,048,518 4,919,195 46,967,713 Total Comprehensive Income For The Year - 7,497,313 7,497,313 Amounts Received From Units Created 45,057,884 - 45,057,884 Amounts Paid For Units Cancelled (14,006,453) - (14,006,453)At 31 December 2012 73,099,949 12,416,508 85,516,457
At 1 January 2013 73,099,949 12,416,508 85,516,457 Total Comprehensive Income For The Year - 31,127,674 31,127,674 Amounts Received From Units Created 103,146,577 - 103,146,577 Amounts Paid For Units Cancelled (23,365,666) - (23,365,666)At 31 December 2013 152,880,860 43,544,182 196,425,042
DANA GEMILANGUnitholders'
capitalUndistributed
income Total equityRM RM RM
At 1 January 2012 14,424,705 1,429,190 15,853,895 Total Comprehensive Income For The Year - 2,420,271 2,420,271 Amounts Received From Units Created 12,212,465 - 12,212,465 Amounts Paid For Units Cancelled (3,974,830) - (3,974,830)At 31 December 2012 22,662,340 3,849,461 26,511,801
At 1 January 2013 22,662,340 3,849,461 26,511,801 Total Comprehensive Income For The Year - 9,100,642 9,100,642 Amounts Received From Units Created 22,987,963 - 22,987,963 Amounts Paid For Units Cancelled (5,857,646) - (5,857,646)At 31 December 2013 39,792,657 12,950,103 52,742,760
SMART INVEST GAIN FUNDUnitholders'
capitalUndistributed
deficit Total equityRM RM RM
At 30 August 2013 - - - Total Comprehensive Income For The Period - (656,794) (656,794)Amounts Received From Units Created 29,100,000 - 29,100,000 Amounts Paid For Units Cancelled (3,206) - (3,206)At 31 December 2013 29,096,794 (656,794) 28,440,000
STATEMENT OFCHANGES IN EqUITY (CONT’D)For financial year ended 31 December 2013
39GREAT EASTERN LIFE ASSURANCE (MALAYSIA) BERHAD
UNIT FUNDS ANNUAL REPORT 2013

CENTENNIAL MAX FUND DANA RESTU01.01.2013
to15.07.2013
01.01.2012to
31.12.2012 2013 2012 RM RM RM RM
Cash Flows From Operating ActivitiesExcess of Income Over Expenditure Before Taxation 5,304,824 13,392,802 120,144,032 70,421,966 Adjustments for: Unrealised Investment Gain - (12,646,052) (107,857,859) (48,528,223) (Gain)/Loss On Disposal Of Investments (5,282,614) (741,333) 1,011,417 (7,679,906) Gross Dividend Income - - (22,999,662) (19,108,217) Interest Income (23,408) (8,123) (3,701,980) (5,060,908) Cash and Cash Equivalents Interest Income - - (372) (417)Excess of Expenditure Over Income From Operations Before Changes In Operating Assets And Liabilities (1,198) (2,706) (13,404,424) (9,955,705)Net Proceeds From Disposal/(Purchase) of Investments 236,454,435 6,677,268 (185,242,404) (20,726,880)(Increase)/Decrease In Deposits With Financial Institutions (235,200,000) (80,000) 131,820,000 (50,800,000)Decrease In Amount Due From Life Fund - - - 140,719 (Decrease)/Increase In Amount Due To Life Fund (2,275,015) 2,103,300 849,794 - Decrease/(Increase) In Amount Due From Brokers 2,344,148 (2,168,979) (5,548,442) - Increase In Amount Due To Brokers - - 15,693,935 3,633,746 Increase In Outstanding Claims - - 5,991,710 3,650,170 (Decrease)/Increase In Amount Due To Intermediaries - - (61,352) 61,352 (Decrease)/Increase In Sundry Payables (5,854) 2,597 (19,600) 7,498 Cash Generated From/(Used In) Operations 1,316,516 6,531,480 (49,920,783) (73,989,100)Dividend Received - - 20,903,164 18,918,775 Interest Received 4,832 8,115 3,858,611 4,979,389 Net Cash Generated From/(Used In) Operating Activities 1,321,348 6,539,595 (25,159,008) (50,090,936)
Cash Flows From Financing ActivitiesCreation Of Units - - 82,981,203 88,522,489 Cancellation Of Units (1,306,471) (6,554,871) (57,856,462) (38,403,871)Net Cash (Used In)/Generated From Financing Activities (1,306,471) (6,554,871) 25,124,741 50,118,618
Net (Decrease)/Increase In Cash And Bank Balances 14,877 (15,276) (34,267) 27,682 Cash And Bank Balances At Beginning Of Year 43,085 58,361 85,674 57,992 Cash And Bank Balances At End Of Year 57,962 43,085 51,407 85,674
CASH FLOWSTATEMENT For financial year ended 31 December 2013
40

CASH FLOWSTATEMENT (CONT’D)For financial year ended 31 December 2013
DANA SEJATI LION BALANCED FUND2013 2012 2013 2012 RM RM RM RM
Cash Flows From Operating ActivitiesExcess of Income Over Expenditure Before Taxation 2,822,257 4,490,870 42,865,341 11,747,119 Adjustments for: Unrealised Investment Loss/(Gain) 767,984 (1,480,437) (36,273,577) (6,963,732) (Gain)/Loss On Disposal Of Investments (462,379) (515,311) (3,201,572) 185,069 Gross Dividend Income - - (3,056,594) (4,042,600) Interest Income (3,530,908) (2,820,550) (3,412,279) (2,773,687) Cash and Cash Equivalents Interest Income (99) (113) - - Excess of Expenditure Over Income From Operations Before Changes In Operating Assets And Liabilities (403,145) (325,541) (3,078,681) (1,847,831)Net Purchase of Investments (4,382,575) (23,741,625) (7,360,885) (79,402,414)(Increase)/Decrease In Deposits With Financial Institutions (10,400,000) 11,430,000 (35,100,000) 38,420,000 Increase In Amount Due From Life Fund (28,641) (315,775) (2,142,831) (2,157,237)Decrease/(Increase) In Amount Due From Brokers - - 240,934 (571,603)(Decrease)/Increase In Amount Due To Brokers - - (245,398) 1,889,099 Increase In Outstanding Claims - - 307 109 (Decrease)/Increase In Amount Due To Intermediaries (5,979) 5,979 (32,333) 32,333 (Decrease)/Increase In Sundry Payables (1,810) 758 (3,217) 1,570 Cash Used In Operations (15,222,150) (12,946,204) (47,722,104) (43,635,974)Dividend Received - - 2,759,554 3,709,963 Interest Received 3,466,258 2,631,287 3,807,9745 2,117,566 Net Cash Used In Operating Activities (11,755,892) (10,314,917) (41,154,575) (37,808,445)
Cash Flows From Financing ActivitiesCreation Of Units 18,721,484 15,730,109 69,367,323 52,660,125 Cancellation Of Units (6,820,058) (5,442,027) (28,176,780) (14,888,179)Net Cash Generated From Financing Activities 11,901,426 10,288,082 41,190,543 37,771,946
Net Increase/(Decrease) In Cash And Bank Balances 145,534 (26,835) 35,968 (36,499)Cash And Bank Balances At Beginning Of Year 27,105 53,940 24,996 61,495 Cash And Bank Balances At End Of Year 172,639 27,105 60,964 24,996
41GREAT EASTERN LIFE ASSURANCE (MALAYSIA) BERHAD
UNIT FUNDS ANNUAL REPORT 2013

CASH FLOWSTATEMENT (CONT’D)For financial year ended 31 December 2013
LION FIXED INCOME FUND LION GROWTH FUND2013 2012 2013 2012 RM RM RM RM
Cash Flows From Operating ActivitiesExcess of Income Over Expenditure Before Taxation 16,667,707 22,570,097 101,844,028 63,766,398 Adjustments for: Unrealised Investment Loss/(Gain) 2,149,891 (6,286,712) (87,656,565) (49,745,207) (Gain)/Loss On Disposal Of Investments (1,000,985) (1,001,584) (134,313) 895,202 Gross Dividend Income - - (22,927,520) (20,893,877) Interest Income (20,173,930) (17,196,884) (2,886,654) (3,797,653)Excess of Expenditure Over Income From Operations Before Changes In Operating Assets And Liabilities (2,357,317) (1,915,083) (11,761,024) (9,775,137)Net Purchase of Investments (69,246,834) (119,996,771) (124,017,290) (29,593,251)(Increase)/Decrease In Deposits With Financial Institutions (3,690,000) 34,670,000 101,830,000 (5,210,000)Decrease/(Increase) In Amount Due From Life Fund 1,654,484 (2,971,473) - -(Decrease)/Increase In Amount Due To Life Fund - - (10,670) 572,578Increase/(Decrease) In Amount Due To Brokers - - 2,141,239 (1,568,172)Increase In Outstanding Claims 3,415 5,363 - - (Decrease)/Increase In Amount Due To Intermediaries (10,500) 10,500 (146,334) 146,334 (Decrease)/Increase In Sundry Payables (10,394) 4,455 (18,884) 7,000 Cash Used In Operations (73,657,146) (90,193,009) (31,982,963) (45,420,648)Dividend Received - - 21,038,058 20,297,964 Interest Received 19,371,643 16,205,702 3,030,456 3,769,660 Net Cash Used In Operating Activities (54,285,503) (73,987,307) (7,914,449) (21,353,024)
Cash Flows From Financing ActivitiesCreation Of Units 103,709,482 114,144,163 47,052,814 49,618,737 Cancellation Of Units (49,416,834) (40,169,239) (39,181,642) (28,237,421)Net Cash Generated From Financing Activities 54,292,648 73,974,924 7,871,172 21,381,316
Net Increase/(Decrease) In Cash And Bank Balances 7,145 (12,383) (43,277) 28,292 Cash And Bank Balances At Beginning Of Year 47,307 59,690 98,013 69,721 Cash And Bank Balances At End Of Year 54,452 47,307 54,736 98,013
42

CASH FLOWSTATEMENT (CONT’D)For financial year ended 31 December 2013
LION PROGRESSIVE FUND LION STRATEGIC FUND2013 2012 2013 2012 RM RM RM RM
Cash Flows From Operating ActivitiesExcess of Income Over Expenditure Before Taxation 111,521,044 66,155,780 100,611,899 46,154,859 Adjustments for: Unrealised Investment Gain (95,208,924) (46,783,663) (80,801,839) (33,782,315) (Gain)/Loss On Disposal Of Investments (519,482) 3,075,166 (2,786,854) (1,459,441) Gross Dividend Income (22,250,205) (25,164,382) (18,025,761) (9,739,681) Interest Income (6,023,837) (6,666,870) (8,741,498) (8,191,373)Excess of Expenditure Over Income From Operations Before Changes In Operating Assets And Liabilities (12,481,404) (9,383,969) (9,744,053) (7,017,951)Net Purchase of Investments (73,237,168) (200,880,534) (164,648,020) (229,199,032)Decrease/(Increase) In Deposits With Financial Institutions 4,290,000 118,290,000 (17,580,000) 113,850,000 Increase In Amount Due From Life Fund (2,851,828) - (1,211,397) (1,107,661)Increase In Amount Due To Life Fund - 2,138,769 - - (Increase)/Decrease In Amount Due From Brokers (932,556) (26,418) 2,009,756 105,705 Increase/(Decrease) In Amount Due To Brokers 1,416,499 (1,566,716) 28,619,008 1,083,134 Increase In Outstanding Claims 128,069 178,996 - - Decrease/(Increase) In Amount Due From Intermediaries 7 (7) - - (Decrease)/Increase in Amount Due To Intermediaries - - (50,332) 50,330 (Decrease)/Increase In Sundry Payables (17,240) 7,047 (11,865) 5,639 Cash Used In Operations (83,685,621) (91,242,832) (162,616,903) (122,229,836)Dividend Received 21,189,122 23,582,207 16,543,124 9,297,976 Interest Received 7,419,134 5,001,762 9,466,677 6,829,628 Net Cash Used In Operating Activities (55,077,365) (62,658,863) (136,607,102) (106,102,232)
Cash Flows From Financing ActivitiesCreation Of Units 97,241,954 89,616,277 184,433,811 140,896,860 Cancellation Of Units (42,206,393) (26,932,757) (47,794,401) (34,826,588)Net Cash Generated From Financing Activities 55,035,561 62,683,520 136,639,410 106,070,272
Net (Decrease)/Increase In Cash And Bank Balances (41,804) 24,657 32,308 (31,960)Cash And Bank Balances At Beginning Of Year 105,573 80,916 34,432 66,392 Cash And Bank Balances At End Of Year 63,769 105,573 66,740 34,432
43GREAT EASTERN LIFE ASSURANCE (MALAYSIA) BERHAD
UNIT FUNDS ANNUAL REPORT 2013

LION US-I FUND LION UK-I FUND2013 2012 2013 2012 RM RM RM RM
Cash Flows From Operating ActivitiesExcess of Income Over Expenditure Before Taxation 1,454,024 296,332 772,027 293,742 Adjustments for: Unrealised Investment Gain (1,399,784) (261,962) (686,871) (230,150) Loss/(Gain) On Disposal Of Investments 3,712 2,512 (1,347) 99 Gross Dividend Income (94,276) (69,281) (105,449) (86,396) Interest Income (752) (265) - - Other Investment Income - - (75) -Excess of Expenditure Over Income From Operations Before Changes In Operating Assets And Liabilities (37,076) (32,664) (21,715) (22,705)Net Purchase of Investments (823,481) (324,417) (215,713) (238,576)(Increase)/Decrease In Amount Due From Life Fund (105,759) - 2,355 (315,878)Decrease In Amount Due To Life Fund - (257,884) - -(Decrease)/Increase In Sundry Payables (97) 36 (70) 28 Cash Used In Operations (966,413) (614,929) (235,143) (577,131)Dividend Received 61,964 44,871 105,450 86,396 Interest Received 751 265 75 - Net Cash Used In Operating Activities (903,698) (569,793) (129,618) (490,735)
Cash Flows From Financing ActivitiesCreation Of Units 1,487,623 467,564 487,651 281,712 Cancellation Of Units (638,310) (247,842) (335,664) (203,865)Net Cash Generated From Financing Activities 849,313 219,722 151,987 77,847
Net (Decrease)/Increase In Cash And Bank Balances (54,385) (350,071) 22,369 (412,888)Cash And Bank Balances At Beginning Of Year 77,825 427,896 16,837 429,725 Cash And Bank Balances At End Of Year 23,440 77,825 39,206 16,837
CASH FLOWSTATEMENT (CONT’D)For financial year ended 31 December 2013
44

LION AU-I FUND LION ASIA PAC FUND2013 2012 2013 2012 RM RM RM RM
Cash Flows From Operating ActivitiesExcess of Income Over Expenditure/ (Expenditure Over Income) Before Taxation 401,675 1,169,831 (19,792) 106,148 Adjustments for: Unrealised Investment Gain (75,027) (952,898) (63,572) (91,930) (Gain)/Loss On Disposal Of Investments (39,762) (32,416) 58,623 (52,477) Gross Dividend Income (434,927) (367,139) - - Interest Income (14,128) (6,562) (6,460) (6,247) Cash and cash equivalents interest income (635) (6,110) (9,393) (6,920)Excess of Expenditure Over Income From Operations Before Changes In Operating Assets And Liabilities (162,804) (195,294) (40,594) (51,426)Net Proceeds From Disposal/(Purchase) of Investments 348,747 (391,676) 689,841 (607,148)(Increase)/Decrease In Deposits With Financial Institutions (1,220,000) (600,000) - 170,000 Increase/(Decrease) In Amount Due To Life Fund 1,265,185 1,665,490 (545,827) 629,410Increase In Amount Due From Brokers (2,018,241) (1) - - Decrease In Amount Due To Brokers - (94,205) - (209,467)Increase/(Decrease) In Sundry Payables 4,999 82 (24) 10 Cash (Used In)/Generated From Operations (1,782,114) 384,396 103,396 (68,621)Dividend Received 400,125 301,915 - - Interest Received 14,783 12,473 15,853 13,181 Net Cash (Used In)/Generated From Operating Activities (1,367,206) 698,784 119,249 (55,440)
Cash Flows From Financing ActivitiesCreation Of Units 2,750,406 - 285,944 145,400 Cancellation Of Units (1,416,138) (1,592,377) (351,675) (117,727)Net Cash Generated From/(Used In) Financing Activities 1,334,268 (1,592,377) (65,731) 27,673
Net (Decrease)/Increase In Cash And Bank Balances (32,938) (893,593) 53,518 (27,767)Cash And Bank Balances At Beginning Of Year 83,549 977,142 22,802 50,569 Cash And Bank Balances At End Of Year 50,611 83,549 76,320 22,802
CASH FLOWSTATEMENT (CONT’D)For financial year ended 31 December 2013
45GREAT EASTERN LIFE ASSURANCE (MALAYSIA) BERHAD
UNIT FUNDS ANNUAL REPORT 2013

LION ENHANCED EQUITY FUND DANA GEMILANG2013 2012 2013 2012 RM RM RM RM
Cash Flows From Operating ActivitiesExcess of Income Over Expenditure Before Taxation 33,613,041 7,989,462 9,823,168 2,580,012 Adjustments for: Unrealised Investment Gain (31,803,635) (6,777,058) (9,676,216) (2,191,648) (Gain)/Loss On Disposal Of Investments (348,444) 279,920 136,653 69,775 Gross Dividend Income (3,289,728) (2,451,914) (876,312) (716,151) Interest Income (368,664) (217,631) (121,292) (78,334) Cash and cash equivalents interest income (242) - (135) (150)Excess of Expenditure Over Income From Operations Before Changes In Operating Assets And Liabilities (2,197,672) (1,177,221) (714,134) (336,496)Net Purchase of Investments (71,109,976) (22,746,857) (18,094,721) (6,368,904)Increase In Deposits With Financial Institutions (5,720,000) (3,870,000) (2,630,000) (610,000)(Increase)/Decrease In Amount Due From Life Fund (4,541,385) (2,861,147) - (348,471)Increase In Amount Due To Life Fund - - 1,855,876 -Decrease/(Increase) In Amount Due From Brokers 2 (3) - - (Decrease)/Increase In Amount Due To Brokers (510,489) (3,554,920) 1,869,144 (1,075,899)Decrease/(Increase) In Amount Due From Intermediaries 20 (20) - - Increase/(Decrease) In Sundry Payables 94 657 (98) 215 Cash Used In Operations (84,079,406) (34,209,511) (17,713,933) (8,739,555)Dividend Received 3,010,993 2,334,931 735,639 673,606 Interest Received 368,544 215,520 121,883 77,291 Net Cash Used In Operating Activities (80,699,869) (31,659,060) (16,856,411) (7,988,658)
Cash Flows From Financing ActivitiesCreation Of Units 103,146,577 45,057,884 22,987,963 12,212,465 Cancellation Of Units (23,365,666) (14,006,453) (5,857,646) (3,974,830)Net Cash Generated From Financing Activities 79,780,911 31,051,431 17,130,317 8,237,635
Net (Decrease)/Increase In Cash And Bank Balances (918,958) (607,629) 273,906 248,977 Cash And Bank Balances At Beginning Of Year 1,248,571 1,856,200 336,582 87,605 Cash And Bank Balances At End Of Year 329,613 1,248,571 610,488 336,582
CASH FLOWSTATEMENT (CONT’D)For financial year ended 31 December 2013
46

SMART INVEST GAIN FUND 30.08.2013 to 31.12.2013
RM
Cash Flows From Operating ActivitiesExcess of Expenditure Over Income Before Taxation (713,897)Adjustments for: Unrealised Investment Loss 741,000 Interest Income (27,208)Excess of Expenditure Over Income From Operations Before Changes In Operating Assets And Liabilities (105)Net Purchase of Investments (26,685,000)Increase In Deposits With Financial Institutions (2,400,000)Increase In Amount Due To Life Fund 3,207 Increase In Sundry Payables 87 Cash Used In Operations (29,081,811)Interest Received 555 Net Cash Used In Operating Activities (29,081,256)
Cash Flows From Financing ActivitiesCreation Of Units 29,100,000 Cancellation Of Units (3,206)Net Cash Generated From Financing Activities 29,096,794
Net Increase In Cash And Bank Balances 15,538 Cash And Bank Balances At Beginning Of Period - Cash And Bank Balances At End Of Period 15,538
CASH FLOWSTATEMENT (CONT’D)For financial year ended 31 December 2013
47GREAT EASTERN LIFE ASSURANCE (MALAYSIA) BERHAD
UNIT FUNDS ANNUAL REPORT 2013

DETAILS OFINVESTMENT As at 31 December 2013
Dana RestuDetails of Investment as at 31 December 2013
Quantity Held Cost Market Value
MarketValue as a% of NAV
EQUITY SECURITIES (in unit of shares) (RM) (RM) (%)
Building Materials / Construction 29,270,105 110,739,156 116,352,265 14.11% GAMUDA BHD 11,000,000 49,162,730 52,800,000 6.40% IJM CORPORATION BHD 6,500,320 32,822,272 38,221,882 4.63% MUHIBBAH ENGINEERING M BHD 7,000,300 16,563,959 15,960,684 1.94% SOUTHERN STEEL BHD 627,300 1,011,007 878,220 0.11% WCT HOLDINGS BHD 4,142,185 11,179,188 8,491,479 1.03%Conglomerates 9,089,730 56,590,183 59,823,040 7.25% DRB-HICOM BHD 2,995,700 8,423,617 8,447,874 1.02% MMC CORPORATION BHD 1,000,000 2,907,100 2,880,000 0.35% SIME DARBY BHD 5,094,030 45,259,466 48,495,166 5.88%Media 3,500,000 6,813,149 5,295,000 0.65% MEDIA CHINESE INT'L LTD 2,000,000 1,588,000 1,950,000 0.24% STAR PUBLICATIONS M BHD 1,500,000 5,225,149 3,345,000 0.41%Others 20,949,600 85,001,633 113,208,498 13.72% HARTALEGA HOLDINGS BHD 4,966,600 23,494,566 35,908,518 4.35% KOSSAN RUBBER INDUSTRIES BHD 10,000,000 31,960,141 43,200,000 5.24% MBM RESOURCES BHD 4,300,000 16,280,793 13,803,000 1.67% UMW HOLDINGS BHD 1,683,000 13,266,133 20,296,980 2.46%Petroleum, Chemical & Gas 52,161,012 148,449,130 208,253,422 25.25% ALAM MARITIM RESOURCES BHD 2,000,000 1,061,701 3,140,000 0.38% BUMI ARMADA BHD 2,000,000 7,900,459 8,060,000 0.98% DAYANG ENTERPRISE HOLDINGS BHD 5,654,100 24,248,368 32,737,239 3.97% DIALOG GROUP BHD 8,500,037 13,095,817 30,430,132 3.69% M'SIA MARINE & HEAVY ENG HLDGS 10,000,000 38,669,527 35,000,000 4.24% PERISAI PETROLEUM TEKNOLOGI 5,500,000 4,840,000 8,745,000 1.06% PETRONAS CHEMICALS GROUP BHD 1,956,500 13,224,425 13,538,980 1.64% SAPURAKENCANA PETROLEUM BHD 11,500,075 30,625,764 56,350,368 6.83% UMW OIL & GAS CORPORATION BHD 5,050,300 14,783,069 20,251,703 2.46%Properties 15,622,016 34,430,798 30,690,035 3.72% EASTERN & ORIENTAL BHD 3,900,100 8,198,823 7,371,189 0.89% GLOMAC BHD 5,721,700 6,769,752 6,408,304 0.78% IOI PROPERTIES GROUP BHD 1,000,216 2,260,488 2,510,542 0.30% S P SETIA BHD 4,000,000 14,326,053 12,040,000 1.46% UEM SUNRISE BHD 1,000,000 2,875,682 2,360,000 0.29%Resource Based 15,851,972 64,723,804 90,498,642 10.97% GENTING PLANTATIONS BHD 2,099,200 13,132,963 23,175,168 2.81% IJM PLANTATIONS BHD 2,504,625 6,257,541 8,891,419 1.08% IOI CORPORATION BHD 2,000,433 9,120,218 9,422,039 1.14% KUALA LUMPUR KEPONG BHD 1,200,250 18,290,040 29,886,225 3.62% TA ANN HOLDINGS BHD 3,000,564 10,371,694 12,512,352 1.52% WTK HOLDINGS BHD 5,046,900 7,551,348 6,611,439 0.80%
48

DETAILS OFINVESTMENTS (CONT’D)As at 31 December 2013
Dana Restu (Cont’d)Details of Investment as at 31 December 2013
Quantity Held Cost Market Value
Market Value as a % of NAV
EQUITY SECURITIES (Cont’d) (in unit of shares) (RM) (RM) (%)
Telecommunication & Cables 17,005,050 78,586,387 99,603,885 12.07% AXIATA GROUP BHD 5,000,050 21,659,280 34,500,345 4.18% DIGI.COM BHD 7,551,000 37,389,064 37,452,960 4.54% MAXIS BHD 1,704,000 9,665,190 12,388,080 1.50% TELEKOM MALAYSIA BHD 2,750,000 9,872,853 15,262,500 1.85%Utilities/ Infrastructure 8,820,000 56,217,078 88,014,000 10.67% PUNCAK NIAGA HOLDINGS BHD 1,520,000 4,986,600 4,940,000 0.60% TENAGA NASIONAL BHD 7,300,000 51,230,478 83,074,000 10.07%TOTAL EQUITY SECURITIES 172,269,485 641,551,318 811,738,787 98.41%
FINANCIAL INSTRUMENTS WITH EMBEDDED DERIVATIVESBuilding Materials / Construction 1,653,832 1,416,247 1,596,469 0.19% IJM CORPORATION BHD 685,572 1,331,968 1,227,174 0.15% WCT HOLDINGS BHD 968,260 84,279 369,295 0.04%Petroleum, Chemical and Gas 480,919 - 538,628 0.07% DIALOG GROUP BHD 480,919 - 538,628 0.07%Resource Based 821,502 664,686 1,752,927 0.21% GENTING PLANTATIONS BHD 402,840 664,686 1,417,996 0.17% IJM PLANTATIONS BHD 418,662 - 334,930 0.04%Technology 530,200 53,020 100,738 0.01% UNISEM M BHD 530,200 53,020 100,738 0.01%TOTAL FINANCIAL INSTRUMENTSWITH EMBEDDED DERIVATIVES 3,486,453 2,133,953 3,988,762 0.48%
UNIT AND PROPERTY TRUST FUNDSProperties 3,521,719 6,743,762 10,318,637 1.25% AXIS REAL ESTATE INV TRUST 3,521,719 6,743,762 10,318,637 1.25%TOTAL UNIT AND PROPERTY TRUST FUNDS 3,521,719 6,743,762 10,318,637 1.25%
DEPOSITS WITH FINANCIAL INSTITUTIONSSpecial Investment Account 60,150,000 60,150,000 60,150,000 7.29%TOTAL DEPOSITS WITH FINANCIALINSTITUTIONS 60,150,000 60,150,000 60,150,000 7.29%
TOTAL INVESTMENTS 239,427,657 710,579,033 886,196,186 107.43%
49GREAT EASTERN LIFE ASSURANCE (MALAYSIA) BERHAD
UNIT FUNDS ANNUAL REPORT 2013

Dana SejatiDetails of Investment as at 31 December 2013
Quantity Held Cost Market Value
Market Value as a % of NAV
MALAYSIAN GOVERNMENT SECURITIES (in unit of shares) (RM) (RM) (%)
Government 10,450,000 10,412,354 10,610,045 11.85% GOVERNMENT INVESTMENT ISSUE - 3.24% 200500022 RM1.0T Profit Based Due 08.02.2016 4,000,000 3,986,800 3,996,800 4.46% GOVERNMENT INVESTMENT ISSUE - 3.24% 200500022 RM1.0T Profit Based Due 08.02.2016 1,000,000 996,700 999,200 1.12% GOVERNMENT INVESTMENT ISSUE - 4.94% 201300054 RM1.0T GII Murabahah Due 06.12.2028 5,450,000 5,428,854 5,614,045 6.27%TOTAL MALAYSIAN GOVERNMENT SECURITIES 10,450,000 10,412,354 10,610,045 11.85%
DEBT SECURITIESConstruction 3,000,000 3,013,200 3,056,700 3.41% GAMUDA BHD - 5.25% 200800007 RM800M IMTN Due 01.04.2015 3,000,000 3,013,200 3,056,700 3.41%Financial Services 5,000,000 5,000,000 4,979,500 5.56% CIMB ISLAMIC BANK BHD - 4.00% 200900049 RM2.0B T-2 Junior Due 18.09.2017 5,000,000 5,000,000 4,979,500 5.56%Highway 6,000,000 5,755,100 5,762,800 6.43% KONSORTIUM LEBUHRAYA UTARA TIMUR (KL) SDN BHD - 4.25% 201300098 RM2300M Sukuk Due 01.12.2023 5,000,000 4,726,500 4,747,000 5.30% NEW PANTAI EXPRESSWAY SDN BHD - 5.55% 200300122 RM490M Senior Debt Due 31.10.2014 1,000,000 1,028,600 1,015,800 1.13%Investment Holding 13,000,000 13,122,000 13,088,500 14.62% DANGA CAPITAL BHD - 4.22% 200900021 RM10B Islamic Sec Due 24.04.2014 5,000,000 5,022,000 5,012,500 5.60% DANGA CAPITAL BHD - 4.35% 200900021 RM10B Islamic Sec Due 13.04.2015 8,000,000 8,100,000 8,076,000 9.02%
DETAILS OFINVESTMENTS (CONT’D)As at 31 December 2013
50

Dana Sejati (Cont’d)Details of Investment as at 31 December 2013
Quantity Held Cost Market Value
Market Value as a % of NAV
DEBT SECURITIES (Cont’d) (in unit of shares) (RM) (RM) (%)
Power 15,800,000 16,459,025 16,253,340 18.15% KAPAR ENERGY VENTURES SDN BHD - 4.12% 201300053 RM2B Sukuk Ijarah Due 05.07.2016 5,500,000 5,546,365 5,519,250 6.16% MALAKOFF POWER BHD - 5.05% 201300107 RM5.4B IMTN Prog Due 17.12.2019 3,000,000 3,007,800 3,010,500 3.36% MUKAH POWER GENERATION SDN BHD - 8.15% 200600125 RM665M Senior Sukuk Due 27.12.2018 2,300,000 2,847,860 2,675,590 2.99% SARAWAK ENERGY BHD - 4.40% 201100040 RM15B IMTN Due 23.06.2016 5,000,000 5,057,000 5,048,000 5.64%Properties 8,000,000 8,126,950 8,129,600 9.07% ENCORP SYSTEMBILT SDN BHD - 4.54% 201200022 RM1.575B Sukuk Due 17.05.2019 5,000,000 5,146,750 5,073,500 5.66% ENCORP SYSTEMBILT SDN BHD - 4.69% 201200022 RM1.575B Sukuk Due 18.05.2020 3,000,000 2,980,200 3,056,100 3.41%Utilites / Infrastructure 5,000,000 4,912,000 4,851,000 5.42% MANJUNG ISLAND ENERGY BHD - 4.43% 201100070 RM3.86B Islamic Sec Due 25.11.2025 5,000,000 4,912,000 4,851,000 5.42%Water 1,700,000 1,715,300 1,713,430 1.91% PENGURUSAN AIR SPV BHD - 4.40% 200900056 RM20.0B IMTN Due 05.11.2014 1,700,000 1,715,300 1,713,430 1.91%Infrastructure-QGov 5,000,000 5,000,000 4,931,000 5.51% DANAINFRA NASIONAL - 4.58% 201200042 RM8.0B Dana Infra Due 31.10.2028 5,000,000 5,000,000 4,931,000 5.51%
TOTAL DEBT SECURITIES 62,500,000 63,103,575 62,765,870 70.08%
DEPOSITS WITH FINANCIAL INSTITUTIONS Special Investment Account 15,550,000 15,550,000 15,550,000 17.36%TOTAL DEPOSITS WITH FINANCIAL INSTITUTIONS 15,550,000 15,550,000 15,550,000 17.36%
TOTAL INVESTMENTS 88,500,000 89,065,929 88,925,915 99.29%
DETAILS OFINVESTMENTS (CONT’D)As at 31 December 2013
51GREAT EASTERN LIFE ASSURANCE (MALAYSIA) BERHAD
UNIT FUNDS ANNUAL REPORT 2013

Lion Balanced FundDetails of Investment as at 31 December 2013
Quantity Held Cost Market Value
Market Value as a % of NAV
DEBT SECURITIES (in unit of shares) (RM) (RM) (%)
Commercial - Prop 10,000,000 9,819,000 9,937,596 4.00% KINABALU CAPITAL SDN BHD - 0.00% 201100059 KCSB RM270M CP/MTN Due 05.03.2014 10,000,000 9,819,000 9,937,596 4.00%Construction 12,000,000 11,976,499 11,983,200 4.82% SUNWAY BHD - 0.00% 201300096 RM2.0B CP/MTN Prog Due 23.01.2014 10,000,000 9,970,699 9,980,000 4.01% WCT HOLDINGS BHD - 4.05% 200800028 RM300M ICP/MTN Due 13.06.2014 2,000,000 2,005,800 2,003,200 0.81%Fin. Institutions 5,000,000 4,912,511 4,977,500 2.00% PAC LEASE BHD - 0.00% 201100055 RM500M CP/MTN Prog Due 21.02.2014 5,000,000 4,912,511 4,977,500 2.00%Financial Services 20,000,000 20,000,000 20,047,500 8.06% CIMB BANK BHD - 4.80% 201300079 RM10B Subordinated Due 13.09.2018 5,000,000 5,000,000 5,016,500 2.02% PUBLIC BANK BHD - 4.80% 201300081 RM10.0 BIL Sub Notes Due 25.09.2018 10,000,000 10,000,000 10,024,000 4.03% AMMB HOLDINGS BHD - 3.80% 201200052 RM2.0B MTN Prog Due 28.08.2014 5,000,000 5,000,000 5,007,000 2.01%Transport - QGov 5,000,000 5,087,500 5,079,000 2.04% SYARIKAT PRASARANA NEGARA BHD - 4.27% RM1.914B Prasarana New Bonds Due 30.11.2016 5,000,000 5,087,500 5,079,000 2.04%TOTAL DEBT SECURITIES 52,000,000 51,795,510 52,024,796 20.92%
DETAILS OFINVESTMENTS (CONT’D)As at 31 December 2013
52

Lion Balanced Fund (Cont’d)Details of Investment as at 31 December 2013
Quantity Held Cost Market Value
Market Value as a % of NAV
EQUITY SECURITIES (in unit of shares) (RM) (RM) (%)
Building Materials / Construction 8,974,150 15,044,223 16,648,549 6.70% ENGTEX GROUP BHD 1,254,500 2,125,624 2,032,290 0.82% GAMUDA BHD 970,200 4,082,182 4,656,960 1.87% HOCK SENG LEE BHD 1,168,300 2,302,795 2,184,721 0.88% JAKS RESOURCES BHD 2,937,400 1,454,746 1,483,387 0.60% KKB ENGINEERING BHD 746,700 1,500,209 1,993,689 0.80% MUHIBBAH ENGINEERING M BHD 1,776,300 3,251,167 4,049,964 1.63% WCT HOLDINGS BHD 120,750 327,500 247,538 0.10%Conglomerates 2,050,700 7,896,683 9,346,644 3.76% CAHYA MATA SARAWAK BHD 650,000 3,068,538 4,465,500 1.80% DRB-HICOM BHD 821,200 2,250,609 2,315,784 0.93% MMC CORPORATION BHD 444,500 1,293,125 1,280,160 0.51% SIME DARBY BHD 135,000 1,284,411 1,285,200 0.52%Financial Services 967,555 6,380,627 6,557,855 2.63% CIMB GROUP HOLDINGS BHD 407,396 3,114,563 3,104,358 1.25% MALAYSIA BUILDING SOCIETY BHD 164,300 83,793 85,436 0.03% MALAYAN BANKING BHD 118,027 1,045,812 1,173,188 0.47% RHB CAPITAL BHD 277,832 2,136,459 2,194,873 0.88%Gaming / Leisure 898,800 5,489,505 5,586,003 2.24% BERJAYA SPORTS TOTO BHD 504,500 2,104,407 2,043,225 0.82% GENTING BHD 308,800 3,023,202 3,168,288 1.27% GENTING MALAYSIA BHD 85,500 361,896 374,490 0.15%Others 3,130,000 7,042,324 11,166,344 4.49% BRAHIM'S HOLDINGS BHD 1,558,400 1,748,821 2,867,456 1.15% HARTALEGA HOLDINGS BHD 536,600 2,516,747 3,879,618 1.56% KAREX BHD 346,200 640,470 1,443,654 0.58% KOSSAN RUBBER INDUSTRIES BHD 688,800 2,136,286 2,975,616 1.20%Petroleum, Chemical & Gas 11,676,996 23,218,114 33,803,389 13.60% ALAM MARITIM RESOURCES BHD 2,778,500 2,651,621 4,362,245 1.75% BARAKAH OFFSHORE PETROLEUM BHD 3,390,000 3,118,800 5,186,700 2.09% BUMI ARMADA BHD 855,000 3,300,646 3,445,650 1.39% M'SIA MARINE & HEAVY ENG HLDGS 761,000 2,848,935 2,663,500 1.07% PERISAI PETROLEUM TEKNOLOGI 684,200 788,374 1,087,878 0.44% PETRONAS CHEMICALS GROUP BHD 413,000 2,921,649 2,857,960 1.15% SAPURAKENCANA PETROLEUM BHD 1,093,396 3,742,847 5,357,640 2.16% UMW OIL & GAS CORPORATION BHD 963,000 2,696,400 3,861,630 1.55% YINSON HOLDINGS BHD 738,900 1,148,842 4,980,186 2.00%Properties 3,971,500 10,254,979 9,250,087 3.72% EASTERN & ORIENTAL BHD 1,091,100 2,255,064 2,062,179 0.83% IJM LAND BHD 745,600 2,088,273 1,901,280 0.76% IOI PROPERTIES GROUP BHD 270,000 610,200 677,700 0.27% S P SETIA BHD 320,000 1,179,977 963,200 0.39% UEM SUNRISE BHD 1,544,800 4,121,465 3,645,728 1.47%
DETAILS OFINVESTMENTS (CONT’D)As at 31 December 2013
53GREAT EASTERN LIFE ASSURANCE (MALAYSIA) BERHAD
UNIT FUNDS ANNUAL REPORT 2013

Lion Balanced Fund (Cont’d)Details of Investment as at 31 December 2013
Quantity Held Cost Market Value
Market Value as a % of NAV
EQUITY SECURITIES (Cont’d) (in unit of shares) (RM) (RM) (%)
Resource Based 5,238,300 13,456,555 13,776,871 5.54% IJM PLANTATIONS BHD 371,500 1,250,993 1,318,825 0.53% IOI CORPORATION BHD 540,000 2,645,388 2,543,400 1.02% KUALA LUMPUR KEPONG BHD 92,000 1,960,143 2,290,800 0.92% SARAWAK OIL PALMS BHD 80,000 478,900 520,800 0.21% TA ANN HOLDINGS BHD 748,300 3,010,057 3,120,411 1.26% TDM BHD 1,333,000 1,327,652 1,266,350 0.51% WTK HOLDINGS BHD 2,073,500 2,783,422 2,716,285 1.09%Technology 3,551,900 4,373,928 7,434,163 2.99% GLOBETRONICS TECHNOLOGY BHD 1,067,900 1,404,323 3,385,243 1.36% INARI AMERTRON BHD 2,484,000 2,969,605 4,048,920 1.63%Telecommunication & Cables 150,000 1,033,095 1,035,000 0.42% AXIATA GROUP BHD 150,000 1,033,095 1,035,000 0.42%Transport Services 26,491,900 2,955,130 3,197,337 1.28% AIRASIA BHD 400,000 884,000 880,000 0.35% HARBOUR-LINK GROUP BHD 78,500 60,272 67,510 0.03% HUBLINE BHD 25,868,300 1,318,415 1,422,757 0.57% MISC BHD 145,100 692,443 827,070 0.33%Utilities/Infrastructure 3,577,500 12,673,824 15,273,367 6.15% CYPARK RESOURCES BHD 1,165,000 2,067,151 2,970,750 1.20% KUMPULAN PERANGSANG SELANGOR 400,200 881,813 768,384 0.31% PUNCAK NIAGA HOLDINGS BHD 1,398,000 4,337,244 4,543,500 1.83% TENAGA NASIONAL BHD 614,300 5,387,616 6,990,733 2.81%TOTAL EQUITY SECURITIES 70,679,301 109,818,987 133,075,609 53.52%
FINANCIAL INSTRUMENTS WITH EMBEDDED DERIVATIVESBuilding Materials / Construction 3,045,600 663,727 719,715 0.29% WCT HOLDINGS BHD 970,600 456,227 387,715 0.16% PANTECH GROUP HOLDINGS BHD - 0.00% 7% Irredeemable Convertible Unsecured Loan Stock Due 21.12.2017 2,075,000 207,500 332,000 0.13%Gaming / Leisure 40,750 61,125 127,547 0.05% GENTING BHD 40,750 61,125 127,547 0.05%Technology 1,947,100 2,211,689 2,336,520 0.94% INARI AMERTRON BHD 1,947,100 2,211,689 2,336,520 0.94%TOTAL FINANCIAL INSTRUMENTS WITHEMBEDDED DERIVATIVES 5,033,450 2,936,541 3,183,782 1.28%
DETAILS OFINVESTMENTS (CONT’D)As at 31 December 2013
54

Lion Balanced Fund (Cont’d)Details of Investment as at 31 December 2013
Quantity Held Cost Market Value
Market Value as a % of NAV
DEPOSITS WITH FINANCIAL INSTITUTIONS (in unit of shares) (RM) (RM) (%)
Short Term Money Market Clean Deposit 62,390,000 62,390,000 62,390,000 25.10%TOTAL DEPOSITS WITH FINANCIAL INSTITUTIONS 62,390,000 62,390,000 62,390,000 25.10%
TOTAL INVESTMENTS 190,102,751 226,941,038 250,674,187 100.82%
Lion Fixed Income FundDetails of Investment as at 31 December 2013
Quantity Held Cost Market Value
Market Value as a % of NAV
MALAYSIAN GOVERNMENT SECURITIES (in unit of shares) (RM) (RM) (%)Government 40,000,000 41,938,000 42,205,000 8.16% GOVERNMENT INVESTMENT ISSUE - 4.44% 201300054 RM1.0T GII Murabahah Due 22.05.2024 10,000,000 9,961,800 10,028,000 1.94% GOVERNMENT INVESTMENT ISSUE - 4.94% 201300054 RM1.0T GII Murabahah Due 06.12.2028 10,000,000 9,961,200 10,301,000 1.99% GOVERNMENT OF MALAYSIA - 5.73% RM4B MGS Due 30.07.2019 20,000,000 22,015,000 21,876,000 4.23%TOTAL MALAYSIAN GOVERNMENT SECURITIES 40,000,000 41,938,000 42,205,000 8.16%
DETAILS OFINVESTMENTS (CONT’D)As at 31 December 2013
55GREAT EASTERN LIFE ASSURANCE (MALAYSIA) BERHAD
UNIT FUNDS ANNUAL REPORT 2013

Lion Fixed Income Fund (Cont’d)Details of Investment as at 31 December 2013
Quantity Held Cost Market Value
Market Value as a % of NAV
DEBT SECURITIES (in unit of shares) (RM) (RM) (%)
Commercial - Prop 10,000,000 9,819,000 9,937,596 1.92% KINABALU CAPITAL SDN BHD - 0.00% 201100059 KCSB RM270M CP/MTN Due 05.03.2014 10,000,000 9,819,000 9,937,596 1.92%Construction 22,000,000 22,083,999 22,092,800 4.27% GAMUDA BHD - 5.25% 200800007 RM800M IMTN Due 01.04.2015 2,000,000 2,008,800 2,037,800 0.39% IJM CORPORATION BHD - 5.50% 200900054 RM650M CP/MTNS Due 23.10.2015 5,000,000 5,172,000 5,142,500 1.00% SUNWAY BHD - 0.00% 201300096 RM2.0B CP/MTN Prog Due 23.01.2014 10,000,000 9,970,699 9,980,000 1.93% WCT HOLDINGS BHD - 4.40% 201300033 RM1.0B MTNS Prog Due 09.04.2020 5,000,000 4,932,500 4,932,500 0.95%Financial Institution 30,000,000 29,826,022 29,868,000 5.79% PAC LEASE BHD - 0.00% 201100055 RM500M CP/MTN Prog Due 21.02.2014 10,000,000 9,825,022 9,955,000 1.93% SABAH DEVELOPMENT BANK - 3.90% 200800027 RM1.0B MTN Prog Due 18.07.2014 5,000,000 5,001,000 5,003,000 0.97% SABAH DEVELOPMENT BANK - 4.15% 201200055 RM1.0B MTN Prog Due 08.08.2017 15,000,000 15,000,000 14,910,000 2.89%Financial Services 242,000,000 243,556,050 243,537,100 47.14% ALLIANCE BANK MALAYSIA BHD - 4.82% 201100022 RM1.5B Subordinated Due 08.04.2016 23,000,000 23,505,600 23,443,900 4.54% AMBANK (M) BHD - 5.20% 201300113 RM4.0B Sub Notes Due 31.12.2018 20,000,000 20,000,000 20,000,000 3.87% AMBANK (M) BHD - 6.25% 200800009 RM2B MTN Programme Due 09.04.2018 5,000,000 5,355,500 5,352,000 1.04% CIMB BANK BHD - 4.30% 201000059 RM5.0B 10NC5 Due 23.12.2015 5,000,000 5,000,000 5,015,000 0.97% CIMB BANK BHD - 4.15% 201000059 RM5.0B 10NC5 Due 30.11.2017 10,000,000 10,000,000 9,883,000 1.91% CIMB BANK BHD - 4.80% 201300079 RM10B Subordinated Due 13.09.2018 10,000,000 10,000,000 10,033,000 1.94%
DETAILS OFINVESTMENTS (CONT’D)As at 31 December 2013
56
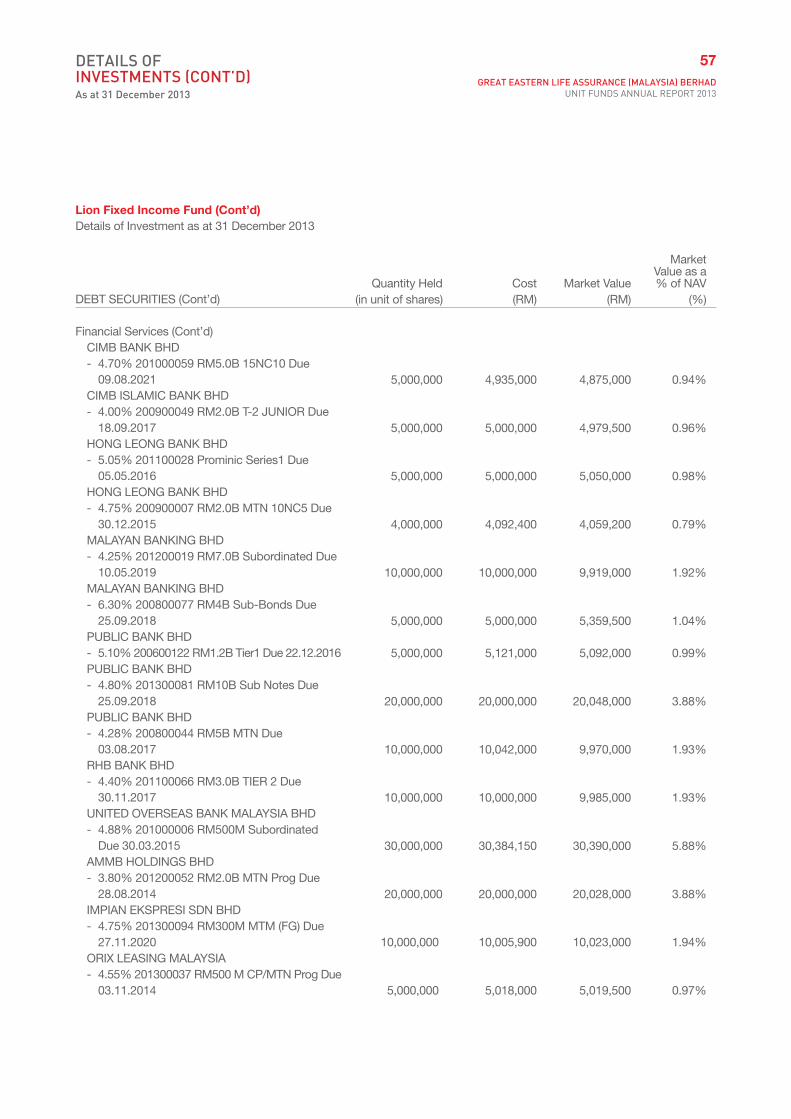
Lion Fixed Income Fund (Cont’d)Details of Investment as at 31 December 2013
Quantity Held Cost Market Value
Market Value as a % of NAV
DEBT SECURITIES (Cont’d) (in unit of shares) (RM) (RM) (%)
Financial Services (Cont’d) CIMB BANK BHD - 4.70% 201000059 RM5.0B 15NC10 Due 09.08.2021 5,000,000 4,935,000 4,875,000 0.94% CIMB ISLAMIC BANK BHD - 4.00% 200900049 RM2.0B T-2 JUNIOR Due 18.09.2017 5,000,000 5,000,000 4,979,500 0.96% HONG LEONG BANK BHD - 5.05% 201100028 Prominic Series1 Due 05.05.2016 5,000,000 5,000,000 5,050,000 0.98% HONG LEONG BANK BHD - 4.75% 200900007 RM2.0B MTN 10NC5 Due 30.12.2015 4,000,000 4,092,400 4,059,200 0.79% MALAYAN BANKING BHD - 4.25% 201200019 RM7.0B Subordinated Due 10.05.2019 10,000,000 10,000,000 9,919,000 1.92% MALAYAN BANKING BHD - 6.30% 200800077 RM4B Sub-Bonds Due 25.09.2018 5,000,000 5,000,000 5,359,500 1.04% PUBLIC BANK BHD - 5.10% 200600122 RM1.2B Tier1 Due 22.12.2016 5,000,000 5,121,000 5,092,000 0.99% PUBLIC BANK BHD - 4.80% 201300081 RM10B Sub Notes Due 25.09.2018 20,000,000 20,000,000 20,048,000 3.88% PUBLIC BANK BHD - 4.28% 200800044 RM5B MTN Due 03.08.2017 10,000,000 10,042,000 9,970,000 1.93% RHB BANK BHD - 4.40% 201100066 RM3.0B TIER 2 Due 30.11.2017 10,000,000 10,000,000 9,985,000 1.93% UNITED OVERSEAS BANK MALAYSIA BHD - 4.88% 201000006 RM500M Subordinated Due 30.03.2015 30,000,000 30,384,150 30,390,000 5.88% AMMB HOLDINGS BHD - 3.80% 201200052 RM2.0B MTN Prog Due 28.08.2014 20,000,000 20,000,000 20,028,000 3.88% IMPIAN EKSPRESI SDN BHD - 4.75% 201300094 RM300M MTM (FG) Due 27.11.2020 10,000,000 10,005,900 10,023,000 1.94% ORIX LEASING MALAYSIA - 4.55% 201300037 RM500 M CP/MTN Prog Due 03.11.2014 5,000,000 5,018,000 5,019,500 0.97%
DETAILS OFINVESTMENTS (CONT’D)As at 31 December 2013
57GREAT EASTERN LIFE ASSURANCE (MALAYSIA) BERHAD
UNIT FUNDS ANNUAL REPORT 2013

Lion Fixed Income Fund (Cont’d)Details of Investment as at 31 December 2013
Quantity Held Cost Market Value
Market Value as a % of NAV
DEBT SECURITIES (Cont’d) (in unit of shares) (RM) (RM) (%)
Financial Services (Cont’d) ORIX LEASING MALAYSIA - 4.65% 201300037 RM500 M CP/MTN Prog Due 30.04.2015 5,000,000 5,023,500 5,024,500 0.97% SILVER SPARROW BHD - 4.15% 201100078 RM515M MTN Due 08.04.2016 10,000,000 10,014,000 9,970,000 1.93% TROPICANA CORPORATION BHD - 4.22% 201200077 RM500M BG CP/MTN Due 02.11.2016 10,000,000 10,059,000 10,018,000 1.94%Highway 20,000,000 18,671,200 18,819,700 3.64% KONSORTIUM LEBUHRAYA UTARA TIMUR (KL) SDN BHD - 4.25% 201300098 RM2300M Sukuk Due 01.12.2023 4,000,000 3,781,200 3,797,600 0.73% KONSORTIUM LEBUHRAYA UTARA TIMUR (KL) SDN BHD - 4.75% 201300098 RM2300M Sukuk Due 30.11.2029 15,000,000 13,918,500 14,043,000 2.72% KONSORTIUM LEBUHRAYA UTARA TIMUR (KL) SDN BHD - 5.25% 201300098 RM2300M Sukuk Due 02.12.2030 1,000,000 971,500 979,100 0.19%Investment Holding 16,000,000 15,872,300 15,834,300 3.06% DANGA CAPITAL BHD - 4.22% 200900021 RM10B Islamic Sec Due 24.04.2014 15,000,000 15,066,000 15,037,500 2.91% KHAZANAH NASIONAL BHD - 0.00% 200600106 RM12.5B Khazanah Due 27.08.2019 1,000,000 806,300 796,800 0.15%Others-FI 10,000,000 10,000,000 9,873,000 1.91% CAGAMAS BHD - 4.55% 200700081 RM20B IMTN Due 28.08.2025 10,000,000 10,000,000 9,873,000 1.91%Plantation 3,500,000 3,500,000 3,493,700 0.68% FIRST RESOURCES LTD - 4.30% 201200043 RM2B Sukuk Due 08.12.2017 3,500,000 3,500,000 3,493,700 0.68%Power 47,000,000 48,707,550 48,318,500 9.36% KAPAR ENERGY VENTURES SDN BHD - 4.12% 201300053 RM2B Sukuk Ijarah Due 05.07.2016 10,000,000 10,084,300 10,035,000 1.94% KAPAR ENERGY VENTURES SDN BHD - 4.30% 201300053 RM2B Sukuk Ijarah Due 05.07.2018 5,000,000 5,067,350 5,018,500 0.97%
DETAILS OFINVESTMENTS (CONT’D)As at 31 December 2013
58

Lion Fixed Income Fund (Cont’d)Details of Investment as at 31 December 2013
DEBT SECURITIES (Cont’d) Quantity Held Cost Market Value
Market Value as a % of NAV
(in unit of shares) (RM) (RM) (%)
Power (Cont’d) MALAKOFF POWER BHD - 5.05% 201300107 RM5.4B IMTN Prog Due 17.12.2019 5,000,000 5,013,000 5,017,500 0.97% MALAKOFF POWER BHD - 5.25% 201300107 RM5.4B IMTN Prog Due 17.12.2021 10,000,000 10,045,000 10,051,000 1.95% MALAKOFF POWER BHD - 5.45% 201300107 RM5.4B IMTN Prog Due 15.12.2023 5,000,000 5,038,500 5,038,000 0.98% MUKAH POWER GENERATION SDN BHD - 8.05% 200600125 RM665M Senior Sukuk Due 27.06.2018 2,000,000 2,211,400 2,294,000 0.44% MUKAH POWER GENERATION SDN BHD - 8.15% 200600125 RM665M Senior Sukuk Due 27.12.2018 5,000,000 6,191,000 5,816,500 1.13% SARAWAK ENERGY BHD - 4.40% 201100040 RM15B IMTN Due 23.06.2016 5,000,000 5,057,000 5,048,000 0.98%Properties 9,500,000 9,651,575 9,578,650 1.85% ENCORP SYSTEMBILT SDN BHD - 3.83% 201200022 RM1.575B Sukuk Due 18.11.2014 5,000,000 5,019,500 5,012,500 0.97% ENCORP SYSTEMBILT SDN BHD - 4.54% 201200022 RM1.575B Sukuk Due 17.05.2019 4,500,000 4,632,075 4,566,150 0.88%Utilites / Infrastructure 5,000,000 4,902,500 4,840,000 0.94% MANJUNG ISLAND ENERGY BHD - 4.58% 201100070 RM3.86B Islamic Sec Due 25.11.2027 5,000,000 4,902,500 4,840,000 0.94%Water 3,000,000 3,027,000 3,023,700 0.59% PENGURUSAN AIR SPV BHD - 4.40% 200900056 RM20.0B IMTN Due 05.11.2014 3,000,000 3,027,000 3,023,700 0.59%Infrastructure-QGov 15,000,000 15,000,000 14,730,000 2.85% DANAINFRA NASIONAL - 4.58% 201200042 RM8.0B Dana Infra Due 31.10.2028 5,000,000 5,000,000 4,931,000 0.95% DANAINFRA NASIONAL - 4.80% 201200042 RM8.0B Dana Infra Due 31.10.2033 10,000,000 10,000,000 9,799,000 1.90%TOTAL DEBT SECURITIES 433,000,000 434,617,196 433,947,046 84.00%
DETAILS OFINVESTMENTS (CONT’D)As at 31 December 2013
59GREAT EASTERN LIFE ASSURANCE (MALAYSIA) BERHAD
UNIT FUNDS ANNUAL REPORT 2013

Lion Fixed Income Fund (Cont’d)Details of Investment as at 31 December 2013
Quantity Held Cost Market Value
Market Value as a % of NAV
DEPOSITS WITH FINANCIAL INSTITUTIONS (in unit of shares) (RM) (RM) (%)
Short Term Money Market Clean Deposit 42,300,000 42,300,000 42,300,000 8.19%TOTAL DEPOSITS WITH FINANCIAL INSTITUTIONS 42,300,000 42,300,000 42,300,000 8.19%
TOTAL INVESTMENTS 515,300,000 518,855,196 518,452,046 100.35%
Lion Growth FundDetails of Investment as at 31 December 2013
Quantity Held Cost Market Value
Market Value as a % of NAV
EQUITY SECURITIES (in unit of shares) (RM) (RM) (%)
Building Materials / Construction 15,383,380 54,887,355 62,997,274 8.44% GAMUDA BHD 7,489,800 30,500,759 35,951,040 4.82% IJM CORPORATION BHD 2,602,680 13,127,111 15,303,758 2.05% KKB ENGINEERING BHD 343,500 918,800 917,145 0.12% MUHIBBAH ENGINEERING M BHD 4,354,200 9,490,078 9,927,576 1.33% SOUTHERN STEEL BHD 489,700 733,110 685,580 0.09% WCT HOLDINGS BHD 103,500 117,497 212,175 0.03%Conglomerates 5,265,842 22,127,173 23,266,560 3.12% DRB-HICOM BHD 2,400,000 6,458,880 6,768,000 0.91% MAGNUM BHD 129,600 279,132 409,536 0.05% MMC CORPORATION BHD 1,500,000 4,374,700 4,320,000 0.58% SIME DARBY BHD 1,236,242 11,014,461 11,769,024 1.58%Financial Services 9,070,828 61,386,659 65,392,545 8.76% CIMB GROUP HOLDINGS BHD 1,520,000 11,483,340 11,582,400 1.55% MALAYAN BANKING BHD 2,142,603 18,025,814 21,297,474 2.85% MPHB CAPITAL BHD 1,641,850 1,641,850 2,758,308 0.37% RHB CAPITAL BHD 3,766,375 30,235,655 29,754,363 3.99%Gaming / Leisure 7,255,789 24,958,256 32,766,699 4.39% BERJAYA SPORTS TOTO BHD 2,527,589 10,931,943 10,236,735 1.37% GENTING BHD 309,600 1,333,700 3,176,496 0.43% GENTING MALAYSIA BHD 4,418,600 12,692,613 19,353,468 2.59%Media 19,337,100 31,103,584 33,236,775 4.45% MEDIA CHINESE INT'L LTD 9,975,500 8,168,581 9,726,113 1.30% MEDIA PRIMA BHD 6,754,600 13,839,633 17,697,052 2.37% STAR PUBLICATIONS M BHD 2,607,000 9,095,370 5,813,610 0.78%Others 5,154,700 25,257,169 38,503,731 5.16% JT INTERNATIONAL BHD 417,700 1,360,936 2,706,696 0.36% KOSSAN RUBBER INDUSTRIES BHD 1,290,000 4,250,347 5,572,800 0.75% MBM RESOURCES BHD 1,282,100 4,619,099 4,115,541 0.55% UMW HOLDINGS BHD 2,164,900 15,026,787 26,108,694 3.50%
DETAILS OFINVESTMENTS (CONT’D)As at 31 December 2013
60

Lion Growth Fund (Cont’d)Details of Investment as at 31 December 2013
Quantity Held Cost Market Value
Market Value as a % of NAV
EQUITY SECURITIES (Cont’d) (in unit of shares) (RM) (RM) (%)
Petroleum, Chemical & Gas 61,618,177 155,825,273 213,091,263 28.56% ALAM MARITIM RESOURCES BHD 7,352,786 4,102,719 11,543,874 1.55% BUMI ARMADA BHD 7,665,200 30,003,160 30,890,756 4.14% DIALOG GROUP BHD 4,287,000 10,311,860 15,347,460 2.06% M'SIA MARINE & HEAVY ENG HLDGS 6,509,700 25,916,320 22,783,950 3.05% PERISAI PETROLEUM TEKNOLOGI 12,862,700 14,263,811 20,451,693 2.74% PETRONAS CHEMICALS GROUP BHD 2,450,000 17,335,435 16,954,000 2.27% PETRONAS GAS BHD 303,700 4,233,491 7,373,836 0.99% SAPURAKENCANA PETROLEUM BHD 14,534,091 36,365,840 71,217,046 9.54% SEALINK INTERNATIONAL BHD 1,696,100 1,946,317 661,479 0.09% UMW OIL & GAS CORPORATION BHD 3,956,900 11,346,320 15,867,169 2.13%Properties 6,581,200 15,807,897 14,005,871 1.87% EASTERN & ORIENTAL BHD 3,246,300 7,055,264 6,135,507 0.82% UEM SUNRISE BHD 3,334,900 8,752,633 7,870,364 1.05%Resource Based 24,379,349 88,493,445 93,636,022 12.56% GENTING PLANTATIONS BHD 2,321,900 20,197,194 25,633,776 3.44% HAP SENG PLANTATIONS HLDGS BHD 1,663,400 5,069,396 4,457,912 0.60% IJM PLANTATIONS BHD 5,184,700 16,578,737 18,405,685 2.47% JAYA TIASA HOLDINGS BHD 1,584,000 4,297,892 3,231,360 0.43% KULIM M BHD 4,343,800 18,266,265 14,942,672 2.00% SARAWAK OIL PALMS BHD 602,800 3,865,673 3,924,228 0.53% TA ANN HOLDINGS BHD 4,080,849 14,441,062 17,017,140 2.28% WTK HOLDINGS BHD 4,597,900 5,777,226 6,023,249 0.81%Technology 3,282,500 4,284,629 5,350,475 0.72% INARI AMERTRON BHD 3,282,500 4,284,629 5,350,475 0.72%Telecommunication & Cables 5,092,700 24,044,485 25,259,792 3.39% DIGI.COM BHD 5,092,700 24,044,485 25,259,792 3.39%Utilities/Infrastructure 24,134,400 94,116,022 112,923,162 15.13% KUMPULAN PERANGSANG SELANGOR 6,029,500 13,321,671 11,576,640 1.55% PUNCAK NIAGA HOLDINGS BHD 6,986,000 22,105,806 22,704,500 3.04% TENAGA NASIONAL BHD 6,196,900 50,227,603 70,520,722 9.45% WAH SEONG CORPORATION BHD 4,922,000 8,460,942 8,121,300 1.09%TOTAL EQUITY SECURITIES 186,555,965 602,291,947 720,430,169 96.55%
FINANCIAL INSTRUMENTS WITH EMBEDDED DERIVATIVES
Building Materials / Construction 523,968 1,135,123 887,413 0.12% IJM CORPORATION BHD 487,968 1,129,003 873,463 0.12% WCT HOLDINGS BHD 36,000 6,120 13,950 0.00%Others 7,320,500 732,050 1,171,280 0.16% PANTECH GROUP HOLDINGS BHD - 0.00% 7% Irredeemable Convertible Unsecured Loan Stock Due 21.12.2017 7,320,500 732,050 1,171,280 0.16%
DETAILS OFINVESTMENTS (CONT’D)As at 31 December 2013
61GREAT EASTERN LIFE ASSURANCE (MALAYSIA) BERHAD
UNIT FUNDS ANNUAL REPORT 2013

Lion Growth Fund (Cont’d)Details of Investment as at 31 December 2013
FINANCIAL INSTRUMENTS WITH EMBEDDED DERIVATIVES (Cont’d)
Quantity Held Cost Market Value
Market Value as a % of NAV
(in unit of shares) (RM) (RM) (%)
Gaming / Leisure 77,400 116,100 242,262 0.03% GENTING BHD 77,400 116,100 242,262 0.03%Petroleum, Chemical and Gas 167,400 - 187,488 0.03% DIALOG GROUP BHD 167,400 - 187,488 0.03%Resource Based 464,380 766,227 1,634,617 0.22% GENTING PLANTATIONS BHD 464,380 766,227 1,634,617 0.22%TOTAL FINANCIAL INSTRUMENTS WITHEMBEDDED DERIVATIVES 8,553,648 2,749,500 4,123,060 0.56%
UNIT AND PROPERTY TRUST FUNDS
Properties 2,307,054 3,633,851 6,759,668 0.91% AXIS REAL ESTATE INV TRUST 2,307,054 3,633,851 6,759,668 0.91%TOTAL UNIT AND PROPERTY TRUST FUNDS 2,307,054 3,633,851 6,759,668 0.91%
DEPOSITS WITH FINANCIAL INSTITUTIONS
Short Term Money Market Clean Deposit 31,250,000 31,250,000 31,250,000 4.19%TOTAL DEPOSITS WITH FINANCIAL INSTITUTIONS 31,250,000 31,250,000 31,250,000 4.19%
TOTAL INVESTMENTS 228,666,667 639,925,298 762,562,897 102.21%
Lion Progressive FundDetails of Investment as at 31 December 2013
Quantity Held Cost Market Value
Market Value as a % of NAV
DEBT SECURITIES (in unit of shares) (RM) (RM) (%)
Commercial - Prop 10,000,000 9,819,000 9,937,596 1.19% KINABALU CAPITAL SDN BHD - 0.00% 201100059 KCSB RM270M CP/MTN Due 05.03.2014 10,000,000 9,819,000 9,937,596 1.19%Construction 5,000,000 5,014,500 5,008,000 0.60% WCT HOLDINGS BHD - 4.05% 200800028 RM300M ICP/MTN Due 13.06.2014 5,000,000 5,014,500 5,008,000 0.60%Financial Services 30,000,000 30,000,000 30,061,500 3.60% CIMB BANK BHD - 4.80% 201300079 RM10B Subordinated Due 13.09.2018 5,000,000 5,000,000 5,016,500 0.60%
DETAILS OFINVESTMENTS (CONT’D)As at 31 December 2013
62

Lion Progressive Fund (Cont’d)Details of Investment as at 31 December 2013
Quantity Held Cost Market Value
Market Value as a % of NAV
DEBT SECURITIES (Cont’d) (in unit of shares) (RM) (RM) (%)
PUBLIC BANK BHD - 4.80% 201300081 RM10B Sub Notes Due 25.09.2018 10,000,000 10,000,000 10,024,000 1.20% AMMB HOLDINGS BHD - 3.80% 201200052 RM2.0B MTN Prog Due 28.08.2014 15,000,000 15,000,000 15,021,000 1.80%TOTAL DEBT SECURITIES 45,000,000 44,833,500 45,007,096 5.39%
EQUITY SECURITIES
Building Materials / Construction 7,426,600 29,082,968 31,887,450 3.81% GAMUDA BHD 2,306,800 10,338,514 11,072,640 1.32% IJM CORPORATION BHD 2,350,700 12,019,143 13,822,116 1.65% KKB ENGINEERING BHD 1,741,400 4,026,959 4,649,538 0.56% MUHIBBAH ENGINEERING M BHD 1,027,700 2,698,352 2,343,156 0.28%Conglomerates 2,757,300 6,541,096 8,713,068 1.04% MAGNUM BHD 2,757,300 6,541,096 8,713,068 1.04%Financial Services 21,440,400 120,782,130 128,667,525 15.39% BURSA MALAYSIA BHD 1,364,300 11,091,020 11,228,189 1.34% CIMB GROUP HOLDINGS BHD 3,950,004 31,095,555 30,099,030 3.60% HONG LEONG BANK BHD 269,600 2,738,267 3,882,240 0.46% MALAYAN BANKING BHD 2,841,055 21,805,054 28,240,087 3.38% MALAYSIA BUILDING SOCIETY BHD 3,793,350 7,298,432 6,246,383 0.75% MPHB CAPITAL BHD 4,962,150 5,873,774 8,336,412 1.00% PUBLIC BANK BHD 607,100 9,692,959 11,777,740 1.41% RHB CAPITAL BHD 3,652,841 31,187,069 28,857,444 3.45%Gaming / Leisure 7,887,100 43,745,312 44,875,662 5.37% BERJAYA SPORTS TOTO BHD 2,376,400 9,575,501 9,624,420 1.15% GENTING BHD 1,890,200 18,803,686 19,393,452 2.32% GENTING MALAYSIA BHD 3,620,500 15,366,125 15,857,790 1.90%Media 7,369,300 18,572,987 18,379,171 2.19% MEDIA PRIMA BHD 4,988,800 10,290,977 13,070,656 1.56% STAR PUBLICATIONS M BHD 2,380,500 8,282,010 5,308,515 0.63%Others 10,527,500 60,587,423 83,904,156 10.04% FIMA CORPORATION BHD 491,600 1,196,279 3,047,920 0.36% HARTALEGA HOLDINGS BHD 4,460,000 22,790,238 32,245,800 3.86% JT INTERNATIONAL BHD 200,000 812,888 1,296,000 0.16% KAREX BHD 92,500 331,840 385,725 0.05% KOSSAN RUBBER INDUSTRIES BHD 391,900 1,415,269 1,693,008 0.20% MBM RESOURCES BHD 574,600 2,214,109 1,844,466 0.22% TAN CHONG MOTOR HOLDINGS BHD 1,477,100 9,405,466 9,143,249 1.09% UMW HOLDINGS BHD 2,839,800 22,421,334 34,247,988 4.10%
DETAILS OFINVESTMENTS (CONT’D)As at 31 December 2013
63GREAT EASTERN LIFE ASSURANCE (MALAYSIA) BERHAD
UNIT FUNDS ANNUAL REPORT 2013

Lion Progressive Fund (Cont’d)Details of Investment as at 31 December 2013
Quantity Held Cost Market Value
Market Value as a % of NAV
EQUITY SECURITIES (Cont’d) (in unit of shares) (RM) (RM) (%)
Petroleum, Chemical & Gas 60,647,726 146,139,329 215,905,149 25.83% ALAM MARITIM RESOURCES BHD 7,612,586 4,572,632 11,951,760 1.43% BARAKAH OFFSHORE PETROLEUM BHD 3,998,300 6,195,644 6,117,399 0.73% BUMI ARMADA BHD 4,888,700 18,606,535 19,701,461 2.36% DAYANG ENTERPRISE HOLDINGS BHD 2,152,200 4,087,485 12,461,238 1.49% DIALOG GROUP BHD 4,203,640 8,734,578 15,049,031 1.80% M'SIA MARINE & HEAVY ENG HLDGS 3,223,500 13,099,040 11,282,250 1.35% PERDANA PETROLEUM BHD 4,856,600 4,391,550 7,721,994 0.92% PERISAI PETROLEUM TEKNOLOGI 7,410,500 7,040,844 11,782,695 1.41% PETRONAS CHEMICALS GROUP BHD 1,542,000 9,578,986 10,670,640 1.28% PETRONAS GAS BHD 575,100 7,991,032 13,963,428 1.67% SAPURAKENCANA PETROLEUM BHD 13,543,300 46,944,686 66,362,170 7.94% UMW OIL & GAS CORPORATION BHD 4,290,800 12,078,740 17,206,108 2.06% UZMA BHD 2,350,500 2,817,577 11,634,975 1.39%Properties 22,526,049 47,641,582 43,300,069 5.17% EASTERN & ORIENTAL BHD 6,871,700 14,195,823 12,987,513 1.55% GLOMAC BHD 6,522,200 8,038,439 7,304,864 0.87% IJM LAND BHD 792,700 2,168,672 2,021,385 0.24% IOI PROPERTIES GROUP BHD 534,349 1,207,629 1,341,216 0.16% S P SETIA BHD 1,884,700 6,123,613 5,672,947 0.68% UEM SUNRISE BHD 5,920,400 15,907,406 13,972,144 1.67%Resource Based 9,138,900 50,251,196 54,330,771 6.49% GENTING PLANTATIONS BHD 1,153,100 10,895,276 12,730,224 1.52% HAP SENG PLANTATIONS HLDGS BHD 261,800 788,891 701,624 0.08% IJM PLANTATIONS BHD 4,217,000 14,004,942 14,970,350 1.79% IOI CORPORATION BHD 1,068,700 5,229,201 5,033,577 0.60% KUALA LUMPUR KEPONG BHD 499,300 10,684,065 12,432,570 1.49% KULIM M BHD 1,355,200 5,361,541 4,661,888 0.56% SARAWAK OIL PALMS BHD 583,800 3,287,279 3,800,538 0.45%Technology 2,925,900 3,809,873 4,769,217 0.57% INARI AMERTRON BHD 2,925,900 3,809,873 4,769,217 0.57%Telecommunication & Cables 3,035,300 18,348,595 19,456,615 2.33% AXIATA GROUP BHD 1,600,000 10,948,870 11,040,000 1.32% DIGI.COM BHD 873,600 4,195,129 4,333,056 0.52% MAXIS BHD 561,700 3,204,596 4,083,559 0.49%Transport Services 4,359,180 4,556,146 7,302,108 0.88% FREIGHT MANAGEMENT HLDGS BHD 2,433,180 1,075,513 3,893,088 0.47% MALAYSIAN BULK CARRIERS BHD 1,926,000 3,480,633 3,409,020 0.41%
DETAILS OFINVESTMENTS (CONT’D)As at 31 December 2013
64

Lion Progressive Fund (Cont’d)Details of Investment as at 31 December 2013
Quantity Held Cost Market Value
Market Value as a % of NAV
EQUITY SECURITIES (Cont’d) (in unit of shares) (RM) (RM) (%)
Utilities / Infrastucture 8,153,000 49,776,655 72,832,036 8.71% CYPARK RESOURCES BHD 1,230,700 1,593,685 3,138,285 0.38% PUNCAK NIAGA HOLDINGS BHD 1,117,100 3,633,075 3,630,575 0.43% TENAGA NASIONAL BHD 5,805,200 44,549,895 66,063,176 7.90%TOTAL EQUITY SECURITIES 168,194,255 599,835,292 734,322,997 87.82%
FINANCIAL INSTRUMENTS WITH EMBEDDED DERIVATIVES
Gaming / Leisure 356,350 534,525 1,115,375 0.13% GENTING BHD 356,350 534,525 1,115,375 0.13%Others 6,929,500 692,950 1,108,720 0.13% PANTECH GROUP HOLDINGS BHD - 0.00% 7% Irredeemable Convertible Unsecured Loan Stock Due 21.12.2017 6,929,500 692,950 1,108,720 0.13%Resource Based 224,740 370,821 791,085 0.09% GENTING PLANTATIONS BHD 224,740 370,821 791,085 0.09%Technology 2,905,900 3,338,531 3,487,080 0.42% INARI AMERTRON BHD 2,905,900 3,338,531 3,487,080 0.42%TOTAL FINANCIAL INSTRUMENTS WITHEMBEDDED DERIVATIVES 10,416,490 4,936,827 6,502,260 0.77%
UNIT AND PROPERTY TRUST FUNDS
Properties 1,107,815 1,947,720 3,245,898 0.39% AXIS REAL ESTATE INV TRUST 1,107,815 1,947,720 3,245,898 0.39%TOTAL UNIT AND PROPERTY TRUST FUNDS 1,107,815 1,947,720 3,245,898 0.39%
DEPOSITS WITH FINANCIAL INSTITUTIONS
Short Term Money Market Clean Deposit 59,290,000 59,290,000 59,290,000 7.09%TOTAL DEPOSITS WITH FINANCIALINSTITUTIONS 59,290,000 59,290,000 59,290,000 7.09%
TOTAL INVESTMENTS 284,008,560 710,843,339 848,368,251 101.46%
DETAILS OFINVESTMENTS (CONT’D)As at 31 December 2013
65GREAT EASTERN LIFE ASSURANCE (MALAYSIA) BERHAD
UNIT FUNDS ANNUAL REPORT 2013

Lion Strategic FundDetails of Investment as at 31 December 2013
Quantity Held Cost Market Value
Market Value as a % of NAV
DEBT SECURITIES (in unit of shares) (RM) (RM) (%)
Commercial - Prop 10,000,000 9,819,000 9,937,596 1.23% KINABALU CAPITAL SDN BHD - 0.00% 201100059 KCSB RM270M CP/MTN Due 05.03.2014 10,000,000 9,819,000 9,937,596 1.23%Financial Institutions 20,000,000 19,827,022 19,961,000 2.47% PAC LEASE BHD - 0.00% 201100055 RM500M CP/MTN Prog Due 21.02.2014 10,000,000 9,825,022 9,955,000 1.23% SABAH DEVELOPMENT BANK - 3.90% 200800027 RM1.0B MTN Prog Due 18.07.2014 10,000,000 10,002,000 10,006,000 1.24%Financial Services 35,000,000 35,000,000 35,068,500 4.34% CIMB BANK BHD - 4.80% 201300079 RM10B Subordinated Due 13.09.2018 5,000,000 5,000,000 5,016,500 0.62% PUBLIC BANK BHD - 4.80% 201300081 RM10B Sub Notes Due 25.09.2018 10,000,000 10,000,000 10,024,000 1.24% AMMB HOLDINGS BHD - 3.80% 201200052 RM2.0B MTN Prog Due 28.08.2014 20,000,000 20,000,000 20,028,000 2.48%Investment Holding 11,000,000 11,137,500 11,104,500 1.38% DANGA CAPITAL BHD - 4.35% 200900021 RM10B Islamic Sec Due 13.04.2015 11,000,000 11,137,500 11,104,500 1.38%TOTAL DEBT SECURITIES 76,000,000 75,783,522 76,071,596 9.42%
EQUITY SECURITIES
Building Materials / Construction 7,812,500 32,104,937 34,665,625 4.29% GAMUDA BHD 3,300,000 14,035,020 15,840,000 1.96% IJM CORPORATION BHD 2,500,000 12,332,756 14,700,000 1.82% WCT HOLDINGS BHD 2,012,500 5,737,161 4,125,625 0.51%Conglomerates 8,026,300 21,481,728 24,775,108 3.07% MAGNUM BHD 5,926,300 15,441,238 18,727,108 2.32% MMC CORPORATION BHD 2,100,000 6,040,490 6,048,000 0.75%Financial Services 19,595,784 130,340,755 130,724,743 16.20% BURSA MALAYSIA BHD 1,400,700 11,421,406 11,527,761 1.43% CIMB GROUP HOLDINGS BHD 4,598,825 34,926,996 35,043,047 4.34% HONG LEONG BANK BHD 1,093,400 15,371,342 15,744,960 1.95% MALAYAN BANKING BHD 3,434,106 31,961,590 34,135,014 4.23% MALAYSIA BUILDING SOCIETY BHD 5,993,900 11,754,064 9,982,622 1.24% RHB CAPITAL BHD 3,074,853 24,905,357 24,291,339 3.01%
DETAILS OFINVESTMENTS (CONT’D)As at 31 December 2013
66

Lion Strategic Fund (Cont’d)Details of Investment as at 31 December 2013
Quantity Held Cost Market Value
Market Value as a % of NAV
EQUITY SECURITIES (Cont’d) (in unit of shares) (RM) (RM) (%)
Gaming/Leisure 4,058,100 25,451,920 27,182,478 3.36% GENTING BHD 1,600,000 15,858,710 16,416,000 2.03% GENTING MALAYSIA BHD 2,458,100 9,593,210 10,766,478 1.33%Media 6,572,500 12,419,445 9,636,675 1.19% MEDIA CHINESE INT'L LTD 4,000,000 3,530,000 3,900,000 0.48% STAR PUBLICATIONS M BHD 2,572,500 8,889,445 5,736,675 0.71%Others 8,877,900 26,753,600 35,733,550 4.43% BRAHIM'S HOLDINGS BHD 5,392,000 5,931,200 9,921,280 1.23% KOSSAN RUBBER INDUSTRIES BHD 2,096,600 8,523,884 9,057,312 1.12% UMW HOLDINGS BHD 1,389,300 12,298,516 16,754,958 2.08%Petroleum, Chemical & Gas 39,260,100 85,499,950 138,275,296 17.12% ALAM MARITIM RESOURCES BHD 5,506,400 3,859,992 8,645,048 1.07% BARAKAH OFFSHORE PETROLEUM BHD 4,000,000 6,187,900 6,120,000 0.76% M'SIA MARINE & HEAVY ENG HLDGS 2,930,400 11,424,890 10,256,400 1.27% PERISAI PETROLEUM TEKNOLOGI 11,088,000 12,147,700 17,629,920 2.18% PETRONAS GAS BHD 569,800 7,679,363 13,834,744 1.71% SAPURAKENCANA PETROLEUM BHD 6,000,000 24,081,550 29,400,000 3.64% UMW OIL & GAS CORPORATION BHD 3,438,200 9,626,960 13,787,182 1.71% YINSON HOLDINGS BHD 5,727,300 10,491,595 38,602,002 4.78%Properties 17,711,700 37,094,935 37,034,410 4.58% GLOMAC BHD 5,844,800 5,481,434 6,546,176 0.81% S P SETIA BHD 3,819,000 11,438,162 11,495,190 1.42% UEM SUNRISE BHD 8,047,900 20,175,339 18,993,044 2.35%Resource Based 11,463,000 45,945,478 55,958,483 6.94% GENTING PLANTATIONS BHD 1,250,000 7,637,283 13,800,000 1.71% IJM PLANTATIONS BHD 5,343,300 16,401,513 18,968,715 2.35% KUALA LUMPUR KEPONG BHD 300,000 4,236,447 7,470,000 0.93% KULIM M BHD 4,569,700 17,670,235 15,719,768 1.95%Technology 4,236,100 5,646,418 6,904,843 0.86% INARI AMERTRON BHD 4,236,100 5,646,418 6,904,843 0.86%Telecommunication & Cables 5,566,000 30,053,948 34,124,820 4.23% DIGI.COM BHD 2,000,000 9,491,727 9,920,000 1.23% MAXIS BHD 2,566,000 15,227,621 18,654,820 2.31% TELEKOM MALAYSIA BHD 1,000,000 5,334,600 5,550,000 0.69%Transport Services 3,513,800 6,222,926 6,219,426 0.77% MALAYSIAN BULK CARRIERS BHD 3,513,800 6,222,926 6,219,426 0.77%Utilities/Infrastructure 8,182,200 47,948,736 68,041,328 8.43% PUNCAK NIAGA HOLDINGS BHD 3,083,900 9,773,386 10,022,674 1.24% TENAGA NASIONAL BHD 5,098,300 38,175,350 58,018,654 7.19%TOTAL EQUITY SECURITIES 144,875,984 506,964,776 609,276,785 75.47%
DETAILS OFINVESTMENTS (CONT’D)As at 31 December 2013
67GREAT EASTERN LIFE ASSURANCE (MALAYSIA) BERHAD
UNIT FUNDS ANNUAL REPORT 2013

Lion Strategic Fund (Cont’d)Details of Investment as at 31 December 2013
FINANCIAL INSTRUMENTS WITH EMBEDDED DERIVATIVES
Quantity Held Cost Market Value
Market Value as a % of NAV
(in unit of shares) (RM) (RM) (%)
Gaming / Leisure 400,000 600,000 1,252,000 0.16% GENTING BHD 400,000 600,000 1,252,000 0.16%Resource Based 240,000 396,000 844,800 0.10% GENTING PLANTATIONS BHD 240,000 396,000 844,800 0.10%TOTAL FINANCIAL INSTRUMENTS WITH EMBEDDED DERIVATIVES 640,000 996,000 2,096,800 0.26%
UNIT AND PROPERTY TRUST FUNDS
Properties 36,669,700 43,187,283 46,235,210 5.74% CAPITAMALLS MALAYSIA TRUST 5,512,700 7,496,693 7,717,780 0.96% IGB REAL ESTATE INV TRUST 13,017,000 16,350,050 15,490,230 1.92% PAVILION REAL ESTATE INV TRUST 13,340,000 13,559,500 17,075,200 2.12% SUNWAY REAL ESTATE INV TRUST 4,800,000 5,781,040 5,952,000 0.74%TOTAL UNIT AND PROPERTY TRUST FUNDS 36,669,700 43,187,283 46,235,210 5.74%
DEPOSITS WITH FINANCIAL INSTITUTIONS
Short Term Money Market Clean Deposit 108,700,000 108,700,000 108,700,000 13.47%TOTAL DEPOSITS WITH FINANCIALINSTITUTIONS 108,700,000 108,700,000 108,700,000 13.47%
TOTAL INVESTMENTS 366,885,684 735,631,581 842,380,391 104.36%
Lion US-i FundDetails of Investment as at 31 December 2013
EQUITY SECURITIES Quantity Held Cost Market Value
Market Value as a % of NAV
(in unit of shares) (RM) (RM) (%)
Others 9,034 3,887,916 5,474,314 101.76% SPDR S&P 500 ETF TRUST 9,034 3,887,916 5,474,314 101.76%TOTAL EQUITY SECURITIES 9,034 3,887,916 5,474,314 101.76%
TOTAL INVESTMENTS 9,034 3,887,916 5,474,314 101.76%
DETAILS OFINVESTMENTS (CONT’D)As at 31 December 2013
68

Lion UK-i FundDetails of Investment as at 31 December 2013
EQUITY SECURITIES Quantity Held Cost Market Value
Market Value as a % of NAV
(in unit of shares) (RM) (RM) (%)
Others 98,874 2,821,863 3,574,499 100.74% ISHARES PLC 98,874 2,821,863 3,574,499 100.74%TOTAL EQUITIES 98,874 2,821,863 3,574,499 100.74%
TOTAL INVESTMENTS 98,874 2,821,863 3,574,499 100.74%
Lion AU-i FundDetails of Investment as at 31 December 2013
EQUITY SECURITIES Quantity Held Cost Market Value
Market Value as a % of NAV
(in unit of shares) (RM) (RM) (%)
Others 56,496 7,841,501 8,200,671 88.08% SPDR 56,496 7,841,501 8,200,671 88.08%TOTAL EQUITIES 56,496 7,841,501 8,200,671 88.08%
DEPOSITS WITH FINANCIAL INSTITUTIONS
Short Term Money Market Clean Deposit 1,820,000 1,820,000 1,820,000 19.55%TOTAL DEPOSITS WITH FINANCIALINSTITUTIONS 1,820,000 1,820,000 1,820,000 19.55%
TOTAL INVESTMENTS 1,876,496 9,661,501 10,020,671 107.63%
Lion Asia Pac FundDetails of Investment as at 31 December 2013
UNIT AND PROPERTY TRUST FUNDS Quantity Held Cost Market Value
Market Value as a % of NAV
(in unit of shares) (RM) (RM) (%)
Unit trust 181,685 810,156 899,392 98.37% LIONGLOBAL ASIA PACIFIC FUND 181,685 810,156 899,392 98.37%TOTAL UNIT AND PROPERTY TRUST FUNDS 181,685 810,156 899,392 98.37%
TOTAL INVESTMENTS 181,685 810,156 899,392 98.37%
DETAILS OFINVESTMENTS (CONT’D)As at 31 December 2013
69GREAT EASTERN LIFE ASSURANCE (MALAYSIA) BERHAD
UNIT FUNDS ANNUAL REPORT 2013

Lion Enhanced Equity FundDetails of Investment as at 31 December 2013
EQUITY SECURITIES Quantity Held Cost Market Value
Market Value as a % of NAV
(in unit of shares) (RM) (RM) (%)
Building Materials / Construction 12,071,600 18,865,322 21,523,876 10.95% ENGTEX GROUP BHD 1,800,000 3,083,400 2,916,000 1.48% GAMUDA BHD 1,260,000 5,003,657 6,048,000 3.08% JAKS RESOURCES BHD 4,855,200 2,594,318 2,451,876 1.25% KIMLUN CORPORATION BHD 359,000 538,500 656,970 0.33% KKB ENGINEERING BHD 2,080,700 4,487,231 5,555,469 2.83% MUHIBBAH ENGINEERING M BHD 1,636,200 2,930,016 3,730,536 1.90% WCT HOLDINGS BHD 80,500 228,200 165,025 0.08%Conglomerates 22,000 503,568 637,040 0.32% KEPPEL CORP LTD 22,000 503,568 637,040 0.32%Financial Services 2,439,906 11,752,874 11,803,262 6.02% IND & COMM BANK OF CHINA 300,000 626,372 663,698 0.34% MALAYAN BANKING BHD 392,307 3,501,566 3,899,532 1.99% MALAYSIA BUILDING SOCIETY BHD 1,050,000 2,078,335 1,729,000 0.88% RHB CAPITAL BHD 697,599 5,546,601 5,511,032 2.81%Gaming / Leisure 692,444 2,863,203 2,919,898 1.49% BERJAYA SPORTS TOTO BHD 342,444 1,481,453 1,386,898 0.71% GENTING MALAYSIA BHD 350,000 1,381,750 1,533,000 0.78%Media 3,337,200 5,335,283 5,479,509 2.79% MEDIA CHINESE INT'L LTD 1,940,900 1,770,221 1,892,378 0.96% MEDIA PRIMA BHD 1,213,800 2,933,983 3,180,156 1.62% STAR PUBLICATIONS M BHD 182,500 631,079 406,975 0.21%Others 3,626,000 10,981,808 14,781,653 7.53% BRAHIM'S HOLDINGS BHD 569,000 623,776 1,046,960 0.53% HARTALEGA HOLDINGS BHD 412,000 1,893,882 2,978,760 1.52% JT INTERNATIONAL BHD 3,400 18,228 22,032 0.01% KAREX BHD 502,000 928,700 2,093,340 1.07% KOSSAN RUBBER INDUSTRIES BHD 1,094,500 3,436,812 4,728,240 2.41% MBM RESOURCES BHD 982,100 3,643,468 3,152,541 1.60% UMW HOLDINGS BHD 63,000 436,942 759,780 0.39%
DETAILS OFINVESTMENTS (CONT’D)As at 31 December 2013
70

Lion Enhanced Equity Fund (Cont’d)Details of Investment as at 31 December 2013
EQUITY SECURITIES (Cont’d) Quantity Held Cost Market Value
Market Value as a % of NAV
(in unit of shares) (RM) (RM) (%)
Petroleum, Chemical & Gas 20,578,561 42,538,314 58,818,047 29.96% ALAM MARITIM RESOURCES BHD 3,283,000 2,889,114 5,154,310 2.62% BARAKAH OFFSHORE PETROLEUM BHD 2,132,000 1,961,440 3,261,960 1.66% BUMI ARMADA BHD 1,982,000 7,688,948 7,987,460 4.07% DIALOG GROUP BHD 1,509,760 3,490,374 5,404,941 2.75% M'SIA MARINE & HEAVY ENG HLDGS 1,177,500 4,666,618 4,121,250 2.10% PERDANA PETROLEUM BHD 2,798,600 2,398,800 4,449,774 2.27% PERISAI PETROLEUM TEKNOLOGI 3,234,000 3,854,860 5,142,060 2.62% PETRONAS CHEMICALS GROUP BHD 300,000 2,075,610 2,076,000 1.06% PETRONAS GAS BHD 72,800 959,720 1,767,584 0.90% SAPURAKENCANA PETROLEUM BHD 2,649,601 8,731,606 12,983,045 6.61% SEALINK INTERNATIONAL BHD 232,500 149,684 90,675 0.05% UMW OIL & GAS CORPORATION BHD 642,800 1,799,840 2,577,628 1.31% YINSON HOLDINGS BHD 564,000 1,871,700 3,801,360 1.94%Properties 1,976,400 4,760,622 4,503,860 2.29% EASTERN & ORIENTAL BHD 1,100,000 2,347,120 2,079,000 1.06% NAIM HOLDINGS BHD 276,400 775,102 1,008,860 0.51% UEM SUNRISE BHD 600,000 1,638,400 1,416,000 0.72%Resource Based 3,668,976 15,765,316 16,057,758 8.18% GENTING PLANTATIONS BHD 202,000 1,906,465 2,230,080 1.14% IJM PLANTATIONS BHD 1,587,600 5,382,258 5,635,980 2.87% KULIM M BHD 406,800 1,863,721 1,399,392 0.71% SARAWAK OIL PALMS BHD 697,100 4,303,714 4,538,121 2.31% TA ANN HOLDINGS BHD 432,976 1,725,610 1,805,510 0.92% WTK HOLDINGS BHD 342,500 583,548 448,675 0.23%Technology 4,139,700 4,704,544 9,277,315 4.72% GLOBETRONICS TECHNOLOGY BHD 1,642,600 2,169,022 5,207,042 2.65% INARI AMERTRON BHD 2,497,100 2,535,522 4,070,273 2.07%Telecommunication & Cables 1,194,300 5,106,066 5,923,728 3.02% DIGI.COM BHD 1,194,300 5,106,066 5,923,728 3.02%Transport Services 35,600 167,551 202,920 0.10% MISC BHD 35,600 167,551 202,920 0.10%Utilities / Infrastucture 4,494,300 16,037,966 19,446,060 9.90% KUMPULAN PERANGSANG SELANGOR 990,400 2,253,200 1,901,568 0.97% PUNCAK NIAGA HOLDINGS BHD 1,303,500 4,144,317 4,236,375 2.16% TENAGA NASIONAL BHD 994,600 7,473,853 11,318,547 5.76% WAH SEONG CORPORATION BHD 1,205,800 2,166,596 1,989,570 1.01%TOTAL EQUITY SECURITIES 58,276,987 139,382,437 171,374,926 87.27%
DETAILS OFINVESTMENTS (CONT’D)As at 31 December 2013
71GREAT EASTERN LIFE ASSURANCE (MALAYSIA) BERHAD
UNIT FUNDS ANNUAL REPORT 2013

Lion Enhanced Equity Fund (Cont’d)Details of Investment as at 31 December 2013
FINANCIAL INSTRUMENTS WITH EMBEDDED DERIVATIVES
Quantity Held Cost Market Value
Market Value as a % of NAV
(in unit of shares) (RM) (RM) (%)
Building Materials / Construction 78,000 149,437 100,350 0.06% IJM CORPORATION BHD 50,000 144,677 89,500 0.05% WCT HOLDINGS BHD 28,000 4,760 10,850 0.01%Others 200,000 20,000 32,000 0.02% PANTECH GROUP HOLDINGS BHD - 0.00% 7% Irredeemable Convertible Unsecured Loan Stock Due 21.12.2017 200,000 20,000 32,000 0.02%Petroleum, Chemical & Gas 12,480 - 13,978 0.01% DIALOG GROUP BHD 12,480 - 13,978 0.01%Resource Based 40,400 66,660 142,208 0.07% GENTING PLANTATIONS BHD 40,400 66,660 142,208 0.07%TOTAL FINANCIAL INSTRUMENTS WITHEMBEDDED DERIVATIVES 330,880 236,097 288,536 0.16%
UNIT AND PROPERTY TRUST FUNDS
Properties 465,817 1,078,184 1,365,084 0.69% AXIS REAL ESTATE INV TRUST 464,057 1,073,203 1,359,687 0.69% KEPPEL REIT 1,760 4,981 5,397 0.00%TOTAL UNIT AND PROPERTY TRUST FUNDS 465,817 1,078,184 1,365,084 0.69%
DEPOSITS WITH FINANCIAL INSTITUTIONS
Short Term Money Market Clean Deposit 18,570,000 18,570,000 18,570,000 9.45%TOTAL DEPOSITS WITHFINANCIAL INSTITUTIONS 18,570,000 18,570,000 18,570,000 9.45%
TOTAL INVESTMENTS 77,643,684 159,266,718 191,598,546 97.57%
DETAILS OFINVESTMENTS (CONT’D)As at 31 December 2013
72

Dana GemilangDetails of Investment as at 31 December 2013
EQUITY SECURITIES Quantity Held Cost Market Value
Market Value as a % of NAV
(in unit of shares) (RM) (RM) (%)
Building Materials / Construction 1,633,940 5,780,386 6,276,227 11.90% GAMUDA BHD 600,000 2,609,070 2,880,000 5.46% IJM CORPORATION BHD 300,000 1,642,046 1,764,000 3.34% MUHIBBAH ENGINEERING M BHD 555,000 1,020,700 1,265,400 2.40% WCT HOLDINGS BHD 178,940 508,570 366,827 0.70%Conglomerates 657,000 4,036,162 4,110,740 7.79% CAHYA MATA SARAWAK BHD 100,000 634,236 687,000 1.30% DRB-HICOM BHD 107,000 298,770 301,740 0.57% MMC CORPORATION BHD 175,000 511,838 504,000 0.96% SIME DARBY BHD 275,000 2,591,318 2,618,000 4.96%Others 1,123,000 3,660,066 4,728,290 8.96% BRAHIM'S HOLDINGS BHD 350,000 400,100 644,000 1.22% HARTALEGA HOLDINGS BHD 123,000 661,740 889,290 1.69% KOSSAN RUBBER INDUSTRIES BHD 600,000 1,982,626 2,592,000 4.91% UMW HOLDINGS BHD 50,000 615,600 603,000 1.14%Petroleum, Chemical & Gas 4,380,092 11,247,593 15,036,795 28.50% ALAM MARITIM RESOURCES BHD 1,100,000 1,144,408 1,727,000 3.27% BUMI ARMADA BHD 125,000 493,800 503,750 0.96% DAYANG ENTERPRISE HOLDINGS BHD 300,000 1,389,887 1,737,000 3.29% DIALOG GROUP BHD 500,080 1,240,639 1,790,286 3.39% M'SIA MARINE & HEAVY ENG HLDGS 450,000 1,692,450 1,575,000 2.99% PERDANA PETROLEUM BHD 560,000 480,000 890,400 1.69% PETRONAS CHEMICALS GROUP BHD 200,000 1,356,120 1,384,000 2.62% SAPURAKENCANA PETROLEUM BHD 650,012 2,050,290 3,185,059 6.04% UMW OIL & GAS CORPORATION BHD 400,000 1,255,599 1,604,000 3.04% YINSON HOLDINGS BHD 95,000 144,400 640,300 1.21%Properties 849,999 982,385 1,021,497 1.94% GLOMAC BHD 800,000 869,387 896,000 1.70% IOI PROPERTIES GROUP BHD 49,999 112,998 125,497 0.24%Resource Based 720,500 4,219,532 4,641,767 8.80% IJM PLANTATIONS BHD 170,300 522,643 604,565 1.15% IOI CORPORATION BHD 100,000 474,242 471,000 0.89% KUALA LUMPUR KEPONG BHD 60,000 1,252,337 1,494,000 2.83% SARAWAK OIL PALMS BHD 190,200 1,164,707 1,238,202 2.35% TA ANN HOLDINGS BHD 200,000 805,603 834,000 1.58%Technology 1,400,000 2,015,606 3,360,000 6.37% GLOBETRONICS TECHNOLOGY BHD 700,000 1,332,753 2,219,000 4.21% INARI AMERTRON BHD 700,000 682,853 1,141,000 2.16%Telecommunication & Cables 760,000 3,526,043 4,349,000 8.24% AXIATA GROUP BHD 250,000 1,508,569 1,725,000 3.27% DIGI.COM BHD 350,000 1,361,571 1,736,000 3.29% TELEKOM MALAYSIA BHD 160,000 655,903 888,000 1.68%
DETAILS OFINVESTMENTS (CONT’D)As at 31 December 2013
73GREAT EASTERN LIFE ASSURANCE (MALAYSIA) BERHAD
UNIT FUNDS ANNUAL REPORT 2013

Dana Gemilang (Cont’d)Details of Investment as at 31 December 2013
EQUITY SECURITIES (Cont’d) Quantity Held Cost Market Value
Market Value as a % of NAV
(in unit of shares) (RM) (RM) (%)
Utilities / Infrastucture 675,000 3,955,827 5,445,751 10.32% PUNCAK NIAGA HOLDINGS BHD 275,000 859,507 893,751 1.69% TENAGA NASIONAL BHD 400,000 3,096,320 4,552,000 8.63%TOTAL EQUITY SECURITIES 12,199,531 39,423,600 48,970,067 92.82%
FINANCIAL INSTRUMENTS WITH EMBEDDED DERIVATIVES
Building Materials / Construction 67,120 98,805 76,110 0.14% IJM CORPORATION BHD 36,000 98,805 64,440 0.12% WCT HOLDINGS BHD 31,120 - 11,670 0.02%Petroleum, Chemical & Gas 9,440 - 10,573 0.02% DIALOG GROUP BHD 9,440 - 10,573 0.02%TOTAL FINANCIAL INSTRUMENTS WITHEMBEDDED DERIVATIVES 76,560 98,805 86,683 0.16%
UNIT AND PROPERTY TRUST FUNDS
Properties 131,303 311,716 384,718 0.73% AXIS REAL ESTATE INVESTMENT TRUST 131,303 311,716 384,718 0.73%TOTAL UNIT AND PROPERTY TRUST FUNDS 131,303 311,716 384,718 0.73%
DEPOSITS WITH FINANCIAL INSTITUTIONS
Short Term Money Market Clean Deposit 6,440,000 6,440,000 6,440,000 12.21%TOTAL DEPOSITS WITH FINANCIALINSTITUTIONS 6,440,000 6,440,000 6,440,000 12.21%
TOTAL INVESTMENTS 18,847,394 46,274,121 55,881,468 105.92%
DETAILS OFINVESTMENTS (CONT’D)As at 31 December 2013
74

Smart Invest Gain FundDetails of Investment as at 31 December 2013
FINANCIAL INSTRUMENTS WITH EMBEDDED DERIVATIVES
Quantity Held Cost Market Value
Market Value as a % of NAV
(in unit of shares) (RM) (RM) (%)
Financial Services 30,000,000 26,685,000 25,944,000 91.22% CIMB BANK BERHAD 30,000,000 26,685,000 25,944,000 91.22%TOTAL FINANCIAL INSTRUMENTS WITHEMBEDDED DERIVATIVES 30,000,000 26,685,000 25,944,000 91.22%
DEPOSITS WITH FINANCIAL INSTITUTIONS
Short Term Money Market Clean Deposit 2,400,000 2,400,000 2,400,000 8.44%TOTAL DEPOSITS WITH FINANCIALINSTITUTIONS 2,400,000 2,400,000 2,400,000 8.44%
TOTAL INVESTMENTS 32,400,000 29,085,000 28,344,000 99.66%
DETAILS OFINVESTMENTS (CONT’D)As at 31 December 2013
75GREAT EASTERN LIFE ASSURANCE (MALAYSIA) BERHAD
UNIT FUNDS ANNUAL REPORT 2013

76 NOTES TO THE FINANCIAL STATEMENTS
1. The Manager and its Principal Activities Centennial Max Fund, Dana Restu, Dana Sejati, Lion Balanced Fund, Lion Fixed Income Fund, Lion Growth Fund,
Lion Progressive Fund, Lion Strategic Fund, Lion US-i Fund, Lion UK-i Fund, Lion AU-i Fund, Lion Asia Pac Fund, Lion Enhanced Equity Fund, Dana Gemilang and Smart Invest Gain Fund (collectively referred to as “the Funds”) are managed by Great Eastern Life Assurance (Malaysia) Berhad (“Manager”). The Manager is a public limited liability company, incorporated and domiciled in Malaysia and licensed under the Financial Services Act, 2013. Its principal activity is the underwriting of life insurance business.
The financial statements were authorised for issue by the Board of Directors of the Manager in accordance with a resolution dated 24 January 2014.
2. Summary of Significant Accounting Policiesa. Basis of Preparation The financial statements have been prepared in accordance with Malaysian Financial Reporting Standards
(“MFRS”), Guidelines/Circulars issued by Bank Negara Malaysia (“BNM”), and the Financial Services Act, 2013. These financial statements also comply with International Financial Reporting Standards (“IFRS”) as issued by the International Accounting Standards Board (“IASB”).
The financial statements are presented in Ringgit Malaysia (“RM”).
The Centennial Max Fund had matured on 15 July 2013. Consequently, the financial statements of this Fund has been prepared on a basis other than going concern. The assets of the Fund has been stated at its respective recoverable values and all liabilities of the Fund, including the estimated expenses upon maturity of the Fund, has been recognised.
At the beginning of the current financial year, the Funds had fully adopted new and revised MFRSs, amendments to MFRS and Issues Committee (“IC”) Interpretations as described fully in Note 4 (a).
The financial statements of the Company have been prepared on a historical cost basis except as disclosed in the accounting policies below.
b. Revenue Recognition Revenue is recognised when it is probable that the economic benefits associated with the transactions will
flow to the Funds and the amount of the revenue can be measured reliably.
i. Interest income is recognised on a time proportion basis that reflects the effective yield on the asset.
ii. Dividend income is recognised on a declared basis when the shareholders’ right to receive payment is established.
iii. Proceeds arising from disposal of investments are set off against the weighted average cost of investments. The resulting gains or losses are taken to the Statement of Comprehensive Income.

77GREAT EASTERN LIFE ASSURANCE (MALAYSIA) BERHAD
UNIT FUNDS ANNUAL REPORT 2013
NOTES TO THE FINANCIAL STATEMENTS (CONT’D)
2. Summary of Significant Accounting Policies (Cont’d)c. Financial Instruments Financial instruments are recognised in the Balance Sheet when a fund has become a party to the contractual
provisions of the instruments.
Financial instruments are classified as liabilities or equity in accordance with the substance of the contractual arrangements. Financial instruments are offset when the fund has a legally enforceable right to offset and intends to settle either on a net basis or to realise the asset and settle the liability simultaneously.
Regular way purchase and sales of all categories of investments in financial instruments are recognised on trade dates i.e. dates on which the Funds commit to purchase or sell the financial instruments.
The Funds classify the investments in accordance to MFRS 139 (Financial Instruments – Recognition and Measurement) at fair value through profit or loss (“FVTPL”) or loans and receivables (“LAR”), as appropriate. Financial assets are classified as FVTPL where the Funds’ documented investment strategy is to manage financial assets on a fair value basis.
i. FVTPL Financial assets classified as FVTPL are all financial assets acquired with the intention to sell in the near
future. These investments are recorded at fair value at inception. Subsequent to initial recognition, these investments are re-measured at fair value in which changes in fair value and realised gains and losses are recognised in the Statement of Comprehensive Income. Transaction costs are recognised in the Statement of Comprehensive Income as incurred.
Financial assets classified as FVTPL include equities, fixed income securities, derivatives and embedded derivatives.
Derivatives are financial instruments or contracts where its values vary according to changes in interest rates, foreign exchange rates, credit spreads or other variables. Embedded derivatives are hybrid financial instruments that include a non-derivative host contract.
ii. LAR LAR are non-derivative financial assets with fixed or determinable payments that are not quoted in an
active market. These investments are initially recognised at cost, being the fair value consideration paid for the acquisition of the investment. All transaction costs directly attributable to the acquisition are also included in the cost of investment. Subsequent to initial measurement, LAR are measured at amortised cost, using the effective yield method, less a provision for impairment. Gains and losses are recognised in the Statement of Comprehensive Income when assets are derecognised or impaired, as well as through the amortisation process.

78 NOTES TO THE FINANCIAL STATEMENTS (CONT’D)
2. Summary of Significant Accounting Policies (Cont’d)c. Financial Instruments (Cont’d) Fair value of Financial Assets
The fair value of financial assets that are actively traded in organised financial markets is determined by reference to quoted market prices at the Balance Sheet date.
The fair value for investments in quoted unit and property trusts is determined by reference to published Net Asset Values.
For financial instruments where there is no active market such as unquoted fixed income securities i.e. unquoted bonds, the estimated fair values are based on the average indicative yield to maturity obtained from licensed financial institutions.
The fair value of floating rate and over-night deposits with financial institutions is its carrying value. The carrying value is the cost of the deposit/placement.
Financial Instruments: Derecognition of Financial Assets and Liabilities
A financial asset is derecognised when:
i. The contractual right to receive cash flows from the financial asset has expired.
ii. The fund retains the contractual rights to receive cash flows from the asset but has assumed an obligation to pay them in full without material delay to a third party.
iii The fund has transferred its rights to receive cash flows from the asset and either (a) has transferred substantially all the risks and rewards of the asset, or (b) has neither transferred nor retained substantially all the risks and rewards of the asset, but has transferred control of the asset.
Impairment of Financial Assets
The fund assess at the Balance Sheet date whether there is any objective evidence that a financial asset or group of financial assets is impaired.
Assets carried at Cost
If there is objective evidence that an impairment loss on a financial asset carried at cost has been incurred, the carrying amount will be written down to the recoverable amount. Such impairment losses are not reversed in subsequent periods.
79GREAT EASTERN LIFE ASSURANCE (MALAYSIA) BERHAD
UNIT FUNDS ANNUAL REPORT 2013
NOTES TO THE FINANCIAL STATEMENTS (CONT’D)
2. Summary of Significant Accounting Policies (Cont’d)c. Financial Instruments (Cont’d) Assets carried at Amortised Cost
If there is objective evidence that an impairment loss on a financial asset carried at amortised cost has been incurred, the amount of the impairment loss is measured as the difference between the asset’s carrying amount and the present value of estimated future cash flows discounted at the financial asset’s original effective interest rate/yield. The carrying amount of the asset is reduced and the loss is recorded in the Statement of Comprehensive Income.
If, in a subsequent period, the amount of the impairment loss decreases and the decrease can be related objectively to an event occurring after the impairment was recognised, the previously recognised impairment loss is reversed to the extent that the carrying amount of the asset does not exceed its amortised cost at the reversal date. The amount of loss is recognised in the Statement of Comprehensive Income.
d. Fair value Measurement The fund measures financial instruments, such as, derivatives, and non-financial assets such as investment
properties, at fair value at each balance sheet date.
Fair value is the price that would be received to sell an asset or paid to transfer a liability in an orderly transaction between market participants at the measurement date. The fair value measurement is based on the presumption that the transaction to sell the asset or transfer the liability takes place either:
- In the principal market for the asset or liability, or- In the absence of a principal market, in the most advantageous market for the asset or liability
The principal or the most advantageous market must be accessible to by the fund.
The fair value of an asset or a liability is measured using the assumptions that market participants would use when pricing the asset or liability, assuming that market participants act in their economic best interest.
A fair value measurement of a non-financial asset takes into account a market participant’s ability to generate economic benefits by using the asset in its highest and best use or by selling it to another market participant that would use the asset in its highest and best use.
The fund uses valuation techniques that are appropriate in the circumstances and for which sufficient data are available to measure fair value, maximising the use of relevant observable inputs and minimising the use of unobservable inputs.
All assets and liabilities for which fair value is measured or disclosed in the financial statements are categorised within the fair value hierarchy, described as follows, based on the lowest level input that is significant to the fair value measurement as a whole:
- Level 1 - Quoted (unadjusted) market prices in active markets for identical assets or liabilities
- Level 2 - Valuation techniques for which the lowest level input that is significant to the fair value measurement is directly or indirectly observable
- Level 3 - Valuation techniques for which the lowest level input that is significant to the fair value measurement is unobservable

80
2. Summary of Significant Accounting Policies (Cont’d)d. Fair value Measurement (Cont’d) For assets and liabilities that are recognised in the financial statements on a recurring basis, the Funds
determine whether transfers have occurred between Levels in the hierarchy by re-assessing categorisation (based on the lowest level input that is significant to the fair value measurement as a whole) at the end of each reporting period.
For the purpose of fair value disclosures, the Funds have determined classes of assets and liabilities on the basis of the nature, characteristics and risks of the asset or liability and the level of the fair value hierarchy as explained above.
e. Other Receivables Other receivables are non-derivative financial assets with fixed or determinable payments. These include
balances due from brokers and other investment receivables. Receivables are recognised initially at fair value.
Receivables that are individually determined to be impaired at the reporting date relate to debtors that are in significant financial difficulties and have defaulted on payments. These receivables are not secured by any collateral or credit enhancements.
f. Financial Liabilities Financial liabilities within the scope of MFRS 139 are recognised in the Balance Sheet when a fund becomes
a party to the contractual obligations of the financial instrument.
Financial liabilities are recognised when due and measured on initial recognition at the fair value of the consideration received plus directly attributable transaction costs. Subsequent to initial recognition, financial liabilities are measured at amortised cost using the effective yield method, except for derivatives, which are measured at fair value.
A financial liability is derecognised when the obligation under the liability is discharged, cancelled or has expired. Gains and losses are recognised in the Statement of Comprehensive Income.
g. Other Payables Other payables are recognised initially at fair value plus directly attributable transaction costs and is
subsequently measured at amortised cost using the effective interest method.
Payables are derecognised when the obligation under the liability is extinguished. Gains and losses are recognised in Statement of Comprehensive Income when the liabilities are derecognised, and through the amortisation process.
NOTES TO THE FINANCIAL STATEMENTS (CONT’D)

81GREAT EASTERN LIFE ASSURANCE (MALAYSIA) BERHAD
UNIT FUNDS ANNUAL REPORT 2013
2. Summary of Significant Accounting Policies (Cont’d)h. Income Tax Income tax on the Statement of Comprehensive Income for the year comprises current and deferred tax.
Current tax is the expected amount of income taxes payable in respect of the taxable profit/surplus for the year and is measured using the tax rates that have been enacted at the Balance Sheet date.
Deferred tax is provided for, using the liability method, on temporary differences at the Balance Sheet date between the tax bases of assets and liabilities and their carrying amounts in the financial statements. In principle, deferred tax liabilities are recognised for all taxable temporary differences and deferred tax assets are recognised for all deductible temporary differences, unused tax losses and unused tax credits to the extent that it is probable that taxable profits will be available against which the deductible temporary differences, unused tax losses and unused tax credits can be utilised.
Deferred tax is measured at the tax rates that are expected to apply in the period when the asset is realised or the liability is settled, based on tax rates that have been enacted or substantively enacted at the Balance Sheet date. Deferred tax is recognised in the Statement of Comprehensive Income.
i. Foreign Currency Transactions In preparing the financial statements of the Funds, transactions in currencies other than the Funds’ functional
currency (foreign currencies) are recorded in the functional currency using the exchange rates prevailing at the dates of transactions. At each Balance Sheet date, monetary items denominated in foreign currencies are translated at the rates prevailing on the Balance Sheet date. Non-monetary items carried at fair value that are denominated in foreign currencies are translated at the rates prevailing on the date when the fair value was determined.
Exchange differences arising on the settlement of monetary items and on the translation of monetary items are included in the Statement of Comprehensive Income for the year.
The principal exchange rates of foreign currency ruling at Balance Sheet date used are as follows:
2013 2012RM RM
i. United States Dollar 3.28 3.06ii. British Pound 5.42 4.97iii. Australian Dollar 2.92 3.18iv. Singapore Dollar 2.59 2.50v. Hong Kong Dollar 0.42 0.39
j. Amounts Received from Units Created Amounts received from units created represent premiums paid by policyholders as payment for a new contract
or subsequent payments to increase the amount of that contract. Net creation of units is recognised on a receipts basis.
k. Amounts Paid for Units Cancelled Amounts paid for units cancelled represent cancellations of units arising from surrenders and withdrawals.
NOTES TO THE FINANCIAL STATEMENTS (CONT’D)

82
2. Summary of Significant Accounting Policies (Cont’d)l. Investment Charge Investment charge is calculated in accordance with the provisions of the policy document.
m. Cash and Cash Equivalents For the purpose of the cash flow statements, cash and cash equivalents consist of cash and bank balances
excluding fixed and call deposits. The cash flow statements have been prepared using an indirect method.
3. Contingent Liabilities and Commitments At 31 December 2013, the Funds have no material contingent liabilities or commitments that are not included in the
financial statements.
4. Change in Accounting Policies and Standards Issued but Not Yet Effectivea. Changes in Accounting Policies The Funds applied, for the first time, certain new standards and amendments in 2013. These include MFRS 13
Fair Value Measurement, MFRS 10 Consolidated Financial Statements, MFRS 11 Joint Arrangements, MFRS 119 Employee Benefits (Revised 2011), MFRS 12 Disclosure of Interests in Other Entities and amendments to MFRS 1 Presentation of Financial Statements. However, the application of these standards and amendments do not impact the annual financial statements of the Funds.
b. Standards Issued but Not Yet Effective As at the date of authorisation of these financial statements, the following MFRSs, amendments to MFRSs
and IC Interpretations have been issued by the Malaysian Accounting Standards Board (“MASB”) but are not yet effective and have not been adopted by the Fund.
Effective for financial periods beginning on or after 1 January 2014• AmendmentstoMFRS132OffsettingFinancialAssetsandFinancialLiabilities• AmendmentstoMFRS10,MFRS12andMFRS127InvestmentEntities• AmendmentstoMFRS136RecoverableAmountDisclosuresforNon-FinancialAssets• AmendmentstoMFRS139NovationofDerivativesandContinuationofHedgeAccounting• ICInterpretation21Levies
Effective for financial periods beginning on or after 1 January 2015• MFRS9FinancialInstruments
The Fund expects that the adoption of the above standards and interpretations will have no material impact on the financial statements in the period of initial application.
NOTES TO THE FINANCIAL STATEMENTS (CONT’D)

83GREAT EASTERN LIFE ASSURANCE (MALAYSIA) BERHAD
UNIT FUNDS ANNUAL REPORT 2013
5. Investments
CENTENNIAL MAX FUND DANA RESTU DANA SEJATI15.07.2013 31.12.2012 2013 2012 2013 2012
RM RM RM RM RM RM
The Fund’s investments are summarised by categories as follows:
Loans and receivables (“LAR”) 235,500,000 300,000 60,150,000 191,970,000 15,550,000 5,150,000
Fair value through profit and loss (“FVTPL”) - 231,171,822 826,046,186 533,957,342 73,375,915 69,298,946
235,500,000 231,471,822 886,196,186 725,927,342 88,925,915 74,448,946
The following investments mature after 12 months:
Fair value through profit and loss (“FVTPL”) - - 2,426,659 - 65,634,185 63,238,696
None of the investments held under LAR mature after 12 months.
(a) LAR Cost / Fair Value
Fixed and call deposits with licensed banks 235,500,000 300,000 60,150,000 191,970,000 15,550,000 5,150,000
The carrying value of the fixed and call deposits with licensed banks approximates fair value due to relatively short term maturities.
NOTES TO THE FINANCIAL STATEMENTS (CONT’D)

84
5. Investments (Cont’d)
LION BALANCED FUND LION FIXED INCOME FUND LION GROWTH FUND2013 2012 2013 2012 2013 2012
RM RM RM RM RM RM
The Fund’s investments are summarised by categories as follows:
Loans and receivables (“LAR”) 62,390,000 27,290,000 42,300,000 38,610,000 31,250,000 133,080,000
Fair value through profit and loss (“FVTPL”) 188,284,187 141,448,153 476,152,046 408,054,119 731,312,897 519,504,730
250,674,187 168,738,153 518,452,046 446,664,119 762,562,897 652,584,730
The following investments mature after 12 months:
Fair value through profit and loss (“FVTPL”) 23,303,283 56,293,601 393,155,250 348,923,594 3,249,598 1,025,255
None of the investments held under LAR mature after 12 months.
(a) LAR Cost / Fair Value
Fixed and call deposits with licensed banks 62,390,000 27,290,000 42,300,000 38,610,000 31,250,000 133,080,000
The carrying value of the fixed and call deposits with licensed banks approximates fair value due to relatively short term maturities.
NOTES TO THE FINANCIAL STATEMENTS (CONT’D)

85GREAT EASTERN LIFE ASSURANCE (MALAYSIA) BERHAD
UNIT FUNDS ANNUAL REPORT 2013
5. Investments (Cont’d)
LION PROGRESSIVE FUND LION STRATEGIC FUND LION US-I FUND2013 2012 2013 2012 2013 2012
RM RM RM RM RM RM
The Fund’s investments are summarised by categories as follows:
Loans and receivables (“LAR”) 59,290,000 63,580,000 108,700,000 91,120,000 - -
Fair value through profit and loss (“FVTPL”) 789,078,251 620,112,677 733,680,391 485,443,678 5,474,314 3,254,763
848,368,251 683,692,677 842,380,391 576,563,678 5,474,314 3,254,763
The following investments mature after 12 months:
Fair value through profit and loss (“FVTPL”) 21,542,761 130,410,085 28,241,800 152,506,350 - -
None of the investments held under LAR mature after 12 months.
(a) LAR Cost / Fair Value
Fixed and call deposits with licensed banks 59,290,000 63,580,000 108,700,000 91,120,000 - -
The carrying value of the fixed and call deposits with licensed banks approximates fair value due to relatively short term maturities.
NOTES TO THE FINANCIAL STATEMENTS (CONT’D)

86
5. Investments (Cont’d)
LION UK-I FUND LION AU-I FUND LION ASIA PAC FUND2013 2012 2013 2012 2013 2012
RM RM RM RM RM RM
The Fund’s investments are summarised by categories as follows:
Loans and receivables (“LAR”) - - 1,820,000 600,000 - -
Fair value through profit and loss (“FVTPL”) 3,574,499 2,670,568 8,200,671 8,434,626 899,392 1,584,284
3,574,499 2,670,568 10,020,671 9,034,626 899,392 1,584,284
None of the investments held under LAR mature after 12 months.
(a) LAR Cost / Fair Value
Fixed and call deposits with licensed banks - - 1,820,000 600,000 - -
The carrying value of the fixed and call deposits with licensed banks approximates fair value due to relatively short term maturities.
NOTES TO THE FINANCIAL STATEMENTS (CONT’D)

87GREAT EASTERN LIFE ASSURANCE (MALAYSIA) BERHAD
UNIT FUNDS ANNUAL REPORT 2013
5. Investments (Cont’d)
LION ENHANCED EQUITY FUND DANA GEMILANG
SMART INVEST GAIN
FUND2013 2012 2013 2012 2013
RM RM RM RM RM
The Fund’s investments are summarised by categories as follows:
Loans and receivables (“LAR”) 18,570,000 12,850,000 6,440,000 3,810,000 2,400,000
Fair value through profit and loss (“FVTPL”) 173,028,546 69,766,490 49,441,468 21,807,183 25,944,000
191,598,546 82,616,490 55,881,468 25,617,183 28,344,000
The following investments mature after 12 months:
Fair value through profit and loss (“FVTPL”) 199,036 19,000 22,243 - 25,944,000
None of the investments held under LAR mature after 12 months.
(a) LAR Cost / Fair Value
Fixed and call deposits with licensed banks 18,570,000 12,850,000 6,440,000 3,810,000 2,400,000
The carrying value of the fixed and call deposits with licensed banks approximates fair value due to relatively short term maturities.
NOTES TO THE FINANCIAL STATEMENTS (CONT’D)

88
5. Investments (Cont’d)
CENTENNIAL MAX FUND DANA RESTU DANA SEJATI15.07.2013 31.12.2012 2013 2012 2013 2012
RM RM RM RM RM RM
(b) FVTPLCostHeld-for-TradingMalaysian government
securities - - - - 10,412,354 11,707,424Debt securities: Unquoted in Malaysia - - - - 63,103,575 56,733,230Equity securities: Quoted in Malaysia - - 641,551,318 404,957,358 - -Financial Instruments
with embedded derivatives - 223,660,988 2,133,953 1,469,267 - -
Unit and property trust funds:
Quoted in Malaysia - - 6,743,762 6,666,815 - -- 223,660,988 650,429,033 413,093,440 73,515,929 68,440,654
Fair valueHeld-for-TradingMalaysian government
securities - - - - 10,610,045 11,697,470Debt securities: Unquoted in Malaysia - - - - 62,765,870 57,601,476Equity securities: Quoted in Malaysia - - 811,738,787 521,207,087 - -Financial Instruments
with embedded derivatives - 231,171,822 3,988,762 1,802,539 - -
Unit and property trust funds:
Quoted in Malaysia - - 10,318,637 10,947,716 - -- 231,171,822 826,046,186 533,957,342 73,375,915 69,298,946
NOTES TO THE FINANCIAL STATEMENTS (CONT’D)

89GREAT EASTERN LIFE ASSURANCE (MALAYSIA) BERHAD
UNIT FUNDS ANNUAL REPORT 2013
5. Investments (Cont’d)
LION BALANCED FUNDLION FIXED
INCOME FUND LION GROWTH FUND2013 2012 2013 2012 2013 2012
RM RM RM RM RM RM
(b) FVTPL (Cont’d)CostHeld-for-TradingMalaysian government
securities - 5,949,050 41,938,000 49,538,700 - -Debt securities: Unquoted in Malaysia 51,795,510 52,786,300 434,617,196 351,584,860 - -Equity securities: Quoted in Malaysia 109,818,987 71,457,669 - - 602,291,947 381,938,081Financial Instruments
with embedded derivatives 2,936,541 1,427,614 - - 2,749,500 2,067,173
Unit and property trust funds:
Quoted in Malaysia - 3,281,978 - - 3,633,851 39,586,052164,551,038 134,902,611 476,555,196 401,123,560 608,675,298 423,591,306
Fair valueHeld-for-TradingMalaysian government
securities - 5,993,867 42,205,000 49,723,753 - -Debt securities: Unquoted in Malaysia 52,024,796 53,844,115 433,947,046 358,330,366 - -Equity securities: Quoted in Malaysia 133,075,609 76,143,894 - - 720,430,169 456,123,014Financial Instruments
with embedded derivatives 3,183,782 1,539,497 - - 4,123,060 1,737,208
Unit and property trust funds:
Quoted in Malaysia - 3,926,780 - - 6,759,668 61,644,508188,284,187 141,448,153 476,152,046 408,054,119 731,312,897 519,504,730
NOTES TO THE FINANCIAL STATEMENTS (CONT’D)

90
5. Investments (Cont’d)
LION PROGRESSIVE FUND LION STRATEGIC FUND LION US-I FUND
2013 2012 2013 2012 2013 2012RM RM RM RM RM RM
(b) FVTPL (Cont’d)CostHeld-for-TradingMalaysian government
securities - 11,052,400 - 9,997,850 - -Debt securities: Unquoted in Malaysia 44,833,500 117,069,340 75,783,522 150,803,700 - -Equity securities: Quoted in Malaysia 599,835,292 364,291,639 506,964,776 248,305,148 - - Quoted outside
Malaysia - - - - 3,887,916 2,879,549Financial Instruments
with embedded derivatives 4,936,827 692,950 996,000 2,029,617 - -
Unit and property trust funds:
Quoted in Malaysia 1,947,720 39,694,392 43,187,283 28,923,170 - -651,553,339 532,800,721 626,931,581 440,059,485 3,887,916 2,879,549
Fair valueHeld-for-TradingMalaysian government
securities - 11,140,430 - 10,081,300 - -Debt securities: Unquoted in Malaysia 45,007,096 119,507,630 76,071,596 152,427,250 - -Equity securities: Quoted in Malaysia 734,322,997 428,762,883 609,276,785 283,675,546 - - Quoted outside
Malaysia - - - - 5,474,314 3,254,763Financial Instruments
with embedded derivatives 6,502,260 808,264 2,096,800 1,807,772 - -
Unit and property trust funds:
Quoted in Malaysia 3,245,898 59,893,470 46,235,210 37,451,810 - -789,078,251 620,112,677 733,680,391 485,443,678 5,474,314 3,254,763
NOTES TO THE FINANCIAL STATEMENTS (CONT’D)
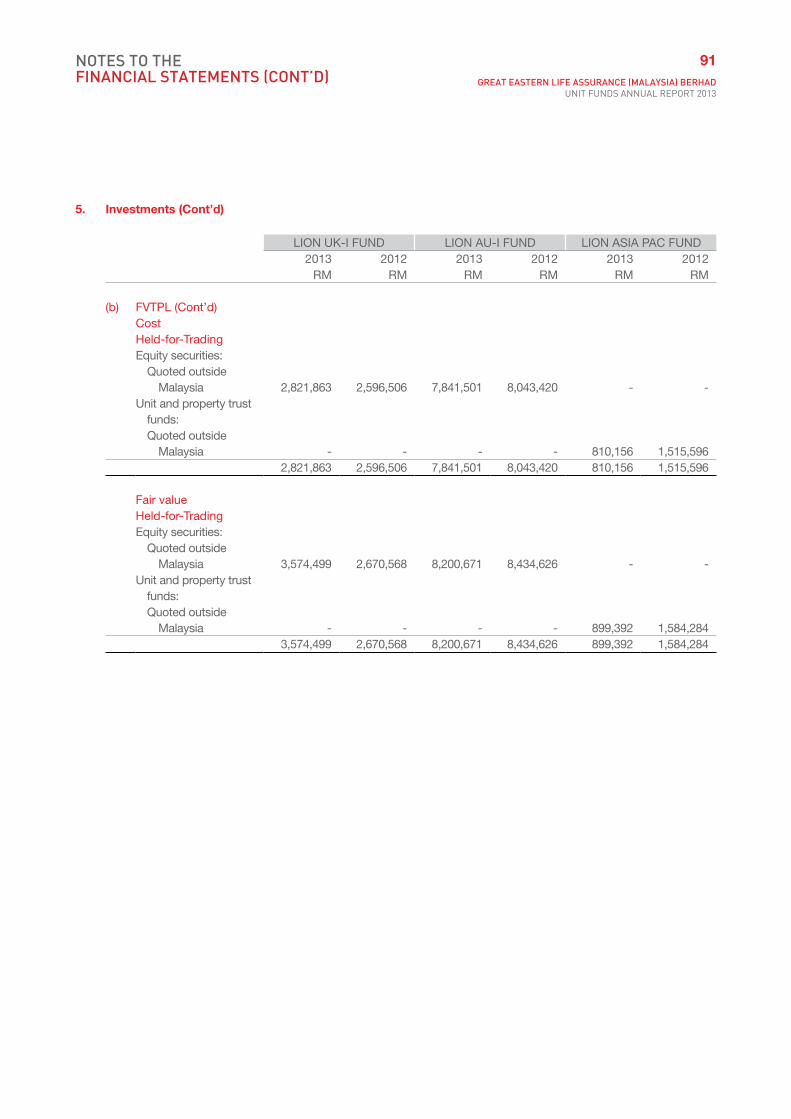
91GREAT EASTERN LIFE ASSURANCE (MALAYSIA) BERHAD
UNIT FUNDS ANNUAL REPORT 2013
5. Investments (Cont’d)
LION UK-I FUND LION AU-I FUND LION ASIA PAC FUND2013 2012 2013 2012 2013 2012
RM RM RM RM RM RM
(b) FVTPL (Cont’d)CostHeld-for-TradingEquity securities: Quoted outside Malaysia 2,821,863 2,596,506 7,841,501 8,043,420 - -Unit and property trust
funds: Quoted outside Malaysia - - - - 810,156 1,515,596
2,821,863 2,596,506 7,841,501 8,043,420 810,156 1,515,596
Fair valueHeld-for-TradingEquity securities: Quoted outside Malaysia 3,574,499 2,670,568 8,200,671 8,434,626 - -Unit and property trust
funds: Quoted outside Malaysia - - - - 899,392 1,584,284
3,574,499 2,670,568 8,200,671 8,434,626 899,392 1,584,284
NOTES TO THE FINANCIAL STATEMENTS (CONT’D)

92
5. Investments (Cont’d)
LION ENHANCED EQUITY FUND DANA GEMILANG
SMART INVEST
GAIN FUND2013 2012 2013 2012 2013
RM RM RM RM RM
(b) FVTPL (Cont’d)CostHeld-for-TradingEquity securities: Quoted in Malaysia 138,252,497 56,893,986 39,423,600 17,937,577 - Quoted outside Malaysia 1,129,940 1,452,712 - 245,971 -Financial Instruments with
embedded derivatives 236,097 169,438 98,805 131,505 26,685,000Unit and property trust funds: Quoted in Malaysia 1,073,203 3,120,868 311,716 308,849 - Quoted outside
Malaysia 4,981 2,120,961 - - -140,696,718 63,757,965 39,834,121 18,623,902 26,685,000
Fair valueHeld-for-TradingEquity securities: Quoted in Malaysia 170,074,188 61,381,127 48,970,067 21,032,546 - Quoted outside
Malaysia 1,300,738 1,759,529 - 272,642 -Financial Instruments with
embedded derivatives 288,536 96,924 86,683 93,821 25,944,000Unit and property trust funds: Quoted in Malaysia 1,359,687 4,103,813 384,718 408,174 - Quoted outside
Malaysia 5,397 2,425,097 - - -173,028,546 69,766,490 49,441,468 21,807,183 25,944,000
NOTES TO THE FINANCIAL STATEMENTS (CONT’D)

93GREAT EASTERN LIFE ASSURANCE (MALAYSIA) BERHAD
UNIT FUNDS ANNUAL REPORT 2013
5. Investments (Cont’d)
CENTENNIAL MAX FUND DANA RESTU DANA SEJATI15.07.2013 31.12.2012 2013 2012 2013 2012
RM RM RM RM RM RM
(c) Fair Values of Financial Investments
The following table shows financial investments recorded at fair value analysed by the different basis of fair values as follows:
FVTPLQuoted market price - - 826,046,186 533,957,342 - -Valuation techniques -
market observable inputs - 231,171,822 - - 73,375,915 69,298,946
- 231,171,822 826,046,186 533,957,342 73,375,915 69,298,946
LION BALANCED FUNDLION FIXED
INCOME FUND LION GROWTH FUND2013 2012 2013 2012 2013 2012
RM RM RM RM RM RM
FVTPLQuoted market price 136,259,391 81,610,171 - - 731,312,897 519,504,730Valuation techniques -
market observable inputs 52,024,796 59,837,982 476,152,046 408,054,119 - -
188,284,187 141,448,153 476,152,046 408,054,119 731,312,897 519,504,730
LION PROGRESSIVE FUND
LION STRATEGIC FUND LION US-I FUND
2013 2012 2013 2012 2013 2012RM RM RM RM RM RM
FVTPLQuoted market price 744,071,155 489,464,617 657,608,795 322,935,128 5,474,314 3,254,763Valuation techniques -
market observable inputs 45,007,096 130,648,060 76,071,596 162,508,550 - -
789,078,251 620,112,677 733,680,391 485,443,678 5,474,314 3,254,763
NOTES TO THE FINANCIAL STATEMENTS (CONT’D)

94
5. Investments (Cont’d)
LION UK-I FUND LION AU-I FUND LION ASIA PAC FUND2013 2012 2013 2012 2013 2012
RM RM RM RM RM RM
(c) Fair Values of Financial Investments (Cont’d)
FVTPLQuoted market price 3,574,499 2,670,568 8,200,671 8,434,626 899,392 1,584,284
LION ENHANCED EQUITY FUND DANA GEMILANG
SMART INVEST
GAIN FUND2013 2012 2013 2012 2013
RM RM RM RM RM
FVTPLQuoted market price 173,028,546 69,766,490 49,441,468 21,807,183 Valuation techniques -
market observable inputs - - - - 25,944,000 173,028,546 69,766,490 49,441,468 21,807,183 25,944,000
6. Deferred Tax Assets/(Liabilities)
CENTENNIAL MAX FUND DANA RESTU DANA SEJATINote 15.07.2013 31.12.2012 2013 2012 2013 2012
RM RM RM RM RM RM
At 1 January (600,869) 458,845 (9,682,800) (5,539,328) (109,047) (187,108)Recognised in the
Statement of Comprehensive Income 9 599,380 (1,059,714) (4,367,759) (4,143,472) 74,684 78,061
At 31 December (1,489) (600,869) (14,050,559) (9,682,800) (34,363) (109,047)
LION BALANCED FUND LION FIXED INCOME FUND LION GROWTH FUNDNote 2013 2012 2013 2012 2013 2012
RM RM RM RM RM RM
At 1 January (583,573) (200,128) (822,364) (1,052,733) (7,685,483) (7,545,248)Recognised in the
Statement of Comprehensive Income 9 (1,342,921) (383,445) 522,515 230,369 (2,126,430) (140,235)
At 31 December (1,926,494) (583,573) (299,849) (822,364) (9,811,913) (7,685,483)
NOTES TO THE FINANCIAL STATEMENTS (CONT’D)

95GREAT EASTERN LIFE ASSURANCE (MALAYSIA) BERHAD
UNIT FUNDS ANNUAL REPORT 2013
6. Deferred Tax Assets/(Liabilities) (Cont’d)
LION PROGRESSIVE FUND LION STRATEGIC FUND LION US-I FUNDNote 2013 2012 2013 2012 2013 2012
RM RM RM RM RM RM
At 1 January (7,136,455) (4,553,224) (3,756,366) (1,956,391) (31,887) (12,269)Recognised in the
Statement of Comprehensive Income 9 (3,905,413) (2,583,231) (4,850,148) (1,799,975) (96,879) (19,618)
At 31 December (11,041,868) (7,136,455) (8,606,514) (3,756,366) (128,766) (31,887)
LION UK-I FUND LION AU-I FUND LION ASIA PAC FUNDNote 2013 2012 2013 2012 2013 2012
RM RM RM RM RM RM
At 1 January (5,929) 12,577 (31,281) 47,693 (5,495) 6,773Recognised in the
Statement of Comprehensive Income 9 (53,181) (18,506) (605) (78,974) (1,601) (12,268)
At 31 December (59,110) (5,929) (31,886) (31,281) (7,096) (5,495)
LION ENHANCED EQUITY FUND DANA GEMILANG
SMART INVEST
GAIN FUNDNote 2013 2012 2013 2012 2013
RM RM RM RM RM
At 1 January (482,147) (212,196) (254,798) (56,314) -Recognised in the Statement of
Comprehensive Income 9 (2,106,482) (269,951) (516,794) (198,484) 57,148At 31 December (2,588,629) (482,147) (771,592) (254,798) 57,148
7. Other Assets
CENTENNIAL MAX FUND DANA RESTU DANA SEJATI15.07.2013 31.12.2012 2013 2012 2013 2012
RM RM RM RM RM RM
Amount Due From Other Funds - - - 507,449 1,597,895 1,569,253
Interest, Dividend and Other Receivables 18,601 25 2,564,846 1,105,700 569,551 504,801
Amount Due From Brokers - 2,344,148 5,548,442 - - -
Tax Recoverable - 26,453 - 365,107 - -Total Other Assets 18,601 2,370,626 8,113,288 1,978,256 2,167,446 2,074,054
NOTES TO THE FINANCIAL STATEMENTS (CONT’D)

96
7. Other Assets (Cont’d)
LION BALANCED FUND LION FIXED INCOME FUND LION GROWTH FUND2013 2012 2013 2012 2013 2012
RM RM RM RM RM RM
Amount Due From Other Funds 5,601,369 3,458,537 3,685,009 5,339,493 - -
Interest, Dividend and Other Receivables 474,085 761,543 4,151,276 3,348,989 1,553,093 727,164
Amount Due From Brokers 330,669 571,603 - - - -
Total Other Assets 6,406,123 4,791,683 7,836,285 8,688,482 1,553,093 727,164
LION PROGRESSIVE FUND LION STRATEGIC FUND LION US-I FUND2013 2012 2013 2012 2013 2012
RM RM RM RM RM RM
Amount Due From Other Funds 1,987,369 - 4,908,403 3,697,006 14,159 -
Amount Due From Intermediaries - 7 - - - -
Interest, Dividend and Other Receivables 1,344,986 2,583,749 1,750,106 1,850,007 20,378 16,348
Amount Due From Brokers 958,974 26,418 - 2,009,756 - -
Total Other Assets 4,291,329 2,610,174 6,658,509 7,556,769 34,537 16,348
LION UK-I FUND LION AU-I FUND LION ASIA PAC FUND2013 2012 2013 2012 2013 2012
RM RM RM RM RM RM
Amount Due From Other Funds 3,794 6,150 - - - -
Interest, Dividend and Other Receivables - - 258,285 224,289 - -
Amount Due From Brokers - - 2,018,242 1 - -
Tax Recoverable - - - - 13,509 9,562 Total Other Assets 3,794 6,150 2,276,527 224,290 13,509 9,562
NOTES TO THE FINANCIAL STATEMENTS (CONT’D)

97GREAT EASTERN LIFE ASSURANCE (MALAYSIA) BERHAD
UNIT FUNDS ANNUAL REPORT 2013
7. Other Assets (Cont’d)
LION ENHANCED EQUITY FUND DANA GEMILANG
SMART INVEST
GAIN FUND2013 2012 2013 2012 2013
RM RM RM RM RM
Amount Due From Other Funds 7,623,721 3,082,336 - 725,388 -Amount Due From Intermediaries - 20 - - -Interest, Dividend and Other
Receivables 227,596 65,521 145,737 24,706 26,653Amount Due From Brokers 1 3 - - -Tax Recoverable - - - 63,174 -Total Other Assets 7,851,318 3,147,880 145,737 813,268 26,653
8 Financial Liabilities/Other Payables
CENTENNIAL MAX FUND DANA RESTU DANA SEJATI15.07.2013 31.12.2012 2013 2012 2013 2012
RM RM RM RM RM RM
Financial Liabilities Amount Due to
Broker - - 19,327,681 3,633,746 - -Other Payables Provision for
Outstanding Claims - - 33,245,362 27,253,652 - - Sundry Creditors and
Other Liabilities 3,794 9,648 3,383 22,983 355 2,165 Amount Due to
Intermediaries - - - 61,352 - 5,979 Amount Due to
Other Funds - 2,275,015 342,345 - - -3,794 2,284,663 33,591,090 27,337,987 355 8,1443,794 2,284,663 52,918,771 30,971,733 355 8,144
NOTES TO THE FINANCIAL STATEMENTS (CONT’D)

98
8 Financial Liabilities/Other Payables (Cont’d)
LION BALANCED FUND LION FIXED INCOME FUND LION GROWTH FUND2013 2012 2013 2012 2013 2012
RM RM RM RM RM RM
Financial Liabilities Amount Due to
Broker 2,996,835 3,242,233 - - 2,141,239 - Other Payables Provision for
Outstanding Claims 1,701 1,394 109,048 105,633 - - Sundry Creditors and
Other Liabilities 927 4,144 2,049 12,443 3,014 21,898 Amount Due to
Intermediaries - 32,333 - 10,500 - 146,334 Amount Due to
Other Funds - - - - 138,621 149,291 2,628 37,871 111,097 128,576 141,635 317,523
2,999,463 3,280,104 111,097 128,576 2,282,874 317,523
LION PROGRESSIVE FUND LION STRATEGIC FUND LION US-I FUND2013 2012 2013 2012 2013 2012
RM RM RM RM RM RM
Financial Liabilities Amount Due to
Broker 1,416,499 - 29,702,142 1,083,134 - - Other Payables Provision for
Outstanding Claims 877,433 749,364 - - - - Sundry Creditors and
Other Liabilities 3,307 20,547 3,045 14,910 20 117 Amount Due to
Intermediaries - - - 50,331 - - Amount Due to
Other Funds - 864,459 - - - 91,601 880,740 1,634,370 3,045 65,241 20 91,718
2,297,239 1,634,370 29,705,187 1,148,375 20 91,718
NOTES TO THE FINANCIAL STATEMENTS (CONT’D)

99GREAT EASTERN LIFE ASSURANCE (MALAYSIA) BERHAD
UNIT FUNDS ANNUAL REPORT 2013
8 Financial Liabilities/Other Payables (Cont’d)
LION UK-I FUND LION AU-I FUND LION ASIA PAC FUND2013 2012 2013 2012 2013 2012
RM RM RM RM RM RM
Other Payables Sundry Creditors and
Other Liabilities 14 84 5,313 314 3 27 Amount Due to
Other Funds - - 2,922,463 1,657,277 67,858 613,684 14 84 2,927,776 1,657,591 67,861 613,711 14 84 2,927,776 1,657,591 67,861 613,711
LION ENHANCED EQUITY FUND DANA GEMILANG
SMART INVEST
GAIN FUND2013 2012 2013 2012 2013
RM RM RM RM RM
Financial Liabilities Amount Due to Broker 351,439 861,928 1,869,144 - - Other Payables Sundry Creditors and
Other Liabilities 1,274 1,180 336 434 87 Amount Due to
Other Funds - - 1,130,488 - 3,207 1,274 1,180 1,130,824 434 3,294
352,713 863,108 2,999,968 434 3,294
9. Taxation
CENTENNIAL MAX FUND DANA RESTU DANA SEJATINote 15.07.2013 31.12.2012 2013 2012 2013 2012
RM RM RM RM RM RM
Income Tax: Current Year’s
Provision 1,023,862 11,927 3,558,504 43,195 379,662 460,424 Deferred Tax: Relating to
Origination and Reversal of Temporary Differences 6 (599,380) 1,059,714 4,367,759 4,143,472 (74,684) (78,061)
Tax Expense for the Year 424,482 1,071,641 7,926,263 4,186,667 304,978 382,363
NOTES TO THE FINANCIAL STATEMENTS (CONT’D)

100
9. Taxation (Cont’d)
LION BALANCED FUND LION FIXED INCOME FUND LION GROWTH FUNDNote 2013 2012 2013 2012 2013 2012
RM RM RM RM RM RM
Income Tax: Current Year’s
Provision 1,913,780 355,770 2,242,534 2,211,146 4,483,869 3,553,834 Deferred Tax: Relating to
Origination and Reversal of Temporary Differences 6 1,342,921 383,445 (522,515) (230,369) 2,126,430 140,235
Tax Expense for the Year 3,256,701 739,215 1,720,019 1,980,777 6,610,299 3,694,069
LION PROGRESSIVE FUND LION STRATEGIC FUND LION US-I FUNDNote 2013 2012 2013 2012 2013 2012
RM RM RM RM RM RM
Income Tax: Current Year’s
Provision 3,538,863 1,241,015 2,085,093 1,264,272 47,358 25,025 Deferred Tax: Relating to
Origination and Reversal of Temporary Differences 6 3,905,413 2,583,231 4,850,148 1,799,975 96,879 19,618
Tax Expense for the Year 7,444,276 3,824,246 6,935,241 3,064,247 144,237 44,643
LION UK-I FUND LION AU-I FUND LION ASIA PAC FUNDNote 2013 2012 2013 2012 2013 2012
RM RM RM RM RM RM
Income Tax: Current Year’s
Provision 7,517 5,113 32,984 50,879 (3,946) (4,246)Deferred Tax: Relating to
Origination and Reversal of Temporary Differences 6 53,181 18,506 605 78,974 1,601 12,268
Tax Expense/(Credit) for the Year 60,698 23,619 33,589 129,853 (2,345) 8,022
NOTES TO THE FINANCIAL STATEMENTS (CONT’D)

101GREAT EASTERN LIFE ASSURANCE (MALAYSIA) BERHAD
UNIT FUNDS ANNUAL REPORT 2013
9. Taxation (Cont’d)
LION ENHANCED EQUITY FUND DANA GEMILANG
SMART INVEST
GAIN FUNDNote 2013 2012 2013 2012 2013
RM RM RM RM RM
Income Tax: Current Year’s
Provision 378,885 222,198 205,732 (38,743) 45 Deferred Tax: Relating to Origination
and Reversal of Temporary Differences 6 2,106,482 269,951 516,794 198,484 (57,148)
Tax Expense/(Credit) for the Year 2,485,367 492,149 722,526 159,741 (57,103)
The tax charge for the year is in respect of investment income and net gains on disposal of investments, net of investment expenses at the rate applicable to that of the Fund.
A reconciliation of income tax expense applicable to the excess of income over expenditure/(expenditure over income) before taxation at the income tax rate applicable to the Fund, to income tax expense at the effective income tax rate is as follows:
CENTENNIAL MAX FUND DANA RESTU DANA SEJATI15.07.2013 31.12.2012 2013 2012 2013 2012
RM RM RM RM RM RM
Excess of Income Over Expenditure Before Taxation 5,304,824 13,392,802 120,144,032 70,421,966 2,822,257 4,490,870
Tax at Rate 8% (2012: 8%) 424,386 1,071,424 9,611,523 5,633,757 225,781 359,270
Non-deductible Expenses/(Income Not Subject to Tax) 96 217 (1,685,260) (1,447,090) 79,197 23,093
Tax Expense for the Year 424,482 1,071,641 7,926,263 4,186,667 304,978 382,363
NOTES TO THE FINANCIAL STATEMENTS (CONT’D)

102
9. Taxation (Cont’d)
LION BALANCED FUND LION FIXED INCOME FUND LION GROWTH FUND2013 2012 2013 2012 2013 2012
RM RM RM RM RM RM
Excess of Income Over Expenditure Before Taxation 42,865,341 11,747,119 16,667,707 22,570,097 101,844,028 63,766,398
Tax at Rate 8% (2012: 8%) 3,429,227 939,770 1,333,417 1,805,608 8,147,522 5,101,312
(Income Not Subject to Tax)/Non-deductible Expenses (172,526) (200,555) 386,602 175,169 (1,537,223) (1,407,243)
Tax Expense for the Year 3,256,701 739,215 1,720,019 1,980,777 6,610,299 3,694,069
LION PROGRESSIVE FUND LION STRATEGIC FUND LION US-I FUND2013 2012 2013 2012 2013 2012
RM RM RM RM RM RM
Excess of Income Over Expenditure Before Taxation 111,521,044 66,155,780 100,611,899 46,154,859 1,454,024 296,332
Tax at Rate 8% (2012: 8%) 8,921,684 5,292,462 8,048,952 3,692,389 116,322 23,707
(Income Not Subject to Tax)/Non-deductible Expenses (1,477,408) (1,468,216) (1,113,711) (628,142) 27,915 20,936
Tax Expense for the Year 7,444,276 3,824,246 6,935,241 3,064,247 144,237 44,643
LION UK-I FUND LION AU-I FUND LION ASIA PAC FUND2013 2012 2013 2012 2013 2012
RM RM RM RM RM RM
Excess of Income Over Expenditure Before Taxation 772,027 293,742 401,675 1,169,831 (19,792) 106,148
Tax at Rate 8% (2012: 8%) 61,762 23,499 32,134 93,586 (1,583) 8,492
(Income Not Subject to Tax)/Non-deductible Expenses (1,064) 120 1,455 36,267 (762) (470)
Tax Expense/(Credit) for the Year 60,698 23,619 33,589 129,853 (2,345) 8,022
NOTES TO THE FINANCIAL STATEMENTS (CONT’D)
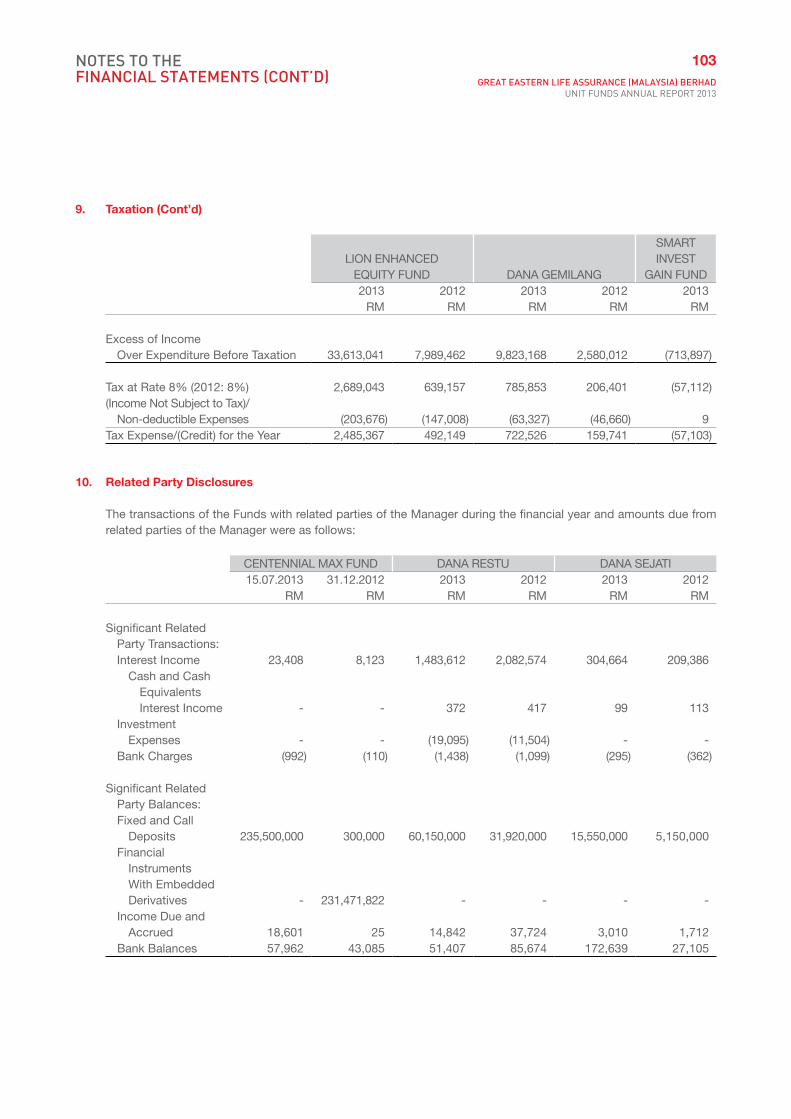
103GREAT EASTERN LIFE ASSURANCE (MALAYSIA) BERHAD
UNIT FUNDS ANNUAL REPORT 2013
9. Taxation (Cont’d)
LION ENHANCED EQUITY FUND DANA GEMILANG
SMART INVEST
GAIN FUND2013 2012 2013 2012 2013
RM RM RM RM RM
Excess of Income Over Expenditure Before Taxation 33,613,041 7,989,462 9,823,168 2,580,012 (713,897)
Tax at Rate 8% (2012: 8%) 2,689,043 639,157 785,853 206,401 (57,112)(Income Not Subject to Tax)/
Non-deductible Expenses (203,676) (147,008) (63,327) (46,660) 9 Tax Expense/(Credit) for the Year 2,485,367 492,149 722,526 159,741 (57,103)
10. Related Party Disclosures
The transactions of the Funds with related parties of the Manager during the financial year and amounts due from related parties of the Manager were as follows:
CENTENNIAL MAX FUND DANA RESTU DANA SEJATI15.07.2013 31.12.2012 2013 2012 2013 2012
RM RM RM RM RM RM
Significant Related Party Transactions:Interest Income 23,408 8,123 1,483,612 2,082,574 304,664 209,386
Cash and Cash Equivalents Interest Income - - 372 417 99 113
Investment Expenses - - (19,095) (11,504) - -
Bank Charges (992) (110) (1,438) (1,099) (295) (362)
Significant Related Party Balances:Fixed and Call
Deposits 235,500,000 300,000 60,150,000 31,920,000 15,550,000 5,150,000Financial
Instruments With Embedded Derivatives - 231,471,822 - - - -
Income Due and Accrued 18,601 25 14,842 37,724 3,010 1,712
Bank Balances 57,962 43,085 51,407 85,674 172,639 27,105
NOTES TO THE FINANCIAL STATEMENTS (CONT’D)

104
10. Related Party Disclosures (Cont’d)
LION BALANCED FUND LION FIXED INCOME FUND LION GROWTH FUND2013 2012 2013 2012 2013 2012
RM RM RM RM RM RM
Significant Related Party Transactions:Interest Income 475,234 341,277 285,784 414,106 472,767 759,163
Investment Expenses (15,914) (8,653) - - (16,910) (14,941)
Bank Charges (1,862) (1,702) (1,240) (1,025) (1,610) (1,677)
Significant Related Party Balances:Fixed and Call
Deposits 34,890,000 27,290,000 42,300,000 2,560,000 17,050,000 23,600,000Income Due and
Accrued 5,501 11,112 6,144 358 3,255 7,871Bank Balances 60,964 24,996 54,452 47,306 54,736 98,013
LION PROGRESSIVE FUND LION STRATEGIC FUND LION US-I FUND2013 2012 2013 2012 2013 2012
RM RM RM RM RM RM
Significant Related Party Transactions:Interest Income 573,012 622,721 642,418 648,854 752 265
Investment Expenses (22,922) (16,087) (10,706) (8,437) - -
Bank Charges (1,957) (1,624) (1,662) (1,414) (1,089) (949)
Significant Related Party Balances:Fixed and Call
Deposits 39,590,000 20,700,000 47,520,000 44,150,000 - -Income Due and
Accrued 5,530 8,811 6,653 15,429 - -Bank Balances 63,769 105,573 66,740 34,432 16,462 51,327
NOTES TO THE FINANCIAL STATEMENTS (CONT’D)

105GREAT EASTERN LIFE ASSURANCE (MALAYSIA) BERHAD
UNIT FUNDS ANNUAL REPORT 2013
10. Related Party Disclosures (Cont’d)
LION UK-I FUND LION AU-I FUND LION ASIA PAC FUND2013 2012 2013 2012 2013 2012
RM RM RM RM RM RM
Significant Related Party Transactions:Interest Income - - 14,128 6,562 6,460 6,247Bank Charges (924) (1,262) (955) (1,525) (416) (1,037)
Significant Related Party Balances:Fixed and Call
Deposits - - 1,820,000 600,000 - -Income Due and
Accrued - - 177 197 - -Bank Balances 5,713 11,371 46,176 52,194 76,320 22,802
LION ENHANCED EQUITY FUND DANA GEMILANG
SMART INVEST
GAIN FUND2013 2012 2013 2012 2013
RM RM RM RM RM
Significant Related Party Transactions:Interest Income 317,469 185,125 121,292 78,334 27,208Cash and Cash Equivalents Interest
Income - - 135 150 -Investment Expenses (5,880) (4,962) (4,762) (2,082) -Bank Charges (1,004) (1,010) (730) (492) (18)
Significant Related Party Balances:Fixed and Call Deposits 18,570,000 12,850,000 6,440,000 3,810,000 2,400,000Income Due and Accrued 3,233 2,873 987 1,444 26,653Bank Balances 86,035 177,578 44,458 79,655 15,538
The Manager is of the opinion that the transactions above have been entered into in the normal course of business and have been established on terms and conditions that are not materially different from those obtainable in transactions with unrelated parties.
The related company is OCBC (M) Berhad.
NOTES TO THE FINANCIAL STATEMENTS (CONT’D)

106
11. Financial Risk Management Frameworka. The Funds are exposed to different financial risks arising from the use of financial instruments. The key financial
risks include interest rate risk, foreign currency risk, equity price risk, credit spread risk, cash flow and liquidity risk, credit risk and concentration risk.
(i) Interest rate risk The Funds are exposed to interest rate risk through its investments in fixed income instruments and as
such will incur an economic loss when interest rates rise. In the event of rising interest rates, prices of fixed income securities will decrease and vice versa. This risk can be mitigated by managing the duration structure of the fixed income portfolio.
(ii) Foreign currency risk Investments denominated in foreign currencies are limited to 50% of the sum of all Investment-linked
funds’ net asset value as prescribed by the regulator. Fluctuations of exchange rates may affect the net asset value attributable to unit holders of the Funds. (Refer to table no.11(a)).
(iii) Equity price risk Exposure in equity price risk exists in funds that have direct equity investment, where the fund bears all
of the volatility in returns and investment performance risk.
(iv) Credit spread risk Exposure to credit spread risk exists in the Funds that invest in bonds. Credit spread is the difference
between the corporate yields against risk-free rate of the same tenure. When spreads widen, it generally implies that the market is factoring more risk of default. A widening in credit spreads will result in a fall in the values of the Funds’ bond portfolio.
(v) Cash flow and liquidity risk Cash flow and liquidity risk arises when a company is unable to meet its obligations at reasonable
cost when required to do so. This typically happens when the investments in the portfolio are illiquid. Demands for funds can usually be met through ongoing normal operations, premiums received, and sale of assets or borrowings. Unexpected demands for liquidity may be triggered by negative publicity, deterioration of the economy, reports of problems in other companies in the same or similar lines of business, unanticipated policy withdrawals, or other unexpected cash demands from unitholders.
Expected liquidity demands are managed through a combination of treasury, investment and asset-liability management practices, which are monitored on an ongoing basis.
Actual and projected cash inflows and outflows are monitored and a reasonable amount of assets are kept in liquid instruments at all times.
Unexpected liquidity demands are managed through a combination of product design, diversification limits, investment strategies and systematic monitoring. (Refer to tables no. 11(b)(i) and (b)(ii)).
NOTES TO THE FINANCIAL STATEMENTS (CONT’D)

107GREAT EASTERN LIFE ASSURANCE (MALAYSIA) BERHAD
UNIT FUNDS ANNUAL REPORT 2013
11. Financial Risk Management Framework (Cont’d)
(vi) Credit risk Funds are exposed to credit risk through investment in bonds, which may result in financial loss due to
credit default by the borrower or counterparty. In addition, financial loss may also materialise as a result of the widening credit spread or downgrade of credit rating.
The task of evaluating and monitoring credit risk is undertaken by the Manager’s Credit Risk Committee, which in turn reports to its Asset Liability Committee (“ALC”). The credit limits are actively monitored and reviewed on a regular basis. The creditworthiness of banks is assessed on an annual basis by reviewing their financial strength through published credit ratings and other publicly available financial information. (Refer to table no. 11(c)).
(vii) Concentration risk An important element of managing both market and credit risk is to actively manage concentration
to specific issuers, counterparties, industry sectors, countries and currencies. The Manager’s internal procedures are in place to ensure compliance with regulatory limits.
b. Sensitivity analysis on financial risks The analysis shown in Table 11(d) is performed for reasonably possible movements in key variables with all
other variables constant. The correlation of variables will have a significant effect in determining the ultimate fair value and/or amortised cost of financial assets, but to demonstrate the impact due to changes in variable, these variables have to be changed on an individual basis. It should be noted that the movements in these variables are non-linear.
The impact on net realised income/loss represents the effect caused by changes in fair value of financial assets whose fair values are recorded in Statement of Comprehensive Income.
NOTES TO THE FINANCIAL STATEMENTS (CONT’D)
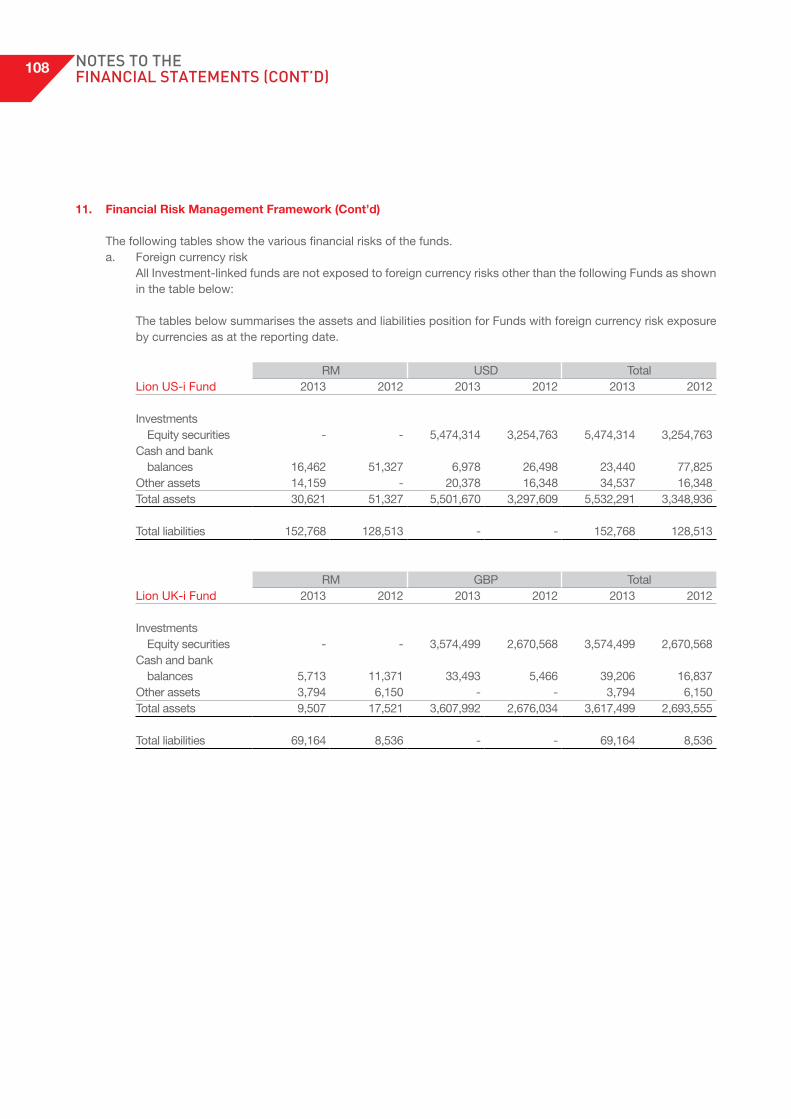
108
11. Financial Risk Management Framework (Cont’d)
The following tables show the various financial risks of the funds.a. Foreign currency risk All Investment-linked funds are not exposed to foreign currency risks other than the following Funds as shown
in the table below:
The tables below summarises the assets and liabilities position for Funds with foreign currency risk exposure by currencies as at the reporting date.
RM USD Total Lion US-i Fund 2013 2012 2013 2012 2013 2012
Investments Equity securities - - 5,474,314 3,254,763 5,474,314 3,254,763Cash and bank
balances 16,462 51,327 6,978 26,498 23,440 77,825Other assets 14,159 - 20,378 16,348 34,537 16,348Total assets 30,621 51,327 5,501,670 3,297,609 5,532,291 3,348,936
Total liabilities 152,768 128,513 - - 152,768 128,513
RM GBP TotalLion UK-i Fund 2013 2012 2013 2012 2013 2012
Investments Equity securities - - 3,574,499 2,670,568 3,574,499 2,670,568Cash and bank
balances 5,713 11,371 33,493 5,466 39,206 16,837Other assets 3,794 6,150 - - 3,794 6,150Total assets 9,507 17,521 3,607,992 2,676,034 3,617,499 2,693,555
Total liabilities 69,164 8,536 - - 69,164 8,536
NOTES TO THE FINANCIAL STATEMENTS (CONT’D)

109GREAT EASTERN LIFE ASSURANCE (MALAYSIA) BERHAD
UNIT FUNDS ANNUAL REPORT 2013
11. Financial Risk Management Framework (Cont’d)a. Foreign currency risk (Cont’d)
RM AUD Total Lion AU-i Fund 2013 2012 2013 2012 2013 2012
Investments Equity securities - - 8,200,671 8,434,626 8,200,671 8,434,626 Deposits with
financial institutions 1,820,000 600,000 - - 1,820,000 600,000Cash and bank
balances 46,176 52,194 4,435 31,355 50,611 83,549Other assets 177 198 2,276,350 224,092 2,276,527 224,290Total assets 1,866,353 652,392 10,481,456 8,690,073 12,347,809 9,342,465
Total liabilities 3,037,758 1,734,768 - - 3,037,758 1,734,768
RM SGD Total Lion Asia Pac Fund 2013 2012 2013 2012 2013 2012
Investments Unit and property
trust funds - - 899,392 1,584,284 899,392 1,584,284 Deposits with
financial institutions - - - - - -Cash and bank
balances 76,320 22,802 - - 76,320 22,802Other assets 13,509 9,562 - - 13,509 9,562Total assets 89,829 32,364 899,392 1,584,284 989,221 1,616,648
Total liabilities 74,957 619,206 - - 74,957 619,206
NOTES TO THE FINANCIAL STATEMENTS (CONT’D)

110
11. Financial Risk Management Framework (Cont’d)a. Foreign currency risk (Cont’d)
RM SGD HKD TotalLion Enhanced Equity Fund 2013 2012 2013 2012 2013 2012 2013 2012
Investments Equity securities 170,074,188 61,381,127 637,040 1,108,769 663,698 650,760 171,374,926 63,140,656 Financial Instruments With Embedded Derivatives 288,536 96,924 - - - - 288,536 96,924 Unit and property trust funds 1,359,687 4,103,813 5,397 2,425,097 - - 1,365,084 6,528,910 Deposits with financial institutions 18,570,000 12,850,000 - - - - 18,570,000 12,850,000 Cash and bank balances 86,035 177,578 210,884 413,007 32,694 657,986 329,613 1,248,571 Other assets 7,851,318 3,147,880 - - - - 7,851,318 3,147,880 Total assets 198,229,764 81,757,322 853,321 3,946,873 696,392 1,308,746 199,779,477 87,012,941
Total liabilities 3,354,435 1,496,464 - - - - 3,354,435 1,496,464
RM SGD HKD TotalDana Gemilang 2013 2012 2013 2012 2013 2012 2013 2012
Investments Equity securities 48,970,067 21,032,546 - 272,642 - - 48,970,067 21,305,188 Financial Instruments With Embedded Derivatives 86,683 93,821 - - - - 86,683 93,821 Unit and property trust funds 384,718 408,174 - - - - 384,718 408,174 Deposits with financial institutions 6,440,000 3,810,000 - - - - 6,440,000 3,810,000 Cash and bank balances 44,458 79,655 316,558 23,882 249,472 233,045 610,488 336,582 Other assets 145,737 813,268 - - - - 145,737 813,268 Total assets 56,071,663 26,237,464 316,558 296,524 249,472 233,045 56,637,693 26,767,033
Total liabilities 3,894,933 255,232 - - - - 3,894,933 255,232
NOTES TO THE FINANCIAL STATEMENTS (CONT’D)

111GREAT EASTERN LIFE ASSURANCE (MALAYSIA) BERHAD
UNIT FUNDS ANNUAL REPORT 2013
11. Financial Risk Management Framework (Cont’d)a. Foreign currency risk (Cont’d)
RM SGD HKD TotalLion Enhanced Equity Fund 2013 2012 2013 2012 2013 2012 2013 2012
Investments Equity securities 170,074,188 61,381,127 637,040 1,108,769 663,698 650,760 171,374,926 63,140,656 Financial Instruments With Embedded Derivatives 288,536 96,924 - - - - 288,536 96,924 Unit and property trust funds 1,359,687 4,103,813 5,397 2,425,097 - - 1,365,084 6,528,910 Deposits with financial institutions 18,570,000 12,850,000 - - - - 18,570,000 12,850,000 Cash and bank balances 86,035 177,578 210,884 413,007 32,694 657,986 329,613 1,248,571 Other assets 7,851,318 3,147,880 - - - - 7,851,318 3,147,880 Total assets 198,229,764 81,757,322 853,321 3,946,873 696,392 1,308,746 199,779,477 87,012,941
Total liabilities 3,354,435 1,496,464 - - - - 3,354,435 1,496,464
RM SGD HKD TotalDana Gemilang 2013 2012 2013 2012 2013 2012 2013 2012
Investments Equity securities 48,970,067 21,032,546 - 272,642 - - 48,970,067 21,305,188 Financial Instruments With Embedded Derivatives 86,683 93,821 - - - - 86,683 93,821 Unit and property trust funds 384,718 408,174 - - - - 384,718 408,174 Deposits with financial institutions 6,440,000 3,810,000 - - - - 6,440,000 3,810,000 Cash and bank balances 44,458 79,655 316,558 23,882 249,472 233,045 610,488 336,582 Other assets 145,737 813,268 - - - - 145,737 813,268 Total assets 56,071,663 26,237,464 316,558 296,524 249,472 233,045 56,637,693 26,767,033
Total liabilities 3,894,933 255,232 - - - - 3,894,933 255,232
11. Financial Risk Management Framework (Cont’d)a. Foreign currency risk (Cont’d)
NOTES TO THE FINANCIAL STATEMENTS (CONT’D)

112
11. Financial Risk Management Framework (Cont’d)b. Cash flow and liquidity risk
i. The following table shows the maturity profile of the Funds’ financial liabilities and the expected recovery or settlement of financial assets based on contractual undiscounted cash flow basis.
CARRYING VALUE UP TO A YEAR 1 - 5 YEARS > 5 YEARS NO MATURITY DATE TOTAL15.07.2013 31.12.2012 15.07.2013 31.12.2012 15.07.2013 31.12.2012 15.07.2013 31.12.2012 15.07.2013 31.12.2012 15.07.2013 31.12.2012
Centennial Max Fund RM RM RM RM RM RM RM RM RM RM RM RM
Financial investments LAR 235,500,000 300,000 235,518,601 300,173 - - - - - - 235,518,601 300,173 FVTPL - 231,171,822 - 235,432,618 - - - - - - - 235,432,618 Cash and bank balances 57,962 43,085 57,962 43,085 - - - - - - 57,962 43,085 Other assets 18,601 2,370,626 18,601 2,370,626 - - - - - - 18,601 2,370,626 Total assets 235,576,563 233,885,533 235,595,164 238,146,502 - - - - - - 235,595,164 238,146,502
Other liabilities 1,002,691 2,885,532 1,002,691 2,885,532 - - - - - - 1,002,691 2,885,532 Total liabilities 1,002,691 2,885,532 1,002,691 2,885,532 - - - - - - 1,002,691 2,885,532
CARRYING VALUE UP TO A YEAR 1 - 5 YEARS > 5 YEARS NO MATURITY DATE TOTAL2013 2012 2013 2012 2013 2012 2013 2012 2013 2012 2013 2012
Dana Restu RM RM RM RM RM RM RM RM RM RM RM RM
Financial investments LAR 60,150,000 191,970,000 60,176,439 192,458,188 - - - - - - 60,176,439 192,458,188 FVTPL 826,046,186 533,957,342 1,562,104 - 1,008,662 - 1,417,997 - 822,057,423 533,957,342 826,046,186 533,957,342 Cash and bank balances 51,407 85,674 51,407 85,674 - - - - - - 51,407 85,674 Other assets 8,113,288 1,978,256 8,113,288 1,978,256 - - - - - - 8,113,288 1,978,256 Total assets 894,360,881 727,991,272 69,903,238 194,522,118 1,008,662 - 1,417,997 - 822,057,423 533,957,342 894,387,320 728,479,460
Other liabilities 69,681,632 40,654,533 69,681,632 40,654,533 - - - - - - 69,681,632 40,654,533 Total liabilities 69,681,632 40,654,533 69,681,632 40,654,533 - - - - - - 69,681,632 40,654,533
CARRYING VALUE UP TO A YEAR 1 - 5 YEARS > 5 YEARS NO MATURITY DATE TOTAL2013 2012 2013 2012 2013 2012 2013 2012 2013 2012 2013 2012
Dana Sejati RM RM RM RM RM RM RM RM RM RM RM RM
Financial investments LAR 15,550,000 5,150,000 15,554,249 5,152,753 - - - - - - 15,554,249 5,152,753 FVTPL 73,375,915 69,298,946 10,966,656 8,867,334 42,987,832 21,461,952 40,261,128 64,597,878 - - 94,215,616 94,927,164 Cash and bank balances 172,639 27,105 172,639 27,105 - - - - - - 172,639 27,105 Other assets 2,167,446 2,074,054 2,167,446 2,074,054 - - - - - - 2,167,446 2,074,054 Total assets 91,266,000 76,550,105 28,860,990 16,121,246 42,987,832 21,461,952 40,261,128 64,597,878 - - 112,109,950 102,181,076
Other liabilities 1,704,304 1,407,114 1,704,304 1,407,114 - - - - - - 1,704,304 1,407,114 Total liabilities 1,704,304 1,407,114 1,704,304 1,407,114 - - - - - - 1,704,304 1,407,114
NOTES TO THE FINANCIAL STATEMENTS (CONT’D)

113GREAT EASTERN LIFE ASSURANCE (MALAYSIA) BERHAD
UNIT FUNDS ANNUAL REPORT 2013
11. Financial Risk Management Framework (Cont’d)b. Cash flow and liquidity risk
i. The following table shows the maturity profile of the Funds’ financial liabilities and the expected recovery or settlement of financial assets based on contractual undiscounted cash flow basis.
CARRYING VALUE UP TO A YEAR 1 - 5 YEARS > 5 YEARS NO MATURITY DATE TOTAL15.07.2013 31.12.2012 15.07.2013 31.12.2012 15.07.2013 31.12.2012 15.07.2013 31.12.2012 15.07.2013 31.12.2012 15.07.2013 31.12.2012
Centennial Max Fund RM RM RM RM RM RM RM RM RM RM RM RM
Financial investments LAR 235,500,000 300,000 235,518,601 300,173 - - - - - - 235,518,601 300,173 FVTPL - 231,171,822 - 235,432,618 - - - - - - - 235,432,618 Cash and bank balances 57,962 43,085 57,962 43,085 - - - - - - 57,962 43,085 Other assets 18,601 2,370,626 18,601 2,370,626 - - - - - - 18,601 2,370,626 Total assets 235,576,563 233,885,533 235,595,164 238,146,502 - - - - - - 235,595,164 238,146,502
Other liabilities 1,002,691 2,885,532 1,002,691 2,885,532 - - - - - - 1,002,691 2,885,532 Total liabilities 1,002,691 2,885,532 1,002,691 2,885,532 - - - - - - 1,002,691 2,885,532
CARRYING VALUE UP TO A YEAR 1 - 5 YEARS > 5 YEARS NO MATURITY DATE TOTAL2013 2012 2013 2012 2013 2012 2013 2012 2013 2012 2013 2012
Dana Restu RM RM RM RM RM RM RM RM RM RM RM RM
Financial investments LAR 60,150,000 191,970,000 60,176,439 192,458,188 - - - - - - 60,176,439 192,458,188 FVTPL 826,046,186 533,957,342 1,562,104 - 1,008,662 - 1,417,997 - 822,057,423 533,957,342 826,046,186 533,957,342 Cash and bank balances 51,407 85,674 51,407 85,674 - - - - - - 51,407 85,674 Other assets 8,113,288 1,978,256 8,113,288 1,978,256 - - - - - - 8,113,288 1,978,256 Total assets 894,360,881 727,991,272 69,903,238 194,522,118 1,008,662 - 1,417,997 - 822,057,423 533,957,342 894,387,320 728,479,460
Other liabilities 69,681,632 40,654,533 69,681,632 40,654,533 - - - - - - 69,681,632 40,654,533 Total liabilities 69,681,632 40,654,533 69,681,632 40,654,533 - - - - - - 69,681,632 40,654,533
CARRYING VALUE UP TO A YEAR 1 - 5 YEARS > 5 YEARS NO MATURITY DATE TOTAL2013 2012 2013 2012 2013 2012 2013 2012 2013 2012 2013 2012
Dana Sejati RM RM RM RM RM RM RM RM RM RM RM RM
Financial investments LAR 15,550,000 5,150,000 15,554,249 5,152,753 - - - - - - 15,554,249 5,152,753 FVTPL 73,375,915 69,298,946 10,966,656 8,867,334 42,987,832 21,461,952 40,261,128 64,597,878 - - 94,215,616 94,927,164 Cash and bank balances 172,639 27,105 172,639 27,105 - - - - - - 172,639 27,105 Other assets 2,167,446 2,074,054 2,167,446 2,074,054 - - - - - - 2,167,446 2,074,054 Total assets 91,266,000 76,550,105 28,860,990 16,121,246 42,987,832 21,461,952 40,261,128 64,597,878 - - 112,109,950 102,181,076
Other liabilities 1,704,304 1,407,114 1,704,304 1,407,114 - - - - - - 1,704,304 1,407,114 Total liabilities 1,704,304 1,407,114 1,704,304 1,407,114 - - - - - - 1,704,304 1,407,114
11. Financial Risk Management Framework (Cont’d)
NOTES TO THE FINANCIAL STATEMENTS (CONT’D)

114
11. Financial Risk Management Framework (Cont’d)b. Cash flow and liquidity risk (Cont’d)
i. The following table shows the maturity profile of the Funds’ financial liabilities and the expected recovery or settlement of financial assets based on contractual undiscounted cash flow basis.
CARRYING VALUE UP TO A YEAR 1 - 5 YEARS > 5 YEARS NO MATURITY DATE TOTAL2013 2012 2013 2012 2013 2012 2013 2012 2013 2012 2013 2012
Lion Balanced Fund RM RM RM RM RM RM RM RM RM RM RM RM
Financial investments LAR 62,390,000 27,290,000 62,422,620 27,304,687 - - - - - - 62,422,620 27,304,687 FVTPL 188,284,187 141,448,153 33,443,969 6,897,628 29,142,677 15,769,332 - 69,629,372 133,075,609 81,381,922 195,662,255 173,678,254Cash and bank balances 60,964 24,996 60,964 24,996 - - - - - - 60,964 24,996Other assets 6,406,123 4,791,683 6,406,123 4,791,683 - - - - - - 6,406,123 4,791,683Total assets 257,141,274 173,554,832 102,333,676 39,018,994 29,142,677 15,769,332 - 69,629,372 133,075,609 81,381,922 264,551,962 205,799,620
Other liabilities 8,551,727 5,764,468 8,551,727 5,764,468 - - - - - - 8,551,727 5,764,468Total liabilities 8,551,727 5,764,468 8,551,727 5,764,468 - - - - - - 8,551,727 5,764,468
CARRYING VALUE UP TO A YEAR 1 - 5 YEARS > 5 YEARS NO MATURITY DATE TOTAL2013 2012 2013 2012 2013 2012 2013 2012 2013 2012 2013 2012
Lion Fixed Income Fund RM RM RM RM RM RM RM RM RM RM RM RM
Financial investments LAR 42,300,000 38,610,000 42,312,342 38,633,678 - - - - - - 42,312,342 38,633,678 FVTPL 476,152,046 408,054,119 104,347,526 77,916,202 307,331,302 153,759,076 187,140,822 320,704,442 - - 598,819,650 552,379,720Cash and bank balances 54,452 47,307 54,452 47,307 - - - - - - 54,452 47,307Other assets 7,836,285 8,688,482 7,836,285 8,688,482 - - - - - - 7,836,285 8,688,482Total assets 526,342,783 455,399,908 154,550,605 125,285,669 307,331,302 153,759,076 187,140,822 320,704,442 - - 649,022,729 599,749,187
Other liabilities 9,637,693 7,935,154 9,637,693 7,935,154 - - - - - - 9,637,693 7,935,154Total liabilities 9,637,693 7,935,154 9,637,693 7,935,154 - - - - - - 9,637,693 7,935,154
CARRYING VALUE UP TO A YEAR 1 - 5 YEARS > 5 YEARS NO MATURITY DATE TOTAL2013 2012 2013 2012 2013 2012 2013 2012 2013 2012 2013 2012
Lion Growth Fund RM RM RM RM RM RM RM RM RM RM RM RM
Financial investments LAR 31,250,000 133,080,000 31,266,003 133,351,364 - - - - - - 31,266,003 133,351,364 FVTPL 731,312,897 519,504,730 1,385,898 652,435 9,301,505 12,955,495 1,634,618 - 727,189,837 518,479,475 739,511,858 532,087,405Cash and bank balances 54,736 98,013 54,736 98,013 - - - - - - 54,736 98,013Other assets 1,553,093 727,164 1,553,093 727,164 - - - - - - 1,553,093 727,164Total assets 764,170,726 653,409,907 34,259,730 134,828,976 9,301,505 12,955,495 1,634,618 - 727,189,837 518,479,475 772,385,690 666,263,946
Other liabilities 17,955,461 10,299,543 17,955,461 10,299,543 - - - - - - 17,955,461 10,299,543Total liabilities 17,955,461 10,299,543 17,955,461 10,299,543 - - - - - - 17,955,461 10,299,543
NOTES TO THE FINANCIAL STATEMENTS (CONT’D)

115GREAT EASTERN LIFE ASSURANCE (MALAYSIA) BERHAD
UNIT FUNDS ANNUAL REPORT 2013
11. Financial Risk Management Framework (Cont’d)b. Cash flow and liquidity risk (Cont’d)
i. The following table shows the maturity profile of the Funds’ financial liabilities and the expected recovery or settlement of financial assets based on contractual undiscounted cash flow basis.
CARRYING VALUE UP TO A YEAR 1 - 5 YEARS > 5 YEARS NO MATURITY DATE TOTAL2013 2012 2013 2012 2013 2012 2013 2012 2013 2012 2013 2012
Lion Balanced Fund RM RM RM RM RM RM RM RM RM RM RM RM
Financial investments LAR 62,390,000 27,290,000 62,422,620 27,304,687 - - - - - - 62,422,620 27,304,687 FVTPL 188,284,187 141,448,153 33,443,969 6,897,628 29,142,677 15,769,332 - 69,629,372 133,075,609 81,381,922 195,662,255 173,678,254Cash and bank balances 60,964 24,996 60,964 24,996 - - - - - - 60,964 24,996Other assets 6,406,123 4,791,683 6,406,123 4,791,683 - - - - - - 6,406,123 4,791,683Total assets 257,141,274 173,554,832 102,333,676 39,018,994 29,142,677 15,769,332 - 69,629,372 133,075,609 81,381,922 264,551,962 205,799,620
Other liabilities 8,551,727 5,764,468 8,551,727 5,764,468 - - - - - - 8,551,727 5,764,468Total liabilities 8,551,727 5,764,468 8,551,727 5,764,468 - - - - - - 8,551,727 5,764,468
CARRYING VALUE UP TO A YEAR 1 - 5 YEARS > 5 YEARS NO MATURITY DATE TOTAL2013 2012 2013 2012 2013 2012 2013 2012 2013 2012 2013 2012
Lion Fixed Income Fund RM RM RM RM RM RM RM RM RM RM RM RM
Financial investments LAR 42,300,000 38,610,000 42,312,342 38,633,678 - - - - - - 42,312,342 38,633,678 FVTPL 476,152,046 408,054,119 104,347,526 77,916,202 307,331,302 153,759,076 187,140,822 320,704,442 - - 598,819,650 552,379,720Cash and bank balances 54,452 47,307 54,452 47,307 - - - - - - 54,452 47,307Other assets 7,836,285 8,688,482 7,836,285 8,688,482 - - - - - - 7,836,285 8,688,482Total assets 526,342,783 455,399,908 154,550,605 125,285,669 307,331,302 153,759,076 187,140,822 320,704,442 - - 649,022,729 599,749,187
Other liabilities 9,637,693 7,935,154 9,637,693 7,935,154 - - - - - - 9,637,693 7,935,154Total liabilities 9,637,693 7,935,154 9,637,693 7,935,154 - - - - - - 9,637,693 7,935,154
CARRYING VALUE UP TO A YEAR 1 - 5 YEARS > 5 YEARS NO MATURITY DATE TOTAL2013 2012 2013 2012 2013 2012 2013 2012 2013 2012 2013 2012
Lion Growth Fund RM RM RM RM RM RM RM RM RM RM RM RM
Financial investments LAR 31,250,000 133,080,000 31,266,003 133,351,364 - - - - - - 31,266,003 133,351,364 FVTPL 731,312,897 519,504,730 1,385,898 652,435 9,301,505 12,955,495 1,634,618 - 727,189,837 518,479,475 739,511,858 532,087,405Cash and bank balances 54,736 98,013 54,736 98,013 - - - - - - 54,736 98,013Other assets 1,553,093 727,164 1,553,093 727,164 - - - - - - 1,553,093 727,164Total assets 764,170,726 653,409,907 34,259,730 134,828,976 9,301,505 12,955,495 1,634,618 - 727,189,837 518,479,475 772,385,690 666,263,946
Other liabilities 17,955,461 10,299,543 17,955,461 10,299,543 - - - - - - 17,955,461 10,299,543Total liabilities 17,955,461 10,299,543 17,955,461 10,299,543 - - - - - - 17,955,461 10,299,543
11. Financial Risk Management Framework (Cont’d)
NOTES TO THE FINANCIAL STATEMENTS (CONT’D)

116
11. Financial Risk Management Framework (Cont’d)b. Cash flow and liquidity risk (Cont’d)
i. The following table shows the maturity profile of the Funds’ financial liabilities and the expected recovery or settlement of financial assets based on contractual undiscounted cash flow basis.
CARRYING VALUE UP TO A YEAR 1 - 5 YEARS > 5 YEARS NO MATURITY DATE TOTAL2013 2012 2013 2012 2013 2012 2013 2012 2013 2012 2013 2012
Lion Progressive Fund RM RM RM RM RM RM RM RM RM RM RM RM
Financial investments LAR 59,290,000 63,580,000 59,322,793 63,634,615 - - - - - - 59,322,793 63,634,615 FVTPL 789,078,251 620,112,677 32,260,223 7,386,149 31,232,083 44,546,663 791,085 159,387,873 737,568,895 488,702,373 801,852,286 700,023,058Cash and bank balances 63,769 105,573 63,769 105,573 - - - - - - 63,769 105,573Other assets 4,291,329 2,610,174 4,291,329 2,610,174 - - - - - - 4,291,329 2,610,174Total assets 852,723,349 686,408,424 95,938,114 73,736,511 31,232,083 44,546,663 791,085 159,387,873 737,568,895 488,702,373 865,530,177 766,373,420
Other liabilities 16,644,406 9,441,810 16,644,406 9,441,810 - - - - - - 16,644,406 9,441,810Total liabilities 16,644,406 9,441,810 16,644,406 9,441,810 - - - - - - 16,644,406 9,441,810
CARRYING VALUE UP TO A YEAR 1 - 5 YEARS > 5 YEARS NO MATURITY DATE TOTAL2013 2012 2013 2012 2013 2012 2013 2012 2013 2012 2013 2012
Lion Strategic Fund RM RM RM RM RM RM RM RM RM RM RM RM
Financial investments LAR 108,700,000 91,120,000 108,830,662 91,248,979 - - - - - - 108,830,662 91,248,979 FVTPL 733,680,391 485,443,678 52,918,774 17,315,041 30,975,432 57,640,096 844,800 163,301,217 655,511,995 322,935,128 740,251,001 561,191,482Cash and bank balances 66,740 34,432 66,740 34,432 - - - - - - 66,740 34,432Other assets 6,658,509 7,556,769 6,658,509 7,556,769 - - - - - - 6,658,509 7,556,769Total assets 849,105,640 584,154,879 168,474,685 116,155,221 30,975,432 57,640,096 844,800 163,301,217 655,511,995 322,935,128 855,806,912 660,031,662
Other liabilities 42,071,620 7,436,927 42,071,620 7,436,927 - - - - - - 42,071,620 7,436,927Total liabilities 42,071,620 7,436,927 42,071,620 7,436,927 - - - - - - 42,071,620 7,436,927
CARRYING VALUE UP TO A YEAR 1 - 5 YEARS > 5 YEARS NO MATURITY DATE TOTAL2013 2012 2013 2012 2013 2012 2013 2012 2013 2012 2013 2012
Lion US-i Fund RM RM RM RM RM RM RM RM RM RM RM RM
Financial investments FVTPL 5,474,314 3,254,763 - - - - - - 5,474,314 3,254,763 5,474,314 3,254,763 Cash and bank balances 23,440 77,825 23,440 77,825 - - - - - - 23,440 77,825 Other assets 34,537 16,348 34,537 16,348 - - - - - - 34,537 16,348 Total assets 5,532,291 3,348,936 57,977 94,173 - - - - 5,474,314 3,254,763 5,532,291 3,348,936
Other liabilities 152,768 128,513 152,768 128,513 - - - - - - 152,768 128,513 Total liabilities 152,768 128,513 152,768 128,513 - - - - - - 152,768 128,513
NOTES TO THE FINANCIAL STATEMENTS (CONT’D)

117GREAT EASTERN LIFE ASSURANCE (MALAYSIA) BERHAD
UNIT FUNDS ANNUAL REPORT 2013
11. Financial Risk Management Framework (Cont’d)b. Cash flow and liquidity risk (Cont’d)
i. The following table shows the maturity profile of the Funds’ financial liabilities and the expected recovery or settlement of financial assets based on contractual undiscounted cash flow basis.
CARRYING VALUE UP TO A YEAR 1 - 5 YEARS > 5 YEARS NO MATURITY DATE TOTAL2013 2012 2013 2012 2013 2012 2013 2012 2013 2012 2013 2012
Lion Progressive Fund RM RM RM RM RM RM RM RM RM RM RM RM
Financial investments LAR 59,290,000 63,580,000 59,322,793 63,634,615 - - - - - - 59,322,793 63,634,615 FVTPL 789,078,251 620,112,677 32,260,223 7,386,149 31,232,083 44,546,663 791,085 159,387,873 737,568,895 488,702,373 801,852,286 700,023,058Cash and bank balances 63,769 105,573 63,769 105,573 - - - - - - 63,769 105,573Other assets 4,291,329 2,610,174 4,291,329 2,610,174 - - - - - - 4,291,329 2,610,174Total assets 852,723,349 686,408,424 95,938,114 73,736,511 31,232,083 44,546,663 791,085 159,387,873 737,568,895 488,702,373 865,530,177 766,373,420
Other liabilities 16,644,406 9,441,810 16,644,406 9,441,810 - - - - - - 16,644,406 9,441,810Total liabilities 16,644,406 9,441,810 16,644,406 9,441,810 - - - - - - 16,644,406 9,441,810
CARRYING VALUE UP TO A YEAR 1 - 5 YEARS > 5 YEARS NO MATURITY DATE TOTAL2013 2012 2013 2012 2013 2012 2013 2012 2013 2012 2013 2012
Lion Strategic Fund RM RM RM RM RM RM RM RM RM RM RM RM
Financial investments LAR 108,700,000 91,120,000 108,830,662 91,248,979 - - - - - - 108,830,662 91,248,979 FVTPL 733,680,391 485,443,678 52,918,774 17,315,041 30,975,432 57,640,096 844,800 163,301,217 655,511,995 322,935,128 740,251,001 561,191,482Cash and bank balances 66,740 34,432 66,740 34,432 - - - - - - 66,740 34,432Other assets 6,658,509 7,556,769 6,658,509 7,556,769 - - - - - - 6,658,509 7,556,769Total assets 849,105,640 584,154,879 168,474,685 116,155,221 30,975,432 57,640,096 844,800 163,301,217 655,511,995 322,935,128 855,806,912 660,031,662
Other liabilities 42,071,620 7,436,927 42,071,620 7,436,927 - - - - - - 42,071,620 7,436,927Total liabilities 42,071,620 7,436,927 42,071,620 7,436,927 - - - - - - 42,071,620 7,436,927
CARRYING VALUE UP TO A YEAR 1 - 5 YEARS > 5 YEARS NO MATURITY DATE TOTAL2013 2012 2013 2012 2013 2012 2013 2012 2013 2012 2013 2012
Lion US-i Fund RM RM RM RM RM RM RM RM RM RM RM RM
Financial investments FVTPL 5,474,314 3,254,763 - - - - - - 5,474,314 3,254,763 5,474,314 3,254,763 Cash and bank balances 23,440 77,825 23,440 77,825 - - - - - - 23,440 77,825 Other assets 34,537 16,348 34,537 16,348 - - - - - - 34,537 16,348 Total assets 5,532,291 3,348,936 57,977 94,173 - - - - 5,474,314 3,254,763 5,532,291 3,348,936
Other liabilities 152,768 128,513 152,768 128,513 - - - - - - 152,768 128,513 Total liabilities 152,768 128,513 152,768 128,513 - - - - - - 152,768 128,513
11. Financial Risk Management Framework (Cont’d)
NOTES TO THE FINANCIAL STATEMENTS (CONT’D)

118
11. Financial Risk Management Framework (Cont’d)b. Cash flow and liquidity risk (Cont’d)
i. The following table shows the maturity profile of the Funds’ financial liabilities and the expected recovery or settlement of financial assets based on contractual undiscounted cash flow basis. (Cont’d)
CARRYING VALUE UP TO A YEAR 1 - 5 YEARS > 5 YEARS NO MATURITY DATE TOTAL2013 2012 2013 2012 2013 2012 2013 2012 2013 2012 2013 2012
Lion UK-i Fund RM RM RM RM RM RM RM RM RM RM RM RM
Financial investments FVTPL 3,574,499 2,670,568 - - - - - - 3,574,499 2,670,568 3,574,499 2,670,568Cash and bank balances 39,206 16,837 39,206 16,837 - - - - - - 39,206 16,837Other assets 3,794 6,150 3,794 6,150 - - - - - - 3,794 6,150Total assets 3,617,499 2,693,555 43,000 22,987 - - - - 3,574,499 2,670,568 3,617,499 2,693,555
Other liabilities 69,164 8,536 69,164 8,536 - - - - - - 69,164 8,536Total liabilities 69,164 8,536 69,164 8,536 - - - - - - 69,164 8,536
CARRYING VALUE UP TO A YEAR 1 - 5 YEARS > 5 YEARS NO MATURITY DATE TOTAL2013 2012 2013 2012 2013 2012 2013 2012 2013 2012 2013 2012
Lion AU-i Fund RM RM RM RM RM RM RM RM RM RM RM RM
Financial investments LAR 1,820,000 600,000 1,820,354 600,247 - - - - - - 1,820,354 600,247 FVTPL 8,200,671 8,434,626 - - - - - - 8,200,671 8,434,626 8,200,671 8,434,626Cash and bank balances 50,611 83,549 50,611 83,549 - - - - - - 50,611 83,549Other assets 2,276,527 224,290 2,276,527 224,290 - - - - - - 2,276,527 224,290Total assets 12,347,809 9,342,465 4,147,492 908,086 - - - - 8,200,671 8,434,626 12,348,163 9,342,712
Other liabilities 3,037,758 1,734,768 3,037,758 1,734,768 - - - - - - 3,037,758 1,734,768Total liabilities 3,037,758 1,734,768 3,037,758 1,734,768 - - - - - - 3,037,758 1,734,768
CARRYING VALUE UP TO A YEAR 1 - 5 YEARS > 5 YEARS NO MATURITY DATE TOTAL2013 2012 2013 2012 2013 2012 2013 2012 2013 2012 2013 2012
Lion Asia Pac Fund RM RM RM RM RM RM RM RM RM RM RM RM
Financial investments FVTPL 899,392 1,584,284 - - - - - - 899,392 1,584,284 899,392 1,584,284Cash and bank balances 76,320 22,802 76,320 22,802 - - - - - - 76,320 22,802Other assets 13,509 9,562 13,509 9,562 - - - - - - 13,509 9,562Total assets 989,221 1,616,648 89,829 32,364 - - - - 899,392 1,584,284 989,221 1,616,648
Other liabilities 74,957 619,206 74,957 619,206 - - - - - - 74,957 619,206Total liabilities 74,957 619,206 74,957 619,206 - - - - - - 74,957 619,206
NOTES TO THE FINANCIAL STATEMENTS (CONT’D)

119GREAT EASTERN LIFE ASSURANCE (MALAYSIA) BERHAD
UNIT FUNDS ANNUAL REPORT 2013
11. Financial Risk Management Framework (Cont’d)b. Cash flow and liquidity risk (Cont’d)
i. The following table shows the maturity profile of the Funds’ financial liabilities and the expected recovery or settlement of financial assets based on contractual undiscounted cash flow basis. (Cont’d)
CARRYING VALUE UP TO A YEAR 1 - 5 YEARS > 5 YEARS NO MATURITY DATE TOTAL2013 2012 2013 2012 2013 2012 2013 2012 2013 2012 2013 2012
Lion UK-i Fund RM RM RM RM RM RM RM RM RM RM RM RM
Financial investments FVTPL 3,574,499 2,670,568 - - - - - - 3,574,499 2,670,568 3,574,499 2,670,568Cash and bank balances 39,206 16,837 39,206 16,837 - - - - - - 39,206 16,837Other assets 3,794 6,150 3,794 6,150 - - - - - - 3,794 6,150Total assets 3,617,499 2,693,555 43,000 22,987 - - - - 3,574,499 2,670,568 3,617,499 2,693,555
Other liabilities 69,164 8,536 69,164 8,536 - - - - - - 69,164 8,536Total liabilities 69,164 8,536 69,164 8,536 - - - - - - 69,164 8,536
CARRYING VALUE UP TO A YEAR 1 - 5 YEARS > 5 YEARS NO MATURITY DATE TOTAL2013 2012 2013 2012 2013 2012 2013 2012 2013 2012 2013 2012
Lion AU-i Fund RM RM RM RM RM RM RM RM RM RM RM RM
Financial investments LAR 1,820,000 600,000 1,820,354 600,247 - - - - - - 1,820,354 600,247 FVTPL 8,200,671 8,434,626 - - - - - - 8,200,671 8,434,626 8,200,671 8,434,626Cash and bank balances 50,611 83,549 50,611 83,549 - - - - - - 50,611 83,549Other assets 2,276,527 224,290 2,276,527 224,290 - - - - - - 2,276,527 224,290Total assets 12,347,809 9,342,465 4,147,492 908,086 - - - - 8,200,671 8,434,626 12,348,163 9,342,712
Other liabilities 3,037,758 1,734,768 3,037,758 1,734,768 - - - - - - 3,037,758 1,734,768Total liabilities 3,037,758 1,734,768 3,037,758 1,734,768 - - - - - - 3,037,758 1,734,768
CARRYING VALUE UP TO A YEAR 1 - 5 YEARS > 5 YEARS NO MATURITY DATE TOTAL2013 2012 2013 2012 2013 2012 2013 2012 2013 2012 2013 2012
Lion Asia Pac Fund RM RM RM RM RM RM RM RM RM RM RM RM
Financial investments FVTPL 899,392 1,584,284 - - - - - - 899,392 1,584,284 899,392 1,584,284Cash and bank balances 76,320 22,802 76,320 22,802 - - - - - - 76,320 22,802Other assets 13,509 9,562 13,509 9,562 - - - - - - 13,509 9,562Total assets 989,221 1,616,648 89,829 32,364 - - - - 899,392 1,584,284 989,221 1,616,648
Other liabilities 74,957 619,206 74,957 619,206 - - - - - - 74,957 619,206Total liabilities 74,957 619,206 74,957 619,206 - - - - - - 74,957 619,206
11. Financial Risk Management Framework (Cont’d)
NOTES TO THE FINANCIAL STATEMENTS (CONT’D)

120
11. Financial Risk Management Framework (Cont’d)b. Cash flow and liquidity risk (Cont’d)
i. The following table shows the maturity profile of the Funds’ financial liabilities and the expected recovery or settlement of financial assets based on contractual undiscounted cash flow basis.
CARRYING VALUE UP TO A YEAR 1 - 5 YEARS > 5 YEARS NO MATURITY DATE TOTAL2013 2012 2013 2012 2013 2012 2013 2012 2013 2012 2013 2012
Lion Enhanced Equity Fund RM RM RM RM RM RM RM RM RM RM RM RM
Financial investments LAR 18,570,000 12,850,000 18,575,039 12,856,251 - - - - - - 18,575,039 12,856,251 FVTPL 173,028,546 69,766,490 103,500 14,000 266,828 278,000 142,208 - 172,740,010 69,744,490 173,252,546 70,036,490Cash and bank balances 329,613 1,248,571 329,613 1,248,571 - - - - - - 329,613 1,248,571Other assets 7,851,318 3,147,880 7,851,318 3,147,880 - - - - - - 7,851,318 3,147,880Total assets 199,779,477 87,012,941 26,859,470 17,266,702 266,828 278,000 142,208 - 172,740,010 69,744,490 200,008,516 87,289,192
Other liabilities 3,354,435 1,496,484 3,354,435 1,496,484 - - - - - - 3,354,435 1,496,484Total liabilities 3,354,435 1,496,484 3,354,435 1,496,484 - - - - - - 3,354,435 1,496,484
CARRYING VALUE UP TO A YEAR 1 - 5 YEARS > 5 YEARS NO MATURITY DATE TOTAL2013 2012 2013 2012 2013 2012 2013 2012 2013 2012 2013 2012
Dana Gemilang RM RM RM RM RM RM RM RM RM RM RM RM
Financial investments LAR 6,440,000 3,810,000 6,441,498 3,811,773 - - - - - - 6,441,498 3,811,773 FVTPL 49,441,468 21,807,183 64,440 - 22,243 - - - 49,354,785 21,807,183 49,441,468 21,807,183Cash and bank balances 610,488 336,582 610,488 336,582 - - - - - - 610,488 336,582Other assets 145,737 813,268 145,737 813,268 - - - - - - 145,737 813,268Total assets 56,637,693 26,767,033 7,262,163 4,961,623 22,243 - - - 49,354,785 21,807,183 56,639,191 26,768,806
Other liabilities 3,894,933 255,232 3,894,933 255,232 - - - - - - 3,894,933 255,232Total liabilities 3,894,933 255,232 3,894,933 255,232 - - - - - - 3,894,933 255,232
CARRYING VALUE UP TO A YEAR 1 - 5 YEARS > 5 YEARS NO MATURITY DATE TOTAL2013 2013 2013 2013 2013 2013
Smart Invest Gain Fund RM RM RM RM RM RM
Financial investments LAR 2,400,000 2,433,922 - - - 2,433,922 FVTPL 25,944,000 - 30,000,000 - - 30,000,000Cash and bank balances 15,538 15,538 - - - 15,538Other assets 83,801 83,801 - - - 83,801Total assets 28,443,339 2,533,261 30,000,000 - - 32,533,261
Other liabilities 3,339 3,339 - - - 3,339Total liabilities 3,339 3,339 - - - 3,339
NOTES TO THE FINANCIAL STATEMENTS (CONT’D)

121GREAT EASTERN LIFE ASSURANCE (MALAYSIA) BERHAD
UNIT FUNDS ANNUAL REPORT 2013
11. Financial Risk Management Framework (Cont’d)b. Cash flow and liquidity risk (Cont’d)
i. The following table shows the maturity profile of the Funds’ financial liabilities and the expected recovery or settlement of financial assets based on contractual undiscounted cash flow basis.
CARRYING VALUE UP TO A YEAR 1 - 5 YEARS > 5 YEARS NO MATURITY DATE TOTAL2013 2012 2013 2012 2013 2012 2013 2012 2013 2012 2013 2012
Lion Enhanced Equity Fund RM RM RM RM RM RM RM RM RM RM RM RM
Financial investments LAR 18,570,000 12,850,000 18,575,039 12,856,251 - - - - - - 18,575,039 12,856,251 FVTPL 173,028,546 69,766,490 103,500 14,000 266,828 278,000 142,208 - 172,740,010 69,744,490 173,252,546 70,036,490Cash and bank balances 329,613 1,248,571 329,613 1,248,571 - - - - - - 329,613 1,248,571Other assets 7,851,318 3,147,880 7,851,318 3,147,880 - - - - - - 7,851,318 3,147,880Total assets 199,779,477 87,012,941 26,859,470 17,266,702 266,828 278,000 142,208 - 172,740,010 69,744,490 200,008,516 87,289,192
Other liabilities 3,354,435 1,496,484 3,354,435 1,496,484 - - - - - - 3,354,435 1,496,484Total liabilities 3,354,435 1,496,484 3,354,435 1,496,484 - - - - - - 3,354,435 1,496,484
CARRYING VALUE UP TO A YEAR 1 - 5 YEARS > 5 YEARS NO MATURITY DATE TOTAL2013 2012 2013 2012 2013 2012 2013 2012 2013 2012 2013 2012
Dana Gemilang RM RM RM RM RM RM RM RM RM RM RM RM
Financial investments LAR 6,440,000 3,810,000 6,441,498 3,811,773 - - - - - - 6,441,498 3,811,773 FVTPL 49,441,468 21,807,183 64,440 - 22,243 - - - 49,354,785 21,807,183 49,441,468 21,807,183Cash and bank balances 610,488 336,582 610,488 336,582 - - - - - - 610,488 336,582Other assets 145,737 813,268 145,737 813,268 - - - - - - 145,737 813,268Total assets 56,637,693 26,767,033 7,262,163 4,961,623 22,243 - - - 49,354,785 21,807,183 56,639,191 26,768,806
Other liabilities 3,894,933 255,232 3,894,933 255,232 - - - - - - 3,894,933 255,232Total liabilities 3,894,933 255,232 3,894,933 255,232 - - - - - - 3,894,933 255,232
CARRYING VALUE UP TO A YEAR 1 - 5 YEARS > 5 YEARS NO MATURITY DATE TOTAL2013 2013 2013 2013 2013 2013
Smart Invest Gain Fund RM RM RM RM RM RM
Financial investments LAR 2,400,000 2,433,922 - - - 2,433,922 FVTPL 25,944,000 - 30,000,000 - - 30,000,000Cash and bank balances 15,538 15,538 - - - 15,538Other assets 83,801 83,801 - - - 83,801Total assets 28,443,339 2,533,261 30,000,000 - - 32,533,261
Other liabilities 3,339 3,339 - - - 3,339Total liabilities 3,339 3,339 - - - 3,339
11. Financial Risk Management Framework (Cont’d)
NOTES TO THE FINANCIAL STATEMENTS (CONT’D)

122
11. Financial Risk Management Framework (Cont’d)b. Cash flow and liquidity risk (Cont’d)
ii. The following tables show the current/non-current classification of assets and liabilities.
Centennial Max Fund
CURRENT* NON-CURRENT TOTAL 15.07.2013 31.12.2012 15.07.2013 31.12.2012 15.07.2013 31.12.2012
RM RM RM RM RM RM
Investments LAR 235,500,000 300,000 - - 235,500,000 300,000 FVTPL - 231,171,822 - - - 231,171,822Cash and bank
balances 57,962 43,085 - - 57,962 43,085Other assets 18,601 2,370,626 - - 18,601 2,370,626Total assets 235,576,563 233,885,533 - - 235,576,563 233,885,533
Other liabilities 1,002,691 2,885,532 - - 1,002,691 2,885,532Total liabilities 1,002,691 2,885,532 - - 1,002,691 2,885,532
Dana Restu
CURRENT* NON-CURRENT TOTAL 2013 2012 2013 2012 2013 2012
RM RM RM RM RM RM
Investments LAR 60,150,000 191,970,000 - - 60,150,000 191,970,000 FVTPL 823,619,527 533,957,342 2,426,659 - 826,046,186 533,957,342Cash and bank
balances 51,407 85,674 - - 51,407 85,674Other assets 8,113,288 1,978,256 - - 8,113,288 1,978,256Total assets 891,934,222 727,991,272 2,426,659 - 894,360,881 727,991,272
Other liabilities 69,681,632 40,654,533 - - 69,681,632 40,654,533Total liabilities 69,681,632 40,654,533 - - 69,681,632 40,654,533
Dana Sejati
CURRENT* NON-CURRENT TOTAL 2013 2012 2013 2012 2013 2012
RM RM RM RM RM RM
Investments LAR 15,550,000 5,150,000 - - 15,550,000 5,150,000 FVTPL 7,741,730 6,060,250 65,634,185 63,238,696 73,375,915 69,298,946Cash and bank
balances 172,639 27,105 - - 172,639 27,105Other assets 2,167,446 2,074,054 - - 2,167,446 2,074,054Total assets 25,631,815 13,311,409 65,634,185 63,238,696 91,266,000 76,550,105
Other liabilities 1,704,304 1,407,114 - - 1,704,304 1,407,114Total liabilities 1,704,304 1,407,114 - - 1,704,304 1,407,114
* Expected utilisation or settlement within 12 months from the Balance Sheet date.
NOTES TO THE FINANCIAL STATEMENTS (CONT’D)
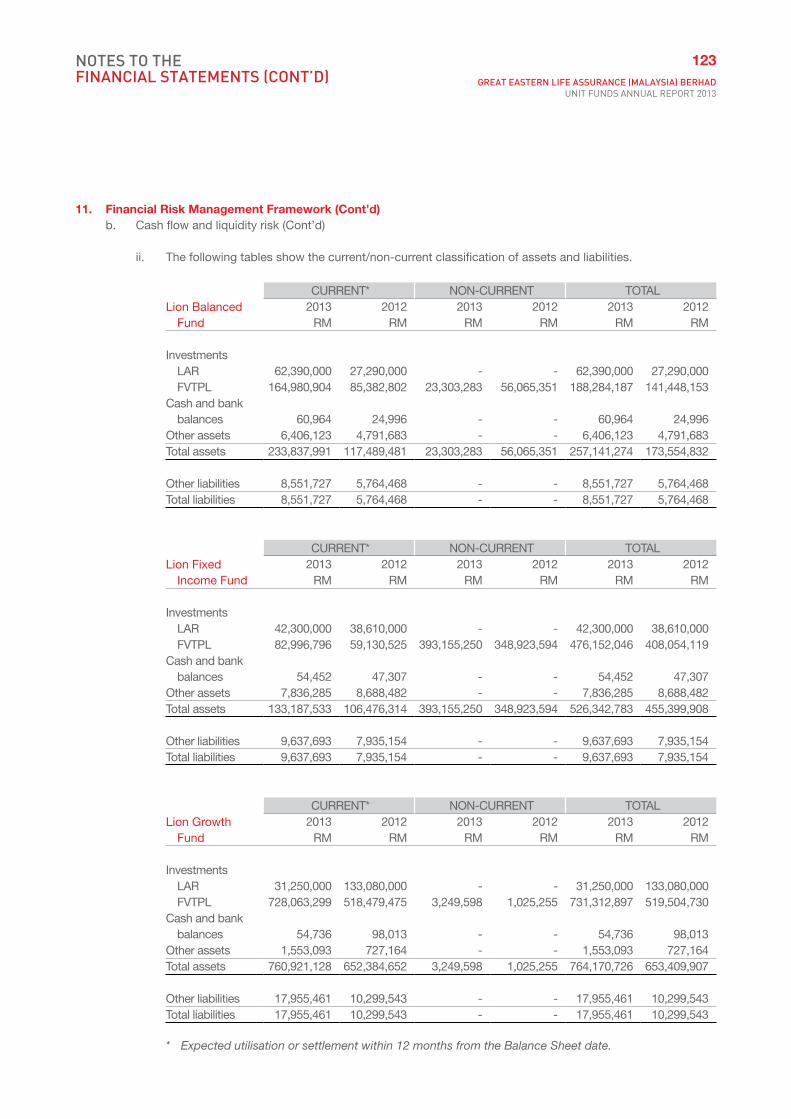
123GREAT EASTERN LIFE ASSURANCE (MALAYSIA) BERHAD
UNIT FUNDS ANNUAL REPORT 2013
11. Financial Risk Management Framework (Cont’d)b. Cash flow and liquidity risk (Cont’d)
ii. The following tables show the current/non-current classification of assets and liabilities.
Lion Balanced Fund
CURRENT* NON-CURRENT TOTAL 2013 2012 2013 2012 2013 2012
RM RM RM RM RM RM
Investments LAR 62,390,000 27,290,000 - - 62,390,000 27,290,000 FVTPL 164,980,904 85,382,802 23,303,283 56,065,351 188,284,187 141,448,153Cash and bank
balances 60,964 24,996 - - 60,964 24,996Other assets 6,406,123 4,791,683 - - 6,406,123 4,791,683Total assets 233,837,991 117,489,481 23,303,283 56,065,351 257,141,274 173,554,832
Other liabilities 8,551,727 5,764,468 - - 8,551,727 5,764,468Total liabilities 8,551,727 5,764,468 - - 8,551,727 5,764,468
Lion Fixed Income Fund
CURRENT* NON-CURRENT TOTAL 2013 2012 2013 2012 2013 2012
RM RM RM RM RM RM
Investments LAR 42,300,000 38,610,000 - - 42,300,000 38,610,000 FVTPL 82,996,796 59,130,525 393,155,250 348,923,594 476,152,046 408,054,119Cash and bank
balances 54,452 47,307 - - 54,452 47,307Other assets 7,836,285 8,688,482 - - 7,836,285 8,688,482Total assets 133,187,533 106,476,314 393,155,250 348,923,594 526,342,783 455,399,908
Other liabilities 9,637,693 7,935,154 - - 9,637,693 7,935,154Total liabilities 9,637,693 7,935,154 - - 9,637,693 7,935,154
Lion Growth Fund
CURRENT* NON-CURRENT TOTAL 2013 2012 2013 2012 2013 2012
RM RM RM RM RM RM
Investments LAR 31,250,000 133,080,000 - - 31,250,000 133,080,000 FVTPL 728,063,299 518,479,475 3,249,598 1,025,255 731,312,897 519,504,730 Cash and bank
balances 54,736 98,013 - - 54,736 98,013 Other assets 1,553,093 727,164 - - 1,553,093 727,164 Total assets 760,921,128 652,384,652 3,249,598 1,025,255 764,170,726 653,409,907
Other liabilities 17,955,461 10,299,543 - - 17,955,461 10,299,543 Total liabilities 17,955,461 10,299,543 - - 17,955,461 10,299,543
* Expected utilisation or settlement within 12 months from the Balance Sheet date.
NOTES TO THE FINANCIAL STATEMENTS (CONT’D)

124
11. Financial Risk Management Framework (Cont’d)b. Cash flow and liquidity risk (Cont’d)
ii. The following tables show the current/non-current classification of assets and liabilities.
Lion Progressive Fund
CURRENT* NON-CURRENT TOTAL 2013 2012 2013 2012 2013 2012
RM RM RM RM RM RM
Investments LAR 59,290,000 63,580,000 - - 59,290,000 63,580,000 FVTPL 767,535,490 489,702,593 21,542,761 130,410,084 789,078,251 620,112,677Cash and bank
balances 63,769 105,573 - - 63,769 105,573Other assets 4,291,329 2,610,174 - - 4,291,329 2,610,174Total assets 831,180,588 555,998,340 21,542,761 130,410,084 852,723,349 686,408,424
Other liabilities 16,644,406 9,441,810 - - 16,644,406 9,441,810Total liabilities 16,644,406 9,441,810 - - 16,644,406 9,441,810
Lion Strategic Fund
CURRENT* NON-CURRENT TOTAL 2013 2012 2013 2012 2013 2012
RM RM RM RM RM RM
Investments LAR 108,700,000 91,120,000 - - 108,700,000 91,120,000 FVTPL 705,438,591 332,937,328 28,241,800 152,506,350 733,680,391 485,443,678Cash and bank
balances 66,740 34,432 - - 66,740 34,432Other assets 6,658,509 7,556,769 - - 6,658,509 7,556,769Total assets 820,863,840 431,648,529 28,241,800 152,506,350 849,105,640 584,154,879
Other liabilities 42,071,620 7,436,927 - - 42,071,620 7,436,927Total liabilities 42,071,620 7,436,927 - - 42,071,620 7,436,927
Lion US-i Fund
CURRENT* NON-CURRENT TOTAL 2013 2012 2013 2012 2013 2012
RM RM RM RM RM RM
Investments FVTPL 5,474,314 3,254,763 - - 5,474,314 3,254,763Cash and bank
balances 23,440 77,825 - - 23,440 77,825Other assets 34,537 16,348 - - 34,537 16,348Total assets 5,532,291 3,348,936 - - 5,532,291 3,348,936
Other liabilities 152,768 128,513 - - 152,768 128,513Total liabilities 152,768 128,513 - - 152,768 128,513
* Expected utilisation or settlement within 12 months from the Balance Sheet date.
NOTES TO THE FINANCIAL STATEMENTS (CONT’D)

125GREAT EASTERN LIFE ASSURANCE (MALAYSIA) BERHAD
UNIT FUNDS ANNUAL REPORT 2013
11. Financial Risk Management Framework (Cont’d)b. Cash flow and liquidity risk (Cont’d)
ii. The following tables show the current/non-current classification of assets and liabilities.
Lion UK-i Fund
CURRENT* NON-CURRENT TOTAL 2013 2012 2013 2012 2013 2012
RM RM RM RM RM RM
Investments FVTPL 3,574,499 2,670,568 - - 3,574,499 2,670,568Cash and bank
balances 39,206 16,837 - - 39,206 16,837Other assets 3,794 6,150 - - 3,794 6,150Total assets 3,617,499 2,693,555 - - 3,617,499 2,693,555
Other liabilities 69,164 8,536 - - 69,164 8,536Total liabilities 69,164 8,536 - - 69,164 8,536
Lion AU-i Fund
CURRENT* NON-CURRENT TOTAL 2013 2012 2013 2012 2013 2012
RM RM RM RM RM RM
Investments LAR 1,820,000 600,000 - - 1,820,000 600,000 FVTPL 8,200,671 8,434,626 - - 8,200,671 8,434,626 Cash and bank
balances 50,611 83,549 - - 50,611 83,549 Other assets 2,276,527 224,290 - - 2,276,527 224,290 Total assets 12,347,809 9,342,465 - - 12,347,809 9,342,465
Other liabilities 3,037,758 1,734,768 - - 3,037,758 1,734,768 Total liabilities 3,037,758 1,734,768 - - 3,037,758 1,734,768
Lion Asia Pac Fund
CURRENT* NON-CURRENT TOTAL 2013 2012 2013 2012 2013 2012
RM RM RM RM RM RM
Investments FVTPL 899,392 1,584,284 - - 899,392 1,584,284 Cash and bank
balances 76,320 22,802 - - 76,320 22,802 Other assets 13,509 9,562 - - 13,509 9,562 Total assets 989,221 1,616,648 - - 989,221 1,616,648
Other liabilities 74,957 619,206 - - 74,957 619,206 Total liabilities 74,957 619,206 - - 74,957 619,206
* Expected utilisation or settlement within 12 months from the Balance Sheet date.
NOTES TO THE FINANCIAL STATEMENTS (CONT’D)

126
11. Financial Risk Management Framework (Cont’d)b. Cash flow and liquidity risk (Cont’d)
ii. The following tables show the current/non-current classification of assets and liabilities.
Lion Enhanced Equity Fund
Current* Non-current Total 2013 2012 2013 2012 2013 2012
RM RM RM RM RM RM
Investments LAR 18,570,000 12,850,000 - - 18,570,000 12,850,000 FVTPL 172,829,510 69,744,490 199,036 22,000 173,028,546 69,766,490Cash and bank
balances 329,613 1,248,571 - - 329,613 1,248,571Other assets 7,851,318 3,147,880 - - 7,851,318 3,147,880Total assets 199,580,441 86,990,941 199,036 22,000 199,779,477 87,012,941
Other liabilities 3,354,435 1,496,484 - - 3,354,435 1,496,484Total liabilities 3,354,435 1,496,484 - - 3,354,435 1,496,484
Dana Gemilang
Current* Non-current Total 2013 2012 2013 2012 2013 2012
RM RM RM RM RM RM
Investments LAR 6,440,000 3,810,000 - - 6,440,000 3,810,000 FVTPL 47,419,225 21,807,183 22,243 - 49,441,468 21,807,183 Cash and bank
balances 610,488 336,582 - - 610,488 336,582 Other assets 145,737 813,268 - - 145,737 813,268 Total assets 56,615,450 26,767,033 22,243 - 56,637,693 26,767,033
Other liabilities 3,894,933 255,232 - - 3,894,933 255,232 Total liabilities 3,894,933 255,232 - - 3,894,933 255,232
Smart Invest Gain Fund
Current* Non-current Total 2013 2013 2013
RM RM RM
Investments LAR 2,400,000 - 2,400,000 FVTPL - 25,944,000 25,944,000Cash and bank
balances 15,538 - 15,538Other assets 83,801 - 83,801Total assets 2,499,339 25,944,000 28,443,339
Other liabilities 3,339 - 3,339Total liabilities 3,339 - 3,339
* Expected utilisation or settlement within 12 months from the Balance Sheet date.
NOTES TO THE FINANCIAL STATEMENTS (CONT’D)

127GREAT EASTERN LIFE ASSURANCE (MALAYSIA) BERHAD
UNIT FUNDS ANNUAL REPORT 2013
11. Financial Risk Management Framework (Cont’d)c. Credit risk
The table below provides information regarding the credit risk exposure of the Funds by classifying assets according to the Company’s credit ratings of counterparties.
Neither past-due nor impairedInvestment grade*
(BBB to AAA) Not Rated Not subject to
credit risk Total 15.07.2013 31.12.2012 15.07.2013 31.12.2012 15.07.2013 31.12.2012 15.07.2013 31.12.2012
RM RM RM RM RM RM RM RMCentennial Max Fund
LARDeposits with
a financial institution 235,500,000 300,000 - - - - 235,500,000 300,000
Financial Investment at FVTPLFinancial instruments
with embedded derivatives - 231,171,822 - - - - - 231,171,822
Cash and bank balances 57,962 43,085 - - - - 57,962 43,085
Other assets 18,601 25 - - - 2,370,601 18,601 2,370,626235,576,563 231,514,932 - - - 2,370,601 235,576,563 233,885,533
Neither past-due nor impairedInvestment grade*
(BBB to AAA) Not Rated Not subject to
credit risk Total 2013 2012 2013 2012 2013 2012 2013 2012
RM RM RM RM RM RM RM RMDana Restu
LARDeposits with
a financial institution 60,150,000 191,970,000 - - - - 60,150,000 191,970,000
Financial investments at FVTPLEquity securities - - - - 811,738,787 521,207,087 811,738,787 521,207,087 Financial instruments
with embedded derivatives - - - - 3,988,762 1,802,539 3,988,762 1,802,539
Unit and property trust funds - - - - 10,318,637 10,947,716 10,318,637 10,947,716
Cash and bank balances 51,407 85,674 - - - - 51,407 85,674
Other assets 14,842 171,099 - - 8,098,446 1,807,157 8,113,288 1,978,256 60,216,249 192,226,773 - - 834,144,632 535,764,499 894,360,881 727,991,272
* Investment grades are based on public ratings assigned by external rating agencies including Ratings Agency of Malaysia (RAM) and Malaysian Rating Corporation Berhad (MARC). There are no non-investment grade assets.
NOTES TO THE FINANCIAL STATEMENTS (CONT’D)

128
11. Financial Risk Management Framework (Cont’d)c. Credit risk (Cont’d)
The table below provides information regarding the credit risk exposure of the Funds by classifying assets according to the Company’s credit ratings of counterparties.
Neither past-due nor impairedInvestment grade*
(BBB to AAA) Not Rated Not subject to
credit risk Total 2013 2012 2013 2012 2013 2012 2013 2012
RM RM RM RM RM RM RM RMDana Sejati
LARDeposits with
a financial institution 15,550,000 5,150,000 - - - - 15,550,000 5,150,000
Financial investments at FVTPLMalaysian
government securities 10,610,045 11,697,470 - - - - 10,610,045 11,697,470
Debt securities 62,765,870 57,601,476 - - - - 62,765,870 57,601,476 Cash and bank
balances 172,639 27,105 - - - - 172,639 27,105 Other assets 569,551 504,801 - - 1,597,895 1,569,253 2,167,446 2,074,054
89,668,105 74,980,852 - - 1,597,895 1,569,253 91,266,000 76,550,105
Lion Balanced Fund
LARFinancial
investments at FVTPL 62,390,000 27,290,000 - - - - 62,390,000 27,290,000
Financial investments at FVTPL
Malaysian government securities - 5,993,867 - - - - - 5,993,867 Debt securities 52,024,796 53,844,115 - - - - 52,024,796 53,844,115 Equity securities - - - - 133,075,609 76,143,894 133,075,609 76,143,894 Financial instruments with embedded derivatives - - - - 3,183,782 1,539,497 3,183,782 1,539,497 Unit and property trust funds - - - - - 3,926,780 - 3,926,780Cash and bank
balances 60,964 24,996 - - - - 60,964 24,996Other assets 311,980 707,676 - - 6,094,143 4,084,007 6,406,123 4,791,683
114,787,740 87,860,654 - - 142,353,534 85,694,178 257,141,274 173,554,832
* Investment grades are based on public ratings assigned by external rating agencies including Ratings Agency of Malaysia (RAM) and Malaysian Rating Corporation Berhad (MARC). There are no non-investment grade assets.
NOTES TO THE FINANCIAL STATEMENTS (CONT’D)

129GREAT EASTERN LIFE ASSURANCE (MALAYSIA) BERHAD
UNIT FUNDS ANNUAL REPORT 2013
11. Financial Risk Management Framework (Cont’d)c. Credit risk (Cont’d)
The table below provides information regarding the credit risk exposure of the Funds by classifying assets according to the Company’s credit ratings of counterparties.
Neither past-due nor impairedInvestment grade*
(BBB to AAA) Not Rated Not subject to
credit risk Total 2013 2012 2013 2012 2013 2012 2013 2012
RM RM RM RM RM RM RM RMLion Fixed Income Fund
LARDeposits with
a financial institution 42,300,000 38,610,000 - - - - 42,300,000 38,610,000
Financial investments at FVTPLMalaysian
government securities 42,205,000 49,723,753 - - - - 42,205,000 49,723,753
Debt securities 433,947,046 358,330,366 - - - - 433,947,046 358,330,366Cash and bank
balances 54,452 47,307 - - - - 54,452 47,307Other assets 4,151,276 3,348,989 - - 3,685,009 5,339,493 7,836,285 8,688,482
522,657,774 450,060,415 - - 3,685,009 5,339,493 526,342,783 455,399,908
Lion Balanced Fund
LARDeposits with
a financial institution 31,250,000 133,080,000 - - - - 31,250,000 133,080,000
Financial investments at FVTPLEquity securities - - - - 720,430,169 456,123,014 720,430,169 456,123,014
Financial instruments with embedded derivatives - - - - 4,123,060 1,737,208 4,123,060 1,737,208
Unit and property trust funds - - - - 6,759,668 61,644,508 6,759,668 61,644,508
Cash and bank balances 54,736 98,013 - - - - 54,736 98,013
Other assets 11,308 155,109 - - 1,541,785 572,055 1,553,093 727,16431,316,044 133,333,122 - - 732,854,682 520,076,785 764,170,726 653,409,907
* Investment grades are based on public ratings assigned by external rating agencies including Ratings Agency of Malaysia (RAM) and Malaysian Rating Corporation Berhad (MARC). There are no non-investment grade assets.
NOTES TO THE FINANCIAL STATEMENTS (CONT’D)

130
11. Financial Risk Management Framework (Cont’d)c. Credit risk (Cont’d)
The table below provides information regarding the credit risk exposure of the Funds by classifying assets according to the Company’s credit ratings of counterparties.
Neither past-due nor impairedInvestment grade*
(BBB to AAA) Not Rated Not subject to
credit risk Total 2013 2012 2013 2012 2013 2012 2013 2012
RM RM RM RM RM RM RM RMLion Progressive Fund
LARDeposits with
a financial institution 59,290,000 63,580,000 - - - - 59,290,000 63,580,000
Financial investments at FVTPLMalaysian
government securities - 11,140,430 - - - - - 11,140,430
Debt securities 45,007,096 119,507,630 - - - - 45,007,096 119,507,630Equity securities - - - - 734,322,997 428,762,883 734,322,997 428,762,883
Financial instruments with embedded derivatives - - - - 6,502,260 808,264 6,502,260 808,264
Unit and property trust funds - - - - 3,245,898 59,893,470 3,245,898 59,893,470
Cash and bank balances 63,769 105,573 - - - - 63,769 105,573
Other assets 427,318 1,822,614 - - 3,864,011 787,560 4,291,329 2,610,174104,788,183 196,156,247 - - 747,935,166 490,252,177 852,723,349 686,408,424
* Investment grades are based on public ratings assigned by external rating agencies including Ratings Agency of Malaysia (RAM) and Malaysian Rating Corporation Berhad (MARC). There are no non-investment grade assets.
NOTES TO THE FINANCIAL STATEMENTS (CONT’D)

131GREAT EASTERN LIFE ASSURANCE (MALAYSIA) BERHAD
UNIT FUNDS ANNUAL REPORT 2013
11. Financial Risk Management Framework (Cont’d)c. Credit risk (Cont’d)
The table below provides information regarding the credit risk exposure of the Funds by classifying assets according to the Company’s credit ratings of counterparties.
Neither past-due nor impairedInvestment grade*
(BBB to AAA) Not Rated Not subject to
credit risk Total 2013 2012 2013 2012 2013 2012 2013 2012
RM RM RM RM RM RM RM RMLion Strategic Fund
LARDeposits with
a financial institution 108,700,000 91,120,000 - - - - 108,700,000 91,120,000
Financial investments at FVTPLMalaysian
government securities - 10,081,300 - - - - - 10,081,300
Debt securities 76,071,596 152,427,250 - - - - 76,071,596 152,427,250Equity securities - - - - 609,276,785 283,675,546 609,276,785 283,675,546
Financial instruments with embedded derivatives - - - - 2,096,800 1,807,772 2,096,800 1,807,772
Unit and property trust funds - - - - 46,235,210 37,451,810 46,235,210 37,451,810
Cash and bank balances 66,740 34,432 - - - - 66,740 34,432
Other assets 832,599 1,557,777 - - 5,825,910 5,998,992 6,658,509 7,556,769185,670,935 255,220,759 - - 663,434,705 328,934,120 849,105,640 584,154,879
* Investment grades are based on public ratings assigned by external rating agencies including Ratings Agency of Malaysia (RAM) and Malaysian Rating Corporation Berhad (MARC). There are no non-investment grade assets.
NOTES TO THE FINANCIAL STATEMENTS (CONT’D)

132
11. Financial Risk Management Framework (Cont’d)c. Credit risk (Cont’d)
The table below provides information regarding the credit risk exposure of the Funds by classifying assets according to the Company’s credit ratings of counterparties.
Neither past-due nor impairedInvestment grade*
(BBB to AAA) Not Rated Not subject to
credit risk Total 2013 2012 2013 2012 2013 2012 2013 2012
RM RM RM RM RM RM RM RMLion US-i Fund
Financial investments at FVTPL Equity securities - - - - 5,474,314 3,254,763 5,474,314 3,254,763
Cash and bank balances 23,440 77,825 - - - - 23,440 77,825
Other assets - - - - 34,537 16,348 34,537 16,34823,440 77,825 - - 5,508,851 3,271,111 5,532,291 3,348,936
Lion UK-i Fund
Financial investments at FVTPL Equity securities - - - - 3,574,499 2,670,568 3,574,499 2,670,568
Cash and bank balances 39,206 16,837 - - - - 39,206 16,837
Other assets - - - - 3,794 6,150 3,794 6,15039,206 16,837 - - 3,578,293 2,676,718 3,617,499 2,693,555
Lion AU-i Fund
LARDeposits with
a financial institution 1,820,000 600,000 - - - - 1,820,000 600,000
Financial investments at FVTPL Equity securities - - - - 8,200,671 8,434,626 8,200,671 8,434,626
Cash and bank balances 50,611 83,549 - - - - 50,611 83,549
Other assets 177 197 - - 2,276,350 224,093 2,276,527 224,2901,870,788 683,746 - - 10,477,021 8,658,719 12,347,809 9,342,465
* Investment grades are based on public ratings assigned by external rating agencies including Ratings Agency of Malaysia (RAM) and Malaysian Rating Corporation Berhad (MARC). There are no non-investment grade assets.
NOTES TO THE FINANCIAL STATEMENTS (CONT’D)

133GREAT EASTERN LIFE ASSURANCE (MALAYSIA) BERHAD
UNIT FUNDS ANNUAL REPORT 2013
11. Financial Risk Management Framework (Cont’d)c. Credit risk (Cont’d)
The table below provides information regarding the credit risk exposure of the Funds by classifying assets according to the Company’s credit ratings of counterparties.
Neither past-due nor impairedInvestment grade*
(BBB to AAA) Not Rated Not subject to
credit risk Total 2013 2012 2013 2012 2013 2012 2013 2012
RM RM RM RM RM RM RM RMLion Asia Pac Fund
Financial investments at FVTPLUnit and property
trust funds - - - - 899,392 1,584,284 899,392 1,584,284Cash and bank
balances 76,320 22,802 - - - - 76,320 22,802Other assets - - - - 13,509 9,562 13,509 9,562
76,320 22,802 - - 912,901 1,593,846 989,221 1,616,648
Lion Enhanced Equity Fund
LARDeposits with
a financial institution 18,570,000 12,850,000 - - - - 18,570,000 12,850,000
Financial investments at FVTPLEquity securities - - - - 171,374,926 63,140,656 171,374,926 63,140,656
Financial instruments with embedded derivatives - - - - 288,536 96,924 288,536 96,924
Unit and property trust funds - - - - 1,365,084 6,528,910 1,365,084 6,528,910
Cash and bank balances 329,613 1,248,571 - - - - 329,613 1,248,571
Other assets 3,233 2,873 - - 7,848,085 3,145,007 7,851,318 3,147,88018,902,846 14,101,444 - - 180,876,631 72,911,497 199,779,477 87,012,941
* Investment grades are based on public ratings assigned by external rating agencies including Ratings Agency of Malaysia (RAM) and Malaysian Rating Corporation Berhad (MARC). There are no non-investment grade assets.
NOTES TO THE FINANCIAL STATEMENTS (CONT’D)

134
11. Financial Risk Management Framework (Cont’d)c. Credit risk
The table below provides information regarding the credit risk exposure of the Funds by classifying assets according to the Company’s credit ratings of counterparties.
Neither past-due nor impairedInvestment grade*
(BBB to AAA) Not Rated Not subject to
credit risk Total 2013 2012 2013 2012 2013 2012 2013 2012
Dana Gemilang
LARDeposits with
a financial institution 6,440,000 3,810,000 - - - - 6,440,000 3,810,000
Financial investments at FVTPLEquity securities - - - - 48,970,067 21,305,188 48,970,067 21,305,188
Financial instruments with embedded derivatives - - - - 86,683 93,821 86,683 93,821
Unit and property trust funds - - - - 384,718 408,174 384,718 408,174
Cash and bank balances 610,488 336,582 - - - - 610,488 336,582
Other assets 987 1,444 - - 144,750 811,824 145,737 813,2687,051,475 4,148,026 - - 49,586,218 22,619,007 56,637,693 26,767,033
Smart Invest Gain Fund
LARDeposits with
a financial institution 2,400,000 - - 2,400,000
Financial investments at FVTPL
Financial instruments with embedded derivatives - - 25,944,000 25,944,000 Cash and bank
balances 15,538 - - 15,538 Deferred tax asset - - 57,148 57,148Other assets 26,653 - - 26,653
2,442,191 - 26,001,148 28,443,339
* Investment grades are based on public ratings assigned by external rating agencies including Ratings Agency of Malaysia (RAM) and Malaysian Rating Corporation Berhad (MARC). There are no non-investment grade assets.
NOTES TO THE FINANCIAL STATEMENTS (CONT’D)

135GREAT EASTERN LIFE ASSURANCE (MALAYSIA) BERHAD
UNIT FUNDS ANNUAL REPORT 2013
11. Financial Risk Management Framework (Cont’d)d. Sensitivity analysis on financial risk
2013RM (million)
CentennialMax Fund
Dana Restu
Dana Sejati
LionBalanced
Fund
Lion FixedIncome
Fund
Lion Growth
Fund
LionProgressive
fund
Change in variablesa) Equity + 20% - + 197.88 - + 33.73 - + 177.09 + 181.01 - 20% - - 132.05 - - 22.49 - - 118.71 - 120.67 b) Alternative investments +/- 10% - +/- 1.03 - - - +/- 0.68 +/- 0.32 c) Foreign currency +/- 5% - - - - - - - d) Interest rate Yield curve +100 bps - - - 3.14 - 0.82 - 17.88 - 0.02 - 0.76 Yield curve -100 bps - - + 3.43 + 0.86 + 19.39 + 0.02 + 0.79 e) Credit spread Spread +100 bps - - - 2.49 - 0.82 - 15.05 - 0.02 - 0.76 Spread -100 bps - - + 2.7 + 0.86 + 16.27 + 0.02 + 0.79
2013RM (million)
LionStrategic
FundLion US-i
FundLion UK-i
FundLion AU-i
FundLion AsiaPac Fund
LionEnhanced
EquityFund
DanaGemilang
SmartInvest
Gain Fund
Change in variablesa) Equity + 20% + 147.69 + 1.15 + 0.75 + 1.72 + 0.22 + 41.29 + 11.82 - - 20% - 98.72 - 1.04 - 0.68 - 1.56 - 0.14 - 27.69 - 7.88 -
b) Alternative investments +/- 10% +/- 4.62 - - - - +/- 0.14 +/- 0.04 -
c) Foreign currency +/- 5% - +/- 0.27 +/- 0.18 +/- 0.41 - +/- 0.03 +/- 0.01 -
d) Interest rate Yield curve +100 bps - 0.95 - - - - - - - Yield curve -100 bps + 0.99 - - - - - - -
e) Credit spread Spread +100 bps - 0.95 - - - - - - - Spread -100 bps + 0.99 - - - - - - -
NOTES TO THE FINANCIAL STATEMENTS (CONT’D)

136
11. Financial Risk Management Framework (Cont’d) d. Sensitivity analysis on financial risk (Cont’d)
2012RM (million)
CentennialMax Fund
Dana Restu
Dana Sejati
LionBalanced
Fund
Lion FixedIncome
Fund
Lion Growth
Fund
LionProgressive
Fund
Change in variablesa) Equity + 20% - +126.21 - +21.98 - +111.20 +103.46 - 20% - -84.80 - -14.80 - -74.77 -70.00b) Alternative investments +/- 10% - +/-1.09 - +/-0.39 - +/-6.16 +/-5.99 c) Foreign currency +/- 5% - - - - - - - d) Interest rate Yield curve +100 bps -1.19 - -4.34 -4.31 -22.91 -0.02 -10.35 Yield curve -100 bps +1.21 - +4.79 +4.83 +25.23 +0.02 +11.85e) Credit spread Spread +100 bps -1.19 - -2.63 -3.78 -17.23 -0.02 -8.70 Spread -100 bps +1.21 - +2.85 +4.25 +18.89 +0.02 +9.83
2012RM (million)
LionStrategic
FundLion US-i
FundLion UK-i
FundLion AU-i
FundLion AsiaPac Fund
LionEnhanced
Equity FundDana
Gemilang
Change in variablesa) Equity + 20% +72.02 +0.68 +0.56 +1.77 +0.38 +15.20 +5.26 - 20% -48.24 -0.62 -0.51 -1.60 -0.25 -10.22 -3.53 b) Alternative investments +/- 10% +/-3.75 - - - - +/-0.65 +/-0.04 c) Foreign currency +/- 5% - +/-0.16 +/-0.13 +/-0.42 - +/-0.07 +/-0.01 d) Interest rate Yield curve +100 bps -11.61 - - - - - - Yield curve -100 bps +12.94 - - - - - -e) Credit spread Spread +100 bps -9.28 - - - - - - Spread -100 bps +10.37 - - - - - -
NOTES TO THE FINANCIAL STATEMENTS (CONT’D)

137GREAT EASTERN LIFE ASSURANCE (MALAYSIA) BERHAD
UNIT FUNDS ANNUAL REPORT 2013
12. Fair value of Financial Assets
The following table shows an analysis of financial instruments that are carried at fair value by level of fair value hierarchy:
Level 1 - QuotedMarket Price
Level 2 - ValuationTechniques -
Market ObservableInputs
Level 3 - ValuationTechniques -
UnobservableInputs Total Fair Value
Centennial Max Fund RM RM RM RM
15.07.2013Financial AssetsFVTPL - Held for TradingFinancial Instruments with Embedded Derivatives: Unquoted in Malaysia - - - -
31.12.2012Financial AssetsFVTPL - Held for TradingFinancial Instruments with Embedded Derivatives: Unquoted in Malaysia - 231,171,822 - 231,171,822
Dana Restu
2013Financial AssetsFVTPL - Held for TradingEquity securities: Quoted in Malaysia 811,738,787 - - 811,738,787 Financial Instruments with embedded derivatives 3,988,762 - - 3,988,762 Unit and property trust funds: Quoted in Malaysia 10,318,637 - - 10,318,637
826,046,186 - - 826,046,186
2012Financial AssetsFVTPL - Held for TradingEquity securities: Quoted in Malaysia 521,207,087 - - 521,207,087 Financial Instruments with embedded derivatives 1,802,539 - - 1,802,539 Unit and property trust funds: Quoted in Malaysia 10,947,716 - - 10,947,716
533,957,342 - - 533,957,342
NOTES TO THE FINANCIAL STATEMENTS (CONT’D)

138
12. Fair value of Financial Assets (Cont’d)
Level 1 - QuotedMarket Price
Level 2 - ValuationTechniques -
Market ObservableInputs
Level 3 - ValuationTechniques -
UnobservableInputs Total Fair Value
Dana Sejati RM RM RM RM
2013Financial AssetsFVTPL - Held for TradingMalaysian government securities - 10,610,045 - 10,610,045 Debt securities: Unquoted in Malaysia - 62,765,870 - 62,765,870
- 73,375,915 - 73,375,915
2012Financial AssetsFVTPL - Held for TradingMalaysian government securities - 11,697,470 - 11,697,470 Debt securities: Unquoted in Malaysia - 57,601,476 - 57,601,476
- 69,298,946 - 69,298,946
NOTES TO THE FINANCIAL STATEMENTS (CONT’D)

139GREAT EASTERN LIFE ASSURANCE (MALAYSIA) BERHAD
UNIT FUNDS ANNUAL REPORT 2013
12. Fair value of Financial Assets (Cont’d)
Level 1 - QuotedMarket Price
Level 2 - ValuationTechniques -
Market ObservableInputs
Level 3 - ValuationTechniques -
UnobservableInputs Total Fair Value
Lion Balanced Fund RM RM RM RM
2013Financial AssetsFVTPL - Held for TradingDebt securities: Unquoted in Malaysia - 52,024,796 - 52,024,796 Equity securities: Quoted in Malaysia 133,075,609 - - 133,075,609 Financial Instruments with embedded derivatives 3,183,782 - - 3,183,782
136,259,391 52,024,796 - 188,284,187
2012Financial AssetsFVTPL - Held for TradingMalaysian government securities - 5,993,867 - 5,993,867 Debt securities: Unquoted in Malaysia - 53,844,115 - 53,844,115 Equity securities: Quoted in Malaysia 76,143,894 - - 76,143,894 Financial Instruments with embedded derivatives 1,539,497 - - 1,539,497 Unit and property trust funds: Quoted in Malaysia 3,926,780 - - 3,926,780
81,610,171 59,837,982 - 141,448,153
NOTES TO THE FINANCIAL STATEMENTS (CONT’D)

140
12. Fair value of Financial Assets (Cont’d)
Level 1 - QuotedMarket Price
Level 2 - ValuationTechniques -
Market ObservableInputs
Level 3 - ValuationTechniques -
UnobservableInputs Total Fair Value
Lion Fixed Income Fund RM RM RM RM
2013Financial AssetsFVTPL - Held for TradingMalaysian government securities - 42,205,000 - 42,205,000 Debt securities: Unquoted in Malaysia - 433,947,046 - 433,947,046
- 476,152,046 - 476,152,046
2012Financial AssetsFVTPL - Held for TradingMalaysian government
securities - 49,723,753 - 49,723,753 Debt securities: Unquoted in Malaysia - 358,330,366 - 358,330,366
- 408,054,119 - 408,054,119
Lion Growth Fund
2013Financial AssetsFVTPL - Held for TradingEquity securities: Quoted in Malaysia 720,430,169 - - 720,430,169 Financial Instruments with embedded derivatives 4,123,060 - - 4,123,060 Unit and property trust funds: Quoted in Malaysia 6,759,668 - - 6,759,668
731,312,897 - - 731,312,897
2012Financial AssetsFVTPL - Held for TradingEquity securities: Quoted in Malaysia 456,123,014 - - 456,123,014 Financial Instruments with embedded derivatives 1,737,208 - - 1,737,208 Unit and property trust funds: Quoted in Malaysia 61,644,508 - - 61,644,508
519,504,730 - - 519,504,730
NOTES TO THE FINANCIAL STATEMENTS (CONT’D)

141GREAT EASTERN LIFE ASSURANCE (MALAYSIA) BERHAD
UNIT FUNDS ANNUAL REPORT 2013
12. Fair value of Financial Assets (Cont’d)
Level 1 - QuotedMarket Price
Level 2 - ValuationTechniques -
Market ObservableInputs
Level 3 - ValuationTechniques -
UnobservableInputs Total Fair Value
Lion Progressive Fund RM RM RM RM
2013Financial AssetsFVTPL - Held for TradingDebt securities: Unquoted in Malaysia - 45,007,096 - 45,007,096 Equity securities: Quoted in Malaysia 734,322,997 - - 734,322,997 Financial Instruments with embedded derivatives 6,502,260 - - 6,502,260 Unit and property trust funds: Quoted in Malaysia 3,245,898 - - 3,245,898
744,071,155 45,007,096 - 789,078,251
2012Financial AssetsFVTPL - Held for TradingMalaysian government securities - 11,140,430 - 11,140,430 Debt securities: Unquoted in Malaysia - 119,507,630 - 119,507,630 Equity securities: Quoted in Malaysia 428,762,883 - - 428,762,883 Financial Instruments with embedded derivatives 808,264 - - 808,264 Unit and property trust funds: Quoted in Malaysia 59,893,470 - - 59,893,470
489,464,617 130,648,060 - 620,112,677
NOTES TO THE FINANCIAL STATEMENTS (CONT’D)

142
12. Fair value of Financial Assets (Cont’d)
Level 1 - QuotedMarket Price
Level 2 - ValuationTechniques -
Market ObservableInputs
Level 3 - ValuationTechniques -
UnobservableInputs Total Fair Value
Lion Strategic Fund RM RM RM RM
2013Financial AssetsFVTPL - Held for TradingDebt securities: Unquoted in Malaysia - 76,071,596 - 76,071,596 Equity securities: Quoted in Malaysia 609,276,785 - - 609,276,785 Financial Instruments with Embedded Derivatives 2,096,800 - - 2,096,800 Unit and property trust funds: Quoted in Malaysia 46,235,210 - - 46,235,210
657,608,795 76,071,596 - 733,680,391
2012Financial AssetsFVTPL - Held for TradingMalaysian government securities - 10,081,300 - 10,081,300 Debt securities: Unquoted in Malaysia - 152,427,250 - 152,427,250 Equity securities: Quoted in Malaysia 283,675,546 - - 283,675,546 Financial Instruments with Embedded Derivatives 1,807,772 - - 1,807,772 Unit and property trust funds: Quoted in Malaysia 37,451,810 - - 37,451,810
322,935,128 162,508,550 - 485,443,678
NOTES TO THE FINANCIAL STATEMENTS (CONT’D)
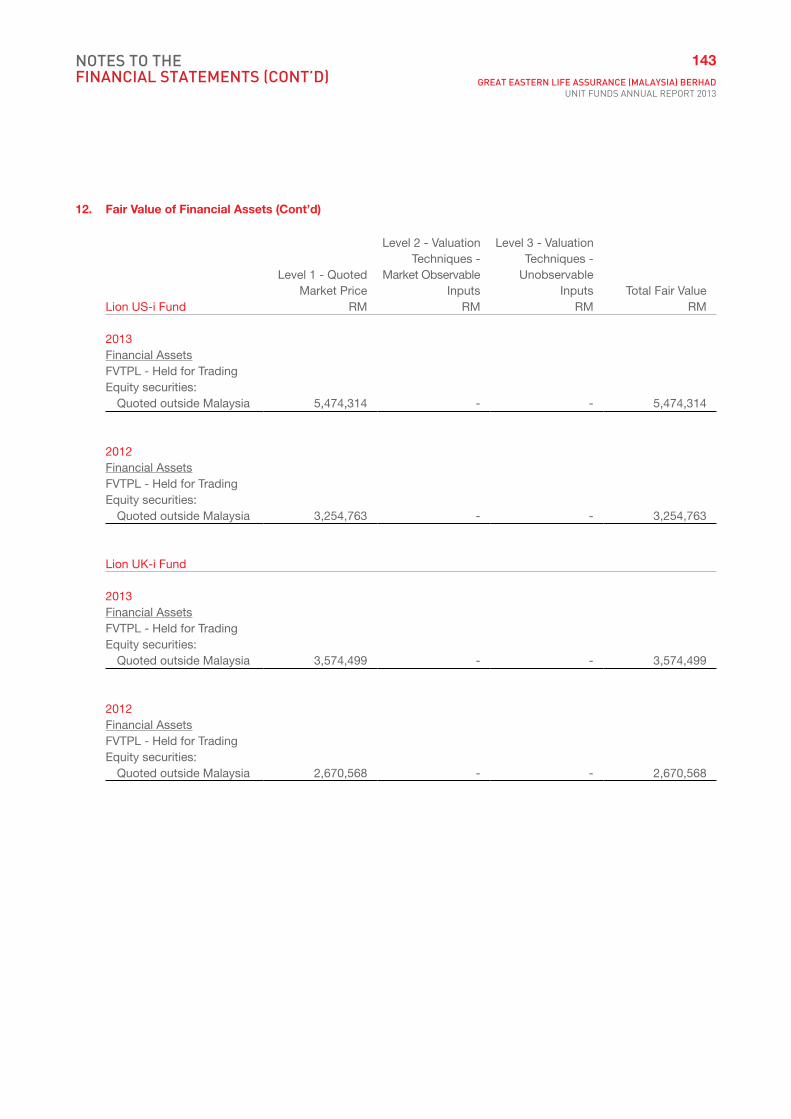
143GREAT EASTERN LIFE ASSURANCE (MALAYSIA) BERHAD
UNIT FUNDS ANNUAL REPORT 2013
12. Fair value of Financial Assets (Cont’d)
Level 1 - QuotedMarket Price
Level 2 - ValuationTechniques -
Market ObservableInputs
Level 3 - ValuationTechniques -
UnobservableInputs Total Fair Value
Lion US-i Fund RM RM RM RM
2013Financial AssetsFVTPL - Held for TradingEquity securities: Quoted outside Malaysia 5,474,314 - - 5,474,314
2012Financial AssetsFVTPL - Held for TradingEquity securities: Quoted outside Malaysia 3,254,763 - - 3,254,763
Lion UK-i Fund
2013Financial AssetsFVTPL - Held for TradingEquity securities: Quoted outside Malaysia 3,574,499 - - 3,574,499
2012Financial AssetsFVTPL - Held for TradingEquity securities: Quoted outside Malaysia 2,670,568 - - 2,670,568
NOTES TO THE FINANCIAL STATEMENTS (CONT’D)

144
12. Fair value of Financial Assets (Cont’d)
Level 1 - QuotedMarket Price
Level 2 - ValuationTechniques -
Market ObservableInputs
Level 3 - ValuationTechniques -
UnobservableInputs Total Fair Value
Lion AU-i Fund RM RM RM RM
2013Financial AssetsFVTPL - Held for TradingEquity securities: Quoted outside Malaysia 8,200,671 - - 8,200,671
2012Financial AssetsFVTPL - Held for TradingEquity securities: Quoted outside Malaysia 8,434,626 - - 8,434,626
Lion Asia Pac Fund
2013Financial AssetsFVTPL - Held for TradingUnit and property trust funds: Quoted outside Malaysia 899,392 - - 899,392
2012Financial AssetsFVTPL - Held for TradingUnit and property trust funds: Quoted outside Malaysia 1,584,284 - - 1,584,284
NOTES TO THE FINANCIAL STATEMENTS (CONT’D)

145GREAT EASTERN LIFE ASSURANCE (MALAYSIA) BERHAD
UNIT FUNDS ANNUAL REPORT 2013
12. Fair value of Financial Assets (Cont’d)
Level 1 - QuotedMarket Price
Level 2 - ValuationTechniques -
Market ObservableInputs
Level 3 - ValuationTechniques -
UnobservableInputs Total Fair Value
Lion Enhanced Equity Fund RM RM RM RM
2013Financial AssetsFVTPL - Held for TradingEquity securities: Quoted in Malaysia 170,074,188 - - 170,074,188 Quoted outside Malaysia 1,300,738 - - 1,300,738 Financial Instruments with embedded derivatives 288,536 - - 288,536 Unit and property trust funds: Quoted in Malaysia 1,359,687 - - 1,359,687 Quoted outside Malaysia 5,397 - - 5,397
173,028,546 - - 173,028,546
2012Financial AssetsFVTPL - Held for TradingEquity securities: Quoted in Malaysia 61,381,127 - - 61,381,127 Quoted outside Malaysia 1,759,529 - - 1,759,529 Financial Instruments with embedded derivatives 96,924 - - 96,924 Unit and property trust funds: Quoted in Malaysia 4,103,813 - - 4,103,813 Quoted outside Malaysia 2,425,097 - - 2,425,097
69,766,490 - - 69,766,490
NOTES TO THE FINANCIAL STATEMENTS (CONT’D)

146
12. Fair value of Financial Assets (Cont’d)
Level 1 - QuotedMarket Price
Level 2 - ValuationTechniques -
Market ObservableInputs
Level 3 - ValuationTechniques -
UnobservableInputs Total Fair Value
Dana Gemilang RM RM RM RM
2013Financial AssetsFVTPL - Held for TradingEquity securities: Quoted in Malaysia 48,970,067 - - 48,970,067 Financial Instruments with embedded derivatives 86,683 - - 86,683 Unit and property trust funds: Quoted in Malaysia 384,718 - - 384,718
49,441,468 - - 49,441,468
2012Financial AssetsFVTPL - Held for TradingEquity securities: Quoted in Malaysia 21,032,546 - - 21,032,546 Quoted outside Malaysia 272,642 - - 272,642 Financial Instruments with embedded derivatives 93,821 - - 93,821 Unit and property trust funds: Quoted in Malaysia 408,174 - - 408,174
21,807,183 - - 21,807,183
Smart Invest Gain Fund
2013Financial AssetsFVTPL - Held for TradingFinancial Instruments with Embedded Derivatives: Unquoted in Malaysia - 25,944,000 - 25,944,000
NOTES TO THE FINANCIAL STATEMENTS (CONT’D)

147GREAT EASTERN LIFE ASSURANCE (MALAYSIA) BERHAD
UNIT FUNDS ANNUAL REPORT 2013
13. Financial Instrument by Category
FVTPL LAR Sub-total
Assets not in scope of MFRS 139 Total
Centennial Max Fund Note RM RM RM RM RM
15.07.2013AssetsInvestments 5 - 235,500,000 235,500,000 - 235,500,000Cash and bank balance - 57,962 57,962 - 57,962Other assets 7 - 18,601 18,601 - 18,601Total assets - 235,576,563 235,576,563 - 235,576,563
FVTPL
Other financial liabilities Sub-total
Liabilitiesnot in scopeof MFRS 139 Total
RM RM RM RM RM
LiabilitiesProvision for taxation - - - 997,408 997,408 Deferred tax liabilities 6 - - - 1,489 1,489 Other payables 8 - 3,794 3,794 - 3,794Total liabilities - 3,794 3,794 998,897 1,002,691
FVTPL LAR Sub-total
Assets not in scope of MFRS 139 Total
Centennial Max Fund Note RM RM RM RM RM
31.12.2012AssetsInvestments 5 231,171,822 300,000 231,471,822 - 231,471,822 Cash and bank balances - 43,085 43,085 - 43,085 Other assets 7 - 2,370,626 2,370,626 - 2,370,626 Total assets 231,171,822 2,713,711 233,885,533 - 233,885,533
FVTPL
Other financial liabilities Sub-total
Liabilitiesnot in scopeof MFRS 139 Total
RM RM RM RM RM
LiabilitiesDeferred tax liabilities 6 - - - 600,869 600,869 Other payables 8 - 2,275,015 2,275,015 9,648 2,284,663 Total liabilities - 2,275,015 2,275,015 610,517 2,885,532
NOTES TO THE FINANCIAL STATEMENTS (CONT’D)

148
13. Financial Instrument by Category (Cont’d)
FVTPL LAR Sub-total
Assets not in scope of MFRS 139 Total
Dana Restu Note RM RM RM RM RM
2013AssetsInvestments 5 826,046,186 60,150,000 886,196,186 - 886,196,186 Cash and bank balances - 51,407 51,407 - 51,407 Other assets 7 - 8,113,288 8,113,288 - 8,113,288 Total assets 826,046,186 68,314,695 894,360,881 - 894,360,881
FVTPL
Other financial liabilities Sub-total
Liabilitiesnot in scopeof MFRS 139 Total
RM RM RM RM RM LiabilitiesProvision for taxation - - - 2,712,302 2,712,302 Deferred tax liabilities 6 - - - 14,050,559 14,050,559 Financial liabilities 8 - 19,327,681 19,327,681 - 19,327,681 Other payables 8 - 33,587,707 33,587,707 3,383 33,591,090 Total liabilities - 52,915,388 52,915,388 16,766,244 69,681,632
FVTPL LAR Sub-total
Assets not in scope of MFRS 139 Total
Dana Restu Note RM RM RM RM RM
2012AssetsInvestments 5 533,957,342 191,970,000 725,927,342 - 725,927,342 Cash and bank balances - 85,674 85,674 - 85,674 Other assets 7 - 1,978,256 1,978,256 - 1,978,256 Total assets 533,957,342 194,033,930 727,991,272 - 727,991,272
FVTPL
Other financial liabilities Sub-total
Liabilitiesnot in scopeof MFRS 139 Total
RM RM RM RM RM
LiabilitiesDeferred tax liabilities 6 - - - 9,682,800 9,682,800 Financial liabilities 8 - 3,633,746 3,633,746 - 3,633,746 Other payables 8 - 27,315,004 27,315,004 22,983 27,337,987 Total liabilities - 30,948,750 30,948,750 9,705,783 40,654,533
NOTES TO THE FINANCIAL STATEMENTS (CONT’D)

149GREAT EASTERN LIFE ASSURANCE (MALAYSIA) BERHAD
UNIT FUNDS ANNUAL REPORT 2013
13. Financial Instrument by Category (Cont’d)
FVTPL LAR Sub-total
Assets not in scope of MFRS 139 Total
Dana Sejati Note RM RM RM RM RM
2013AssetsInvestments 5 73,375,915 15,550,000 88,925,915 - 88,925,915 Cash and bank balances - 172,639 172,639 - 172,639 Other assets 7 - 2,167,446 2,167,446 - 2,167,446 Total assets 73,375,915 17,890,085 91,266,000 - 91,266,000
FVTPL
Other financial liabilities Sub-total
Liabilitiesnot in scopeof MFRS 139 Total
RM RM RM RM RM
LiabilitiesProvision for taxation - - - 1,669,586 1,669,586 Deferred tax liabilities 6 - - - 34,363 34,363 Other payables 8 - - - 355 355 Total liabilities - - - 1,704,304 1,704,304
FVTPL LAR Sub-total
Assets not in scope of MFRS 139 Total
Dana Sejati Note RM RM RM RM RM
2012AssetsInvestments 5 69,298,946 5,150,000 74,448,946 - 74,448,946 Cash and bank balances - 27,105 27,105 - 27,105 Other assets 7 - 2,074,054 2,074,054 - 2,074,054 Total assets 69,298,946 7,251,159 76,550,105 - 76,550,105
FVTPL
Other financial liabilities Sub-total
Liabilitiesnot in scopeof MFRS 139 Total
RM RM RM RM RM
LiabilitiesProvision for taxation - - - 1,289,923 1,289,923 Deferred tax liabilities 6 - - - 109,047 109,047 Other payables 8 - 5,979 5,979 2,165 8,144 Total liabilities - 5,979 5,979 1,401,135 1,407,114
NOTES TO THE FINANCIAL STATEMENTS (CONT’D)

150
13. Financial Instrument by Category (Cont’d)
FVTPL LAR Sub-total
Assets not in scope of MFRS 139 Total
Lion Balanced Fund Note RM RM RM RM RM
2013AssetsInvestments 5 188,284,187 62,390,000 250,674,187 - 250,674,187 Cash and bank balances - 60,964 60,964 - 60,964 Other assets 7 - 6,406,123 6,406,123 - 6,406,123 Total assets 188,284,187 68,857,087 257,141,274 - 257,141,274
FVTPL
Other financial liabilities Sub-total
Liabilitiesnot in scopeof MFRS 139 Total
RM RM RM RM RM
LiabilitiesProvision for taxation - - - 3,625,770 3,625,770 Deferred tax liabilities 6 - - - 1,926,494 1,926,494 Financial liabilities 8 - 2,996,835 2,996,835 - 2,996,835 Other payables 8 - 1,701 1,701 927 2,628 Total liabilities - 2,998,536 2,998,536 5,553,191 8,551,727
FVTPL LAR Sub-total
Assets not in scope of MFRS 139 Total
Lion Balanced Fund Note RM RM RM RM RM
2012AssetsInvestments 5 141,448,153 27,290,000 168,738,153 - 168,738,153 Cash and bank balances - 24,996 24,996 - 24,996 Other assets 7 - 4,791,683 4,791,683 - 4,791,683 Total assets 141,448,153 32,106,679 173,554,832 - 173,554,832
FVTPL
Other financial liabilities Sub-total
Liabilitiesnot in scopeof MFRS 139 Total
RM RM RM RM RM
LiabilitiesProvision for taxation - - - 1,900,791 1,900,791 Deferred tax liabilities 6 - - - 583,573 583,573 Financial liabilities 8 - 3,242,233 3,242,233 - 3,242,233 Other payables 8 - 33,727 33,727 4,144 37,871 Total liabilities - 3,275,960 3,275,960 2,488,508 5,764,468
NOTES TO THE FINANCIAL STATEMENTS (CONT’D)

151GREAT EASTERN LIFE ASSURANCE (MALAYSIA) BERHAD
UNIT FUNDS ANNUAL REPORT 2013
13. Financial Instrument by Category (Cont’d)
FVTPL LAR Sub-total
Assets not in scope of MFRS 139 Total
Lion Fixed Income Fund Note RM RM RM RM RM
2013AssetsInvestments 5 476,152,046 42,300,000 518,452,046 - 518,452,046 Cash and bank balances 54,452 54,452 - 54,452 Other assets 7 7,836,285 7,836,285 - 7,836,285 Total assets 476,152,046 50,190,737 526,342,783 - 526,342,783
FVTPL
Other financial liabilities Sub-total
Liabilitiesnot in scopeof MFRS 139 Total
RM RM RM RM RM
LiabilitiesProvision for taxation - - - 9,226,747 9,226,747 Deferred tax liabilities 6 - - - 299,849 299,849 Other payables 8 - 109,049 109,049 2,048 111,097 Total liabilities - 109,049 109,049 9,528,644 9,637,693
FVTPL LAR Sub-total
Assets not in scope of MFRS 139 Total
Lion Fixed Income Fund Note RM RM RM RM RM
2012AssetsInvestments 5 408,054,119 38,610,000 446,664,119 - 446,664,119 Cash and bank balances - 47,307 47,307 - 47,307 Other assets 7 - 8,688,482 8,688,482 - 8,688,482 Total assets 408,054,119 47,345,789 455,399,908 - 455,399,908
FVTPL
Other financial liabilities Sub-total
Liabilitiesnot in scopeof MFRS 139 Total
RM RM RM RM RM
LiabilitiesProvision for taxation - - - 6,984,214 6,984,214 Deferred tax liabilities 6 - - - 822,364 822,364 Other payables 8 - 116,133 116,133 12,443 128,576 Total liabilities - 116,133 116,133 7,819,021 7,935,154
NOTES TO THE FINANCIAL STATEMENTS (CONT’D)

152
13. Financial Instrument by Category (Cont’d)
FVTPL LAR Sub-total
Assets not in scope of MFRS 139 Total
Lion Growth Fund Note RM RM RM RM RM
2013AssetsInvestments 5 731,312,897 31,250,000 762,562,897 - 762,562,897 Cash and bank balances - 54,736 54,736 - 54,736 Other assets 7 - 1,553,093 1,553,093 - 1,553,093 Total assets 731,312,897 32,857,829 764,170,726 - 764,170,726
FVTPL
Other financial liabilities Sub-total
Liabilitiesnot in scopeof MFRS 139 Total
RM RM RM RM RM
LiabilitiesProvision for taxation - - - 5,860,674 5,860,674 Deferred tax liabilities 6 - - - 9,811,913 9,811,913 Financial liabilities 8 - 2,141,239 2,141,239 - 2,141,239 Other payables 8 - 138,621 138,621 3,014 141,635 Total liabilities - 2,279,860 2,279,860 15,675,601 17,955,461
FVTPL LAR Sub-total
Assets not in scope of MFRS 139 Total
Lion Growth Fund Note RM RM RM RM RM
2012AssetsInvestments 5 519,504,730 133,080,000 652,584,730 - 652,584,730 Cash and bank balances - 98,013 98,013 - 98,013 Other assets 7 - 727,164 727,164 - 727,164 Total assets 519,504,730 133,905,177 653,409,907 - 653,409,907
FVTPL
Other financial liabilities Sub-total
Liabilitiesnot in scopeof MFRS 139 Total
RM RM RM RM RM
LiabilitiesProvision for taxation - - - 2,296,537 2,296,537 Deferred tax liabilities 6 - - - 7,685,483 7,685,483 Other payables 8 - 295,625 295,625 21,898 317,523 Total liabilities - 295,625 295,625 10,003,918 10,299,543
NOTES TO THE FINANCIAL STATEMENTS (CONT’D)

153GREAT EASTERN LIFE ASSURANCE (MALAYSIA) BERHAD
UNIT FUNDS ANNUAL REPORT 2013
13. Financial Instrument by Category (Cont’d)
FVTPL LAR Sub-total
Assets not in scope of MFRS 139 Total
Lion Progressive Fund Note RM RM RM RM RM
2013AssetsInvestments 5 789,078,251 59,290,000 848,368,251 - 848,368,251 Cash and bank balances - 63,769 63,769 - 63,769 Other assets 7 - 4,291,329 4,291,329 - 4,291,329 Total assets 789,078,251 63,645,098 852,723,349 - 852,723,349
FVTPL
Other financial liabilities Sub-total
Liabilitiesnot in scopeof MFRS 139 Total
RM RM RM RM RM
LiabilitiesProvision for taxation - - - 3,305,299 3,305,299 Deferred tax liabilities 6 - - - 11,041,868 11,041,868 Financial liabilities 8 - 1,416,499 1,416,499 - 1,416,499 Other payables 8 - 877,433 877,433 3,307 880,740 Total liabilities - 2,293,932 2,293,932 14,350,474 16,644,406
FVTPL LAR Sub-total
Assets not in scope of MFRS 139 Total
Lion Progressive Fund Note RM RM RM RM RM
2012AssetsInvestments 5 620,112,677 63,580,000 683,692,677 - 683,692,677 Cash and bank balances - 105,573 105,573 - 105,573 Other assets 7 - 2,610,174 2,610,174 - 2,610,174 Total assets 620,112,677 66,295,747 686,408,424 - 686,408,424
FVTPL
Other financial liabilities Sub-total
Liabilitiesnot in scopeof MFRS 139 Total
RM RM RM RM RM
LiabilitiesProvision for taxation - - - 670,985 670,985 Deferred tax liabilities 6 - - - 7,136,455 7,136,455 Other payables 8 - 1,613,823 1,613,823 20,547 1,634,370 Total liabilities - 1,613,823 1,613,823 7,827,987 9,441,810
NOTES TO THE FINANCIAL STATEMENTS (CONT’D)

154
13. Financial Instrument by Category (Cont’d)
FVTPL LAR Sub-total
Assets not in scope of MFRS 139 Total
Lion Strategic Fund Note RM RM RM RM RM
2013AssetsInvestments 5 733,680,391 108,700,000 842,380,391 - 842,380,391 Cash and bank balances - 66,740 66,740 - 66,740 Other assets 7 - 6,658,509 6,658,509 - 6,658,509 Total assets 733,680,391 115,425,249 849,105,640 - 849,105,640
FVTPL
Other financial liabilities Sub-total
Liabilitiesnot in scopeof MFRS 139 Total
RM RM RM RM RM
LiabilitiesProvision for taxation - - - 3,759,919 3,759,919 Deferred tax liabilities 6 - - - 8,606,514 8,606,514 Financial liabilities 8 - 29,702,142 29,702,142 - 29,702,142 Other payables 8 - - - 3,045 3,045 Total liabilities - 29,702,142 29,702,142 12,369,478 42,071,620
FVTPL LAR Sub-total
Assets not in scope of MFRS 139 Total
Lion Strategic Fund Note RM RM RM RM RM
2012AssetsInvestments 5 485,443,678 91,120,000 576,563,678 - 576,563,678 Cash and bank balances - 34,432 34,432 - 34,432 Other assets 7 - 7,556,769 7,556,769 - 7,556,769 Total assets 485,443,678 98,711,201 584,154,879 - 584,154,879
FVTPL
Other financial liabilities Sub-total
Liabilitiesnot in scopeof MFRS 139 Total
RM RM RM RM RM
LiabilitiesProvision for taxation - - - 2,532,186 2,532,186 Deferred tax liabilities 6 - - - 3,756,366 3,756,366 Financial liabilities 8 - 1,083,134 1,083,134 - 1,083,134 Other payables 8 - 50,331 50,331 14,910 65,241 Total liabilities - 1,133,465 1,133,465 6,303,462 7,436,927
NOTES TO THE FINANCIAL STATEMENTS (CONT’D)

155GREAT EASTERN LIFE ASSURANCE (MALAYSIA) BERHAD
UNIT FUNDS ANNUAL REPORT 2013
13. Financial Instrument by Category (Cont’d)
FVTPL LAR Sub-total
Assets not in scope of MFRS 139 Total
Lion US-i Fund Note RM RM RM RM RM
2013AssetsInvestments 5 5,474,314 - 5,474,314 - 5,474,314 Cash and bank balances - 23,440 23,440 - 23,440 Other assets 7 - 34,537 34,537 - 34,537 Total assets 5,474,314 57,977 5,532,291 - 5,532,291
FVTPL
Other financial liabilities Sub-total
Liabilitiesnot in scopeof MFRS 139 Total
RM RM RM RM RM
LiabilitiesProvision for taxation - - - 23,982 23,982 Deferred tax liabilities 6 - - - 128,766 128,766 Other payables 8 - - - 20 20 Total liabilities - - - 152,768 152,768
FVTPL LAR Sub-total
Assets not in scope of MFRS 139 Total
Lion US-i Fund Note RM RM RM RM RM
2012AssetsInvestments 5 3,254,763 - 3,254,763 - 3,254,763 Cash and bank balances - 77,825 77,825 - 77,825 Other assets 7 - 16,348 16,348 - 16,348 Total assets 3,254,763 94,173 3,348,936 - 3,348,936
FVTPL
Other financial liabilities Sub-total
Liabilitiesnot in scopeof MFRS 139 Total
RM RM RM RM RM
LiabilitiesProvision for taxation - - - 4,908 4,908 Deferred tax liabilities 6 - - - 31,887 31,887 Other payables 8 - 91,601 91,601 117 91,718 Total liabilities - 91,601 91,601 36,912 128,513
NOTES TO THE FINANCIAL STATEMENTS (CONT’D)

156
13. Financial Instrument by Category (Cont’d)
FVTPL LAR Sub-total
Assets not in scope of MFRS 139 Total
Lion UK-I Fund Note RM RM RM RM RM
2013AssetsInvestments 5 3,574,499 - 3,574,499 - 3,574,499 Cash and bank balances - 39,206 39,206 - 39,206 Other assets 7 - 3,794 3,794 - 3,794 Total assets 3,574,499 43,000 3,617,499 - 3,617,499
FVTPL
Other financial liabilities Sub-total
Liabilitiesnot in scopeof MFRS 139 Total
RM RM RM RM RM
LiabilitiesProvision for taxation - - - 10,040 10,040 Deferred tax liabilities 6 - - - 59,110 59,110 Other payables 8 - - - 14 14 Total liabilities - - - 69,164 69,164
FVTPL LAR Sub-total
Assets not in scope of MFRS 139 Total
Lion UK-I Fund Note RM RM RM RM RM
2012AssetsInvestments 5 2,670,568 - 2,670,568 - 2,670,568 Cash and bank balances - 16,837 16,837 - 16,837 Other assets 7 - 6,150 6,150 - 6,150 Total assets 2,670,568 22,987 2,693,555 - 2,693,555
FVTPL
Other financial liabilities Sub-total
Liabilitiesnot in scopeof MFRS 139 Total
RM RM RM RM RM
LiabilitiesProvision for taxation - - - 2,523 2,523 Deferred tax liabilities 6 - - - 5,929 5,929 Other payables 8 - - - 84 84 Total liabilities - - - 8,536 8,536
NOTES TO THE FINANCIAL STATEMENTS (CONT’D)

157GREAT EASTERN LIFE ASSURANCE (MALAYSIA) BERHAD
UNIT FUNDS ANNUAL REPORT 2013
13. Financial Instrument by Category (Cont’d)
FVTPL LAR Sub-total
Assets not in scope of MFRS 139 Total
Lion AU-i Fund Note RM RM RM RM RM
2013AssetsInvestments 5 8,200,671 1,820,000 10,020,671 - 10,020,671 Cash and bank balances - 50,611 50,611 - 50,611 Other assets 7 - 2,276,527 2,276,527 - 2,276,527 Total assets 8,200,671 4,147,138 12,347,809 - 12,347,809
FVTPL
Other financial liabilities Sub-total
Liabilitiesnot in scopeof MFRS 139 Total
RM RM RM RM RM
LiabilitiesProvision for taxation - - - 78,096 78,096 Deferred tax liabilities 6 - - - 31,886 31,886 Other payables 8 - 2,927,741 2,927,741 35 2,927,776 Total liabilities - 2,927,741 2,927,741 110,017 3,037,758
FVTPL LAR Sub-total
Assets not in scope of MFRS 139 Total
Lion AU-i Fund Note RM RM RM RM RM
2012AssetsInvestments 5 8,434,626 600,000 9,034,626 - 9,034,626 Cash and bank balances - 83,549 83,549 - 83,549 Other assets 7 - 224,290 224,290 - 224,290 Total assets 8,434,626 907,839 9,342,465 - 9,342,465
FVTPL
Other financial liabilities Sub-total
Liabilitiesnot in scopeof MFRS 139 Total
RM RM RM RM RM
LiabilitiesProvision for taxation - - - 45,896 45,896 Deferred tax liabilities 6 - - - 31,281 31,281 Other payables 8 - 1,657,277 1,657,277 314 1,657,591 Total liabilities - 1,657,277 1,657,277 77,491 1,734,768
NOTES TO THE FINANCIAL STATEMENTS (CONT’D)

158
13. Financial Instrument by Category (Cont’d)
FVTPL LAR Sub-total
Assets not in scope of MFRS 139 Total
Lion Asia Pac Fund Note RM RM RM RM RM
2013AssetsInvestments 5 899,392 - 899,392 - 899,392 Cash and bank balances - 76,320 76,320 - 76,320 Other assets 7 - 13,509 13,509 - 13,509 Total assets 899,392 89,829 989,221 - 989,221
FVTPL
Other financial liabilities Sub-total
Liabilitiesnot in scopeof MFRS 139 Total
RM RM RM RM RM
LiabilitiesDeferred tax liabilities 6 - - - 7,096 7,096 Other payables 8 - 67,857 67,857 4 67,861 Total liabilities - 67,857 67,857 7,100 74,957
FVTPL LAR Sub-total
Assets not in scope of MFRS 139 Total
Lion Asia Pac Fund Note RM RM RM RM RM
2012AssetsInvestments 5 1,584,284 - 1,584,284 - 1,584,284 Cash and bank balances - 22,802 22,802 - 22,802 Other assets 7 - 9,562 9,562 - 9,562 Total assets 1,584,284 32,364 1,616,648 - 1,616,648
FVTPL
Other financial liabilities Sub-total
Liabilitiesnot in scopeof MFRS 139 Total
RM RM RM RM RM
LiabilitiesDeferred tax liabilities 6 - - - 5,495 5,495 Other payables 8 - 613,684 613,684 27 613,711 Total liabilities - 613,684 613,684 5,522 619,206
NOTES TO THE FINANCIAL STATEMENTS (CONT’D)

159GREAT EASTERN LIFE ASSURANCE (MALAYSIA) BERHAD
UNIT FUNDS ANNUAL REPORT 2013
13. Financial Instrument by Category (Cont’d)
FVTPL LAR Sub-total
Assets not in scope of MFRS 139 Total
Lion Enhanced Equity Fund Note RM RM RM RM RM
2013AssetsInvestments 5 173,028,546 18,570,000 191,598,546 - 191,598,546 Cash and bank balances - 329,613 329,613 - 329,613 Deferred tax assets 6 - - - - - Other assets 7 - 7,851,318 7,851,318 - 7,851,318 Total assets 173,028,546 26,750,931 199,779,477 - 199,779,477
FVTPL
Other financial liabilities Sub-total
Liabilitiesnot in scopeof MFRS 139 Total
RM RM RM RM RM
LiabilitiesProvision for taxation - - - 413,093 413,093 Deferred tax liabilities 6 - - - 2,588,629 2,588,629 Financial liabilities 8 - 351,439 351,439 - 351,439 Other payables 8 - - - 1,274 1,274 Total liabilities - 351,439 351,439 3,002,996 3,354,435
FVTPL LAR Sub-total
Assets not in scope of MFRS 139 Total
Lion Enhanced Equity Fund Note RM RM RM RM RM
2012AssetsInvestments 5 69,766,490 12,850,000 82,616,490 - 82,616,490 Cash and bank balances - 1,248,571 1,248,571 - 1,248,571 Other assets 7 - 3,147,880 3,147,880 - 3,147,880 Total assets 69,766,490 17,246,451 87,012,941 - 87,012,941
FVTPL
Other financial liabilities Sub-total
Liabilitiesnot in scopeof MFRS 139 Total
RM RM RM RM RM
LiabilitiesProvision for taxation - - - 151,229 151,229 Deferred tax liabilities 6 - - - 482,147 482,147 Financial liabilities 8 - 861,928 861,928 - 861,928 Other payables 8 - - - 1,180 1,180 Total liabilities - 861,928 861,928 634,556 1,496,484
NOTES TO THE FINANCIAL STATEMENTS (CONT’D)

160
13. Financial Instrument by Category (Cont’d)
FVTPL LAR Sub-total
Assets not in scope of MFRS 139 Total
Dana Gemilang Note RM RM RM RM RM
2013AssetsInvestments 5 49,441,468 6,440,000 55,881,468 - 55,881,468Cash and bank balances - 610,488 610,488 - 610,488 Other assets 7 - 145,737 145,737 - 145,737 Total assets 49,441,468 7,196,225 56,637,693 - 56,637,693
FVTPL
Other financial liabilities Sub-total
Liabilitiesnot in scopeof MFRS 139 Total
RM RM RM RM RM
LiabilitiesProvision for taxation - - - 123,373 123,373 Deferred tax liabilities 6 - - - 771,592 771,592 Financial liabilities 8 - 1,869,144 1,869,144 - 1,869,144 Other payables 8 - 1,130,488 1,130,488 336 1,130,824 Total liabilities - 2,999,632 2,999,632 895,301 3,894,933
FVTPL LAR Sub-total
Assets not in scope of MFRS 139 Total
Dana Gemilang Note RM RM RM RM RM
2012AssetsInvestments 5 21,807,183 3,810,000 25,617,183 - 25,617,183 Cash and bank balances - 336,582 336,582 - 336,582 Other assets 7 - 813,268 813,268 - 813,268 Total assets 21,807,183 4,959,850 26,767,033 - 26,767,033
FVTPL
Other financial liabilities Sub-total
Liabilitiesnot in scopeof MFRS 139 Total
RM RM RM RM RM
LiabilitiesDeferred tax liabilities 6 - - - 254,798 254,798 Other payables 8 - - - 434 434 Total liabilities - - - 255,232 255,232
NOTES TO THE FINANCIAL STATEMENTS (CONT’D)

161GREAT EASTERN LIFE ASSURANCE (MALAYSIA) BERHAD
UNIT FUNDS ANNUAL REPORT 2013
13. Financial Instrument by Category (Cont’d)
FVTPL LAR Sub-total
Assets not in scope of MFRS 139 Total
Smart Invest Gain Fund Note RM RM RM RM RM
2013AssetsInvestments 5 25,944,000 2,400,000 28,344,000 - 28,344,000 Cash and bank balances - 15,538 15,538 - 15,538 Deferred tax assets 6 - - - 57,148 57,148 Other assets 7 - 26,653 26,653 - 26,653 Total assets 25,944,000 2,442,191 28,386,191 57,148 28,443,339
FVTPL
Other financial liabilities Sub-total
Liabilitiesnot in scopeof MFRS 139 Total
RM RM RM RM RM
LiabilitiesProvision for taxation - - - 45 45 Other payables 8 - 3,206 3,206 88 3,294 Total liabilities - 3,206 3,206 133 3,339
NOTES TO THE FINANCIAL STATEMENTS (CONT’D)

STATEMENTBY MANAGER
We, Koh Yaw Hui and Yeoh Beow Tit, being two of the Directors of Great Eastern Life Assurance (Malaysia) Berhad, do hereby state that, in the opinion of the Manager, the accompanying financial statements set out on pages 17 to 161 have been drawn up in accordance with Malaysian Financial Reporting Standards, International Financial Reporting Standards and the Guidelines issued by Bank Negara Malaysia so as to give a true and fair view:
(a) of the financial position of Centennial Max Fund as at 15 July 2013 (“maturity date”), and of Dana Restu, Dana Sejati, Lion Balanced Fund, Lion Fixed Income Fund, Lion Growth Fund, Lion Progressive Fund, Lion Strategic Fund, Lion US-i Fund, Lion UK-i Fund, Lion AU-i Fund, Lion Asia Pac Fund, Lion Enhanced Equity Fund, Dana Gemilang and Smart Invest Gain Fund as at 31 December 2013; and
(b) of their financial performance and cash flows of Centennial Max Fund from 1 January 2013 to 15 July 2013 and of Dana Restu, Dana Sejati, Lion Balanced Fund, Lion Fixed Income Fund, Lion Growth Fund, Lion Progressive Fund, Lion Strategic Fund, Lion US-i Fund, Lion UK-i Fund, Lion AU-i Fund, Lion Asia Pac Fund, Lion Enhanced Equity Fund and Dana Gemilang from 1 January 2013 to 31 December 2013 and of Smart Invest Gain Fund from 30 August 2013 (“date of incorporation”) to 31 December 2013.
On behalf of the Board
Dato Koh Yaw Hui Dato’ Yeoh Beow Tit
Kuala Lumpur, Malaysia24 January 2014
162

INDEPENDENT AUDITORS’REPORT TO THE UNITHOLDERSof Unit Linked Investment Funds of Great Eastern Life Assurance (Malaysia) Berhad (Incorporated in Malaysia)
We have audited the financial statements of Centennial Max Fund, Dana Restu, Dana Sejati, Lion Balanced Fund, Lion Fixed Income Fund, Lion Growth Fund, Lion Progressive Fund, Lion Strategic Fund, Lion US-i Fund, Lion UK-i Fund, Lion AU-i Fund, Lion Asia Pac Fund, Lion Enhanced Equity Fund, Dana Gemilang and Smart Invest Gain Fund (collectively referred to as “the Funds”), which comprise:
(a) the balance sheet of Centennial Max Fund as at 15 July 2013 (“maturity date”), and of Dana Restu, Dana Sejati, Lion Balanced Fund, Lion Fixed Income Fund, Lion Growth Fund, Lion Progressive Fund, Lion Strategic Fund, Lion US-i Fund, Lion UK-i Fund, Lion AU-i Fund, Lion Asia Pac Fund, Lion Enhanced Equity Fund, Dana Gemilang and Smart Invest Gain Fund as at 31 December 2013;
(b) the statements of comprehensive income, statements of changes in equity and cash flow statements of Centennial Max Fund from 1 January 2013 to 15 July 2013 and of Dana Restu, Dana Sejati, Lion Balanced Fund, Lion Fixed Income Fund, Lion Growth Fund, Lion Progressive Fund, Lion Strategic Fund, Lion US-i Fund, Lion UK-i Fund, Lion AU-i Fund, Lion Asia Pac Fund, Lion Enhanced Equity Fund and Dana Gemilang from 1 January 2013 to 31 December 2013 and of Smart Invest Gain Fund from 30 August 2013 (“date of incorporation”) to 31 December 2013; and
(c) a summary of significant accounting policies and other explanatory information, as set out on pages 17 to 161.
Directors’ responsibility for the financial statementsThe directors of the Manager are responsible for the preparation of financial statements so as to give a true and fair view in accordance with Malaysian Financial Reporting Standards, International Financial Reporting Standards and the Guidelines issued by Bank Negara Malaysia. The directors are also responsible for such internal control as the directors determine is necessary to enable the preparation of financial statements that are free from material misstatement, whether due to fraud or error.
Auditors’ responsibilityOur responsibility is to express an opinion on these financial statements based on our audit. We conducted our audit in accordance with approved standards on auditing in Malaysia. Those standards require that we comply with ethical requirements and plan and perform the audit to obtain reasonable assurance about whether the financial statements are free from material misstatement.
An audit involves performing procedures to obtain audit evidence about the amounts and disclosures in the financial statements. The procedures selected depend on our judgment, including the assessment of risks of material misstatement of the financial statements, whether due to fraud or error. In making those risk assessments, we consider internal control relevant to the Funds’ preparation of financial statements that give a true and fair view in order to design audit procedures that are appropriate in the circumstances, but not for the purpose of expressing an opinion on the effectiveness of the Funds’ internal control. An audit also includes evaluating the appropriateness of the accounting policies used and the reasonableness of accounting estimates made by the directors, as well as evaluating the overall presentation of the financial statements.
We believe that the audit evidence we have obtained is sufficient and appropriate to provide a basis for our audit opinion.
163GREAT EASTERN LIFE ASSURANCE (MALAYSIA) BERHAD
UNIT FUNDS ANNUAL REPORT 2013

OpinionIn our opinion, the financial statements have been properly drawn up in accordance with Malaysian Financial Reporting Standards, International Financial Reporting Standards and the Guidelines issued by Bank Negara Malaysia so as to give a true and fair view:
(a) of the financial position of Centennial Max Fund as at 15 July 2013 (“maturity date”), and of Dana Restu, Dana Sejati, Lion Balanced Fund, Lion Fixed Income Fund, Lion Growth Fund, Lion Progressive Fund, Lion Strategic Fund, Lion US-i Fund, Lion UK-i Fund, Lion AU-i Fund, Lion Asia Pac Fund, Lion Enhanced Equity Fund, Dana Gemilang and Smart Invest Gain Fund as at 31 December 2013; and
(b) of their financial performance and cash flows for the period/year then ended.
Other mattersThis report is made solely to the unitholders’ of the Funds, as a body, in accordance with Guidelines issued by Bank Negara Malaysia and for no other purpose. We do not assume responsibility to any other person for the content of this report.
Ernst & Young Dato’ Abdul Rauf bin Rashid AF: 0039 No. 2305/05/14(J) Chartered Accountants Chartered Accountant Kuala Lumpur, Malaysia 24 January 2014
INDEPENDENT AUDITORS’REPORT TO THE UNITHOLDERS
164

CORPORATE SHARIAH ADVISOR’S REPORT
To the Investment-Linked Policy Owners of Great Eastern Life Assurance (Malaysia) Berhad
I, DR OBIYATHULLA ISMATH BACHA being the Shariah Advisor of the DANA RESTU, DANA GEMILANG and DANA SEJATI (the “Funds”) am of the opinion that GREAT EASTERN LIFE ASSURANCE (MALAYSIA) BERHAD (the “Company”), has fulfilled their duties in the following manner for the financial year ended 31 December 2013.
In my opinion:
a. For the period under review, the Dana Restu and Dana Gemilang were invested in accordance with the list of Shariah-approved securities published by Securities Commission; and
b. The Dana Sejati was invested in accordance with the list of Shariah-approved instruments rated by Rating Agency Malaysia Berhad or Malaysia Rating Corporation Berhad.
..........................................................DR OBIYATHULLA ISMATH BACHA
Date: 31 December 2013
165GREAT EASTERN LIFE ASSURANCE (MALAYSIA) BERHAD
UNIT FUNDS ANNUAL REPORT 2013

COMPARATIVEPERFORMANCE TABLE
Dana RestuComparative Performance Table
2009 2010 2011 2012 2013
I) Composition of fund according to industry sectors and category of investments
Equity Securities Building Materials / Construction 10.05% 7.80% 9.01% 6.85% 14.11% Conglomerates 5.22% 2.05% 4.14% 4.00% 7.25% Media 0.00% 3.27% 3.26% 2.43% 0.65% Petroleum, Chemical & Gas 14.52% 20.49% 17.37% 14.06% 25.25% Properties 3.60% 2.14% 2.53% 0.00% 3.72% Resource Based 15.82% 19.08% 18.21% 14.12% 10.97% Technology 6.15% 3.69% 2.27% 1.27% 0.00% Telecommunication & Cables 11.78% 11.58% 13.59% 17.57% 12.07% Transport Services 4.50% 3.60% 1.67% 0.24% 0.00% Utilities / Infrastructure 10.25% 9.21% 0.00% 5.98% 10.67% Others 1.89% 5.78% 6.09% 9.33% 13.72%
83.78% 88.69% 78.14% 75.85% 98.41% Financial Instruments with Embedded Derivatives Building Materials / Construction 0.14% 0.39% 0.23% 0.16% 0.19% Petroleum, Chemical and Gas 0.00% 0.00% 0.00% 0.03% 0.07% Resource Based 0.07% 0.10% 0.05% 0.05% 0.21% Technology 0.00% 0.10% 0.04% 0.01% 0.01%
0.21% 0.59% 0.32% 0.25% 0.48% Unit and Property Trust Funds Properties 1.04% 1.60% 1.59% 1.59% 1.25% Plantation 0.54% 0.00% 0.00% 0.00% 0.00%
1.58% 1.60% 1.59% 1.59% 1.25%
Deposits With a Financial Institution 18.37% 12.08% 24.72% 27.93% 7.29%
Bank Balances 0.03% 0.04% 0.01% 0.01% 0.01%
Other Assets / (Liabilities) -3.97% -3.00% -4.78% -5.63% -7.44% Total 100.00% 100.00% 100.00% 100.00% 100.00%
166

COMPARATIVEPERFORMANCE TABLE (CONT’D)
Dana Restu (Cont’d)Comparative Performance Table (Cont’d)
2009 2010 2011 2012 2013
II) Total Unitholders’ Capital 371,404,659 500,230,113 570,982,822 687,336,739 824,679,249
III) Number of Units 194,758,605 223,516,582 246,964,888 268,490,914 279,268,286
IV) Unitholders’ Capital Per Unit 1.907 2.238 2.312 2.560 2.953
V) Highest Unitholders’ Capital Per Unit during the financial year 1.919 2.251 2.402 2.560 2.953
VI) Lowest Unitholders’ Capital Per Unit during the financial year 1.382 1.900 2.063 2.303 2.477
VII) Total annual return of the fund (%) 34.0% 17.4% 3.3% 10.7% 15.4% Capital growth 34.0% 17.4% 3.3% 10.7% 15.4% Income distribution - - - - -
VIII) Total return One-year 34.0% 17.4% 3.3% 10.7% 15.4% Three-years 16.2% 1.1% 62.5% 34.2% 31.9% Five-years 38.4% 71.2% 40.9% 15.6% 107.5%
IX) Performance of relevant benchmark indices - FBMS * One-year 43.0% 18.2% 2.4% 11.8% 13.3% Three-years 17.6% -4.5% 73.1% 35.4% 29.8% Five-years 35.8% 75.9% 42.3% 9.4% 119.4%
Note : * KLSI - replaced by FBMS effective 1 November 2007.
167GREAT EASTERN LIFE ASSURANCE (MALAYSIA) BERHAD
UNIT FUNDS ANNUAL REPORT 2013

Dana SejatiComparative Performance Table
2009 2010 2011 2012 2013
I) Composition of fund according to industry sectors and category of investments
Malaysian Government Securities 48.25% 10.90% 3.39% 15.57% 11.85%
Debt Securities Building Materials / Construction 0.00% 13.57% 5.12% 0.00% 3.41% Conglomerates 0.00% 0.00% 0.00% 4.12% 0.00% Financial Services 0.00% 0.00% 6.67% 6.65% 5.56% Highway 12.95% 36.86% 27.56% 12.65% 6.43% Power 14.10% 12.77% 18.19% 13.54% 18.15% Properties 0.00% 10.70% 4.95% 10.89% 9.07% Plantation 0.00% 0.00% 0.00% 4.00% 0.00% Investment Holding 0.00% 0.00% 0.00% 7.28% 14.62% Transportation - Qgov 0.00% 0.00% 0.00% 6.82% 0.00% Infrastructure - Qgov 0.00% 0.00% 0.00% 0.00% 5.51% Government 0.00% 0.00% 0.00% 6.65% 0.00% Water 13.81% 9.57% 5.83% 0.00% 1.91% Utilities / Infrastructure 0.00% 0.00% 0.00% 0.00% 5.42% Others 0.00% 0.00% 0.00% 4.05% 0.00%
40.86% 83.47% 68.32% 76.65% 70.08%
Deposits With a Financial Institution 10.34% 5.87% 27.29% 6.85% 17.36% Bank Balances 0.33% 0.11% 0.09% 0.04% 0.19% Other Assets / (Liabilities) 0.22% -0.35% 0.91% 0.89% 0.52% Total 100.00% 100.00% 100.00% 100.00% 100.00%
COMPARATIVEPERFORMANCE TABLE (CONT’D)168

Dana Sejati (Cont’d)Comparative Performance Table (Cont’d)
2009 2010 2011 2012 2013
II) Total Unitholders' Capital 33,363,840 45,802,132 60,746,402 75,142,991 89,561,696
III) Number of Units 22,665,652 28,698,078 35,565,809 41,332,778 47,740,776
IV) Unitholders' Capital Per Unit 1.472 1.596 1.708 1.818 1.876
V) Highest Unitholders' Capital Per Unit during the financial year 1.472 1.596 1.708 1.818 1.876
VI) Lowest Unitholders' Capital Per Unit during the financial year 1.412 1.472 1.596 1.708 1.818
VII) Total annual return of the fund (%) 3.7% 8.4% 7.0% 6.4% 3.2% Capital growth 3.7% 8.4% 7.0% 6.4% 3.2% Income distribution - - - - -
VIII) Total return One-year 3.7% 8.4% 7.0% 6.4% 3.2% Three-years 15.7% 17.4% 20.3% 23.5% 17.5% Five-years 37.3% 37.6% 34.3% 33.7% 32.1%
IX) Performance of relevant benchmark indices-12 Months Mudharabah Deposit One-year 2.8% 2.8% 3.1% 3.2% 3.2% Three-years 10.7% 9.7% 9.0% 9.4% 9.8% Five-years 19.0% 18.0% 17.3% 16.7% 16.1%
COMPARATIVEPERFORMANCE TABLE (CONT’D)
169GREAT EASTERN LIFE ASSURANCE (MALAYSIA) BERHAD
UNIT FUNDS ANNUAL REPORT 2013

Lion Balanced FundComparative Performance Table
2009 2010 2011 2012 2013
I) Composition of fund according to industry sectors and category of investments
Malaysian Government Securities 0.00% 0.00% 0.00% 3.57% 0.00%
Debt Securities Construction 0.00% 0.00% 0.00% 1.20% 4.82% Commercial - Prop 0.00% 0.00% 0.00% 0.00% 4.00% Financial Services 5.38% 3.56% 0.00% 9.58% 8.06% Financial Institutions 0.00% 0.00% 0.00% 0.00% 2.00% Highway 8.64% 11.02% 0.00% 11.14% 0.00% Government 0.00% 0.00% 0.00% 0.60% 0.00% Leisure 0.00% 0.00% 0.00% 0.32% 0.00% Power 0.00% 0.00% 0.00% 3.22% 0.00% Properties 6.51% 3.65% 0.00% 6.04% 0.00% Water 16.29% 10.48% 0.00% 0.00% 0.00% Transportation - QGov 0.00% 0.00% 0.00% 0.00% 2.04% Utilities / Infrastructure 0.00% 0.00% 0.00% 0.00% 0.00% Others 0.00% 0.08% 0.00% 0.00% 0.00%
36.82% 28.79% 0.00% 32.10% 20.92% Equity Securities Building Materials / Construction 3.33% 4.26% 5.30% 5.20% 6.70% Conglomerates 0.00% 0.00% 1.50% 0.99% 3.76% Financial Services 4.74% 4.35% 5.66% 6.50% 2.63% Gaming / Leisure 3.27% 2.12% 0.86% 2.39% 2.24% Media 3.41% 5.26% 3.23% 3.37% 0.00% Petroleum, Chemical & Gas 15.67% 14.56% 4.62% 7.62% 13.60% Resource Based 2.05% 10.14% 8.34% 3.09% 5.54% Properties 0.00% 0.00% 2.57% 1.23% 3.72% Technology 4.88% 0.00% 0.00% 2.39% 2.99% Telecommunication & Cables 0.00% 2.04% 2.71% 1.22% 0.42% Transport Services 2.98% 3.03% 1.53% 1.08% 1.28% Utilities / Infrastructure 2.71% 1.68% 0.00% 5.50% 6.15% Others 9.97% 6.50% 6.73% 4.80% 4.49%
53.01% 53.94% 43.05% 45.38% 53.52%
Financial Instruments with Embedded Derivatives Building Materials / Construction 0.03% 0.95% 0.22% 0.10% 0.29% Media 0.00% 0.04% 0.00% 0.00% 0.00% Gaming / Leisure 0.00% 0.00% 0.00% 0.00% 0.05% Transport Services 0.00% 0.00% 0.00% 0.00% 0.00% Technology 0.00% 0.04% 0.00% 0.01% 0.94% Others 0.00% 0.24% 1.06% 0.81% 0.00%
0.03% 1.23% 1.28% 0.92% 1.28%
COMPARATIVEPERFORMANCE TABLE (CONT’D)170

Lion Balanced Fund (Cont’d)Comparative Performance Table (Cont’d)
2009 2010 2011 2012 2012
Unit and Property Trust Funds Properties 0.00% 0.00% 2.11% 2.34% 0.00% Deposits With a Financial Institution 10.97% 15.79% 55.21% 16.26% 25.10% Bank Balances 0.13% 0.05% 0.05% 0.01% 0.02% Other Assets / (Liabilities) -0.96% 0.20% -1.70% -0.58% -0.84% Total 100.00% 100.00% 100.00% 100.00% 100.00%
II) Total Unitholders' Capital 56,325,564 85,850,016 119,010,514 167,790,364 248,589,547
III) Number of Units 25,625,825 33,057,380 42,979,601 55,837,060 67,790,986
IV) Unitholders' Capital Per Unit 2.198 2.597 2.769 3.005 3.667
V) Highest Unitholders' Capital Per Unit during the financial year 2.198 2.597 2.815 3.006 3.668
VI) Lowest Unitholders' Capital Per Unit during the financial year 1.652 2.206 2.542 2.767 2.973
VII) Total annual return of the fund (%) 29.3% 18.2% 6.6% 8.5% 22.0% Capital growth 29.3% 18.2% 6.6% 8.5% 22.0% Income distribution - - - - -
VIII) Average annual return One-year 29.3% 18.2% 6.6% 8.5% 22.0% Three-years 39.2% 22.4% 62.9% 36.7% 41.2% Five-years 72.7% 103.5% 75.4% 41.6% 115.7%
IX) Performance of relevant benchmark indices - FBMKLCI & FBM100 * One-year 45.6% 21.8% 1.9% 9.6% 11.4% Three-years 16.5% 7.6% 80.8% 36.0% 24.4% Five-years 40.7% 72.8% 44.6% 20.2% 120.7%
X) Performance of Weighted Benchmark 50% weight on 12-months Fixed Deposit return and 50% weight on FBMKLCI & FBM100* return One-year 22.5% 12.0% 2.7% 6.4% 7.3% Three-years 14.8% 9.5% 40.9% 22.4% 17.3% Five-years 31.2% 44.7% 32.0% 19.7% 60.9%
Note :* 2006 - Jun 2009 : KLCI* Jul 2009 - Dec 2010 : Time weighted of FBMKLCI & FBM100
COMPARATIVEPERFORMANCE TABLE (CONT’D)
171GREAT EASTERN LIFE ASSURANCE (MALAYSIA) BERHAD
UNIT FUNDS ANNUAL REPORT 2013

Lion Fixed Income FundComparative Performance Table
2009 2010 2011 2012 2013
I) Composition of fund according to industry sectors and category of investments
Malaysian Government Securities 27.20% 14.84% 14.87% 11.11% 8.16% Debt Securities Commercial - Properties 0.00% 0.00% 1.45% 1.13% 1.92% Construction 0.00% 0.00% 0.00% 0.00% 4.27% Building Materials / Construction 0.00% 9.27% 3.34% 4.92% 0.00% Financial Institution 0.00% 0.00% 0.00% 3.35% 5.79% Financial Services 8.05% 21.90% 22.49% 28.47% 47.14% Government 0.00% 0.00% 0.00% 2.23% 0.00% Highway 5.73% 16.30% 10.20% 4.88% 3.64% Investment Holding 0.00% 0.00% 0.00% 2.45% 3.06% Plantation 0.00% 0.00% 0.00% 2.24% 0.68% Power 6.44% 6.46% 12.17% 9.64% 9.36% Properties 18.70% 14.46% 5.27% 5.70% 1.85% Transport 0.00% 0.00% 0.00% 3.61% 0.00% Infrastructure-QGov 0.00% 0.00% 0.00% 0.00% 2.85% Utilities / Infrastructure 0.52% 0.37% 0.27% 0.00% 0.94% Water 11.27% 6.16% 3.62% 0.00% 0.59% Leisure 0.00% 0.00% 3.04% 6.94% 0.00% Others 10.71% 4.06% 2.85% 4.54% 1.91%
61.42% 78.98% 64.70% 80.10% 84.00%
Deposits With a Financial Institution 11.03% 6.17% 20.77% 8.63% 8.19%
Bank Balances 0.04% 0.02% 0.02% 0.01% 0.01%
Other Assets / (Liabilities) 0.31% -0.01% -0.36% 0.15% -0.36% Total 100.00% 100.00% 100.00% 100.00% 100.00%
COMPARATIVEPERFORMANCE TABLE (CONT’D)172

COMPARATIVEPERFORMANCE TABLE (CONT’D)
Lion Fixed Income Fund (Cont’d)Comparative Performance Table (Cont’d)
2009 2010 2011 2012 2013
II) Total Unitholders' Capital 188,897,293 258,455,284 352,900,510 447,464,754 516,705,090
III) Number of Units 99,576,854 127,067,494 162,477,214 195,484,821 218,664,871
IV) Unitholders' Capital Per Unit 1.897 2.034 2.172 2.289 2.363
V) Highest Unitholders' Capital Per Unit during the financial year 1.897 2.034 2.172 2.289 2.363
VI) Lowest Unitholders' Capital Per Unit during the financial year 1.819 1.897 2.034 2.173 2.289
VII) Total annual return of the fund (%) 4.2% 7.2% 6.8% 5.4% 3.2% Capital growth 4.2% 7.2% 6.8% 5.4% 3.2% Income distribution - - - - -
VIII) Total return One-year 4.2% 7.2% 6.8% 5.4% 3.2% Three-years 17.5% 17.6% 19.3% 20.7% 16.2% Five-years 40.5% 39.1% 34.6% 32.4% 29.8%
IX) Performance of relevant benchmark indices - 12 Months FD One-year 2.7% 2.8% 3.1% 3.2% 3.2% Three-years 10.5% 9.5% 8.7% 9.3% 9.8% Five-years 19.1% 18.0% 17.1% 16.5% 15.8%
173GREAT EASTERN LIFE ASSURANCE (MALAYSIA) BERHAD
UNIT FUNDS ANNUAL REPORT 2013

Lion Growth FundComparative Performance Table
2009 2010 2011 2012 2013
I) Composition of fund according to industry sectors and category of investments
Equity Securities
Building Materials / Construction 7.67% 5.19% 4.45% 5.42% 8.44%
Conglomerates 3.40% 3.28% 3.97% 5.17% 3.12%
Financial Services 14.41% 14.90% 12.41% 9.60% 8.76%
Gaming / Leisure 13.71% 9.25% 8.38% 4.13% 4.39%
Media 3.76% 5.37% 4.75% 5.43% 4.45%
Petroleum, Chemical & Gas 11.32% 15.89% 10.35% 9.74% 28.56%
Properties 1.53% 0.99% 0.80% 0.00% 1.87%
Resource Based 6.17% 9.26% 9.22% 12.03% 12.56%
Technology 2.53% 0.00% 0.00% 0.00% 0.72%
Telecommunication & cables 8.83% 10.97% 8.52% 7.02% 3.39%
Utilities / Infrastructure 5.61% 5.15% 0.00% 4.95% 15.13%
Others 2.57% 6.73% 5.94% 7.43% 5.16%
81.51% 86.98% 68.79% 70.92% 96.55%
Financial Instruments with Embedded Derivatives
Building Materials / Construction 0.03% 0.49% 0.21% 0.09% 0.12%
Gaming / Leisure 0.00% 0.00% 0.00% 0.00% 0.03%
Media 0.00% 0.02% 0.00% 0.00% 0.00%
Petroleum, Chemical and Gas 0.00% 0.00% 0.00% 0.01% 0.03%
Resource Based 0.01% 0.01% 0.01% 0.01% 0.22%
Others** 0.00% 0.19% 0.16% 0.16% 0.16%
0.04% 0.71% 0.38% 0.27% 0.56%
Unit and Property Trust Funds
Properties 1.83% 6.44% 9.37% 9.59% 0.91%
Plantation 1.81% 0.00% 0.00% 0.00% 0.00%
3.64% 6.44% 9.37% 9.59% 0.91%
Deposits With a Financial Institution 15.35% 7.16% 22.77% 20.69% 4.19%
Bank Balances 0.03% 0.04% 0.01% 0.02% 0.01%
Other Assets / (Liabilities) -0.57% -1.33% -1.32% -1.49% -2.22%
Total 100.00% 100.00% 100.00% 100.00% 100.00%
COMPARATIVEPERFORMANCE TABLE (CONT’D)174

Lion Growth Fund (Cont’d)Comparative Performance Table (Cont’d)
2009 2010 2011 2012 2013
II) Total Unitholders' Capital 372,148,520 489,740,915 561,656,719 643,110,364 746,215,265
III) Number of Units 304,291,513 331,129,760 351,694,877 364,575,036 368,683,432
IV) Unitholders' Capital Per Unit 1.223 1.479 1.597 1.764 2.024
V) Highest Unitholders' Capital Per Unit during the financial year 1.223 1.481 1.639 1.764 2.026
VI) Lowest Unitholders' Capital Per Unit during the financial year 0.863 1.217 1.419 1.591 1.728
Income distribution - - - - -
VII) Total annual return of the fund (%) 37.3% 20.9% 8.0% 10.5% 14.7% Capital growth 37.3% 20.9% 8.0% 10.5% 14.7% Income distribution - - - - -
VIII) Total return One-year 37.3% 20.9% 8.0% 10.5% 14.7% Three-years 23.5% 12.4% 79.2% 44.2% 36.8% Five-years 42.4% 82.8% 61.3% 34.0% 127.2%
IX) Performance of relevant benchmark indices - FBMKLCI & FBM100 * One-year 45.6% 21.8% 1.9% 9.6% 11.4% Three-years 16.5% 7.6% 80.8% 36.0% 24.4% Five-years 40.7% 72.8% 44.6% 20.2% 120.7%
Note :* 2005 - Jun 2009 : KLCI* Jul 2009 - Dec 2010 : Time weighted of FBMKLCI & FBM100** Pantech ICULS which is reclassified as equity hybrid from 2011 onwards
COMPARATIVEPERFORMANCE TABLE (CONT’D)
175GREAT EASTERN LIFE ASSURANCE (MALAYSIA) BERHAD
UNIT FUNDS ANNUAL REPORT 2013

Lion Progressive FundComparative Performance Table
2009 2010 2011 2012 2013
I) Composition of fund according to industry sectors and category of investments
Malaysian Government Securities 0.00% 0.00% 0.00% 1.65% 0.00%
Debt Securities Construction 0.00% 0.00% 0.00% 0.74% 0.60% Commercial - Prop 0.00% 0.00% 0.00% 0.00% 1.19% Financial Services 0.00% 0.00% 0.00% 3.26% 3.60% Government 0.00% 0.00% 0.00% 1.48% 0.00% Highway 6.68% 5.45% 0.00% 9.22% 0.00% Leisure 0.00% 0.00% 0.00% 0.60% 0.00% Properties 3.71% 4.71% 0.00% 0.75% 0.00% Power 0.00% 0.00% 0.00% 1.60% 0.00% Water 7.68% 4.19% 0.00% 0.00% 0.00% Others 0.00% 0.00% 0.00% 0.00% 0.00%
18.07% 14.35% 0.00% 17.65% 5.39% Equity Securities Building Materials / Construction 5.88% 4.63% 4.47% 2.51% 3.81% Conglomerates 0.85% 1.69% 2.60% 4.95% 1.04% Financial Services 13.47% 16.78% 11.92% 6.55% 15.39% Gaming / Leisure 10.98% 7.39% 6.24% 3.40% 5.37% Media 4.73% 6.24% 5.41% 7.44% 2.19% Petroleum, Chemical & Gas 8.73% 13.62% 8.77% 8.66% 25.83% Properties 0.00% 0.00% 0.54% 0.01% 5.17% Resource Based 1.58% 3.97% 5.24% 8.50% 6.49% Technology 1.41% 0.00% 0.00% 0.16% 0.57% Telecommunication & cables 9.22% 10.53% 7.11% 7.43% 2.33% Transport Services 0.88% 0.60% 0.55% 0.30% 0.88% Utilities / Infrastructure 4.01% 5.31% 0.65% 5.11% 8.71% Others 9.16% 8.72% 7.39% 8.31% 10.04%
70.90% 79.48% 60.89% 63.33% 87.82% Financial Instruments with Embedded Derivatives Building Materials / Construction 0.03% 0.04% 0.03% 0.00% 0.00% Gaming / Leisure 0.00% 0.00% 0.00% 0.00% 0.13% Resource Based 0.00% 0.00% 0.00% 0.00% 0.09% Technology 0.00% 0.00% 0.00% 0.00% 0.42% Transport Services 0.00% 0.00% 0.00% 0.01% 0.00% Others ** 0.00% 0.16% 0.12% 0.11% 0.13%
0.03% 0.20% 0.15% 0.12% 0.77% Unit and Property Trust Funds Properties 1.32% 4.50% 7.00% 8.85% 0.39% Plantation 0.25% 0.00% 0.00% 0.00% 0.00%
1.57% 4.50% 7.00% 8.85% 0.39%
COMPARATIVEPERFORMANCE TABLE (CONT’D)176

Lion Progressive Fund (Cont’d)Comparative Performance Table (Cont’d)
2009 2010 2011 2012 2013
Deposits With a Financial Institution 11.22% 2.22% 32.95% 9.39% 7.09%
Bank Balances 0.04% 0.01% 0.01% 0.02% 0.01%
Other Assets / (Liabilities) -1.83% -0.76% -1.00% -1.01% -1.47% Total 100.00% 100.00% 100.00% 100.00% 100.00%
II) Total Unitholders' Capital 315,415,035 443,856,869 551,951,560 676,966,614 836,078,943
III) Number of Units 133,707,094 159,202,608 182,947,153 202,806,056 218,069,625
IV) Unitholders' Capital Per Unit 2.359 2.788 3.017 3.338 3.834
V) Highest Unitholders' Capital Per Unit during the financial year 2.359 2.788 3.091 3.339 3.840
VI) Lowest Unitholders' Capital Per Unit during the financial year 1.725 2.357 2.725 3.004 3.280
VII) Total annual return of the fund (%) 33.2% 18.2% 8.2% 10.6% 14.9% Capital growth 33.2% 18.2% 8.2% 10.6% 14.9% Income distribution - - - - -
VIII) Total return One-year 33.2% 18.2% 8.2% 10.6% 14.9% Three-years 28.1% 13.4% 70.4% 41.5% 37.5% Five-years 57.9% 88.8% 63.9% 35.8% 116.5%
IX) Performance of relevant benchmark indices - FBMKLCI & FBM100 * One-year 45.6% 21.8% 1.9% 9.6% 11.4% Three-years 16.5% 7.6% 80.8% 36.0% 24.4% Five-years 40.7% 72.8% 44.6% 20.2% 120.7%
Note :* 2005 - Jun 2009 : KLCI* Jul 2009 - Dec 2010 : Time weighted of FBMKLCI & FBM100** Reclassified ICULS as equity hybrid from 2011 onwards
COMPARATIVEPERFORMANCE TABLE (CONT’D)
177GREAT EASTERN LIFE ASSURANCE (MALAYSIA) BERHAD
UNIT FUNDS ANNUAL REPORT 2013

Lion Strategic FundComparative Performance Table
2009 2010 2011 2012 2013
I) Composition of fund according to industry sectors and category of investments
Malaysian Government Securities 0.00% 0.00% 0.00% 1.75% 0.00%
Debt Securities Financial Services 0.00% 0.00% 0.00% 8.69% 4.34% Financial Institutions 0.00% 0.00% 0.00% 1.74% 2.47% Commercial - Prop 0.00% 0.00% 0.00% 0.00% 1.23% Investment Holding 0.00% 0.00% 0.00% 0.00% 1.38% Government 0.00% 0.00% 0.00% 1.73% 0.00% Highway 6.52% 1.48% 0.00% 3.59% 0.00% Leisure 0.00% 0.00% 0.00% 2.69% 0.00% Power 0.00% 0.00% 0.00% 1.87% 0.00% Properties 0.00% 0.36% 0.00% 4.39% 0.00% Transport - Quoted Government 0.00% 0.00% 0.00% 1.72% 0.00% Water 4.12% 2.48% 0.00% 0.00% 0.00%
10.64% 4.32% 0.00% 26.43% 9.42%
Equity Securities Building Materials / Construction 4.04% 5.94% 5.94% 3.60% 4.29% Conglomerates 0.78% 1.48% 1.94% 3.11% 3.07% Financial Services 15.35% 16.62% 7.41% 4.85% 16.20% Gaming / Leisure 7.40% 2.07% 0.00% 0.37% 3.36% Media 1.50% 3.53% 2.71% 1.73% 1.19% Petroleum, Chemical & Gas 4.20% 12.88% 3.48% 5.80% 17.12% Properties 4.55% 4.23% 2.74% 1.16% 4.58% Resource Based 14.84% 17.71% 10.94% 10.16% 6.94% Technology 3.13% 0.00% 0.33% 0.00% 0.86% Telecommunication & cables 9.93% 7.05% 4.19% 5.35% 4.23% Transport Services 0.00% 0.00% 0.00% 0.00% 0.77% Utilities / Infrastructure 4.41% 0.00% 0.00% 5.53% 8.43% Others 4.76% 5.52% 7.71% 7.53% 4.43%
74.89% 77.03% 47.39% 49.19% 75.47%
Financial Instruments with Embedded Derivatives Building Materials / Construction 0.03% 0.13% 0.19% 0.10% 0.00% Gaming / Leisure 0.00% 0.00% 0.00% 0.00% 0.16% Resource Based 0.00% 0.00% 0.00% 0.00% 0.10% Others 0.00% 0.00% 0.27% 0.21% 0.00%
0.03% 0.13% 0.46% 0.31% 0.26%
Unit And Property Trust Funds Properties 0.00% 1.01% 3.84% 6.49% 5.74%
0.00% 1.01% 3.84% 6.49% 5.74%
COMPARATIVEPERFORMANCE TABLE (CONT’D)178

Lion Strategic Fund (Cont’d)Comparative Performance Table (Cont’d)
2009 2010 2011 2012 2013
Deposits With a Financial Institution 13.31% 16.46% 47.94% 15.80% 13.47%
Bank Balances 0.05% 0.01% 0.02% 0.01% 0.01%
Other Assets / (Liabilities) 1.08% 1.04% 0.35% 0.02% -4.37% Total 100.00% 100.00% 100.00% 100.00% 100.00%
II) Total Unitholders' Capital 198,973,066 314,508,643 427,557,068 576,717,952 807,034,020
III) Number of Units 136,939,481 180,752,094 230,737,759 284,798,988 347,260,766
IV) Unitholders' Capital Per Unit 1.453 1.740 1.853 2.025 2.324
V) Highest Unitholders' Capital Per Unit during the financial year 1.453 1.75 1.915 2.025 2.324
VI) Lowest Unitholders' Capital Per Unit during the financial year 1.113 1.431 1.698 1.850 2.001
VII) Total annual return of the fund (%) 27.6% 19.8% 6.5% 9.3% 14.8% Capital growth 27.6% 19.8% 6.5% 9.3% 14.8% Income distribution - - - - -
VIII) Total return One-year 27.6% 19.8% 6.5% 9.3% 14.8% Three-years 28.9% 18.3% 62.7% 39.4% 33.6% Five-years - - 64.4% 37.7% 104.0%
IX) Performance of relevant benchmark indices - FBMKLCI & FBM100 * One-year 45.6% 21.8% 1.9% 9.6% 11.4% Three-years 16.5% 7.6% 80.8% 36.0% 24.4% Five-years - - 44.6% 20.2% 120.7%
X) Performance of Weighted Benchmark One-year 22.5% 7.8% 2.7% 6.4% 7.3% Three-years 14.8% 8.8% 40.9% 22.4% 17.3% Five-years - - 32.0% 19.7% 60.9%
Note :* 2006 - Jun 2009 : KLCI* Jul 2009 - Dec 2010 : Time weighted of FBMKLCI & FBM100
COMPARATIVEPERFORMANCE TABLE (CONT’D)
179GREAT EASTERN LIFE ASSURANCE (MALAYSIA) BERHAD
UNIT FUNDS ANNUAL REPORT 2013
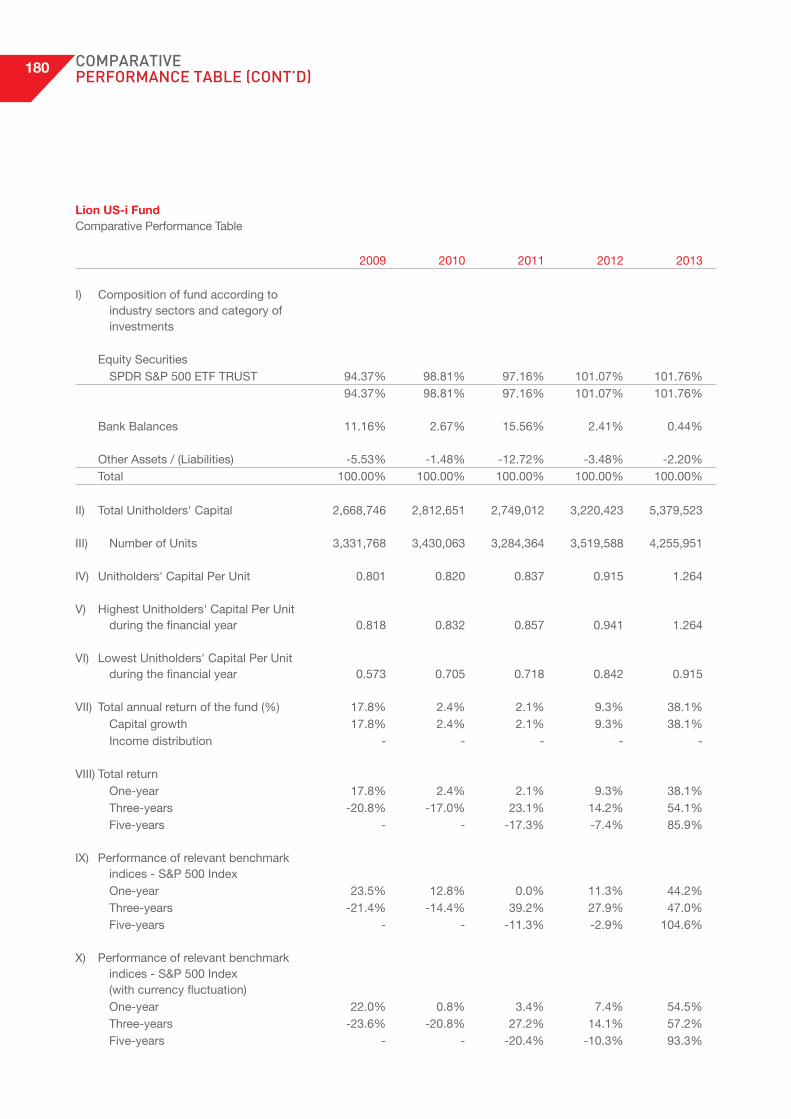
Lion US-i FundComparative Performance Table
2009 2010 2011 2012 2013
I) Composition of fund according to industry sectors and category of investments
Equity Securities SPDR S&P 500 ETF TRUST 94.37% 98.81% 97.16% 101.07% 101.76%
94.37% 98.81% 97.16% 101.07% 101.76%
Bank Balances 11.16% 2.67% 15.56% 2.41% 0.44%
Other Assets / (Liabilities) -5.53% -1.48% -12.72% -3.48% -2.20% Total 100.00% 100.00% 100.00% 100.00% 100.00%
II) Total Unitholders' Capital 2,668,746 2,812,651 2,749,012 3,220,423 5,379,523
III) Number of Units 3,331,768 3,430,063 3,284,364 3,519,588 4,255,951
IV) Unitholders' Capital Per Unit 0.801 0.820 0.837 0.915 1.264
V) Highest Unitholders' Capital Per Unit during the financial year 0.818 0.832 0.857 0.941 1.264
VI) Lowest Unitholders' Capital Per Unit during the financial year 0.573 0.705 0.718 0.842 0.915
VII) Total annual return of the fund (%) 17.8% 2.4% 2.1% 9.3% 38.1% Capital growth 17.8% 2.4% 2.1% 9.3% 38.1% Income distribution - - - - -
VIII) Total return One-year 17.8% 2.4% 2.1% 9.3% 38.1% Three-years -20.8% -17.0% 23.1% 14.2% 54.1% Five-years - - -17.3% -7.4% 85.9%
IX) Performance of relevant benchmark indices - S&P 500 Index One-year 23.5% 12.8% 0.0% 11.3% 44.2% Three-years -21.4% -14.4% 39.2% 27.9% 47.0% Five-years - - -11.3% -2.9% 104.6%
X) Performance of relevant benchmark indices - S&P 500 Index (with currency fluctuation) One-year 22.0% 0.8% 3.4% 7.4% 54.5% Three-years -23.6% -20.8% 27.2% 14.1% 57.2% Five-years - - -20.4% -10.3% 93.3%
COMPARATIVEPERFORMANCE TABLE (CONT’D)180

Lion UK-i FundComparative Performance Table
2009 2010 2011 2012 2013
I) Composition of fund according to industry sectors and category of investments
Equity Securities ISHARES PLC 92.11% 96.48% 94.22% 99.46% 100.74%
92.11% 96.48% 94.22% 99.46% 100.74%
Bank Balances 10.87% 1.24% 18.39% 0.63% 1.10%
Other Assets / (Liabilities) -2.98% 2.28% -12.61% -0.09% -1.84% Total 100.00% 100.00% 100.00% 100.00% 100.00%
II) Total Unitholders' Capital 1,492,257 1,922,549 2,337,049 2,685,019 3,548,335
III) Number of Units 1,804,421 2,455,363 3,091,334 3,181,302 3,353,815
IV) Unitholders' Capital Per Unit 0.827 0.783 0.756 0.844 1.058
V) Highest Unitholders' Capital Per Unit during the financial year 0.848 0.841 0.832 0.854 1.064
VI) Lowest Unitholders' Capital Per Unit during the financial year 0.545 0.668 0.699 0.748 0.837
VII) Total annual return of the fund (%) 35.6% -5.3% -3.4% 11.6% 25.4% Capital growth 35.6% -5.3% -3.4% 11.6% 25.4% Income distribution - - - - -
VIII) Total return One-year 35.6% -5.3% -3.4% 11.6% 25.4% Three-years -16.9% -21.4% 23.9% 2.1% 35.1% Five-years - - -24.0% -15.3% 73.4%
IX) Performance of relevant benchmark indices - FTSE 100 Index One-year 22.1% 9.0% -5.6% 5.8% 14.4% Three-years -13.0% -8.6% 25.7% 9.0% 14.4% Five-years - - -10.4% -8.7% 52.2%
X) Performance of relevant benchmark indices - FTSE 100 Index (with currency fluctuation) One-year 34.1% -5.9% -2.8% 6.3% 25.3% Three-years -30.2% -33.4% 22.7% -2.8% 29.5% Five-years - - -36.2% -31.2% 63.4%
COMPARATIVEPERFORMANCE TABLE (CONT’D)
181GREAT EASTERN LIFE ASSURANCE (MALAYSIA) BERHAD
UNIT FUNDS ANNUAL REPORT 2013

Lion AU-i FundComparative Performance Table
2009 2010 2011 2012 2013
I) Composition of fund according to industry sectors and category of investments
Equity Securities SPDR 94.13% 97.86% 86.49% 110.87% 88.08%
94.13% 97.86% 86.49% 110.87% 88.08%
Deposits With a Financial Institution 0.00% 0.00% 0.00% 7.88% 19.55%
Bank Balances 7.06% 0.22% 11.97% 1.10% 0.54%
Other Assets / (Liabilities) -1.19% 1.92% 1.54% -19.85% -8.17% Total 100.00% 100.00% 100.00% 100.00% 100.00%
II) Total Unitholders' Capital 6,841,286 7,385,640 8,160,096 7,607,697 9,310,051
III) Number of Units 6,503,124 6,720,327 8,250,856 6,891,030 8,440,663
IV) Unitholders' Capital Per Unit 1.052 1.099 0.989 1.104 1.103
V) Highest Unitholders' Capital Per Unit during the financial year 1.075 1.100 1.132 1.111 1.25
VI) Lowest Unitholders' Capital Per Unit during the financial year 0.571 0.826 0.890 0.936 0.989
VII) Total annual return of the fund (%) 58.2% 4.5% -10.0% 11.6% -0.1% Capital growth 58.2% 4.5% -10.0% 11.6% -0.1% Income distribution - - - - -
VIII) Total return One-year 58.2% 4.5% -10.0% 11.6% -0.1% Three-years 2.3% -7.3% 48.7% 4.9% 0.4% Five-years - - -3.8% -6.9% 65.9%
IX) Performance of relevant benchmark indices - S&P / ASX 200 Index One-year 30.8% -2.6% -14.5% 14.6% 15.1% Three-years -14.1% -25.2% 9.0% -4.6% 12.8% Five-years - - -28.5% -26.7% 43.8%
X) Performance of relevant benchmark indices - S&P / ASX 200 Index (with currency fluctuation) One-year 65.9% -0.7% -11.8% 12.5% 5.9% Three-years -5.0% -18.9% 45.2% -1.5% 5.1% Five-years - - -16.9% -19.6% 73.1%
COMPARATIVEPERFORMANCE TABLE (CONT’D)182

Lion Asia Pac FundComparative Performance Table
2010 2011 2012 2013
I) Composition of fund according to industry sectors and category of investments
Unit and Property Trust Funds Lion Global Asia Pacific Fund 92.24% 95.54% 158.83% 98.37%
92.24% 95.54% 158.83% 98.37%
Deposits With a Financial Institution 0.00% 19.50% 0.00% 0.00%
Bank Balances 5.61% 5.80% 2.29% 8.35%
Other Assets / (Liabilities) 2.15% -20.84% -61.12% -6.72% Total 100.00% 100.00% 100.00% 100.00%
II) Total Unitholders' Capital 1,072,599 871,643 997,442 914,264
III) Number of Units 1,019,581 1,146,898 1,280,414 1,344,505
IV) Unitholders' Capital Per Unit 1.052 0.760 0.779 0.680
V) Highest Unitholders' Capital Per Unit during the financial period/year 1.114 1.061 0.812 0.833
VI) Lowest Unitholders' Capital Per Unit during the financial period/year 0.906 0.740 0.713 0.617
VII) Total annual return of the fund (%) * 10.7% -27.8% 2.5% -12.7% Capital growth 10.7% -27.8% 2.5% -12.7% Income distribution - - - -
VIII) Total return One-year * 10.7% -27.8% 2.5% -12.7% Three-years - - - -35.4% Five-years - - - -
IX) Performance of relevant benchmark indices - MSCI AC AP ex Japan (SGD) One-year * 3.7% -14.6% 15.2% 6.9% Three-years - - - 1.7% Five-years - - - 13.9%
X) Performance of relevant benchmark indices - (with currency fluctuation) One-year * 6.3% -13.2% 18.0% 10.8% Three-years - - - 4.3% Five-years - - - 15.6%
Note : * Total return & fund performance are calculated since inception on 15 April 2010.
COMPARATIVEPERFORMANCE TABLE (CONT’D)
183GREAT EASTERN LIFE ASSURANCE (MALAYSIA) BERHAD
UNIT FUNDS ANNUAL REPORT 2013

Lion Enhanced Equity FundComparative Performance Table
2010 2011 2012 2013
I) Composition of fund according to industry sectors and category of investments
Equity Securities Building Materials / Construction 7.67% 7.74% 3.98% 10.95% Conglomerates 1.56% 4.09% 0.71% 0.32% Financial Services 5.39% 12.11% 11.69% 6.02% Gaming / Leisure 0.98% 0.55% 1.74% 1.49% Media 5.51% 3.58% 5.41% 2.79% Petroleum, Chemical & Gas 20.08% 11.39% 13.68% 29.96% Properties 16.46% 2.65% 1.84% 2.29% Resource Based 6.91% 8.11% 10.32% 8.18% Technology 0.00% 0.00% 2.79% 4.72% Telecommunication & cables 1.43% 18.23% 9.15% 3.02% Transport Services 3.50% 1.61% 0.03% 0.10% Utilities / Infrastructure 8.81% 1.04% 6.47% 9.90% Others 0.00% 7.49% 6.02% 7.53%
78.30% 78.59% 73.83% 87.27%
Financial Instruments with Embedded Derivatives Building Materials / Construction 2.73% 0.20% 0.08% 0.06% Petroleum, Chemical & Gas 0.00% 0.00% 0.01% 0.01% Resource Based 0.00% 0.00% 0.00% 0.07% Others 0.09% 1.01% 0.03% 0.02%
2.82% 1.21% 0.12% 0.16%
Unit And Property Trust Funds Properties 5.54% 6.48% 7.63% 0.69%
Deposits With Financial Institutions 24.82% 19.12% 15.03% 9.45%
Bank Balances 0.29% 3.95% 1.46% 0.17%
Other Assets / (Liabilities) -11.77% -9.35% 1.93% 2.26% Total 100.00% 100.00% 100.00% 100.00%
COMPARATIVEPERFORMANCE TABLE (CONT’D)184
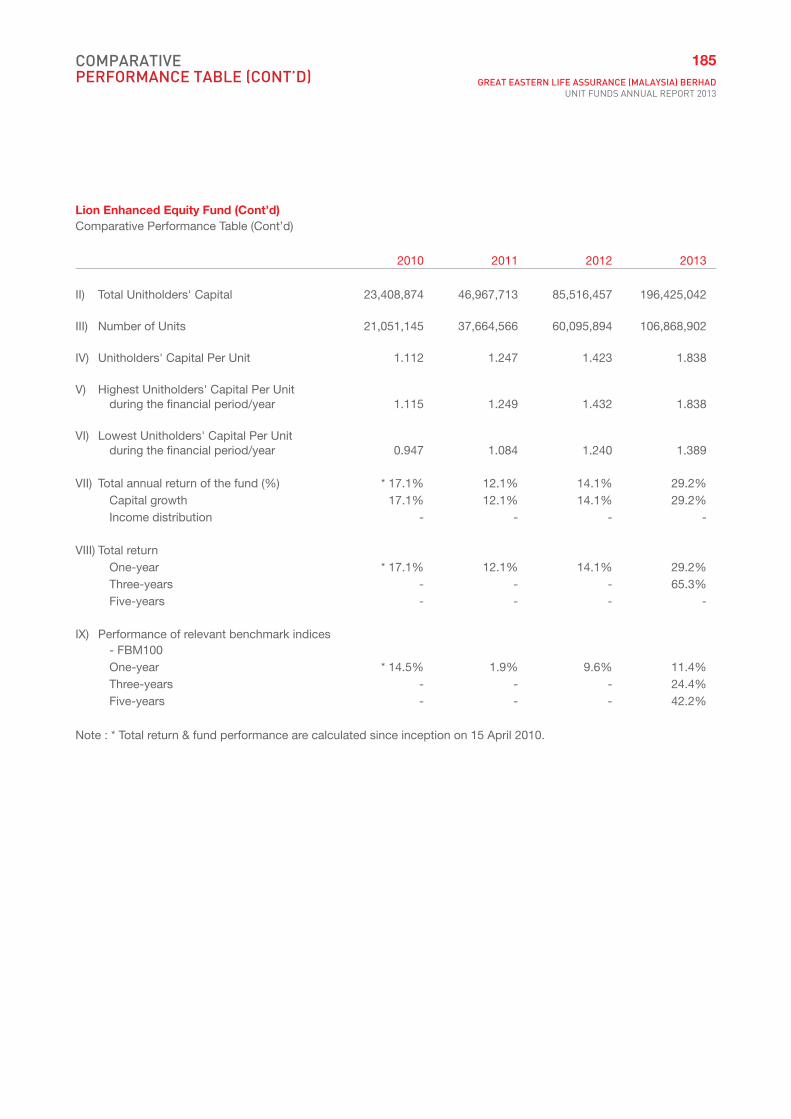
Lion Enhanced Equity Fund (Cont’d)Comparative Performance Table (Cont’d)
2010 2011 2012 2013
II) Total Unitholders' Capital 23,408,874 46,967,713 85,516,457 196,425,042
III) Number of Units 21,051,145 37,664,566 60,095,894 106,868,902
IV) Unitholders' Capital Per Unit 1.112 1.247 1.423 1.838
V) Highest Unitholders' Capital Per Unit during the financial period/year 1.115 1.249 1.432 1.838
VI) Lowest Unitholders' Capital Per Unit during the financial period/year 0.947 1.084 1.240 1.389
VII) Total annual return of the fund (%) * 17.1% 12.1% 14.1% 29.2% Capital growth 17.1% 12.1% 14.1% 29.2% Income distribution - - - -
VIII) Total return One-year * 17.1% 12.1% 14.1% 29.2% Three-years - - - 65.3% Five-years - - - -
IX) Performance of relevant benchmark indices - FBM100 One-year * 14.5% 1.9% 9.6% 11.4% Three-years - - - 24.4% Five-years - - - 42.2%
Note : * Total return & fund performance are calculated since inception on 15 April 2010.
COMPARATIVEPERFORMANCE TABLE (CONT’D)
185GREAT EASTERN LIFE ASSURANCE (MALAYSIA) BERHAD
UNIT FUNDS ANNUAL REPORT 2013

Dana GemilangComparative Performance Table
2010 2011 2012 2013
I) Composition of fund according to industry sectors and category of investments
Equity Securities Building Materials / Construction 7.91% 10.20% 9.23% 11.90% Conglomerates 5.02% 3.51% 4.76% 7.79% Media 18.47% 2.59% 1.40% 0.00% Petroleum, Chemical & Gas 14.04% 14.21% 19.88% 28.50% Resource Based 2.57% 16.39% 9.26% 8.80% Properties 8.05% 4.22% 1.58% 1.94% Technology 3.94% 0.00% 2.30% 6.37% Telecommunication & cables 6.82% 16.85% 15.29% 8.24% Transport Services 7.97% 1.76% 0.00% 0.00% Utilities / Infrastructure 0.00% 0.86% 8.63% 10.32% Others 0.00% 10.67% 8.04% 8.96%
74.79% 81.26% 80.37% 92.82%
Financial Instruments with Embedded Derivatives Building Materials / Construction 0.95% 0.60% 0.19% 0.14% Petroleum, Chemical & Gas 0.00% 0.00% 0.02% 0.02% Others 0.00% 0.00% 0.14% 0.00%
0.95% 0.60% 0.34% 0.16%
Unit And Property Trust Funds Properties 1.68% 2.14% 1.55% 0.73% Deposits With a Financial Institution 15.74% 20.18% 14.37% 12.21% Bank Balances 0.53% 0.55% 1.27% 1.16% Other Assets / (Liabilities) 6.31% -4.73% 2.10% -7.08% Total 100.00% 100.00% 100.00% 100.00%
COMPARATIVEPERFORMANCE TABLE (CONT’D)186

Dana Gemilang (Cont’d)Comparative Performance Table (Cont’d)
2010 2011 2012 2013
II) Total Unitholders' Capital 10,417,488 15,853,895 26,511,801 52,742,760
III) Number of Units 9,574,897 13,797,993 20,393,693 31,753,618
IV) Unitholders' Capital Per Unit 1.088 1.149 1.300 1.661
V) Highest Unitholders' Capital Per Unit during the financial period/year 1.091 1.179 1.300 1.661
VI) Lowest Unitholders' Capital Per Unit during the financial period/year 0.945 0.987 1.146 1.254
VII) Total annual return of the fund (%) * 14.5% 5.6% 13.1% 27.8% Capital growth 14.5% 5.6% 13.1% 27.8% Income distribution - - - -
VIII) Total return One-year * 14.5% 5.6% 13.1% 27.8% Three-years - - - 52.7% Five-years - - - -
IX) Performance of relevant benchmark indices - FBMS One-year * 10.7% 2.4% 11.8% 13.3% Three-years - - - 29.8% Five-years - - - 119.4%
Note : * Total return & fund performance are calculated since inception on 15 April 2010.
COMPARATIVEPERFORMANCE TABLE (CONT’D)
187GREAT EASTERN LIFE ASSURANCE (MALAYSIA) BERHAD
UNIT FUNDS ANNUAL REPORT 2013

Smart Invest Gain FundComparative Performance Table
2013
I) Composition of fund according to industry sectors and category of investments
Financial Instruments with Embedded Derivatives 91.22%91.22%
Deposits With a Financial Institution 8.44%
Bank Balances 0.05%
Other Assets / (Liabilities) 0.29% Total 100.00%
II) Total Unitholders' Capital 28,440,000
III) Number of Units 30,000,000
IV) Unitholders' Capital Per Unit 0.948
V) Highest Unitholders' Capital Per Unit during the financial year 0.970
VI) Lowest Unitholders' Capital Per Unit during the financial year 0.941
VII) Total annual return of the fund (%) -2.3% Capital growth -2.3% Income distribution -
VIII) Total return One-year -2.3% Three-years - Five-years -
IX) Performance of relevant benchmark indices One-year * 1.0% Three-years - Five-years -
COMPARATIVEPERFORMANCE TABLE (CONT’D)188

HEAD OFFICE AND BRANCH NETWORK
Head OfficeMenara Great Eastern 303 Jalan Ampang 50450 Kuala LumpurTel: +603 4259 8888Fax: +603 4259 8000Email: [email protected]: greateasternlife.com
Alor Setar66 & 68 Jalan Teluk Wanjah05200 Alor Setar, KedahTel: +604 731 9877Fax: +604 731 9878Branch Administration Manager: Yap Sun LinBusiness Development Manager: Brandon Lee Chi Ping
Batu Pahat109, Jalan Rahmat83000 Batu Pahat, JohorTel: +607 432 5562Fax: +607 432 5560 Branch Administration Manager: Yap Ley TinBusiness Development Manager: Irene Koh Ai Lian
Bintulu No 313, Lot 3956, Phase 4Bintulu Parkcity Commerce SquareJalan Tun Ahmad Zaidi / Jalan Tanjung Batu97000 Bintulu, SarawakTel: +6086 336 676Fax: +6086 332 601 Branch Administration Manager: Ting Siew Hoon
IpohWisma Great EasternNo 16, Persiaran TuguGreentown Avenue30450 Ipoh, PerakTel: +605 254 2027Fax: +605 255 5578Regional Manager (Branch Operations):Siah Koh LeongRegional Manager (Business Development):Chew Ing Tiong
Johor Bahru10th Floor, Menara PelangiJalan Kuning, Taman Pelangi80400 Johor Bahru, JohorTel: +607 334 1022Fax: +607 334 9122 Regional Manager (Branch Operations): Teo Hui LingRegional Manager (Business Development): James Pang
KlangNo.8 & 10 Jalan Tiara 2ABandar Baru Klang41150 Klang, SelangorTel: +603 3343 6688Fax: +603 3341 3398 Branch Administration Manager: Matthew Nah Yu JenBusiness Development Manager: Tan Pang Siang
KluangNo 22 & 24Jalan Md Lazim Saim86000 Kluang, JohorTel: +607 772 3529Fax: +607 772 3449 Branch Administration Manager: Lim Kee Chii
Kota BharuNo.S25/5252-T & UJalan Sultan Yahya Petra15200 Kota Bharu, KelantanTel: +609 748 2332Fax: +609 744 9701 Branch Administration Manager: Yeap Siew GiokSenior Business Development Manager:Radzuan Abu Bakar
Kota KinabaluWisma Great Eastern Level 4 & 5No. 65 Jalan Gaya88000 Kota Kinabalu, SabahTel: +6088 252 033Fax: +6088 210 437 Deputy Regional Manager (Branch Operations): Chong Kee JyhSenior Business Development Manager: Scott Wong Charng Yeon
189GREAT EASTERN LIFE ASSURANCE (MALAYSIA) BERHAD
UNIT FUNDS ANNUAL REPORT 2013

Kuala Terengganu 2nd Floor, 6FBangunan Persatuan Hin AnnJalan Air Jernih20300 Kuala Terengganu, TerengganuTel: +609 622 4959Fax: +609 626 5195 Branch Administration Head: Yeo Ai May
KuantanA25 Jalan Dato Lim Hoe Lek25200 Kuantan, PahangTel: +609 515 7666Fax: +609 515 8477Branch Administration Manager: Hong Shee YiBusiness Development Manager: See Han Chung
KuchingHouse No 51, Lot 435, Section 54, KTLDTravilion Commercial CentreJalan Padungan93100 Kuching, SarawakTel: +082 412 736Fax: +082 426 684Regional Manager (Branch Operations): Ting LeeRegional Manager (Business Development): Ricky Voon Woo Kian
Lahad Datu Ground & 1st FloorMDLD 3804, Lot 66Fajar Centre, Jalan Segama91100 Lahad Datu, SabahTel: +6089 884 136Fax: +6089 884 226 Branch Administration Manager: Charlene Ng Oi Len
MelakaNo.23 Jalan PM 15Plaza Mahkota75000 MelakaTel: +606 282 4577Fax: +606 283 4579Business Development Manager: Tan Chu Boon
Miri Lots 1260 & 1261, Block 10M.C.L.D, Jalan Melayu98000 Miri, SarawakTel: +6085 413 299Fax: +6085 417 518 Branch Administration Manager: Tiong Hie Hung
Penang25, Light Street10200 PenangTel: +604 262 2141Fax: +604 262 2140 Branch Administration Manager: Betty Lim Sut LangRegional Manager (Business Development): Ken Ong Kean TeikSenior Business Development Manager: Alex Ch’ng Seet Loke
Sandakan Lot 5 & 6, Block 40Lorong Indah 15Bandar Indah, Phase 7Mile 4, North Road90000 Sandakan, SabahTel: +6089 213 484Fax: +6089 271 343Branch Administration Manager: Joan Lai Kar Kee
HEAD OFFICEAND BRANCH NETWORK190

Seremban101 & 103Jalan Yam Tuan70000 Seremban, Negeri SembilanTel: +606 763 6120Fax: +606 763 1480Regional Manager (Branch Operations): Mohd Azidi KamaruddinSenior Business Development Manager: Yap Hock Ban
SibuNo. 10A-F, Wisma Great EasternPersiaran Brooke96000 Sibu, SarawakTel: +6084 312 829Fax: +6084 333 925 Branch Administration Manager: Peter Wong Yuk Ung
HEAD OFFICEAND BRANCH NETWORK
Taiping60 Jalan Barrack34000 Taiping, PerakTel: +605 805 1021Fax: +605 805 1023Branch Administration Manager: Tan Hoe Soon
TawauGround Floor, Wisma Great EasternJalan Billian91000 Tawau, SabahTel: +6089 771 322Fax: +6089 762 341Branch Administration Manager: Crystal Ng Fong Kim
191GREAT EASTERN LIFE ASSURANCE (MALAYSIA) BERHAD
UNIT FUNDS ANNUAL REPORT 2013

GREAT EASTERN LIFE ASSURANCE (MALAYSIA) BERHAD (93745-A)(A member of the OCBC Group)
Menara Great Eastern 303 Jalan Ampang
50450 Kuala Lumpur
Tel: +603 4259 8888 Fax: +603 4259 8000
Customer Service Careline: 1300 1300 88 Agents’ Service Careline: +603 4259 8111
Website: greateasternlife.comE-mail: [email protected]