Embed Size (px)
Citation preview

June 2017
Unit 9, Professional Engineers
2017 Salary Survey
California Department of Human Resources Office of Financial Management and Economic Research
1515 S Street, North Building, Suite 400 Sacramento, California 95811
Attachment 2
Unit 9, Professional Engineers 2017 Salary Survey Page 1
Table of Contents
Overview .......................................................................................................................................................... 2
Table 1: Survey Results ................................................................................................................................. 2
Methodology ................................................................................................................................................... 3
Memorandum of Understanding Survey Requirement ................................................................................ 3
State of California’s Benchmark Job Classifications...................................................................................... 3
Survey Lag Calculation ................................................................................................................................. 4
Table 2: Simplified Illustration of Salary Lag Calculation .............................................................................. 4
Lag Calculation Anomalies ............................................................................................................................ 5
Survey Results ............................................................................................................................................... 6
Salary Lag for Entry, Journey, and First Level Supervisors ............................................................................ 6
Table 3: Display of Survey’s Lags* ................................................................................................................ 6
Attachment 1 ................................................................................................................................................... 7
Attachment 2 ................................................................................................................................................... 8
Attachment 3 ................................................................................................................................................. 11
Attachment 2
Unit 9, Professional Engineers 2017 Salary Survey Page 2
Overview
This salary survey report is prepared by the Department of Human Resources as required by the
Memorandum of Understanding (MOU) between the state and the Professional Engineers in
California Government (PECG).
The Department and PECG jointly completed the 2017 Unit 9 salary survey. Although the
current MOU requires this survey to be completed, it also states that salary increases for Unit
9 employees as a result of a lag in the survey, “shall not be provided during the term of this
MOU.”
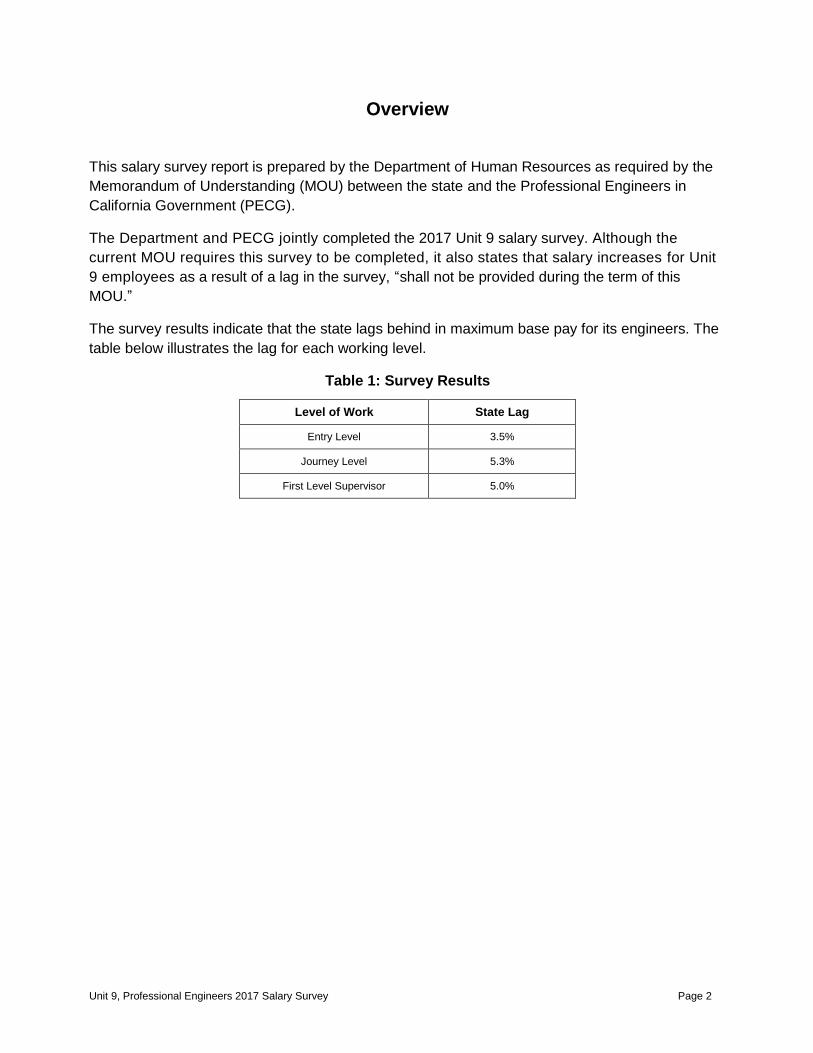
The survey results indicate that the state lags behind in maximum base pay for its engineers. The
table below illustrates the lag for each working level.
Table 1: Survey Results
Level of Work State Lag
Entry Level 3.5%
Journey Level 5.3%
First Level Supervisor 5.0%
Attachment 2
Unit 9, Professional Engineers 2017 Salary Survey Page 3
Methodology
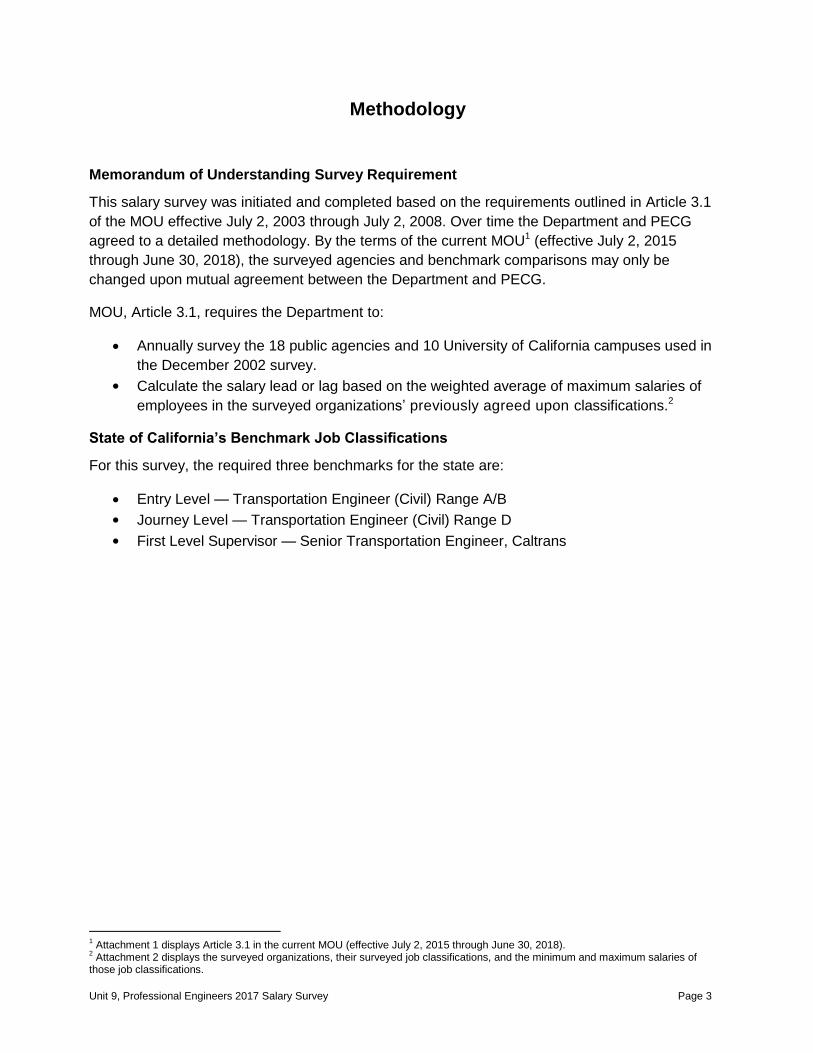
Memorandum of Understanding Survey Requirement
This salary survey was initiated and completed based on the requirements outlined in Article 3.1
of the MOU effective July 2, 2003 through July 2, 2008. Over time the Department and PECG
agreed to a detailed methodology. By the terms of the current MOU1 (effective July 2, 2015
through June 30, 2018), the surveyed agencies and benchmark comparisons may only be
changed upon mutual agreement between the Department and PECG.
MOU, Article 3.1, requires the Department to:
Annually survey the 18 public agencies and 10 University of California campuses used in
the December 2002 survey.
Calculate the salary lead or lag based on the weighted average of maximum salaries of
employees in the surveyed organizations’ previously agreed upon classifications.2
State of California’s Benchmark Job Classifications
For this survey, the required three benchmarks for the state are:
Entry Level — Transportation Engineer (Civil) Range A/B
Journey Level — Transportation Engineer (Civil) Range D
First Level Supervisor — Senior Transportation Engineer, Caltrans
1 Attachment 1 displays Article 3.1 in the current MOU (effective July 2, 2015 through June 30, 2018).
2 Attachment 2 displays the surveyed organizations, their surveyed job classifications, and the minimum and maximum salaries of
those job classifications.
Attachment 2
Unit 9, Professional Engineers 2017 Salary Survey Page 4
Survey Lag Calculation
The agreed upon methodology requires a comparison to be made between the State of
California’s maximum salary to the weighted average maximum salary for the surveyed
organizations.
There are two parts to the survey lag calculation. The first part weights the maximum salary of
each surveyed organization (excluding state employee counts) by the total number of engineers in
the comparable classification(s) in each organization. This is done separately for the entry level,
journey level, and first level supervisor categories, resulting in a separate weighted average salary
for each level.
The second part of the lag computation compares the weighted average salary for the surveyed
organizations with the maximum salary of the state benchmark engineer classification. The
percentage difference is the survey lag. A separate lag is computed for entry, journey, and first
level supervisors.
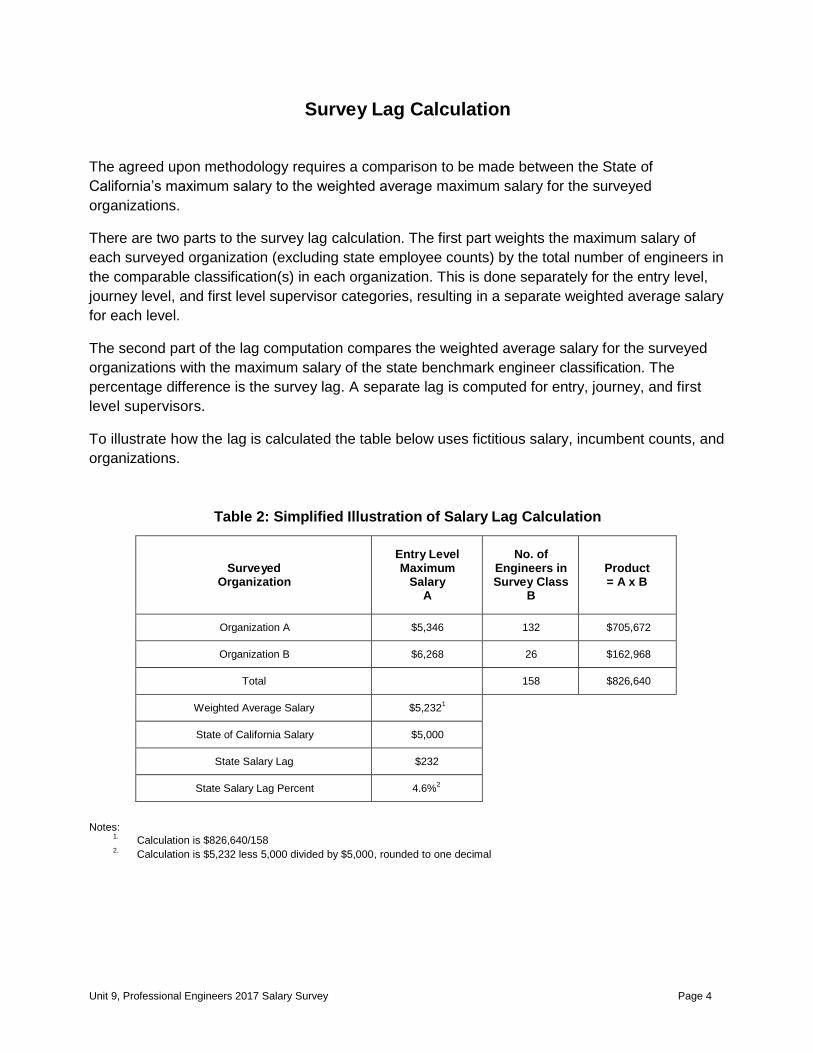
To illustrate how the lag is calculated the table below uses fictitious salary, incumbent counts, and
organizations.
Table 2: Simplified Illustration of Salary Lag Calculation
Notes:
1. Calculation is $826,640/158
2. Calculation is $5,232 less 5,000 divided by $5,000, rounded to one decimal
Surveyed Organization
Entry Level Maximum
Salary A
No. of Engineers in Survey Class
B
Product = A x B
Organization A $5,346 132 $705,672
Organization B $6,268 26 $162,968
Total 158 $826,640
Weighted Average Salary $5,2321
State of California Salary $5,000
State Salary Lag $232
State Salary Lag Percent 4.6%2
Attachment 2
Unit 9, Professional Engineers 2017 Salary Survey Page 5
Lag Calculation Anomalies
There are two unique anomalies affecting the lag calculation.
The first is a few of the surveyed organizations use two classifications for either entry or journey
level. Five surveyed organizations used two classifications for the entry level, and one surveyed
organization used two classifications for the journey level.
For those organizations using two classifications for a single level, the Department combined the
incumbent counts for the two classifications, and then weighted the survey using the higher-
salaried classification by the combined incumbent count.
The second anomaly affecting the lag calculation is the additional pay that the City of San Diego
provides their engineers for possessing a state certification as a Registered Engineer.
The City of San Diego pays an additional 15 percent of salary to its employees in the journey and
first level supervisor classifications for possessing state certification as a Registered Civil
Engineer. To compute the survey’s salary lag, 15 percent of pay was added to the maximum
salary, and then was weighted by an incumbent count.
PECG and the Department agreed on the application of the two anomalies for the survey
methodology.
Attachment 2
Unit 9, Professional Engineers 2017 Salary Survey Page 6
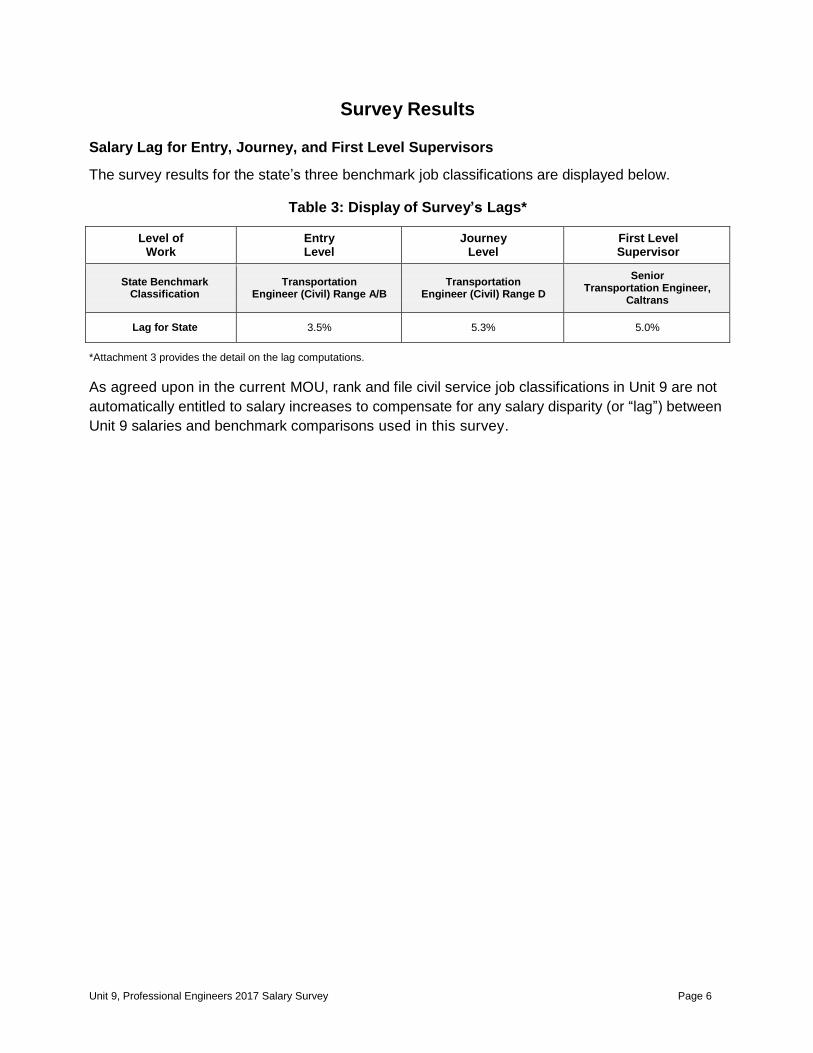
Survey Results
Salary Lag for Entry, Journey, and First Level Supervisors
The survey results for the state’s three benchmark job classifications are displayed below.
Table 3: Display of Survey’s Lags*
Level of Work
Entry Level
Journey Level
First Level Supervisor
State Benchmark Classification
Transportation Engineer (Civil) Range A/B
Transportation Engineer (Civil) Range D
Senior Transportation Engineer,
Caltrans
Lag for State 3.5% 5.3% 5.0%
*Attachment 3 provides the detail on the lag computations.
As agreed upon in the current MOU, rank and file civil service job classifications in Unit 9 are not
automatically entitled to salary increases to compensate for any salary disparity (or “lag”) between
Unit 9 salaries and benchmark comparisons used in this survey.
Attachment 2
Unit 9, Professional Engineers 2017 Salary Survey Page 7
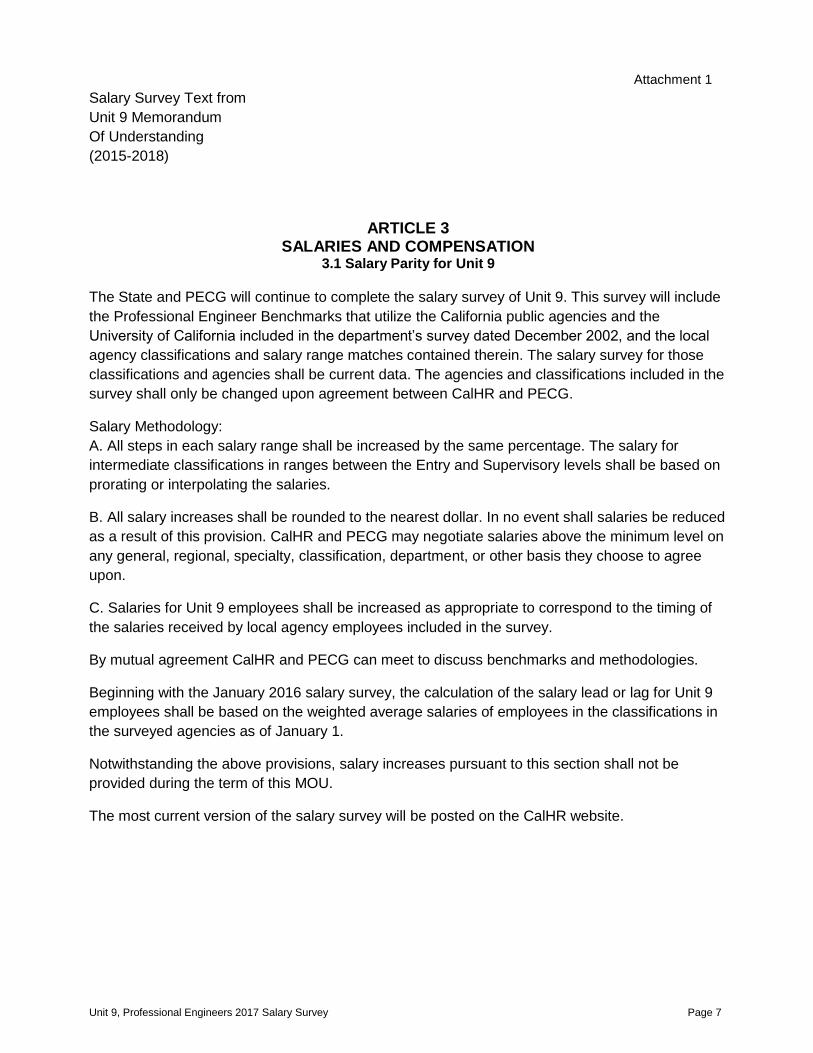
Attachment 1
Salary Survey Text from
Unit 9 Memorandum
Of Understanding
(2015-2018)
ARTICLE 3
SALARIES AND COMPENSATION 3.1 Salary Parity for Unit 9
The State and PECG will continue to complete the salary survey of Unit 9. This survey will include
the Professional Engineer Benchmarks that utilize the California public agencies and the
University of California included in the department’s survey dated December 2002, and the local
agency classifications and salary range matches contained therein. The salary survey for those
classifications and agencies shall be current data. The agencies and classifications included in the
survey shall only be changed upon agreement between CalHR and PECG.
Salary Methodology:
A. All steps in each salary range shall be increased by the same percentage. The salary for
intermediate classifications in ranges between the Entry and Supervisory levels shall be based on
prorating or interpolating the salaries.
B. All salary increases shall be rounded to the nearest dollar. In no event shall salaries be reduced
as a result of this provision. CalHR and PECG may negotiate salaries above the minimum level on
any general, regional, specialty, classification, department, or other basis they choose to agree
upon.
C. Salaries for Unit 9 employees shall be increased as appropriate to correspond to the timing of
the salaries received by local agency employees included in the survey.
By mutual agreement CalHR and PECG can meet to discuss benchmarks and methodologies.
Beginning with the January 2016 salary survey, the calculation of the salary lead or lag for Unit 9
employees shall be based on the weighted average salaries of employees in the classifications in
the surveyed agencies as of January 1.
Notwithstanding the above provisions, salary increases pursuant to this section shall not be
provided during the term of this MOU.
The most current version of the salary survey will be posted on the CalHR website.
Unit 9, Professional Engineers 2017 Salary Survey Page 8
Attachment 2
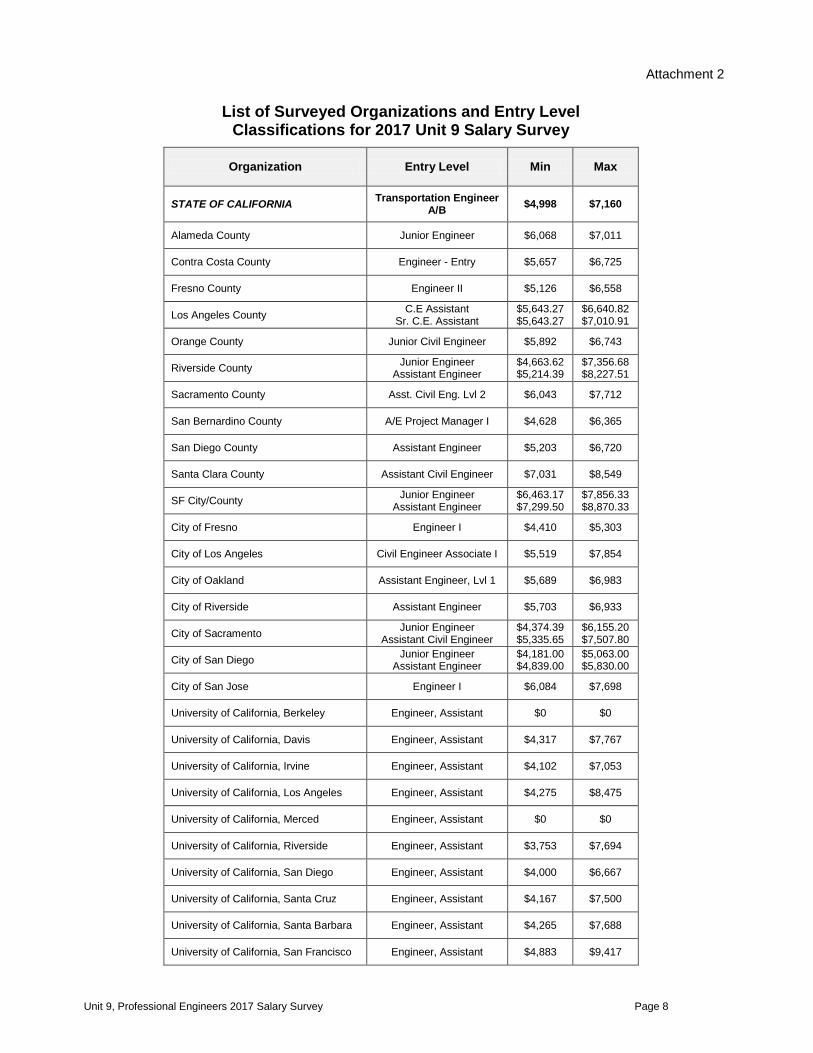
List of Surveyed Organizations and Entry Level
Classifications for 2017 Unit 9 Salary Survey
Organization Entry Level Min Max
STATE OF CALIFORNIA Transportation Engineer
A/B $4,998 $7,160
Alameda County Junior Engineer $6,068 $7,011
Contra Costa County Engineer - Entry $5,657 $6,725
Fresno County Engineer II $5,126 $6,558
Los Angeles County C.E Assistant
Sr. C.E. Assistant $5,643.27 $5,643.27
$6,640.82 $7,010.91
Orange County Junior Civil Engineer $5,892 $6,743
Riverside County Junior Engineer
Assistant Engineer $4,663.62 $5,214.39
$7,356.68 $8,227.51
Sacramento County Asst. Civil Eng. Lvl 2 $6,043 $7,712
San Bernardino County A/E Project Manager I $4,628 $6,365
San Diego County Assistant Engineer $5,203 $6,720
Santa Clara County Assistant Civil Engineer $7,031 $8,549
SF City/County Junior Engineer
Assistant Engineer $6,463.17 $7,299.50
$7,856.33 $8,870.33
City of Fresno Engineer I $4,410 $5,303
City of Los Angeles Civil Engineer Associate I $5,519 $7,854
City of Oakland Assistant Engineer, Lvl 1 $5,689 $6,983
City of Riverside Assistant Engineer $5,703 $6,933
City of Sacramento Junior Engineer
Assistant Civil Engineer $4,374.39 $5,335.65
$6,155.20 $7,507.80
City of San Diego Junior Engineer
Assistant Engineer $4,181.00 $4,839.00
$5,063.00 $5,830.00
City of San Jose Engineer I $6,084 $7,698
University of California, Berkeley Engineer, Assistant $0 $0
University of California, Davis Engineer, Assistant $4,317 $7,767
University of California, Irvine Engineer, Assistant $4,102 $7,053
University of California, Los Angeles Engineer, Assistant $4,275 $8,475
University of California, Merced Engineer, Assistant $0 $0
University of California, Riverside Engineer, Assistant $3,753 $7,694
University of California, San Diego Engineer, Assistant $4,000 $6,667
University of California, Santa Cruz Engineer, Assistant $4,167 $7,500
University of California, Santa Barbara Engineer, Assistant $4,265 $7,688
University of California, San Francisco Engineer, Assistant $4,883 $9,417
Unit 9, Professional Engineers 2017 Salary Survey Page 9
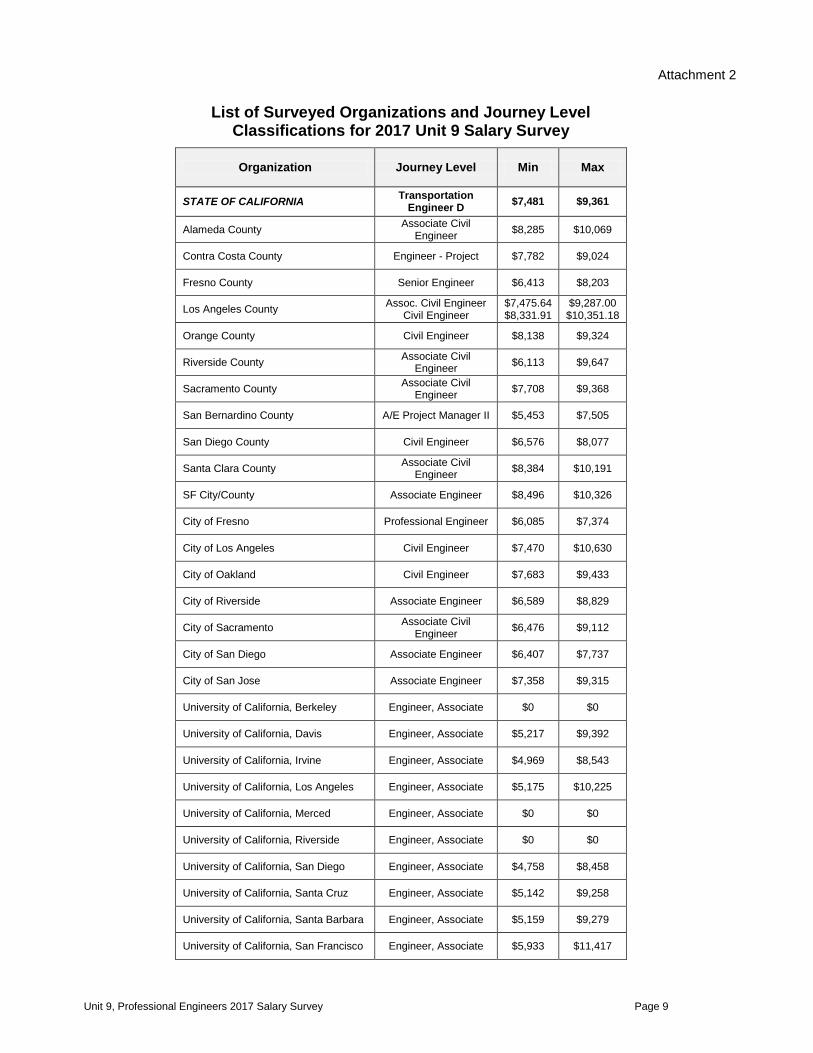
Attachment 2
List of Surveyed Organizations and Journey Level
Classifications for 2017 Unit 9 Salary Survey
Organization Journey Level Min Max
STATE OF CALIFORNIA Transportation
Engineer D $7,481 $9,361
Alameda County Associate Civil
Engineer $8,285 $10,069
Contra Costa County Engineer - Project $7,782 $9,024
Fresno County Senior Engineer $6,413 $8,203
Los Angeles County Assoc. Civil Engineer
Civil Engineer $7,475.64 $8,331.91
$9,287.00 $10,351.18
Orange County Civil Engineer $8,138 $9,324
Riverside County Associate Civil
Engineer $6,113 $9,647
Sacramento County Associate Civil
Engineer $7,708 $9,368
San Bernardino County A/E Project Manager II $5,453 $7,505
San Diego County Civil Engineer $6,576 $8,077
Santa Clara County Associate Civil
Engineer $8,384 $10,191
SF City/County Associate Engineer $8,496 $10,326
City of Fresno Professional Engineer $6,085 $7,374
City of Los Angeles Civil Engineer $7,470 $10,630
City of Oakland Civil Engineer $7,683 $9,433
City of Riverside Associate Engineer $6,589 $8,829
City of Sacramento Associate Civil
Engineer $6,476 $9,112
City of San Diego Associate Engineer $6,407 $7,737
City of San Jose Associate Engineer $7,358 $9,315
University of California, Berkeley Engineer, Associate $0 $0
University of California, Davis Engineer, Associate $5,217 $9,392
University of California, Irvine Engineer, Associate $4,969 $8,543
University of California, Los Angeles Engineer, Associate $5,175 $10,225
University of California, Merced Engineer, Associate $0 $0
University of California, Riverside Engineer, Associate $0 $0
University of California, San Diego Engineer, Associate $4,758 $8,458
University of California, Santa Cruz Engineer, Associate $5,142 $9,258
University of California, Santa Barbara Engineer, Associate $5,159 $9,279
University of California, San Francisco Engineer, Associate $5,933 $11,417
Unit 9, Professional Engineers 2017 Salary Survey Page 10
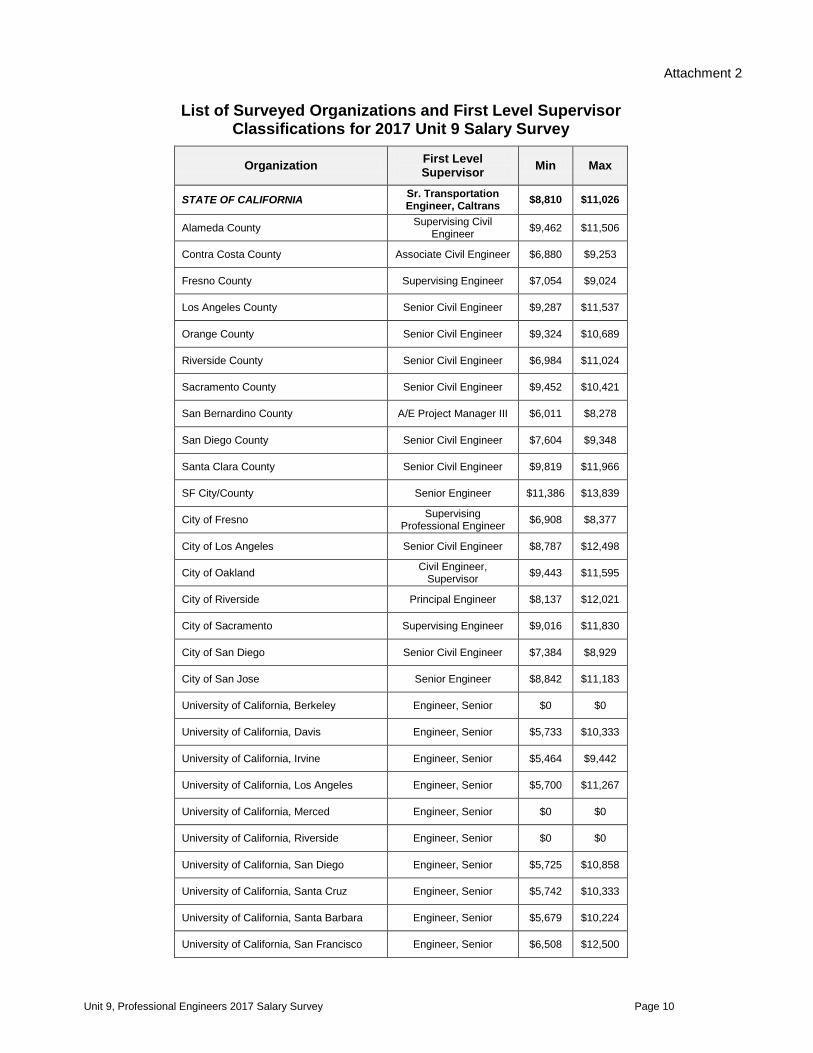
Attachment 2
List of Surveyed Organizations and First Level Supervisor
Classifications for 2017 Unit 9 Salary Survey
Organization First Level Supervisor
Min Max
STATE OF CALIFORNIA Sr. Transportation Engineer, Caltrans
$8,810 $11,026
Alameda County Supervising Civil
Engineer $9,462 $11,506
Contra Costa County Associate Civil Engineer $6,880 $9,253
Fresno County Supervising Engineer $7,054 $9,024
Los Angeles County Senior Civil Engineer $9,287 $11,537
Orange County Senior Civil Engineer $9,324 $10,689
Riverside County Senior Civil Engineer $6,984 $11,024
Sacramento County Senior Civil Engineer $9,452 $10,421
San Bernardino County A/E Project Manager III $6,011 $8,278
San Diego County Senior Civil Engineer $7,604 $9,348
Santa Clara County Senior Civil Engineer $9,819 $11,966
SF City/County Senior Engineer $11,386 $13,839
City of Fresno Supervising
Professional Engineer $6,908 $8,377
City of Los Angeles Senior Civil Engineer $8,787 $12,498
City of Oakland Civil Engineer,
Supervisor $9,443 $11,595
City of Riverside Principal Engineer $8,137 $12,021
City of Sacramento Supervising Engineer $9,016 $11,830
City of San Diego Senior Civil Engineer $7,384 $8,929
City of San Jose Senior Engineer $8,842 $11,183
University of California, Berkeley Engineer, Senior $0 $0
University of California, Davis Engineer, Senior $5,733 $10,333
University of California, Irvine Engineer, Senior $5,464 $9,442
University of California, Los Angeles Engineer, Senior $5,700 $11,267
University of California, Merced Engineer, Senior $0 $0
University of California, Riverside Engineer, Senior $0 $0
University of California, San Diego Engineer, Senior $5,725 $10,858
University of California, Santa Cruz Engineer, Senior $5,742 $10,333
University of California, Santa Barbara Engineer, Senior $5,679 $10,224
University of California, San Francisco Engineer, Senior $6,508 $12,500
Unit 9, Professional Engineers 2017 Salary Survey Page 11 Page 11
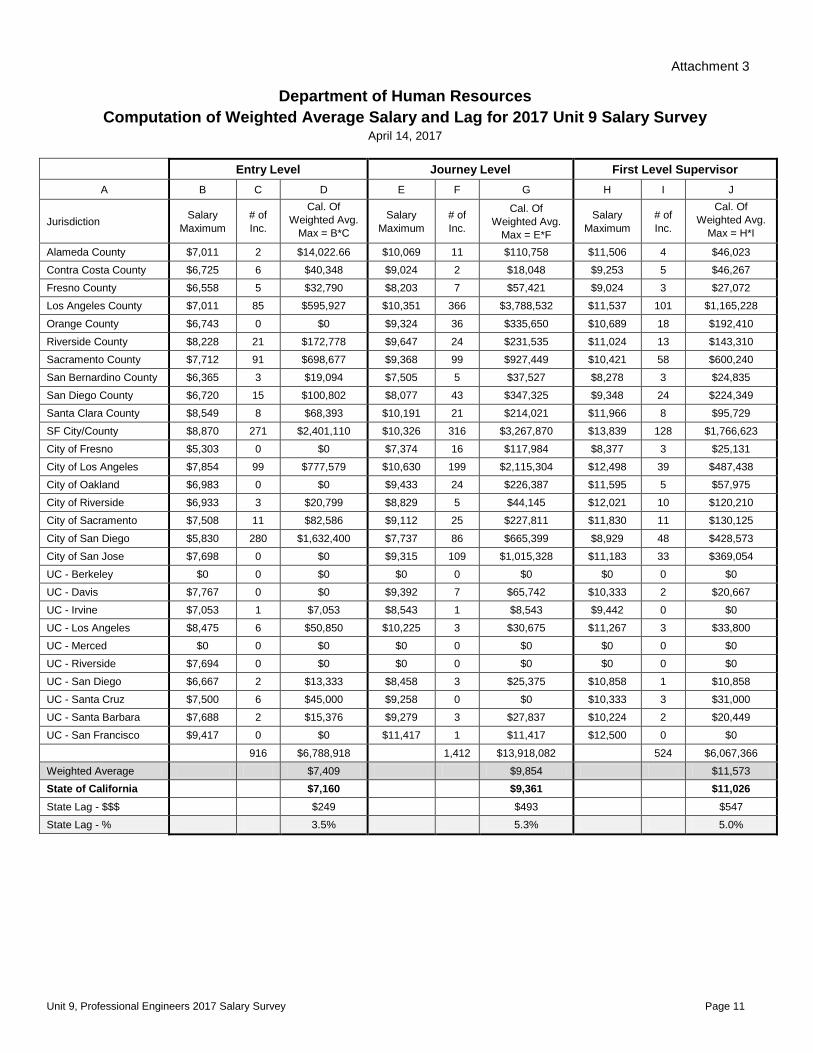
Attachment 3
Department of Human Resources
Computation of Weighted Average Salary and Lag for 2017 Unit 9 Salary Survey April 14, 2017
Entry Level Journey Level First Level Supervisor
A B C D E F G H I J
Jurisdiction Salary
Maximum
# of
Inc.
Cal. Of
Weighted Avg.
Max = B*C
Salary
Maximum
# of
Inc.
Cal. Of
Weighted Avg.
Max = E*F
Salary
Maximum
# of
Inc.
Cal. Of
Weighted Avg.
Max = H*I
Alameda County $7,011 2 $14,022.66 $10,069 11 $110,758 $11,506 4 $46,023
Contra Costa County $6,725 6 $40,348 $9,024 2 $18,048 $9,253 5 $46,267
Fresno County $6,558 5 $32,790 $8,203 7 $57,421 $9,024 3 $27,072
Los Angeles County $7,011 85 $595,927 $10,351 366 $3,788,532 $11,537 101 $1,165,228
Orange County $6,743 0 $0 $9,324 36 $335,650 $10,689 18 $192,410
Riverside County $8,228 21 $172,778 $9,647 24 $231,535 $11,024 13 $143,310
Sacramento County $7,712 91 $698,677 $9,368 99 $927,449 $10,421 58 $600,240
San Bernardino County $6,365 3 $19,094 $7,505 5 $37,527 $8,278 3 $24,835
San Diego County $6,720 15 $100,802 $8,077 43 $347,325 $9,348 24 $224,349
Santa Clara County $8,549 8 $68,393 $10,191 21 $214,021 $11,966 8 $95,729
SF City/County $8,870 271 $2,401,110 $10,326 316 $3,267,870 $13,839 128 $1,766,623
City of Fresno $5,303 0 $0 $7,374 16 $117,984 $8,377 3 $25,131
City of Los Angeles $7,854 99 $777,579 $10,630 199 $2,115,304 $12,498 39 $487,438
City of Oakland $6,983 0 $0 $9,433 24 $226,387 $11,595 5 $57,975
City of Riverside $6,933 3 $20,799 $8,829 5 $44,145 $12,021 10 $120,210
City of Sacramento $7,508 11 $82,586 $9,112 25 $227,811 $11,830 11 $130,125
City of San Diego $5,830 280 $1,632,400 $7,737 86 $665,399 $8,929 48 $428,573
City of San Jose $7,698 0 $0 $9,315 109 $1,015,328 $11,183 33 $369,054
UC - Berkeley $0 0 $0 $0 0 $0 $0 0 $0
UC - Davis $7,767 0 $0 $9,392 7 $65,742 $10,333 2 $20,667
UC - Irvine $7,053 1 $7,053 $8,543 1 $8,543 $9,442 0 $0
UC - Los Angeles $8,475 6 $50,850 $10,225 3 $30,675 $11,267 3 $33,800
UC - Merced $0 0 $0 $0 0 $0 $0 0 $0
UC - Riverside $7,694 0 $0 $0 0 $0 $0 0 $0
UC - San Diego $6,667 2 $13,333 $8,458 3 $25,375 $10,858 1 $10,858
UC - Santa Cruz $7,500 6 $45,000 $9,258 0 $0 $10,333 3 $31,000
UC - Santa Barbara $7,688 2 $15,376 $9,279 3 $27,837 $10,224 2 $20,449
UC - San Francisco $9,417 0 $0 $11,417 1 $11,417 $12,500 0 $0
916 $6,788,918 1,412 $13,918,082 524 $6,067,366
Weighted Average $7,409 $9,854 $11,573
State of California $7,160 $9,361 $11,026
State Lag - $$$ $249 $493 $547
State Lag - % 3.5% 5.3% 5.0%