Embed Size (px)
Citation preview

8th Grade Mathematics
Unit #2 : Understanding and Representing Linear Relationships Pacing: 40 Days
Unit Overview In this unit, students will build upon informal knowledge of one-variable linear equations, to solve equations, which include cases with infinitely many solutions or no solutions as well as cases requiring algebraic manipulation. Students will use the equation of a linear model to solve problems in the context of bivariate measurement data, interpreting the slope and intercept. Students will solve systems of two linear equations in two variables and relate the systems to pairs of lines in the plane; these intersect, are parallel, or are the same line. Students will solve systems of equations using graphing, substitution and elimination. In addition, students will be able to write and solve systems of equations from word problems. Students will use their understandings of linear equations, systems of linear equations, linear functions, and their understanding of slope of a line to analyze situations and solve problems. Students should engage in mathematical tasks that provide an opportunity to connect this content to the Mathematical Practices.
Prerequisite Skills Vocabulary Mathematical Practices • Computation with whole numbers and decimals,
including application of order of operations • Operations with fractions • Plotting points in four quadrant coordinate plane • Understanding of independent and dependent
variables • Characteristics of a proportional relationships • Operations with integers
Truncate Equations Rational Coefficient Multiplicative Inverse Equivalence Properties of Equality Two-Step Equation Null Set Identity Constant of Proportionality Constant of Variation Constant Rate of Change Direct Variation Linear Relationships Point-Slope Form Rise Run
Slope Slope-Intercept Form Standard Form Substitution Systems of Equations x-intercept y-intercept Ordered Pair Intersecting Lines Parallel Lines
MP.1: Make sense of problems and persevere in solving them
MP.2: Reason abstractly and quantitatively
MP.3: Construct viable arguments and critique the reasoning of others
MP.4: Model with mathematics
MP.5: Use appropriate tools strategically
MP.6: Attend to precision
MP.7: Look for and make use of structure
MP.8: Look for and express regularity in repeated reasoning

2 | P a g e
Common Core State Standards Progression of Skills According to the PARCC Model Content Framework, Standard 3.NF.2 should serve as an opportunity for in- depth focus:
According to the PARCC Model Content Framework, “Students build on previous work with proportional relationships, unit rates, and graphing to connect these ideas and understand that the points (x, y) on a non-vertical line are the solutions of the equation y = mx + b, where m is the slope of the line as well as the unit rate of a proportional relationship (in the case b = 0).” “8.EE.7 Students have been working informally with one-variable linear equations since as early as kindergarten. This important line of development culminates in grade 8 with the solution of general one-variable linear equations, including cases with infinitely many solutions or no solutions as well as cases requiring algebraic manipulation using properties of operations. Coefficients and constants in these equations may be any rational numbers.”
7th Grade 8th Grade 9th Grade
7.EE.2: Equivalent Expressions Understand that rewriting an expression in different forms in a problem context can shed light on the problem and how the quantities in it are related. For example, a + 0.05a = 1.05a means that "increase by 5%" is the same as "multiply by 1.05."
8.EE.7a: Linear Equations and Number of Solutions Give examples of linear equations in one variable with one solution, infinitely many solutions, or no solutions. Show which of these possibilities is the case by successively transforming the given equation into simpler forms, until an equivalent equation of the form x = a, a = a, or a = b results (where a and b are different numbers).
HSA.CED.A.1: Create equations that describe numbers or relationships Create equations and inequalities in one variable and use them to solve problems. Include equations arising from linear and quadratic functions, and simple rational and exponential functions.
7.EE.4: Solve Real-life Mathematical Problems Using Expressions and Equations Use variables to represent quantities in a real-‐world or mathematical problem, and construct simple equations and inequalities to solve problems by reasoning about the quantities.
8.EE.7b: Solve Multi-Step Linear Equations Solve linear equations with rational number coefficients, including equations whose solutions require expanding expressions using the distributive property and collecting like terms.
HSA.REI.C.5: Solve systems of equations Prove that, given a system of two equations in two variables, replacing one equation by the sum of that equation and a multiple of the other produces a system with the same solutions.
N/A
8.EE.8c: Solve Contextual Problems with Systems of Linear Equations Solve real-world and mathematical problems leading to two linear equations in two variables. For example, given coordinates for two pairs of points, determine whether the line through the first pair of points intersects the line through the second pair.
HSA.REI.C.7: Solve systems of equations Solve a simple system consisting of a linear equation and a quadratic equation in two variables algebraically and graphically. For example, find the points of intersection between the line y = -3x and the circle x2 + y2 = 3.
Supporting Standards (20%) 8.SP.2
Know that straight lines model relationships. 8.SP.3 Use the equation of a
linear model to solve problems.
8.EE.5: Graph Proportional Relationships and Interpret the Unit Rate as the Slope of the Graph
8.EE.6 Use similar triangles to explain why the slope m is the same.
8.EE.7: Solve Linear Equations in One Variable 8.EE.8: Analyze and Solve Pairs of Simultaneous Linear
Equations
Major Standards (70%)

3 | P a g e
Big Ideas Students Will… • What does the graph of a
proportional relationship look like? How does the graph compare to the slope of the related line in a proportional relationship?
• How can the use of tables, graphs, and equations represent linear relationships and how can each be analyzed to predict rates of change? How are changes in linear relationships affected and shown in a table, graph, or equation?
• Linear equations may have one solution, an infinite amount of solutions, or no solution and it is important to know the constraints for each type of solution set.
• There are several methods for
solving systems of equations such as numerically, graphically, or algebraically using substitution or elimination
Know/Understand Be Able To… • Linear equations with one variable may have one solution,
infinitely many solutions or no solutions dependent on what the equation looks like when simplified where it is x = a or a = b
• Solving linear equations in one variable with rational number coefficients may necessitate expanding the expression using the distributive property and collecting like terms
• Linear equations may be solved using inverse operations or by graphing the equation and finding the value of x based on the value of y
• Linear models can be represented with a linear equation that represents the fit line of a bivariate measurement data on a scatter plot
• Slope and intercept of the equation of a linear model provides information about the two quantities reflected in bivariate measurement data
• Equation of a linear model can be used to solve problems related to bivariate measurement data
• Two-way table organizes and summarizes data between two different variables using the columns and rows to display the association between the two variables
• To make a two�way table, data on each category must be collected
• Bivariate data can be presented in a two�way table. • Patterns of associate in bivariate data can be identified and
quantified using a two�way table. Students understand that relative frequencies for rows or columns of the two way table can be used to describe possible associations between the two variables
• Expressing the solution to a problem involving very small or very large quantities in scientific notation with the appropriate size measurement
• Explaining the appropriate size measurement and value of a quantity expressed in scientific notation and generated by technology when performing operations between very large or very small numbers
• Identifying whether a linear equation has one solution, infinitely many solutions, or no solutions by simplifying the equation to find x = a or a = b.
• Providing examples of a linear equation in one variable with one solution, infinitely many solutions, or no solutions and explain why. Students use the distributive property to expand expressions in a linear equation and collect like terms across the linear equation
• Solving one�variable linear equations using inverse operations, applying the distributive property or collecting like terms or by graphing the linear equations on a coordinate plane or representing it with pictures
• Writing the equation for a linear model to reflect bivariate measurement data on a scatter plot
• Interpreting what the slope and intercept of the equation of a linear model means in the context of the bivariate measurement data.
• Using the equation of a linear model to solve problems about bivariate measurement data
• Constructing a two-way table summarizing data on two variables or bivariate data
• Interpreting a two-way table to understand possible patterns of association between the two variables
• Calculating the relative frequencies for rows or columns of the two-way table
• Describing possible patterns of association between two variables using the calculated relative frequencies

4 | P a g e
Unit Sequence Lesson Learning Objective
SWBAT… Sample Assessment Item from
Exit Ticket Instructional Resources
1
Use properties of equality and inverse operations to solve one-step equations with rational coefficients
In the eighth grade, 417 students voted for the new mascot to be a bearcat. This was !
! of
the total number of students in the eighth grade. How many students are in the eighth grade?
My Math Chapter 2 Lesson 1 http://learnzillion.com/lessons/1013 http://learnzillion.com/lessons/1014
2 Use properties of equality and inverse operations to solve two-step equations with rational coefficients
1) What is the solution to this equation? ¾ y -1/2 = 5/8
1. y = 9/20
2. y = 4/5
3. y = 27/32
4. y = 3/2
My Math Chapter 2 Lesson 2 http://learnzillion.com/lessons/1015

5 | P a g e
3
Represent real world scenarios by writing one and two-step equations with one variable; solve for the unknown
Examples for mini lesson or guided practice:
Represent each scenario by writing an equation, then solve for the unknown: 1) Miriam read a book with an unknown number of
pages. The first week she read five less than !! of
the pages. The second week she read 171 pages and finished the book. Write an equation that represents the total number of pages in the book.
2) Subtract seven more than twice a number from the square of one-third of the number to get zero.
Write and solve an equation for the following scenario: Bruce bought two books. One book costs four dollars more than three times the other. Together, the two books cost him $72. Find the cost of each book.
My Math Chapter 2 Lesson 3 http://www.nsa.gov/academia/_files/collected_learning/middle_school/algebra/solving_equations.pdf
4 Flex Day (Instruction Based on Data) Recommended Resources:
Chapter 2 Problem-Solving Investigation (Pages 137 – 139)
Chapter 2 Mid-Chapter Check (Page 140) Chapter 2 Inquiry Lab (Pages 141 – 144)
5 Solve equations with variables on both sides of the equal sign
Angel transformed the following equation from 6𝑥 + 4− 𝑥 = 2(𝑥 + 1) to 10 = 2(𝑥 + 1). He then stated that the solution to the equation is 𝑥 = 4. Is he correct? Explain.
My Math Chapter 2 Lesson 4 http://learnzillion.com/lessons/1008 http://learnzillion.com/lessons/152 http://learnzillion.com/lessons/151
6

6 | P a g e
7
Solve multi-step equations Solve real world problems by identifying the solution or range of solutions to a linear equation in one variable
Analyze and represent contextual situations with equations, identify whether there is one, none, or many solutions, and then solve to prove conjectures about the solutions.
Sample Problem for Mini-‐Lesson or Guided Practice: Two linear equations are given below. • Equation 1: 5x = 8x – 3(x + 2) • Equation 2: 4x = 2(x+5)
1. How many solutions does equation 1 have? Show or explain how you found your answer.
2. How many solutions does equation 2 have? Show or explain how you found your answer.
1) Which statement regarding the number of solutions for the linear equation shown below is true? 4(3X+8) – 9 = 2(6X – 8) + 39
a. There are infinitely many solutions.
b. There are exactly two solutions. c. There is exactly one solution. d. There is no solution.
2) Give an example of a linear equation that has infinitely many solutions. Explain how you know your equation has infinitely many solutions.
My Math Chapter 2 Lesson 5 http://www.education.com/activity/article/tic-tac-equations/
8
9 Flex Day (Instruction Based on Data) Recommended Resources:
My Math Chapter 2 Review (Pages 163 – 166)
10 Explore proportional relationships related to average speed and constant speed in order to write a linear equation in two variables.
The table represents Rebeca’s travel time. Based on the table, what is her constant speed? Explain your reasoning.
x (hours) y (miles)
3 91.5 5 152.5 8 244
Engage NY Module 4 Lesson 10 (Appendix C) Resource for Remediation: My Math Chapter 3, Lesson 1

7 | P a g e
11 Evaluate numerical data to determine the rate of change. Plot points on a coordinate plane to represent rate of change problems.
1) Vicky reads at a constant rate. She can read 5 pages in 9 minutes. We want to know how many pages, 𝑝, Vicky can read after 𝑡 minutes. Write a linear equation in two variables that represents the number of pages Vicky reads in any given time interval.
Engage NY Module 4 Lesson 11 (Appendix C) Resource for Remediation: My Math Chapter 3, Lesson 1
12 Use a table to find solutions to a given linear equation and plot the solutions on a coordinate plane
Find three solutions for the linear equation 4x – 3y = 1, and plot the solutions as points on a coordinate plane. x Linear
equation: 4x – 3y =1
y
Engage NY Module 4 Lesson 12 (Appendix C)
13 Given a set of coordinate points or a line graphed on a coordinate plane, calculate the slope of the line.
Sketch a line that has a negative slope. Explain how you know your slope is negative.
Engage NY Module 4 Lesson 15 (Appendix C) Resource for Remediation: My Math Chapter 3, Lesson 2
14 Derive the formula for a direct variation. Write equations in y=mx form to represent mathematical and real world situations.
What is the relationship among the unit rate, slope, and constant rate of change of a proportional linear relationship?
My Math Chapter 3, Lesson 3

8 | P a g e
15 Derive the equation for a non-proportional linear relationship by using the slope formula. Write equations in slope-intercept form to represent mathematical and real world situations.
The entrance fee to the carnival is $8 and each ride cost $2. The total cost y for a trip to the carnival for x number of rides can be represented by the equation y = 2x + 8. Interpret the slope and y-intercept.
My Math Chapter 3, Lesson 4
16 Use x- and y-intercepts to graph equations on a coordinate plane Monty has a total of $290 in ten dollar and five dollar bills. This can be represented by the function 10x + 5y = 290. Interpret the x- and y-intercepts.
My Math Chapter 3, Lesson 5
17 Based on the information you are given, determine which form you must use to write a linear equation
The equation of a line is y = -2x + 7. Write an equation in point-slope form for the same line. Explain the steps that you used.
My Math Chapter 3, Lesson 6
18 Prove that any point on the graph of y = mx + b is on a line l and that any point on a line l is a point on the graph of y = mx + b.
Graph the equation 𝑦 = !!𝑥 − 10 using
the y-intercept and slope. Graph the equation 5x – 4y = 40 using intercepts. What can you conclude about the equations 𝑦 = !
!𝑥 − 10 and 5x – 4y =
40?
Engage NY Module 4 Lesson 19 (Appendix C)
19 Compare two different proportional relationships represented by graphs, equations, and tables to determine which has a greater rate of change.
Water flows out of Pipe A at a constant rate. Pipe A can fill 3 buckets of the same size in 14 minutes. Write a linear equation that represents the situation. The figure below represents the rate at which Pipe B can fill the same sized buckets. Write a linear equation that represents the situation for Pipe B.
Engage NY Module 4 Lesson 22 (Appendix C)

9 | P a g e
Which pipe fills buckets faster? Explain.
20 Deduce that: 1) two equations in the form of ax + by = c and a'x + b'y = c' graph as the same line when a'/a = b'/b = c'/c and at least one of a or b is nonzero. 2) the graph of a linear equation ax + by = c, where a, b, and c are constants and at least one of a or b is nonzero, is the line defined by the equation ax + by = c.
Given the equation 3𝑥−𝑦 =11, write another equation that will have the same graph. Explain why.
Engage NY Module 4 Lesson 23 (Appendix C)
21 Flex Days (Instruction Based on Data) Recommended Resources:
“Solving Linear Equations with One Variable” (Appendix C) “Baseball Jerseys” (Appendix C) Engage NY Lesson 21 (Appendix C)
“We Predict” (Appendix C) My Math Chapter 3 Inquiry Lab (Pages 207 – 208)
My Math Mid-Chapter Check (Page 220)
22
23 Write equations with various solution types and provide step-by-step solutions with justifications
See Performance Task
Performance Task: Writing for a Math Website (Appendix C)
24 Identify solutions of systems of linear equations in 2 variables * Note: Students must understand that simultaneous linear equations may be graphed on a coordinate plane using ordered pairs and/or linear equations and may be identified using a line in order to graph systems of linear equations on a coordinate pair using ordered pairs and/or the equations.
Can you determine whether a system of equations has a solution by looking at the graph of the equations? Explain.
My Math Chapter 3 Lesson 7 Pgs. 233-242 http://learnzillion.com/lessons/64
10 | P a g e
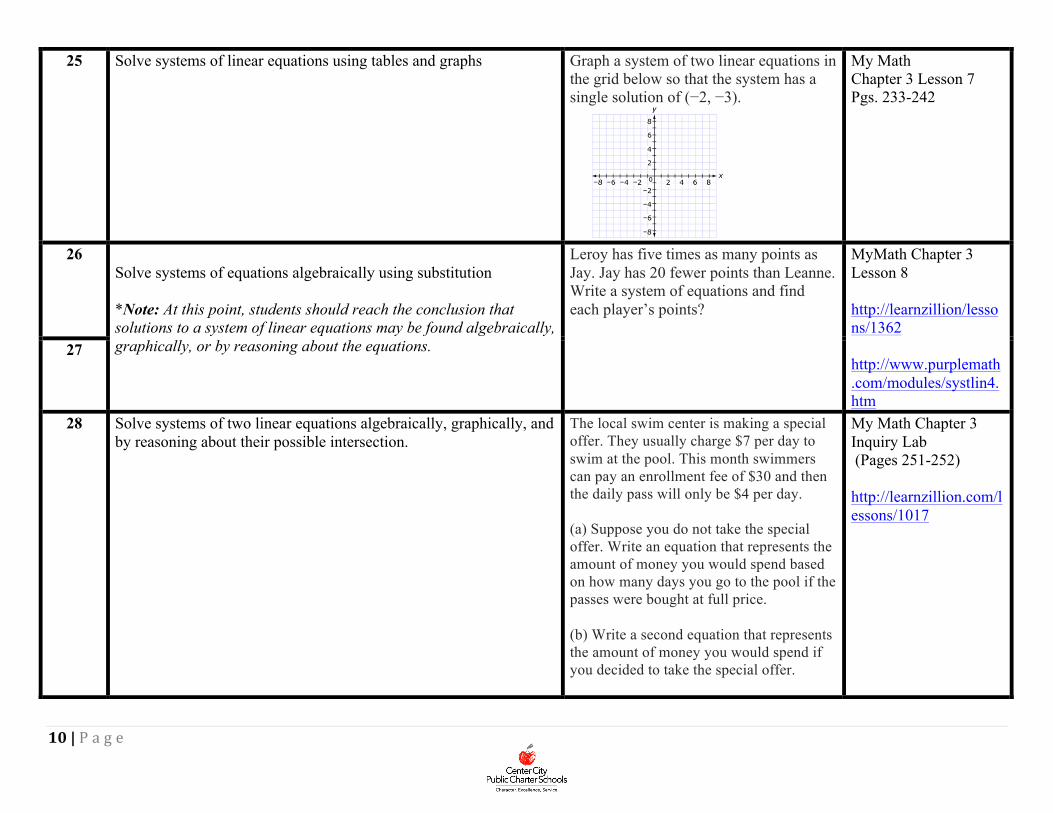
25 Solve systems of linear equations using tables and graphs
Graph a system of two linear equations in the grid below so that the system has a single solution of (−2, −3).
My Math Chapter 3 Lesson 7 Pgs. 233-242
26 Solve systems of equations algebraically using substitution *Note: At this point, students should reach the conclusion that solutions to a system of linear equations may be found algebraically, graphically, or by reasoning about the equations.
Leroy has five times as many points as Jay. Jay has 20 fewer points than Leanne. Write a system of equations and find each player’s points?
MyMath Chapter 3 Lesson 8 http://learnzillion/lessons/1362 http://www.purplemath.com/modules/systlin4.htm
27
28 Solve systems of two linear equations algebraically, graphically, and by reasoning about their possible intersection.
The local swim center is making a special offer. They usually charge $7 per day to swim at the pool. This month swimmers can pay an enrollment fee of $30 and then the daily pass will only be $4 per day. (a) Suppose you do not take the special offer. Write an equation that represents the amount of money you would spend based on how many days you go to the pool if the passes were bought at full price. (b) Write a second equation that represents the amount of money you would spend if you decided to take the special offer.
My Math Chapter 3 Inquiry Lab (Pages 251-252) http://learnzillion.com/lessons/1017

11 | P a g e
29 Apply the method elimination in order to solve systems of equations
What is the first step to solving this system of equation algebraically? Justify your reasoning. 4x + 5y = 13
3x + 3y = 9
Engage NY Module 4 Lesson 28 (Appendix C)
http://www.khanacademy.org/math/algebra/systems-of-eq-and-ineq/fast-systems-of-equations/v/solving-systems-of-equations-by-elimination
30 Explain the relationship between the number of solutions a system of linear equations has and the types of lines that represent these systems. *Note: Students will deduce that the systems of linear equations that have one solution or point of intersection are intersecting lines, those with infinite number of solutions are equivalent lines, and those with no solutions are parallel lines.
Consider the equation 5x − 2y = 3. If possible, write a second linear equation to create a system of equations that has: (a) Exactly 1 solution. (b) Exactly 2 solutions. (c) No solutions. (d) Infinitely many solutions. For each of these cases, how many such equations are possible?
“What are the Coefficients?” (Appendix C) “Classifying Solutions to Systems of Equations” (Appendix C) http://learnzillion/lessons/1018 http://learnzillion/lessons/1019
31 Write real world problems into systems of linear equations and solve using elimination and substitution methods
Small boxes contain DVDs, and large boxes contain one gaming machine. Three boxes of gaming machines and a box of DVDs weigh 𝟒8 pounds. Three boxes of gaming machines and five boxes of DVDs weigh 𝟕2 pounds. How much does each box weigh? Write and solve a system of equations.
Engage NY Module 4 Lesson 29 (Appendix C)

12 | P a g e
32 Flex Day (Instruction Based on Data) Recommended Resources:
Engage NY Lesson 30 (Appendix C) My Math Chapter 3 Review and Reflect (Pages 255 – 258)
33 Make sense of real world problems and persevere in solving them.
*Teaching Tip: Provide a variety of structures for students to work within this week (i.e. Socratic discussions, homogenuous groups and hetereogenuous groups, etc; if the majority of the class is struggling, provide a gradual release over the course of the week so they are working more independently by the end of the week) *Teaching Tip: Build in structures this week to maximize opportunities for students to construct mathematical arguments and critique the arguments of their peers (MP 3)
“Cara’s Candles” (Appendix C) “DVD Club” (Appendix C) “Field Day” (Appendix C) “Stacking Cups” (Appendix C) “Free Throw Percentages” (Appendix C) “How Much Did They Cost?” (Appendix C) “Fencing” (Appendix C) “Planning a Party” (Appendix C) “Real World Problem Solving” (Appendix C)
http://hotmath.com/hotmath_help/topics/writing-systems-of-linear-equations-from-word-problems.html http://www.purplemath.com/modules/systprob.htm http://www.bigideasmath.com/protected/content/ipe_cc/grade%208/03/g8_03_05.pdf
34
35
36
37
38
39 Performance Task: “Stained Glass Window”
(Appendix C) *Note: create an opportunity for students to discuss and debate their strategies and solution at the end of the lesson
*This does not need to be treated as an assessment – students may work independently, collaboratively, and/or receive some scaffolding in small groups as needed
40 MCLASS Beacon End of Unit Assessment Appendix B
*This assessment will be administered online

13 | P a g e
Appendix A:
Unpacked Standards Guide Source: Public Schools of North Carolina NCDPI Collaborative Workspace
Standard Unpacking What do these standards mean a child will know and be able to do?
8.EE.5 Graph proportional relationships, interpreting the unit rate as the slope of the graph. Compare two different proportional relationships represented in different ways. For example, compare a distance-time graph to a distance-time equation to determine which of two moving objects has greater speed.
8.EE.5 Students build on their work with unit rates from 6th grade and proportional relationships in 7th grade to compare graphs, tables and equations of proportional relationships. Students identify the unit rate (or slope) in graphs, tables and equations to compare two proportional relationships represented in different ways. Example 1: Compare the scenarios to determine which represents a greater speed. Explain your choice including a written description of each scenario. Be sure to include the unit rates in your explanation. Scenario 1: Scenario 2: y = 55x x is time in hours y is distance in miles Solution: Scenario 1 has the greater speed since the unit rate is 60 miles per hour. The graph shows this rate since 60 is the distance traveled in one hour. Scenario 2 has a unit rate of 55 miles per hour shown as the coefficient in the equation. Given an equation of a proportional relationship, students draw a graph of the relationship. Students recognize that the unit rate is the coefficient of x and that this value is also the slope of the line.

14 | P a g e
8.EE.7 Solve linear equations in one variable. • Give examples of linear
equations in one variable with one solution, infinitely many solutions, or no solutions. Show which of these possibilities is the case by successively transforming the given equation into simpler forms, until an equivalent equation of the form x = a, a = a, or a = b results (where a and b are different numbers).
• Solve linear equations with rational number coefficients, including equations whose solutions require expanding expressions using the distributive property and collecting like terms.
8.EE.7 Students solve one-variable equations including those with the variables being on both sides of the equals sign. Students recognize that the solution to the equation is the value(s) of the variable, which make a true equality when substituted back into the equation. Equations shall include rational numbers, distributive property and combining like terms. Example 1: Equations have one solution when the variables do not cancel out. For example, 10x – 23 = 29 – 3x can be solved to x = 4. This means that when the value of x is 4, both sides will be equal. If each side of the equation were treated as a linear equation and graphed, the solution of the equation represents the coordinates of the point where the two lines would intersect. In this example, the ordered pair would be (4, 17). 10 • 4 – 23 = 29 – 3 • 4 40 – 23 = 29 – 12 17 = 17 Example 2: Equations having no solution have variables that will cancel out and constants that are not equal. This means that there is not a value that can be substituted for x that will make the sides equal. -x + 7 – 6x = 19 – 7x Combine like terms -7x + 7 = 19 – 7x Add 7x to each side 7 ≠ 19 This solution means that no matter what value is substituted for x the final result will never be equal to each other. If each side of the equation were treated as a linear equation and graphed, the lines would be parallel. Example 3: An equation with infinitely many solutions occurs when both sides of the equation are the same. Any value of x will produce a valid equation. For example the following equation, when simplified will give the same values on both sides.
– (36a – 6) = (4 – 24a)
–18a + 3 = 3 – 18a
€
12
€
34
15 | P a g e
If each side of the equation were treated as a linear equation and graphed, the graph would be the same line. Example 4: Two more than a certain number is 15 less than twice the number. Find the number. Solution: n + 2 = 2n – 15 17 = n
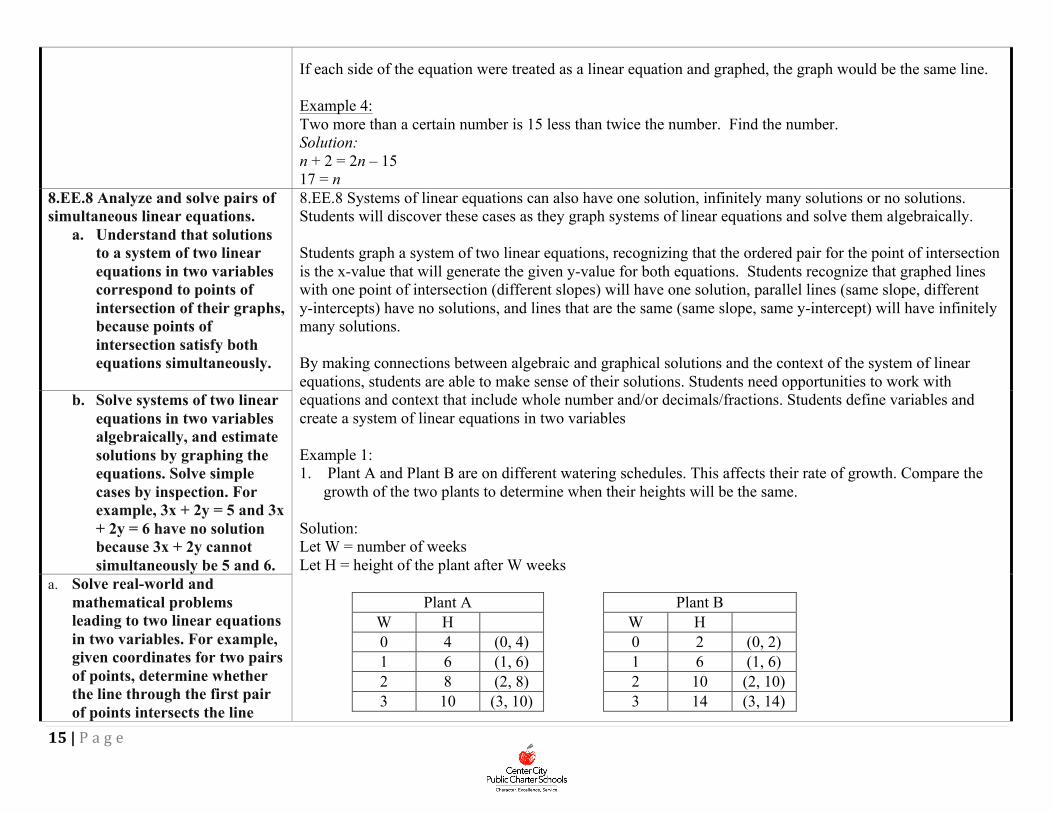
8.EE.8 Analyze and solve pairs of simultaneous linear equations.
a. Understand that solutions to a system of two linear equations in two variables correspond to points of intersection of their graphs, because points of intersection satisfy both equations simultaneously.
8.EE.8 Systems of linear equations can also have one solution, infinitely many solutions or no solutions. Students will discover these cases as they graph systems of linear equations and solve them algebraically. Students graph a system of two linear equations, recognizing that the ordered pair for the point of intersection is the x-value that will generate the given y-value for both equations. Students recognize that graphed lines with one point of intersection (different slopes) will have one solution, parallel lines (same slope, different y-intercepts) have no solutions, and lines that are the same (same slope, same y-intercept) will have infinitely many solutions. By making connections between algebraic and graphical solutions and the context of the system of linear equations, students are able to make sense of their solutions. Students need opportunities to work with equations and context that include whole number and/or decimals/fractions. Students define variables and create a system of linear equations in two variables Example 1: 1. Plant A and Plant B are on different watering schedules. This affects their rate of growth. Compare the
growth of the two plants to determine when their heights will be the same. Solution: Let W = number of weeks Let H = height of the plant after W weeks
Plant A Plant B W H W H 0 4 (0, 4) 0 2 (0, 2) 1 6 (1, 6) 1 6 (1, 6) 2 8 (2, 8) 2 10 (2, 10) 3 10 (3, 10) 3 14 (3, 14)
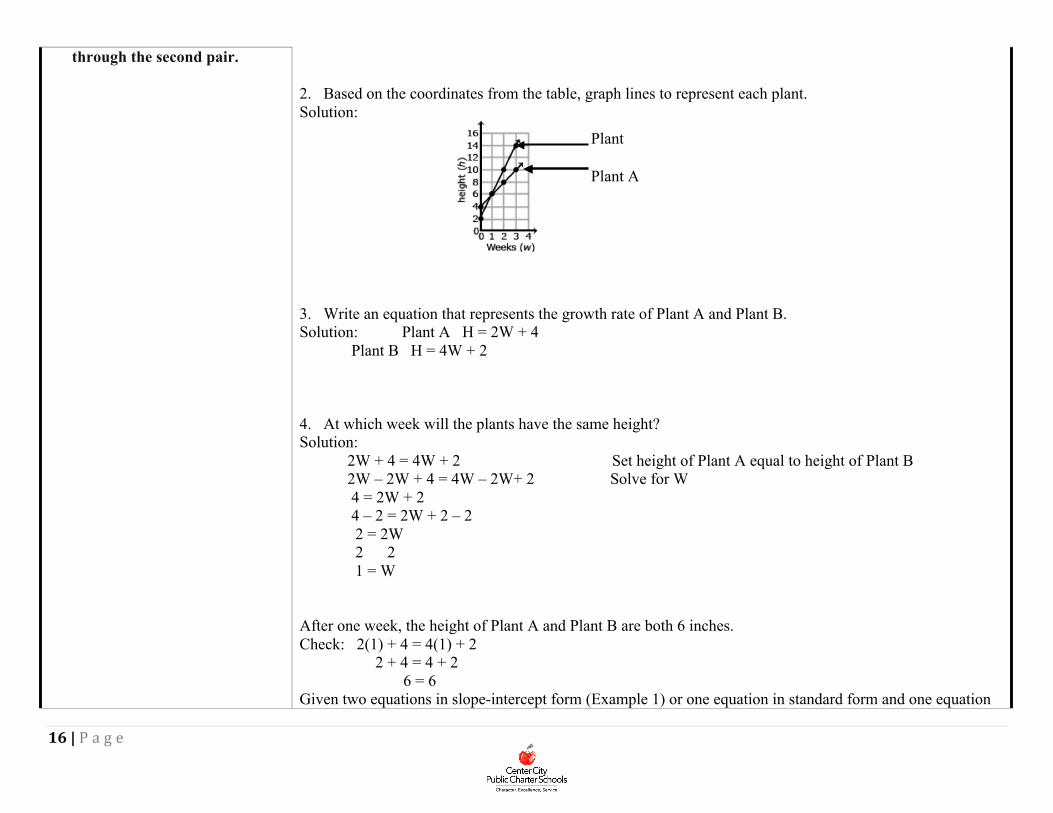
b. Solve systems of two linear equations in two variables algebraically, and estimate solutions by graphing the equations. Solve simple cases by inspection. For example, 3x + 2y = 5 and 3x + 2y = 6 have no solution because 3x + 2y cannot simultaneously be 5 and 6.
a. Solve real-world and mathematical problems leading to two linear equations in two variables. For example, given coordinates for two pairs of points, determine whether the line through the first pair of points intersects the line
16 | P a g e
through the second pair. 2. Based on the coordinates from the table, graph lines to represent each plant. Solution: 3. Write an equation that represents the growth rate of Plant A and Plant B. Solution: Plant A H = 2W + 4 Plant B H = 4W + 2 4. At which week will the plants have the same height? Solution: 2W + 4 = 4W + 2 Set height of Plant A equal to height of Plant B 2W – 2W + 4 = 4W – 2W+ 2 Solve for W 4 = 2W + 2 4 – 2 = 2W + 2 – 2 2 = 2W 2 2 1 = W After one week, the height of Plant A and Plant B are both 6 inches. Check: 2(1) + 4 = 4(1) + 2 2 + 4 = 4 + 2 6 = 6 Given two equations in slope-intercept form (Example 1) or one equation in standard form and one equation
Plant B Plant A

17 | P a g e
in slope-intercept form, students use substitution to solve the system. Example 2: Solve: Victor is half as old as Maria. The sum of their ages is 54. How old is Victor? Solution: Let v = Victor’s age v + m = 54 Let m = Maria’s age v = ½ m ½ m + m = 54 Substitute ½m for v in the first equation 1½ m = 54 m = 36 If Maria is 36, then substitute 36 into v + m = 54 to find Victor’s age of 18. Note: Students are not expected to change linear equations written in standard form to slope-intercept form or solve systems using elimination. For many real world contexts, equations may be written in standard form. Students are not expected to change the standard form to slope-intercept form. However, students may generate ordered pairs recognizing that the values of the ordered pairs would be solutions for the equation. For example, in the equation above, students could make a list of the possible ages of Victor and Maria that would add to 54. The graph of these ordered pairs would be a line with all the possible ages for Victor and Maria.
Victor Maria 20 34 10 44 50 4 29 25


![4x + 6y = 4 x = -6 + 2y - Algebra - Homealgebra.flippedmath.com/uploads/1/1/3/0/11305589/8.2...[8.2: SOLVING SYSTEMS BY SUBSTITUTION] 1. Solve the following system of equations using](https://img.pdfslide.us/doc/110x75/5ae60e6f7f8b9a29048d095a/4x-6y-4-x-6-2y-algebra-82-solving-systems-by-substitution-1-solve.jpg)