Embed Size (px)
Citation preview

Unit 5

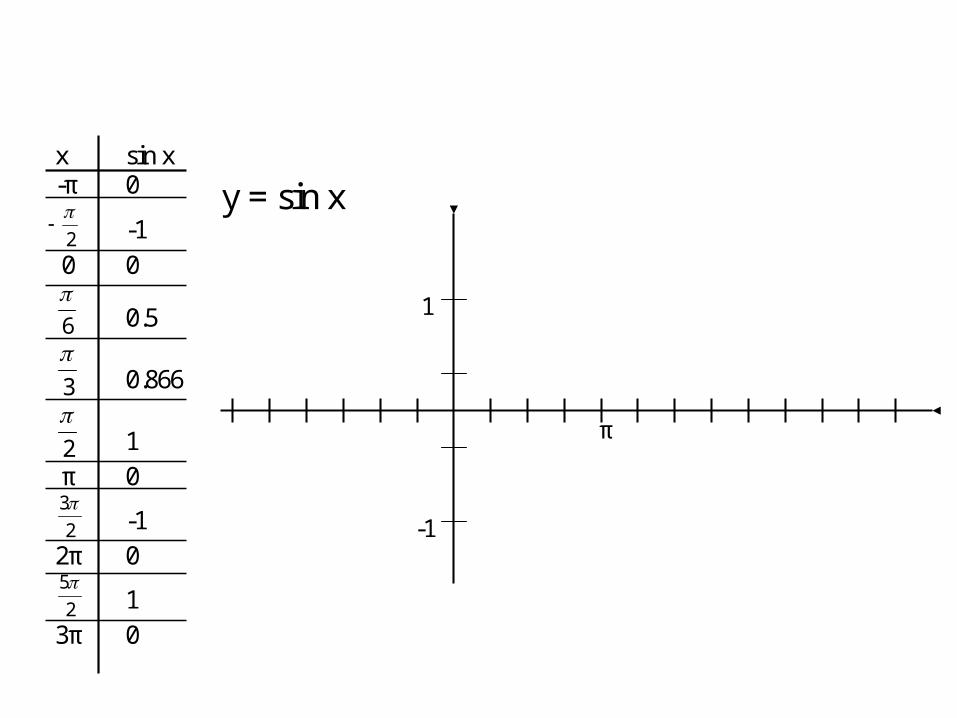
x sin x -π 0
2
-1
0 0
6
0.5
3
0.866
2
1
π 0
2
3 -1
2π 0
2
5 1
3π 0
y = sin x
π
1
-1

x cos x -π -1
2
0
0 1
6
0.866
3
.5
2
0
π -1
2
3 0
2π 1
2
5 0
3π -1
y = cos x
π
1
-1
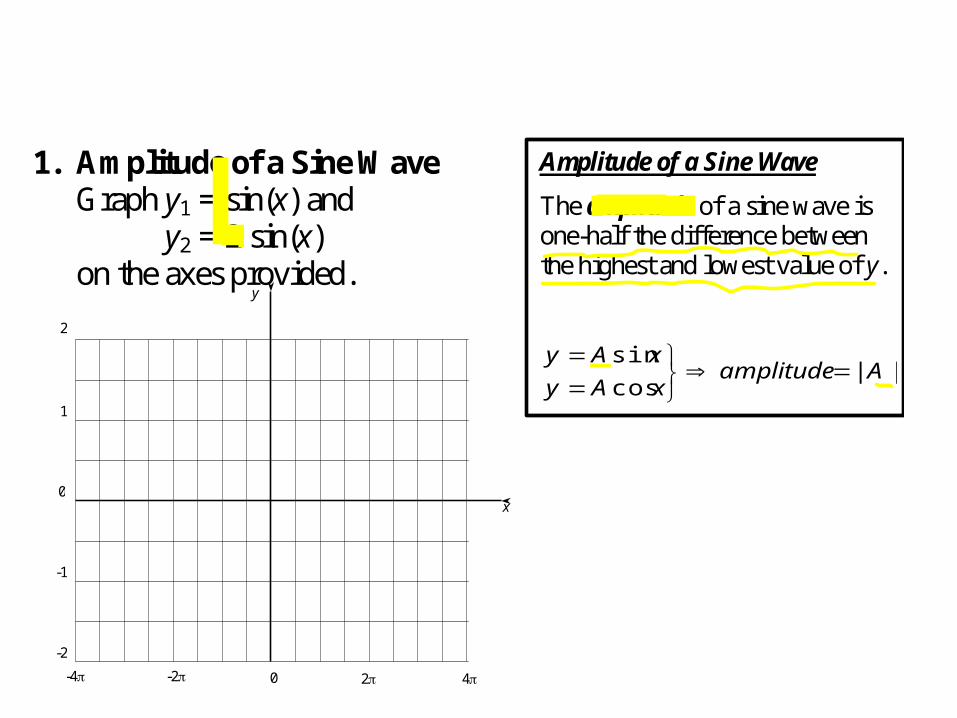
1. Amplitude of a Sine Wave
Graph y1 = sin(x) and y2 = 2 sin(x) on the axes provided.
2 4 -4 -2
2
1
-1
-2
0
0
x
y
Amplitude of a Sine Wave
The amplitude of a sine wave is one-half the difference between the highest and lowest value of y.
||cos
sinAamplitude
xAy
xAy

2. Period of a Sine Wave
Graph y1 = sin(x) and y2 = sin(2x) on the axes provided.
2 4 -4 -2
2
1
-1
-2
0
0
x
y
Period of a Sine Wave
The period of a sine wave is the distance between wave peaks.
bperiod
bxy
bxy 2
cos
sin
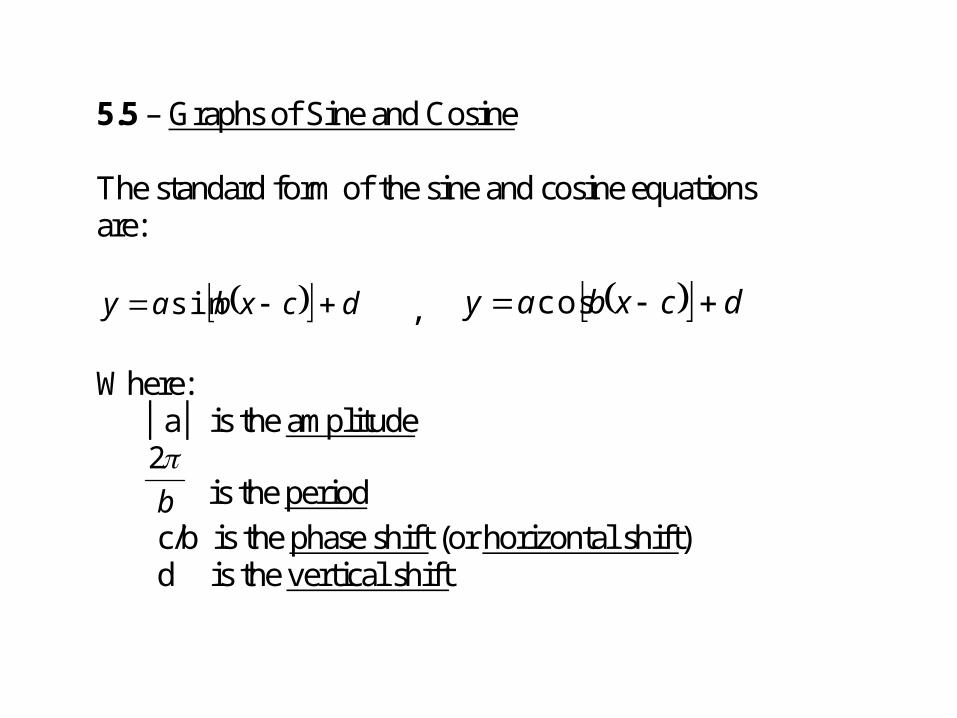
5.5 – Graphs of Sine and Cosine The standard form of the sine and cosine equations are:
dcxbay sin , dcxbay cos Where:
│a│ is the amplitude
b
2 is the period
c/b is the phase shift (or horizontal shift) d is the vertical shift
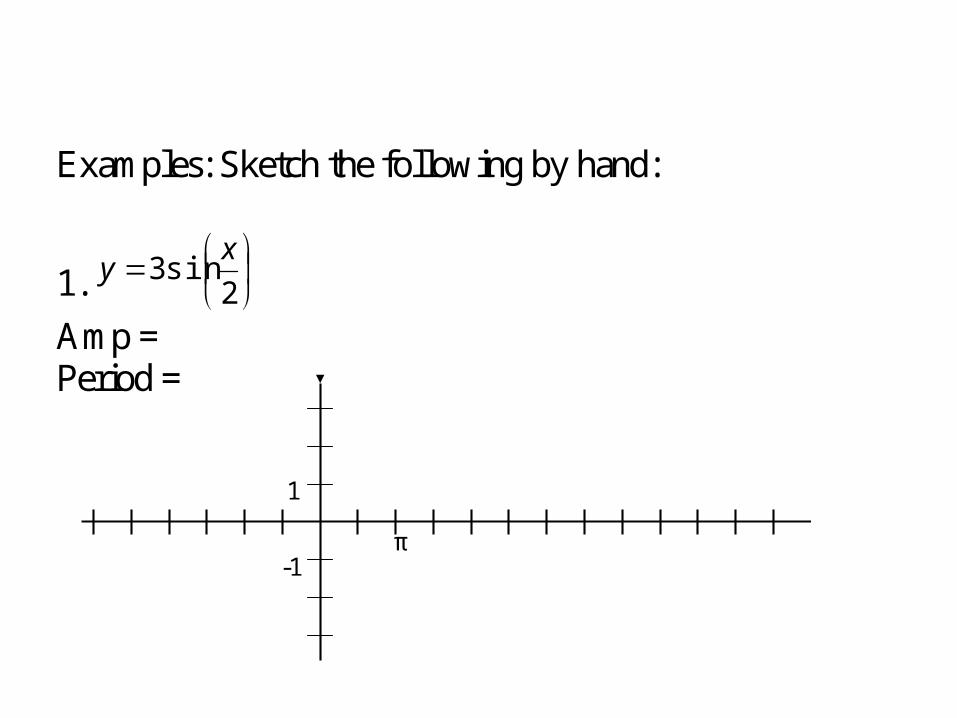
Examples: Sketch the following by hand:
1.
2sin3
xy
Amp = Period =
π
1
-1

Examples: Sketch the following by hand:
2. xy 3sin2
1
Amp = Period =
π
1
-1
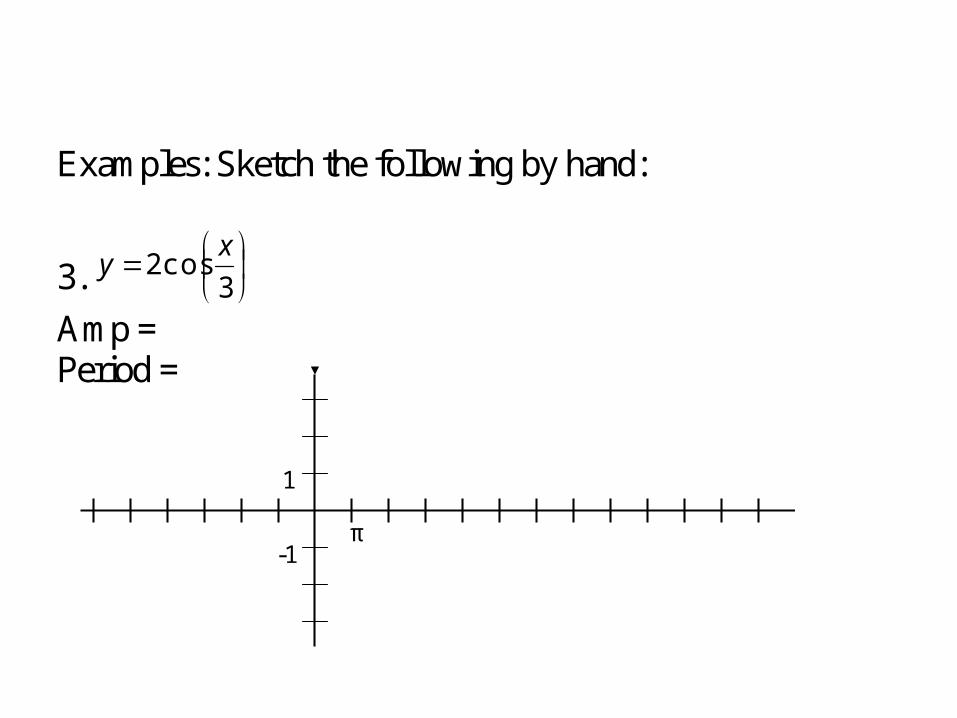
Examples: Sketch the following by hand:
3.
3cos2
xy
Amp = Period =
π
1
-1
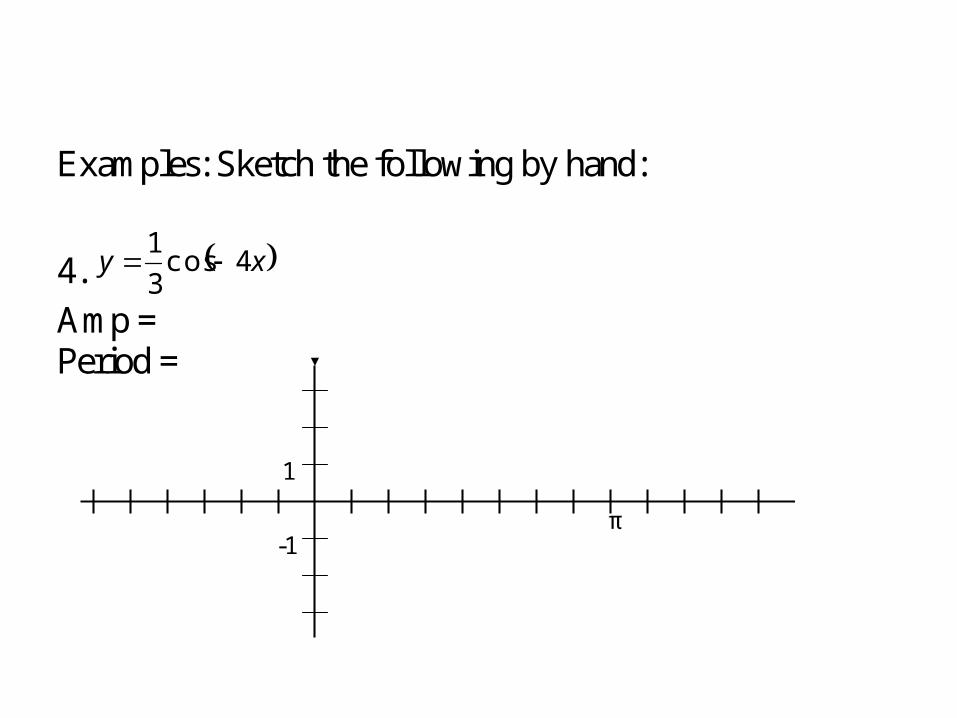
Examples: Sketch the following by hand:
4. xy 4cos3
1
Amp = Period =
π
1
-1

» Graphing Worksheet


![NERCTranslate this page - Clean.pdf%PDF-1.6 %âãÏÓ 510 0 obj > endobj 522 0 obj >/Filter/FlateDecode/ID[724981DFCD71F64096B30776897166D2>3C06A2D58E1D8D4C8572B8C568526F03>]/Index[510](https://img.pdfslide.us/doc/110x75/5ab4e5f77f8b9a2f438c07e7/nerctranslate-this-cleanpdfpdf-16-510-0-obj-endobj-522-0-obj-filterflatedecodeid724981dfcd71f64096b30776897166d23c06a2d58e1d8d4c8572b8c568526f03index510.jpg)