Embed Size (px)
Citation preview
September
2013 IENGINEERS- CONSULTANTS LECTURE NOTES SERIES MBA SEMESTER 1
MANEGERIAL ECONOMICS UNIT4
Managerial Economics UNIT-2 By: Mayank Pandey
1
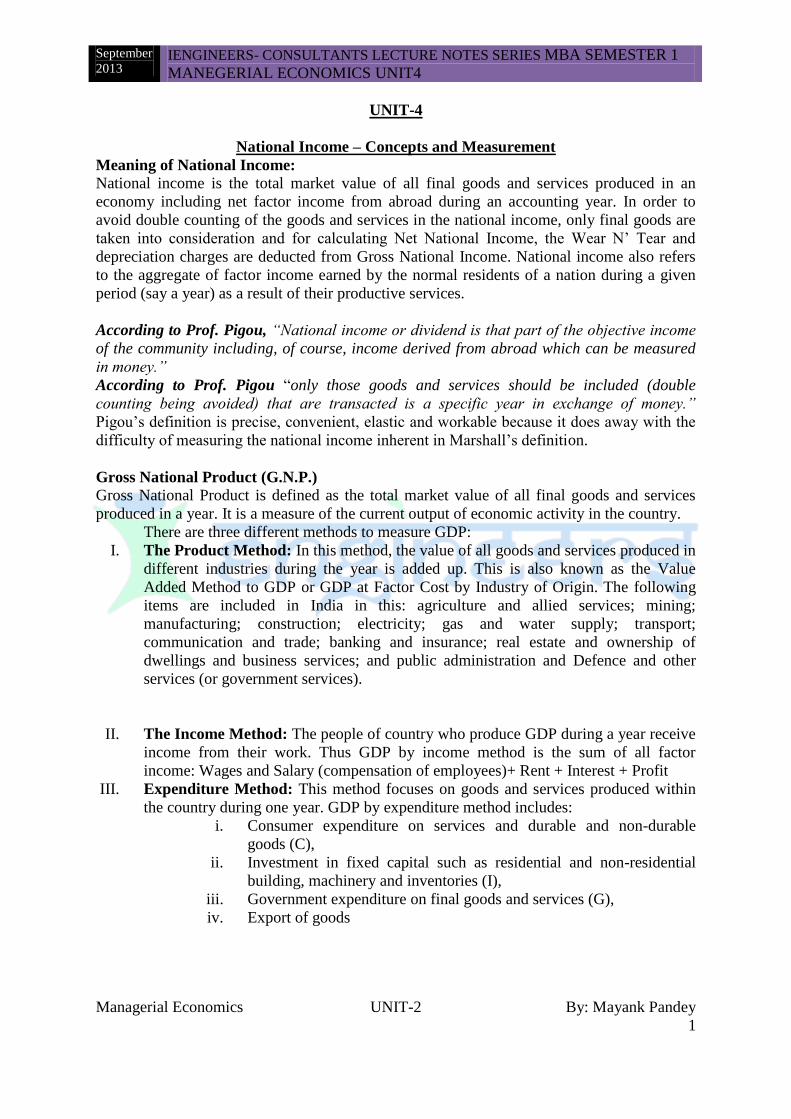
UNIT-4
National Income – Concepts and Measurement
Meaning of National Income:
National income is the total market value of all final goods and services produced in an
economy including net factor income from abroad during an accounting year. In order to
avoid double counting of the goods and services in the national income, only final goods are
taken into consideration and for calculating Net National Income, the Wear N’ Tear and
depreciation charges are deducted from Gross National Income. National income also refers
to the aggregate of factor income earned by the normal residents of a nation during a given
period (say a year) as a result of their productive services.
According to Prof. Pigou, “National income or dividend is that part of the objective income
of the community including, of course, income derived from abroad which can be measured
in money.”
According to Prof. Pigou “only those goods and services should be included (double
counting being avoided) that are transacted is a specific year in exchange of money.”
Pigou’s definition is precise, convenient, elastic and workable because it does away with the
difficulty of measuring the national income inherent in Marshall’s definition.
Gross National Product (G.N.P.) Gross National Product is defined as the total market value of all final goods and services
produced in a year. It is a measure of the current output of economic activity in the country.
There are three different methods to measure GDP:
I. The Product Method: In this method, the value of all goods and services produced in
different industries during the year is added up. This is also known as the Value
Added Method to GDP or GDP at Factor Cost by Industry of Origin. The following
items are included in India in this: agriculture and allied services; mining;
manufacturing; construction; electricity; gas and water supply; transport;
communication and trade; banking and insurance; real estate and ownership of
dwellings and business services; and public administration and Defence and other
services (or government services).
II. The Income Method: The people of country who produce GDP during a year receive
income from their work. Thus GDP by income method is the sum of all factor
income: Wages and Salary (compensation of employees)+ Rent + Interest + Profit
III. Expenditure Method: This method focuses on goods and services produced within
the country during one year. GDP by expenditure method includes:
i. Consumer expenditure on services and durable and non-durable
goods (C),
ii. Investment in fixed capital such as residential and non-residential
building, machinery and inventories (I),
iii. Government expenditure on final goods and services (G),
iv. Export of goods
September
2013 IENGINEERS- CONSULTANTS LECTURE NOTES SERIES MBA SEMESTER 1
MANEGERIAL ECONOMICS UNIT4
Managerial Economics UNIT-2 By: Mayank Pandey
2
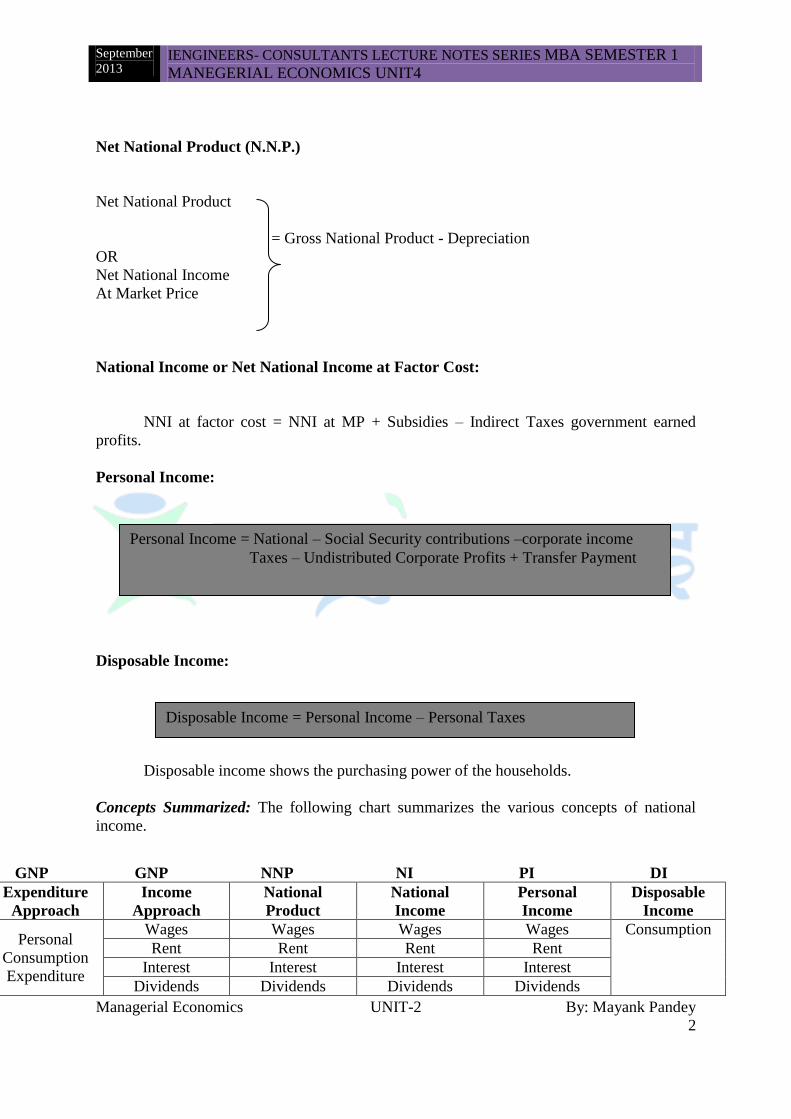
Net National Product (N.N.P.)
Net National Product
= Gross National Product - Depreciation
OR
Net National Income
At Market Price
National Income or Net National Income at Factor Cost:
NNI at factor cost = NNI at MP + Subsidies – Indirect Taxes government earned
profits.
Personal Income:
Disposable Income:
Disposable income shows the purchasing power of the households.
Concepts Summarized: The following chart summarizes the various concepts of national
income.
GNP GNP NNP NI PI DI
Expenditure
Approach
Income
Approach
National
Product
National
Income
Personal
Income
Disposable
Income
Personal
Consumption
Expenditure
Wages Wages Wages Wages Consumption
Rent Rent Rent Rent
Interest Interest Interest Interest
Dividends Dividends Dividends Dividends
Personal Income = National – Social Security contributions –corporate income
Taxes – Undistributed Corporate Profits + Transfer Payment
Disposable Income = Personal Income – Personal Taxes

September
2013 IENGINEERS- CONSULTANTS LECTURE NOTES SERIES MBA SEMESTER 1
MANEGERIAL ECONOMICS UNIT4
Managerial Economics UNIT-2 By: Mayank Pandey
3
National Income at Current Prices and National Income at Constant Prices
While estimating national income goods and services produced are multiple by their prices.
Thus,
(Here, NI =national income, = sum total, P =price, G = Goods and services)
Conversion of Monetary National Income into Real National Income
Or
Derivation of Real National Income:
By Estimating National Income at some fixed prices:
Real National income or Material income at constant prices
=National Income at Current Prices
Current Price Index Number
Example: if in 1981, national is Rs. 100 crores, and in 2001 it is Rs.200 crores at the current
prices and if price index rises from 100 to 200 within this period, then national income at
current prices can be converted into national income at constant prices (at 1981 prices) as
under:
Real national income in the year 1981 =
Real National Income in the year 2001 =200
400 X 100 = 50
Government
Purchases
Income of the
unincorporated
business
Income of the
unincorporated
business
Income of the
unincorporated
business
Income of the
unincorporated
business
Saving
Corporate
Income Taxes
Corporate
Income Taxes
Corporate
Income Taxes
Subsides
Transfer
Payments Personal
Taxes
Social Security
contributions
Social Security
contributions
Social Security
contributions
Gross Private
Domestic
Investment
Undistributed
Corporate profits
Undistributed
Corporate profits
Undistributed
Corporate profits
Indirect Business
Taxes
Indirect Business
Taxes
Subsidies
Net Foreign
Investment
Depreciation Govt’s Surpluses
NI = PG

September
2013 IENGINEERS- CONSULTANTS LECTURE NOTES SERIES MBA SEMESTER 1
MANEGERIAL ECONOMICS UNIT4
Managerial Economics UNIT-2 By: Mayank Pandey
4
By using a G.N.P. Deflator:
GNP deflator =Current Year Price Index
Base Year Price Index
Suppose the current year (2001) price index is 220 while the base year (1981) price index
number is 200, then the GNP deflator is 220
200x= 22/20=11/10=1.1
In order to obtain the real national income or national income of constant prices we divide the
nominal GNP of national income at current prices with the GNP deflator.
Private income
Private income is the income of the private sector obtained from any sources, productive of
otherwise, and the retained income of the corporations.
Private Income includes income from domestic product accruing to the private sector,
transfer earning, undistributed profits and net factor income from abroad.
Private income = Income from Domestic Product Accruing to the Private Sector + Net
Factor Income from Abroad + Net Transfer Payments from the Government + Transfer
Payments from the Rest of the World + Interest on National Debt.
Per Capita Income
Per capita income of a country usually refer to the average earnings or income of an
individual in a particular year in that country. It denotes the income received by an individual
in a certain year in a country. Per capita income is expressed at current prices.
Per Capita Income (2012) =National Income in 2012
Population in 2012
MEASUREMENT OF NATIONAL INCOME
There are three methods of measurement of national income:
1. Product Method of Value Added Method.
2. Income Method.
3. Expenditure Method.
On the basis of these methods, national income so calculated would be identical i.e. gross
national product, gross national income and gross national expenditure is identical.
GNP=GNI=GNE
PRODUCT METHOD OF VALUE ADDED METHOD
This is also known as the ‘Inventory Method’ or ‘Commodity Service Method’. This method
approaches national income from the output side.
INCOME METHOD

September
2013 IENGINEERS- CONSULTANTS LECTURE NOTES SERIES MBA SEMESTER 1
MANEGERIAL ECONOMICS UNIT4
Managerial Economics UNIT-2 By: Mayank Pandey
5
This method approaches national income from the distribution side. In other words, this
method measure the national income after it has been distributed and appears as income
earned of received by individuals of the country. Thus, according to this method, nation
income is obtained by summing up of the incomes of all individuals in the country.
Following the income approach, national income can be measured by aggregating the annual
flows of factor earnings generated by the production of the final output, say good I (Pi Qi) is
also reflected in the sum of the corresponding factor incomes generated, i.e., Pi Qi = Ri + Wi +
Ii + Pi.
Where Ri , Wi , Ii , Pi denotes flow of rent, wages, interest, and profits generated by the
production of good i. it follows, therefore, that national income can be measured as the sum
of annual flow of different types of factor incomes in the economy.
In this approach, payments for factor, viz., wages, salaries, rents, interest and profits are
directly aggregated together to obtain estimates of value added.
EXPENDITURE MEETHOD
This method arrives at national income by adding up all the expenditure made on goods and
services during a year. Income can be spent either on consumer goods or investment goods.
Thus, we can get national income by summing up all consumption expenditure and
investment expenditure made by all individuals as well as the government of a country during
a year. Hence, the gross national product is found by adding up the following.
(a)Personal Consumption Expenditure: What private individual spend on consumer goods
and services.
(b)Gross Domestic Private Investment: What private businesses spend on replacement,
renewals, and new investment.
(c)Net Foreign Investment: What the foreign countries spend on the goods and services of
the national economy over the above what this economy spends on the output of the foreign
countries, i.e., export minus imports.
(d)Government Purchases: What the government spends on the purchase of goods and
services, i.e., government purchases.
NATIONAL INCOME AS A MEASURE OF ECONOMIC WELFARE
Gross National product (GNP) is not a satisfactory measure of economic welfare because the
quantitative estimates of national income do not include certain production activities and
services which definitely affect the overall welfare of the people. Some of these factors not
taken into consideration in computing GNP are as follows:
1. Leisure
2. Quality of Life
3. Non-market Transactions
4. Structure of Production
5. Availability of Essential Consumer Goods

September
2013 IENGINEERS- CONSULTANTS LECTURE NOTES SERIES MBA SEMESTER 1
MANEGERIAL ECONOMICS UNIT4
Managerial Economics UNIT-2 By: Mayank Pandey
6
6. Externalities
DIFFICULTIES IN THE CALCULATION OF NATIONAL INCOME
Although all methods are used almost in all countries to calculate national income, yet the
calculation is a complex affair and is beset with conceptual and statistical difficulties.
Kuznets mentions the following difficulties:
1. Difficulty of Defining the Nation
2. Non-marketing Services
3. Inapplicability of any one Method
4. Which Stage to Choose
5. Paucity of Statistics
6. How to Avoid Double Counting
7. Identification of Transfer Payments
8. Self-consumption Production
9. Multiple Occupations
10. Incorrect Statistics
IMPORTANCE OF NATIONAL INCOME STUDIES
The growing importance of national income studies in recent years is due to the following
reasons:
1. Rate of Economic Growth
2. Economic Welfare of the People
3. Knowledge of the Distribution of National Income
4. Economy’s Structure
5. Standard of Living Comparison
6. Economic policy
7. Economic Planning
8. Distribution of Grants-in –aid
9. Relative Role of Public and Private Sectors
10. Defence and Development
Inflation-
Meaning and Definition
The word inflation is derived from the Latin “Inflare” and means to increase or to balloon.
In economics, inflation is a rise in the general level of prices of goods and services in an
economy over a period of time. When the general price level rises, each unit of currency buys
fewer goods and services.
Types of Inflation:
The following are the types of inflation:

September
2013 IENGINEERS- CONSULTANTS LECTURE NOTES SERIES MBA SEMESTER 1
MANEGERIAL ECONOMICS UNIT4
Managerial Economics UNIT-2 By: Mayank Pandey
7
1- Hyperinflation: An extremely high rate of inflation is known as hyperinflation. It is a
state of galloping inflation. N. Gregory Mankiw has defined Hyperinflation as
“inflation that exceeds 50% per month, which is just over 1% over per day.
2- Suppressed Inflation: Suppressed inflation is a situation where deliberate policies
are pursued to prevent price rises in the present, but it is only a temporary suppression
of inflation.
Deflation: this means a fall in prices, the opposite of inflation.
Disinflation: It refers to the slowing of the rate of inflation, that is, prices are still rising, but
at a slower rate than before. It implies the process of bringing down prices moderately from
their previous higher level.
3- Reflation: It is a term used to denote inflation after a period of deflation, meaning
inflation designed to restore prices to a previous level.
4- Crawling Inflation: Crawling inflation is where inflation is low and which moves up
and down slowly.
Based on its cases or sources, we can identify three kinds of inflation
a. Administered Pricing
b. Demand Pull Inflation
c. Cost Pull Inflation
Administered Pricing: Inflation caused by the revision of prices by the government.
Demand Pull Inflation: Demand-pull inflation arises when aggregate demand outpaces
aggregate supply in an economy.
Cost Pull Inflation: This is because of rise in costs. Cost-push inflation or supply-shock
inflation is a type of inflation caused by large increases in the cost of important goods or
services where no suitable alternative is available.
General Causes of Inflation in India
Following are the main causes of inflation in India:
1. Supply Constraints
2. Demand Accelerators
Following are the main supply constraints because of which prices rise in India:
1. Fluctuation in Agricultural Output
2. Hoarding of Essential Goods
3. Low growth of Industrial Sector
4. Increment in Administered Prices
5. Restriction on Imports
The various factors that have accelerated demand thus have resulted in the increase in prices
are:
1. Growth of Population
2. Increment in Income and Employment
3. Urbanization
Monetary and fiscal factors have also contributed to price rise in the India as they work as
demand accelerations. The following are important reasons in this respect:

September
2013 IENGINEERS- CONSULTANTS LECTURE NOTES SERIES MBA SEMESTER 1
MANEGERIAL ECONOMICS UNIT4
Managerial Economics UNIT-2 By: Mayank Pandey
8
1. Rising Level of Government Spending
2. Deficit Financing
Measurement of Inflation/Price Indices in India
Inflation is measure through various price indices. The following price indices used in India
to measure inflation:
1. GDP Deflator.
2. Consumer Price Indices.
3. Wholesale Price Index.
GDP Deflation: It is the broadest measure of the price level. Gross Domestic Product (GDP)
deflator is the index of the average price for the goods and services produced in the economy.
It includes the price of all finished goods
Consumer Price Indices (CPI): The consumer price Indices (CPI) measure the price of a
selection of goods purchased by a ‘typical consumer’
In India we have three such CPIs:
(i) CPI for Industrial Workers (CPI-W).
(ii) CPI for urban non-manual employees (CPI-UNME).
(iii)CPI for agriculture laborers (CPI-AL).
Whole Price Index: It measures the change in price of a selection of goods at wholesale (i.e.,
typically prior to sales taxes). It includes the prices of raw materials and semi-finished goods,
as well as of imported tangible goods, besides the prices of tangible goods included in the
GDP, if they are transacted at the wholesale level. It excludes the prices of services.
Impact of Inflation
Inflation influences and touches the life of every individual and corporate entity. Hence,
inflation influences the decisions affects our lives in the following ways:
1. Indirect Tex
2. Shoe Leather Costs
3. Menu costs
4. Variability in Relative Prices
5. Negative Impact on Export
6. Change in Yardstick
7. Tax Anomaly
8. Redistribution
9. Reduction in Investment and Saving
10. Vicious Circle of Inflation
Impact of Inflation on Different Groups

September
2013 IENGINEERS- CONSULTANTS LECTURE NOTES SERIES MBA SEMESTER 1
MANEGERIAL ECONOMICS UNIT4
Managerial Economics UNIT-2 By: Mayank Pandey
9
1. Loan Agreements/Future Contract/Future payment
2. Producers and Traders
3. Fixed Income Group
4. Investors
Measures to Control Inflation
Monetary Policy: Inflation can be controlled by controlling the supply of money in the
economy. The central bank, through its monetary policy, can control inflation to a certain
extent. Through various measures like CRR, SLR, Bank Rate, Open Market Operations,
Moral Suasion (for details see chapter of Monetary Policy), etc. the Central bank can increase
or decrease the supply of currency in the economy and thus control inflation to some extent.
Price Controls This vicious circle can be understood from the following equation
(Diagram-1 Showing Vicious Circle)
This can be understood from the following diagram:
Deflation Reduction
in Demand
Low
Production
Unemploymen
t
Vicious Circle of Deflation
Results in widespread Unemployment
Inflation
Demand
Savings
Production Employment

September
2013 IENGINEERS- CONSULTANTS LECTURE NOTES SERIES MBA SEMESTER 1
MANEGERIAL ECONOMICS UNIT4
Managerial Economics UNIT-2 By: Mayank Pandey
10
(Diagram-2 Showing Impact of Mild Inflation)
So thus see that mild inflation is better than no inflation at all. This is true especially
for a country which is in the take off stage of development.
Business Cycles
Meaning and Definition
The term business cycle for trades cycle refers to the fluctuations in reconnecting activity that
occur in as more or less regular time sequence in all capitalist society
According to Prof. Haberler:
“The business cycle in the general sense may be defined as an alternation in the periods of
prosperity and depression of good and bad trade.”
CHARACTERISTICS OF BUSINESS CYCLE
Business Cycle possesses the following characteristics:
1. Cyclical fluctuations are wave-like movements.
2. Fluctuations are recurrent in nature.
3. They are non periodic or irregular.
4. They occur in such aggregate variables as output, income, employment and prices.
5. These variables move at about the same time in same direction but at different rate.
6. The durable goods industries experience relatively wide fluctuations in output and
employment and small fluctuation in price. On the other hand non-durable industries
experience relatively wide fluctuation in price and small fluctuation in output and
employment.
7. Business cycles are not seasonal fluctuations such as upswings in retail trade during
Diwali or Christmas.
8. Trade cycles are not secular trends such as long run growth or decline in economic
activity.
9. Upswing and downswings are cumulative in their effects.
PHASES OF THE BUSINESS CYCLE According to Prof. Schumpeter a trade cycle will have four phases:
1. Expansion or Boom
2. Recession
3. Depression or Trough or Contraction

September
2013 IENGINEERS- CONSULTANTS LECTURE NOTES SERIES MBA SEMESTER 1
MANEGERIAL ECONOMICS UNIT4
Managerial Economics UNIT-2 By: Mayank Pandey
11
4. Recovery
Expansion or Boom
This phase of trade cycle represent the best stage of prosperity. In this stage hectic economic
activities go on and factors of production are put to optimum use. The main characteristics of
this phase are as under:
i. Income or production is the maximum. On account of the interaction of multiplier
and accelerator, increase in income is many times more than that of increase in
investment.
ii. The economy reaches full employment by removing unemployment. Beyond the
stage of full employment, the economy experiences over full employment and hence
rise prices and wages.
iii. Prices rise and wages rate are very high.
iv. Traders and industrialists earn huge profits.
v. There is expansion in bank credit.
vi. There is expansion in consumption expenditure, consequently demand also
increases.
vii. Rate of interest also rises. However, the rise in rate of interest is less than the rise in
rate of profit.
Recession
Under the phase of prosperity, the entrepreneurs make investment in certain ventures which
do not prove to be profitable. The main features of this phase are:
i. There is fall in income, employment and output.
ii. Prices and wages begin to fall.
iii. Since profits fall, there is no new borrowing despite fall in the rate of interest.
iv. There is contraction of bank credit.
v. Fall investment sets in motion the reverse action of the multiplier. Consequently,
income falls many times more than the decline in investment.
vi. Demand of the consumers for various goods also falls.
vii. There is sharp decline in the stock of the goods.
viii. There is a feeling of doubt and fear among the people.
Depression or Contraction

September
2013 IENGINEERS- CONSULTANTS LECTURE NOTES SERIES MBA SEMESTER 1
MANEGERIAL ECONOMICS UNIT4
Managerial Economics UNIT-2 By: Mayank Pandey
12
Once the process of recession starts it becomes almost difficult to stop the trend. Salient
features of this phase are as follows:
i. Level of output and income is low.
ii. Unemployment increases.
iii. Wages, interest, prices and other costs decline.
iv. Volume of profit falls sharply. Hence despite fall in rate of interest, inducement to
invest is very low.
v. Cash reserves with the banks pile up and demand for credit falls.
vi. Old and worn-out machines are not replaced. Hence demand for capital goods falls.
vii. Demand for consumer goods falls.
viii. There is an all-round decline in investment causing reverse action of multiplier and
accelerator.
ix. People grow pessimist and it affects economy adversely.
Recovery
During the phase of depression the entrepreneurs do not even replace machine and other
capital goods. The main features of recovery are as follows:
i. Replacement investment results into increase in income and output.
ii. Employment increases.
iii. Demand for consumption and production goods rises.
iv. Prices begin to rise and there are more profits.
v. Costs increase relatively less.
vi. Investment increases.
vii. Demand for bank loans and advances increases.
viii. Pessimism gives place to optimism.
Features of Different Phases of Business Cycle
Features Phase-I
Expansion or
Boom
Phase-II
Recession
Phase-III
Depression
Phase-IV
Recovery
1. Employment Increase
Increases
Suddenly falls
Falls
Very Low
Falls very low
Slowly Rises
Slowly Rises

September
2013 IENGINEERS- CONSULTANTS LECTURE NOTES SERIES MBA SEMESTER 1
MANEGERIAL ECONOMICS UNIT4
Managerial Economics UNIT-2 By: Mayank Pandey
13
2. Output
3. Wages
4. Prices
5. Interest
6. Bank Credit
7. Cost of
Production
8. Stocks
9. Feelings
Rise
Rise
High
Expands
Rises
Large
Optimism
Fall
Fall Sharply
Begins to fall
Suddenly falls
Falls
Fall
Doubt and
Fear
Fall very low
Fall very low
Very low
Falls low
Falls very low
Fall very low
Pessimism
Begin to Rise
Begins to Rise
Begins to Rise
Begins to
Expand
Begins to Rise
Begins to Rise
Optimism
Features Phase-I
Expansion or
Boom
Phase-II
Recession
Phase-III
Depression
Phase-IV
Recovery
Employment Increase Suddenly falls Very Low Slowly Rises
Output Increases
Falls
Falls very low
Slowly Rises
Wages Rise
Fall
Fall very low
Begin to Rise
Prices Rise
Fall Sharply
Fall very low
Begins to Rise
Interest High
Begins to fall
Very low
Begins to Rise
Bank Credit Expands
Suddenly falls
Falls low
Begins to Expand
Cost of
Production
Rises
Falls
Falls very low Begins to Rise
Stocks Large
Fall
Fall very low
Begins to Rise
Feelings
Optimism Doubt and Fear Pessimism Optimism
Causes of Business Cycle
Economists have given various causes of business cycles. Some attributes them to monetary
and non-monetary factors while others to psychological factors. Samuelson attributes
business cycles to external and internal factors.
External Factors
September
2013 IENGINEERS- CONSULTANTS LECTURE NOTES SERIES MBA SEMESTER 1
MANEGERIAL ECONOMICS UNIT4
Managerial Economics UNIT-2 By: Mayank Pandey
14
The external factors emphasize the causes of business cycles in the fluctuations of something
outside of the economic system. Such external factors are:
sunspots,
wars,
revolutions,
political events,
gold discoveries,
growth rate of population,
migrations,
discoveries of new land and
resources,
Scientific and technological
discoveries and
innovations.
These outside factors change the level of national income by affecting either the investment
or consumption component of aggregate demand.
Internal Factors The internal factors related to mechanisms within the economic system itself which will give
rise to self generating business cycles, so that every expansion will breed recession and
contraction, and every contraction will in turn breed revival and expansion, in the regular,
repeating, never-ending chain. Internal factors divided into monetary and non-monetary
which we explain as follows:
i. Bank Credit
ii. Over-Saving or Under
Consumption
iii. Over Investment
iv. Competition
v. Psychological Causes
vi. Innovations
MINIMIZING EFFECTS OF BUSINESS CYCLES
The methods employed by businessmen to avoid or minimize the ill-effects of the business
cycle fall into two general categories:
I. Preventive Measures
The various preventive measures are given below:
1. Conserving assets during expansion, avoiding undue increase in plant and equipment,
and in dividends.
2. Managing plant in such a way as to-
(a) Avoid decrease in unit production;
(b) Avoid increase in unit overheads; and
(c) Maintain satisfactory labour conditions and steady employment throughout the
year.
3. Avoiding excessive inventories of raw materials, materials in process, and finished
products.
4. Avoiding purchase commitments in excess of financial resources.
5. Avoiding excessive sales which result in cancellations.
6. Employing a flexible credit standard which may be tightened during expansion and
relaxed during contraction.

September
2013 IENGINEERS- CONSULTANTS LECTURE NOTES SERIES MBA SEMESTER 1
MANEGERIAL ECONOMICS UNIT4
Managerial Economics UNIT-2 By: Mayank Pandey
15
II. Relief Measures
Of the various measures employed to mitigate the effect of contraction, the following are
worth mentioning:
1. Quick liquidation of inventories.
2. Reduction of costs of manufacture, both direct and indirect.
3. Improvement of quality to enhance demand.
4. Adoption of selling methods based on accurate analysis of the new situation.
5. Development of plant and organization for future business.
6. Part-time operation.
7. Utilization of profits gained in good times for payments to out-of-work employees.
8. Launching new merchandise lines during slack periods. Plans for these new lines are
perfected before the contraction arrives, so that the plant is ready to begin production
at once when the occasion calls for it. Such a policy is particularly appropriate for a
concern manufacturing novelties.
9. Transference of employees from on department to another during contraction. If such
a versatile labour force has been secured. Some of the worst effects of contraction on
the manufacturing firm can be avoided during depression. Such a move not only
benefits the firm concerned but also hastens recovery as a whole through the
maintenance of purchasing power among the working population.