Embed Size (px)
Citation preview
Unit 4: Measuring economic performance

Macroeconomics is the study of the large economy as a whole. It is the study of the big picture.• Instead of analyzing one consumer, we analyze everyone. • Instead of one business we study all businesses.
What is Macroeconomics?
Why study the whole economy?• Macro was created to:
1. Measure the health of the whole economy.
2. Guide government policies to fix problems.
2
1. Promote Economic Growth2. Keep Prices Stable (Limit Inflation)
3. Limit unemployment
In this unit we will analyze how each of these are measured.
For all countries there are three major economic goals:
3

Stats used to measure economic performance:
• 1. Gross domestic product
• 2. productivity
• 3. inflation
• 4. unemployment
Gross Domestic Product
Most important stat used to measure ECONOMC GROWTH!!! 5
GDP
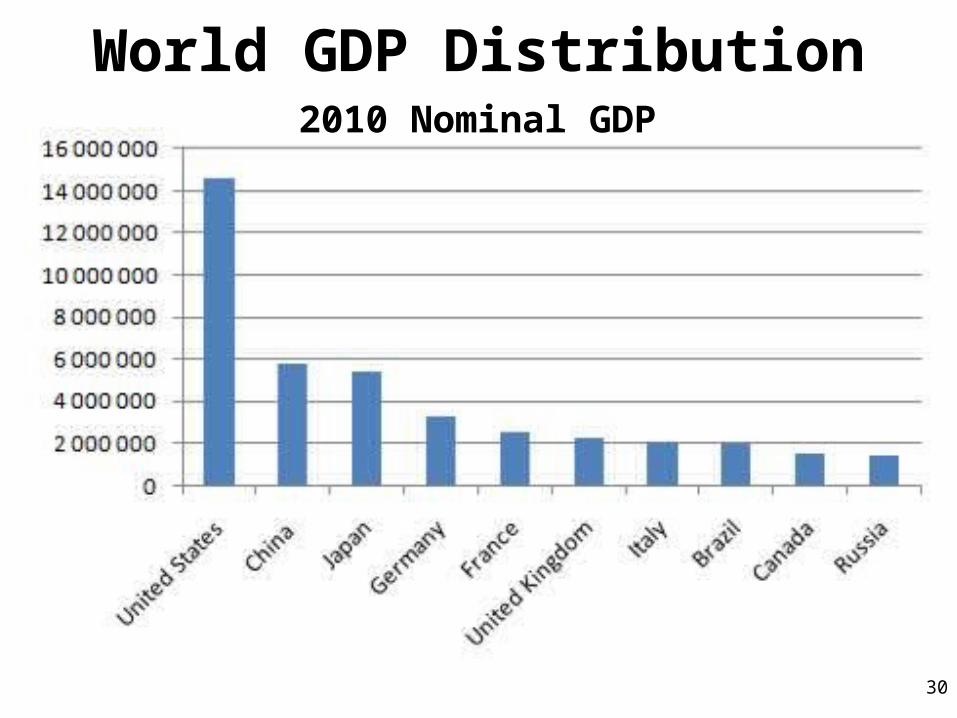
• GROSS DOMESTIC PRODUT (GDP) =
dollar value of all final goods and services produced within a country’s borders in one year.
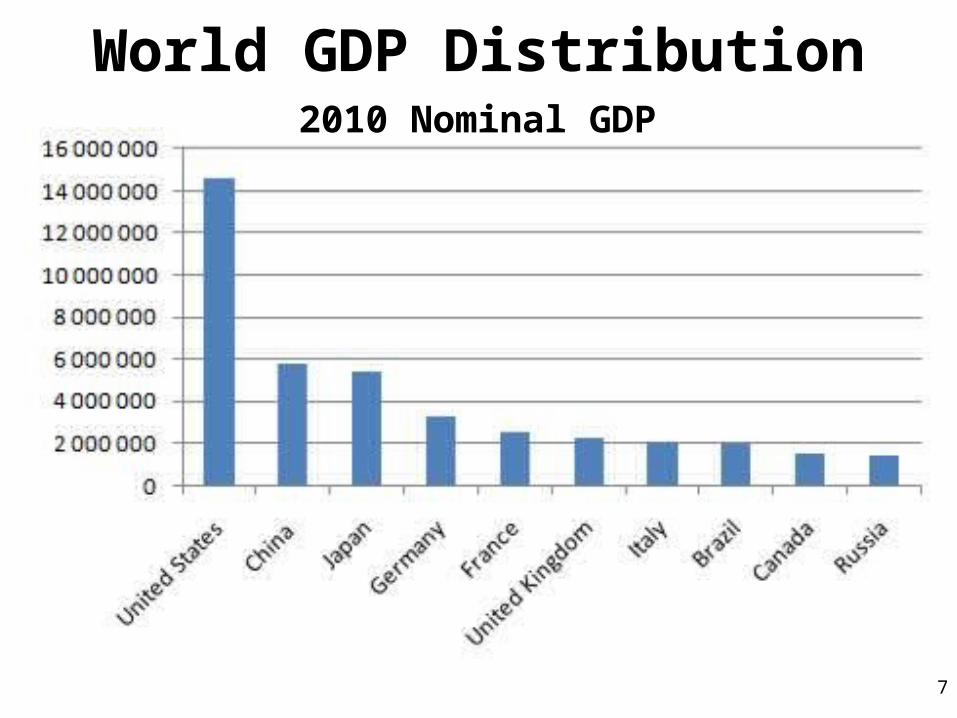
World GDP Distribution
7
2010 Nominal GDP
GDP expenditure approach
• Adds up the value of spending in an economy in one year
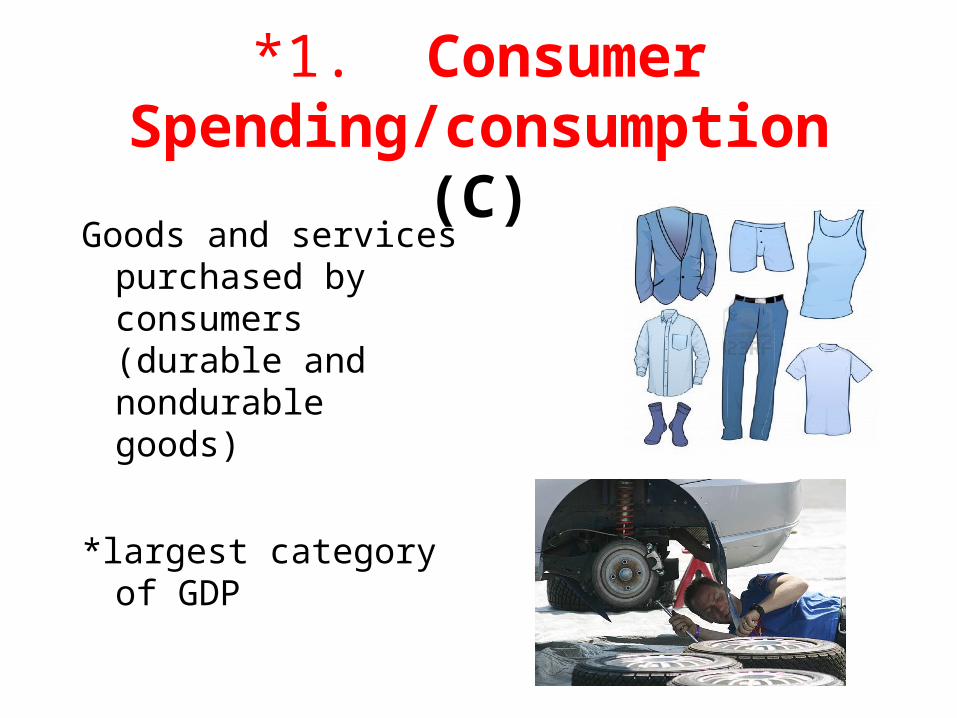
*1. Consumer Spending/consumption (C)
Goods and services purchased by consumers (durable and nondurable goods)
*largest category of GDP
2. Investment (I)spending
• When businesses put money back into their own business
Includes spending on:
Capital resources
Construction
Inventory

Equipment, machinery,
factories etc
Capital resources

Construction
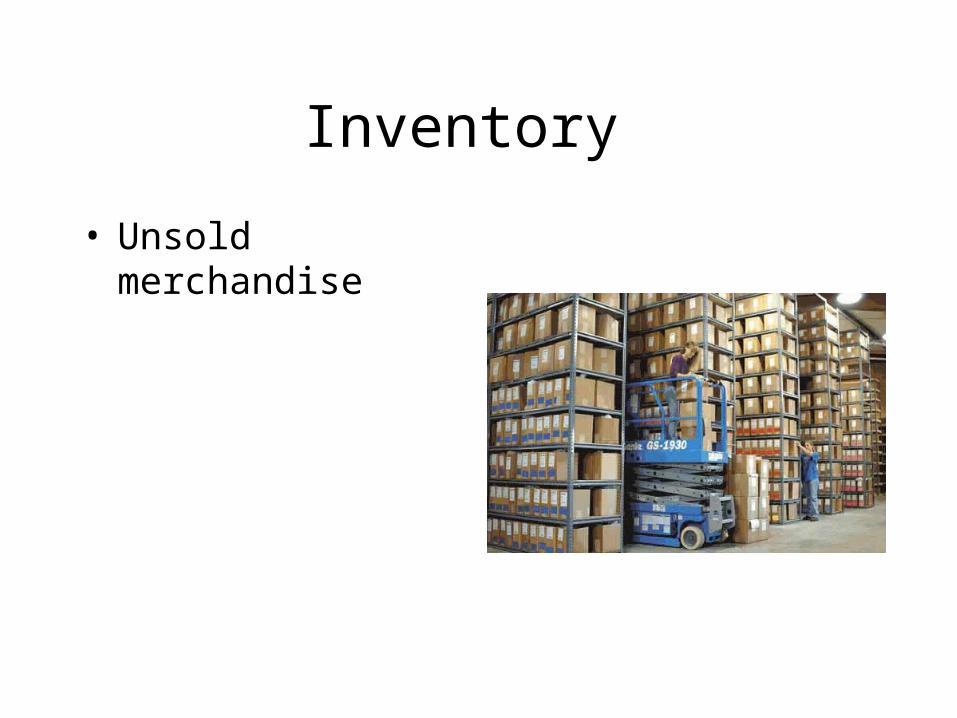
• Unsold merchandise
Inventory
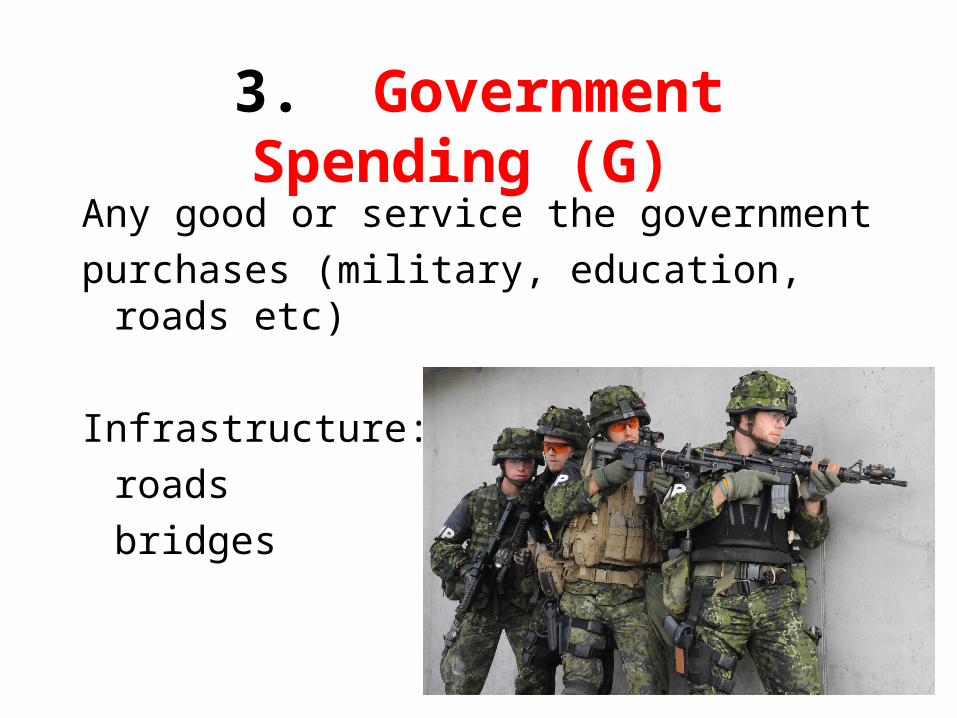
3. Government Spending (G)
Any good or service the government
purchases (military, education, roads etc)
Infrastructure:
roads
bridges
4. Net Exports (Xn) spending
Spending on TOTAL exports
Exports vs. Imports
• Exports
items made in the US and sold to another country
• Imports
items made in another country and sold to the US
Imports are counted in
The GDP, but
NEGATIVELY!!
Formula for GDP (expenditure approach)
GDP = C + I + G + XN
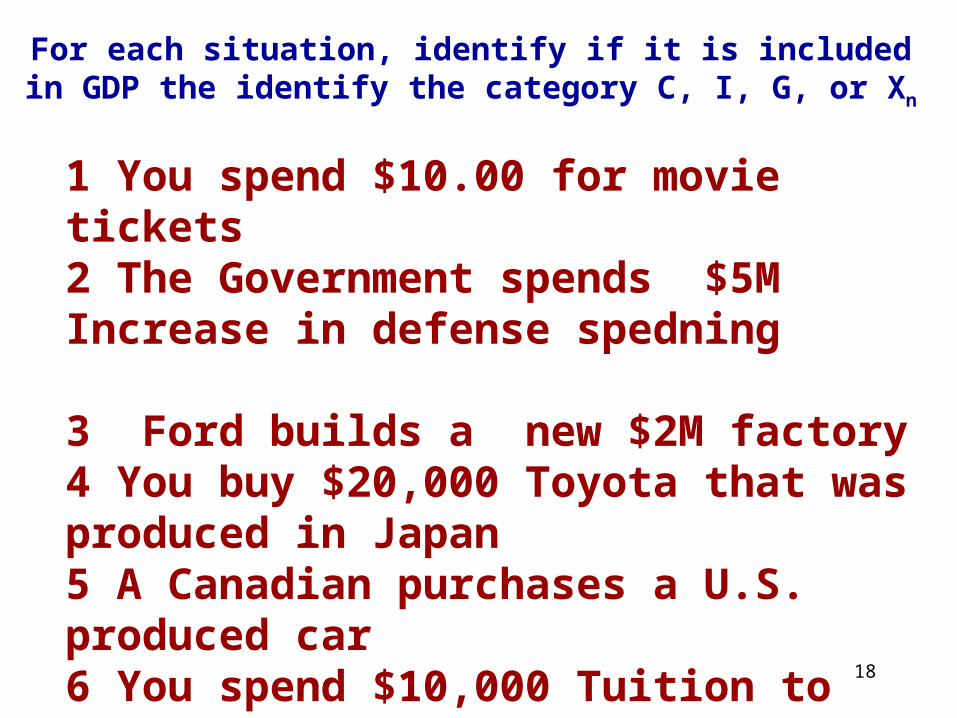
For each situation, identify if it is included in GDP the identify the category C, I, G, or Xn
1 You spend $10.00 for movie tickets2 The Government spends $5M Increase in defense spedning 3 Ford builds a new $2M factory4 You buy $20,000 Toyota that was produced in Japan 5 A Canadian purchases a U.S. produced car 6 You spend $10,000 Tuition to attend college7 A Farmer purchases new $100K tractor18
Things excluded in expenditure approach:
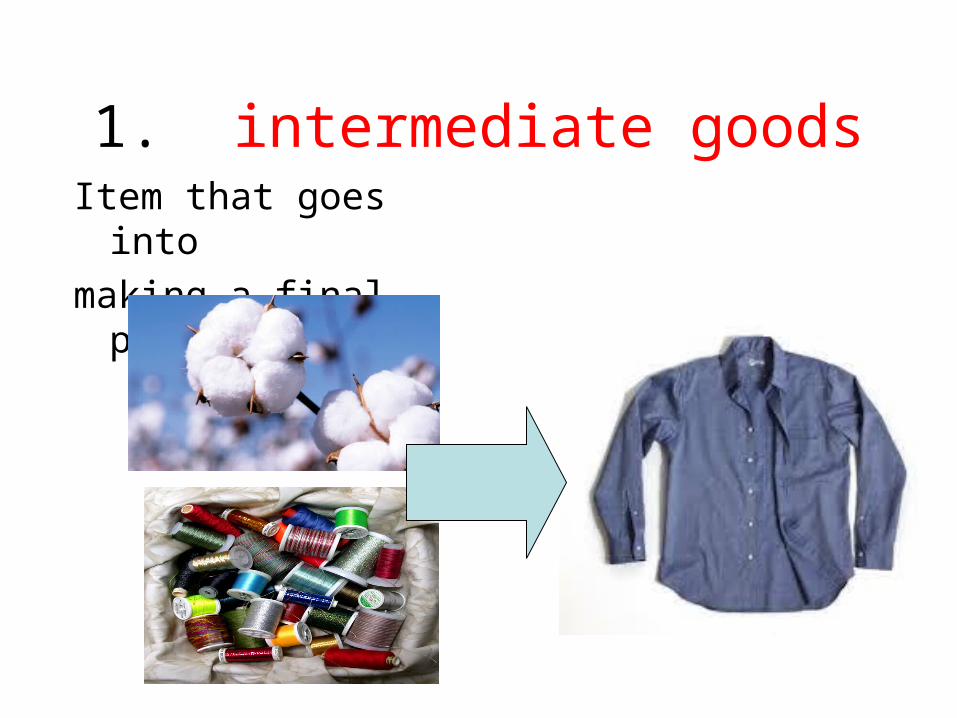
1. intermediate goodsItem that goes into
making a final product
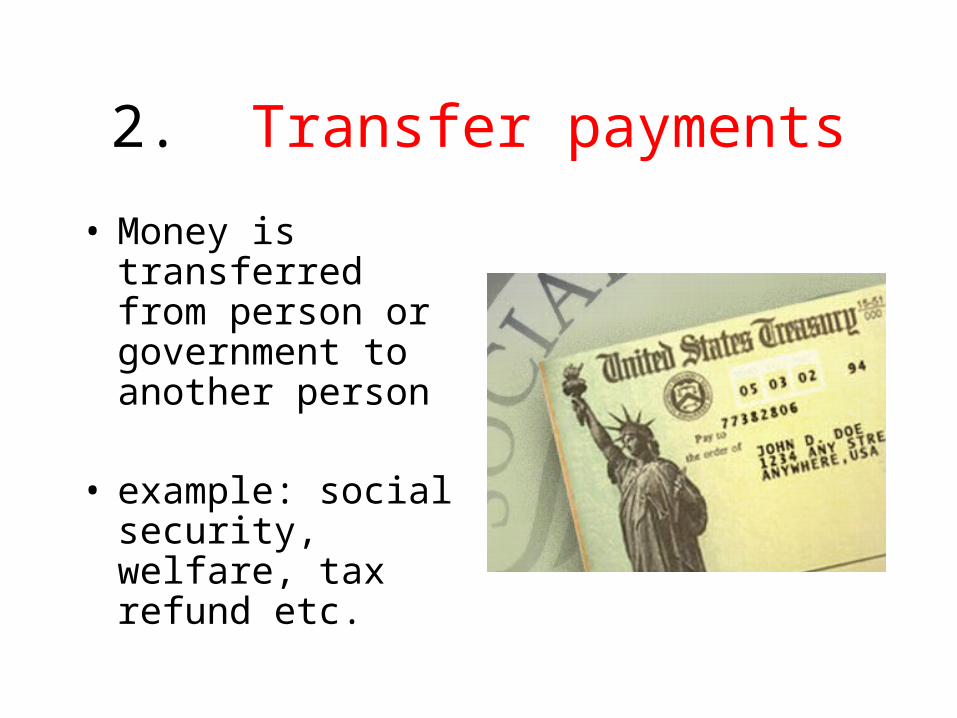
2. Transfer payments
• Money is transferred from person or government to another person
• example: social security, welfare, tax refund etc.

3. donations and gifts
4. Financial transactions
Include things like:
Buying and selling of stock
One business buying another
5. used items
6. illegal sales
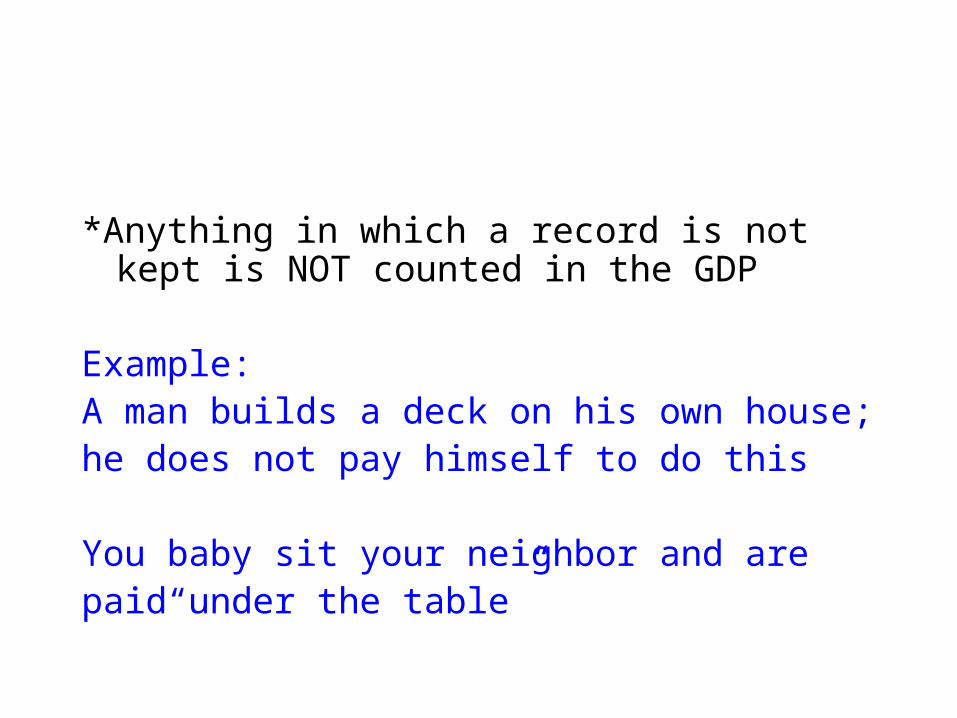
*Anything in which a record is not kept is NOT counted in the GDP
Example: A man builds a deck on his own house;he does not pay himself to do this
You baby sit your neighbor and arepaid“under the table”
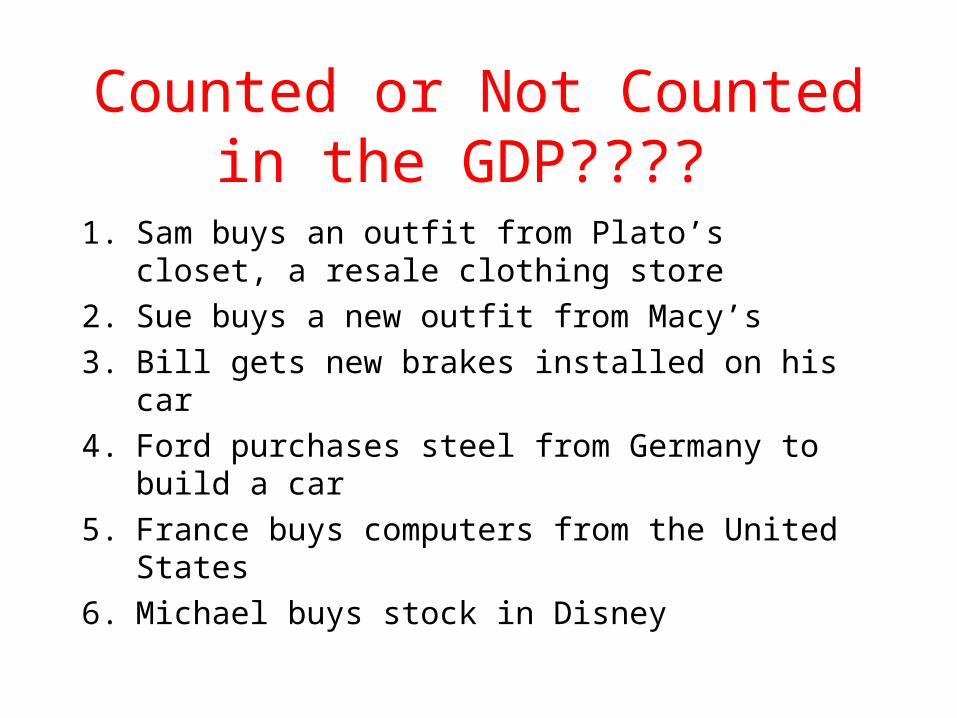
Counted or Not Counted in the GDP????
1. Sam buys an outfit from Plato’s closet, a resale clothing store
2. Sue buys a new outfit from Macy’s
3. Bill gets new brakes installed on his car
4. Ford purchases steel from Germany to build a car
5. France buys computers from the United States
6. Michael buys stock in Disney
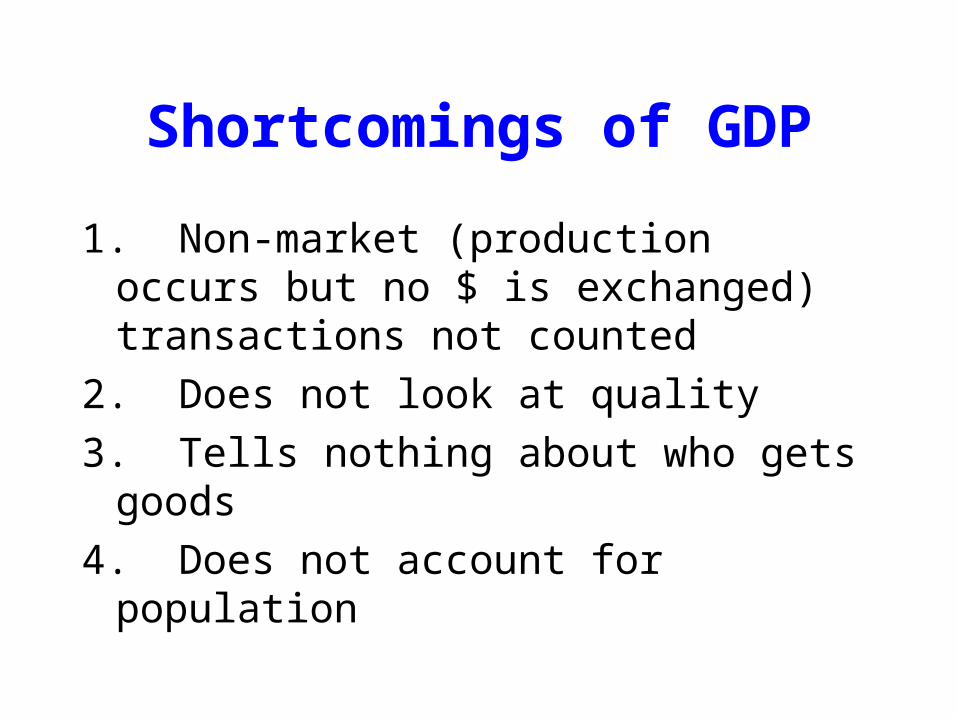
Shortcomings of GDP
1. Non-market (production occurs but no $ is exchanged) transactions not counted
2. Does not look at quality
3. Tells nothing about who gets goods
4. Does not account for population
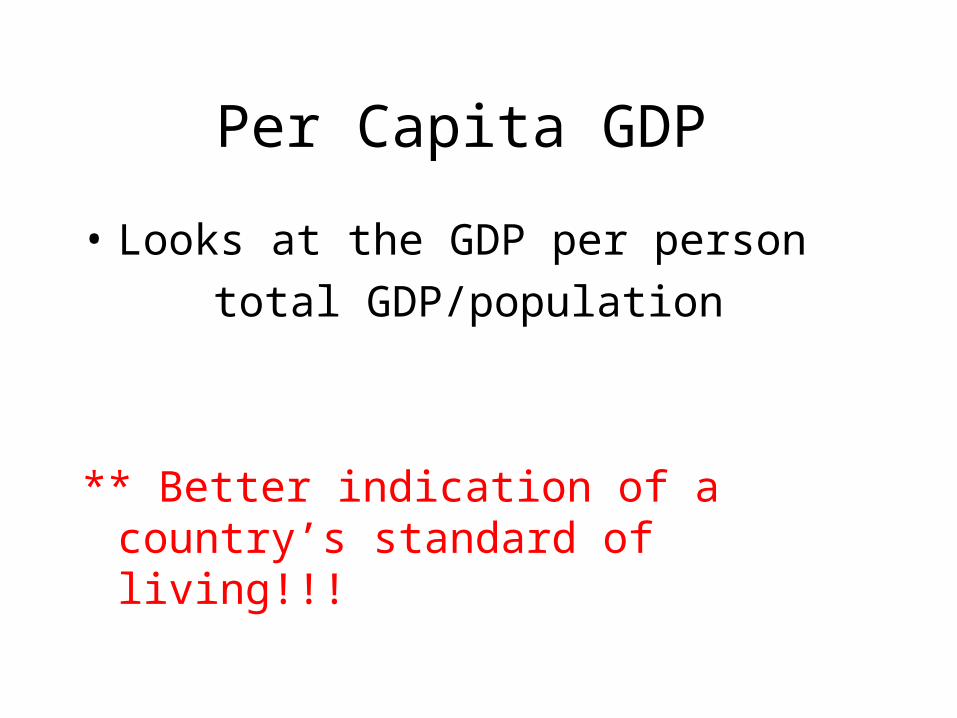
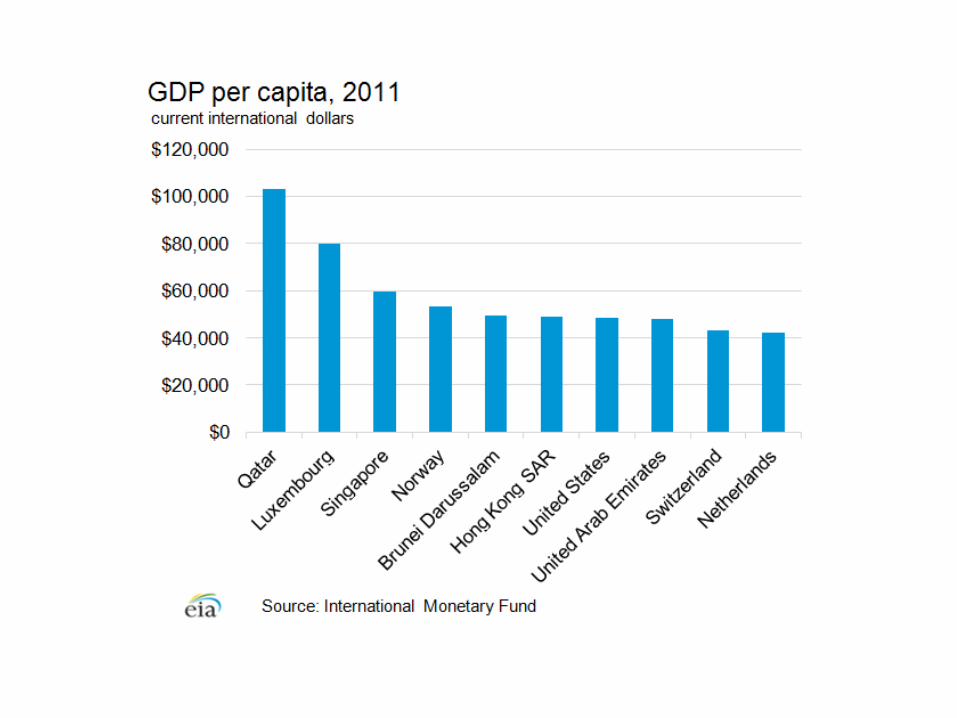
Per Capita GDP
• Looks at the GDP per person
total GDP/population
** Better indication of a country’s standard of living!!!
World GDP Distribution
30
2010 Nominal GDP
Topic 2: Interpreting GDP Statistics
GDP measures growth or lack of growth of an
economy
Business Cycle
Calculating GDP over severalyears results in a Business Cycle = ups and downs of the economy
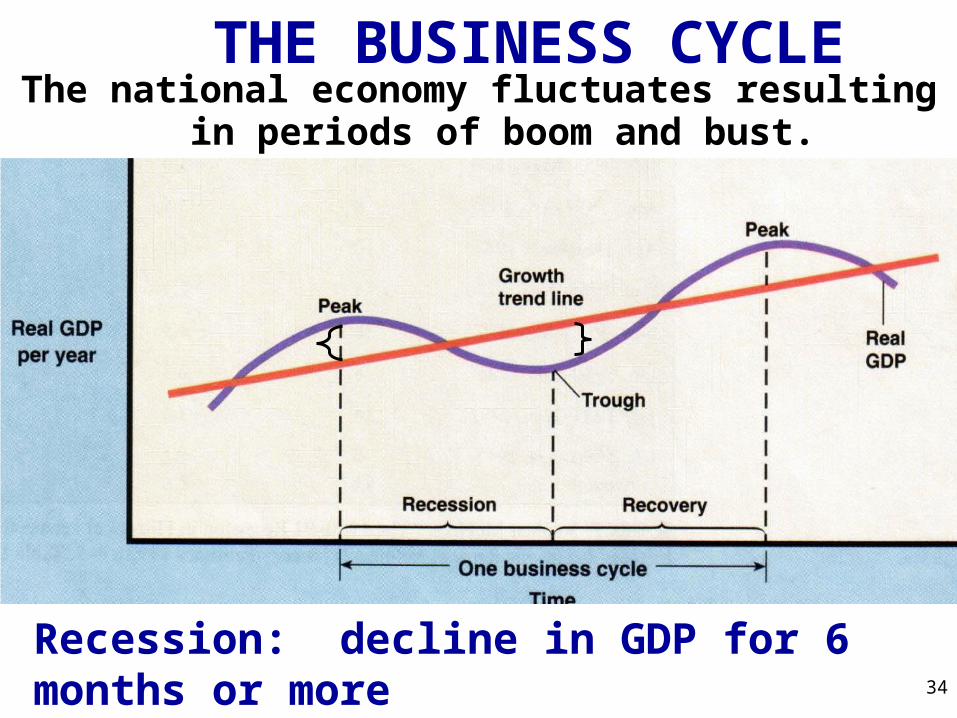
THE BUSINESS CYCLEThe national economy fluctuates resulting in periods of
boom and bust.
34
Recession: decline in GDP for 6 months or more
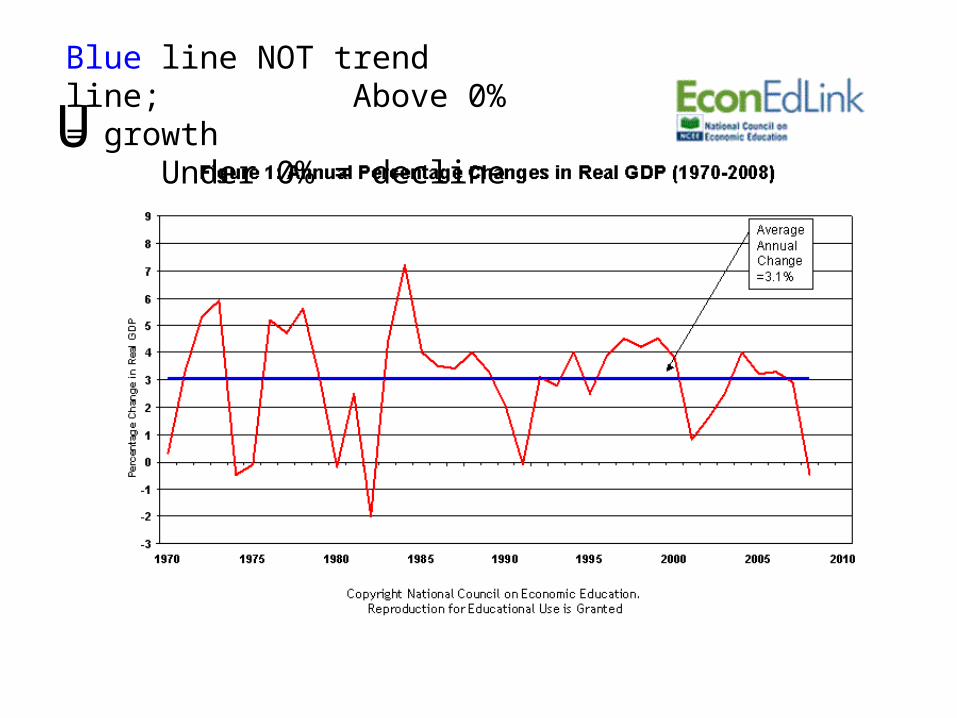
U.S. Business Cycle Blue line NOT trend line;
Above 0% = growth Under 0% = decline
36
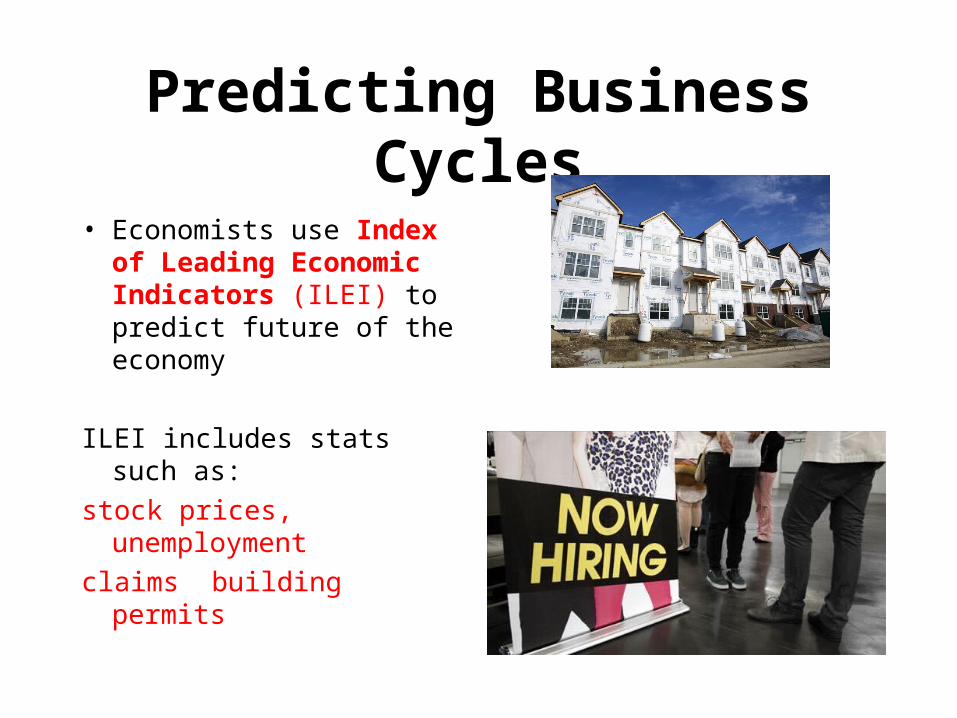
Predicting Business Cycles
• Economists use Index of Leading Economic Indicators (ILEI) to predict future of the economy
ILEI includes stats such as:
stock prices, unemployment
claims building permits
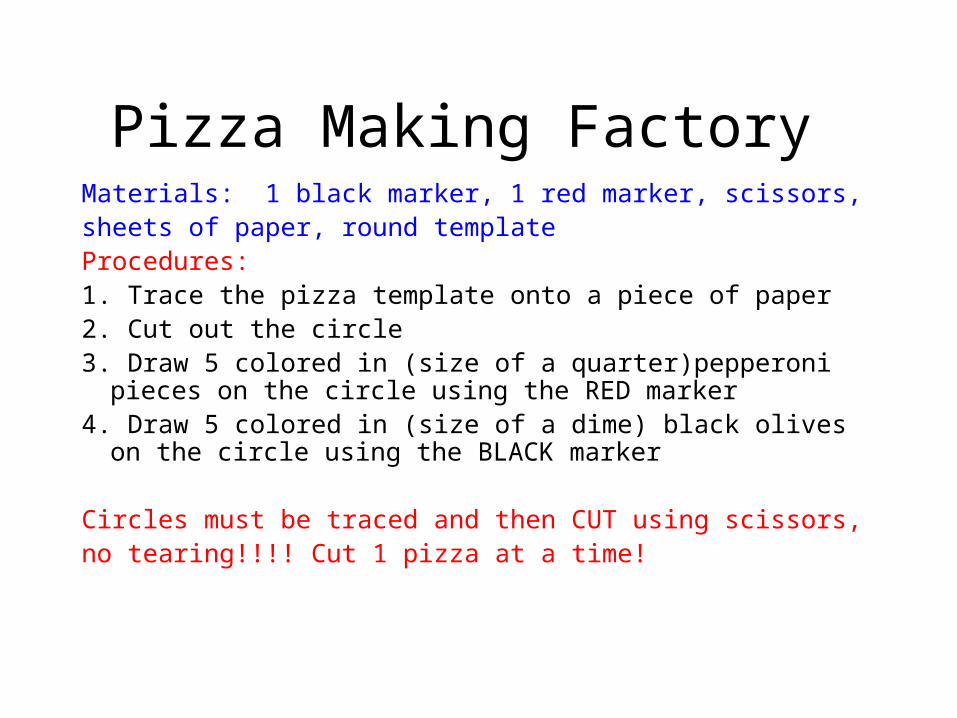
Pizza Making Factory Materials: 1 black marker, 1 red marker, scissors,sheets of paper, round templateProcedures: 1. Trace the pizza template onto a piece of paper2. Cut out the circle 3. Draw 5 colored in (size of a quarter)pepperoni pieces on the circle
using the RED marker4. Draw 5 colored in (size of a dime) black olives on the circle using
the BLACK marker
Circles must be traced and then CUT using scissors,no tearing!!!! Cut 1 pizza at a time!
Pizza Making Factory
1. What happened to productivity (line 10) from round 1 to round 3? Why?
2. What happened to the quality of the pizzas from round 1 to 3? Why?
3. What effect did productivity have on the average cost of a pizza (line 8)?
Why is this important???

Topic 3: Productivity
Number of goods/ services that a worker can
produce for each hour of work
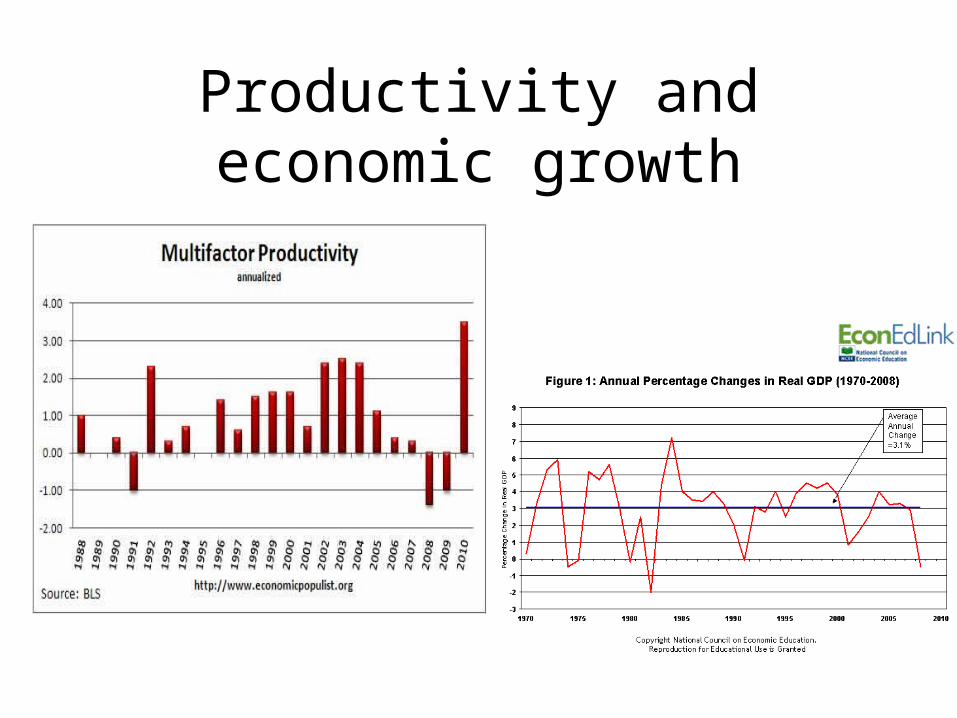
Productivity and economic growth
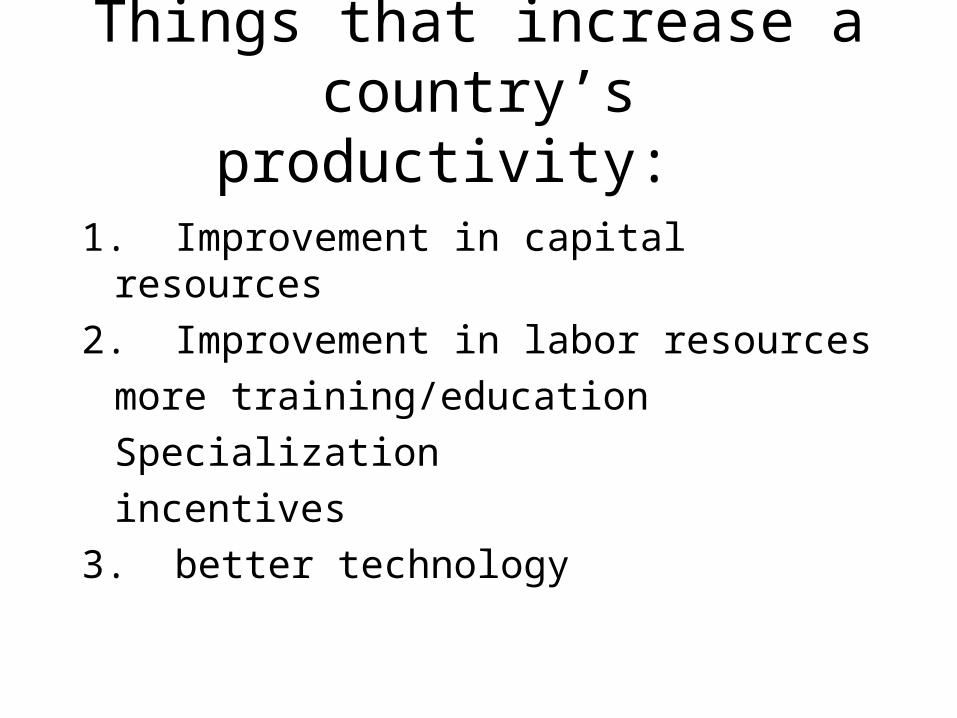
Things that increase a country’s productivity:
1. Improvement in capital resources
2. Improvement in labor resources
more training/education
Specialization
incentives
3. better technology
Topic 4: Inflation
Increase in the economy’s overall price level
(does not mean all prices are rising, prices rise
unevenly)
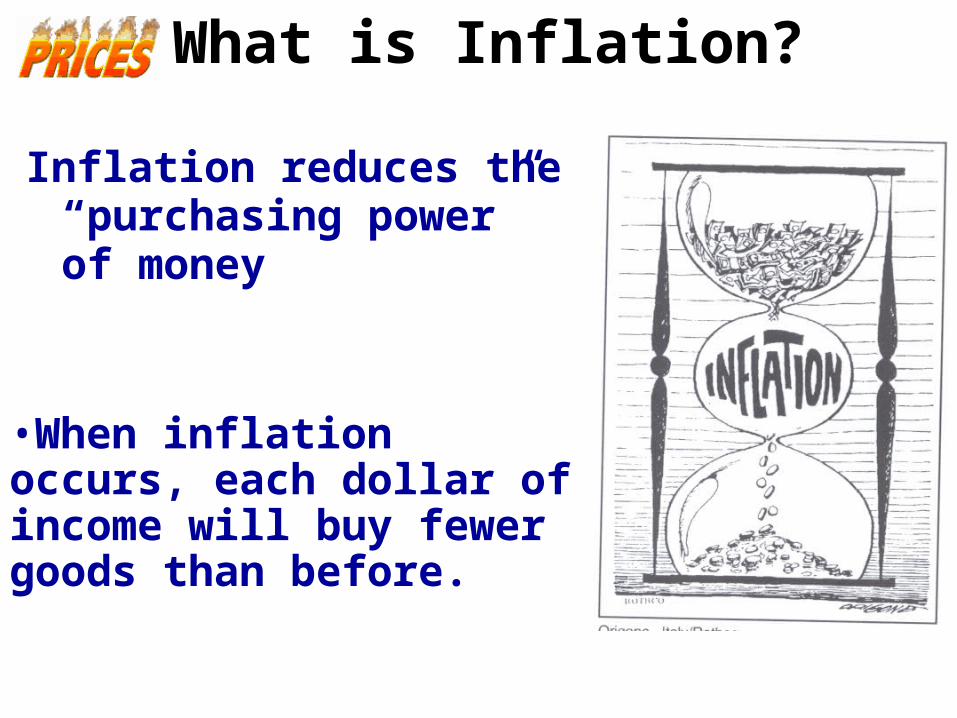
What is Inflation?
Inflation reduces the “purchasing power” of money
•When inflation occurs, each dollar of income will buy fewer goods than before.
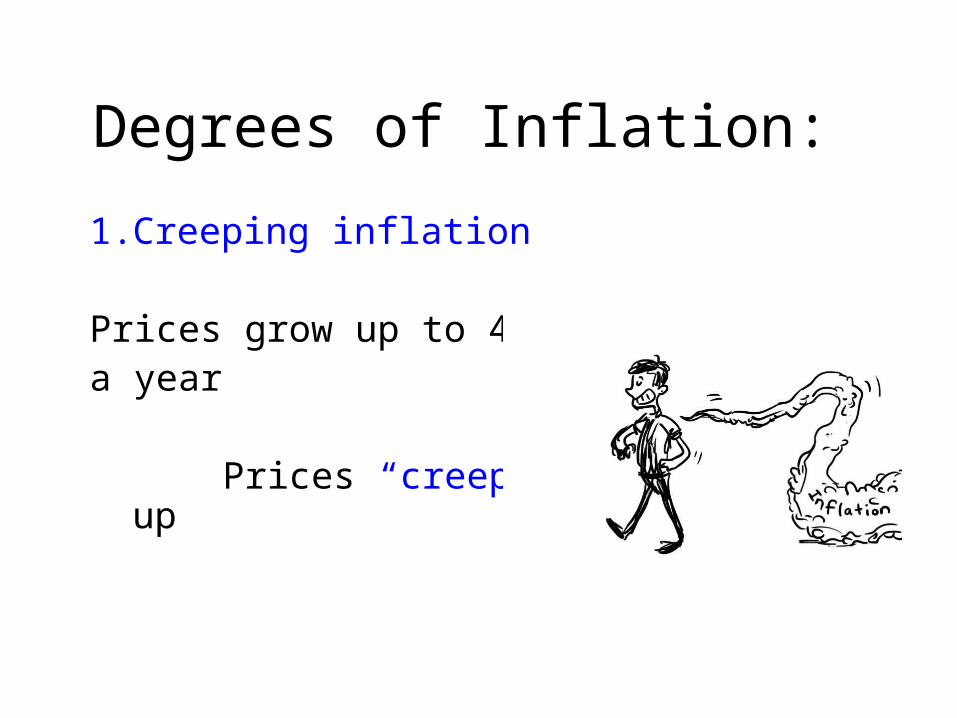
Degrees of Inflation:
1. Creeping inflation
Prices grow up to 4%a year
Prices “creep” up
2. Galloping
Price level DOUBLES in a year
3. Hyperinflation
Prices increase 500% a year or more
“Ducktales – inflation”


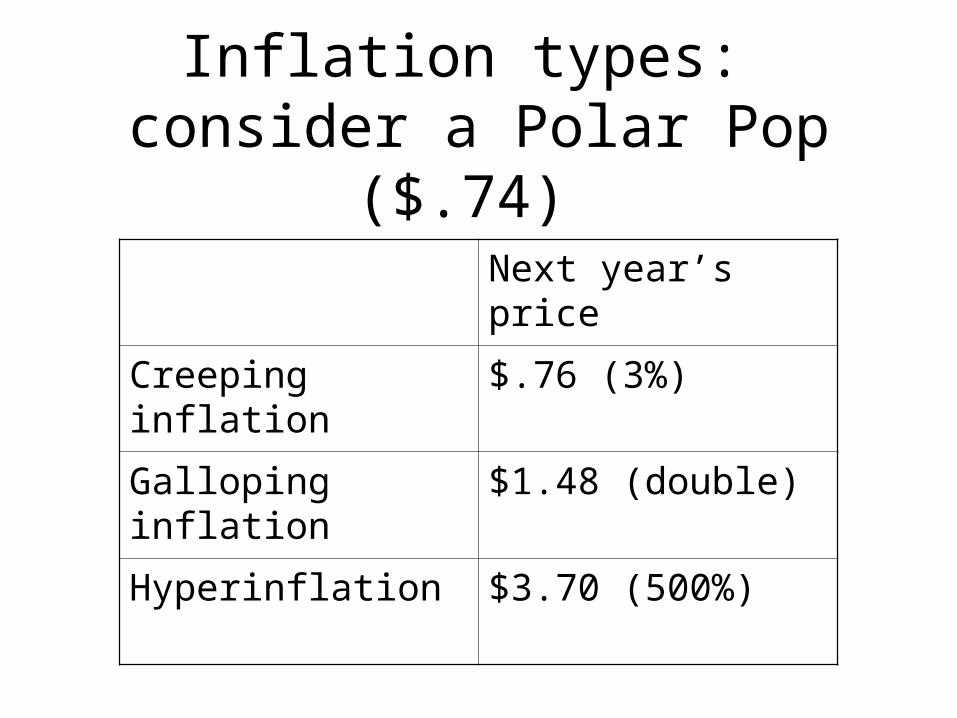
Inflation types: consider a Polar Pop ($.74)
Next year’s price
Creeping inflation $.76 (3%)
Galloping inflation $1.48 (double)
Hyperinflation $3.70 (500%)
Measuring Inflation
1. Consumer Price Index (CPI)
Index used to measure INFLATION
CPI looks at a consumer market basket of goods such as food, clothing, transportation, entertainment & medical care
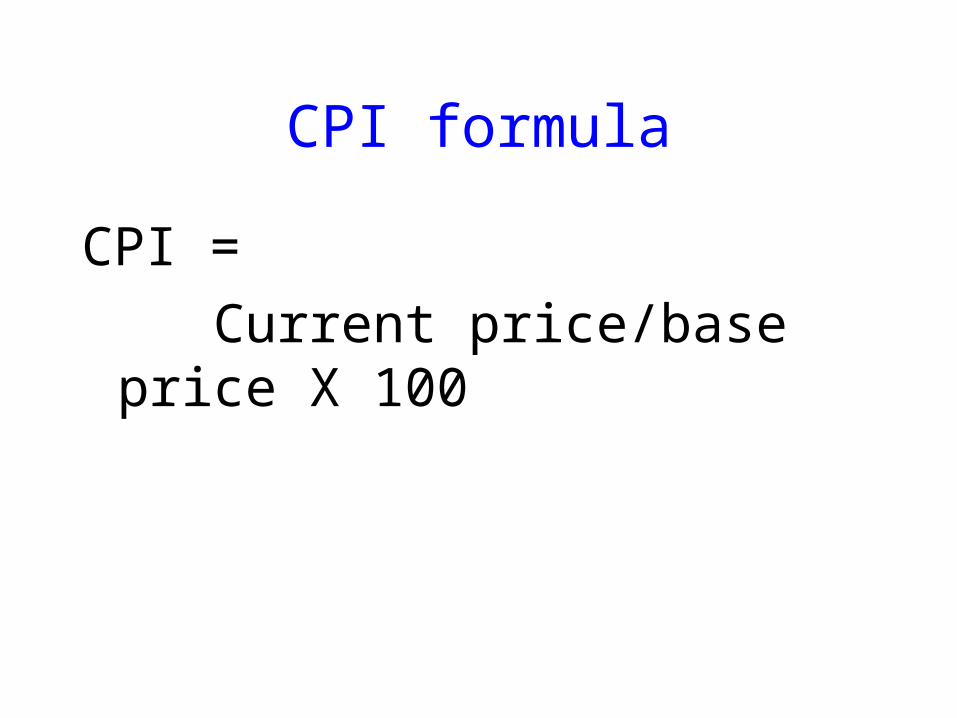
CPI formula
CPI =
Current price/base price X 100

CPI exampleYear Price of
bread CPI - using 2000 as base
2000 $1.19
2002 $1.32
2006 $1.49
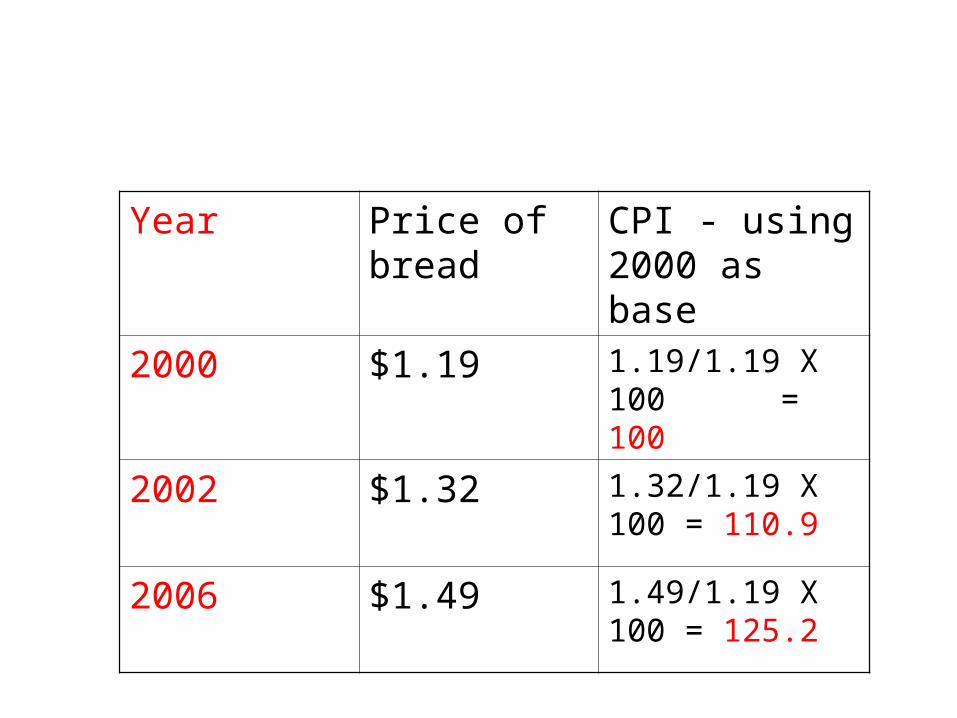
Year Price of bread
CPI - using 2000 as base
2000 $1.19 1.19/1.19 X 100 = 100
2002 $1.32 1.32/1.19 X 100 = 110.9
2006 $1.49 1.49/1.19 X 100 = 125.2
CPI info.
• To find % rate of change in inflation, take the CPI and subtract 100 from it
• Base year will always have a CPI of 100
Adjusting numbers for inflation
• To be able to compare the value of items or statistics, they must be adjusted for inflation– WHY?? Prices increases over the years; a
2012 statistic would always be more than a 2011, 2005 1990 etc. statistic because prices have increased during that time period
Example of adjusting for inflation (highest grossing movies in U.S. history)
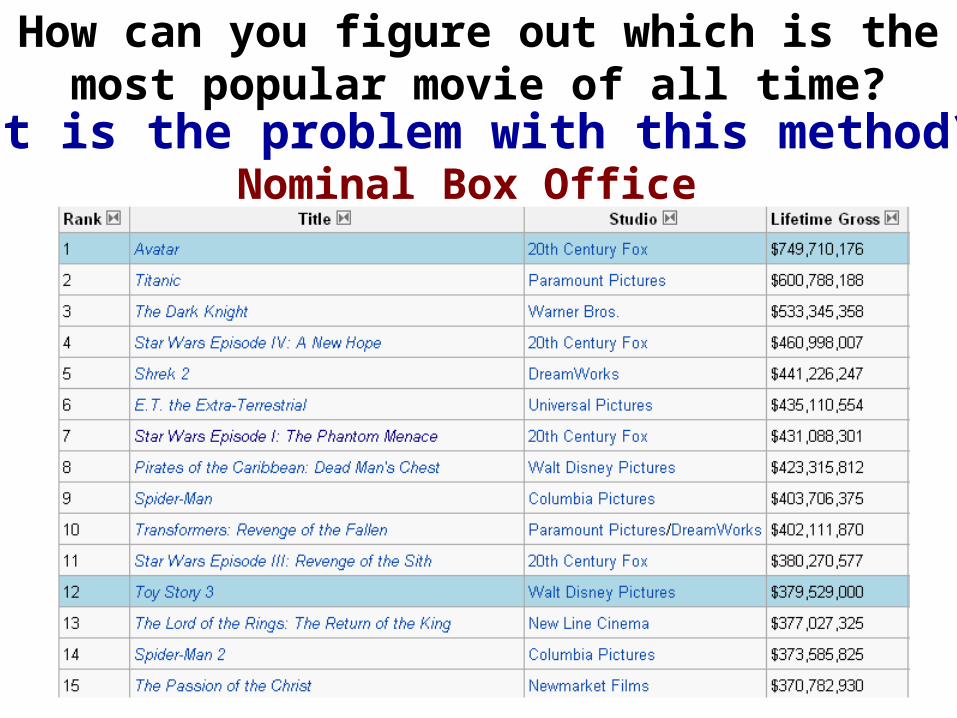
How can you figure out which is the most popular movie of all time?
What is the problem with this method? Nominal Box Office Receipts
63

How can you figure out which is the most popular movie of all time?
Real Box Office Receipts (adjusted for inflation)

Did the economy below actually grow???
If apples are the only thing being producedYear 1: 10 apples at $1 each; GDP = $10$10
Year 2: 10 apples x $2.00; GDP = $20$20 65
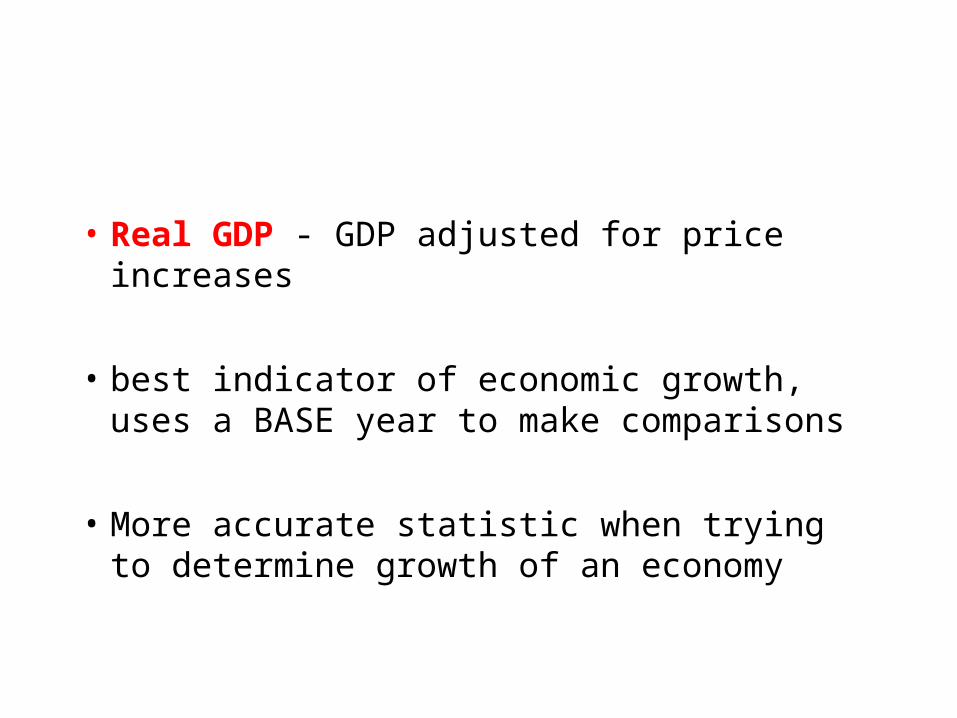
• Real GDP - GDP adjusted for price increases
• best indicator of economic growth, uses a BASE year to make comparisons
• More accurate statistic when trying to determine growth of an economy

• GDP deflator
removes the effects of inflation from the GDP
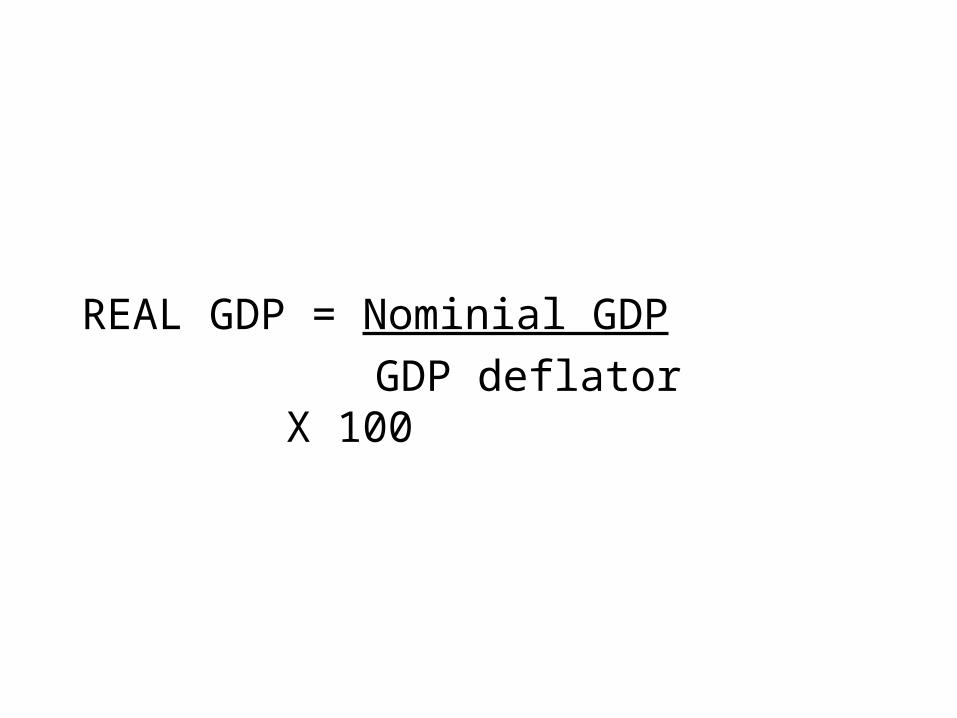
REAL GDP = Nominial GDP
GDP deflator X 100
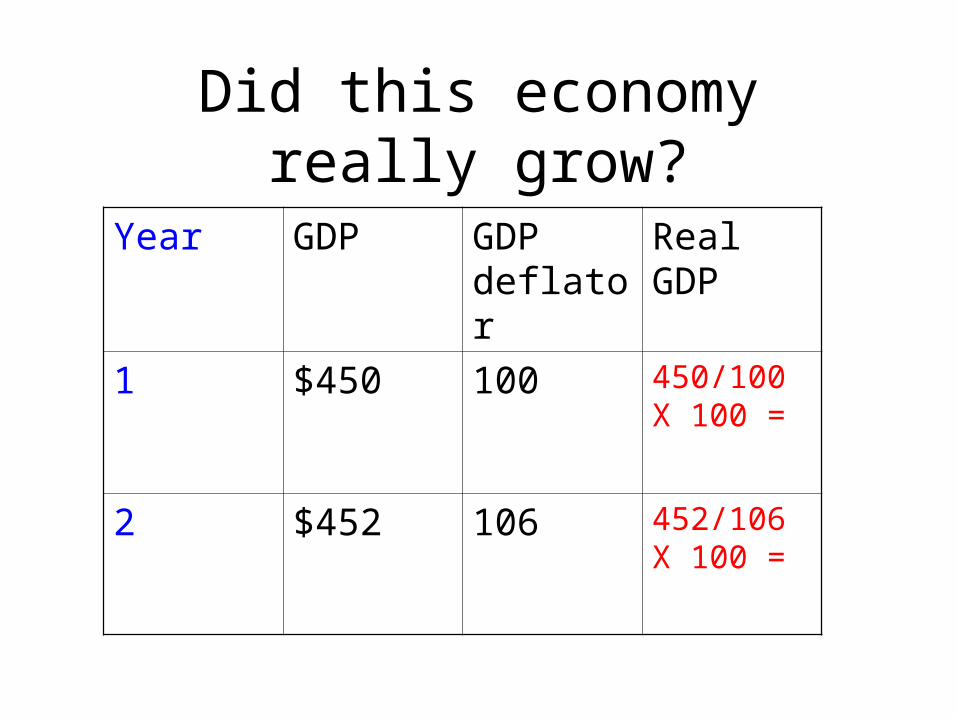
Did this economy really grow?
Year GDP GDP deflator
Real GDP
1 $450 100 450/100 X 100 =
2 $452 106 452/106 X 100 =

Example of Real GDP
Year GDP GDP
deflator
Real GDP
1 $450 100 $450
2 $452 106 $426
Once real GDP is calculated it shows the economy did not really grow from year 1
Rule of 70
Can find the # of years it will take for
prices to double
Take % increase in prices and divide into 70
How long will it take for prices to double if prices increase by 3% a year:
70/3 = 23 years
Does GDP accurately measure standard of living?
Real GDP per capita is the best measure of anation’s standard of living.
Real GDP per capita is real GDP divided by the total population.
73
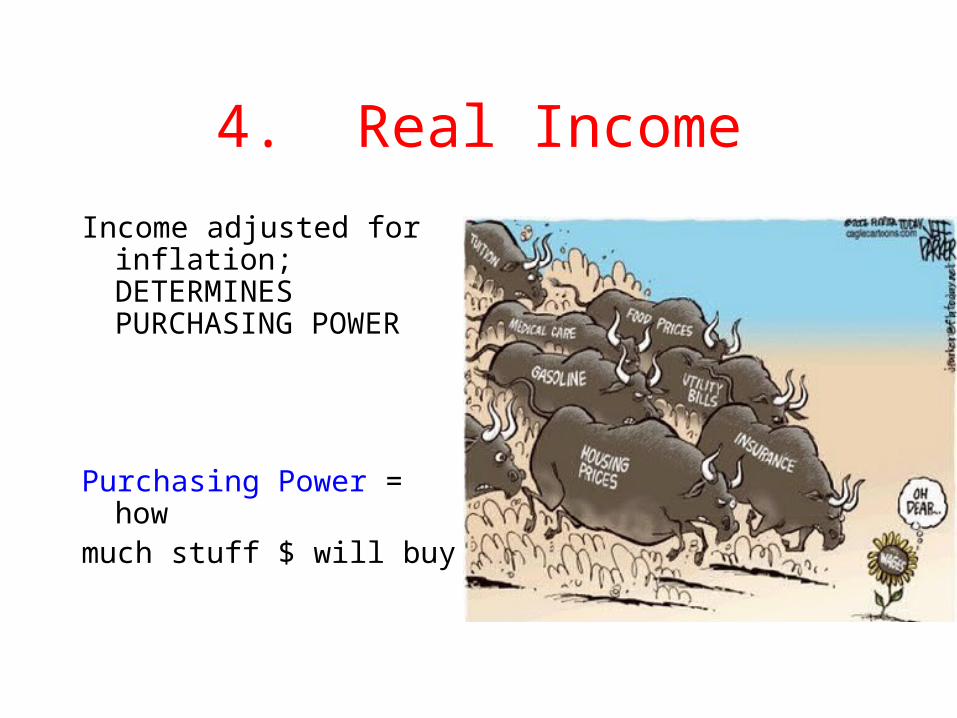
4. Real Income
Income adjusted for inflation; DETERMINES PURCHASING POWER
Purchasing Power = howmuch stuff $ will buy
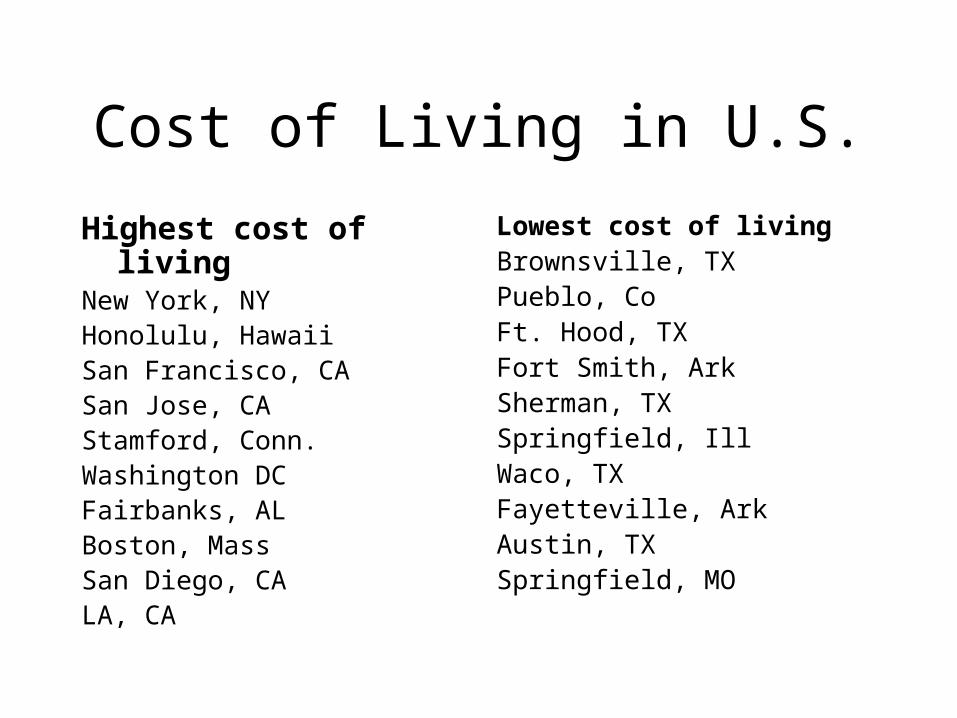
Cost of Living in U.S.
Highest cost of livingNew York, NY Honolulu, HawaiiSan Francisco, CA San Jose, CAStamford, Conn.Washington DCFairbanks, AL Boston, MassSan Diego, CALA, CA
Lowest cost of livingBrownsville, TXPueblo, CoFt. Hood, TXFort Smith, ArkSherman, TX Springfield, IllWaco, TX Fayetteville, Ark Austin, TXSpringfield, MO
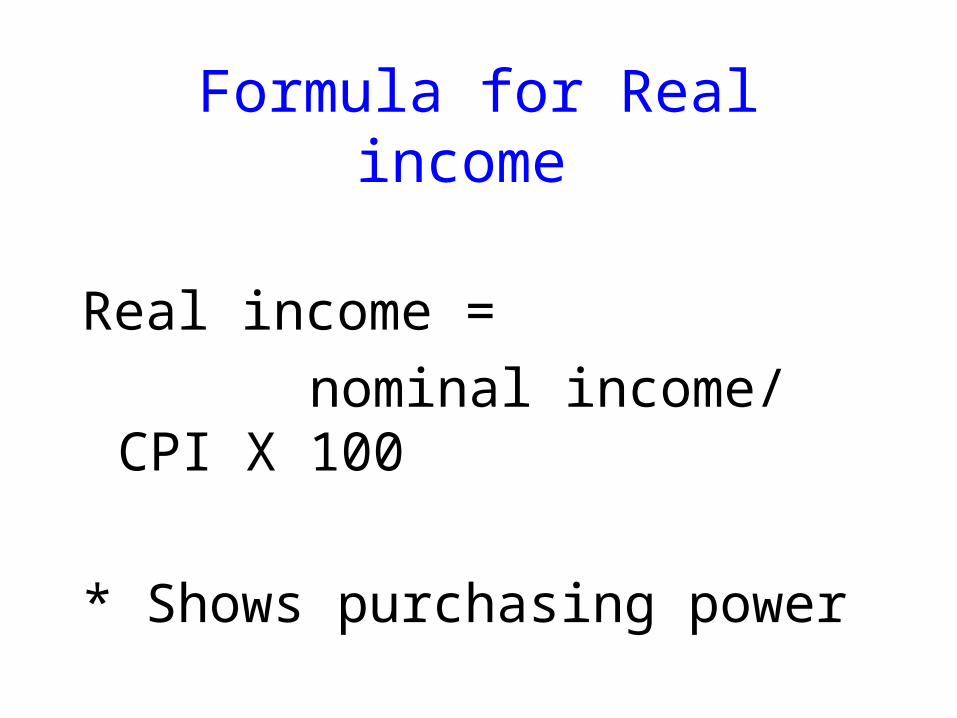
Formula for Real income
Real income =
nominal income/ CPI X 100
* Shows purchasing power
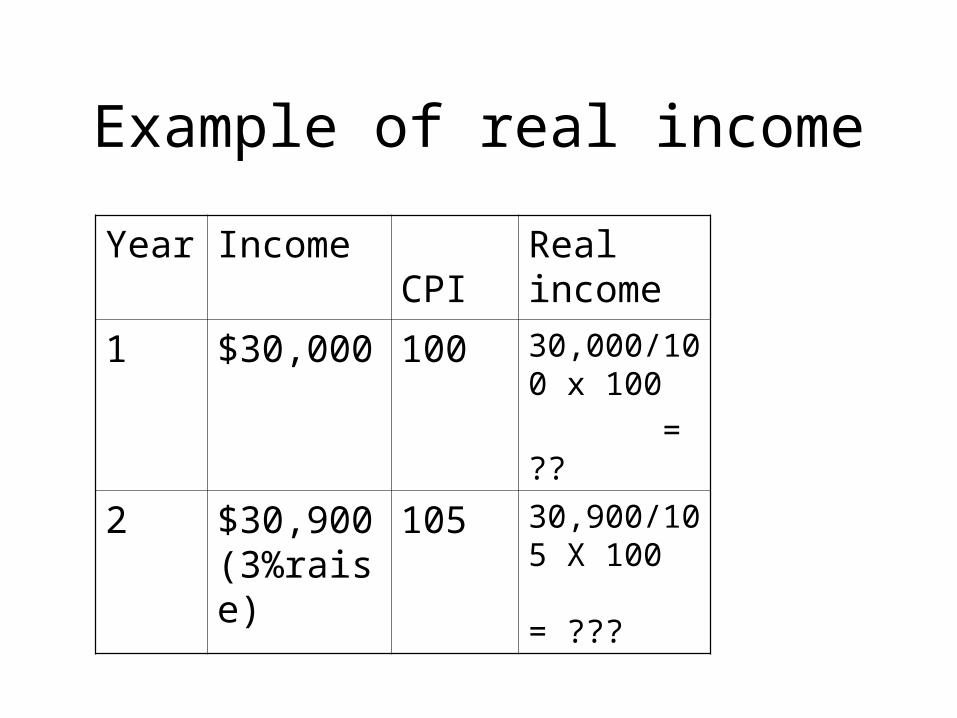
Example of real income
Year Income CPI Real income
1 $30,000 100 30,000/100 x 100
= ??
2 $30,900 (3%raise)
105 30,900/105 X 100 = ???
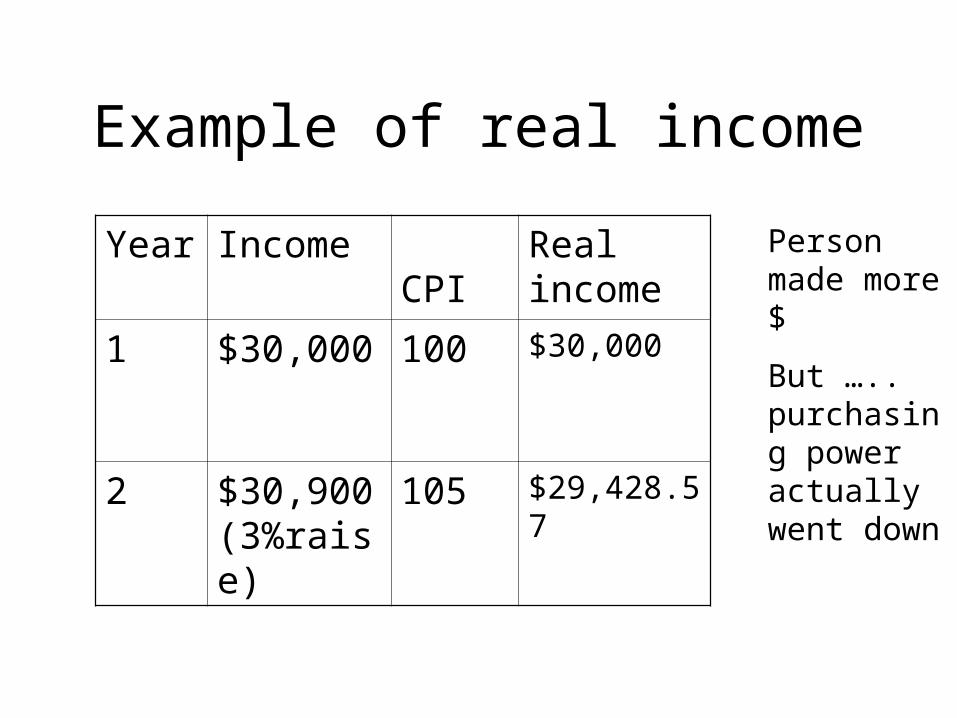
Example of real income
Year Income CPI Real income
1 $30,000 100 $30,000
2 $30,900 (3%raise)
105 $29,428.57
Person made more $
But ….. purchasing power actually went down

Reasons for Inflation
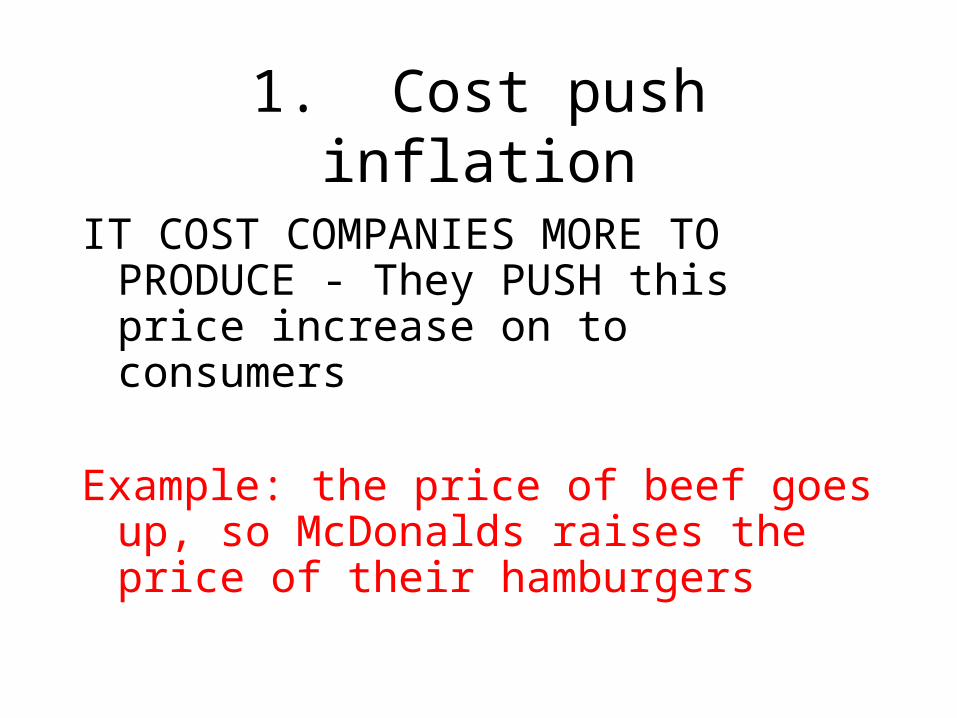
1. Cost push inflation
IT COST COMPANIES MORE TO PRODUCE - They PUSH this price increase on to consumers
Example: the price of beef goes up, so McDonalds raises the price of their hamburgers
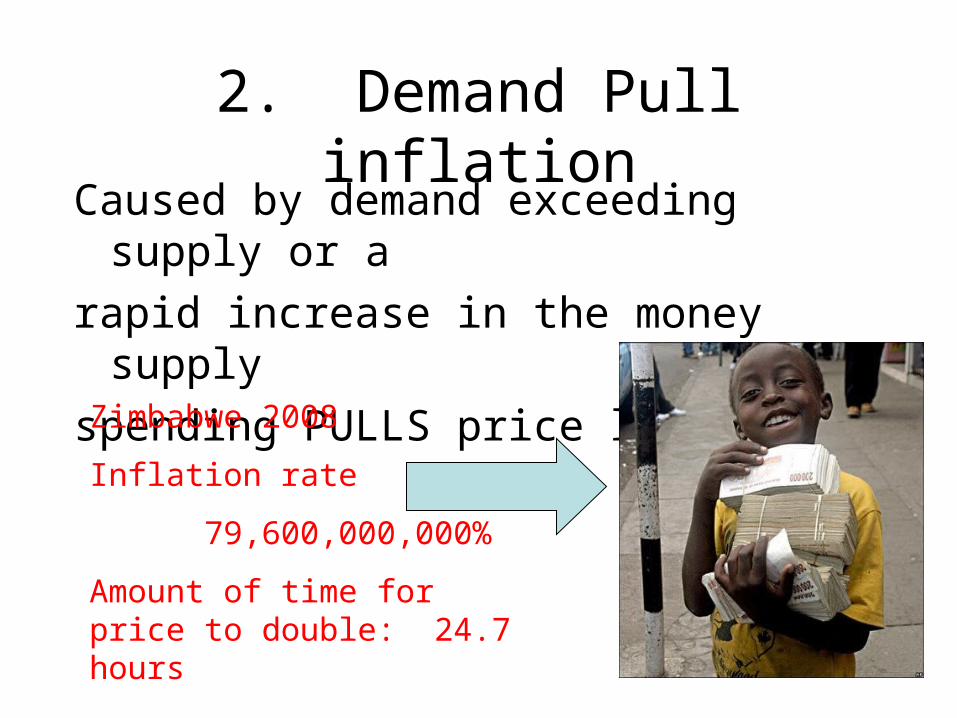
2. Demand Pull inflationCaused by demand exceeding supply or a
rapid increase in the money supply
spending PULLS price level up
Zimbabwe 2008
Inflation rate
79,600,000,000%
Amount of time for price to double: 24.7 hours
Inflation practice
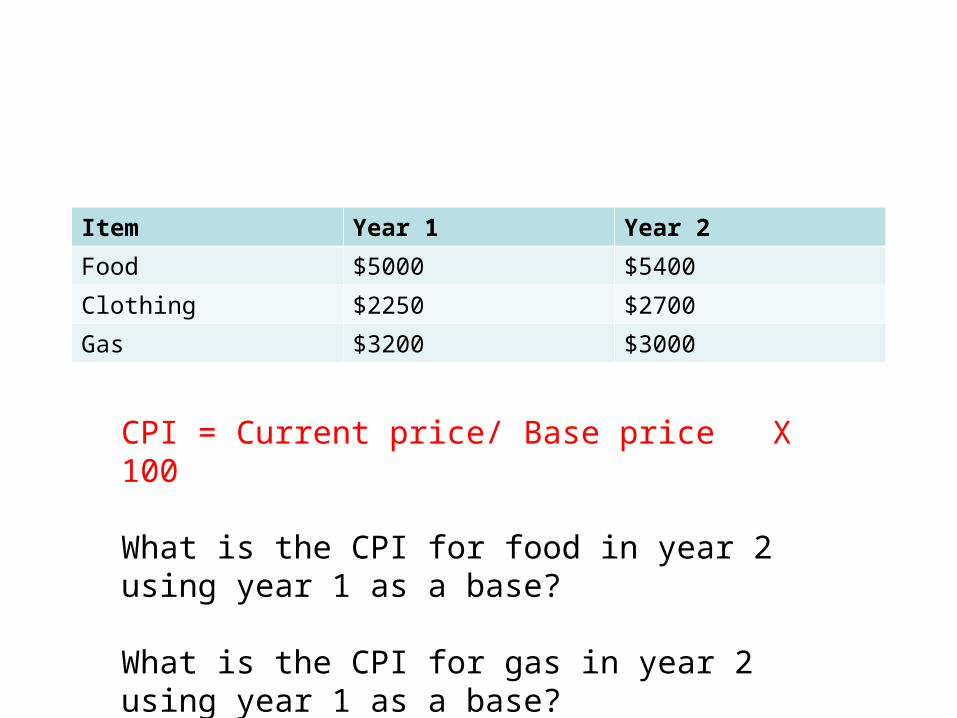
Item Year 1 Year 2
Food $5000 $5400
Clothing $2250 $2700
Gas $3200 $3000
CPI = Current price/ Base price X 100
What is the CPI for food in year 2 using year 1 as a base?
What is the CPI for gas in year 2 using year 1 as a base?
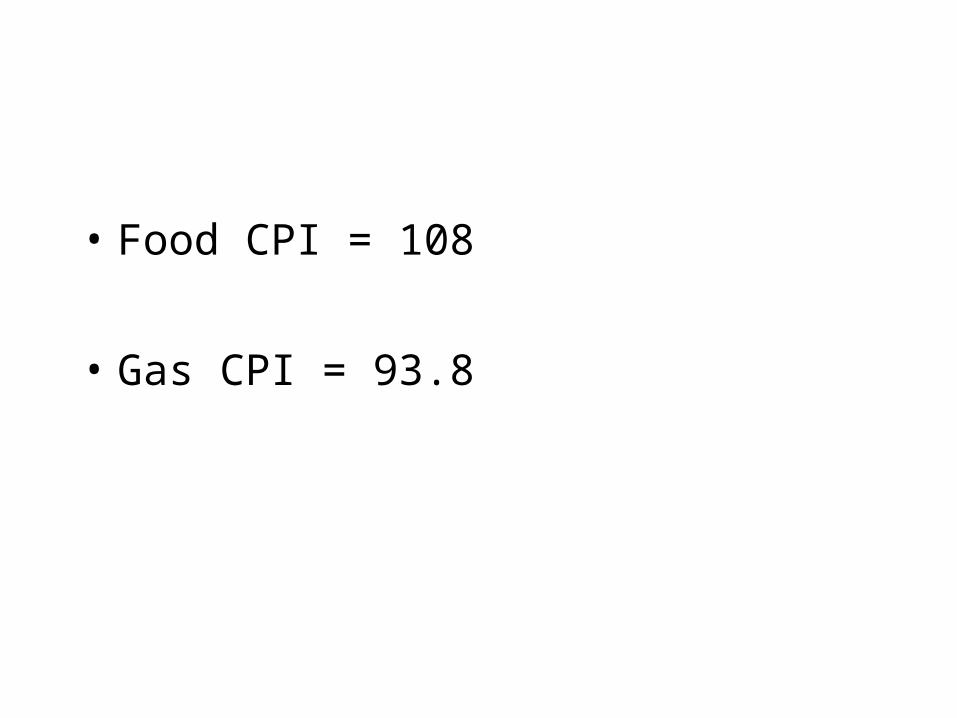
• Food CPI = 108
• Gas CPI = 93.8
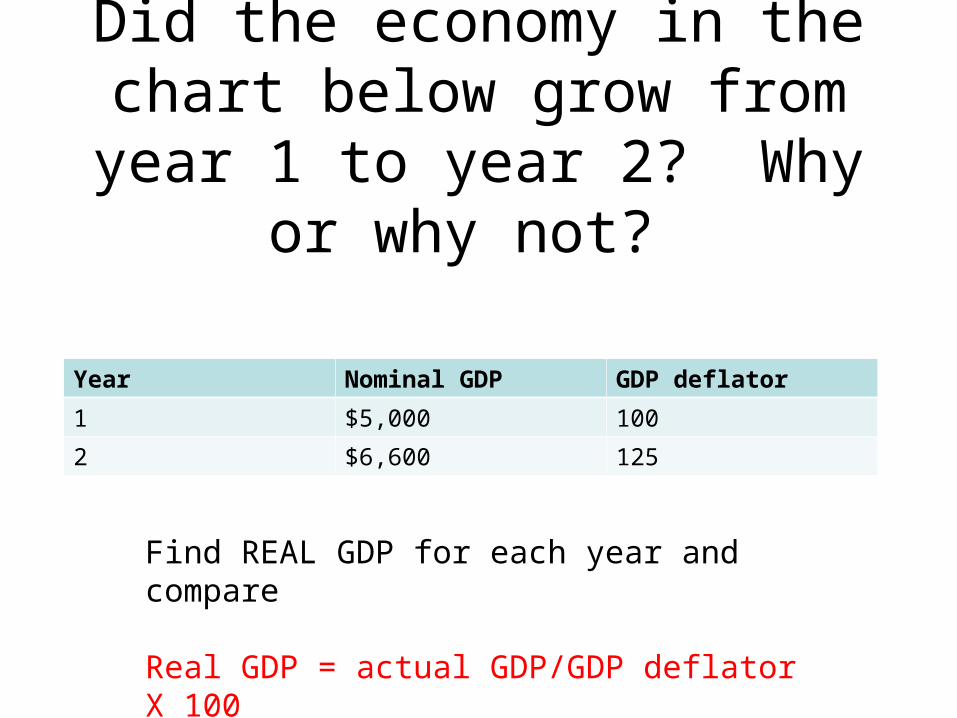
Did the economy in the chart below grow from year 1 to year 2? Why or why not?
Year Nominal GDP GDP deflator
1 $5,000 100
2 $6,600 125
Find REAL GDP for each year and compare
Real GDP = actual GDP/GDP deflator X 100
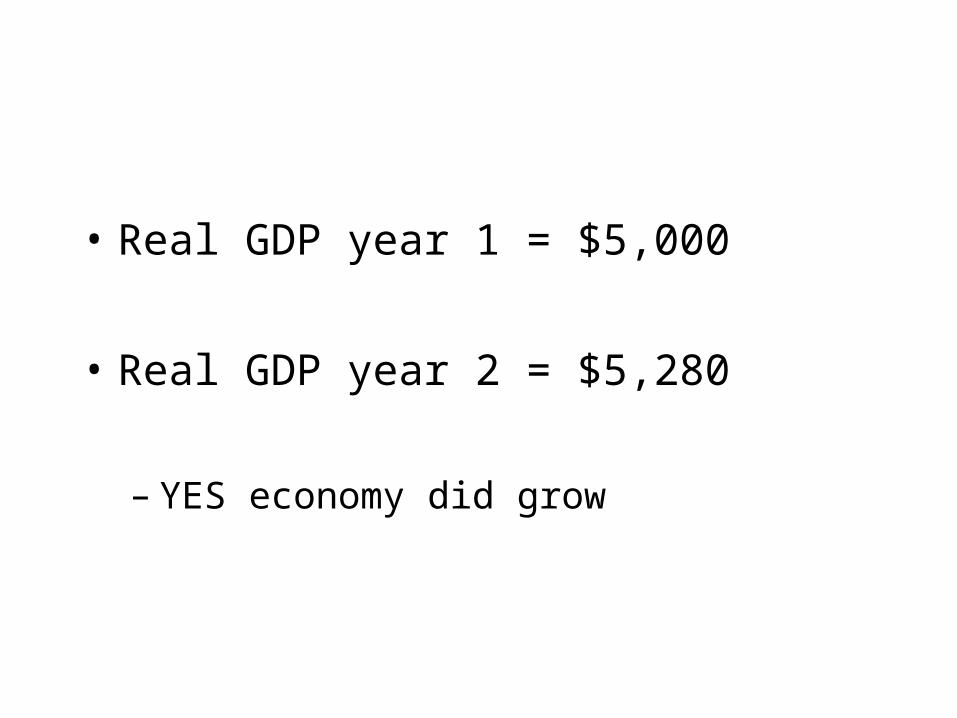
• Real GDP year 1 = $5,000
• Real GDP year 2 = $5,280
– YES economy did grow
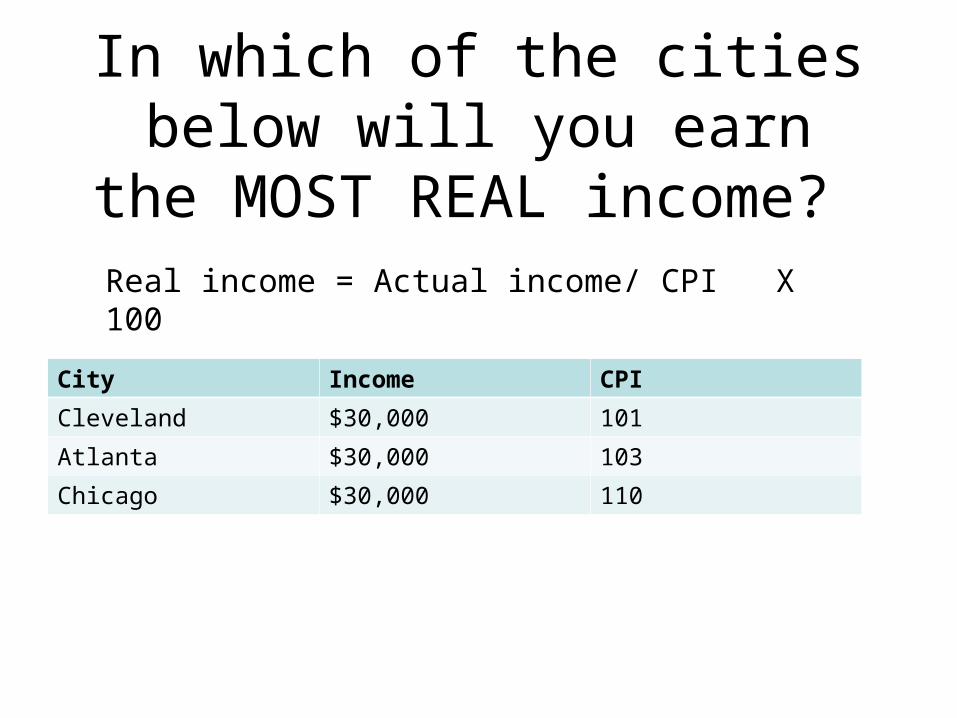
In which of the cities below will you earn the MOST REAL
income?
City Income CPI
Cleveland $30,000 101
Atlanta $30,000 103
Chicago $30,000 110
Real income = Actual income/ CPI X 100
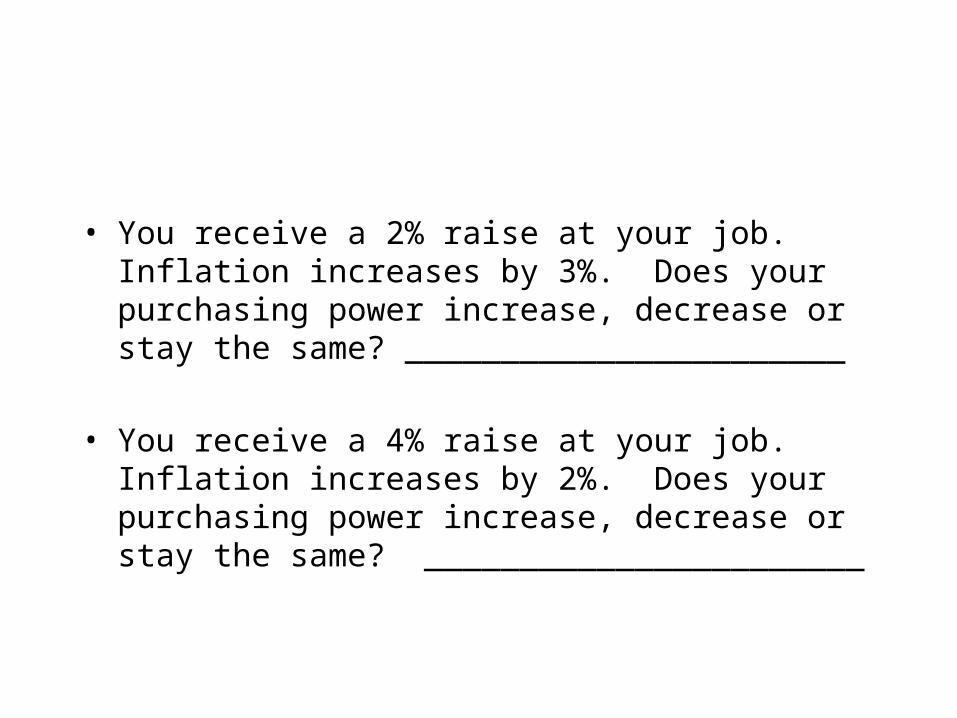
• You receive a 2% raise at your job. Inflation increases by 3%. Does your purchasing power increase, decrease or stay the same? _______________________
• You receive a 4% raise at your job. Inflation increases by 2%. Does your purchasing power increase, decrease or stay the same? _______________________
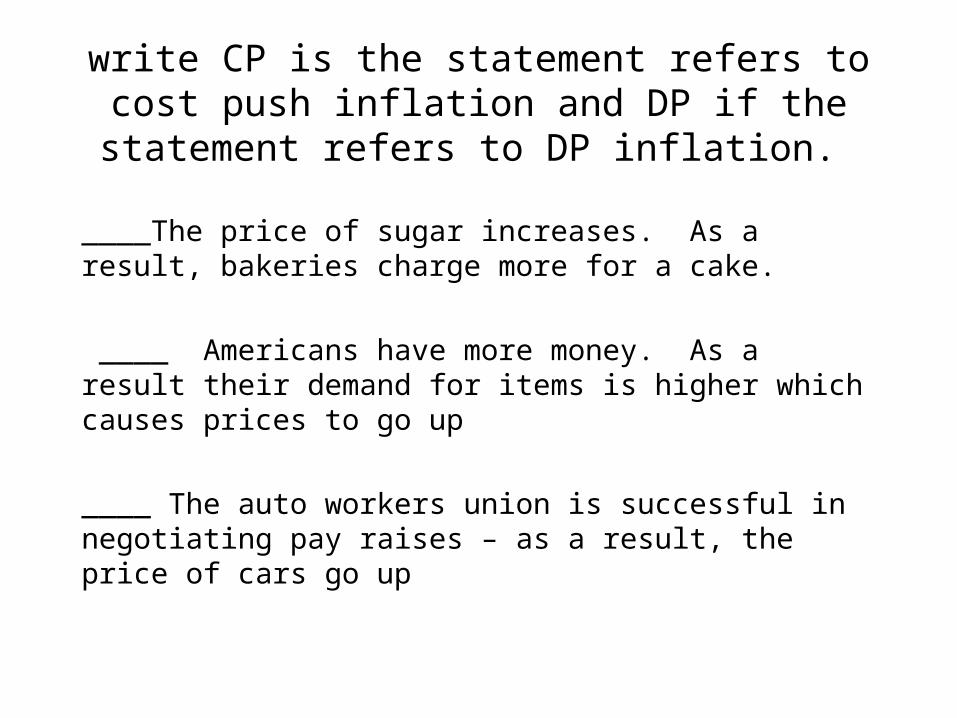
write CP is the statement refers to cost push inflation and DP if the statement refers to DP
inflation.
____The price of sugar increases. As a result, bakeries charge more for a cake.
____ Americans have more money. As a result their demand for items is higher which causes prices to go up
____ The auto workers union is successful in negotiating pay raises – as a result, the price of cars go up
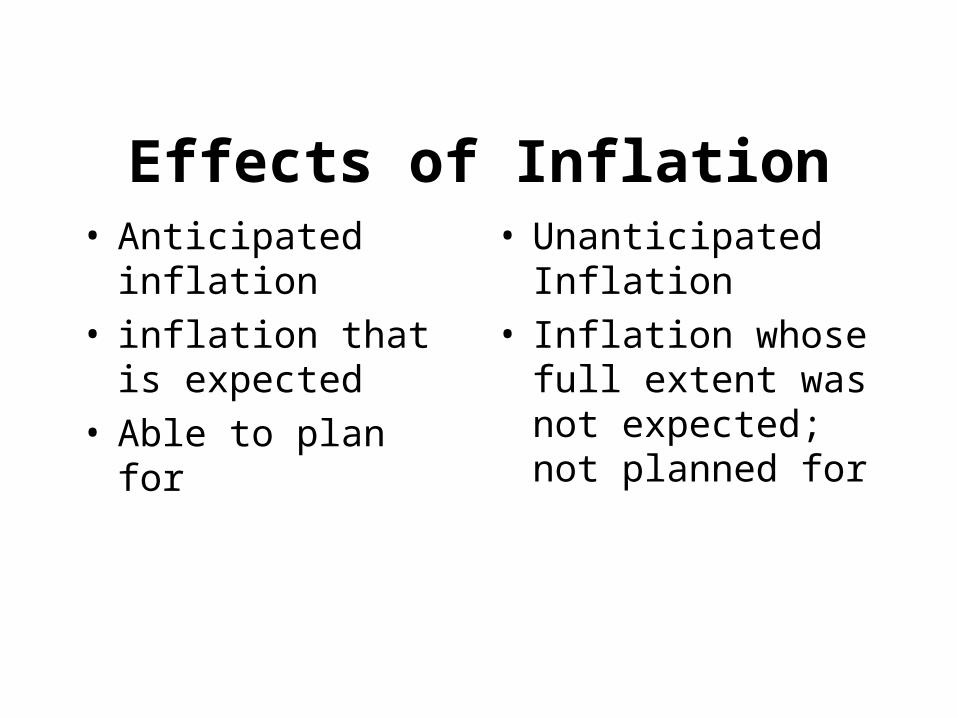
Effects of Inflation• Anticipated inflation
• inflation that is expected
• Able to plan for
• Unanticipated Inflation
• Inflation whose full extent was not expected; not planned for
1. Fixed Income Groups
- elderly living on fixed retirement funds - landlords receiving fixed payments - minimum wage workers
* are hurt by inflation because the amount of $ being received is FIXED for a number of years.
Prices go up, but income stays the same = decreasein purchasing power
2. Savers
• *depends on interest rate given and what happens to price level.
• For example: if you earn 1% interest on a savings account but inflation goes up 1.5%, your $ will buy less; If you earn more interest than the inflation rate purchasing power will go up
3. Lenders
• * depends on interest rate charged and what happens to price level.
• For example: if a bank charges a 6% interest rate and inflation goes up 7%, the $, once it is paid back will be worth less than when it was borrowed

4. Borrowers
* Depends on interest rate charged and what happens to price level.
Helped or hurt by inflation??
• 1. A man lends $100 to his friend in 2010. The friend pays him back today.
• 2. A tenant signs a one year lease to rent an apartment for $800 a month?
• 3. An elderly couple lives off fixed retirements payments $2,000 a month
• 4. A woman who is saving money in a savings account earning 1% a year. Inflation is going up by 3% a year.
Topic 5: Unemployment
The % of people who are not
working, but actively seeking
employment
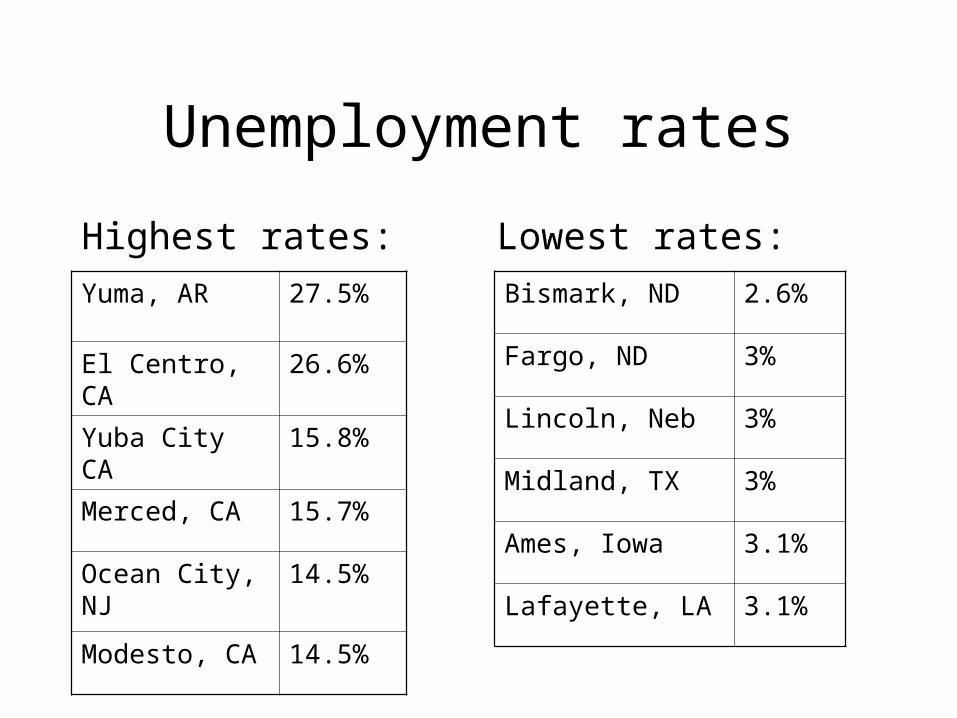
Unemployment rates
Highest rates: Lowest rates:
Yuma, AR 27.5%
El Centro, CA 26.6%
Yuba City CA 15.8%
Merced, CA 15.7%
Ocean City, NJ 14.5%
Modesto, CA 14.5%
Bismark, ND 2.6%
Fargo, ND 3%
Lincoln, Neb 3%
Midland, TX 3%
Ames, Iowa 3.1%
Lafayette, LA 3.1%

Types of Unemployment
99

1. Frictional Unemployment“Temporarily unemployed” Skills are present
• Results from “normal” changes in the labor market
Reasons for frictional unemployment •Graduating from school •In between jobs•Re-enter workforce
100
2. Seasonal Unemployment•Due to time of year and the nature of the job.•These jobs will come back
Examples:
Life Guards
101
3. Structural Unemployment•Changes in the organization of the labor force or the structure of a company
•Workers DO NOT have skills needed and these jobs will not come back OR skill of worker is obsolete
•Workers must learn new skills to get a job.
Examples: •VCR repairmen•Carriage makers 102
Change in technology
Company relocates
Merger takes place
103
Reasons why structural unemployment occurs:
4 Cyclical Unemployment•Unemployment that results from
a RECESSION
- the company doesn’t have $ to keep the worker
Examples: •Steel workers laid off during recessions.•workers laid off due to people not spending $
104
Practice1. Joe just graduated from school and is
looking for his first management job
2. Sally lost her job at Sears due to declining sales
3. Tim was replaced by a robot on the assembly line
4. Kim just graduated from school and cannot find a job in her field so she is working as a waitress
5. Jim lost his job when his company consolidated and moved to another state
Video clip
• “unemployment benefits - the 99ers”
•This is the normal amount of unemployment that we SHOULD have.
The Natural Rate of Unemployment
108
Full employment means NO Cyclical unemployment!
Unemployment rate of around 4-6% = FULL EMPLOYMENT
109
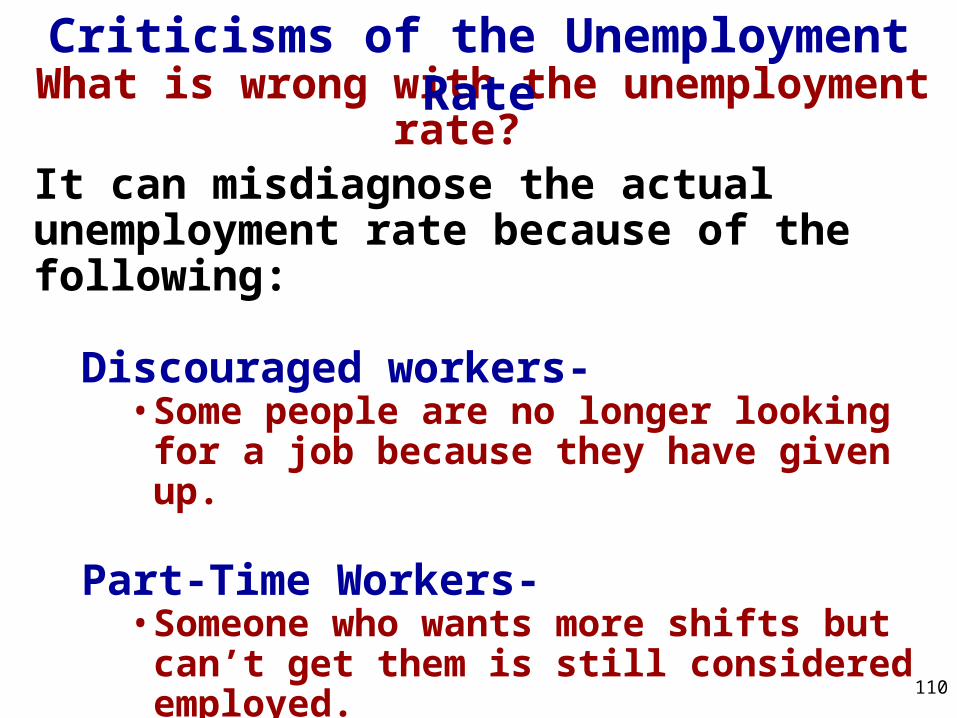
What is wrong with the unemployment rate? It can misdiagnose the actual unemployment rate because of the following:
Discouraged workers-• Some people are no longer looking for a job
because they have given up.
Part-Time Workers- • Someone who wants more shifts but can’t get
them is still considered employed.
Criticisms of the Unemployment Rate
110
Cost of Unemployment
GDP GAP - potential production is lost
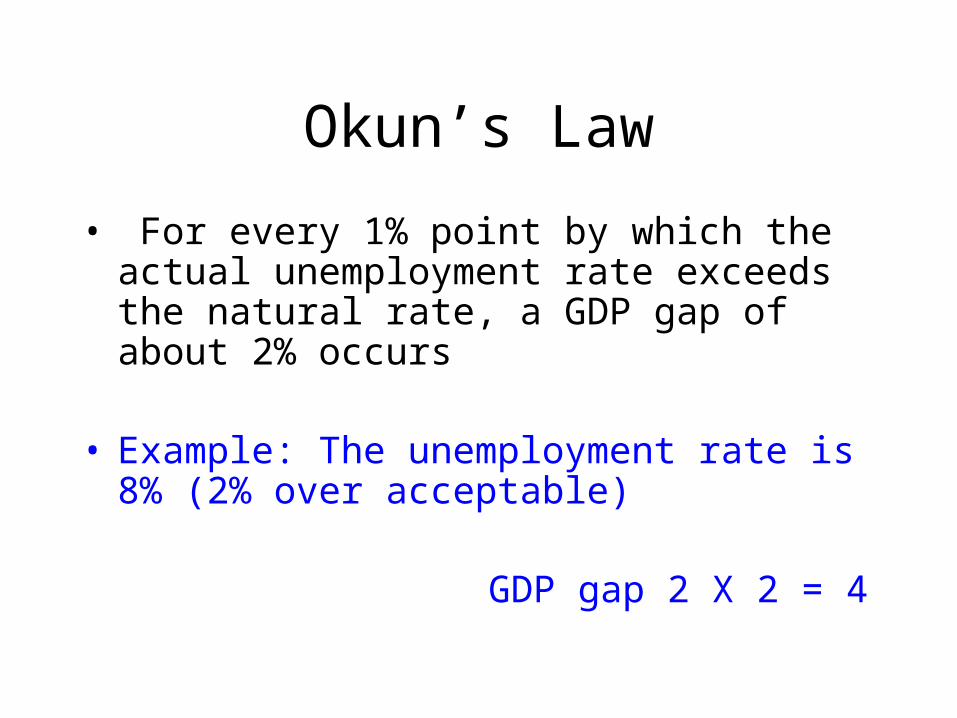
Okun’s Law
• For every 1% point by which the actual unemployment rate exceeds the natural rate, a GDP gap of about 2% occurs
• Example: The unemployment rate is 8% (2% over acceptable)
GDP gap 2 X 2 = 4
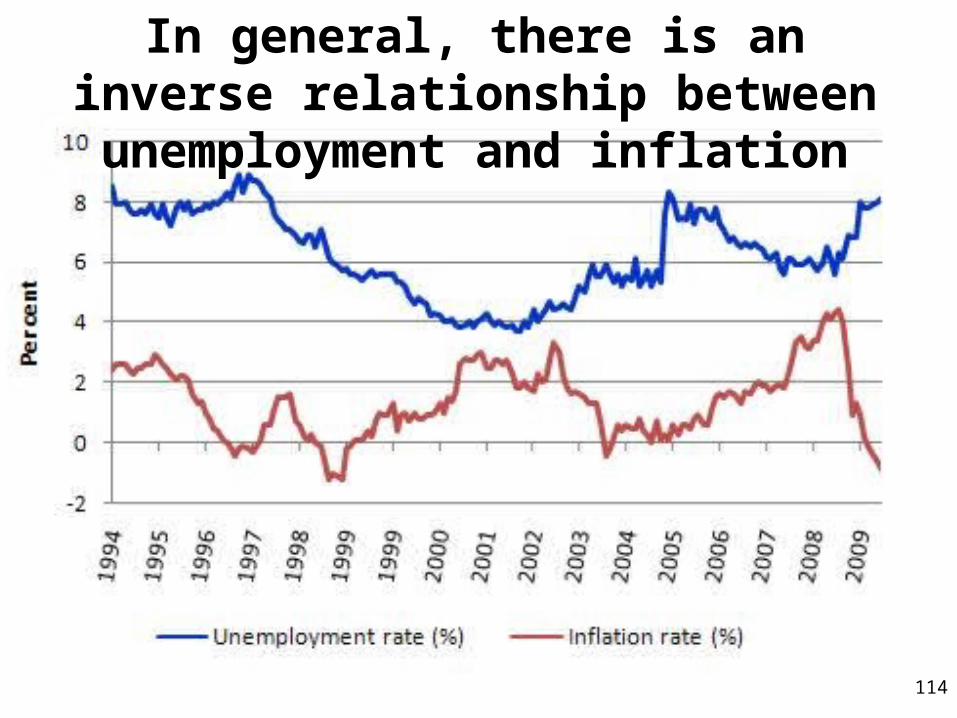
Tradeoff between inflation and unemployment.
114
In general, there is an inverse relationship between unemployment and inflation
• When UNEMPLOYMENT is low (more $ circulating in the economy) the value of the dollar goes down INFLATION is higher
• When UNEMPLOYMENT is high (less $ circulating in economy) INFALTION is lower


![AP Macroeconomics Exam/Course Study Guidecampbellhighschool.typepad.com/files/macro_study_guide... · Web viewAP Macroeconomics Exam: Course Study Guide [ UNIT I ] What is economics?](https://img.pdfslide.us/doc/110x75/5ae47f057f8b9a87048b4e93/ap-macroeconomics-examcourse-study-gui-viewap-macroeconomics-exam-course-study.jpg)


![AP Macroeconomics Exam/Course Study Guide - PBworksmrzittlesclassroom.pbworks.com/.../macro_study_guide_… · Web viewAP Macroeconomics Exam: Course Study Guide [ UNIT I ] What](https://img.pdfslide.us/doc/110x75/5a715ed07f8b9a93538cdfa0/ap-macroeconomics-examcourse-study-guide-pbworksmrzittlesclassroompbworkscommacrostudyguidedoc.jpg)