Embed Size (px)
Citation preview
UNIT 4AreA of study 3
ChApter 7 Key practical skills and communication
AreA of study 1
ChApter 8 Structures and nomenclature of organic compounds
ChApter 9 Properties and reactions of organic compounds
ChApter 10 Analysis of organic compounds
AreA of study 2
ChApter 11 Vitamins and proteins
ChApter 12 Food and energy
UNCORRECTED PAGE P
ROOFS

Conducting properly designed experiments to investigate questions is a critical part of the scientific method. So too is communicating your findings to others in the same field so that your results can be independently replicated. In this chapter, you will build on skills learned in Units 1 and 2 to accomplish both these tasks. You will learn how to design an experiment so that its results are reliable and authentic, and to use well-established scientific conventions and practices to report to others.
You will examine:
■ how to decide on a suitable question, formulate an aim and write a hypothesis
■ how to plan a suitable procedure that is ethical and safe and that will give results that are not compromised by unwanted variables
■ how to record results of your experiment to the appropriate level of precision
■ the importance of data analysis and evidence-based conclusions
■ the requirements for reporting your work in the form of a scientific poster
■ scientific notation, significant figures and the role of uncertainty
■ the role of independent, dependent and controlled variables, as well as the importance of using a scientific control where appropriate
■ how to work with tables and graphs ■ how to prepare a risk analysis as part of safe working practices
■ how to acknowledge sources.
CHaPTeR
Experiments must be properly designed so that they are performed safely and the results produced contain minimal errors.
7 Key practical skills and communication
ContentsKey practical skills and communicationKey practical skills in chemistryPreparing for your experimentPlanning your experimentPerforming your experimentAnalysing your dataProducing your posterDealing with variablesWorking with figures Tables and graphsWorking safelyAcknowledging sources
UNCORRECTED PAGE P
ROOFS
191CHAPTER 7 Key practical skills and communication
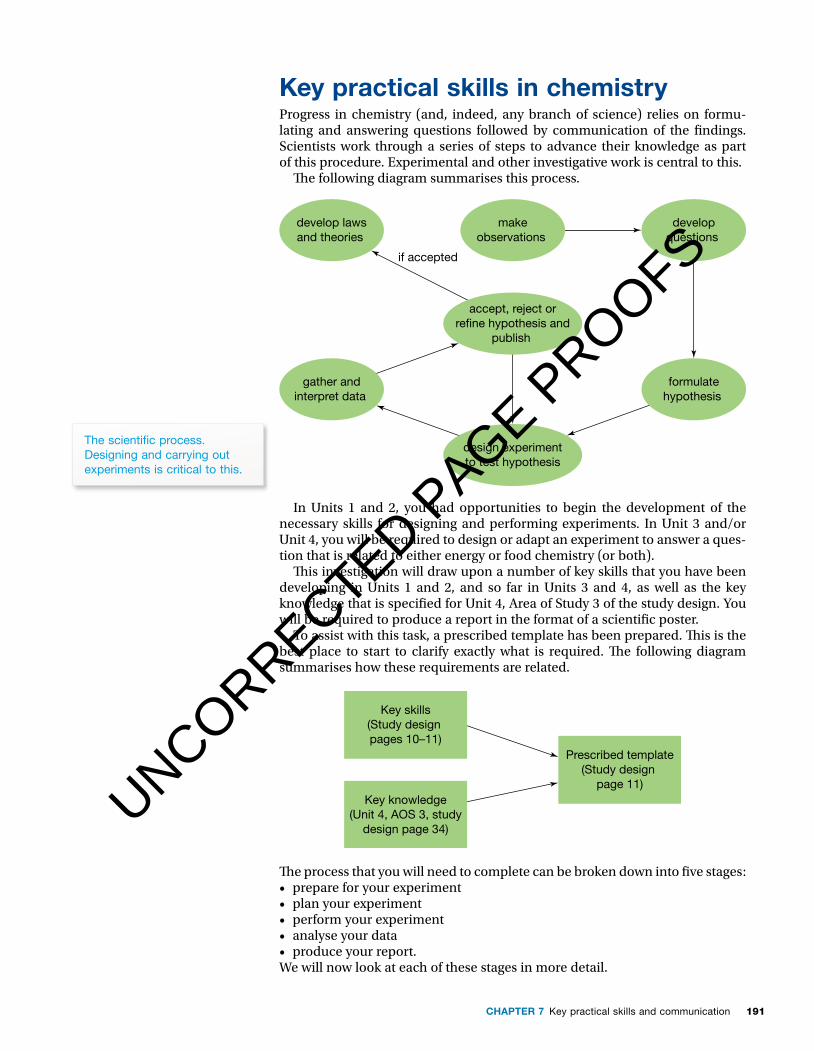
Key practical skills in chemistryProgress in chemistry (and, indeed, any branch of science) relies on formu-lating and answering questions followed by communication of the findings. Scientists work through a series of steps to advance their knowledge as part of this procedure. Experimental and other investigative work is central to this.
The following diagram summarises this process.
develop lawsand theories
makeobservations
developquestions
formulatehypothesis
design experimentto test hypothesis
gather andinterpret data
accept, reject orre�ne hypothesis and
publish
if accepted
The scientific process. Designing and carrying out experiments is critical to this.
In Units 1 and 2, you had opportunities to begin the development of the necessary skills for designing and performing experiments. In Unit 3 and/or Unit 4, you will be required to design or adapt an experiment to answer a ques-tion that is related to either energy or food chemistry (or both).
This investigation will draw upon a number of key skills that you have been developing in Units 1 and 2, and so far in Units 3 and 4, as well as the key knowledge that is specified for Unit 4, Area of Study 3 of the study design. You will be required to produce a report in the format of a scientific poster.
To assist with this task, a prescribed template has been prepared. This is the best place to start to clarify exactly what is required. The following diagram summarises how these requirements are related.
Key skills(Study design pages 10–11)
Key knowledge(Unit 4, AOS 3, study
design page 34)
Prescribed template(Study design
page 11)
The process that you will need to complete can be broken down into five stages: • prepare for your experiment• plan your experiment• perform your experiment• analyse your data • produce your report.We will now look at each of these stages in more detail.
UNCORRECTED PAGE P
ROOFS
UniT 4192
Preparing for your experimentYou should not rush into doing your experiment. Time spent preparing will make the subsequent stages easier and your data more reliable. It may even prevent you from having to start again. There are some important things to consider at this stage.
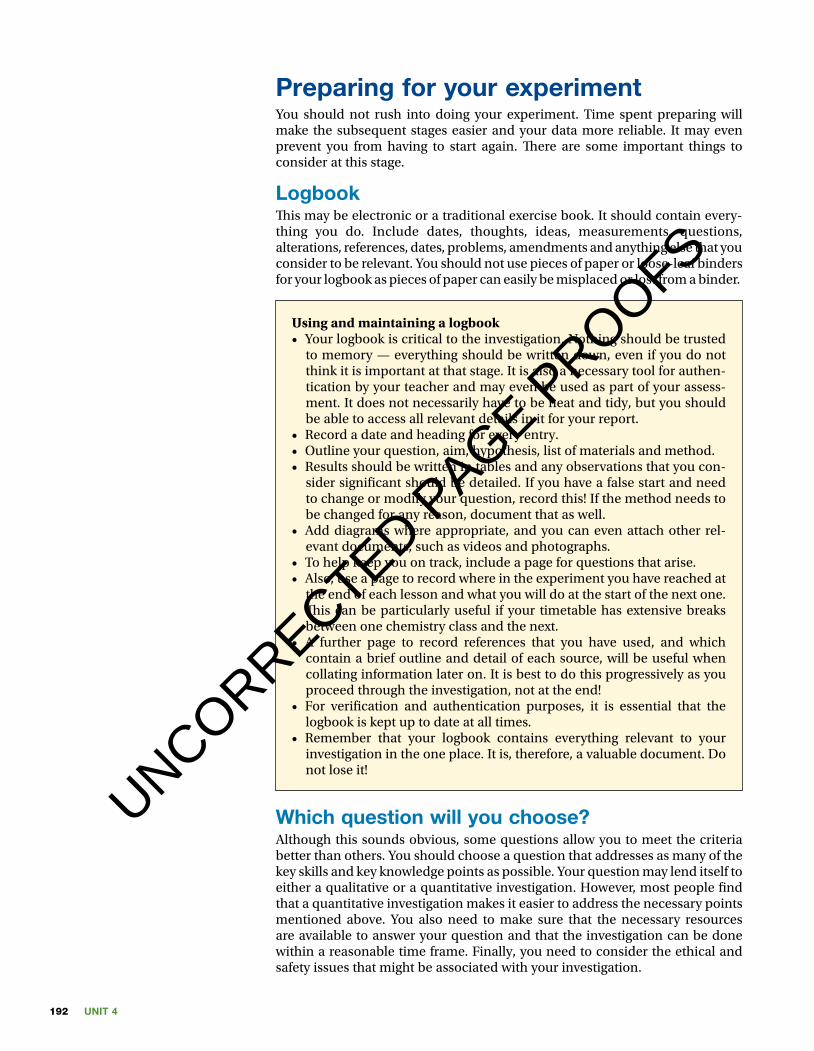
LogbookThis may be electronic or a traditional exercise book. It should contain every-thing you do. Include dates, thoughts, ideas, measurements, questions, alterations, references, dates, problems, amendments and anything else that you consider to be relevant. You should not use pieces of paper or loose-leaf binders for your logbook as pieces of paper can easily be misplaced or lost from a binder.
Using and maintaining a logbook• Your logbook is critical to the investigation. Nothing should be trusted
to memory — everything should be written down, even if you do not think it is important at that stage. It is also a necessary tool for authen-tication by your teacher and may even be used as part of your assess-ment. It does not necessarily have to be neat and tidy, but you should be able to access all relevant details in it for your report.
• Record a date and heading for every entry. • Outline your question, aim, hypothesis, list of materials and method. • Results should be written in tables and any observations that you con-
sider significant should be detailed. If you have a false start and need to change or modify your question, record this! If the method needs to be changed for any reason, document that as well.
• Add diagrams where appropriate, and you can even attach other rel-evant documents, such as videos and photographs.
• To help keep you on track, include a page for questions that arise. • Also, use a page to record where in the experiment you have reached at
the end of each lesson and what you will do at the start of the next one. This can be particularly useful if your timetable has extensive breaks between one chemistry class and the next.
• A further page to record references that you have used, and which contain a brief outline and detail of each source, will be useful when collating information later on. It is best to do this progressively as you proceed through the investigation, not at the end!
• For verification and authentication purposes, it is essential that the logbook is kept up to date at all times.
• Remember that your logbook contains everything relevant to your investigation in the one place. It is, therefore, a valuable document. Do not lose it!
Which question will you choose? Although this sounds obvious, some questions allow you to meet the criteria better than others. You should choose a question that addresses as many of the key skills and key knowledge points as possible. Your question may lend itself to either a qualitative or a quantitative investigation. However, most people find that a quantitative investigation makes it easier to address the necessary points mentioned above. You also need to make sure that the necessary resources are available to answer your question and that the investigation can be done within a reasonable time frame. Finally, you need to consider the ethical and safety issues that might be associated with your investigation.
UNCORRECTED PAGE P
ROOFS
193CHAPTER 7 Key practical skills and communication
In light of these points, it is probably a good idea to have more than one ques-tion in mind, or at least some variations of your question. Sometimes it is easier to work around a problem by sidestepping it with a different question (or variation).
Formulating your hypothesis and aimYour hypothesis is related to, and informed by, your question. It is an educated guess based on the theory and current knowledge related to your question. The hypothesis must be testable. In fact, it is the aim of your experiment to verify, dismiss or suggest modifications to your hypothesis, based on the data you obtain.
To write a hypothesis, a good tip is to use the if (statement involving indepen-dent variable), then (prediction involving dependent variable) structure. For example, consider the question: Does the number of bonds in a hydrocarbon molecule influence its use as a fuel? A reasonable hypothesis could be: If the number of bonds in a hydrocarbon fuel is increased, then the energy output from it also increases when it is combusted in excess oxygen.
Revision questions
1. Testing a scientific question by experiment involves a number of stages. These are shown by the statements below. Use the letters to put these stages into their correct order.A Formulate the hypothesis.B Decide on the question.C Analyse the results.
D Communicate the results.E Plan the experiment.F Carry out the experiment.
2. After some preliminary reading, a student has become intrigued by the possibility that fats and oils may have different energy contents. Therefore, she proposes the question: Do fats and oils have different energy contents per gram?(a) Write a reasonable hypothesis that she could test experimentally based
on this question.(b) Which of the following is a characteristic of a good hypothesis?
A It must be proven true. B It must be testable by observation or experiment. C It must be based upon experiments done by other scientists.
Planning your experimentIt is important that your experiment produces reliable findings. Therefore, you need to consider the variables involved in your experiment. Which need to be controlled? Which are the dependent and independent variables? You should consider errors (both systematic and random) and how they can be minimised. Will it be practical to repeat the experiment a number of times to reduce random errors? You may need to do a trial run (pilot study) of your method and be prepared to change your method on the basis of the evidence obtained from such a trial.
On a more practical level, you need to consider the necessary skills required, as well as the time and cost of your proposed experiment. For example, are you proficient enough at titrations? You may find that you can adapt an already existing method, or you may have to design a completely new method from scratch. Will your experiment take too long to complete, given the time available? Will it require the purchase of specialist equipment or expensive chemicals?
You should also consider the most appropriate equipment to use for a par-ticular purpose. For example, if a liquid volume of 25 mL is required, what would be the most appropriate piece of equipment to measure it? If a high-precision
UNCORRECTED PAGE P
ROOFS
UniT 4194
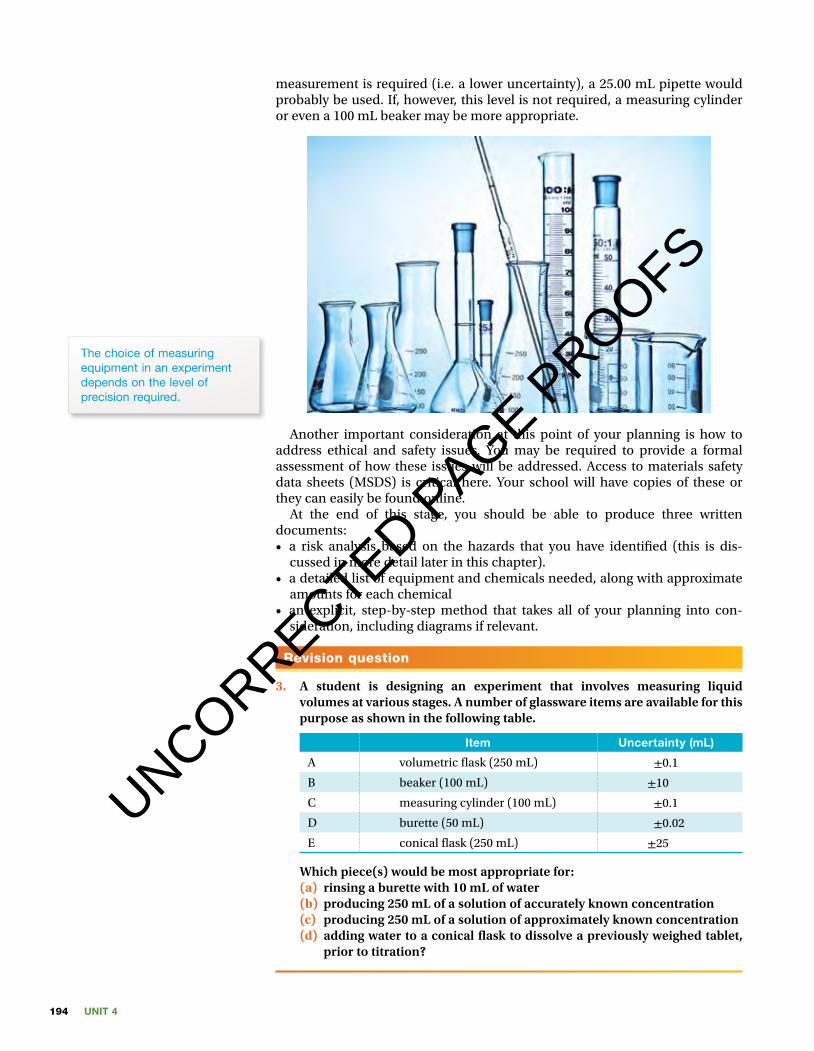
measurement is required (i.e. a lower uncertainty), a 25.00 mL pipette would probably be used. If, however, this level is not required, a measuring cylinder or even a 100 mL beaker may be more appropriate.
The choice of measuring equipment in an experiment depends on the level of precision required.
Another important consideration at this point of your planning is how to address ethical and safety issues. You may be required to provide a formal assessment of how these issues will be addressed. Access to materials safety data sheets (MSDS) is critical here. Your school will have copies of these or they can easily be found online.
At the end of this stage, you should be able to produce three written documents:• a risk analysis based on the hazards that you have identified (this is dis-
cussed in more detail later in this chapter).• a detailed list of equipment and chemicals needed, along with approximate
amounts for each chemical• an explicit, step-by-step method that takes all of your planning into con-
sideration, including diagrams if relevant.
Revision question
3. A student is designing an experiment that involves measuring liquid volumes at various stages. A number of glassware items are available for this purpose as shown in the following table.
item Uncertainty (mL)
A volumetric flask (250 mL) ±0.1
B beaker (100 mL) ±10
C measuring cylinder (100 mL) ±0.1
D burette (50 mL) ±0.02
E conical flask (250 mL) ±25
Which piece(s) would be most appropriate for:(a) rinsing a burette with 10 mL of water(b) producing 250 mL of a solution of accurately known concentration(c) producing 250 mL of a solution of approximately known concentration(d) adding water to a conical flask to dissolve a previously weighed tablet,
prior to titration?
UNCORRECTED PAGE P
ROOFS
195CHAPTER 7 Key practical skills and communication
Working in groupsJust as in the real world, you will probably not work alone in your investi-gation. However, the poster that you produce must be your own work. How do you balance these two apparent contradictions and obtain the best result for yourself?
There are a few simple points that you should bear in mind.• As part of your planning, assign clear roles to each group member, but
be prepared to rotate these from one lesson to the next. This means that every person has a function in each lesson, and each person experiences all the different roles required in the experiment.
• Every person should be prepared to jot down in their logbooks what they consider to be important observations. If large amounts of data are being collected, it may be the role of one group member to write this down. However, every other member must ensure they copy this data into their logbooks as soon as possible. Do not expect to be able to get this data at a later date.
• While it is permissible to broadly discuss the analysis and implications of your data, the final detailed analysis must be your own work. Your poster must contain your own words, drawings, calculations etc.
• Remember the importance of your logbook. It is a vital method of recording, and also critical to your teacher’s authentication of your work. It should prove that you have been an active, contributing member of your group — not just someone who has sat back and obtained some results at the last minute.
• Finally, do not forget to acknowledge the help that others give you. This, of course, also applies to members of your group.
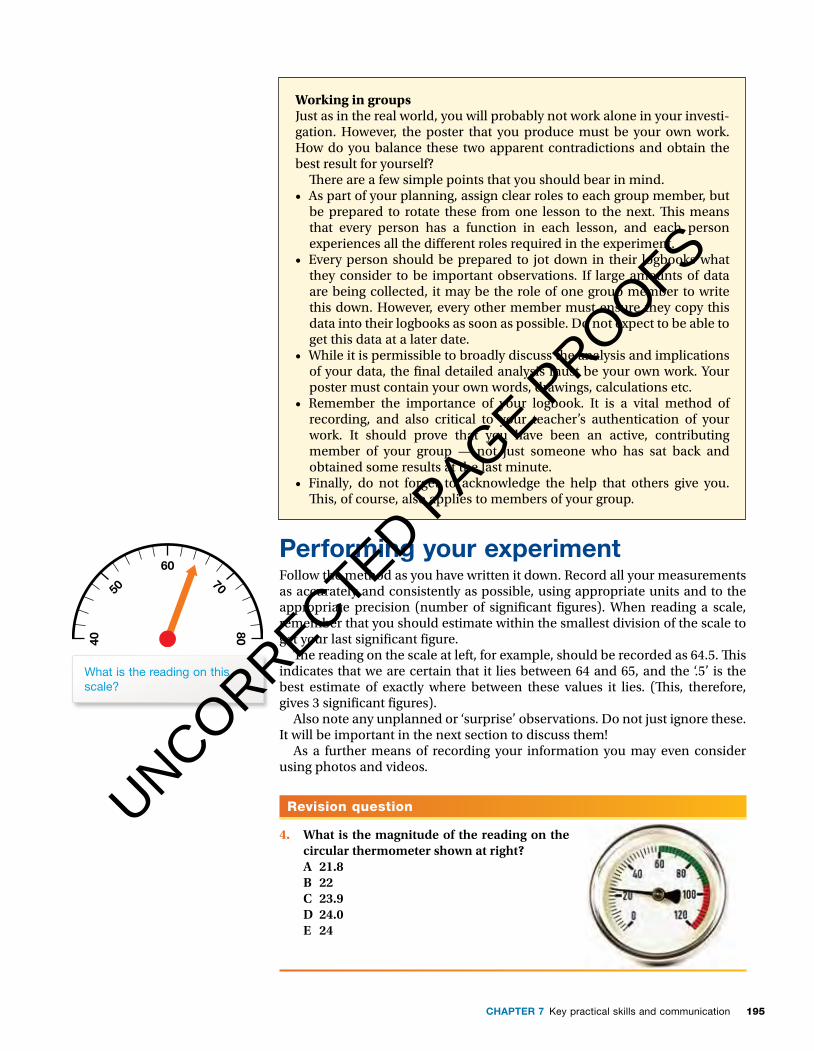
Performing your experimentFollow the method as you have written it down. Record all your measurements as accurately and consistently as possible, using appropriate units and to the appropriate precision (number of significant figures). When reading a scale, remember that you should estimate within the smallest division of the scale to get your last significant figure.
The reading on the scale at left, for example, should be recorded as 64.5. This indicates that we are certain that it lies between 64 and 65, and the ‘.5’ is the best estimate of exactly where between these values it lies. (This, therefore, gives 3 significant figures).
Also note any unplanned or ‘surprise’ observations. Do not just ignore these. It will be important in the next section to discuss them!
As a further means of recording your information you may even consider using photos and videos.
Revision question
4. What is the magnitude of the reading on the circular thermometer shown at right?A 21.8 B 22 C 23.9 D 24.0 E 24
60
50
40
8070
What is the reading on this scale?
UNCORRECTED PAGE P
ROOFS
UniT 4196
Analysing your dataIn this stage, you will look for patterns, trends and relationships that can be used to evaluate your hypothesis. These processes are often mathematical operations such as calculations (remember significant figures!), averaging, graphing, converting to and from scientific notation etc. You need to consider the limitations of your data and your method. Together with any unexpected results, these may lead to suggested modifications to your method.
Now is also the time to consider your conclusion. Remember that this must provide a response to the question. It must not draw on any new information. Rather, it should be informed by the data and the analysis that has already been performed.
Producing your posterWhen writing a scientific report, it is important to write in a style that is objective. The traditional method for many years has been to write in the ‘third person, past tense’. However, in recent years, this has been modified slightly. It is now sometimes permissible to use pronouns such as I, we and you, providing that they are not overused and that they add conciseness to your writing.
According to the study design, your poster must use the following prescribed format.• Title. This is, of course, the question that you are investigating. Also, don’t
forget your name!• Introduction. Explain why you chose the question that you did. You should
discuss current theory and concepts that are relevant to this question. You should finish this section with a clear aim and state the hypothesis that you are going to test.
• Method. You should already have this available from carrying out your experiment. However, you may choose to rephrase sections to make it more readable to another person. The test here is that it should be clear enough for someone else (at your level) to repeat your experiment, but not contain extra details that such a person would be reasonably expected to already know.
Do not forget to highlight how the relevant ethical and safety concerns have been addressed.
You may choose to keep your method in point form (step by step), but you may also decide to run it together into a paragraph. Either way, it still must meet the test of reproducibility mentioned above.
Do not be afraid to include clearly labelled diagrams. As the saying goes — a picture is worth a thousand words!
It is also permissible to include a list of equipment and chemicals used here, although many people choose to include this under a separate heading, such as ‘Materials’, immediately before this section.
• Results. Make sure you present your results in an organised and clear manner, following accepted conventions. For example, if tables are used, each table should have a title. Make sure you include the appropriate units and use the correct number of significant figures. Try to organise this in such a way that any patterns or relationships start to become obvious, thus making it easier to analyse in the next section.
You do not do any analysis in this section!• Discussion. This section is particularly important. Here is where you do your
analysis. Make sure you do not just repeat your results! Do the necessary cal-culations and identify any trends and relationships that become apparent. Comment on any unexpected results. Suggest sources of error and poss-ible modifications to the experiment. Discuss any difficulties, and suggest improvements and future follow-up investigations.
UNCORRECTED PAGE P
ROOFS
197CHAPTER 7 Key practical skills and communication
Check that you have used correct scientific terminology and conventions.• Conclusion. This should relate to the aim and must be based entirely on the
evidence obtained in the experiment. It should state whether the hypothesis is supported. This usually forms the last part of your discussion, although some people like to include it under a separate heading.
• List of references and acknowledgements. You should quote the sources of any content that you include that is not your own original work. Unaltered tables, diagrams and graphs are examples that fit this description, as are direct quotes. In your introduction, you may have mentioned previous work that your investigation is based on. This also needs to be acknowledged, along with any sources that inform your discussion of concepts and theory in a more general sense.
Practical investigation checklist
Your name, the title and the aim/hypothesis are listed.
A synopsis describes the purpose and outlines the investigation in a logical and concise manner. Key terms are defined and variables are stated clearly. Relevant theory is addressed.
The method is outlined clearly in step form including a consideration of ethics, health and safety. A risk assessment is provided.
Your logbook contains dates, headings and complete records.
Results are presented in an organised way, in a table if possible. All relevant measurements are recorded with appropriate accuracy and units. Any abbreviations are explained.
Observations are clear and concise, as are any diagrams or photos used.
The discussion includes clear and correctly set out calculations.
There is a concise summary and interpretation of key findings, including trends and any unexpected results. Connections to relevant chemistry are explained.
The experimental design is evaluated and possible improvements are included.
There are suggestions for future investigations.
The conclusion concisely summarises how your results support or contradict your original hypothesis.
All sources are acknowledged and references correctly cited.
The layout of your poster is clear and logical. The use of key terms and chemical conventions, symbols and equations is appropriate.
Dealing with variablesA variable is any factor in an experiment that can be changed, measured, observed or controlled in some way. For the results of an experiment to be reliable and authentic, it is important to consider the role of variables and how they may affect the data that you obtain.
In many experiments, there are three main types of variables: independent variables, dependent variables and controlled variables.
independent variablesIndependent variables are those that are changed by the experimenter. For example, in an experiment to check the stoichiometry of a reaction repre-sented by the equation:
xA(aq) + yB(aq) zC(s)
UNCORRECTED PAGE P
ROOFS
UniT 4198
a student reacted variable amounts of substance A and measured the mass of substance C produced after filtering and drying. The independent variable in this experiment is therefore the amount of substance A that was used in each trial.
When graphing results, the independent variable is always placed on the horizontal axis.
Dependent variablesDependent variables are those that are measured. In the example above, this would be the mass of substance C produced.
The dependent variable is always placed on the vertical axis of a graph.
Controlled variablesControlled variables are any other factors that might affect your measurement of the dependent variable. In the previous case, the amount of substance B present could possibly affect the mass of substance C produced. It would, therefore, be very important to keep the amount of substance B present at a value that would reasonably be expected to be in excess.
Experiments normally have a number of controlled variables.
More about variablesIn any experiment, there may also be other variables that you are unaware of or that would be reasonably expected not to affect the result.
In the previous example, the temperature of the aqueous solution might not be considered to be important. However, if substance C shows a solubility that increases dramatically with temperature, this would also affect the mass of substance C that is collected. It would then become necessary to repeat the experiment making sure that the temperature is held constant. In other words, temperature would become another controlled variable.
It is possible that a controlled variable may become an influencing vari-able. Once again, in the previous example, if the amount of substance A used becomes too large, substance B may no longer be in excess and would there-fore affect the mass of substance C produced by becoming the limiting reagent.
Dealing with variables experimentallyThere are a number of ways that an experimental method may deal with the variables involved to give fair results. One common way is to simply keep each of the identified controlled variables at a constant value. In the experiment described on the previous page, this could be achieved by keeping the amount of substance B at an amount representing a large excess, and by performing each trial at a constant temperature.
If the identification of controlled variables is complex, or many are present, it might be simpler to include a control. A scientific control is an experiment or observation that involves all variables except the independent variable. For example, a scientist may be trying to measure the absorbance of light by various concentrations of cobalt chloride, CoCl2, solutions. The indepen-dent variable in such an investigation would be the concentration of cobalt chloride, and the dependent variable would be the absorbance reading obtained. However, there are a number of other variables that may affect the result. These include the nature of the solvent, the type of glass that the con-tainers holding the solutions are made from, the distance the light has to travel (especially through the solution) before it is measured, the temperature of the solution and so on. A convenient way to control all these variables, and maybe even some that you aren’t aware of, is to use a control. Everything about the control, from the way it is prepared to how it is manipulated and measured in the experiment, is the same as for the test solutions containing cobalt chloride.
UNCORRECTED PAGE P
ROOFS
199CHAPTER 7 Key practical skills and communication
The only difference is that there is no cobalt chloride (the controlled variable) in the control. This, therefore, allows the scientist to isolate the amount of absorption in each reading that is due to the cobalt chloride alone as it is the only variable left that is responsible for any differences in absorbance readings.
Revision questions
5. A student conducted an experiment to measure the effect of changing pressure on the volume of a sample of gas. This was done in three stages using a range of pressures on various concentrations of gas at various temperatures.
Stage 1: 0.01 mol of gas at 10 °C Stage 2: 0.02 mol of gas at 20 °C Stage 3: 0.03 mol of gas at 30 °C The results from each trial were then analysed to produce an overall
conclusion.(a) State the independent and the dependent variables in this experiment.(b) What were the controlled variables in this experiment?(c) What was the purpose of stages 2 and 3 in this experiment?
6. The following is an excerpt from a report describing the method for an experiment on determining the optimum fertiliser level for lucerne growth.
Five seeds of Medicago sativa (lucerne) were planted in each of 11 iden-tical pots using potting mix from the same packet. These pots were then placed in the same position inside a greenhouse. Each pot was watered daily with 100 mL of fertiliser solution of constant concentration. The concentrations used in the experiment ranged from 0 to 5 g L–1. After 2 weeks, the shoots in each pot were cut at soil level and weighed.
(a) What is the independent variable in this experiment?(b) What is the dependent variable?(c) State as many controlled variables as you can think of.(d) Which pot is the control in this experiment? (e) Why is the control an important part of this experiment?
Working with figures Scientific notationWhen working with the sizes of atoms, we are dealing with very, very small numbers and yet, when working with numbers of atoms, we need to use very, very large numbers. For example, depending on how it is calculated, there are 33 500 000 000 000 000 000 water molecules in a drop of water. It is really not convenient to write these figures with large numbers of zeroes before or after the decimal point. Using scientific notation, this number is written as 3.35 × 10¹⁹ water molecules.
There are two parts to scientific notation; the first part is the first digit of the number, and the second part is a decimal point followed by the remaining digits. This is multiplied by 10 raised to the power that returns the number to its original value.
Sample problem 7.1
Write 37 769 using scientific notation.
37 769 = 3.7769 × 10 000 = 3.7769 × 10⁴
Remember that the power of 10 is positive if the number is greater than 1 and negative if the number is less than 1. On a calculator, the ∧ key is used to raise 10 to a particular power. Scientific notation is also called standard form.
Solution:
UNCORRECTED PAGE P
ROOFS
UniT 4200
Revision questions
7. Express the following measurements in scientific notation.(a) The wavelength of red light is 0.000 000 75 m.(b) A typical page thickness is 0.0023 mm.(c) The distance from the Earth to the Sun is 149 600 000 000 km.
8. Convert each of the following to scientific notation.(a) 927 500(b) 45 868(c) 0.0357
(d) 0.005 629(e) 0.056 29(f) 0.000 000 013 457
9. Convert each of the following numbers from scientific notation to an ordi-nary number.(a) 1.00 × 10² (b) 2.19 × 10⁻³
(c) 3.759 × 100
(d) 7.77 × 10⁻¹
(e) 5.0 × 10⁵
(f) 5.00 × 10⁵
(g) 5.00 × 10⁻⁵
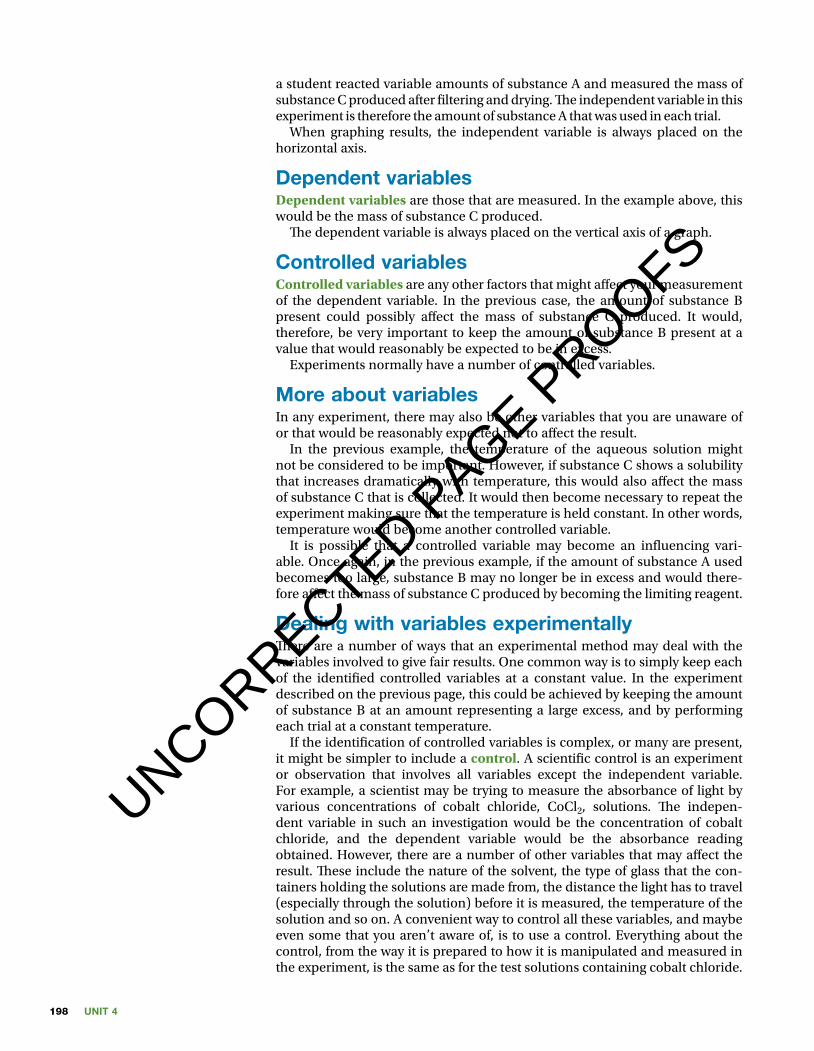
Significant figuresEvery measurement that you make has an inherent level of uncertainty. This is due in part to the limitations of the measuring equipment itself and in part to user interpretation. Significant figures are one means of recognising these limitations. We say that significant figures indicate the level of precision in a measurement. When reading a scale, read it to 1
10 of the smallest division in the
scale.
Sample problem 7.2
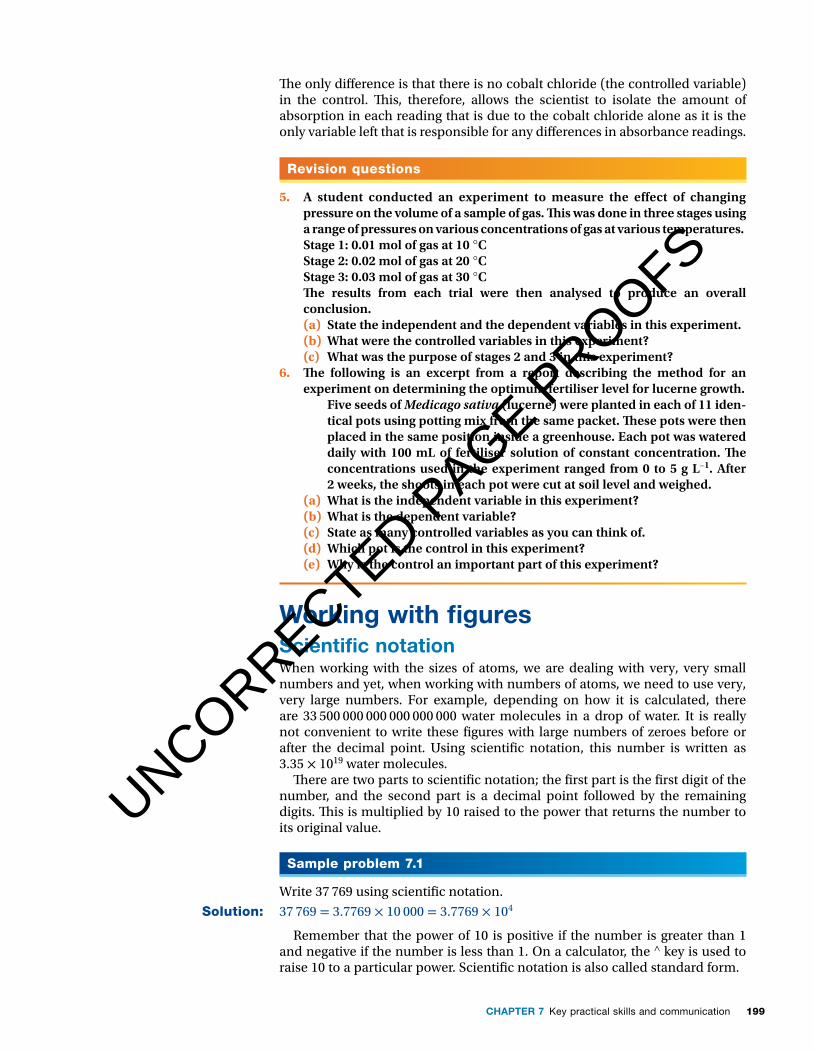
What is the reading on this burette?
30
29
29.65
The reading at the bottom of the meniscus is 29.65 mL.
Revision questions
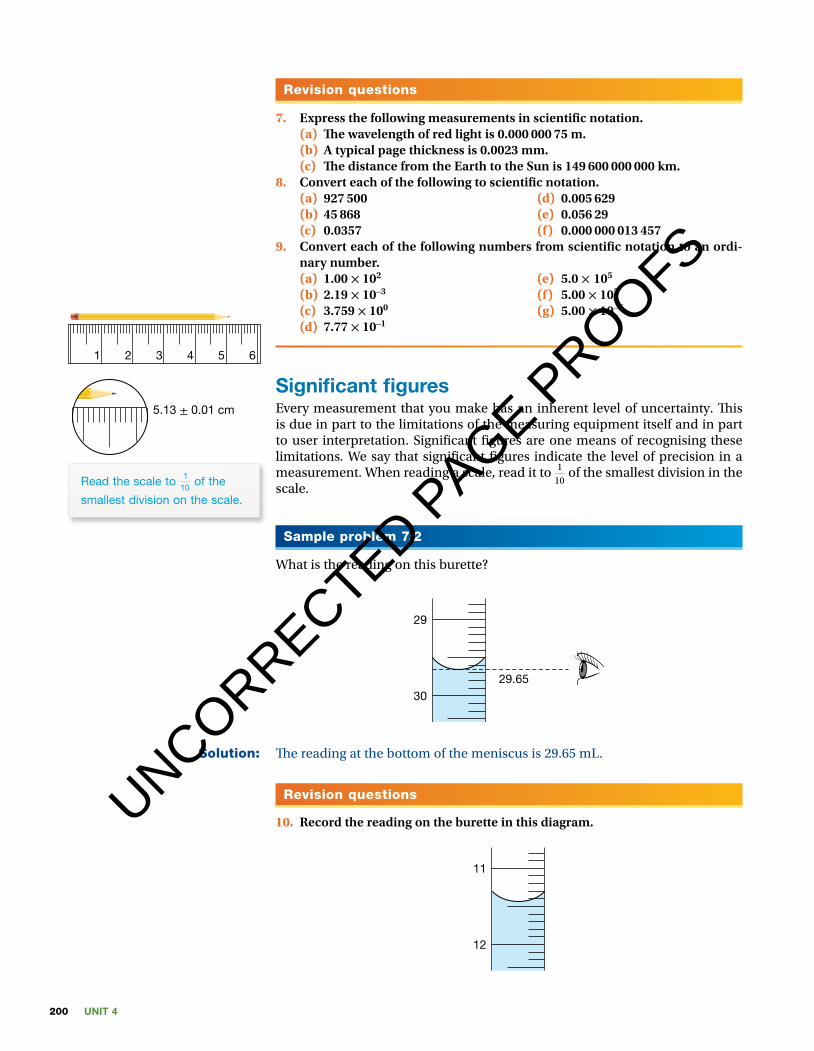
10. Record the reading on the burette in this diagram.
12
11
1 2 3 4 5 6
5.13 ± 0.01 cm
Read the scale to 110
of the
smallest division on the scale.
Solution:
UNCORRECTED PAGE P
ROOFS
201CHAPTER 7 Key practical skills and communication
11. Explain why a student reading this burette as 8.67 mL is incorrect.
8
7
How do we count significant figures?When calculations are to be made from different measurements, it is impor-tant that we are able to assess the number of significant figures in each measurement. We can then quote the answer to an appropriate level of precision.
In assessing the number of significant figures in a measurement, we use two rules:• All non-zero digits are counted.• Zeros are counted if they come after a non-zero digit.
Examples• A burette reading of 21.37 mL has 4 significant figures.• A pipette reading of 20.00 mL has 4 significant figures.• A measurement of 100 mL from a gas syringe has 3 significant figures.• A mass of 1.003 g has 4 significant figures.• A mass of 0.003 g has 1 significant figure.• A mass of 0.300 g has 3 significant figures.Note: Significant figures are not the same as decimal places. If a measure-ment is expressed in standard form, significant figures are counted from the decimal part only. For example, the Avogadro constant, when expressed as 6.02 × 10²³, contains 3 significant figures. The digits in the index are not counted.
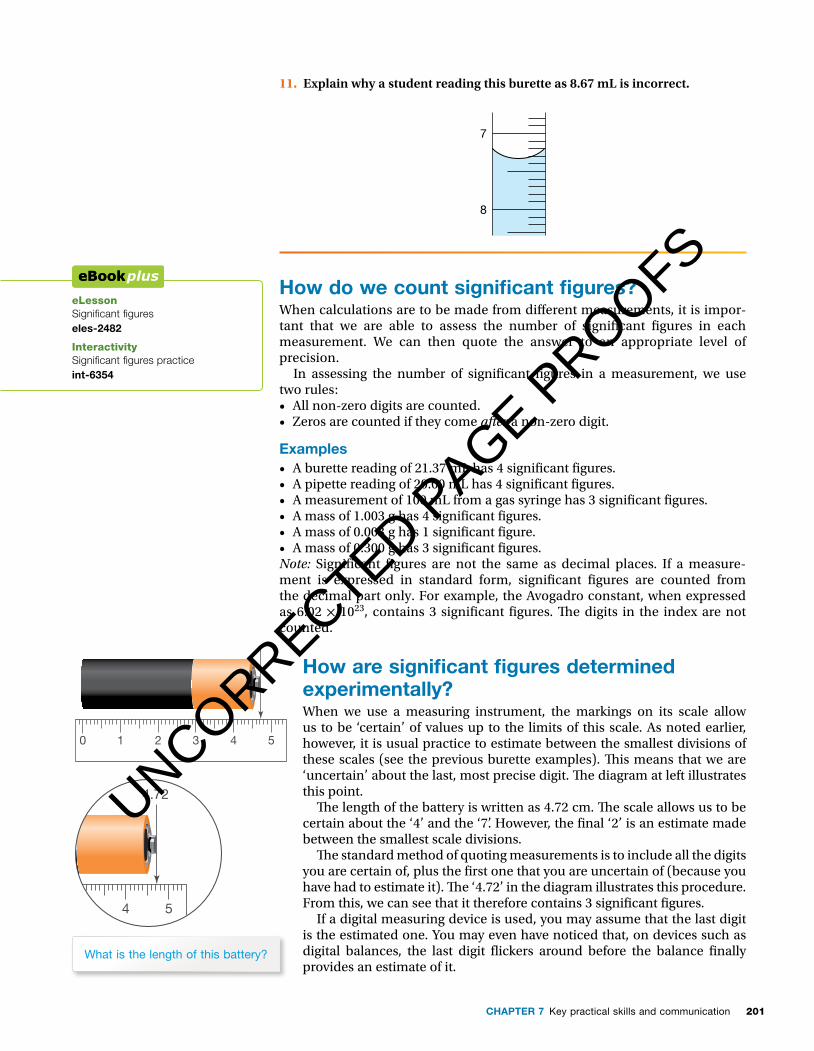
How are significant figures determined experimentally?When we use a measuring instrument, the markings on its scale allow us to be ‘certain’ of values up to the limits of this scale. As noted earlier, however, it is usual practice to estimate between the smallest divisions of these scales (see the previous burette examples). This means that we are ‘uncertain’ about the last, most precise digit. The diagram at left illustrates this point.
The length of the battery is written as 4.72 cm. The scale allows us to be certain about the ‘4’ and the ‘7’. However, the final ‘2’ is an estimate made between the smallest scale divisions.
The standard method of quoting measurements is to include all the digits you are certain of, plus the first one that you are uncertain of (because you have had to estimate it). The ‘4.72’ in the diagram illustrates this procedure. From this, we can see that it therefore contains 3 significant figures.
If a digital measuring device is used, you may assume that the last digit is the estimated one. You may even have noticed that, on devices such as digital balances, the last digit flickers around before the balance finally provides an estimate of it.
eLessonSignificant figureseles-2482
InteractivitySignificant figures practice int-6354
0 1 2 3 4 5
3 4 5
4.72
What is the length of this battery?
UNCORRECTED PAGE P
ROOFS
UniT 4202
Significant figures and calculationsThe number of significant figures allowed in any calculated answer is governed by the number of significant figures in the least precise value from which that answer is calculated.
If a calculation involves defined conversion constants, these are not counted. Remember that it is only the measurements that are considered.
Working with significant figures• When multiplying or dividing, the answer is written to the smallest
number of significant digits.• When adding or subtracting, the answer is written to the smallest
number of decimal places.
Sample problem 7.3
In determining the density of a particular liquid, a student measured the volume of a sample as 8.3 mL. She then weighed the same sample and obtained a mass of 7.2136 g. Calculate the density to the correct level of precision.
densitymass
volume
7.2136
8.3
(5 significant figures)
(2 significant figures)
=
=
= 0.8691 (This needs to be rounded to 2 significant figures.)
= 0.87 g mL−1
Revision questions
12. How many significant figures are there in each of the following measurements?(a) Ar(H) = 1.007 94(b) Ar(H) = 1.00
(c) 42.450 g(d) –273.14 °C
13. Calculate the following to the correct number of decimal places.(a) 57.45 + 3.349(b) 3.45 – 2.4(c) 23.9636 + 43.875
(d) 35.356 – 24(e) 34.984 573 + 0.1(f) 4.275 – 6.45
14. Solve the following problems, giving your answers with the correct unit and number of significant figures.(a) energy evolved (hexane) = 5.32 mol × 4.158 kJ mol–1
(b) ( )Cl0.23 g
35.5 g mol 1n = −
(c) m(ethanol) = 0.79 g mL–1 × 20.00 mL(d) energy added = 5.2 °C × 1.00 × 102 × 4.18 J g–1 °C g–1
An ambiguous caseIn the third example listed on page 201, a gas syringe with a volume of 100 mL was quoted as having 3 significant figures. Because a gas syringe is quite an accurate piece of equipment for measuring gas volumes, this statement is almost certainly true. However, what if the measurement was given as 100 mL with no indication of what was used to measure it? The problem with measure-ments such as this (and others such as 25 000 and 3500) is that zeros are used to
Solution:
UNCORRECTED PAGE P
ROOFS
203CHAPTER 7 Key practical skills and communication
mathematically allocate place value. This can cause confusion about whether they also indicate precision and uncertainty.
Let us take a closer look at this. Suppose a student has gone to a football game with a newly invented instrument called a ‘crowdometer’. By simply scanning the crowd with this instrument, it can tell her how many people are present. When she does this, it returns a reading of 45 000. This could mean any (or more) of the following:• There are between 44 999 and 50 001 people present, with 45 000 being the
best estimate (5 significant figures).• There are between 44 000 and 46 000 people present, with 45 000 being the
best estimate (2 significant figures).• There are between 40 000 and 50 000 people present, with 45 000 being the
best estimate (2 significant figures).In the first case, the last zero in 45 000 is uncertain and is presented as a
‘best estimate’. In this instance, 45 000 has 5 significant figures.In the second and third cases, however, it is the 5 in 45 000 that is uncertain
and it represents a ‘best estimate’. The 45 000 in these cases therefore has only 2 significant figures, with the three zeros being required to indicate that we are measuring in ‘thousands’.
There are two ways to overcome this ambiguity:• Use scientific notation. If the crowd figure is written as 4.5000 × 10⁴ or
4.50 × 10⁴, the number of significant figures is immediately clear (5 and 3, respectively). A recording of 4.500 × 10⁴ would indicate 4 significant figures with the uncertainty being the digit in the tens position.
• By indicating the level of uncertainty with the ± notation, as explained below.
Errors and uncertaintiesThe ideas of errors and uncertainties are related to the topic of significant figures.
Errors cause the value of a measurement to change. The errors associated with taking a measurement cause its value to be different from the true value. Errors (no matter how small) are present in every measurement we make. There are two types of errors:• Random errors cause measurements to be sometimes higher than their true
values and sometimes lower. The effect of random errors can therefore be minimised by doing a large number of measurements and averaging them.
• Systematic errors are always biased the same way. In other words, they cause values to be always too high or always too low. The effect of systematic errors cannot be minimised by multiple observations and averaging.Uncertainty is an extension of significant figures. A plus/minus notation is
used to indicate the possible range of values for the last significant figure. For example, when using an electronic balance, a student might record the result as:
35.964 ± 0.002 g
As discussed above, the use of 35.964 indicates that the ‘4’ is the digit that we are least certain of. The ‘4’ is our ‘best estimate’. The uncertainty of ± 0.002 indi-cates how uncertain we are. In effect, we are stating that the measured mass could reasonably be expected to lie between 35.962 g and 35.966 g.
Applying this to the ‘crowdometer’ mentioned previously, if the results are quoted as 45 000 ± 10 or as 45 000 ± 5000, it is immediately obvious how pre-cise the measurement is. It is, therefore, easy to locate the digit that represents the ‘best estimate’ and hence the number of significant figures.
Students often confuse errors with mistakes. Errors are present in every investigation and it should be the aim of the experimenter to minimise them. Mistakes, however, are just ‘things done wrongly’. There is no excuse for mis-takes in an experiment or a report. If something is done wrongly, you simply fix it and do it again!
UNCORRECTED PAGE P
ROOFS
UniT 4204
Reliability and accuracyThese are two further terms that you may come across in a formal analysis of errors.
Accuracy, as the name suggests, represents how close the measured data is to the true (or accepted) value. However, it should be remembered that, in many experiments, the true value is not known. Accuracy depends on the quality of the equipment and the skill of the investigator.
Reliability refers to the consistency with which a measurement can be repeated. It is not the same as accuracy. For example, if an object is weighed on a balance by a number of students, all of the values obtained should be similar — we would say that they are reliable. If, however, the balance had not been tared correctly and was reading 3 g too much, there would be a system-atic error present that would result in these weights not being accurate.
Tables and graphsTables are one of the best ways for organising large amounts of data. They can also organise the results of calculations made from that data. Tables can show patterns, suggest relationships between observations and indicate the pre-cision with which measurements have been made.
All tables should:• have a heading• display the data in some type of logical order. For example, they should
show the independent variable in the left-hand column and in increasing value.
• include units in the column headings. This removes clutter from the data entry columns.
• be designed to be easy to read. If a table becomes too complicated, it is better to break it down into a number of smaller tables. The same applies if you have a very large amount of data to display. In most cases, tables contain the independent variable in the left-hand
column, with value(s) for the dependent variable(s) in columns to the right. It is generally accepted practice to show the values for variables in columns rather than rows.
Graphs are a logical complement to tables. A graph can be a powerful tool when determining patterns and exact relationships between numeric vari-ables. Often a relationship may be suggested by a table, and a graph can then be used to establish the precise nature of such a relationship.
Graphs have many other uses as well. Where non-numeric variables are involved, they may, in fact, be more appropriate than tables for displaying data. Pie charts, bar and column graphs often fit into this category.
When drawing graphs:• decide on the type of graph to be used. Different types of information are
better suited to different types of graphs. For example, an investigation into the number of oxidation states of the first series transition metals would be best presented as a column graph, whereas data to draw a calibration curve for an analytical instrument would require a line graph.
• no matter what type of graph you draw, it must have a title that reflects the information it contains. This often includes the variables involved in the col-lection of the data.
• axes should be ruled and each should be clearly labelled. Those displaying numerical variables should have a clearly marked scale and units. There should be enough values for the reader to easily understand the scale being used. Avoid marking large numbers of scale points and therefore leading to visual clutter.
UNCORRECTED PAGE P
ROOFS
205CHAPTER 7 Key practical skills and communication
• make sure your scale is suitable. The points you plot should be distributed across as much of your graph as possible, rather than clustered in a tiny section. To achieve this, it may not be appropriate to start a scale at zero. If this is the case, make certain that you clearly indicate this by following the usual conventions for this procedure.
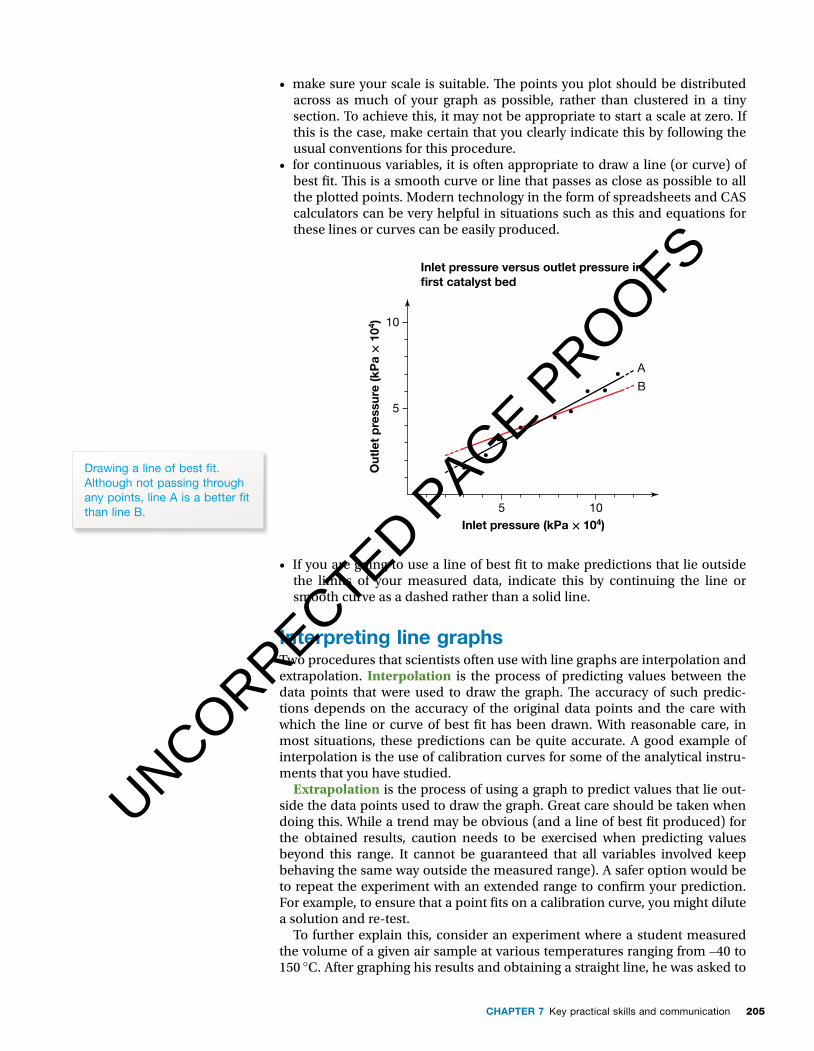
• for continuous variables, it is often appropriate to draw a line (or curve) of best fit. This is a smooth curve or line that passes as close as possible to all the plotted points. Modern technology in the form of spreadsheets and CAS calculators can be very helpful in situations such as this and equations for these lines or curves can be easily produced.
5 10
A
B
5
10
Out
let
pre
ssur
e (k
Pa
× 1
04 )
Inlet pressure (kPa × 104)
Inlet pressure versus outlet pressure in first catalyst bed
• If you are going to use a line of best fit to make predictions that lie outside the limits of your measured data, indicate this by continuing the line or smooth curve as a dashed rather than a solid line.
interpreting line graphsTwo procedures that scientists often use with line graphs are interpolation and extrapolation. Interpolation is the process of predicting values between the data points that were used to draw the graph. The accuracy of such predic-tions depends on the accuracy of the original data points and the care with which the line or curve of best fit has been drawn. With reasonable care, in most situations, these predictions can be quite accurate. A good example of interpolation is the use of calibration curves for some of the analytical instru-ments that you have studied.
Extrapolation is the process of using a graph to predict values that lie out-side the data points used to draw the graph. Great care should be taken when doing this. While a trend may be obvious (and a line of best fit produced) for the obtained results, caution needs to be exercised when predicting values beyond this range. It cannot be guaranteed that all variables involved keep behaving the same way outside the measured range). A safer option would be to repeat the experiment with an extended range to confirm your prediction. For example, to ensure that a point fits on a calibration curve, you might dilute a solution and re-test.
To further explain this, consider an experiment where a student measured the volume of a given air sample at various temperatures ranging from –40 to 150 °C. After graphing his results and obtaining a straight line, he was asked to
Drawing a line of best fit. Although not passing through any points, line A is a better fit than line B.
UNCORRECTED PAGE P
ROOFS
UniT 4206
predict the volume at –180 °C. While extrapolation to values just outside the above range might be justified, –180 °C is far enough outside this range that any value predicted would be have to be treated with caution. In this case, –180 °C is only just above the boiling temperature of oxygen (–183 °C) and so other variables will almost certainly be affecting the volume.
Revision questions
15. What is the difference between systematic and random errors in an experi-ment? How can the effects of each be minimised?
16. The following is an extract from a student’s logbook where the temperature was recorded at regular intervals during an experiment.
Initial temperature = 15.0 °C Temperature every 30 seconds after (°C) = 16.5, 18.1, 19.5, 20.8, 22.4, 23.7,
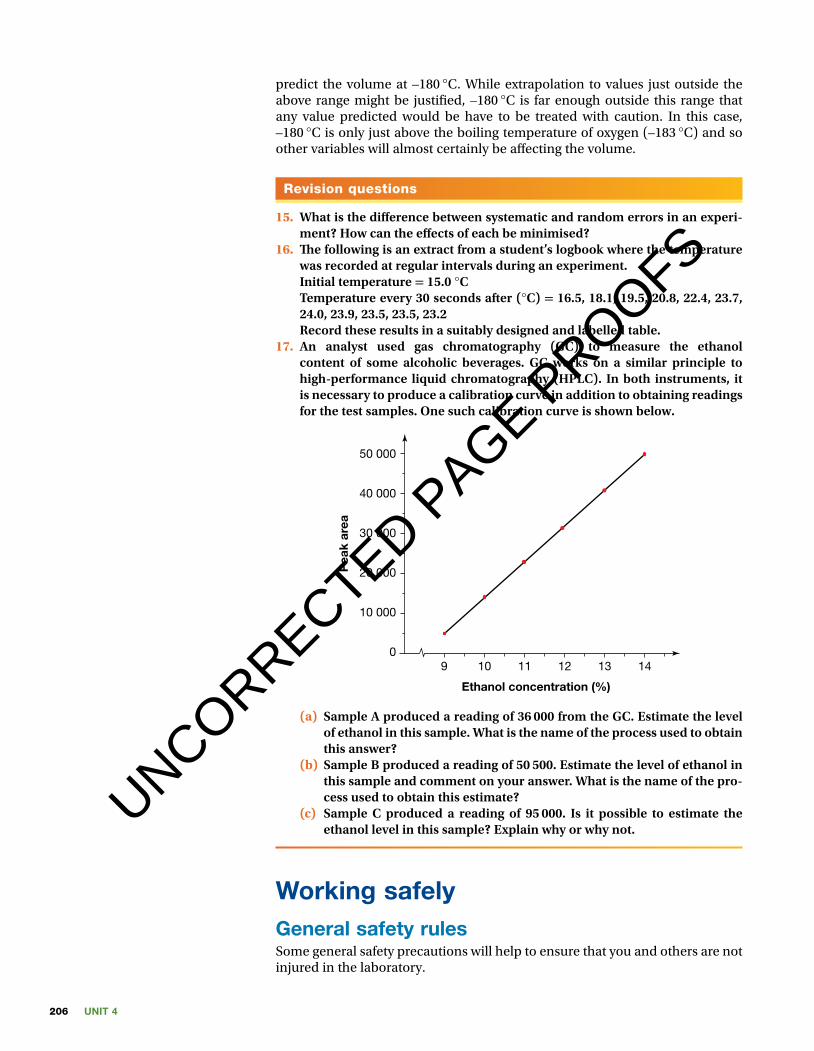
24.0, 23.9, 23.5, 23.5, 23.2 Record these results in a suitably designed and labelled table.17. An analyst used gas chromatography (GC) to measure the ethanol
content of some alcoholic beverages. GC works on a similar principle to high-performance liquid chromatography (HPLC). In both instruments, it is necessary to produce a calibration curve in addition to obtaining readings for the test samples. One such calibration curve is shown below.
50 000
40 000
30 000
20 000
10 000
09 10 11 12 13 14
Ethanol concentration (%)
Pea
k ar
ea
(a) Sample A produced a reading of 36 000 from the GC. Estimate the level of ethanol in this sample. What is the name of the process used to obtain this answer?
(b) Sample B produced a reading of 50 500. Estimate the level of ethanol in this sample and comment on your answer. What is the name of the pro-cess used to obtain this estimate?
(c) Sample C produced a reading of 95 000. Is it possible to estimate the ethanol level in this sample? Explain why or why not.
Working safelyGeneral safety rulesSome general safety precautions will help to ensure that you and others are not injured in the laboratory.
UNCORRECTED PAGE P
ROOFS
207CHAPTER 7 Key practical skills and communication
• Wear protective clothing. This might include laboratory coat, safety glasses and gloves.
• Be aware of the position of safety equipment such as fire blanket, fire extinguisher, safety shower and eye wash.
• Ask if you are unsure how to operate equipment or how to use apparatus.• Read labels carefully to confirm contents and concentration of chemicals.• Clean and return all equipment to the correct places.• Read instructions carefully before commencing an experiment.• Prepare a risk assessment for required chemicals and equipment.
Risk assessmentsRisk assessment is a procedure for identifying hazardous chemicals, what the risks are and how to work safely with them. Table 7.1 lists the usual require-ments for a written risk assessment.
TABLE 7.1 Requirements for a written risk assessment
summary of method brief list of steps indicating how the chemicals and equipment will be used
chemicals used list of chemicals used and their concentrations
chemical hazards details of the hazards caused by the chemicals. These can be found by looking at the MSDS (materials safety data sheets), which can be accessed online.
risk control methods precautions taken to limit risks. This will depend on the chemicals involved.
equipment list of materials used in the experiment
equipment risk list of hazards associated with the equipment
risk control measures how the risks associated with the equipment will be minimised
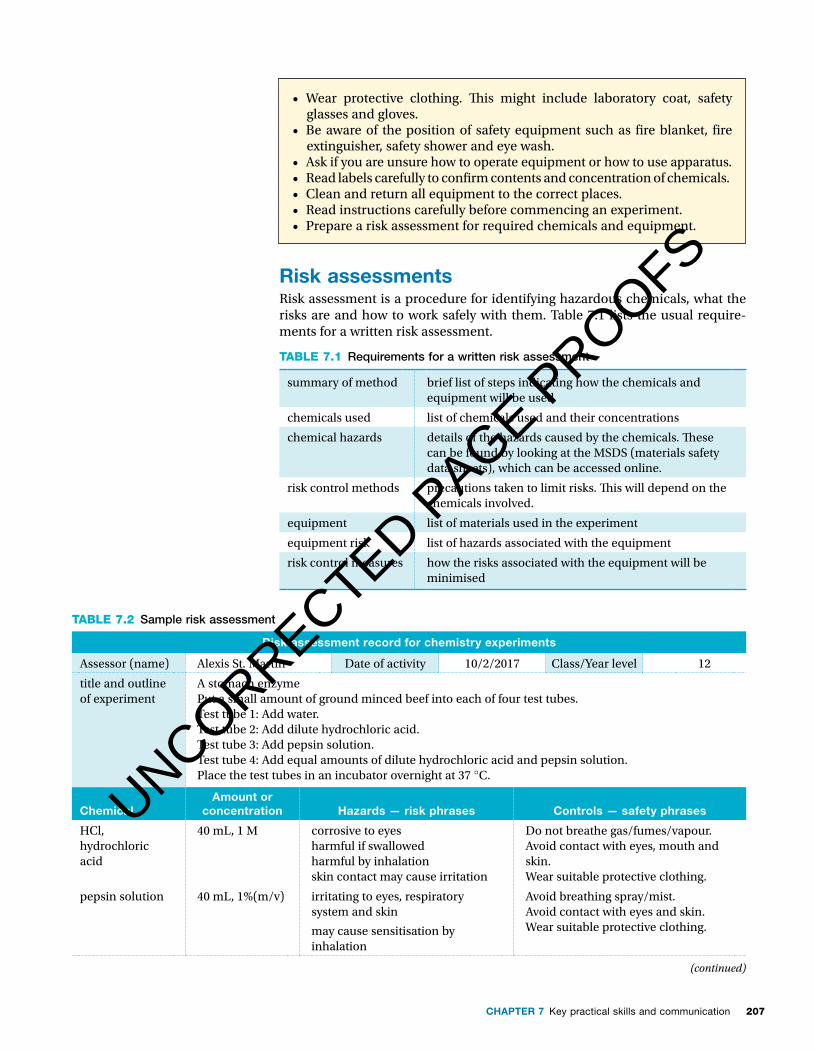
TABLE 7.2 Sample risk assessment
Risk assessment record for chemistry experiments
Assessor (name) Alexis St. Martin Date of activity 10/2/2017 Class/Year level 12
title and outline of experiment
A stomach enzymePut a small amount of ground minced beef into each of four test tubes. Test tube 1: Add water.Test tube 2: Add dilute hydrochloric acid.Test tube 3: Add pepsin solution.Test tube 4: Add equal amounts of dilute hydrochloric acid and pepsin solution. Place the test tubes in an incubator overnight at 37 °C.
Chemical
Amount or concentration
Hazards — risk phrases
Controls — safety phrases
HCl, hydrochloric acid
40 mL, 1 M corrosive to eyesharmful if swallowedharmful by inhalationskin contact may cause irritation
Do not breathe gas/fumes/vapour.Avoid contact with eyes, mouth and skin.Wear suitable protective clothing.
pepsin solution 40 mL, 1%(m/v) irritating to eyes, respiratory system and skin
may cause sensitisation by inhalation
Avoid breathing spray/mist.Avoid contact with eyes and skin.Wear suitable protective clothing.
(continued)
UNCORRECTED PAGE P
ROOFS
UniT 4208
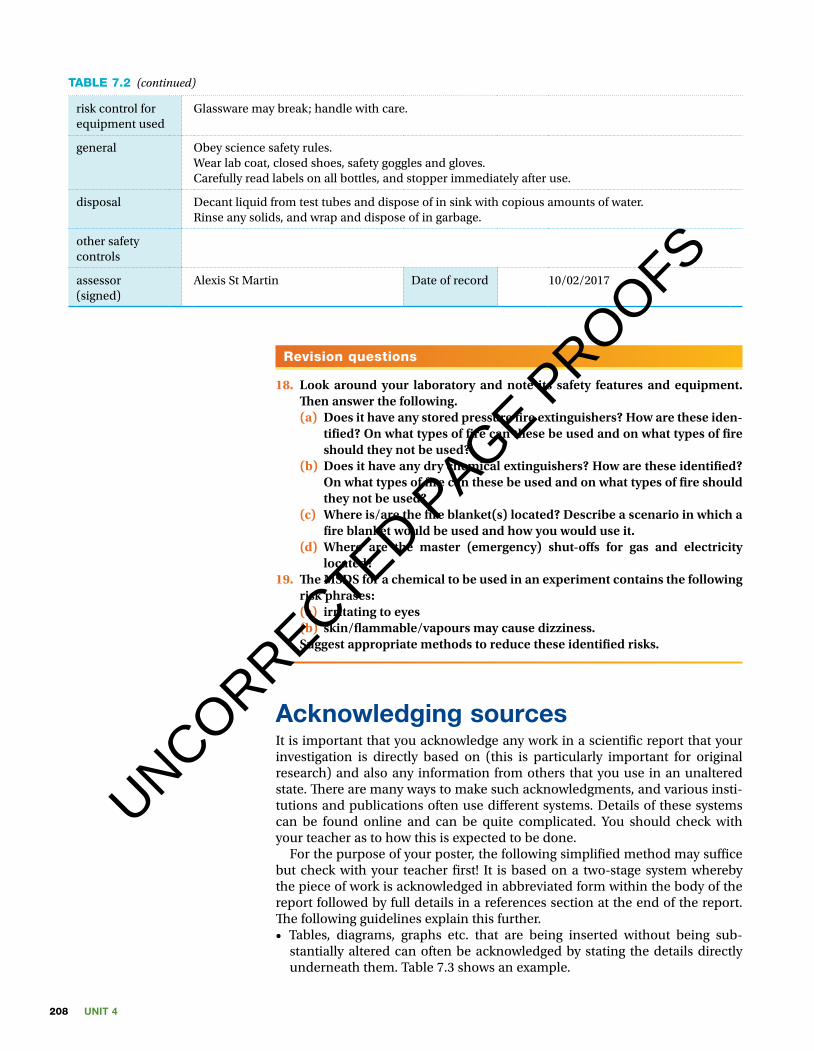
TABLE 7.2 (continued)
risk control for equipment used
Glassware may break; handle with care.
general Obey science safety rules.Wear lab coat, closed shoes, safety goggles and gloves.Carefully read labels on all bottles, and stopper immediately after use.
disposal Decant liquid from test tubes and dispose of in sink with copious amounts of water.Rinse any solids, and wrap and dispose of in garbage.
other safety controls
assessor (signed)
Alexis St Martin Date of record 10/02/2017
Revision questions
18. Look around your laboratory and note its safety features and equipment. Then answer the following.(a) Does it have any stored pressure fire extinguishers? How are these iden-
tified? On what types of fire can these be used and on what types of fire should they not be used?
(b) Does it have any dry chemical extinguishers? How are these identified? On what types of fire can these be used and on what types of fire should they not be used?
(c) Where is/are the fire blanket(s) located? Describe a scenario in which a fire blanket would be used and how you would use it.
(d) Where are the master (emergency) shut-offs for gas and electricity located?
19. The MSDS for a chemical to be used in an experiment contains the following risk phrases:(a) irritating to eyes (b) skin/flammable/vapours may cause dizziness.
Suggest appropriate methods to reduce these identified risks.
Acknowledging sourcesIt is important that you acknowledge any work in a scientific report that your investigation is directly based on (this is particularly important for original research) and also any information from others that you use in an unaltered state. There are many ways to make such acknowledgments, and various insti-tutions and publications often use different systems. Details of these systems can be found online and can be quite complicated. You should check with your teacher as to how this is expected to be done.
For the purpose of your poster, the following simplified method may suffice but check with your teacher first! It is based on a two-stage system whereby the piece of work is acknowledged in abbreviated form within the body of the report followed by full details in a references section at the end of the report. The following guidelines explain this further.• Tables, diagrams, graphs etc. that are being inserted without being sub-
stantially altered can often be acknowledged by stating the details directly underneath them. Table 7.3 shows an example.
UNCORRECTED PAGE P
ROOFS
209CHAPTER 7 Key practical skills and communication
TABLE 7.3 Energy content of commonly available sleigh fuels
Fuel Energy content (kJ L–1)
Rudolphene 45
Polar plus 29
Super sleigh 53
(Claus, 2016, p. 45)
In the list of references, this might then be quoted as follows:Claus S. (2016). Choosing a sleigh fuel. Polar Press.
• Direct quotes should be followed by either an abbreviated reference (in brackets) or a ‘numerical indicator’ such as a superscript that refers to your list of references at the end of the report. The same applies to the authors of any work that you are using as a basis for your investigation. For example, the introduction to a report on sleigh fuels may contain the following:
. . . over the past 10 years, the number of eligible children has increased (Kringle, 2008) and a need has therefore developed for sleighs to travel faster to meet the required delivery schedule. More efficient fuels are required for this purpose.
The reference list might then contain:
Kringle, K. (2008). Journal of Polar Transport, Vol. 34, p. 356.
Another method of making such an acknowledgment looks like this:
. . . over the past 10 years, the number of eligible children has increased5 and a need has therefore developed for sleighs to travel faster to meet the required delivery schedule. More efficient fuels are required for this purpose.
The reference list might then contain:5 Kringle, K. (2008). Journal of Polar Transport, Vol. 34, p. 356.
BibliographiesA reference list contains full details of all sources (print, electronic and verbal) that are referred to in the report, arranged alphabetically by author. A bibli-ography, on the other hand, is a list of references that have been found useful in planning the investigation, but not referred to directly in your report.
Revision question
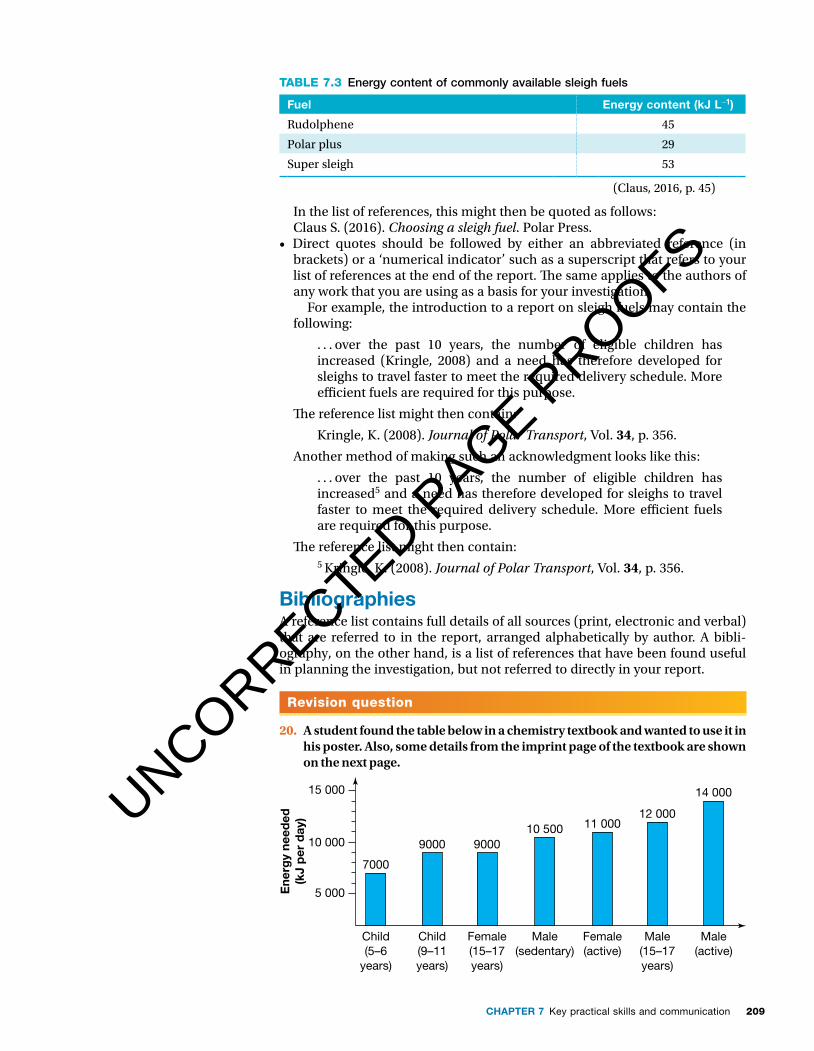
20. A student found the table below in a chemistry textbook and wanted to use it in his poster. Also, some details from the imprint page of the textbook are shown on the next page.
15 000
10 000
5 000
Child(5–6
years)
Child(9–11years)
Female(15–17years)
Male(sedentary)
Female(active)
Male(15–17years)
Male(active)
7000
9000 900010 500 11 000
12 000
14 000
Ene
rgy
need
ed(k
J p
er d
ay)UNCORRECTED P
AGE PROOFS

UniT 4210
Show how this work could be acknowledged:(a) in the body of the poster(b) in the references section at the end of the poster.
UNCORRECTED PAGE P
ROOFS
211CHAPTER 7 Key practical skills and communication
Chapter review
Multiple choice questions 1. 40 mL of a solution could be most accurately
measured using a:A 50 mL beakerB 50 mL buretteC 50 mL pipetteD 50 mL measuring cylinder.
2. Any unused chemical should always be:A returned to its original containerB placed in a new containerC disposed of in a labelled waste containerD poured down the sink.
3. Using a solution that has the incorrect molarity marked on the label is an example of a:A systematic errorB random errorC reading errorD parallax error.
4. The independent variable in an experiment is:A the variable that is observed in an experimentB the variable that is changed in an experimentC the variable that is kept the same in an
experimentD none of the above.
5. Qualitative results are:A results that are expected to be observed during
an experimentB results that are measured in an experimentC results that are observed during an experimentD none of the above.
6. The safest way to treat an acid spill on the skin is to:A wash the skin with a base such as dilute
sodium hydroxideB wash the skin under running waterC sprinkle sodium bicarbonate on the skinD wipe the skin with paper towel immediately.
7. The definition of accuracy is:A the number of significant figures used in a
measurementB how close the measured value is to the actual
valueC a measure of how often an experimental value
can be reproducedD none of the above.
Review questions 1. Why is it important to conduct scientific tests more
than once? 2. What is the difference between the dependent and
independent variable? 3. You perform an experiment and record
observations and data. You notice some of the data does not fit with what you expected or does not agree with the other data. What should you do?
4. The alcohol 2-methylpropan-1-ol can be converted through a number of steps to produce diesel and jet fuel. If the viscosity of a fuel is not within a certain range then it can cause damage to the fuel pump and engine.
A student was asked to design an experiment to compare the viscosity of some fuels. Suggest an experiment that could be done to compare viscosities.
5. Stephen decided to investigate how the rate of reaction is affected by the concentration of acid. He weighed out 3.00 g of calcium carbonate powder and put it in a balloon. He put on some safety gloves and added 50 mL of 1.0 M ethanoic acid to a flask and then stretched the balloon over the opening of the flask before mixing the two chemicals. When the bubbling stopped, he weighed the balloon and flask again. He repeated the experiment again using 3.00 g of calcium carbonate powder but used 50 mL of 2.0 M hydrochloric acid. He found that changing the concentration had little effect on the rate of reaction because there was hardly any change in mass.(a) Comment on the safety precautions taken.(b) Evaluate the experimental design.(c) Rewrite the method correctly.
UNCORRECTED PAGE P
ROOFS


![G etinogn: sal Pter - [24]7.ai](https://img.pdfslide.us/doc/110x75/6177d4218b55f809c60e8dca/g-etinogn-sal-pter-247ai.jpg)

