Embed Size (px)
Citation preview

Unit 2a (2017 – 18): Population
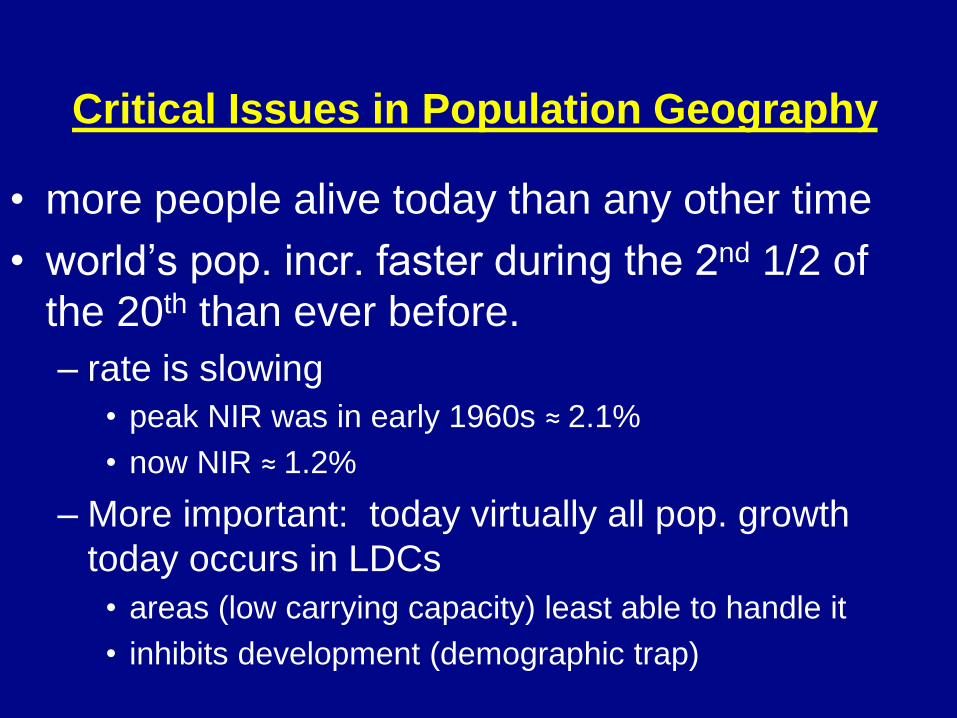
Critical Issues in Population Geography
• more people alive today than any other time
• world’s pop. incr. faster during the 2nd 1/2 of
the 20th than ever before.
– rate is slowing
• peak NIR was in early 1960s ≈ 2.1%
• now NIR ≈ 1.2%
– More important: today virtually all pop. growth
today occurs in LDCs
• areas (low carrying capacity) least able to handle it
• inhibits development (demographic trap)
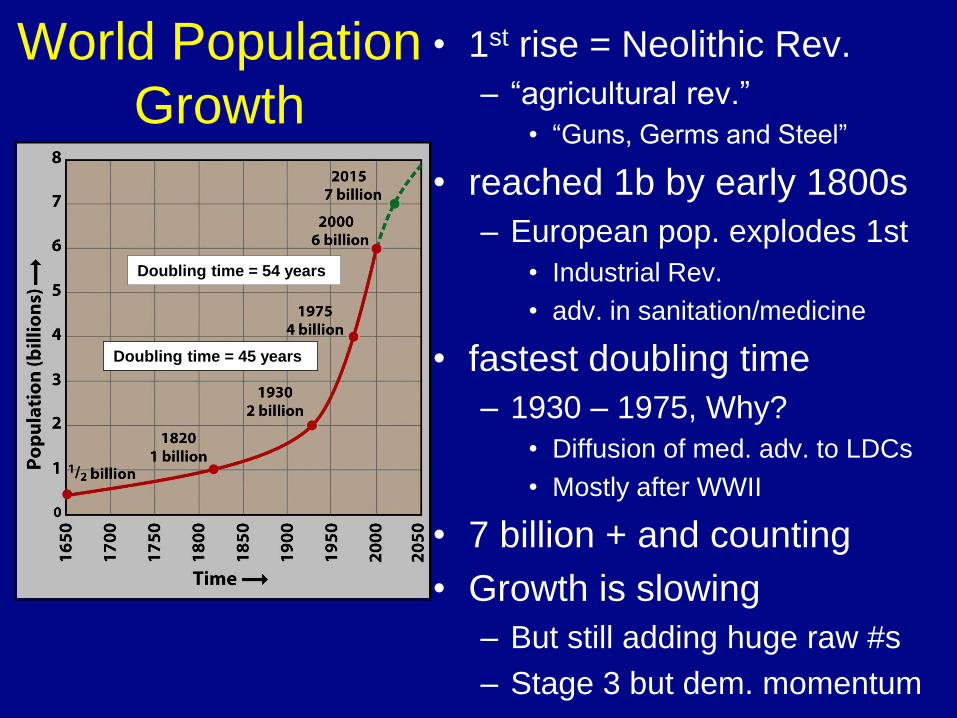
World Population
Growth
• 1st rise = Neolithic Rev.
– “agricultural rev.”
• “Guns, Germs and Steel”
• reached 1b by early 1800s
– European pop. explodes 1st
• Industrial Rev.
• adv. in sanitation/medicine
• fastest doubling time
– 1930 – 1975, Why?
• Diffusion of med. adv. to LDCs
• Mostly after WWII
• 7 billion + and counting
• Growth is slowing
– But still adding huge raw #s
– Stage 3 but dem. momentum
Doubling time = 54 years
Doubling time = 45 years
Where Is the World’s Population Distributed?
• Arithmetic density (total pop./total area) • “population density”
• Physiological density (total pop./arable land) • High may mean resources are stretched
– Must feed more people on less land
– Difference between arithmetic and physiological?
» Lots of land unsuitable for farming or unproductive
Where Is the World’s Population Distributed?
• The ecumene
– permanently settled area of world
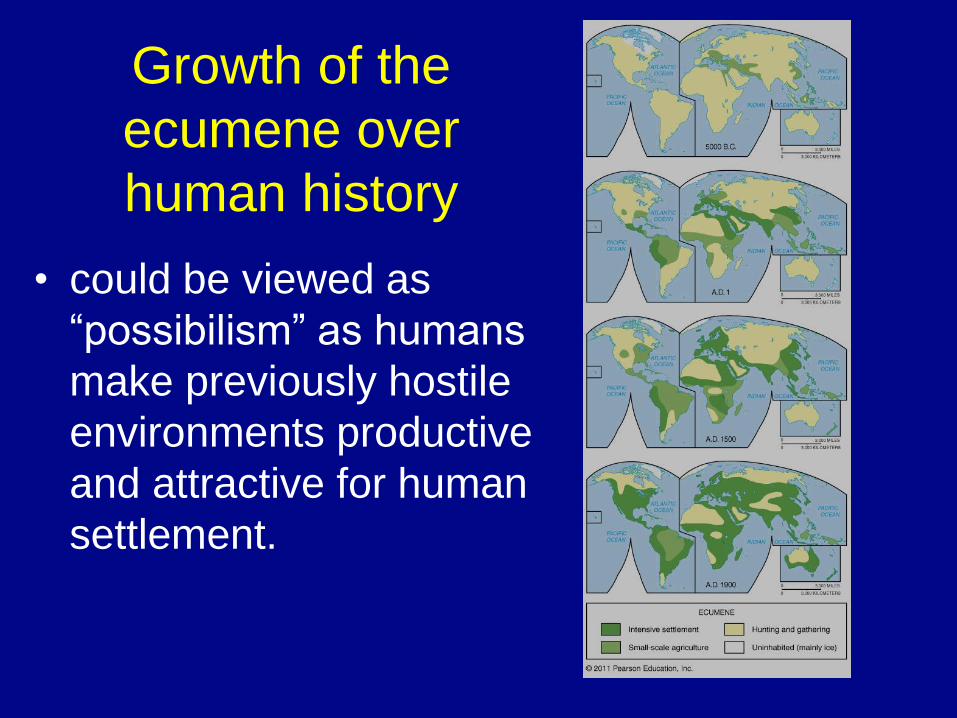
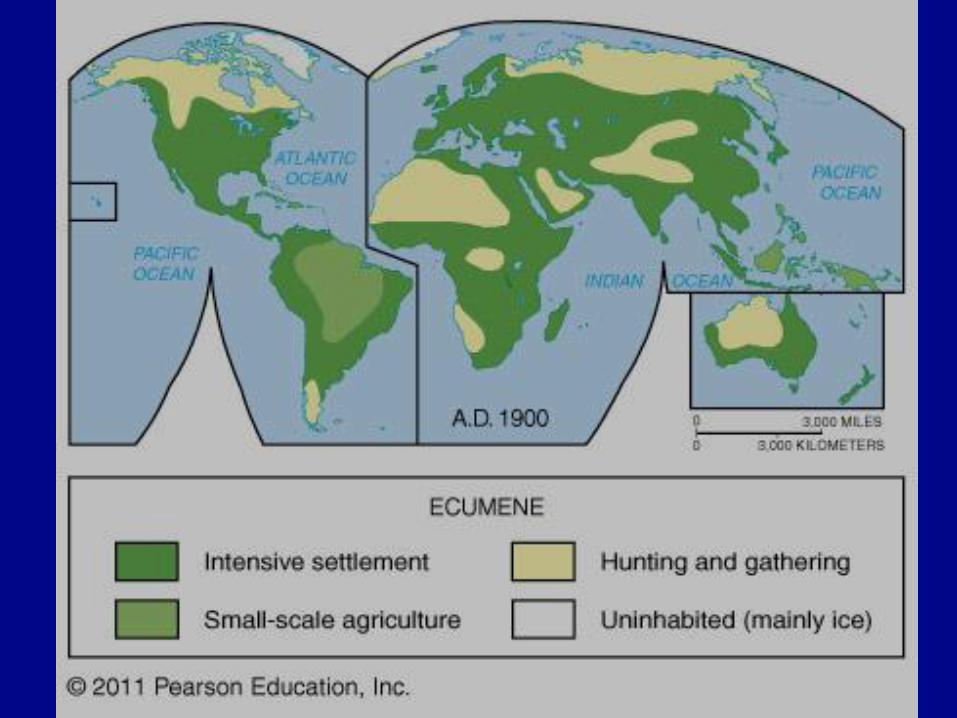
Growth of the
ecumene over
human history
• could be viewed as
“possibilism” as humans
make previously hostile
environments productive
and attractive for human
settlement.
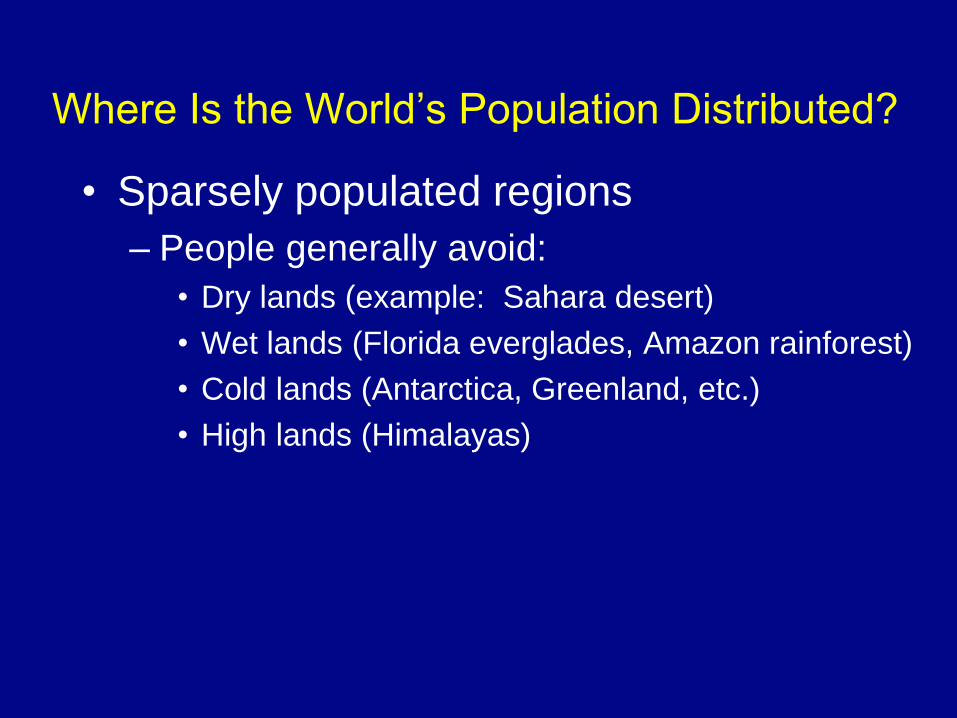
Where Is the World’s Population Distributed?
• Sparsely populated regions
– People generally avoid:
• Dry lands (example: Sahara desert)
• Wet lands (Florida everglades, Amazon rainforest)
• Cold lands (Antarctica, Greenland, etc.)
• High lands (Himalayas)

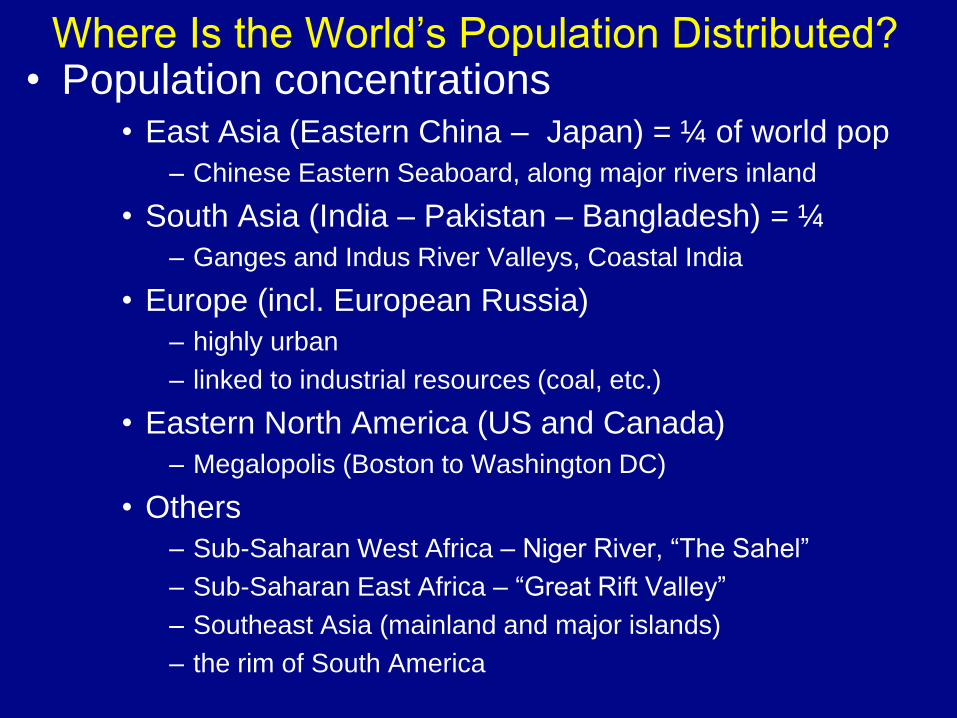
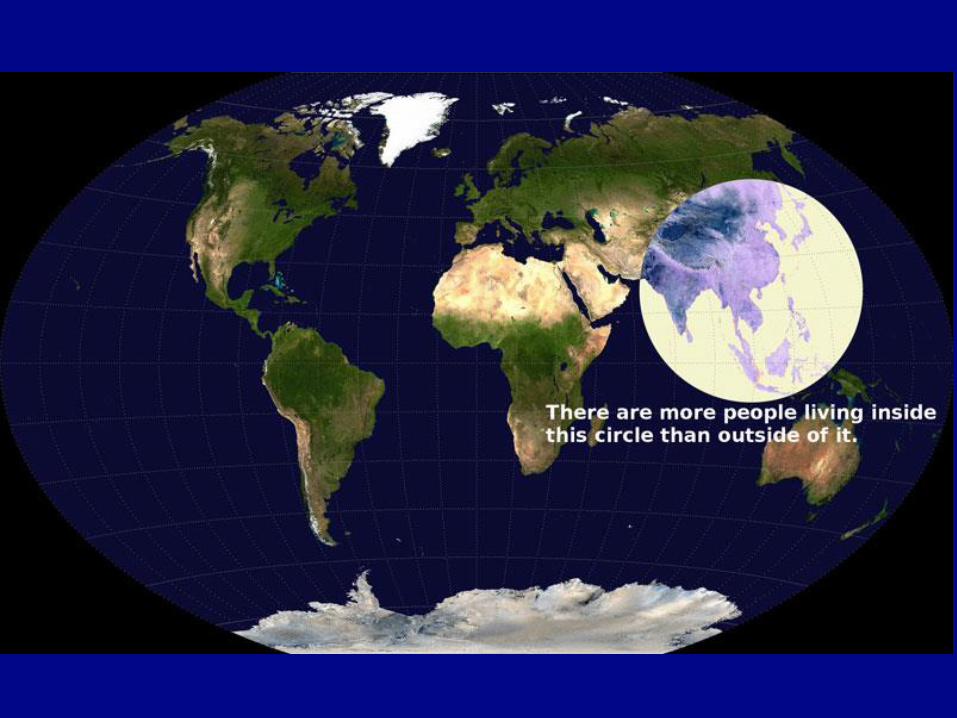
Where Is the World’s Population Distributed? • Population concentrations
• East Asia (Eastern China – Japan) = ¼ of world pop
– Chinese Eastern Seaboard, along major rivers inland
• South Asia (India – Pakistan – Bangladesh) = ¼
– Ganges and Indus River Valleys, Coastal India
• Europe (incl. European Russia)
– highly urban
– linked to industrial resources (coal, etc.)
• Eastern North America (US and Canada)
– Megalopolis (Boston to Washington DC)
• Others
– Sub-Saharan West Africa – Niger River, “The Sahel”
– Sub-Saharan East Africa – “Great Rift Valley”
– Southeast Asia (mainland and major islands)
– the rim of South America

Population Distribution (compare to previous list)
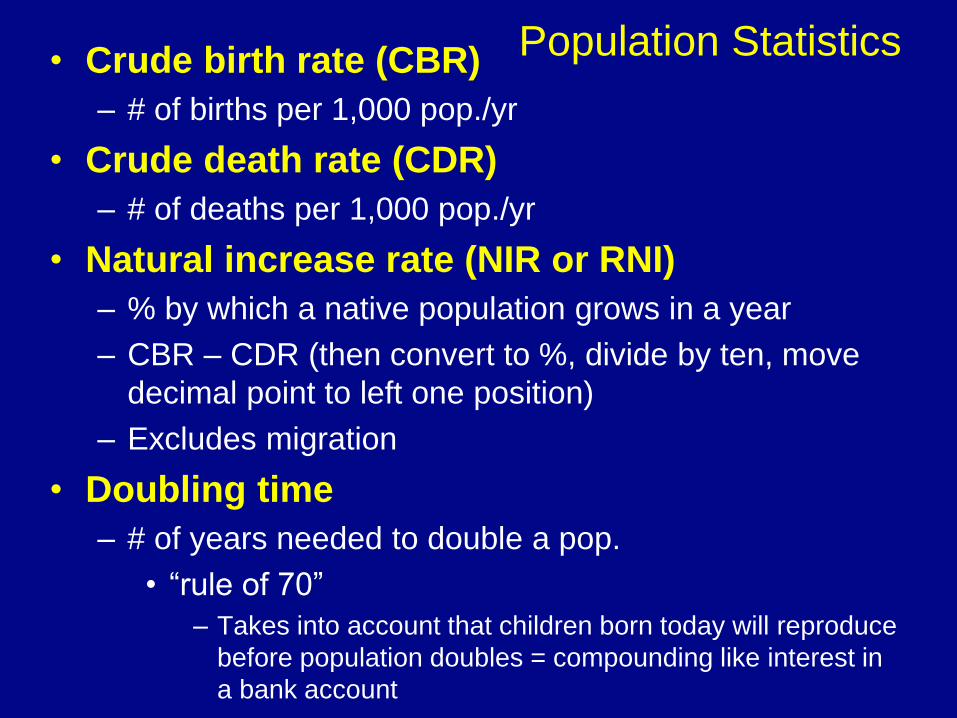
Population Statistics • Crude birth rate (CBR)
– # of births per 1,000 pop./yr
• Crude death rate (CDR)
– # of deaths per 1,000 pop./yr
• Natural increase rate (NIR or RNI)
– % by which a native population grows in a year
– CBR – CDR (then convert to %, divide by ten, move
decimal point to left one position)
– Excludes migration
• Doubling time
– # of years needed to double a pop.
• “rule of 70”
– Takes into account that children born today will reproduce
before population doubles = compounding like interest in
a bank account
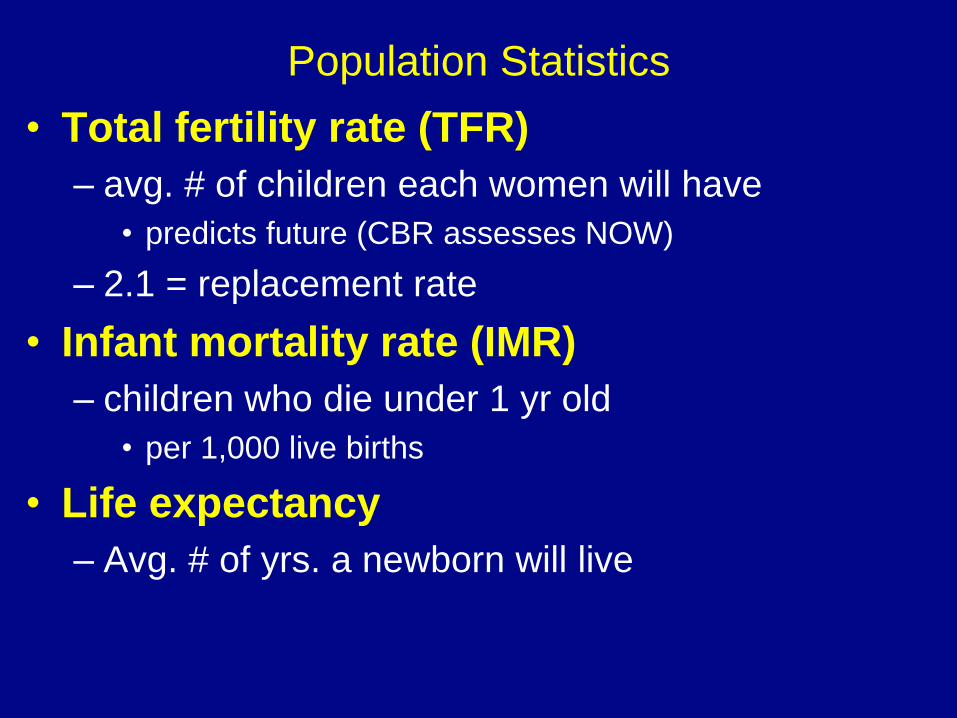
Population Statistics
• Total fertility rate (TFR)
– avg. # of children each women will have
• predicts future (CBR assesses NOW)
– 2.1 = replacement rate
• Infant mortality rate (IMR)
– children who die under 1 yr old
• per 1,000 live births
• Life expectancy
– Avg. # of yrs. a newborn will live
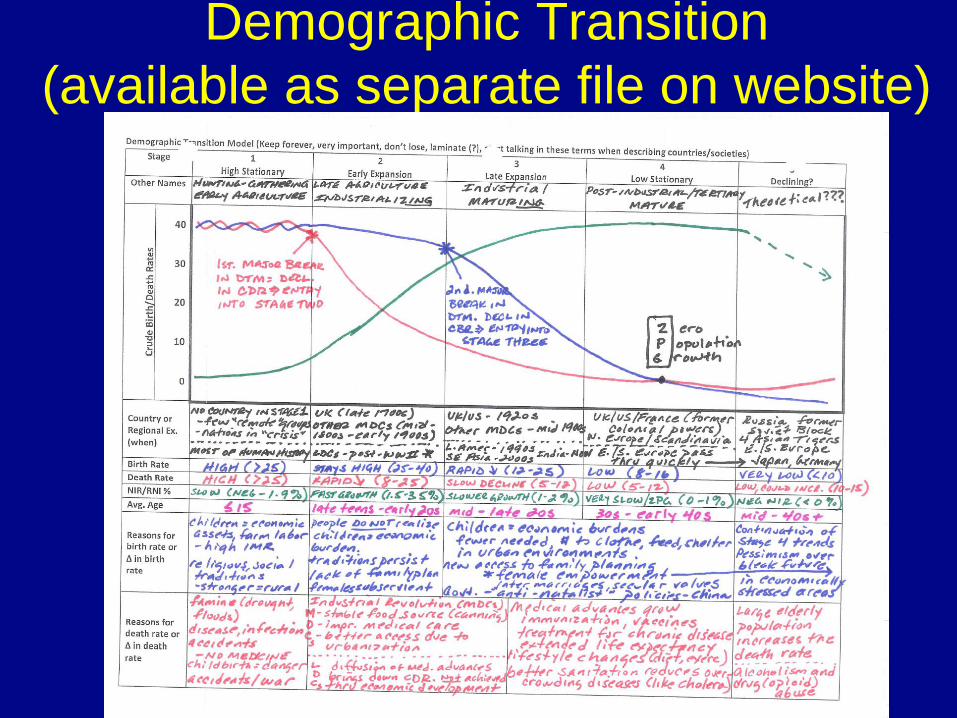
Demographic Transition
(available as separate file on website)
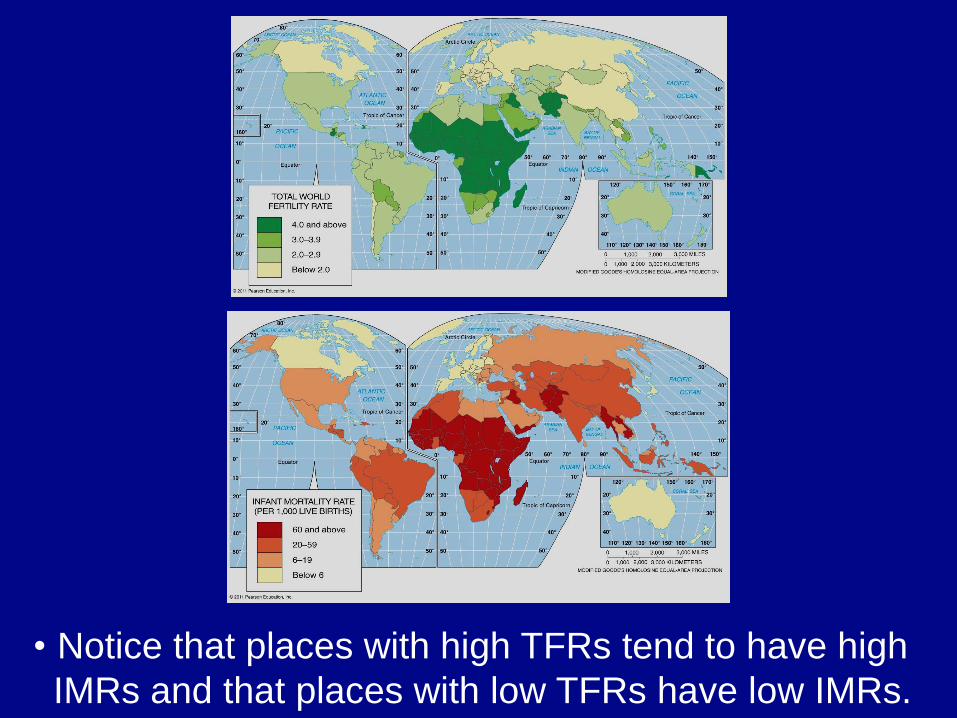
• Notice that places with high TFRs tend to have high
IMRs and that places with low TFRs have low IMRs.
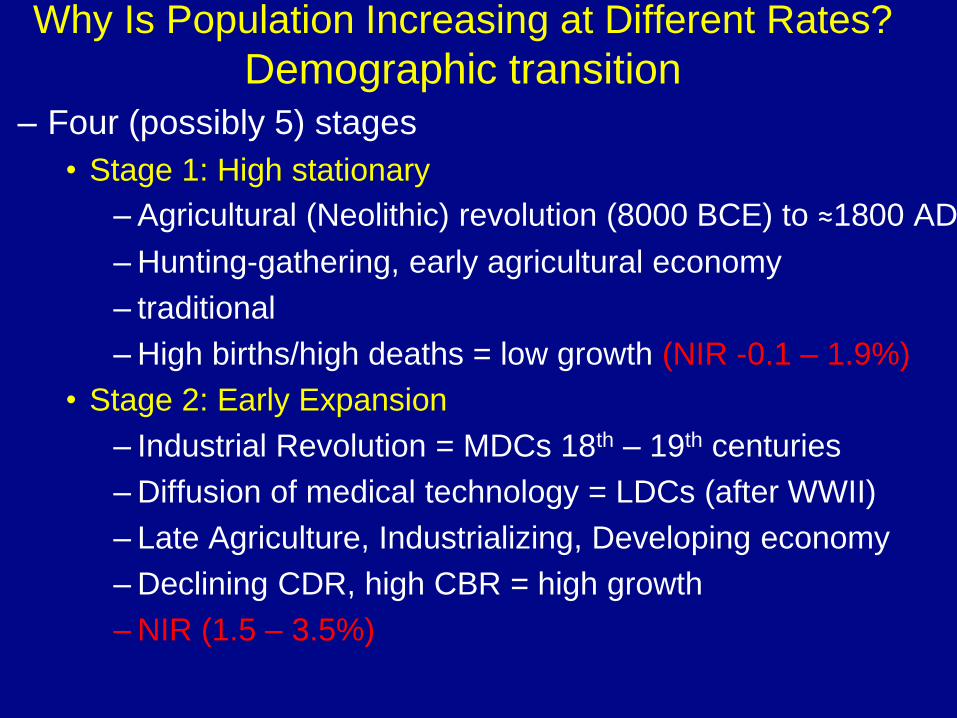
Why Is Population Increasing at Different Rates?
Demographic transition – Four (possibly 5) stages
• Stage 1: High stationary
– Agricultural (Neolithic) revolution (8000 BCE) to ≈1800 AD
– Hunting-gathering, early agricultural economy
– traditional
– High births/high deaths = low growth (NIR -0.1 – 1.9%)
• Stage 2: Early Expansion
– Industrial Revolution = MDCs 18th – 19th centuries
– Diffusion of medical technology = LDCs (after WWII)
– Late Agriculture, Industrializing, Developing economy
– Declining CDR, high CBR = high growth
– NIR (1.5 – 3.5%)
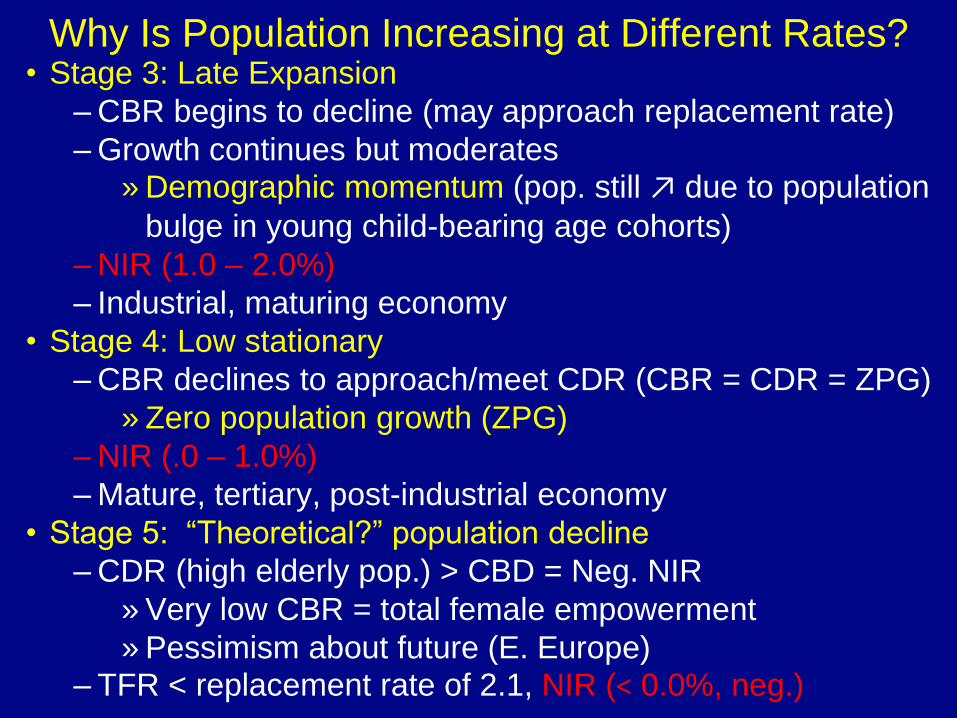
Why Is Population Increasing at Different Rates? • Stage 3: Late Expansion
– CBR begins to decline (may approach replacement rate)
– Growth continues but moderates » Demographic momentum (pop. still ↗ due to population
bulge in young child-bearing age cohorts)
– NIR (1.0 – 2.0%)
– Industrial, maturing economy
• Stage 4: Low stationary
– CBR declines to approach/meet CDR (CBR = CDR = ZPG)
» Zero population growth (ZPG)
– NIR (.0 – 1.0%)
– Mature, tertiary, post-industrial economy
• Stage 5: “Theoretical?” population decline
– CDR (high elderly pop.) > CBD = Neg. NIR
» Very low CBR = total female empowerment
» Pessimism about future (E. Europe) – TFR < replacement rate of 2.1, NIR (< 0.0%, neg.)
Population Pyramids
– A bar graph showing a place’s age and sex composition
– Shape of the pyramid is determined mainly by the CBR
– Age distribution
• Dependency ratio
• (# of people < 15 + # of people > 64)/ # of people 15
– 64
– Sex distribution
• Male and female side should be balanced
– In elderly cohorts you can expect a somewhat
larger number of females due to higher female life
expectancy. Shouldn’t be too great however.
• Sex ratio (comparing # of one gender to the other)
– note anomalies (unbalanced by gender, missing
populations)
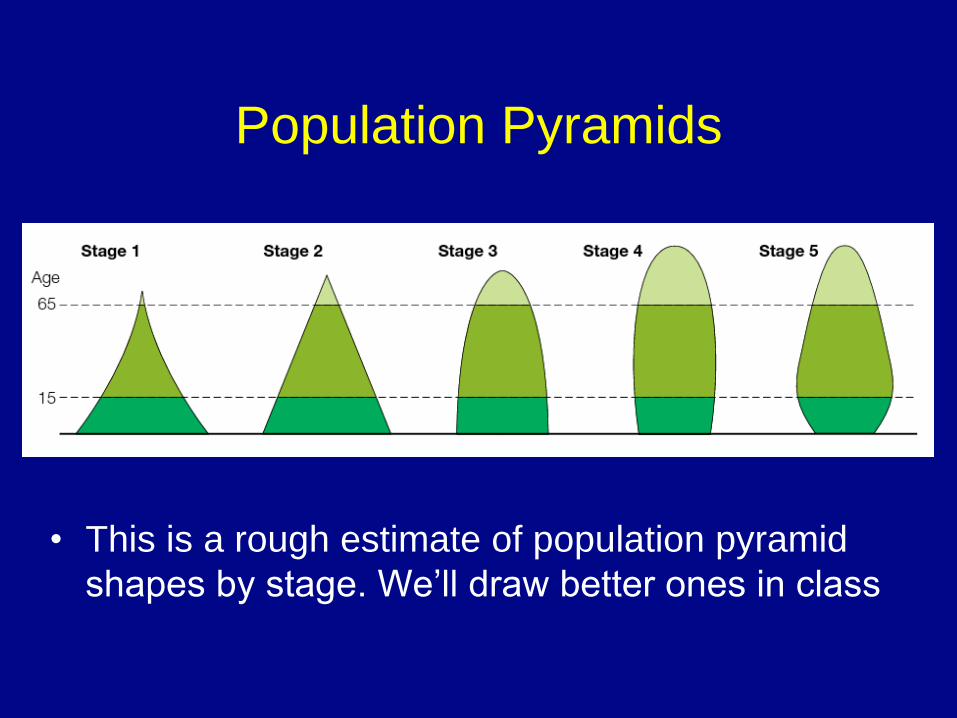
Population Pyramids
• This is a rough estimate of population pyramid
shapes by stage. We’ll draw better ones in class
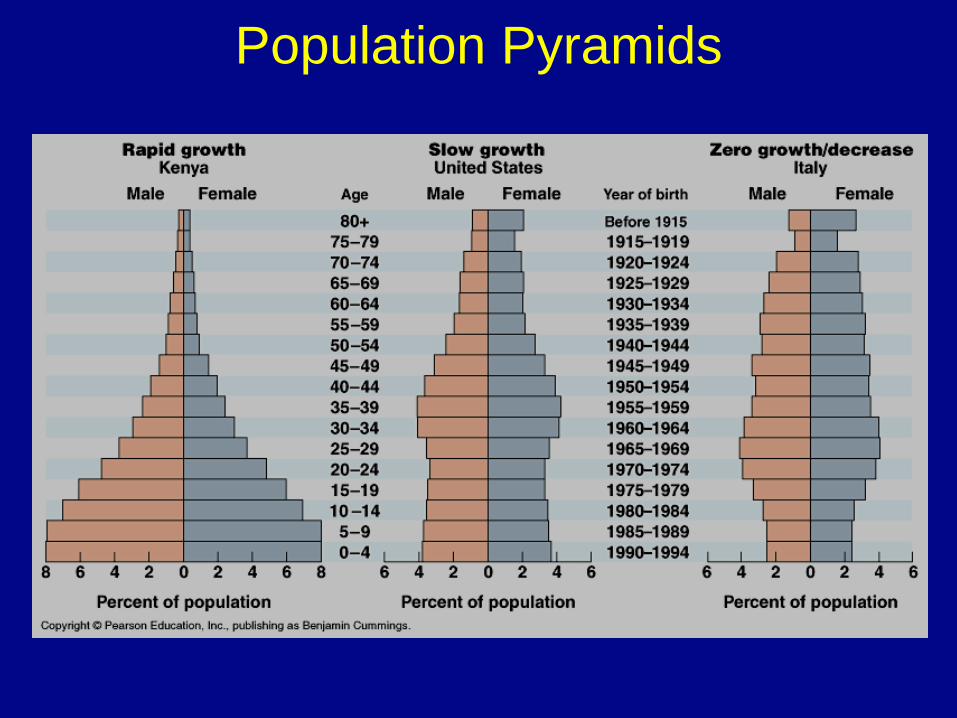
Population Pyramids
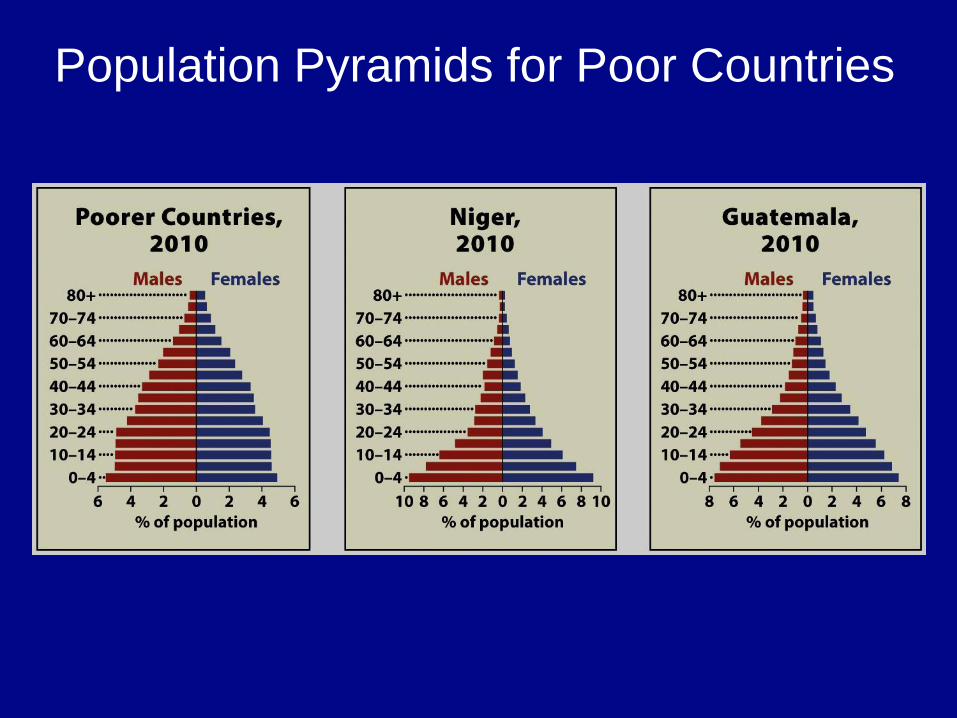
Population Pyramids for Poor Countries
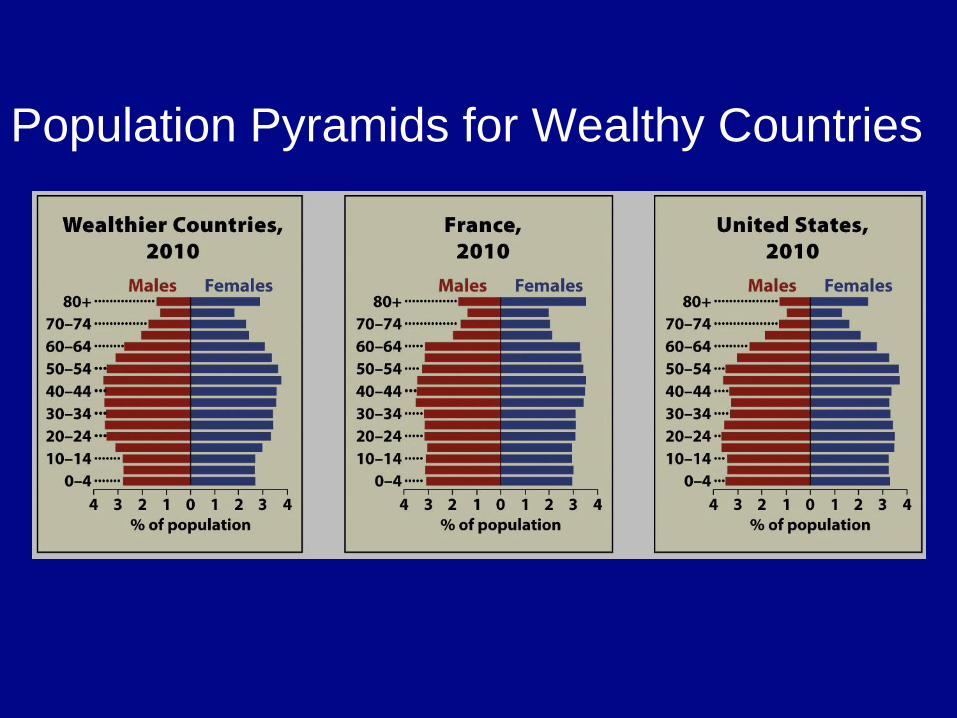
Population Pyramids for Wealthy Countries
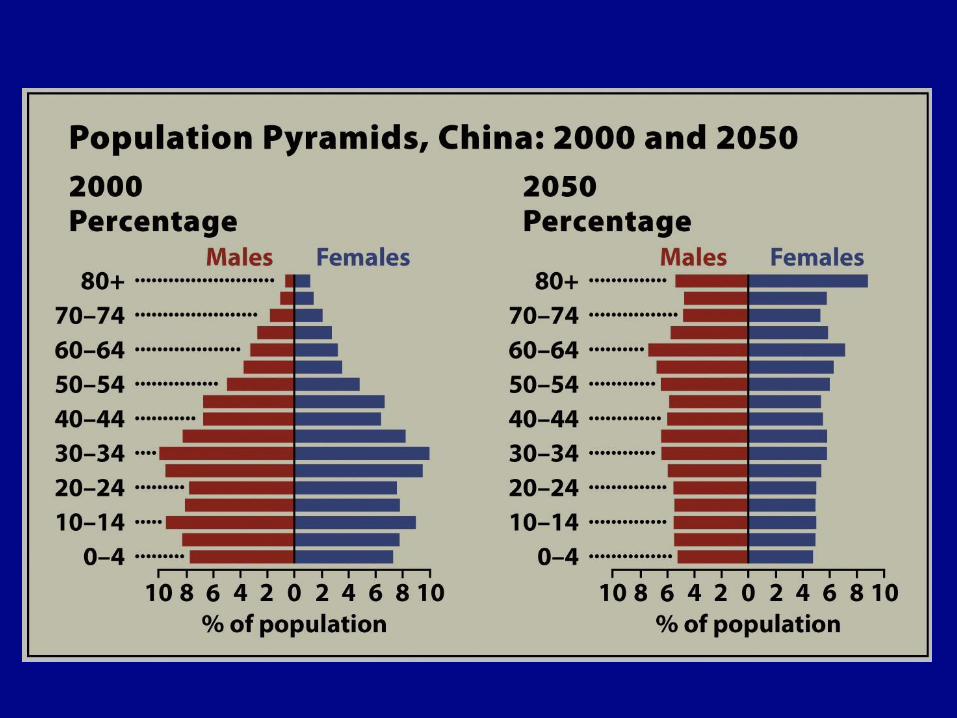
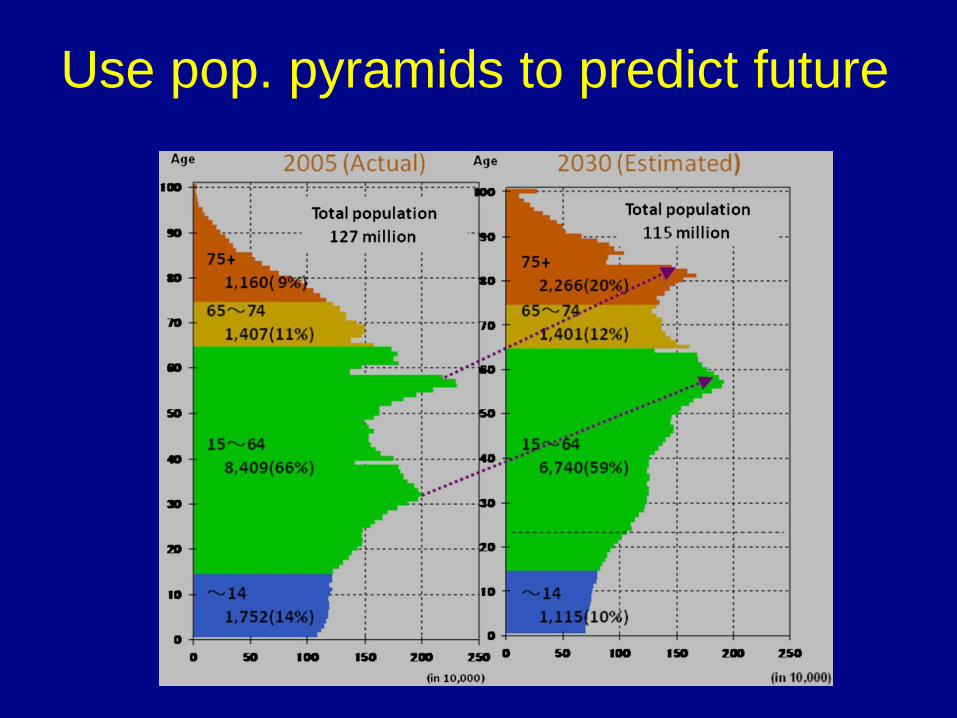
Use pop. pyramids to predict future
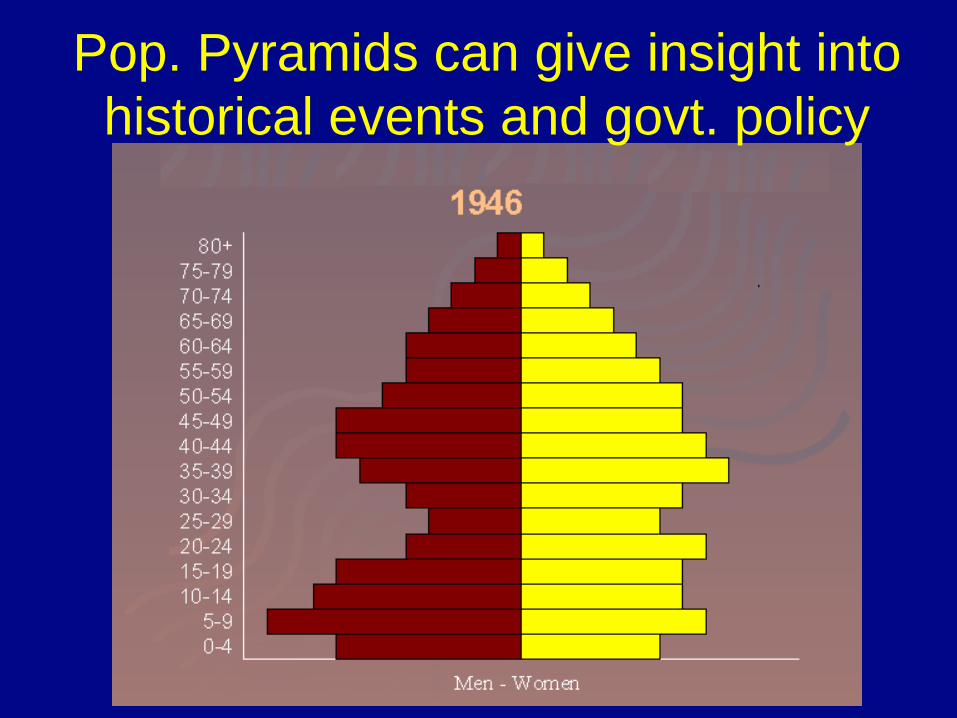
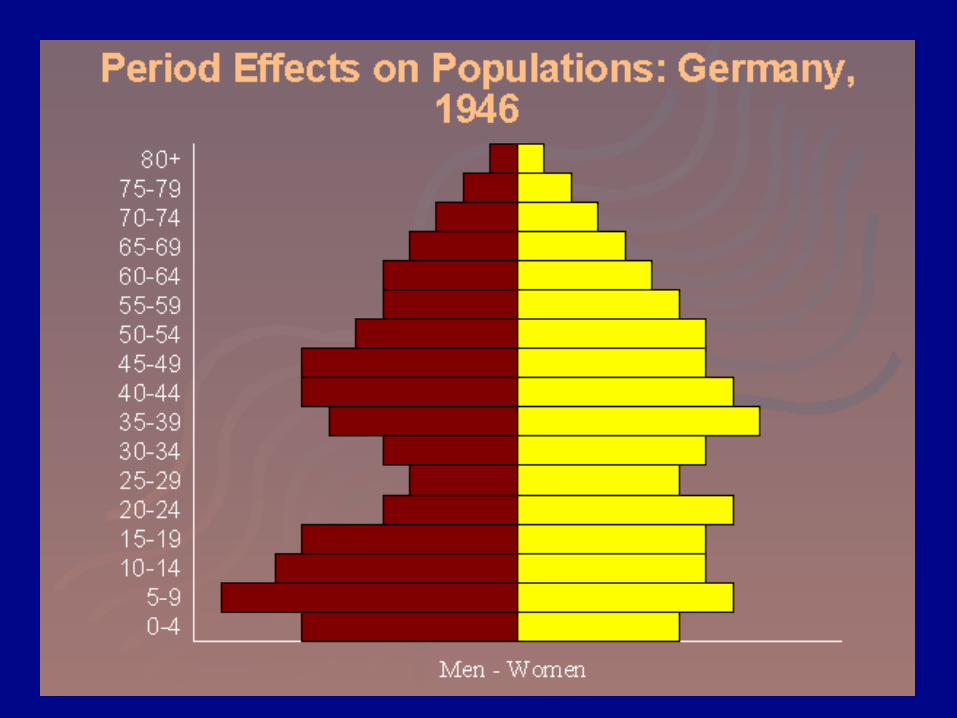
Pop. Pyramids can give insight into
historical events and govt. policy
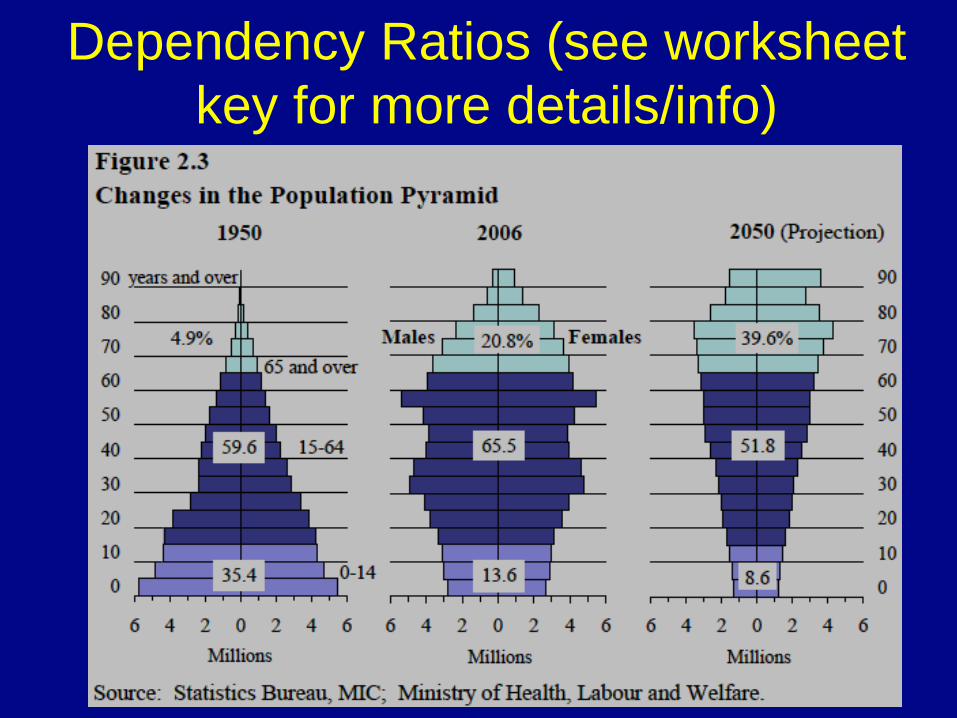
Dependency Ratios (see worksheet
key for more details/info)
Why Might Overpopulation be a Concern?
• Malthus on overpopulation
– Overpopulation = too many people for available
resources
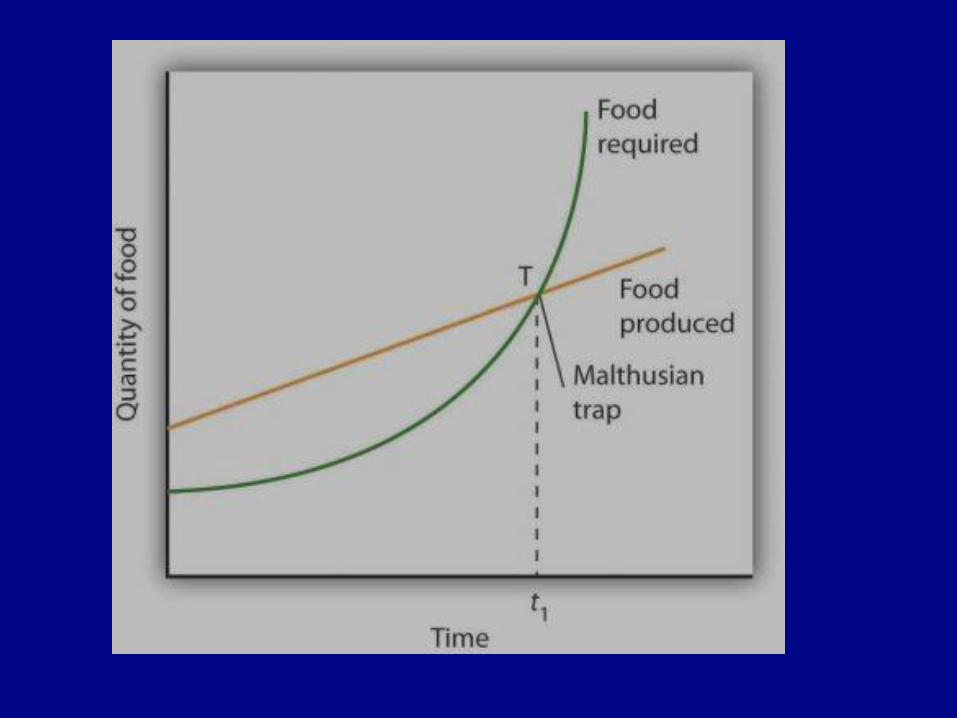
– An Essay on the Principle of Population (1798):
• Population grows geometrically
• food supply grows arithmetically
• Upper classes must lower CBRs thru moral restraint
– or risk war, disease, famine
» increase CDRs
Criticism of Malthus
– Resources
• Too pessimistic on resource growth
– Failure to consider technological innovation
– Green Revolution greatly increased food production
• Marxist critique
– Not pop. growth but unequal dist. of resources
– Malthus did blame overpopulation on the poor!!!
– Population
• Large population = economic growth
– Esther Boserup, Simon Kuznets, Julian Simon
– More babies – more workers, more innovation!
• Population growth has moderated (stage three)
Neo-Malthusians
• Frightened by NIR during second ½ of 20th century
– Growth in LDCs (stuck in demographic trap)
– Also….competition will be for other resources not just food
• Search for clean air, fuel, water could lead to violence
Demographic trap • Population growth (Stage 2 = high CBR, declining
CDR, from diffusion of medical advancements not from
economic development) strain on resources (overspending on youth dependency = schools, day care,
hospitals) lack of investment in infrastructure
(roads, ports, computer wiring, etc.) low economic
development (low living standards, reliance on mostly
primary jobs) children are economic assets,
female subservience reinforces high
fertility population growth (back to the top)!
Therefore: country is unable to advance to stage 3 of
declining birth rates (most of sub-Saharan Africa,
some Central Amer., S. Asia, Middle East, SE Asia)
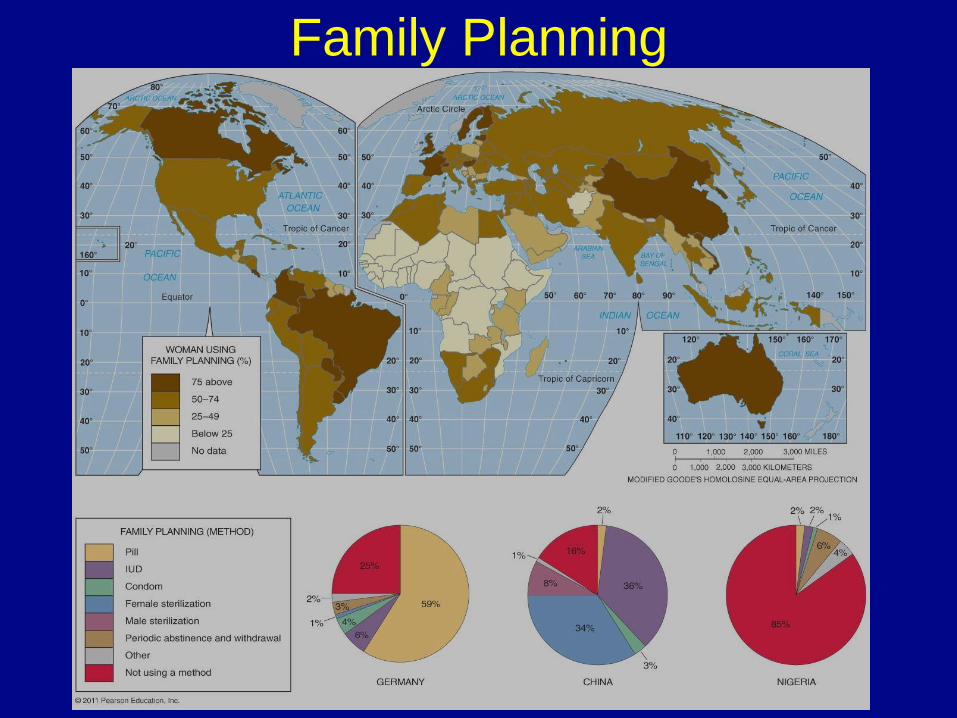
Family Planning
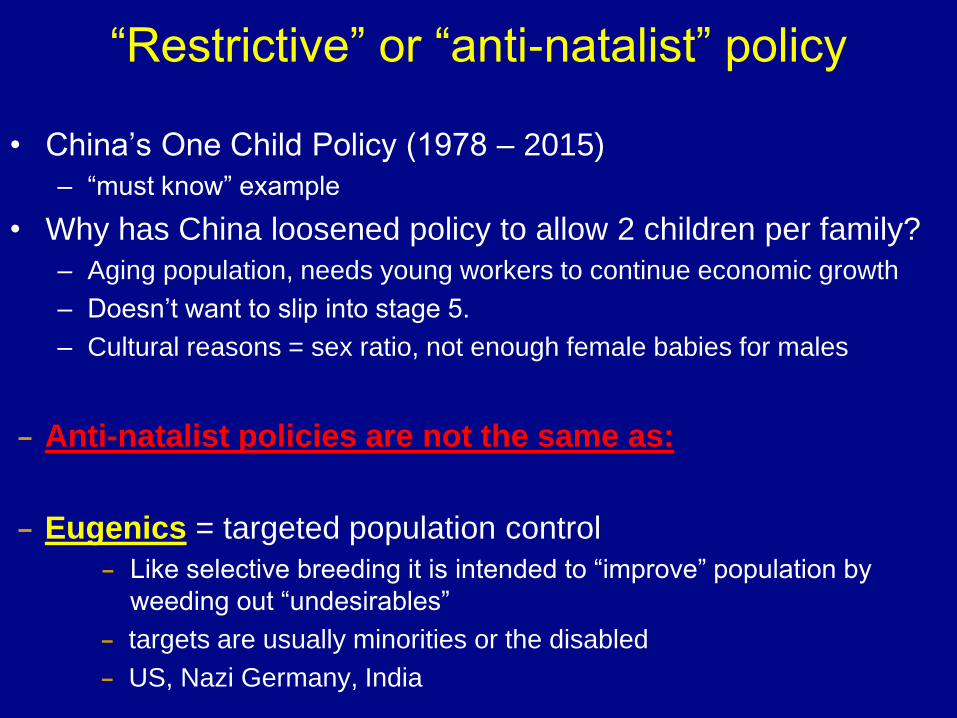
“Restrictive” or “anti-natalist” policy
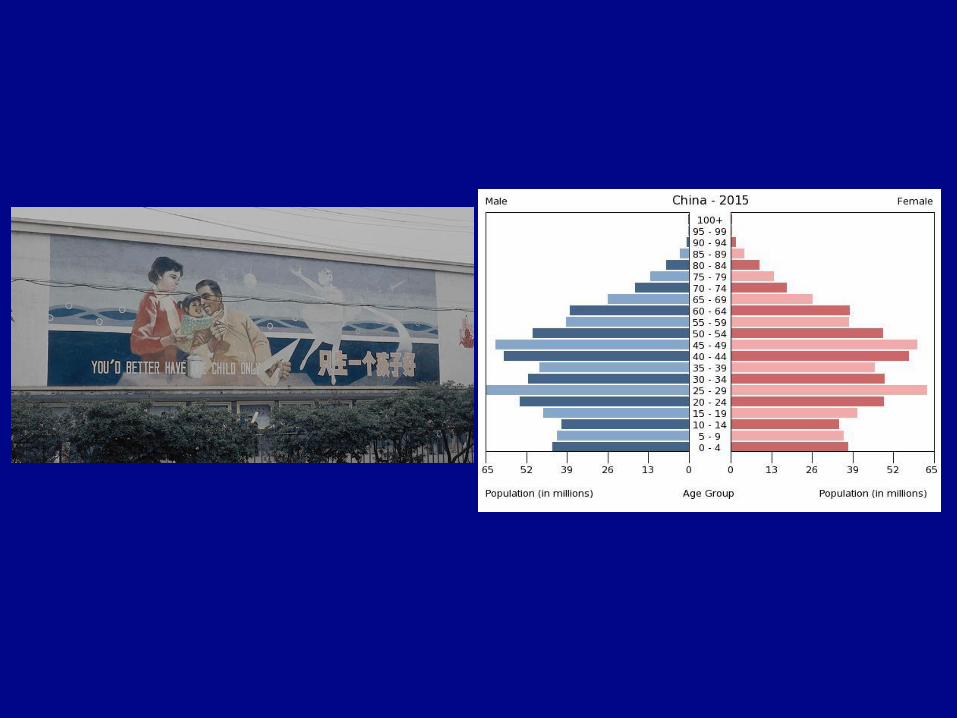
• China’s One Child Policy (1978 – 2015)
– “must know” example
• Why has China loosened policy to allow 2 children per family?
– Aging population, needs young workers to continue economic growth
– Doesn’t want to slip into stage 5.
– Cultural reasons = sex ratio, not enough female babies for males
– Anti-natalist policies are not the same as:
– Eugenics = targeted population control
– Like selective breeding it is intended to “improve” population by
weeding out “undesirables”
– targets are usually minorities or the disabled
– US, Nazi Germany, India
India (example of govt pop. policy)
• 1960s: population planning program
• 1970s: country began forced sterilization program for
men with 3 or more children.
– 22.5 million men were sterilized.
• 2004: state of Uttar Pradesh began guns for sterilization
program (attempt to incentivize policy).
• Today, most states use advertising and persuasion to
lower birth rates.

Pro-natalist or “expansionary” policies • Attempts to increase CBD/TFR/NIR
• “Do it for Denmark”
– https://www.youtube.com/watch?v=vrO3TfJc9Qw
– https://www.youtube.com/watch?v=B00grl3K01g&t=3s
• Incentives may include:
– a one time baby bonus
– ongoing child benefit payments
– tax reductions
– paid maternity and paternity leave policies
– Some impose penalties/taxes on those w/too few children
– Singapore, South Korea, and Taiwan
– Japanese alternative:
• https://www.cbsnews.com/videos/japans-population-is-plunging-can-
they-fill-the-void-with-robots/
Epidemiological Transition
– Stage 1: Pestilence and famine
• Pandemics
– The Black Plague
• Vectored diseases
– Malaria
– African sleeping sickness
– West Nile Virus
• Non-vectored = contagious
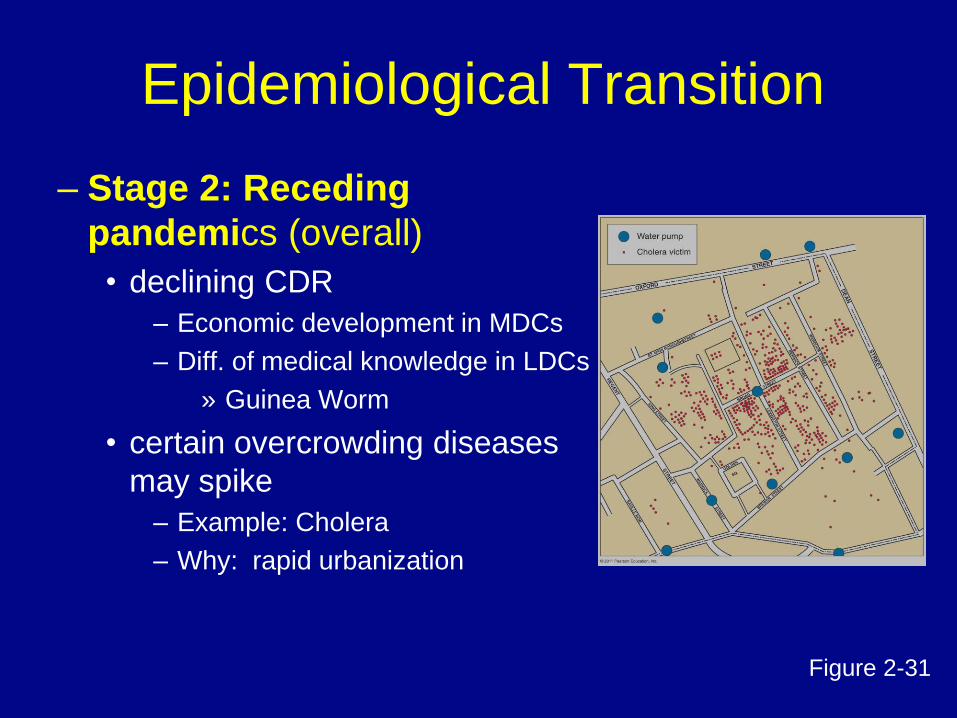
Epidemiological Transition
– Stage 2: Receding
pandemics (overall)
• declining CDR
– Economic development in MDCs
– Diff. of medical knowledge in LDCs
» Guinea Worm
• certain overcrowding diseases
may spike
– Example: Cholera
– Why: rapid urbanization
Figure 2-31
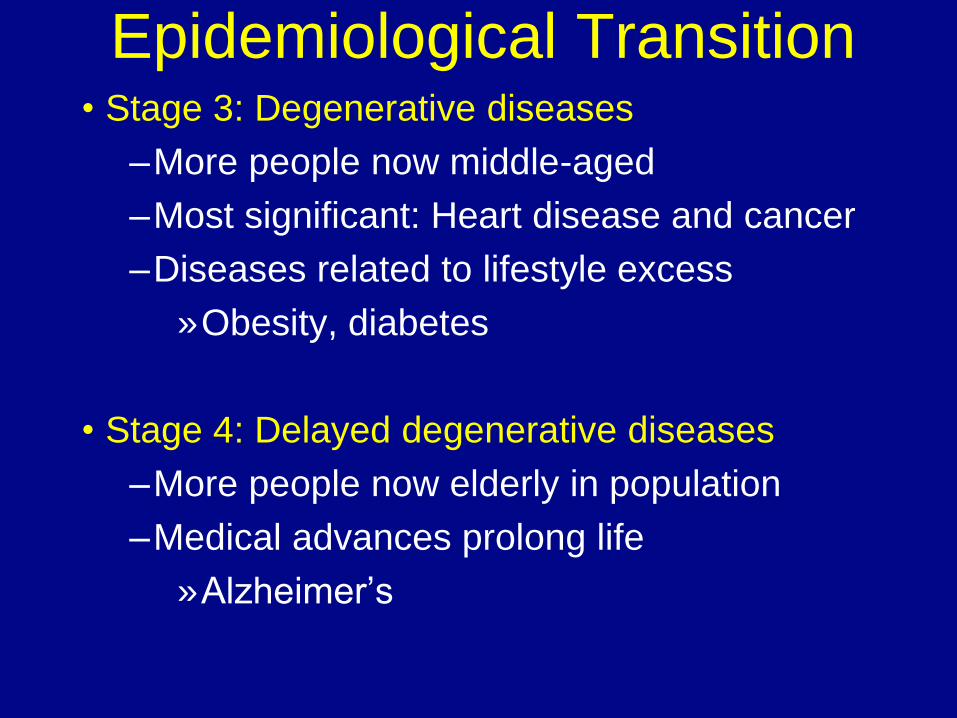
Epidemiological Transition • Stage 3: Degenerative diseases
–More people now middle-aged
–Most significant: Heart disease and cancer
–Diseases related to lifestyle excess
»Obesity, diabetes
• Stage 4: Delayed degenerative diseases
–More people now elderly in population
–Medical advances prolong life
»Alzheimer’s
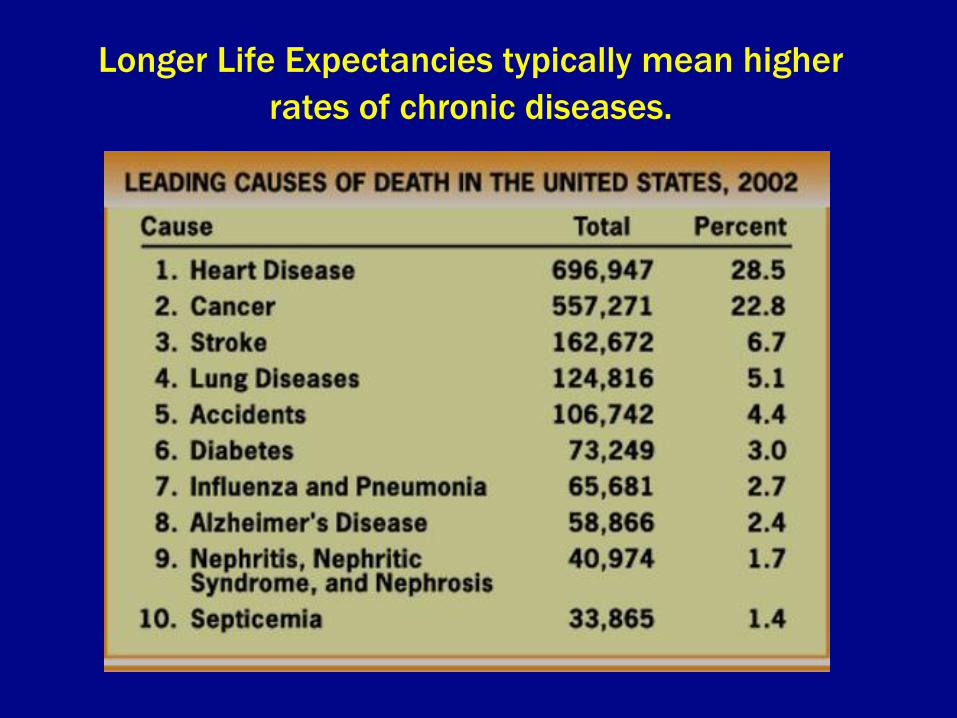
Longer Life Expectancies typically mean higher
rates of chronic diseases.
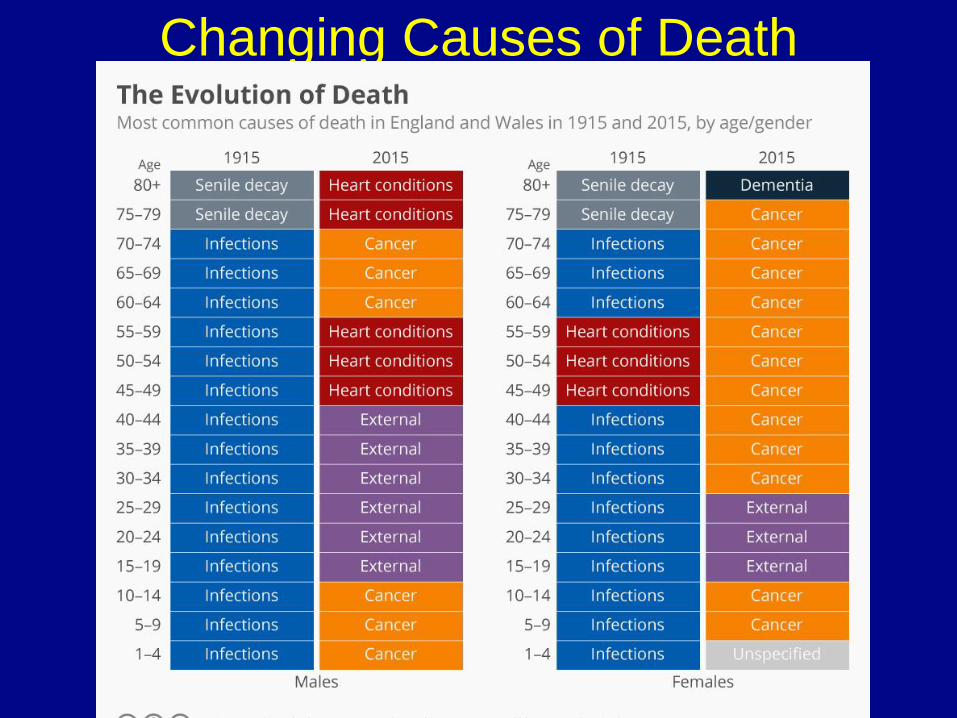
Changing Causes of Death
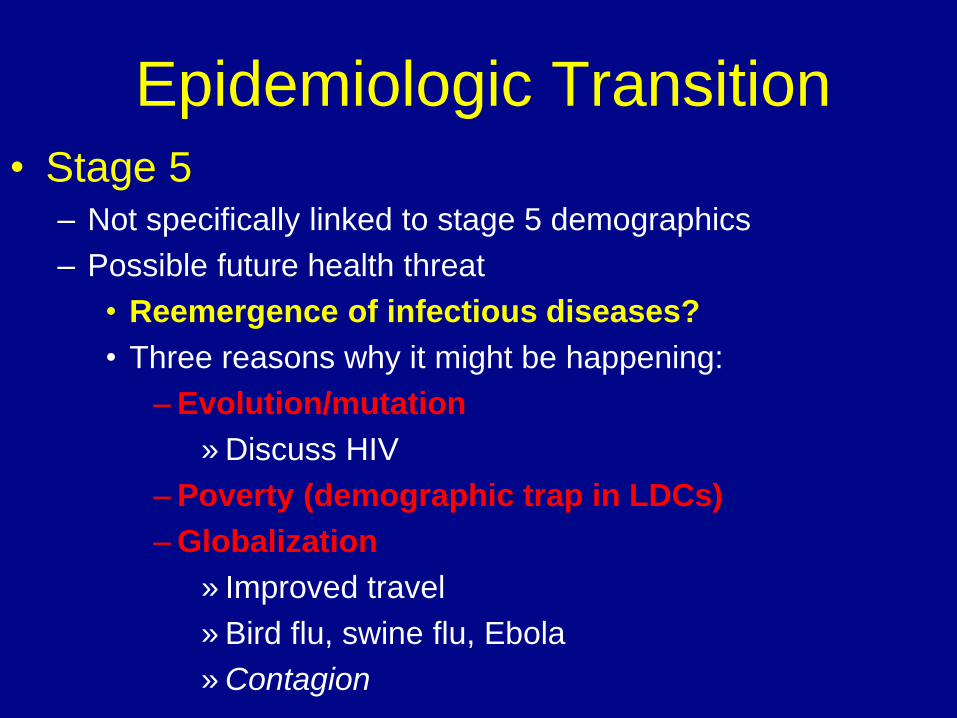
Epidemiologic Transition • Stage 5
– Not specifically linked to stage 5 demographics
– Possible future health threat
• Reemergence of infectious diseases?
• Three reasons why it might be happening:
– Evolution/mutation
» Discuss HIV
– Poverty (demographic trap in LDCs)
– Globalization
» Improved travel
» Bird flu, swine flu, Ebola
» Contagion
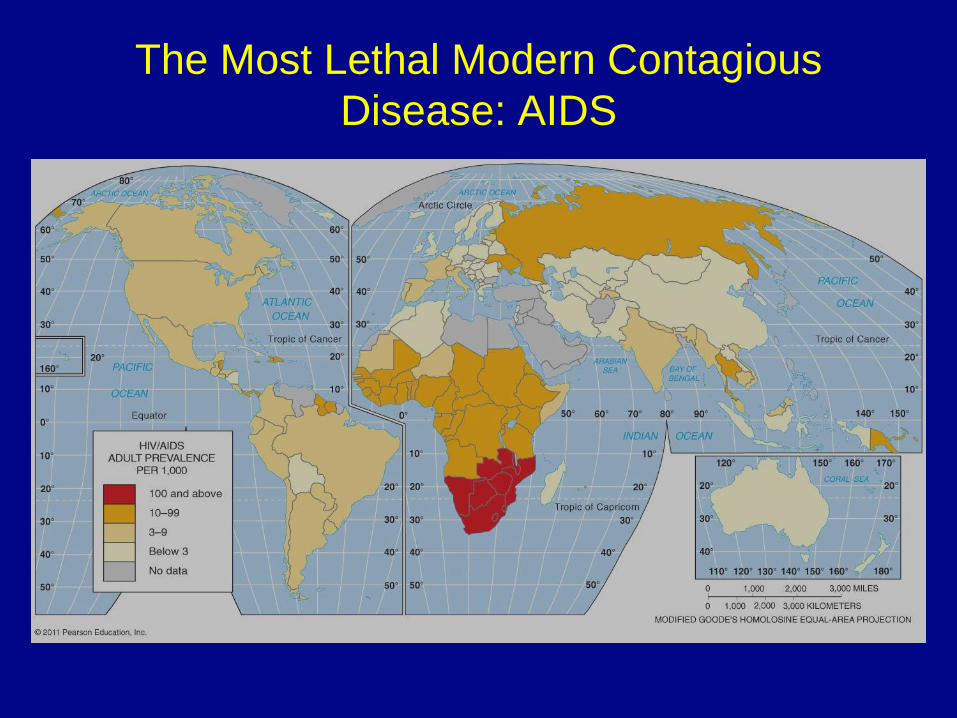
The Most Lethal Modern Contagious
Disease: AIDS
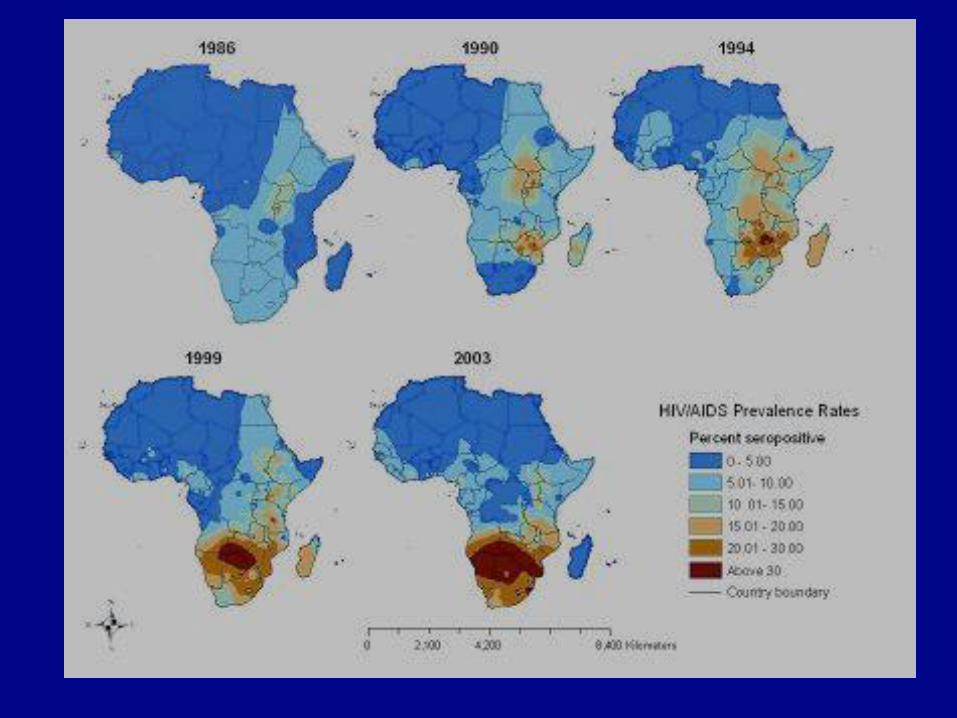
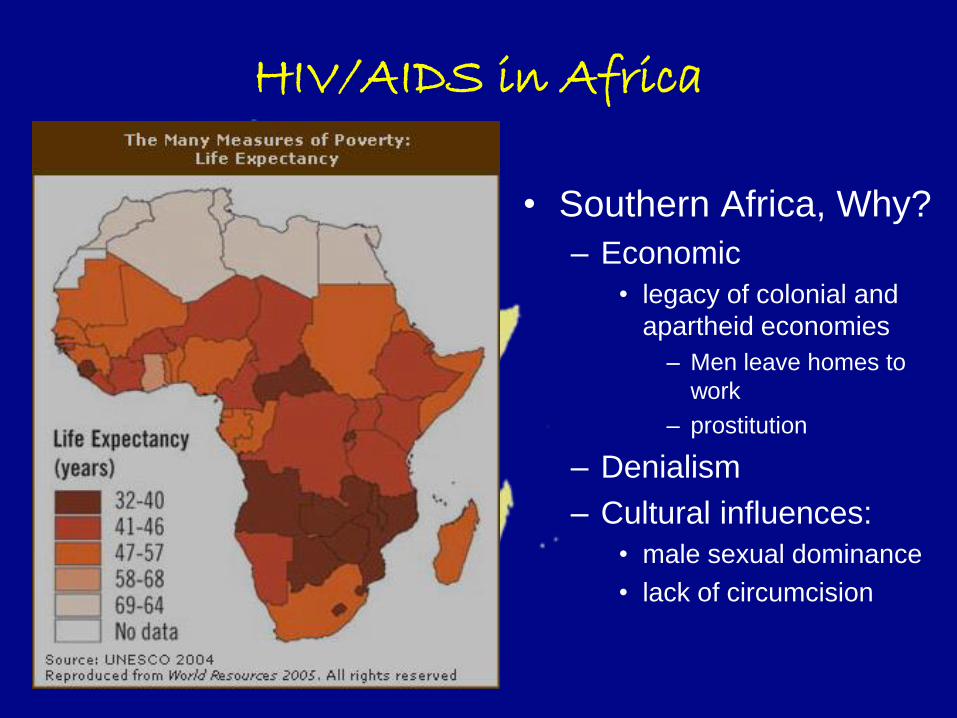
HIV/AIDS in Africa
• Southern Africa, Why?
– Economic
• legacy of colonial and
apartheid economies
– Men leave homes to
work
– prostitution
– Denialism
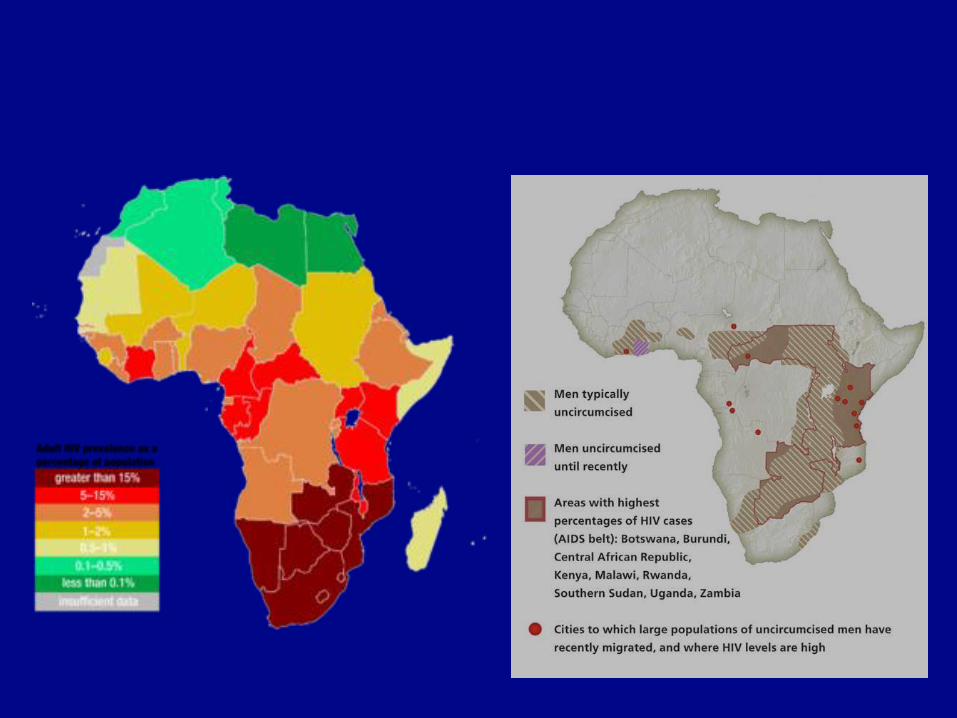
– Cultural influences:
• male sexual dominance
• lack of circumcision
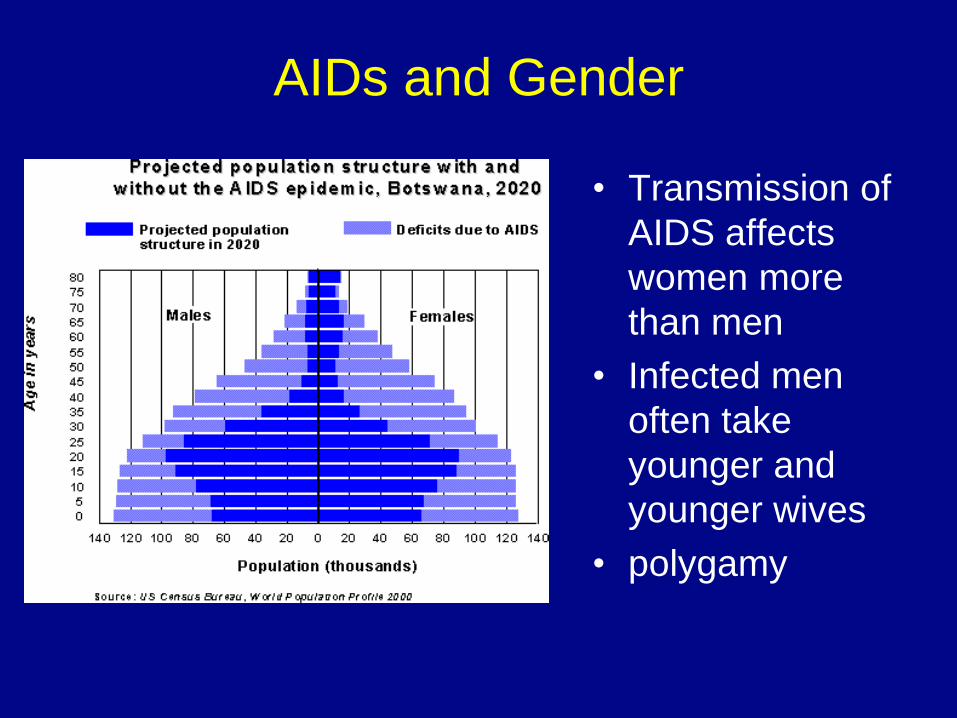
AIDs and Gender
• Transmission of
AIDS affects
women more
than men
• Infected men
often take
younger and
younger wives
• polygamy
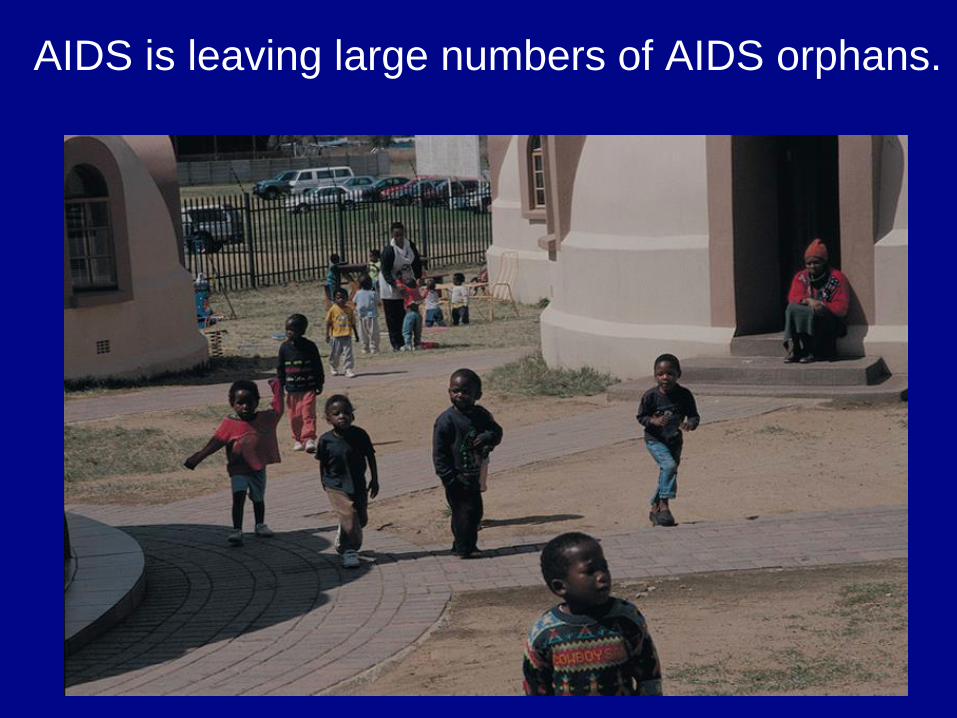
AIDS is leaving large numbers of AIDS orphans.
The End.
Up next: Migration