Embed Size (px)
Citation preview
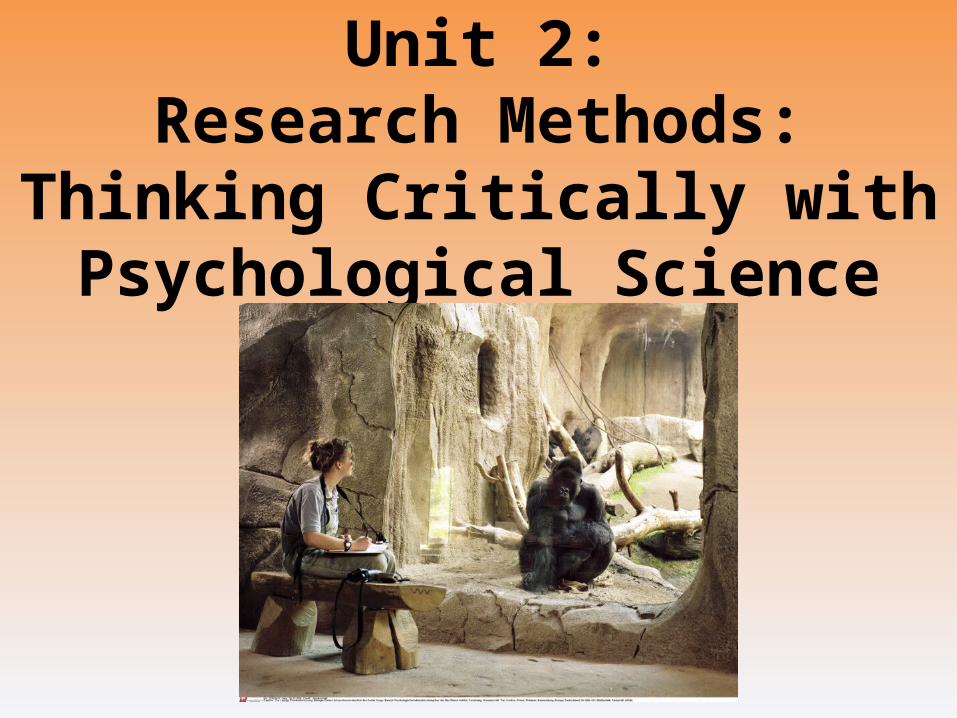
Unit 2:Research Methods: Thinking Critically with Psychological
Science
Unit Overview
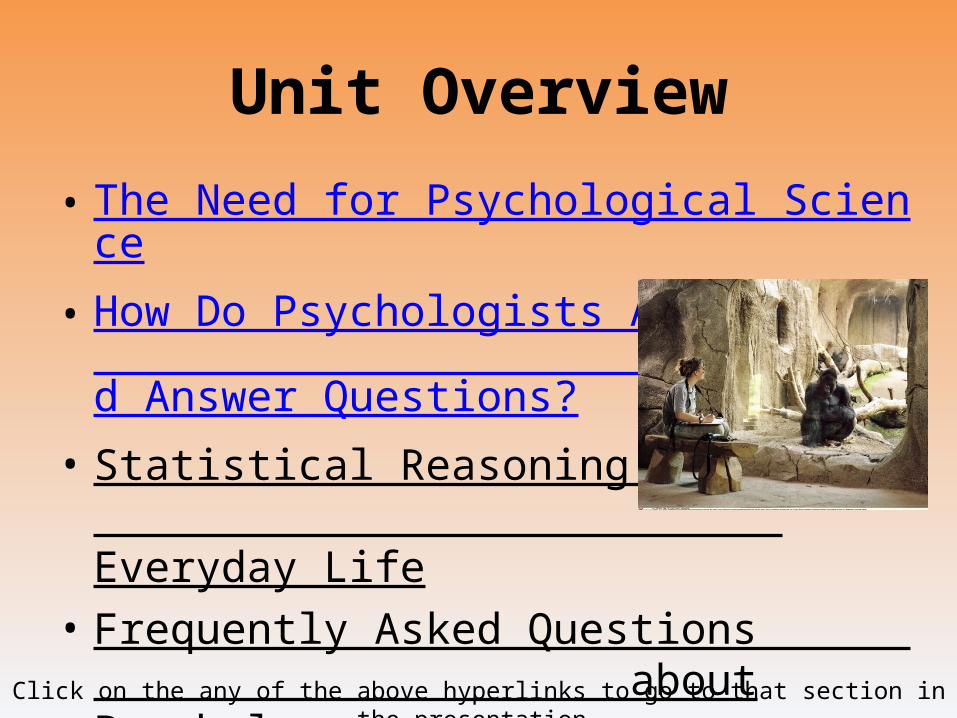
• The Need for Psychological Science
• How Do Psychologists Ask and Answer Questions?
• Statistical Reasoning in Everyday Life
• Frequently Asked Questions about Psychology
Click on the any of the above hyperlinks to go to that section in the presentation.
Seniors vs. Freshmen
reaction time activity
quiz
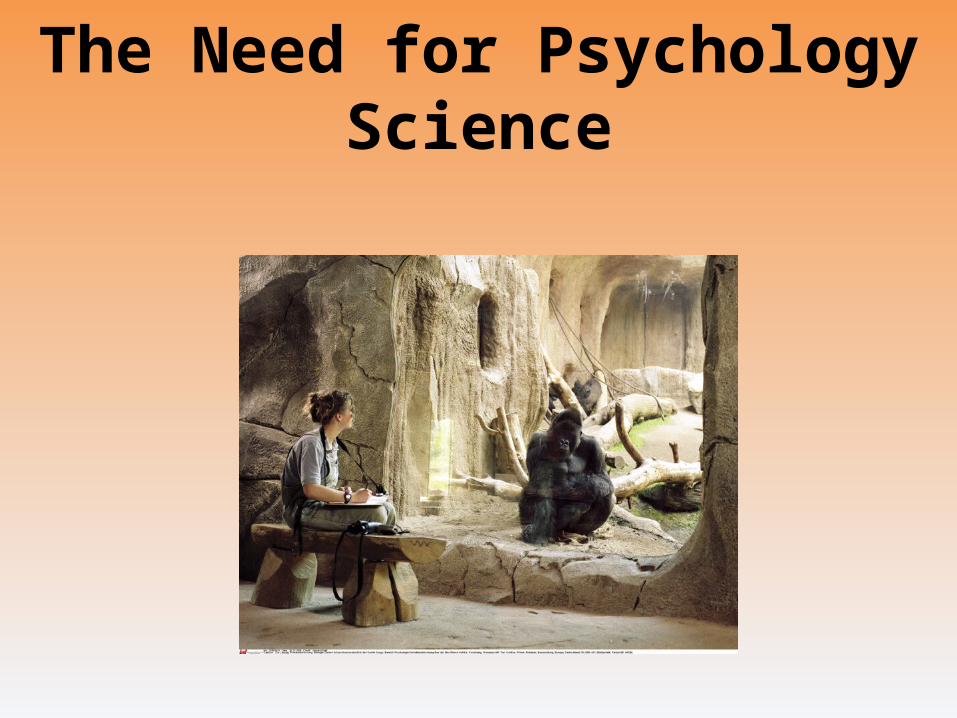
The Need for Psychology Science
Assign LO’s
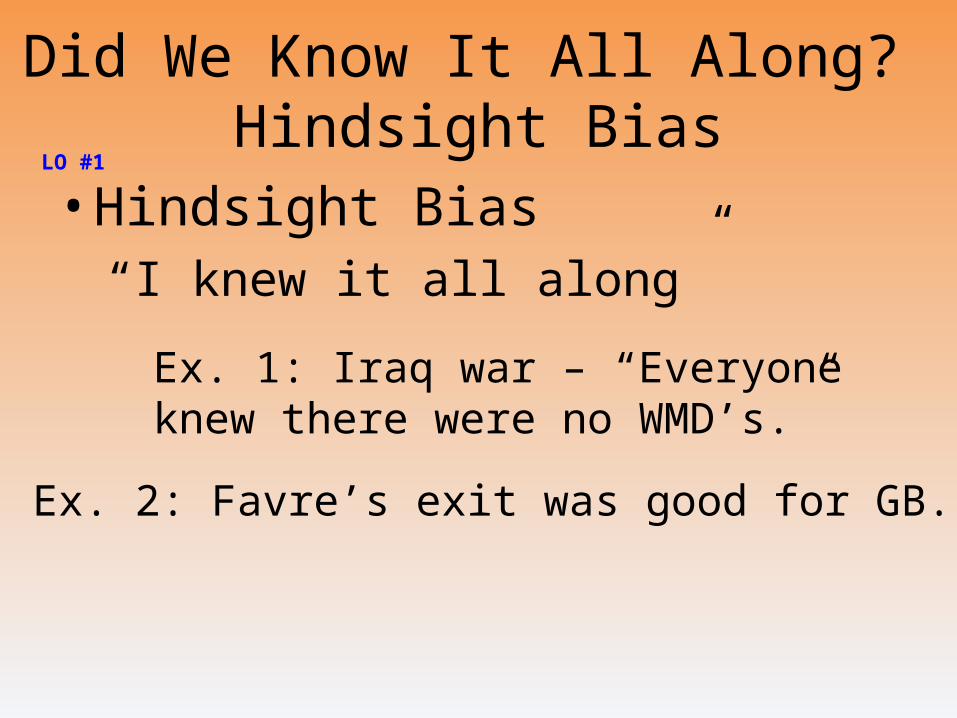
Did We Know It All Along? Hindsight Bias
• Hindsight Bias“I knew it all along”
Ex. 1: Iraq war – “Everyone knew there were no WMD’s.”
Ex. 2: Favre’s exit was good for GB.
LO #1
Overconfidence
• Overconfidence, p. 21
–Together with hindsight bias, can lead to overestimate our intuition
Handout 2-2
1. Read the statement.
2. Mark your choice.
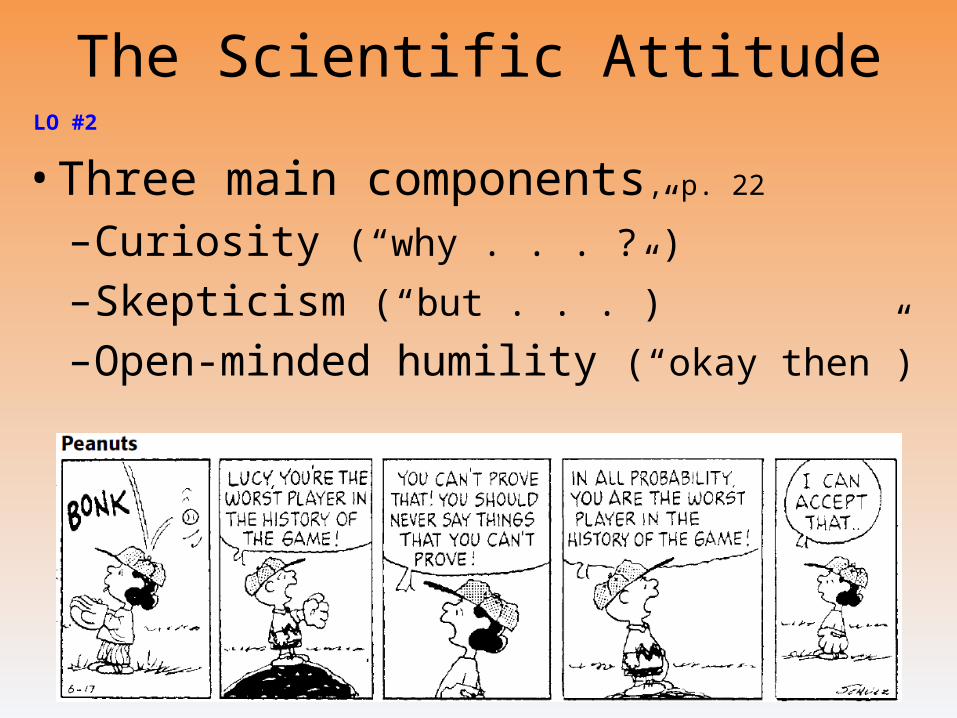
The Scientific Attitude
• Three main components, p. 22
–Curiosity (“why . . . ?”)
–Skepticism (“but . . .”)
–Open-minded humility (“okay then”)
LO #2
Critical Thinking
• Critical Thinking, p. 24
–“Smart thinking”
–Four elements• Examines assumptions
• Discerns hidden values
• Evaluates evidence
• Assesses conclusions

How Do Psychologists Ask and Answer Questions?
The Scientific Method, p. 25
• Theory“mere hunch”
• HypothesisCan be confirmed or refuted
Paper ball experiment
• Operational Definition (be clear!)
• Replication (repeat)
LO #3
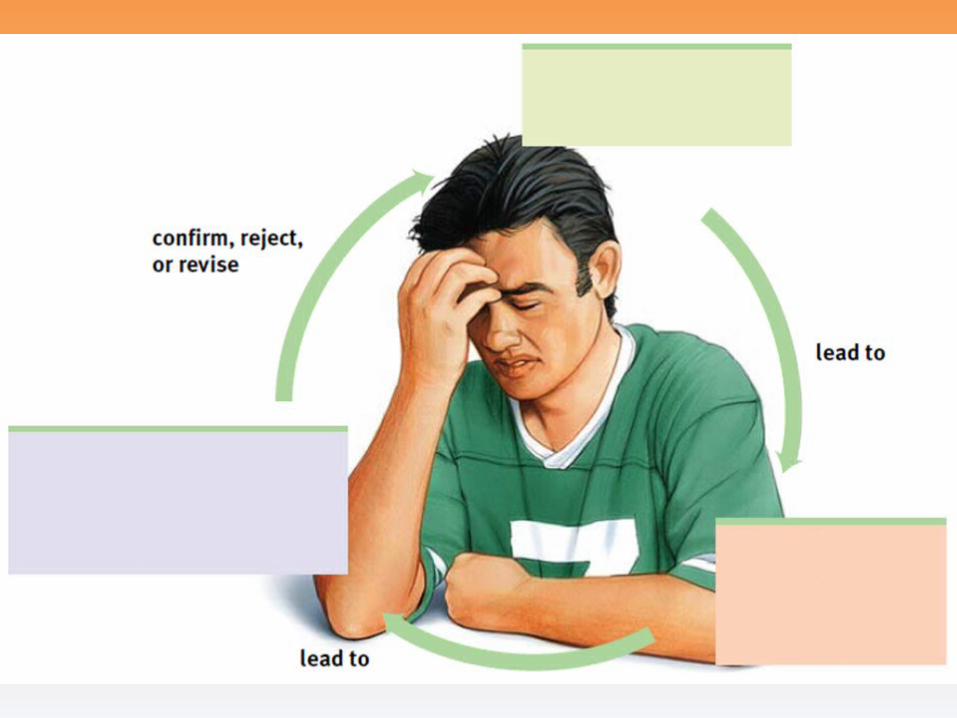
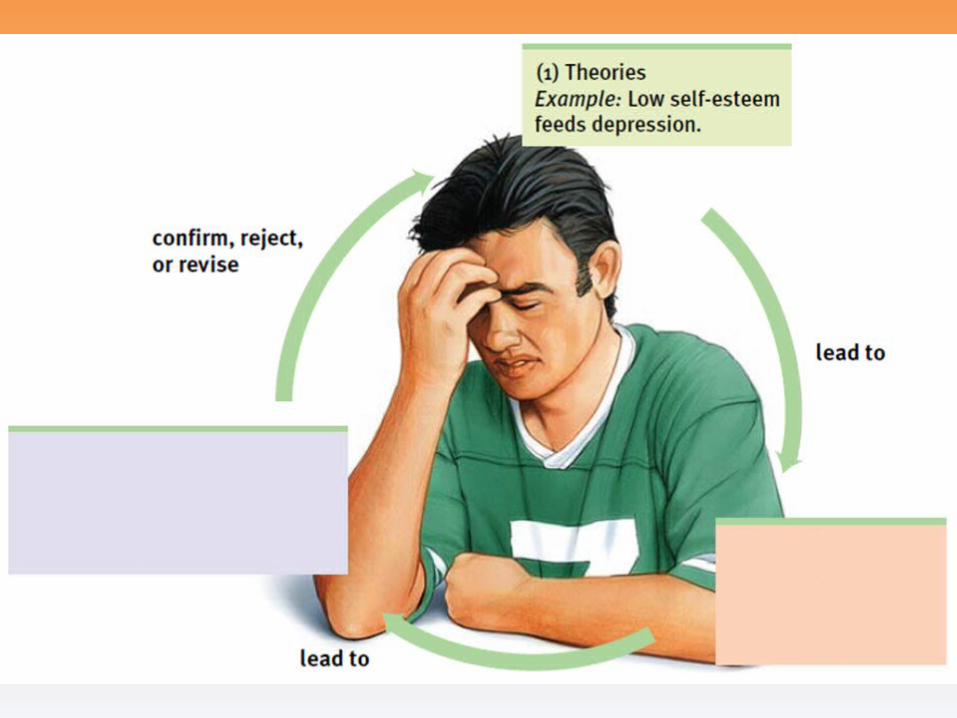
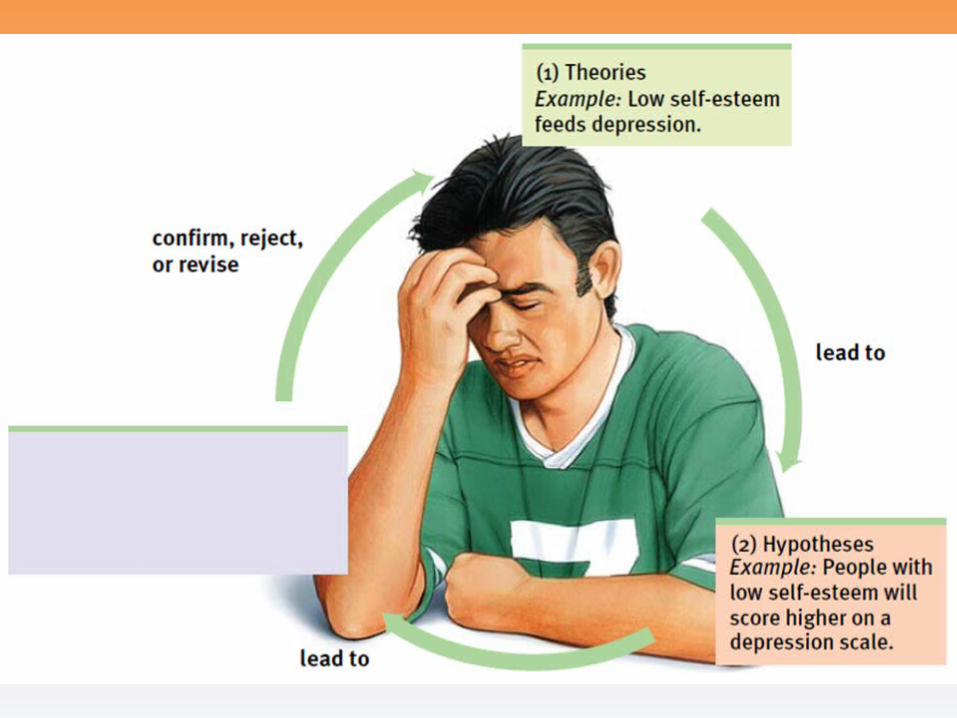
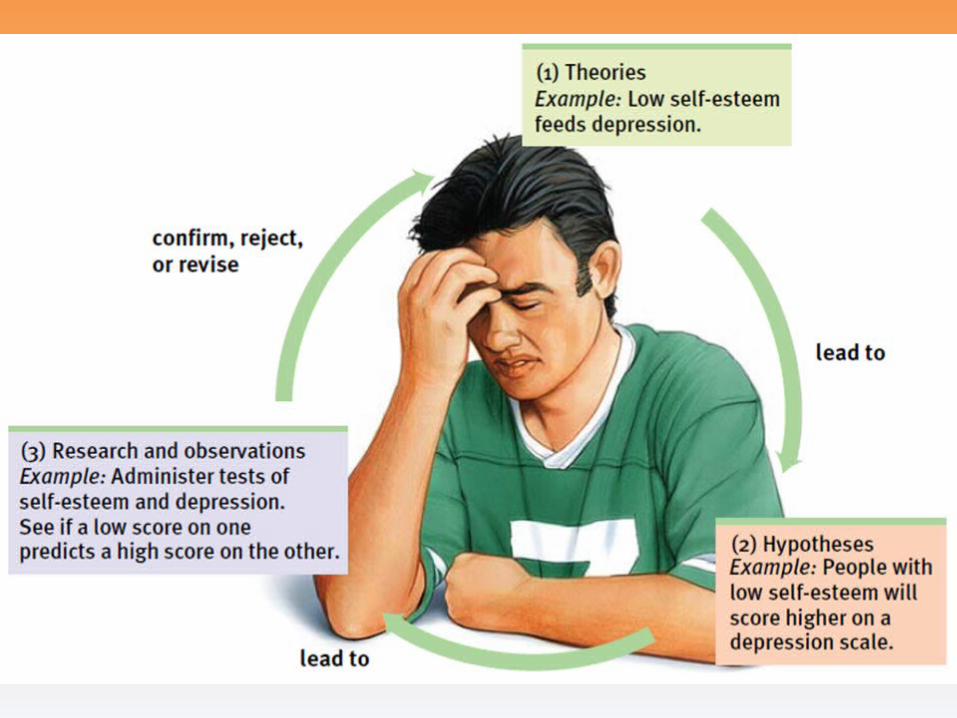
The Scientific Method
• A good theory is useful if it . . .–effectively organizes a range of
self-reports and observations
–implies clear predictions that anyone can use to check the theory
Three Means to Test a Hypothesis
Descriptive methods (three), p. 26
– case studies
– surveys
– naturalistic observations
Correlational methods
Experimental methods
LO #4
DescriptionThe Case Study
• Case Study–Suggest directions for further study
–Cannot discern general truths
Genie video
DescriptionThe Survey
• Survey, p. 27
–Looks at many cases at once
• Effect of wording
• Random sampling–Representative sample
Exercise: Survey Wording (Handout 2-5, p. 13)
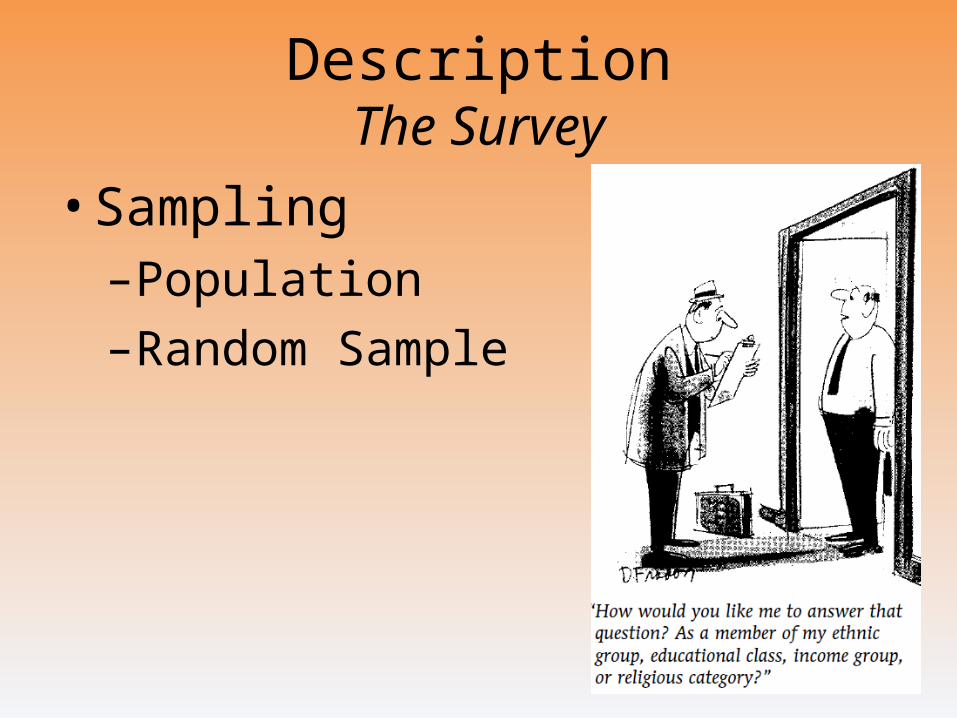
DescriptionThe Survey
• Sampling–Population
–Random Sample
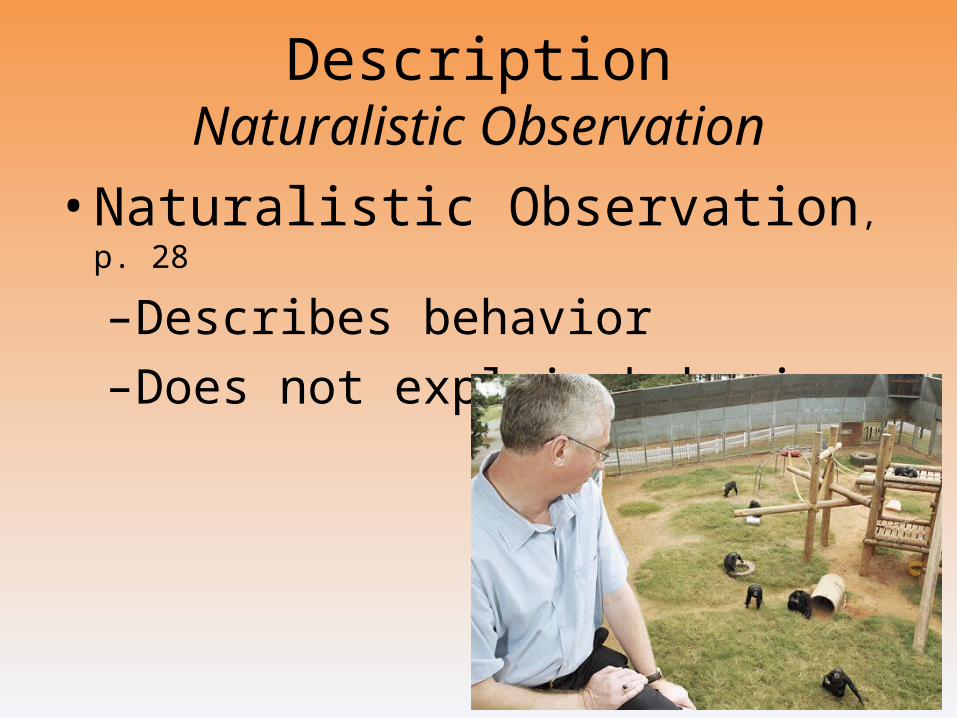
DescriptionNaturalistic Observation
• Naturalistic Observation, p. 28
–Describes behavior
–Does not explain behavior
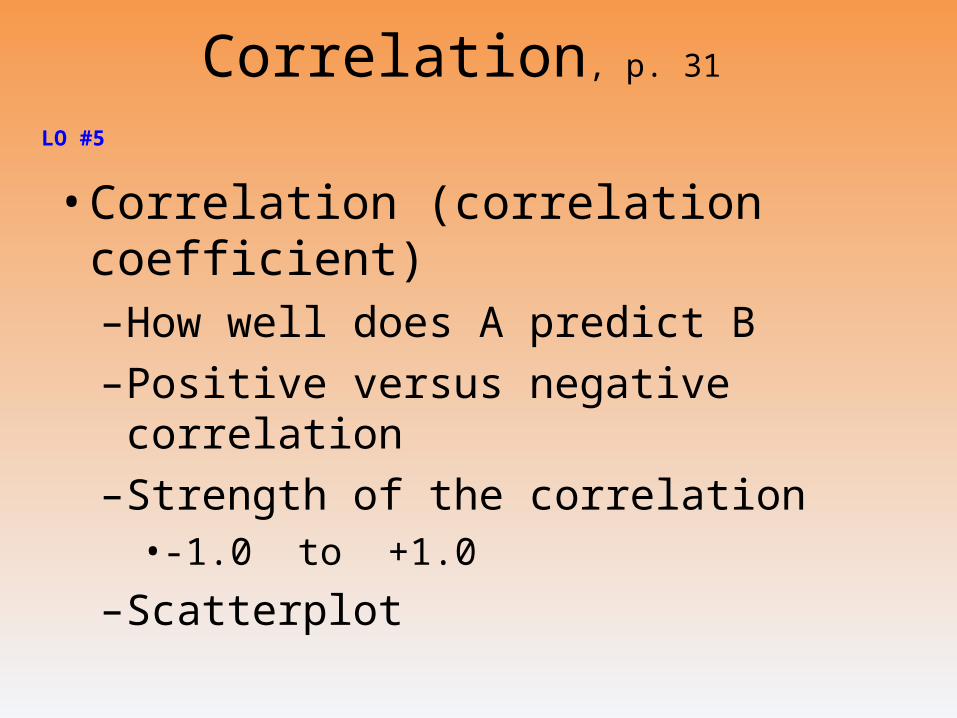
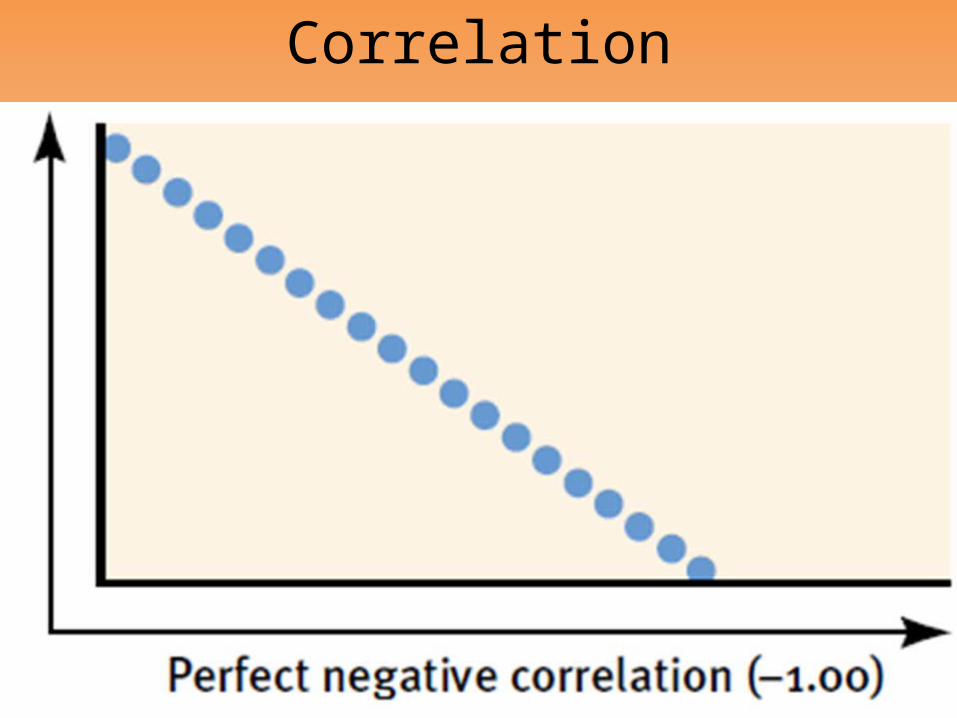
Correlation, p. 31
• Correlation (correlation coefficient)–How well does A predict B
–Positive versus negative correlation
–Strength of the correlation• -1.0 to +1.0
–Scatterplot
LO #5
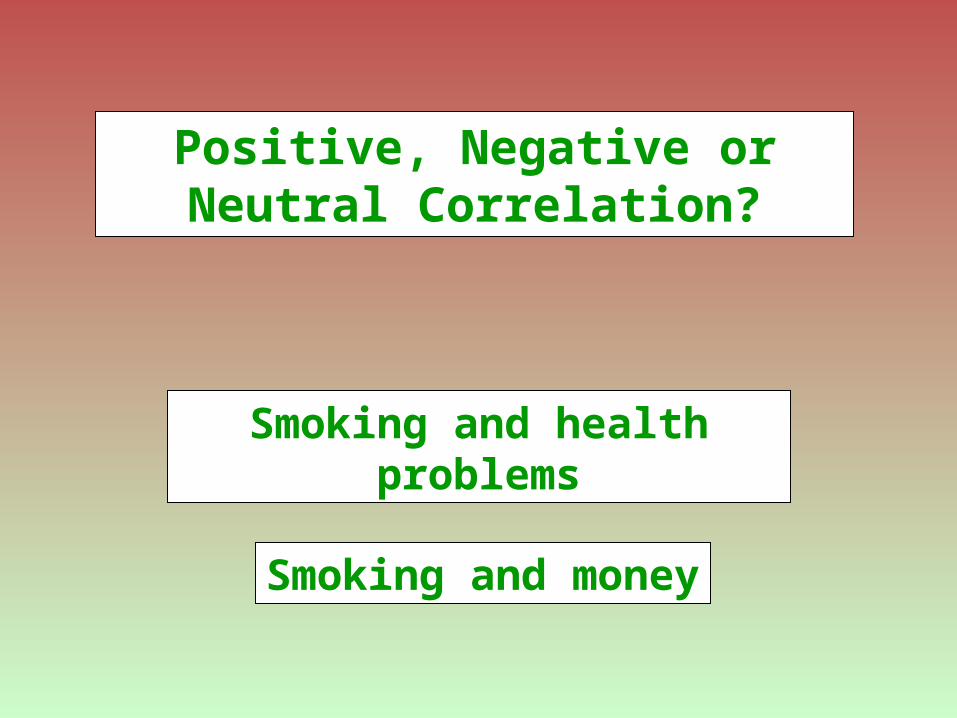
Smoking and health problems
Positive, Negative or Neutral Correlation?
Smoking and money
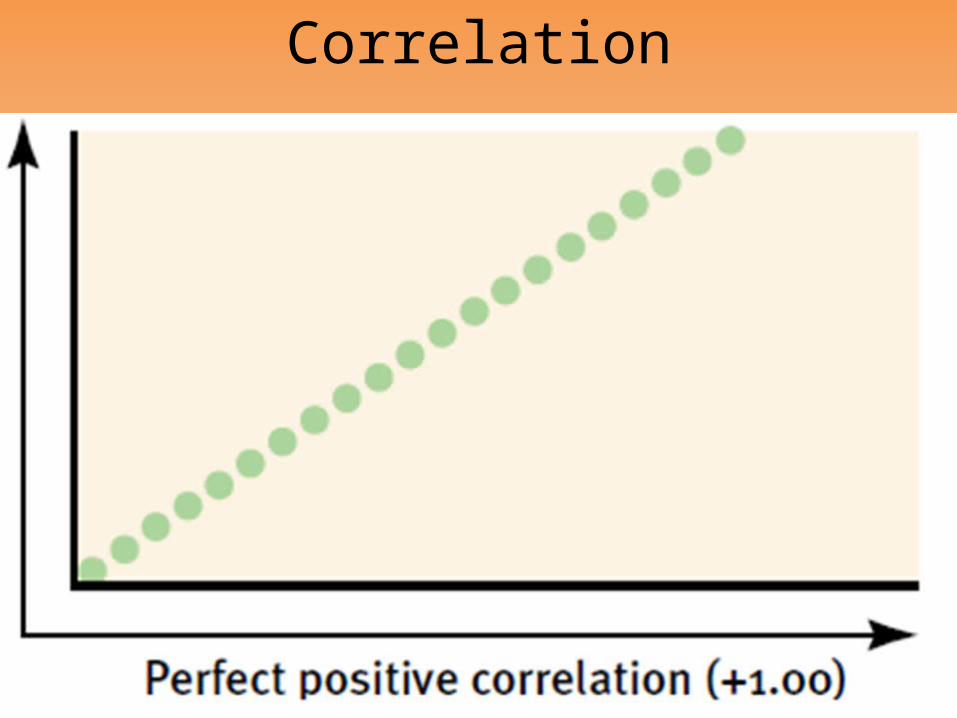
Correlation
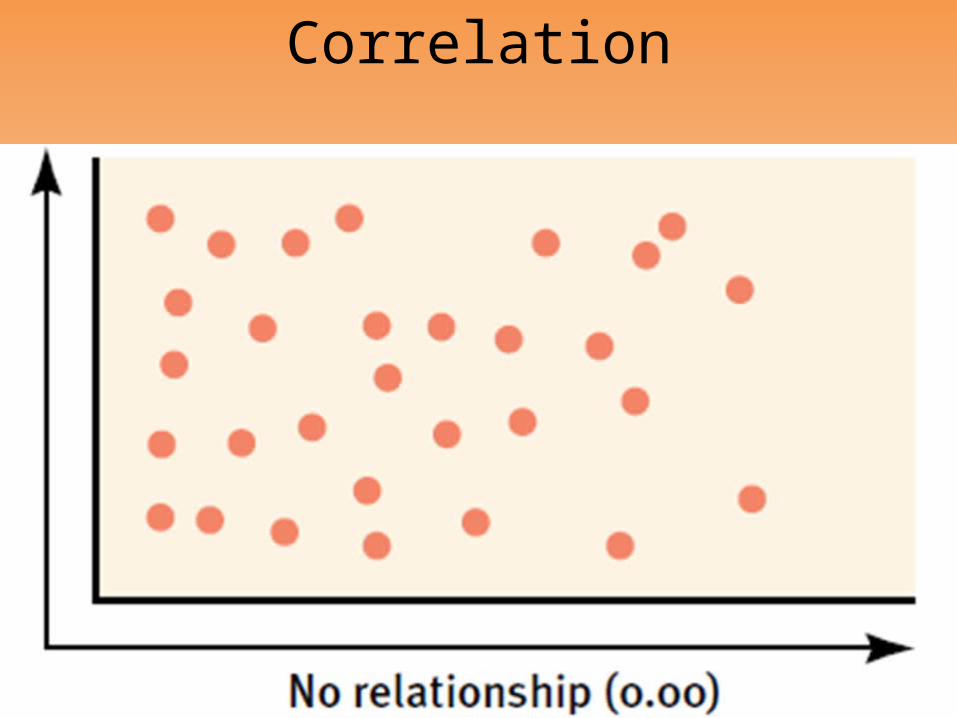
Correlation
Correlation
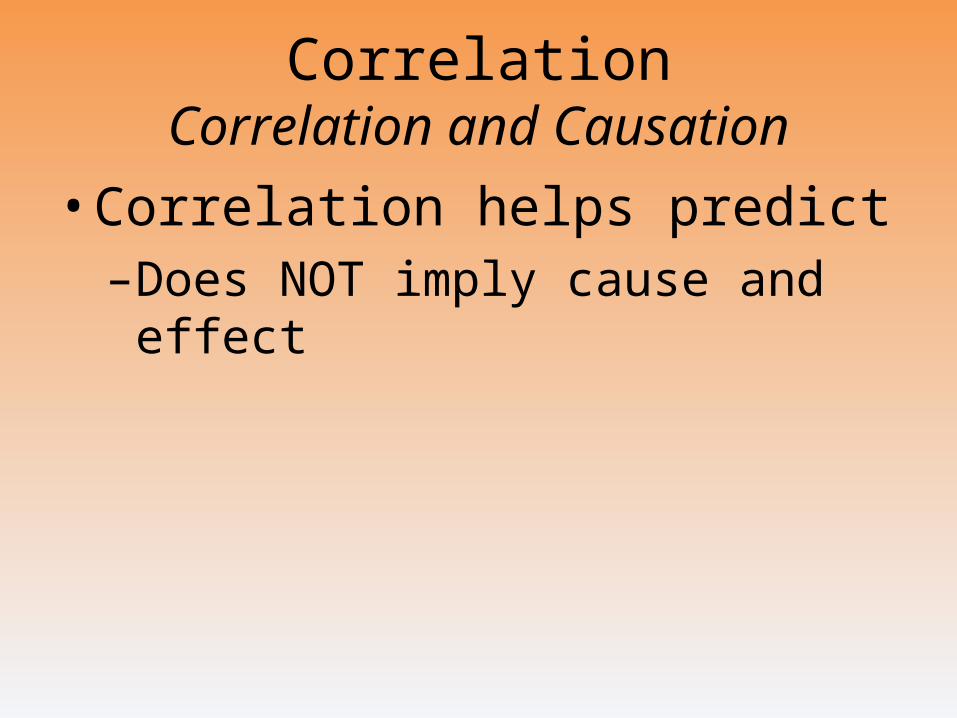
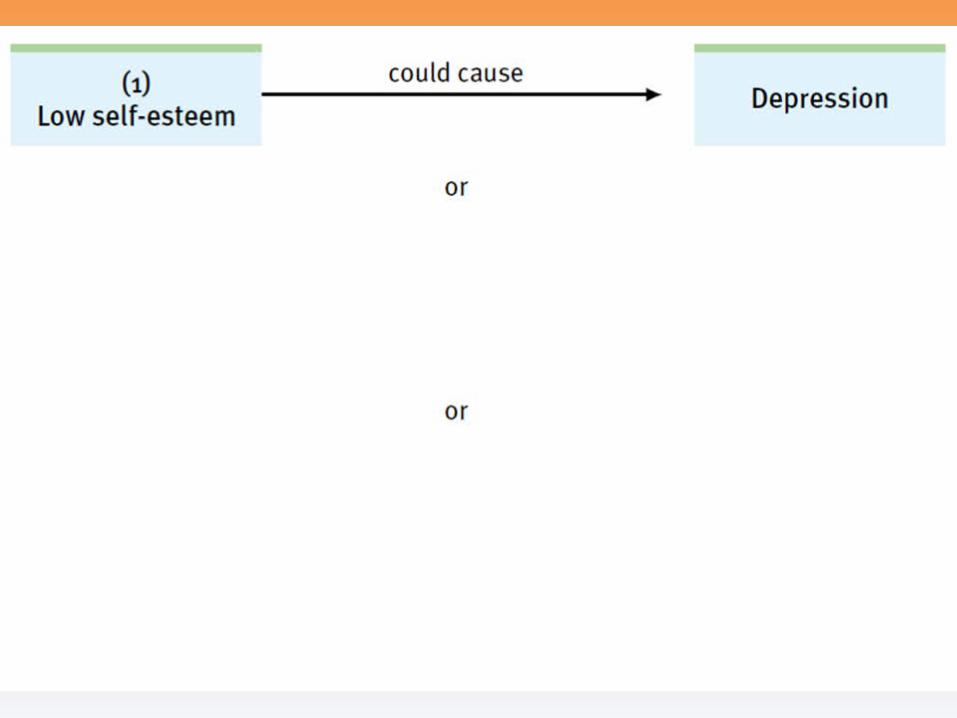
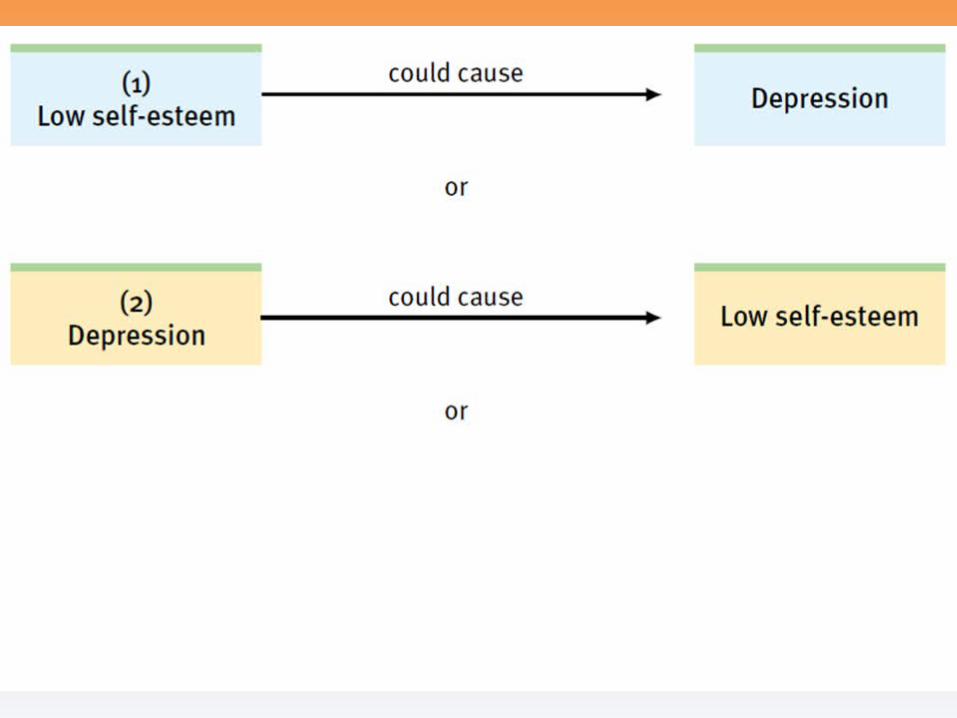
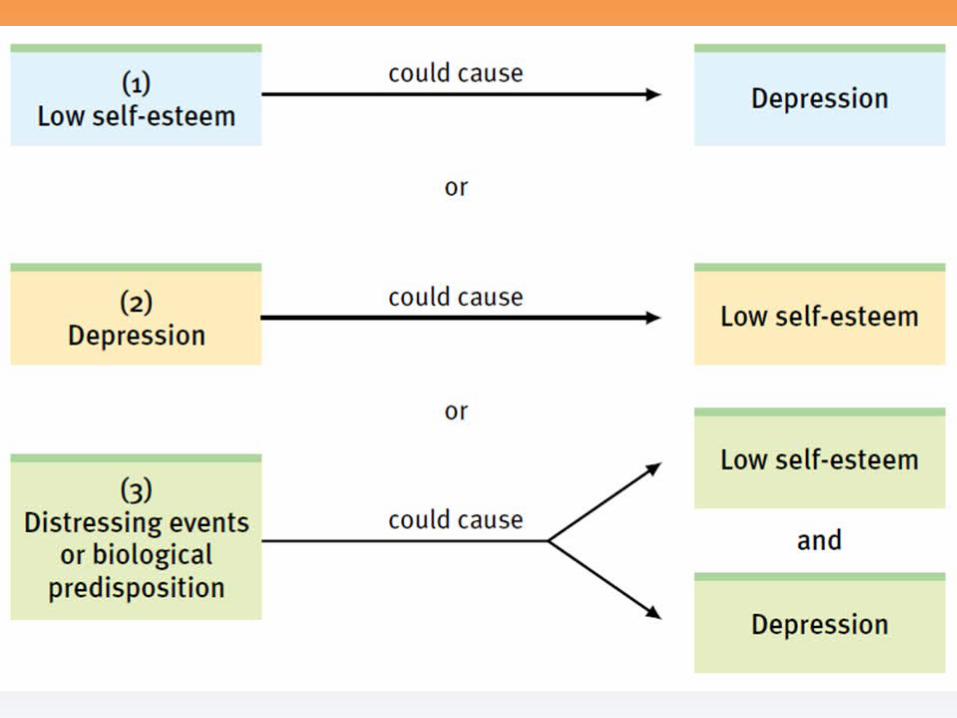
CorrelationCorrelation and Causation
• Correlation helps predict–Does NOT imply cause and effect
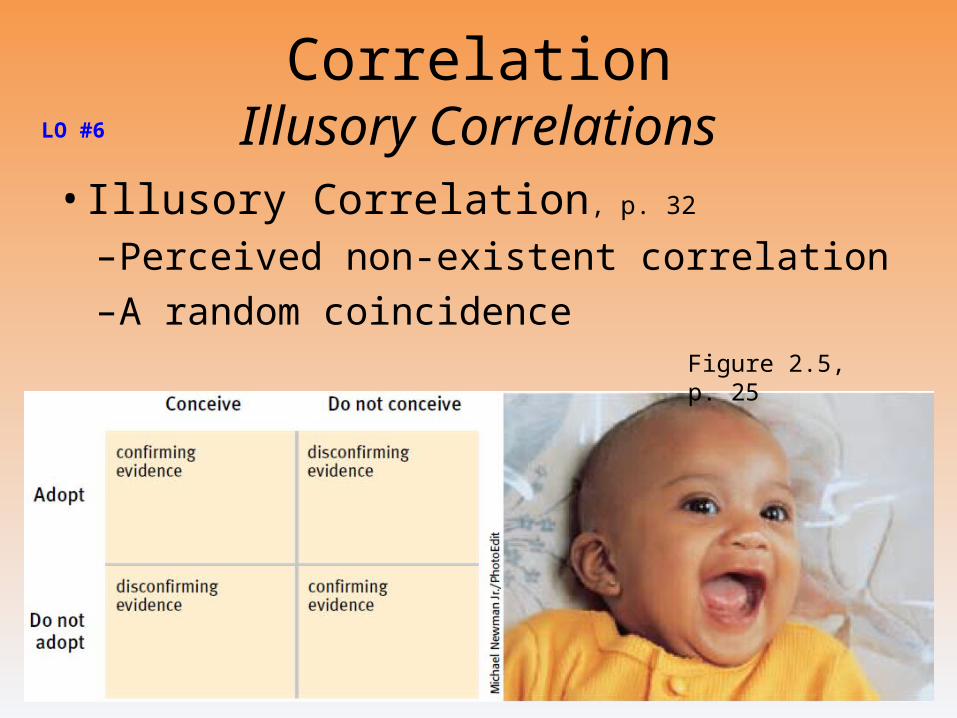
CorrelationIllusory Correlations
• Illusory Correlation, p. 32
–Perceived non-existent correlation
–A random coincidence Figure 2.5, p. 25
LO #6
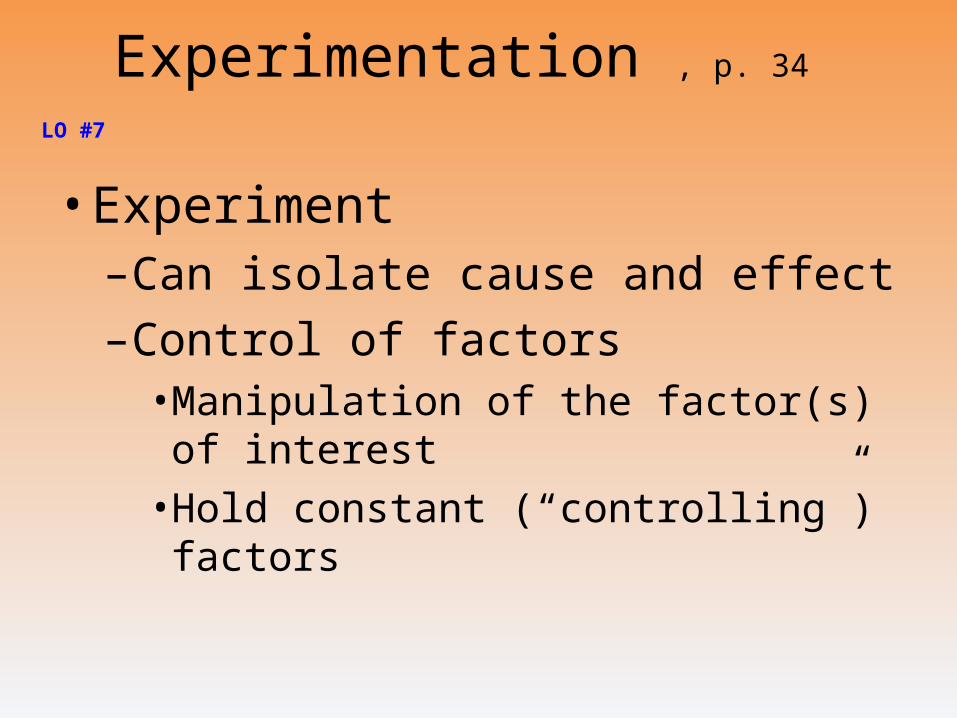
Experimentation , p. 34
• Experiment–Can isolate cause and effect
–Control of factors• Manipulation of the factor(s) of
interest
• Hold constant (“controlling”) factors
LO #7
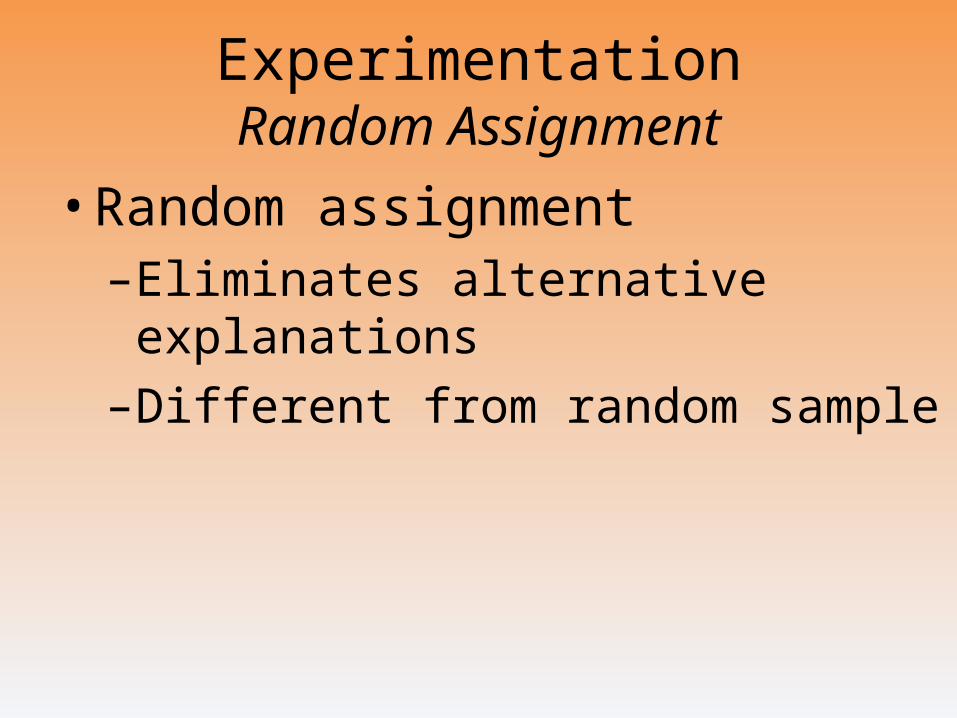
ExperimentationRandom Assignment
• Random assignment–Eliminates alternative explanations
–Different from random sample
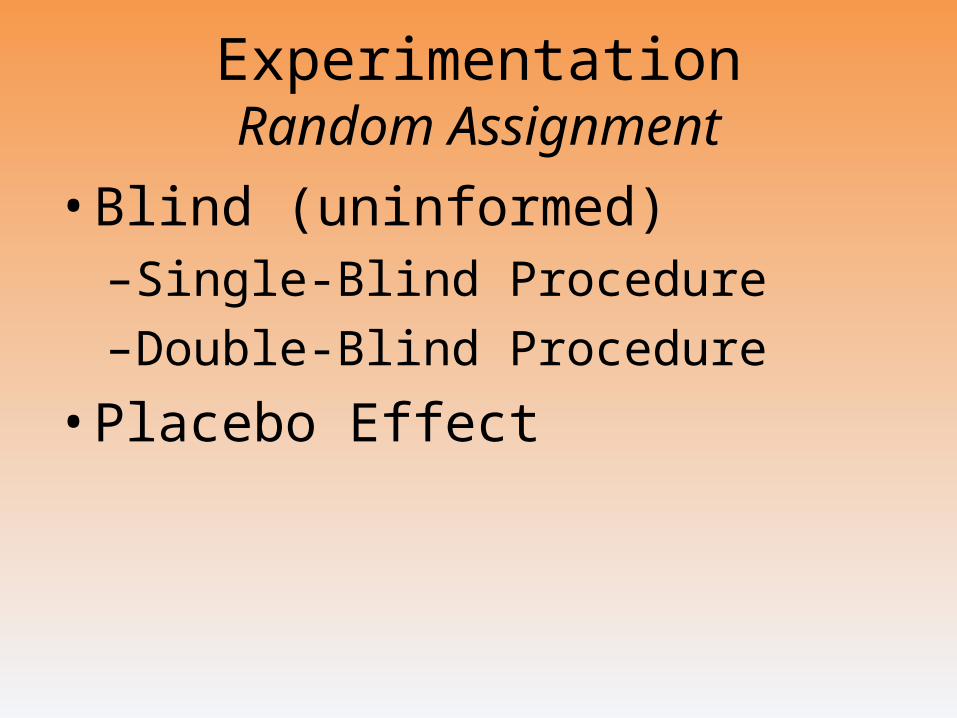
ExperimentationRandom Assignment
• Blind (uninformed)–Single-Blind Procedure
–Double-Blind Procedure
• Placebo Effect
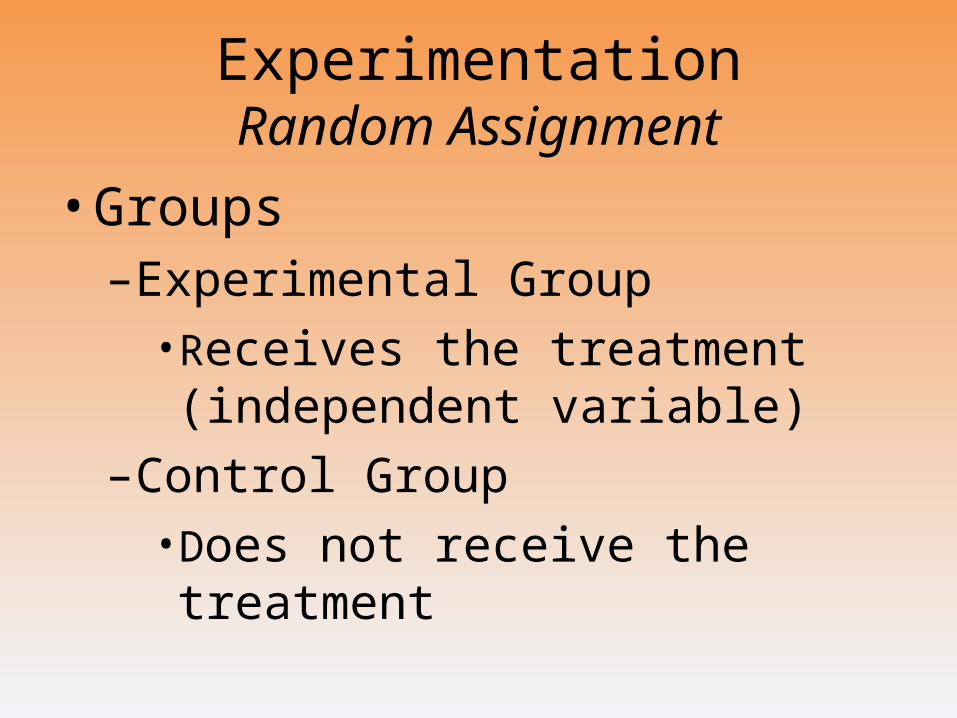
ExperimentationRandom Assignment
• Groups–Experimental Group
• Receives the treatment (independent variable)
–Control Group• Does not receive the treatment
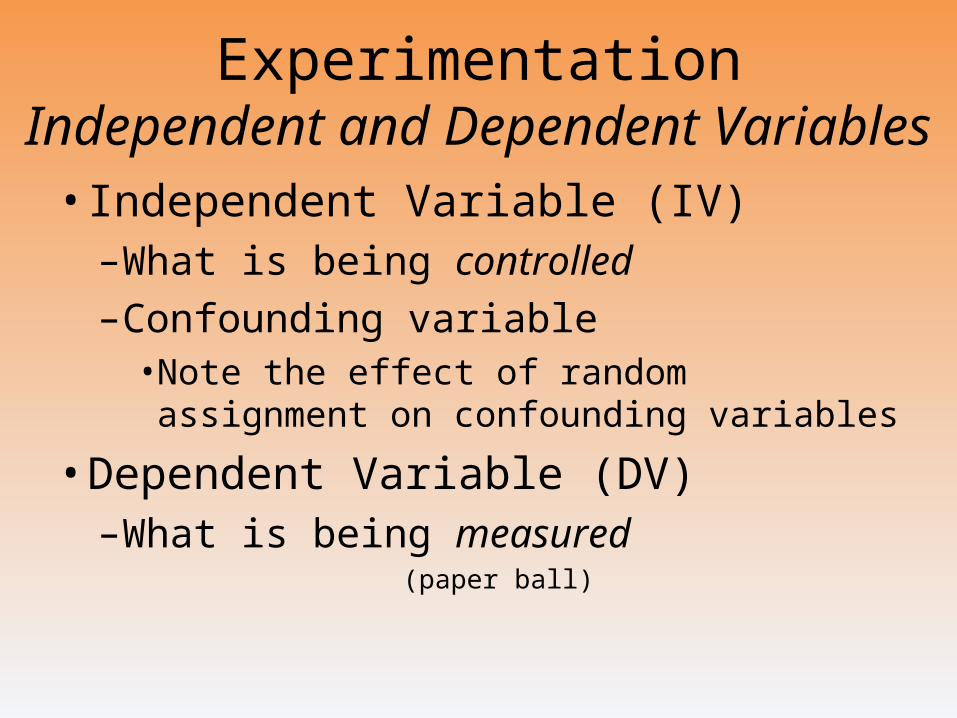
ExperimentationIndependent and Dependent Variables
• Independent Variable (IV)–What is being controlled
–Confounding variable• Note the effect of random assignment on
confounding variables
• Dependent Variable (DV)–What is being measured
(paper ball)
Video: Does Self-Confidence Intimidate Others?
Vol. 2, DVD1 (Clip 101, 3:25)
Experiments
For each hypothesis, consider how you could design a study that would test it, then in the experiment that’s given, identify the independent and dependent variables.
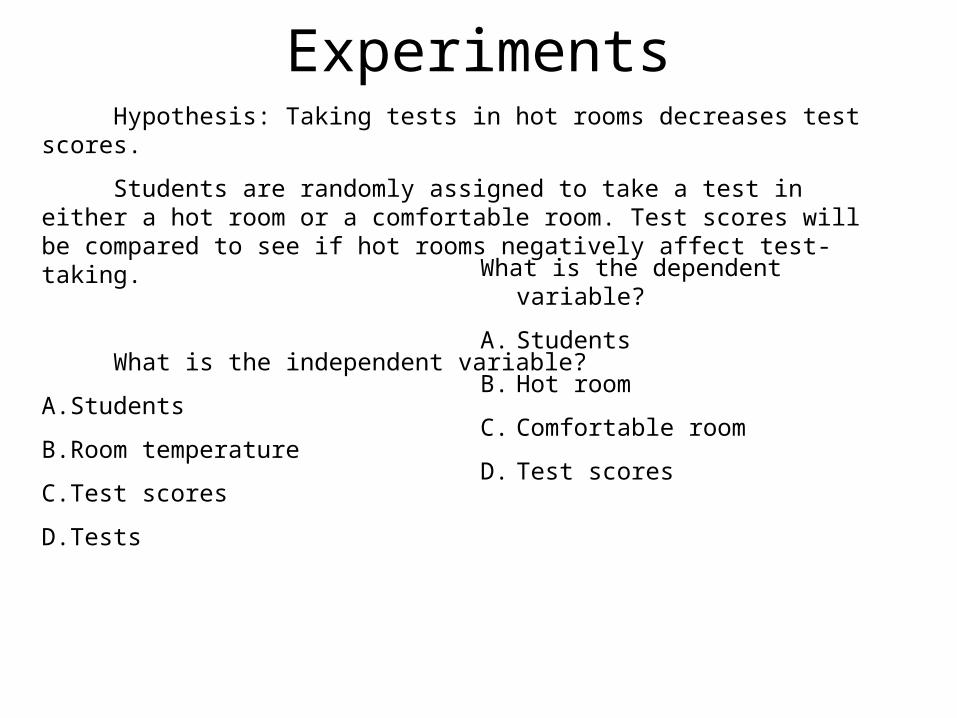
Hypothesis: Taking tests in hot rooms decreases test scores.
Students are randomly assigned to take a test in either a hot room or a comfortable room. Test scores will be compared to see if hot rooms negatively affect test-taking.
What is the independent variable?
A.Students
B.Room temperature
C.Test scores
D.Tests
What is the dependent variable?
A. Students
B. Hot room
C. Comfortable room
D. Test scores
Experiments
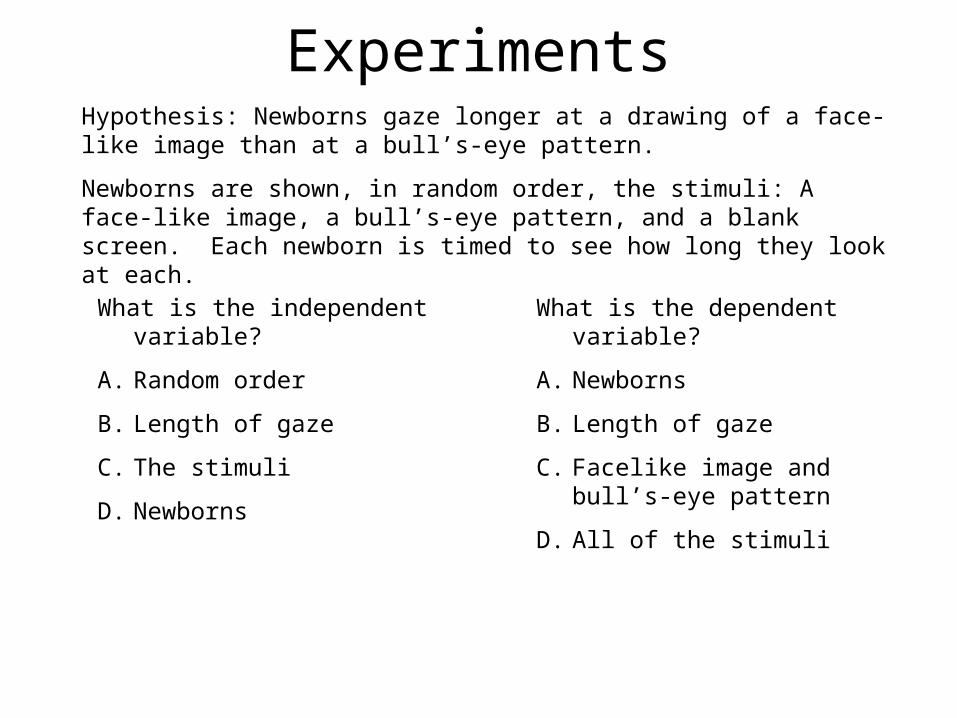
Hypothesis: Newborns gaze longer at a drawing of a face-like image than at a bull’s-eye pattern.
Newborns are shown, in random order, the stimuli: A face-like image, a bull’s-eye pattern, and a blank screen. Each newborn is timed to see how long they look at each.
What is the dependent variable?
A. Newborns
B. Length of gaze
C. Facelike image and bull’s-eye pattern
D. All of the stimuli
What is the independent variable?
A. Random order
B. Length of gaze
C. The stimuli
D. Newborns
Experiments
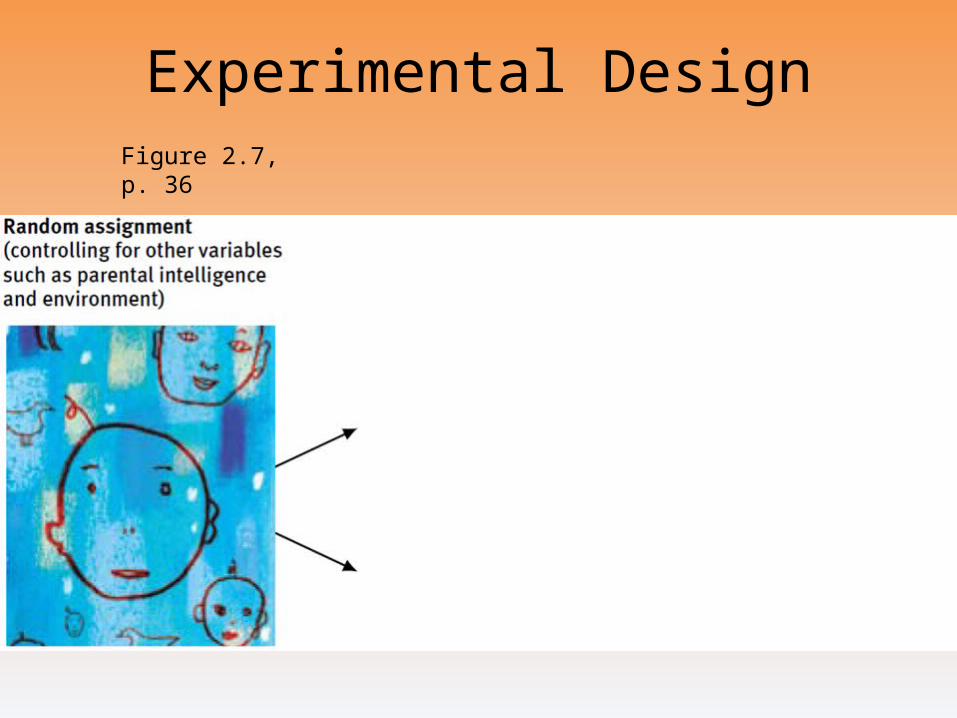
Experimental DesignFigure 2.7, p. 36
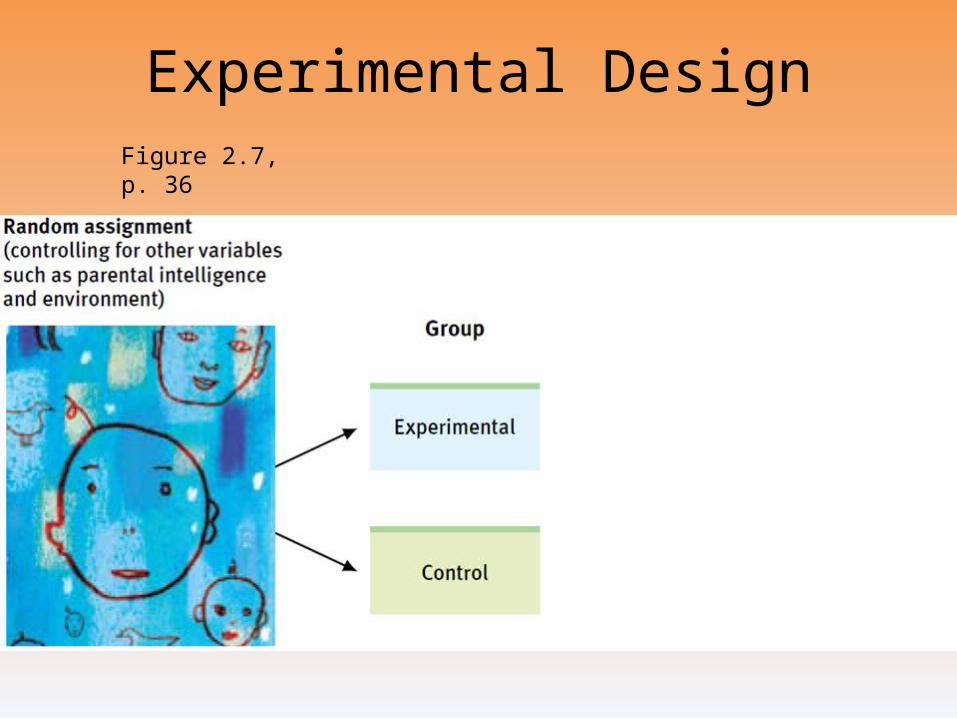
Experimental DesignFigure 2.7, p. 36
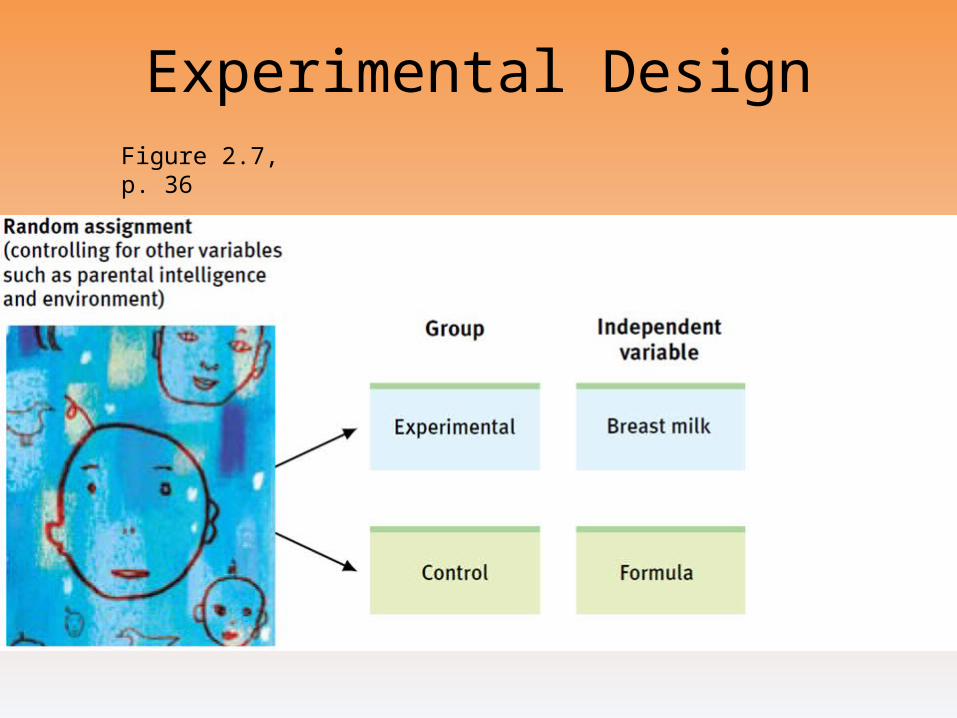
Experimental DesignFigure 2.7, p. 36
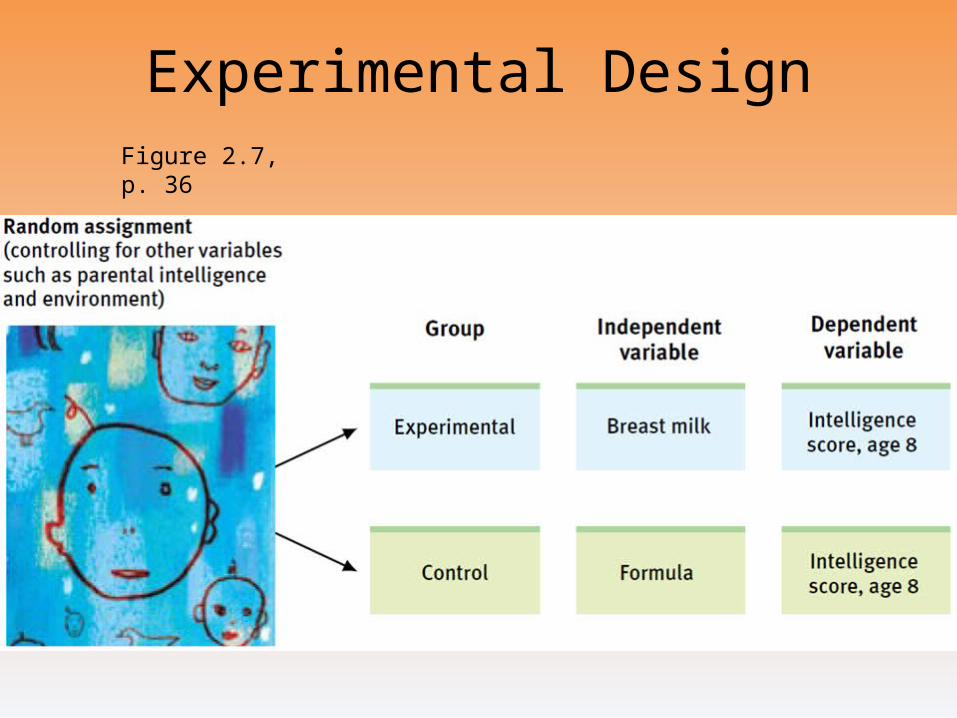
Experimental DesignFigure 2.7, p. 36
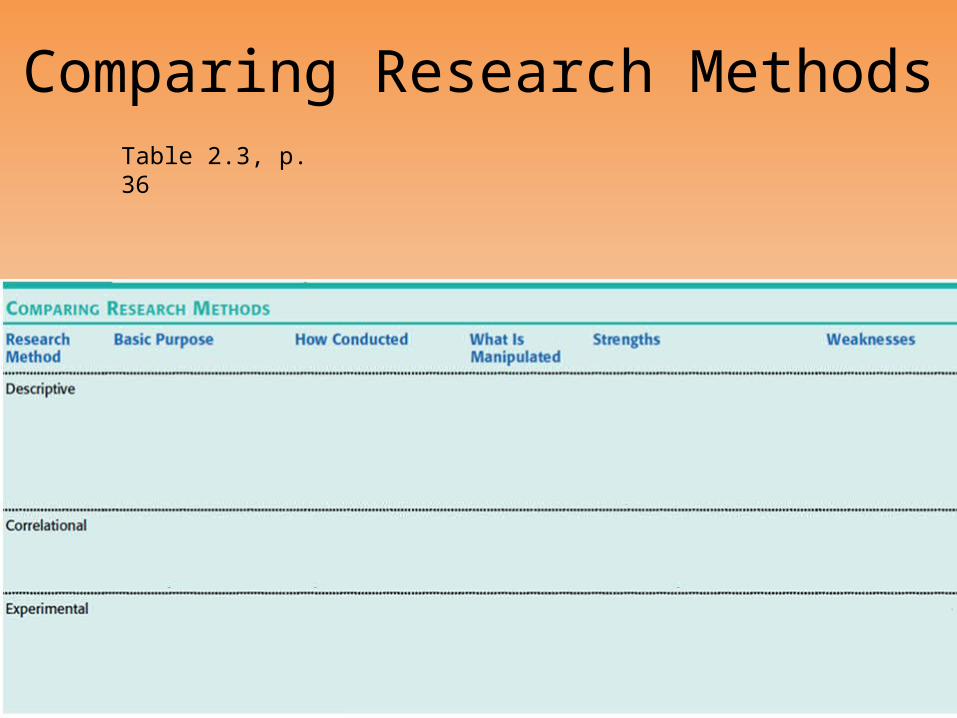
Comparing Research MethodsTable 2.3, p. 36
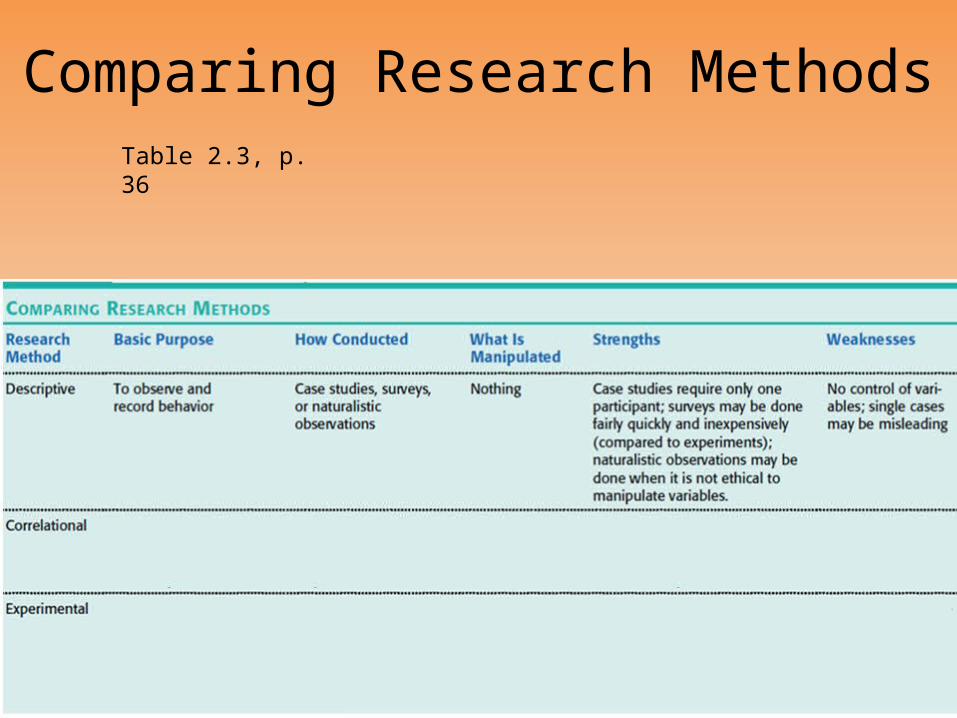
Comparing Research MethodsTable 2.3, p. 36
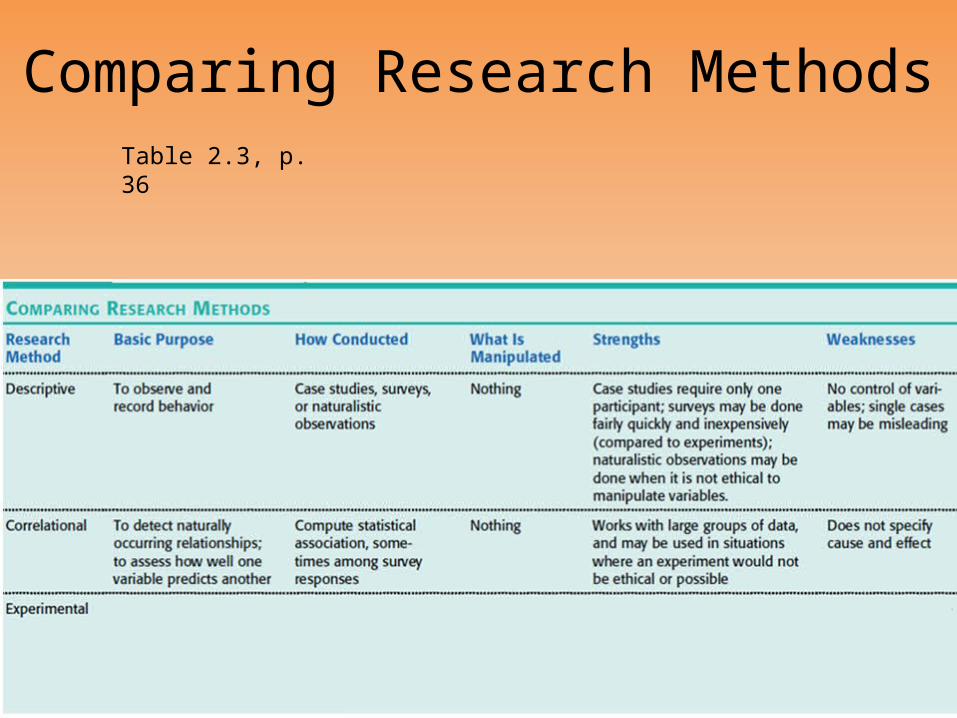
Comparing Research MethodsTable 2.3, p. 36
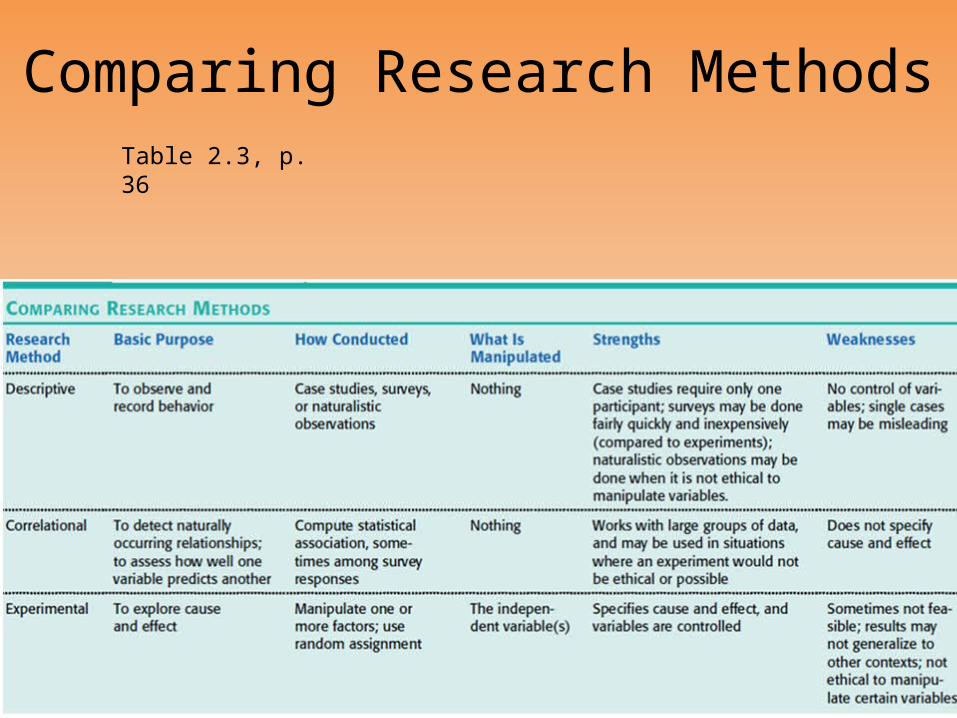
Comparing Research MethodsTable 2.3, p. 36
Statistical Reasoning in Everyday Life
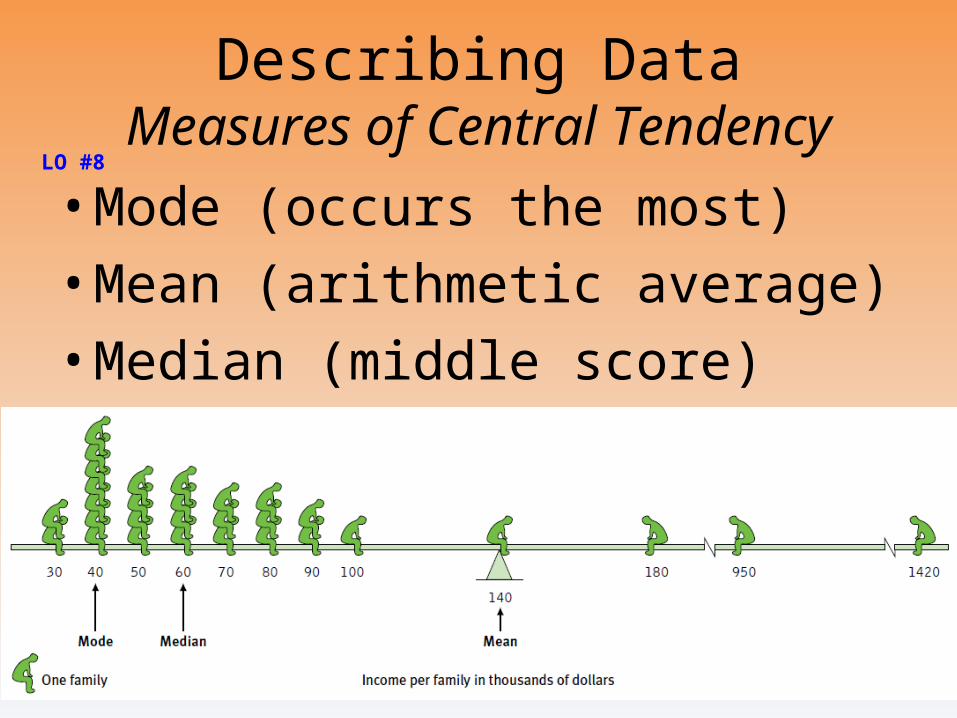
Describing DataMeasures of Central Tendency
• Mode (occurs the most)
• Mean (arithmetic average)
• Median (middle score)
LO #8
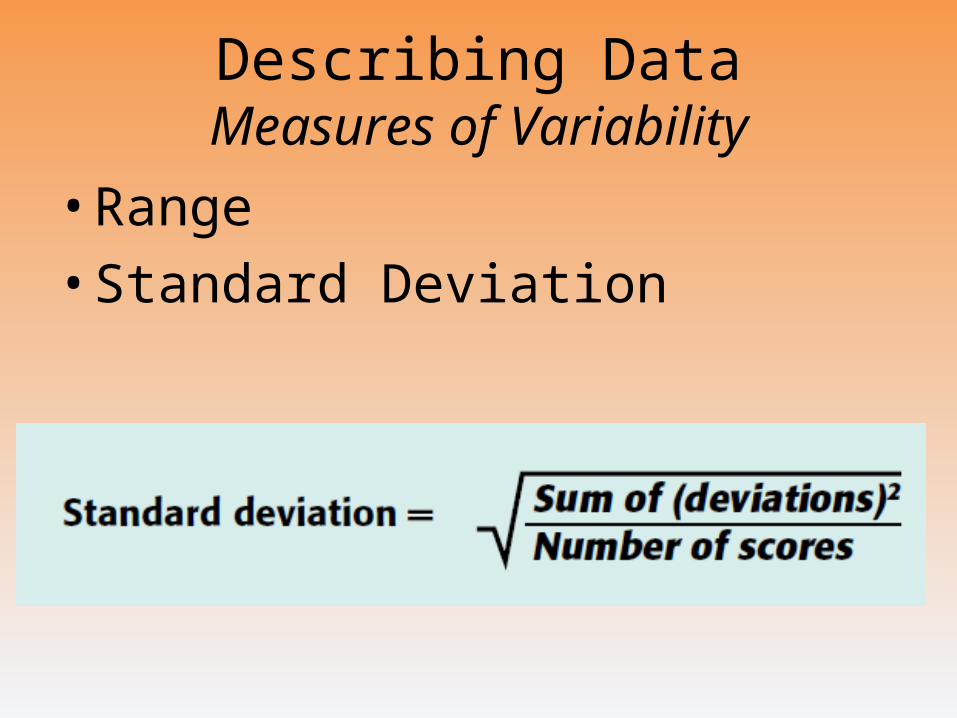
Describing DataMeasures of Variability
• Range
• Standard Deviation
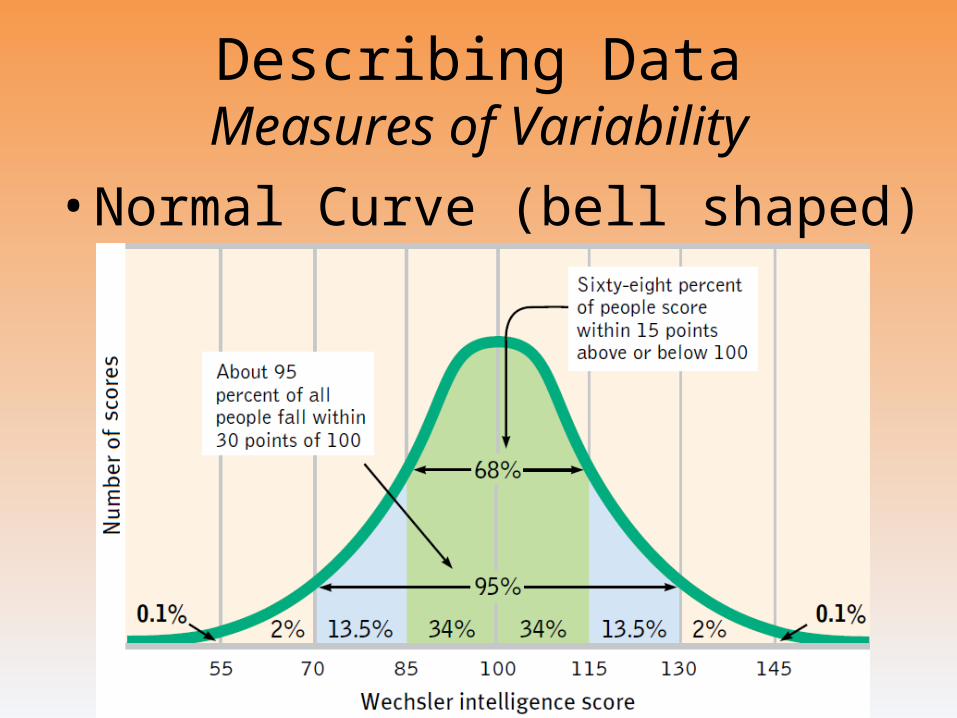
Describing DataMeasures of Variability
• Normal Curve (bell shaped)
Making InferencesWhen Is a Difference Significant?
• Statistical significance–The averages are reliable
–The differences between averages are relatively large
–Does imply the importance of the results
LO #9
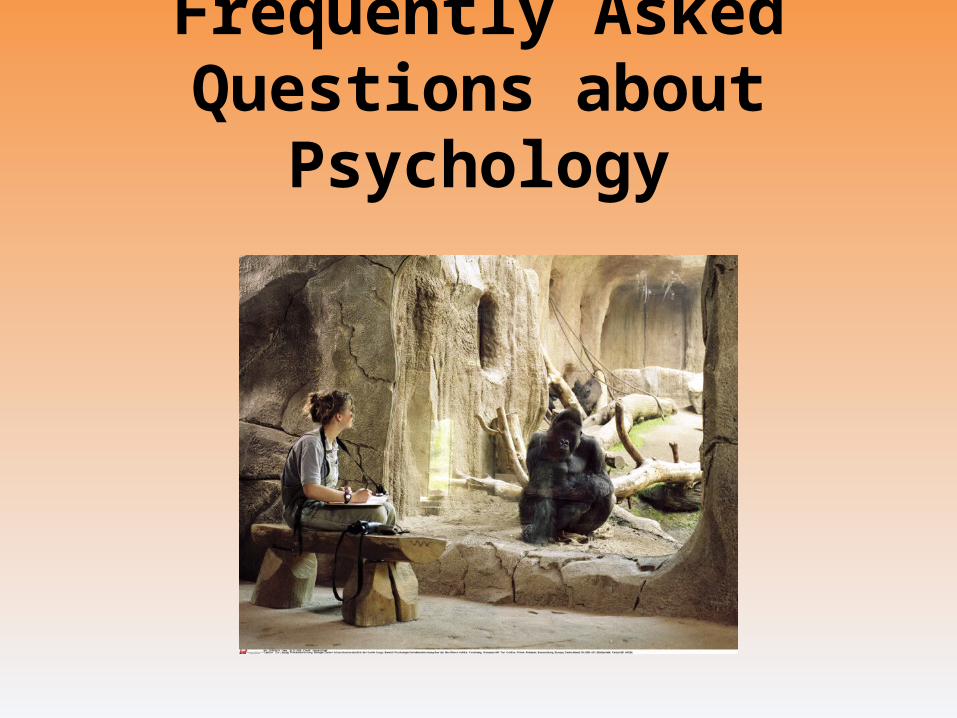
Frequently Asked Questions about Psychology
Psychology Applied
• Can laboratory experiments illuminate everyday life?–The principles - not the research
findings - help explain behavior
LO #10
Psychology Applied
• Does behavior depend on one’s culture and gender?–Culture
• Influence of culture on behavior
–Gender• More similarities than differences
LO #11
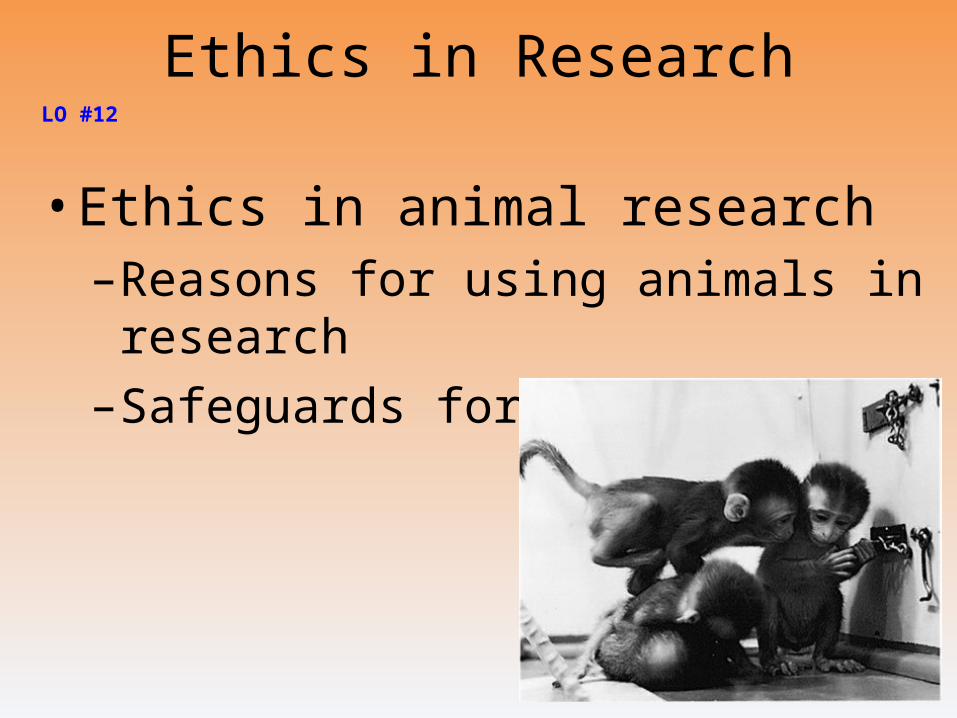
Ethics in Research
• Ethics in animal research–Reasons for using animals in research
–Safeguards for animal use
LO #12
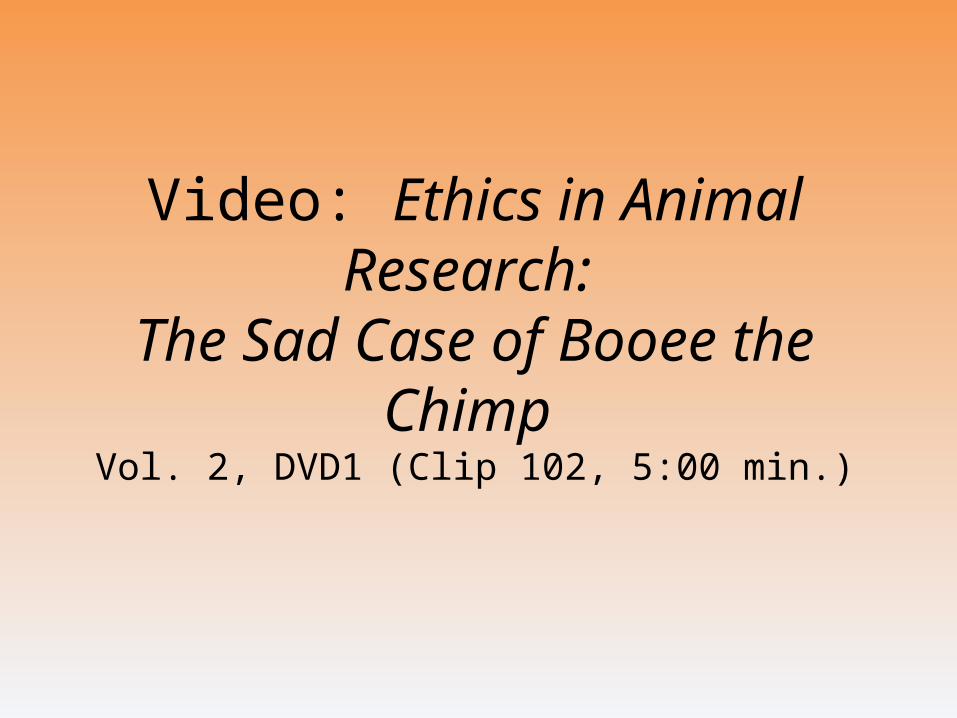
Video: Ethics in Animal Research: The Sad Case of Booee the Chimp
Vol. 2, DVD1 (Clip 102, 5:00 min.)
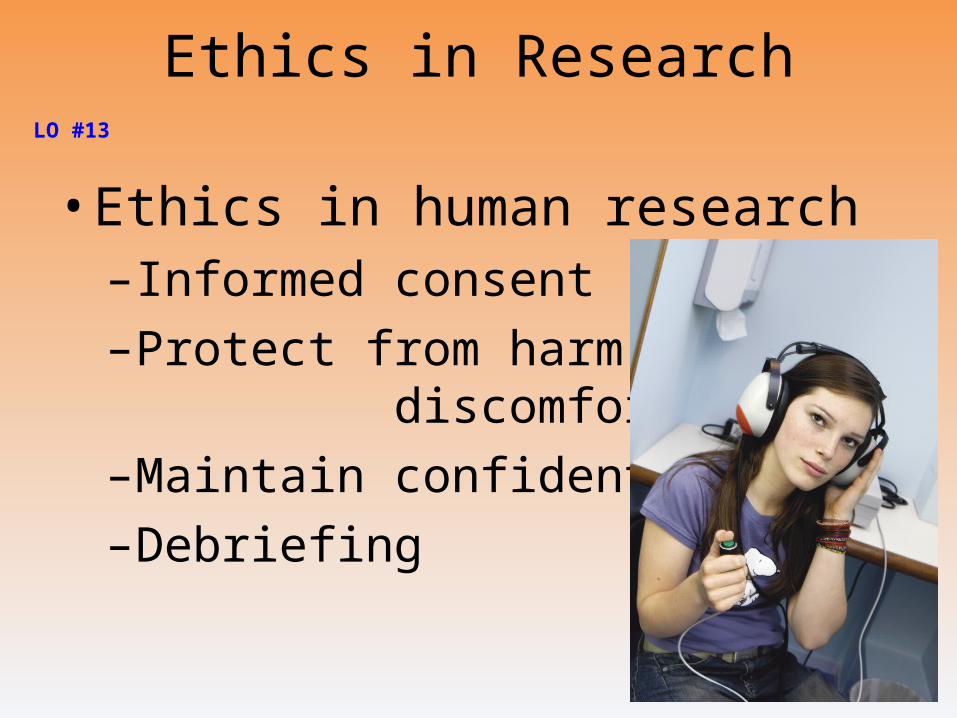
Ethics in Research
• Ethics in human research–Informed consent
–Protect from harm and discomfort
–Maintain confidentiality
–Debriefing
LO #13
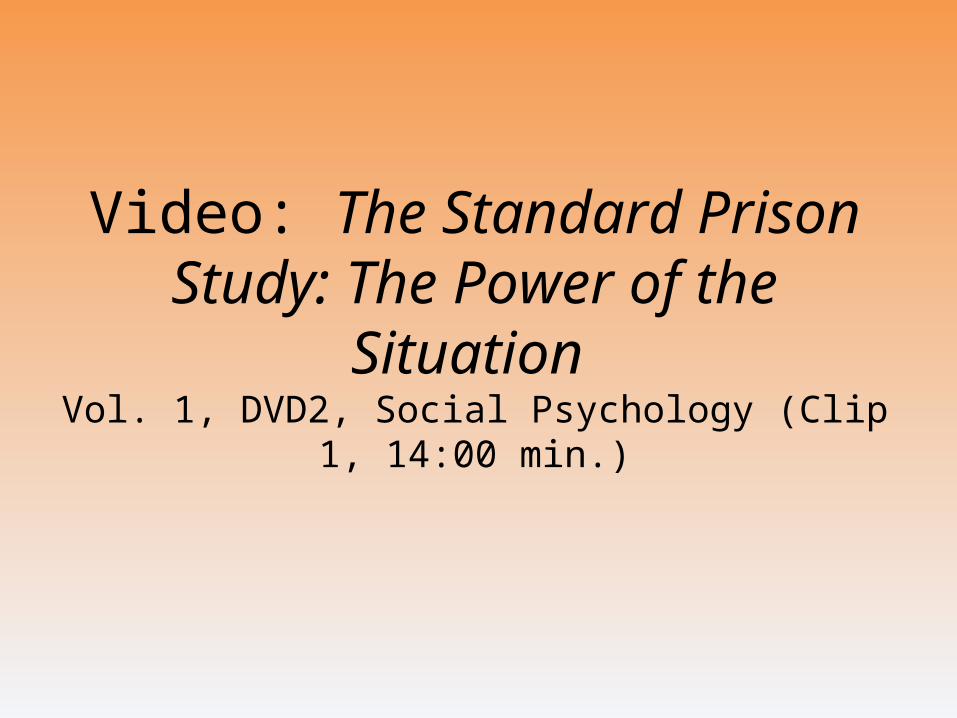
Video: The Standard Prison Study: The Power of the Situation
Vol. 1, DVD2, Social Psychology (Clip 1, 14:00 min.)
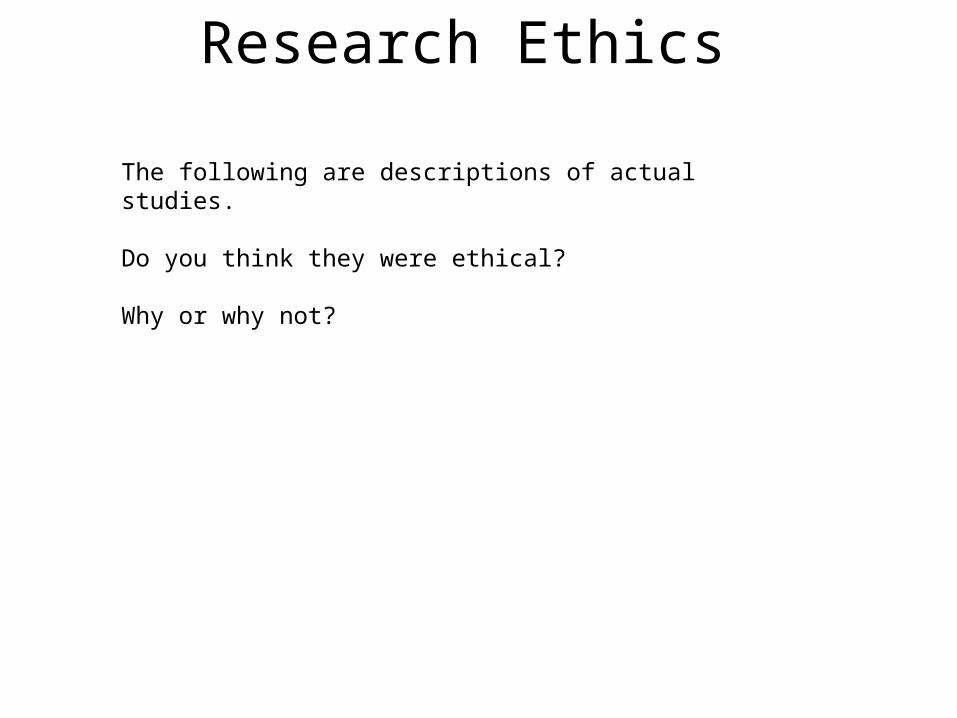
Research Ethics
The following are descriptions of actual studies.
Do you think they were ethical?
Why or why not?
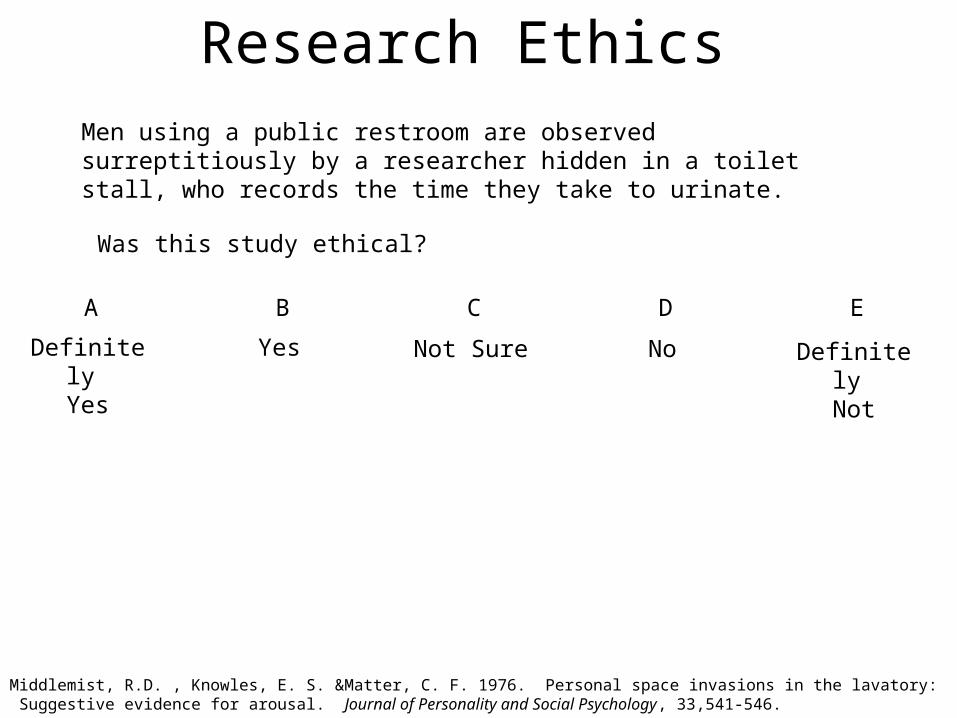
Research EthicsMen using a public restroom are observed surreptitiously by a researcher hidden in a toilet stall, who records the time they take to urinate.
Was this study ethical?
A B C D E
Not SureYes Definitely Not
NoDefinitely Yes
Middlemist, R.D. , Knowles, E. S. &Matter, C. F. 1976. Personal space invasions in the lavatory: Suggestive evidence for arousal. Journal of Personality and Social Psychology, 33,541-546.
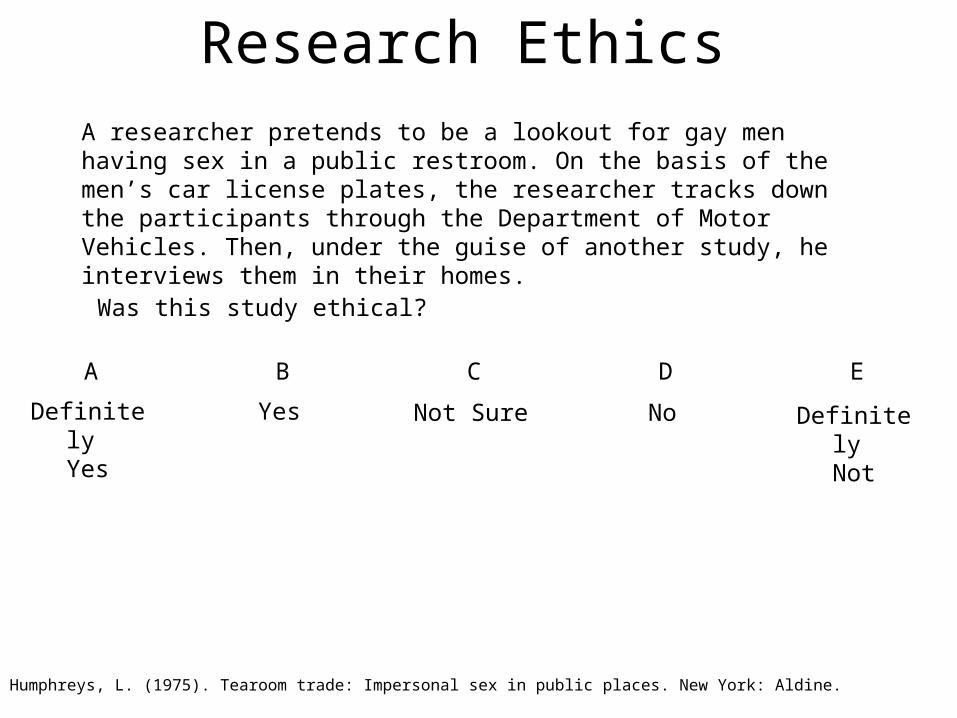
Research EthicsA researcher pretends to be a lookout for gay men having sex in a public restroom. On the basis of the men’s car license plates, the researcher tracks down the participants through the Department of Motor Vehicles. Then, under the guise of another study, he interviews them in their homes.
Was this study ethical?
A B C D E
Not SureYes Definitely Not
NoDefinitely Yes
Humphreys, L. (1975). Tearoom trade: Impersonal sex in public places. New York: Aldine.
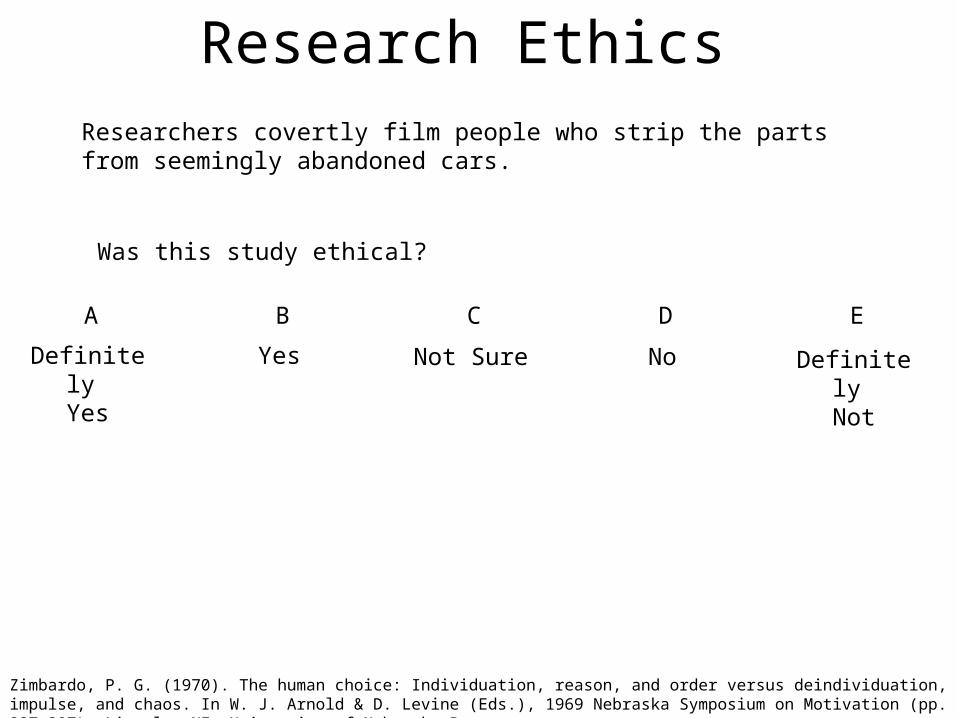
Research EthicsResearchers covertly film people who strip the parts from seemingly abandoned cars.
Was this study ethical?
A B C D E
Not SureYes Definitely Not
NoDefinitely Yes
Zimbardo, P. G. (1970). The human choice: Individuation, reason, and order versus deindividuation, impulse, and chaos. In W. J. Arnold & D. Levine (Eds.), 1969 Nebraska Symposium on Motivation (pp. 237-307). Lincoln, NE: University of Nebraska Press.
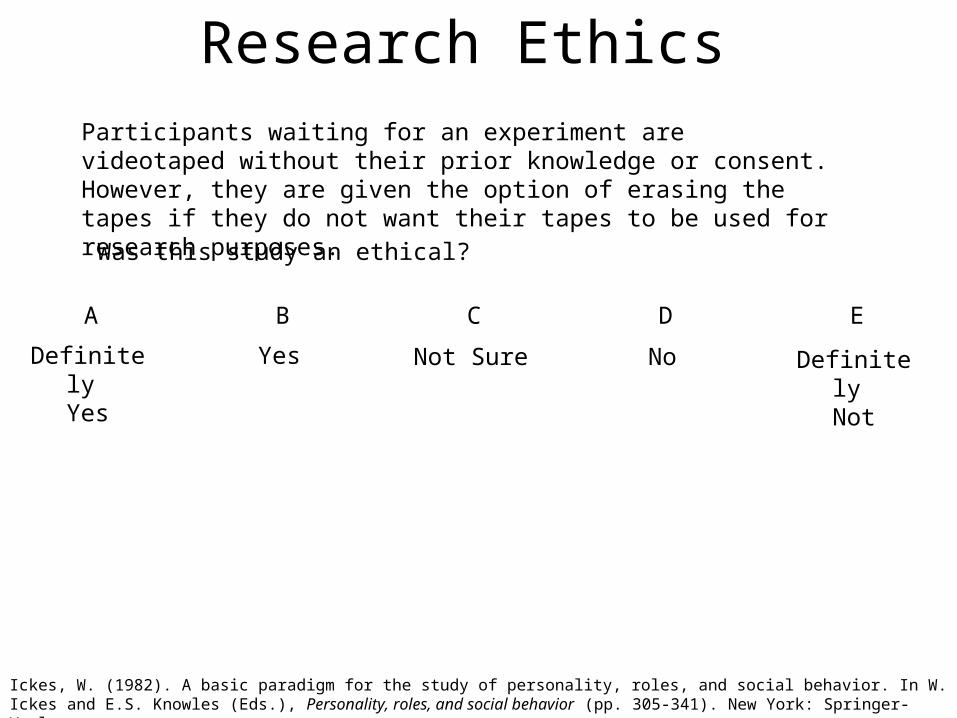
Research EthicsParticipants waiting for an experiment are videotaped without their prior knowledge or consent. However, they are given the option of erasing thetapes if they do not want their tapes to be used for research purposes.
Was this study an ethical?
A B C D E
Not SureYes Definitely Not
NoDefinitely Yes
Ickes, W. (1982). A basic paradigm for the study of personality, roles, and social behavior. In W. Ickes and E.S. Knowles (Eds.), Personality, roles, and social behavior (pp. 305-341). New York: Springer-Verlag.
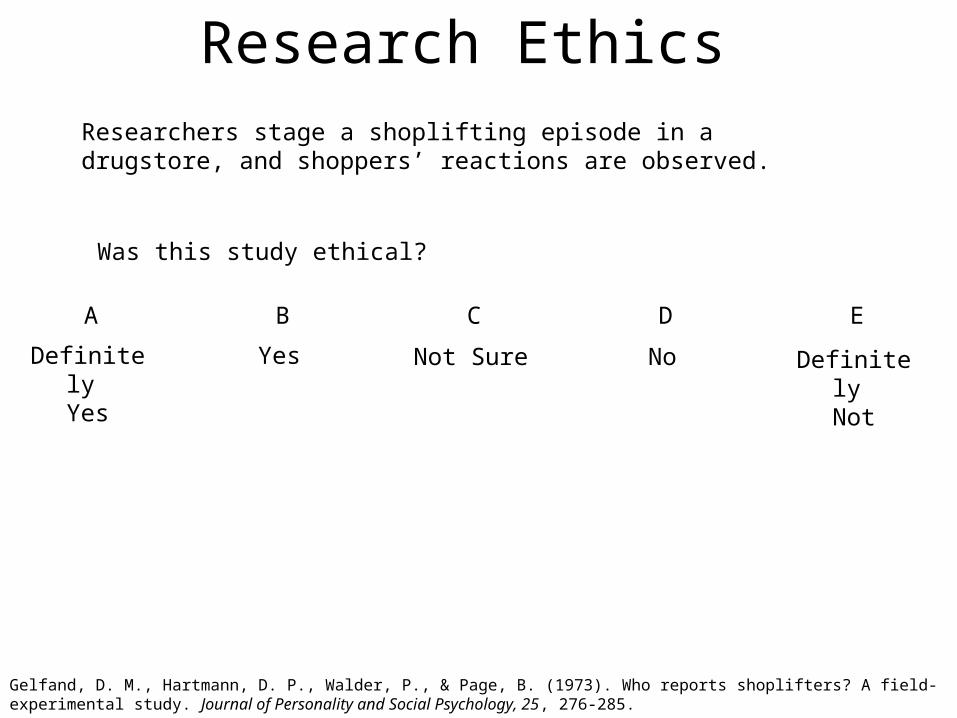
Research EthicsResearchers stage a shoplifting episode in a drugstore, and shoppers’ reactions are observed.
Was this study ethical?
A B C D E
Not SureYes Definitely Not
NoDefinitely Yes
Gelfand, D. M., Hartmann, D. P., Walder, P., & Page, B. (1973). Who reports shoplifters? A field-experimental study. Journal of Personality and Social Psychology, 25, 276-285.
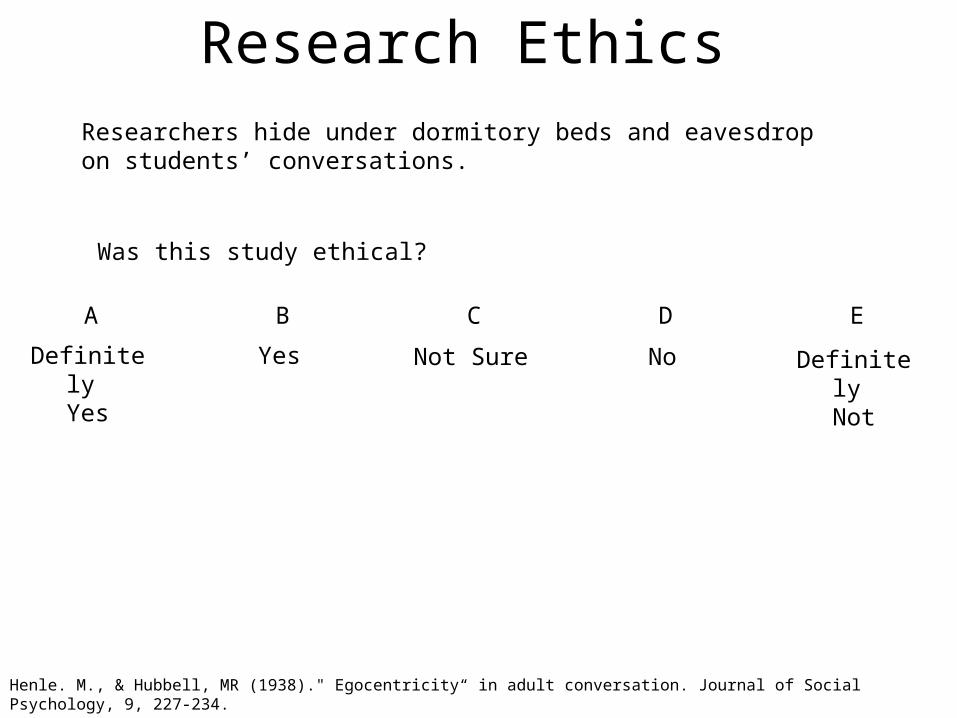
Research EthicsResearchers hide under dormitory beds and eavesdrop on students’ conversations.
Was this study ethical?
A B C D E
Not SureYes Definitely Not
NoDefinitely Yes
Henle. M., & Hubbell, MR (1938)." Egocentricity“ in adult conversation. Journal of Social Psychology, 9, 227-234.
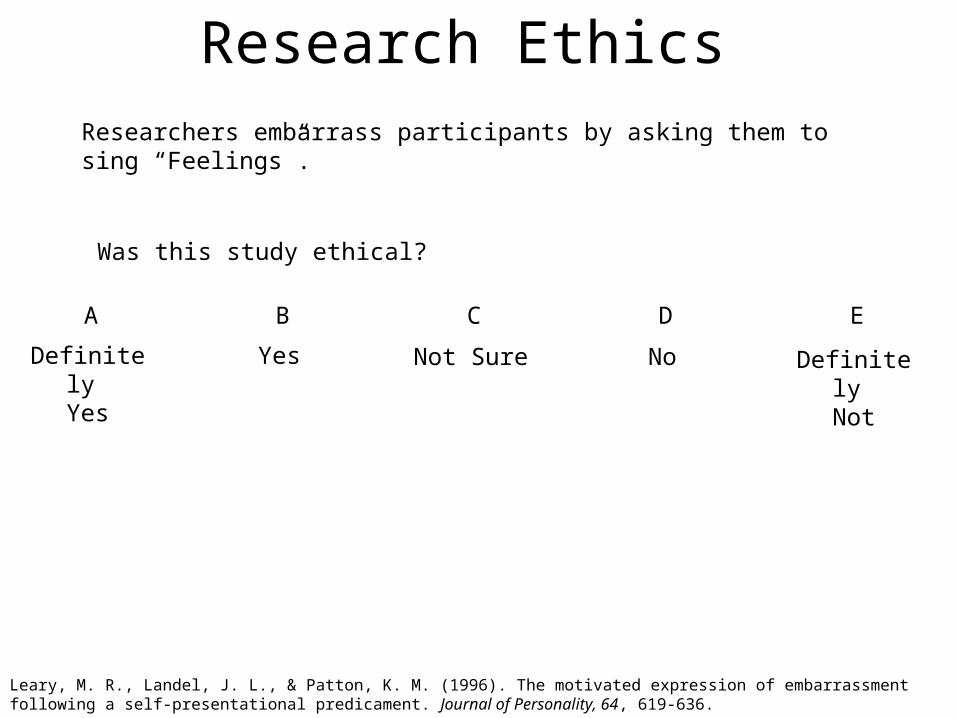
Research EthicsResearchers embarrass participants by asking them to sing “Feelings”.
Was this study ethical?
A B C D E
Not SureYes Definitely Not
NoDefinitely Yes
Leary, M. R., Landel, J. L., & Patton, K. M. (1996). The motivated expression of embarrassment following a self-presentational predicament. Journal of Personality, 64, 619-636.
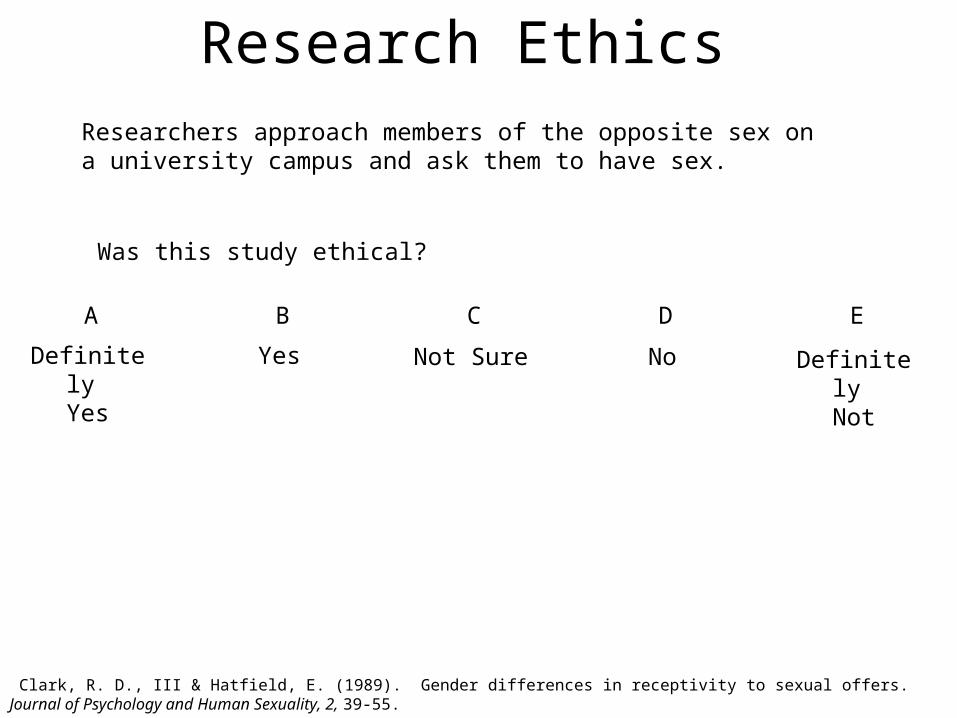
Research EthicsResearchers approach members of the opposite sex on a university campus and ask them to have sex.
Was this study ethical?
A B C D E
Not SureYes Definitely Not
NoDefinitely Yes
Clark, R. D., III & Hatfield, E. (1989). Gender differences in receptivity to sexual offers. Journal of Psychology and Human Sexuality, 2, 39-55.

LO #14
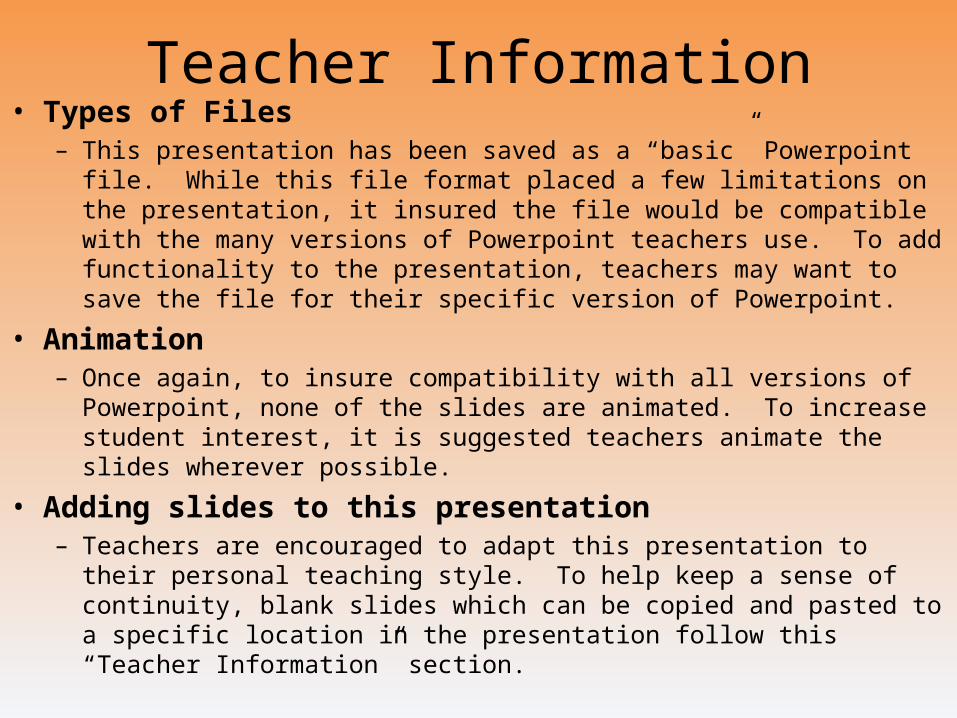
Teacher Information• Types of Files
– This presentation has been saved as a “basic” Powerpoint file. While this file format placed a few limitations on the presentation, it insured the file would be compatible with the many versions of Powerpoint teachers use. To add functionality to the presentation, teachers may want to save the file for their specific version of Powerpoint.
• Animation– Once again, to insure compatibility with all versions of Powerpoint, none of the
slides are animated. To increase student interest, it is suggested teachers animate the slides wherever possible.
• Adding slides to this presentation– Teachers are encouraged to adapt this presentation to their personal teaching
style. To help keep a sense of continuity, blank slides which can be copied and pasted to a specific location in the presentation follow this “Teacher Information” section.
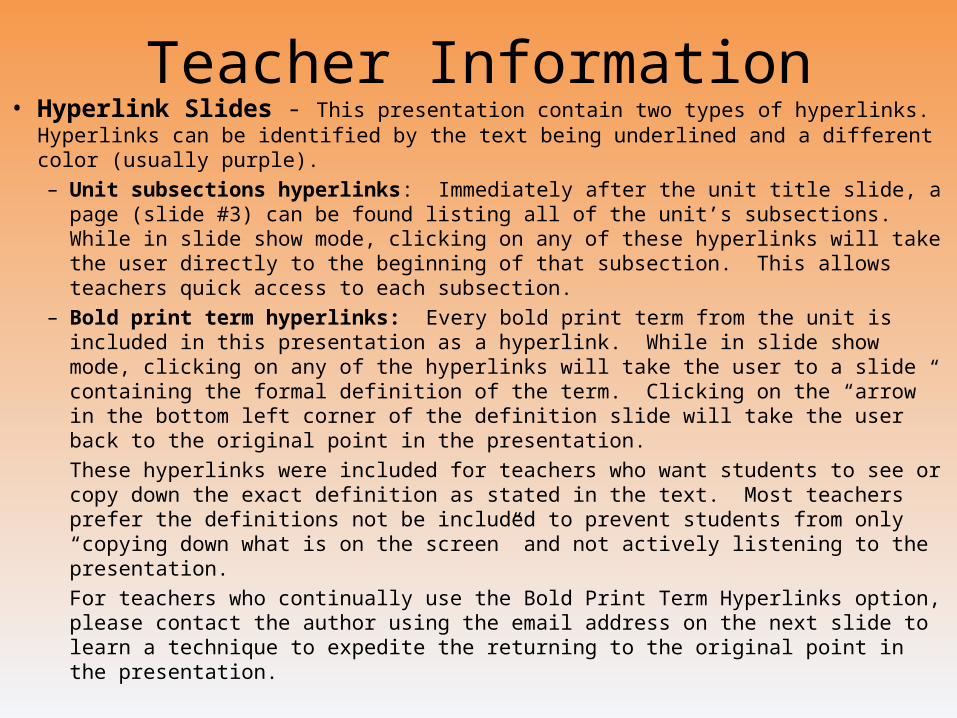
Teacher Information• Hyperlink Slides - This presentation contain two types of hyperlinks. Hyperlinks
can be identified by the text being underlined and a different color (usually purple).– Unit subsections hyperlinks: Immediately after the unit title slide, a page (slide
#3) can be found listing all of the unit’s subsections. While in slide show mode, clicking on any of these hyperlinks will take the user directly to the beginning of that subsection. This allows teachers quick access to each subsection.
– Bold print term hyperlinks: Every bold print term from the unit is included in this presentation as a hyperlink. While in slide show mode, clicking on any of the hyperlinks will take the user to a slide containing the formal definition of the term. Clicking on the “arrow” in the bottom left corner of the definition slide will take the user back to the original point in the presentation. These hyperlinks were included for teachers who want students to see or copy down the exact definition as stated in the text. Most teachers prefer the definitions not be included to prevent students from only “copying down what is on the screen” and not actively listening to the presentation.For teachers who continually use the Bold Print Term Hyperlinks option, please contact the author using the email address on the next slide to learn a technique to expedite the returning to the original point in the presentation.
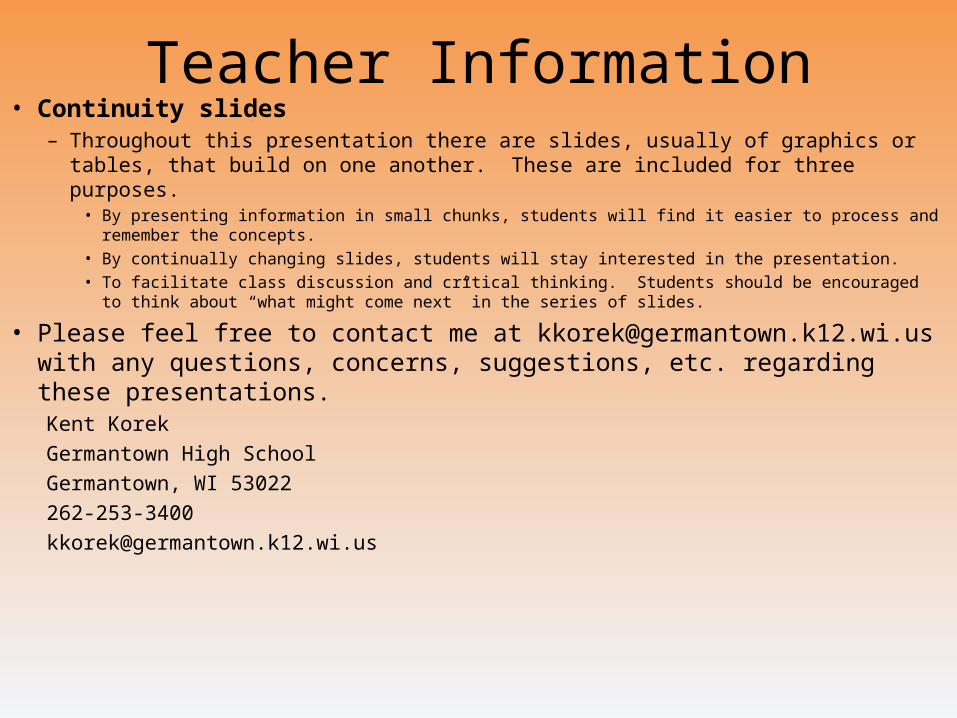
Teacher Information• Continuity slides
– Throughout this presentation there are slides, usually of graphics or tables, that build on one another. These are included for three purposes.
• By presenting information in small chunks, students will find it easier to process and remember the concepts.
• By continually changing slides, students will stay interested in the presentation.• To facilitate class discussion and critical thinking. Students should be encouraged to think about “what
might come next” in the series of slides.
• Please feel free to contact me at [email protected] with any questions, concerns, suggestions, etc. regarding these presentations. Kent KorekGermantown High SchoolGermantown, WI [email protected]
Division title (green print)subdivision title (blue print)
• xxx–xxx
–xxx
Division title (green print)subdivision title (blue print)
Use this slide to add a table, chart, clip art, picture, diagram, or video clip. Delete this box when finished
Definition Slide
= add definition here
Definition Slides
Hindsight Bias
= the tendency to believe, after learning an outcome, that one would have foreseen it.
• Also known as the “I knew it all along” phenomenon.
Critical Thinking
= thinking that does not blindly accept arguments and conclusions. Rather, it examines assumptions, discerns hidden values, evaluates evidence, and assesses conclusions.
Theory
= an explanation using an integrated set of principles that organizes observations and predicts behaviors or events.
Hypothesis
= a testable prediction, often implied by a theory.
Operational Definition
= a statement of the procedures (operations) used to define research variables.
• i.e. Human intelligence may be operationally defined as what an intelligence test measures.
Replication
= repeating the essence of a research study, usually with different participants in different situations, to see whether the basic finding extends to other participants and circumstances.
Case Study
= an observation technique in which one person is studied in depth in the hope of revealing universal principles.
Survey
= a technique for ascertaining the self-reported attitudes or behaviors of a particular group, usually by questioning a representative, random sample of the group.
Population
= all the cases in a group being studied, from which samples may be drawn.
• Note: Except for national studies, this does NOT refer to a country’s whole population.
Random Sample
= a sample that fairly represents a population because each member has an equal chance of inclusion.
Naturalistic Observation
= observing and recording behavior in naturally occurring situations without trying to manipulate and control the situation.
Correlation
= a measure of the extent to which two factors vary together, and thus of how well either factor predicts the other.
Correlation Coefficient
= a statistical index of the relationship between two things (from -1 to +1).
Scatterplot
= a graphed cluster of dots, each of which represents the values of two variables. The slope of the points suggests the direction of the relationship between the two variables. The amount of scatter suggests the strength of the correlation (little scatter indicates high correlation).
Illusory Correlation
= the perception of a relationship where none exists.
Experiment
= a research method in which an investigator manipulates one or more factors (independent variables) to observe the effect on some behavior or mental process (the dependent variable). By random assignment of participants, the experimenter aims to control other relevant factors.
Random Assigment
= assigning participants to experimental and control groups by chance, thus minimizing preexisting differences between those assigned to the different groups.
Double-Blind Procedure
= an experimental procedure in which both the research participants and the research staff are ignorant (blind) about whether the research participants have received the treatment or the placebo. Commonly used in drug-evaluation studies.
Placebo Effect
= experimental results caused by expectation alone; any effect on behavior caused by the administration of an inert substance or condition, which the recipient assumes is an active agent.
Experimental Group
= in an experiment, the group that is exposed to the treatment, that is, to one version of the independent variable.
Control Group
= in an experiment, the group that is NOT exposed to the treatment; contrasts with the experimental group and serves as a comparison for evaluating the effect of treatment.
Independent Variable
= the experimental factor that is manipulated; the variable whose effect is being studied.
* “what is controlled”
Confounding Variable
= a factor other than the independent variable that might produce an effect in an experiment.
Dependent Variable
= the outcome factor; the variable that may change in response to manipulations of the independent variable.
* “what is measured”
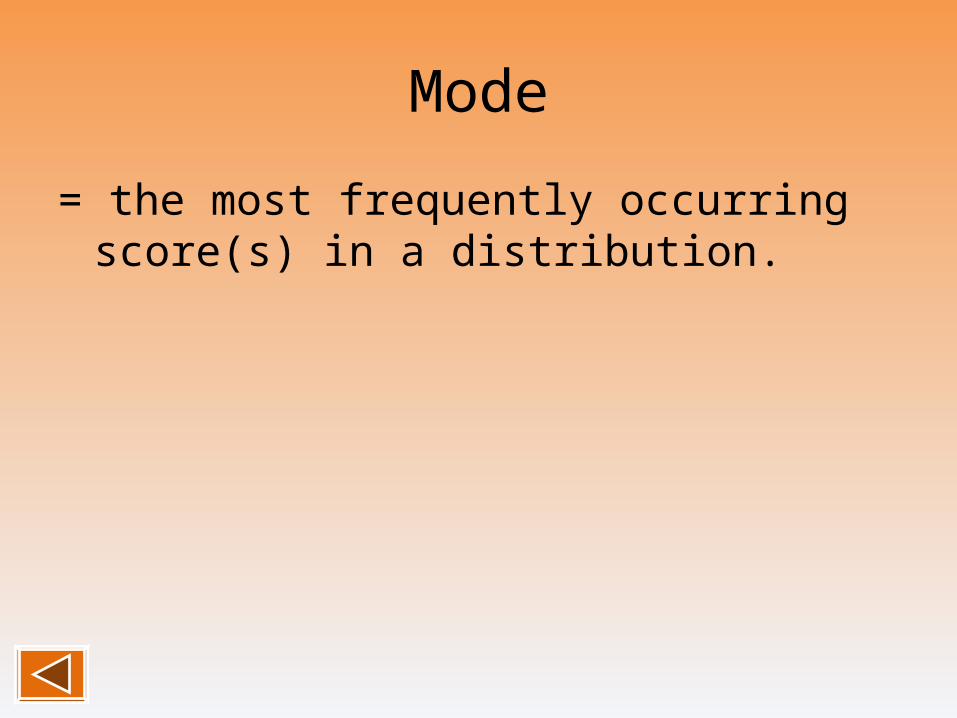
Mode
= the most frequently occurring score(s) in a distribution.
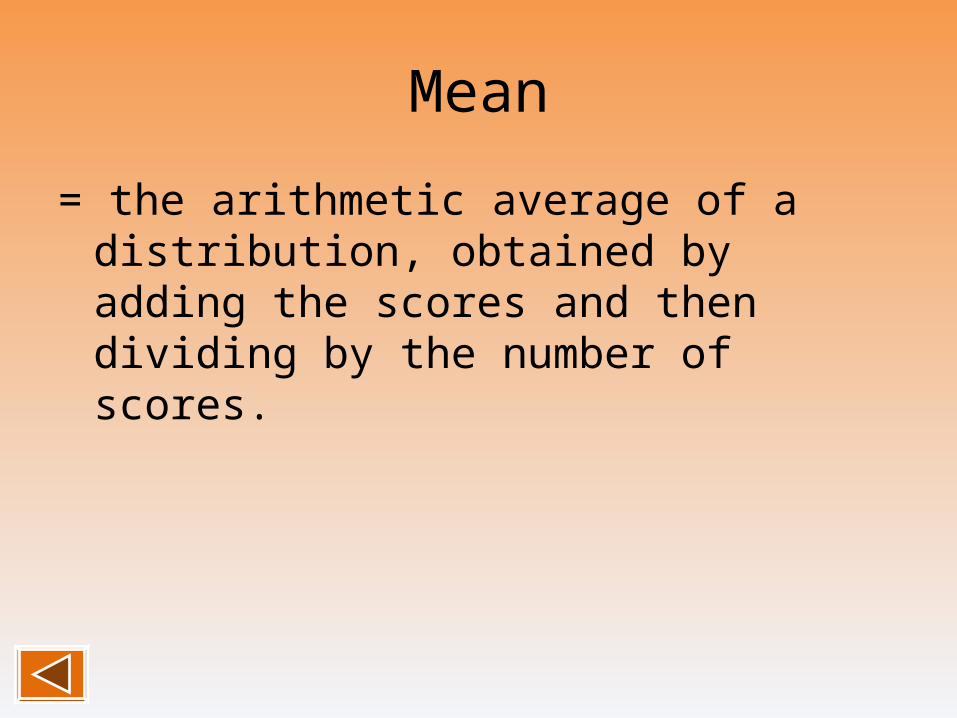
Mean
= the arithmetic average of a distribution, obtained by adding the scores and then dividing by the number of scores.
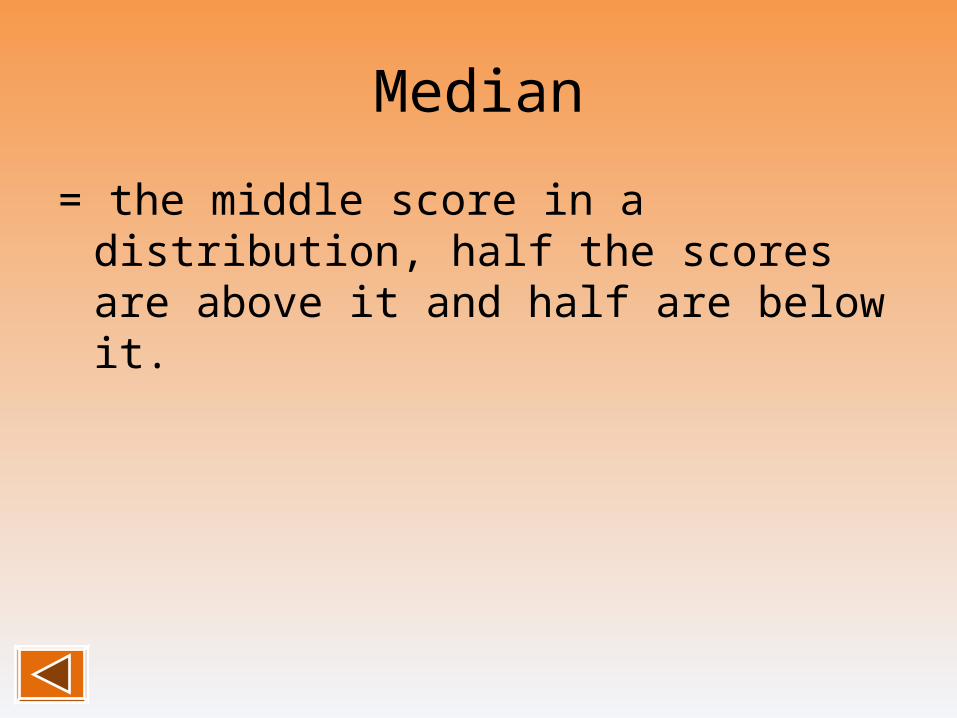
Median
= the middle score in a distribution, half the scores are above it and half are below it.
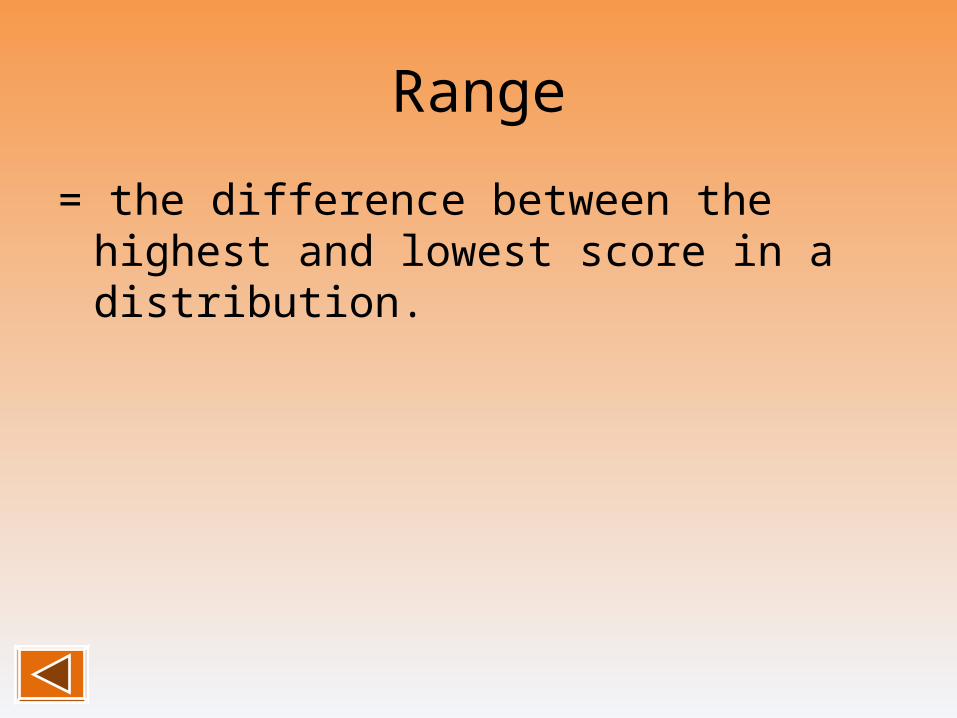
Range
= the difference between the highest and lowest score in a distribution.
Standard Deviation
= a computed measure of how much scores vary around the mean score.
Normal Curve
= a symmetrical, bell-shaped curve that describes the distribution of many types of data; most scored fall near the mean (68 percent fall within one standard deviation of it) and fewer and fewer near the extremes.
Statistical Significance
= a statistical statement of how likely it is that an obtained result occurred by chance.
Culture
= the enduring behavior, ideas, attitudes, and traditions shared by a group of people and transmitted from one generation to the next.
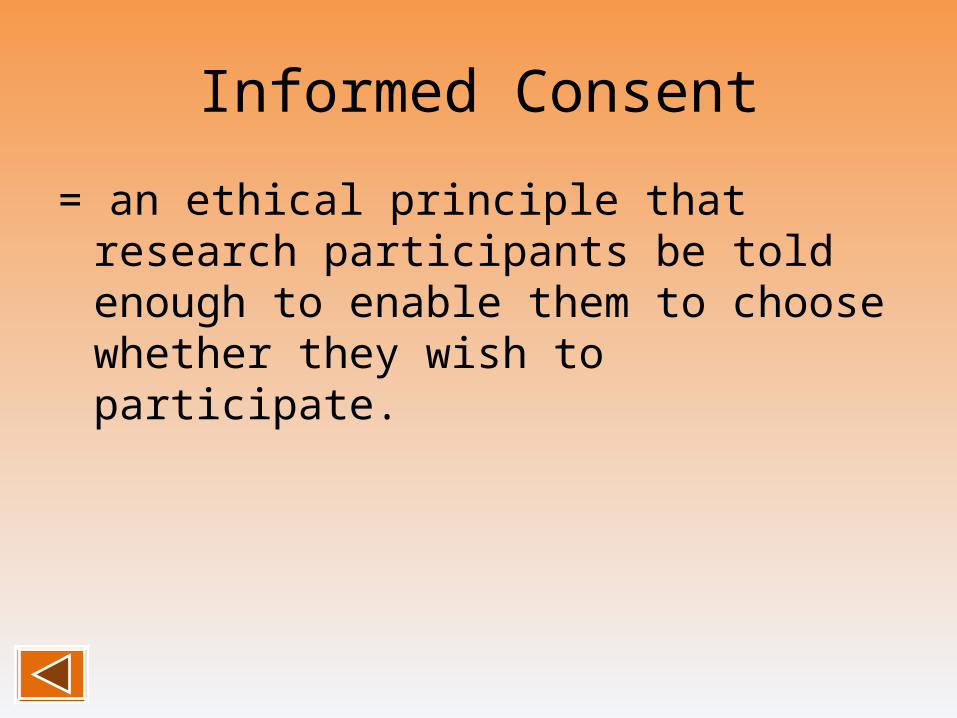
Informed Consent
= an ethical principle that research participants be told enough to enable them to choose whether they wish to participate.
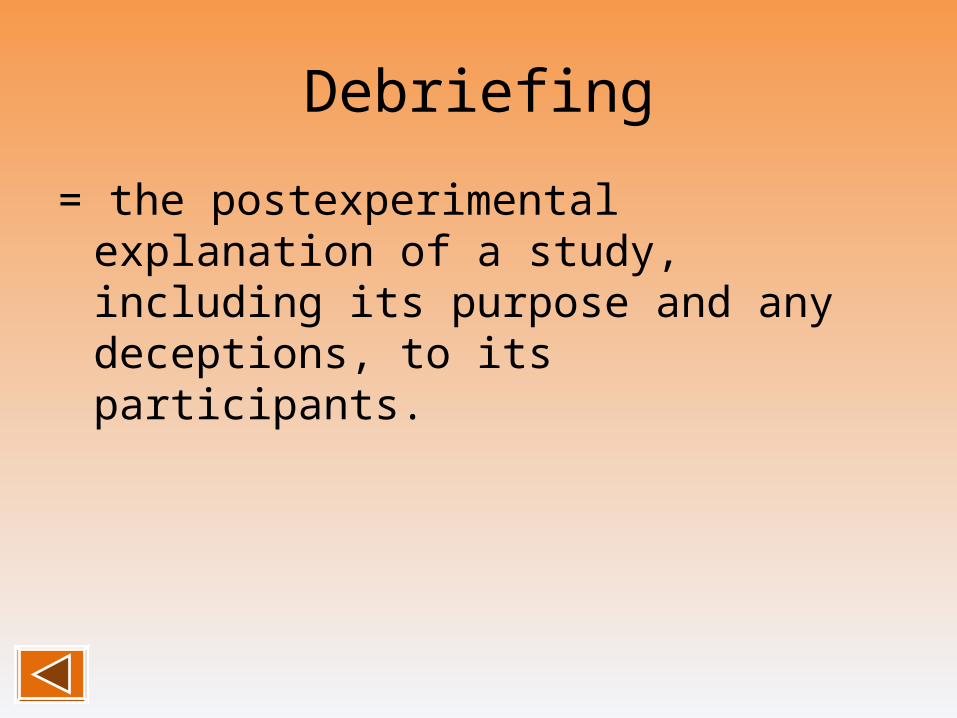
Debriefing
= the postexperimental explanation of a study, including its purpose and any deceptions, to its participants.