Embed Size (px)
Citation preview
MDM4U: Unit 2 – Organization of Data for Analysis 2008 1
Unit 2: Organization of Data for Analysis MDM4U
Lesson Outline
Big Picture
Students will:
demonstrate an understanding of the role of data in statistical studies;
describe the characteristics of a good sample and compare sampling techniques;
design an effective survey and collect data;
understand how data is organized;
find sources of data, refine topic of interest, and design a plan in preparation for the Culminating
Investigation.
Day Lesson Title Math Learning Goals Expectations
1 Brainstorming
Smart Ideas™ file:
Brainstorm Topics
Develop Reasoning and Proving processes by using prepared
data to:
recognize and describe the role of data in statistical studies;
describe examples of applications of statistical studies;
recognize that conclusions drawn from statistical studies of
the same relationship may disagree, and explain why.
C1.1, C1.2
CGE 4f
2 Distinguishing
Types of Data Use prepared data to distinguish different types of statistical
data that is: discrete from continuous; qualitative from
quantitative; categorical from numerical; nominal from
ordinal; primary from secondary; experimental from
observational; micro data from aggregate data.
C1.3
CGE 5e
3 Sampling Jigsaw Describe and compare sampling techniques, i.e., simple
random, systematic, stratified, convenience, voluntary.
Describe principles of primary data collection.
Demonstrate an understanding of the difference between
population and sample.
C2.2
CGE 5a
4 Data Validity Describe the characteristics of a good sample, i.e., bias free,
random, representative.
Distinguish between population and sample, and understand
why sampling is necessary.
Understand how using random samples with a bias or non-
random samples can affect the results of a study.
C2.1, C2.2, C2.3
CGE 5b
5 Surveys Describe the characteristics of an effective survey.
Collect data from primary sources, through experimentation,
organize data with one or more attributes.
C2.4, C2.5
CGE 5e
6 Census of School,
Collecting Data
(lesson not included)
Design questionnaires. C 2.4
7 Culminating
Investigation
Searching for data
(lesson not included)
Collect data from secondary sources, e.g., by using the
Internet to access reliable data from a well-organized
database such as e-stat; by using print sources such as
newspapers and magazines.
C2.5
MDM4U: Unit 2 – Organization of Data for Analysis 2008 2
Day Lesson Title Math Learning Goals Expectations
8 Demographics and
Beverage
Consumptions
(lesson not included)
Collect data from secondary sources, e.g., by using the Internet to
access reliable data from a well-organized database such as e-
stat; by using print sources such as newspapers and magazines.
C2.5
9 Project Day
(lesson not included)
Find sources of data in preparation for the Culminating
Investigation.
Refine topic of interest for Culminating Investigation.
Design a plan to investigate topic.
C2.5
E1.1, E1.2, E1.3
10–
11
Jazz/Summative
MDM4U: Unit 2 – Organization of Data for Analysis 2008 3
Unit 2: Day 1: Brainstorming MDM4U
75 min
Math Learning Goals Develop Reasoning and Proving processes by using prepared data to:
recognize and describe the role of data in statistical studies;
describe examples of applications of statistical studies;
recognize that conclusions drawn from statistical studies of the same relationship
may disagree, and explain why.
Materials BLM 2.1.1, 2.1.2
Internet access or
printed articles
Assessment Opportunities
Minds On… Small Groups Place Mat Introduce the purpose of the Culminating Investigation which takes place over
the next two units. Explain that the purpose is to pose a significant problem of
interest, and design and carryout a culminating investigation that requires the
tools of this course. Brainstorm and record ideas using place mats. Place mats
should have different central ideas such as: Health, Sports, Environment, Issues
Facing Teens, Social Issues, but not necessarily limited to these topics.
Small groups identify related topics or subcategories concerning the central
idea.
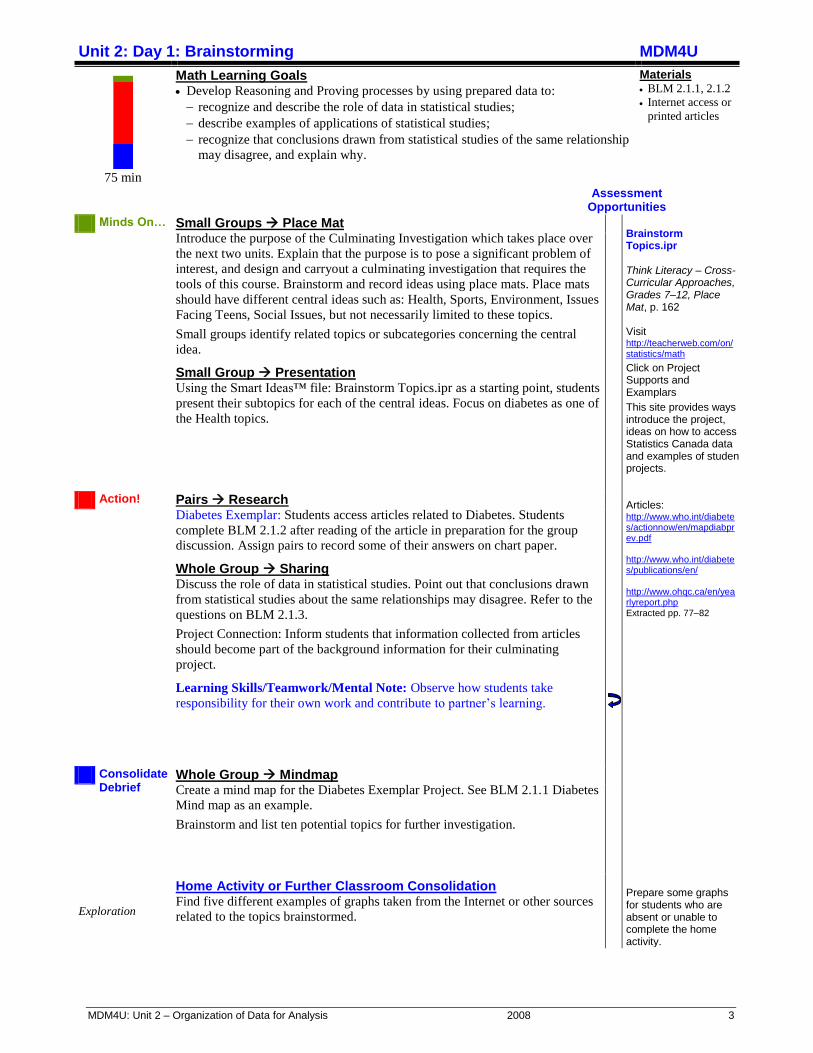
Small Group Presentation Using the Smart Ideas™ file: Brainstorm Topics.ipr as a starting point, students
present their subtopics for each of the central ideas. Focus on diabetes as one of
the Health topics.
Brainstorm Topics.ipr Think Literacy – Cross-Curricular Approaches, Grades 7–12, Place Mat, p. 162 Visit http://teacherweb.com/on/statistics/math
Click on Project Supports and Examplars
This site provides ways to introduce the project, ideas on how to access Statistics Canada data and examples of student projects. Articles: http://www.who.int/diabetes/actionnow/en/mapdiabprev.pdf http://www.who.int/diabetes/publications/en/ http://www.ohqc.ca/en/yearlyreport.php Extracted pp. 77–82
Action! Pairs Research Diabetes Exemplar: Students access articles related to Diabetes. Students
complete BLM 2.1.2 after reading of the article in preparation for the group
discussion. Assign pairs to record some of their answers on chart paper.
Whole Group Sharing Discuss the role of data in statistical studies. Point out that conclusions drawn
from statistical studies about the same relationships may disagree. Refer to the
questions on BLM 2.1.3.
Project Connection: Inform students that information collected from articles
should become part of the background information for their culminating
project.
Learning Skills/Teamwork/Mental Note: Observe how students take
responsibility for their own work and contribute to partner’s learning.
Consolidate Debrief
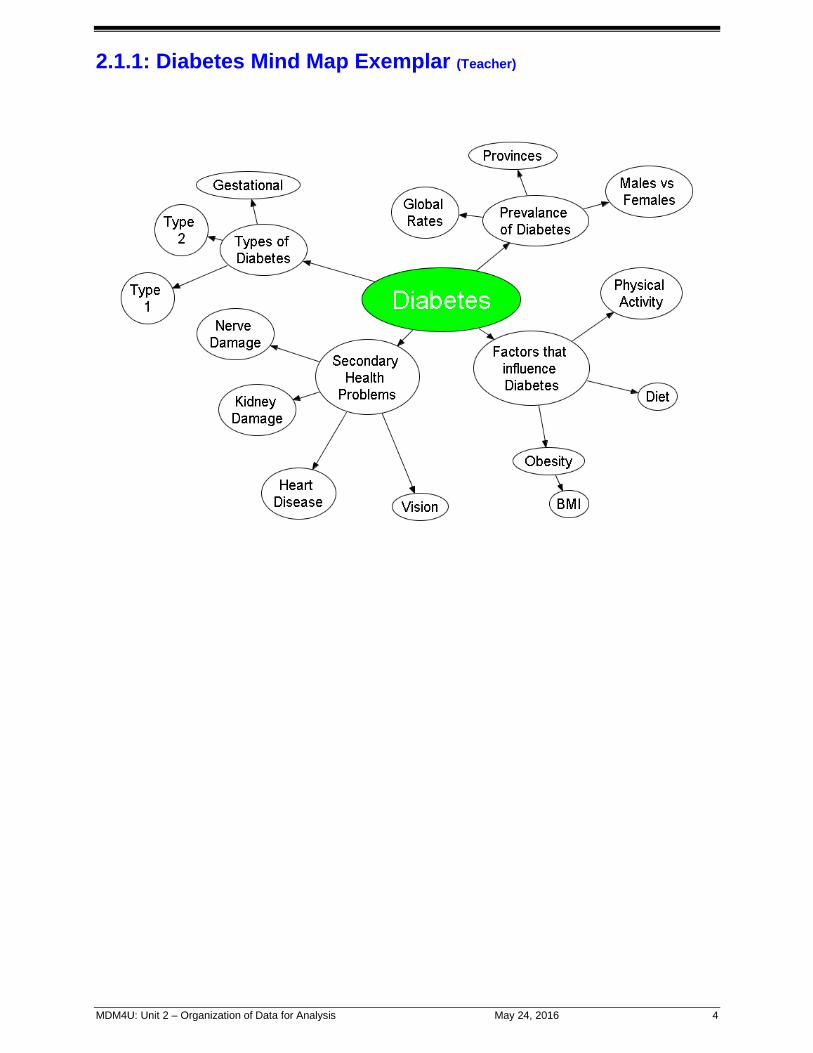
Whole Group Mindmap Create a mind map for the Diabetes Exemplar Project. See BLM 2.1.1 Diabetes
Mind map as an example.
Brainstorm and list ten potential topics for further investigation.
Exploration
Home Activity or Further Classroom Consolidation Find five different examples of graphs taken from the Internet or other sources
related to the topics brainstormed.
Prepare some graphs for students who are absent or unable to complete the home activity.
MDM4U: Unit 2 – Organization of Data for Analysis May 24, 2016 4
2.1.1: Diabetes Mind Map Exemplar (Teacher)
MDM4U: Unit 2 – Organization of Data for Analysis May 24, 2016 5
2.1.2: Searching for the Data in Diabetes For the article you were assigned, focus only on the information related to Diabetes. You may not be able to answer all of the following questions.
Guiding Questions
1. What is the title of the article and who is the author? Why is it important to know who wrote
the article? 2. If your article contains a graph or table related to diabetes, what does the graph or table tell
you? 3. How is the data in the article presented? (numbers, percentages, graphs, etc…) What are
the claims being made? 4. Does your article offer an opinion? If so, what is the stance the article has taken? 5. Does the article make any predictions? If so, what claims are being made? 6. Does the article give information regarding the source of the data? 7. Does the article give information on the reliability of the data? If so, how is it presented? 8. There are many factors that may influence the rate of diabetes, what factors are mentioned
in the article? Think of other factors that may be important to examine. 9. Do the conclusions in the articles agree with the statistics presented or disagree? Explain. 10. Is there any other important information presented in your article that you believe would be
required for a statistical study on diabetes?
MDM4U: Unit 2 – Organization of Data for Analysis May 24, 2016 6
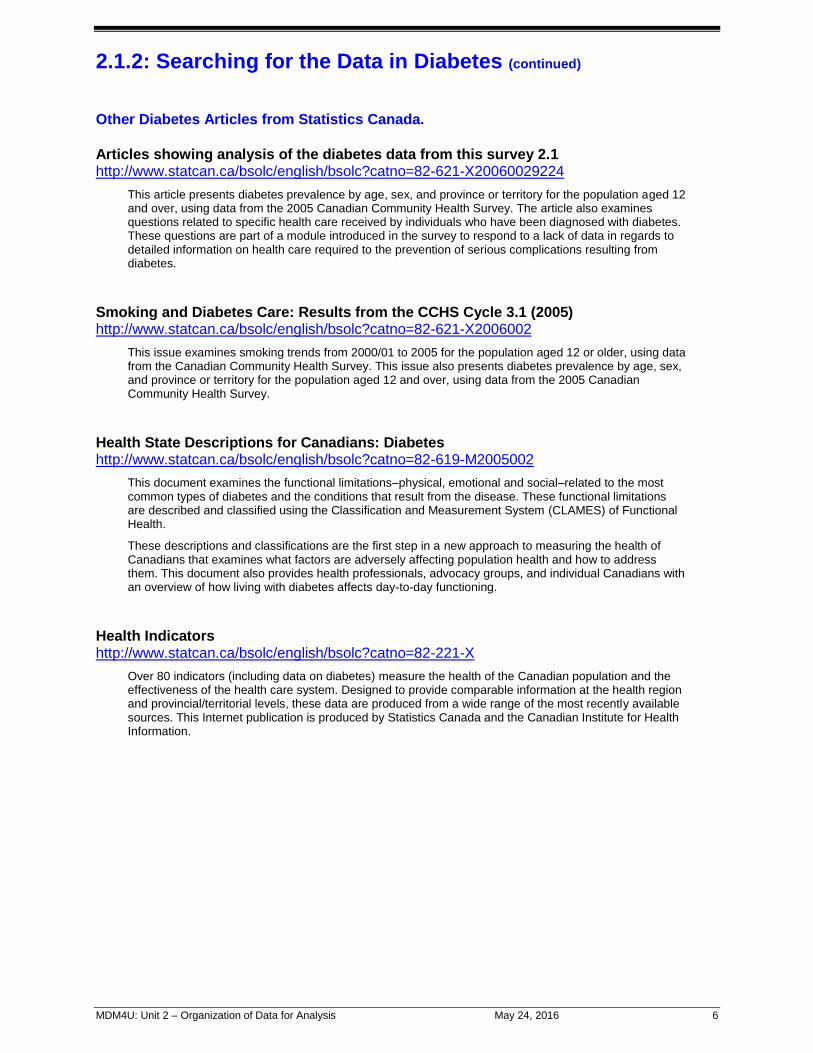
2.1.2: Searching for the Data in Diabetes (continued)
Other Diabetes Articles from Statistics Canada.
Articles showing analysis of the diabetes data from this survey 2.1 http://www.statcan.ca/bsolc/english/bsolc?catno=82-621-X20060029224
This article presents diabetes prevalence by age, sex, and province or territory for the population aged 12 and over, using data from the 2005 Canadian Community Health Survey. The article also examines questions related to specific health care received by individuals who have been diagnosed with diabetes. These questions are part of a module introduced in the survey to respond to a lack of data in regards to detailed information on health care required to the prevention of serious complications resulting from diabetes.
Smoking and Diabetes Care: Results from the CCHS Cycle 3.1 (2005) http://www.statcan.ca/bsolc/english/bsolc?catno=82-621-X2006002
This issue examines smoking trends from 2000/01 to 2005 for the population aged 12 or older, using data from the Canadian Community Health Survey. This issue also presents diabetes prevalence by age, sex, and province or territory for the population aged 12 and over, using data from the 2005 Canadian Community Health Survey.
Health State Descriptions for Canadians: Diabetes http://www.statcan.ca/bsolc/english/bsolc?catno=82-619-M2005002
This document examines the functional limitations–physical, emotional and social–related to the most common types of diabetes and the conditions that result from the disease. These functional limitations are described and classified using the Classification and Measurement System (CLAMES) of Functional Health.
These descriptions and classifications are the first step in a new approach to measuring the health of Canadians that examines what factors are adversely affecting population health and how to address them. This document also provides health professionals, advocacy groups, and individual Canadians with an overview of how living with diabetes affects day-to-day functioning.
Health Indicators http://www.statcan.ca/bsolc/english/bsolc?catno=82-221-X
Over 80 indicators (including data on diabetes) measure the health of the Canadian population and the effectiveness of the health care system. Designed to provide comparable information at the health region and provincial/territorial levels, these data are produced from a wide range of the most recently available sources. This Internet publication is produced by Statistics Canada and the Canadian Institute for Health Information.
MDM4U: Unit 2 – Organization of Data for Analysis 2008 7
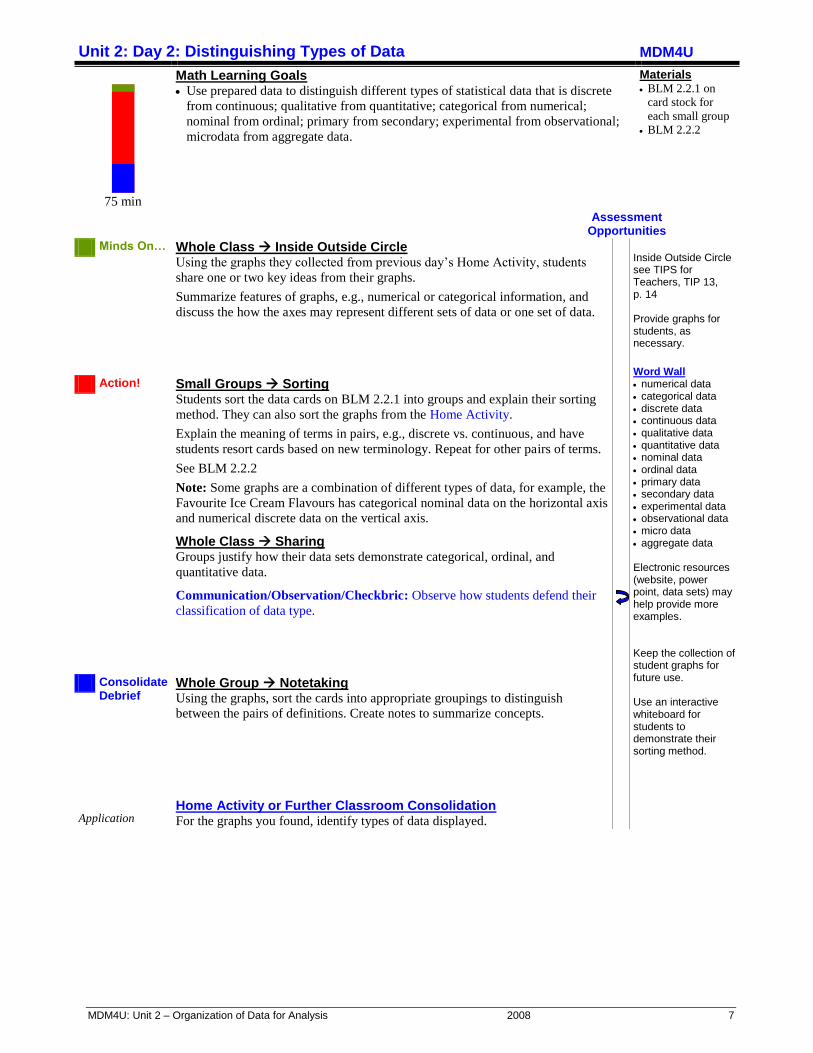
Unit 2: Day 2: Distinguishing Types of Data MDM4U
75 min
Math Learning Goals Use prepared data to distinguish different types of statistical data that is discrete
from continuous; qualitative from quantitative; categorical from numerical;
nominal from ordinal; primary from secondary; experimental from observational;
microdata from aggregate data.
Materials BLM 2.2.1 on
card stock for
each small group
BLM 2.2.2
Assessment Opportunities
Minds On… Whole Class Inside Outside Circle Using the graphs they collected from previous day’s Home Activity, students
share one or two key ideas from their graphs.
Summarize features of graphs, e.g., numerical or categorical information, and
discuss the how the axes may represent different sets of data or one set of data.
Inside Outside Circle see TIPS for Teachers, TIP 13, p. 14 Provide graphs for students, as necessary.
Word Wall numerical data categorical data discrete data continuous data qualitative data quantitative data nominal data ordinal data primary data secondary data experimental data observational data micro data aggregate data Electronic resources (website, power point, data sets) may help provide more examples. Keep the collection of student graphs for future use. Use an interactive whiteboard for students to demonstrate their sorting method.
Action! Small Groups Sorting Students sort the data cards on BLM 2.2.1 into groups and explain their sorting
method. They can also sort the graphs from the Home Activity.
Explain the meaning of terms in pairs, e.g., discrete vs. continuous, and have
students resort cards based on new terminology. Repeat for other pairs of terms.
See BLM 2.2.2
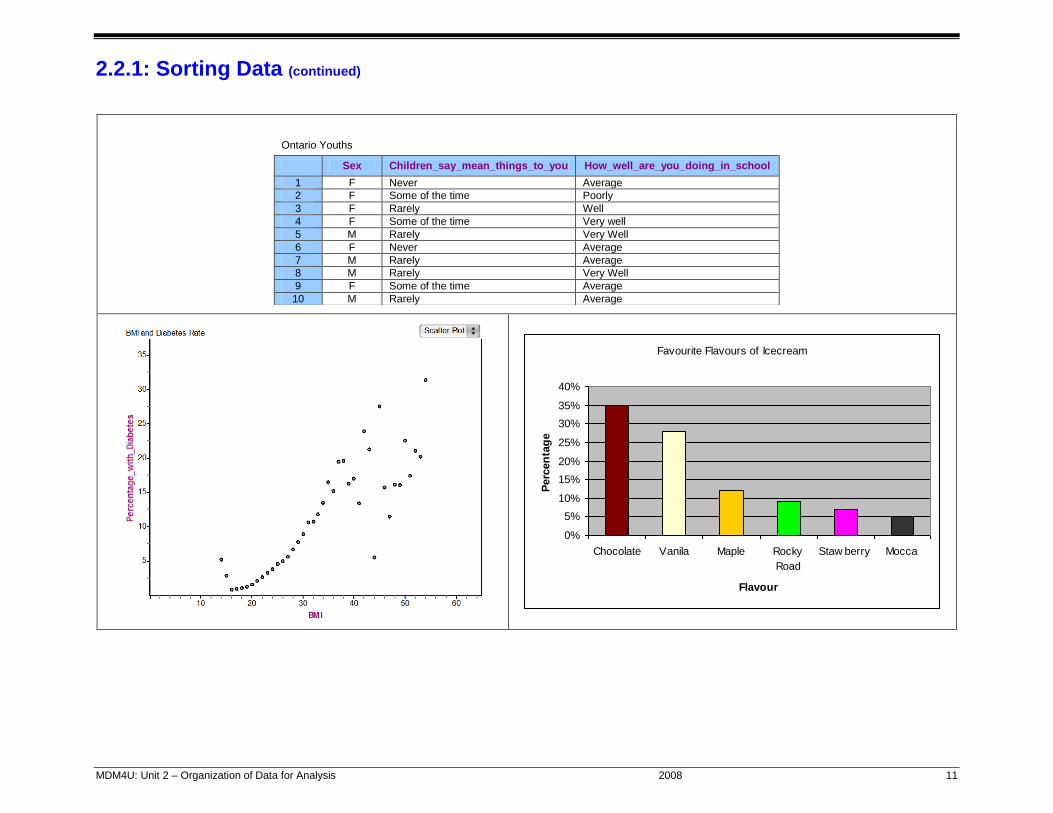
Note: Some graphs are a combination of different types of data, for example, the
Favourite Ice Cream Flavours has categorical nominal data on the horizontal axis
and numerical discrete data on the vertical axis.
Whole Class Sharing Groups justify how their data sets demonstrate categorical, ordinal, and
quantitative data.
Communication/Observation/Checkbric: Observe how students defend their
classification of data type.
Consolidate Debrief
Whole Group Notetaking Using the graphs, sort the cards into appropriate groupings to distinguish
between the pairs of definitions. Create notes to summarize concepts.
Application Home Activity or Further Classroom Consolidation For the graphs you found, identify types of data displayed.
MDM4U: Unit 2 – Organization of Data for Analysis 2008 8
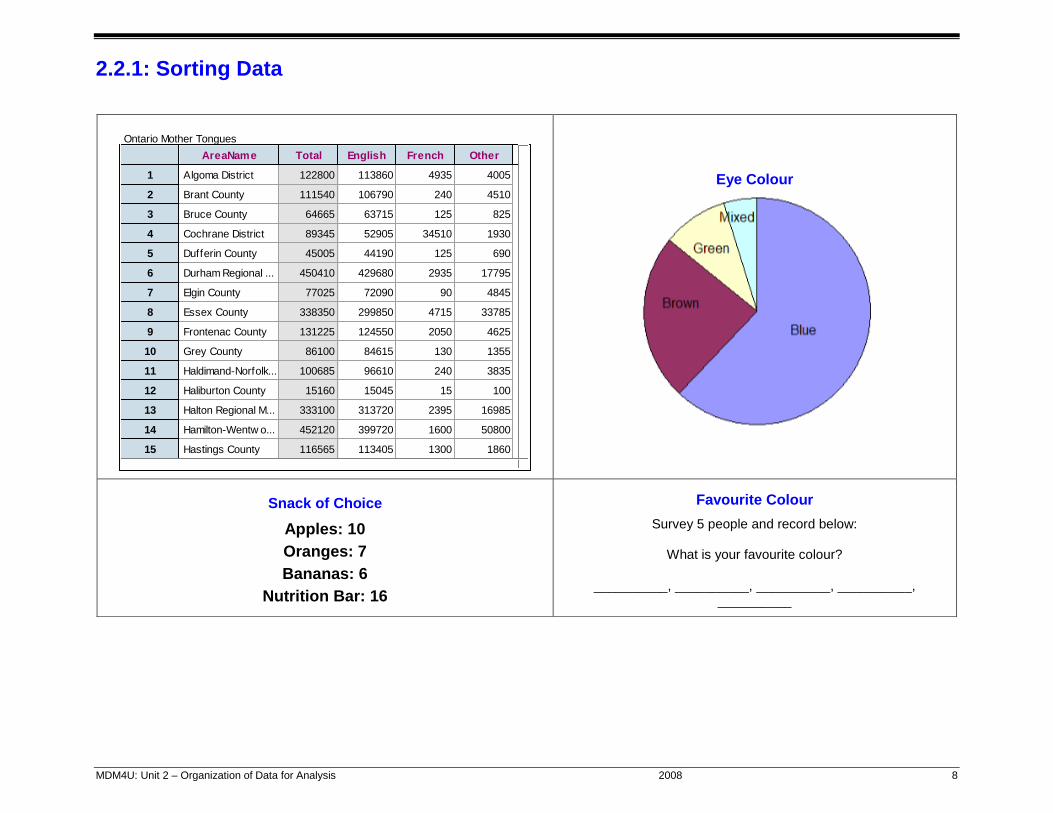
2.2.1: Sorting Data
Ontario Mother Tongues
AreaName Total English French Other <new>
1
2
3
4
5
6
7
8
9
10
11
12
13
14
15
16
Algoma District 122800 113860 4935 4005
Brant County 111540 106790 240 4510
Bruce County 64665 63715 125 825
Cochrane District 89345 52905 34510 1930
Dufferin County 45005 44190 125 690
Durham Regional ... 450410 429680 2935 17795
Elgin County 77025 72090 90 4845
Essex County 338350 299850 4715 33785
Frontenac County 131225 124550 2050 4625
Grey County 86100 84615 130 1355
Haldimand-Norfolk... 100685 96610 240 3835
Haliburton County 15160 15045 15 100
Halton Regional M... 333100 313720 2395 16985
Hamilton-Wentw o... 452120 399720 1600 50800
Hastings County 116565 113405 1300 1860
Huron County 59140 57605 65 1470
Eye Colour
Snack of Choice
Apples: 10
Oranges: 7
Bananas: 6
Nutrition Bar: 16
Favourite Colour
Survey 5 people and record below:
What is your favourite colour?
__________, __________, __________, __________, __________
MDM4U: Unit 2 – Organization of Data for Analysis 2008 9
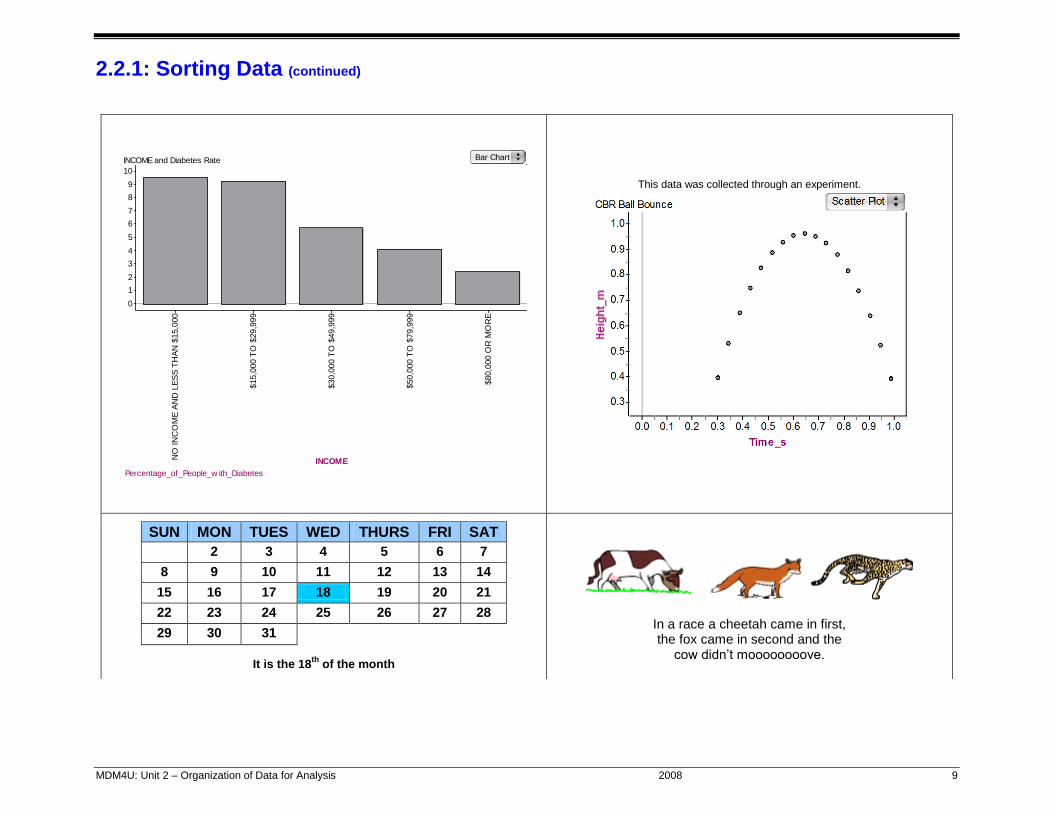
2.2.1: Sorting Data (continued)
Percentage_of_People_w ith_Diabetes
0
1
2
3
4
5
6
7
8
9
10
INCOMENO
IN
CO
ME
AN
D L
ES
S T
HA
N $
15,0
00
$15,0
00 T
O $
29,9
99
$30,0
00 T
O $
49,9
99
$50,0
00 T
O $
79,9
99
$80,0
00 O
R M
OR
E
INCOME and Diabetes Rate Bar Chart
This data was collected through an experiment.
SUN MON TUES WED THURS FRI SAT
2 3 4 5 6 7
8 9 10 11 12 13 14
15 16 17 18 19 20 21
22 23 24 25 26 27 28
29 30 31
It is the 18th
of the month
In a race a cheetah came in first, the fox came in second and the
cow didn’t moooooooove.
MDM4U: Unit 2 – Organization of Data for Analysis 2008 10
2.2.1: Sorting Data (continued)
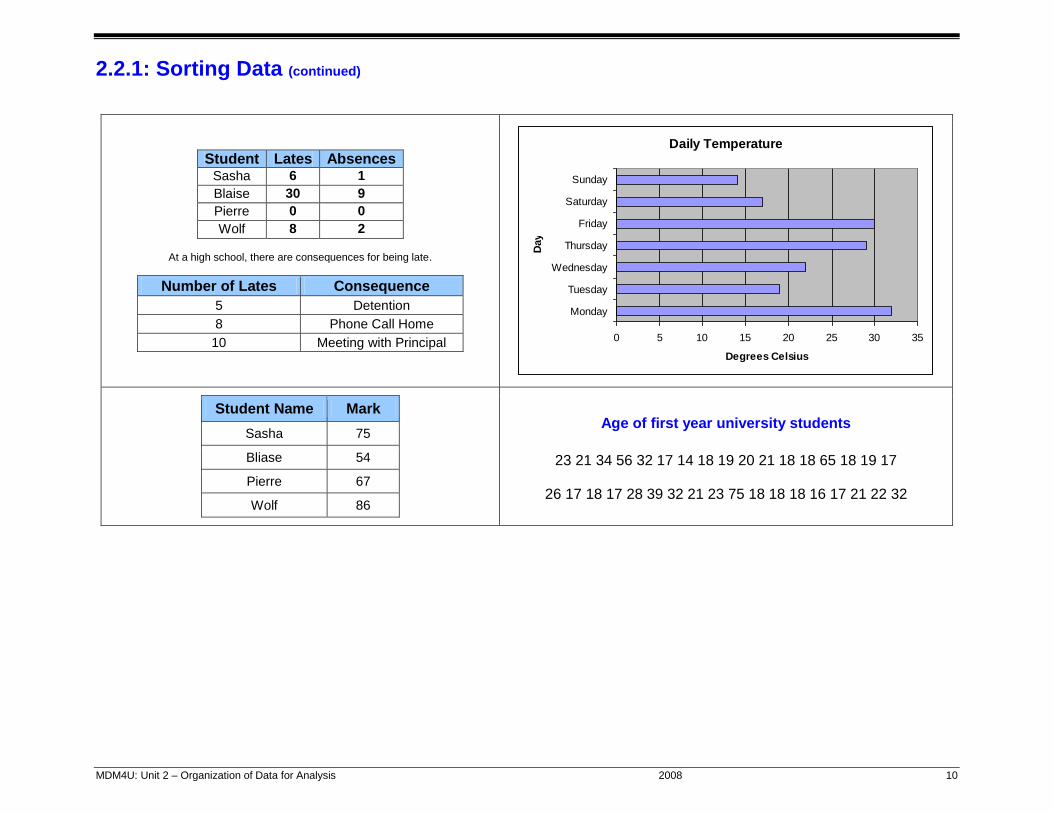
Student Lates Absences Sasha 6 1
Blaise 30 9
Pierre 0 0
Wolf 8 2
At a high school, there are consequences for being late.
Number of Lates Consequence
5 Detention
8 Phone Call Home
10 Meeting with Principal
Daily Temperature
0 5 10 15 20 25 30 35
Monday
Tuesday
Wednesday
Thursday
Friday
Saturday
Sunday
Day
Degrees Celsius
Student Name Mark
Sasha 75
Bliase 54
Pierre 67
Wolf 86
Age of first year university students
23 21 34 56 32 17 14 18 19 20 21 18 18 65 18 19 17
26 17 18 17 28 39 32 21 23 75 18 18 18 16 17 21 22 32
MDM4U: Unit 2 – Organization of Data for Analysis 2008 11
2.2.1: Sorting Data (continued)
Ontario Youths
Sex Children_say_mean_things_to_you How_well_are_you_doing_in_school
1 F Never Average
2 F Some of the time Poorly
3 F Rarely Well
4 F Some of the time Very well
5 M Rarely Very Well
6 F Never Average
7 M Rarely Average
8 M Rarely Very Well
9 F Some of the time Average
10 M Rarely Average
Favourite Flavours of Icecream
0%
5%
10%
15%
20%
25%
30%
35%
40%
Chocolate Vanila Maple Rocky
Road
Staw berry Mocca
Flavour
Perc
en
tag
e
MDM4U: Unit 2 – Organization of Data for Analysis 2008May 24, 2016 12
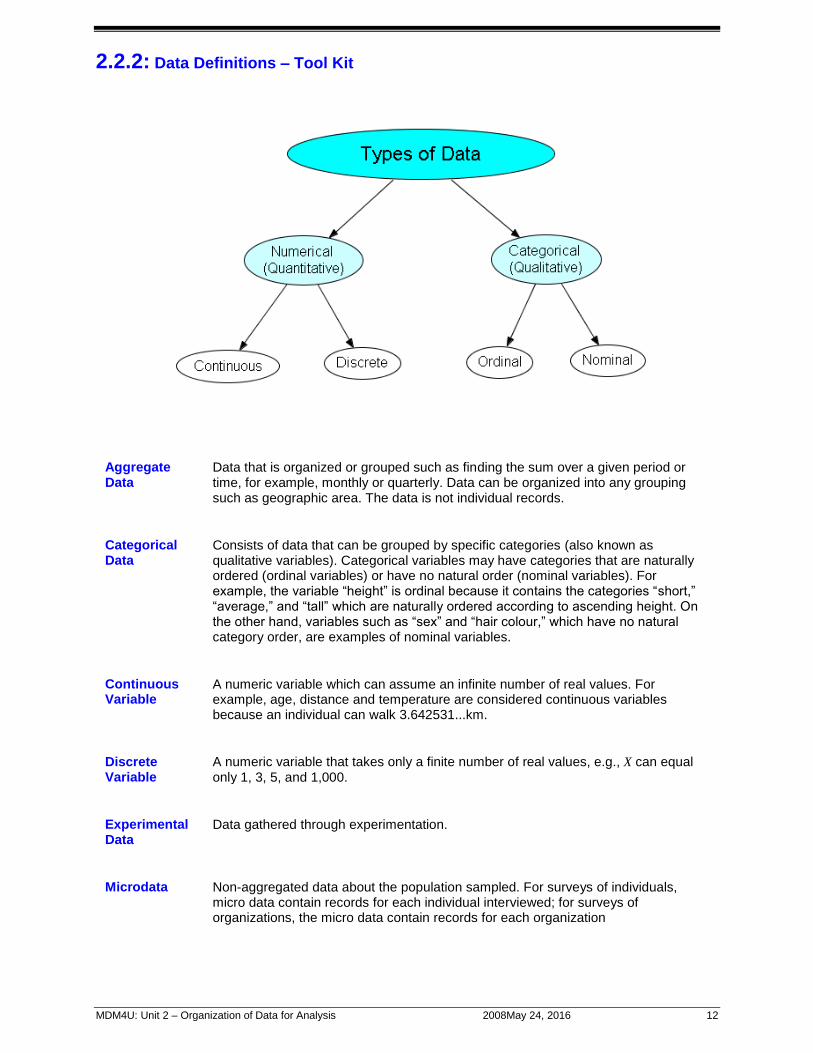
2.2.2: Data Definitions – Tool Kit
Aggregate Data
Data that is organized or grouped such as finding the sum over a given period or time, for example, monthly or quarterly. Data can be organized into any grouping such as geographic area. The data is not individual records.
Categorical Data
Consists of data that can be grouped by specific categories (also known as qualitative variables). Categorical variables may have categories that are naturally ordered (ordinal variables) or have no natural order (nominal variables). For example, the variable “height” is ordinal because it contains the categories “short,” “average,” and “tall” which are naturally ordered according to ascending height. On the other hand, variables such as “sex” and “hair colour,” which have no natural category order, are examples of nominal variables.
Continuous Variable
A numeric variable which can assume an infinite number of real values. For example, age, distance and temperature are considered continuous variables because an individual can walk 3.642531...km.
Discrete Variable
A numeric variable that takes only a finite number of real values, e.g., X can equal only 1, 3, 5, and 1,000.
Experimental Data
Data gathered through experimentation.
Microdata Non-aggregated data about the population sampled. For surveys of individuals, micro data contain records for each individual interviewed; for surveys of organizations, the micro data contain records for each organization
MDM4U: Unit 2 – Organization of Data for Analysis 2008May 24, 2016 13
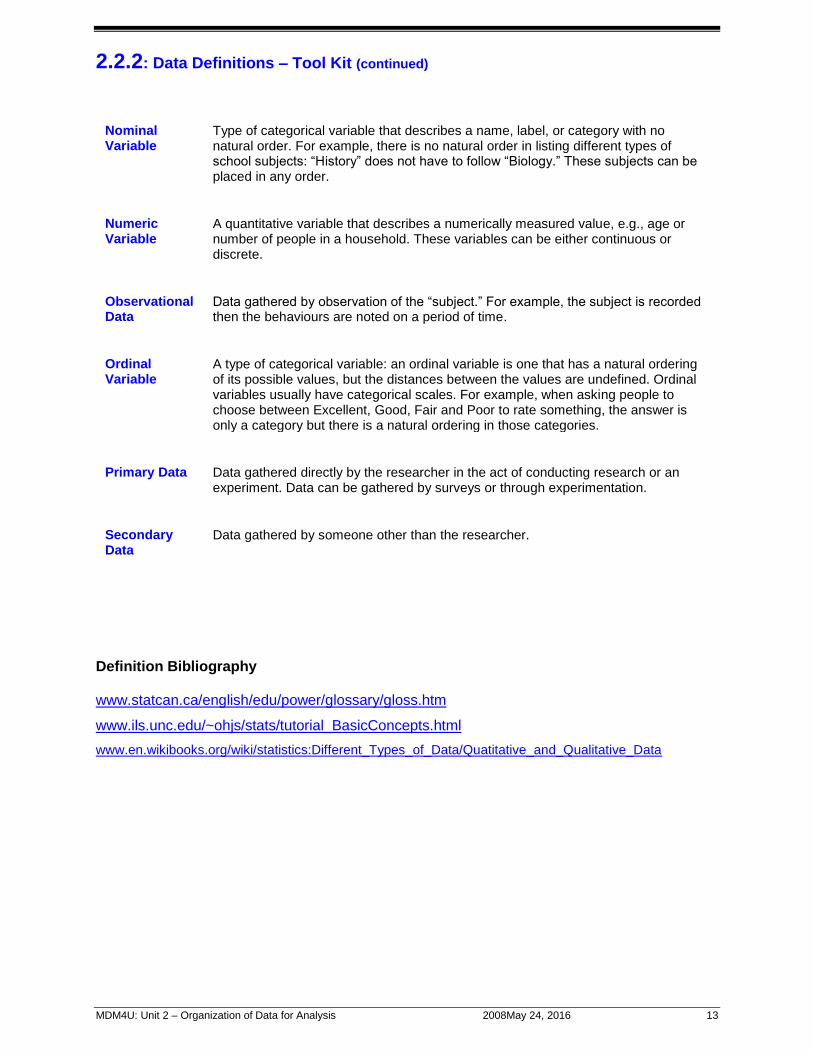
2.2.2: Data Definitions – Tool Kit (continued)
Nominal Variable
Type of categorical variable that describes a name, label, or category with no natural order. For example, there is no natural order in listing different types of school subjects: “History” does not have to follow “Biology.” These subjects can be placed in any order.
Numeric Variable
A quantitative variable that describes a numerically measured value, e.g., age or number of people in a household. These variables can be either continuous or discrete.
Observational Data
Data gathered by observation of the “subject.” For example, the subject is recorded then the behaviours are noted on a period of time.
Ordinal Variable
A type of categorical variable: an ordinal variable is one that has a natural ordering of its possible values, but the distances between the values are undefined. Ordinal variables usually have categorical scales. For example, when asking people to choose between Excellent, Good, Fair and Poor to rate something, the answer is only a category but there is a natural ordering in those categories.
Primary Data Data gathered directly by the researcher in the act of conducting research or an experiment. Data can be gathered by surveys or through experimentation.
Secondary Data
Data gathered by someone other than the researcher.
Definition Bibliography www.statcan.ca/english/edu/power/glossary/gloss.htm
www.ils.unc.edu/~ohjs/stats/tutorial_BasicConcepts.html
www.en.wikibooks.org/wiki/statistics:Different_Types_of_Data/Quatitative_and_Qualitative_Data
MDM4U: Unit 2 – Organization of Data for Analysis 2008 14
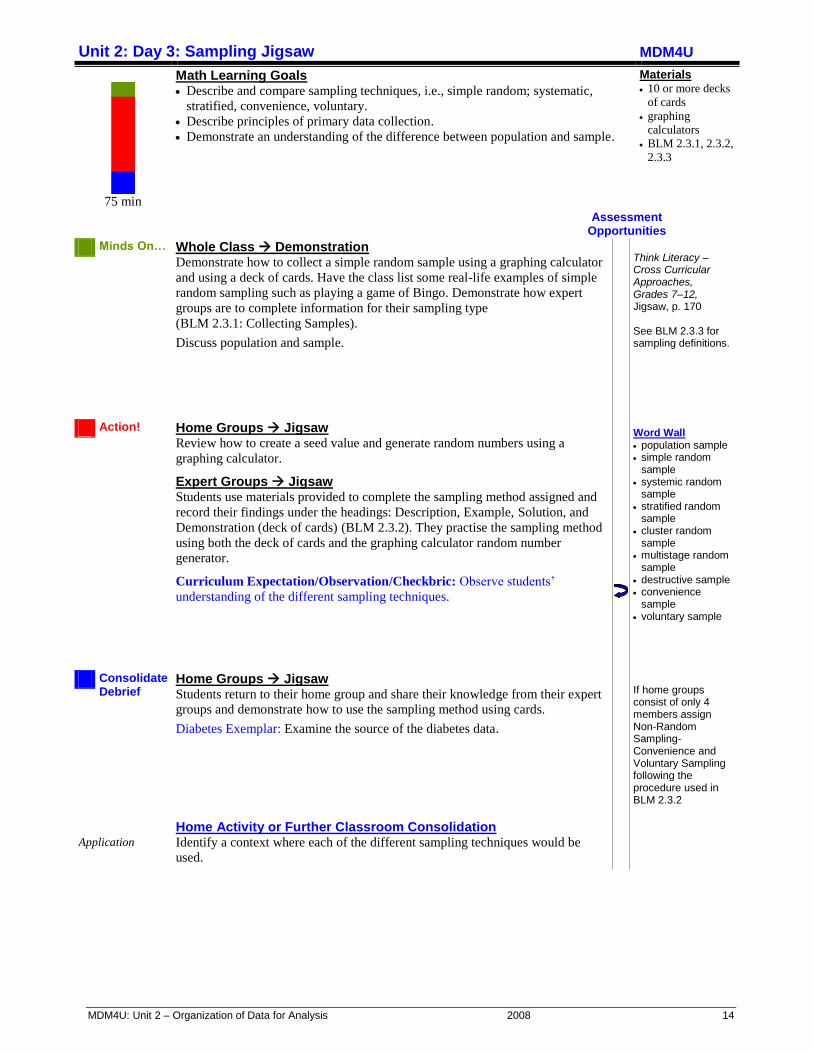
Unit 2: Day 3: Sampling Jigsaw MDM4U
75 min
Math Learning Goals Describe and compare sampling techniques, i.e., simple random; systematic,
stratified, convenience, voluntary.
Describe principles of primary data collection.
Demonstrate an understanding of the difference between population and sample.
Materials 10 or more decks
of cards
graphing
calculators
BLM 2.3.1, 2.3.2,
2.3.3
Assessment Opportunities
Minds On… Whole Class Demonstration Demonstrate how to collect a simple random sample using a graphing calculator
and using a deck of cards. Have the class list some real-life examples of simple
random sampling such as playing a game of Bingo. Demonstrate how expert
groups are to complete information for their sampling type
(BLM 2.3.1: Collecting Samples).
Discuss population and sample.
Think Literacy –Cross Curricular Approaches, Grades 7–12, Jigsaw, p. 170 See BLM 2.3.3 for sampling definitions.
Word Wall population sample simple random
sample systemic random
sample stratified random
sample cluster random
sample multistage random
sample destructive sample convenience
sample voluntary sample If home groups consist of only 4 members assign Non-Random Sampling-Convenience and Voluntary Sampling following the procedure used in BLM 2.3.2
Action! Home Groups Jigsaw Review how to create a seed value and generate random numbers using a
graphing calculator.
Expert Groups Jigsaw Students use materials provided to complete the sampling method assigned and
record their findings under the headings: Description, Example, Solution, and
Demonstration (deck of cards) (BLM 2.3.2). They practise the sampling method
using both the deck of cards and the graphing calculator random number
generator.
Curriculum Expectation/Observation/Checkbric: Observe students’
understanding of the different sampling techniques.
Consolidate Debrief
Home Groups Jigsaw Students return to their home group and share their knowledge from their expert
groups and demonstrate how to use the sampling method using cards.
Diabetes Exemplar: Examine the source of the diabetes data.
Application
Home Activity or Further Classroom Consolidation Identify a context where each of the different sampling techniques would be
used.
MDM4U: Unit 2 – Organization of Data for Analysis 2008 15
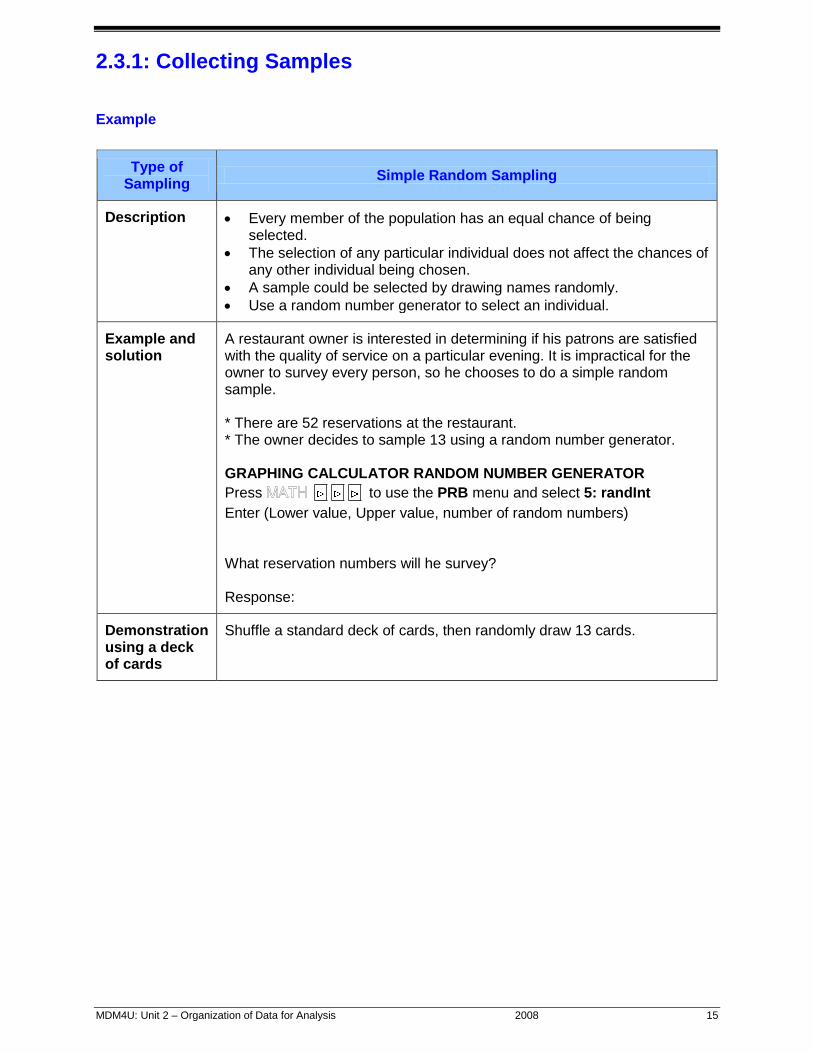
2.3.1: Collecting Samples
Example
Type of Sampling
Simple Random Sampling
Description Every member of the population has an equal chance of being selected.
The selection of any particular individual does not affect the chances of any other individual being chosen.
A sample could be selected by drawing names randomly.
Use a random number generator to select an individual.
Example and solution
A restaurant owner is interested in determining if his patrons are satisfied with the quality of service on a particular evening. It is impractical for the owner to survey every person, so he chooses to do a simple random sample. * There are 52 reservations at the restaurant. * The owner decides to sample 13 using a random number generator. GRAPHING CALCULATOR RANDOM NUMBER GENERATOR
Press to use the PRB menu and select 5: randInt
Enter (Lower value, Upper value, number of random numbers) What reservation numbers will he survey? Response:
Demonstration using a deck of cards
Shuffle a standard deck of cards, then randomly draw 13 cards.
MDM4U: Unit 2 – Organization of Data for Analysis 2008 16
2.3.1: Collecting Samples (continued)
Type of Sampling
Description
Example and solution
Demonstration using a deck of cards
MDM4U: Unit 2 – Organization of Data for Analysis 2008 17
2.3.2: Collecting Samples Jigsaw Instructions
To choose HOME groups:
Use a deck of cards with appropriate sets of 4 cards to create groups of 4. (To make groups of 5 use jokers; students with jokers can choose to join any group of 4). For example, all the Aces belong to the same home group.
HOME Group
Each home group will have up to 5 members who become “experts” on a specific type of sampling method. Your card type is used to assign which expert group you belong to. After the expert groups meet to understand and explain how their sampling method works, experts return to home groups to present their findings to other members. Each member of the home group is responsible for creating their own note on each of the sampling methods described.
To choose EXPERT groups:
♥ Systematic Random Sampling ♦ Stratified Random Sampling ♣ Cluster Random Sampling ♠ Multi-stage Random Sampling ☺ Non-Random Sampling – Convenience and Voluntary Sampling (Jokers, if used)
EXPERT Groups
Expert groups meet together to learn about one method of sampling. Use textbooks or any other available resources. Each expert is responsible to report the following to their home group:
Type of Sampling
Description of Sampling Method
An example of how this sampling method is used in practical terms
Demonstration of your method of sampling using a deck of cards Note: If Home groups consist of only 4 members assign Non-Random Sampling – Convenience and Voluntary Sampling for Home Activity.
MDM4U: Unit 2 – Organization of Data for Analysis 2008 18
2.3.3: Definitions Simple Random Sampling The sample is chosen from the entire population, using a random number generator. Each member of the population has an equal chance of being selected. The selection of any particular individual does not affect the chances of any other individual being chosen. Systematic Random Sampling A random starting point is chosen, using a random number generator. The sample is chosen by going through the population sequentially; the members of the sample are selected at regular intervals, e.g., every fifth person is selected. Stratified Random Sampling The population is divided into groups that share a common characteristic. From each group a simple random sample of the members is taken. The size of each sample from each group is proportional to the size of each group. Cluster Random Sampling The population is divided into groups. A random sample of groups is chosen. All members from the chosen group are surveyed. Multi-stage Random Sampling The population is organized into groups. A random sample of groups is chosen. From each group a random sample is chosen. This method uses several levels of random sampling. Destructive Sampling A random sample is taken; each sample is destroyed during the process of testing, e.g., testing life of light bulbs. Voluntary Sampling The researcher invites members of the population to participate in the survey on a voluntary basis. Convenience Sampling The researcher selects members of the population that are easily accessible.
MDM4U: Unit 2 – Organization of Data for Analysis 2008 19
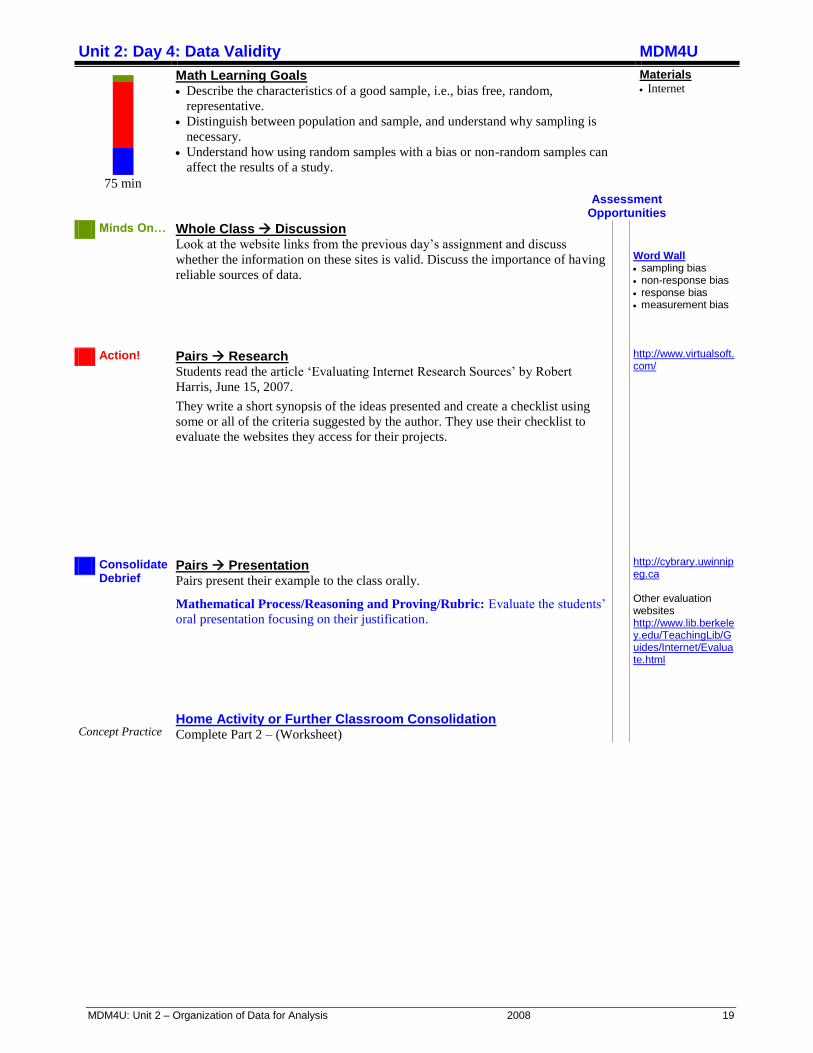
Unit 2: Day 4: Data Validity MDM4U
75 min
Math Learning Goals Describe the characteristics of a good sample, i.e., bias free, random,
representative.
Distinguish between population and sample, and understand why sampling is
necessary.
Understand how using random samples with a bias or non-random samples can
affect the results of a study.
Materials Internet
Assessment Opportunities
Minds On… Whole Class Discussion Look at the website links from the previous day’s assignment and discuss
whether the information on these sites is valid. Discuss the importance of having
reliable sources of data.
Word Wall sampling bias non-response bias response bias measurement bias http://www.virtualsoft.com/ http://cybrary.uwinnipeg.ca Other evaluation websites http://www.lib.berkeley.edu/TeachingLib/Guides/Internet/Evaluate.html
Action! Pairs Research Students read the article ‘Evaluating Internet Research Sources’ by Robert
Harris, June 15, 2007.
They write a short synopsis of the ideas presented and create a checklist using
some or all of the criteria suggested by the author. They use their checklist to
evaluate the websites they access for their projects.
Consolidate Debrief
Pairs Presentation Pairs present their example to the class orally.
Mathematical Process/Reasoning and Proving/Rubric: Evaluate the students’
oral presentation focusing on their justification.
Concept Practice Home Activity or Further Classroom Consolidation Complete Part 2 – (Worksheet)
MDM4U: Unit 2 – Organization of Data for Analysis 2008 20
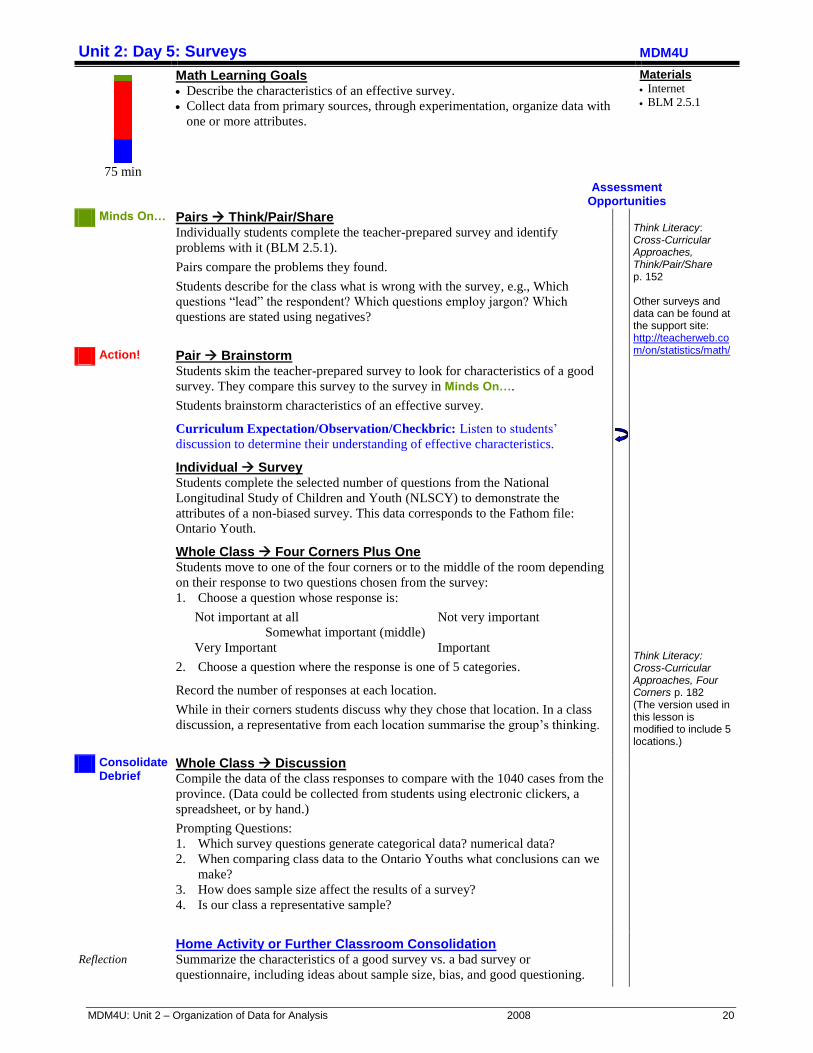
Unit 2: Day 5: Surveys MDM4U
75 min
Math Learning Goals Describe the characteristics of an effective survey.
Collect data from primary sources, through experimentation, organize data with
one or more attributes.
Materials Internet
BLM 2.5.1
Assessment Opportunities
Minds On… Pairs Think/Pair/Share Individually students complete the teacher-prepared survey and identify
problems with it (BLM 2.5.1).
Pairs compare the problems they found.
Students describe for the class what is wrong with the survey, e.g., Which
questions “lead” the respondent? Which questions employ jargon? Which
questions are stated using negatives?
Think Literacy: Cross-Curricular Approaches, Think/Pair/Share p. 152 Other surveys and data can be found at the support site: http://teacherweb.com/on/statistics/math/
Think Literacy: Cross-Curricular Approaches, Four Corners p. 182 (The version used in this lesson is modified to include 5 locations.)
Action! Pair Brainstorm Students skim the teacher-prepared survey to look for characteristics of a good
survey. They compare this survey to the survey in Minds On….
Students brainstorm characteristics of an effective survey.
Curriculum Expectation/Observation/Checkbric: Listen to students’
discussion to determine their understanding of effective characteristics.
Individual Survey Students complete the selected number of questions from the National
Longitudinal Study of Children and Youth (NLSCY) to demonstrate the
attributes of a non-biased survey. This data corresponds to the Fathom file:
Ontario Youth.
Whole Class Four Corners Plus One Students move to one of the four corners or to the middle of the room depending
on their response to two questions chosen from the survey:
1. Choose a question whose response is:
Not important at all
Somewhat important (middle)
Very Important
Not very important
Important
2. Choose a question where the response is one of 5 categories.
Record the number of responses at each location.
While in their corners students discuss why they chose that location. In a class
discussion, a representative from each location summarise the group’s thinking.
Consolidate Debrief
Whole Class Discussion Compile the data of the class responses to compare with the 1040 cases from the
province. (Data could be collected from students using electronic clickers, a
spreadsheet, or by hand.)
Prompting Questions:
1. Which survey questions generate categorical data? numerical data?
2. When comparing class data to the Ontario Youths what conclusions can we
make?
3. How does sample size affect the results of a survey?
4. Is our class a representative sample?
Reflection
Home Activity or Further Classroom Consolidation Summarize the characteristics of a good survey vs. a bad survey or
questionnaire, including ideas about sample size, bias, and good questioning.
MDM4U: Unit 2 – Organization of Data for Analysis 2008 21
2.5.1: Creating an Unacceptable Sample Survey (Teacher) Create a survey that breaks all the following rules:
uses jargon
uses abbreviations
uses negatives, e.g., from the list below, indicate which books you wouldn’t recommend to parents.
uses leading questions
includes questions that are insensitive
will creates response bias
uses changes in font (to highlight or lead)
uses language that is unclear or complex rather than simple