Embed Size (px)
Citation preview
MCT4C: Unit 2 – Polynomial Functions 1
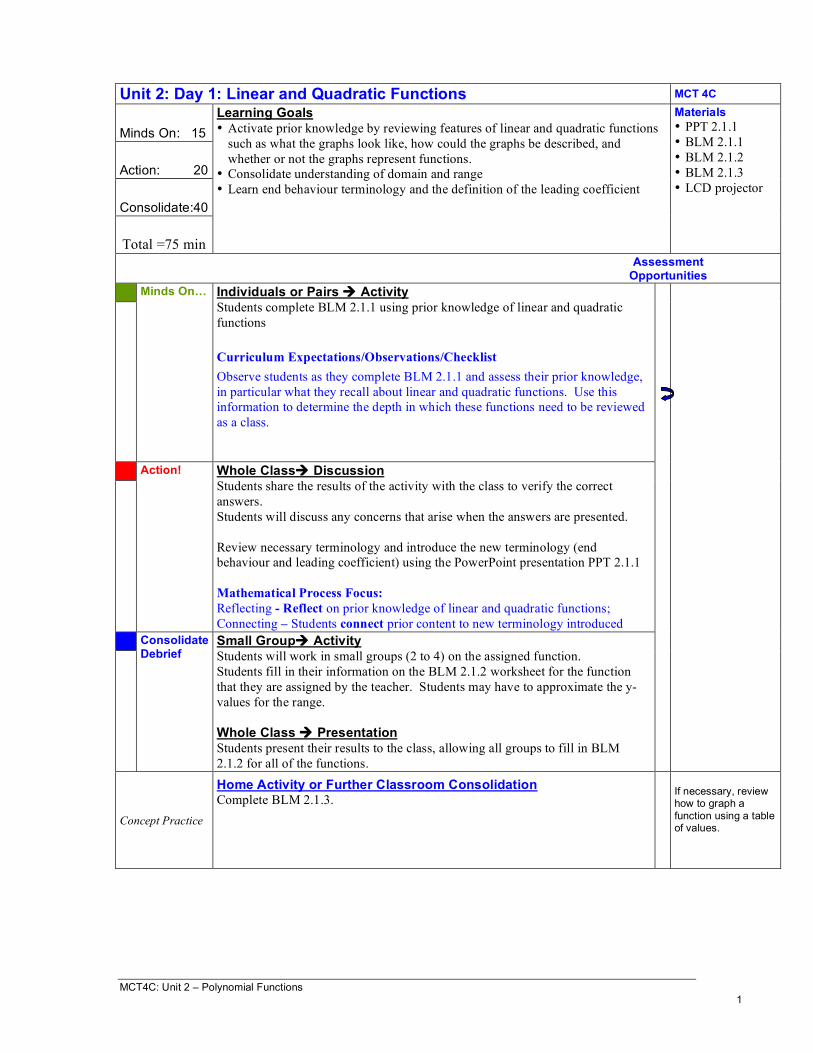
Unit 2: Day 1: Linear and Quadratic Functions MCT 4C
Minds On: 15
Action: 20
Consolidate:40
Total =75 min
Learning Goals • Activate prior knowledge by reviewing features of linear and quadratic functions
such as what the graphs look like, how could the graphs be described, and whether or not the graphs represent functions.
• Consolidate understanding of domain and range • Learn end behaviour terminology and the definition of the leading coefficient
Materials • PPT 2.1.1 • BLM 2.1.1 • BLM 2.1.2 • BLM 2.1.3 • LCD projector
Assessment Opportunities
Minds On… Individuals or Pairs Activity Students complete BLM 2.1.1 using prior knowledge of linear and quadratic functions Curriculum Expectations/Observations/Checklist Observe students as they complete BLM 2.1.1 and assess their prior knowledge, in particular what they recall about linear and quadratic functions. Use this information to determine the depth in which these functions need to be reviewed as a class.
Action! Whole Class Discussion Students share the results of the activity with the class to verify the correct answers. Students will discuss any concerns that arise when the answers are presented. Review necessary terminology and introduce the new terminology (end behaviour and leading coefficient) using the PowerPoint presentation PPT 2.1.1 Mathematical Process Focus: Reflecting - Reflect on prior knowledge of linear and quadratic functions; Connecting – Students connect prior content to new terminology introduced
Consolidate Debrief
Small Group Activity Students will work in small groups (2 to 4) on the assigned function. Students fill in their information on the BLM 2.1.2 worksheet for the function that they are assigned by the teacher. Students may have to approximate the y-values for the range. Whole Class Presentation Students present their results to the class, allowing all groups to fill in BLM 2.1.2 for all of the functions.
Concept Practice
Home Activity or Further Classroom Consolidation Complete BLM 2.1.3.
If necessary, review how to graph a function using a table of values.

MCT4C: Unit 2 – Polynomial Functions 2
-10 -8 -6 -4 -2 2 4 6 8 10
-10
-8
-6
-4
-2
2
4
6
8
10
-10 -8 -6 -4 -2 2 4 6 8 10
-10
-8
-6
-4
-2
2
4
6
8
10
-10 -8 -6 -4 -2 2 4 6 8 10
-10
-8
-6
-4
-2
2
4
6
8
10
-10 -8 -6 -4 -2 2 4 6 8 10
-10
-8
-6
-4
-2
2
4
6
8
10
-10 -8 -6 -4 -2 2 4 6 8 10
-10
-8
-6
-4
-2
2
4
6
8
10
-10 -8 -6 -4 -2 2 4 6 8 10
-10
-8
-6
-4
-2
2
4
6
8
10
-10 -8 -6 -4 -2 2 4 6 8 10
-10
-8
-6
-4
-2
2
4
6
8
10
-10 -8 -6 -4 -2 2 4 6 8 10
-10
-8
-6
-4
-2
2
4
6
8
10
2.1.1: Match It! Match each given function with the graph on the right-hand side. 1. ______ 12 += xy 2. ______ 6
2!!= xxy
3. ______ 6
2++!= xxy
4. ______ 12 != xy 5. ______ 6
2!+= xxy
6. ______ 12 !!= xy 7. ______ 65
2!!!= xxy
8. ______ 12 +!= xy
A B
C D
E F
G H

MCT4C: Unit 2 – Polynomial Functions 3
2.1.2: Linear and Quadratic Functions
Function Domain and Range Degree Leading Coefficient
End Behaviour
1. 12 += xy
2. 6
2!!= xxy
3. 6
2++!= xxy
4. 12 != xy
5. 6
2!+= xxy
6. 12 !!= xy
7. 65
2!!!= xxy
8. 12 +!= xy

MCT4C: Unit 2 – Polynomial Functions 4
2.1.3: Linear and Quadratic Functions – Practice For each of the given functions, sketch the graph of the relation, creating a table of values if necessary. Use the graph and the equation to fill in the table relating to each graph. 1. 23 +!= xy Domain
Range
Degree
Sign of Leading Coefficient
End Behaviour
Is the relation a function?
2. 5
2!!= xy
Domain
Range
Degree
Sign of Leading Coefficient
End Behaviour
Is the relation a function?

MCT4C: Unit 2 – Polynomial Functions 5
2.1.3: Linear and Quadratic Functions – Practice (continued)
3. 42
1+= xy
Domain
Range
Degree
Sign of Leading Coefficient
End Behaviour
Is the relation a function?
4. 96
2+!= xxy
Domain
Range
Degree
Sign of Leading Coefficient
End Behaviour
Is the relation a function?
5. Is it possible to graph a line of the form bmxy += that will not result in a function?
Explain your reasoning. 6. Is it possible to graph a quadratic relation of the form cbxaxy ++=
2 that will not result in a function? Explain your reasoning.

MCT4C: Unit 2 – Polynomial Functions 6
Unit 2: Day 2: A Higher Degree MCT 4C
Minds On: 10
Action: 60
Consolidate: 5
Total =75 min
Learning Goals: • Investigate cubic and quartic functions and explain why they are functions. • Graph the equations of cubic and quartic functions and investigate end
behaviours, domain and range. • Describe end behaviours and the impact of the leading coefficient (positive and
negative values).
Materials • BLM 2.2.1 • BLM 2.2.2 • BLM 2.2.3 • Graphing
calculators
Assessment Opportunities
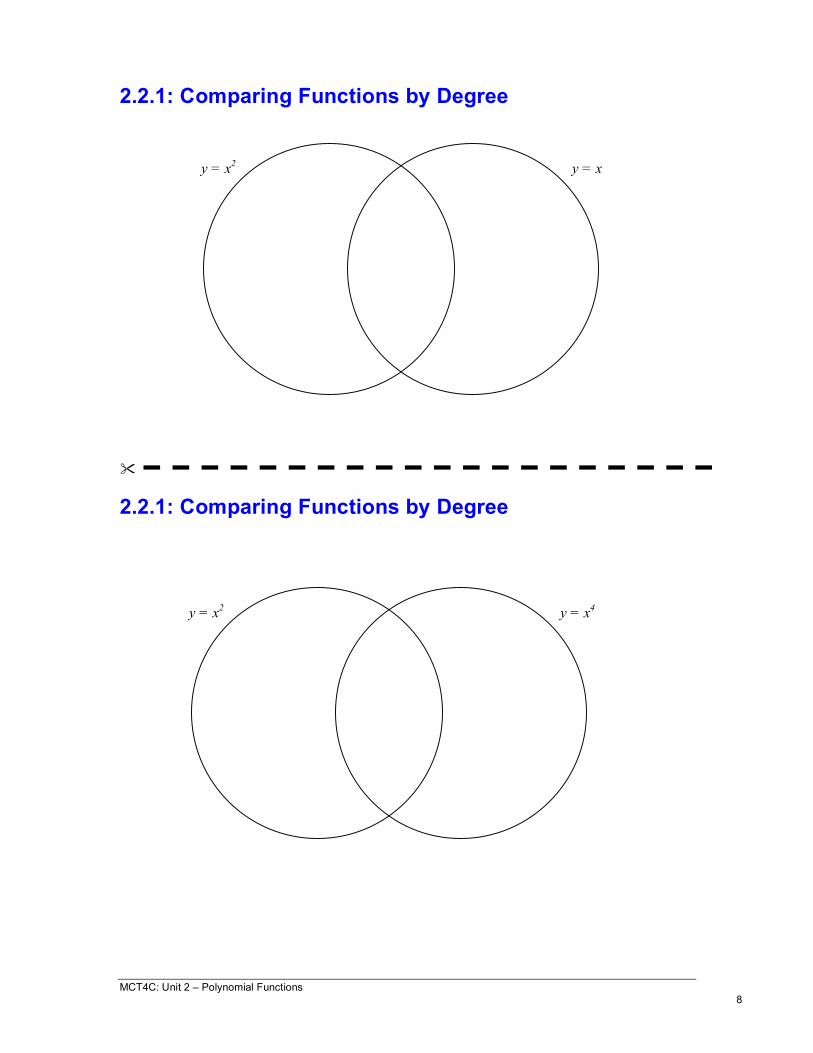
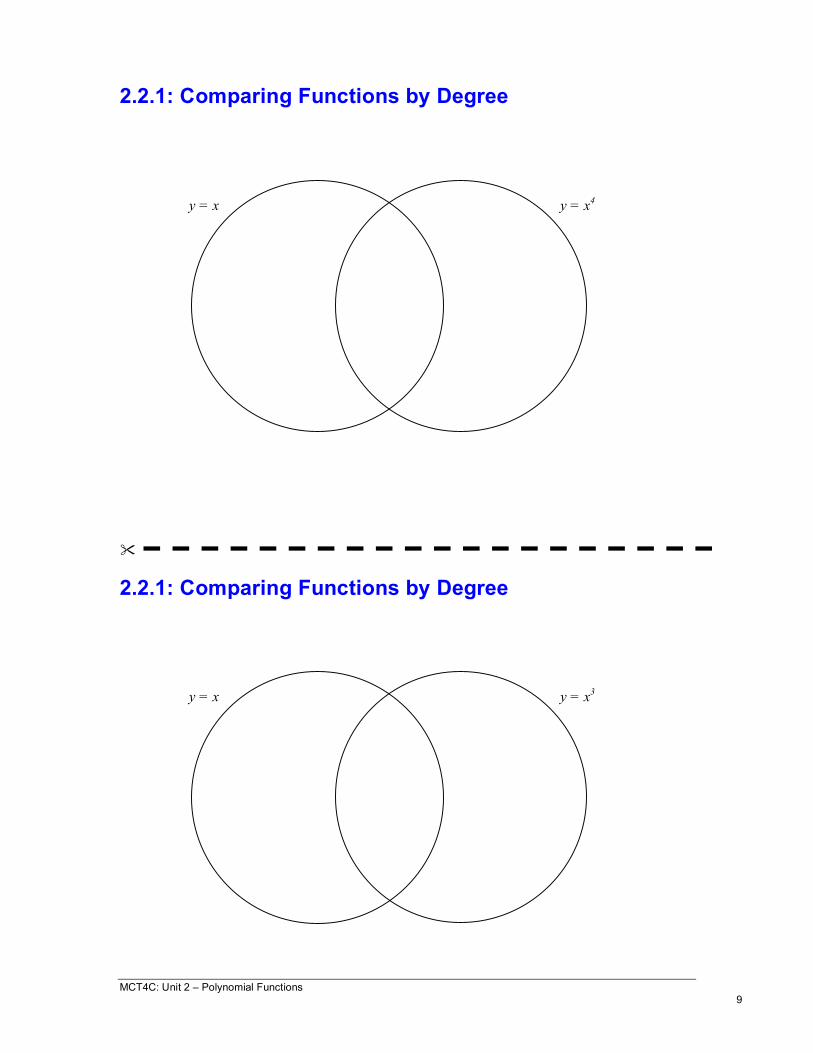
Minds On… Pairs Activity Pairs are given a section of BLM 2.2.1 and take a few minutes to consider the relations. Each pair will have two functions from y = x, y = x2, y = x3, and y = x4 and must hypothesize about how the relations will be the same and how they will be different, with reference to the following items:
effect of leading coefficient, end behaviour, degree, maximum number of x-intercepts, domain, range, whether or not the relations are functions
Students will fill in the Venn Diagram in BLM 2.2.1 with their results.
Action! Small Groups Jigsaw (Home Groups) In groups of 4 , students should each select a different chart to complete on BLM 2.2.2. Small Groups Jigsaw (Expert Groups) Students form expert groups according to the chart that selected. Each group creates graphs for each function in BLM 2.2.1 using a graphing calculator. Students make conclusions about the behaviour of cubic and quartic functions based on the investigations. Curriculum Expectations/Oral Questions/Rubric Assess students as they complete BLM 2.2.1 in their expert groups on their understanding of the key components of functions. Small Groups Jigsaw (Home Groups) Students regroup too share their results. Students use the information shared to complete all charts and questions. Mathematical Process Focus: Reasoning and Proving – Students use their reasoning skills to determine patterns related to properties of polynomials.
Consolidate Debrief
Pairs Activity Students work in the same pairs from the Minds On activity and compare their hypotheses with the actual results. They should make any necessary changes to their Venn Diagram.
Teacher should copy BLM 2.2.1 and cut the page in half. There should be one Venn diagram for each pair of students in the class.
Reflection
Home Activity Complete a Frayer Model (BLM 2.2.3) for cubic and quartic functions.

MCT4C: Unit 2 – Polynomial Functions 7
y = x3 y = x4
2.2.1: Comparing Functions by Degree 2.2.1: Comparing Functions by Degree
y = x2 y = x3
MCT4C: Unit 2 – Polynomial Functions 8
2.2.1: Comparing Functions by Degree 2.2.1: Comparing Functions by Degree
y = x2 y = x
y = x2 y = x4
MCT4C: Unit 2 – Polynomial Functions 9
2.2.1: Comparing Functions by Degree 2.2.1: Comparing Functions by Degree
y = x y = x4
y = x y = x3
MCT4C: Unit 2 – Polynomial Functions 10
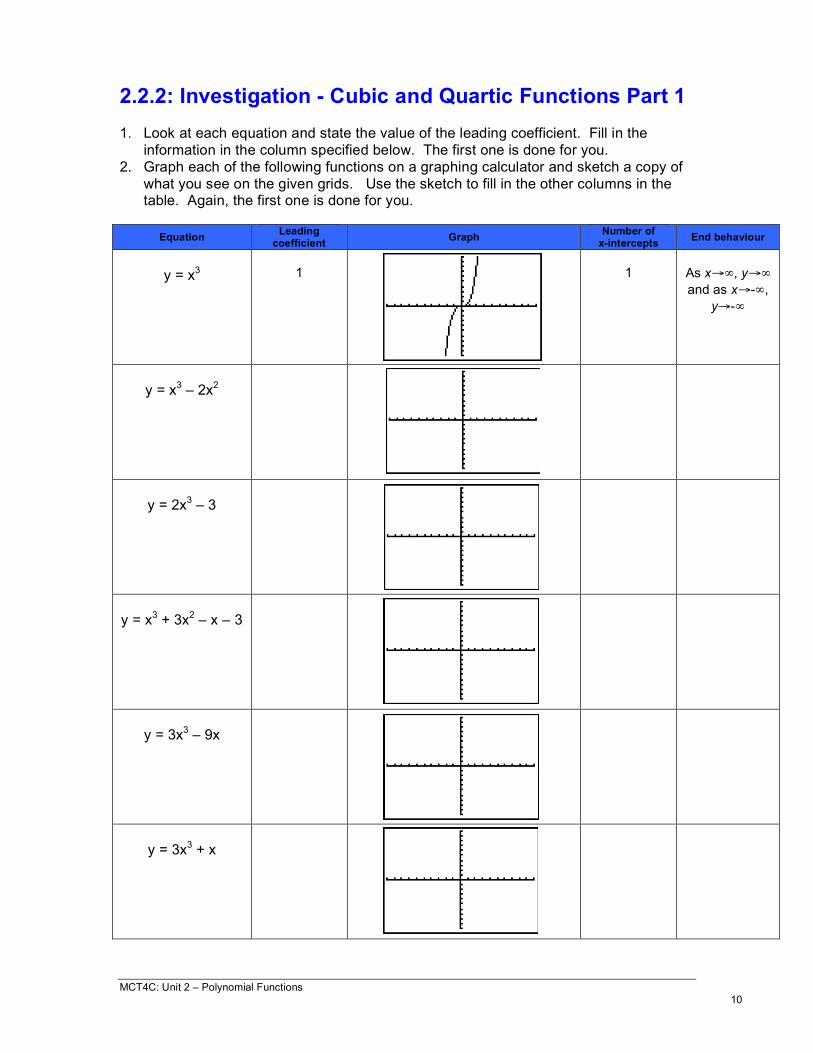
2.2.2: Investigation - Cubic and Quartic Functions Part 1 1. Look at each equation and state the value of the leading coefficient. Fill in the
information in the column specified below. The first one is done for you. 2. Graph each of the following functions on a graphing calculator and sketch a copy of
what you see on the given grids. Use the sketch to fill in the other columns in the table. Again, the first one is done for you.
Equation Leading
coefficient Graph Number of x-intercepts End behaviour
y = x3
1
1
As x→∞, y→∞ and as x→-∞,
y→-∞
y = x3 – 2x2
y = 2x3 – 3
y = x3 + 3x2 – x – 3
y = 3x3 – 9x
y = 3x3 + x
MCT4C: Unit 2 – Polynomial Functions 11
2.2.2: Investigation - Cubic and Quartic Functions Part 1 (continued) Refer to the chart that you just completed on the previous page to answer questions 3 – 7. 3. What is true about the leading coefficient of all of the polynomials? 4. What is true about the degree of all of the polynomials? 5. What is true about the end behaviour of all of the polynomials? 6. What is the maximum number of x-intercepts for all of the polynomials? 7. Do the graphs of the relations represent functions? Explain.

MCT4C: Unit 2 – Polynomial Functions 12
2.2.2: Investigation - Cubic and Quartic Functions Part 2 1. Look at each equation and state the value of the leading coefficient. Fill in the
information in the column specified below. The first one is done for you. 2. Graph each of the following functions on a graphing calculator and sketch a copy of
what you see on the given grids. Use the sketch to fill in the other columns in the table. Again, the first one is done for you.
Equation Leading
coefficient Graph Number of x-intercepts End behaviour
y = -x3
-1
1
As x→∞, y→-∞ and as x→-∞,
y→∞
y = -x3 – 2x2
y = -2x3 – 1
y = -2x3 + x2 + 2x – 1
y = -2x3 – 6x
y = -2x3 + 4x
MCT4C: Unit 2 – Polynomial Functions 13
2.2.2: Investigation - Cubic and Quartic Functions Part 2 (continued) Refer to the chart that you just completed on the previous page to answer questions 3 – 8. 3. What is true about the leading coefficient of all of the polynomials? 4. What is true about the degree of all of the polynomials? 5. What is true about the end behaviour of all of the polynomials? 6. What is the maximum number of x-intercepts for all of the polynomials? 7. Do the graphs of the relations represent functions? Explain. 8. What impact do the signs of the leading coefficients seem to have on the graphs
from the first chart and the second chart?
MCT4C: Unit 2 – Polynomial Functions 14
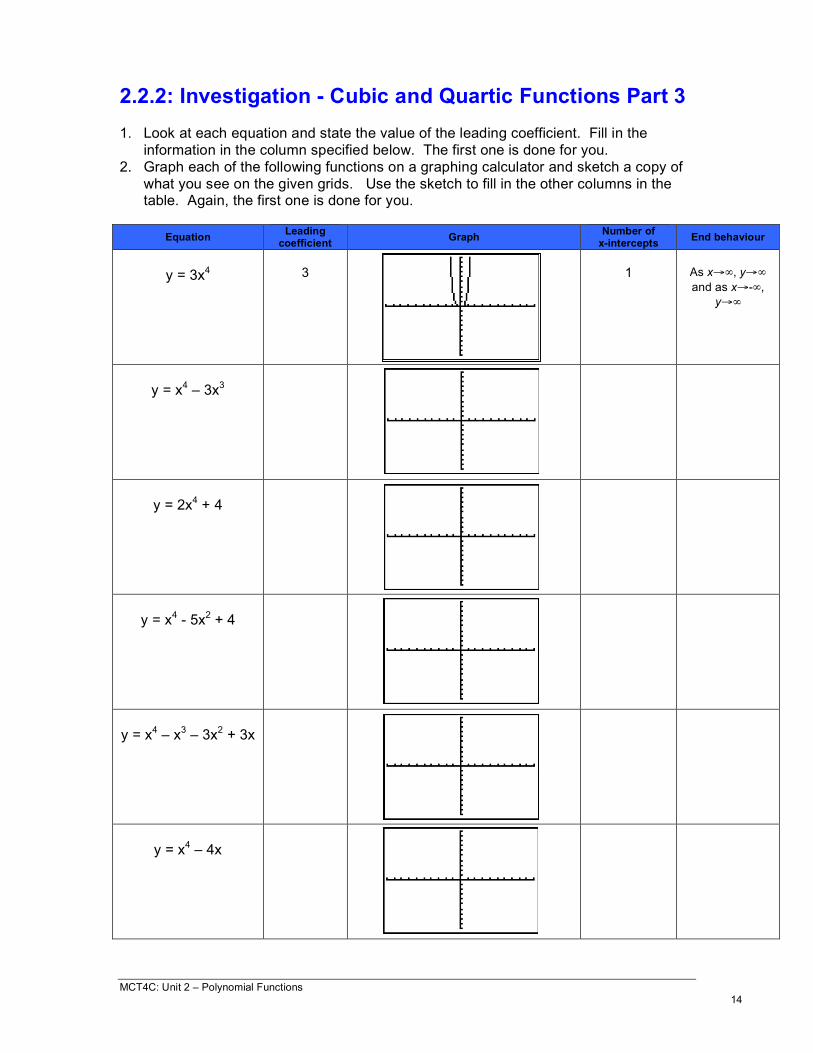
2.2.2: Investigation - Cubic and Quartic Functions Part 3 1. Look at each equation and state the value of the leading coefficient. Fill in the
information in the column specified below. The first one is done for you. 2. Graph each of the following functions on a graphing calculator and sketch a copy of
what you see on the given grids. Use the sketch to fill in the other columns in the table. Again, the first one is done for you.
Equation Leading
coefficient Graph Number of x-intercepts End behaviour
y = 3x4
3
1
As x→∞, y→∞ and as x→-∞,
y→∞
y = x4 – 3x3
y = 2x4 + 4
y = x4 - 5x2 + 4
y = x4 – x3 – 3x2 + 3x
y = x4 – 4x

MCT4C: Unit 2 – Polynomial Functions 15
2.2.2: Investigation - Cubic and Quartic Functions Part 3 (continued) Refer to the chart that you just completed on the previous page to answer questions 3 – 7. 3. What is true about the leading coefficient of all of the polynomials? 4. What is true about the degree of all of the polynomials? 5. What is true about the end behaviour of all of the polynomials? 6. What is the maximum number of x-intercepts for all of the polynomials? 7. Do the graphs of the relations represent functions? Explain.

MCT4C: Unit 2 – Polynomial Functions 16
2.2.2: Investigation - Cubic and Quartic Functions Part 4 1. Look at each equation and state the value of the leading coefficient. Fill in the
information in the column specified below. The first one is done for you. 2. Graph each of the following functions on a graphing calculator and sketch a copy of
what you see on the given grids. Use the sketch to fill in the other columns in the table. Again, the first one is done for you.
Equation Leading
coefficient Graph Number of x-intercepts End behaviour
y = -5x4
-5
1
As x→∞, y→-∞ and as x→-∞,
y→-∞
y = -x4 – 3x3
y = -2x4 + 4
y = -x4 + x3 + 4x2 – 4x
y = -x4 + 4x2
y = -x4 +5x2 - 4

MCT4C: Unit 2 – Polynomial Functions 17
2.2.2: Investigation - Cubic and Quartic Functions Part 4 (continued) Refer to the chart that you just completed on the previous page to answer questions 3 – 9. 3. What is true about the degree of all of the polynomials? 4. What is true about the leading coefficient of all of the polynomials? 5. What is true about the end behaviour of all of the polynomials? 6. What is the maximum number of x-intercepts for all of the polynomials? 7. Do the graphs of the relations represent functions? Explain. 8. What impact do the signs of the leading coefficients seem to have on the graphs in
the third and fourth chart? 9. In general, what is the relationship between the degree of a polynomial and the
maximum number of x-intercepts for the polynomial?

MCT4C: Unit 2 – Polynomial Functions 18
2.2.3: Frayer Model - Cubic and Quartic Functions
MCT4C: Unit 2 – Polynomial Functions 19
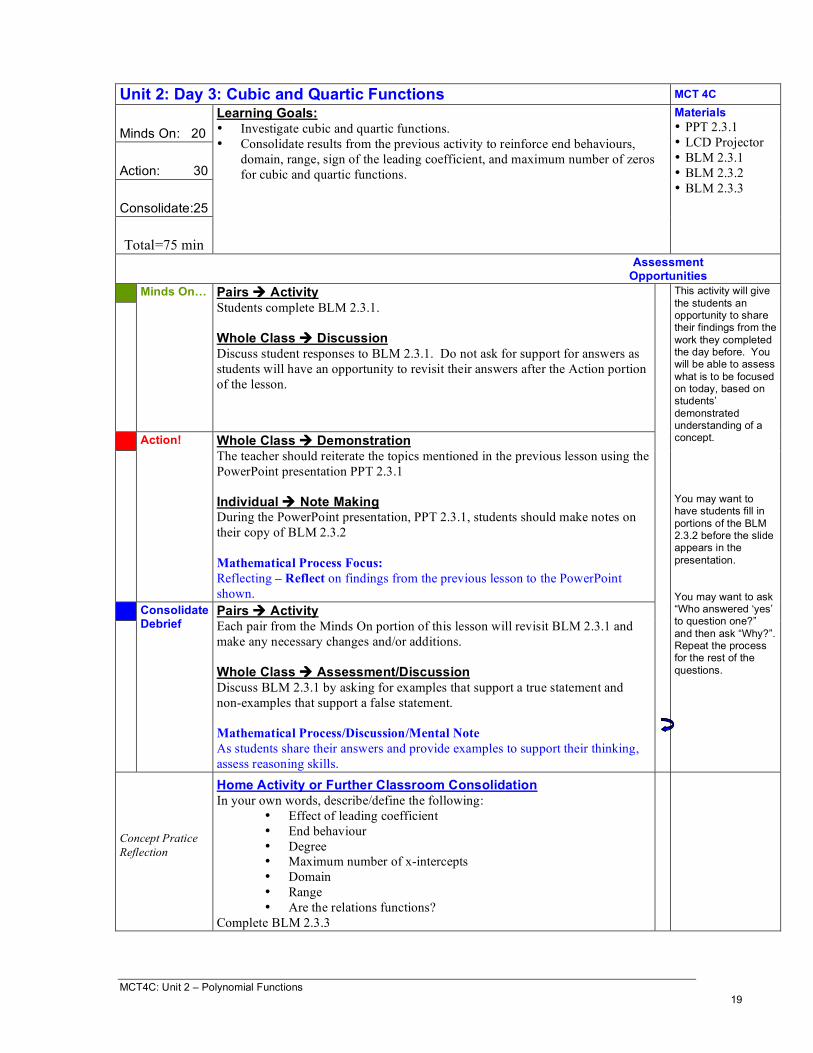
Unit 2: Day 3: Cubic and Quartic Functions MCT 4C
Minds On: 20
Action: 30
Consolidate:25
Total=75 min
Learning Goals: • Investigate cubic and quartic functions. • Consolidate results from the previous activity to reinforce end behaviours,
domain, range, sign of the leading coefficient, and maximum number of zeros for cubic and quartic functions.
Materials • PPT 2.3.1 • LCD Projector • BLM 2.3.1 • BLM 2.3.2 • BLM 2.3.3
Assessment Opportunities
Minds On… Pairs Activity Students complete BLM 2.3.1. Whole Class Discussion Discuss student responses to BLM 2.3.1. Do not ask for support for answers as students will have an opportunity to revisit their answers after the Action portion of the lesson.
Action! Whole Class Demonstration The teacher should reiterate the topics mentioned in the previous lesson using the PowerPoint presentation PPT 2.3.1 Individual Note Making During the PowerPoint presentation, PPT 2.3.1, students should make notes on their copy of BLM 2.3.2 Mathematical Process Focus: Reflecting – Reflect on findings from the previous lesson to the PowerPoint shown.
Consolidate Debrief
Pairs Activity Each pair from the Minds On portion of this lesson will revisit BLM 2.3.1 and make any necessary changes and/or additions. Whole Class Assessment/Discussion Discuss BLM 2.3.1 by asking for examples that support a true statement and non-examples that support a false statement. Mathematical Process/Discussion/Mental Note As students share their answers and provide examples to support their thinking, assess reasoning skills.
This activity will give the students an opportunity to share their findings from the work they completed the day before. You will be able to assess what is to be focused on today, based on students’ demonstrated understanding of a concept. You may want to have students fill in portions of the BLM 2.3.2 before the slide appears in the presentation. You may want to ask “Who answered ‘yes’ to question one?” and then ask “Why?”. Repeat the process for the rest of the questions.
Concept Pratice Reflection
Home Activity or Further Classroom Consolidation In your own words, describe/define the following:
• Effect of leading coefficient • End behaviour • Degree • Maximum number of x-intercepts • Domain • Range • Are the relations functions?
Complete BLM 2.3.3

MCT4C: Unit 2 – Polynomial Functions 20
2.3.1: True or False? Read each of the following statements and circle True or False below. 1. A degree of four is the highest degree that a cubic function can have.
True False
2. A cubic function has to have at least one x-intercept. True False
3. The leading coefficient for the function 2x3 – 5x2 + 10x + 3 is 2x3. True False
4. The domain and range for all quartic functions will never be restricted. True False
5. The domain and range for all cubic functions will never be restricted. True False
6. A quartic function can have three x-intercepts. True False
7. A cubic function can have four x-intercepts. True False
8. A quartic function can resemble a quadratic function when graphed. True False
9. Sometimes a quartic relation is not a function. True False
10. As x→∞, y→-∞ and x→-∞, y→-∞ means the graph is starting on the left in quadrant 3 and ending on the right in quadrant 4. True False
11. The leading coefficient does not influence the graph of a quartic function. True False
12. The x-intercepts do not change when the graph is reflected on the x-axis. True False
13. The function y = (x – 3)2 (x + 1) would have two x-intercepts. True False
14. The function y = (x – 2)(x – 2)(x – 2) would have three x-intercepts. True False
15. The function y = (x + 4)2(x – 4)2 would create a “W” shape. True False
16. The end behaviour for the function y = -x4 + 2x3 – x2 + 3x – 10 would be as x→∞, y→∞ and x→-∞, y→∞. True False
MCT4C: Unit 2 – Polynomial Functions 21
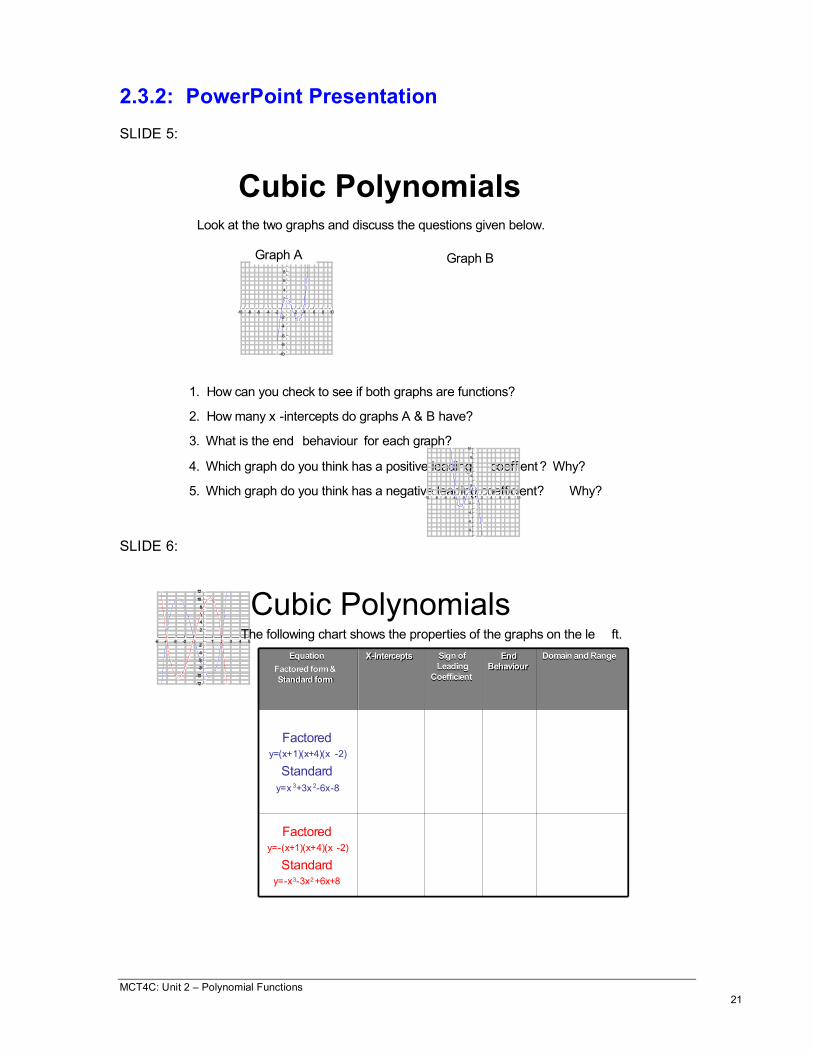
2.3.2: PowerPoint Presentation SLIDE 5:
Cubic PolynomialsLook at the two graphs and discuss the questions given below.
1. How can you check to see if both graphs are functions?
3. What is the end behaviour for each graph?
4. Which graph do you think has a positive leading coeffient? Why?
5. Which graph do you think has a negative leading coefficient? Why?
2. How many x -intercepts do graphs A & B have?
-10 -8 -6 -4 -2 2 4 6 8 10
-10
-8
-6
-4
-2
2
4
6
8
10
-10 -8 -6 -4 -2 2 4 6 8 10
-10
-8
-6
-4
-2
2
4
6
8
10
Graph BGraph A
SLIDE 6:
Cubic Polynomials-5 -4 -3 -2 -1 1 2 3 4 5
-12
-10
-8
-6
-4
-2
2
4
6
8
10
12
-5 -4 -3 -2 -1 1 2 3 4 5
-12
-10
-8
-6
-4
-2
2
4
6
8
10
12
Factoredy=-(x+1)(x+4)(x -2)
Standardy=-x3-3x2+6x+8
Factoredy=(x+1)(x+4)(x -2)
Standard
y=x 3+3x 2-6x-8
EquationEquation
Factored form & Factored form &
Standard formStandard form
Domain and RangeDomain and RangeEnd End
BehaviourBehaviourSign of Sign of
Leading Leading
CoefficientCoefficient
XX--InterceptsIntercepts
The following chart shows the properties of the graphs on the le ft.

MCT4C: Unit 2 – Polynomial Functions 22
2.3.2: PowerPoint Presentation (continued) SLIDE 7:
-5 -4 -3 -2 -1 1 2 3 4 5
-12
-10
-8
-6
-4
-2
2
4
6
8
10
12
-5 -4 -3 -2 -1 1 2 3 4 5
-12
-10
-8
-6
-4
-2
2
4
6
8
10
12
Cubic Polynomials
Factoredy=-(x+3) 2(x-1)
Standard
y= -x3-5x2-3x+9
Factoredy=(x+3) 2(x-1)
Standard
y=x3+5x 2+3x -9
EquationEquation
Factored form & Factored form &
Standard formStandard form
Domain and RangeDomain and RangeEnd End
BehaviourBehaviourSign of Sign of
Leading Leading
CoefficientCoefficient
XX--InterceptsIntercepts
The following chart shows the properties of the graphs on the le ft.
SLIDE 8:
-5 -4 -3 -2 -1 1 2 3 4 5
-12
-10
-8
-6
-4
-2
2
4
6
8
10
12
-5 -4 -3 -2 -1 1 2 3 4 5
-12
-10
-8
-6
-4
-2
2
4
6
8
10
12
Cubic Polynomials
Factored
y= -(x-2)3
Standardy=-x3+6x 2-12x+8
Factoredy=(x -2)3
Standard
y=x3-6x2+12x -8
EquationEquation
Factored form & Factored form &
Standard formStandard form
Domain and RangeDomain and RangeEnd End
BehaviourBehaviourSign of Sign of
Leading Leading
CoefficientCoefficient
XX--InterceptsIntercepts
The following chart shows the properties of the graphs on the le ft.
MCT4C: Unit 2 – Polynomial Functions 23
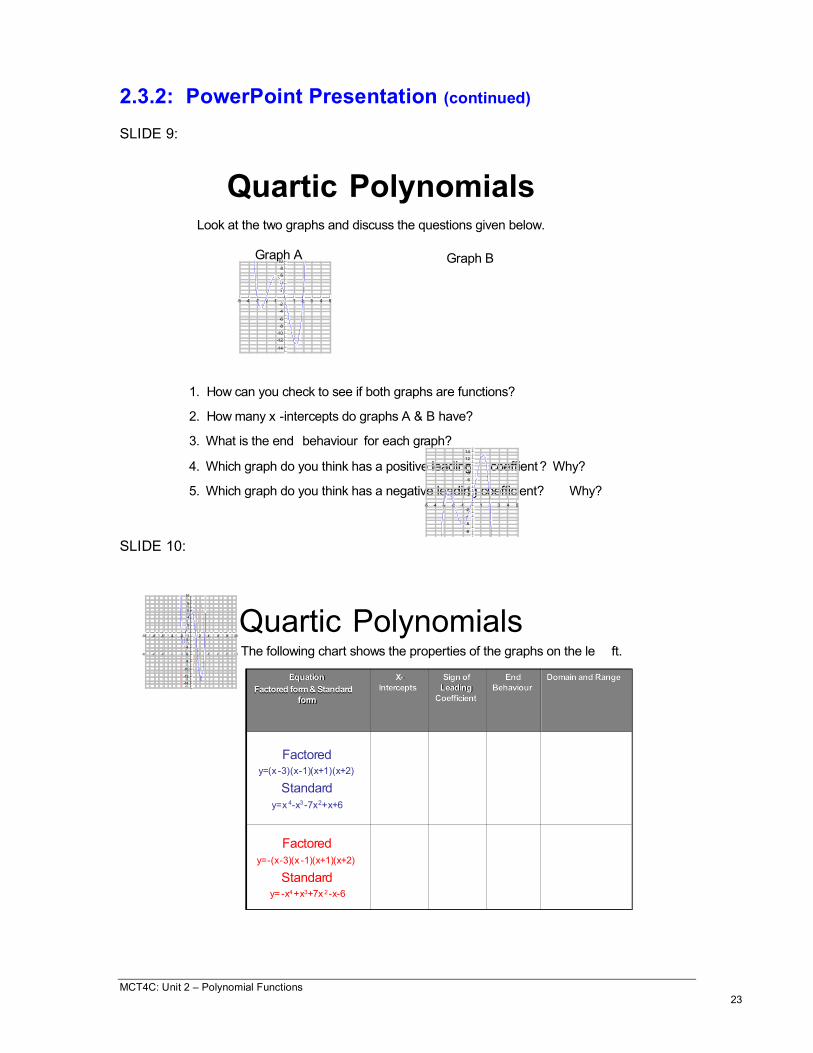
2.3.2: PowerPoint Presentation (continued) SLIDE 9:
Quartic PolynomialsLook at the two graphs and discuss the questions given below.
1. How can you check to see if both graphs are functions?
3. What is the end behaviour for each graph?
4. Which graph do you think has a positive leading coeffient? Why?
5. Which graph do you think has a negative leading coefficient? Why?
2. How many x -intercepts do graphs A & B have?
Graph BGraph A
-5 -4 -3 -2 -1 1 2 3 4 5
-14
-12
-10
-8
-6
-4
-2
2
4
6
8
10
-5 -4 -3 -2 -1 1 2 3 4 5
-10
-8
-6
-4
-2
2
4
6
8
10
12
14
SLIDE 10:
-10 -8 -6 -4 -2 2 4 6 8 10
-10
-8
-6
-4
-2
2
4
6
8
10
12
14
-10 -8 -6 -4 -2 2 4 6 8 10
-14
-12
-10
-8
-6
-4
-2
2
4
6
8
10
Quartic Polynomials
Factored
y=-(x-3)(x -1)(x+1)(x+2)
Standardy= -x4+x3+7x 2-x-6
Factoredy=(x -3)(x-1)(x+1)(x+2)
Standard
y=x 4-x3-7x2+x+6
EquationEquation
Factored form & Standard Factored form & Standard
formform
Domain and RangeDomain and RangeEnd End
BehaviourBehaviour
Sign of Sign of
Leading Leading
CoefficientCoefficient
XX--
InterceptsIntercepts
The following chart shows the properties of the graphs on the le ft.

MCT4C: Unit 2 – Polynomial Functions 24
2.3.2: PowerPoint Presentation (continued) SLIDE 11:
-5 -4 -3 -2 -1 1 2 3 4 5
-15
-12
-9
-6
-3
3
6
9
12
15
18
-5 -4 -3 -2 -1 1 2 3 4 5
-18
-15
-12
-9
-6
-3
3
6
9
12
15
Quartic Polynomials
Factoredy=-(x-4)2(x-1)(x+1)
Standardy=-x4+8x 3-15x 2-8x+16
Factoredy=(x -4)2(x-1)(x+1)
Standard
y=x 4-8x3+15x 2+8x -16
EquationEquation
Factored form & Standard Factored form & Standard
formform
Domain and RangeDomain and RangeEnd End
BehaviourBehaviour
Sign of Sign of
Leading Leading
CoefficientCoefficient
XX--
InterceptsIntercepts
The following chart shows the properties of the graphs on the le ft.
SLIDE 12:
-5 -4 -3 -2 -1 1 2 3 4 5
-10
-8
-6
-4
-2
2
4
6
8
10
-5 -4 -3 -2 -1 1 2 3 4 5
-10
-8
-6
-4
-2
2
4
6
8
10
Quartic Polynomials
Factored
y=-(x+2) 3(x-1)
Standardy=-x4-5x3-6x 2+4x+8
Factoredy=(x+2) 3(x-1)
Standard
y=x4+5x 3+6x 2-4x-8
EquationEquation
Factored form & Standard Factored form & Standard
formform
Domain and RangeDomain and RangeEnd End
BehaviourBehaviour
Sign of Sign of
Leading Leading
CoefficientCoefficient
XX--
InterceptsIntercepts
The following chart shows the properties of the graphs on the le ft.

MCT4C: Unit 2 – Polynomial Functions 25
2.3.2: PowerPoint Presentation (continued) SLIDE 13:
-5 -4 -3 -2 -1 1 2 3 4 5
-10
-8
-6
-4
-2
2
4
6
8
10
-5 -4 -3 -2 -1 1 2 3 4 5
-10
-8
-6
-4
-2
2
4
6
8
10
Quartic Polynomials
Factoredy= -(x-3)4
Standardy=-x4+12x 3-54x2+108x -81
Factoredy=(x -3)4
Standard
y=x4-12x 3+54x 2-108x+81
EquationEquation
Factored form & Standard Factored form & Standard
formform
Domain and RangeDomain and RangeEnd End
BehaviourBehaviour
Sign of Sign of
Leading Leading
CoefficientCoefficient
XX--
InterceptsIntercepts
The following chart shows the properties of the graphs on the le ft.
MCT4C: Unit 2 – Polynomial Functions 26
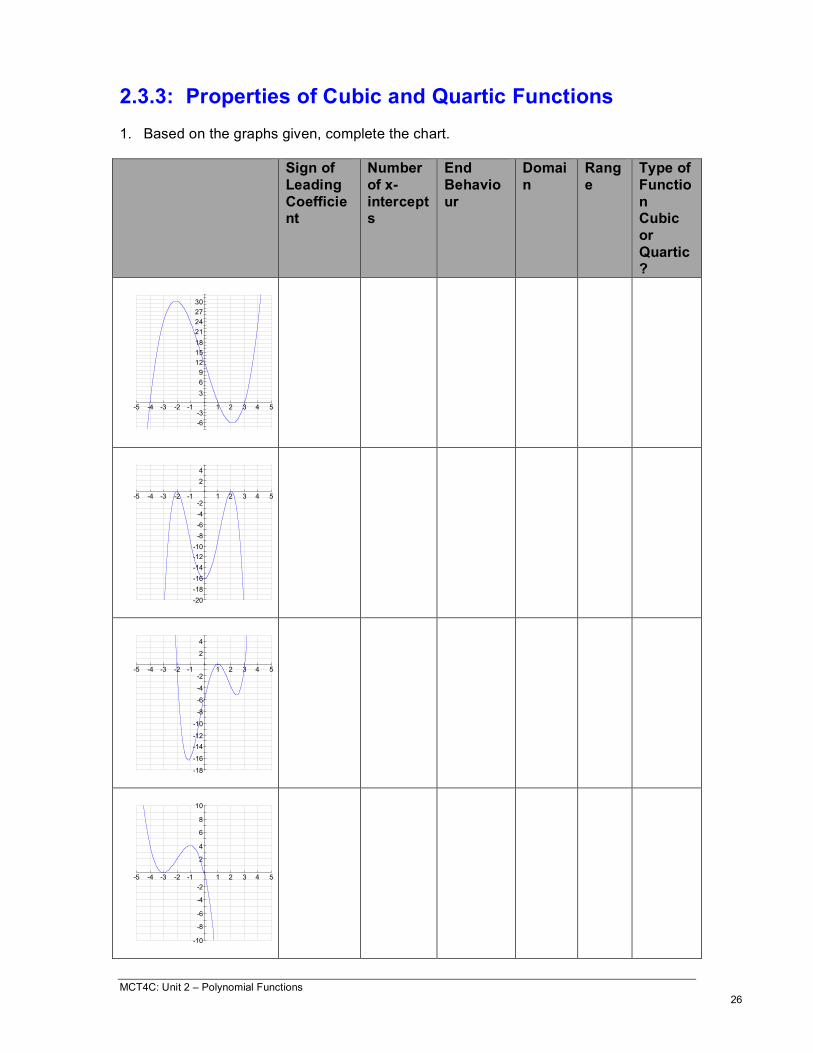
2.3.3: Properties of Cubic and Quartic Functions 1. Based on the graphs given, complete the chart. Sign of
Leading Coefficient
Number of x-intercepts
End Behaviour
Domain
Range
Type of Function Cubic or Quartic?
-5 -4 -3 -2 -1 1 2 3 4 5
-6
-3
3
6
9
12
15
18
21
24
27
30
-5 -4 -3 -2 -1 1 2 3 4 5
-20
-18
-16
-14
-12
-10
-8
-6
-4
-2
2
4
-5 -4 -3 -2 -1 1 2 3 4 5
-18
-16
-14
-12
-10
-8
-6
-4
-2
2
4
-5 -4 -3 -2 -1 1 2 3 4 5
-10
-8
-6
-4
-2
2
4
6
8
10

MCT4C: Unit 2 – Polynomial Functions 27
Unit 2: Day 10: Using Polynomial Functions to Model Real Life Data MCT 4C
Minds On: 10
Action: 60
Consolidate:5
Total =75 min
Learning Goals • Activate prior knowledge by reviewing features of the graphing calculator such as
regression analysis, if needed. • Apply knowledge of polynomial functions to a set of data to determine an
appropriate model for the data.
Materials • BLM 2.10.1 • BLM 2.10.2 • Graphing
calculators • Overhead panel
or TI-Smartview, if available
Assessment Opportunities
Minds On… Pairs Activity Students complete BLM 2.10.1 to review how to plot data and use the graphing calculator for regression analysis.
Action! Individuals or Pairs Activity Students complete BLM 2.10.2 using the graphing calculators. Note: It is very difficult to find data that fits a cubic or quartic function. The given data does not really fit a quartic model outside of the given data. The website calculator.maconstate.edu/cubic_modeling_lesson/index.html has a set of data that fits a cubic model nicely. However, the statistics are US based. Teachers may decide to use this data instead of the given data. Mathematical Process/Observation/Checklist Assess students’ ability to reflect and connect as they complete the task. Mathematical Process Focus: Reflecting - Reflect on understanding of regression to complete the journal for the home activity Connecting – Students connect prior content to new terminology introduced
Consolidate Debrief
Whole Class Discussion Discuss the assignment, once it has been handed in (if it is being assessed), to determine which model is the better fit. Also discuss the limitations that students found in the model and their confidence in using the model to predict values that are outside of the data range. Explain that when given a set of real-life data, there are two major considerations when determining a best-fit model for the data. The first consideration is whether or not the model is a good mathematical fit. This entails looking at the graph to see if the model is close to the data points and checking the value of R2. The second consideration should be whether the fit seems reasonable based on what the data is representing. This entails looking at what happens to the function and determining if it makes sense that the data would continue to increase where the function is increasing and to decrease where the function is decreasing.
This activity is only needed if students have not recently used the graphing calculators for regression analysis. If time is a concern, have students complete all of the parts that require the use of the graphing calculator during class and the conclusions (#7) can be done for homework or in class the following day.
Journal
Home Activity Reflect on the activity and complete the following statements:
1. The hardest part of the assignment was… 2. I think I could do better if …
MCT4C: Unit 2 – Polynomial Functions 28
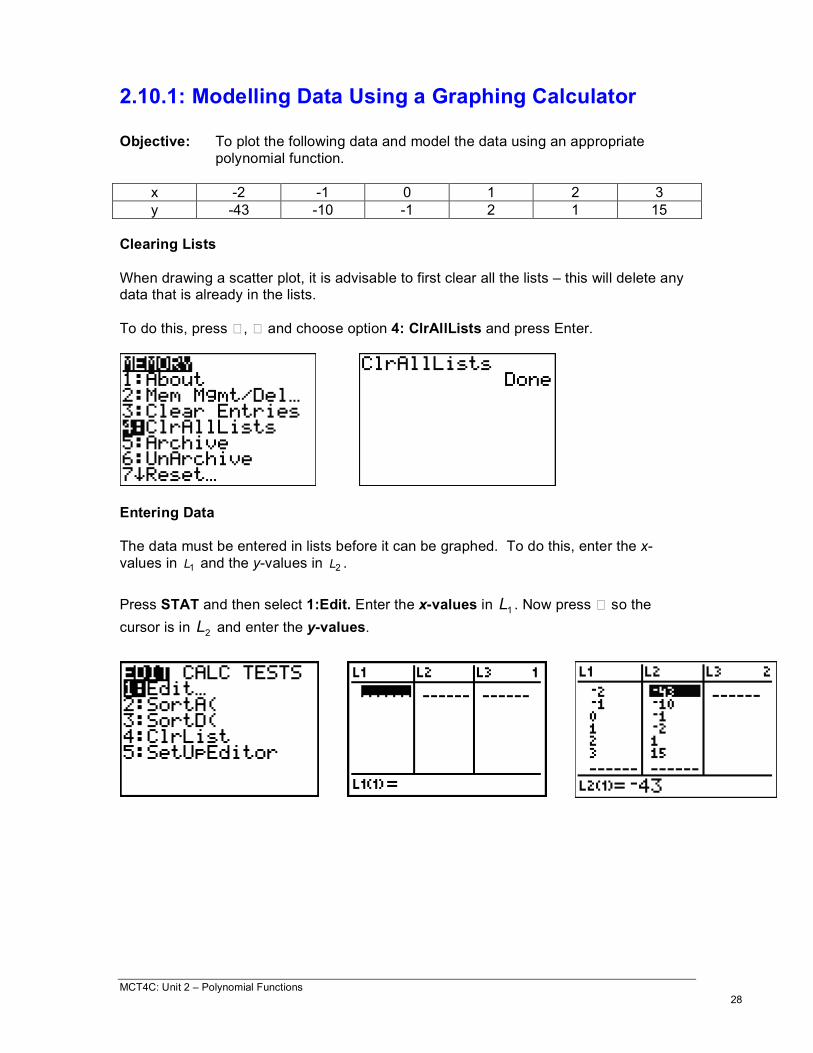
2.10.1: Modelling Data Using a Graphing Calculator Objective: To plot the following data and model the data using an appropriate
polynomial function.
x -2 -1 0 1 2 3 y -43 -10 -1 2 1 15
Clearing Lists When drawing a scatter plot, it is advisable to first clear all the lists – this will delete any data that is already in the lists. To do this, press � , � and choose option 4: ClrAllLists and press Enter.
Entering Data The data must be entered in lists before it can be graphed. To do this, enter the x-values in 1L and the y-values in 2L .
Press STAT and then select 1:Edit. Enter the x-values in 1L . Now press � so the
cursor is in 2L and enter the y-values.

MCT4C: Unit 2 – Polynomial Functions 29
2.10.1: Modelling Data Using a Graphing Calculator (continued)
Plotting Data
To plot the data, it is necessary to turn the plotting feature of the calculator on so that it will graph the data in the lists. The lists to be used must also be specified. Remember that the x-values have been entered in
1L and the y-values have been entered in
2L .
Press � , � and choose 1: Plot1. Move the cursor to On and press � so that Plot1 is on. Note that the Xlist is
1L and the Ylist is
2L .
Adjusting Viewing Window
It is important to let the calculator know what values for x and y need to be plotted. For our data, the x-values range from -2 to 3 and the y-values range from -43 to 17.
Press � and set the x- and y-values to include these ranges.
Now press � and the scatter plot should appear. There were six points to be plotted so make sure that 6 points are visible in the graph. If this is not the case, adjust the viewing window. (The arrows on the graph indicate the six points.)
MCT4C: Unit 2 – Polynomial Functions 30
2.10.1: Modelling Data Using a Graphing Calculator (continued)
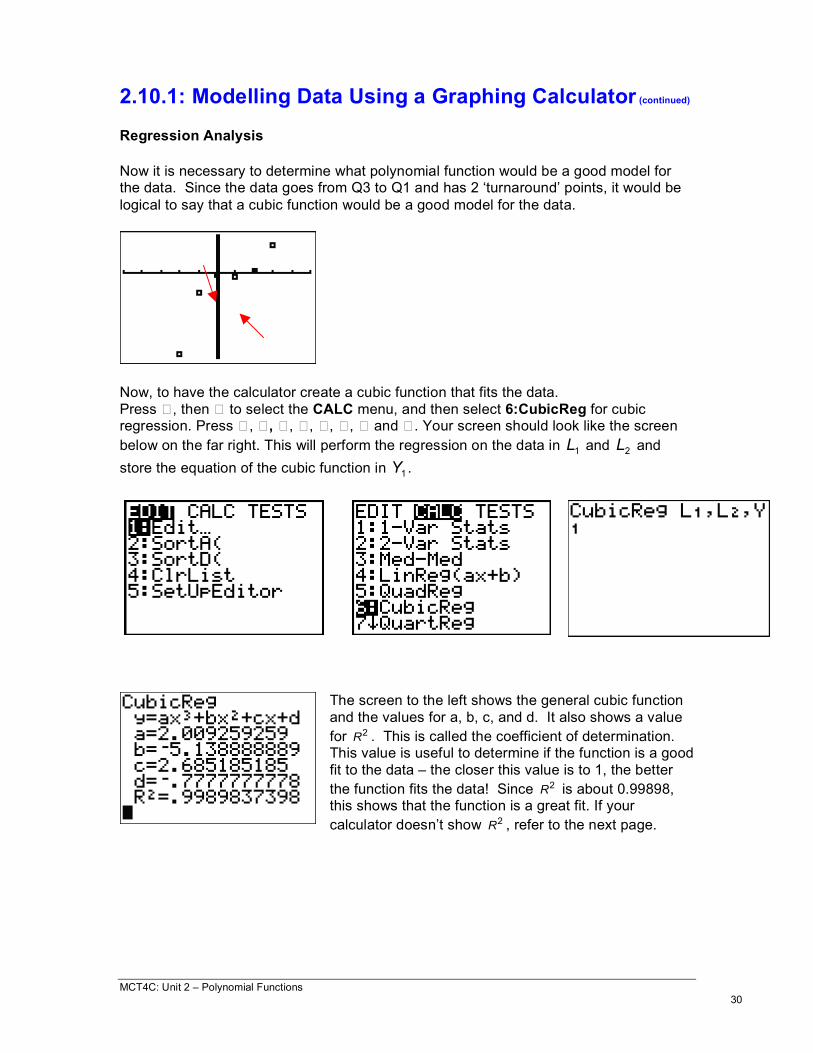
Regression Analysis
Now it is necessary to determine what polynomial function would be a good model for the data. Since the data goes from Q3 to Q1 and has 2 ‘turnaround’ points, it would be logical to say that a cubic function would be a good model for the data.
Now, to have the calculator create a cubic function that fits the data. Press � , then � to select the CALC menu, and then select 6:CubicReg for cubic regression. Press � , � , � , � , � , � , � and � . Your screen should look like the screen below on the far right. This will perform the regression on the data in
1L and
2L and
store the equation of the cubic function in 1Y .
The screen to the left shows the general cubic function and the values for a, b, c, and d. It also shows a value for 2
R . This is called the coefficient of determination. This value is useful to determine if the function is a good fit to the data – the closer this value is to 1, the better the function fits the data! Since 2
R is about 0.99898, this shows that the function is a great fit. If your calculator doesn’t show 2
R , refer to the next page.
MCT4C: Unit 2 – Polynomial Functions 31
2.10.1: Modelling Data Using a Graphing Calculator (continued)
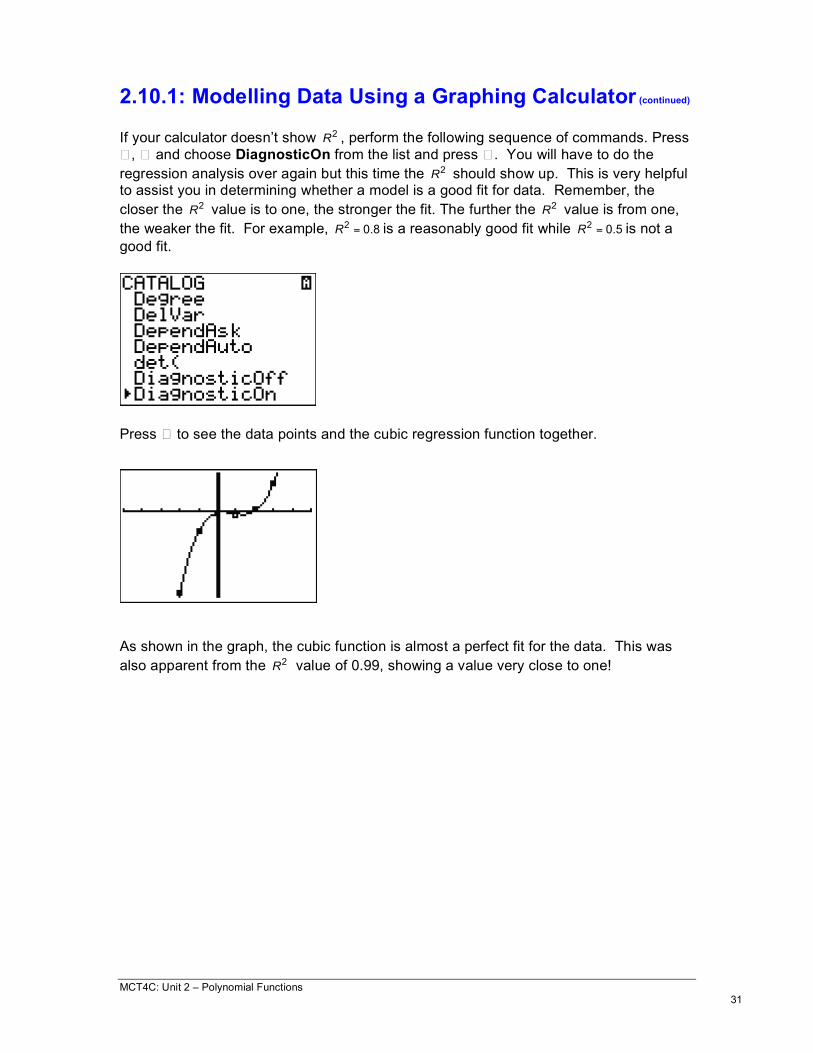
If your calculator doesn’t show 2R , perform the following sequence of commands. Press
� , � and choose DiagnosticOn from the list and press � . You will have to do the regression analysis over again but this time the 2
R should show up. This is very helpful to assist you in determining whether a model is a good fit for data. Remember, the closer the 2
R value is to one, the stronger the fit. The further the 2R value is from one,
the weaker the fit. For example, 8.02=R is a reasonably good fit while 5.0
2=R is not a
good fit.
Press � to see the data points and the cubic regression function together.
As shown in the graph, the cubic function is almost a perfect fit for the data. This was also apparent from the 2
R value of 0.99, showing a value very close to one!
MCT4C: Unit 2 – Polynomial Functions 32
2.10.2: Regression, Regression, Regression
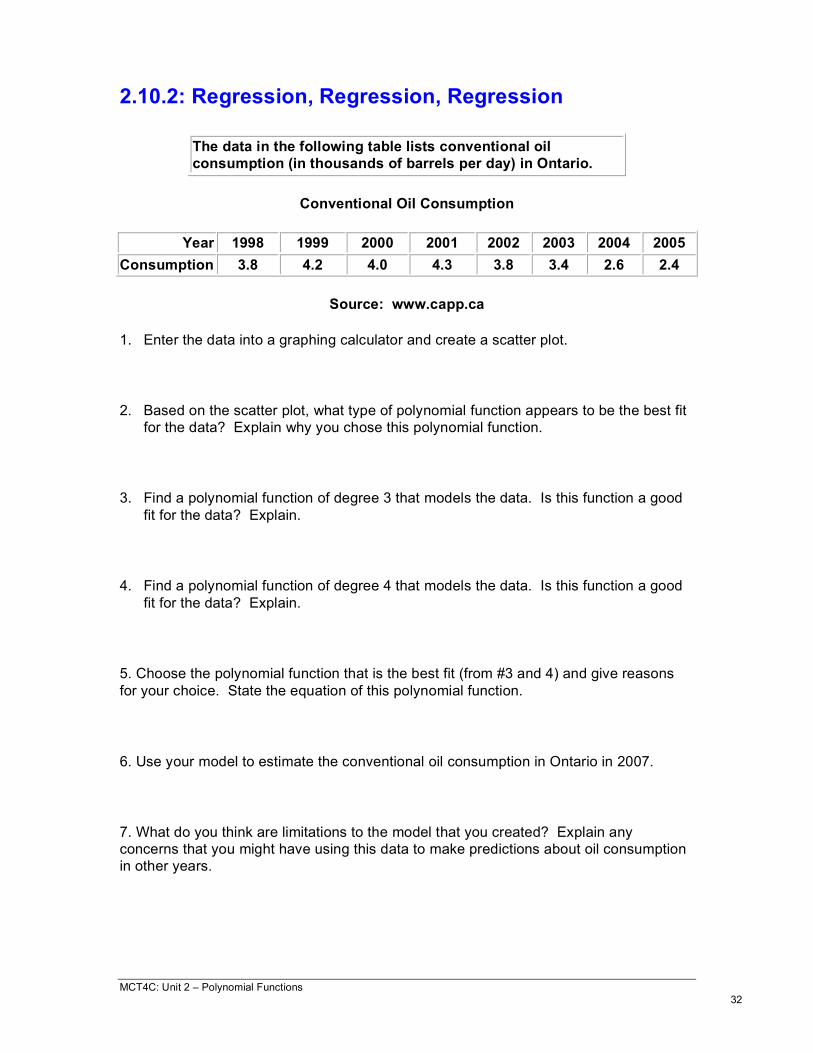
The data in the following table lists conventional oil consumption (in thousands of barrels per day) in Ontario.
Conventional Oil Consumption
Year 1998 1999 2000 2001 2002 2003 2004 2005 Consumption 3.8 4.2 4.0 4.3 3.8 3.4 2.6 2.4
Source: www.capp.ca
1. Enter the data into a graphing calculator and create a scatter plot.
2. Based on the scatter plot, what type of polynomial function appears to be the best fit for the data? Explain why you chose this polynomial function.
3. Find a polynomial function of degree 3 that models the data. Is this function a good fit for the data? Explain.
4. Find a polynomial function of degree 4 that models the data. Is this function a good fit for the data? Explain.
5. Choose the polynomial function that is the best fit (from #3 and 4) and give reasons for your choice. State the equation of this polynomial function.
6. Use your model to estimate the conventional oil consumption in Ontario in 2007.
7. What do you think are limitations to the model that you created? Explain any concerns that you might have using this data to make predictions about oil consumption in other years.
MCT4C: Unit 2 – Polynomial Functions 33
2.10.2: Regression, Regression, Regression (Solutions)
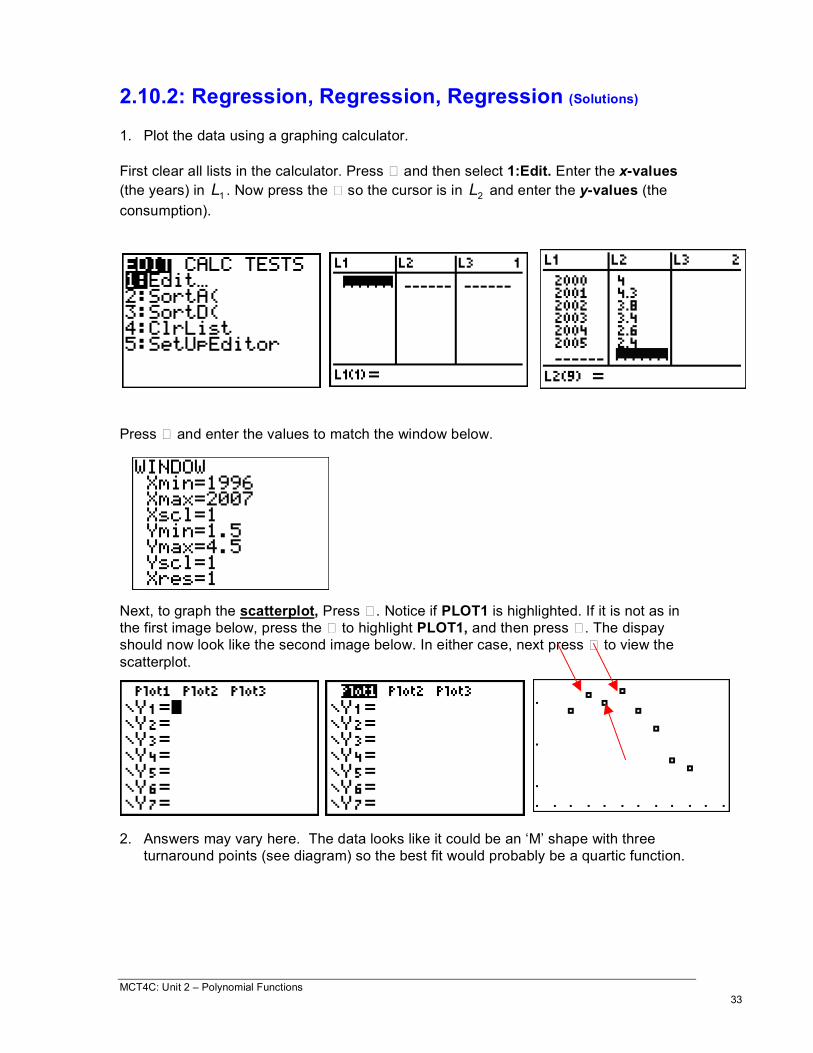
1. Plot the data using a graphing calculator.
First clear all lists in the calculator. Press � and then select 1:Edit. Enter the x-values (the years) in
1L . Now press the � so the cursor is in
2L and enter the y-values (the
consumption).
Press � and enter the values to match the window below.
Next, to graph the scatterplot, Press � . Notice if PLOT1 is highlighted. If it is not as in the first image below, press the � to highlight PLOT1, and then press � . The dispay should now look like the second image below. In either case, next press � to view the scatterplot.
2. Answers may vary here. The data looks like it could be an ‘M’ shape with three turnaround points (see diagram) so the best fit would probably be a quartic function.

MCT4C: Unit 2 – Polynomial Functions 34
2.10.2: Regression, Regression, Regression (Solutions - Continued)
3. Press � , then the � to select the CALC menu, and then select 6:CubicReg for cubic regression. Press � , � , � , � , � , � , � and � . This will perform the regression and store the equation of the cubic function in
1Y . Press � to see the data points
and the cubic function together.
The data is a pretty good fit as shown in the graph, the points are mostly on the curve and by the value of 2
R , it is about 0.95 which is quite close to 1. However, the graph does not match the data for the year 2000, where the production of oil decreased. The graph shows an increase in the year 2000.
MCT4C: Unit 2 – Polynomial Functions 35
2.10.2: Regression, Regression, Regression (Solutions - Continued)
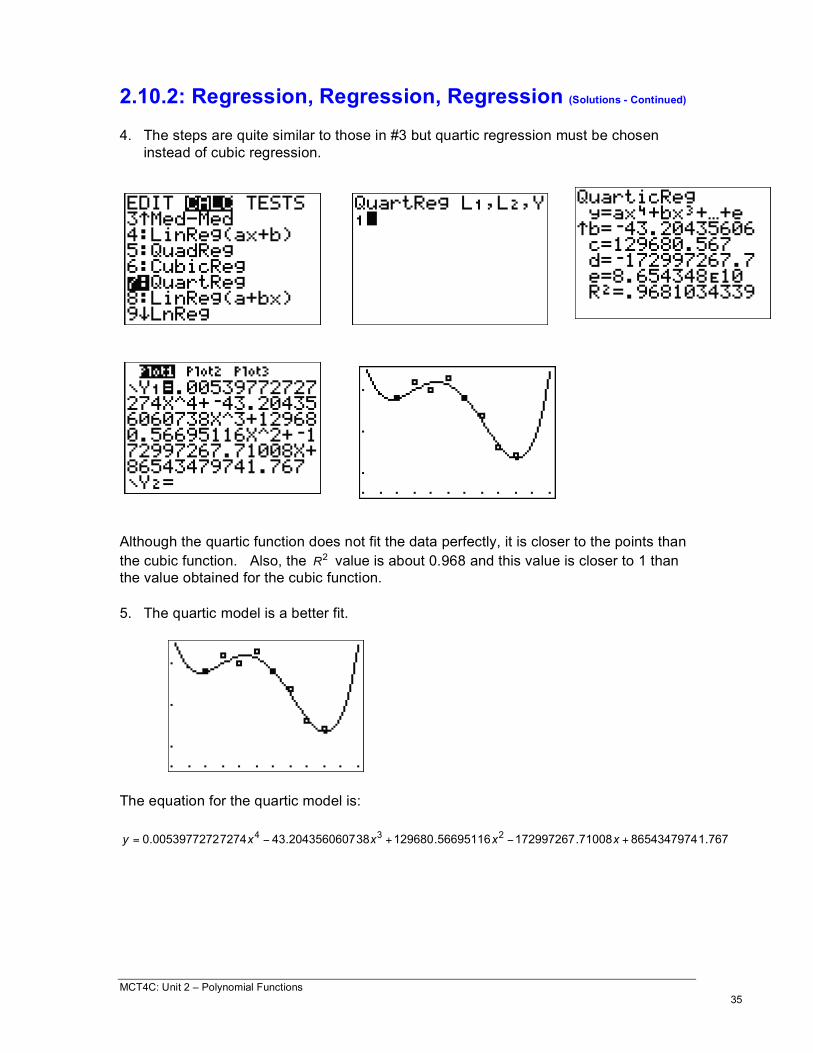
4. The steps are quite similar to those in #3 but quartic regression must be chosen instead of cubic regression.
Although the quartic function does not fit the data perfectly, it is closer to the points than the cubic function. Also, the 2
R value is about 0.968 and this value is closer to 1 than the value obtained for the cubic function.
5. The quartic model is a better fit.
The equation for the quartic model is:
767.1865434797471008.17299726756695116.129680382043560607.4372740053977272.0234
+!+!= xxxxy
MCT4C: Unit 2 – Polynomial Functions 36
2.10.2: Regression, Regression, Regression (Solutions - Continued)
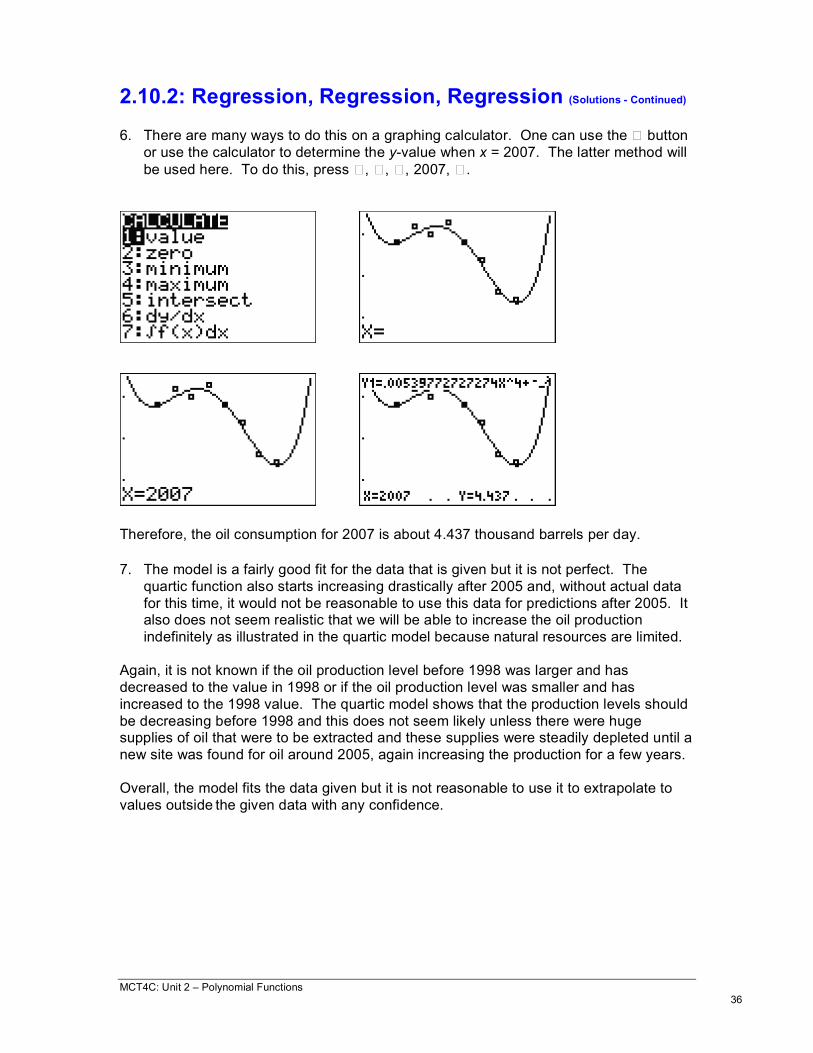
6. There are many ways to do this on a graphing calculator. One can use the � button or use the calculator to determine the y-value when x = 2007. The latter method will be used here. To do this, press � , � , � , 2007, � .
Therefore, the oil consumption for 2007 is about 4.437 thousand barrels per day.
7. The model is a fairly good fit for the data that is given but it is not perfect. The quartic function also starts increasing drastically after 2005 and, without actual data for this time, it would not be reasonable to use this data for predictions after 2005. It also does not seem realistic that we will be able to increase the oil production indefinitely as illustrated in the quartic model because natural resources are limited.
Again, it is not known if the oil production level before 1998 was larger and has decreased to the value in 1998 or if the oil production level was smaller and has increased to the 1998 value. The quartic model shows that the production levels should be decreasing before 1998 and this does not seem likely unless there were huge supplies of oil that were to be extracted and these supplies were steadily depleted until a new site was found for oil around 2005, again increasing the production for a few years. Overall, the model fits the data given but it is not reasonable to use it to extrapolate to values outside the given data with any confidence.