Embed Size (px)
DESCRIPTION
ECOLOGY
Citation preview
UNIT 2 ENVIRONMENTAL COMPONENTS: 1. LIGHT, TEMPERATURE AND ATMOSPHERE
Structure 2.1 Introduction
Objectives 2.2 Light
Electromagnetic Spectrum Solar Energy Input Radiation Instruments Rriodic Variations in Light - Diurnal and Seasonal Light and Distribution Photoperiodism
2.3 Temperature Latitudinal Variations Altitudinal Variations Global Temperature Tmpcrature saes.3 Adaptations
2.4 Atmosphere Composition Saatific#on Ressun '~radient Global Air Circulation Wind
2.5 Summary 2.6 Terminal Questions 2.7 Answers
2.1 INTRODUCTION
In unit 1 we have given you a general introduction to the discipline of Ecology. You have learnt about the environment and its biotic and abiotic components that affect the organisms. This and the following two units deal with some of the abiotic components of the environment and their mutual interaction.
Among the abiotic components a knowledge of physical environmental factors like light, temperature, winds, water, soil etc. is important if we wish to understand the survival, distribution, abundance and adaptability of organisms in different ecosystems of the earth. In this unit, we will describe the solar radiation reaching the earth, its qualitative and quantitative features, temperature and the atmosphere. We will also learn about the instruments used for the measurement of light. Variations in light and heat significantly affect the distribution an$behaviour of biotic communities. Green plants trap sun's energy and convert it to c h e ~ l energy through the process of photosynthesis. In animals, light reception is the t important sensory modality in the exploration of environment. Most animals are z M with light receptors, which to a great extent influence their behaviour.
Organi s are adapted to a certain range of temperature only in which they can survive and re / uce. Plants and animals tolerate extremes of temperature by developing special structural and physiological adaptations or develop special strategies to avoid unfavourable temperature regimes. Wind is yet another important factor which affects the distribution and behaviour of organisms. The importance of wind is especially prominent in case of plants which have special needs to withstand high wind velocity. Some of these adaptations will be briefly discussed in the unit.
We have discussed the abiotic factors separately for the sake of convenience but they seldom operate independently. The discussion that follows in this unit and other units will help you to appreciate their integrated influence on the living organisms and ecosystem processes.
Objectives After reading this unit you should be able to:
Environmental Components : 1. Light, Temperature and
Atmosphere t
differentiate between quality, quantity and duration of light and its importance to various \ . ecosystems and describe instruments used for light measurement, outline global radiation balance and explain variation in light climate in terrestrial and aquatic ecosystem, describe the latitudinal and altitudinal variations in temperature and its influence on the . formation of biomes, describe the composition and stratification of the earth's atmosphere, outline the features of global wind circulation, inversion, monsoon, explain the importance of adaptations in plants and animals to different light conditions and extremes of temperature and wind, use in proper context the terms solar constant, albedo, lux, photoperiodism, adiabatic change, thermoperiodism, cardinal temperatures, homeotherm, poikilotherm, stenotherm and eurytherm, exotherm and endotherm.
2.2 LIGHT
All of us know that the sun is the ultimate source of energy for all activities in our biosphere. The electromagnetic radiations from the sun supply energy which warms up the earth and the atmosphere to provide a favourable global temperature for the living organisms. In addition. light plays a variety of roles in the living world. It is essential for photosynthesis, the process by which light is converted into usable chemical energy. It is involved in the transmission of information, for instance, it helps plants and animals to programme their life cycles. coordinates the opening of buds and flowers, dropping of leaves and a variety of other physiological processes. Variation in theamount of light generally affects the local distribution of plants. In animals light regulates reproduction, hibernation and migration and of course makes vision possible. All these biological phenomena are readily influenced by variation in the intensity, and by seasohal or diurnal variations of light.
I I In the following sections we will discuss briefly the properties of solar radiations, and their global distribution.
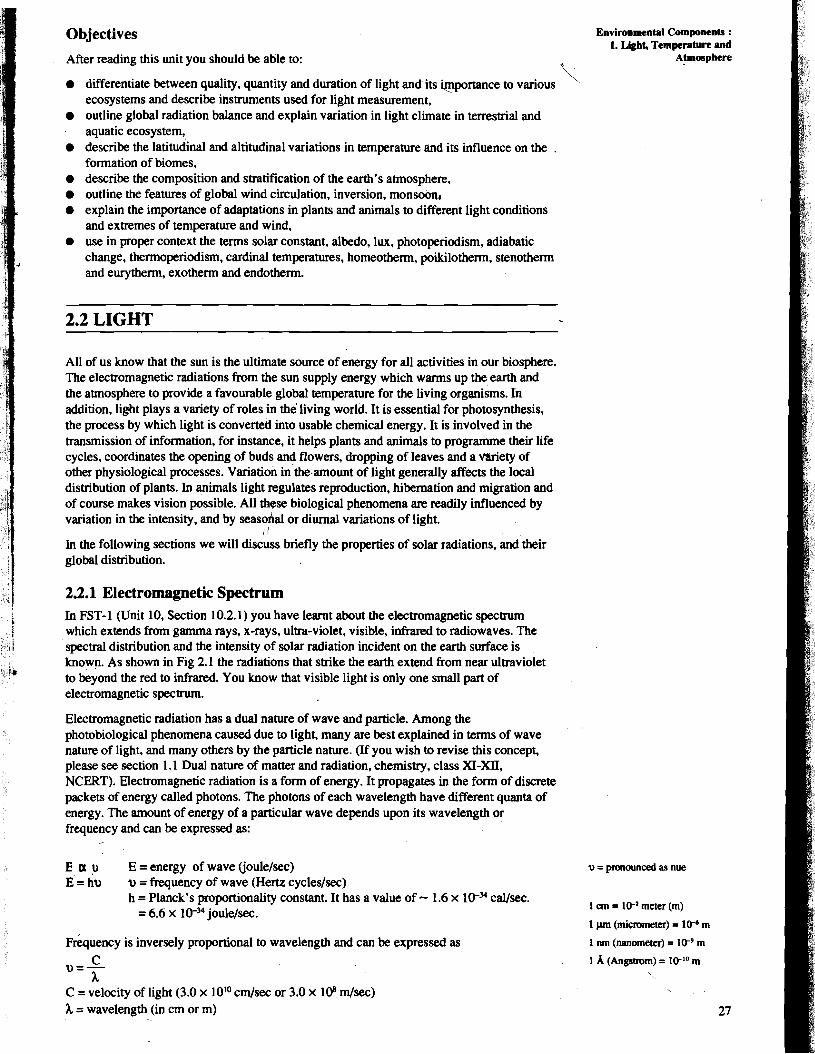
2.2.1 Electromagnetic Spectrum In FST-1 (Unit 10, Section 10.2.1) you have learnt about the electromagnetic spectrum which extends from gamma rays, x-rays, ultra-violet, visible, infrared to radiowaves. The spectral distribution and the intensity of solar radiation incident on the earth surface is known. As shown in Fig 2.1 the radiations that strike the earth extend from near ultraviolet to beyond the red to infrared. You know that visible light is only one small part of electromagnetic spectrum.
Electromagnetic radiation has a dual nature of wave and particle. Among the photobiological phenomena caused due to light, many are best explained in terms of wave nature of light, and many others by the particle nature. (If you wish to revise this concept, please see section 1.1 Dual nature of matter and radiation, chemistry, class XI-XU, NCERT). Electromagnetic radiation is a form of energy. It propagates in the form of discrete packets of energy called photons. The photons of each wavelength have different quanta of energy. The amount of energy of a particular wave depends upon its wavelength or frequency and can be expressed as:
,
a o E = energy of wave (joulelsec) = hu u = frequency of wave (Hertz cycleslsec)
h = Planck's proportionality constant. It has a value of - 1.6 x lVW callsec. = 6.6 x 10⁻³⁴ joulelsec.
~ r k ~ u e n c ~ is inversely proportional to wavelength and can be expressed as
h C = velocity of light (3.0 x 101° cm/sec or 3.0 x 10⁸, m/sec) A. = wavelength (in cm or m)
u = pronounced as nue
1 cm = lVa meter (m)
1 nm (nanometer) = lV9 m
1 A (Angstrom) = lVIO m
Environment and its Components
Tbelnmunqemponds m wavu in the mge of 400 mn to 700 mn. 'Ihese waves produce vision ud are d l + viribklighrOuryeirmcrro rarritivetoSS5m., . Pbotorymhesi~ needs cnsgy of wavelengthr roughly compunble to thpt of visible lighL
Red light is low mergy wave with deep pen~rability. %at i s why red signals are used for mad lights.
Look at the visibleregion of electromagnetic spectrum in Fig 2.1. The varying wavelengths of visible light are perceived as different colours. Blue light has shorter wavelength, relatively higher frequency and high energy than red light which has higher wavelength ~elatively lower frequency and lower energy. .As indicated earlier, visible light has a spectrum of colours and each colour has a Specific range of wavelengths. Scientists use special colour filters to obtain fight of a particular wavelength and study its effect on the various biological 'processes and behaviour of the organisms. . . The radiations whichaffect the photobiological phenoinena lie between 300 nm and 900.nm. In Fig 2.1 you will see the region af u l h vjokt, visible and infrared regions and the photobiological phenomena' caused by them. You may spend sometime studying this figure. Before ~ a d i n g the next section we would like you to cmpleu tk foilowing SAQ. YOU m y fmd it useful to consult the gloss& to remind yourself of some of these photobiblogical phenomena.
4
,Photosynfi&i$
Phototropism
Phototaxis
I Photoperiodism
.vision
Chlorophyll Synthesis
.Nudei Aadw and Protein
Fig 2.1 : Electromagnetk spectrum of solar radiation8 and the regions effective for photobiologial phenomena.
2.2.2 Solar Energy .Input' ' . . We have mentioned earlier that the spectral distribution and the intensity of solar radiation incident on the earth's surface are known. Of the enormous'amount of energy that is radiated by the sun (5.6 x l P 7 callmin), enly.about one-half of 1 billionth of that amount is intercepted by the eafth. Not all the solar.radiation can penetrate the earth's atmosphere; however, the amount of solar energy received at the top of atmosphere is constant. This
. energy isrefined to as solar constaqt. It is defined as the rate at which solar radiation falls on a unit area is a plane surface, which is oriented peqiendicular to the solar beam, when the earth is at its mean distance from the sun. Qn an aietage the value of solar constant is 2 cal/ om2/min.
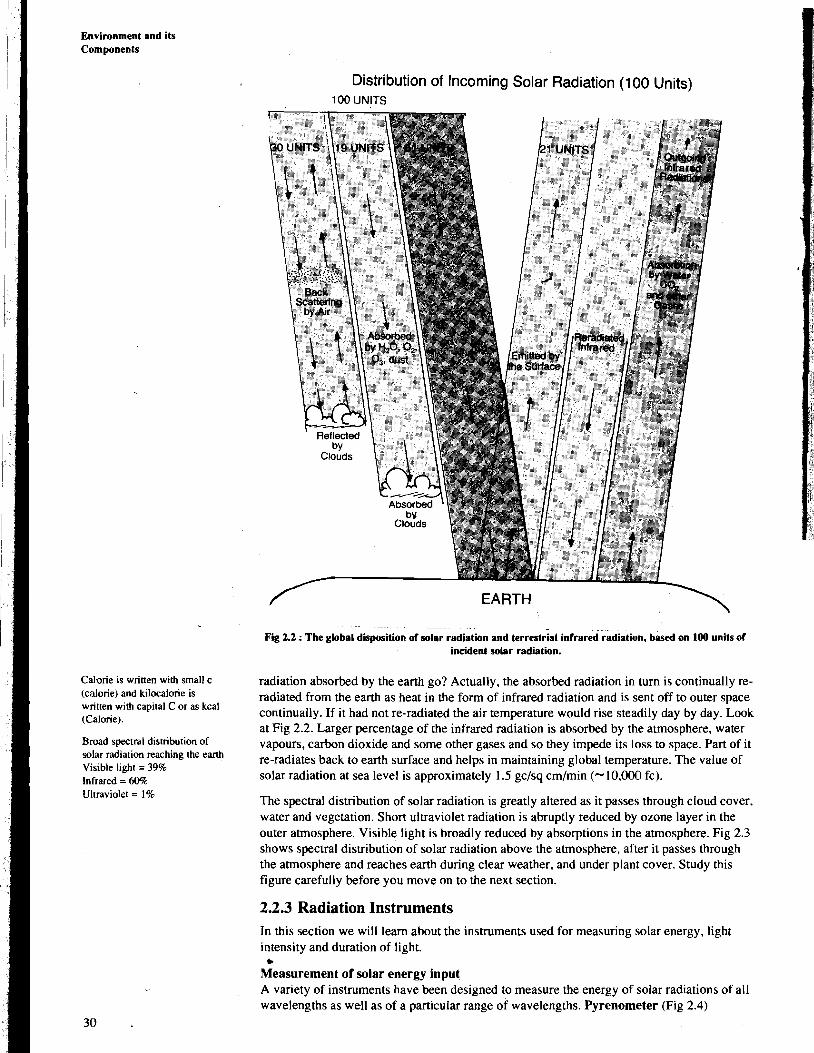
As the solar radiation &vels through the atmosphep it interkts wi& it k d gets diminished in three different ways: by reflection, scamring and absorption. Fig 2.2 shows the result of .interaction of 100 units of solar radiation with earthand atmosphere. About 30% of the total incoming solar radiation is reflected by clouds and a portion of it is back-scattered and lost in space. About 19% of it is directly absprbed by oxygen, ozone, water, ice crystals and suspended particles.'This absorbed radiation is converted into heat energy and the air is warmed to some extent. The remaining 5 1 % is absorbed or reflected by earth's surface that is converted to heat. Thus a total of 70% (19% by atmosphere aid 5 1% by earth) of the radiation absorbed by e m and atmosphere is involved in the functioning of our biosphere.
The earth has a variety of surfaces - rough, smooth, ice-covered, .or water-covered and areas with differeht types of vegetation. The amount of radiation absorbed or reflected depends upon the nat% of surface. features i.e. topography of the area. The percentage of reflectivity of the incident radiation in mete'orology is called albedo, which is
Reflected radiation Albedo = x lo0
Incident radiation
Albedo of snow covered landscapes is higher than vegetated landscape or water column. Freshly fallen.sn6w typically has an albedo between 75 to 95%. Ocean waters have low albedo and therefore they appear darker thw the adjacent continental land masses. Rough surfaces have low albedo than smooth surfaces. Also the light coloured surfaces reflect more thandark surfaces. Reflectivity also depends upon the angle of incident radiation. The surfaces that are less peGndicu1ar to *e sun's rays are more reflective than surfaces that make almost a right angle with the incoming solar radiation.
We have learnt that earth and atmosphere receive solar radiation, absorb a part of it and get warmed up. We also know that during night earth cools down. So where does the energy ~f
Environmental Components : . 1. Light, Temperature and
Atmosphere The present unit used for measuring energy is pulefrnehel sec. 4.18 Joule (I) = 1 calorie (c) = 4.187 x lo7 erg Watt =
, ~ouldsec.
The blue colour of the sky is due to the scattering of the blue portion of visible sunlight by nitrogen and oxygen molecules present in the earth's atmosphere.
Environment and its Components
Calgorie is written with small c (calorie) and kilocalorie is written with capital C or as kcal (Calorie).
Broad spectral distribution of solar radiation reaching the earth Visible light = 39% Infrared = 60% Ultraviolet = 1%
Distribl~tion of Incoming Solar Radiation (100 Units) 100 UNITS
EARTH
---
Fig 2.2 : The global disposition of solar radiation and terrestrial infrared radiation, based on 100 units of incident solar radiation.
radiation absorbed by the earth go? Actually, the absorbed radiation in turn is continually re- radiated from the earth as heat in the form of infrared radiation and is sent off to outer space continually. If it had not re-radiated the air temperature would rise steadily day by day. Look at Fig 2.2. Larger percentage of the infrared radiation is absorbed by the atmosphere, water vapours, carbon dioxide and some other gases and so they impede its loss to space. Part of it re-radiates back to earth surface and helps in maintaining global temperature. The value of solar radiation at sea level is approximately 1.5 gc/sq cm/min (-10,000 fc).
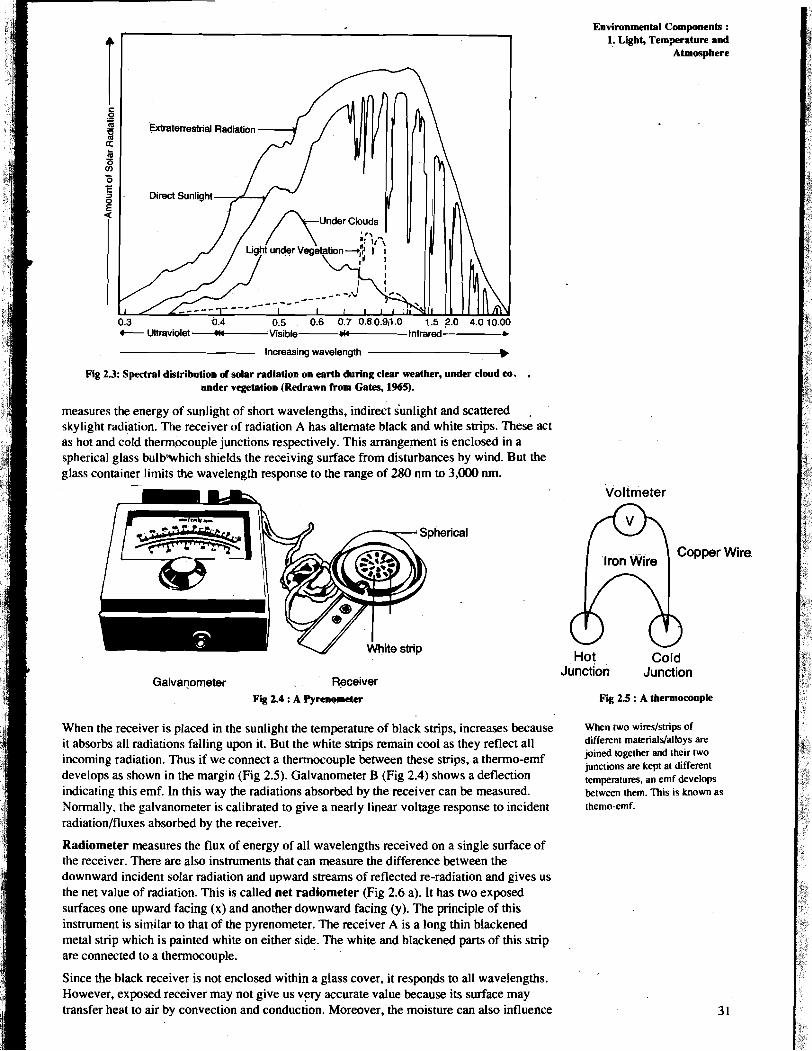
The spectral distribution of solar radiation is greatly altered as it passes through cloud cover, water and vegetation. Short ultraviolet radiation is abruptly reduced by ozone layer in the outer atmosphere. Visible light is broadly reduced by absorptions in the atmosphere. Fig 2.3 shows spectral distribution of solar radiation above the atmosphere, after it passes through the atmosphere and reaches earth during clear weather, and under plant cover. Study this figure carefully before you move on to the next section.
2.2.3 Radiation Instruments In this section we will learn about the instruments used for measuring solar energy, light intensity and duration of light.
Measurement of solar energy input A variety of instruments have been designed to measure the energy of solar radiations of all wavelengths as well as of a particular range of wavelengths. Pyrenometer (Fig 2.4)
Environmental Components : 1. Light, Temperature and
Atmosphere
I s .- - m o Extraterrestrial Radiation m
; - 3: - 0 - a E a
0.3 0.4 0.5 0.6 0.7 0.80.9P.O 1.5 2.0 4.0 10.00 t Ulmviolet Visible d- - Infrared-
Increasing wavelength b
Fig 2.3 Spectral distribution of solar radiation on earth during clear weather, under cloud eo; , under vegetation (Redrawn from Gates, 1%5).
measures the energy of sunlight of short wavelengths, indirect sunlight and scatrered . skylight radiation. The receiver of radiation A has alternate black and white strips. These act as hot and cold thermwouple junctions respectively. This arrangement is enclosed in a spherical glass bulbwhich shields the receiving surface from disturbances by wind. But the glass container limits the wavelength response to the range of 280 nm to 3,000 nm.
voltmeter
Wire.
Galvanometer . . ' Receiver Fq 2.4 : A Pyrencyneter
When the receiver is placed in the sunlight the temperature of black strips, increases because it absorbs all radiations falling upon it. But the white strips remain cool as they reflect all incoming radiation. Thus if we connect a thermocouple between these ships, a thermo-emf develops as shown in the margin (Fig 2.5). Galvanometer B (Fig 2.4) shows a deflection indicating this emf. In this way the radiations absorbed by the receiver can be measured. Normally. the galvanometer is calibrated to give a nearly linear voltage response to incident radiationlfluxes absorbed by the receiver.
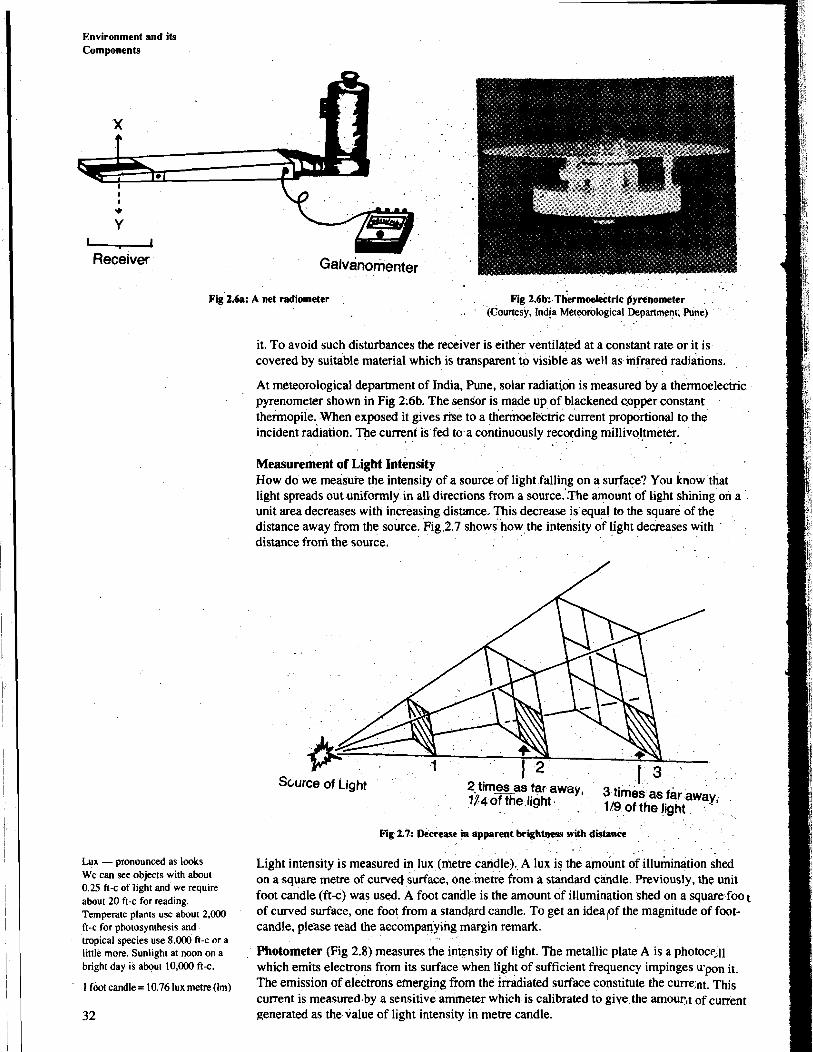
Radiometer measures the flux of energy of all wavelengths received on a single surface of the receiver. There are also instruments that can measure the difference between the downward incident solar radiation and upward streams of reflected re-radiation and gives us the net value of radiation. This is called net radiometer (Fig 2.6 a). It has two exposed surfaces one upward facing (x) and another downward facing (y). The principle of this instrument is similar to that of the pyrenometer. The receiver A is a long thin blackened metal strip which is painted white on either side. The white and blackened parts of this strip are connected to a thermocouple.
Since the black receiver is not enclosed within a glass cover, it responds to all wavelengths. However, exposed receiver may not give us very accurate value because its surface may transfer heat to air by convection and conduction. Moreover, the moisture can also influence
Hot Cold Junction Junction
Fig 2.5 : A thermocouple
When two wiredstrips of different materials/alloys are pined together and their two junctions are kept at different temperatures. an emf develops between them. This is known as themo-emf.
Environment and its Components
u Receiver Galvanomenter
. . Fig 2.h: A net radiometer Fig 2.6b: ~hermoektric pyrenometer
. (Cburtesy. lndja Meteorological Department, Pune)
it. To avoid such disturbances tbe receiver is either ventilated at a constant rate or it is covered by suitable material which is transparent to visible as well as infrared radiations.
At meteorological depamnent of India, Punc, solar radiation is measured by a thermoelectric pyrenometer shown in Fig 2.6b. The sensor is made up of blackened c,opper constant thermopile. When exposed it gives rise to a thermoel'ectric current proportional to the incident radiation. The current is fed to a continuously recording millivoltmeter. . .
Measurement of Light Intensity How do we measure the intensity of a source of light falling on a surface? You know that light spreads out uniformly in all directions from a source.'.The amount of light shining on a unit area decreases with increasing distance, This decrease is equal to the square of the distance away from the source. Fig.2.7 shows how the intensity of light decreases with distance from the source.
Lux - pronounced as looks We can see objects with about 0.25 ft-c of light and we require about 20 ft-c for reading. Temperate plants use about 2,000 ft-c for photosynthesis and tropical species use 8,000 ft-c or a little more. Sunlight atnoon on a bright day is about 10,000 ft-c.
1 fbot candle = 10.76 lux metre (lm)
Fig 2.7: Decrease in apparent bright~ess with distance
Light intensity is measured in lux (metre candle). A lux is the amount of illumination shed on a square metre of cutved surface, one metre from a standard candle. Previously, the unlt foot candle (ftc) was used. A foot candle is the amount of illumination shed on a square foot of curved surface, one foot from a standard candle. To get an idealof the magnitude of foot- candle, please read the accompanying margin remark.
Photometer (Fig 2.8) measures the intensity of light. The metallic plate A is a photoc~~11 which emits electrons from its surface when light of sufficient frequency impinges Wpon it. The emission of electrons emerging from the irradiated surface constitute the curre:nt. This current is measured by a sensitive ammeter which is calibrated to give the amour,t of current generated as the value of light intensity in metre candle.
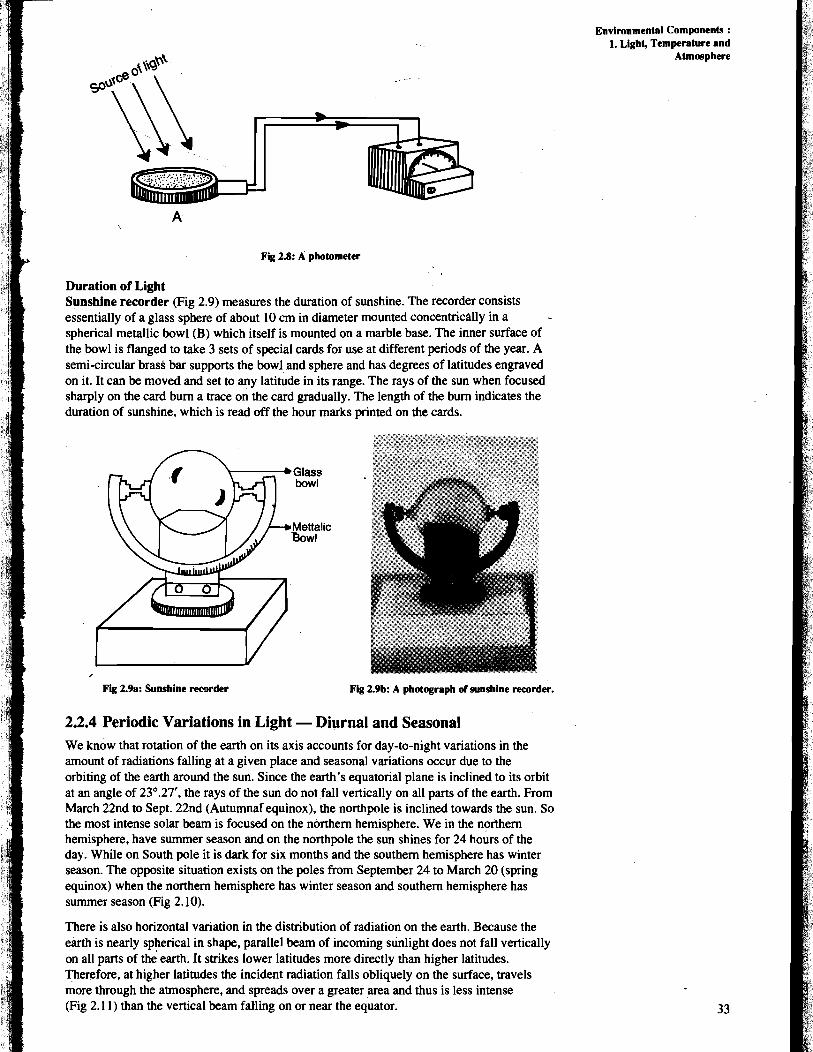
Fig 2.8: A photometer
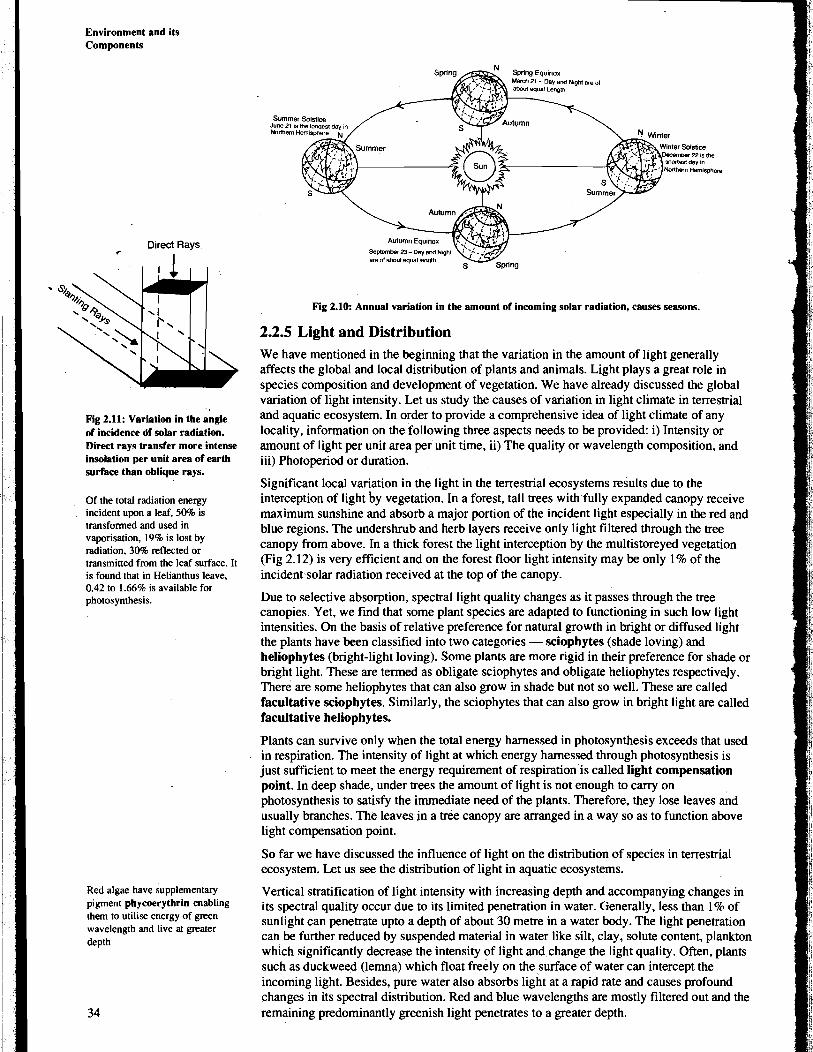
Duration of Light Sunshine recorder (Fig 2.9) measures the duration of sunshine. The recorder consists essentially of a glass sphere of about 10 cm in diameter mounted concentrically in a - spherical metallic bowl (B) which itself is mounted on a marble base. The inner surface of the bowl is flanged to take 3 sets of special cards for use at different periods of the year. A semi-circular brass bar supports the bowl and sphere and has degrees of latitudes engraved on it. It can be moved and set to any latitude in its range. The rays of the sun when focused sharply on the card bum a trace on the card gradually. The length of the burn indicates the duration of sunshine. which is read off the hour marks printed on the cards.
Fig 2.9a: Sunshine recorder Fig 2.9b: A photograph of sunshine recorder.
2.2.4 Periodic Variations in Light - Diurnal and Seasonal We know that rotation of the earth on its axis accounts for day-to-night variations in the amount of radiations falling at a given place and seasonal variations occur due to the orbiting of the earth around the sun. Since the earth's equatorial plane is inclined to its orbit at an angle of 23O.27'. the rays of the sun do not fall vertically on all parts of the earth. From March 22nd to Sept. 22nd (AutumnaTequinox), the northpole is inclined towards the sun. So the most intense solar beam is focused on the northern hemisphere. We in the northern hemisphere, have summer season and on the northpole the sun shines for 24 hours of the day. While on South pole it is dark for six months and the southern hemisphere has winter season. The opposite situation exists on the poles from September 24 to March 20 (spring equinox) when the northern hemisphere has winter season and southern hemisphere has summer season (Fig 2.10).
There is also horizontal variation in the distribution of radiation on the earth. Because the earth is nearly spherical in shape, parallel beam of incoming sunlight does not fall vertically on all parts of the earth. It strikes lower latitudes more directly than higher latitudes. Therefore, at higher latitudes the incident radiation falls obliquely on the surface, travels more through the atmosphere, and spreads over a greater area and thus is less intense (Fig 2.1 1) than the vertical beam falling on or near the equator.
Environmental Componenh : 1. Light, Temperature and
Atmosphere
Environment and its Components
Direct Rays C
I
Fig 2.11: Variation in the angle of incidence df solar radiation. Direct rays transfer more intense insolation per unit area of earth surface than oblique rays.
Of the total radiation energy incident upon a leaf, 5040 is transformed and used in vaporisation, 19% is lost by radiation, 30% reflected or transmitted from the leaf surface. It is found that in Helianthus leave, 0.42 to 1.66% is available for photosynthesis.
Red algae have supplementary pigment phycoerythrin enabling them to utilise energy of green wavelength and live at greater depth
Nathan Hernosphere
September 23 -Day and Nlghl are of a b u t equal lenqm.
Fig 2.10: Annual variation in the amount of incoming solar radiation, causes seasons.
2.2.5 Light and Distribution We have mentioned in the beginning that the variation in the amount of light generally affects the global and local distribution of plants and animals. Light plays a great role in species composition and development of vegetation. We have already discussed the global variation of light intensity. Let us study the causes of variation in light climate in terrestrial and aquatic ecosystem. In order to provide a comprehensive idea of light climate of any locality, information on the following three aspects needs to be provided: i) Intensity or amount of light per unit area per unit time, ii) The quality or wavelength composition, and iii) Photoperiod or duration.
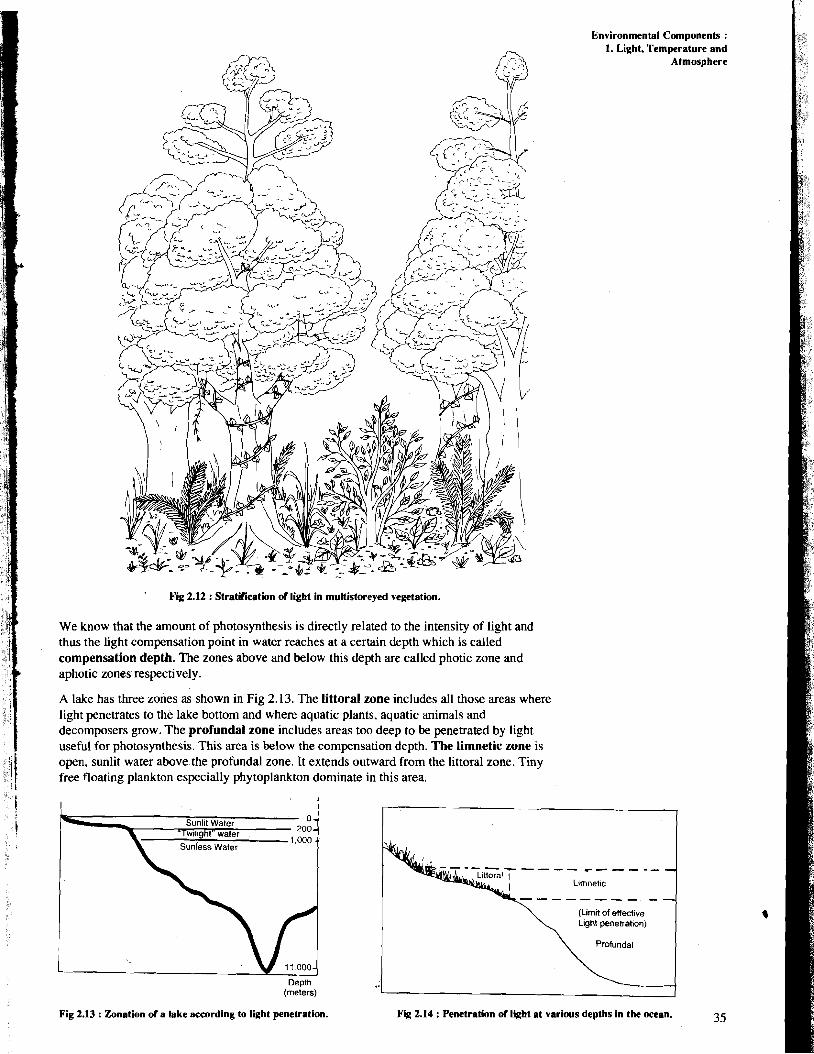
Significant local variation in the light in the terrestrial ecosystems results due to the interception of light by vegetation. In a forest, tall trees with fully expanded canopy receive maximum sunshine and absorb a major portion of the incident light especially in the red and blue regions. The undershrub and herb layers receive only light filtered through the tree canopy from above. In a thick forest the light interception by the multistoreyed vegetation (Fig 2.12) is very efficient and on the forest floor light intensity may be only 1% of the incident solar radiation received at the top of the canopy.
Due to selective absorption, spectral light quality changes as it passes through the tree canopies. Yet, we find that some plant species are adapted to functioning in such low light intensities. On the basis of relative preference for natural growth in bright or diffused light the plants have been classified into two categories - sciophytes (shade loving) and heliophytes (bright-light loving). Some plants are more rigid in their preference for shade or bright light. These are termed as obligate sciophytes and obligate heliophytes respectively. There are some heliophytes that can also grow in shade but not so well. These are called facultative sciophytes. Similarly, the sciophytes that can also grow in bright light are called facultative heliophytes.
Plants can survive only when the total energy harnessed in photosynthesis exceeds that used in respiration. The intensity of light at which energy harnessed through photosynthesis is just sufficient to meet the energy requirement of respiration is called light compensation point. In deep shade, under trees the amount of light is not enough to carry on photosynthesis to satisfy the immediate need of the plants. Therefore, they lose leaves and usually branches. The leaves in a tree canopy are arranged in a way so as to function above light compensation point.
So far we have discussed the influence of light on the distribution of species in terrestrial ecosystem. Let us see the distribution of light in aquatic ecosystems.
Vertical stratification of light intensity with increasing depth and accompanying changes in its spectral quality occur due to its limited penetration in water. Generally, less than 1% of sunlight can penetrate upto a depth of about 30 metre in a water body. The light penetration can be further reduced by suspended material in water like silt, clay, solute content, plankton which significantly decrease the intensity of light and change the light quality. Often, plants such as duckweed (lernna) which float freely on thesurface of water can intercept the incoming light. Besides, pure water also absorbs light at a rapid rate and causes profound changes in its spectral distribution. Red and blue wavelengths are mostly filtered out and the remaining predominantly greenish light penetrates to a greater depth.
Environmental Components : I. Light, Temperature and
Atmosphere
Fig 2.12 : Stratification of light in multistoreyed vegetation.
We know that the amount of photosynthesis is directly related to the intensity of light and thus the light compensation point in water reaches at a certain depth which is called compensation depth. The zones above and below this depth are called photic zone and aphotic zones respectively.
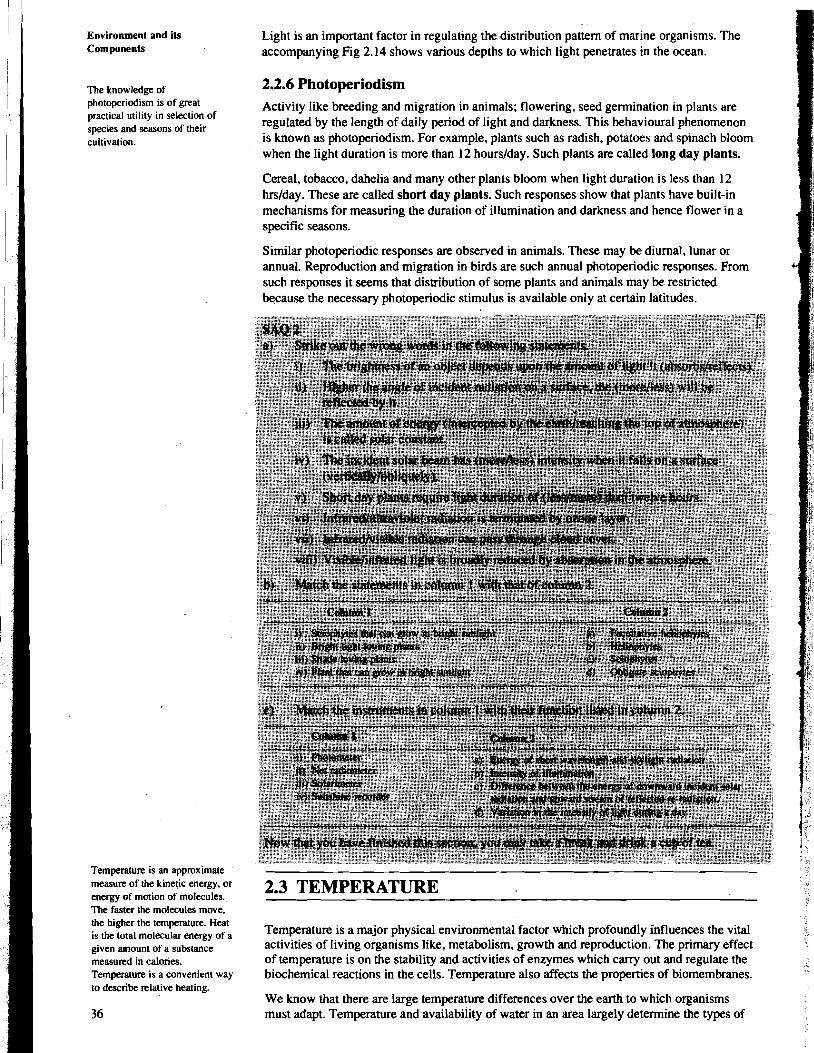
A lake has three zones as shown in Fig 2.13. The littoral zone includes all those areas where light penetrates to the lake bottom and where aquatic plants, aquatic animals and decomposers grow. The profundal zone includes areas too deep to be penetrated by light useful for photosynthesis. This area is below the compensation depth. The limnetic zone is open, sunlit water above the profundal zone. It extends outward from the littoral zone. Tiny free floating plankton especially phytoplankton dominate in this area.
I
"Tw~l~ght" water 200- 1 000 . Sunless Water
Depth (meters)
Fig 2.13 : Zonation of a lake according to light penetration.
(Limit of effective Light penetration)
Profundal
L 1 Fig 2.14 : Penetration d light at various depths in the ocean. 35
Environment and its Components
The knowledge of photoperiodism is of great practical utility in selection of species and seasons of their cultivation.
Temperature is an approximate measure of the kinetic energy, or energy of motion of molecules. The faster the molecules move, the higher the temperature. Heat is the total molecular energy of a given amount of a substance measured in calories. Temperature is a convenient way to describe relative heating.
Light is an important factor in regulating the distribution pattern of marine organisms. The accompanying Fig 2.14 shows various depths to which light penetrates in the ocean.
2.2.6 Photoperiodism Activity like breeding and migration in animals; flowering, seed germination in plants are regulated by the length of daily period of light and darkness. This behavioural phenomenon is known as photoperiodism. For example, plants such as radish, potatoes and spinach bloom when the light duration is more than 12 hourslday. Such plants are called long day plants.
Cereal, tobacco, dahelia and many other plants bloom when light duration is less than 12 hrslday. These are called short day plants. Such responses show that plants have built-in mechanisms for measuring the duration of illumination and darkness and hence flower in a specific seasons.
Similar photoperiodic responses are observed in animals. These may be diurnal, lunar or annual. Reproduction and migration in birds are such annual photoperiodic responses. From such responses it seems that distribution of some plants and animals may be restricted because the necessary photoperiodic stimulus is available only at certain latitudes.
2.3 TEMPERATURE
Temperature is a major physical environmental factor which profoundly influences the vital activities of living organisms like, metabolism, growth and reproduction. The primary effect of temperature is on the stability and activities of enzymes which carry out and regulate the biochemical reactions in the cells. Temperature also affects the properties of biomembranes.
We know that there are large temperature differences over the earth to which organisms must adapt. Temperature and availability of water in an area largely determine the types of
plants and animals that can grow, survive and reprduce there. Every organism has a certain range of tolerance for temperature delineated by an upper and lower lethal temperature, which vary from species to species. Thus, temperature is one of the factors that limit the geographical distributions of plants and animals. Temperature also indirectly influences the availability of water which itself is an important ecological factor. Before we describe the adaptations in organisms due to temperature stress let us discuss the temperature variation at different latitudes and altitudes and examine the global picture of temperature.
2.3.1 Latitudinal Variations The latitudinal variation of temperature over the earth is the result of two main variables
i i) incoming solar radiation and
ii) the distribution of land and water masses
What do you think could be the other factors influencing temperature?
The movement of wind and water, and the direction of slopes of hills and mountains also modify the temperature.
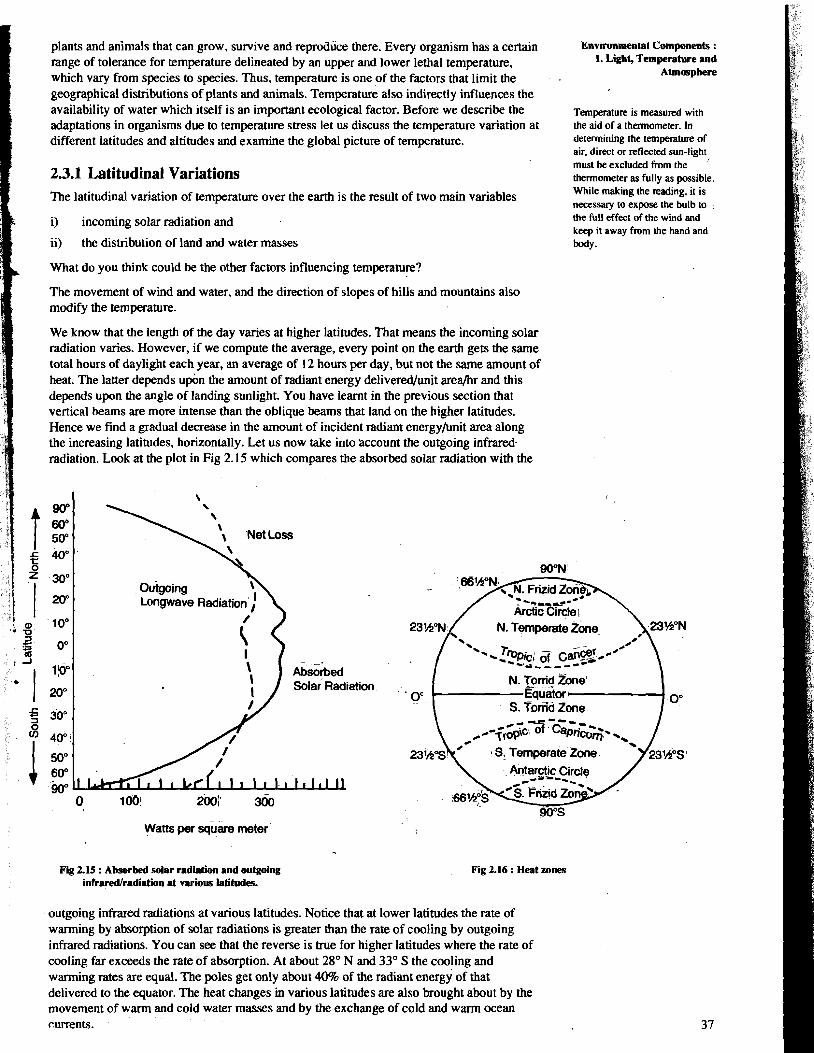
We know that the length of the day varies at higher latitudes. That means the incoming solar radiation varies. However, if we compute the average, every point on the earth gets the same total hours of daylight each year, an average of 12 hours per day, but not the same amount of heat. The latter depends upbn the amount of radiant energy delivered/unit area/hr and this depends upon the angle of landing sunlight. You have learnt in the previous section that vertical beams afe more intense than the oblique beams that land on the higher latitudes. Hence we find a gradual decrease in the amount of incident radiant energytunit area along the increasing latitudes, horizontally. Let us now take into account the outgoing infrared-
I radiation. Look at the plot in Fig 2.15 which compares the absorbed solar radiation with the
1!o0
20" Solar Radiation
300
40"
0 2001' 300
Envmmmental Components : 1. Light, Temperature and
Atmosphere
Temperature is measured with the aid of a thermometer. In determining the temperature of air. direct or reflected sun-light must be excluded from the ' thermometer as fully as possible. While making the d i n g , it is necessary to expose the bulb to the full effect of the wind and keep it away from the hand and body.
Watts per square meter
Fig 2.15 : Absorbed solar radiition and outgoing infraredlradiation at variow latitudes.
Arctic Circle i N. Temperate zbne
'-* - :?piCi a ca6&f0- -,a--- -0s-
N. Torrid Zone' '0.
S. Tomd Zone
t S. Temperate Zone
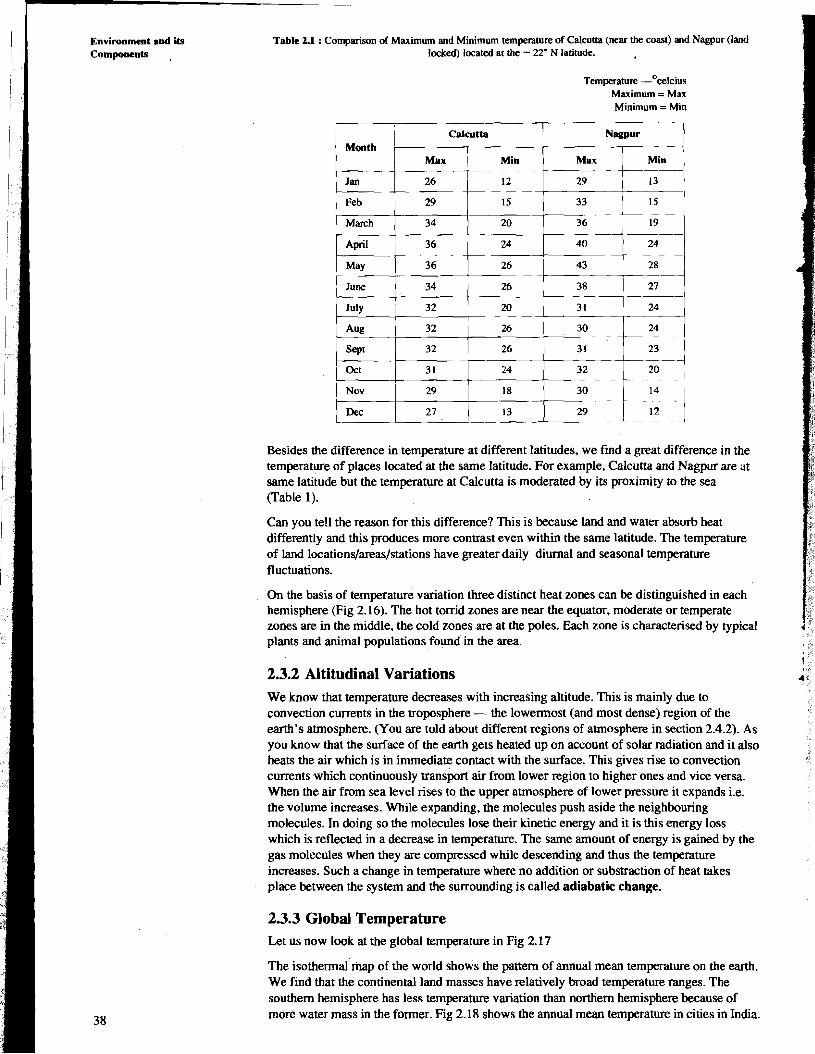
Fig 2.16 : Heat zones
outgoing infrared radiations at various latitudes. Notice that at lower latitudes the rate of warming by absorption of solar radiations is greater than the rate of cooling by outgoing infrared radiations. You can see that thireverse is true for higher latitudes where the rate of cooling far exceeds the rate of absorption. At about 28" N and 33" S the cooling and warming rates are equal. The poles get only about 40% of the radiant energy of that delivered to the equator. The heat changes in various latitudes are also brought about by the movement of warm and cold water masses and by the exchange of cold and warm ocean currents.
Environment and its Components .
Table 2.1 : Comparison of Maximum and Minimum temperature of Calcutta (near the coast) and Nagpur (land locked) located at the - 22' N latitude.
Temperature -Ocelcius Maximum = Max Minimum = Min
Calcutta Month
Feb 29 15 33 15
March 34 20 36 19 --
April 36 24 40 24
May 36 26 43 28
June 34 26 38 27 I
July 1 32 20 3 1 24
Besides the difference in temperature at different latitudes, we find a great difference in the temperature of places located at the same latitude. For example, Calcutta and Nagpur are at same latitude but the temperature at Calcutta is moderated by its proximity to the sea (Table 1).
Can you te!l the reason for this difference? This is because land and water absorb heat differently and this produces more contrast even within the same latitude. The temperature of land locations/areas/stations have greater daily diurnal and seasonal temperature fluctuations.
On the basis of temperature variation three distinct heat zones can be distinguished in each hemisphere (Fig 2.16). The hot torrid zones are near the equator. moderate or temperate zones are in the middle, the cold zones are at the poles. Each zone is characterised by typical plants and animal populations found in the area.
2.3.2 Altitudinal Variations We know that temperature decreases with increasing altitude. This is mainly due to convection currents in the troposphere - the lowermost (and most dense) region of the earth's atmosphere. (You are told about different regions of atmosphere in section 2.4.2). As you know that the surface of the earth gets heated up on account of solar radiation and it also heats the air which is in immediate contact with the surface. This gives rise to convection currents which continuously transport air from lower region to higher ones and vice versa. When the air from sea level rises to the upper atmosphere of lower pressure it expands i.e. the volume increases. While expanding, the molecules push aside the neighbouring molecules. In doing so the molecules lose their kinetic energy and it is this energy loss which is reflected in a decrease in temperature. The same amount of energy is gained by the gas molecules when they are compressed while descending and thus the temperature increases. Such a change in temperature where no addition or substraction of heat takes place between the system and the surrounding is called adiabatic change.
2.3.3 Global Temperature Let us now look at the global temperature in Fig 2.17
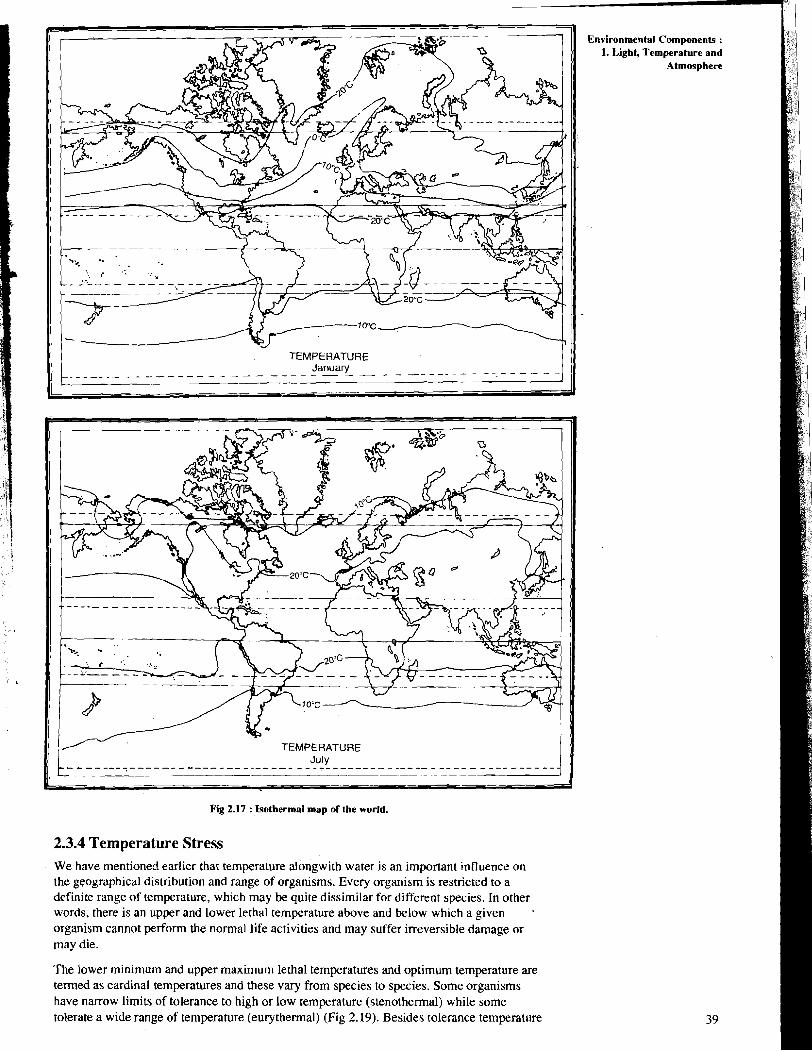
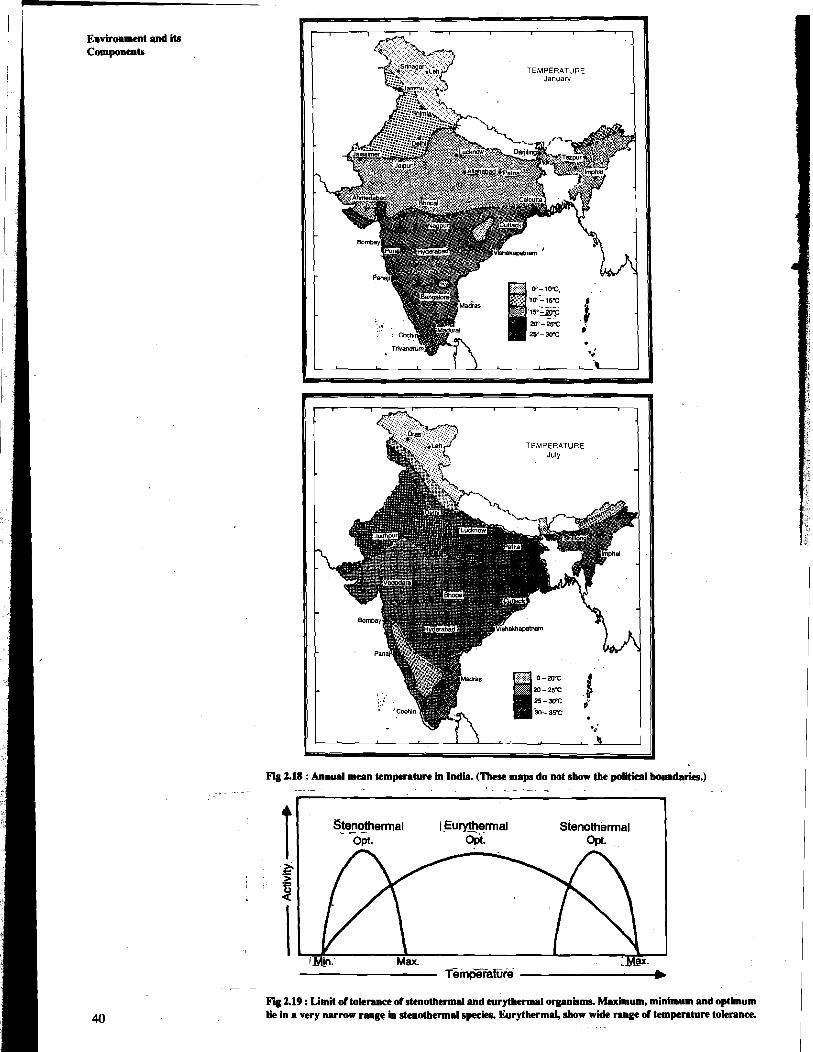
The isothermal map of the world shows the pattern of annual mean temperature on the earth. We find that the continental land masses have relatively broad temperature ranges. The southern hemisphere has less temperature variation than northern hemisphere because of more water mass in the former. Fig 2.18 shows the annual mean temperature in cities in India.
TEMPERATURE
- -
TEMPERATURE
Fig 2.17 : Isothermal map of the world.
2.3.4 Temperature Stress We have mentioned earlier that temperature alongwith water is an important influence on the geographical distribution and range of organisms. Every organism is restricted to a definite range of temperature, which may be quite dissimilar for different species. In other words, there is an upper and lower lethal temperature above and below which a given - organism cannot perform the normal life activities and may suffer irreversible damage or may die.
The lower minimum and upper maximum lethal temperatures and optimum temperature are termed as cardinal temperatures and these vary from species to species. Some organisms have narrow limits of tolerance to high or low temperature (stenothermal) while some tolerate a wide range of temperature (eurythermal) (Fig 2.19). Besides tolerance temperature
Environmental Components : 1. Light, Temperature and
Atmosphere
Environment and its Components
TEMPERATURE
Fig 2.18 : Annual mean temperatun in India. (These map do not sbow the political bou.drrrics.)
[ I Stenqthetmal -- I Eu@etmal Stenothermal opt. odt. I
-- -
Fi 2.19 : Limit of tolerance of stenothermal and curytbermd organisms. Muimum, minimum and optimum lie in a very narrow range in stenotbermd species. Eurythermd, sbow wide range of temperature tolerance.
Environmental Components : 1. Light, Temperature and
Atmosphere
lncreas~ng Latitude b
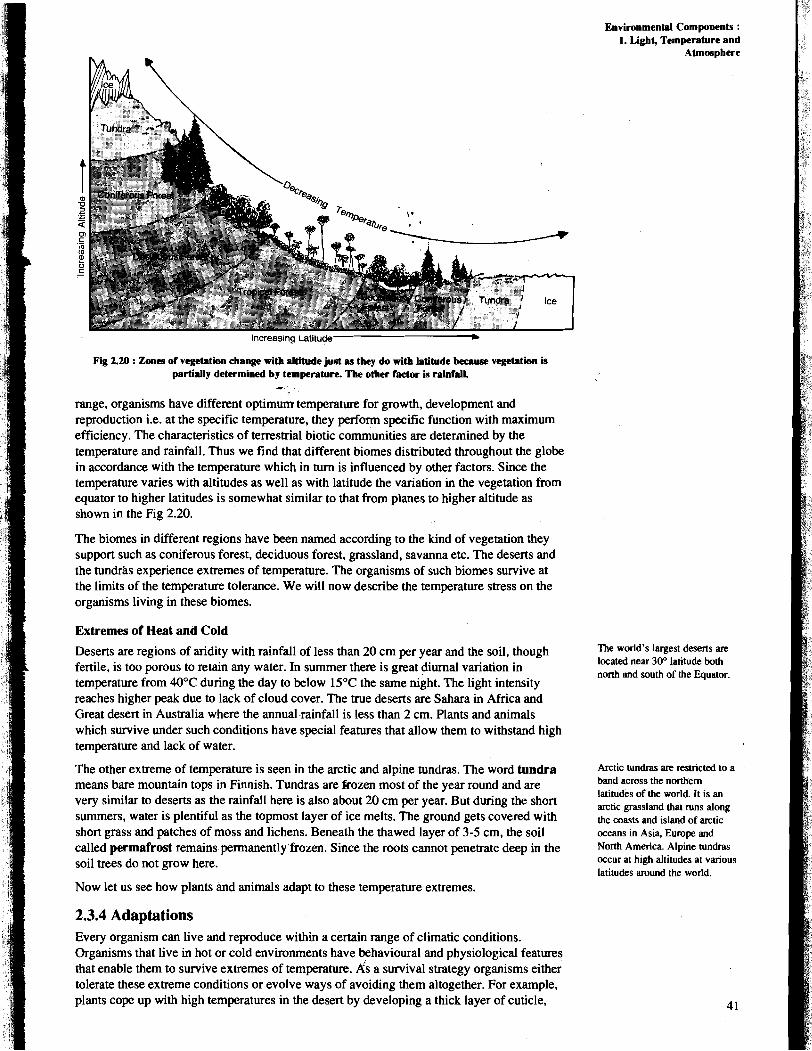
Fig 2.20 : Zones of vegetation change with altitude just as they do with Latitude because vegetation is partially determined by temperature. The other factor is rainfall. -
range, organisms have different optimum temperature for growth, development and reproduction i.e. at the specific temperature, they perform specific function with maximum efficiency. The characteristics of terrestrial biotic communities are determined by the temperature and rainfall. Thus we find that different biomes distributed throughout the globe in accordance with the temperature which in turn is influenced by other factors. Since the temperature varies with altitudes as well as with latitude the variation in the vegetation from equator to higher latitudes is somewhat similar to that from planes to higher altitude as shown in the Fig 2.20.
The biomes in different regions have been named according to the kind of vegetation they support such as coniferous forest, deciduous forest, grassland, savanna etc. The deserts and the tundras experience extremes of temperature. The organisms of such biomes survive at the limits of the temperature tolerance. We will now describe the temperature stress on the organisms living in these biomes.
Extremes of Heat and Cold
Deserts are regions of aridity with rainfall of less than 20 cm per year and the soil, though L, fertile, is too porous to retain any water. In summer there is great diurnal variation in
temperature from 40°C during the day to below 15°C the same night. The light intensity reaches higher peak due to lack of cloud cover. The true deserts are Sahara in Africa and Great desert in Australia where the annual rainfall is less than 2 cm. Plants and animals which survive under such conditions have special features that allow them to withstand high temperature and lack of water.
The other extreme of temperature is seen in the arctic and alpine tundras. The word tundra means bare mountain tops in Finnish. Tundras are kozen most of the year round and are very similar to deserts as the rainfall here is also about 20 cm per year. But during the short summers, water is plentiful as the topmost layer of ice melts. The ground gets covered with short grass and patches of moss and lichens. Beneath the thawed layer of 3-5 cm, the soil called permafrost remains permanently frozen. Since the roots cannot penetrate deep in the soil trees do not grow here.
Now let us see how plants and animals adapt to these temperature extremes.
2.3.4 Adaptations Every organism can live and reproduce within a certain range of climatic conditions. Organisms that live in hot or cold environments have behavioural and physiological features that enable them to survive extremes of temperature. k s a survival strategy organisms either tolerate these extreme conditions or evolve ways of avoiding them altogether. For example, plants cope up with high temperatures in the desert by developing a thick layer of cuticle,
The world's largest deserts are located near 30° latitude both north and south of the Equator.
Arctic tundras are restricted to a band across the northern latitudes of the world. It is an arctic grassland that runs along the coasts and island of arctic oceans in Asia. Eumpe and North America. Alpine tundras occur at high altitudes at various latitudes around the world.
Environment and it8 Component8
succulence i.e., water storage tissue in the leaves and stems. In many cacti the stem is green and carry out the functions of leaf and makes food by photosynthesis. These plants also have physiological adaptations. The stomata remain closed during the day to prevent the loss of water due to transpiration. CO, diffusion cannot occur in stomata1 closure in the day. To carry on photosynthesis these plants have evolved special physiological adaptation. During night when their stomata open they trap CO, and store it in the form of four carbon acid. The CO, trapped in the leaf at night is subsequently released during the day and used in photosynthesis. This type of metabolism is called crusstulacean acid metabolism (CAM). The details will be covered in physiology course. Comparative study of plant responses to constant favourable temperature region verses alternating temperature shows that seed germination, vegetative growth or fruit production is best under the latter conditions. This shows that plants are adjusted to natural rythmic diurnal cycle temperature changes. The regulation of plant responses to periodic thermal changes is called thermoperiodism.
Let us now see what sort of strategy animals adopt to cope with temperature stress. Animals have advantage over plants as they can move from one place to another. They cope with temperature stress by regulating their internal and external environment by physiological and behavioural means. Probably you know that birds and mammals are capable of maintaining constant body temperature. They do so by using the energy of.metabolism released during cellular respiration. They are called homeotherms or endotherms because they control constant body temperature by internal means. The body fat, feather, fur or hair etc. help to retain this heat. Some animals use a number of behavioural mechanisms to regulate their body temperature. This type of regulation is termed as behavioural thermoregulation. For instance, they can move to shady areas or take a dip inawater during the hot period of the day. The desert animals such as snakes, lizards, scorpions, and rats are mostly nocturnal i.e. they remain hiding during the day to avoid the scorching sun and roam in search of food at night or early in the morning when temperature is generally low. Reptiles like lizard and snake are considered cold blooded because they cannot control their body temperature. However, experiments on these animals have revealed that they can also control their body temperature effectively by behavioural means. Reptiles move in and out of burrow in such a way that their body temperature remains fairly constant. It has been found that in spite of great temperature fluctuation of environment, desert lizard can maintain its body temperature between 31 "C to 39°C. These animals are called poikilotherms or exotherms because they control body temperature to a considerable range by behavioural means. Animals also regulate their body temperature by losing excess heat by sweating and evaporation. I
In colder climates animals have adaptations to gather heat. Birds warm up their bddy by increasing the muscular activity in their wings by shivering. The chameleons change their colour to black, thus increasing their heat absorbing capacity, the ectotherms bask in the sun. The animals also manipulate by exposing a certain portion of their body so as to acquire desirable heat.
Another way to avoid adverse climatic conditions is through migration. Probably you know that birds of northern or colder regions migrate to warmer southern regions during the winter season. Fishes also swim long distances until they reach water masses which have suitable temperature for their survival.
Some animals such as bats, hedgehogs, ground-squirrels, lizards reduce their metabolic activity and thus enter into hibernation to minimise their energy needs during winter. To overcome high temperature during summer insects, lungfish, amphibians etc. also suspend their activities and lead dormant life. This state is called aestivation.
~yironmental Compoacnb : 1. Light, Tempcntwt and
Atmosphere
2.4 ATMOSPHERE
You have already studied (Unit 15 of the FST Course) that the earth is surrounded by a gaseous envelope called atmosphere. The atmosphere is an essential part of our biosphere. It is important to study the composition of the atmosphere because this composition is responsible for the weather and climate on our planet and life supporting system.
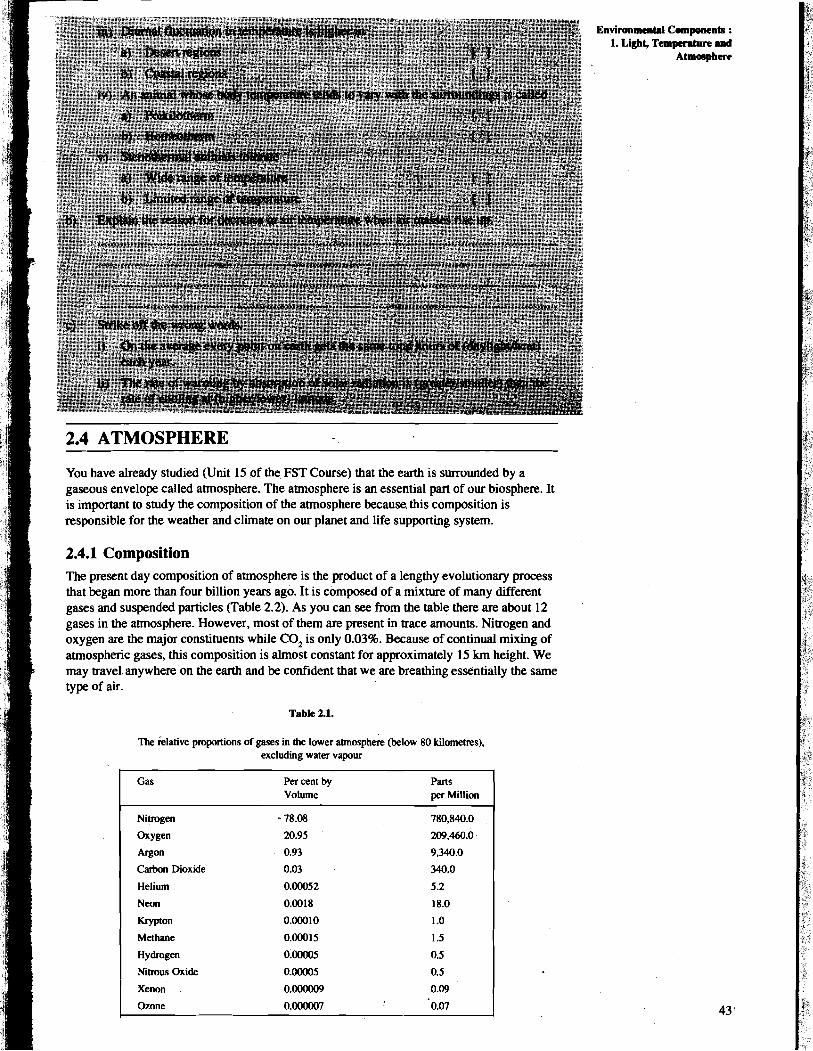
2.4.1 Composition The present day composition of atmosphere is the product of a lengthy evolutionary process that began more than four billion years ago. It is composed of a mixture of many different gases and suspended particles (Table 2.2). As you can see from the table there are about 12 gases in the atmosphere. However, most of them are present in trace amounts. Nitrogen and oxygen are the major constituents while CO, is only 0.03%. Because of continual mixing of atmospheric gases, this composition is almost constant for approximately 15 krn height. We may travel. anywhere on the earth and be confident that we are breathing essentially the same type of air.
Table 2.1.
The klative proportions of gases in the lower atmosphek (below 80 kilometres), excluding water vapour
Gas Per cent by Parts Volume per Million
Nitrogen - 78.08 780,840.0
Oxygen 20.95 209.460.0
Awn 0.93 9,340.0
Carbon Dioxide 0.03 340.0
Helium 0.00052 5.2
Neon 0.0018 18.0
Krypton 0.00010 1 .O
Methane 0.00015 1.5
H~dro%en 0.00005 0.5
Nitrous Oxide 0.00005 0.5
Xenon 0.000009 0.09
Ozone 0.000007 I 0.07
Envhment and its Components
Atmosphere also contains minute liquid or solid particles in a suspended form which are known as aerosols. Most of these are found in the lower atmosphere (up to 80 km) near the earth's surface. They originate as a result of forest fires, wind erosion of soil, as sea salt crystals from ocean sprays as well as, from industrial and agricultural activities.
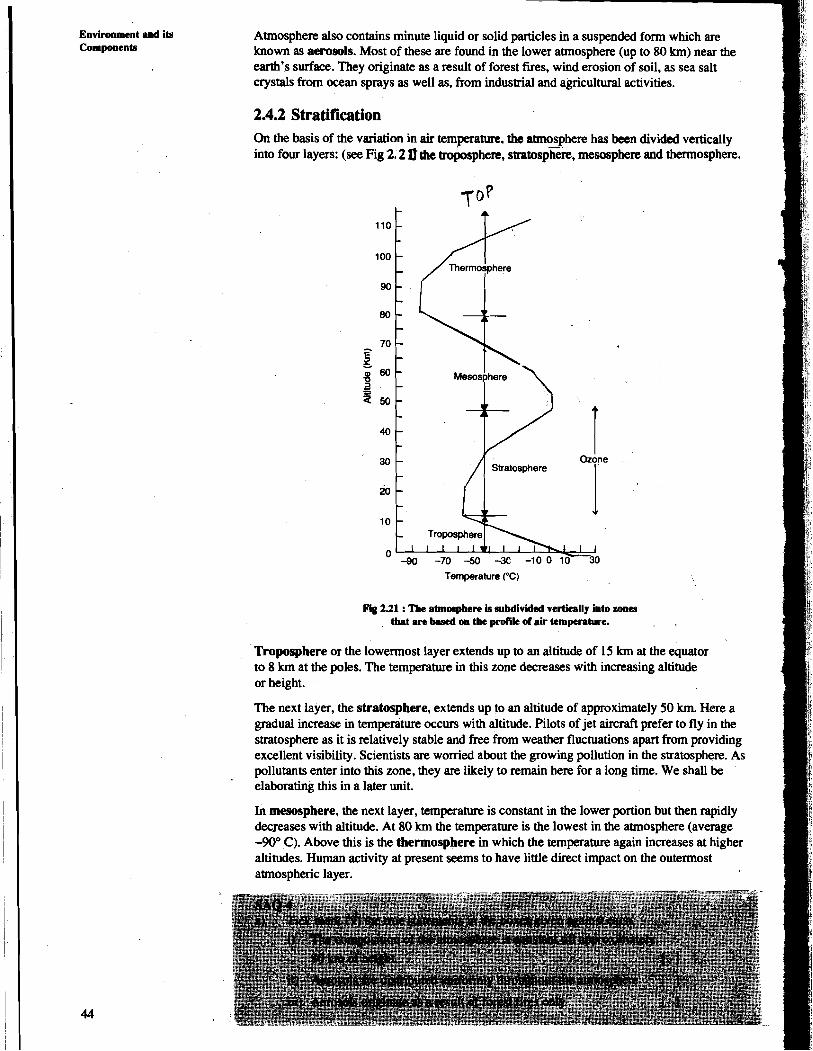
2.4.2 Stratification On the basis of the variation in air temperature. the atmosphere has been divided vertically into four layers: (see Fig 2.2 1]' dre troposphere, stratospG, mesosphere and thermosphere.
Temperature PC)
Fig 2.21 : Thc atmosphere is subdivided vertically into zooar . that are based oa the profile of air temperature. . a
Troposphere or the lowermost layer extends up to an altitude of 15 km at the equator to 8 km at the poles. The temperature in this zone decreases with increasing altitude or height.
The next layer, the stratosphere, extends up to an altitude of approximately 50 km. Here a gradual increase in temperature occurs with altitude. Pilots of jet aircraft prefer to fly in the stratosphere as it is relatively stable and free from weather fluctuations apart from providing excellent visibility. Scientists are womed about the growing pollution in the stratosphere. As pollutants enter into this zone, they are likely to remain here for a long time. We shall be elaborating this in a later unit.
In mesosphere, the next layer, temperature is constant in the lower portion but then rapidly decreases with altitude. At 80 km the temperature is the lowest in the atmosphere (average -90" C). Above this is the thermosphere in which the temperature again increases at higher altitudes. Human activity at present seems to have little direct impact on the outermost atmospheric layer.
b) ~ h g o s e t h e 4 x m e t % ~ ~ r o m c a c b ~ @ ~ r s v a d ~ d h ~ Eoviro~nmemtsl Cwpoacmts :
i) A s w e g u ~ ~ i n ~ ~ ; ~ a i r ~ e a ~ ~ t u r e ~ ) . 1. Light, Temperature Atmoepbere u d
ii) J e t p a a a e @ o t r s p r e f e r t s f l y i a t h e f ~ ) . iii) In tbt? & tt?wperature (-m) with altitude. iv) Temperatwe is (Jowest(highest) at SO km attitude in the ~~.
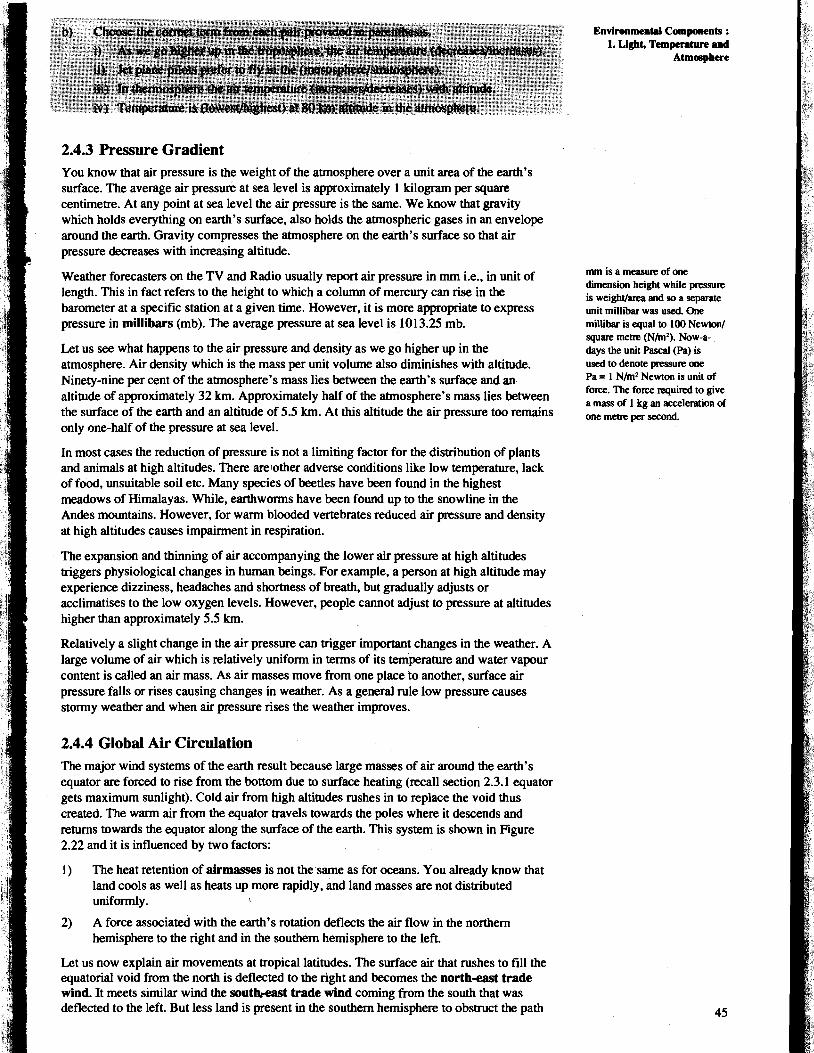
2.4.3 Pressure Gradient You know that air pressure is the weight of the atmosphere over a unit area of the earth's surface. The average air pressure at sea level is approximately 1 kilogram per square centimetre. At any point at sea level the air pressure is the same. We know that gravity which holds everything on earth's surface, also holds the atmospheric gases in an envelope around the earth. Gravity compresses the atmosphere on the earth's surface so that air pressure decreases with increasing altitude.
! Weather forecasters on the TV and Radio usually report air pressure in rnm i.e.. in unit of length. This in fact refers to the height to which a column of mercury can rise in the barometer at a specific station at a given time. However, it is more appropriate to express pressure in millibars (mb). The average pressure at sea level is 1013.25 mb.
Let us see what happens to the air pressure and density as we go higher up in the atmosphere. Air density which is the mass per unit volume also diminishes with altitude. Ninety-nine per cent of the atmosphere's mass lies between the earth's surface and an altitude of approximately 32 km. Approximately half of the atmosphere's mass lies between the surface of the earth and an altitude of 5.5 km. At this altitude the air pressure too remains only one-half of the pressure at sea level.
In most cases the reduction of pressure is not a limiting factor for the distribution of plants and animals at high altitudes. There arelother adverse conditions like low temperature, lack of food, unsuitable soil etc. Many species of beetles have been found in the highest meadows of Himalayas. While, earthworms have been found up to the snowline in the Andes mountains. However, for warm blooded vertebrates reduced air pressure and density at high altitudes causes impairment in respiration.
The expansion and thinning of air accompanying the lower air pressure at high altitudes triggers physiological changes in human beings. For example, a person at high altitude may experience dizziness, headaches and shortness of breath, but gradually adjusts or acclimatises to the low oxygen levels. However, people cannot adjust to pressure at altitudes higher than approximately 5.5 km.
Relatively a slight change in the air pressure can trigger important changes in the weather. A large volume of air which is relatively uniform in terms of its temperature and water vapour content is called an air mass. As air masses move from one place to another, surface air pressure falls or rises causing changes in weather. As a general rule low pressure causes stormy weather and when air pressure rises the weather improves.
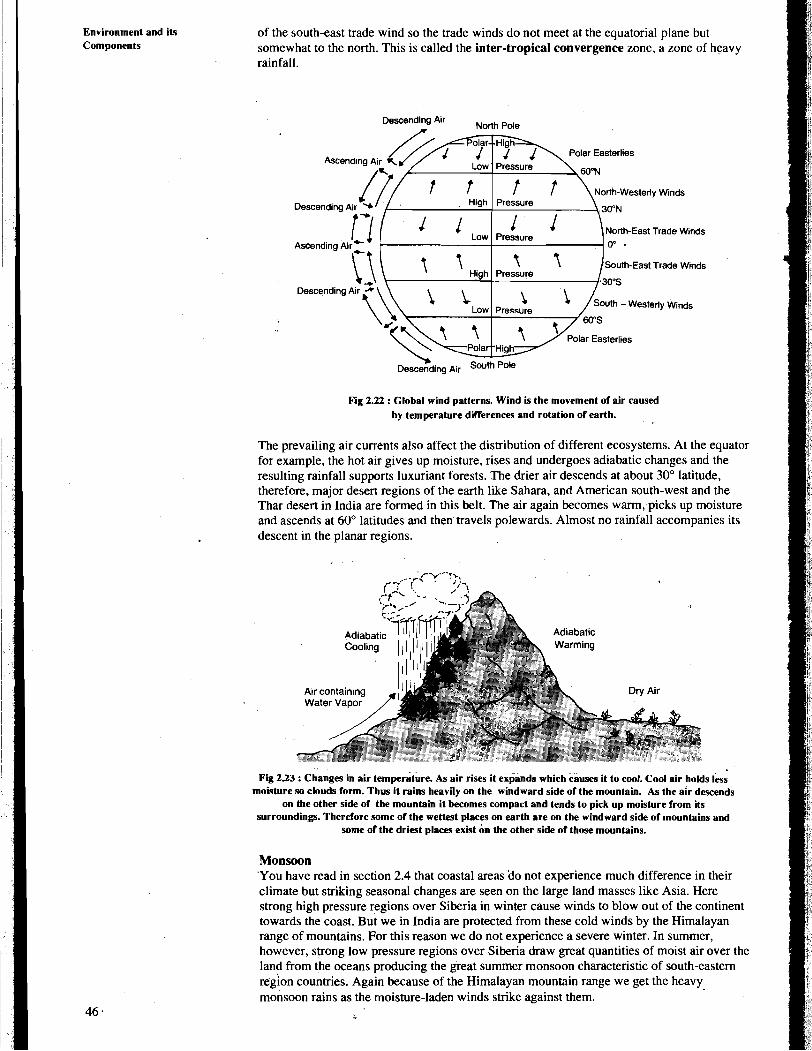
2.4.4 Global Air Circulation The major wind systems of the earth result because large masses of air around the earth's equator are forced to rise from the bottom due to surface heating (recall section 2.3.1 equator gets maximum sunlight). Cold air from high altitudes rushes in to replace the void thus created. The warm air from the equator travels towards the poles where it descends and returns towards the equator along the surface of the earth. This system is shown in Figure 2.22 and it is influenced by two factors:
1) The heat retention of airmasses is not the same as for oceans. You already know that land cools as well as heats up more rapidly, and land masses are not distributed uniformly. i
2) A force associated with the earth's rotation deflects the air flow in the northern hemisphere to the right and in the southern hemisphere to the left.
Let us now explain air movements at tropical latitudes. The surface air that rushes to fill the equatorial void from the north is deflected to the right and becomes the north-east trade wind. It meets similar wind the s o u t h a t trade wind coming from the south that was deflected to the left. But less land is present in the southern hemisphere to obstruct the path
mm is a measure of one dimension height while pressure is weightlarea and so a separate unit millibar was used. One millibar is equal to 100 Newton/ square metre (N/m2). Now-a- . days the unit Pascal (Pa) is used to denote pressure one Pa = 1 N/m2 Newton is unit of force. The force required to give a mass of 1 kg an acceleration of one metre per second.
Environment and its Components
of the south-east trade wind so the trade winds do not meet at the equatorial plane but somewhat to the north. This is called the inter-tropical convergence zone, a zone of heavy rainfall.
Descending Air North Pole
ast Trade Winds LOW l Pressure
I ""' " '-" Ascending A i r r ' 1 I ( 0 " - I
\ ---.. . &"", , .""" ..a, mu.,
High I Pressure 30%
Descending Air A i\ lerlies
n Descending Air
Fig 2.22 : Global wind patterns. Wind is the movement of air caused by temperature differences and rotation of earth.
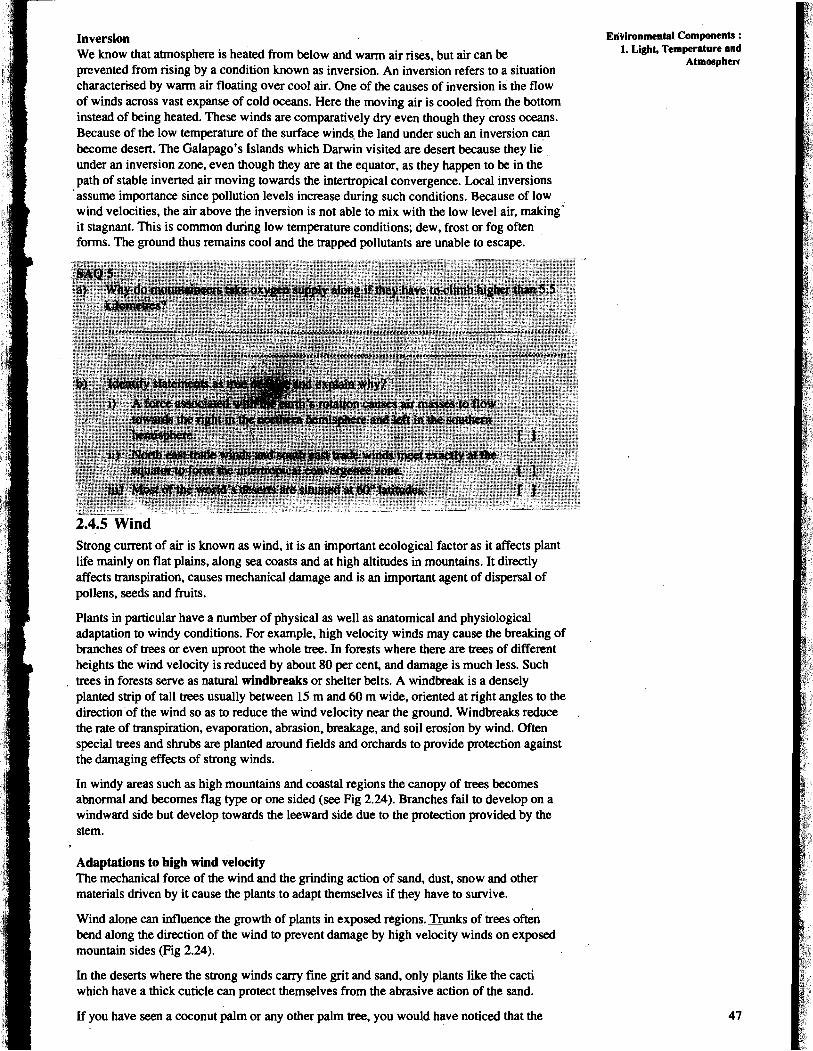
The prevailing air currents also affect the distribution of different ecosystems. At the equator for example, the hot air gives up moisture, rises and undergoes adiabatic changes ancl the resulting rainfall supports luxuriant forests. The drier air descends at about 30" latitude, therefore, major desert regions of the earth like Sahara, and American south-west and the Thar desert in India are formed in this belt. The air again becomes warm, picks up moisture and ascends at 60" latitudes and then travels polewards. Almost no rainfall accompanies its descent in the planar regions.
Fig 2.23 : Changes in air temperature. As air rises it expands which causes it to cool. Cool air holds less moisture so clouds form. Thus it rains heavily on the windward side of the mountain. As the air descends
on the other side of the mountain it becomes compact and tends to pick up moisture from its surroundings. Therefore some of the wettest places on earth are on the windward side of mountains and
some of the driest places exist on the other side of those mountains.
Monsoon 'You have read in section 2.4 that coastal areas 'do not experience much difference in their climate but striking seasonal changes are seen on the large land masses like Asia. Here strong high pressure regions over Siberia in winter cause winds to blow out of the continent towards the coast. But we in India are protected from these cold winds by the Himalayan range of mountains. For this reason we do not experience a severe winter. In summer, however, strong low pressure regions over Siberia draw great quantities of moist air over the land from the oceans producing the great summer monsoon characteristic of south-eastem region countries. Again because of the Himalayan mountain range we get the heavy monsoon rains as the moisture-laden winds strike against them.
Inversion EliWronmental Components : We know that atmosphere is heated from below and warm air rises, but air can be 1. Light, Temperature and
Atmmpherc prevented from rising by a condition known as inversion. An inversion refers to a situation characterised by warm air floating over cool air. One of the causes of inversion is the flow of winds across vast expanse of cold oceans. Here the moving air is cooled from the bottom instead of being heated. These winds are comparatively dry even though they cross oceans. Because of the low temperature of the surface winds the land under such an inversion can become desert. The Galapago's Islands which Darwin visited are desert because they lie under an inversion zone, even though they are at the equator. as they happen to be in the path of stable inverted air moving towards the intertropical convergence. Local inversions
'assume importance since pollution levels increase during such conditions. Because of low wind velocities, the air above the inversion is not able to mix with the low level air, making- it stagnant. This is common during low temperature conditions; dew, frost or fog often forms. The ground thus remains cool and the trapped pollutants are unable to escape.
2.4.5 Wind Strong current of air is known as wind, it is an important ecological factor as it affects plant life mainly on flat plains, along sea coasts and at high altitudes in mountains. It directly affects transpiration, causes mechanical ,damage and is an important agent of dispersal of pollens, seeds and fruits.
Plants in particular have a number of physical as well as anatomical and physiological adaptation to windy conditions. For example, high velocity winds may cause the breaking of branches of trees or even uproot the whole tree. In forests where there are trees of different
I heights the wind velocity is reduced by about 80 per cent, and damage is much less. Such . trees in forests serve as natural windbreaks or shelter belts. A windbreak is a densely
planted strip of tall trees usually between 15 m and 60 m wide, oriented at right angles to the direction'of the wind so as to reduce the wind velocity near the ground. Windbreaks reduce the rate of transpiration, evaporation, abrasion, breakage, and soil erosion by wind. Often special trees and shrubs are planted around fields and orchards to provide protection against the damaging effects of strorlg winds.
In windy areas such as high mountains and coastal regions the canopy of trees becomes abnormal and becomes flag type or one sided (see Fig 2.24). Branches fail to develop on a windward side but develop towards the leeward side due to the protection provided by the stem.
Adaptations to high wind velocity The mechanical force of the wind and the grinding action of sand, dust, snow and other materials driven by it cause the plants to adapt themselves if they have to survive.
Wind alone can influence the growth of plants in exposed regions. mnks of trees often bend along the direction of the wind to prevent damage by high velocity winds on exposed mountain sides (Fig 2.24).
In the deserts where the strong winds carry fine grit and sand, only plants like the cacti which have a thick cuticle can protect themselves from the abrasive action of the sand.
i If you have seen a coconut palm or any other palm tree, you would have noticed that the
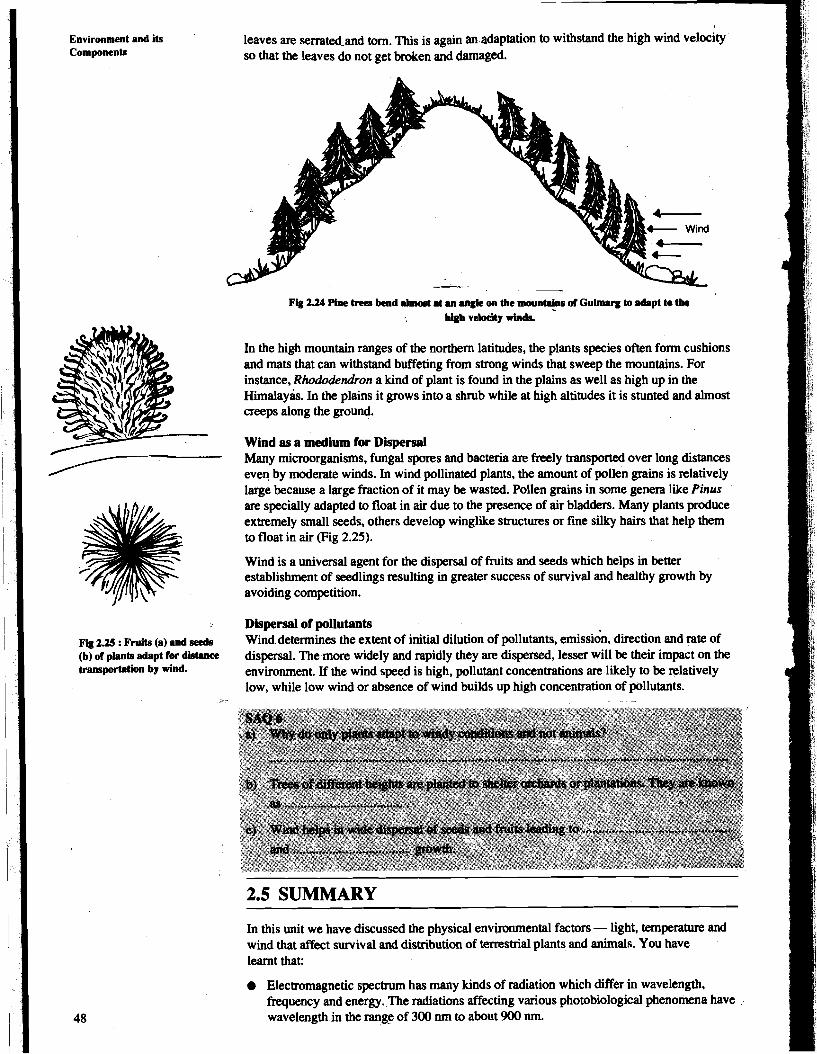
Environment and its ' leaves are serrated and torn. This is again an adaptation to withstand the high wind velocity Components so that the leaves do not get broken and damaged.
Fig 2.24 Pine brce bend alnmet at m mgk on the mount.i-m d Gulmarg lo dnpt to t k high vekeity win&.
Fig 2.25 : Fruits (a) and s d s (b) d plants adapt for dlet.aee transportation by wind.
In the high mountain ranges of the northern latitudes, the plants species often form cushions and mats that can withstand buffeting from strong winds that sweep the mountains. For instance, Rhododendron a kind of plant is found in the plains as well as high up in the Himalayis. In the plains it grows into a shrub while at high altitudes it is stunted and almost creeps along tle ground.
Wind as a medium for Dispelgal Many microorganisms, fungal spores and bacteria are freely transported over long distances even by moderate winds. In wind pollinated plants, the amount of pollen grains is relatively large because a large fraction of it may be wasted. Pollen grains in some genera like Pinus are specially adapted to float in air due to the presence of air bladders. Many plants produce extremely small seeds, others develop winglike structures or fine silky hairs that help them to float in air (Fig 2.25).
Wind is a universal agent for the dispersal of fruits and seeds which helps in better establishment of seedlings resulting in greater success of survival and healthy growth by avoiding competition.
Dispersal of pollutants Wind determines the extent of initial dilution of pollutants, emissidn, direction and rate of dispersal. The more widely and rapidly they are dispersed, lesse~ will be their impact on the environment. If the wind speed is high, pollutant concentrations are likely to be relatively low, while low wind or absence of wind builds up high concentration of pollutants.
-
2.5 SUMMARY
In this unit we have discussed the physical environmental factors - light, temperature and wind that affect survival and distribution of terrestrial plants and animals. You have learnt that:
Electromagnetic spectrum has many kinds of radiation which differ in wavelength, frequency and energy. The radiations affecting various photobiological phenomena have wavelengthin the range of 300 nm to about 900 nm.
The global distribution of solar radiation and its spectra distribution reaching on the earth surface is affected by atmospheric conditions and vegetation. Quantity, quality, and duration of solar radiation can be measured by instruments. Latitudiial, altitudinal and periodic changes in light along with wind circulation affect - the global temperature. The atmosphere is divided into horizontal layers on the basis of variation in temperature. Air pressure and density fall rapidly with altitude, and thinning of air with height triggers physiological changes in organisms.
, The atmospheric wind circulation causes redistribution of heat from the equator towards the poles. Organisms function at the limit of climatic tolerance. In tundras and desert regions or at places where there are larger fluctuation in temperature, plants and animals have behavioural, physiological and structural adaptations that enable them to survive extremes of temperature. Plants in regions of high wind velocity develop various structural adaptations to enable them to survive under such conditions.
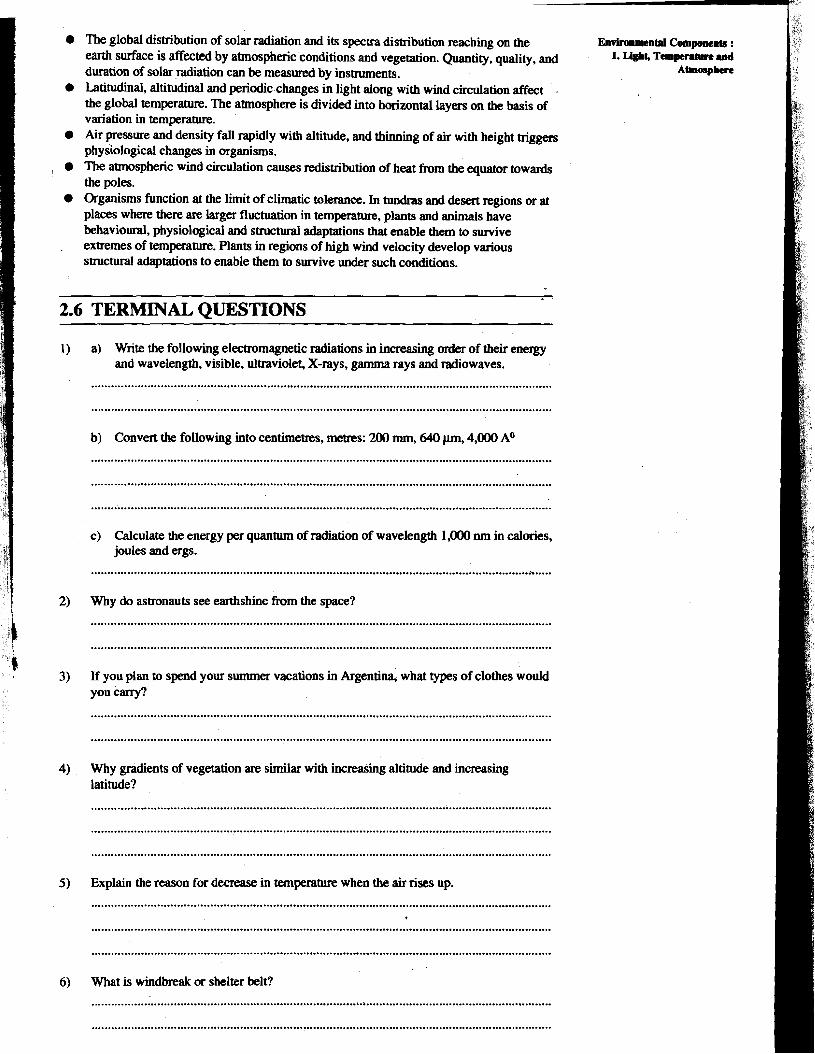
2.6 TERMINAL QUESTIONS
1) a) Write the following electromagnetic radiations in increasing order of their energy and wavelength, visible, ultraviolet, X-rays, gamma rays and radiowaves.
b) Convert the following into centirnetres, metres: 200 mm, 640 pn, 4,000 A0
c) Calculate the energy per quantum of radiation of wavelength 1,000 nrn in calories, joules and ergs.
2) Why do astronauts see earthshine from the space?
...........................................................................................................................................
3) If you plan to spend your summer vacations in Argenoha, what types of clothes would you Carry?
4) Why gradients of vegetation are similar with increasing altitude and increasing latitude?
5 ) Explain the reason for decrease in temperature when the air rises up.
...........................................................................................................................................
6) What is windbreak or shelter belt?
Eovhbnwnt and its Compormts
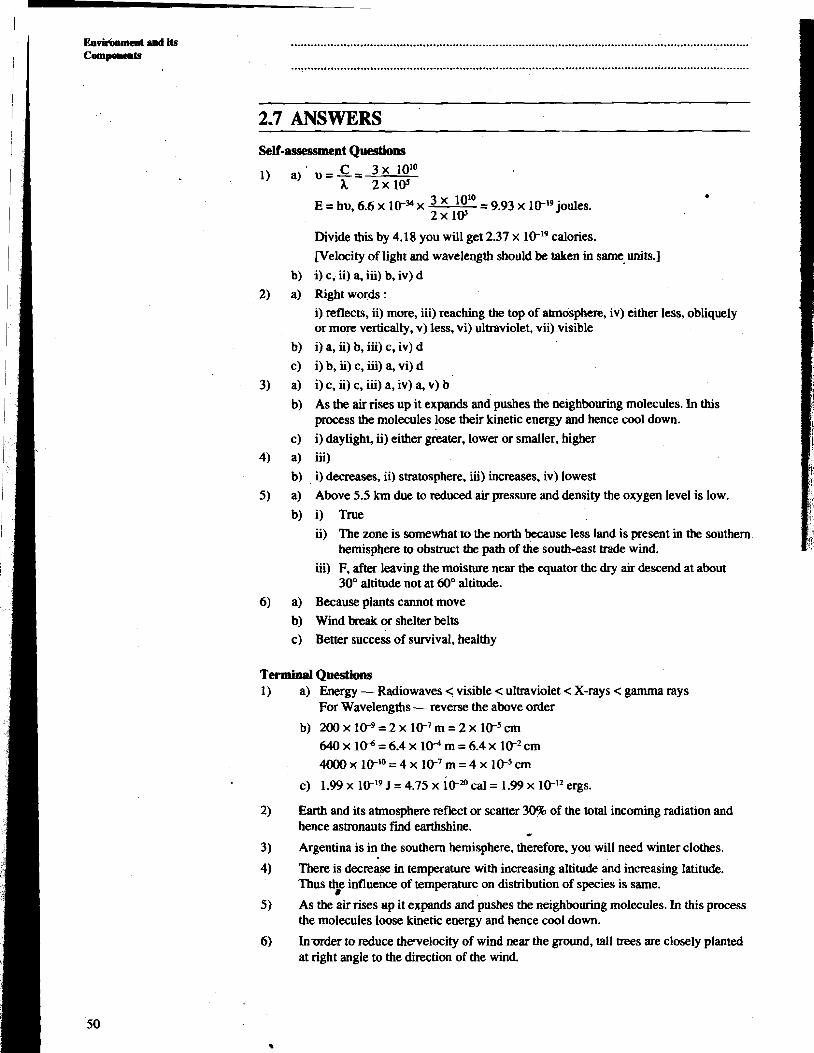
2.7 ANSWERS
Self-assessment Questio~~
E = hu, 6.6 x lCY x l0l0 = 9.93 x 1V19 joules. 2 x 1 v
Divide this by 4.18 you will get 2.37 x lW9 calories.
[Velocity of light and wavelength should be taken in same, units.] i) c, ii) a, i i ) b, iv) d
Right words : i) reflects, ii) more, iii) reaching the top of atmosphere, iv) either less, obliquely or more vertically, v) less, vi) ultraviolet, vii) visible i) a, ii) b, iu) c, iv) d
i) b, ii) c, iii) a, vi) d
i) c, ii) c, iii) a, iv) a, v) b
As the air rises up it expands and pushes the neighbouring molecules. In this process the molecules lose their kinetic energy and hence cool down. i) daylight, ii) either greater, lower or smaller, higher iii)
i) decreases, ii) stratosphere, iii) increases, iv) lowest Above 5.5 km due to reduced air pressure and density the oxygen level is low.
i) True
ii) The zone is somewhat to the north because less land is present in the southern hemisphere to obstruct the path of the southeast trade wind.
iii) F, after leaving the moisture near the equator the dry air descend at about 30" altitude not at 60" altitude.
Because plants cannot move Wind break or shelter belts Better success of survival, healthy
Terminal Questions 1) a) Energy - Radiowaves < visible < ultraviolet < X-rays < gamma rays
For Wavelengths - reverse the above order
b) 2 0 0 x l W = 2 x 1 C 7 m = 2 x 1k5cm 640x1W=6.4x10⁻⁴m=6.4x1V2cm 4000x 1C10=4x 1C7m=4x 10⁻⁵cm
c) 1 .!I9 x 1C19 J = 4.75 x 1cm cal = 1.99 x 10-l2 ergs.
2) Earth and its atmosphere reflect or scatter 30% of the total incoming radiation and hence astronauts fmd earthshine. .
3) Argentina is in the southern hemisphere, therefore, you will need winter clothes.
4) There is decrease in temperature with increasing altitude and increasing latitude. Thus the influence of temperature on distribution of species is same.
5) As the air rises up it expands and pushes the neighbouring molecules. In this process the molecules loose kinetic energy and hence cool down.
6) Inurder to reduce thevelocity of wind near the ground, tall trees are closely planted at right angle to the direction of the wind.


![Unit 1 Unit 2 Unit 3 Unit 4 Unit 5 Unit 6 Unit 7 Unit 8 ... 5 - Formatted.pdf · Unit 1 Unit 2 Unit 3 Unit 4 Unit 5 Unit 6 ... and Scatterplots] Unit 5 – Inequalities and Scatterplots](https://img.pdfslide.us/doc/110x75/5b76ea0a7f8b9a4c438c05a9/unit-1-unit-2-unit-3-unit-4-unit-5-unit-6-unit-7-unit-8-5-formattedpdf.jpg)