Embed Size (px)
Citation preview
Unit 1: Planning and financing a business
Financial planning
Calculating costs, revenues and profits
Chapter 11
Unit 1: Planning and financing a business
Financial planning
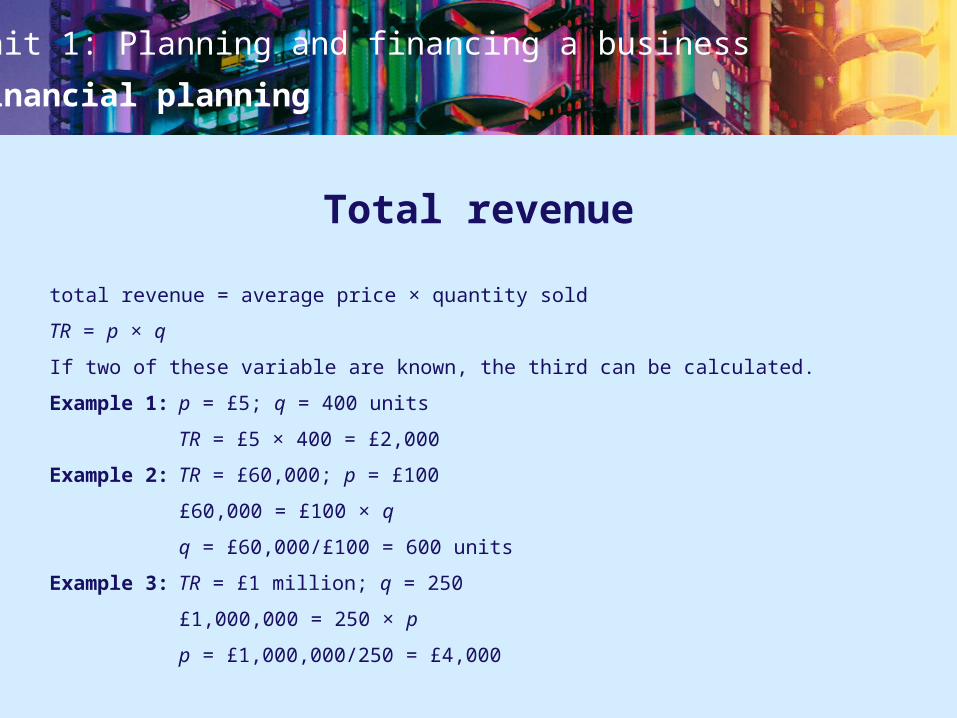
Total revenue
total revenue = average price × quantity sold
TR = p × q
If two of these variable are known, the third can be calculated.
Example 1: p = £5; q = 400 units
TR = £5 × 400 = £2,000
Example 2: TR = £60,000; p = £100
£60,000 = £100 × q
q = £60,000/£100 = 600 units
Example 3: TR = £1 million; q = 250
£1,000,000 = 250 × p
p = £1,000,000/250 = £4,000
Unit 1: Planning and financing a business
Financial planning
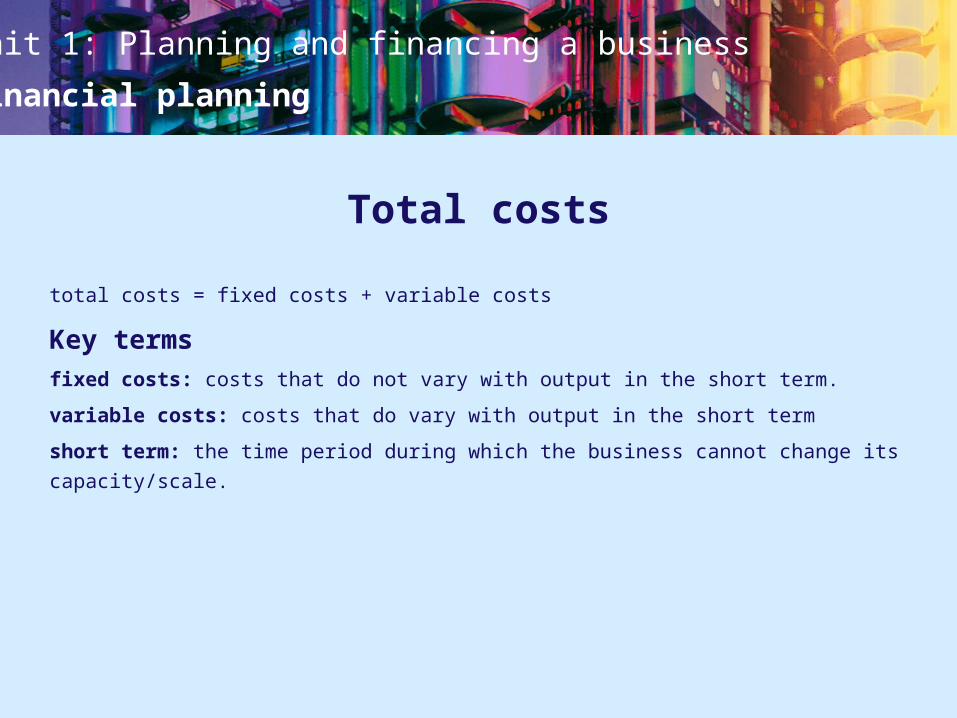
Total costs
total costs = fixed costs + variable costs
Key termsfixed costs: costs that do not vary with output in the short term.
variable costs: costs that do vary with output in the short term
short term: the time period during which the business cannot change its
capacity/scale.
Unit 1: Planning and financing a business
Financial planning
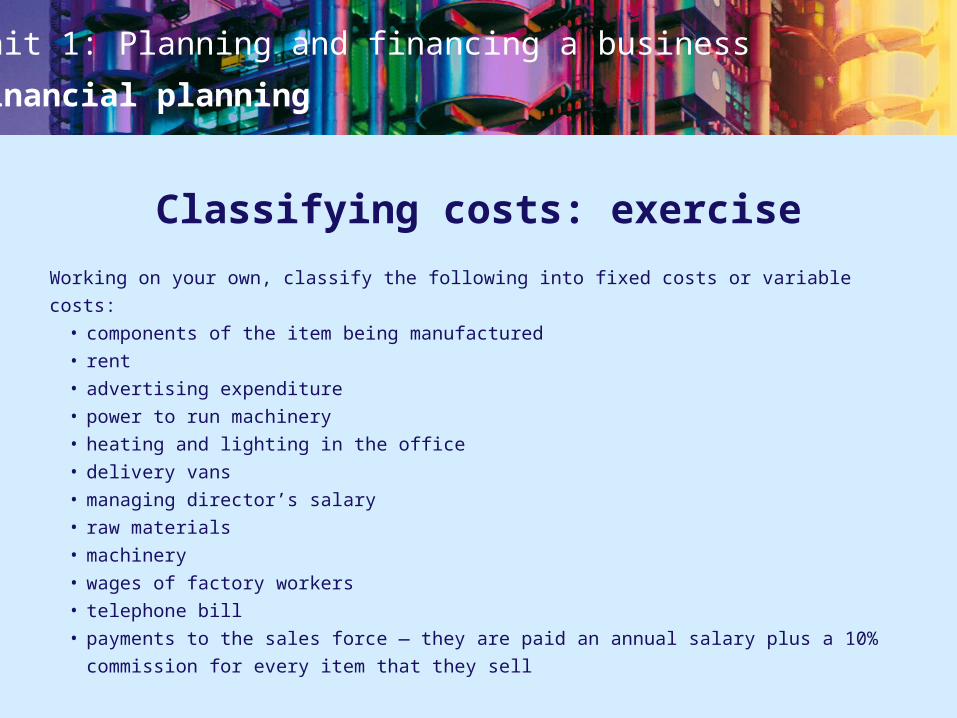
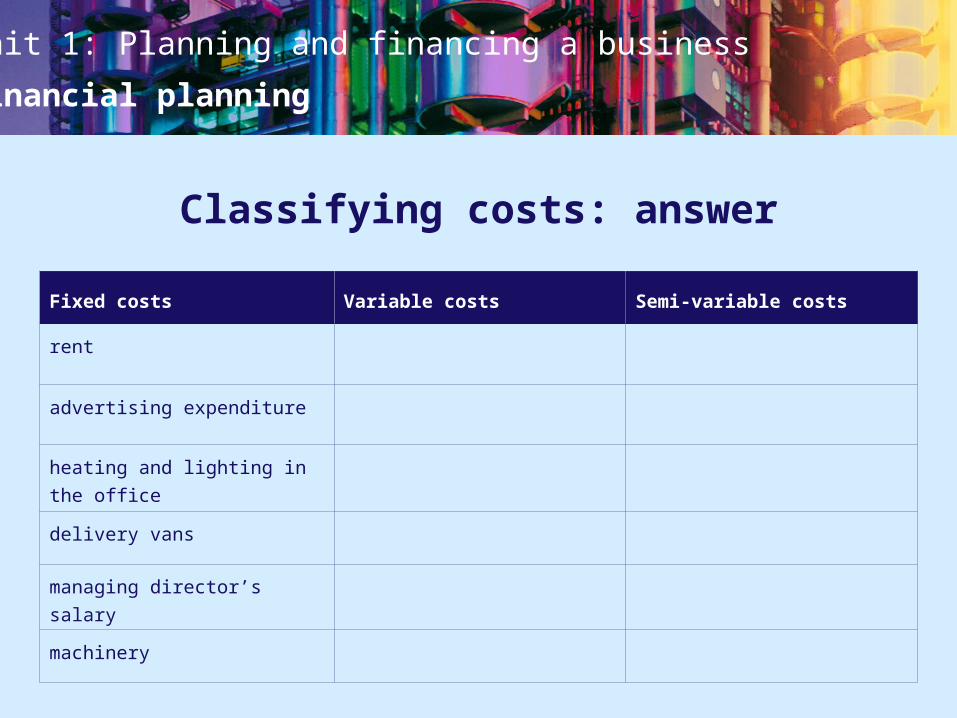
Classifying costs: exercise
Working on your own, classify the following into fixed costs or variable costs:• components of the item being manufactured• rent• advertising expenditure• power to run machinery• heating and lighting in the office• delivery vans• managing director’s salary• raw materials• machinery• wages of factory workers• telephone bill• payments to the sales force — they are paid an annual salary plus a 10%
commission for every item that they sell
Unit 1: Planning and financing a business
Financial planning
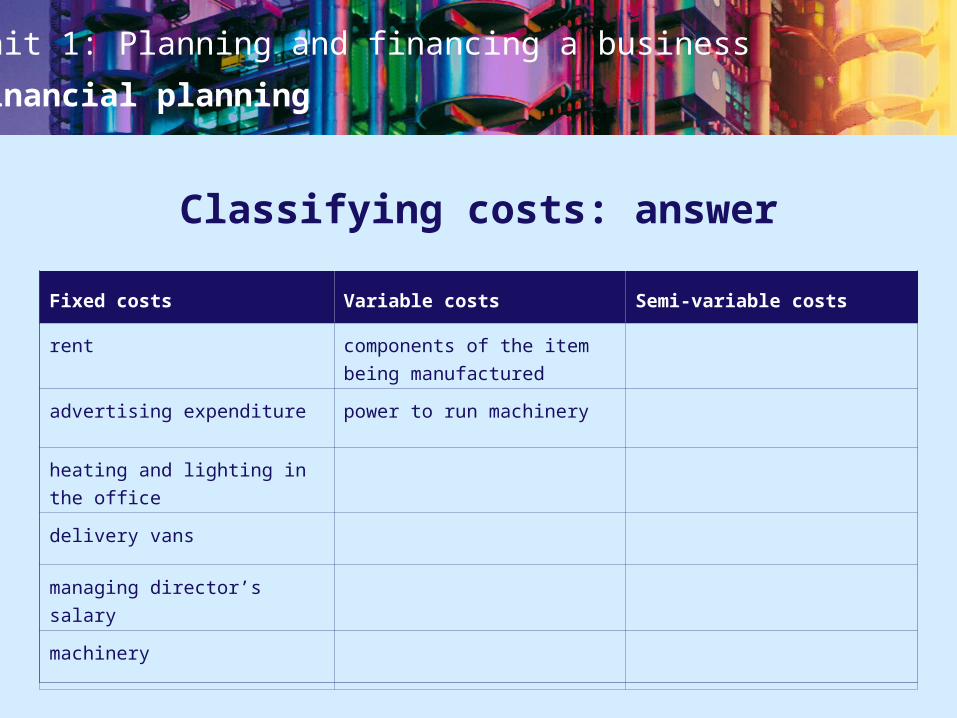
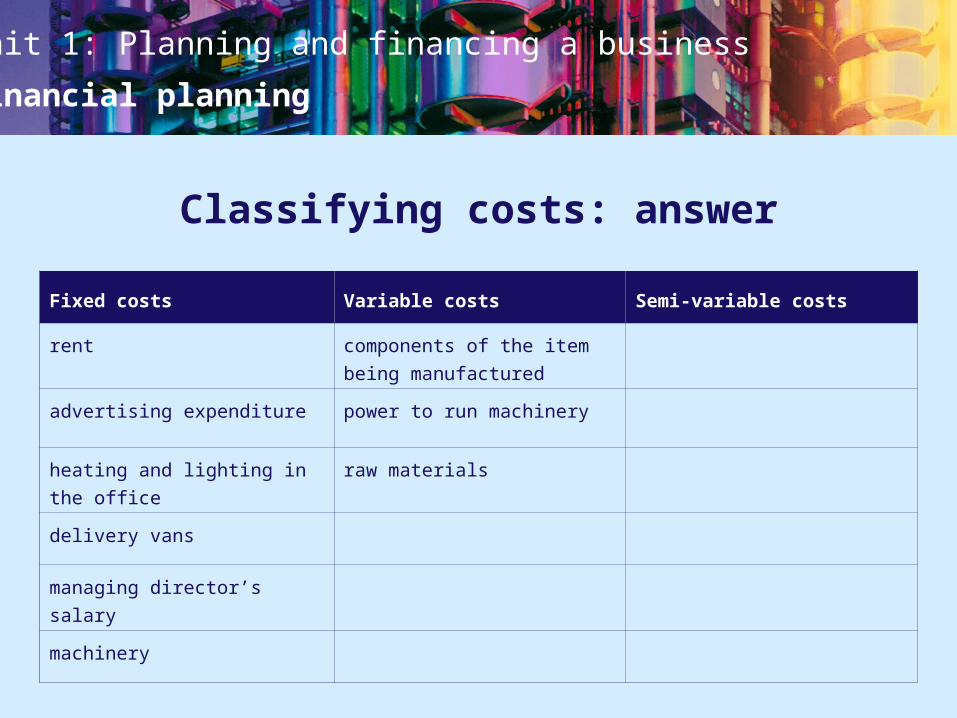
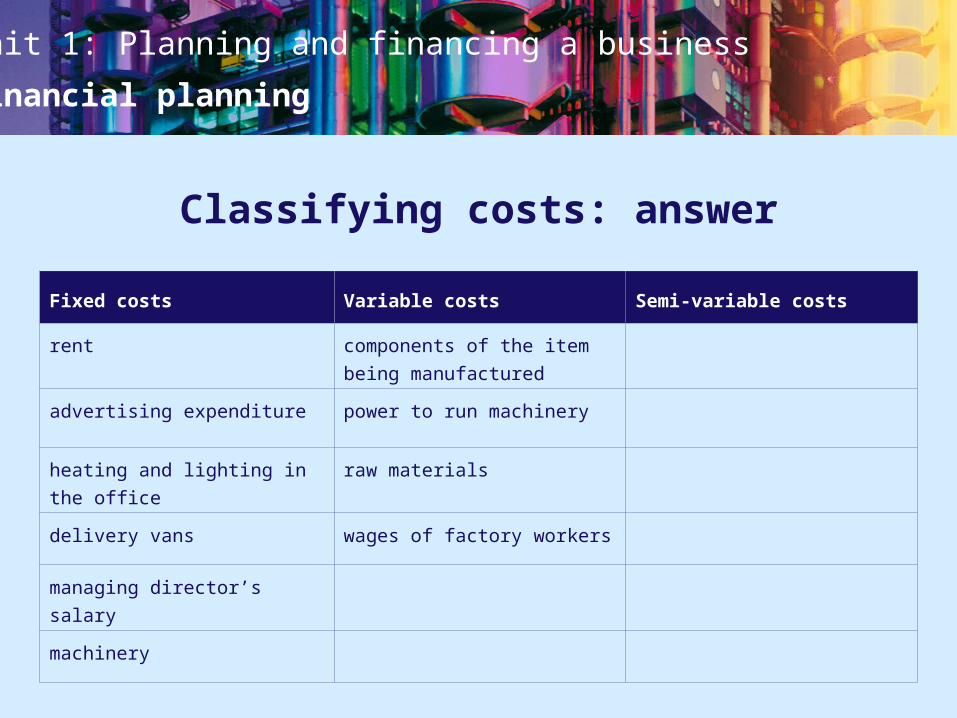
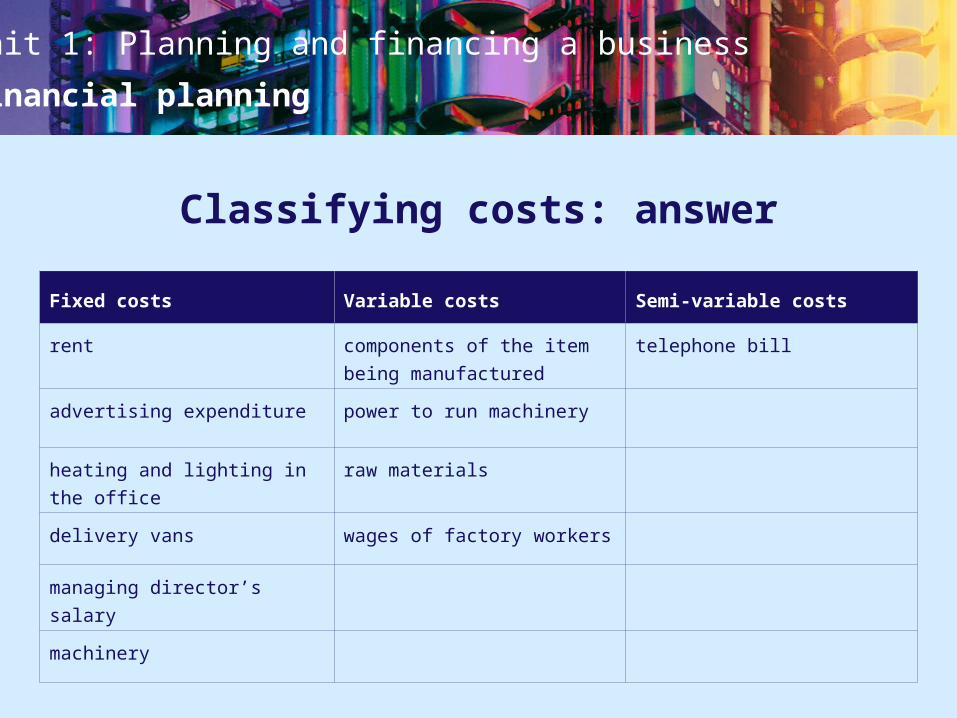
Classifying costs: answer
Fixed costs Variable costs Semi-variable costs
rent
advertising expenditure
heating and lighting in the
office
delivery vans
managing director’s salary
machinery

Unit 1: Planning and financing a business
Financial planning
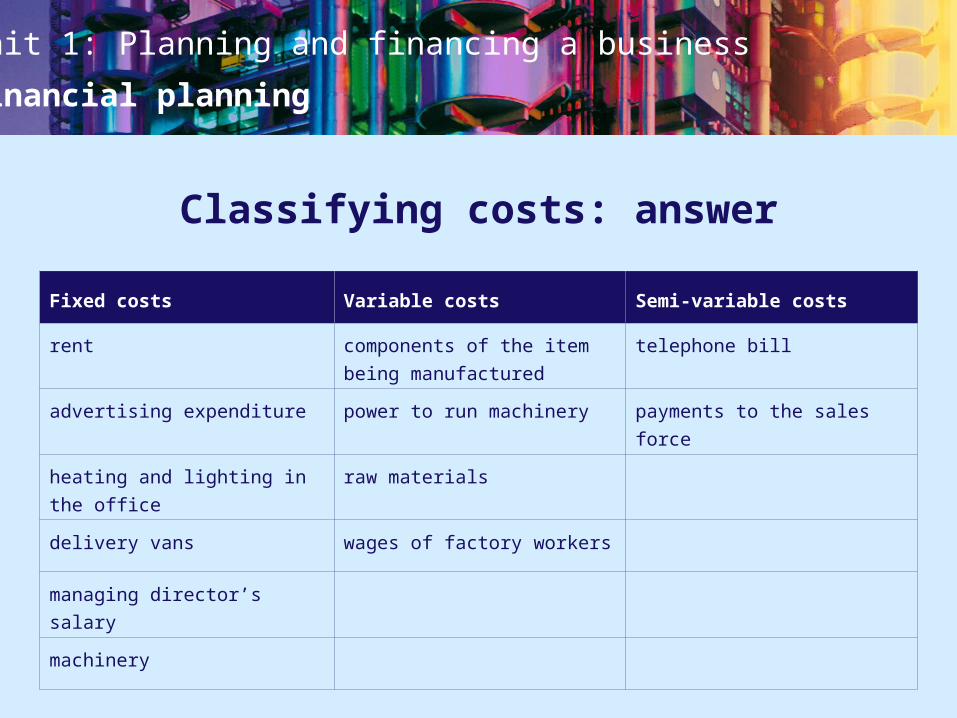
Classifying costs: answer
Fixed costs Variable costs Semi-variable costs
rent components of the item
being manufactured
telephone bill
advertising expenditure power to run machinery payments to the sales force
heating and lighting in the
office
raw materials
delivery vans wages of factory workers
managing director’s salary
machinery
Fixed costs Variable costs Semi-variable costs
rent components of the item
being manufactured
advertising expenditure power to run machinery
heating and lighting in the
office
raw materials
delivery vans wages of factory workers
managing director’s salary
machinery
Fixed costs Variable costs Semi-variable costs
rent components of the item
being manufactured
advertising expenditure power to run machinery
heating and lighting in the
office
raw materials
delivery vans
managing director’s salary
machinery
Fixed costs Variable costs Semi-variable costs
rent components of the item
being manufactured
advertising expenditure power to run machinery
heating and lighting in the
office
delivery vans
managing director’s salary
machinery
Fixed costs Variable costs Semi-variable costs
rent components of the item
being manufactured
advertising expenditure
heating and lighting in the
office
delivery vans
managing director’s salary
machinery
Unit 1: Planning and financing a business
Financial planning
Classifying costs: answer
Fixed costs Variable costs Semi-variable costs
rent components of the item
being manufactured
telephone bill
advertising expenditure power to run machinery payments to the sales force
heating and lighting in the
office
raw materials
delivery vans wages of factory workers
managing director’s salary
machinery
Fixed costs Variable costs Semi-variable costs
rent components of the item
being manufactured
advertising expenditure power to run machinery
heating and lighting in the
office
raw materials
delivery vans wages of factory workers
managing director’s salary
machinery
Fixed costs Variable costs Semi-variable costs
rent components of the item
being manufactured
advertising expenditure power to run machinery
heating and lighting in the
office
raw materials
delivery vans
managing director’s salary
machinery
Fixed costs Variable costs Semi-variable costs
rent components of the item
being manufactured
advertising expenditure power to run machinery
heating and lighting in the
office
delivery vans
managing director’s salary
machinery
Unit 1: Planning and financing a business
Financial planning
Classifying costs: answer
Fixed costs Variable costs Semi-variable costs
rent components of the item
being manufactured
advertising expenditure power to run machinery
heating and lighting in the
office
raw materials
delivery vans wages of factory workers
managing director’s salary
machinery
Fixed costs Variable costs Semi-variable costs
rent components of the item
being manufactured
advertising expenditure power to run machinery
heating and lighting in the
office
raw materials
delivery vans
managing director’s salary
machinery
Unit 1: Planning and financing a business
Financial planning
Classifying costs: answer
Fixed costs Variable costs Semi-variable costs
rent components of the item
being manufactured
advertising expenditure power to run machinery
heating and lighting in the
office
raw materials
delivery vans wages of factory workers
managing director’s salary
machinery
Unit 1: Planning and financing a business
Financial planning
Classifying costs: answer
Fixed costs Variable costs Semi-variable costs
rent components of the item
being manufactured
telephone bill
advertising expenditure power to run machinery payments to the sales force
heating and lighting in the
office
raw materials
delivery vans wages of factory workers
managing director’s salary
machinery
Unit 1: Planning and financing a business
Financial planning
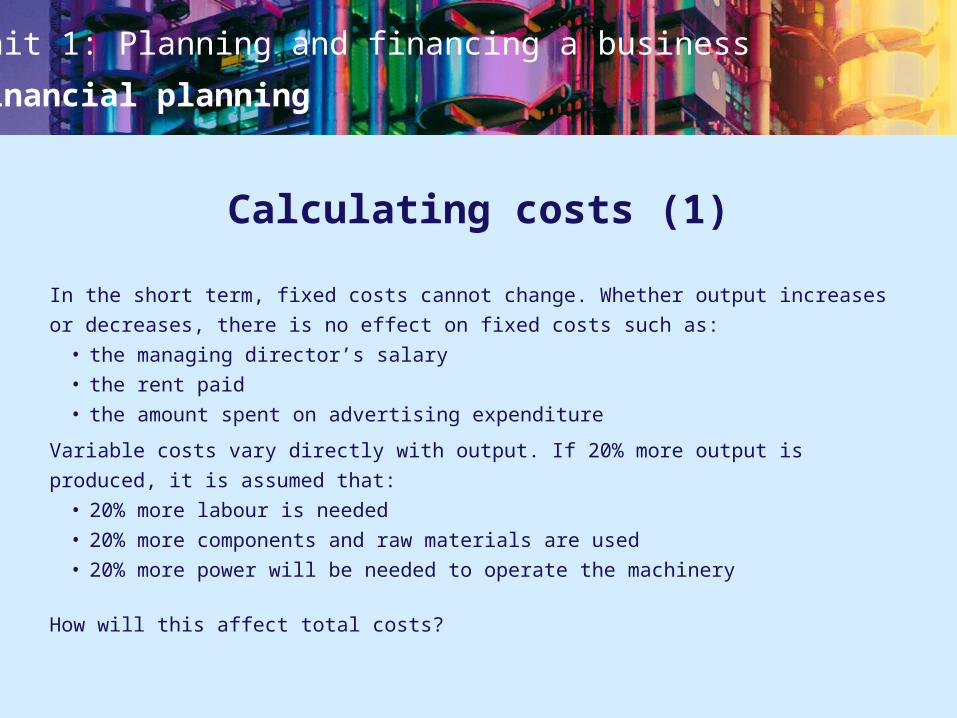
Calculating costs (1)
In the short term, fixed costs cannot change. Whether output increases or decreases,
there is no effect on fixed costs such as:• the managing director’s salary• the rent paid• the amount spent on advertising expenditure
Variable costs vary directly with output. If 20% more output is produced, it is
assumed that:• 20% more labour is needed• 20% more components and raw materials are used• 20% more power will be needed to operate the machinery
How will this affect total costs?
Unit 1: Planning and financing a business
Financial planning
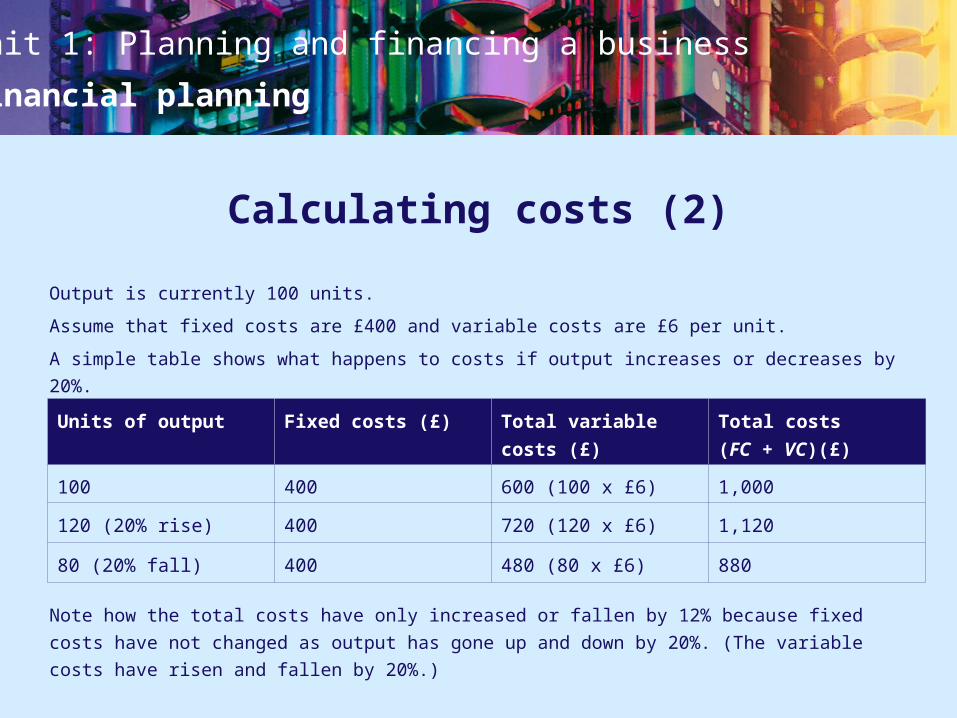
Calculating costs (2)
Output is currently 100 units.
Assume that fixed costs are £400 and variable costs are £6 per unit.
A simple table shows what happens to costs if output increases or decreases by 20%.
Note how the total costs have only increased or fallen by 12% because fixed costs
have not changed as output has gone up and down by 20%. (The variable costs have
risen and fallen by 20%.)
Units of output Fixed costs (£) Total variable
costs (£)
Total costs
(FC + VC)(£)
100 400 600 (100 x £6) 1,000
120 (20% rise) 400 720 (120 x £6) 1,120
80 (20% fall) 400 480 (80 x £6) 880
Unit 1: Planning and financing a business
Financial planning
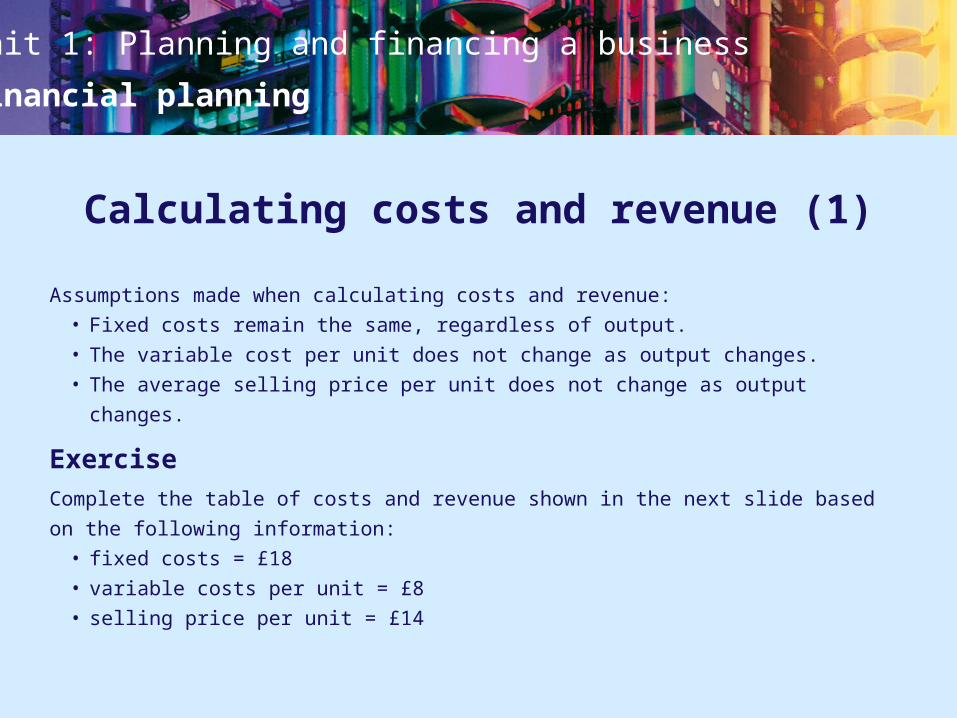
Calculating costs and revenue (1)
Assumptions made when calculating costs and revenue:• Fixed costs remain the same, regardless of output.• The variable cost per unit does not change as output changes.• The average selling price per unit does not change as output changes.
ExerciseComplete the table of costs and revenue shown in the next slide based on the
following information:• fixed costs = £18• variable costs per unit = £8• selling price per unit = £14
Unit 1: Planning and financing a business
Financial planning
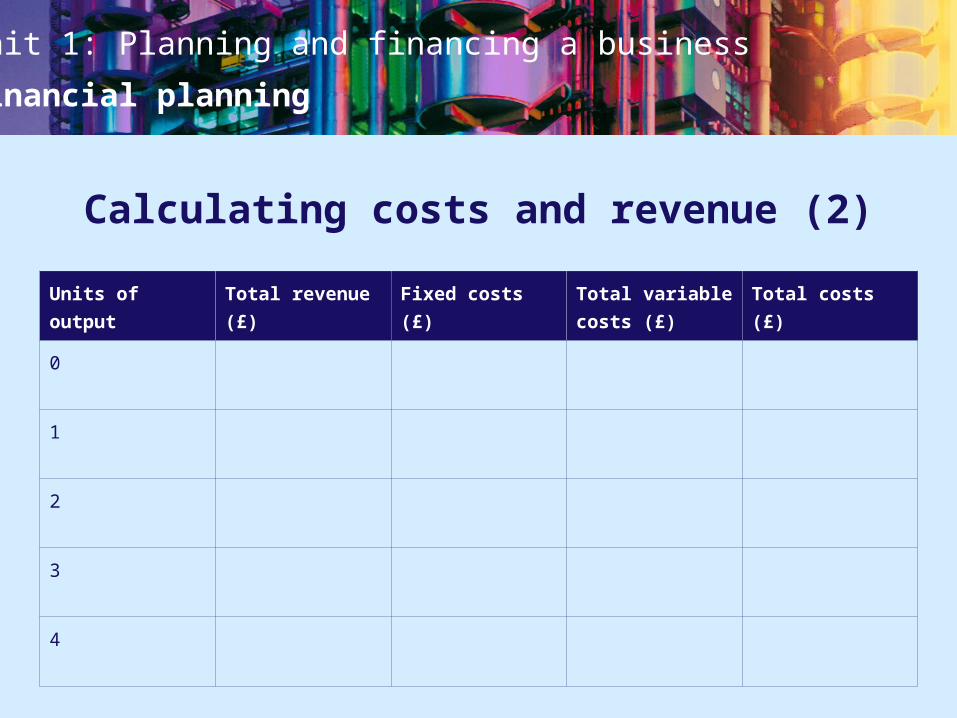
Calculating costs and revenue (2)
Units of
output
Total revenue
(£)
Fixed costs (£) Total variable
costs (£)
Total costs (£)
0
1
2
3
4
Unit 1: Planning and financing a business
Financial planning
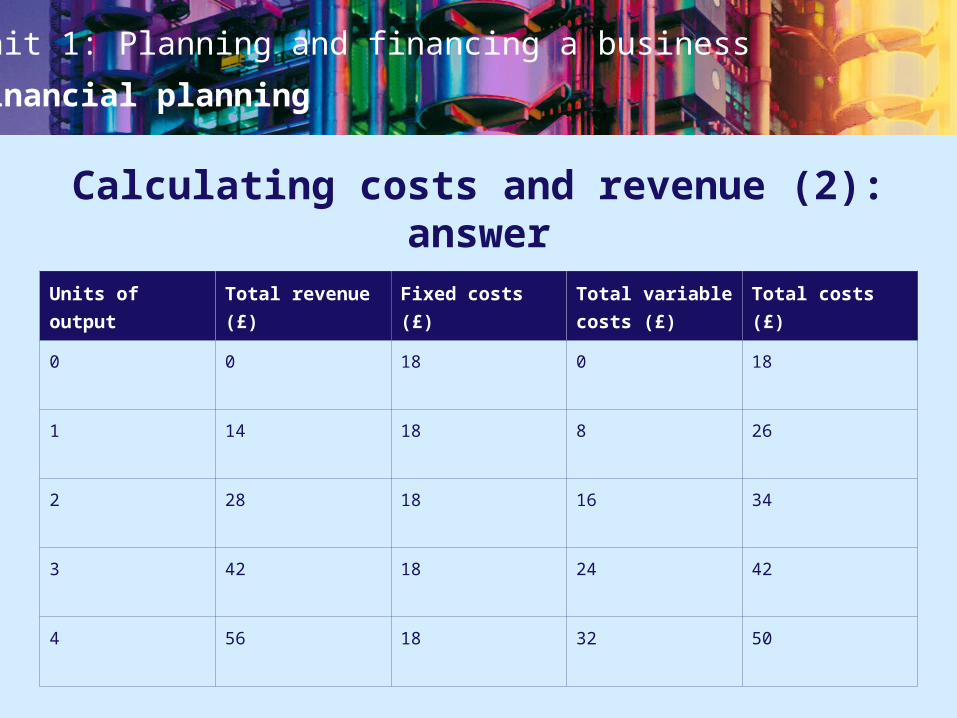
Calculating costs and revenue (2): answer
Units of
output
Total revenue
(£)
Fixed costs (£) Total variable
costs (£)
Total costs (£)
0 0 18 0 18
1 14 18 8 26
2 28 18 16 34
3 42 18 24 42
4 56 18 32 50
Unit 1: Planning and financing a business
Financial planning
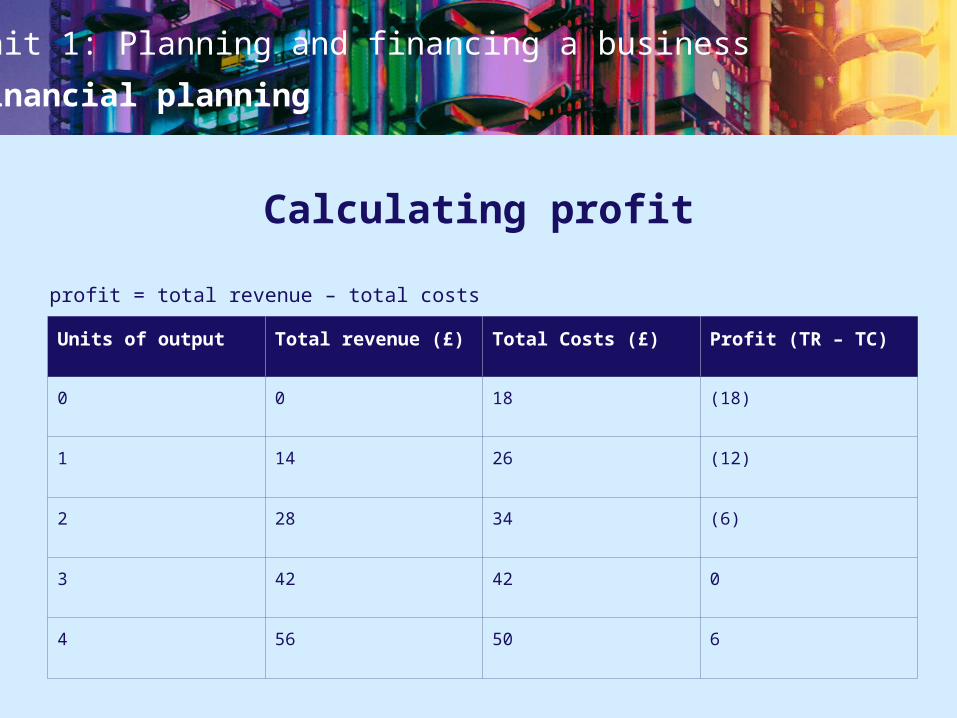
Calculating profit
profit = total revenue – total costs
Units of output Total revenue (£) Total Costs (£) Profit (TR – TC)
0 0 18 (18)
1 14 26 (12)
2 28 34 (6)
3 42 42 0
4 56 50 6
Unit 1: Planning and financing a business
Financial planning
Units of
output
Total
revenue (£)
Fixed costs
(£)
Total variable
costs (£)
Total
costs (£)
Profit (£)
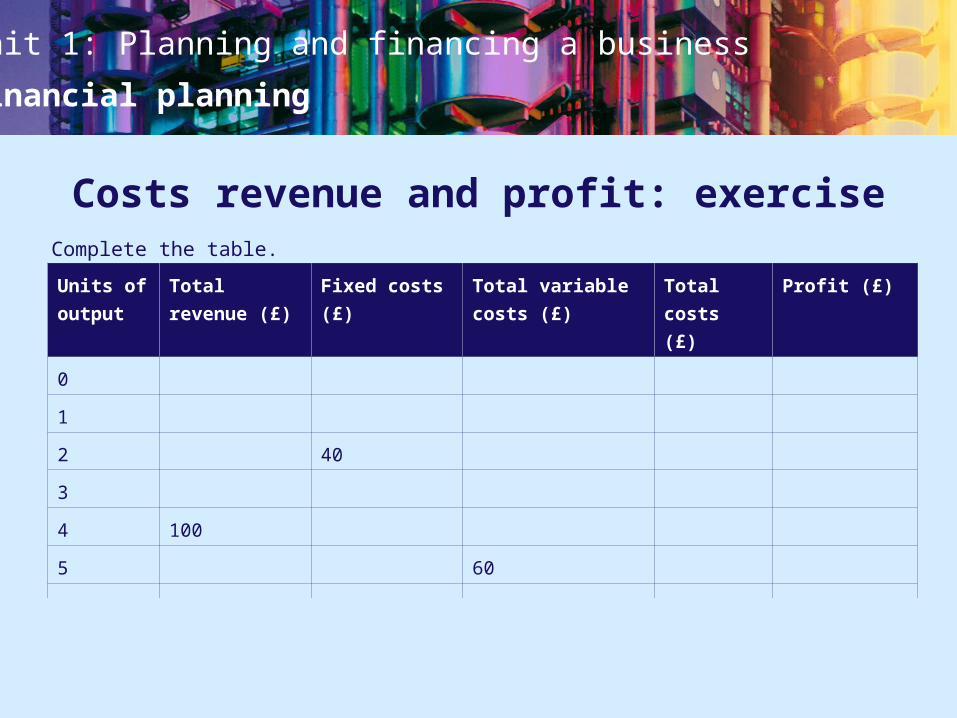
0
1
2 40
3
4 100
5 60
6
Costs revenue and profit: exercise
Clue 1: If 4 units earn £100, what is the selling price?
Clue 2: In the short term, fixed costs are…?
Clue 3: Use the logic in Clue 1 to work out the variable cost per unit.
Clue 1: If 4 units earn £100, what is the selling price?
Clue 2: In the short term, fixed costs are…?
Clue 1: If 4 units earn £100, what is the selling price?
Complete the table.
Unit 1: Planning and financing a business
Financial planning
Units of
output
Total
revenue (£)
Fixed costs
(£)
Total variable
costs (£)
Total
costs (£)
Profit (£)
0
1
2 40
3
4 100
5 60
6
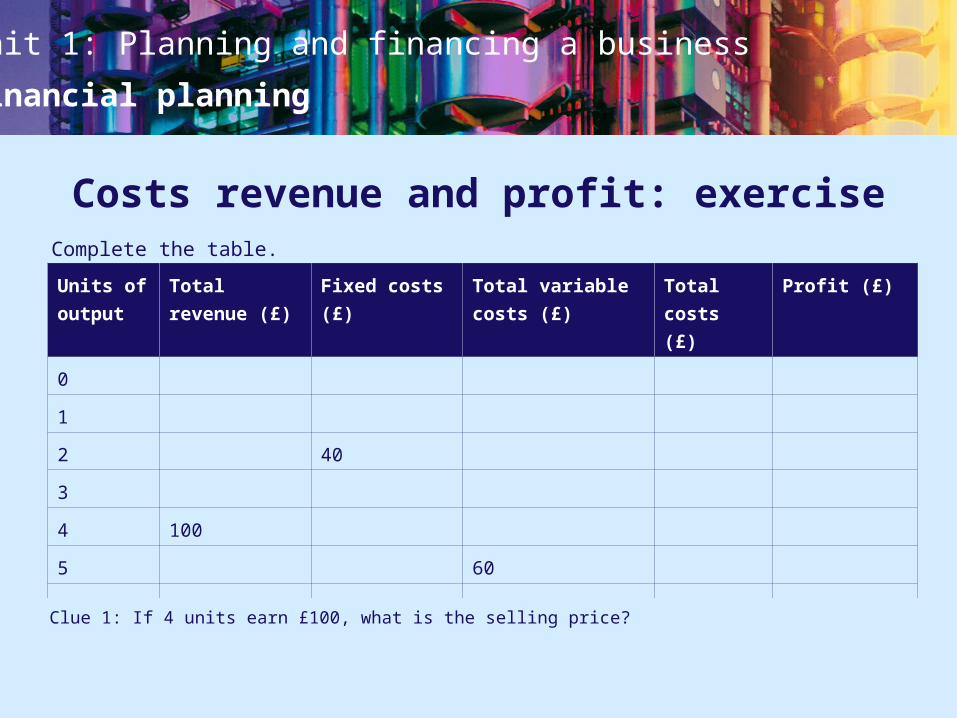
Costs revenue and profit: exercise
Clue 1: If 4 units earn £100, what is the selling price?
Clue 2: In the short term, fixed costs are…?
Clue 3: Use the logic in Clue 1 to work out the variable cost per unit.
Clue 1: If 4 units earn £100, what is the selling price?
Clue 2: In the short term, fixed costs are…?
Clue 1: If 4 units earn £100, what is the selling price?
Complete the table.

Unit 1: Planning and financing a business
Financial planning
Units of
output
Total
revenue (£)
Fixed costs
(£)
Total variable
costs (£)
Total
costs (£)
Profit (£)
0
1
2 40
3
4 100
5 60
6
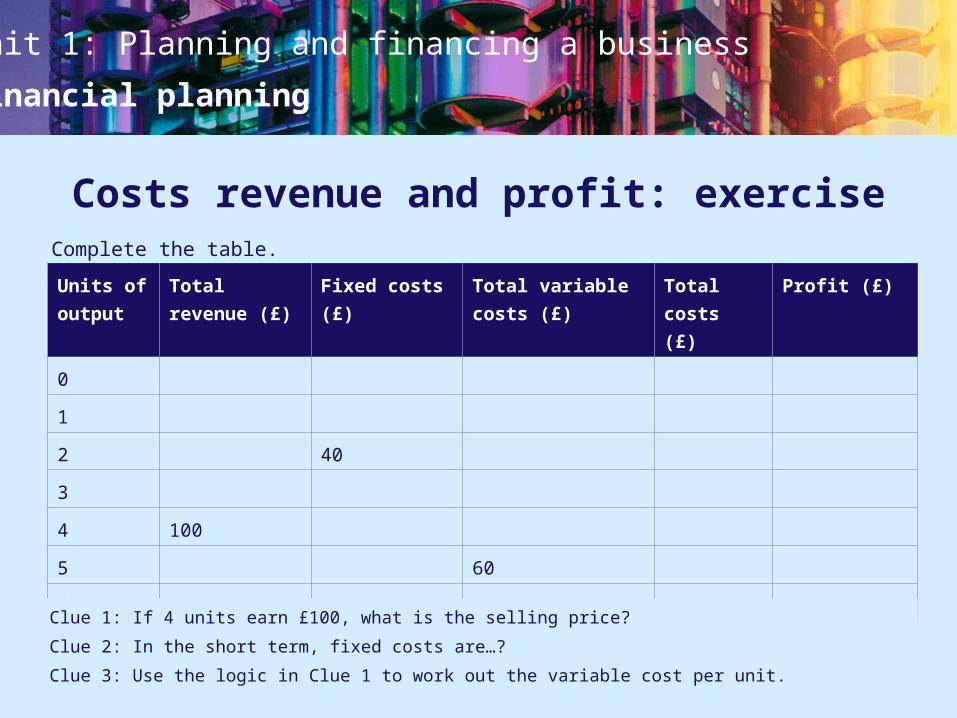
Costs revenue and profit: exercise
Clue 1: If 4 units earn £100, what is the selling price?
Clue 2: In the short term, fixed costs are…?
Clue 3: Use the logic in Clue 1 to work out the variable cost per unit.
Clue 1: If 4 units earn £100, what is the selling price?
Clue 2: In the short term, fixed costs are…?
Complete the table.
Unit 1: Planning and financing a business
Financial planning
Units of
output
Total
revenue (£)
Fixed costs
(£)
Total variable
costs (£)
Total
costs (£)
Profit (£)
0
1
2 40
3
4 100
5 60
6
Costs revenue and profit: exercise
Clue 1: If 4 units earn £100, what is the selling price?
Clue 2: In the short term, fixed costs are…?
Clue 3: Use the logic in Clue 1 to work out the variable cost per unit.
Complete the table.
Unit 1: Planning and financing a business
Financial planning
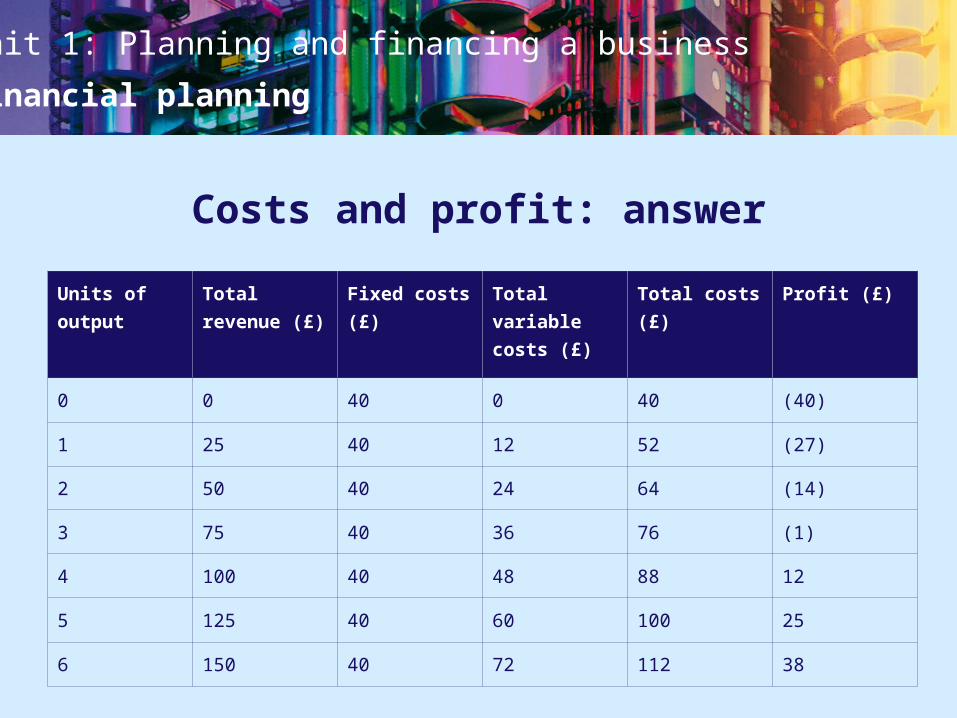
Costs and profit: answer
Units of
output
Total
revenue (£)
Fixed costs
(£)
Total
variable
costs (£)
Total costs
(£)
Profit (£)
0 0 40 0 40 (40)
1 25 40 12 52 (27)
2 50 40 24 64 (14)
3 75 40 36 76 (1)
4 100 40 48 88 12
5 125 40 60 100 25
6 150 40 72 112 38
Unit 1: Planning and financing a business
Financial planning
Costs, revenue and profit: follow-up exercise
Complete the practice exercises and the case study questions at the end of Chapter
11 of the textbook.
Unit 1: Planning and financing a business
Financial planning
Chapter 12
Using breakeven analysis to make decisions
Unit 1: Planning and financing a business
Financial planning
Contribution
contribution per unit: selling price per unit – variable costs per unit.
Example: if variable costs are 47p and the product sells for 88p, the contribution per
unit is 41p (88p – 47p).
total contribution: the difference between total revenue and total variable costs.
The total contribution of a product can be calculated in two ways:
contribution per unit × no. of units sold
sales revenue – total variable costs
Unit 1: Planning and financing a business
Financial planning
Calculating total contribution
Using the data on the previous slide, calculate the total contribution if 100 items are
sold.
Method 1total contribution = contribution per unit × no. of units sold
= 41p × 100 = £41
Method 2total contribution = sales revenue – total variable costs
= (88p × 100) – (47p × 100)
= £88 – £47 = £41
Unit 1: Planning and financing a business
Financial planning
Calculating contribution per unit and total contribution (1)
Calculate the total contribution based on the following data:
units sold = 30
selling price = £6 per unit
variable costs = £2.60 per unit
Unit 1: Planning and financing a business
Financial planning
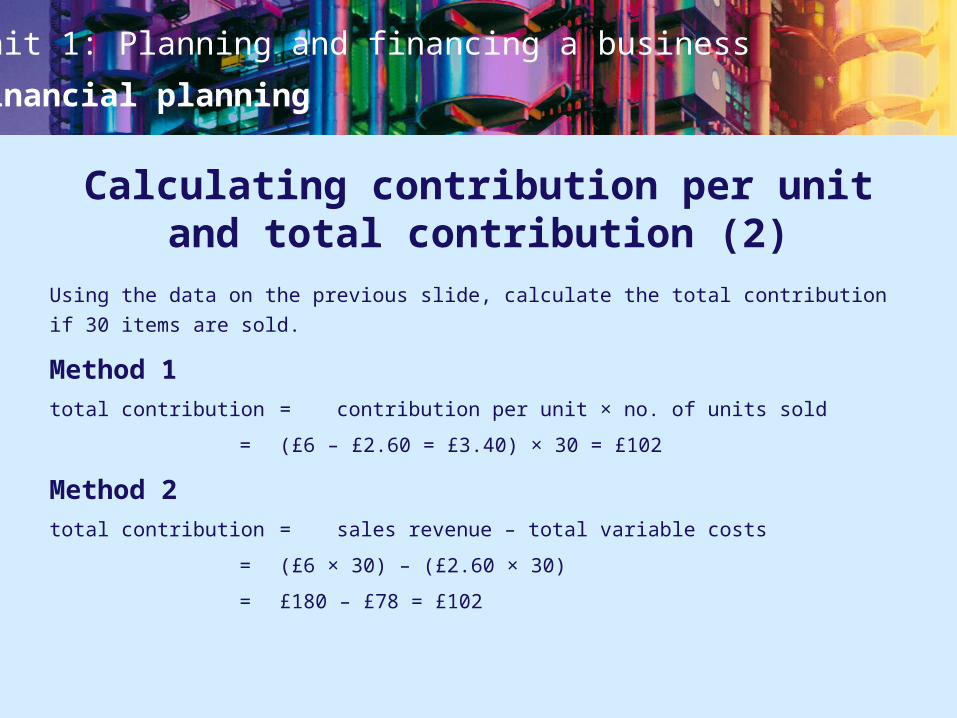
Calculating contribution per unit and total contribution (2)
Using the data on the previous slide, calculate the total contribution if 30 items are
sold.
Method 1total contribution = contribution per unit × no. of units sold
= (£6 – £2.60 = £3.40) × 30 = £102
Method 2total contribution = sales revenue – total variable costs
= (£6 × 30) – (£2.60 × 30)
= £180 – £78 = £102
Unit 1: Planning and financing a business
Financial planning
Significance of total contribution
If the total contribution exceeds the fixed costs, the business is making a profit.
If the fixed costs exceed the total contribution, the firm is making a loss.
A firm will break even if the total contribution is equal to the fixed costs
(or if TR = TC).
Unit 1: Planning and financing a business
Financial planning
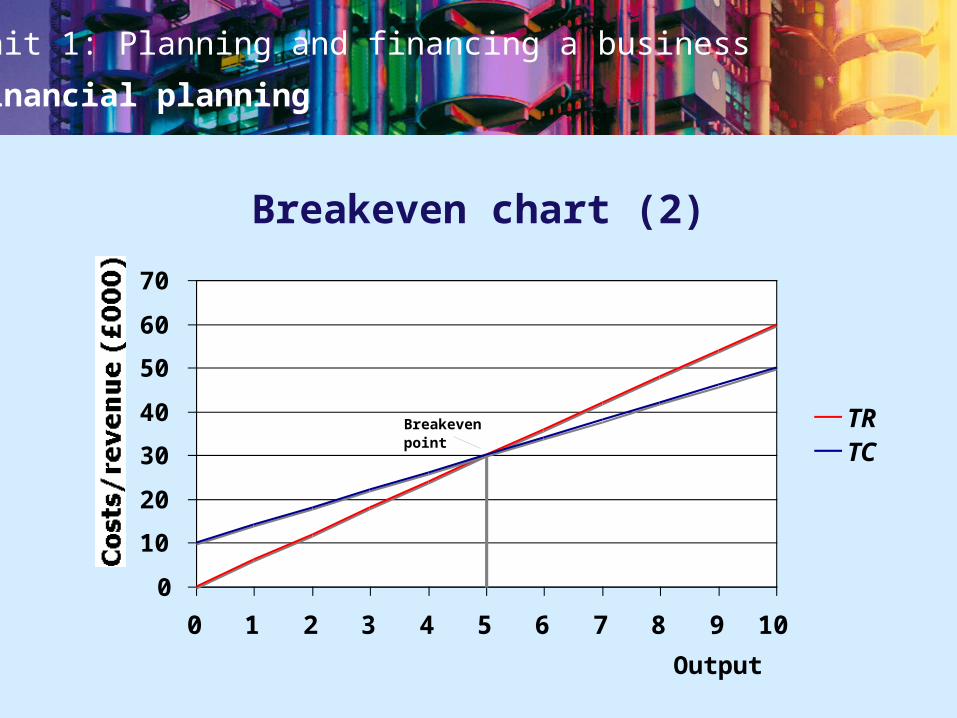
Breakeven
breakeven output: the level of output at which total sales revenue is equal to total
costs of production.
breakeven analysis: the study of the relationship between total costs and total
revenue to identify the output at which a business breaks even (i.e. makes neither a
profit nor a loss).
A business can also use breakeven analysis to discover the impact of changes in
output on its profit levels.
Unit 1: Planning and financing a business
Financial planning
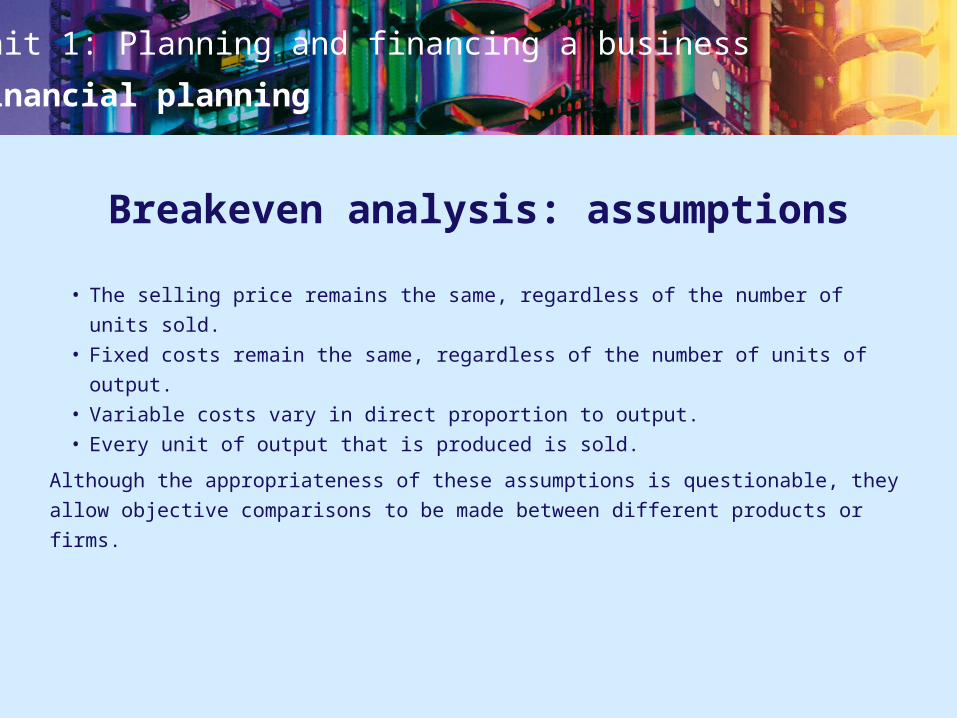
Breakeven analysis: assumptions
• The selling price remains the same, regardless of the number of units sold.• Fixed costs remain the same, regardless of the number of units of output.• Variable costs vary in direct proportion to output. • Every unit of output that is produced is sold.
Although the appropriateness of these assumptions is questionable, they allow
objective comparisons to be made between different products or firms.
Unit 1: Planning and financing a business
Financial planning
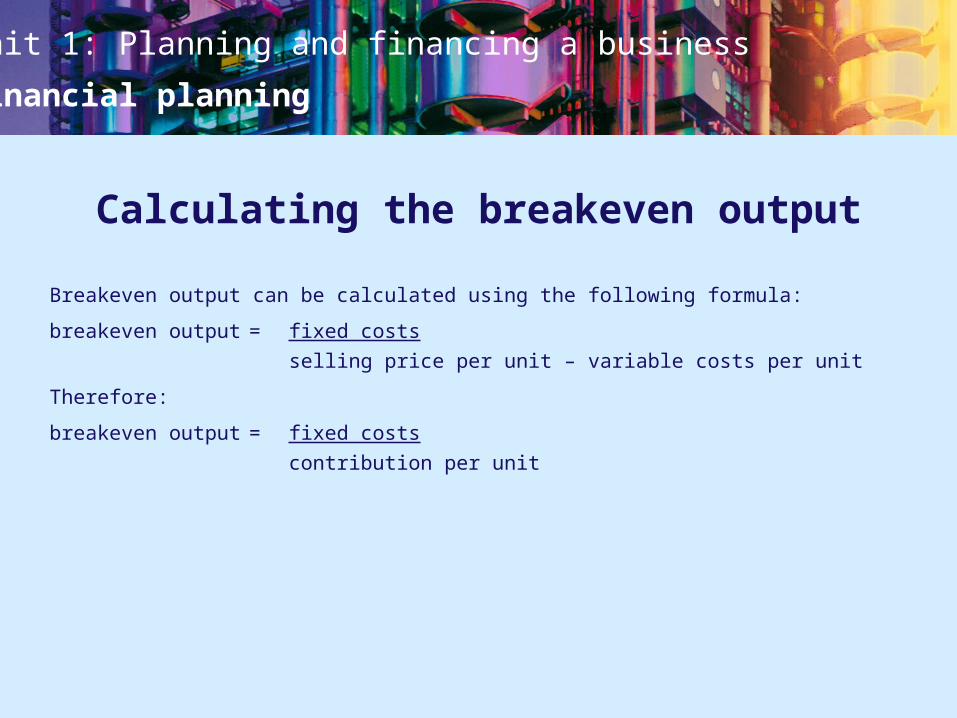
Calculating the breakeven output
Breakeven output can be calculated using the following formula:
breakeven output = fixed costs
selling price per unit – variable costs per unit
Therefore:
breakeven output = fixed costs
contribution per unit
Unit 1: Planning and financing a business
Financial planning
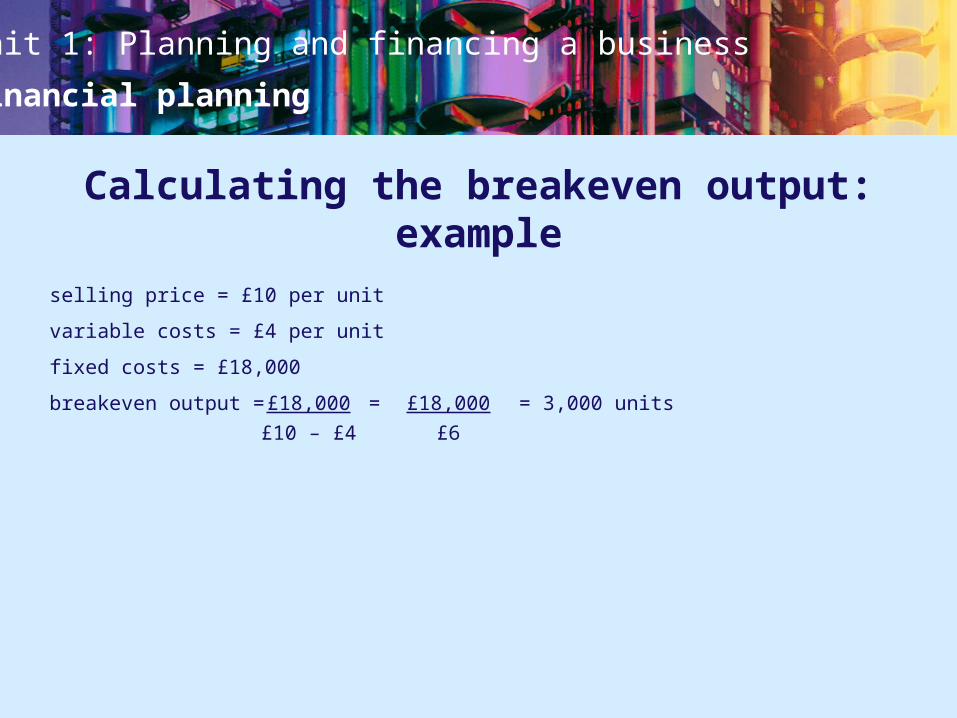
Calculating the breakeven output: example
selling price = £10 per unit
variable costs = £4 per unit
fixed costs = £18,000
breakeven output = £18,000 = £18,000 = 3,000 units
£10 – £4 £6
Unit 1: Planning and financing a business
Financial planning
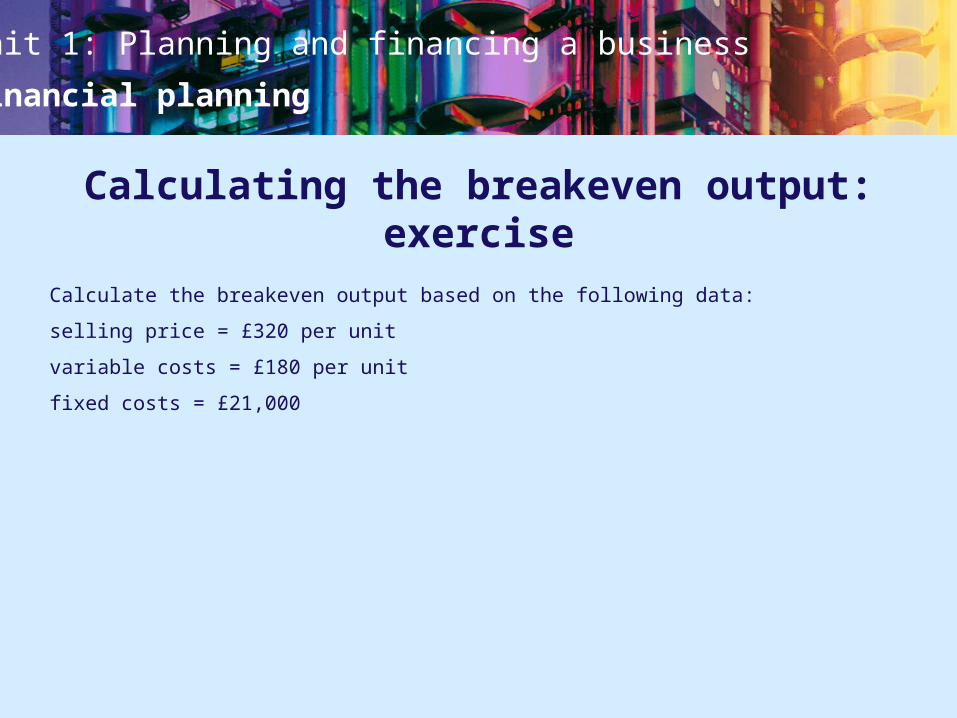
Calculating the breakeven output: exercise
Calculate the breakeven output based on the following data:
selling price = £320 per unit
variable costs = £180 per unit
fixed costs = £21,000
Unit 1: Planning and financing a business
Financial planning
0
10
20
30
40
50
60
70
0 1 2 3 4 5 6 7 8 9 10
Output
Costs/revenue (£000s)
VCFCTC
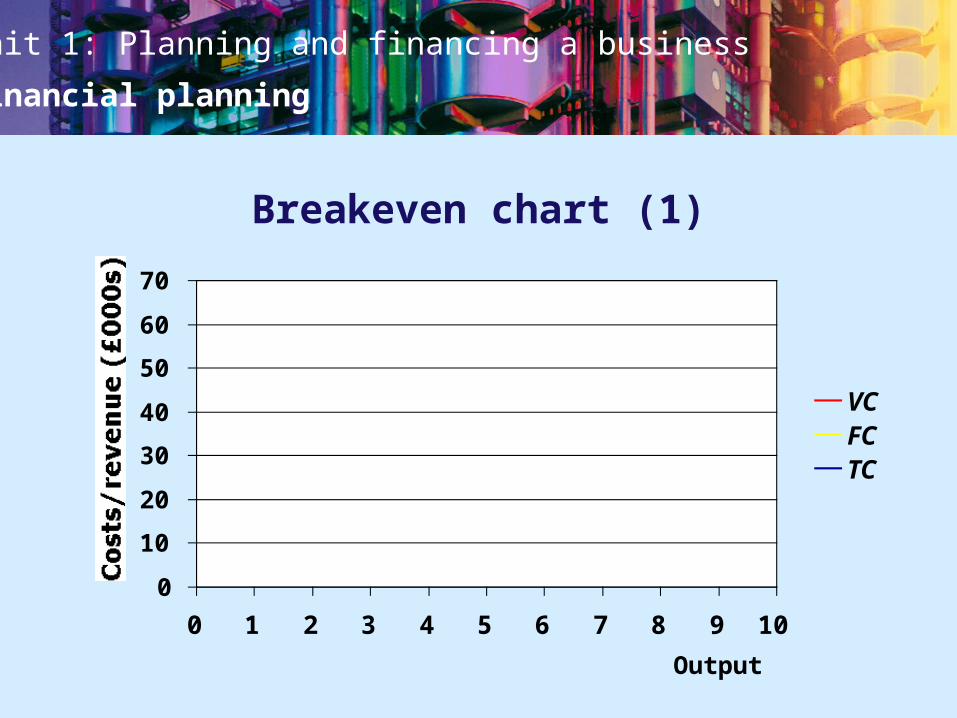
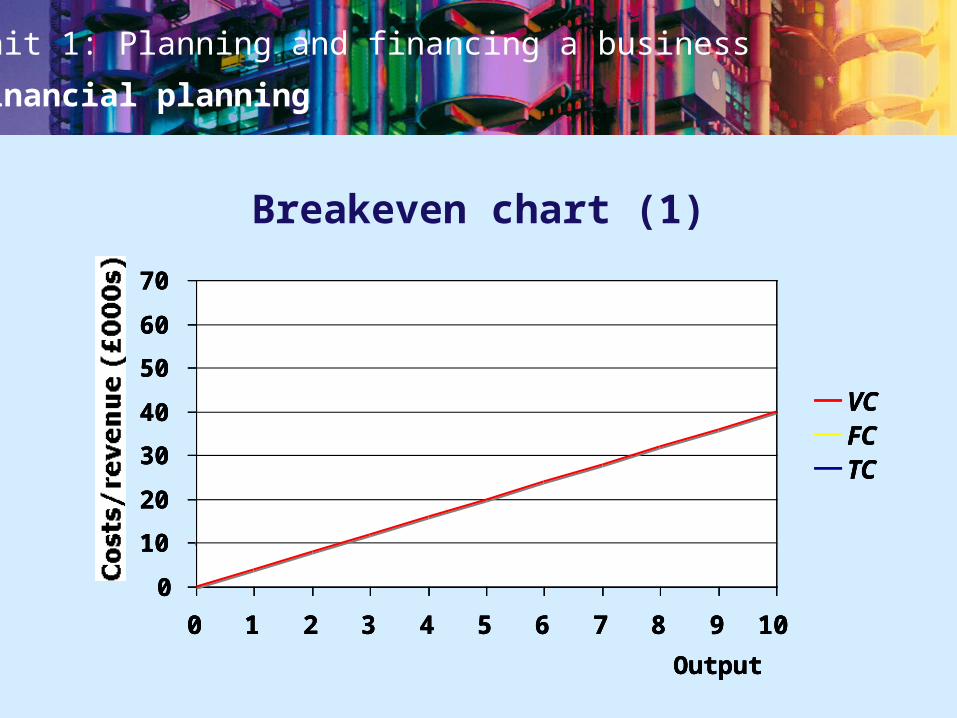
Breakeven chart (1)
Unit 1: Planning and financing a business
Financial planning
0
10
20
30
40
50
60
70
0 1 2 3 4 5 6 7 8 9 10
Output
Costs/revenue (£000s)
VCFCTC
0
10
20
30
40
50
60
70
0 1 2 3 4 5 6 7 8 9 10
Output
Costs/revenue (£000s)
VCFCTC
0
10
20
30
40
50
60
70
0 1 2 3 4 5 6 7 8 9 10
Output
Costs/revenue (£000s)
VCFCTC
Breakeven chart (1)

Unit 1: Planning and financing a business
Financial planning
0
10
20
30
40
50
60
70
0 1 2 3 4 5 6 7 8 9 10
Output
Costs/revenue (£000s)
VCFCTC
0
10
20
30
40
50
60
70
0 1 2 3 4 5 6 7 8 9 10
Output
Costs/revenue (£000s)
VCFCTC
Breakeven chart (1)

Unit 1: Planning and financing a business
Financial planning
0
10
20
30
40
50
60
70
0 1 2 3 4 5 6 7 8 9 10
Output
Costs/revenue (£000s)
VCFCTC
Breakeven chart (1)

Unit 1: Planning and financing a business
Financial planning
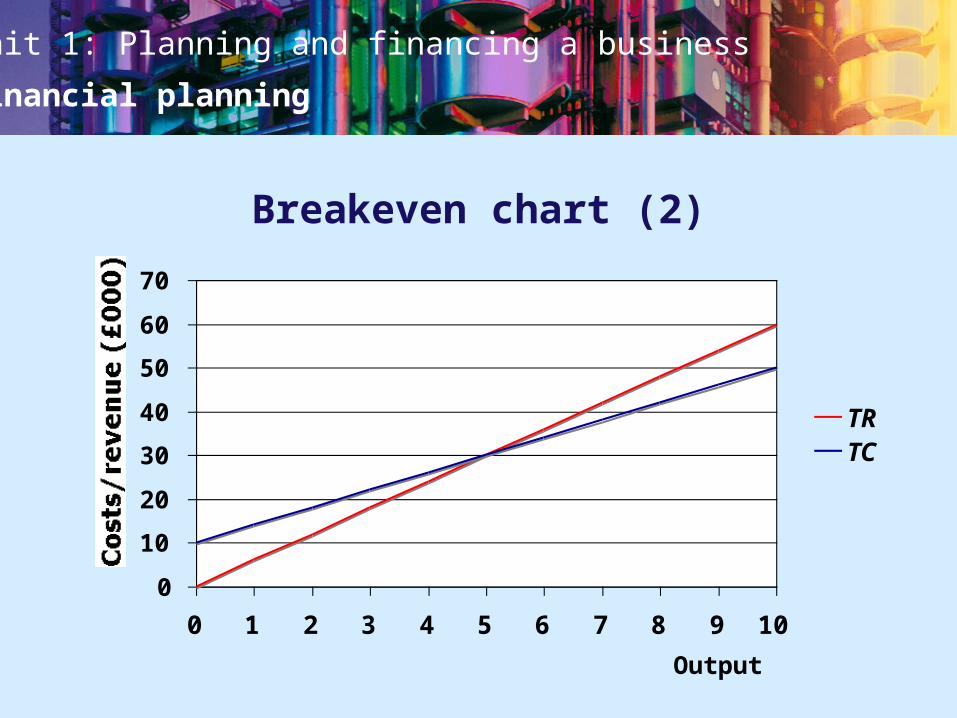
Breakeven chart (2)
0
10
20
30
40
50
60
70
0 1 2 3 4 5 6 7 8 9 10
Output
Costs/revenue (£000)
TRTC

Unit 1: Planning and financing a business
Financial planning
0
10
20
30
40
50
60
70
0 1 2 3 4 5 6 7 8 9 10
Output
Costs/revenue (£000)
TRTC
Breakeven chart (2)
Unit 1: Planning and financing a business
Financial planning
0
10
20
30
40
50
60
70
0 1 2 3 4 5 6 7 8 9 10
Output
Costs/revenue (£000)
TRTC
Breakeven chart (2)
Unit 1: Planning and financing a business
Financial planning
0
10
20
30
40
50
60
70
0 1 2 3 4 5 6 7 8 9 10
Output
Costs/revenue (£000)
TRTC
Breakevenpoint
Breakeven chart (2)
Unit 1: Planning and financing a business
Financial planning
0
10
20
30
40
0 100 200 300 400 500 600 700 800
Output
Costs/revenue (£000s)
TRTCVCFC
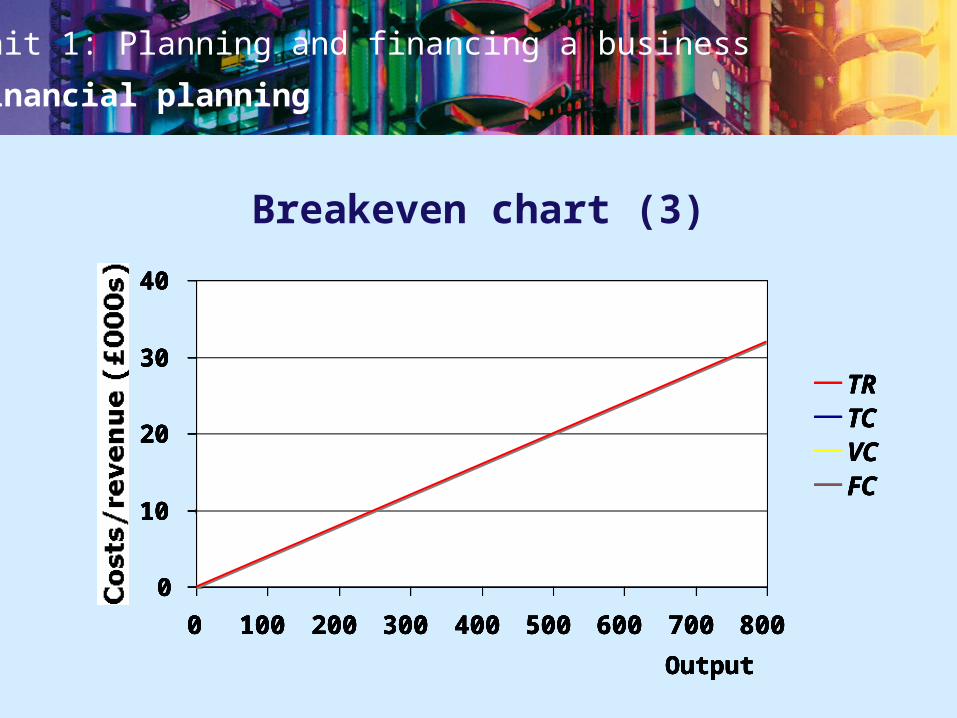
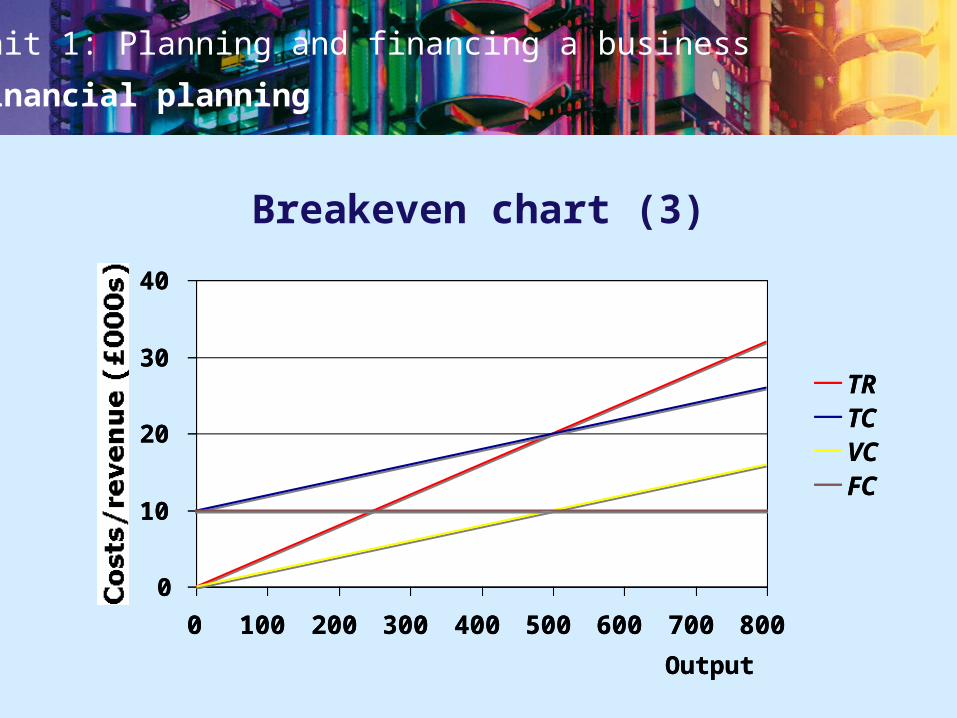
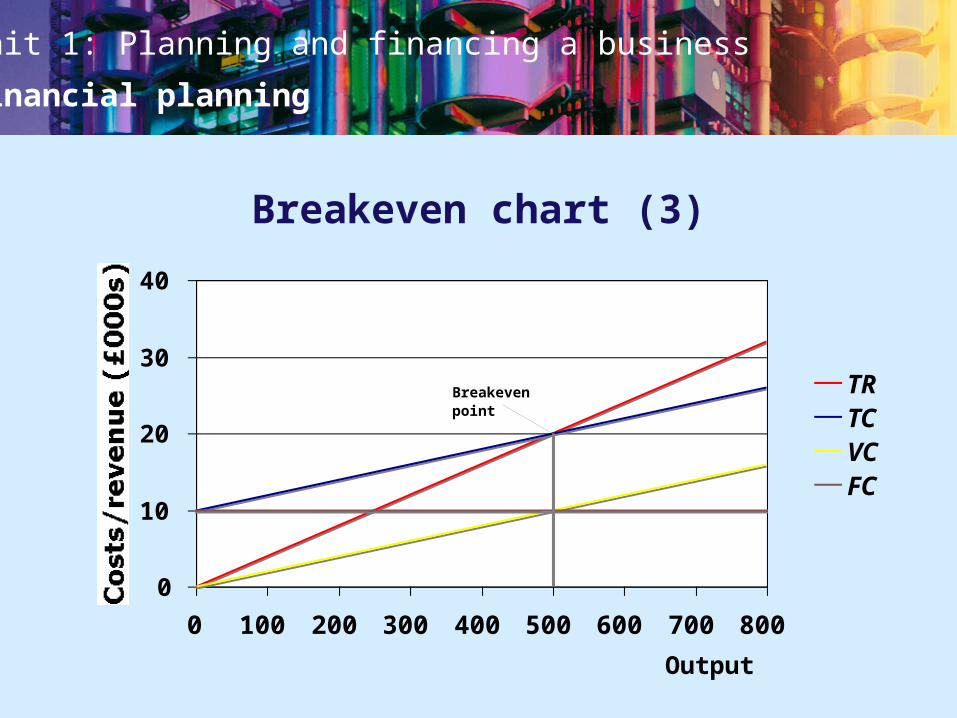
Breakeven chart (3)
Unit 1: Planning and financing a business
Financial planning
0
10
20
30
40
0 100 200 300 400 500 600 700 800
Output
Costs/revenue (£000s)
TRTCVCFC
Breakeven point
0
10
20
30
40
0 100 200 300 400 500 600 700 800
Output
Costs/revenue (£000s)
TRTCVCFC
0
10
20
30
40
0 100 200 300 400 500 600 700 800
Output
Costs/revenue (£000s)
TRTCVCFC
0
10
20
30
40
0 100 200 300 400 500 600 700 800
Output
Costs/revenue (£000s)
TRTCVCFC
0
10
20
30
40
0 100 200 300 400 500 600 700 800
Output
Costs/revenue (£000s)
TRTCVCFC
Breakeven chart (3)

Unit 1: Planning and financing a business
Financial planning
0
10
20
30
40
0 100 200 300 400 500 600 700 800
Output
Costs/revenue (£000s)
TRTCVCFC
Breakeven point
0
10
20
30
40
0 100 200 300 400 500 600 700 800
Output
Costs/revenue (£000s)
TRTCVCFC
0
10
20
30
40
0 100 200 300 400 500 600 700 800
Output
Costs/revenue (£000s)
TRTCVCFC
0
10
20
30
40
0 100 200 300 400 500 600 700 800
Output
Costs/revenue (£000s)
TRTCVCFC
Breakeven chart (3)

Unit 1: Planning and financing a business
Financial planning
0
10
20
30
40
0 100 200 300 400 500 600 700 800
Output
Costs/revenue (£000s)
TRTCVCFC
Breakeven point
0
10
20
30
40
0 100 200 300 400 500 600 700 800
Output
Costs/revenue (£000s)
TRTCVCFC
0
10
20
30
40
0 100 200 300 400 500 600 700 800
Output
Costs/revenue (£000s)
TRTCVCFC
Breakeven chart (3)
Unit 1: Planning and financing a business
Financial planning
0
10
20
30
40
0 100 200 300 400 500 600 700 800
Output
Costs/revenue (£000s)
TRTCVCFC
Breakeven point
0
10
20
30
40
0 100 200 300 400 500 600 700 800
Output
Costs/revenue (£000s)
TRTCVCFC
Breakeven chart (3)
Unit 1: Planning and financing a business
Financial planning
0
10
20
30
40
0 100 200 300 400 500 600 700 800
Output
Costs/revenue (£000s)
TRTCVCFC
Breakeven point
Breakeven chart (3)
Unit 1: Planning and financing a business
Financial planning
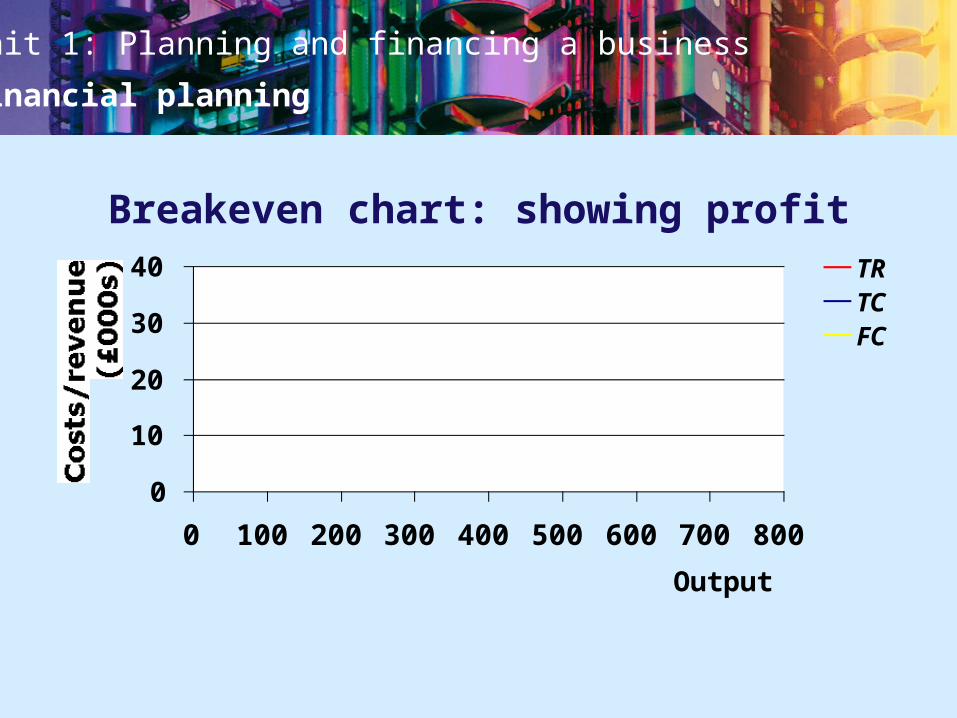
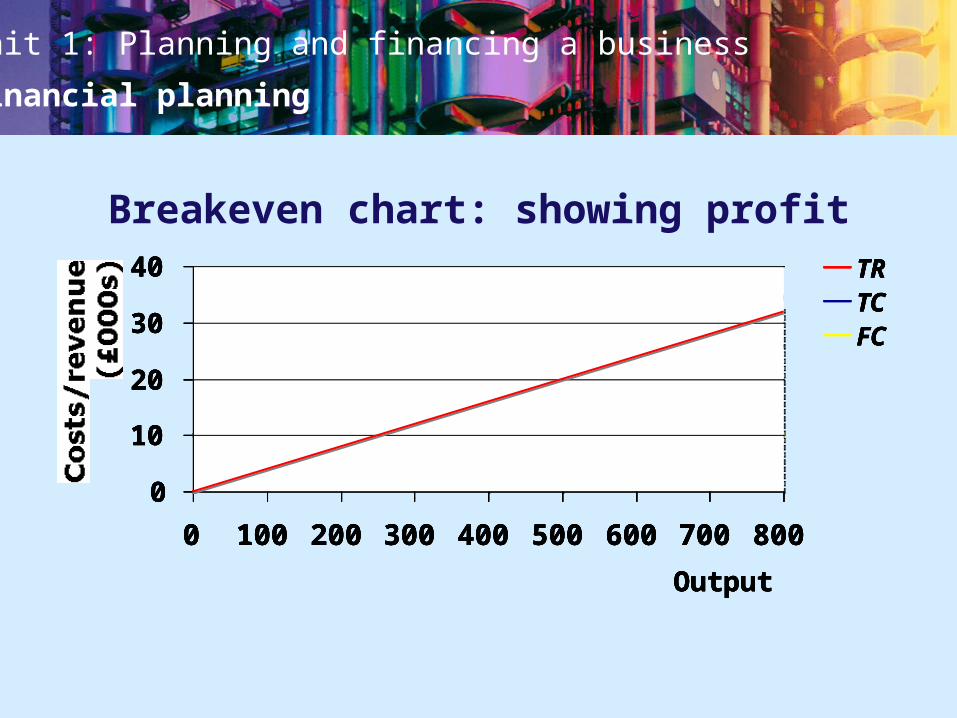
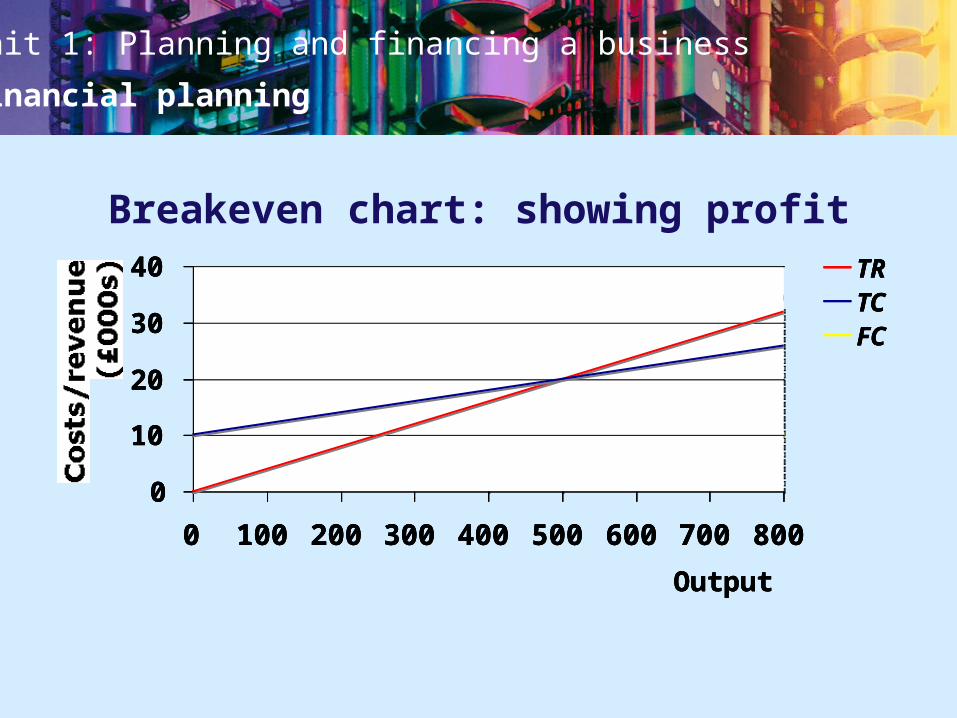
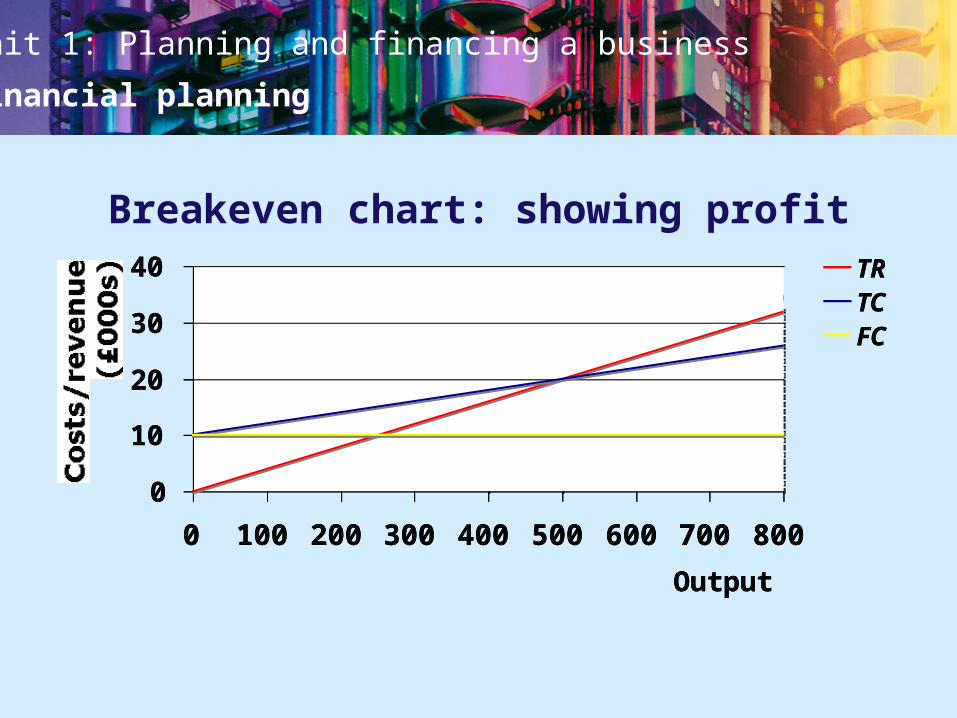
Breakeven chart: showing profit
0
10
20
30
40
0 100 200 300 400 500 600 700 800
Output
Costs/revenue
(£000s)
TRTCFC
Unit 1: Planning and financing a business
Financial planning
0
10
20
30
40
0 100 200 300 400 500 600 700 800
Output
Costs/revenue
(£000s)
TRTCFC
(a)
(b)(c)
(d)
0
10
20
30
40
0 100 200 300 400 500 600 700 800
Output
Costs/revenue
(£000s)
TRTCFC
0
10
20
30
40
0 100 200 300 400 500 600 700 800
Output
Costs/revenue
(£000s)
TRTCFC
0
10
20
30
40
0 100 200 300 400 500 600 700 800
Output
Costs/revenue
(£000s)
TRTCFC
Breakeven chart: showing profit
Unit 1: Planning and financing a business
Financial planning
0
10
20
30
40
0 100 200 300 400 500 600 700 800
Output
Costs/revenue
(£000s)
TRTCFC
(a)
(b)(c)
(d)
0
10
20
30
40
0 100 200 300 400 500 600 700 800
Output
Costs/revenue
(£000s)
TRTCFC
0
10
20
30
40
0 100 200 300 400 500 600 700 800
Output
Costs/revenue
(£000s)
TRTCFC
Breakeven chart: showing profit
Unit 1: Planning and financing a business
Financial planning
0
10
20
30
40
0 100 200 300 400 500 600 700 800
Output
Costs/revenue
(£000s)
TRTCFC
(a)
(b)(c)
(d)
0
10
20
30
40
0 100 200 300 400 500 600 700 800
Output
Costs/revenue
(£000s)
TRTCFC
Breakeven chart: showing profit

Unit 1: Planning and financing a business
Financial planning
0
10
20
30
40
0 100 200 300 400 500 600 700 800
Output
Costs/revenue
(£000s)
TRTCFC
(a)
(b)(c)
(d)
Breakeven chart: showing profit
Unit 1: Planning and financing a business
Financial planning
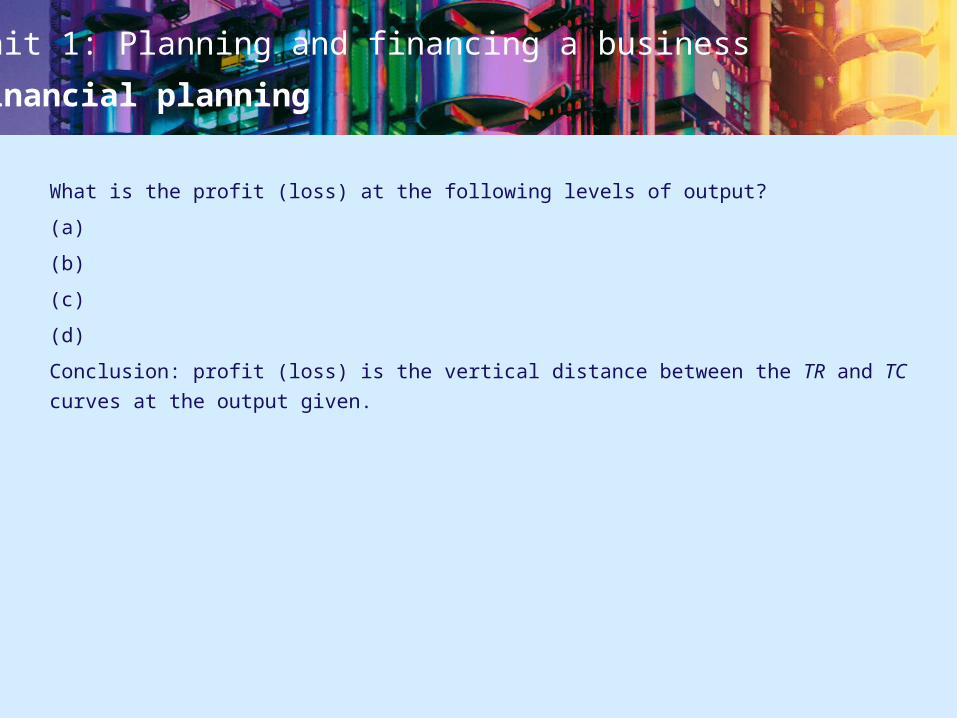
What is the profit (loss) at the following levels of output?
(a)
(b)
(c)
(d)
Conclusion: profit (loss) is the vertical distance between the TR and TC curves at the
output given.
Unit 1: Planning and financing a business
Financial planning
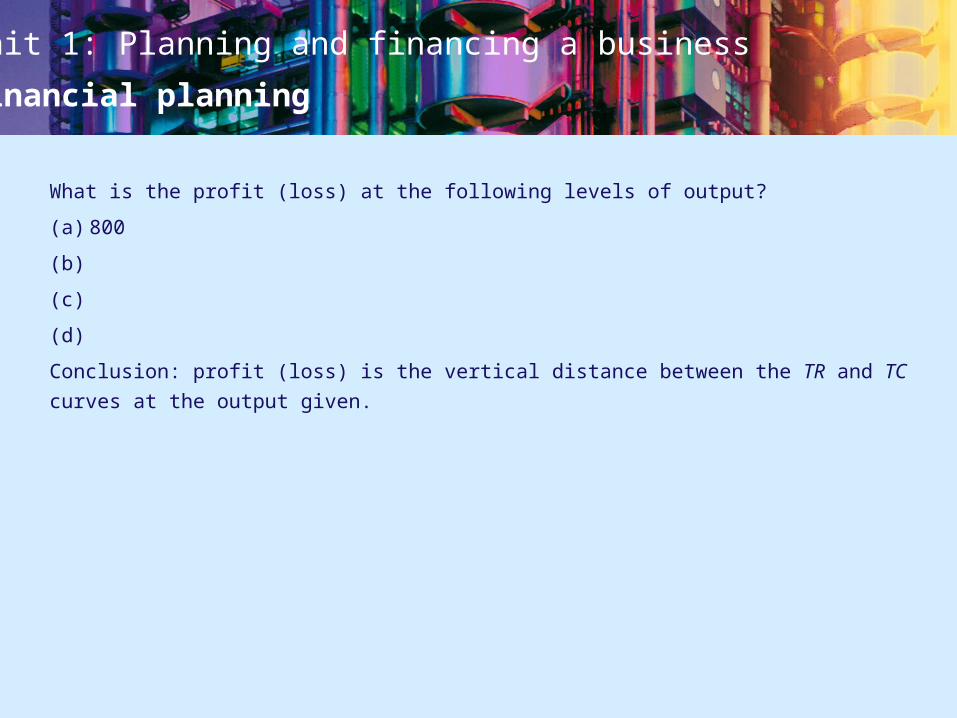
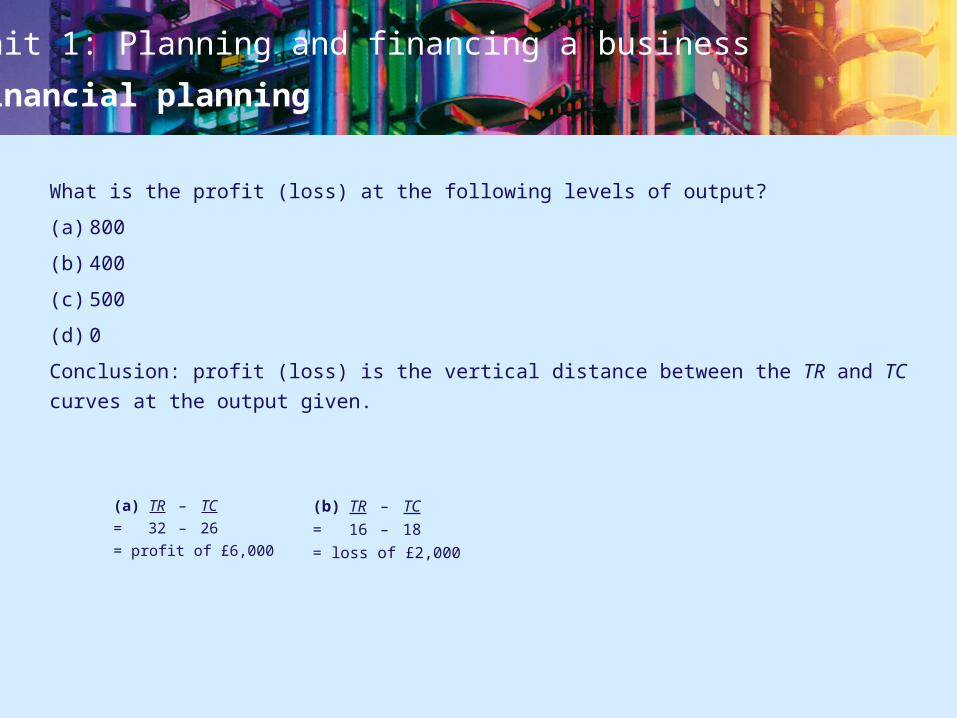
What is the profit (loss) at the following levels of output?
(a) 800
(b) 400
(c) 500
(d) 0
Conclusion: profit (loss) is the vertical distance between the TR and TC curves at the
output given.
What is the profit (loss) at the following levels of output?
(a) 800
(b) 400
(c) 500
(d)
Conclusion: profit (loss) is the vertical distance between the TR and TC curves at the
output given.
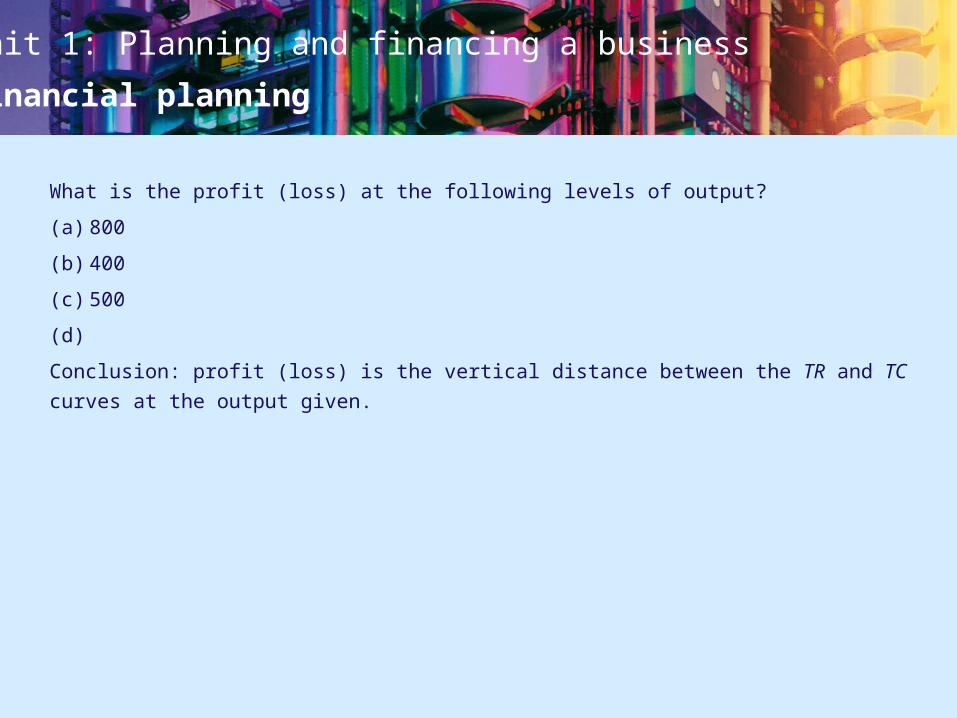
What is the profit (loss) at the following levels of output?
(a) 800
(b) 400
(c)
(d)
Conclusion: profit (loss) is the vertical distance between the TR and TC curves at the
output given.
What is the profit (loss) at the following levels of output?
(a) 800
(b)
(c)
(d)
Conclusion: profit (loss) is the vertical distance between the TR and TC curves at the
output given.
(a) TR – TC
= 32 – 26
= profit of £6,000
(b) TR – TC
= 16 – 18
= loss of £2,000
(c) TR – TC
= 20 – 20
= (breakeven)
(d) TR – TC
= 0 – 10
= loss of £10,000

Unit 1: Planning and financing a business
Financial planning
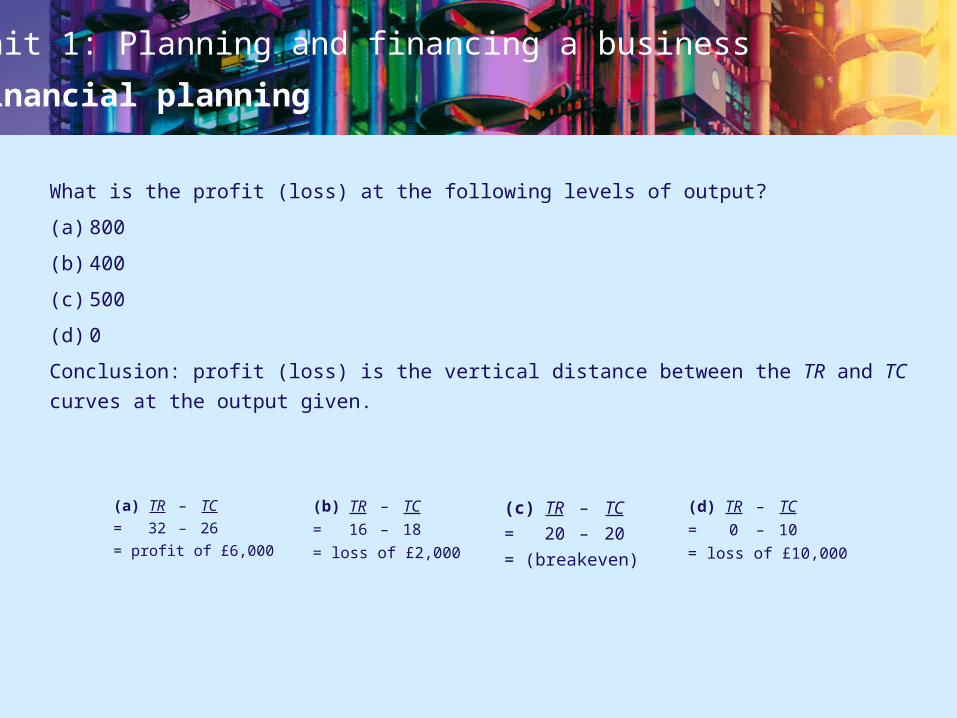
What is the profit (loss) at the following levels of output?
(a) 800
(b) 400
(c) 500
(d) 0
Conclusion: profit (loss) is the vertical distance between the TR and TC curves at the
output given.
What is the profit (loss) at the following levels of output?
(a) 800
(b) 400
(c) 500
(d)
Conclusion: profit (loss) is the vertical distance between the TR and TC curves at the
output given.
What is the profit (loss) at the following levels of output?
(a) 800
(b) 400
(c)
(d)
Conclusion: profit (loss) is the vertical distance between the TR and TC curves at the
output given.
(a) TR – TC
= 32 – 26
= profit of £6,000
(b) TR – TC
= 16 – 18
= loss of £2,000
(c) TR – TC
= 20 – 20
= (breakeven)
(d) TR – TC
= 0 – 10
= loss of £10,000
Unit 1: Planning and financing a business
Financial planning
What is the profit (loss) at the following levels of output?
(a) 800
(b) 400
(c) 500
(d) 0
Conclusion: profit (loss) is the vertical distance between the TR and TC curves at the
output given.
What is the profit (loss) at the following levels of output?
(a) 800
(b) 400
(c) 500
(d)
Conclusion: profit (loss) is the vertical distance between the TR and TC curves at the
output given.
(a) TR – TC
= 32 – 26
= profit of £6,000
(b) TR – TC
= 16 – 18
= loss of £2,000
(c) TR – TC
= 20 – 20
= (breakeven)
(d) TR – TC
= 0 – 10
= loss of £10,000

Unit 1: Planning and financing a business
Financial planning
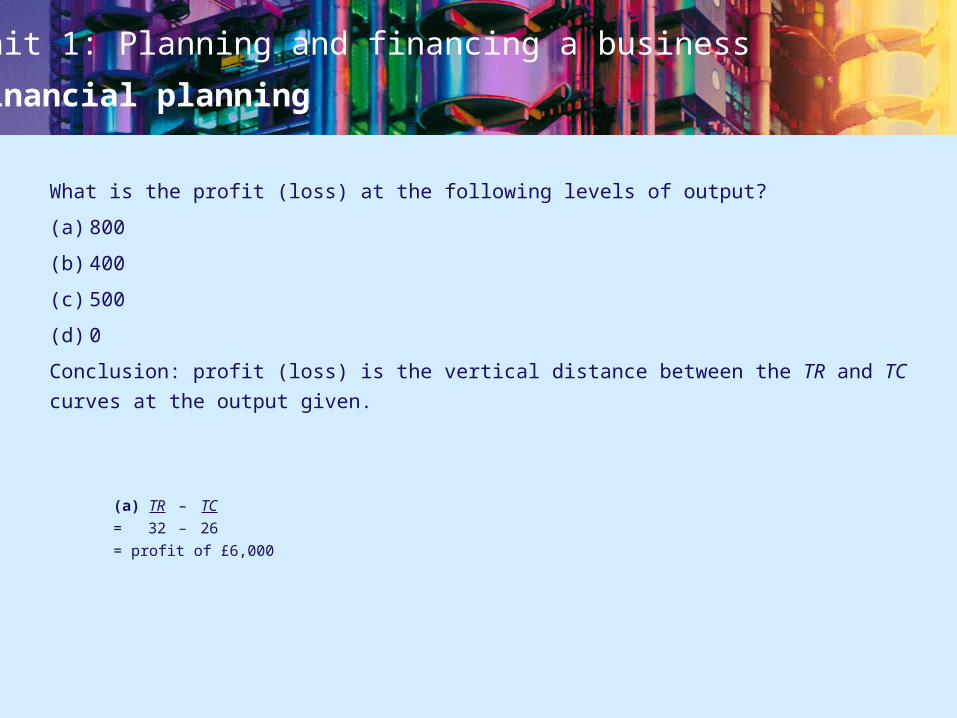
What is the profit (loss) at the following levels of output?
(a) 800
(b) 400
(c) 500
(d) 0
Conclusion: profit (loss) is the vertical distance between the TR and TC curves at the
output given.
(a) TR – TC
= 32 – 26
= profit of £6,000
(b) TR – TC
= 16 – 18
= loss of £2,000
(c) TR – TC
= 20 – 20
= (breakeven)
(d) TR – TC
= 0 – 10
= loss of £10,000
Unit 1: Planning and financing a business
Financial planning
What is the profit (loss) at the following levels of output?
(a) 800
(b) 400
(c) 500
(d) 0
Conclusion: profit (loss) is the vertical distance between the TR and TC curves at the
output given.
(a) TR – TC
= 32 – 26
= profit of £6,000
(b) TR – TC
= 16 – 18
= loss of £2,000
(c) TR – TC
= 20 – 20
= (breakeven)
(d) TR – TC
= 0 – 10
= loss of £10,000
Unit 1: Planning and financing a business
Financial planning
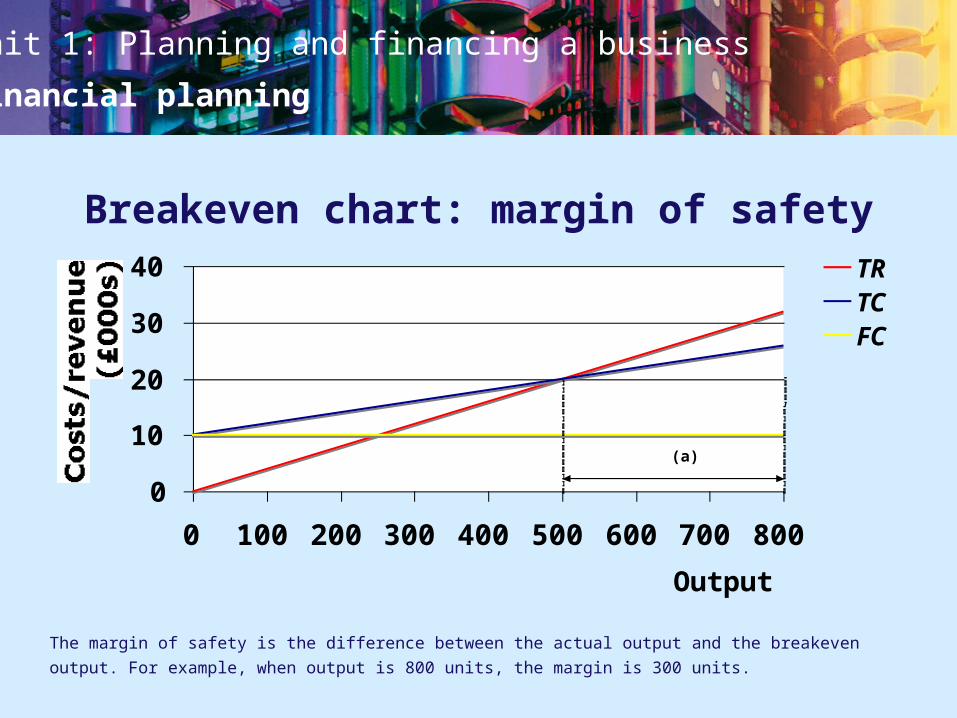
Breakeven chart: margin of safety
The margin of safety is the difference between the actual output and the breakeven
output. For example, when output is 800 units, the margin is 300 units.
0
10
20
30
40
0 100 200 300 400 500 600 700 800
Output
Costs/revenue
(£000s)
TRTCFC
(a)
Unit 1: Planning and financing a business
Financial planning
0
10
20
30
40
0 100 200 300 400 500 600 700 800
Output
Costs/revenue
(£000s)
TRTCFC
(d)0
10
20
30
40
0 100 200 300 400 500 600 700 800
Output
Costs/revenue
(£000s)
TRTCFC
(c)0
10
20
30
40
0 100 200 300 400 500 600 700 800
Output
Costs/revenue
(£000s)
TRTCFC
(b)
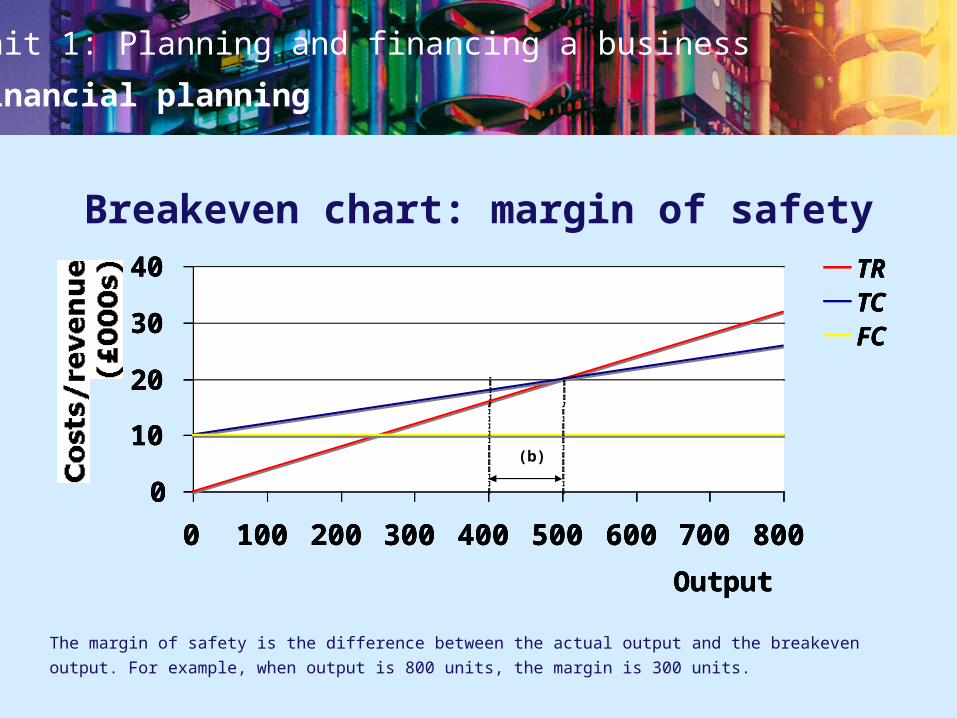
Breakeven chart: margin of safety
The margin of safety is the difference between the actual output and the breakeven
output. For example, when output is 800 units, the margin is 300 units.

Unit 1: Planning and financing a business
Financial planning
0
10
20
30
40
0 100 200 300 400 500 600 700 800
Output
Costs/revenue
(£000s)
TRTCFC
(d)0
10
20
30
40
0 100 200 300 400 500 600 700 800
Output
Costs/revenue
(£000s)
TRTCFC
(c)
The margin of safety is the difference between the actual output and the breakeven
output. For example, when output is 800 units, the margin is 300 units.
Breakeven chart: margin of safety

Unit 1: Planning and financing a business
Financial planning
0
10
20
30
40
0 100 200 300 400 500 600 700 800
Output
Costs/revenue
(£000s)
TRTCFC
(d)
The margin of safety is the difference between the actual output and the breakeven
output. For example, when output is 800 units, the margin is 300 units.
Breakeven chart: margin of safety
Unit 1: Planning and financing a business
Financial planning
Breakeven chart: ‘what if?’ analysis
Breakeven charts can be used to see what happens if one of the variables is
changed: for example, what happens if:• price increases to £50• variable costs fall to £10 per unit• fixed costs increase to £15,000

Unit 1: Planning and financing a business
Financial planning
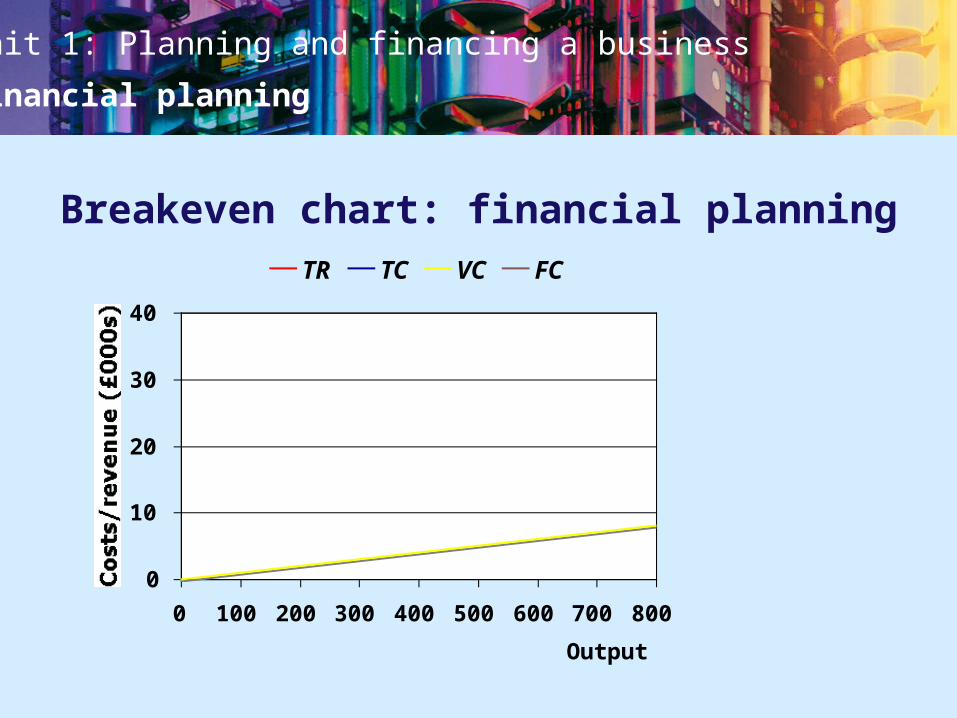
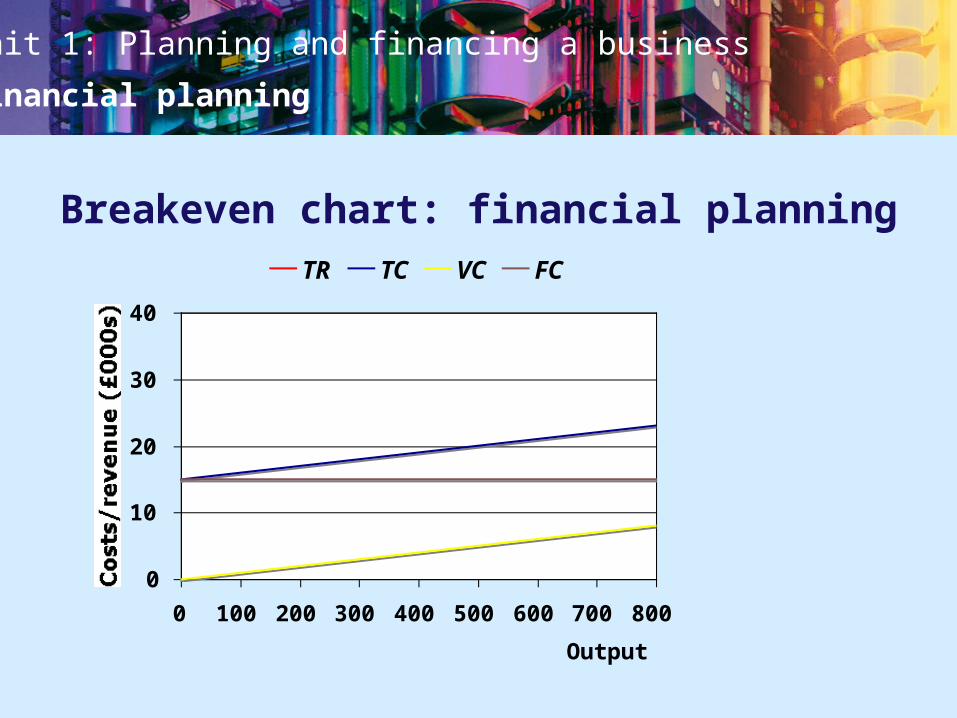
Breakeven chart: financial planning
0
10
20
30
40
0 100 200 300 400 500 600 700 800
Output
Costs/revenue (£000s)
TR TC VC FC
Unit 1: Planning and financing a business
Financial planning
0
10
20
30
40
0 100 200 300 400 500 600 700 800
Output
Costs/revenue (£000s)
TR TC VC FC
Breakeven chart: financial planning

Unit 1: Planning and financing a business
Financial planning
0
10
20
30
40
0 100 200 300 400 500 600 700 800
Output
Costs/revenue (£000s)
TR TC VC FC
Breakeven chart: financial planning
Unit 1: Planning and financing a business
Financial planning
0
10
20
30
40
0 100 200 300 400 500 600 700 800
Output
Costs/revenue (£000s)
TR TC VC FC
Breakeven chart: financial planning

Unit 1: Planning and financing a business
Financial planning
0
10
20
30
40
0 100 200 300 400 500 600 700 800
Output
Costs/revenue (£000s)
TR TC VC FC
Breakeven chart: financial planning
Unit 1: Planning and financing a business
Financial planning
0
10
20
30
40
0 100 200 300 400 500 600 700 800
Output
Costs/revenue (£000s)
TR TC VC FC
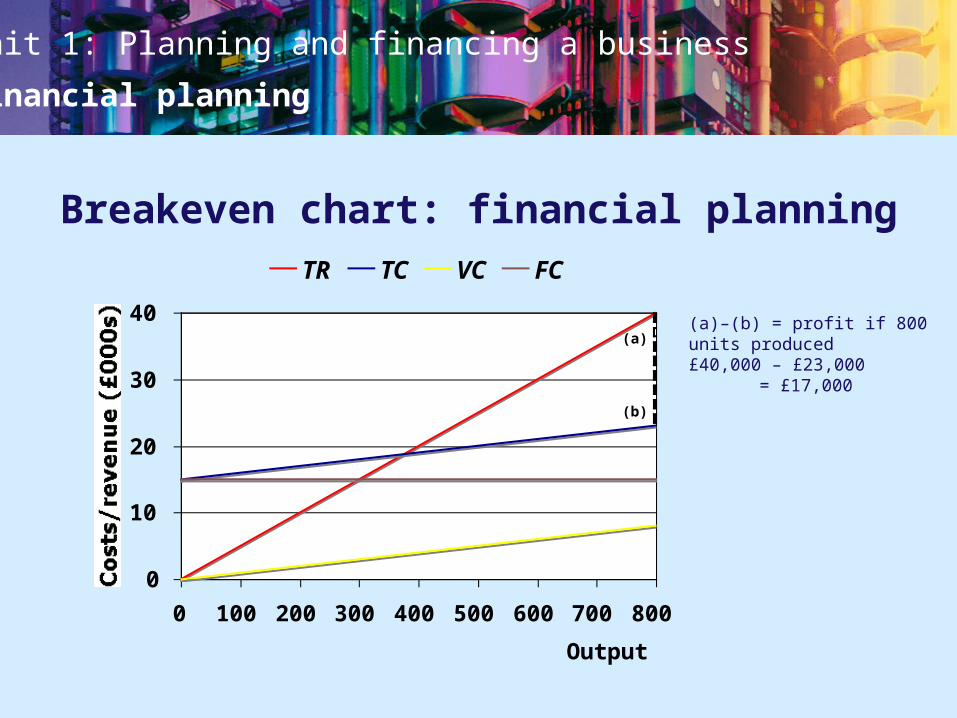
(a)
(b)
Breakeven chart: financial planning
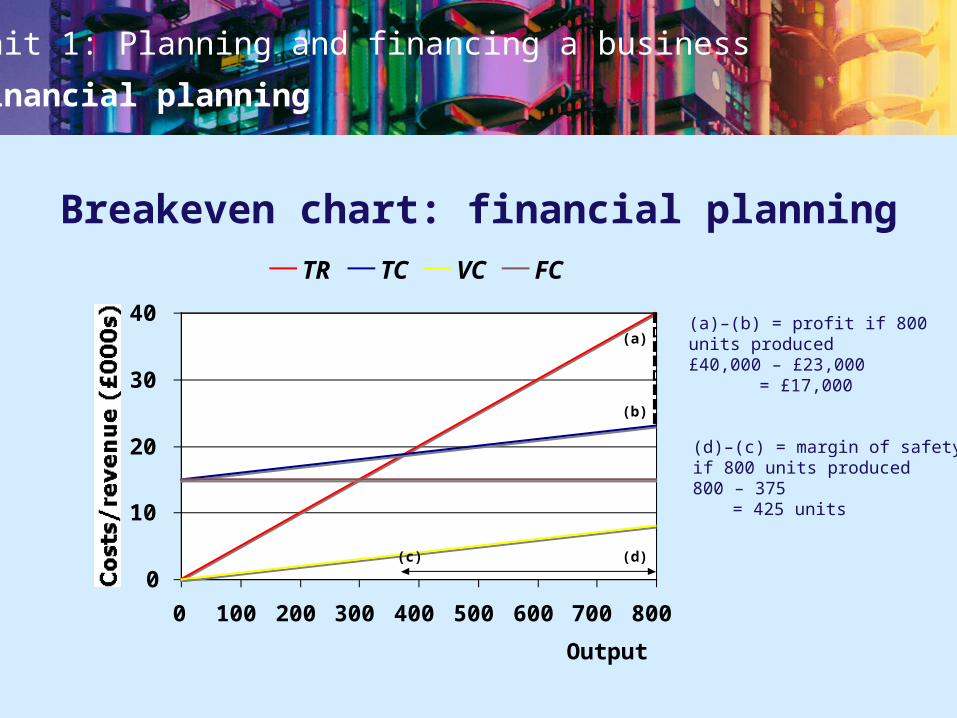
(a)–(b) = profit if 800units produced £40,000 – £23,000 = £17,000
Unit 1: Planning and financing a business
Financial planning
0
10
20
30
40
0 100 200 300 400 500 600 700 800
Output
Costs/revenue (£000s)
TR TC VC FC
(a)
(b)
(c) (d)
Breakeven chart: financial planning
(d)–(c) = margin of safetyif 800 units produced800 – 375 = 425 units
(a)–(b) = profit if 800units produced £40,000 – £23,000 = £17,000

Unit 1: Planning and financing a business
Financial planning
0
10
20
30
40
0 100 200 300 400 500 600 700 800
Output
Costs/revenue (£000s)
TR TC VC FC
Breakeven point
(a)
(b)
(c) (d)
(a)–(b) = profit if 800units produced £40,000 – £23,000 = £17,000
Breakeven chart: financial planning
(d)–(c) = margin of safetyif 800 units produced800 – 375 = 425 units
Unit 1: Planning and financing a business
Financial planning
Usefulness of breakeven analysis to start-up businesses
• To calculate how long it will take to reach the level of output needed to make a
profit. This will help it to assess whether the business is viable or not.• To get financial support, such as a bank overdraft.• To assess the probability of success and to gain some idea of the level of risk,
using the margin of safety.• To use ‘what if?’ analysis to show the different breakeven outputs and changes in
levels of profit that might arise from changes in prices, variable costs and fixed
costs.
Unit 1: Planning and financing a business
Financial planning
Strengths of breakeven analysis as a technique
• It is flexible — it can show the different levels of profit arising from various levels
of output.• The calculations are quick and easy to complete, thus saving businesses time. • Businesses that foresee future changes (e.g. higher wage costs or lower prices)
can examine the impact on individual products in their range.• For firms that have a target profit level, breakeven analysis can be adapted
to discover at which point a company can reach a particular profit level
(see the next slide).
Unit 1: Planning and financing a business
Financial planning
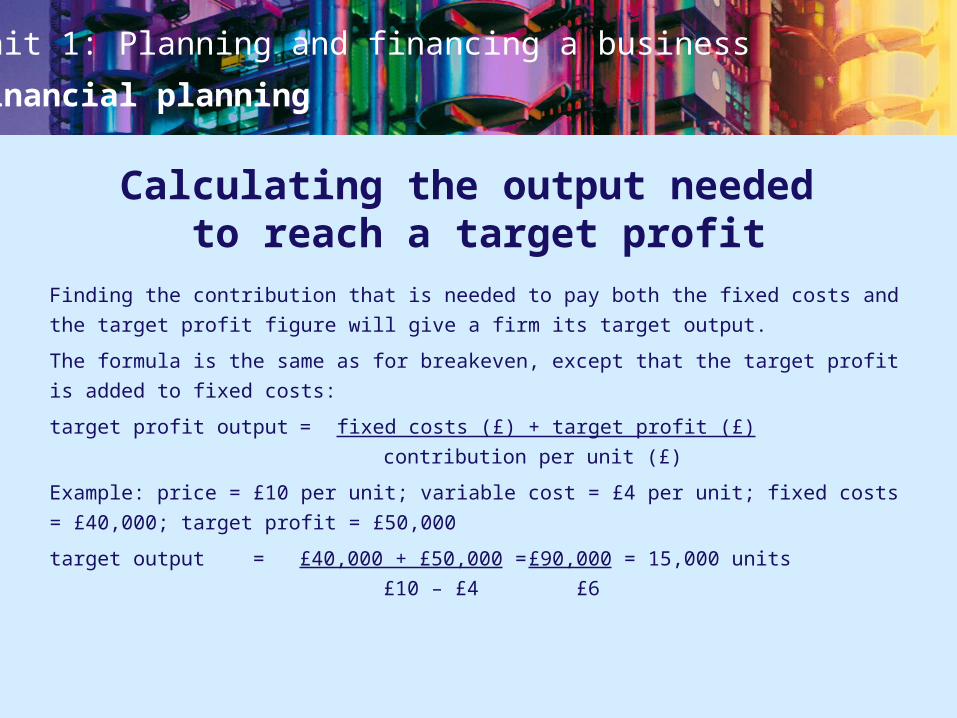
Calculating the output needed to reach a target profit
Finding the contribution that is needed to pay both the fixed costs and the target
profit figure will give a firm its target output.
The formula is the same as for breakeven, except that the target profit is added to
fixed costs:
target profit output = fixed costs (£) + target profit (£)
contribution per unit (£)
Example: price = £10 per unit; variable cost = £4 per unit; fixed costs = £40,000;
target profit = £50,000
target output = £40,000 + £50,000 = £90,000 = 15,000 units
£10 – £4 £6
Unit 1: Planning and financing a business
Financial planning
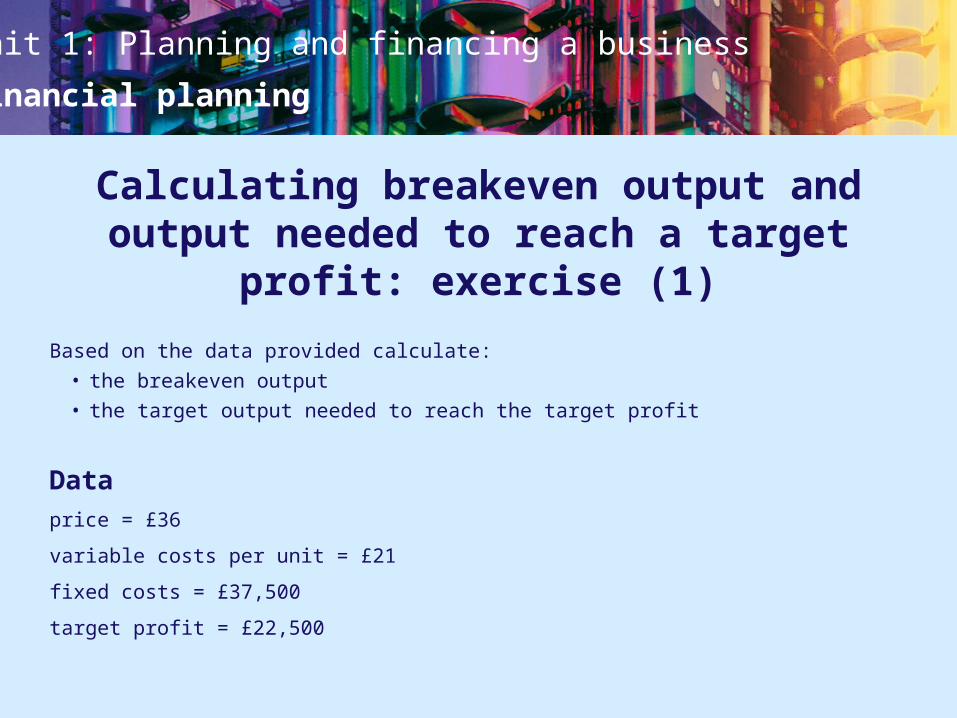
Calculating breakeven output and output needed to reach a target
profit: exercise (1)
Based on the data provided calculate:• the breakeven output• the target output needed to reach the target profit
Dataprice = £36
variable costs per unit = £21
fixed costs = £37,500
target profit = £22,500
Unit 1: Planning and financing a business
Financial planning
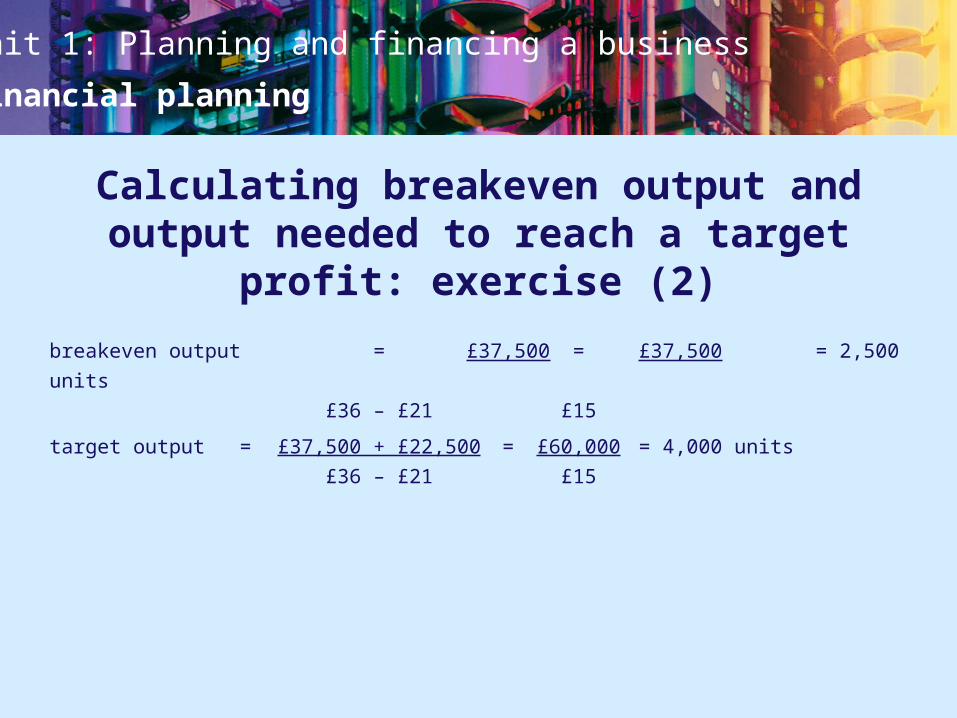
Calculating breakeven output and output needed to reach a target
profit: exercise (2)
breakeven output = £37,500 = £37,500 = 2,500 units
£36 – £21 £15
target output = £37,500 + £22,500 = £60,000 = 4,000 units
£36 – £21 £15
Unit 1: Planning and financing a business
Financial planning
Weaknesses of breakeven analysis
Most, but not all, of the weaknesses of breakeven analysis are based on the
assumptions made.• Information may be unreliable.• It is unlikely that sales will be exactly equal to output.• Selling price may need to fall if more is to be sold. • Fixed costs may not stay the same as output changes. • Variable costs per unit may not always be the same.
Unit 1: Planning and financing a business
Financial planning
Breakeven analysis: conclusion
Overall breakeven analysis is very useful, particularly for a start-up.
BUT…the method oversimplifies the true nature of business finances
AND…it works best if the future can be predicted accurately!
Unit 1: Planning and financing a business
Financial planning
Chapter 13
Using cash-flow forecasting
Unit 1: Planning and financing a business
Financial planning
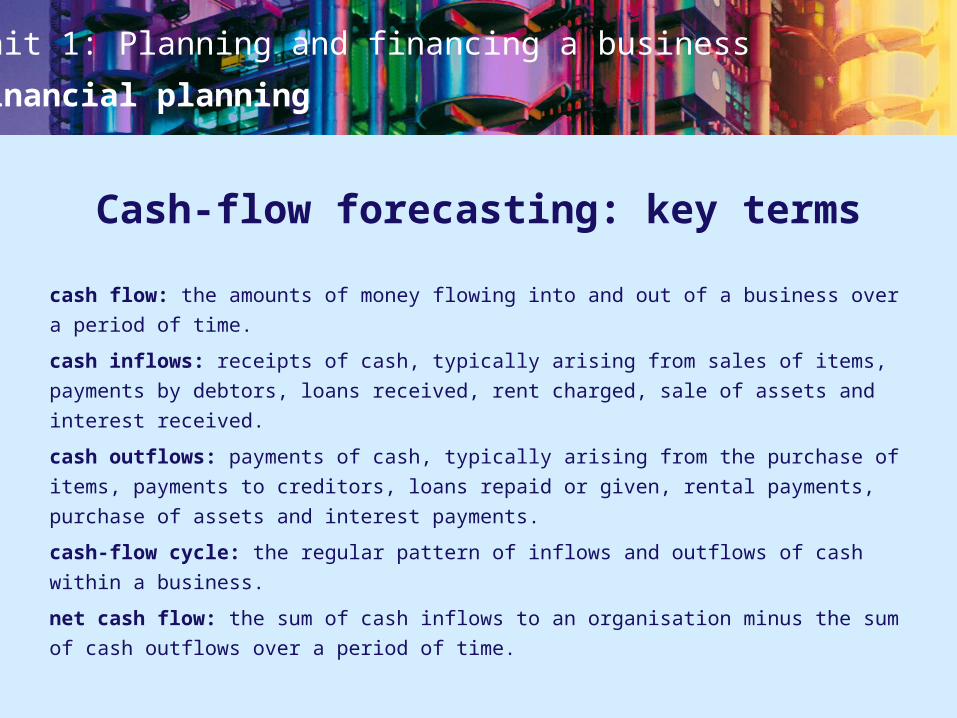
Cash-flow forecasting: key terms
cash flow: the amounts of money flowing into and out of a business over a period of
time.
cash inflows: receipts of cash, typically arising from sales of items, payments by
debtors, loans received, rent charged, sale of assets and interest received.
cash outflows: payments of cash, typically arising from the purchase of items,
payments to creditors, loans repaid or given, rental payments, purchase of assets
and interest payments.
cash-flow cycle: the regular pattern of inflows and outflows of cash within a
business.
net cash flow: the sum of cash inflows to an organisation minus the sum of cash
outflows over a period of time.
Unit 1: Planning and financing a business
Financial planning
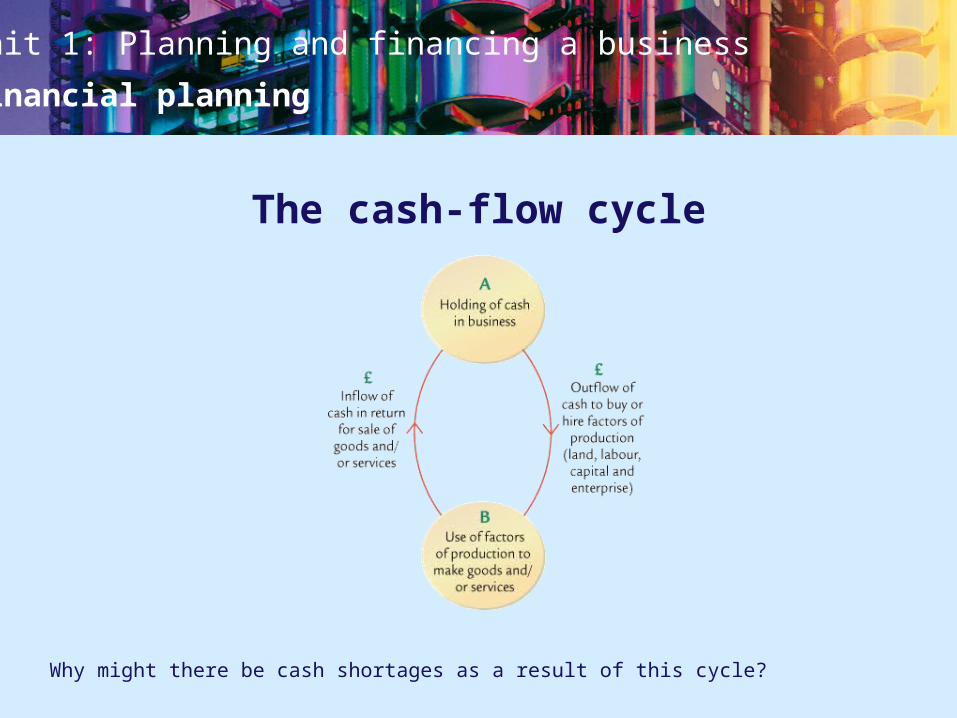
The cash-flow cycle
Why might there be cash shortages as a result of this cycle?
Unit 1: Planning and financing a business
Financial planning
Cash-flow forecasts and cash-flow statements
cash-flow forecasting: the process of estimating the expected cash inflows and
cash outflows over a period of time. Cash flow is often seasonal, so it is advisable to
forecast for a period of 1 year.
cash-flow statement: a description of how cash flowed into and out of a business
during a particular period of time.
A cash-flow forecast attempts to predict the future whereas a cash-flow statement
describes what actually happened in the past.
Unit 1: Planning and financing a business
Financial planning
Sources of information for cash-flow forecasts
Where can a business get information from in order to forecast cash flow?
Possible ideas include:• previous cash-flow forecasts• cash-flow statements• consumer research• competitors• contacting potential suppliers for quotes• banks• consultants
Unit 1: Planning and financing a business
Financial planning
Possible causes of inaccuracy in cash-flow forecasts
• changes in levels of consumer spending in the economy• changes in consumer tastes• inaccurate market research• changing levels of competition• unexpected changes in costs
Unit 1: Planning and financing a business
Financial planning
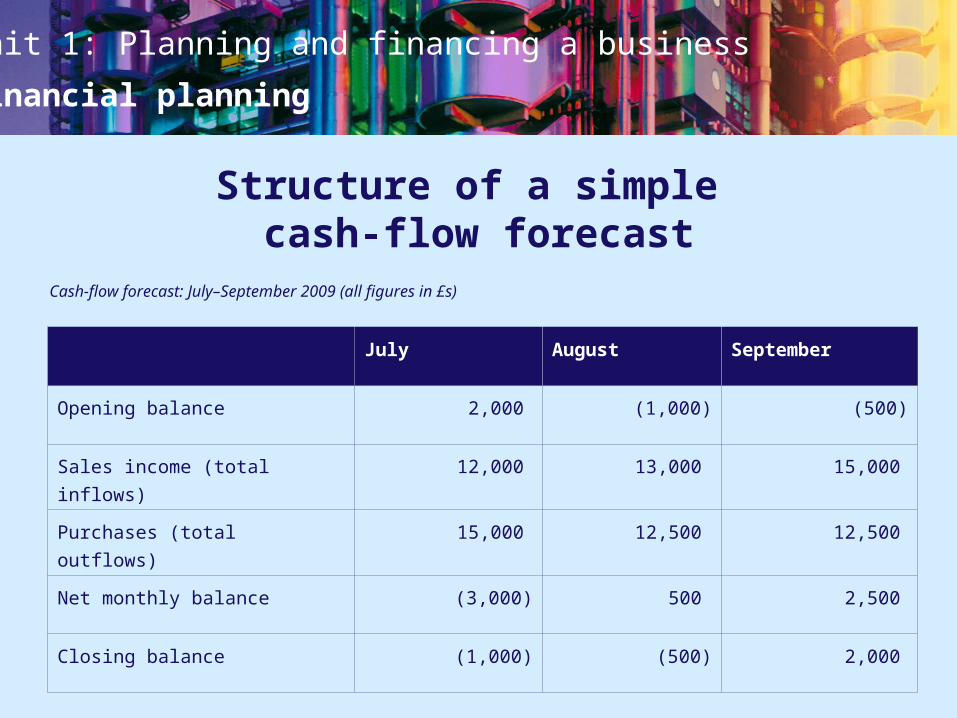
Structure of a simple cash-flow forecast
Cash-flow forecast: July–September 2009 (all figures in £s)
July August September
Opening balance 2,000 (1,000) (500)
Sales income (total inflows) 12,000 13,000 15,000
Purchases (total outflows) 15,000 12,500 12,500
Net monthly balance (3,000) 500 2,500
Closing balance (1,000) (500) 2,000
Unit 1: Planning and financing a business
Financial planning
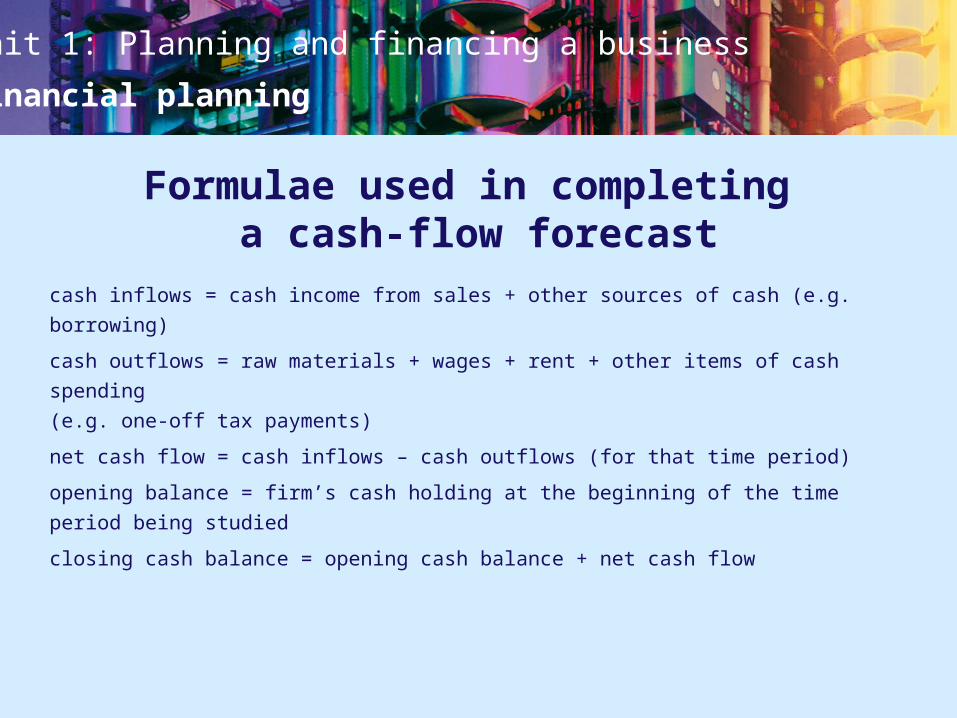
Formulae used in completing a cash-flow forecast
cash inflows = cash income from sales + other sources of cash (e.g. borrowing)
cash outflows = raw materials + wages + rent + other items of cash spending
(e.g. one-off tax payments)
net cash flow = cash inflows – cash outflows (for that time period)
opening balance = firm’s cash holding at the beginning of the time period being
studied
closing cash balance = opening cash balance + net cash flow
Unit 1: Planning and financing a business
Financial planning
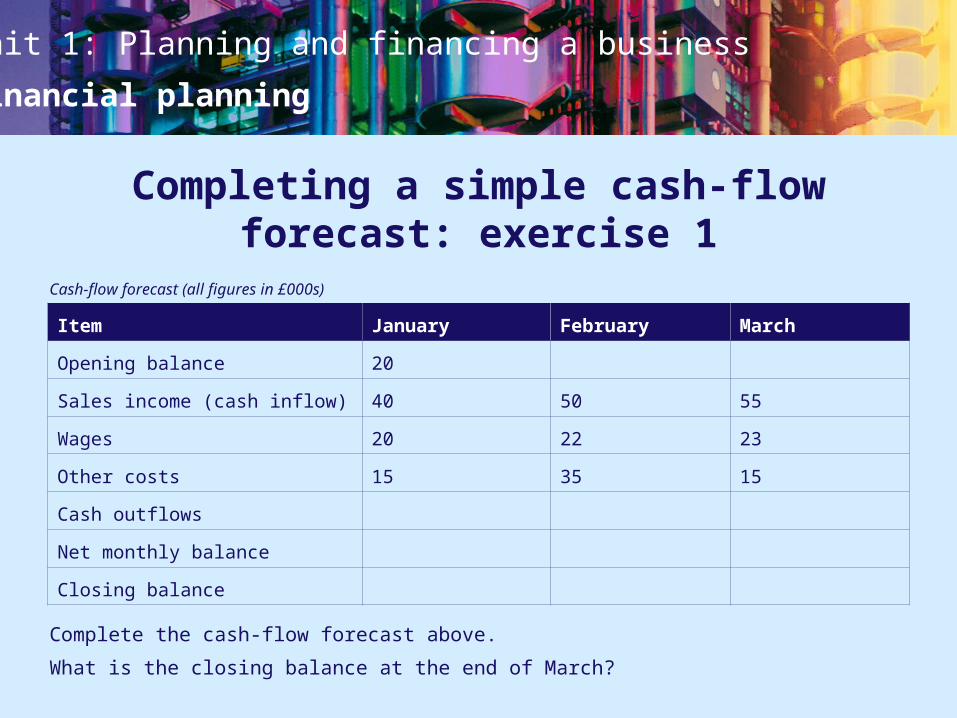
Completing a simple cash-flow forecast: exercise 1
Cash-flow forecast (all figures in £000s)
Complete the cash-flow forecast above.
What is the closing balance at the end of March?
Item January February March
Opening balance 20
Sales income (cash inflow) 40 50 55
Wages 20 22 23
Other costs 15 35 15
Cash outflows
Net monthly balance
Closing balance
Unit 1: Planning and financing a business
Financial planning
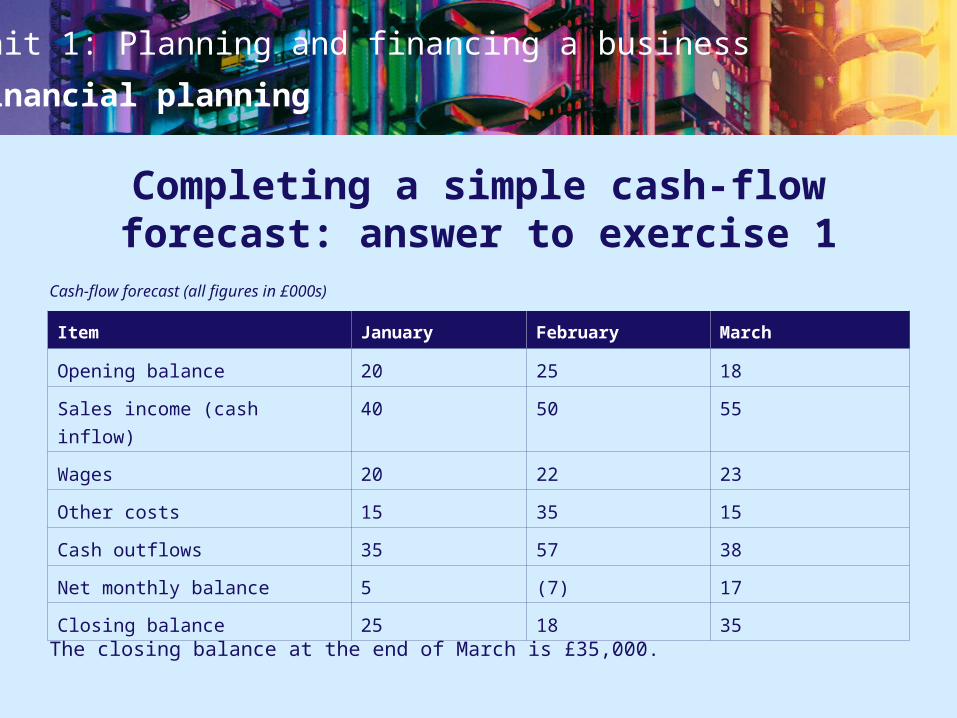
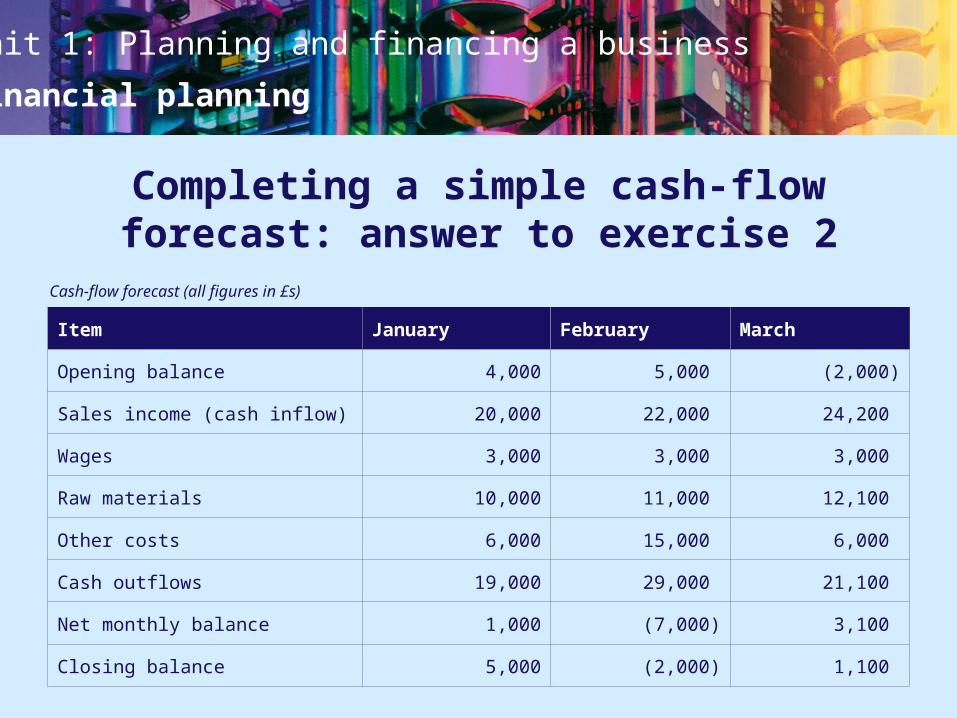
Completing a simple cash-flow forecast: answer to exercise 1
Cash-flow forecast (all figures in £000s)
The closing balance at the end of March is £35,000.
Item January February March
Opening balance 20 25 18
Sales income (cash inflow) 40 50 55
Wages 20 22 23
Other costs 15 35 15
Cash outflows 35 57 38
Net monthly balance 5 (7) 17
Closing balance 25 18 35
Unit 1: Planning and financing a business
Financial planning
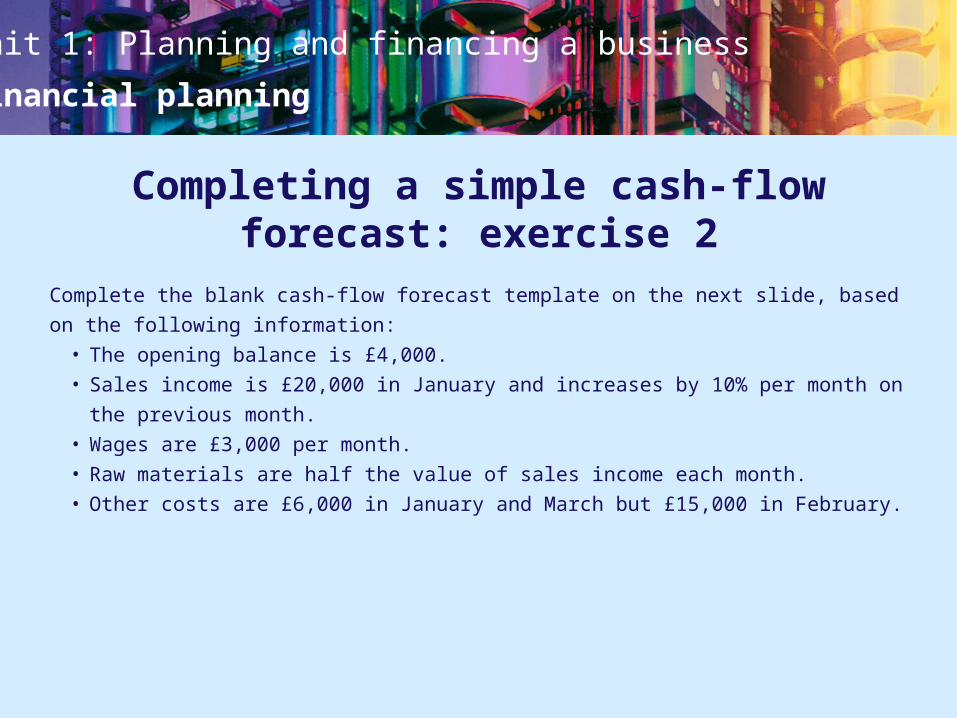
Completing a simple cash-flow forecast: exercise 2
Complete the blank cash-flow forecast template on the next slide, based on the
following information: • The opening balance is £4,000.• Sales income is £20,000 in January and increases by 10% per month on the
previous month.• Wages are £3,000 per month.• Raw materials are half the value of sales income each month. • Other costs are £6,000 in January and March but £15,000 in February.
Unit 1: Planning and financing a business
Financial planning
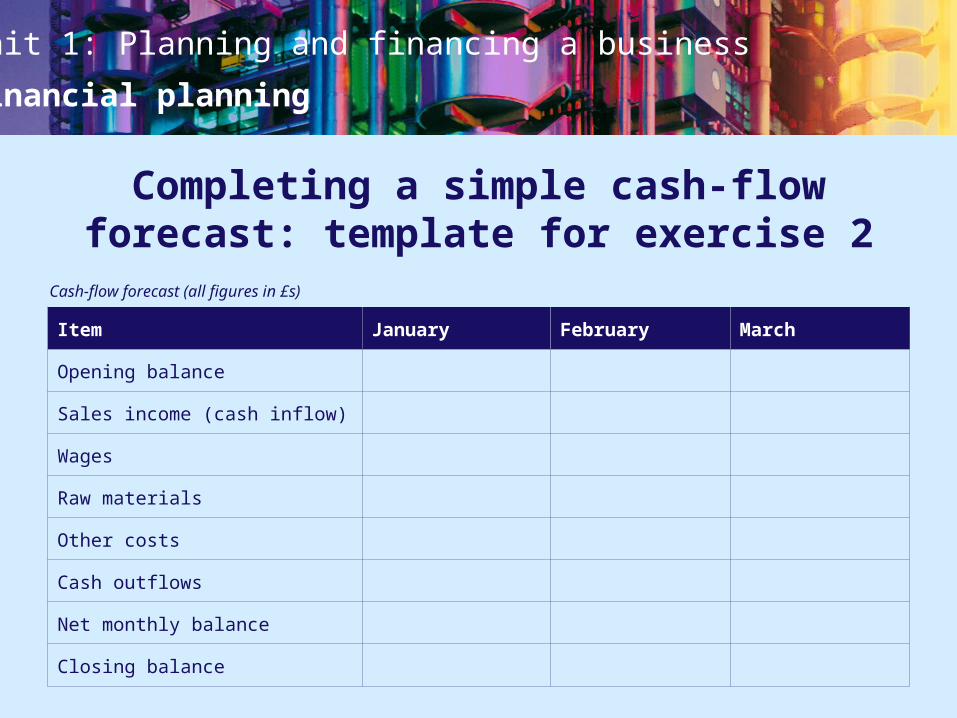
Completing a simple cash-flow forecast: template for exercise 2
Cash-flow forecast (all figures in £s)
Item January February March
Opening balance
Sales income (cash inflow)
Wages
Raw materials
Other costs
Cash outflows
Net monthly balance
Closing balance
Unit 1: Planning and financing a business
Financial planning
Completing a simple cash-flow forecast: answer to exercise 2
Cash-flow forecast (all figures in £s)
Item January February March
Opening balance 4,000 5,000 (2,000)
Sales income (cash inflow) 20,000 22,000 24,200
Wages 3,000 3,000 3,000
Raw materials 10,000 11,000 12,100
Other costs 6,000 15,000 6,000
Cash outflows 19,000 29,000 21,100
Net monthly balance 1,000 (7,000) 3,100
Closing balance 5,000 (2,000) 1,100
Unit 1: Planning and financing a business
Financial planning
Significance of cash-flow forecasting
Liquidity is the ability to convert an asset into cash without loss or delay.
The most liquid asset that a business can possess is cash. All firms, however
profitable, must manage their cash to guarantee their survival.
The significance of cash-flow forecasts is that they enable a firm to see times
in the future when it may be short of liquidity, so that measures can be taken
to prevent this from happening.
Unit 1: Planning and financing a business
Financial planning
Reasons for cash-flow forecasting
• to identify potential cash-flow problems in advance• to guide the firm towards appropriate action• to make sure that there is sufficient cash available to pay suppliers etc.• to provide evidence in support of a request for financial assistance
(e.g. asking a bank for an overdraft)• to avoid the possibility of the company being forced out of business
(into liquidation)• to identify the possibility of holding too much cash
Unit 1: Planning and financing a business
Financial planning
Using cash-flow forecasting: follow-up exercises
Complete the practice exercises and case study questions at the end of Chapter 13.
Unit 1: Planning and financing a business
Financial planning
Chapter 14
Setting budgets
Unit 1: Planning and financing a business
Financial planning
Budgeting: key terms
budget: an agreed plan establishing, in numerical or financial terms, the policy to
be pursued and the anticipated outcomes of that policy.
Types of budgetincome budget: the agreed, planned income of a business (or division of a
business) over a period of time. It may also be described as a revenue budget or
sales budget.
expenditure budget: the agreed, planned expenditure of a business (or division of
a business) over a period of time.
profit budget: the agreed, planned profit of a business (or division of a business)
over a period of time.
Unit 1: Planning and financing a business
Financial planning
Income budget
Key points:• It links to the marketing targets of the business.• It is subdivided into different elements to allow analysis of different sources —
particularly in multi-product firms.• It helps the business to assess expenditure needs, especially raw materials.• It includes other sources of income, such as rent received.
Unit 1: Planning and financing a business
Financial planning
Expenditure budget
The expenditure budget can be more complex than the income budget, as there are
many different items of expenditure in a business — for example: • raw materials/components• labour costs• marketing expenditure• administration costs• rent• capital costs
Unit 1: Planning and financing a business
Financial planning
Profit budget
profit budget = income budget – expenditure budget
• The profit budget usually has an annual focus to avoid seasonal distortions.• It is important for regular review to assess whether budget targets are being hit.
Unit 1: Planning and financing a business
Financial planning
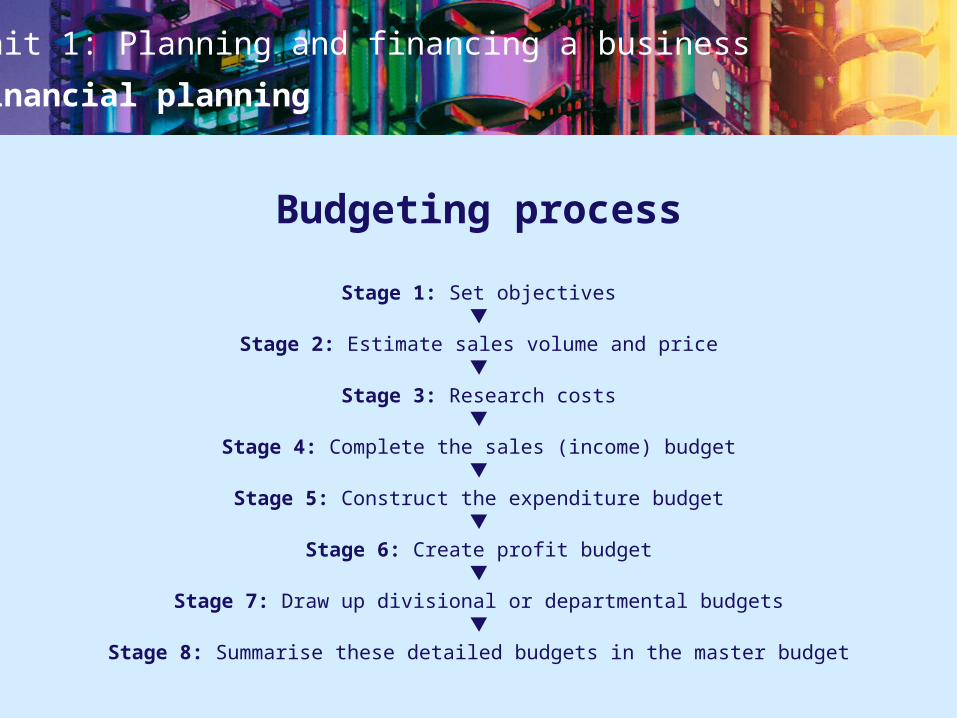
Budgeting process
Stage 1: Set objectives
Stage 2: Estimate sales volume and price
Stage 3: Research costs
Stage 4: Complete the sales (income) budget
Stage 5: Construct the expenditure budget
Stage 6: Create profit budget
Stage 7: Draw up divisional or departmental budgets
Stage 8: Summarise these detailed budgets in the master budget
Unit 1: Planning and financing a business
Financial planning
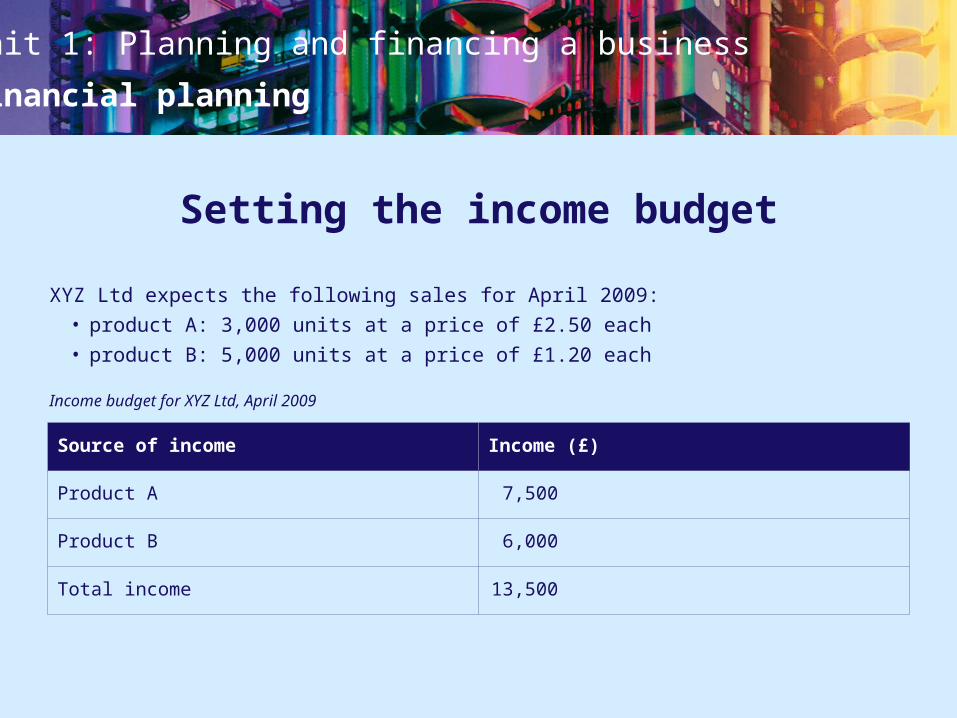
Setting the income budget
XYZ Ltd expects the following sales for April 2009:• product A: 3,000 units at a price of £2.50 each• product B: 5,000 units at a price of £1.20 each
Income budget for XYZ Ltd, April 2009
Source of income Income (£)
Product A 7,500
Product B 6,000
Total income 13,500
Unit 1: Planning and financing a business
Financial planning
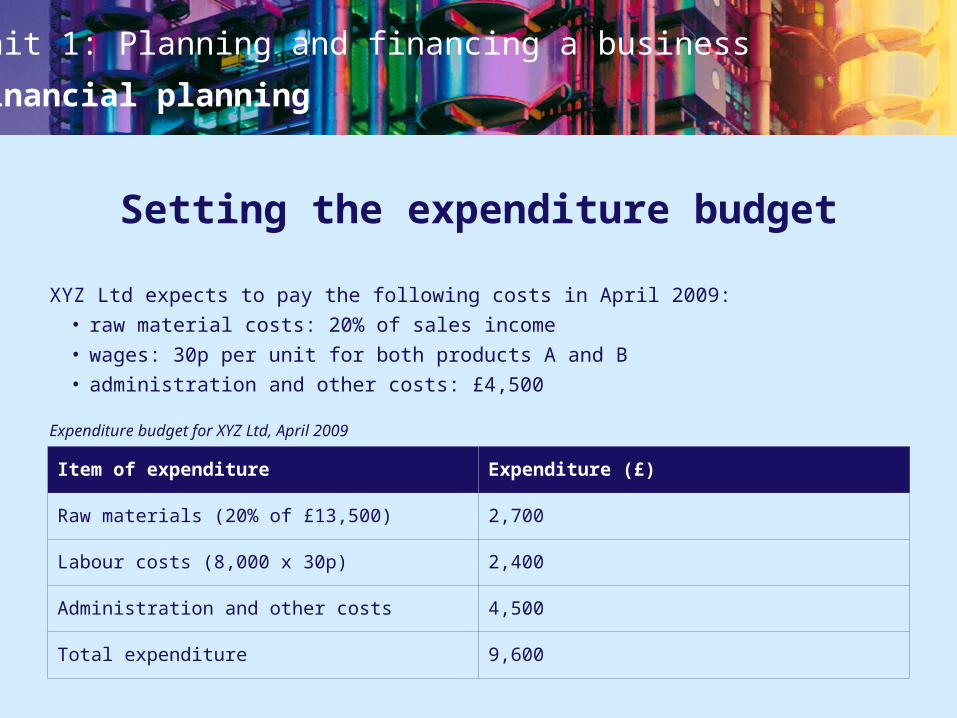
Setting the expenditure budget
XYZ Ltd expects to pay the following costs in April 2009:• raw material costs: 20% of sales income• wages: 30p per unit for both products A and B• administration and other costs: £4,500
Expenditure budget for XYZ Ltd, April 2009
Item of expenditure Expenditure (£)
Raw materials (20% of £13,500) 2,700
Labour costs (8,000 x 30p) 2,400
Administration and other costs 4,500
Total expenditure 9,600
Unit 1: Planning and financing a business
Financial planning
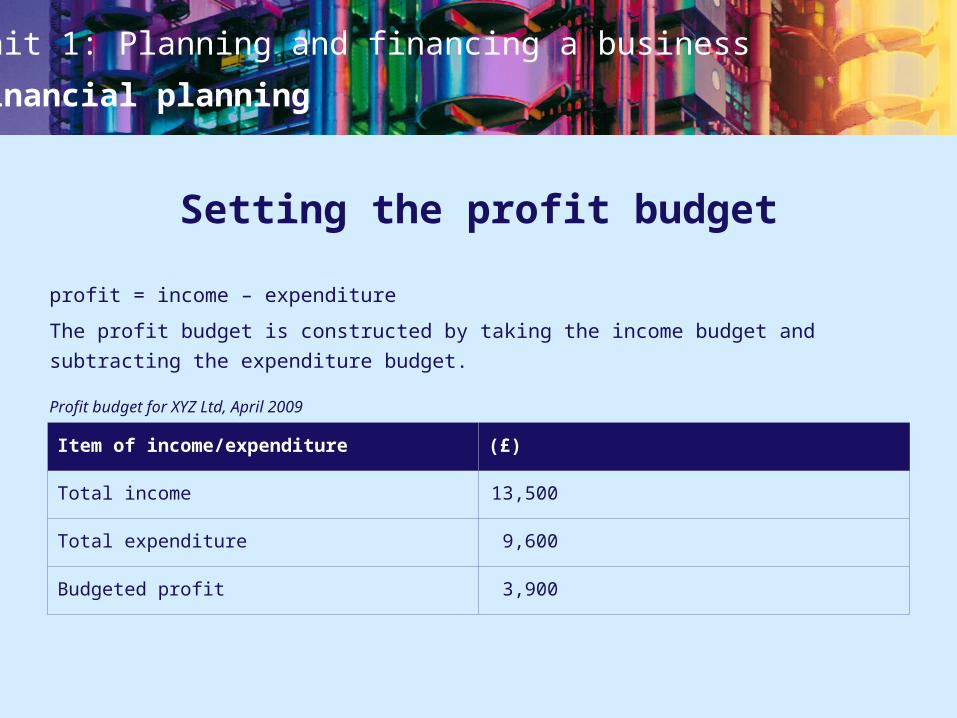
Setting the profit budget
profit = income – expenditure
The profit budget is constructed by taking the income budget and subtracting the
expenditure budget.
Profit budget for XYZ Ltd, April 2009
Item of income/expenditure (£)
Total income 13,500
Total expenditure 9,600
Budgeted profit 3,900
Unit 1: Planning and financing a business
Financial planning
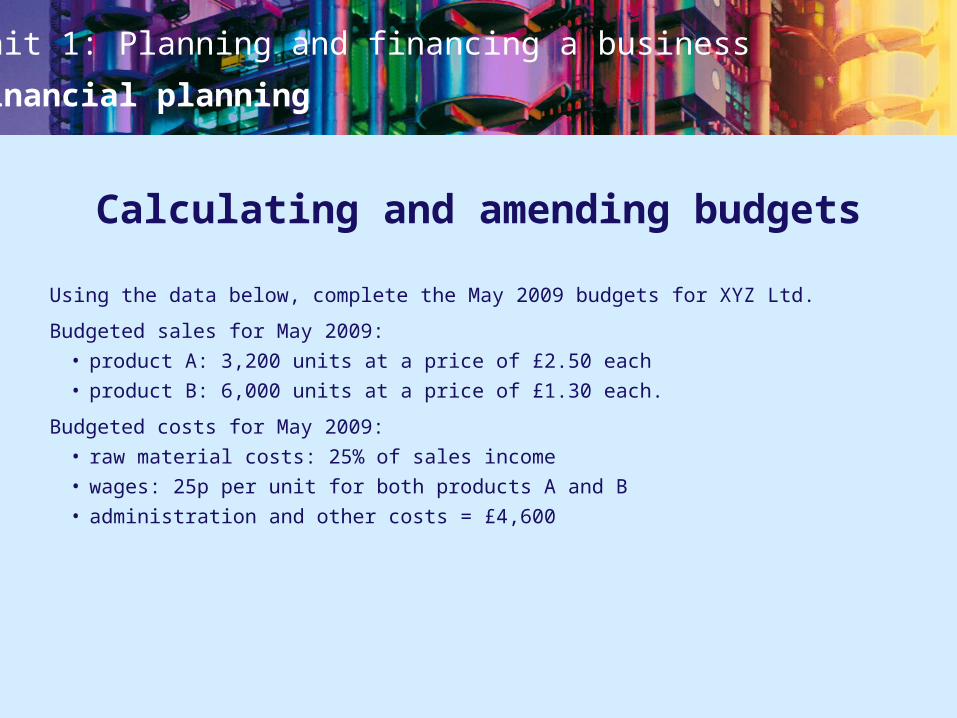
Calculating and amending budgets
Using the data below, complete the May 2009 budgets for XYZ Ltd.
Budgeted sales for May 2009:• product A: 3,200 units at a price of £2.50 each• product B: 6,000 units at a price of £1.30 each.
Budgeted costs for May 2009:• raw material costs: 25% of sales income• wages: 25p per unit for both products A and B• administration and other costs = £4,600
Unit 1: Planning and financing a business
Financial planning
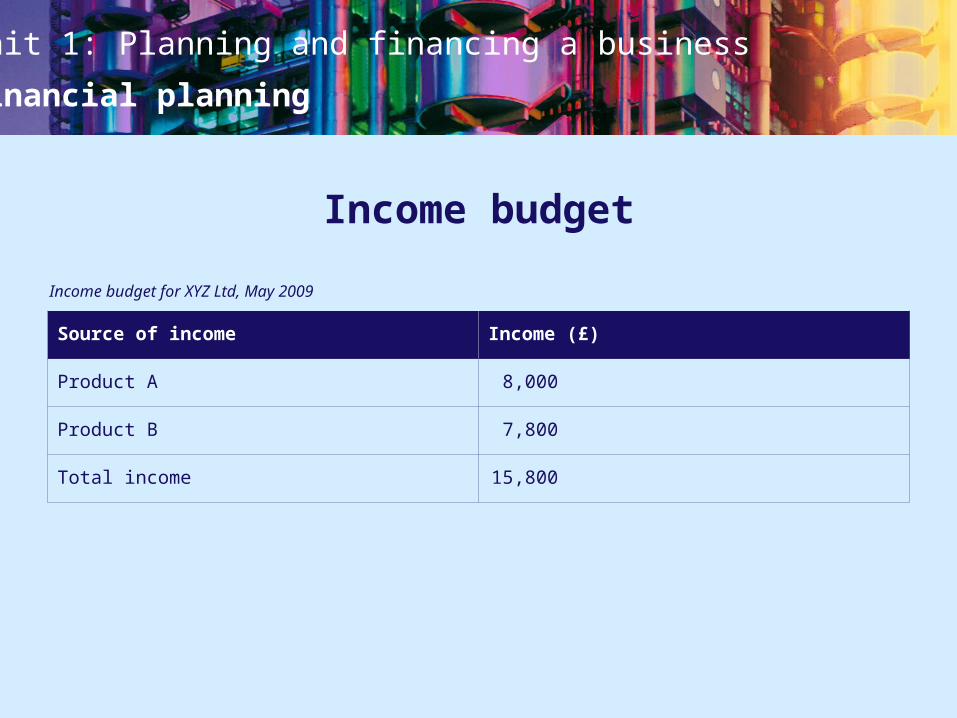
Income budget
Income budget for XYZ Ltd, May 2009
Source of income Income (£)
Product A 8,000
Product B 7,800
Total income 15,800
Unit 1: Planning and financing a business
Financial planning
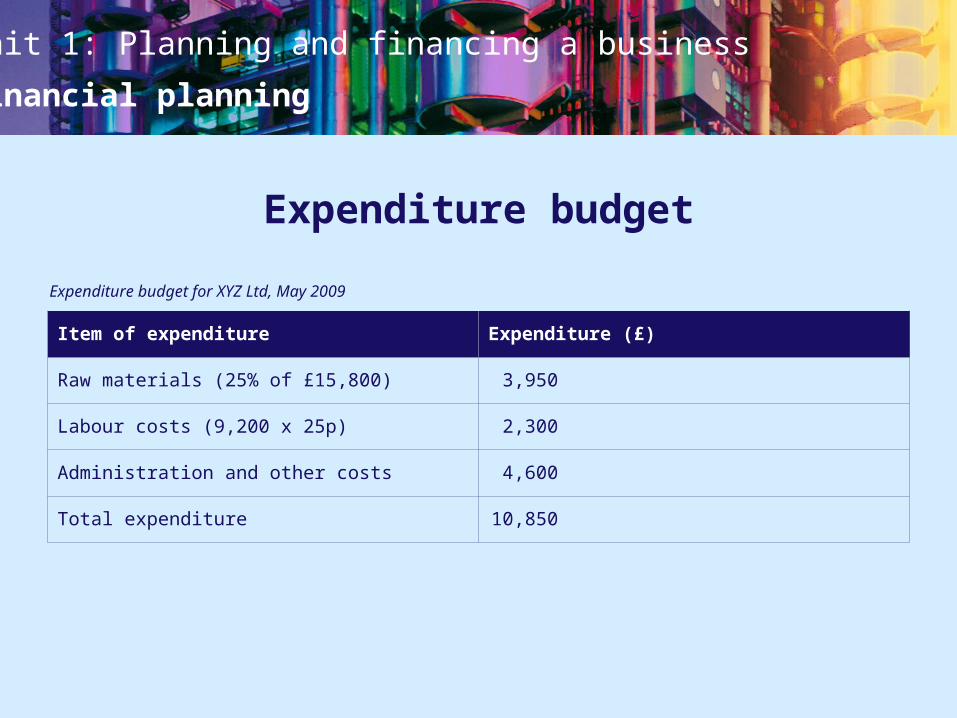
Expenditure budget
Expenditure budget for XYZ Ltd, May 2009
Item of expenditure Expenditure (£)
Raw materials (25% of £15,800) 3,950
Labour costs (9,200 x 25p) 2,300
Administration and other costs 4,600
Total expenditure 10,850
Unit 1: Planning and financing a business
Financial planning
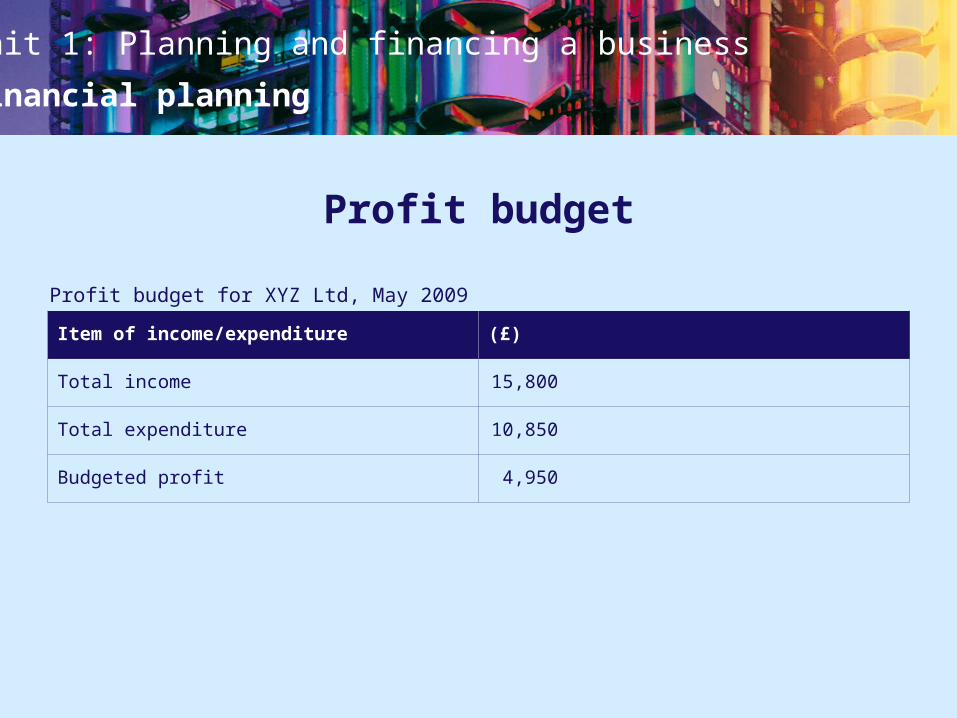
Item of income/expenditure (£)
Total income 15,800
Total expenditure 10,850
Budgeted profit 4,950
Profit budget
Profit budget for XYZ Ltd, May 2009
Unit 1: Planning and financing a business
Financial planning
Methods of setting a budget
• budgeting according to company objectives• budgeting according to competitors’ spending• setting the budget as a percentage of sales revenue• zero budgeting/budgeting based on expected outcomes • budgeting according to last year’s budget allocation
Unit 1: Planning and financing a business
Financial planning
Reasons for setting budgets
• to gain financial support• to ensure that a business does not overspend• to establish priorities• to encourage delegation and responsibility, and to motivate staff• to assign responsibility• to improve efficiency
Unit 1: Planning and financing a business
Financial planning
Problems of setting budgets
• managers not knowing enough about the division or department• difficulties in gathering information• unforeseen changes• changes in prices that are difficult to foresee• problems arising from budgets being imposed • the time taken in setting budgets
Unit 1: Planning and financing a business
Financial planning
Setting budgets: follow-up exercises
Complete practice exercise 2 and the case study questions from Chapter 14.
Unit 1: Planning and financing a business
Financial planning
Chapter 15
Assessing business start-ups
Unit 1: Planning and financing a business
Financial planning
Assessing the business idea or plan
Possible issues to consider include:• what the business objectives are• which product or service is to be provided and whether it can be produced and
supplied profitably• customers’ needs and wants, and which market segment to target• the possibility of competition and an appropriate pricing and selling strategy• finance for day-to-day and longer-term operations, and the time scales between
start-up and breakeven• who will be involved, what they will be doing and what skills, expertise and
experience they have• the risks involved
Unit 1: Planning and financing a business
Financial planning
Refer to the Tribal Woods case study on page 165 of the textbook and discuss the
following questions: • Is there anything special, new or different about the Bill’s products that would
make them appeal to consumers? • Could the products compete successfully with other products on the market?
Assessing the business start-up: exercise
Unit 1: Planning and financing a business
Financial planning
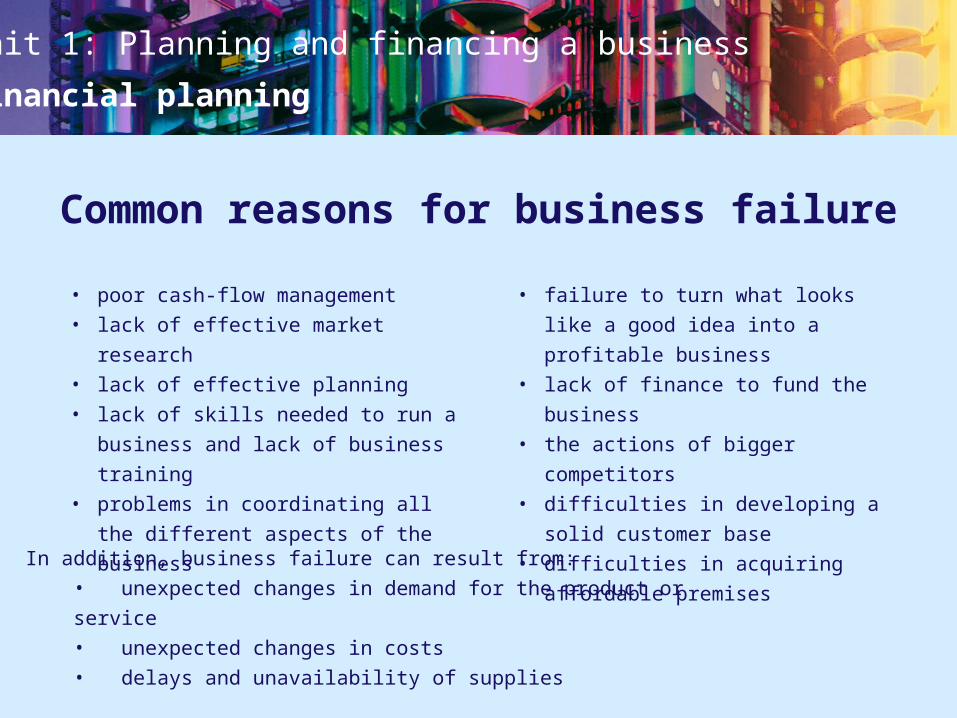
Common reasons for business failure
• poor cash-flow management• lack of effective market research• lack of effective planning• lack of skills needed to run a
business and lack of business
training• problems in coordinating all the
different aspects of the business
• failure to turn what looks like a
good idea into a profitable business• lack of finance to fund the business• the actions of bigger competitors• difficulties in developing a solid
customer base• difficulties in acquiring affordable
premises
In addition, business failure can result from:• unexpected changes in demand for the product or service• unexpected changes in costs• delays and unavailability of supplies
Unit 1: Planning and financing a business
Financial planning
Working in groups, take one of the following areas: finance, marketing, operations,
personnel, external factors. Investigate the main problems that might occur in your
allocated area for a business start-up in relation to this area and, in particular, why
such problems might lead to the failure of the business. Share your findings with the
rest of the class and assess how interrelated the problems are.
Investigating problems of business start-ups
Unit 1: Planning and financing a business
Financial planning
Financial difficulties
Raising financeOver a quarter of all start-up businesses in the government’s Annual Small Business
Survey said they experienced difficulty in obtaining the finance they needed. Discuss
the likely impact of this on a new business.
Cash flowIn the government’s Annual Small Business Survey, nearly 30% of all businesses
thought late payment was a factor that might cause cash-flow problems. Discuss why
this might be the case.
Why do even profitable firms sometimes find it impossible to continue trading
because they are unable to meet their current debts?
Unit 1: Planning and financing a business
Financial planning
Competition
The success of a business start-up will be determined by its ability to attract and
retain its customers. To do this it will have to offer something more than any of its
competitors. In the government’s Annual Small Business Survey, over 40% of all
businesses thought competition in the market was an obstacle to their success —
especially larger competitors with more influence and resources.
Working in groups, take any type of product or service and explore how a new, small,
local firm could compete successfully with an established, large, national firm. Share
your findings with the class.
Unit 1: Planning and financing a business
Financial planning
Difficulties of building a customer base
Satisfied customers are likely to recommend the business to others; such
recommendation is the most effective but least expensive form of advertising.
Factors to consider when trying to encourage customer loyalty include:• providing customers with service that is efficient and meets their expectations • providing a good after-sales service and dealing effectively and positively with
customer complaints • understanding customers’ buying habits and ensuring that stock and staff
availability are in tune with this• ensuring that contact between customers and staff is always friendly and
efficient
Working in groups, develop each of the above points by providing a business
example that illustrates the impact on a business if it fails to ensure these factors are
present in the service it offer to customers.
Unit 1: Planning and financing a business
Financial planning
Regulations and ‘red tape’
A business must meet legal requirements relating to employment, health and safety,
consumer protection and environmental protection as well as the requirements
relating to taxation and other financial issues.
Much of this is very complex to comply with and costly, both financially and in terms
of time.
New legislation on age discrimination, which came into force in October 2007, adds
another layer of red tape for small firms to deal with. Why do you think that this
legislation might cause problems for a small business?