Embed Size (px)
Citation preview

Grade 11 U/C – Unit 1: Introduction 1
Unit # 1: Introduction (4 days + 0 jazz days + 0 summative evaluation days)
BIG Ideas: • This is an opportunity for students to see the big picture of the course. • Students will explore 4 functions (linear, quadratic, exponential and periodic) in a very general way. • Having students “walk” each of these graphs will give them a kinesthetic connection with the similarities and differences
DAY
Lesson Title & Description 2P 2D Expectations Teaching/Assessment Notes and Curriculum Sample Problems
1
Walk the Line • Review of DT graphs Lesson Included
Review of Grade 10
N N EF1.05
distinguish exponential functions from linear and quadratic functions by making comparisons in a variety of ways (e.g., comparing rates of change using finite differences in tables of values; identifying a constant ratio in a table of values; inspecting graphs; comparing equations), within the same context when possible (e.g., simple interest and compound interest; population growth)
Sample problem: Explain in a variety of ways how you can distinguish the exponential function f (x) = 2x from the quadratic function f (x) = x2 and the linear function f (x) = 2x.
2
Lines, Curves and Waves Oh My! • Investigate Linear, Quadratic,
Exponential and Periodic Graphs with the CBR
Lesson Included
N N TF3.01
collect data that can be modelled as a sine function (e.g., voltage in an AC circuit, sound waves), through investigation with and without technology, from primary sources, using a variety of tools (e.g., concrete materials; measurement tools such as motion sensors), or from secondary sources (e.g. websites such as Statistics Canada, E-STAT), and graph the data
Sample problem: Measure and record distance-time data for a swinging pendulum, using a motion sensor or other measurement tools, and graph the data.

Grade 11 U/C – Unit 1: Introduction 2
EF1.05
3
A Cube Conundrum • Compare and contrast linear and
quadratic relationships • Students begin to group
relationships into categories of linear, quadratic or other
Lesson Included
TF3.01
EF1.05
4
Getting Ready for the Journey • Classify relationships as linear,
quadratic or other • Explore some characteristics of
exponential and periodic relationships
Lesson Included
TF3.01

Grade 11 U/C – Unit 1: Introduction 3
Unit 1 : Day 1 : Walk the Line Grade 11 U/C
Minds On: 15
Action: 15
Consolidate:10
Total=40 min
Note: It is estimated that approximately the first 30 minutes will be spent on First Day Administrative activities, eg. seating plans, attendance, etc. Description/Learning Goals • To recall features of distance-time graphs using technology. • To investigate the feasibility of various distance-time graphs.
Materials • TI 83/84
viewscreen calculator
• Viewscreen • CBR • BLM 1.1.1, 1.1.2,
1.1.3
Assessment Opportunities
Minds On… Individual Review Show overhead of BLM 1.1.1 and give each student a copy. Students will individually write a story that describes a situation that could be modelled by the given graph. Mathematical Process Focus: Communication (Students will communicate the various parts of the graph using appropriate terminology)
Action! Whole Class Demonstration Arrange the room so that there is room for a student volunteer to walk in front of the CBR (motion detector) Have student volunteers take turns trying to match graphs from the D-T Match application. Encourage all students to participate in discussing how each volunteer should walk to match the graph. For instructions on using the D-T match see BLM 1.1.2. Approximately 7 student volunteers should be sufficient. Mathematical Process Focus: Representing, Connecting (Students will connect the graphical representation of a distance time walk.)
Consolidate Debrief Whole Class Discussion
Draw a V on the blackboard and ask for a volunteer to come up and walk to produce that graph. Draw a B on the blackboard and ask for a volunteer to come up and walk to produce that graph. Hopefully students will conclude that it can’t be walked. Students should be able to give reason(s) why it cannot be walked.
This is an opportunity for students that may have not had the opportunity to work with the CBR in earlier grades to become more familiar with it. They will need to understand how the D-T graphs work for the next day’s activity. It may be helpful to refer back to this activity when students are introduced to the concept of a function (i.e. a letter that you can walk is a function)
Application Exploration Reflection
Home Activity or Further Classroom Consolidation BLM 1.1.3

Grade 11 U/C – Unit 1: Introduction 4
1.1.1 Take a Hike You and a friend are going on a hike. Use the graph below to tell a story about the hike that you and your friend take.

Grade 11 U/C – Unit 1: Introduction 5
1.1.2 Distance-Time Match with the CBR and the TI-83+ / TI-84+ Calculator Follow these directions carefully to connect and use the CBR with the calculator. TEACHER NOTE: If your class is using the TI-84+, it is recommended you check the calculators in advance for the APPS program CBL / CBR. It can be transferred from another TI-83+ calculator. - - - - - - - - - - - - - - - - - - - - - - - - - - - - - - - - - - - - - - - - - - - - - - - - - - - - - - - - - - - - - - - 1. Connect the CBR to the calculator. 2. Press the APPS key. You will see a screen similar to: Find the CBL / CBR option and select it. 3. The CBL / CBR application will begin. You will see:
Follow the directions and PRESS ANY KEY
4. Select 3:RANGER The Ranger program will begin. Press [ENTER] 5. You will see the main menu. Select 3: APPLICATIONS 6. For the units, select 1:METERS. 7. Once you press [ENTER], you will see: Select 1:DIST MATCH Follow the instructions on the screen.
A distance time graph will appear. The student volunteer will need to study the graph to decide on
their motion. When the student is ready to start, press [ENTER]. 8. After the first walker is done, discuss any changes that need to
be made to get a better match. 9. Press [ENTER] to continue and then select either 1: SAME MATCH or 2:NEW MATCH.

Grade 11 U/C – Unit 1: Introduction 6
1.1.3 How Well Do You Know Your A, B, C’s? Examine the following letters of the alphabet. Decide which one(s) you would be able to create on your graphing calculator by walking in front of a motion sensor. If you are able to create the letter, describe what the walk would look like. (Use phrases like “walk away from the sensor”.) If you are unable to create the letter, explain why not.
Letter Can you Create
It? (check one)
Explain how to create it or
Explain why you cannot create it
U � Yes
� No
S � Yes
� No
X � Yes
� No
C � Yes
� No
M � Yes
� No
Now, classify all the letters of the alphabet as “walkable” or “not walkable”.
Walkable Not Walkable
What do you notice about the letters that are “not walkable”?

Grade 11 U/C – Unit 1: Introduction 7
Unit 1 : Day 2 : Lines, Curves and Waves, Oh My! Grade 11 U/C
Minds On: 15
Action: 40
Consolidate:20
Total=75 min
Description/Learning Goals • Compare and contrast, in a very broad sense, the four basic graphs that students
will encounter in the course. • Determine the connection between distance and time and the graph created by
changing those conditions.
Materials • BLM 1.2.1, 1.2.2,
1.2.3, 1.2.4 • CBR, graphing
calculator, viewscreen or projection unit
Assessment Opportunities
Minds On… Whole Class Visual Activity Discuss Alphabet homework. Have students share observations about which letters can and can’t be created.
Distribute BLM 1.2.1 to all students. Teacher or student volunteer does a “walk” in front of the CBR. The graph should not be shown on the overhead at this point. Students should carefully observe the “walk” and then individually sketch the graph that would be created by this walk.
Once all students have sketched their graph, reveal the graph on the calculator for students to compare. Students should reflect on reasons for differences between their sketches and the actual graph. Have another volunteer walk. Repeat the process a total of 4 times.
Action! Small Groups Investigation Organize students into groups of 4. Each group should receive a CBR, a graphing calculator and BLM1.2.2 and BLM1.2.3. Students should work in their groups to create each of the 4 graphs shown. Students should save their graphs as explained in the instructions and be prepared to share their graphs and how they created them.
Learning Skill (Teamwork)/Observation/Checkbric: Observe and record students’ collaboration skills.
Consolidate Debrief Whole Class Presentation
Have groups report to the class on how they created each of their graphs. Encourage groups to give detailed descriptions including information about starting points, rates, direction. Whole Class Discussion Tell students that these graphs will be the focus of this course (specifically the quadratic, exponential and periodic). Discuss the similarities and differences in the graphs. Students already have names for linear and quadratic. Now may be a good time to introduce the terms exponential and periodic. Emphasis should be placed on connecting the “shape” of each graph to the “big ideas” to be explored in the coming units. Mathematical Process Focus: Communication (Students will communicate the various parts of the graph using appropriate terminology)
While students are working through activity, circulate around the room, observe group approaches to creating graphs and make note of interesting approaches for sharing later. It is probably best to use the term periodic rather than sinusoidal at this point as students haven’t yet had the opportunity to make the connection between this graph and a sine graph. It would be helpful to share news articles that use the terms exponential and periodic to show students how these terms are used in the real world.
Application Concept Practice Reflection
Home Activity or Further Classroom Consolidation Have student complete 1.2.4

Grade 11 U/C – Unit 1: Introduction 8
1.2.1 Sketch My Walk Use the graphs below to sketch the motion of the walker.
Graph #1 Graph #2
Graph #3 Graph #4
Time
Dis
tance
Time
Dis
tance
Time
Dis
tance
Time
Dis
tance
Grade 11 U/C – Unit 1: Introduction 9
1.2.2 Using the CBR with the TI-83+ / TI-84+ Calculator Follow these directions carefully to connect and use the CBR with the calculator. TEACHER NOTE: If your class is using the TI-84+, it is recommended you check the calculators in advance for the APPS program CBL / CBR. It can be transferred from a TI-83+ calculator. - - - - - - - - - - - - - - - - - - - - - - - - - - - - - - - - - - - - - - - - - - - - - - - - - - - - - - - - - - - - - - - 1. Connect the CBR to the calculator. 2. Press the APPS button. You will see a screen similar to:
Find the CBL / CBR option and select it.
3. The CBL / CBR program will begin. You will see: Follow the directions and PRESS ANY KEY
4. Select the program RANGER
The Ranger program will begin. Press [ENTER] 5. You will see the menu. You will select 2: SET DEFAULTS 6. The defaults are set for the activity. Press ENTER. 7. Once you press ENTER, you will see: 8. You are now ready to start to create your graph. 9. Once you have completed your graph, press ENTER. 10. If you are satisfied with your graph, you can choose 5: QUIT
If you would like to try your graph again, select 3: REPEAT SAMPLE

Grade 11 U/C – Unit 1: Introduction 10
1.2.2 Using the CBR with the TI-83+ / TI-84+ Calculator (continued) 11. To store your graph:
• Press 2nd PRGM , cursor over to STO and choose 1:StorePic
• Type in 1 for your first graph (when you do your second graph type “2”, etc)
• Then press ENTER 12. When you want to recall a picture:
• Make sure that all PLOTS are off and no equations are entered in your Y= screen. • Press 2nd PRGM cursor over to STO and choose 2:RecallPic • Type in the number of the picture you want to recall and press ENTER
Note: if you need to erase a picture from the screen: Press 2nd PRGM and choose 1:ClrDraw

Grade 11 U/C – Unit 1: Introduction 11
1.2.3 Match Challenge ▪ Create each of the graphs below using the CBR. If you need help using the CBR use the
instruction sheet provided (1.2.2) ▪ Once you are satisfied with your graph save it on the calculator using the instructions
provided. ▪ Be prepared to share your graphs with the class and explain how you created them.
Graph 1
Graph 2
Graph 3
Graph 4

Grade 11 U/C – Unit 1: Introduction 12
1.2.4 Extreme MATCH Challenge During class you created 4 different graphs with the graphing calculator and CBR. Use what you learned from this activity to help you answer the following: Graph 1 The graphs above are both linear. To create the graph on the left, a student started 3 metres away from the sensor and then walked slowly away from the sensor at a constant speed. Explain how the student would have to change their walk to create the graph on the right. Graph 2 The graphs above are both quadratic. To create the graph on the left, a student had to wait, then walk towards the sensor walking quickly at first and then slowing down. They then moved away from the sensor, slowly at first and then speeding up. Explain what changes the student would have to make to their walk to create the graph on the right.

Grade 11 U/C – Unit 1: Introduction 13
1.2.4 Extreme MATCH Challenge (continued) Graph 3 The graphs above are both exponential. To create the graph on the left a student started one metre away from the sensor then moved away from the sensor, increasing their speed as they walked. Explain how the student would have to change their walk to create the graph on the right. Graph 4 The graphs above are both periodic. To create the graph on the left the student start 3 metres away from the sensor and walked away from the detector, then towards and away repeatedly. Explain how the student would have to change their walk to create the graph on the right.

Grade 11 U/C – Unit 1: Introduction 14
Unit 1 : Day 3 : A Cube Conundrum Grade 11 U/C
Minds On: 15
Action: 45
Consolidate:20
Total=75 min
Description/Learning Goals • Compare and contrast the features of linear and quadratic relations. • Collect data that results in a linear relationship, and data that results in a
quadratic relationship. • By the end of the activity students should be fairly comfortable with
categorizing relationships as linear, quadratic or neither.
Materials • BLM 1.3.1, 1.3.2,
1.3.3, 1.3.4, 1.3.5, 1.3.6
• Signs for Four Corners Activity (Linear, Quadratic, Exponential, Periodic)
• Linking cubes Assessment Opportunities
Minds On… Whole Class Four Corners Warm-Up: Display the examples on BLM 1.3.1 one at a time and ask students to classify as linear, quadratic, exponential, periodic. “Four Corners”: Display the first graph from BLM 1.3.2 and ask students to move to the corner that they think will best represent the function. One student from each corner should justify their choice. Tell students that you are going to show them more of the graph. Display the next graph on BLM 1.3.2. Students can now change corners if they feel that another one is more appropriate with this new information. Continue to do this with each of the graphs on BLM 1.3.2. (These show the same function with different viewing windows.) All students should end up at the periodic function corner. Discuss with students what information is useful when determining the appropriate function (i.e. shape of graph, context, scale, etc). Emphasize that just a quick glance at a graph may not be enough to make a decision.
Action! Small Groups Investigation In groups of 3 or 4, students will complete the activities from BLM 1.3.3. Each group may want some linking cubes to work with. Mathematical Process Focus: Problem Solving(Students will determine what type of model fits the data), Representing(Students will have represent a model), Communicating (Students will communicate their findings)
Consolidate Debrief Pairs Using a Graphic Organizer (FRAME)
Enlarge BLM 1.3.4 onto 11x17 paper. Each student should get two copies – one for linear and one for quadratic. Students should work with a partner to fill in as much as they can (Each student should keep their own copy). It may be helpful to give a few sample answers/ideas to get them started. They should finish this for homework. Note: The linear organizer should be completely filled in. The quadratics one can be started, but the algebraic information on factoring, expanding, etc, can be filled in at the end of the next unit. Students coming from the 10 applied course will have little experience with the algebraic representation of quadratics. BLM 1.3.6 contains possible responses that students may give.
Literacy Strategy – Four Corners. Make 4 signs, one for linear, quadratic, exponential, periodic and place one in each corner of the room. See page 72 in Think Literacy, Mathematics, grades 10 – 12 for more on Four Corners. For teachers with access to an LCD projector, you may want to work through the GSP sketch “What Function Am I?” It is hoped that the FRAME graphic organizer will be a framework that students can add to throughout the course and eventually use as a study guide.
Application Reflection
Home Activity or Further Classroom Consolidation Students are to complete their FRAME organizers as much as possible. Students are to complete BLM 1.3.5.
Grade 11 U/C – Unit 1: Introduction 15
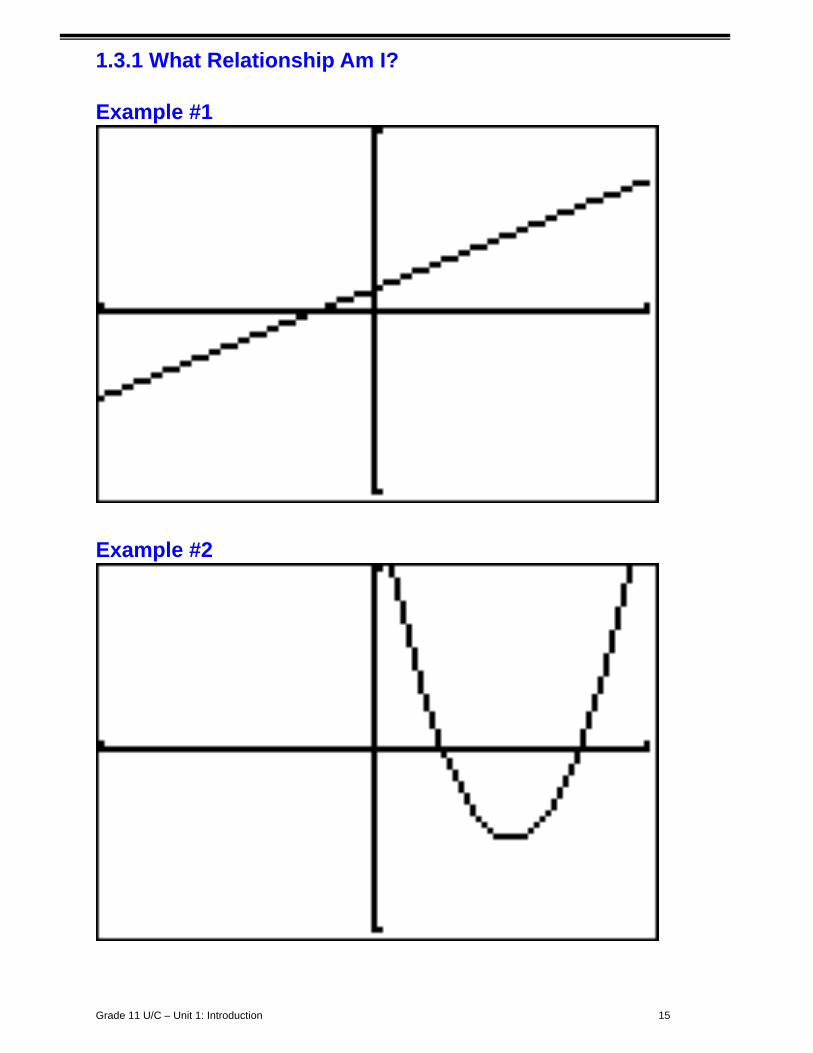
1.3.1 What Relationship Am I? Example #1
Example #2

Grade 11 U/C – Unit 1: Introduction 16
1.3.1 What Relationship Am I? (continued) Example #3

Grade 11 U/C – Unit 1: Introduction 17
1.3.2 Four Corners

Grade 11 U/C – Unit 1: Introduction 18
1.3.2 Four Corners (continued)

Grade 11 U/C – Unit 1: Introduction 19
1.3.3 Painted Cube Problem
1. A 3×3×3 cube made up of small cubes is dipped into a bucket of red
paint and removed. The indicated cube will have two of its faces painted. How many of these small cubes will have exactly two faces painted? 2. Repeat Part 1 when a 4×4×4 cube is dipped into the bucket of red paint. 3. Complete the following table showing the number of small cubes with two faces painted for
various sizes of large cubes. Two entries have been provided to help you. 4. What type of relationship do you think exists between the side length of the large cube (n)
and the number of small cubes with two faces painted? Justify your answer.
2 faces painted
Size of large cube (n×n×n)
Number of small cubes with two faces painted
3×3×3 4×4×4 5×5×5 36 6×6×6 7×7×7 60 8×8×8
HINT: You may want to use finite differences or create a scatter plot.

Grade 11 U/C – Unit 1: Introduction 20
1.3.3 Painted Cube Problem (continued) 5. Some of the small cubes will have just one side painted. Complete the following table
showing this information. Entries have been provided to help you. 6. What type of relationship do you think exists between the side length of the large cube (n)
and the number of small cubes with one face painted? Justify your answer.
Size of large cube (n×n×n)
Number of small cubes with one
face painted 3×3×3 4×4×4 5×5×5 54 6×6×6 7×7×7 150 8×8×8
HINT: You may want to use finite differences or create a scatter plot.

Grade 11 U/C – Unit 1: Introduction 21
1.3.4 FRAME (Function Representation And Model Examples) template
Visu
al/
Sp
atia
l/C
on
crete
Co
nte
xtu
al
Gra
ph
ical M
od
el
Descrip
tion
/K
ey w
ord
s N
um
erica
l Mo
del
Alg
eb
raic M
od
el

Grade 11 U/C – Unit 1: Introduction 22
1.3.5 What Am I? 1. Examine the graphs below and classify as linear, quadratic, exponential, periodic, not
sure.
_______________ _______________ _______________ _______________ 2. Examine each table of values below. Use finite differences to classify each relationship
as linear, quadratic, or other.
x y
1 −2
2 8
3 −2
4 8
5 −2
x y
1 12
2 7
3 5
4 6
5 10
x y
1 -9
2 -4
3 1
4 6
5 11
x y
1 32
2 −16
3 8
4 −4
5 2

Grade 11 U/C – Unit 1: Introduction 23
1.3.5 What Am I? (continued) 3. Read each of the following situations.
Decide if each situation would produce a linear, quadratic, exponential or periodic graph. a. Nabilia takes a taxi to the airport. She pays a flat fee of $5 and $1.50 for every
kilometer traveled. (x = distance, y = total amount paid) b. Your boss pays you $1 for your first day of work. On your second day, he pays you
twice the amount of the first day; on the third day, he pays you twice the amount of the second day; on the fourth day, he pays you twice the amount of the third day, and so on. (x = day number, y = amount paid to you on that day)
c. A soccer ball is kicked into the air. It rises to a maximum height of 12m and then falls back down to the ground. (x = time, y = height above the ground)
d. The pendulum on a clock swings back and forth, back and forth, back and forth. (x = time, y = distance from vertical)
e. You roll 36 dice and remove the dice with one dot showing. You roll the remaining dice and remove the dice with one dot showing. You roll the remaining dice and remove the dice with one dot showing. Repeat this process until you have no dice left. (x = roll number, y = number of dice remaining)
Distance from vertical

Grade 11 U/C – Unit 1: Introduction 24
1.3.6 Possible responses to BLM 1.3.4 LINEAR: Graphical Model Negative Slope
Positive Slope
(students may or may not need to label x&y intercepts, rise and run)
Zero Slope (horizontal line)
Undefined Slope (vertical line)
Numerical Model
x y First Differences – 3 – 2
3 – 2 1
3 – 1 4
3 0 7
3 1 10
3 2 13
3 3 16
Contextual 1. Compufix charges a base fee of $50 plus $30/h to fix your computer. 2. A hot air balloon is launched from a hill 2000m above sea level. It rises at 25m/s. 3. A car travels at a constant speed of 100km/h. 4. Ryan has $480 in his bank account and he withdraws $20 each week. 5. Helena works at The Gap. She is paid $300 each week plus 4% commission on all her sales. Description/Key Words Constant rate of change.
12
12
xxyym
−−
=
Slope equals rise over run.
The data represents a linear relationship because the first differences are constant.
Algebraic Model Slope-y-intercept Form: y =mx + b Standard Form: ax + by + c = 0
y-intercept
x-intercept
rise
run

Grade 11 U/C – Unit 1: Introduction 25
1.3.6 Possible responses to BLM 1.3.4 (continued) QUADRATIC: Graphical Model
Numerical Model
x y First Differences Second Differences
– 3 12 – 10 – 2 2 4
– 6 – 1 – 4 4
– 2 0 – 6 4
2 1 – 4 4
6 2 2 4
10 3 12 Contextual 1. A golf ball is hit into the air. It reaches a maximum height of 15m and then returns to the ground. 2. You walk towards a motion sensor, turn around and walk away from it. Description/Key Words It looks like a U or an upside down U. It has a highest or lowest point. Zeros – Points where the graph crosses the x-axis. Vertex – The highest or lowest point. Optimal Value – The y-coordinate of the vertex.
Algebraic Model Standard Form: y = ax2 + bx + c
The data represents a quadratic relationship because the second differences are constant.

Grade 11 U/C – Unit 1: Introduction 26
Unit 1 : Day 4 : Getting Ready for the Journey Grade 11 U/C
Minds On: 15
Action: 40
Consolidate:20
Total=75 min
Description/Learning Goals • Be able to identify characteristics of different graphs • Be able to classify a graph as a linear or non-linear • Explore the different characteristics of non-linear models
Materials • BLM 1.3.4 • BLM 1.4.1 • BLM 1.4.2 • CBRs and
graphing calculators
• M&M ® candies or Skittles®
Assessment Opportunities
Minds On… Whole Class Discussion Discuss responses to the homework on BLM 1.35 Students should share their entries on the FRAME templates (BLM1.3.4) for linear and quadratic. It may be helpful to complete a large class version of these templates to be posted around the room. The large class template can be a place to record the various responses from students. Where we are headed as a class: We can classify models as linear / quadratic / neither. How can we divide the neither category up further?
Action! Small Groups Investigation Organize students into groups of 4. Students will be working through 2 different activities. Set up the room so that half of the groups can work on each activity and then they can switch after 20 minutes. Distribute BLM 1.4.1 and BLM 1.4.2. Students will move to the appropriate work station and complete the activities. Mathematical Processes Focus: Connecting(Students will use prior knowledge of procedures and concepts introduced in gr. 9 and gr. 10), Reasoning and Proving(Students will make conjectures about types of models), Problem solving (Students will determine what type of model fits the data)
Consolidate Debrief Whole Class Graphical Organizer
Distribute the FRAME graphical organizer (BLM 1.3.4) and guide students in completing some parts of the FRAME for exponential models and periodic models. Students may only fill in some vague information about these models at this point. They may only have parts of the graphical, description, context sections filled out at this point.
In the discussion on dividing up the neither category, continue to look at the models in a very broad context. The discussion can focus on looking at sub-dividing the category into exponential, periodic, and other. Students will encounter n3 . Students may classify this model as an exponential model because of its rapid increase. For BLM 1.4.2 you will need to set up an appropriate number of stations for the activity. At this point, students will not be able to fully complete the graphical organizer. In the discussion, let students know that some pieces will be left unknown for the moment, and as they progress through the course, the missing pieces will be filled in.
Reflection
Home Activity or Further Classroom Consolidation Students search in the media for an example that could be modelled by 1 of the 4 models examined in this unit. Students write to explain what information they have selected and justify the model they believe to best represent the data / situation.

Grade 11 U/C – Unit 1: Introduction 27
1.4.1 Eli “M” ination
1. Pour a bag of M&M’s onto a paper plate so that the candies are one layer thick. You will need to spread the M&M’s to the edges of the plate.
2. Remove all the M&M’s with the M showing on one side (look closely at the yellow ones
because the M is hard to see). 3. Count and record the number of M&M’s removed and the number remaining on the chart
below. 4. Eliminate the M&M’s with the M showing and pour the remaining ones into a container.
Shake the container and pour these M&M’s back onto the plate. Again remove all the M&M’s with the M showing.
5. Record the number removed and the number remaining. Continue to repeat this
process until all the M&M’s are removed. Add additional trial numbers to the chart below as the experiment progresses.
Trial Number Number Removed Number Remaining
1
2
3
4
5

Grade 11 U/C – Unit 1: Introduction 28
1.4.1 Eli “M” ination (continued) Calculator Activity: 1. Enter the trial number into L1. 2. Enter the number of pieces remaining into L2. 3. Create a scatter plot of L1 and L2 using the big dot. Sketch the plot in the window
below, and fill in the window settings you used.
4. Decide which type of function best represents the data from the four choices below.
linear quadratic exponential periodic
Justify your selection. ________________________________________________________________ ________________________________________________________________ ________________________________________________________________

Grade 11 U/C – Unit 1: Introduction 29
1.4.2 Round and Round You Go In this activity, you will walk in a circle in front of a CBR. The CBR will produce a graph of your distance from the CBR as you walk. Instructions: 1. Refer to BLM 1.2.2 for the calculator set-up instructions. 2. The walker will walk in a steady circular path in front of the CBR for 15 seconds. The
walker should start between 2 and 3m from the CBR. 3. The diameter of the circular path should be between 0.5 and 1m. This will keep the
walker within the cone that the CBR can track. You may need to repeat the experiment until you have a path in which the walker stayed within the range of the CBR.
4. Sketch the plot in the window. 5. Decide which type of function best represents the data from the four choices below.
linear quadratic exponential periodic
Justify your selection. ________________________________________________________________ ________________________________________________________________ ________________________________________________________________
Suggestion: To stay in a circular path, you may want to: a) walk around a hoola hoop or b) walk around a chair.
Ensure that the path of the walker is well within the cone that the CBR can track.
CBR
1m
2 m

Grade 11 U/C – Unit 1: Introduction 30
1.4.2 Round and Round You Go (continued) Extensions: For each of the following, make a hypothesis and then test your hypothesis. What if:
• the walker starts farther away from the CBR? (i.e. move the circle’s centre further from the CBR)
• the radius of the circular path is increased?
• the pace of walking is increased?
• during the walk, the walker changes direction of walking on the circle?