Embed Size (px)
Citation preview
1
Unit 1
Introducing Indian Society
Introduction
Sociology as a discipline is considered as a soft subject by the learners due to their prior knowledge or
familiarity with society. But it is not enough to have this commonsense knowledge about the society,
because this prior knowledge or common sense knowledge may be acquired from a particular viewpoint.
It may be only a partial view of the social reality. A sociologist should look society from the eyes of
different people to perceive what the reality may look like. A social map will help in locating oneself in
the society. It also helps to locate different identifies. The plurality of Indian society does provide an
individual with multiple identities. This unit will help the learner to understand Indian society from a
sociological rather than common sense point of view.
Learning outcomes
The learner will be able to….
1.1 Evaluate the impact of prior knowledge or familiarity about society in the learning of sociology.
1.2 Compare and contrast geographical map reading and social map reading.
1.3 Identify the importance of social maps over common sense maps
1.4 Analyse the role of colonial rule in shaping Indian consciousness and nationalism
Values and attitudes
After the successful transaction of this unit; the learner will appreciate the nature of sociology. The
learner will develop an attitude of using self-reflexivity and objective perception of the society and gain
an understanding of the influence of colonialism in forming Indian consciousness.
2
Unit Frame
Concepts/Content/Ideas Learning process/Activities with
assessment
Learning outcomes
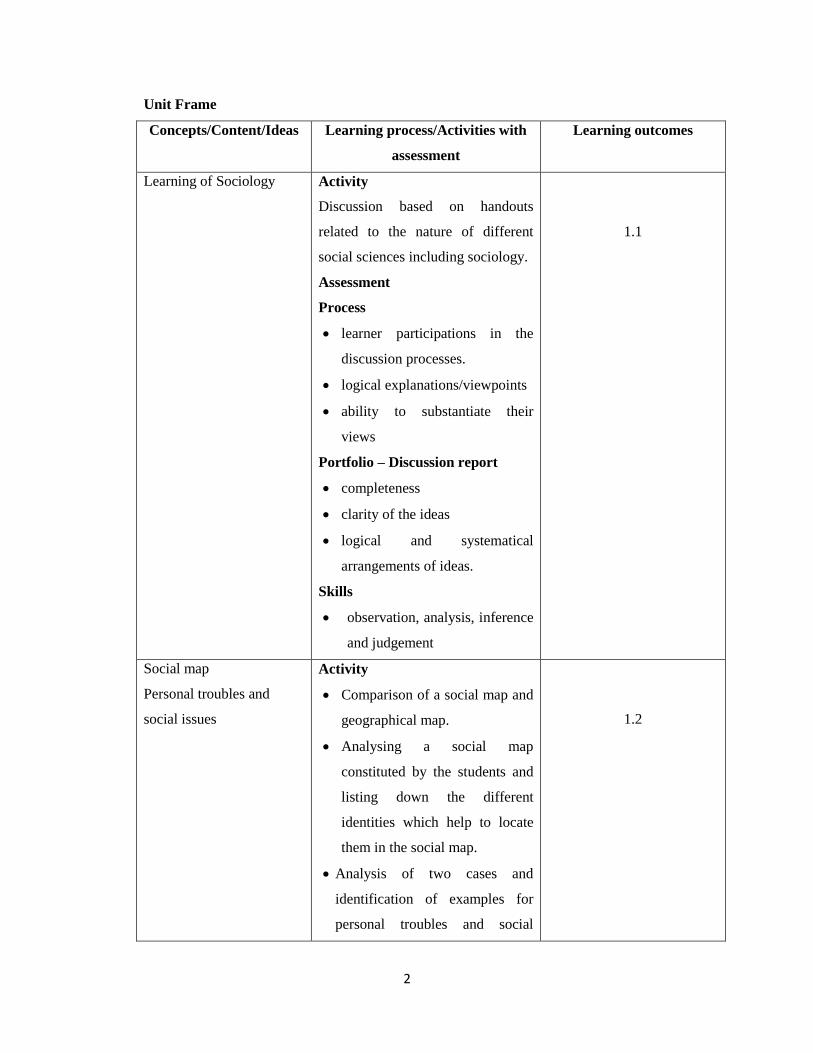
Learning of Sociology Activity
Discussion based on handouts
related to the nature of different
social sciences including sociology.
Assessment
Process
learner participations in the
discussion processes.
logical explanations/viewpoints
ability to substantiate their
views
Portfolio – Discussion report
completeness
clarity of the ideas
logical and systematical
arrangements of ideas.
Skills
observation, analysis, inference
and judgement
1.1
Social map
Personal troubles and
social issues
Activity
Comparison of a social map and
geographical map.
Analysing a social map
constituted by the students and
listing down the different
identities which help to locate
them in the social map.
Analysis of two cases and
identification of examples for
personal troubles and social
1.2
3
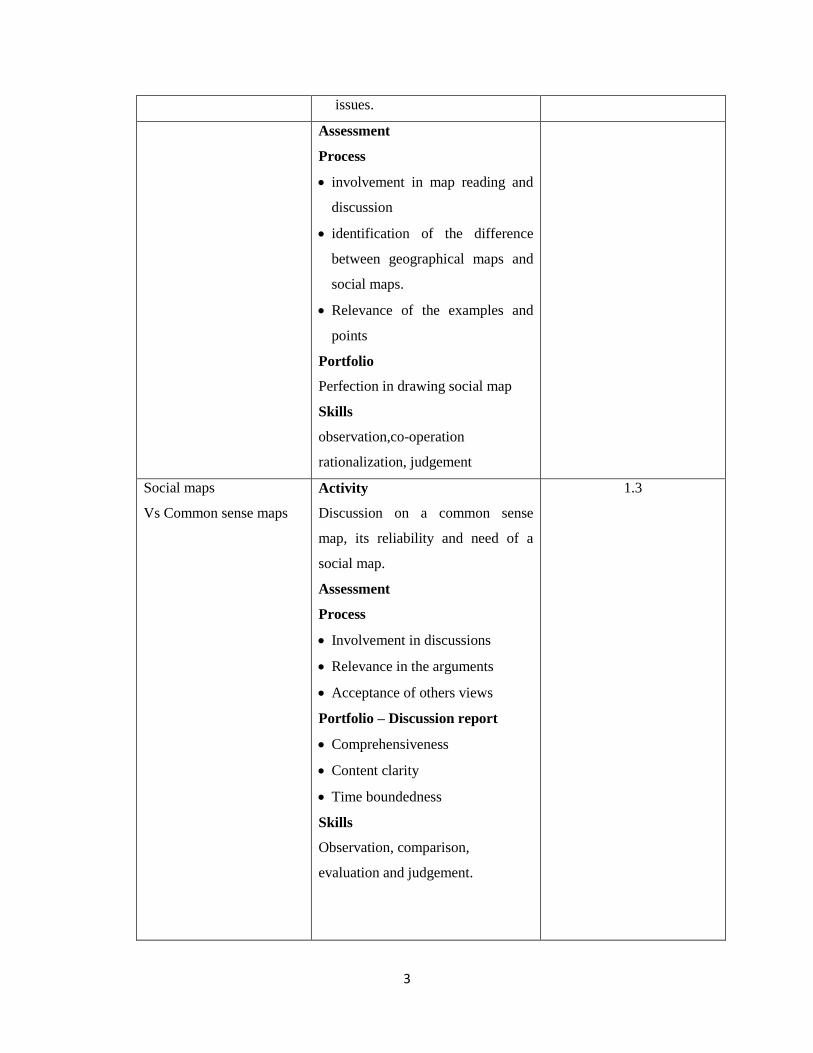
issues.
Assessment
Process
involvement in map reading and
discussion
identification of the difference
between geographical maps and
social maps.
Relevance of the examples and
points
Portfolio
Perfection in drawing social map
Skills
observation,co-operation
rationalization, judgement
Social maps
Vs Common sense maps
Activity
Discussion on a common sense
map, its reliability and need of a
social map.
Assessment
Process
Involvement in discussions
Relevance in the arguments
Acceptance of others views
Portfolio – Discussion report
Comprehensiveness
Content clarity
Time boundedness
Skills
Observation, comparison,
evaluation and judgement.
1.3
4
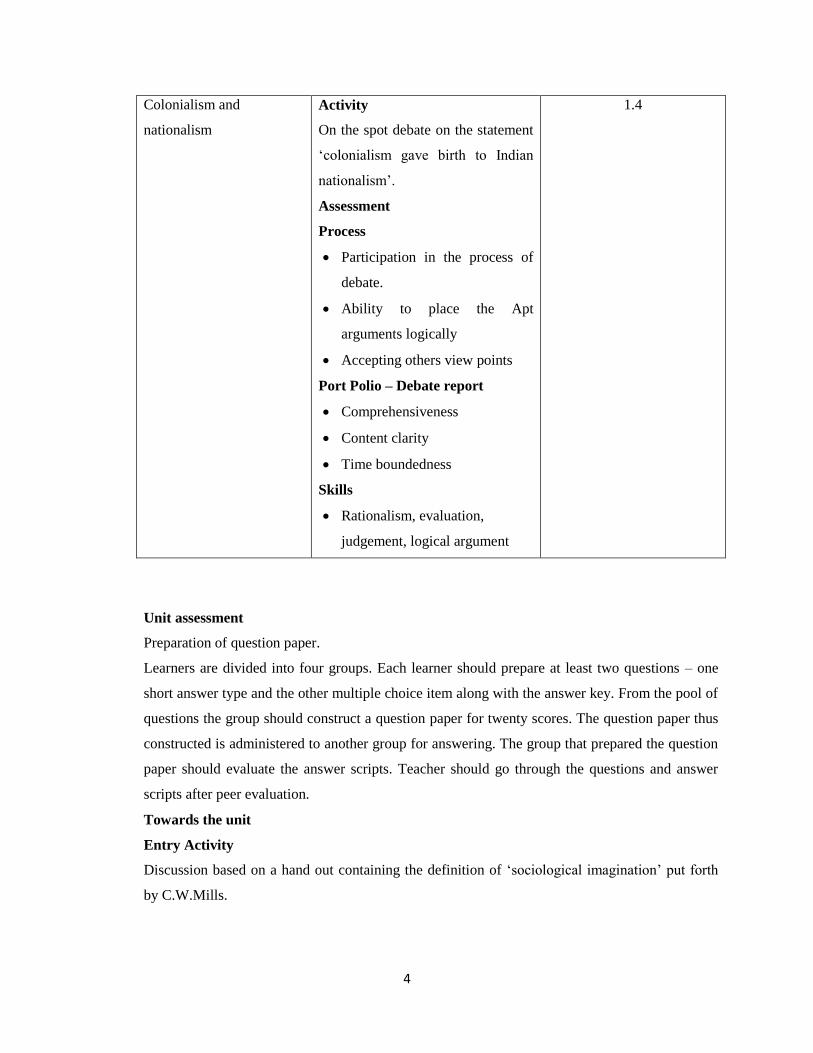
Colonialism and
nationalism
Activity
On the spot debate on the statement
„colonialism gave birth to Indian
nationalism‟.
Assessment
Process
Participation in the process of
debate.
Ability to place the Apt
arguments logically
Accepting others view points
Port Polio – Debate report
Comprehensiveness
Content clarity
Time boundedness
Skills
Rationalism, evaluation,
judgement, logical argument
1.4
Unit assessment
Preparation of question paper.
Learners are divided into four groups. Each learner should prepare at least two questions – one
short answer type and the other multiple choice item along with the answer key. From the pool of
questions the group should construct a question paper for twenty scores. The question paper thus
constructed is administered to another group for answering. The group that prepared the question
paper should evaluate the answer scripts. Teacher should go through the questions and answer
scripts after peer evaluation.
Towards the unit
Entry Activity
Discussion based on a hand out containing the definition of „sociological imagination‟ put forth
by C.W.Mills.

5
Poverty as a social phenomenon is taken for the discussion. Personal, biased views expressed
during the discussion are noted down. Each one of them is compared with the views thatexplain
the phenomenon as a social issue.
Worksheetscontaining different social phenomenon are given to the students and are asked to
write down the reasons for considering them as a social phenomena.
One or two worksheets completed by the learners are presented in the class. Others can contribute
in the discussion. After the discussion each one goes through the worksheet and makes necessary
modifications.
The learners are guided towards a conclusion that we have some preconceived notion about many
social phenomena. We acquired many of these ideas naturally or automatically through our
personal or limited social experiences. In most cases this knowledge ispartial and hence must be
de learned and unlearned in order to properly learn sociology.
Role of prior knowledge in learning of Sociology
Handouts containing the nature of different Social Sciences including sociology are distributed
among the learners for discussion in small groups. After the discussion each group has to
complete the following worksheet showing the role of prior knowledge about society in the
learning of the social sciences.
They are to find out the positive and negative aspects regarding the prior knowledge in sociology.
Worksheet
Subjects Economic History Sociology
Prior
knowledge
Positive Negative Positive Negative Positive Negative
6
From the worksheet they are to discuss the danger of finding solution to problems in a biased way.
The completed worksheets are mutually exchanged among learners to see if it is complete and filled
correctly. Learners are asked to make necessary modifications in the worksheet based on the peer
evaluation. Meanwhile one learner from each group is asked to present a short report regarding the
participation of the group members in the discussion process.
Case analysis
The following case is given to the learners.
„One higher secondary school asked its students not to wear dothy.‟
What will be the responses of the,.....
teachers of the same school.
teachers from other schools
parents of the students in the school.
students.
the public
the manager of the company which provide uniform to the school.
different other personalities whom the learners can identify.
Each learner writes down the possible responses and a few responses are presented in the class followed
by a short discussion.
Consolidation
The teacher helps them to come to the conclusion that each individual will have a different opinion about
the issue and each view is only a partial one about of the situation.
Social map.
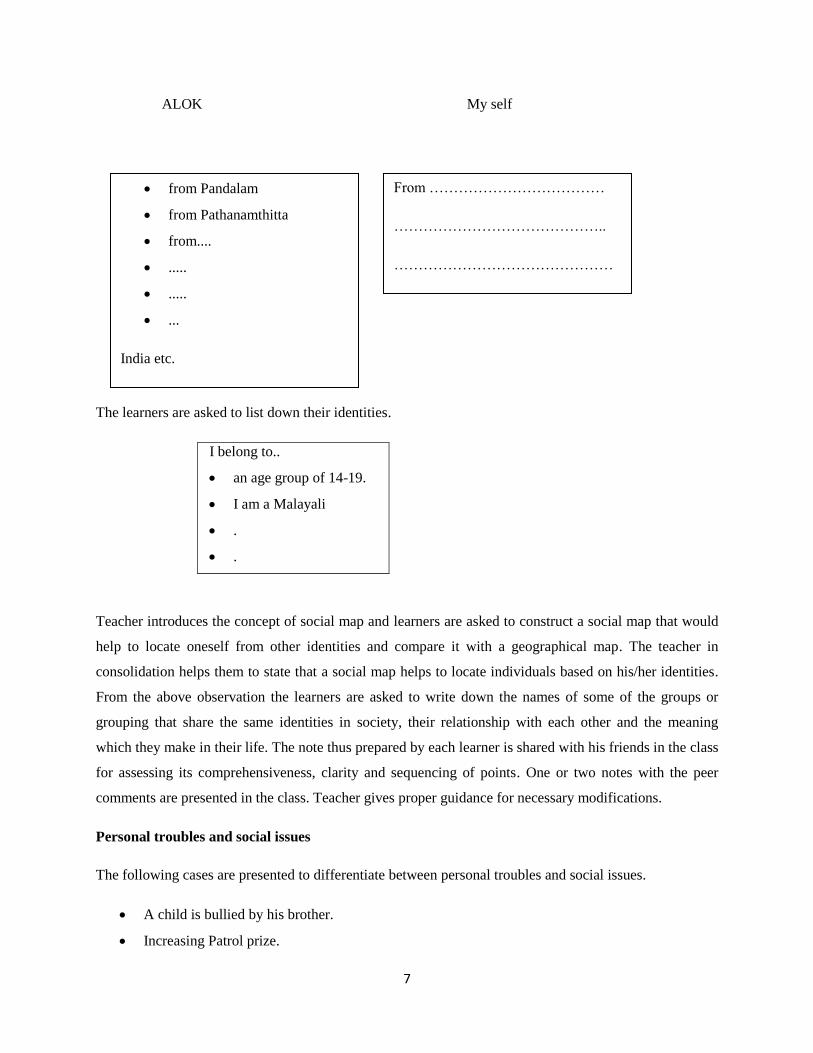
The learners are asked to locate themselves in a geographical map.
7
ALOK My self
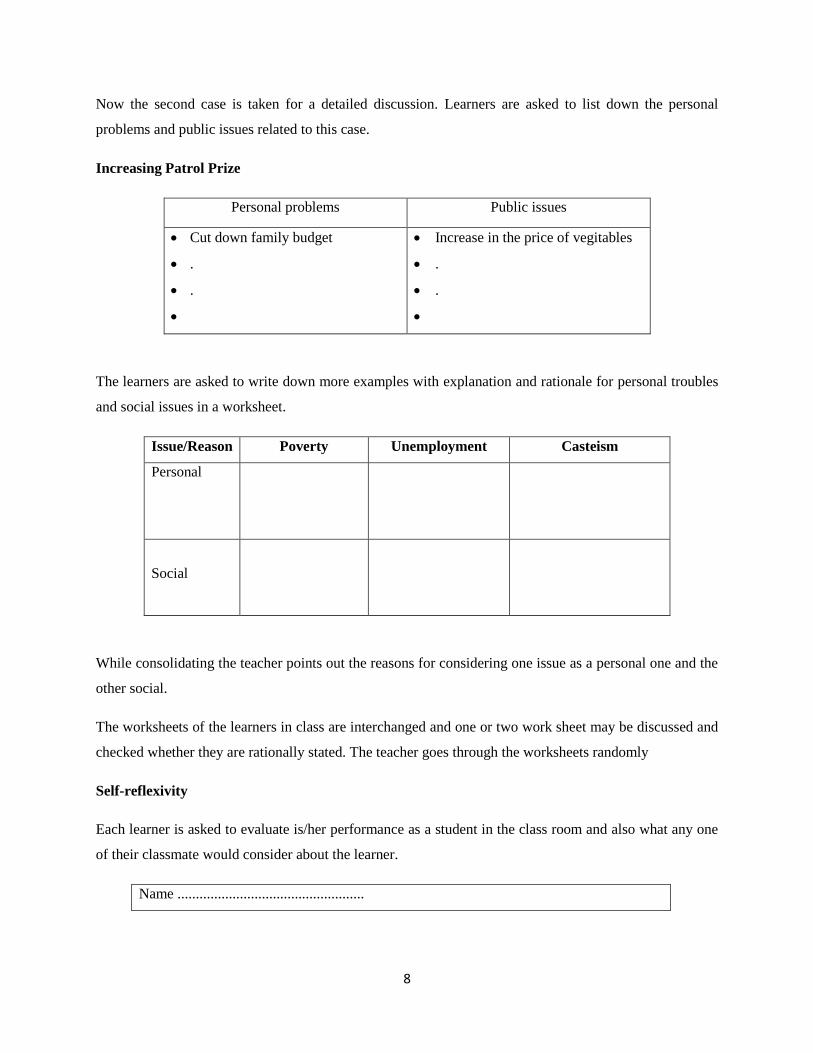
The learners are asked to list down their identities.
I belong to..
an age group of 14-19.
I am a Malayali
.
.
Teacher introduces the concept of social map and learners are asked to construct a social map that would
help to locate oneself from other identities and compare it with a geographical map. The teacher in
consolidation helps them to state that a social map helps to locate individuals based on his/her identities.
From the above observation the learners are asked to write down the names of some of the groups or
grouping that share the same identities in society, their relationship with each other and the meaning
which they make in their life. The note thus prepared by each learner is shared with his friends in the class
for assessing its comprehensiveness, clarity and sequencing of points. One or two notes with the peer
comments are presented in the class. Teacher gives proper guidance for necessary modifications.
Personal troubles and social issues
The following cases are presented to differentiate between personal troubles and social issues.
A child is bullied by his brother.
Increasing Patrol prize.
from Pandalam
from Pathanamthitta
from....
.....
.....
...
India etc.
From ………………………………
……………………………………..
………………………………………
8
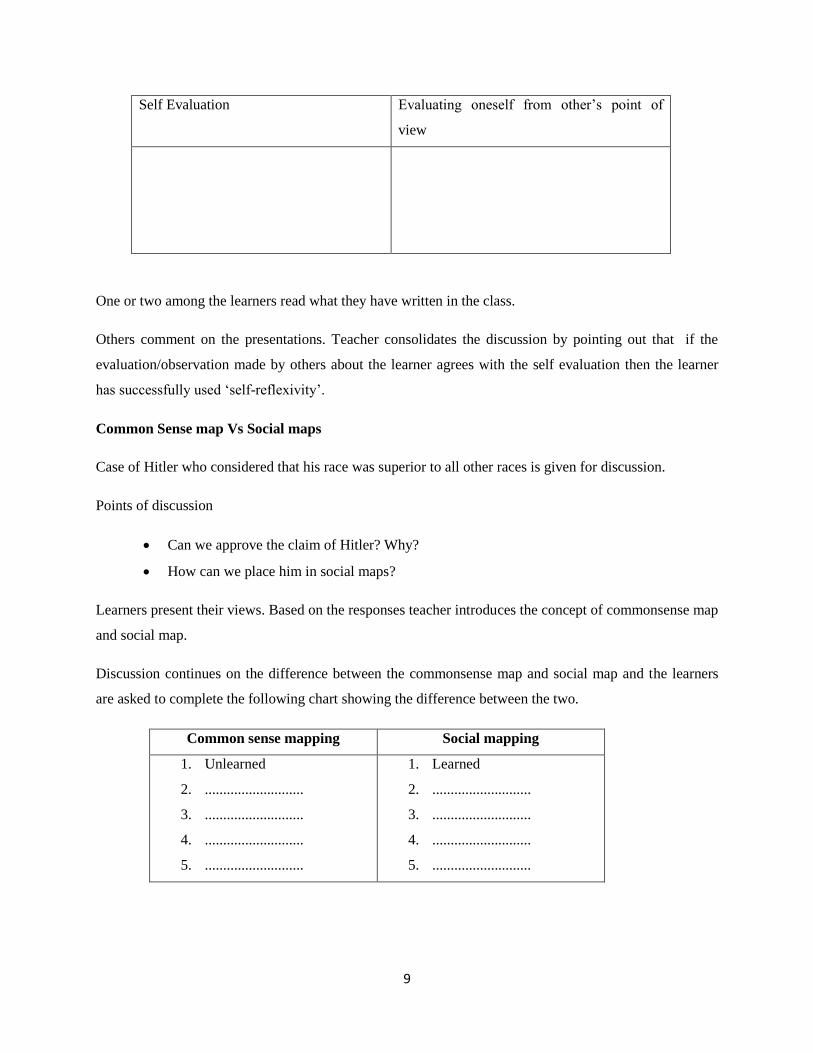
Now the second case is taken for a detailed discussion. Learners are asked to list down the personal
problems and public issues related to this case.
Increasing Patrol Prize
Personal problems Public issues
Cut down family budget
.
.
Increase in the price of vegitables
.
.
The learners are asked to write down more examples with explanation and rationale for personal troubles
and social issues in a worksheet.
Issue/Reason Poverty Unemployment Casteism
Personal
Social
While consolidating the teacher points out the reasons for considering one issue as a personal one and the
other social.
The worksheets of the learners in class are interchanged and one or two work sheet may be discussed and
checked whether they are rationally stated. The teacher goes through the worksheets randomly
Self-reflexivity
Each learner is asked to evaluate is/her performance as a student in the class room and also what any one
of their classmate would consider about the learner.
Name ...................................................
9
Self Evaluation Evaluating oneself from other‟s point of
view
One or two among the learners read what they have written in the class.
Others comment on the presentations. Teacher consolidates the discussion by pointing out that if the
evaluation/observation made by others about the learner agrees with the self evaluation then the learner
has successfully used „self-reflexivity‟.
Common Sense map Vs Social maps
Case of Hitler who considered that his race was superior to all other races is given for discussion.
Points of discussion
Can we approve the claim of Hitler? Why?
How can we place him in social maps?
Learners present their views. Based on the responses teacher introduces the concept of commonsense map
and social map.
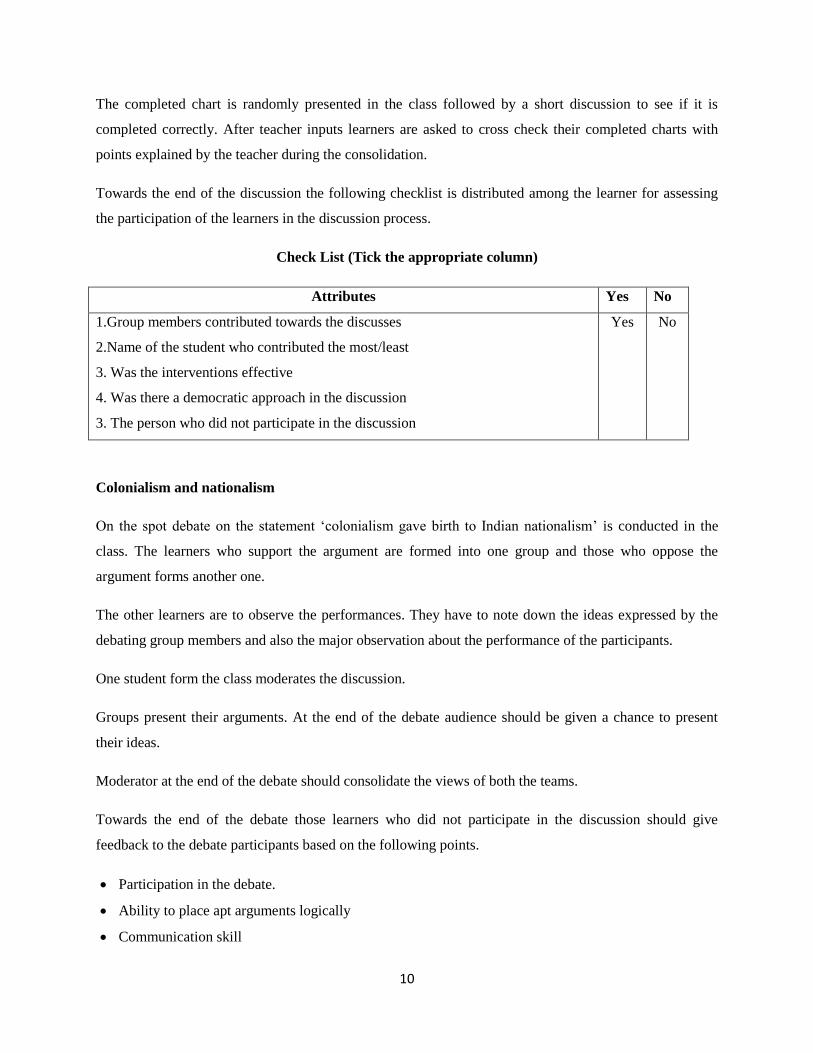
Discussion continues on the difference between the commonsense map and social map and the learners
are asked to complete the following chart showing the difference between the two.
Common sense mapping Social mapping
1. Unlearned
2. ...........................
3. ...........................
4. ...........................
5. ...........................
1. Learned
2. ...........................
3. ...........................
4. ...........................
5. ...........................
10
The completed chart is randomly presented in the class followed by a short discussion to see if it is
completed correctly. After teacher inputs learners are asked to cross check their completed charts with
points explained by the teacher during the consolidation.
Towards the end of the discussion the following checklist is distributed among the learner for assessing
the participation of the learners in the discussion process.
Check List (Tick the appropriate column)
Attributes Yes No
1.Group members contributed towards the discusses
2.Name of the student who contributed the most/least
3. Was the interventions effective
4. Was there a democratic approach in the discussion
3. The person who did not participate in the discussion
Yes No
Colonialism and nationalism
On the spot debate on the statement „colonialism gave birth to Indian nationalism‟ is conducted in the
class. The learners who support the argument are formed into one group and those who oppose the
argument forms another one.
The other learners are to observe the performances. They have to note down the ideas expressed by the
debating group members and also the major observation about the performance of the participants.
One student form the class moderates the discussion.
Groups present their arguments. At the end of the debate audience should be given a chance to present
their ideas.
Moderator at the end of the debate should consolidate the views of both the teams.
Towards the end of the debate those learners who did not participate in the discussion should give
feedback to the debate participants based on the following points.
Participation in the debate.
Ability to place apt arguments logically
Communication skill
11
Ability to convince others
Democratic approach
One or two participants from each group can also make self-assessment considering the above indicators.
While consolidating the teacher should point out that
Colonial rule unified India
colonialism gave birth to its enemy, nationalism
Colonialism and western education gave the impetus for the discovery of tradition
New classes and communities with new role and status emerged.
Each leaner has to prepare a detailed report on the debate including concluding remarks of the teacher.
Teacher randomly checks the debate reports.
Sample Questions
1. Analyse the advantages and disadvantages of prior knowledge about ones society in learning
sociology.
2. “We need to unlearn or de-learn our commonsense understanding of the society in order to
understand sociology.” Critically evaluate this statement.
3. Partial knowledge is a knowledge which is an.........................knowledge or a biased knowledge
4. .................................... knowledge allows us to see only a part of social reality.
5. Sociology does not offer a solution by showing us the whole of reality in a completely unbiased
way. But helps in seeing the world from many vantage points. Do you agree? Substantiate
6. Self inspection should be critical – quick to criticize and slow to praise one-self. This is known as
............................
7. Compare a geographical map with a social map.
8. ..................... help us to know where we are in relation to others in the society.
(geographical map, physical map, social map, political map)
9. Social map will help to locate ---------------. (Identify the item from the distracters given below
which does not agree with the statement.)
(geographical area, categories, identities, religion)
10. What is the explanation given by C.W.Mills on social issues.Compare social issues with personal
troubles.
11. A tribal girl „Kathi‟ gave birth to a child. Unfortunately the child dies within a few days. Reflect
on this statement and explain how this problem can become a social issue.
12
12. The phenomenon which cannot be considered as a social issue.
(a) Communalism, (b) Casteism (c) gender inequalities, (d) generation gap
(i) a & b
(ii) C and d
(iii) d and a
(iv) none
Why do you think so?
13 Explain how a common sense map might become misleading one.
14. Colonialism gave birth to nationalism. Analyse this statement.
15. How did colonialism help in reviving the rediscovery of tradition of India?
16. The --------------- were the main carriers of nationalism which were created by colonialism.
1
Chapter 2
The Demographic structure of the Indian Society
Introduction
Demography is the systematic study of population. The term is of Greek origin and is composed of two
words, ‘demos’ (people) and ‘graphein’ (describe). Demography studies the trends and processes
associated with population including changes in population size, patterns of birth, deaths and migration;
and the structure and composition of the population, such as the relative proportions of women, men
and different age groups.
Demography has its role and functions in the development of public health management, policing and
maintenance of law and order, economic policies relating to agriculture, industry, taxation and revenue
generation and governance of cities.
This chapter discusses on various concepts and indicators in demography and the theoretical
background behind the population changes from time to time . The advantages of demographic
dividend and its relevance also discussed here. In this lesson we will study size and growth of population
along with certain dimensions. Firstly the factors influence death rate, birth rate, maternal mortality
etc.. Secondly discussed the factors of declining sex ratio. Next we will find out the relationship between
ilteracy , rural urban differences and demography. Finally, we have a glance at National population
policy of India. All these analytical aspects would help us to look at our population not only as mere
numbers but as a human resource as well.
Values and attitudes
After the successful completion of this unit, the learner will identify and critically analyze the
various aspects of population such as birth rate, death rate, sex ratio , life expectancy, demographic
dividend ,ageing etc.. All these analytical aspects would help the learners to look at our population not
only as mere numbers but as human resources as well. After completing this unit the learner will be able
to relate population trends and policies with society and social change in India
III Learning outcomes
Students will be able to
1. Define the term demography, Social demography and social statistics.
2. Identify importance of social Demography, social statistics.
3. Judge the relevance of Malthusian theory of population growth.
4. Define and compare the theory of Demographic transition with the Malthusian theory of
population growth.
2
5. Explain common concepts and indicators in demography (Birth rate, death rate, fertility rate,
infant mortality, maternal mortality)
6. Define the term life expectancy, sex ratio, age structure, dependency ratio and Ageing.
7. Identify the Demographic dividend of India.
8. Analysis the size and Growth of Indian’s population.
9. Analyze the factors influence death rate and birth rate in India.
10. Explain the birth rate in India in 2004.
11. Compare and contrast the age structure of the Indian population.
12. The factors influence the declining sex ratio in India.
13. Identify the relationship between literacy and demographic trend in India.
14. Analyze rural-urban differences as a function of the demographic transition in India.
15. Describe the population policy in India.
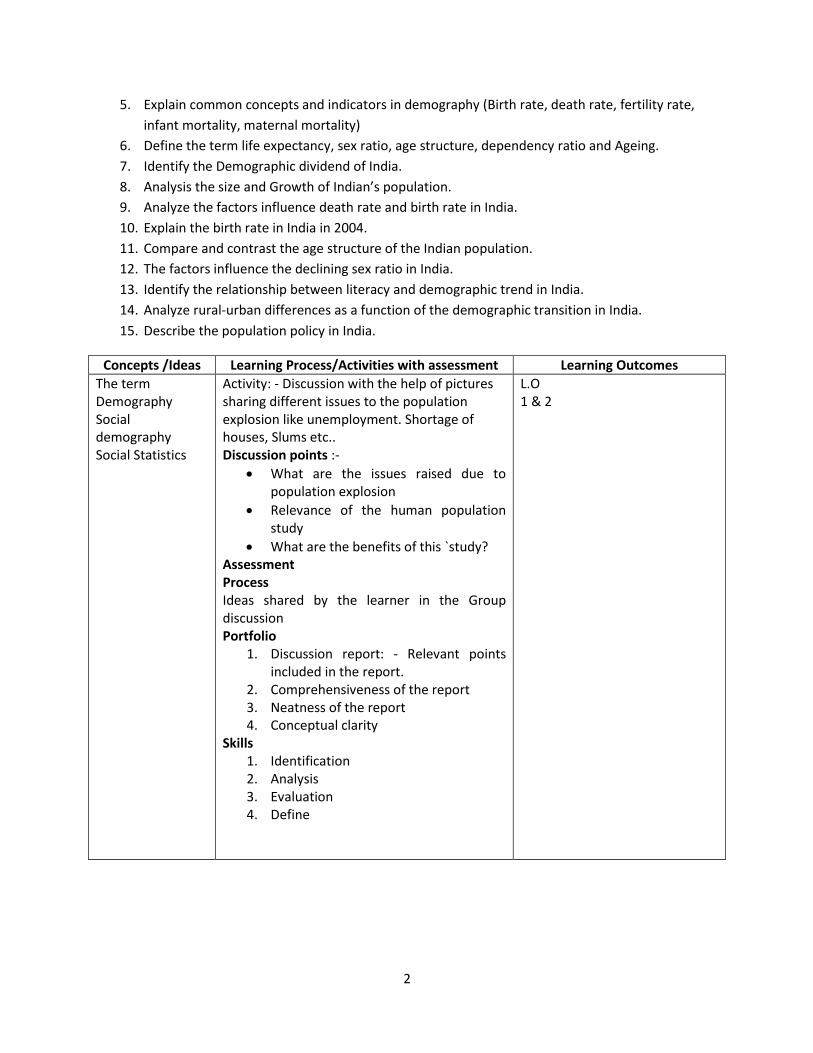
Concepts /Ideas Learning Process/Activities with assessment Learning Outcomes
The term Demography Social demography Social Statistics
Activity: - Discussion with the help of pictures sharing different issues to the population explosion like unemployment. Shortage of houses, Slums etc.. Discussion points :-
What are the issues raised due to population explosion
Relevance of the human population study
What are the benefits of this `study? Assessment Process Ideas shared by the learner in the Group discussion Portfolio
1. Discussion report: - Relevant points included in the report.
2. Comprehensiveness of the report 3. Neatness of the report 4. Conceptual clarity
Skills 1. Identification 2. Analysis 3. Evaluation 4. Define
L.O 1 & 2
3
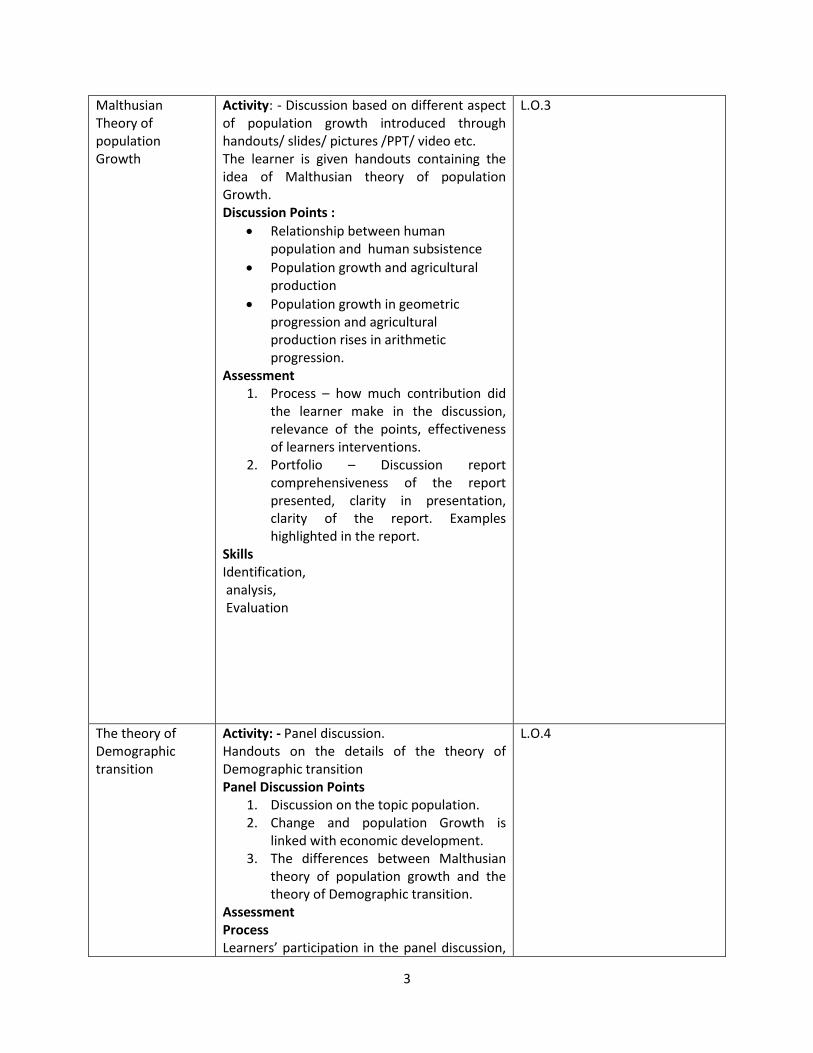
Malthusian Theory of population Growth
Activity: - Discussion based on different aspect of population growth introduced through handouts/ slides/ pictures /PPT/ video etc. The learner is given handouts containing the idea of Malthusian theory of population Growth. Discussion Points :
Relationship between human population and human subsistence
Population growth and agricultural production
Population growth in geometric progression and agricultural production rises in arithmetic progression.
Assessment 1. Process – how much contribution did
the learner make in the discussion, relevance of the points, effectiveness of learners interventions.
2. Portfolio – Discussion report comprehensiveness of the report presented, clarity in presentation, clarity of the report. Examples highlighted in the report.
Skills Identification, analysis, Evaluation
L.O.3
The theory of Demographic transition
Activity: - Panel discussion. Handouts on the details of the theory of Demographic transition Panel Discussion Points
1. Discussion on the topic population. 2. Change and population Growth is
linked with economic development. 3. The differences between Malthusian
theory of population growth and the theory of Demographic transition.
Assessment Process Learners’ participation in the panel discussion,
L.O.4
4
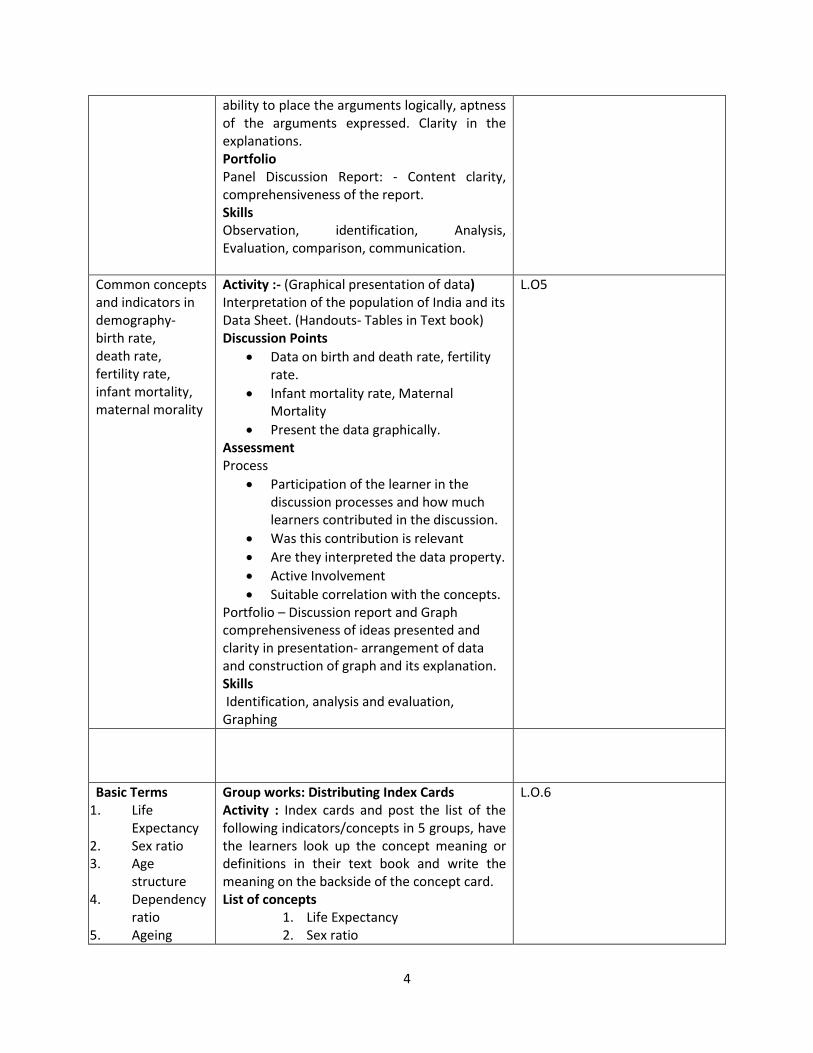
ability to place the arguments logically, aptness of the arguments expressed. Clarity in the explanations. Portfolio Panel Discussion Report: - Content clarity, comprehensiveness of the report. Skills Observation, identification, Analysis, Evaluation, comparison, communication.
Common concepts and indicators in demography- birth rate, death rate, fertility rate, infant mortality, maternal morality
Activity :- (Graphical presentation of data) Interpretation of the population of India and its Data Sheet. (Handouts- Tables in Text book) Discussion Points
Data on birth and death rate, fertility rate.
Infant mortality rate, Maternal Mortality
Present the data graphically. Assessment Process
Participation of the learner in the discussion processes and how much learners contributed in the discussion.
Was this contribution is relevant
Are they interpreted the data property.
Active Involvement
Suitable correlation with the concepts. Portfolio – Discussion report and Graph comprehensiveness of ideas presented and clarity in presentation- arrangement of data and construction of graph and its explanation. Skills Identification, analysis and evaluation, Graphing
L.O5
Basic Terms 1. Life
Expectancy 2. Sex ratio 3. Age
structure 4. Dependency
ratio 5. Ageing
Group works: Distributing Index Cards Activity : Index cards and post the list of the following indicators/concepts in 5 groups, have the learners look up the concept meaning or definitions in their text book and write the meaning on the backside of the concept card. List of concepts
1. Life Expectancy 2. Sex ratio
L.O.6
5
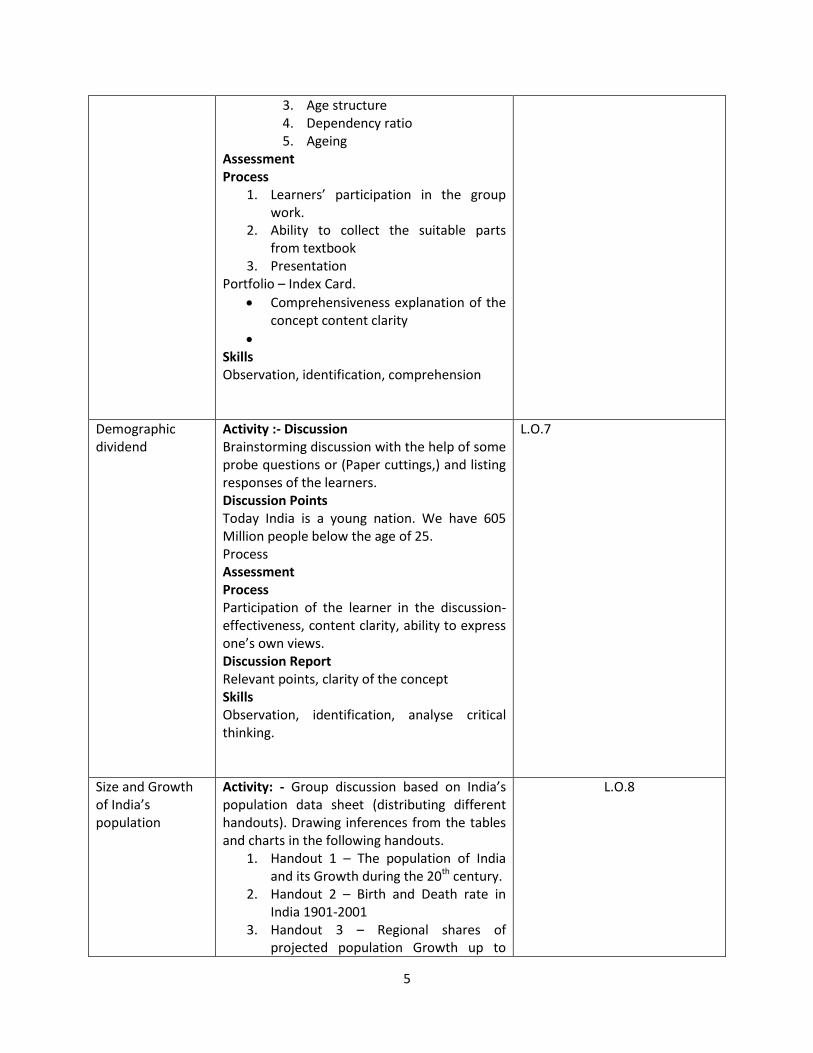
3. Age structure 4. Dependency ratio 5. Ageing
Assessment Process
1. Learners’ participation in the group work.
2. Ability to collect the suitable parts from textbook
3. Presentation Portfolio – Index Card.
Comprehensiveness explanation of the concept content clarity
Skills Observation, identification, comprehension
Demographic dividend
Activity :- Discussion Brainstorming discussion with the help of some probe questions or (Paper cuttings,) and listing responses of the learners. Discussion Points Today India is a young nation. We have 605 Million people below the age of 25. Process Assessment Process Participation of the learner in the discussion-effectiveness, content clarity, ability to express one’s own views. Discussion Report Relevant points, clarity of the concept Skills Observation, identification, analyse critical thinking.
L.O.7
Size and Growth of India’s population
Activity: - Group discussion based on India’s population data sheet (distributing different handouts). Drawing inferences from the tables and charts in the following handouts.
1. Handout 1 – The population of India and its Growth during the 20th century.
2. Handout 2 – Birth and Death rate in India 1901-2001
3. Handout 3 – Regional shares of projected population Growth up to
L.O.8
6
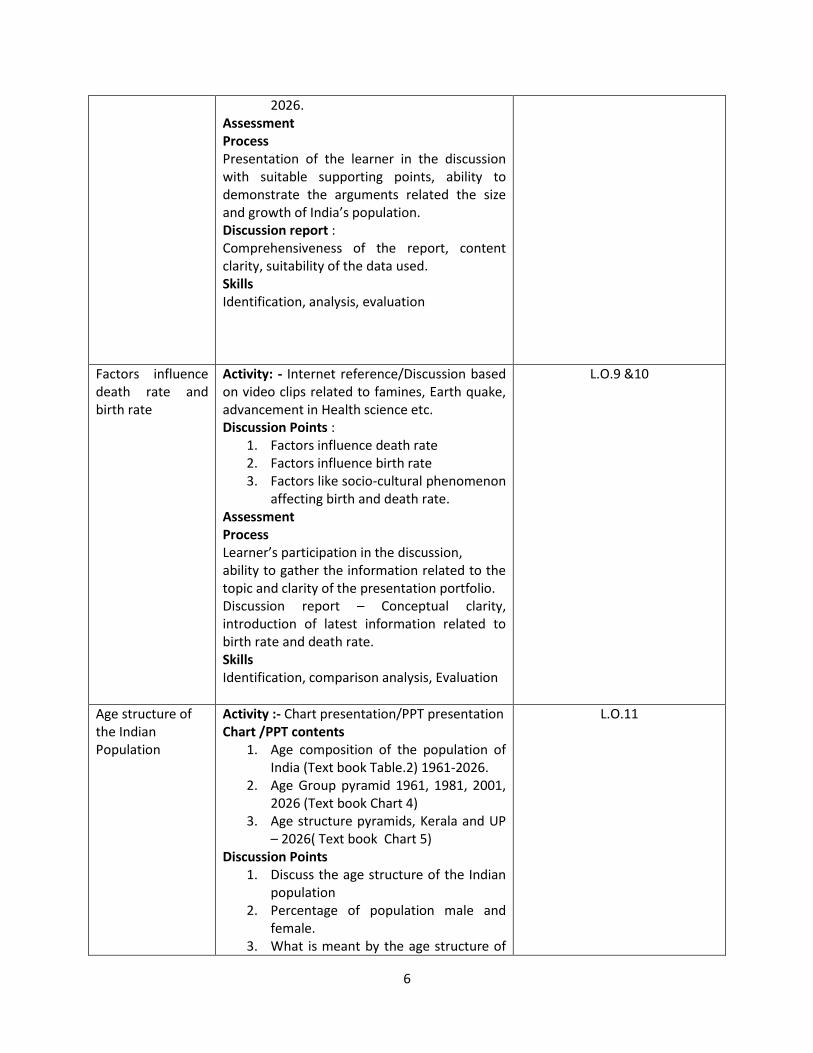
2026. Assessment Process Presentation of the learner in the discussion with suitable supporting points, ability to demonstrate the arguments related the size and growth of India’s population. Discussion report : Comprehensiveness of the report, content clarity, suitability of the data used. Skills Identification, analysis, evaluation
Factors influence death rate and birth rate
Activity: - Internet reference/Discussion based on video clips related to famines, Earth quake, advancement in Health science etc. Discussion Points :
1. Factors influence death rate 2. Factors influence birth rate 3. Factors like socio-cultural phenomenon
affecting birth and death rate. Assessment Process Learner’s participation in the discussion, ability to gather the information related to the topic and clarity of the presentation portfolio. Discussion report – Conceptual clarity, introduction of latest information related to birth rate and death rate. Skills Identification, comparison analysis, Evaluation
L.O.9 &10
Age structure of the Indian Population
Activity :- Chart presentation/PPT presentation Chart /PPT contents
1. Age composition of the population of India (Text book Table.2) 1961-2026.
2. Age Group pyramid 1961, 1981, 2001, 2026 (Text book Chart 4)
3. Age structure pyramids, Kerala and UP – 2026( Text book Chart 5)
Discussion Points 1. Discuss the age structure of the Indian
population 2. Percentage of population male and
female. 3. What is meant by the age structure of
L.O.11
7
the population? 4. Why is it relevant for economic
development and growth? Assessment Process Learners’ participation in the discussion clarity in the ideas presented. Discussion Report and Chart /PPT /conceptual clarity, assimilation of the concepts. Skills Observation, analysis, comparison, contrast and judging.
The Declining sex ratio in India
Activity :- PPT/Chart presentation PPT/Chart points The declining sex-ratio in India 1901-
2011 Map of child sex ratios across states
Discussion Points 1. Sex ratio and gender balance. 2. What are the implications of declining
sex ratio? Assessment – Process Participation of the learner in the discussion processes- How much the learner contributed in the discussion. Discussion report and chart Comprehensiveness of the report and chart, clarity in presentation, arrangement of points in sequential order. Skills Identification, collection of the data. Analysis, Evaluation
L.O. 12
Relationship between Literacy and demography
Activity : Discussion based on video clip related to population and literacy and followed by using chart on Literacy rate in India. Discussion Points.
1. Literacy and health awareness 2. Depth of illiteracy. 3. How does literacy rate influence
population Assessment – Process Involvement of the learners in the discussion to be assessed on the basis of participation. Clarity in the points, relevance etc.
L.O. 13
8
Discussion report: - Presentation of the report clarity of the report, illustration of the concept. Skill Identification, Analysis, Evaluation
Rural – Urban differences
Activity Data collection and analysis: - Conduct a case analysis on the basis of population in rural and urban areas. From the different sources like news paper, Internet etc. utilize to verify the factors influence. In demographic transition in Rural – Urban areas.. Assessment – Process Participation of the learner in the Data collection process and analysis, Identification of the learner in the concept with suitable examples Portfolio :- Discussion report :- Presentation of the data and its clarity. Skills Identification, Analysis, Evaluation,
L.0.14
Population Policy in India
Activity: - Seminar: Topic. Importance of India’s population policy. On the above topic , learners are asked to present a seminar paper on the above topic . Assessment Learners’ participation in the Seminar and their contribution of the points in the debate. Clarity of the points. Skills Observation, identification, Comparison, Analysis, evaluation
L.O.15
UNIT ASSESSMENT : QUIZ PROGRAMME
The class can be divided in to 5 groups. Each group prepares 20 questions and conducts a quiz
programme in their class.
Teacher records the performance of group members and scores obtained by each group in the right side
column of the teacher planner in order to be considered for term end CE assessment.
9
Towards the Unit
Entry Activity
Learners are asked to arrange the following places in terms of population size;
Thiruvananthapuram, Mumbai, Ernakulum, Lakshadweep, and Chennai.
Learners directed to answer some questions
How does population related to our social life.
India’s population to overtake china’s by 2028. How do you comment on this?
How do you correlate the national development with population
Do you think population study is important for the socio-economic development of our country?
Considering the discussion points raised by the learners and teacher introduces the
demographic study of the Indian society
Teacher Consolidation
Demography is the systematic study of population. The term is of Greek Origin and
composed of two words, ‘demos’ means people and ‘graphein’ means describe i.e. description
of people. Demographic studies associated with population including changes in population site,
patterns of births, deaths, migration and structure and composition of the population. All
demographic studies are based on processes of counting or enumeration such as the Censes or
the Survey.
DEMOGRAPHY,SOCIAL DEMOGRAPHY AND SOCIAL STATISTICS
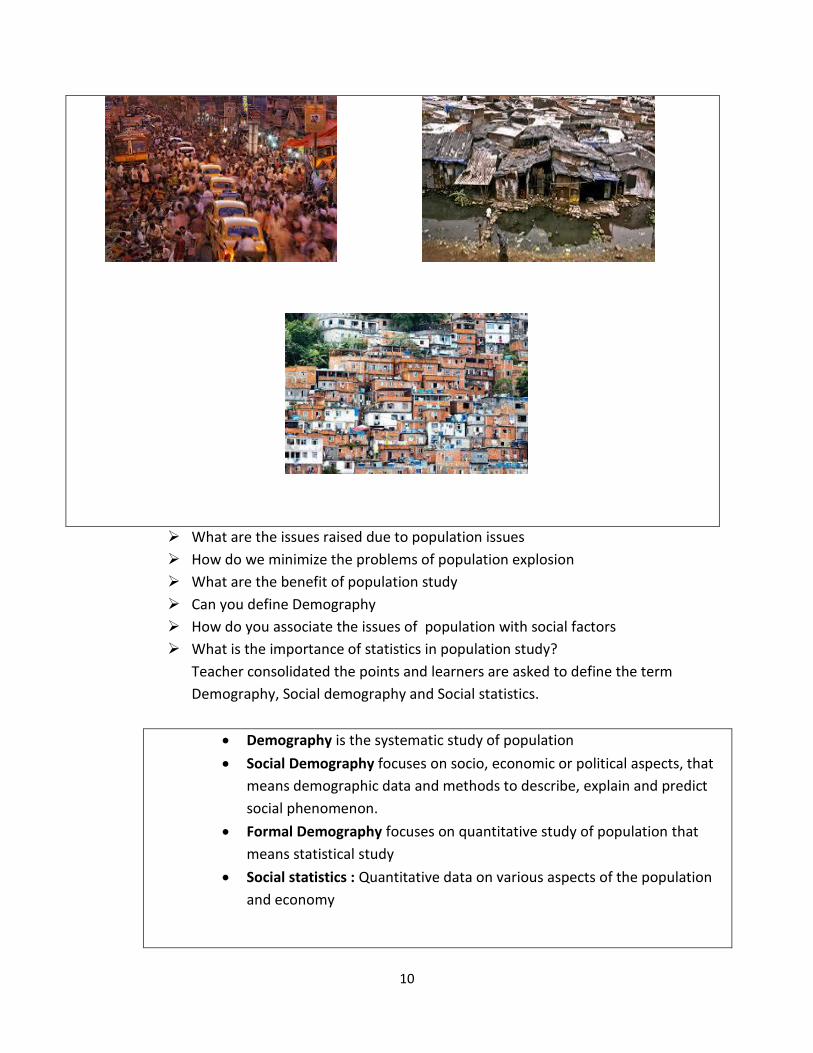
Shows the following different pictures related to the population explosion such as shortage of
houses, slums, problems of transportation etc. Initiates the discussion with the following points.
10
What are the issues raised due to population issues
How do we minimize the problems of population explosion
What are the benefit of population study
Can you define Demography
How do you associate the issues of population with social factors
What is the importance of statistics in population study?
Teacher consolidated the points and learners are asked to define the term
Demography, Social demography and Social statistics.
Demography is the systematic study of population
Social Demography focuses on socio, economic or political aspects, that
means demographic data and methods to describe, explain and predict
social phenomenon.
Formal Demography focuses on quantitative study of population that
means statistical study
Social statistics : Quantitative data on various aspects of the population
and economy
11
Learners are asked to prepare individual discussion report in their activity logs.
The activity log is exchanged among learners to ensure:
Relevant points included in the report
Conceptual clarity
Comprehensiveness of the report
Neatness of the report
If any difficulties identified, teacher should provide necessary support.
Teacher Input:
Census
An official, usually periodic enumeration of a population.
The first modern census was American census conducted in 1970
In India , the first census was conducted by British Indian Government in 1867-72
Regular ten yearly (Decennial) census conducted since 1881
Six decennial census have been conducted since 1951
Last census conducted in 2011
Indian census is the largest such exercise in the world
In China, doesn’t conduct regular census.
After consolidation learners are asked to complete the discussion report along with the
consolidation points in their activity log which will go the learner’s portfolio. The completed
activity log is interchanged among learners along with the following check list.
12
Check list
Tick the appropriate column
Attributes Yes No
The concept of Demography , Social demography and
social statistics are clearly presented
Report contains all the points listed during the discussion
with the consolidation points
Definitions are properly written
Learners mutually cross check the activity log with the check list and write their comments and
hand over the same to the learner concerned.
MALTHUSIAN THEORY OF POPULATION GROWTH
Discussion based on different aspects of population growth introduced through
handouts/ppt/video etc.
The learner is given handouts containing the details of Malthusian theory of population growth.
13
Handout. 1
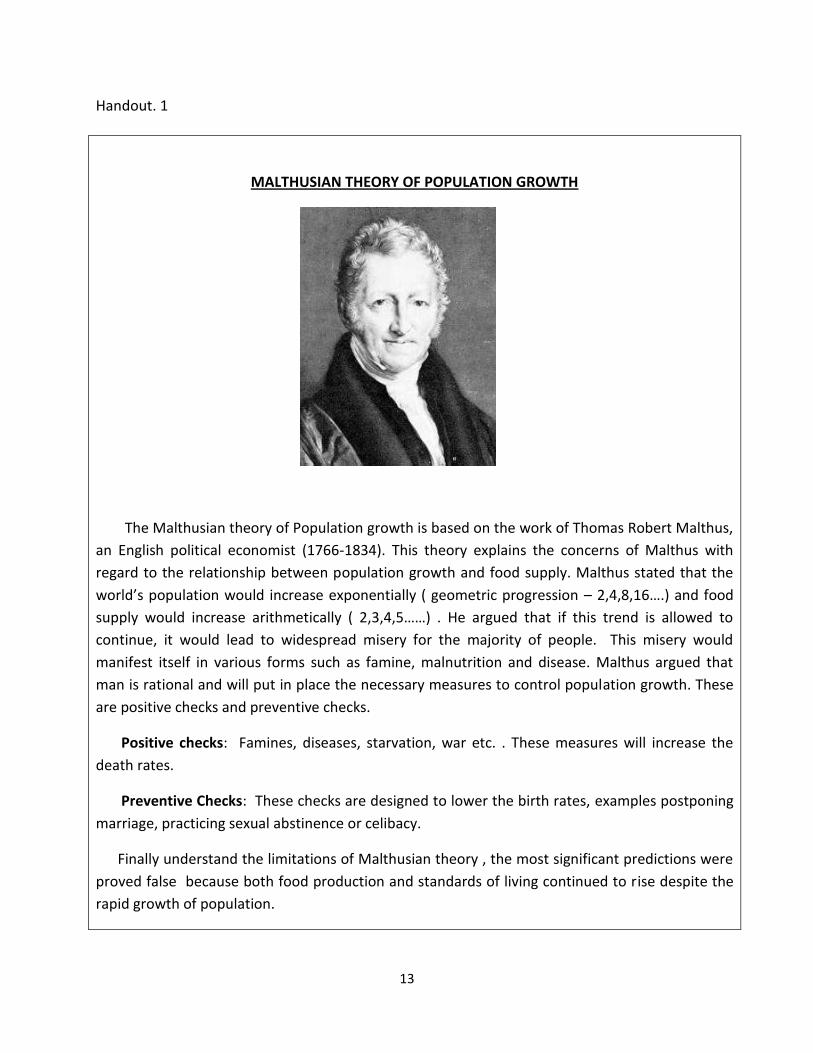
MALTHUSIAN THEORY OF POPULATION GROWTH
The Malthusian theory of Population growth is based on the work of Thomas Robert Malthus,
an English political economist (1766-1834). This theory explains the concerns of Malthus with
regard to the relationship between population growth and food supply. Malthus stated that the
world’s population would increase exponentially ( geometric progression – 2,4,8,16….) and food
supply would increase arithmetically ( 2,3,4,5……) . He argued that if this trend is allowed to
continue, it would lead to widespread misery for the majority of people. This misery would
manifest itself in various forms such as famine, malnutrition and disease. Malthus argued that
man is rational and will put in place the necessary measures to control population growth. These
are positive checks and preventive checks.
Positive checks: Famines, diseases, starvation, war etc. . These measures will increase the
death rates.
Preventive Checks: These checks are designed to lower the birth rates, examples postponing
marriage, practicing sexual abstinence or celibacy.
Finally understand the limitations of Malthusian theory , the most significant predictions were
proved false because both food production and standards of living continued to rise despite the
rapid growth of population.
14
Reflection Points:
Relationship between human population and food supply
Relationship between human population and agricultural production
Positive checks and preventive checks
Famines, diseases, starvation, war and its correlation with population
Explain the basic difference between positive and preventive checks
Discuss the relevance of Malthusian theory
What are the negative effects of overpopulation
Teacher randomly asks a few learners to explain the important points of Malthusian theory of
population growth. From the responses teacher can ensure that all the learners attained the
details of Malthusian theory of population growth.
Teacher Consolidation
Malthusian theory of Population growth is explained the relationship between
population growth and food supply
Positive checks: Famines, diseases, starvation, war etc. . These measures will increase
the death rates.
Preventive Checks: These checks are designed to lower the birth rates, examples
postponing marriage, practicing sexual abstinence or celibacy
Learners complete the discussion reports and the teacher individually checks the reports and
writes his/her comments in activity log.
15
Self assessment Check list
I have written the definition of Malthusian theory of Population growth in my activity log :
Yes No
I wrote the points related to the difference between positive checks and preventive checks
Yes No
I am able to explain all the points that I have written in my activity log
Yes No
Teacher randomly checks the learner self assessment check list and ensures that every learner
in the class attained the concept. If any learner is noted as lagging behind , the teacher should
scaffold that learner.
Sample Questions:
1. Define demography.
2. Critically analyze the relevance of Malthusian theory of Population growth.
3. Why did Malthus believe that catastrophic events like famines and epidemics that cause
mass deaths were inevitable?
4. Differentiate between social demography and demography.
5. Discuss the problems of population explosion.
6. State the use of demographic data
7. What is meant by social demography and Social statistics?
8. Sate various type of demography.
9. Explain the scope of Demography.