Embed Size (px)
Citation preview
*24GBY1101*
12005
*GBY11*
TIME1 hour 15 minutes.
INSTRUCTIONS TO CANDIDATESWrite your Centre Number and Candidate Number in the spaces provided at the top of this page.You must answer the questions in the spaces provided. Do not write outside the boxed area on each page or on blank pages.Complete in black ink only. Do not write with a gel pen.Answer all twelve questions.
INFORMATION FOR CANDIDATESThe total mark for this paper is 80.Figures in brackets printed down the right-hand side of pages indicate the marks awarded to each question or part question.Quality of written communication will be assessed in Question 12.
Centre Number
Candidate Number
*GBY11*
General Certificate of Secondary EducationJanuary 2019
Biology
Unit 1Foundation Tier
[GBY11]MONDAY 14 JANUARY, MORNING
12005
*24GBY1102*
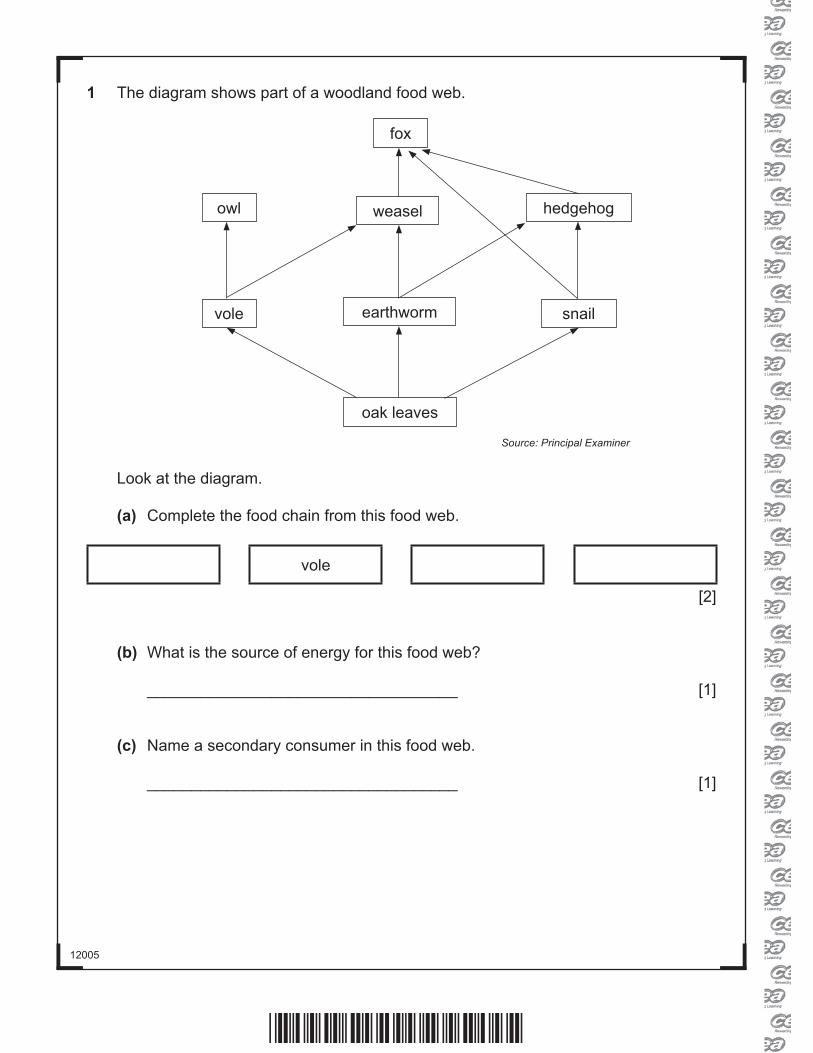
1 The diagram shows part of a woodland food web.
earthworm
oak leaves
weasel
fox
owl hedgehog
vole snail
Source: Principal Examiner
Look at the diagram.
(a) Complete the food chain from this food web.
vole
[2]
(b) What is the source of energy for this food web?
___________________________________ [1]
(c) Name a secondary consumer in this food web.
___________________________________ [1]
*24GBY1103*
12005[Turn over
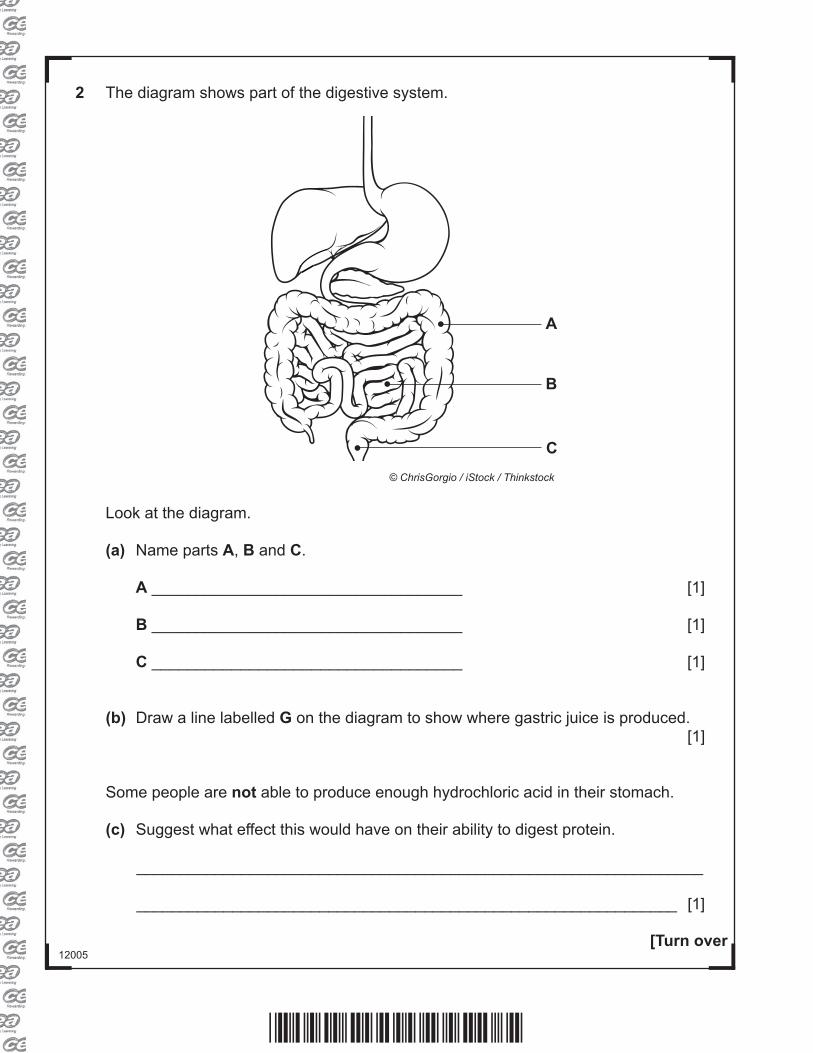
2 The diagram shows part of the digestive system.
A
B
C© ChrisGorgio / iStock / Thinkstock
Look at the diagram.
(a) Name parts A, B and C.
A ___________________________________ [1]
B ___________________________________ [1]
C ___________________________________ [1]
(b) Draw a line labelled G on the diagram to show where gastric juice is produced.[1]
Some people are not able to produce enough hydrochloric acid in their stomach.
(c) Suggest what effect this would have on their ability to digest protein.
_________________________________________________________________
______________________________________________________________ [1]
*24GBY1104*
12005
3 A pupil destarched a plant.
(a) Describe how the pupil destarched the plant.
_________________________________________________________________
_________________________________________________________________
______________________________________________________________ [2]
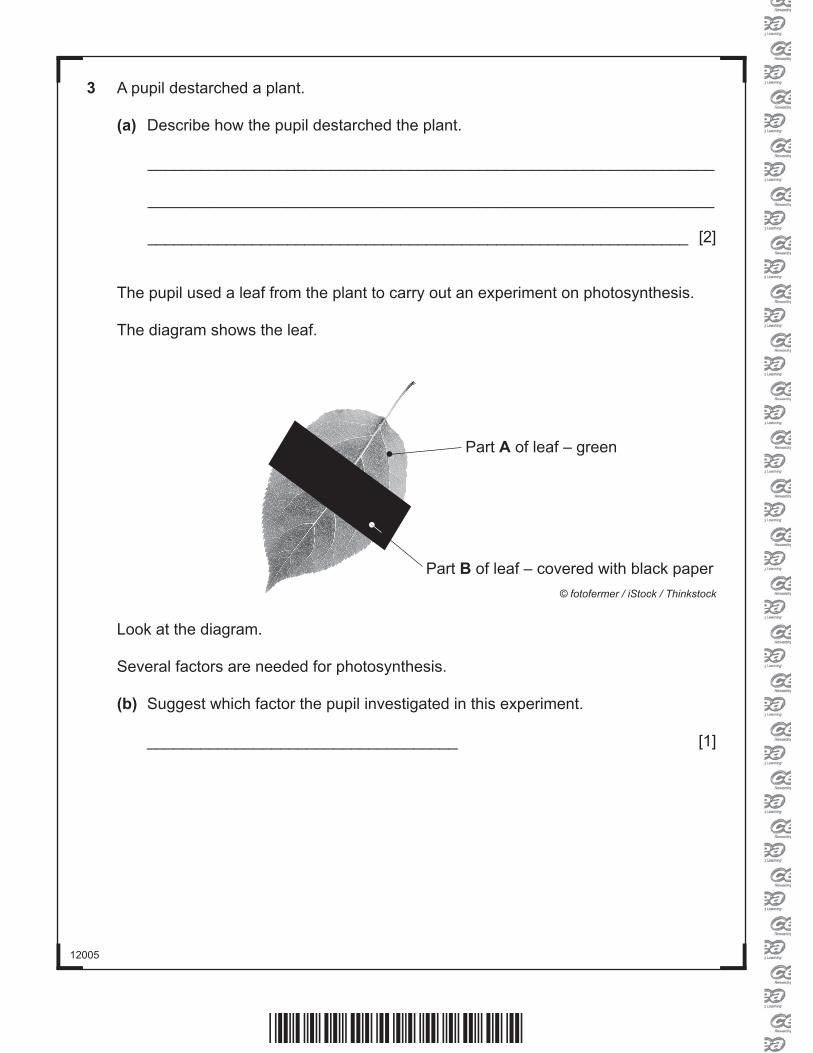
The pupil used a leaf from the plant to carry out an experiment on photosynthesis.
The diagram shows the leaf.
Part A of leaf – green
Part B of leaf – covered with black paper© fotofermer / iStock / Thinkstock
Look at the diagram.
Several factors are needed for photosynthesis.
(b) Suggest which factor the pupil investigated in this experiment.
___________________________________ [1]
*24GBY1105*
12005[Turn over
The pupil left the plant in bright light for 24 hours.
He then tested the leaf for starch using iodine solution.
The table shows his results.
Part of leafColour of iodine solution
before test after test
A yellow/brown blue/black
B yellow/brown yellow/brown
Look at the table.
(c) Explain the result for part B of the leaf.
Use evidence from the table and the diagram in your answer.
_________________________________________________________________
_________________________________________________________________
_________________________________________________________________
_________________________________________________________________
_________________________________________________________________
_________________________________________________________________
_________________________________________________________________
______________________________________________________________ [3]
*24GBY1106*
12005
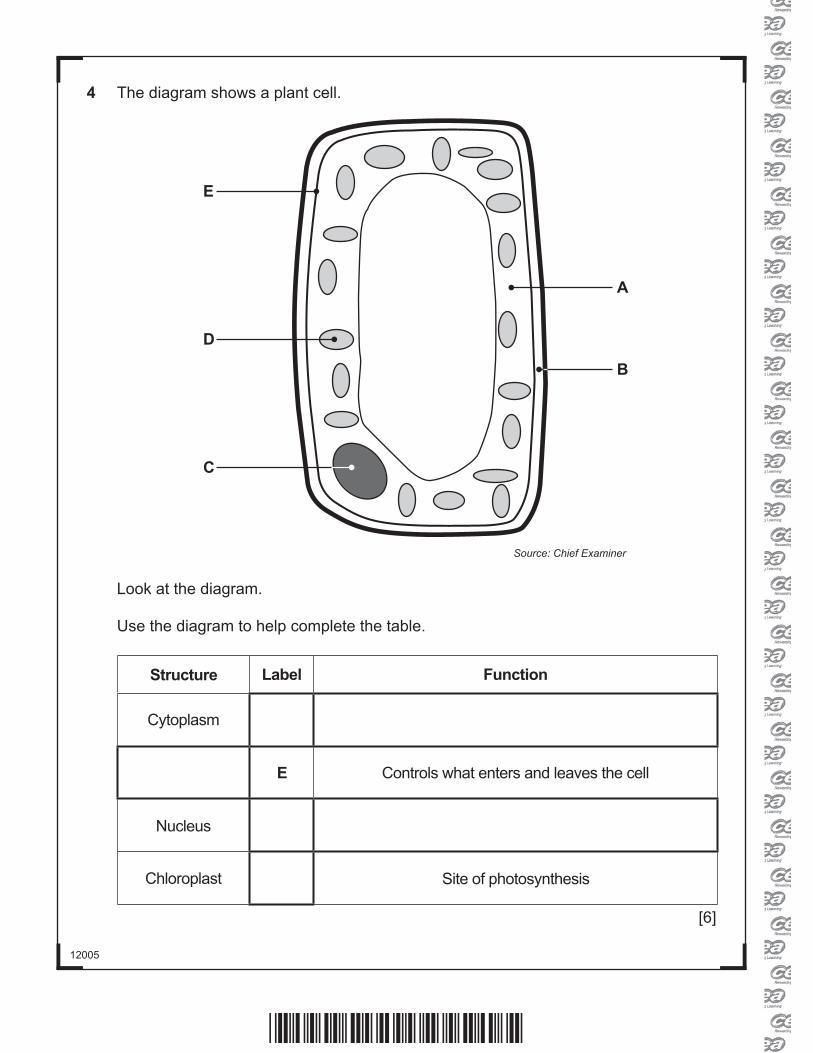
4 The diagram shows a plant cell.
C
D
E
A
B
Source: Chief Examiner
Look at the diagram.
Use the diagram to help complete the table.
Structure Label Function
Cytoplasm
E Controls what enters and leaves the cell
Nucleus
Chloroplast Site of photosynthesis
[6]
*24GBY1107*
12005[Turn over
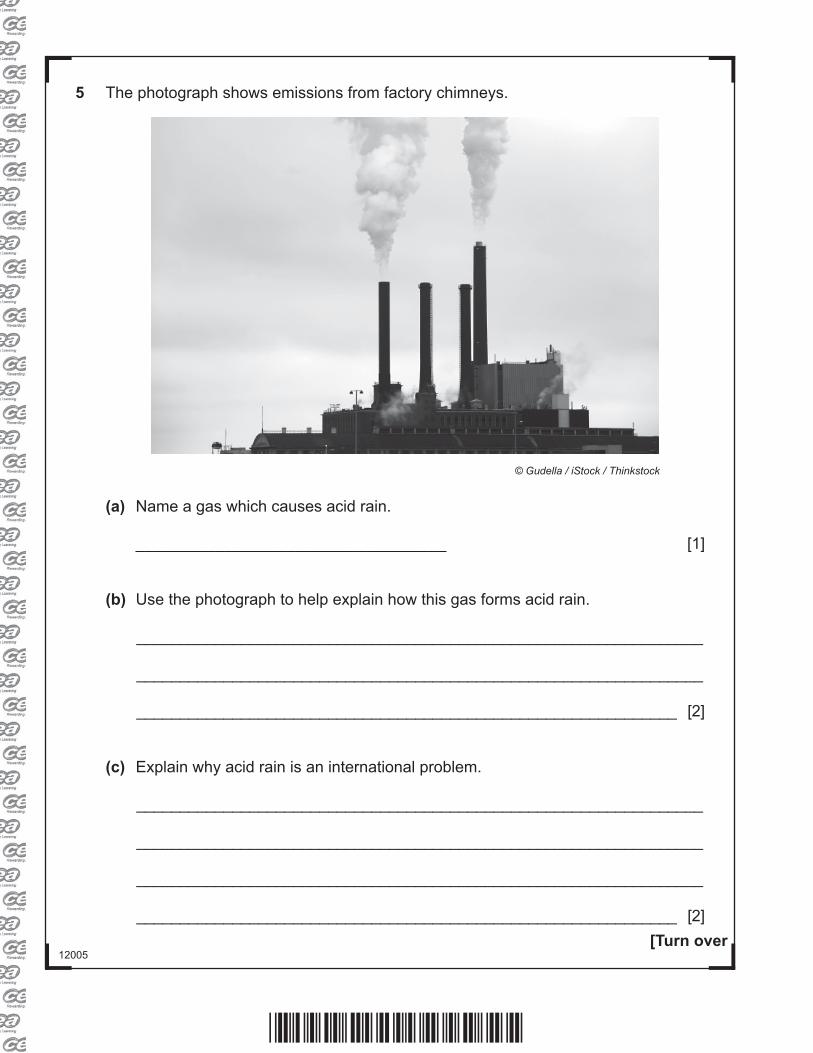
5 The photograph shows emissions from factory chimneys.
© Gudella / iStock / Thinkstock
(a) Name a gas which causes acid rain.
___________________________________ [1]
(b) Use the photograph to help explain how this gas forms acid rain.
_________________________________________________________________
_________________________________________________________________
______________________________________________________________ [2]
(c) Explain why acid rain is an international problem.
_________________________________________________________________
_________________________________________________________________
_________________________________________________________________
______________________________________________________________ [2]
*24GBY1108*
12005
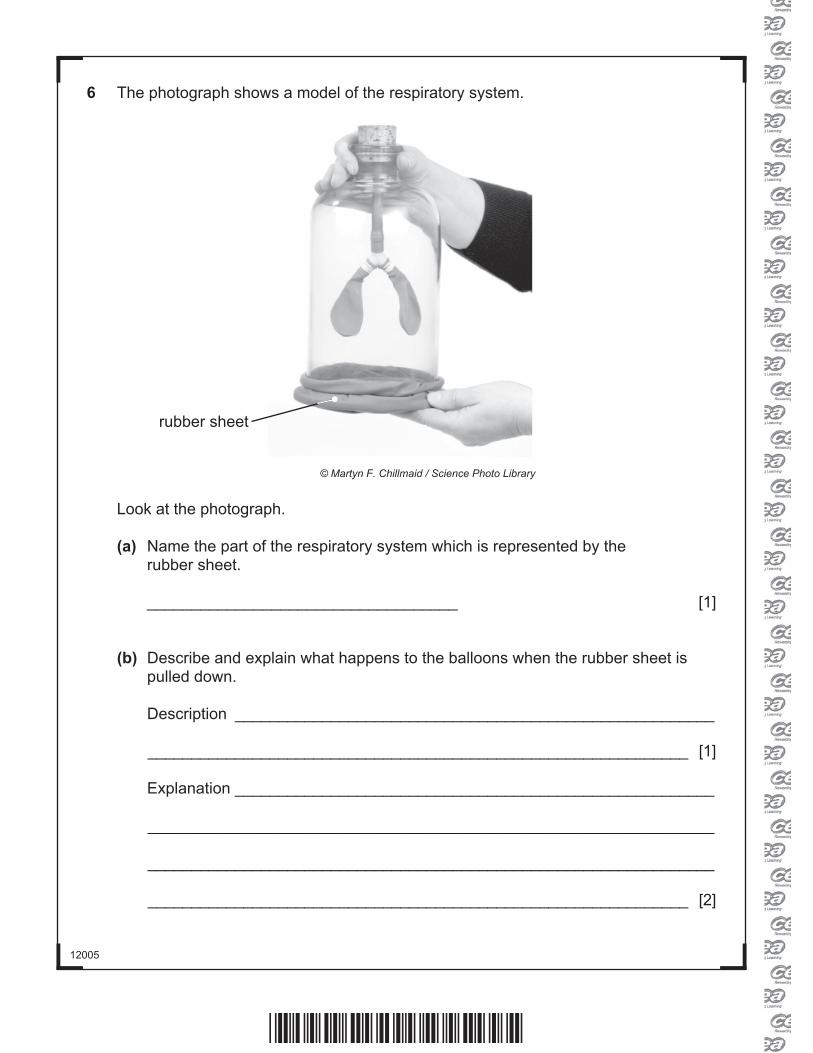
6 The photograph shows a model of the respiratory system.
rubber sheet
© Martyn F. Chillmaid / Science Photo Library
Look at the photograph.
(a) Name the part of the respiratory system which is represented by therubber sheet.
___________________________________ [1]
(b) Describe and explain what happens to the balloons when the rubber sheet ispulled down.
Description _______________________________________________________
______________________________________________________________ [1]
Explanation _______________________________________________________
_________________________________________________________________
_________________________________________________________________
______________________________________________________________ [2]
*24GBY1109*
12005[Turn over
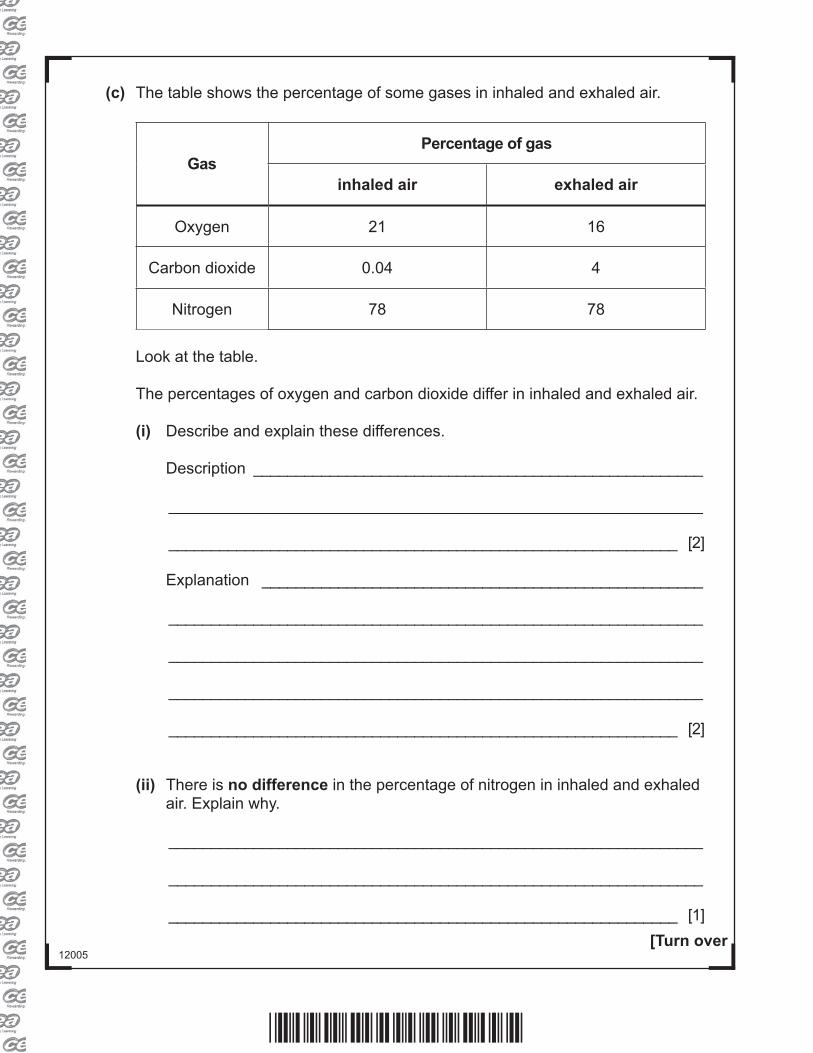
(c) The table shows the percentage of some gases in inhaled and exhaled air.
GasPercentage of gas
inhaled air exhaled air
Oxygen 21 16
Carbon dioxide 0.04 4
Nitrogen 78 78
Look at the table.
The percentages of oxygen and carbon dioxide differ in inhaled and exhaled air.
(i) Describe and explain these differences.
Description _____________________________________________________
_______________________________________________________________
____________________________________________________________ [2]
Explanation ____________________________________________________
_______________________________________________________________
_______________________________________________________________
_______________________________________________________________
____________________________________________________________ [2]
(ii) There is no difference in the percentage of nitrogen in inhaled and exhaledair. Explain why.
_______________________________________________________________
_______________________________________________________________
____________________________________________________________ [1]
*24GBY1110*
12005
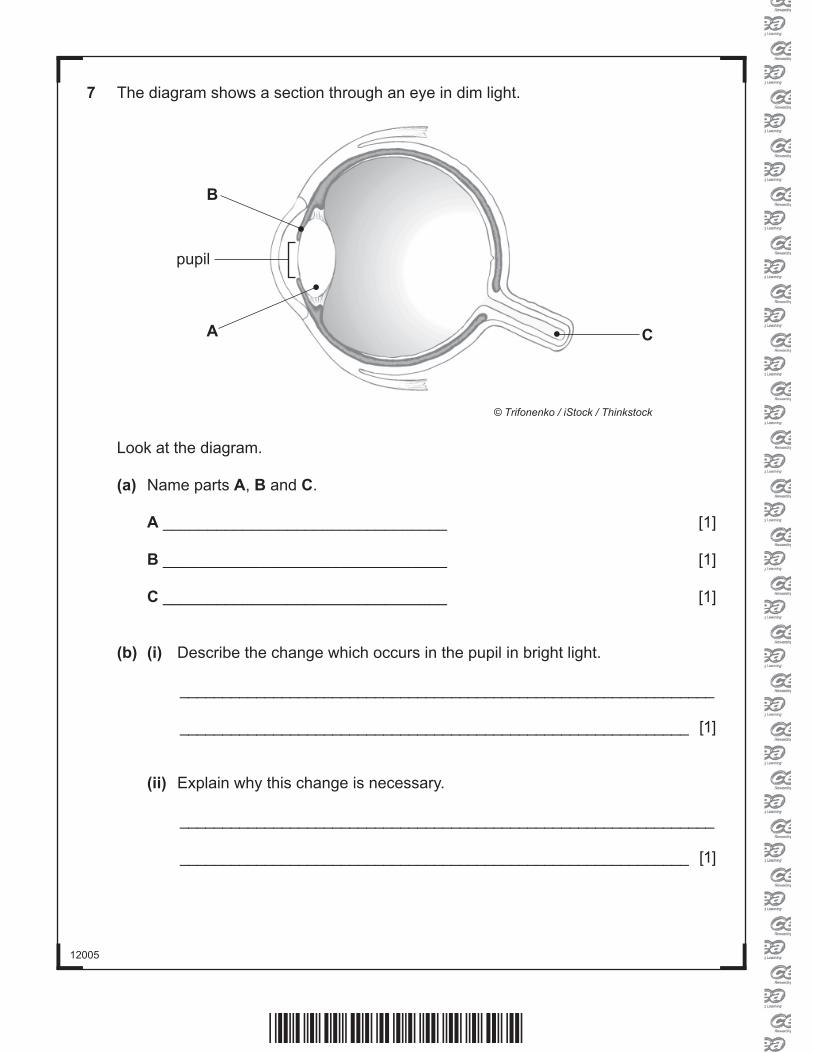
7 The diagram shows a section through an eye in dim light.
A
B
C
pupil
© Trifonenko / iStock / Thinkstock
Look at the diagram.
(a) Name parts A, B and C.
A ________________________________ [1]
B ________________________________ [1]
C ________________________________ [1]
(b) (i) Describe the change which occurs in the pupil in bright light.
_______________________________________________________________
____________________________________________________________ [1]
(ii) Explain why this change is necessary.
_______________________________________________________________
____________________________________________________________ [1]
*24GBY1111*
12005[Turn over
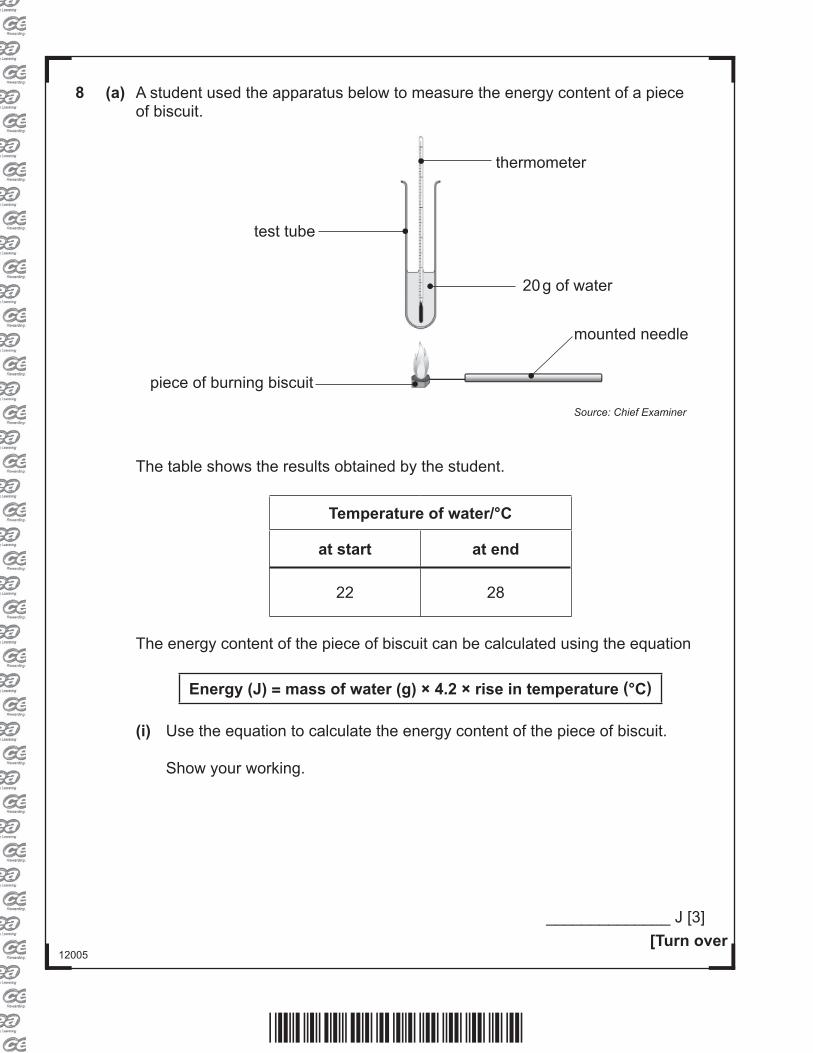
8 (a) A student used the apparatus below to measure the energy content of a piece of biscuit.
thermometer
20 g of water
mounted needle
test tube
piece of burning biscuit
Source: Chief Examiner
The table shows the results obtained by the student.
Temperature of water/°C
at start at end
22 28
The energy content of the piece of biscuit can be calculated using the equation
Energy (J) = mass of water (g) × 4.2 × rise in temperature (°C)
(i) Use the equation to calculate the energy content of the piece of biscuit.
Show your working.
______________ J [3]
*24GBY1112*
12005
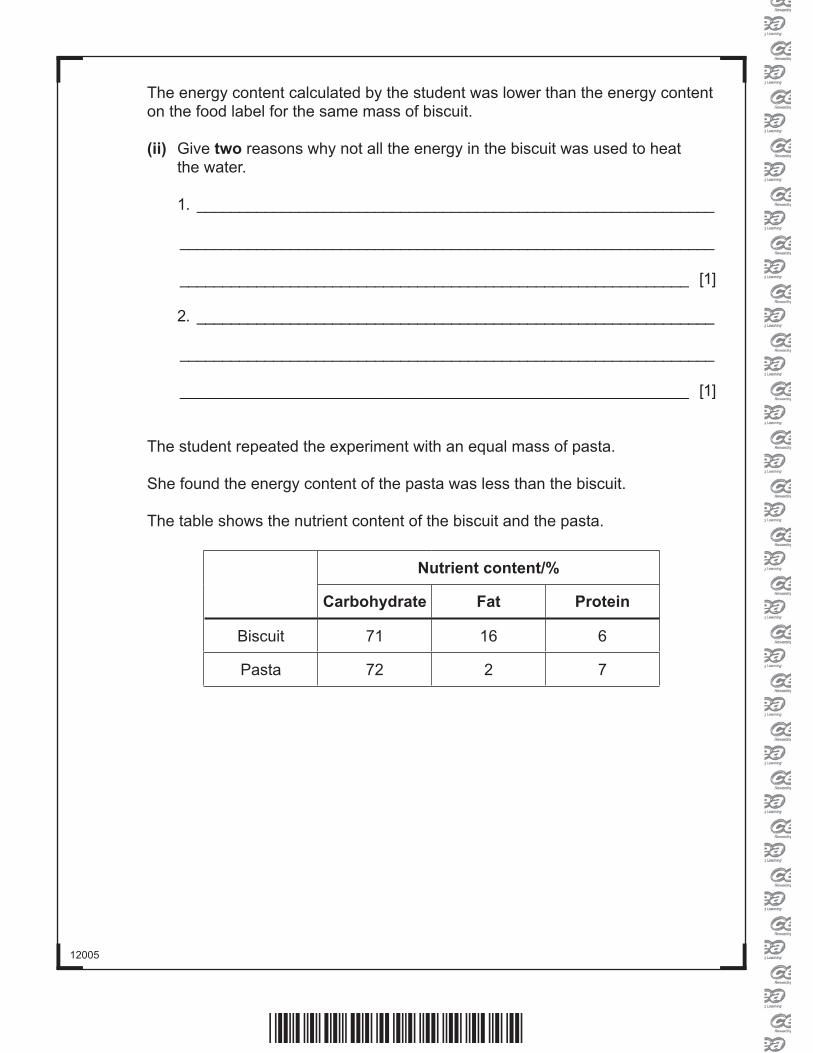
The energy content calculated by the student was lower than the energy content on the food label for the same mass of biscuit.
(ii) Give two reasons why not all the energy in the biscuit was used to heatthe water.
1. _____________________________________________________________
_______________________________________________________________
____________________________________________________________ [1]
2. _____________________________________________________________
_______________________________________________________________
____________________________________________________________ [1]
The student repeated the experiment with an equal mass of pasta.
She found the energy content of the pasta was less than the biscuit.
The table shows the nutrient content of the biscuit and the pasta.
Nutrient content/%
Carbohydrate Fat Protein
Biscuit 71 16 6
Pasta 72 2 7
*24GBY1113*
12005[Turn over
(iii) Suggest why the energy content of the pasta was less than the biscuit.
Use evidence from the table to support your answer.
_______________________________________________________________
_______________________________________________________________
_______________________________________________________________
_______________________________________________________________
____________________________________________________________ [2]
(b) People are advised to monitor their energy intake to maintain a healthy lifestyle.
(i) Give one use of energy in the body.
_______________________________________________________________
____________________________________________________________ [1]
(ii) Give two factors which affect the energy requirements of a person.
1. __________________________________________________________ [1]
2. __________________________________________________________ [1]
People who have an unhealthy diet may become obese.
(iii) Give two other health problems linked to an unhealthy diet.
1. __________________________________ [1]
2. __________________________________ [1]
*24GBY1114*
12005
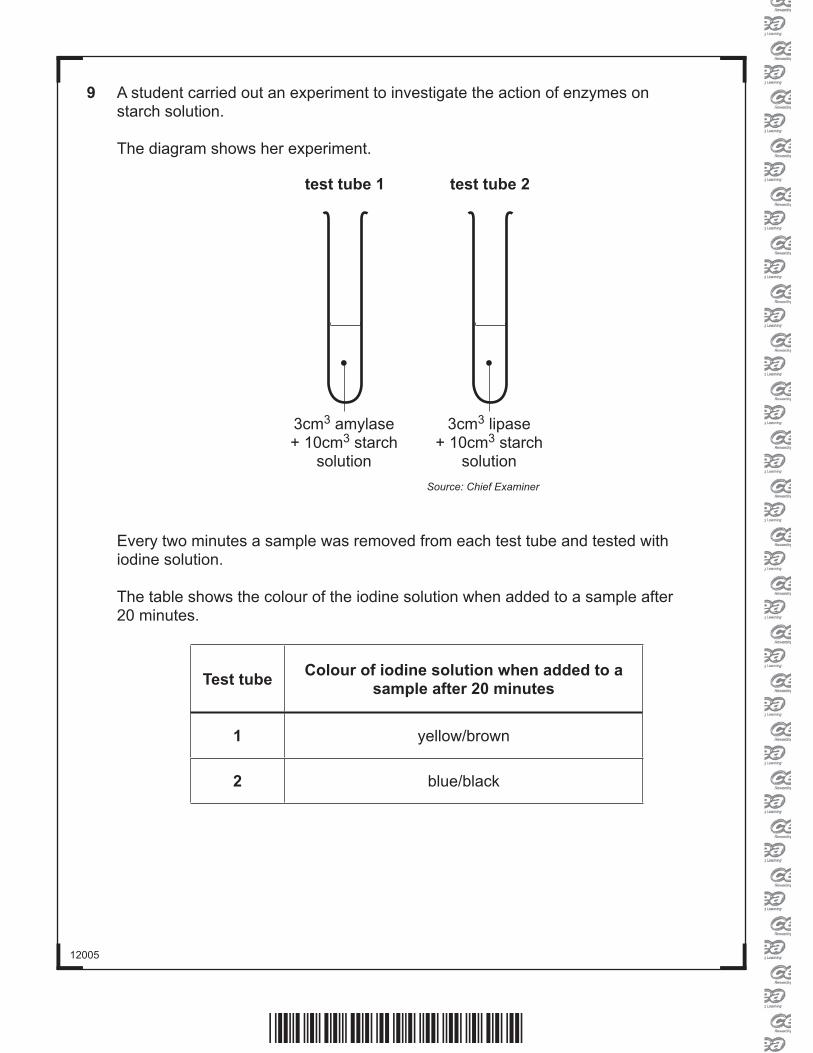
9 A student carried out an experiment to investigate the action of enzymes on starch solution.
The diagram shows her experiment.
test tube 1 test tube 2
3cm3 amylase + 10cm3 starch
solution
3cm3 lipase+ 10cm3 starch
solutionSource: Chief Examiner
Every two minutes a sample was removed from each test tube and tested with iodine solution.
The table shows the colour of the iodine solution when added to a sample after 20 minutes.
Test tube Colour of iodine solution when added to a sample after 20 minutes
1 yellow/brown
2 blue/black
*24GBY1115*
12005[Turn over
Look at the table opposite.
(a) Give two factors the student controlled in this experiment.
1. ____________________________________________________________ [1]
2. ____________________________________________________________ [1]
(b) Describe what happened to the starch in test tube 1.
_________________________________________________________________
_________________________________________________________________
______________________________________________________________ [2]
(c) Explain the results for test tube 2 using your knowledge of enzyme action.
_________________________________________________________________
_________________________________________________________________
_________________________________________________________________
_________________________________________________________________
_________________________________________________________________
_________________________________________________________________
_________________________________________________________________
_________________________________________________________________
_________________________________________________________________
_________________________________________________________________
_________________________________________________________________
______________________________________________________________ [4]
*24GBY1116*
12005
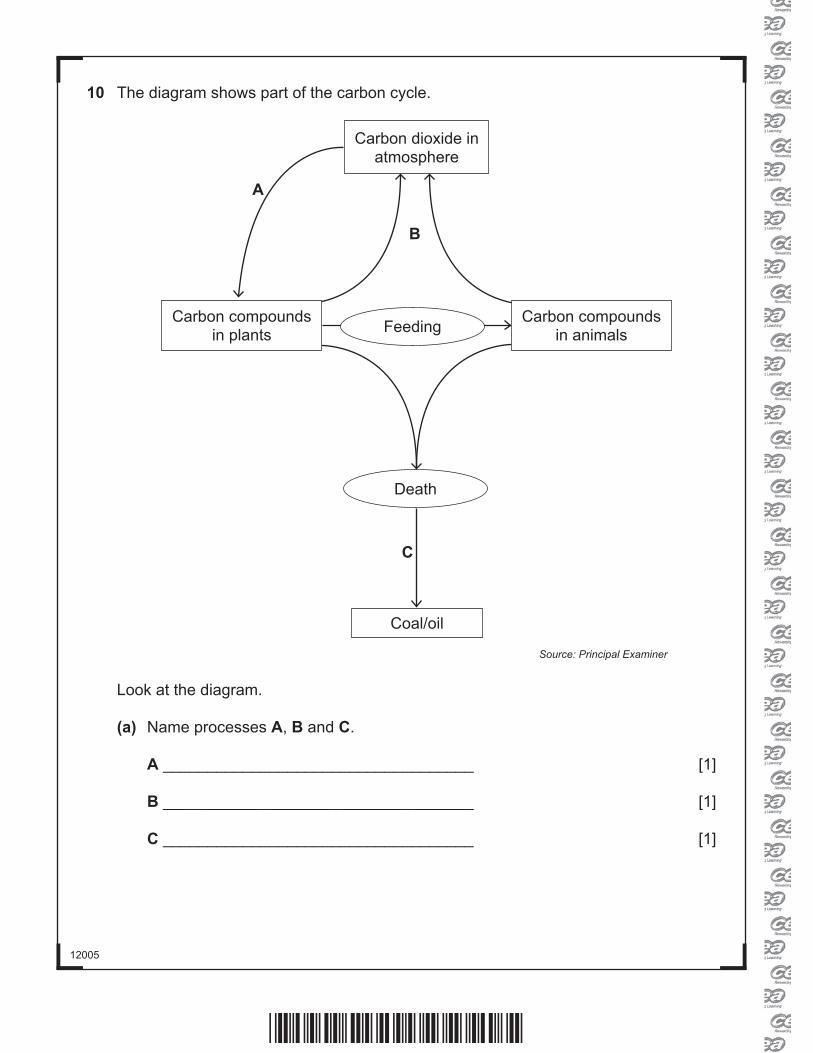
10 The diagram shows part of the carbon cycle.
Carbon dioxide in atmosphere
Coal/oil
Death
Feeding
A
B
C
Carbon compoundsin animals
Carbon compoundsin plants
Source: Principal Examiner
Look at the diagram.
(a) Name processes A, B and C.
A ___________________________________ [1]
B ___________________________________ [1]
C ___________________________________ [1]
*24GBY1117*
12005[Turn over
(b) The graph shows how the temperature of the Earth and the carbon dioxideconcentration in the atmosphere have changed over a five-hundred-year period.
Look at the graph.
(i) Explain how, after 1910, the graph provides evidence to suggest thatcarbon dioxide is a major cause of global warming.
_______________________________________________________________
_______________________________________________________________
_______________________________________________________________
____________________________________________________________ [1]
(ii) Suggest one reason for the change in carbon dioxide concentration from1910 to 2000.
_______________________________________________________________
____________________________________________________________ [1]
Image removed due to copyright
*24GBY1118*
12005
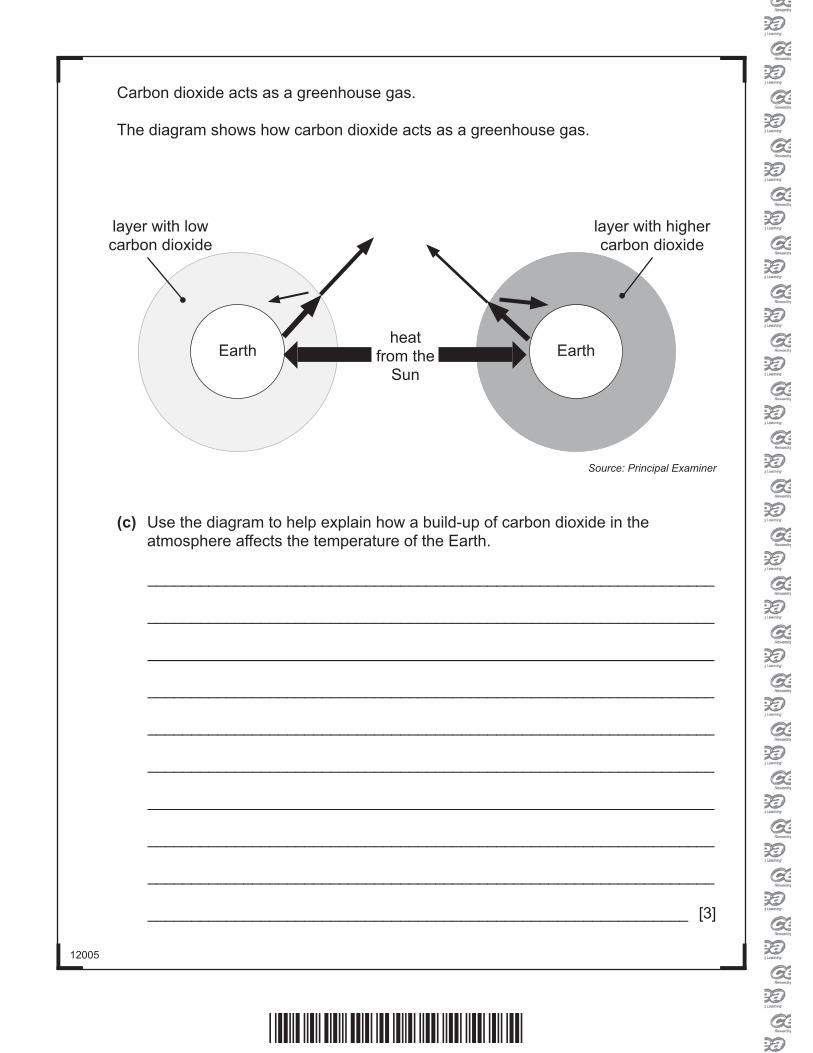
Carbon dioxide acts as a greenhouse gas.
The diagram shows how carbon dioxide acts as a greenhouse gas.
Earth Earthheat
from the Sun
layer with lowcarbon dioxide
layer with higher carbon dioxide
Source: Principal Examiner
(c) Use the diagram to help explain how a build-up of carbon dioxide in theatmosphere affects the temperature of the Earth.
_________________________________________________________________
_________________________________________________________________
_________________________________________________________________
_________________________________________________________________
_________________________________________________________________
_________________________________________________________________
_________________________________________________________________
_________________________________________________________________
_________________________________________________________________
______________________________________________________________ [3]
*24GBY1119*
12005[Turn over
BLANK PAGE
DO NOT WRITE ON THIS PAGE
(Questions continue overleaf)
*24GBY1120*
12005
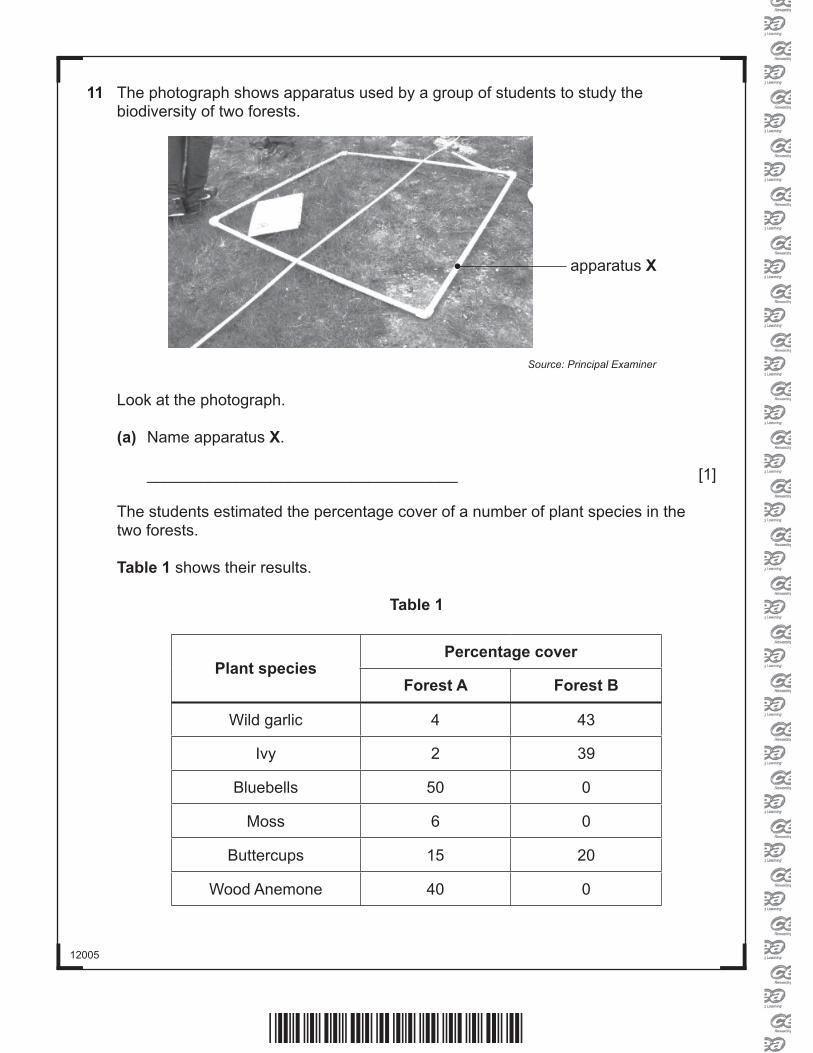
11 The photograph shows apparatus used by a group of students to study the biodiversity of two forests.
apparatus X
Source: Principal Examiner
Look at the photograph.
(a) Name apparatus X.
___________________________________ [1]
The students estimated the percentage cover of a number of plant species in the two forests.
Table 1 shows their results.
Table 1
Plant speciesPercentage cover
Forest A Forest B
Wild garlic 4 43
Ivy 2 39
Bluebells 50 0
Moss 6 0
Buttercups 15 20
Wood Anemone 40 0
*24GBY1121*
12005[Turn over
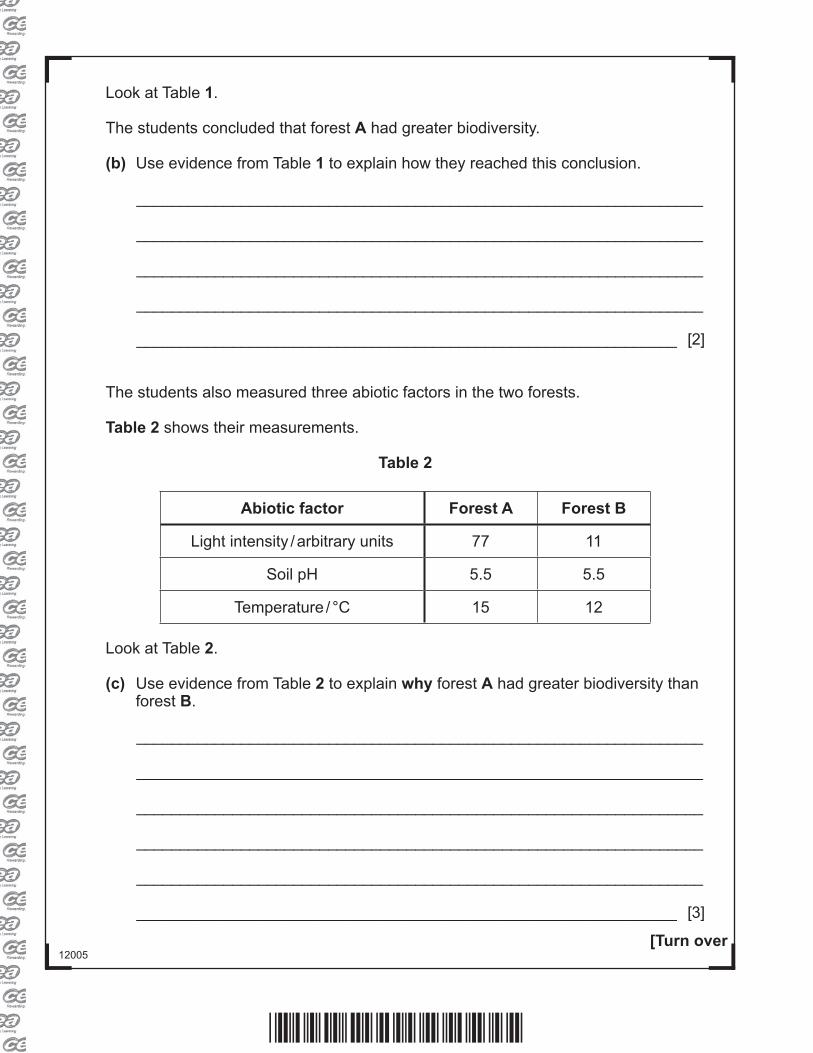
Look at Table 1.
The students concluded that forest A had greater biodiversity.
(b) Use evidence from Table 1 to explain how they reached this conclusion.
_________________________________________________________________
_________________________________________________________________
_________________________________________________________________
_________________________________________________________________
______________________________________________________________ [2]
The students also measured three abiotic factors in the two forests.
Table 2 shows their measurements.
Table 2
Abiotic factor Forest A Forest B
Light intensity / arbitrary units 77 11
Soil pH 5.5 5.5
Temperature / °C 15 12
Look at Table 2.
(c) Use evidence from Table 2 to explain why forest A had greater biodiversity thanforest B.
_________________________________________________________________
_________________________________________________________________
_________________________________________________________________
_________________________________________________________________
_________________________________________________________________
______________________________________________________________ [3]
*24GBY1122*
12005
12 Vitamins are an important part of our diet.You are provided with an orange and a grapefruit.
• Describe the steps you would take to compare the amount of vitamin C inthe orange and the grapefruit.
• Name the reagent you would use and describe the colour change whenvitamin C is present.
• Explain how the results would show which fruit contained more vitamin C.
In this question, you will be assessed on your written communication skills including the use of specialist scientifi c terms.
____________________________________________________________________
____________________________________________________________________
____________________________________________________________________
____________________________________________________________________
____________________________________________________________________
____________________________________________________________________
____________________________________________________________________
____________________________________________________________________
____________________________________________________________________
____________________________________________________________________
____________________________________________________________________
____________________________________________________________________
____________________________________________________________________
____________________________________________________________________
____________________________________________________________________
____________________________________________________________________
_________________________________________________________________ [6]
*24GBY1123*
12005
THIS IS THE END OF THE QUESTION PAPER
BLANK PAGE
DO NOT WRITE ON THIS PAGE
Permission to reproduce all copyright material has been applied for.In some cases, efforts to contact copyright holders may have been unsuccessful and CCEAwill be happy to rectify any omissions of acknowledgement in future if notifi ed.
Examiner Number
*24GBY1124*
12005/5
For Examiner’suse only
QuestionNumber Marks
1 2 3 4 5 6 7 8 9101112
TotalMarks
DO NOT WRITE ON THIS PAGE


![Unit 4: Writing *GSH41* Foundation Tier · Spanish Unit 4: Writing Foundation Tier [GSH41] THURSDAY 30 MAY, MORNING *16GSH4102* *16GSH4102* 11990 BLANK PAGE DO NOT WRITE ON THIS PAGE](https://img.pdfslide.us/doc/110x75/5faccd194c968f5e8e764276/unit-4-writing-gsh41-foundation-tier-spanish-unit-4-writing-foundation-tier.jpg)


![Unit 4: Reading *GSP41* Foundation Tier...Unit 4: Reading Foundation Tier [GSP41] TUESDAY 22 JANUARY, AFTERNOON TIME 40 minutes. INSTRUCTIONS TO CANDIDATES Write your Centre Number](https://img.pdfslide.us/doc/110x75/5fbd7ff9f5aca40b7000e0f4/unit-4-reading-gsp41-foundation-tier-unit-4-reading-foundation-tier-gsp41.jpg)